
Submitted:
11 September 2024
Posted:
12 September 2024
You are already at the latest version
Abstract
Maritime transport has adapted to recent political and economic shifts by addressing stringent pollution reduction requirements, redrawing transport routes for safety, reducing onboard technical incidents, managing data security risks and transitioning to autonomous vessels. The integration of AI-based technologies for fault diagnosis and decision-making, coupled with proper personnel training, has become essential for optimal ship operation, with AI-assisted predictive maintenance emerging as the key strategy to ensure onboard systems function within desired parameters and enhance equipment availability. This study proposes a machine-learning algorithm for evaluating onboard systems performance by analyzing sensor data and mapping it to fault patterns to estimate functional states, validated through tests on a seawater cooling system from an oil tanker, demonstrating operational efficiency and reliability. The immediate advantage is reduced time for fault diagnosis by rapidly assessing the system using operational data, the algorithm enabling real-time monitoring and fault data management to minimize efforts as part of predictive maintenance assisted by machine learning tools.
Keywords:
artificial intelligence
; machine learning
; KNN
; big data analysis
; maritime fault diagnosis
; FMECA
; ship maintenance
1. Introduction
AI-based learning systems, which simulate the state of industrial processes or their components (e.g., maritime ships) exclusively using available measurement data associated with a specific state (or class), are becoming increasingly common in maintenance engineering [1].
Although traditional maintenance strategies (corrective and preventive) have become inefficient in fulfilling the safety and efficiency standards demanded by the industry, Prognostics and Health Management (PHM), identified as Condition-Based Maintenance (CBM), can address these shortcomings [2]. The objectives encompass increasing equipment availability, reducing maintenance costs and enhancing system reliability and safety through facility monitoring.
The estimation of Remaining Useful Life (RUL) based on historical operational data trajectories is pivotal for refining maintenance programs to prevent unplanned failures and associated costs [3]. In general, the existing methods for Prognostics and Health Management (PHM) can be classified into three primary categories: model-based approaches, which are accurate if the complex system degradation is well-modeled but necessitate advanced knowledge; historical operational data-based approaches, which require substantial volumes of data to develop a realistic model and are more practical to implement as they do not demand high levels of expertise; and hybrid approaches, which combine elements of both methodologies [4].
There has been a noticeable increase in interest regarding the rapport between monitored system data and the estimated lifespan of such systems. The key advantage of employing Machine Learning Techniques (ML) lies in their capability to handle complex, multidimensional systems without the need for expertise in the system’s physical behavior, thus MLs have been harnessed to develop applications that can learn mapping from the gathered operational data.
Generally, incidents in the maritime field are complex forces usually caused by a chain of risky events. Understanding these can be used to prevent future accidents. The regions where most naval incidents occurred in the last decade are the British Isles, North Sea, Eng. Channel and Bay of Biscay, with a total of 5279 cases, almost 19% of the total number [5].
In analyzing naval incidents, technical failures (machinery damage or failure) are the primary cause of maritime incidents from 2014 to 2023, accounting for 11,506 cases, almost four times more than the secondary cause, collision, with a total of 3,014 cases. In 2023 alone, over 50% of incidents, 1587 were caused by technical equipment failures.
Furthermore, the maritime industry is undergoing continuous digital transformation through robust collaboration among all stakeholders - ship designers, equipment manufacturers, classification societies and shipping companies - where fully autonomous vessels will become a reality in a short time.
To address these challenges, we propose a novel approach that integrates reliability and risk analysis methods using machine learning to develop an algorithm aimed at enhancing equipment maintenance activities. The remainder of the paper is organized as follows: First, we elaborate on the essential foundation and related work in the field, considering the previously mentioned tools and methods. Subsequently, we provide an overview of naval equipment maintenance. Following this, we present our methodology, propose a fault detection algorithm and discuss the results obtained from testing on a shipboard system. The research concludes with a brief summary, discussion of limitations and suggestions for future research directions.
2. Materials and Methods
Fault detection and diagnosis (FDD) ensures system reliability and safety by identifying, isolating and addressing faults using techniques like Fault Tree Analysis (FTA) and Failure Mode Effect Analysis (FMEA), while recent advances in artificial intelligence (AI) and machine learning (ML) enhance predictive maintenance and optimize fault management in complex systems.
Literature Review
Fault detection and diagnosis (FDD) involves identifying, isolating and understanding system faults to ensure the reliability, safety and efficiency of complex systems across various domains. The first step is detecting abnormalities using sensors, monitoring devices, data analysis techniques and expert knowledge. Once detected, the root cause is isolated by analyzing system behavior and sensor data through fault isolation techniques such as Fault Tree Analysis (FTA), root cause analysis and model-based reasoning. Faults are then classified based on type, severity, duration and impact on performance. Diagnosis determines the fault’s nature and effects, while prognosis predicts the system’s future behavior considering fault progression. Fault diagnostic systems offer decision support tools, helping operators and engineers respond effectively to faults. Continuous system monitoring refines fault detection algorithms, improving fault isolation techniques and system reliability.
Fault diagnosis varies by system type and fault nature, but it is crucial for timely detection and resolution to prevent downtime, catastrophic failures and optimize system performance. Safety and reliability are critical in technical system design and operation, whether involving machines, vehicles, or complex installations. Probabilistic risk assessment (PRA) processes, including FTA, Failure Mode Effect Analysis (FMEA) and Event Tree Analysis (ETA), are widely used to manage these risks. These methods depend on component failure data for quantitative analysis, though data collection is often incomplete due to monitoring limitations in maritime systems [6].
FTA, developed by Bell Telephone Laboratories in 1962 and later advanced by Boeing, analyzes potential failure causes and provides a logical, graphical model of system failures. It is a structured method for qualitative and quantitative failure analysis [7,8] but requires expert involvement and focuses only on potential failures [9,10,11]. FMEA, first used in the aerospace industry, identifies and prioritizes potential failure modes by assessing severity, occurrence and detectability, aiming to mitigate risks and improve system reliability [12]. When paired with Criticality Analysis (CA), FMEA becomes FMECA, which quantitatively prioritizes system vulnerabilities. Both FTA and FMEA are recommended for reliability applications, with research suggesting forward and backward integration of the methods for improved risk evaluation [13].
Recent studies have focused on enhancing maritime system reliability and risk assessment through the integration of FTA, FMEA and other techniques [14,15,16,17,18]. Research [19,20,21,22] focused on assessing risks and improving reliability in maritime systems. For example, some researchers have proposed reconfigurations to increase system reliability, others have used reliability block diagrams to modify ship systems and some have applied advanced techniques like the Fuzzy Multi-Criteria Decision-Making Approach [21] (FCDMA) and dynamic fault tree analysis (DFTA) to prioritize maintenance actions [22]. The Risk Priority Number (RPN) method (1) in FMEA prioritizes failure modes based on severity (S), occurrence (O) and detectability (D), though its simple multiplication formula has been widely critiqued.
RPN=S×O×D,
Alternative approaches [23,24,25,26], such as weighted RPN calculations and fuzzy logic, have been proposed to improve accuracy.
Moreover, the integration of artificial intelligence (AI) and machine learning (ML) in predictive maintenance has gained significant attention, with AI techniques used to predict equipment failures and optimize maintenance schedules [27,28,29]. Machine learning algorithms—supervised, unsupervised, semi-supervised and reinforcement learning—can automate tasks [30,31,32], discover patterns in data and make intelligent decisions without explicit human intervention. Recent applications of deep learning, neural networks and other ML algorithms like decision trees and support vector machines have shown promise in fault pattern recognition and classification in technical systems [33,34].
Finally, performance metrics for machine learning algorithms [35], such as the confusion matrix, help assess classification accuracy by comparing predicted labels with actual outcomes, providing insights into precision, recall and overall model performance.
Methodology
A comprehensive fault diagnosis methodology involves several steps to systematically detect, isolate and understand faults in a system. The proposed methodology involves system understanding, data acquisition and preprocessing, feature selection and extraction, fault detection, fault localization and isolation, fault classification and severity assessment, diagnostic decision-making, feedback and continuous improvement.
Understanding the system architecture and expected behaviors is fundamental to fault diagnosis methodologies, ensuring a comprehensive grasp of critical components and operational norms. Acquiring and preprocessing relevant data involves collecting and refining information from sensors and monitoring devices and refining it through filtering and normalization to enhance accuracy. The selection of informative features is crucial for capturing meaningful patterns in the data, which facilitates effective fault detection and localization.
Applying fault detection algorithms enables the identification of anomalies or deviations from normal system behavior, laying the foundation for subsequent diagnostic steps. Localizing and isolating faults involves narrowing down potential causes to specific components or subsystems, thereby aiding in the identification of root causes and effective mitigation strategies. Classifying and assessing fault severity helps prioritize response actions, ensuring that critical issues are addressed promptly to minimize disruptions and optimize system performance. Decision support systems play a pivotal role in guiding informed fault response decisions considering various factors such as safety, reliability and cost implications. Continuous feedback and improvement drive the evolution of fault diagnosis methodologies, ensuring their effectiveness in terms of addressing emerging insights and adapting to changes in system behavior.
To properly analyze a problem, it is necessary to utilize three primary data sources: operational parameters, maintenance history and the technical condition of components, to allow for the estimation of future values based on trends, seasonal variations and cyclical phenomena, in accordance with the theoretical principles of machine learning in the product-program lifecycle [45,46].
Fault detection and diagnosis methods, such as FTA, FMEA and ETA, are integral components of PRA methodologies. FTA, a systematic approach to identify and analyze potential system failures, is often utilized within PRA to assess the likelihood and consequences of various fault scenarios. Similarly, FMEA and ETA complement PRA by providing detailed evaluations of the failure modes and their effects, as well as the sequences of events following fault occurrence, respectively. In research [47] authors identified limitations in the traditional risk assessment method and proposed an improved analysis model using frequency-impact values plotted on a four-quadrant evaluation chart. Meanwhile, research [48] evaluated the failure modes using the FMECA method and prioritized the risk factors, which were then used for opportunity analysis regarding the implementation of Condition Monitoring Systems (CMS) and CBM practices. Potential failures in FTA-based naval propulsion systems are outlined in research [49]. The impact of disruptive events on critical ship components are assessed in research [50] and proposed a method for evaluating operational time without human intervention. Research [51] explored FTA’s applicability across industries, including maritime ones and incorporated fuzzy logic to address event interdependencies. Also, research [52] analyzed failures in the propulsion systems of four identical ships, identifying key components for reliability calculations and suggesting improvements through RAM analysis and FTA.
Furthermore, in fault diagnosis tasks, techniques like k Nearest Neighbors (kNN) can be employed to classify and identify faults based on similarities with known fault patterns, which contributes to the overall reliability and safety analysis of complex systems. The kNN machine learning algorithm used in this study is versatile for both classification and regression tasks, utilizing a simple approach to classify new cases based on a majority vote from its k nearest neighbors, assessed through a distance function [53].
To determine the final accuracy of the tests, the confusion matrix, a performance evaluation tool in machine learning that represents the accuracy of a classification model, particularly for multi-class methods, is used to assess the performance of a classification model by comparing predicted and actual class labels [54]), providing insight into the classification model's operation and the types of errors displayed through a comparison of actual target values with those predicted by the model within an n×n matrix, where n represents the total number of target classes. The difference from the regular confusion matrix was in calculating the final results with the cumulative overall precision accuracy for the test data.
In this study, the proposed predicted algorithm is used to make predictions across multiple classes and follows a lifecycle guided by theoretical principles of machine learning, resulting in an algorithm adhering to this cycle as depicted in Figure 1.
Beginning with developing requirements, the problem is stated and a solution is proposed that emphasizes the purpose and benefits. Analysis evaluates the existing situation and proposes methods and algorithms for problem solving, often using intuitive graphical representations for clarity.
The design involves abstracting the facts from the analysis to realize information and action modeling, while implementation and testing bring the product model to life through programing and debugging. Once completed, the algorithm is deployed for operation and updates are provided to address issues and improve performance.
This life cycle repeats with each iteration of development. In a specific research context, analysis, design and implementation are essential for developing predictive data analysis programs using machine learning techniques that are adapted from existing works [55,56]. System analysis identifies critical points and variables, enabling the model's application to various installations and enhancing operational understanding and automation potential [57].
The algorithm further involves data collection from installation sensors, processing raw data to distinguish normal and faulty states through techniques like feature generation. This iterative process ensures a high-quality database, facilitating reliable analysis and results generation [58]. The algorithm creation process involves flexibility in terms of strategy and technique selection, which is tailored to the available data types and volume. Multiple techniques are simultaneously employed to build various predictive models, each offering various solutions to the problem at hand, the notable results will be considered in defining the optimal method.
Fault Detection Algorithm
This paper proposes a new fault detection algorithm, integrating risk analysis tools like FTA and FMECA, along with ML techniques, to enhance maritime maintenance practices. In addition, it introduces the Supplier Inputs Process Output Customer (SIPOC) diagram as a graphical representation tool to illustrate the inputs, utility and benefits of a maritime maintenance system. Originating from Edward Deming’s Total Quality Management principles, the SIPOC diagram visualizes processes as integrated entities, emphasizing the interconnectedness of various elements (Figure 2).
This concept portrays manufacturing as a complete and integrated process rather than a series of disjointed elements, aiding in understanding the diverse applications and stages preceding and succeeding any action. To pinpoint real issues within the manufacturing process, SIPOC components include both internal and external customers, product requirements and the inputs and outputs of the process [59,60].
The proposed algorithm effectively analyzes a problem, utilizes three primary data sources: operating parameters encompassing both normal and faulty operations, detailed maintenance history and the technical condition of components, including degradation over time, to estimate operating hours until failure [44]. By analyzing the recorded parameter values, it is possible to estimate values for future moments, the type of trend (long-term increase or decrease in values), seasonal phenomena (changes in values over equal time periods) and cyclical phenomena (fluctuations that do not always have the same duration, i.e., are not periodic).
The algorithm, tailored to meet the operational and maintenance requirements of a ship's crew, utilizes planned activities and data from onboard monitoring systems to efficiently manage information, provide insights and enhance operational and maintenance processes through five structured operational modules, which are integrated for comprehensive functionality (Figure 3).
The proposed algorithm has a universal character, is applicable to monitoring all installations onboard a ship and contain five modules: MONITOR and GRAPH were enhanced based on similar monitoring systems onboard, while DIAG, ANALYSIS and LINK to PMS were developed to conduct a technical state analysis of shipboard installations. Particularly, for the implementation, testing and operation stages, an onboard ship installation (e.g. seawater cooling system) was chosen to validate the results.
The algorithm references 20 basic operational parameters for maritime vessels, computes 10 additional DELTA parameters (difference between input and output values), stores them in a Monitoring Array for modules MONITOR, DIAG and GRAPH, transmits real-time data to a database and signals functional imbalances, saving and analyzing data for defects and deviations from nominal values.
The MONITOR module displays in real time, within the interface of the chosen installation, the values of the functional parameters obtained from the sensors.
The DIAG module (Figure 4) provides a graphical representation of the evolution of the operating data values according to the user’s preference over set time intervals. The deviation of these parameters lies between the minimum and maximum values accepted for the optimal operating regime. Any value exceeding the maximum or minimum limits (values exceeding 100%) indicates an abnormal functional state. To normalize the data presented in the graph, the domain (-100, 100) was utilized, and deviations from optimal parameters were measured as percentage values, where -100% and 100% denote negative and positive deviations, respectively, 0 represents the optimal operation.
This information is required to correlate the functional states of the components with the values of the operating data.
The ANALYSIS module, having possible faults in the functional state as reference points, analyzes the provided dataset online or offline to determine the trend for each variable. The module extracts the time and variables provided by the sensors from the installation under test, sets a threshold for small variations and fits a linear model to each variable (2) to analyze, determine and display trends for each variable (4) based on a linear regression model (3).
mdl = fitlm(time,sensors(:,i)),
slope = mdl.Coefficients.Estimate,
trends{i} = determineTrend(slope,threshold),
Taking into account that our scenarios dataset is small to moderately sized and low-dimensional and the fault classes are well-separated, for fault diagnosis, the kNN model is most suitable based on its simplicity and non-parametric nature, which makes it effective for real-time fault diagnosis and applications in which minimal assumptions about data distribution are required.
The module trains a k-nearest neighbor classifier, where the number of nearest neighbors in the predictors (k) is 5. The kNN model (Mdl) is created to classify data points based on the given features and labels, and ensures that the numeric data are standardized to realize better performance (5).
Mdl = fitcknn(X,Y,'NumNeighbors',5,'Standardize',1),
The predicted class labels (predict responses/labels -1, 0, 1) are generated to evaluate the model's performance on the training set using trained regression models (6).
predictedY = resubPredict(Mdl),
A suitable ML technique for multi-class fault diagnosis depends on the specific characteristics of the dataset and the fault diagnosis requirements. In the proposed algorithm, the kNN model is best fitted for fault diagnosis based on a predefined fault and confusion array because the dataset is small to moderately sized, the feature space is low-dimensional and the fault classes are well separated. In this case study, the simplicity, ease of implementation and effectiveness of the proposed method in scenarios with distinct clusters of faults make it a viable choice for real-time and straightforward fault diagnosis applications. However, careful consideration of the dataset's size and dimensionality is critical to ensure kNN's efficiency and accuracy in fault diagnosis.
Therefore, a confusion array/chart and the derived metrics are crucial for assessing performance and guiding the selection of the best model for fault diagnosis, providing a summary of prediction results by showing the counts of true positives, false positives, true negatives and false negatives. The confusion chart (cm) visually represents the performance of the kNN classifier by displaying the actual versus predicted class labels, which helps assess the model’s accuracy and identify any misclassifications (7).
The confusion chart’s rows correspond to the true class, the columns correspond to the predicted class and diagonal and off-diagonal cells correspond to correctly and incorrectly classified observations, respectively.
The normalized confusion matrix (CM) provides a more interpretable view of the classification performance by showing the proportion of each predicted class relative to the actual class, which can be useful for comparing performance across different classes (8).
cm = confusionchart(Y,predictedY),
CM=cm.NormalizedValues,
Thus, in the proposed algorithm, the typology of the faults was structured as an array corresponding to the 12 functional states described in the Results section, each containing 41 functional parameters supplied by sensors placed under the testing installation.
Algorithm testing, validation and updating were performed using test files obtained during the operation of the on-board installations, online or offline, during or after the trip was completed. Using K-Nearest Neighbors (KNN), we classify a new data point by analyzing and voting on the classes of the k closest points from the initial dataset and visualize the predictions in the confusion matrix chart created from the true labels and the predicted labels and we compare the performance across different classes. At the end, the algorithm indicates the defects in order of their incidence.
The GRAPH module allows a graphical representation of the operating data values according to the user option. The module serves as an essential tool for operational personnel to observe changes over time in monitored and calculated parameter values, functioning as an analysis instrument for failure modes in cases where the analysis report from the preceding module does not provide sufficient information for classification, when results are very close in value, or when necessary, analysis trends are not identified. Using data stored in the Monitoring Array matrix for monitored pressure and temperature parameters, the algorithm enables real-time or continuous 2D display of the target parameters throughout the recording period. The information is necessary to correlate the functional state of the components with the values of the operating data.
The LINK2PMS module assists users in managing maintenance processes by providing relevant information on facility failures, displaying possible causes and remedial measures from FTA and FMECA analyses in a table format. It integrates with PMS on transport vessels to demonstrate the key features of the affected components and details of recent maintenance work.
3. Results
The algorithm's testing and validation used as a reference system for seawater cooling installations, selecting 20 basic operational parameters common in similar maritime transport vessel installations. Following parameter input, the algorithm computes 10 additional DELTA parameters (the difference between input and output values for each component). These parameters are stored as a matrix called the Monitoring Array (9), which serves as input data for subsequent modules (MONITOR, DIAG and GRAPH). The initial module transmits real-time operational data to a database and the algorithm’s novelty lies in its calculation of DELTA parameters, which are crucial for signaling functional imbalances in component failures.
3.1. The MONITOR Module
The MONITOR module (Figure 5) displays the real-time values of the functional parameters obtained from the sensors within the interface of the selected installation.
MonitoringArray(i,:)=[VPinpp1, VPoutpp1, VPinpp2, VPoutpp2, VPinswc1, … VPoutswc1, VTinswc1, VToutswc1, VPinswc2, VPoutswc2, VTinswc2, ... VToutswc2, VPinfwc1, VPoutfwc1, VTinfwc1, VToutfwc1, VPinfwc2, … VPoutfwc2, VTinfwc2, VToutfwc2, opDPpp1, opDPpp2, opDPswc1, … opDTswc1, opDPswc2, opDTswc2, opDPfwc1, opDTfwc1, opDPfwc2, … opDTfwc2];
After each display, the data are saved for the analysis phase in the ANALYSIS module, which also offers additional data calculation and displays defect states representing deviations from nominal parameter values.
3.2. The DIAG Module
The DIAG module (Figure 6) graphically represents the evolution of the operating data values over user-defined time intervals, highlighting deviations (10) within a normalized domain of (-100, 100) where -100% and 100% denote deviations and 0 represents optimal operation, where any value exceeding these limits indicates an abnormal functional state, thereby correlating the component functionality with the operating data values.
3.3. The ANALYSIS Module
The ANALYSIS module examines sensor data to determine trends and detect faults by fitting linear regression models to each variable and using a kNN classifier for real-time fault diagnosis. It standardizes numeric data, visualizes predictions with a confusion matrix to assess model performance and indicates defects based on their incidence. The proposed approach leverages kNN's simplicity and effectiveness of kNN on small, well-separated datasets, making it suitable for real-time fault diagnosis in maritime installations. To validate the results of the algorithm, 12 functional states on the tested installation, 12 functional states were taken as a reference. Following the specific analysis, for the targeted installation, a malfunction matrix (Fault Array) was created for 12 existing functional states, 11 functional states with deviations from optimal parameters and 1 operating state with nominal parameters (and in this situation some fluctuations of parameter values were identified). The functional states are:
- F1 – sea water chest malfunction;
- F2 – sea water pump malfunction;
- F3 – clogging main sea water cooler;
- F4 – clogging main fresh water cooler;
- F5 – low efficiency main fresh water cooler;
- F6 – clogging secondary sea water cooler;
- F7 – clogging secondary fresh water cooler;
- F8 – low efficiency secondary fresh water cooler;
- F9 – seawater pump failure and clogging main sea water cooler;
- F10 – seawater pump failure and low efficiency main fresh water cooler;
- F11 – clogging main sea water cooler and low efficiency main fresh water cooler;
- F12 – operation in nominal parameters (or with minimal deficiencies)
In the proposed algorithm, fault types were structured as arrays corresponding to 12 functional states, each containing 41 functional parameters from the sensors in the testing installation. The algorithm was tested, validated and updated using test files from on-board installations, either online or offline, during or after trips. Using K-Nearest Neighbors (KNN), new data points are classified by analyzing and voting on the classes of the k closest points from the initial dataset, with predictions visualized in a confusion matrix to compare performance across classes, ultimately indicating defects in order of incidence and descending highlighting possible failure modes (Figure 7).
The algorithm indicates the defects in the order of their incidence as is depicted in Figure 8.
3.4. The GRAPH Module
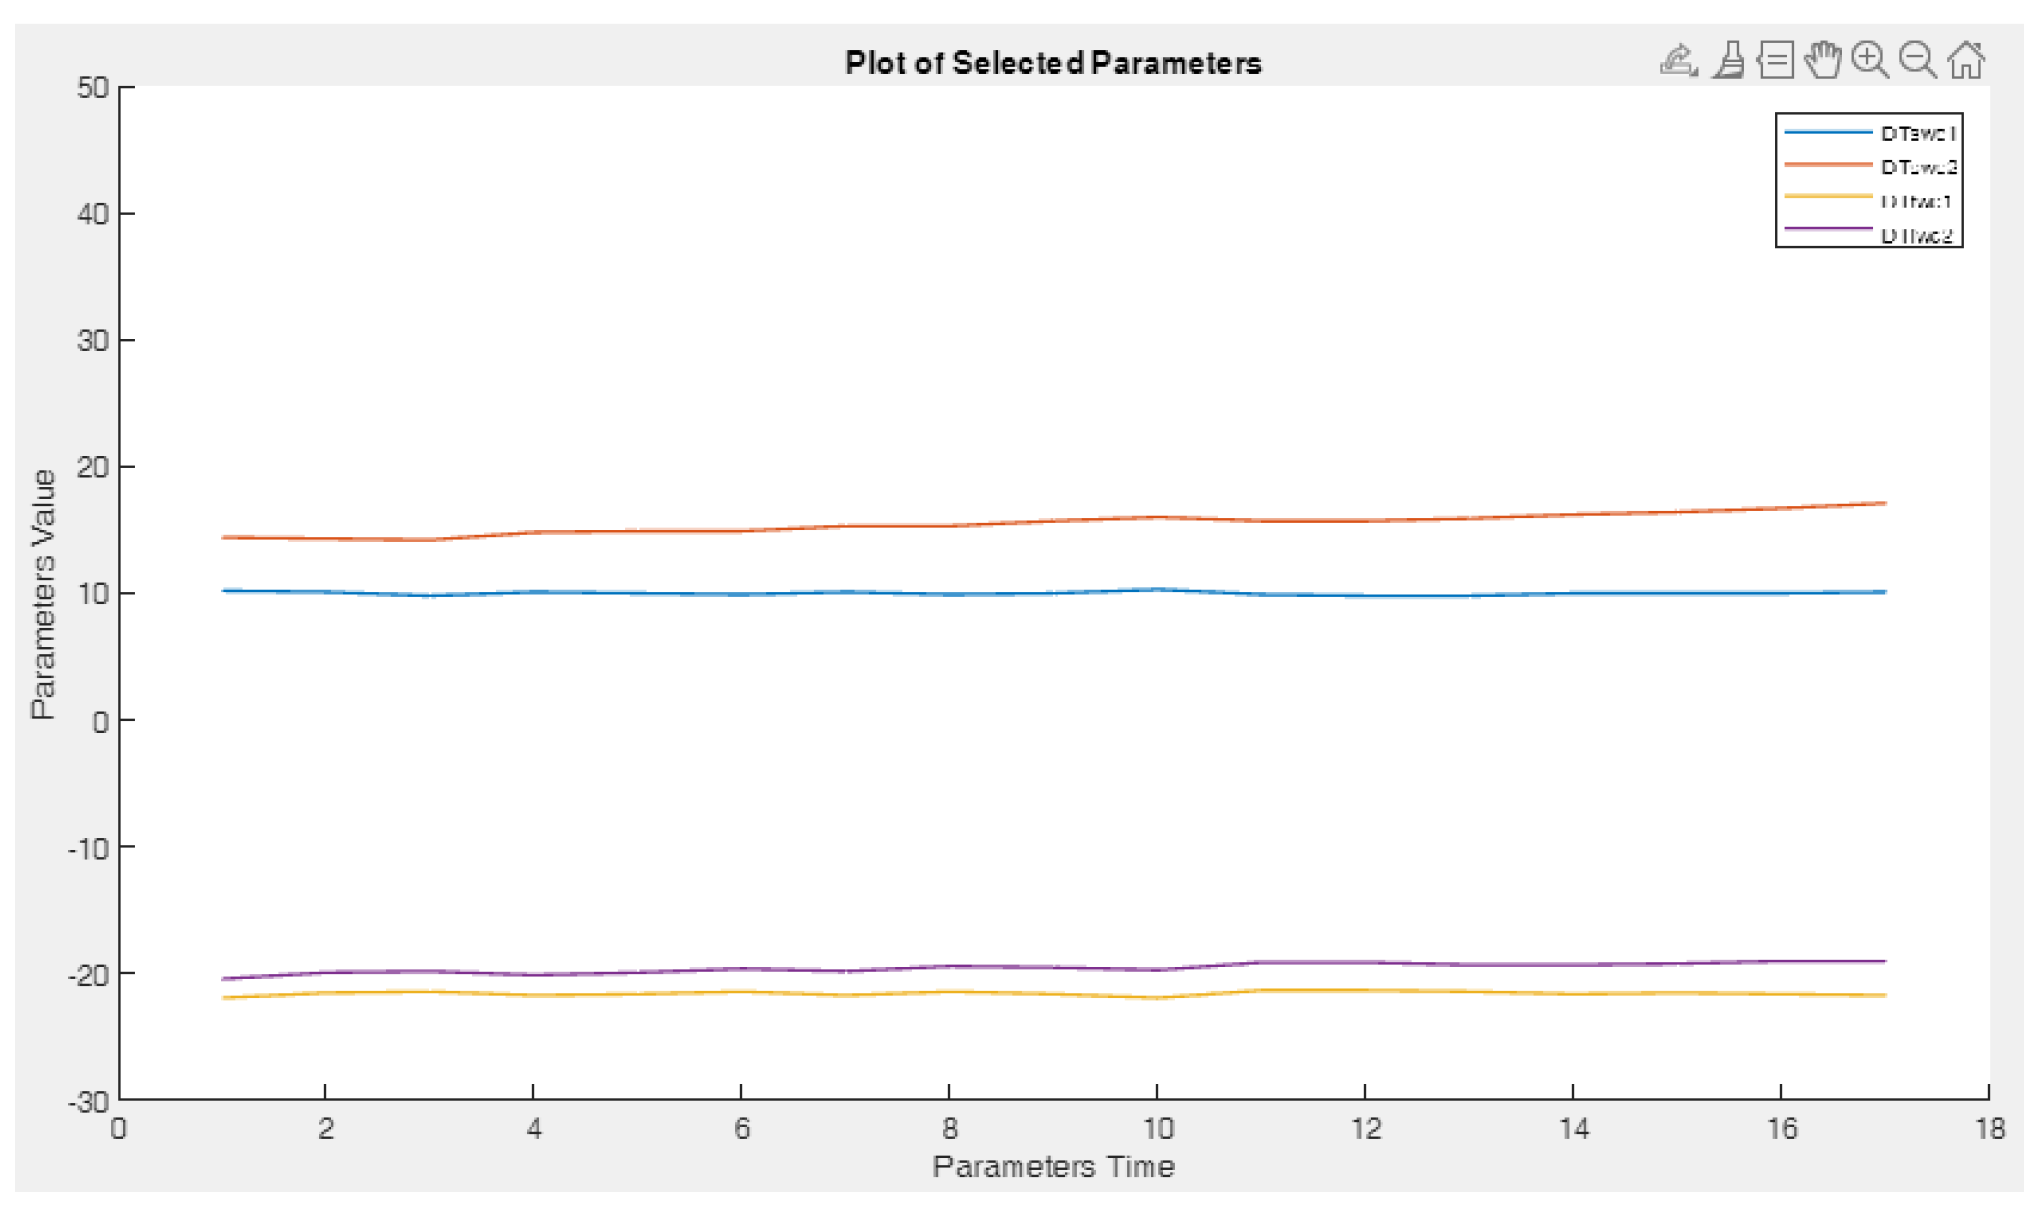
The GRAPH module (Figure 9) graphically represents the evolution of operating data values (11) based on user preferences, serving as a crucial tool for operational personnel to monitor changes in parameter values over time, analyze failure modes when the previous module's report is insufficient and display real-time or continuous 2D data from the Monitoring Array matrix for monitored pressure (12) and temperature (13) parameters to correlate the component functional states with the operating data.
ParamNames={'Pinpp1', 'Poutpp1', 'Pinpp2', 'Poutpp2', 'Pinswc1', 'Poutswc1', … 'Tinswc1', 'Toutswc1', 'Pinswc2', 'Poutswc2', 'Tinswc2', 'Toutswc2', 'Pinfwc1', … 'Poutfwc1', 'Tinfwc1', 'Toutfwc1', 'Pinfwc2', 'Poutfwc2', 'Tinfwc2', 'Toutfwc2', ... 'DPpp1', 'DPpp2', 'DPswc1', 'DTswc1', 'DPswc2', 'DTswc2', 'DPfwc1', … 'DTfwc1', 'DPfwc2', 'DTfwc2'};
3.5. The LINK2PMS Module
The LINK2PMS module is designed to provide users with relevant information for managing the maintenance process based on the type of component failure. Possible causes and remedial measures for the identified defects extracted from qualitative analyses of FTA and FMECA are displayed.
4. Discussion
This paper proposes an innovative approach to enhancing the reliability and safe operation of equipment by implementing a new model for the automated evaluation of the technical conditions of equipment using machine learning techniques. The objective is to provide early warning of operational deviations, eliminate human errors, notify upcoming maintenance stages in advance and reduce costs.
In developing the algorithm, several methods were considered, including fault tree analysis, failure mode and effects analysis (FMEA) and fault detection using machine learning techniques. Using the S.I.P.O.C. diagram, all these methods were integrated to construct the algorithm. The algorithm was designed to handle both continuous data flow from onboard the ship and offline analysis by exporting recorded data for shore-based analysis during and after a voyage. Based on specified requirements and development possibilities and through the integration of machine learning techniques, the algorithm facilitates the monitoring of operations and the evaluation of the functional state of naval installations by analyzing operational data to assist maintenance decision-making.
The algorithm enhances the monitoring phase of onboard installations by alerting potential defects and their effects on the components. In addition, the proposed algorithm facilitates the visualization of trends and functional deviations, mapping them to possible failure modes. It is also scalable, accommodating the complexity of installations and allowing for the integration of additional sensors.
The obtained results contribute to the field of maintenance for ship systems and installations in several ways: (1) the integration of risk and reliability analysis (FTA and FMECA), simulation tools and machine learning techniques is achieved using the SIPOC method; (2) a database has been created to identify fault precursors by analyzing operational parameter values; (3) the monitoring system and graphical analysis of operational data have been enhanced; (4) a fault matrix has been constructed to identify possible failure modes in naval installations; (5) the analysis of operational parameter trends is integrated with machine learning techniques to identify potential failure modes in naval installations. Finally, an algorithm was developed leveraging the research findings to enhance the current monitoring system and assist in maintenance decision-making for naval installations. The primary advantage lies in the reduced time required for diagnosing the root cause of failures through rapid system evaluation using operational data. However, testing and validating the proposed algorithm on a generic installation revealed potential limitations arising from the complexity of the employed methods and tools.
Methodologically, two risk analysis methods (FTA and FMECA) were employed, which provided the best results in the naval field. The limitations of each method were minimized by integrating them into the research. Although the choice of installation for the case study was thoroughly justified, applying the algorithm to a single installation was a limitation of the study. Due to the varying technological levels of the testing installation (limited number of monitored parameters, depending on the sensors placed on the installation), evaluating trends can be challenging. However, by calculating additional parameters, functional trends become evident and the early detection of these trends can differentiate between possible failure modes.
Considering the above points combined with the rapid technological development and application of machine learning techniques, the proposed algorithm represents a significant advancement in naval maintenance. It contributes to the safe operation of naval equipment by immediately reporting parameter deviations and improving the activities of personnel involved in ship operation, thereby enhancing autonomous maritime transport.
Furthermore, new research directions are thus outlined, aiming at the development of an application that enables: (1) Automation of the diagnosis process for naval equipment by integrating the application into the ship's maintenance management system; (2) Application of the study to other onboard installations by replicating the steps described in the SIPOC diagram; (3) Mapping fault matrices for other naval installations and automating the diagnosis process; (4) Updating the application with new technological capabilities (additional sensors for measuring operational parameters) to unequivocally differentiate between the various and complex possible failure modes; (5) Creating support materials (operating manuals and training videos) to develop new competencies for operating personnel.
This work aims to serve as a foundation for developing an application that integrates the study conducted by creating a pilot model to diagnose faults in naval installations and evaluate operational parameters. The proposed model is intended to estimate functional deviations and assist maintenance decision-making.
5. Conclusions
This research offers a significant contribution to the field of naval maintenance by advancing fault diagnosis automation, improving the monitoring of onboard systems and supporting the development of autonomous maritime transport.
Incorporating ML algorithms like k Nearest Neighbors (kNN) into fault diagnosis tasks improves fault classification by comparing new cases with known fault patterns. Performance evaluation tools, such as the confusion matrix, assess the classification model's accuracy, providing insights into errors and overall model performance.
The proposed algorithm in this study, designed for multi-class predictions, follows a machine learning lifecycle involving problem identification, analysis, design, implementation and testing, with iterative development to refine the model. The algorithm demonstrates the potential to improve fault detection, classification and visualization of operational trends, enabling more informed and timely maintenance decisions for complex installations.
Future research should focus on expanding the algorithm’s applicability to other naval systems, integrating more sensors and developing tools for training and personnel development to optimize system operation and maintenance management.
Author Contributions
Conceptualization, D.S., E.F. and F.P. ; methodology, D.S., E.F. and F.P.; software, F.P. ; validation, D.S., E.F., F.P. and B.F.; formal analysis, D.S., E.F. and B.F.; investigation, D.S., E.F. and B.F.; resources, D.S. and F.P.; data curation, E.F. and B.F.; writing—original draft preparation, D.S and F.P.; writing—review and editing, F.P.; visualization, D.S., E.F., F.P. and B.F.; supervision, E.F. and F.P.; project administration, D.S. and F.P.; funding acquisition, E.F. and B.F. All authors have read and agreed to the published version of the manuscript.
Funding
This work was supported by the National University of Science and Technology POLITEHNICA Bucharest under Grant PubArt. The APC was funded by PubArt.
Data Availability Statement
This is not the case.
Conflicts of Interest
The authors declare no conflicts of interest.
References
- Konieczny, J.; Stojek, J. Use of the K-Nearest Neighbour Classifier in Wear Condition Classification of a Positive Displacement Pump. Sensors 2021, 21, 6247. [Google Scholar] [CrossRef] [PubMed]
- Zhao, Z.; Liang, N.B.; Wang, X.; Lu, W. Remaining Useful Life Prediction of Aircraft Engine Based on Degradation Pattern Learning. Reliability Engineering & System Safety 2017, 164, 74–83. [Google Scholar] [CrossRef]
- Lee, J.; Wu, F.; Zhao, W.; Ghaffari, M.; Liao, L.; Siegel, D. Prognostics and Health Management Design for Rotary Machinery Systems—Reviews, Methodology and Applications. Mechanical Systems and Signal Processing 2014, 42, 314–334. [Google Scholar] [CrossRef]
- Li, X.; Ding, Q.; Sun, J.-Q. Remaining Useful Life Estimation in Prognostics Using Deep Convolution Neural Networks. Reliability Engineering & System Safety 2018, 172, 1–11. [Google Scholar] [CrossRef]
- Safety and shipping review, 2024. Allianz Commercial, Online. Available online: https://commercial.allianz.com/content/dam/onemarketing/commercial/commercial/reports/Commercial-Safety-Shipping-Review-2024.pdf.
- Kabir, S.; Papadopoulos, Y. A Review of Applications of Fuzzy Sets to Safety and Reliability Engineering. International Journal of Approximate Reasoning 2018, 100, 29–55. [Google Scholar] [CrossRef]
- C. Ericson, “Fault Tree Analysis—A History,” 17th International System Safety Conference, 1999. - References - Scientific Research Publishing Available online: https://www.scirp.org/reference/referencespapers?referenceid=1049972.
- Barbelian, M.A.; Bălan, C.V. Fault Tree Event Classifiction by Neural Network Analysis. U.P.B. Sci. Bull. Series D Vol.79 2017, ISSN 1454-2358. Available online: https://www.scientificbulletin.upb.ro/rev_docs_arhiva/full03e_888924.pdf.
- Lind, M.; Zhang, X. Functional modeling for fault Diagnosis and its application for NPP. Nuclear Engineering and Technology 2014, 46, 753–772. [Google Scholar] [CrossRef]
- Lin, J.; Yuan, Y.; Zhang, M. Improved FTA Methodology and Application to Subsea Pipeline Reliability Design. PLoS ONE 2014, 9, e93042. [Google Scholar] [CrossRef]
- Liu, P.; Wu, Y.; Li, Y.; Wu, X. An Improved FMEA Method Based on the Expert Trust Network for Maritime Transportation Risk Management. Expert Systems With Applications 2024, 238, 121705. [Google Scholar] [CrossRef]
- Carpitella, S.; Certa, A.; Izquierdo, J.; La Fata, C.M. A Combined Multi-Criteria Approach to Support FMECA Analyses: A Real-World Case. Reliability Engineering & System Safety 2018, 169, 394–402. [Google Scholar] [CrossRef]
- Liu, P.; Li, Y. An Improved Failure Mode and Effect Analysis Method for Multi-Criteria Group Decision-Making in Green Logistics Risk Assessment. Reliability Engineering & System Safety 2021, 215, 107826. [Google Scholar] [CrossRef]
- I Lazakis, I.; Raptodimos, Y.; Varelas, T. Predicting Ship Machinery System Condition through Analytical Reliability Tools and Artificial Neural Networks. Ocean Engineering 2018, 152, 404–415. [Google Scholar] [CrossRef]
- Emovon, I.; Norman, R.A.; Murphy, A.J.; Pazouki, K. An Integrated Multicriteria Decision Making Methodology Using Compromise Solution Methods for Prioritising Risk of Marine Machinery Systems. Ocean Engineering 2015, 105, 92–103. [Google Scholar] [CrossRef]
- Liu, N.; Guo, N.; Zhang, N. An Improved Assessment Method for FMEA for a Shipboard Integrated Electric Propulsion System Using Fuzzy Logic and DEMATEL Theory. Energies 2019, 12, 3162. [Google Scholar] [CrossRef]
- Shafiee, M.; Enjema, E.; Kolios, A. An Integrated FTA-FMEA Model for Risk Analysis of Engineering Systems: A Case Study of Subsea Blowout Preventers. Applied Sciences 2019, 9, 1192. [Google Scholar] [CrossRef]
- Liu, C.-T.; Hwang, S.-L.; Lin, I. Safety Analysis of Combined FMEA and FTA with Computer Software Assistance – Take Photovoltaic Plant for Example. IFAC Proceedings Volumes 2013, 46, 2151–2155. [Google Scholar] [CrossRef]
- Allal, A.A.; Mansouri, K.; Youssfi, M.; Qbadou, M. Toward a reliable main engine lubricating oil system for a safe operation of autonomous ship 2nd International Conference on System Reliability and Safety (ICSRS), 2017; Volume 2017.
- Dionysiou, K.; Bolbot, V.; Theotokatos, G. A functional model-based approach for ship systems safety and reliability analysis: application to a cruise ship lubricating oil system. Proc. Inst. Mech. Eng. M 2022, 236, 228–244. [Google Scholar] [CrossRef]
- Velasco-Gallego, C.; Lazakis, I. RADIS: A Real-Time Anomaly Detection Intelligent System for Fault Diagnosis of Marine Machinery. Expert Systems With Applications 2022, 204, 117634. [Google Scholar] [CrossRef]
- Daya, A.A.; Lazakis, I. Developing an advanced reliability analysis framework for marine systems operations and maintenance. Ocean Eng. 2023, 272, 113766. [Google Scholar] [CrossRef]
- Bluvband, Z.; Polak, R.; Grabov, P. Bouncing failure analysis (BFA): the unified FTA-FMEA methodology. Proceedings Annual Reliability and Maintainability Symposium, 2005; pp. 463–467, 24–27 January 2005.
- F. Franceschini and M. Galetto, “A new approach for evaluation of risk priorities of failure modes in FMEA,” International Journal of Production Research, pp. 2991-3002, 2001.
- Mandal, S.; Maiti, J. Risk analysis using FMEA: fuzzy similarity value and possibility theory based approach. Expert Syst. Appl. 2014, 41, 3527–3537. [Google Scholar] [CrossRef]
- Gupta, G.; Ghasemian, H.; Janvekar, A.A. A Novel Failure Mode Effect and Criticality Analysis (FMECA) Using Fuzzy Rule-Based Method: A Case Study of Industrial Centrifugal Pump. Engineering Failure Analysis 2021, 123, 105305. [Google Scholar] [CrossRef]
- Machine learning yearning, Online. Available online: https://nessie.ilab.sztaki.hu/~kornai/2020/AdvancedMachineLearning/Ng_MachineLearningYearning.pdf.
- Lee, J.; Ardakani, H.D.; Yang, S.; Bagheri, B. Industrial Big Data Analytics and Cyber-Physical Systems for Future Maintenance & Service Innovation. Procedia CIRP 2015, 38, 3–7. [Google Scholar] [CrossRef]
- Mobley, R.K. An Introduction to Predictive Maintenance; Elsevier: Amsterdam, 2002. [Google Scholar]
- Lughofer, E.; Sayed-Mouchaweh, M. Predictive Maintenance in Dynamic Systems Springer: Berlin, ISBN 978-3-030-05645, 2019-2.
- Dhillon, B.S. , Reliability, Maintainability and Safety for Engineers; CRC Press: Boca Raton, USA, 2020; ISBN 978-0367352653. [Google Scholar]
- Abaei, M.M.; Hekkenberg, R.; BahooToroody, A. A Multinomial Process Tree for Reliability Assessment of Machinery in Autonomous Ships. Reliability Engineering & System Safety 2021, 210, 107484. [Google Scholar] [CrossRef]
- Carvalho, T.P.; Soares, F.A.A.M.N.; Vita, R.; Francisco, R.d.P.; Basto, J.P.; Alcalá, S.G.S. A systematic literature review of machine learning methods applied to predictive maintenance. Comput. Ind. Eng. 2019, 137, 106024. [Google Scholar] [CrossRef]
- Joshi, A.; Khosravy, M.; Gupta, N. Machine learning for predictive analysis. In Proceedings of the ICTIS 2020; Springer: Berlin, 2020. [Google Scholar]
- Pommé, L.-E.; Bourqui, R.; Giot, R.; Auber, D. Relative Confusion Matrix: Efficient Comparison of Decision Models. International Conference Information Visualisation (IV) 2022. [Google Scholar] [CrossRef]
- Hu, X.; Qian, X.; Yang, X. Remaining useful life prediction based on a joint model with degradation-failure association structures, U.P.B. Sci. Bull. Series D Vol.85 2023 ISSN 1454-2358. Available online: https://www.scientificbulletin.upb.ro/rev_docs_arhiva/full002_778083.pdf.
- Maintenance Terminology. European Standard; European Committee for Standardization: EN13306 Brussels, 2017.
- Trojan, F.; Marçal, R.F. Proposal of maintenance-types classification to clarify maintenance concepts in production and operations management. J. Bus. Econ. 2017, 8, 560–572. [Google Scholar]
- Gašpar, G.; Poljak, I.; Orović, J. Computerized Planned Maintenance System Software Models. Pomorstvo 2018, 32, 141–145. [Google Scholar] [CrossRef]
- Stazić, L.; Račić, N.; Stanivuk, T.; Dobrota, Đ. Determination of Benefits of the Application of CMMS Database Improvement Proposals. Applied Sciences 2023, 13, 2731. [Google Scholar] [CrossRef]
- Wang, C.; Zhou, B.; Li, P.; Li, P. Study on Maintenance Progress FMECA for Ship Equipment. 2017 International Conference on Computer Technology, Electronics and Communication (ICCTEC) 2017, doi:10.1109/icctec.2017.00073. [CrossRef]
- Knežević, V.; Orović, J.; Stazić, L.; Čulin, J. Fault Tree Analysis and Failure Diagnosis of Marine Diesel Engine Turbocharger System. Journal of Marine Science and Engineering 2020, 8, 1004. [Google Scholar] [CrossRef]
- Eriksen, S.; Utne, I.B.; Lützen, M. An RCM Approach for Assessing Reliability Challenges and Maintenance Needs of Unmanned Cargo Ships. Reliability Engineering & System Safety 2021, 210, 107550. [Google Scholar] [CrossRef]
- Park, J.; Oh, J. Anomalistic Symptom Judgment Algorithm for Predictive Maintenance of Ship Propulsion Engine Using Machine Learning. Applied Sciences 2023, 13, 11818. [Google Scholar] [CrossRef]
- Postolache, F. Programarea calculatoarelor si limbaje de programare prin exemple practice. Editura Academiei Navale Mircea cel Bătrân Constanţa, 2018.
- Yu, J. Research Process on Software Development Model. IOP Conference Series Materials Science and Engineering 2018, 394, 032045. [Google Scholar] [CrossRef]
- Tinga, T.; Tiddens, W.; Amoiralis, F.; Politis, M. “Predictive maintenance of maritime systems: Models and challenges,” Safety and Reliability – Theory and Applications, 2017.
- Scheu, M.N.; Tremps, L.; Smolka, U.; Kolios, A.; Brennan, F. A Systematic Failure Mode Effects and Criticality Analysis for Offshore Wind Turbine Systems towards Integrated Condition Based Maintenance Strategies. Ocean Engineering 2019, 176, 118–133. [Google Scholar] [CrossRef]
- Van Ta, T.; Vu, N.H.; Triet, M.A.; Thien, D.M.; Cang, V.T. Assesment of Marine Propulsion System Reliability Based on Fault Tree Analysis. International Journal of Transportation Engineering and Technology 2017, 2, 55. [Google Scholar] [CrossRef]
- Abaei, M.M.; Hekkenberg, R.; BahooToroody, A. A Multinomial Process Tree for Reliability Assessment of Machinery in Autonomous Ships. Reliability Engineering & System Safety 2021, 210, 107484. [Google Scholar] [CrossRef]
- Ehiagwina, F.O.; Kehinde, O.O.; Sidiq, N.; Afolabi, L.O.; Olatinwo, I.S. Fault tree analysis and its modifications as tools for reliability and risk analysis Ebgineering systems – an overview, January 2022. Online. International Journal of Research Publication and Reviews; Volume 3; pp. 383–396. Available online: https://ijrpr.com/uploads/V3ISSUE1/IJRPR2327.pdf.
- Bayraktar, M.; Nuran, M. Reliability, availability and maintainability analysis of the propulsion system of a fleet. Zesz. Nauk. Akad. Morsk. Szczecinie; Scientific Journals of the Maritime University of Szczecin, 70, 63–70. Available online: https://repository.am.szczecin.pl/handle/123456789/2710.
- Vahed, A.T.; Ghodrati, B.; Hossienie, H. Enhanced K-Nearest Neighbors Method Application in Case of Draglines Reliability Analysis. In Springer eBooks; 2019; pp. 481–488.
- Tiwari, A. Supervised Learning: From Theory to Applications. In Elsevier eBooks; 2022; pp. 23–32. [CrossRef]
- Sisode, M.; Devare, M. A Review on Machine Learning Techniques for Predictive Maintenance in Industry 4.0. Advances in Computer Science Research 2023, 774–783. [Google Scholar] [CrossRef]
- Zhang, P.; Gao, Z.; Cao, L.; Dong, F.; Zou, Y.; Wang, K.; Zhang, Y.; Sun, P. Marine Systems and Equipment Prognostics and Health Management: A Systematic Review from Health Condition Monitoring to Maintenance Strategy. Machines 2022, 10, 72. [Google Scholar] [CrossRef]
- De Aguiar Vallim Filho, A.R.; Moraes, D.F.; De Aguiar Vallim, M.V.B.; Da Silva, L.S.; Da Silva, L.A. A Machine Learning Modeling Framework for Predictive Maintenance Based on Equipment Load Cycle: An Application in a Real World Case. Energies 2022, 15, 3724. [Google Scholar] [CrossRef]
- Traini, E.; Bruno, G.; D’Antonio, G.; Lombardi, F. Machine Learning Framework for Predictive Maintenance in Milling. IFAC-PapersOnLine 2019, 52, 177–182. [Google Scholar] [CrossRef]
- Brown, C. Why and How to Employ the SIPOC Model. Journal of Business Continuity & Emergency Planning 2019. [CrossRef]
- Mishra, P.; Sharma, R.K. A Hybrid Framework Based on SIPOC and Six Sigma DMAIC for Improving Process Dimensions in Supply Chain Network. International Journal of Quality & Reliability Management 2014, 31, 522–546. [Google Scholar] [CrossRef]
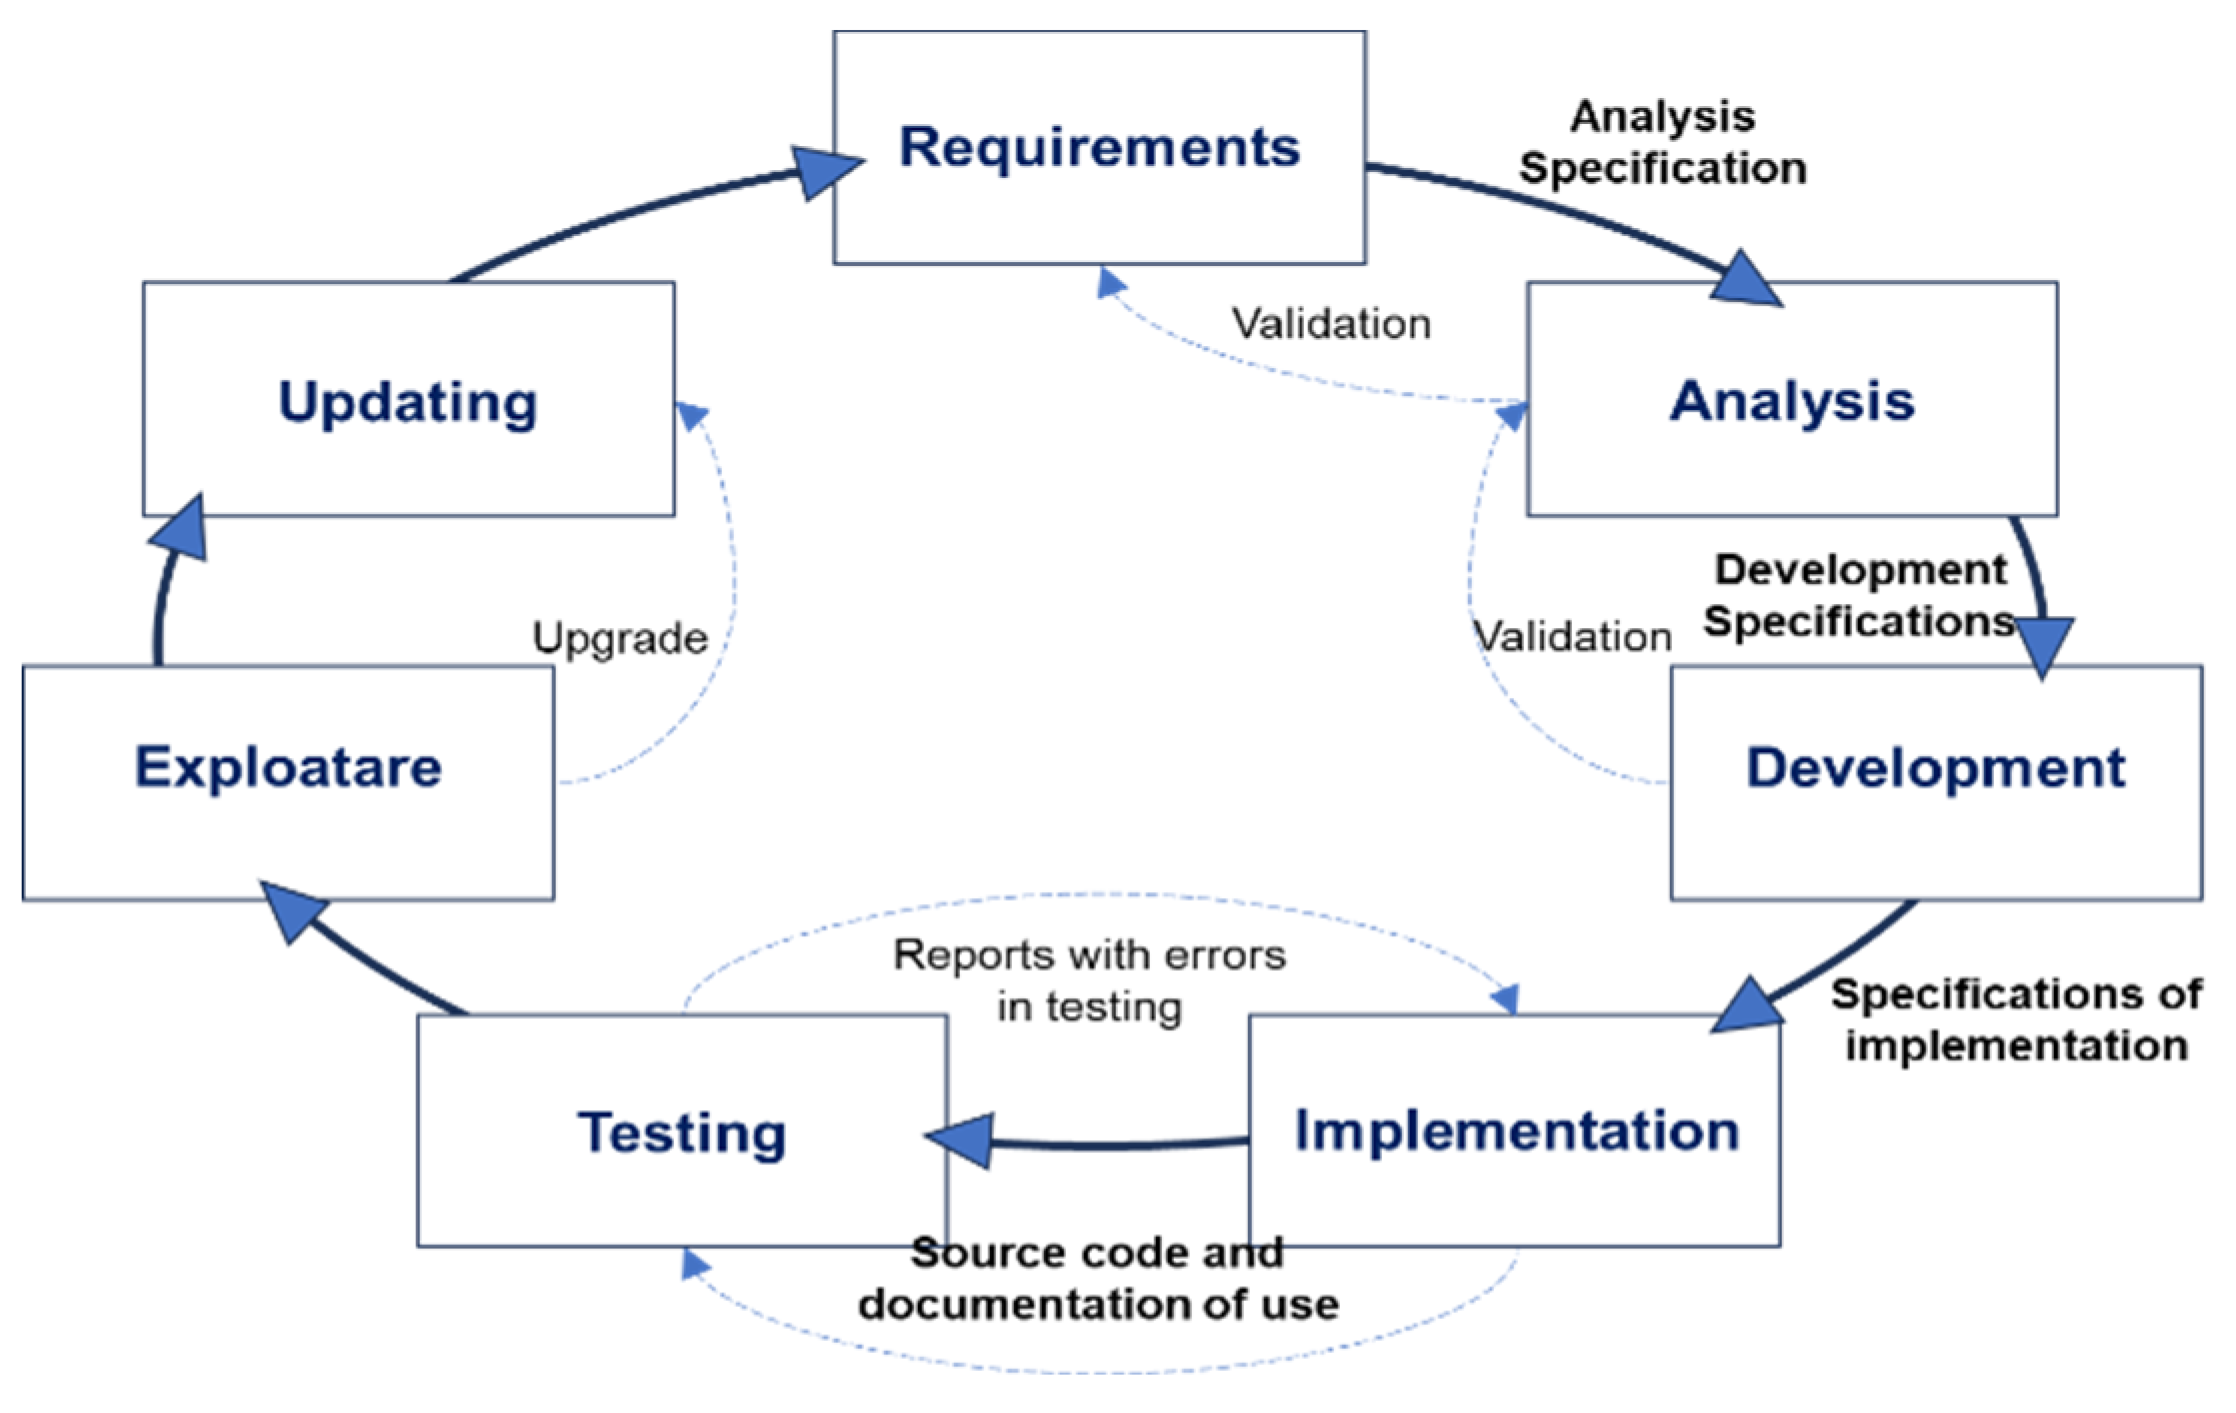
Figure 2.
The SIPOC diagram for integrating research methods.
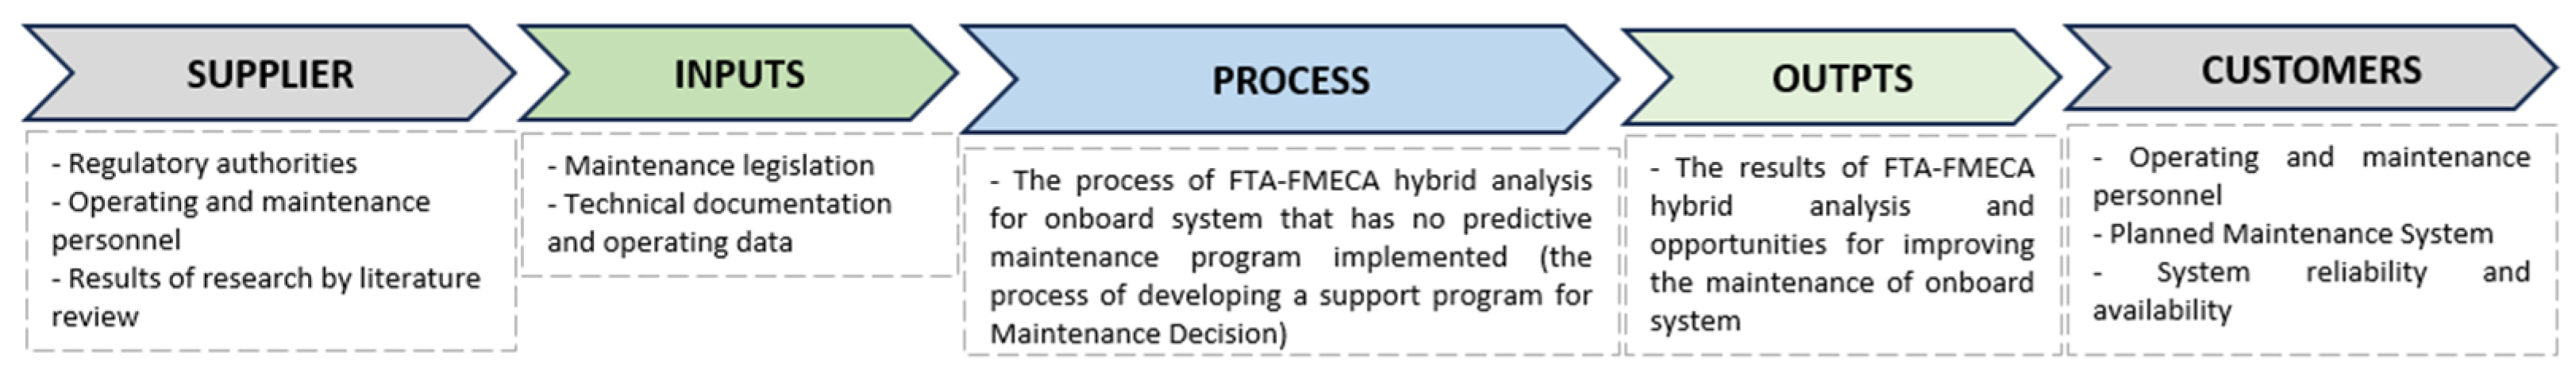
Figure 3.
The proposed algorithm with submodules.
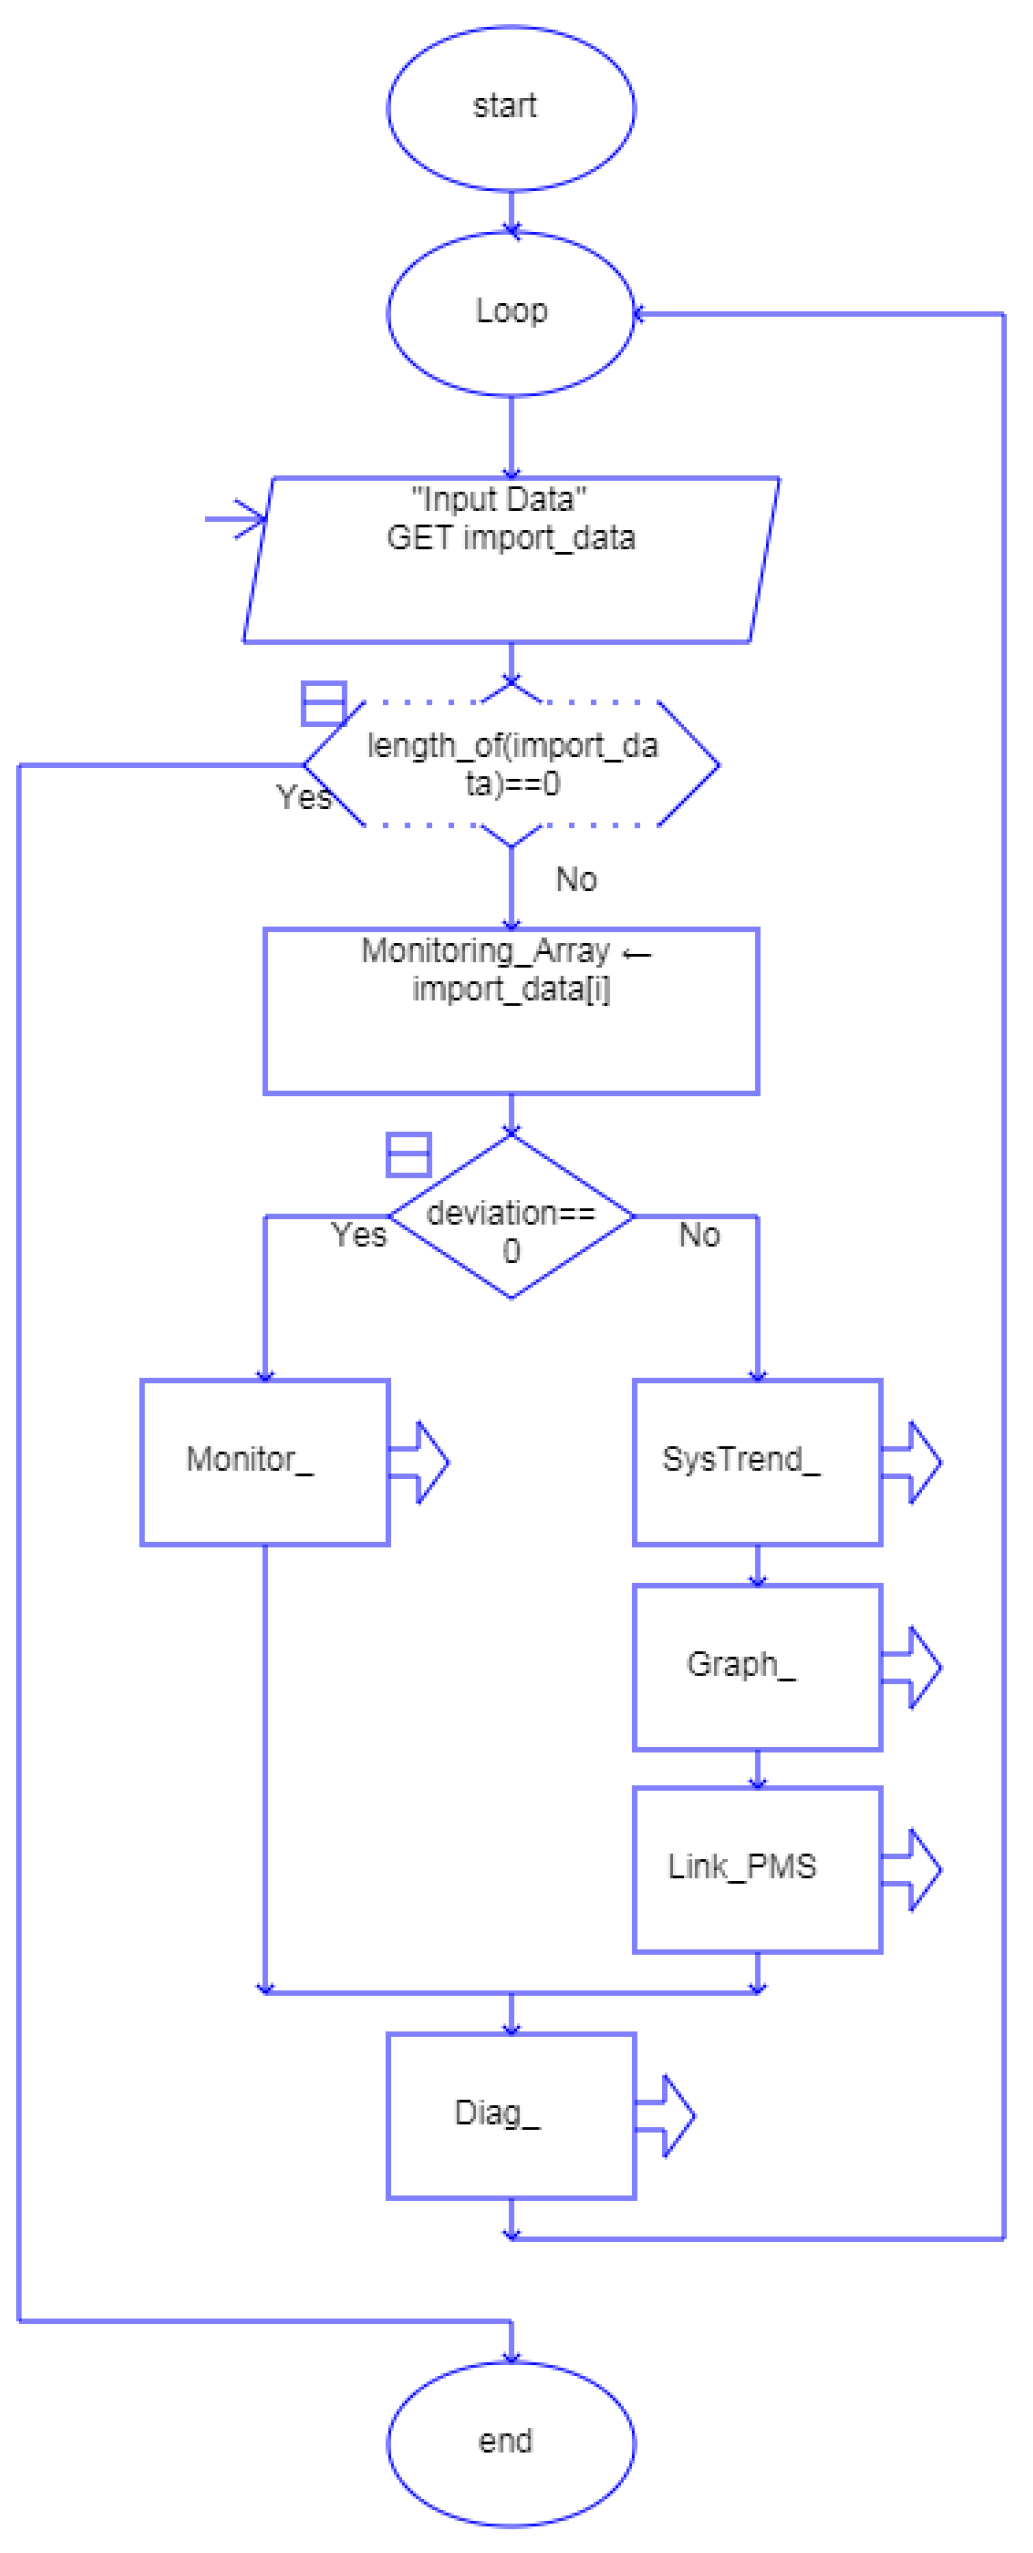
Figure 4.
DIAG Logical Sequence Module.
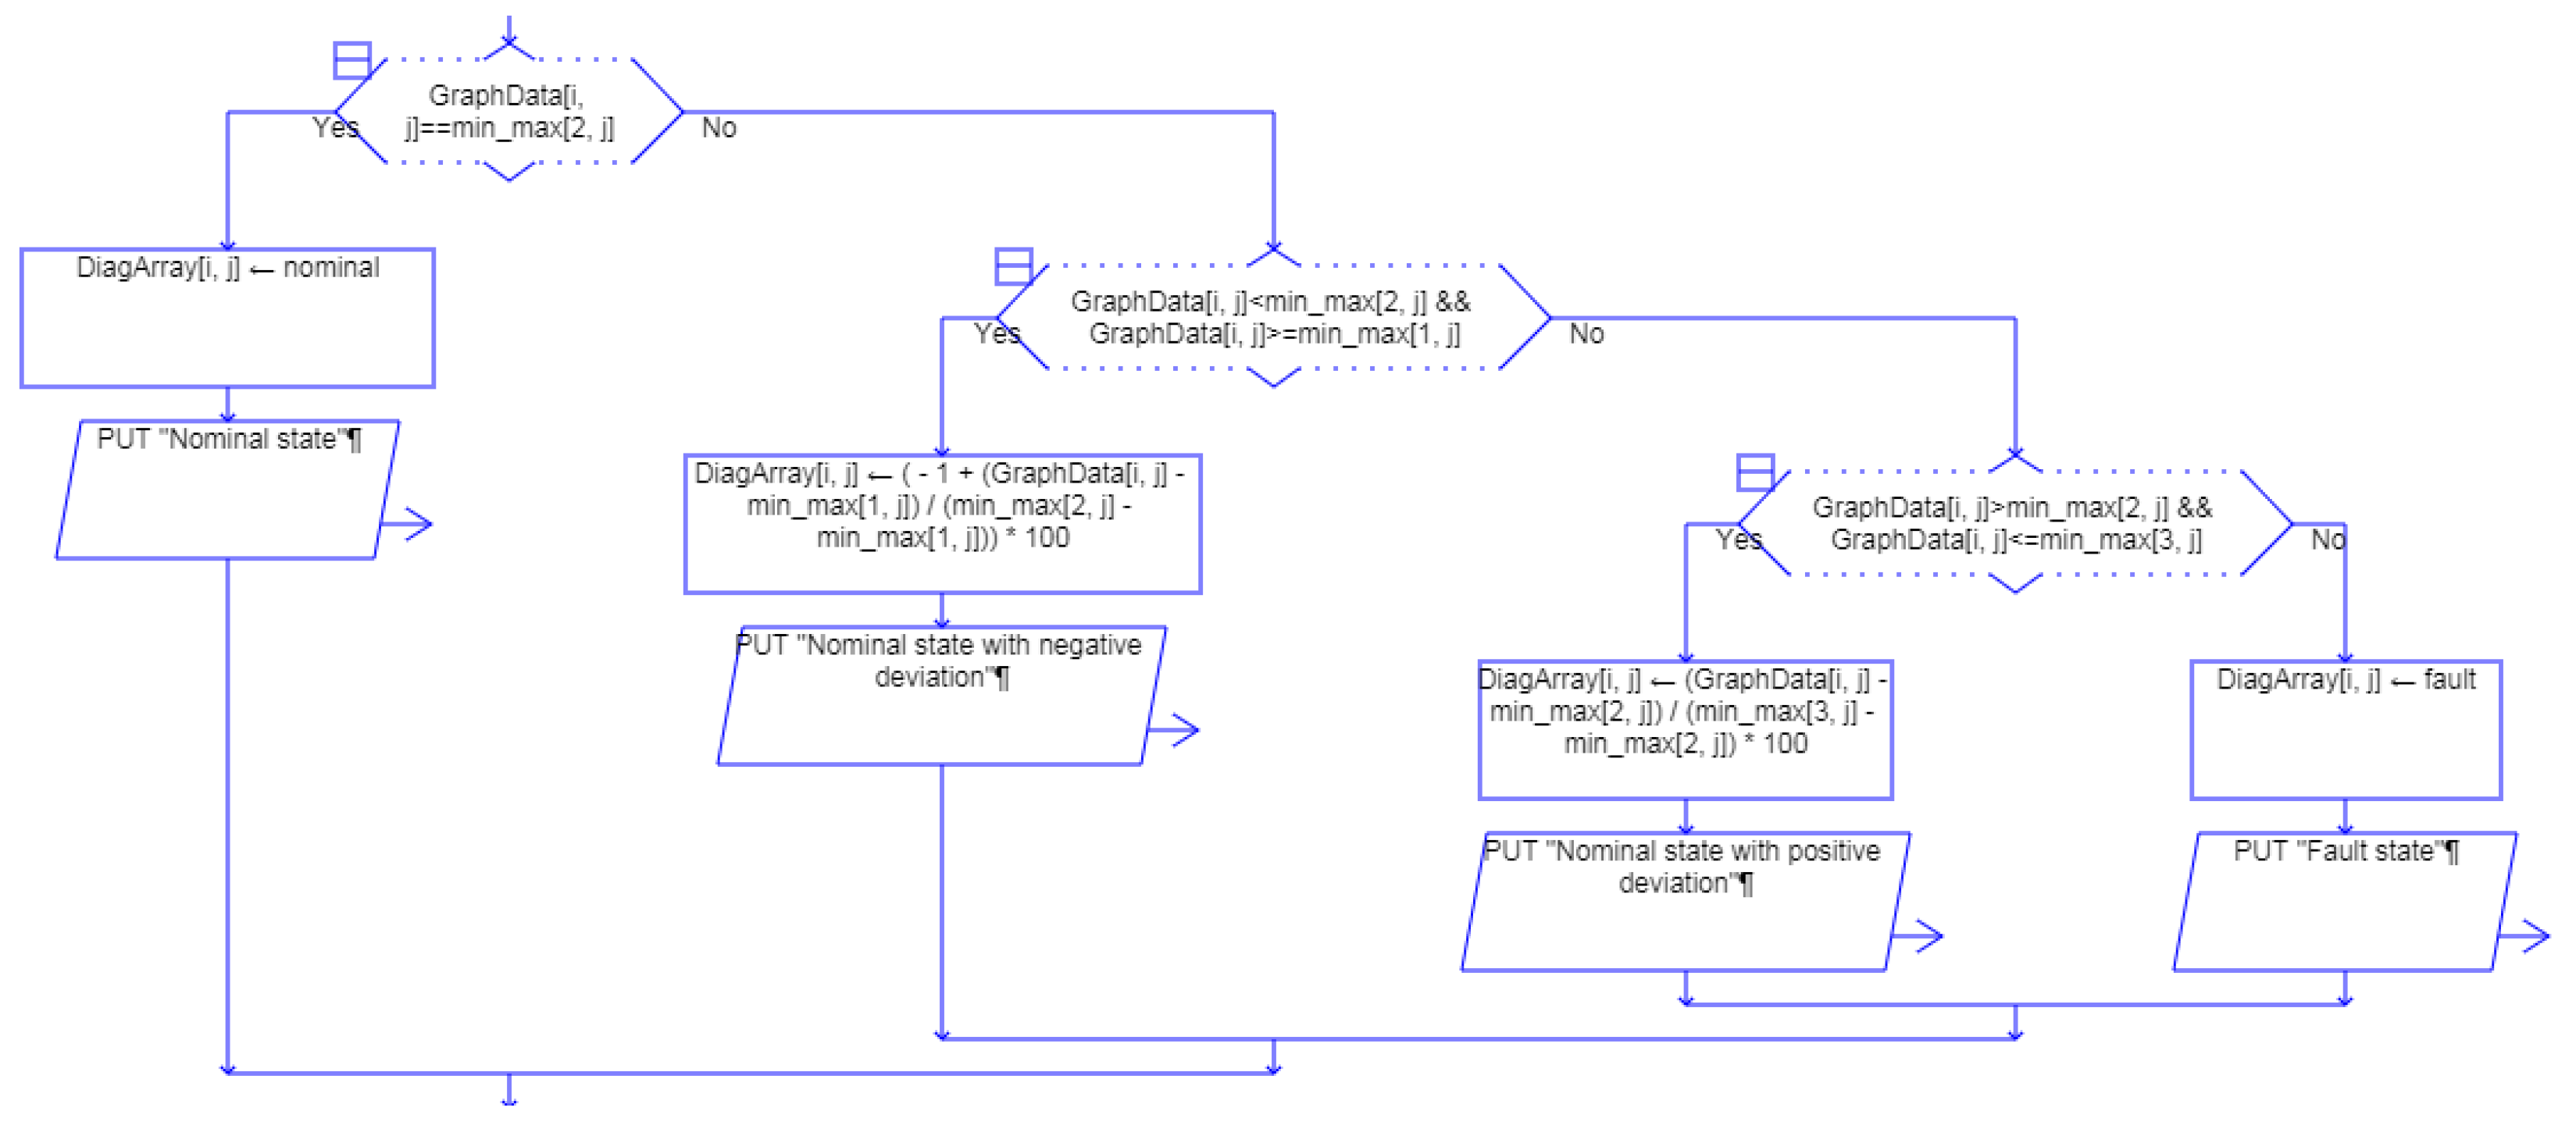
Figure 5.
Graphical interface for MONITOR module.
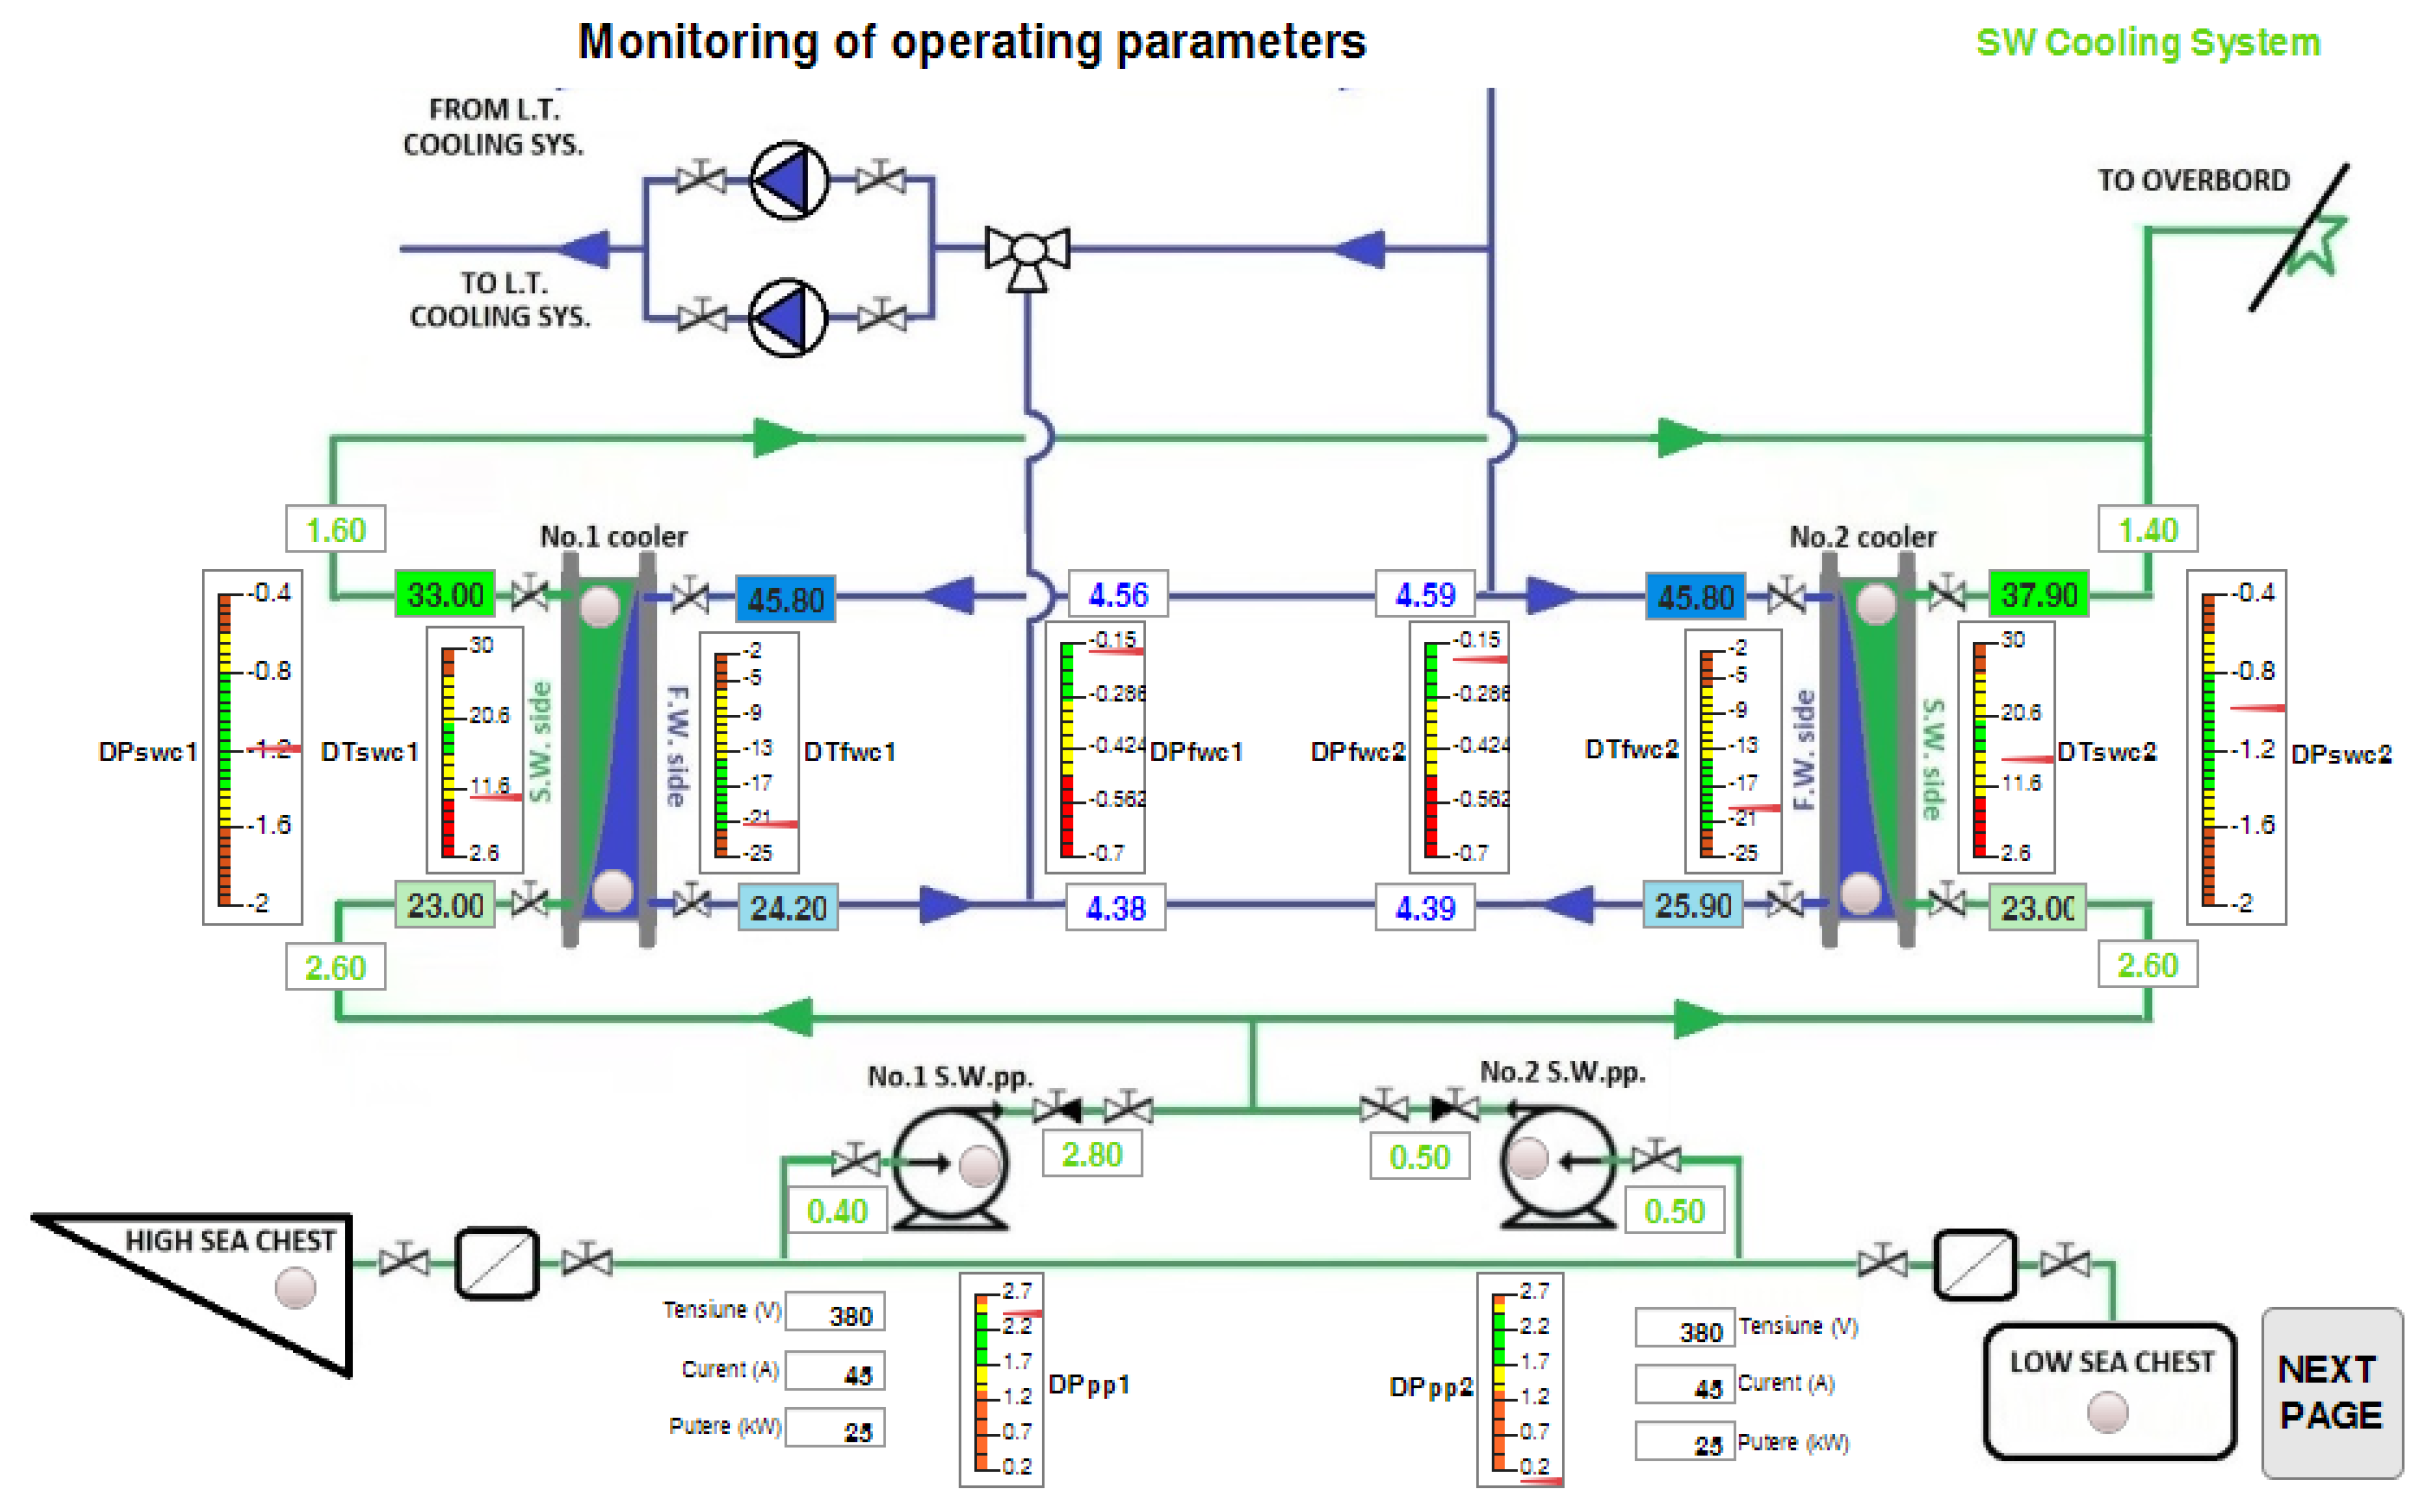
Figure 6.
DIAG module results.
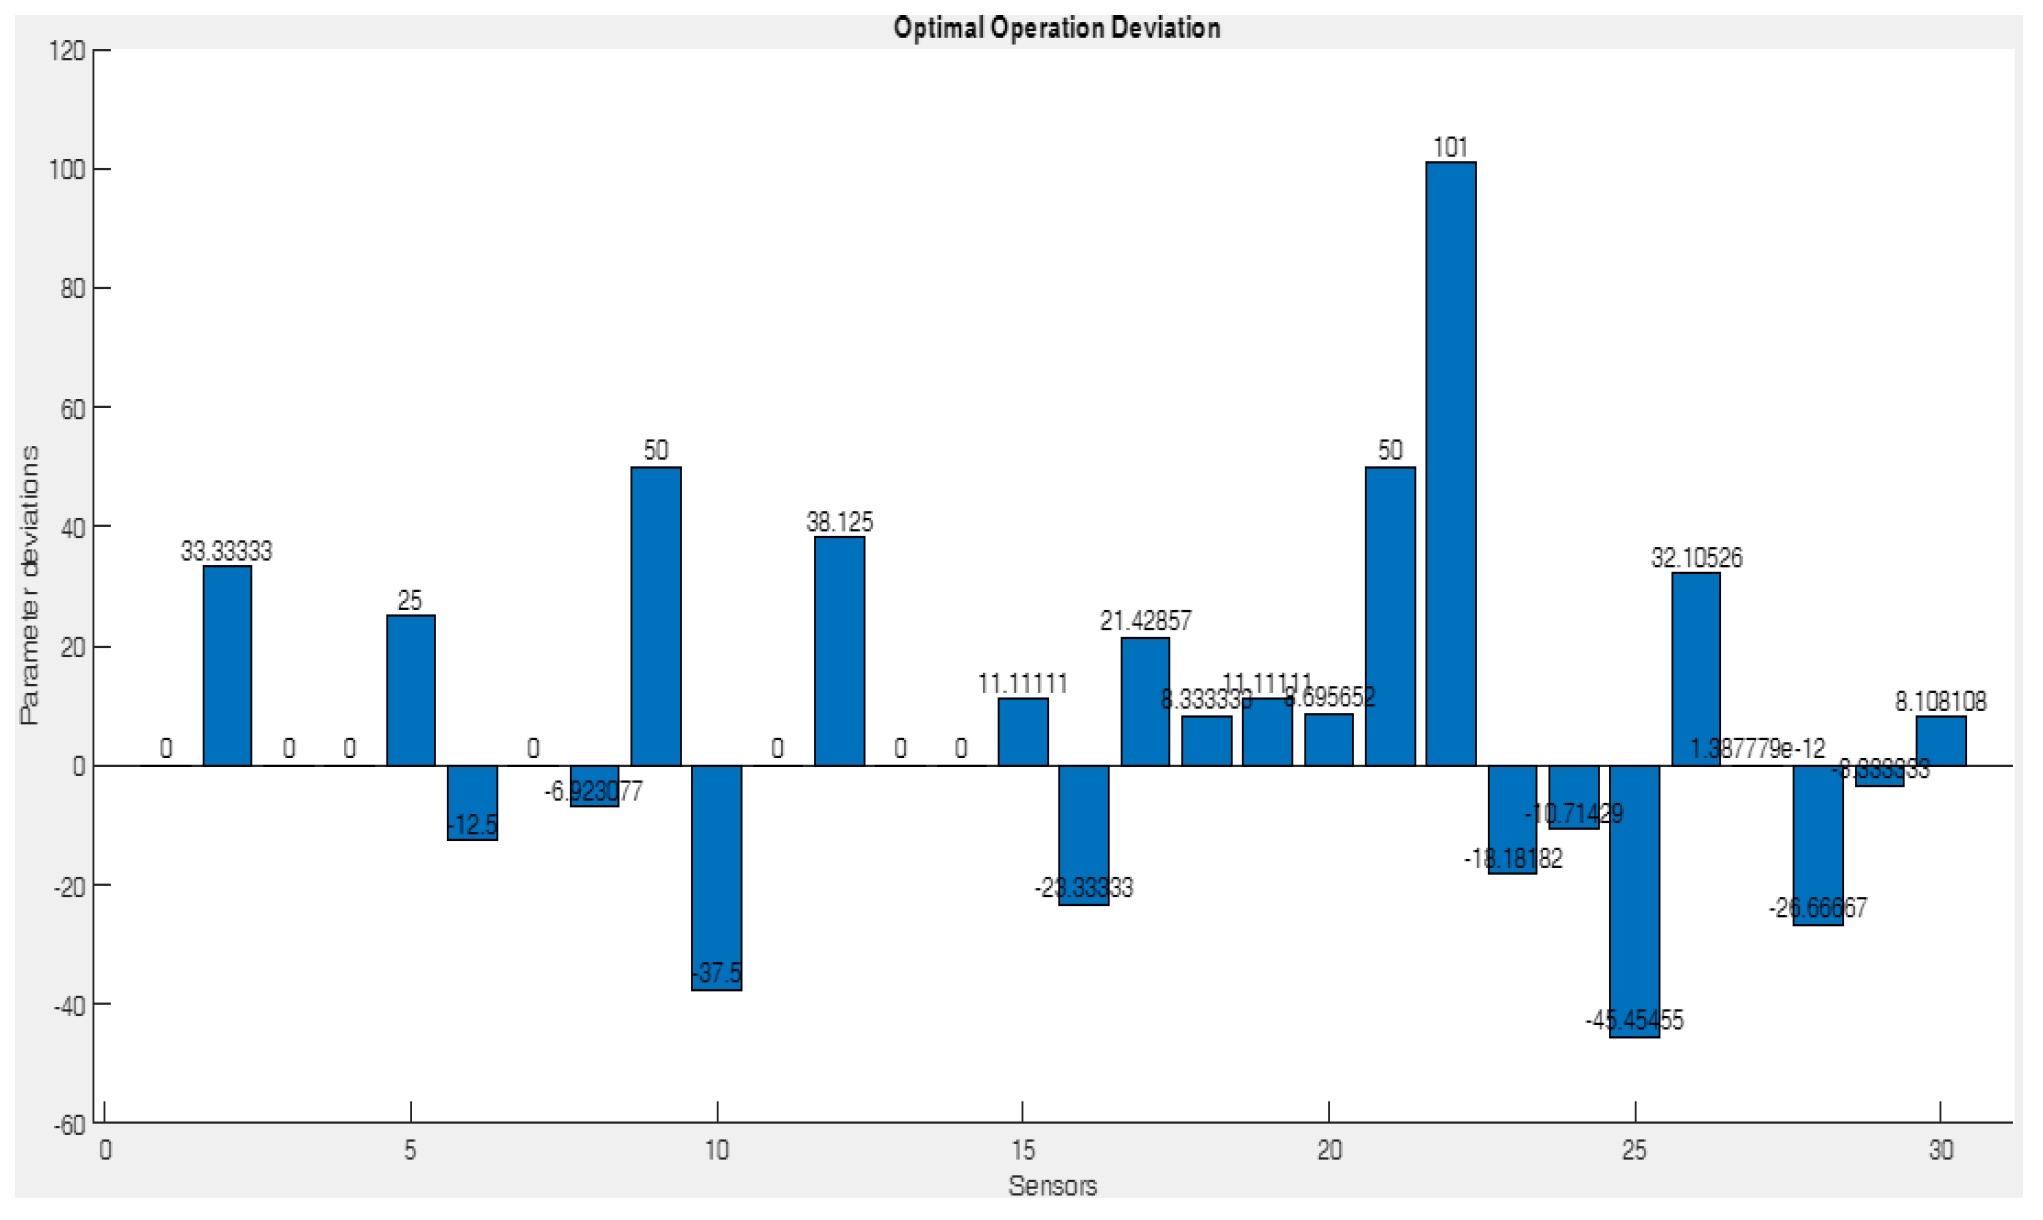
Figure 7.
KNN classification in ANALYSIS module.
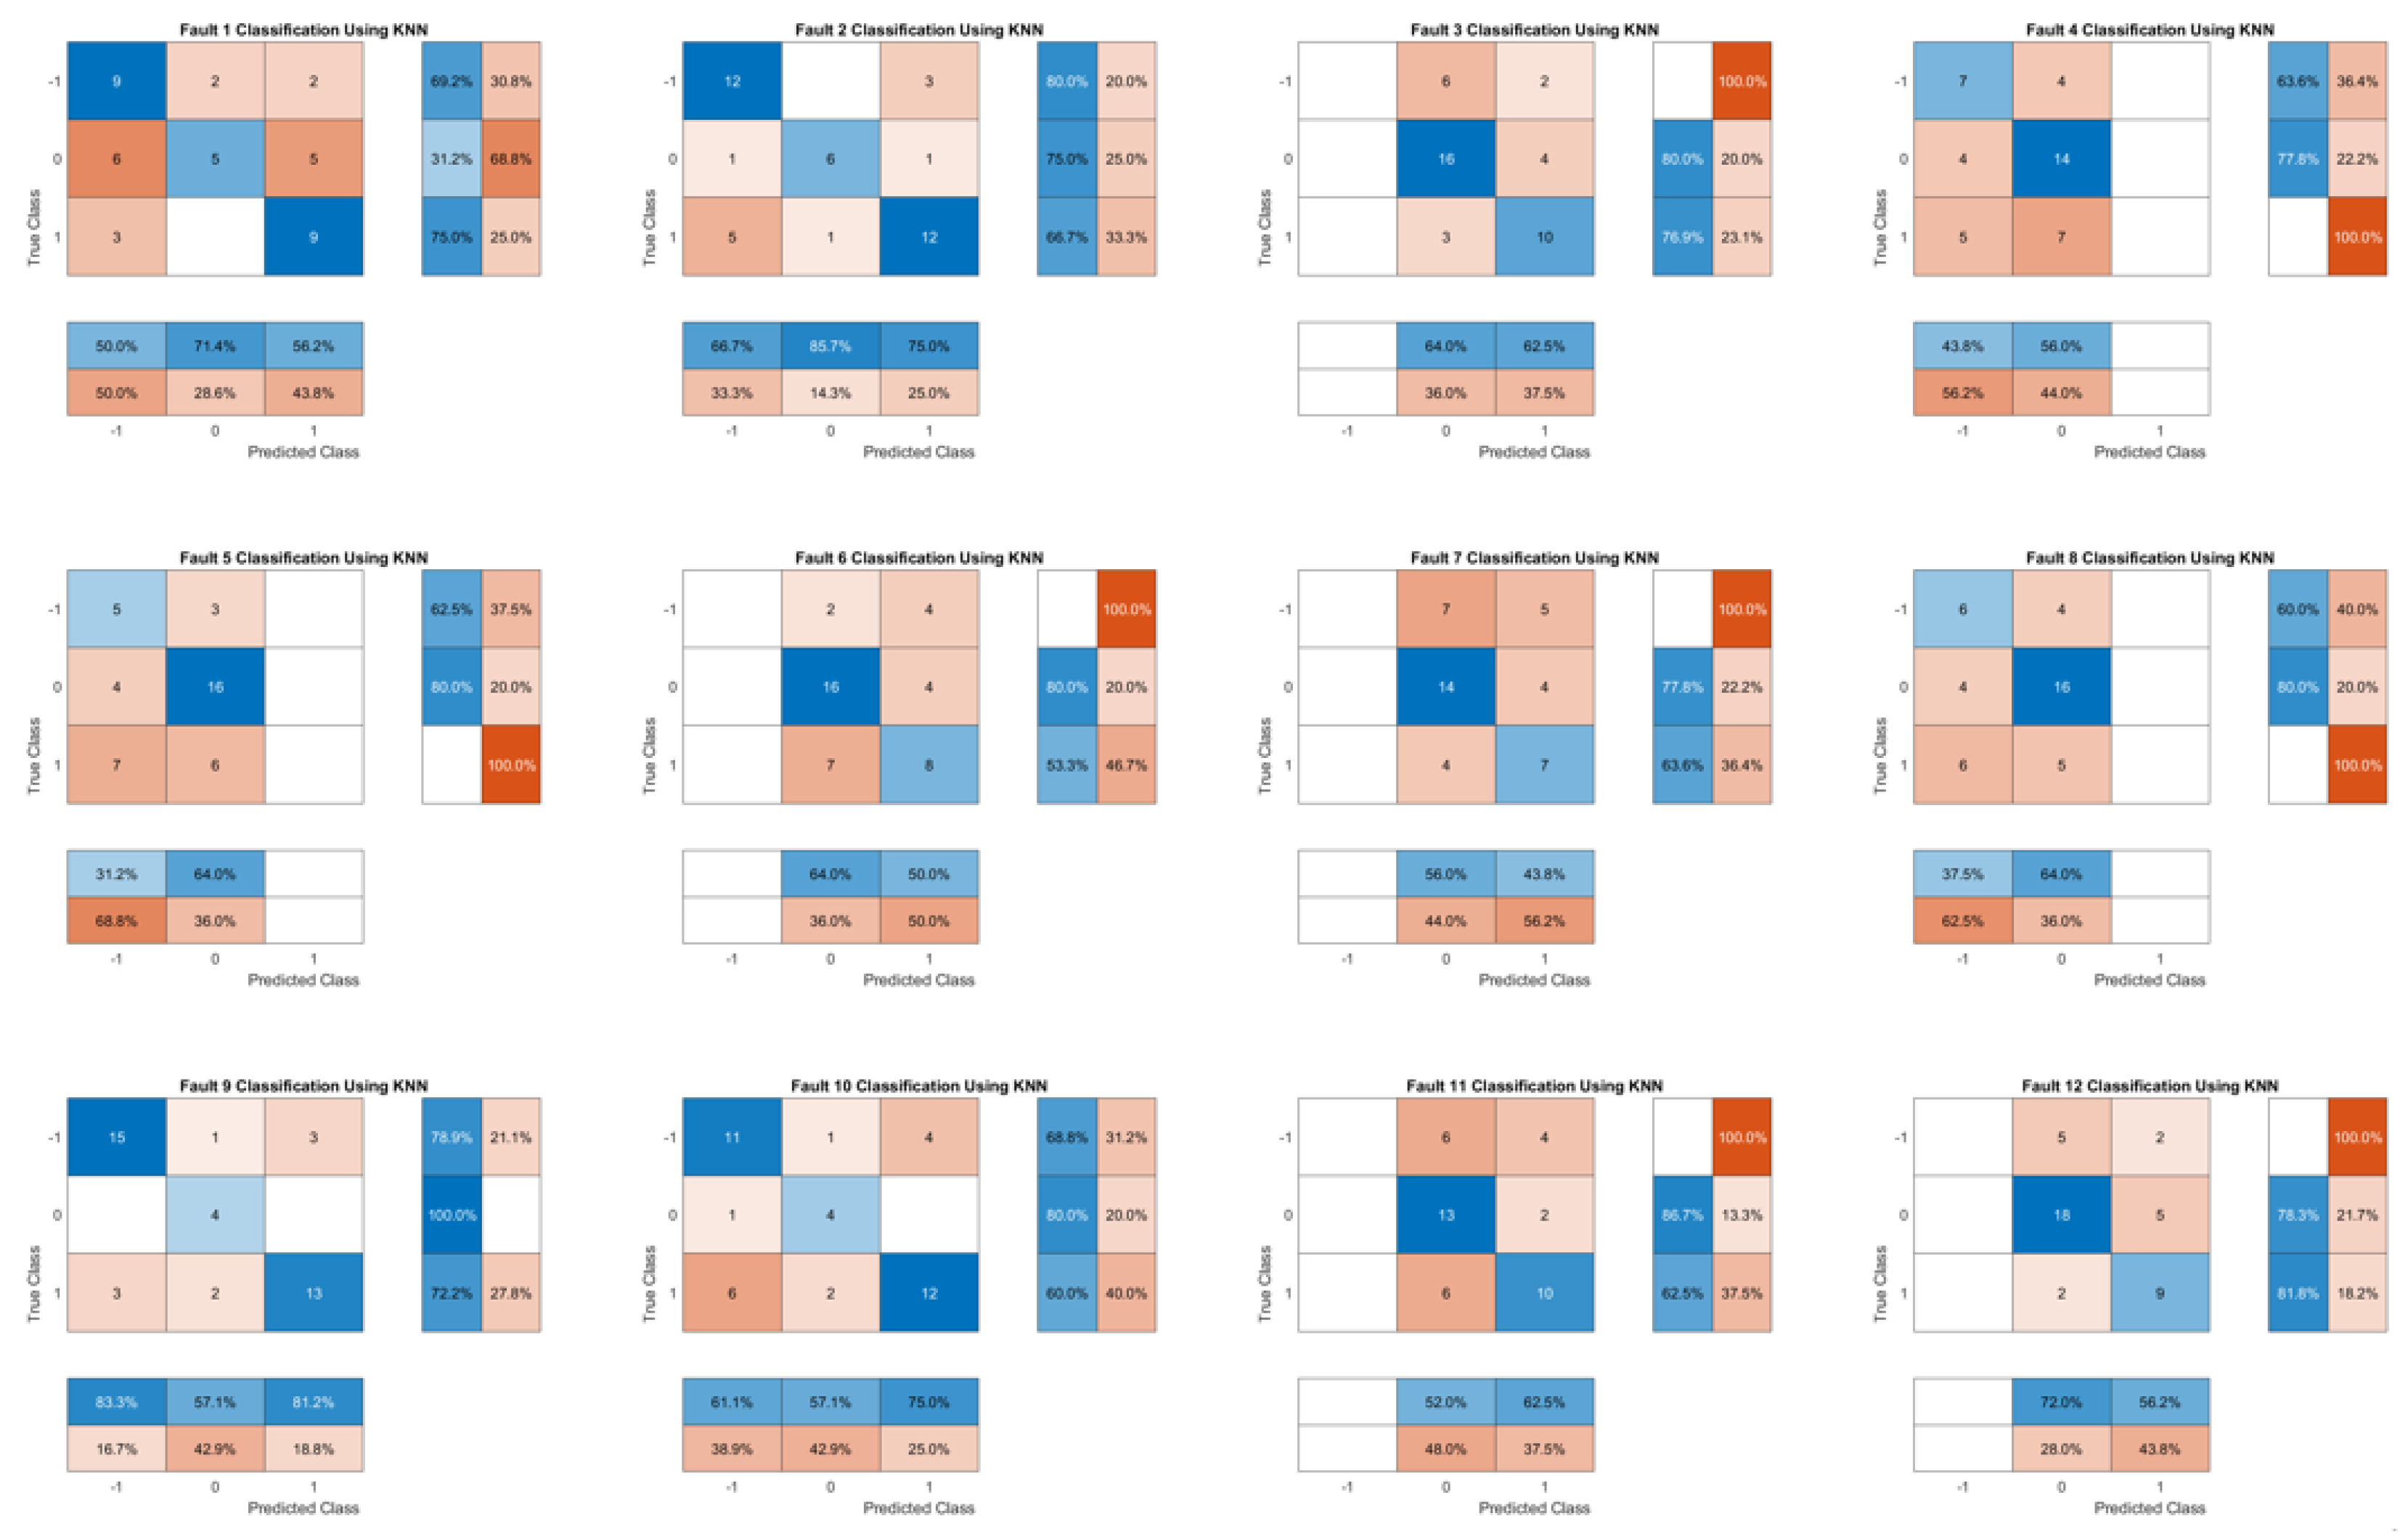
Figure 8.
Fault hierarchy in ANALYSIS module.
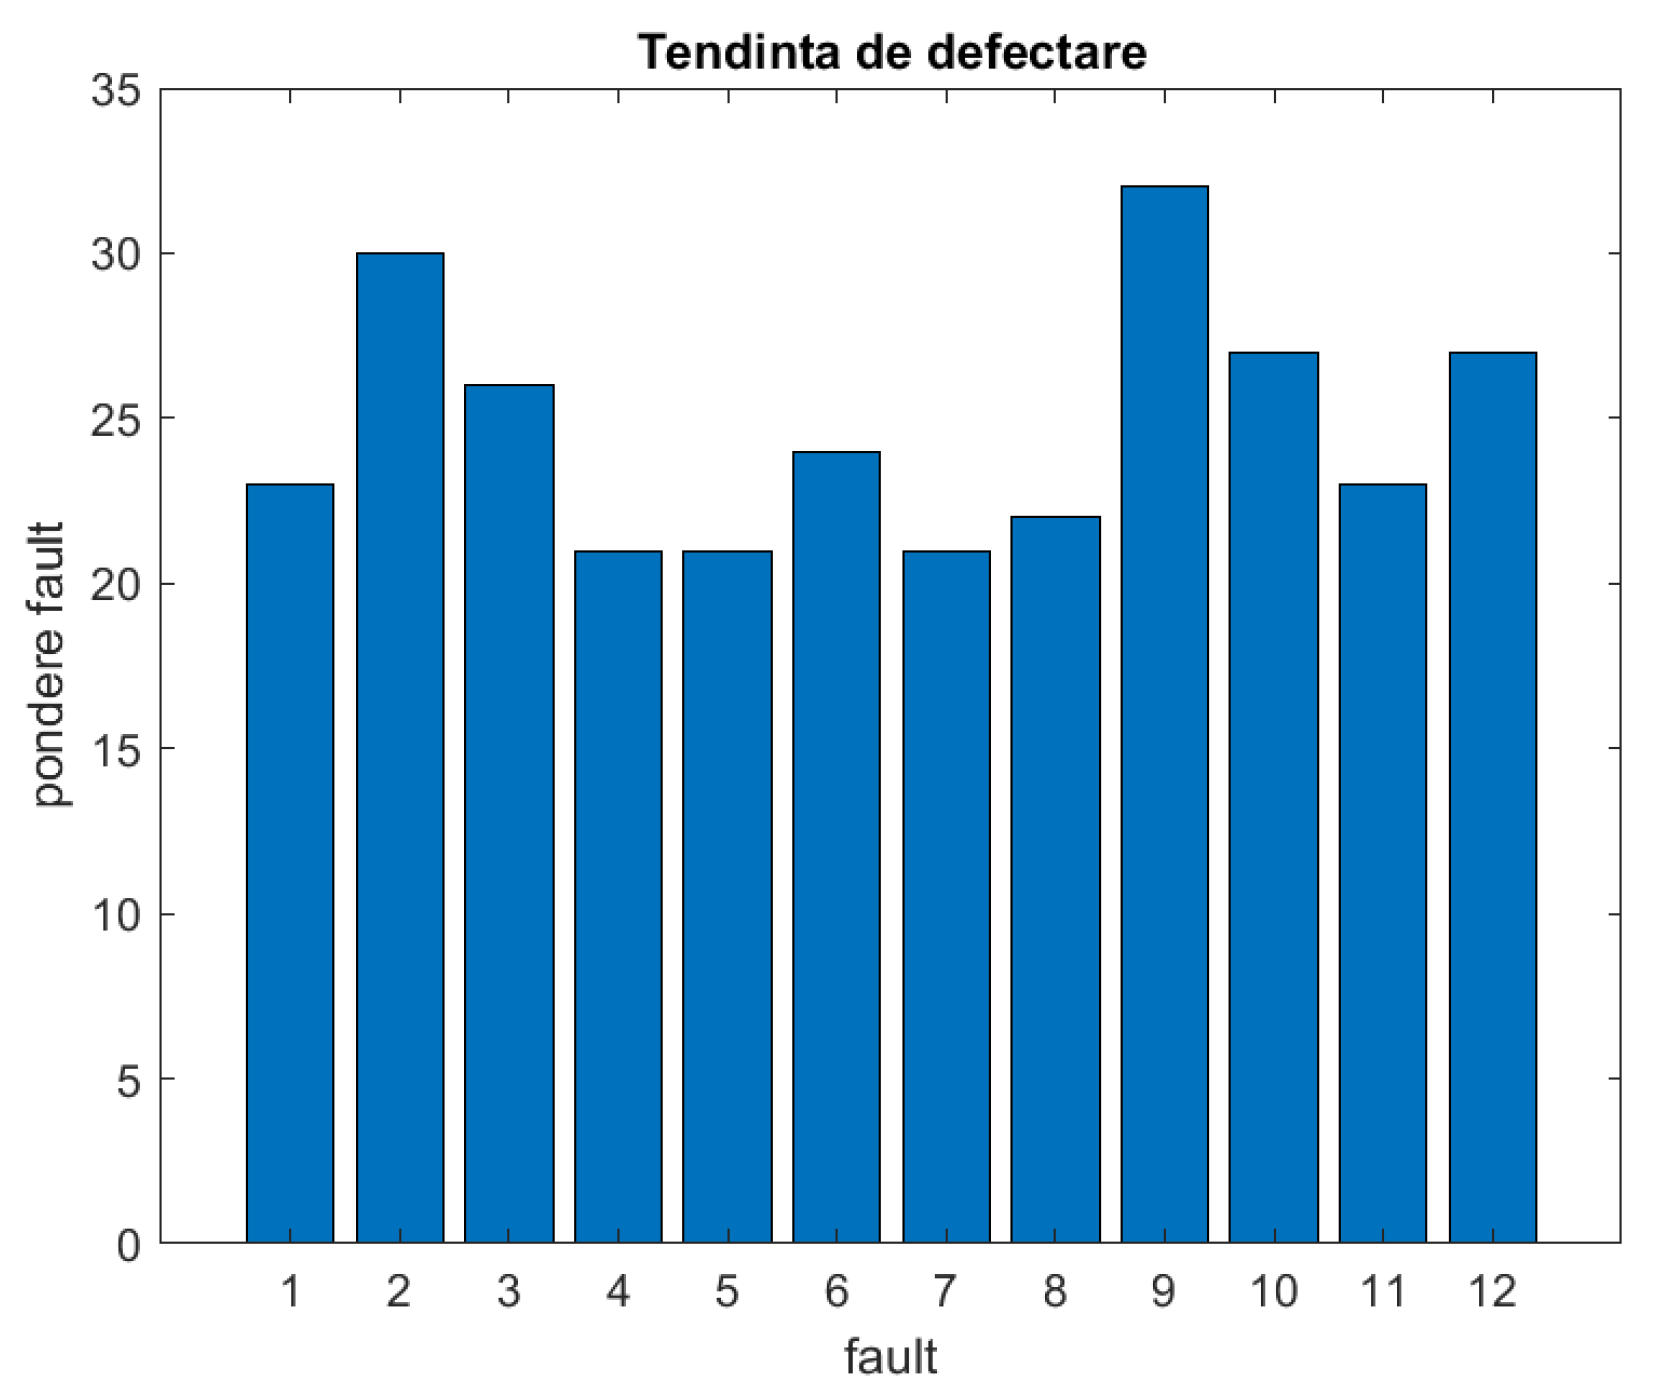
Figure 9.
2D graphical representation for the selected parameters in GRAPH module.
Disclaimer/Publisher’s Note: The statements, opinions and data contained in all publications are solely those of the individual author(s) and contributor(s) and not of MDPI and/or the editor(s). MDPI and/or the editor(s) disclaim responsibility for any injury to people or property resulting from any ideas, methods, instructions or products referred to in the content. |
© 2024 by the authors. Licensee MDPI, Basel, Switzerland. This article is an open access article distributed under the terms and conditions of the Creative Commons Attribution (CC BY) license (http://creativecommons.org/licenses/by/4.0/).
Copyright: This open access article is published under a Creative Commons CC BY 4.0 license, which permit the free download, distribution, and reuse, provided that the author and preprint are cited in any reuse.


