

Submitted:
09 September 2024
Posted:
10 September 2024
You are already at the latest version
Abstract
This paper presents three approaches to estimating battery parameters of the electrical equivalent circuit model (ECM) based on electrochemical impedance spectroscopy (EIS); these approaches are referred to as (a) least squares (LS), (b) exhaustive search (ES), and (c) nonlinear least squares (NLS). The ES approach is assisted with the LS method for the rough determination of the lower and upper bound of the ECM parameters, and the NLS approach is incorporated with the Monte Carlo run such that different initial guesses can be assigned to improve the goodness of EIS fitting. The proposed approaches are validated using both simulated and real EIS data. Compared to LS approach, the ES and NLS approaches show better fitting accuracy at various noise levels; whereas both in the validation using simulated EIS data and actual EIS data collected from LG 18650 and Molicel 21700 batteries, the NLS approach shows better fitting accuracy than that of LS and ES approaches. In all cases, compared with the ES approach, the computational time of the NLS approach is significantly faster, and compared with the LS approach, the NLS approach shows a minimal difference in computational time and considerably better fitting performance.
Keywords:
Li-ion battery (LIB)
; battery parameters estimation
; battery management system
; electrochemical impedance spectroscopy (EIS)
; electrical equivalent circuit models (ECM)
; exhaustive search (ES)
; least squares (LS)
; Monte-Carlo run
; nonlinear least squares (NLS)
1. Introduction
Battery Management System (BMS) is a crucial component in electric vehicles (EVs), renewable energy systems, and other applications that use rechargeable batteries to ensure safe and efficient operation. The primary function of a BMS is to monitor the battery’s state of charge (SOC) and state of health (SOH) [1]. Electrochemical impedance spectroscopy (EIS) was proposed by Heaviside 1894 [2], it has become an essential tool in the study and development of batteries, this allows researchers to better understand the fundamental electrochemical mechanisms such that correct strategies can be implemented in BMS for improving battery performance and lifespan.
EIS has been used to study the ion transport properties and electrode/electrolyte interfacial behavior of Li-ion batteries, providing insights into their performance and potential avenues for improvement [3]. In a typical EIS experiment, a small amplitude sinusoidal current/voltage signal is applied to the battery, and the resulting voltage/current response is measured over a range of frequencies [4]. The resulting impedance data can be analyzed using equivalent electrical circuit models to extract information on the underlying electrochemical behavior [5]. EIS can provide detailed information on the electrochemical processes occurring within the battery, including the charge transfer kinetics, ion transport properties, and electrode/electrolyte interfacial behavior [6]. Pastor-Fernández et al. [7] conducted the battery aging identification and quantification research by analyzing the EIS of four parallel Li-ion cells.
The EIS can be characterized using an equivalent circuit model (ECM), which represents the battery as a combination of resistive, inductive, and capacitive components; then, the ECM parameters can be identified by fitting the ECM to the measured EIS data [8]. There are different ECM models relevant to different types of batteries, this requires prior knowledge of the battery chemistry [9]; furthermore, by iteratively adjusting the ECM parameters, the best fit can be obtained.
There are various approaches to fit the ECM model to the measured EIS data. For instance, nonlinear least squares (NLS) approach can be used to estimate the parameters of a nonlinear model; this aims to optimize the nonlinear function such that the difference between experimental data and the estimations based on the ECM model can be minimized [10]. Xu et al. [11] applied a NLS approach to fit the EIS data of a supercapacitor using the ECM model, this approach can identify the ECM parameters by minimizing the error between measurements and predictions.
Besides, Genetic Algorithm (GA) is a population-based optimization approach that can also be used in fitting the ECM to EIS data; however, the computational complexity of this approach will increase significantly with the number of ECM parameters, which means that a large number of iterations are needed; furthermore, the selection of population size, mutation rate, and crossover rate requires continuous tuning to reach the optimal estimation [12].
The complex nonlinear least squares (CNLS) approach is widely used to fit the ECM model to EIS data. Pastor-Fernández et al. [7] applied the CNLS algorithm to fit ECM to the EIS data measured from four Lion-ion batteries. Feng et al. [13] applied CNLS approach to estimate ECM parameters using the EIS data collected from a battery cell at different SOC level and temperature. The drawback of this approach is that the fitting accuracy can easily be affected by the initial guess of the ECM parameters; for instance, the optimization algorithm may converge to a local minimum instead of converging to a global minimum if the initial guess is selected inappropriately; this will lead to inaccurate ECM parameter estimation. Also, CNLS approach requires the specification of ECM models, such as the number of components and the arrangement of RC circuits, which leads to extra work being done before the fitting process; furthermore, CNLS is a computationally expensive approach, especially when the size of EIS measurements are large [14].
Ghadi [15] applied the least squares (LS) approach to fit the EIS data to identify ECM parameters by assuming the solid electrolyte interphase (SEI) arc and charge transfer (CT) arc as semicircle, and the solid electrolyte interphase resistance and charge transfer resistance is the diameter of the SEI arc and the CT arc, respectively; the merit of this approach is that the estimation of the parameters can be expressed in closed form; however, the main drawback is that the accuracy of this approach is not sufficient. One of the improvements is to apply the exhaustive search (ES) approach to identify more accurate estimations of ECM parameters with the assistance of LS approach, in this paper, the ES approach will be explained in detail.
Furthermore, we proposed a novel NLS approach which only needs to define the objective function, then, randomly choose the initial guess in each Monte-Carlo Run and the estimated parameters that can reach the lowest fitting error will be selected. While the ES approach can somewhat reach a better fitting accuracy compared with the LS approach, the computational time is still very slow. Besides, the computational time of the NLS approach is much faster than that of the ES approach; in addition, compared to LS and ES approach, NLS shows higher fitting accuracy.
The contributions of this paper can be summarized as follows:
- This paper compares the performance of the LS, ES, and Monte-Carlo-based NLS approaches to identifying battery ECM parameters.
- Compared to the LS approach presented in [15], the ES and the NLS approach can significantly boost the fitting accuracy of EIS measurements.
- This paper presents a novel approach to implementing NLS through Monte Carlo runs. At each Monte Carlo run, the initial parameters required for the NLS approach are selected randomly. This approach results in better accuracy and much faster computation time than the ES approach.
- All the methods are validated using both simulated EIS data with different noise levels and real EIS data collected from two different types of Li-ion batteries; the fitting performance of the NLS approach outweighs other approaches in all cases.
The remainder of the paper is organized as follows: Section 2 describes the analysis of battery ECM parameters via EIS in the frequency domain. Section 3 describes the algorithms to estimate ECM parameters using the least squares approach. Section 4 describes algorithms of exhaustive search, the Monte-Carlo-based nonlinear least squares approach is explained in Section 5. Implementation procedure is explained in Section 6. Results are discussed in Section 7. Section 8 concludes the paper.
2. Analysis of ECM Parameters in Frequency Domain
EIS is a widely used technique to investigate the impedance response of the battery. To measure the EIS, a small perturbation current with a wide range of frequencies (0.01 Hz to 10 kHz) is injected to the battery; then, by using the discrete Fourier transform (DFT), the measured voltage and current in the time domain can be converted to the frequency domain; thus, the impedance in the frequency domain can be analyzed [16,17]. The battery EIS can then be represented by the real and imaginary part of the impedance on the complex plane to form the Nyquist plot [18,19]. This plot represents the impedance spectrum of the battery at a range of frequencies; the ECM parameters can be estimated by fitting the EIS data with suitable fitting algorithms.
The frequency domain approach uses the Adaptive Randles (AR) ECM shown in Figure 1. The AR-ECM consists of the following components [17]:
- Voltage Source,
- Stray Inductance, L
- Ohmic Resistance,
- Solid Electrolytic Interface (SEI) Resistance,
- SEI Capacitance,
- Charge Transfer (CT) resistance,
- Double Layer (DL) Capacitance,
- Warburg Impedance,
3. Least Squares Approach
To solve the problem of ECM parameter estimation, Ghadi [15] applied the LS algorithm to fit the EIS measurements; furthermore, this approach can express the estimation of ECM parameters in closed form. In this section, an improved LS approach to AR-ECM parameter estimation is presented.
Figure 2 shows the impedance spectrum/Nyquist plot corresponding to the AR-ECM shown in Figure 1. Each data point in the Nyquist plot is obtained through the procedure as shown in Figure 3, where and are the measured voltage and current in the time domain while injecting sinusoidal current to the battery at different frequencies; and are the Fourier transform of the corresponding voltage and current measurements; and the real part and imaginary part of the measured impedance can be defined as:
where, .
It can be observed that the Nyquist plot needs to be divided into four parts to see how it is directly related to the AR-ECM. The feature points of the Nyquist plot are indicated by index and in the DF arc; are indicated by and in the CT arc; are indicated by and in the SEI arc; and are indicated by and in the RL arc. Different parts of the Nyquist plot represent the battery’s impedance at different frequencies [20]. In this paper, to keep the consistency of nomenclature, we define:
- is the index of the first data point in the DF arc, in this paper, we define .
- is selected such that the data points from to follows the linear line.
- is selected at the beginning of the CT arc such that the data points start to follow the arc.
- is selected at the end of the CT arc such that data points between follow the CT arc.
- Similarly, is selected at the beginning of the SEI arc.
- is selected at the end of the SEI arc such that data points between follow the SEI arc.
- is selected at the beginning of the RL arc.
- is selected at the end of the RL arc.
3.1. Estimation of Ohmic Resistance and Stray Inductance
As shown in Figure 2, based on the impedance measurements in the RL arc, the estimation of ohmic resistance can be estimated as
and stray inductance L can be estimated using the improved method:
3.2. Estimation of Diffusion Arc’s Gradient m
Considering the imaginary part of the measured impedance and the real part of the measured impedance in the Diffusion arc, it can be represented with a linear model [21]:
Assuming the measurements are from to as shown in Figure 2, the following can be written as
Equation (6) can be written in the matrix form
m and a can be estimated using the LS approach:
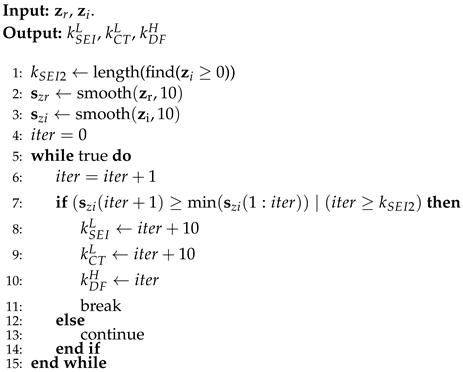
Algorithm 1 estimates quantities (list) based on the following impedance values:
In this paper, the uppermost bound of the DF arc is denoted as , the lowest bound of the CT arc is denoted as , and the lowest bound of the SEI arc is denoted as , these boundaries can be identified by applying moving average filter (MAF) to process the measured impedance data via Algorithm 1, the filtered EIS data is shown in Figure 4a. The algorithms presented in this paper are written by utilizing MATLAB syntax. Algorithm 1 uses the following MATLAB commands: ’smooth’, ’length’, ’find’,’min’, ’break’, and ’continue’.
Figure 3.
The procedure to obtain battery EIS [22].
Figure 3.
The procedure to obtain battery EIS [22].

| Algorithm 1 Boundary identification. |
 |
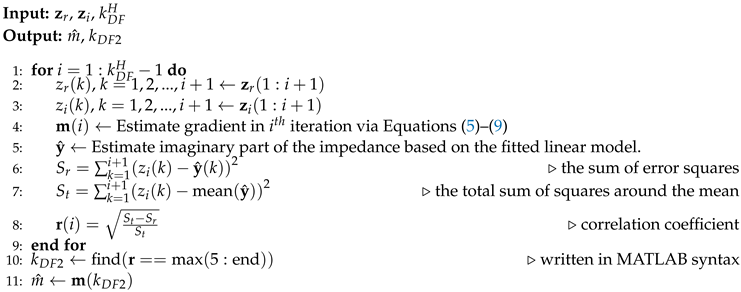
The gradient m of the Diffusion arc can be estimated by fitting the Diffusion arc with the linear model mentioned in (5) and searching out the best fit using Algorithm 2. The fitting process is also demonstrated in Figure 4b,c. Algorithm 2 uses the following MATLAB commands: ’mean’, ’find’, and ’max’.
| Algorithm 2 Diffusion arc fitting. |
 |
3.3. First Estimation of Warburg Coefficient
From the observation of EIS measurements in [20], it was found that the gradient of the Diffusion arc varies with the SOC level; in addition, gradients may be different even at the same SOC level of batteries from two different manufacturers; therefore, an improved method to represent Warburg impedance is defined mathematically as
where is the Warburg coefficient, m is the gradient of fitted DF arc, and j is .
It must be emphasized here that in [15] the gradient was assumed to be . In this paper, it is proposed to estimate the gradient m to achieve better EIS fitting.
It can be shown based on (1) that the Warburg impedance is significant only at lower frequencies. In Figure 2, impedance measurements from to are selected to estimate the Warburg coefficient (we define , and is obtained via Algorithm 2). Considering the real part of the impedance in the diffusion arc:
where .
3.4. Estimation of and
As shown in Figure 2, to fit the SEI arc precisely, we select feature points that lie between and . Let us denote the impedance measurements in the SEI arc as
The estimation of is to fit the SEI arc using a semicircle with its centre lying on the real axis; the coordinate of this semicircle’s center can be denoted as (, 0); the radius of the semicircle can be denoted as ; thus, the measurements in (16) should satisfy the equation of the semicircle [20]:
Let and , thus
And (18) can be rewritten as
In the matrix form, (21) can be written as
Using LS algorithm, the estimate of will be given by
The estimates of c and d are:
From Figure 2, is the diameter of the SEI arc; thus, by substituting the values of c and d in (20), the estimate of is
The estimated centre of the semicircle can then be expressed as
The fitting accuracy of the SEI arc can be evaluated as [23]
Where is the geometrical distance between the actual EIS data point and predicted EIS data point, which is defined as
It can be shown in (1) that when the frequency is very high, the impedance in CT arc and Diffusion arc will be minimal so that it is negligible; thus, we assume the term will be zero, that is
Therefore, the impedance in SEI arc can be expressed as:
Take the imaginary part on both sides of the above equation,
Finally, average all the estimates to obtain the final estimate
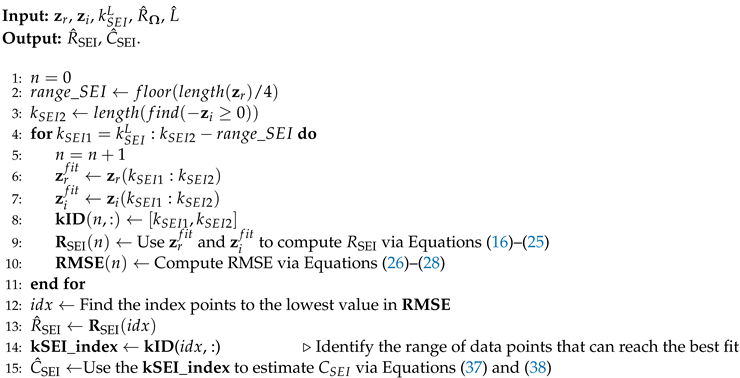
Using the LS approach to identify and via the automatic selection of feature points are fully described in Algorithm 3. In addition, Figure 5a shows the RMSE of the fitted SEI arc in each iteration and Figure 5b shows the SEI arc, which is selected since it can reach the best fit. Algorithm 3 uses the following MATLAB commands: ’floor’, ’length’.
| Algorithm 3 Estimate and via automatic feature detection. |
 |
3.5. Estimation of and
It can be observed in Figure 2 that to fit the CT arc using a semicircle precisely, we need to select feature points that lie between to ; therefore, the impedance measurements in the CT arc can be denoted as:
Assuming that the centre of the semicircle lies on the real axis, which is noted as (, 0), the radius of the semicircle can be noted as ; thus, the measurements in (39) should satisfy the equation of the semicircle [20]:
Let and , thus
And (41) can be rewritten as
In the matrix form, (44) can be written as
From (45), can be estimated using LS algorithm
Thus, the estimates of a and b are:
As shown in Figure 2, is the diameter of the CT arc; thus, by substituting the values of a and b in (43), the estimate of is
The estimated centre of the semicircle can then be expressed as
The fitting accuracy of the CT arc can be evaluated as [23]
Where is the geometrical distance between the actual EIS data point and predicted EIS data point, which is defined as [23]
Based on (1),
Therefore, the impedance in CT arc and DF arc can be expressed as:
Take the imaginary part on both sides of (56), and substitute with the expression given in (13), we obtain
Substituting L, , , , and with the estimations given in (4), (3), (25), (38), (48) and (15) respectively, in the above equation at :
Finally, average all the estimates to obtain the final estimate
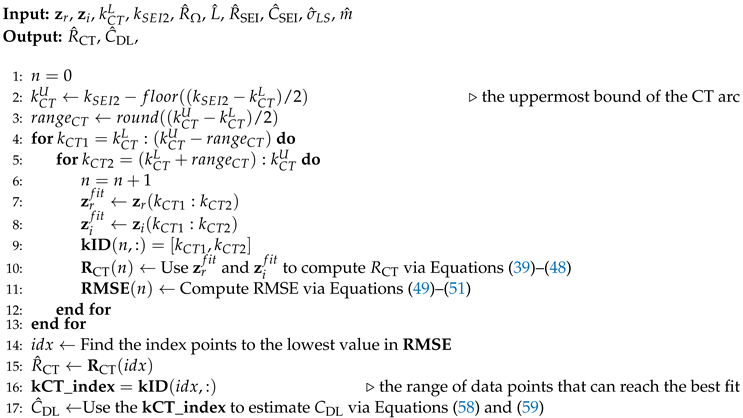
Using the LS approach to identify and via the automatic selection of feature points is shown in Algorithm 4. Furthermore, Figure 6a shows the RMSE of the fitted CT arc in each iteration, and Figure 6b shows the CT arc selected since it can reach the best fit. Algorithm 4 uses the following MATLAB commands: ’floor’ and ’round’.
| Algorithm 4 Estimate and via automatic feature detection. |
 |
3.6. Evaluation of the General Fitting Accuracy
In the complex plane, the absolute value of the error between the measured EIS and estimated EIS is actually the distance between measured EIS data points and estimated EIS data points as shown in Figure 7, , where , ... are the distances between measured EIS data point and estimated EIS data point , which can be used to evaluate the fitting accuracy, the distance is represented as.
where n is the number of measurements, .
Therefore, the evaluation of EIS fitting can be expressed as
where is the measured impedance at , is the impedance estimation at , which is computed based on (1) with the estimated ECM parameters, N is the total number of measurements, denotes the absolute value of the complex number.
The goal is to fit the EIS measurements such that the fitted EIS can achieve the lowest MAE.
The percentage error of the estimated parameters can be expressed as:
4. Exhaustive Search Approach
The Exhaustive Search (ES) approach aims to improve the goodness of fitting by searching the optimal value of each parameter based on the initial estimations of two RC components and gradient m identified via LS approach, this process is shown in Figure 8.
4.1. Second Estimation of Warburg Coefficient
Assume , L, , , , and m are given, based on (54),
thus,
then,
then, the Warburg impedance can also be expressed as:
Take the real part on both sides of the above equation, at ,
The real part of the Warburg impedance can be noted as:
Take the real part on both sides of (12), we get
Thus,
Finally, average all the estimates to obtain the final estimate
4.2. Specify the Range of Parameters for Exhaustive Search
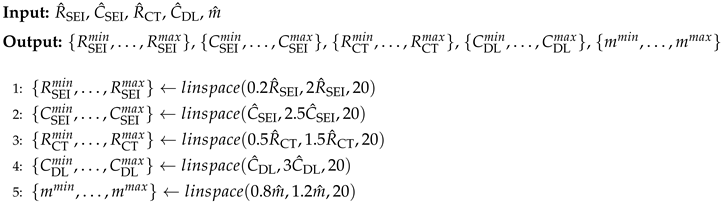
As presented in Section 3, the rough estimations of ECM parameters are given; therefore, we can assign the lower and upper bound for each parameter such that the exhaustive search approach can identify the most suitable parameter between the boundary. As shown in Algorithm 5, the range of each ECM parameter is assigned based on the empirical coefficient. In this paper, the size of possible values in each ECM parameter is restricted to 20 such that the computational time is within the acceptable range. Algorithm 5 uses the MATLAB command ’linspace’.
| Algorithm 5 Set the range of ECM parameters estimated by LS approach. |
 |
4.3. Implement Exhaustive Search
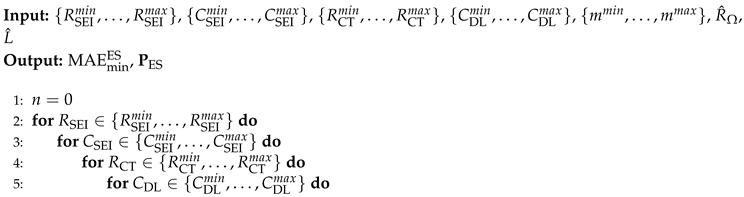
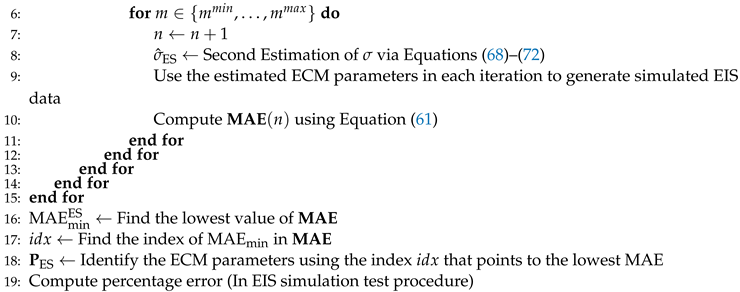
Algorithm 6 describes the ES approach that can be applied to precisely identify the ECM parameters; where, the input is estimated via (3), and is estimated via (4). Figure 9 shows the MAE evaluated from the initial iteration throughout the end of the exhaustive search process; by finding the lowest MAE in this figure, one can identify the best estimation of ECM parameters via the ES approach.
| Algorithm 6 Exhaustive Search Approach. |
|
5. Nonlinear Least Squares Approach
The concept of implementing the NLS approach based on the Monte-Carlo run is shown in Figure 10. This approach randomly selects initial guesses of the ECM parameters in each Monte Carlo run to fit the EIS data in different cases.
5.1. Objective Function
The goal is to find the optimized ECM parameters to minimize the following function.
Where,
and is the measured impedance at , N is total number of measurements, denotes the absolute value of the complex number.
The nonlinear least square approach is implemented in MATLAB using the built-in function to fit the EIS data.
5.2. Initial Guess
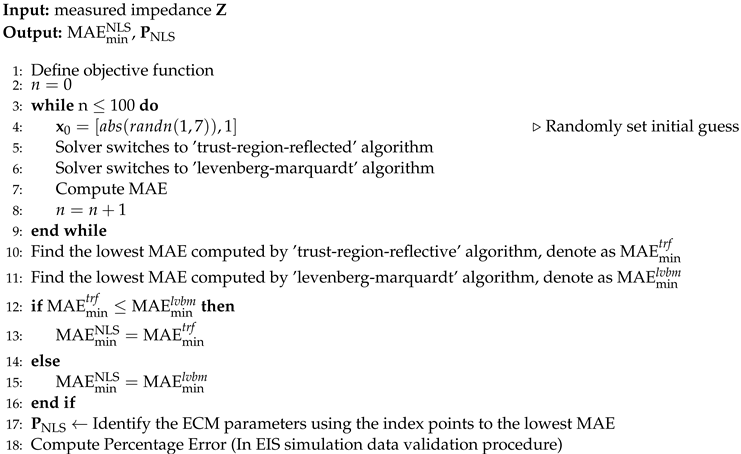
Instead of setting the lower bound and upper bound for the NLS approach, in this paper, we randomly select initial guess in each Monte-Carlo runs to try different NLS fitting based on different initial guess, this way, to find the best fit among all cases. In MATLAB the initial guess is defined as:
5.3. Algorithm Switch
To reach the best fit, the NLS approach will apply ’trust-region-reflective’ algorithm [24,25] and ’levenberg-margquardt’ algorithm [26,27,28] to fit the EIS data with different initial guess, after that, the algorithm that can achieve the lowest mean absolute error (MAE) will be select as the approach that can reach the best fit. The detailed approach is shown in Algorithm 7. This algorithm uses the following MATLAB commands: ’abs’ and ’randn’.
| Algorithm 7 NLS Approach. |
 |
6. Implementation
This paper implements three ECM parameter estimation approaches in MATLAB R2020a with a 3 GHz Processor and 16 GB RAM.
6.1. Simulate EIS Data
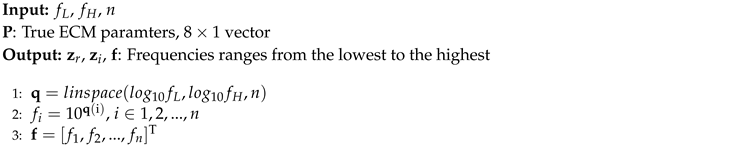
The simulated EIS data was generated using Algorithm 8, where the frequency ranges from 0.01 Hz to 10 kHz, and the number of EIS measurements is 121; this is to keep the conformity with the sampling size we set in the EIS experiment [20]. In addition, Table 1 shows the true ECM parameters for simulating EIS data. To generate various noise levels for the simulated EIS measurements, we implement Gaussian noise with zero-mean, standard deviation , and independent outcome.
Algorithm 8 uses the MATLAB command ’linspace’, ’real’, ’imag’, and ’randn’.
| Algorithm 8 EIS simulation. |
|
6.2. Collect Real EIS Data
The impedance data is measured from two Li-ion batteries: LG 18650 and Molicel 21700. In addition, the specifications of LG and Molicel batteries are shown in [20] Table 1. The data are collected using the Arbin battery cycler (Model: LBT21084UC), which has 16 channels that can operate in parallel. In this experiment, eight channels were used to collect data simultaneously at room temperature (23 °C).
The EIS data are measured by the EIS device (Gamry interface 5000P). We operated the Gamry EIS device and Arbin battery cycler using the software provided by Arbin company. The voltage measurement error of the Gamry EIS device is 0.2 mV as specified from [29]. In this paper, we validated LS, ES, and NLS approaches on EIS data collected from one LG and one Molicel battery when the SOC is at 90%, 50% and 10%, while discharging from a fully charged state.
7. Results
In this section, fitting results obtained from the simulated and real EIS data are shown and discussed.
7.1. Estimation Results of ECM Parameters Using Simulated EIS Data
The comparisons of simulated EIS data fitted by LS, ES, and NLS approaches are shown in Figure 11a–d. It can be observed that the LS approach shows insufficient goodness of fitting, whereas ES and NLS approaches generally reach considerable fitting accuracy. Table 2 shows that at any noise level, the computational time of the LS approach is the fastest; however, the fitting accuracy MAE is the lowest. On the contrary, the ES approach has the slowest computational time, but the fitting accuracy is significantly improved compared with the LS approach. The NLS approach reaches the lowest MAE and is considerably faster than the ES approach. Furthermore, with the noise level decreasing, the MAE decreases.
As shown in Figure 12a–d, it is clear that at any noise level, the percentage error of the estimated RC components reaches the highest when using the LS approach and reaches the lowest when using NLS approach, except for that the percentage error of estimated via NLS is higher than that estimated via ES when = 0.1075 ; besides, at any noise level, the percentage errors of estimated ECM parameters using NLS approach are well below , this shows significantly higher estimation accuracy compared with ES and LS approaches.
7.2. Estimation Results of ECM Parameters Using Real EIS Data
LG 18650 and Molicel 21700 Li-ion batteries were selected to validate whether the LS, ES, and NLS approaches show consistency in fitting real EIS data that are collected at , , and SOC.
Figure 13a–c show the fitted EIS of LG 18650 battery using LS, ES, and NLS approaches; Figure 13d–f show the fitted EIS of Molicel battery using same approaches. Compare to the LS approach, both ES and NLS approaches show higher fitting accuracy.
In Table 3, it can be observed that when fitting the LG battery’s EIS data at any SOC level, the EIS approach outperforms the ES and LS approaches; furthermore, in terms of the computational time, the ES approach is considerably slower than the NLS approach. Though the LS approach is the fastest, the MAE is the highest among all SOC levels. Additionally, in Table 4, the validation on the Molicel battery shows consistent results.
8. Conclusions and Discussions
This paper presented the LS, ES, and NLS approaches to extract ECM parameters through battery impedance measurements. Compared to the LS approach, the ES and NLS approach can extract ECM parameters more accurately. Though the LS approach shows insufficient goodness of fitting at various noise levels, it can boost the fitting accuracy of the ES approach by offering initial estimations; however, it is worth mentioning that while the ECM contains more than two RC components, the computation time will increase significantly such that this approach will be infeasible.
When fitting the simulated EIS data, both ES and NLS approaches show considerably high accuracy at each noise level, and the fitting accuracy increases as the noise decreases. When fitting the battery EIS measurements, the NLS approach still shows faster and more accurate fitting performance than the ES approach; this result is validated in simulated EIS data.
In future works, we will investigate deploying the NLS approach to the BMS board combined with the rapid EIS measurement hardware to improve the accuracy and computational time for ECM parameters estimation; the BMS can then adopt these precisely estimated ECM parameters for more accurate online SOC/SOH estimation.
Acknowledgments
B. Balasingam would like to acknowledge the Natural Sciences and Engineering Research Council of Canada (NSERC) for financial support under the Discovery Grants (DG) program (funding reference number RGPIN-2018-04557) and the Alliance Program (funding reference number ALLRP 561015).
References
- Z.-Y. Hou, P.-Y. Lou, and C.-C. Wang, “State of charge, state of health, and state of function monitoring for EV BMS,” in 2017 IEEE International Conference on Consumer Electronics (ICCE), 2017. [CrossRef]
- O. Heaviside, “Electrical papers by oliver heaviside (in two volumes),” New York: MacMillon & Co, vol. 268, 1894.
- P. Ranque, E. Gonzalo, M. Armand, and D. Shanmukaraj, “Performance-based materials evaluation for Li batteries through impedance spectroscopy: a critical review,” Mater. Today Energy, vol. 34, no. 101283, p. 101283, 2023. [CrossRef]
- S. R. Islam and S.-Y. Park, “Precise online electrochemical impedance spectroscopy strategies for li-ion batteries,” IEEE Transactions on Industry Applications, vol. 56, no. 2, pp. 1661–1669, 2019. [CrossRef]
- S. Mandal, P. Barai, P. Mukherjee, and R. Sharma, “An impedance-based study on the ageing of Li-ion batteries,” Electrochimica Acta, vol. 307, pp. 161–174, 2019.
- H. Ju, J. Wu, and Y. Xu, “Revisiting the electrochemical impedance behaviour of the LiFePO4/C cathode,” J. Chem. Sci. (Bangalore), vol. 125, no. 3, pp. 687–693, 2013. [CrossRef]
- C. Pastor-Fernández, W. D. Widanage, J. Marco, M.-Á. Gama-Valdez, and G. H. Chouchelamane, “Identification and quantification of ageing mechanisms in lithium-ion batteries using the eis technique,” in 2016 IEEE Transportation Electrification Conference and Expo (ITEC), pp. 1–6, IEEE, 2016. [CrossRef]
- N. Meddings et al., “Application of electrochemical impedance spectroscopy to commercial Li-ion cells: A review,” J. Power Sources, vol. 480, no. 228742, p. 228742, 2020. [CrossRef]
- M. Theiler, D. Schneider, and C. Endisch, “Experimental Investigation of State and Parameter Estimation within Reconfigurable Battery Systems,” J. Batteries, vol. 9, no. 3, p. 145, Feb. 2023. [CrossRef]
- N. Tian, Y. Wang, J. Chen, and H. Fang, “One-shot parameter identification of the Thevenin’s model for batteries: Methods and validation,” J. Energy Storage, vol. 29, no. 101282, p. 101282, 2020. [CrossRef]
- J. Xu, L. Guo, Y. Liu, W. Li, Z. Li, and X. Zhang, “A non-linear least squares fitting method for analysis of electrochemical impedance spectroscopy data of a supercapacitor,” Journal of Energy Storage, 2020.
- X. Li, C. Chen, X. Lü, W. Zhang, J. Liu, and H. Yu, “A review on the applications of electrochemical impedance spectroscopy in batteries,” Journal of Energy Chemistry, vol. 53, pp. 146–162, 2021.
- F. Feng et al., “Electrochemical impedance characteristics at various conditions for commercial solid–liquid electrolyte lithium-ion batteries: Part. 2. Modeling and prediction,” Energy (Oxf.), vol. 243, no. 123091, p. 123091, 2022. [CrossRef]
- Y. Liu, Y. Cai, T. Gao, and H. Liu, “Comparison of different methods for fitting equivalent circuit models to EIS data of lithium-ion batteries,” Electrochimica Acta, vol. 343, 2020.
- M. A. Ghadi, Performance Analysis and Improvement of Electrochemical Impedance Spectroscopy for Online Estimation of Battery Parameters, Master’s thesis, University of Windsor, Windsor, ON, Canada, 2021.
- E. Barsoukov and J. R. Macdonald, Eds., “Impedance Spectroscopy; Theory, Experiment, and Applications,” Wiley Interscience Publications, 2005.
- M. E. Orazem and B. Tribollet, “Electrochemical impedance spectroscopy,” New Jersey, pp. 383–389, 2008.
- B. Balasingam and K. R. Pattipati, “On the identification of electrical equivalent circuit models based on noisy measurements,” IEEE Transactions on Instrumentation and Measurement, vol. 70, pp. 1–16, 2021. [CrossRef]
- W. Waag, S. Käbitz, and D. U. Sauer, “Experimental investigation of the lithium-ion battery impedance characteristic at various conditions and aging states and its influence on the application,” Applied energy, vol. 102, pp. 885–897, 2013. [CrossRef]
- Y. Wu, S. Sundaresan, and B. Balasingam, “Battery parameter analysis through electrochemical impedance spectroscopy at different state of charge levels,” J. Low Power Electron. Appl., vol. 13, no. 2, p. 29, 2023. [CrossRef]
- S. Chatterjee and A. S. Hadi, Regression Analysis by Example, 5th ed. Hoboken, NJ: Wiley-Blackwell, 2015.
- P. Lu, M. Li, L. Zhang, and L. Zhou, “A novel fast-EIS measuring method and implementation for lithium-ion batteries,” in 2019 Prognostics and System Health Management Conference (PHM-Qingdao), 2019. [CrossRef]
- M. Baum, V. Klumpp, and U. D. Hanebeck, “A novel Bayesian method for fitting a circle to noisy points,” in 2010 13th International Conference on Information Fusion, 2010. [CrossRef]
- T. F. Coleman and Y. Li, “An Interior, Trust Region Approach for Nonlinear Minimization Subject to Bounds,” SIAM Journal on Optimization, vol. 6, pp. 418–445, 1996. [CrossRef]
- T. F. Coleman and Y. Li, “On the Convergence of Reflective Newton Methods for Large-Scale Nonlinear Minimization Subject to Bounds,” Mathematical Programming, vol. 67, no. 2, pp. 189–224, 1994.
- K. Levenberg, “A Method for the Solution of Certain Problems in Least-Squares,” Quarterly Applied Mathematics, vol. 2, pp. 164–168, 1944.
- D. W. Marquardt, “An algorithm for least-squares estimation of nonlinear parameters,” J. Soc. Ind. Appl. Math., vol. 11, no. 2, pp. 431–441, 1963. [CrossRef]
- J. J. Moré, “The Levenberg-Marquardt Algorithm: Implementation and Theory,” Numerical Analysis, vol. 630, pp. 105–116, 1977. [CrossRef]
- Instrument Operator’s Manual, Gamry Instruments Inc, EIS Box, 2018.
- M. Welvaert and Y. Rosseel, “On the definition of signal-to-noise ratio and contrast-to-noise ratio for FMRI data,” PLoS One, vol. 8, no. 11, p. e77089, 2013. [CrossRef]
Figure 1.
Adaptive Randles equivalent circuit model (AR-ECM) of a battery.
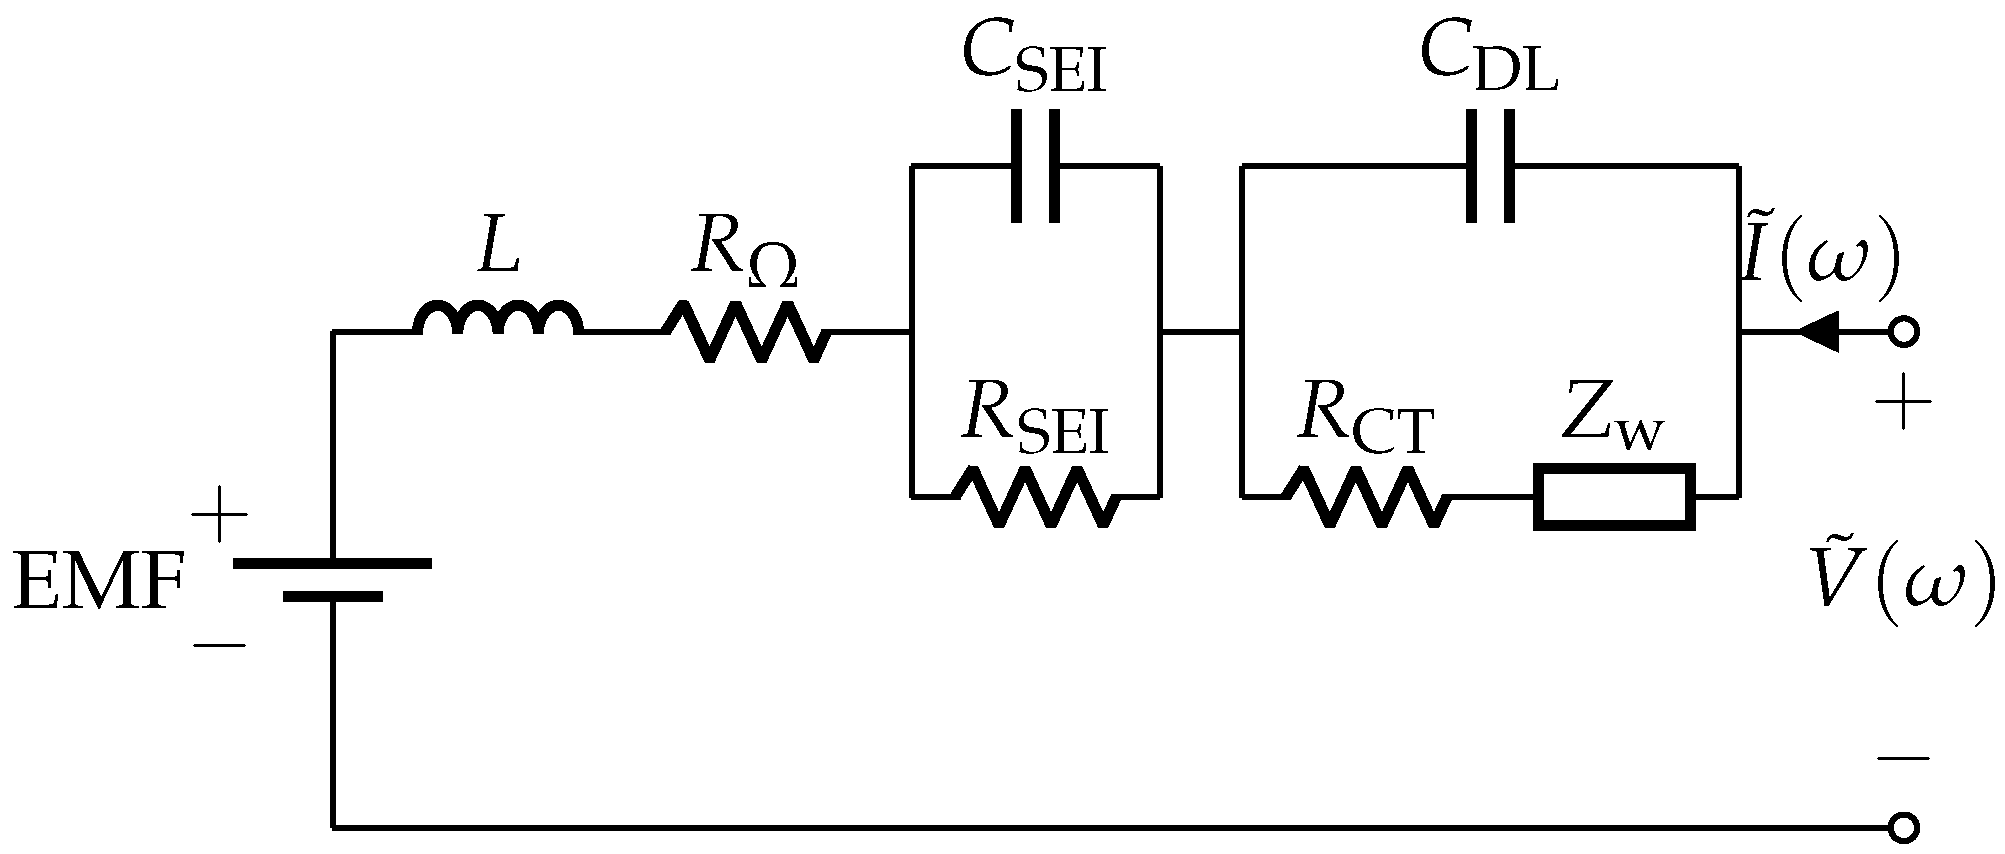
Figure 2.
The theoretical Nyquist plot corresponding to the AR-ECM.
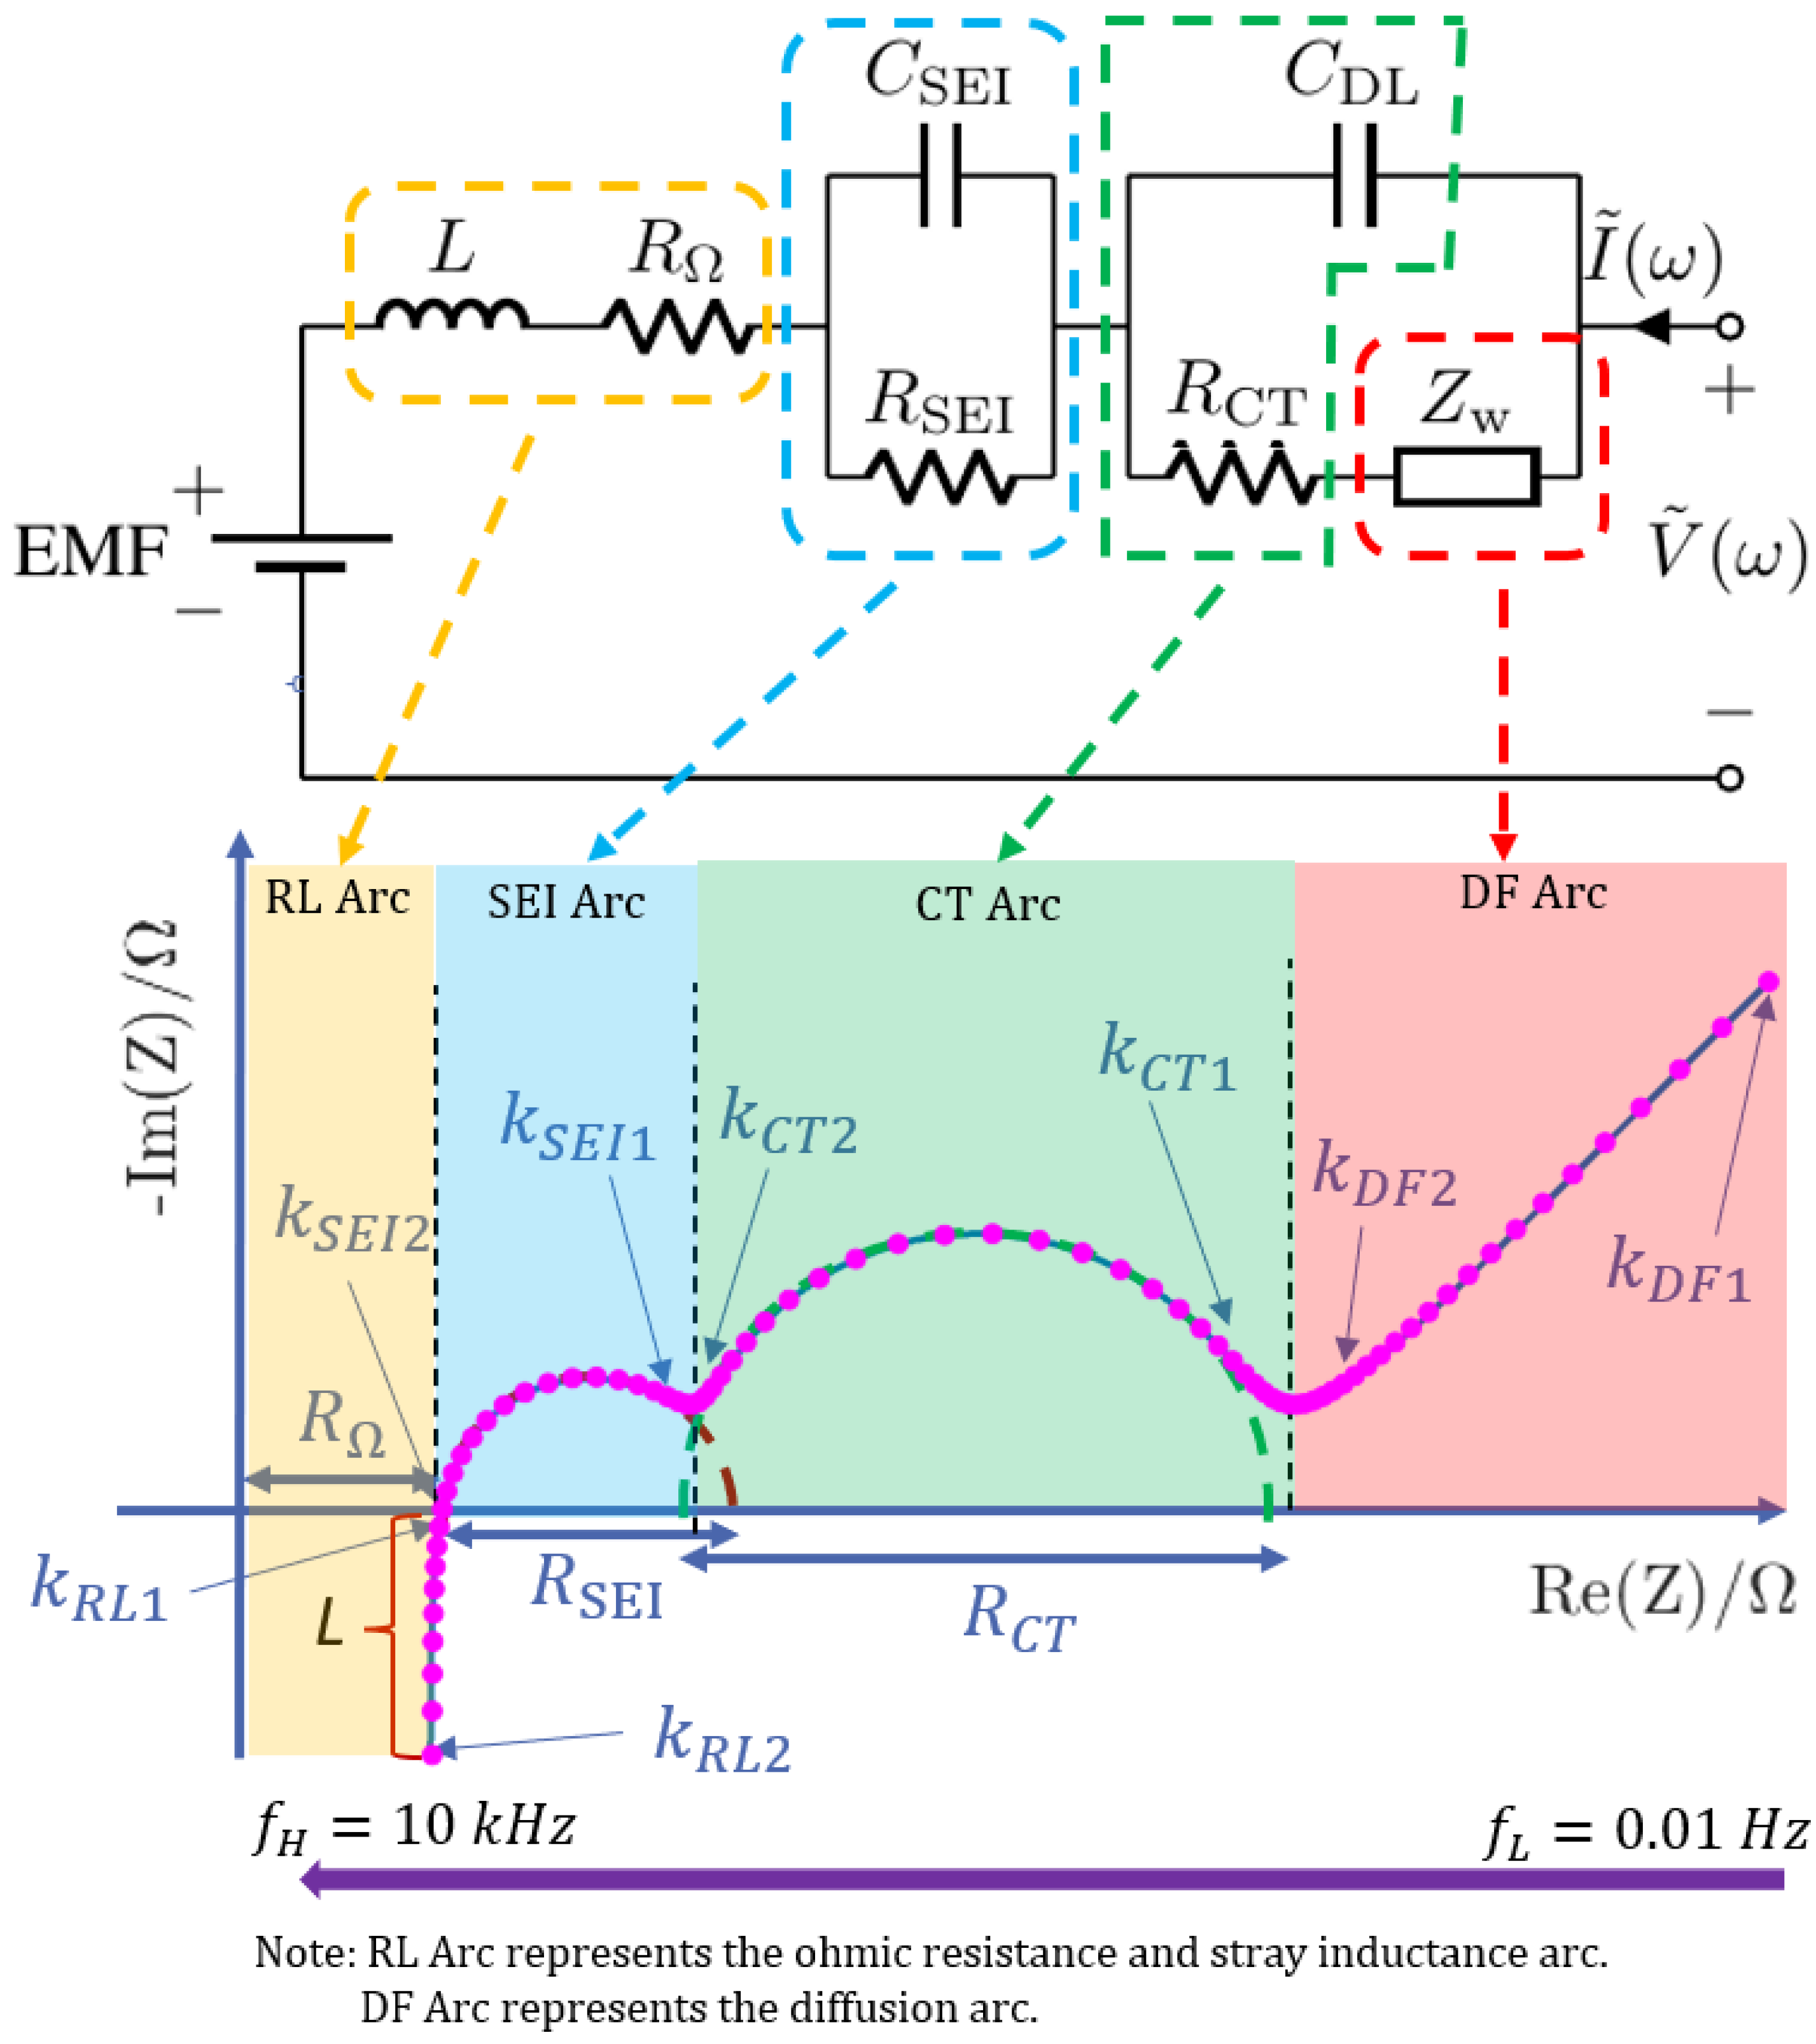
Figure 4.
DF arc fitting process. (a) Smooth the EIS using MAF. (b) Find the highest correlation coefficient r when fitting the DF arc. (c) Fitted DF arc.
Figure 4.
DF arc fitting process. (a) Smooth the EIS using MAF. (b) Find the highest correlation coefficient r when fitting the DF arc. (c) Fitted DF arc.
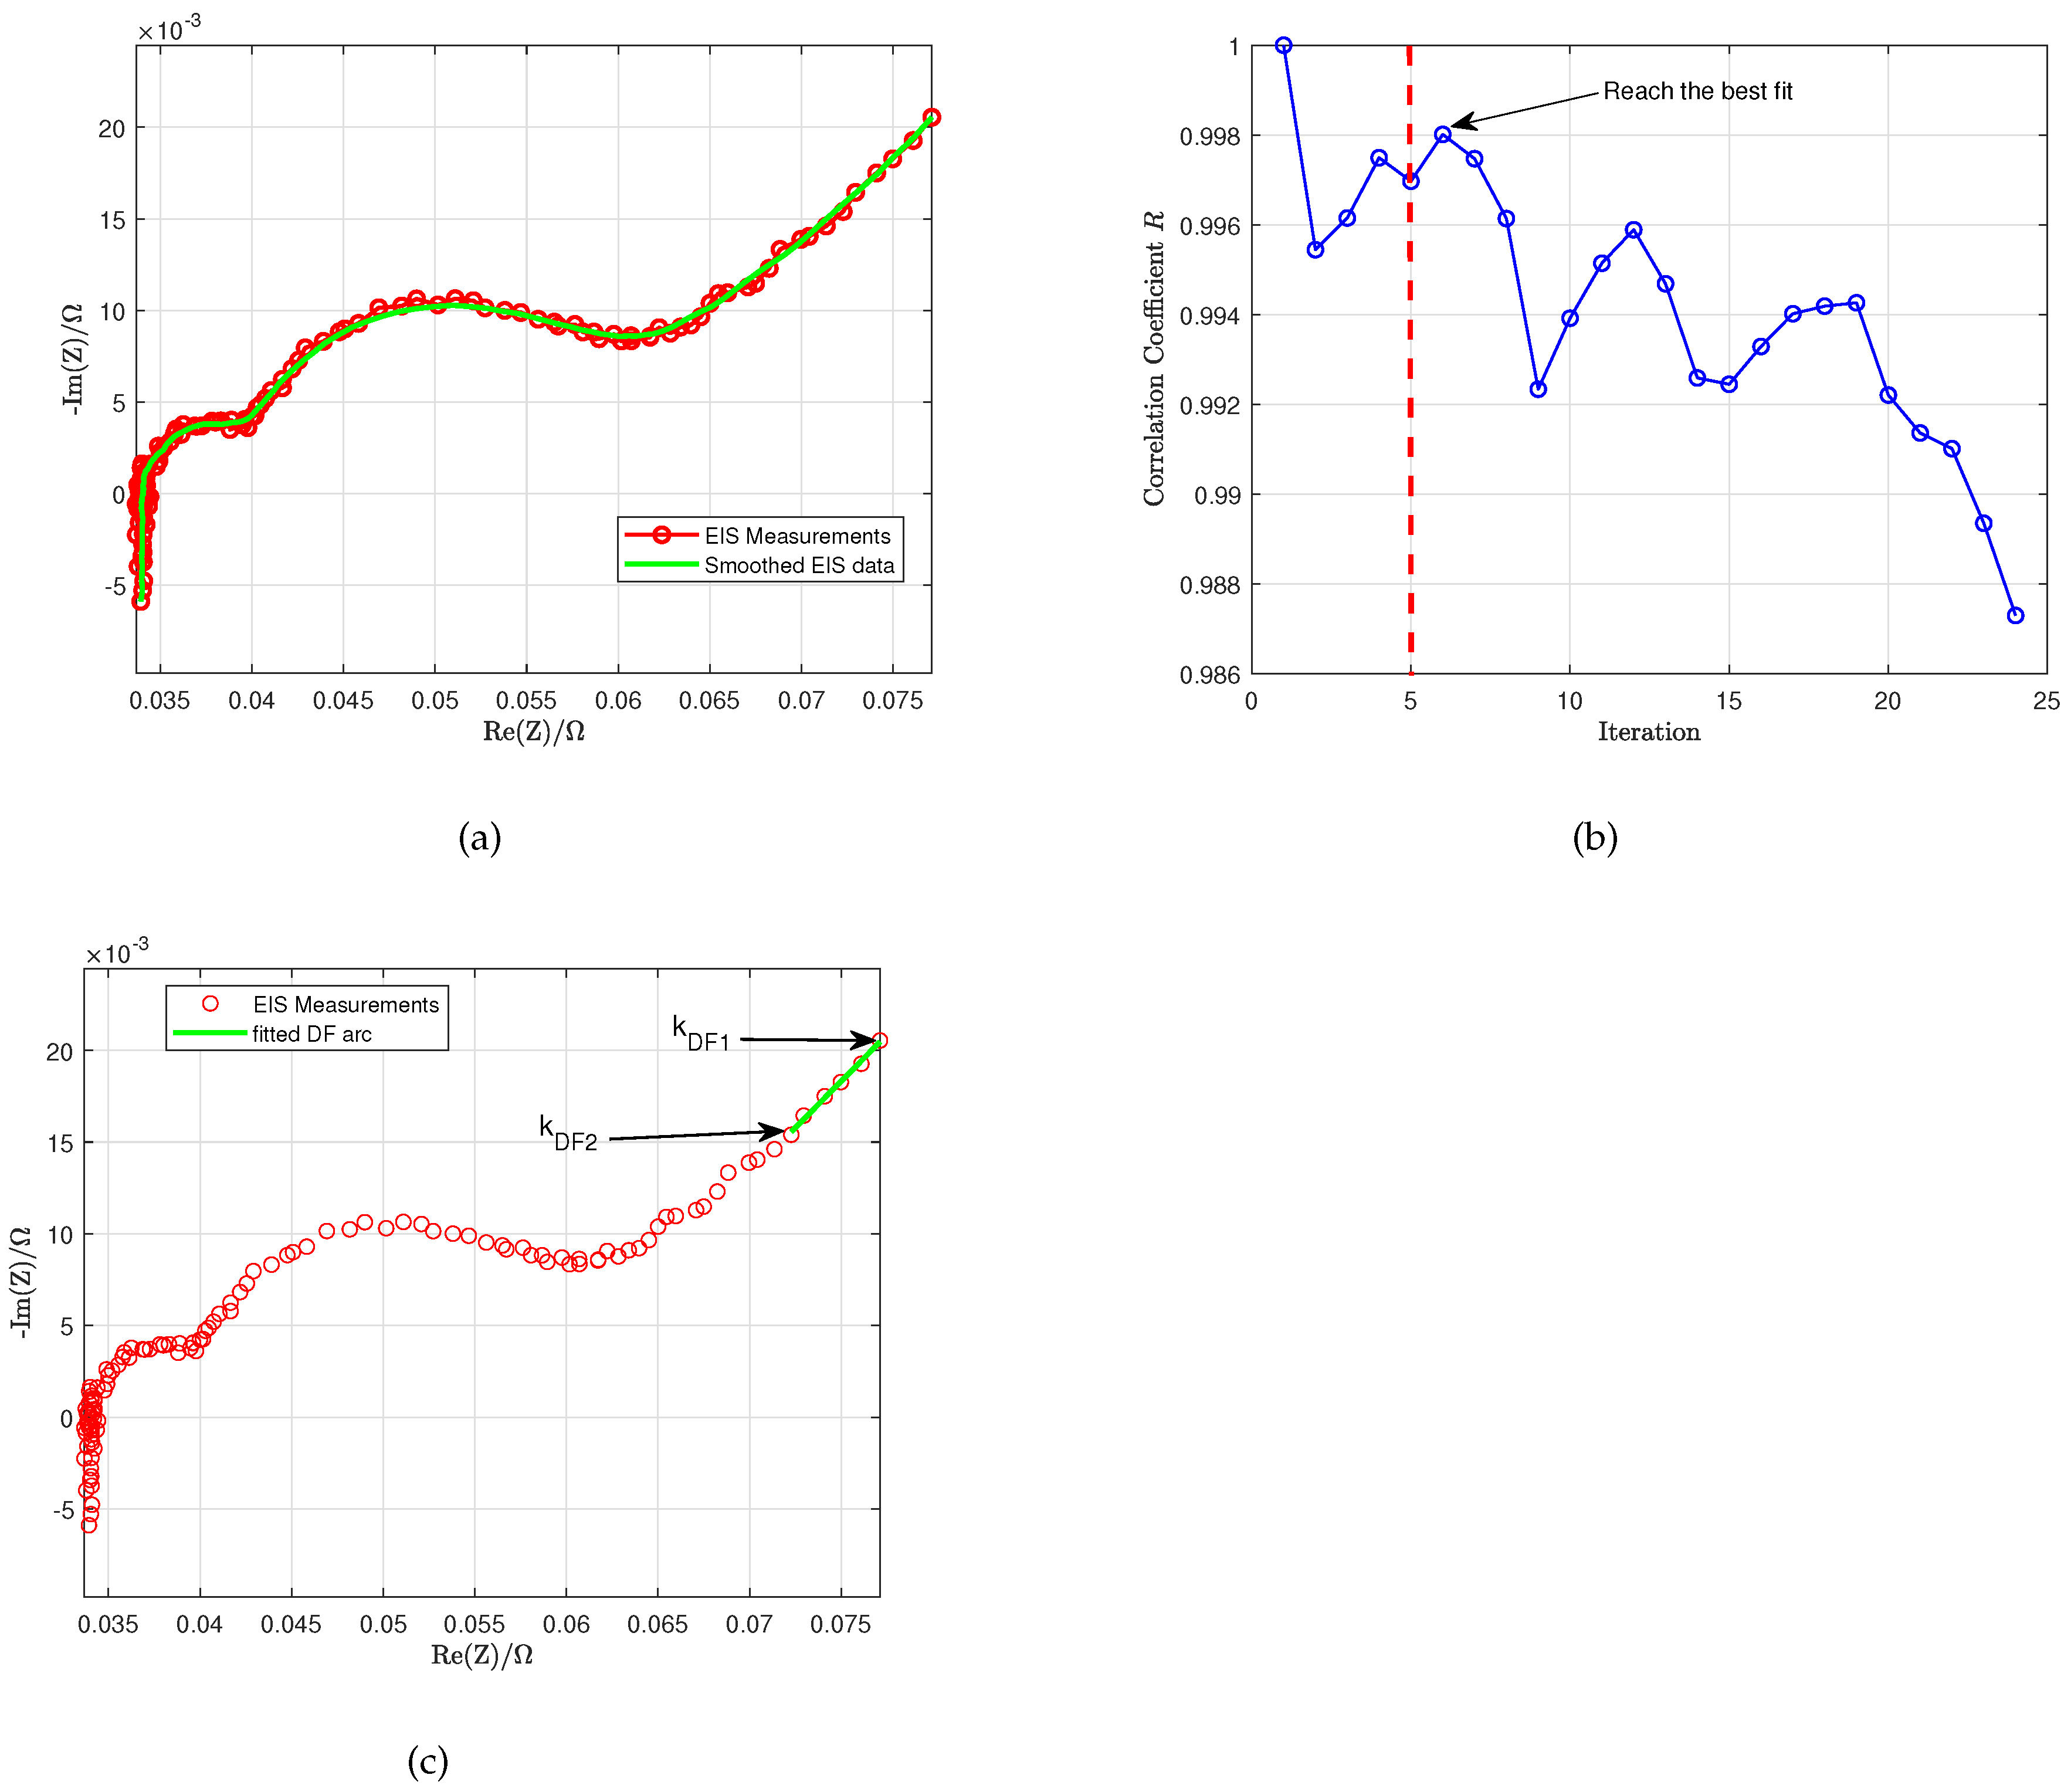
Figure 5.
Fitted SEI arc using LS approach. (a) RMSE of the fitted SEI arc. (b) Best fitting of SEI arc.
Figure 5.
Fitted SEI arc using LS approach. (a) RMSE of the fitted SEI arc. (b) Best fitting of SEI arc.
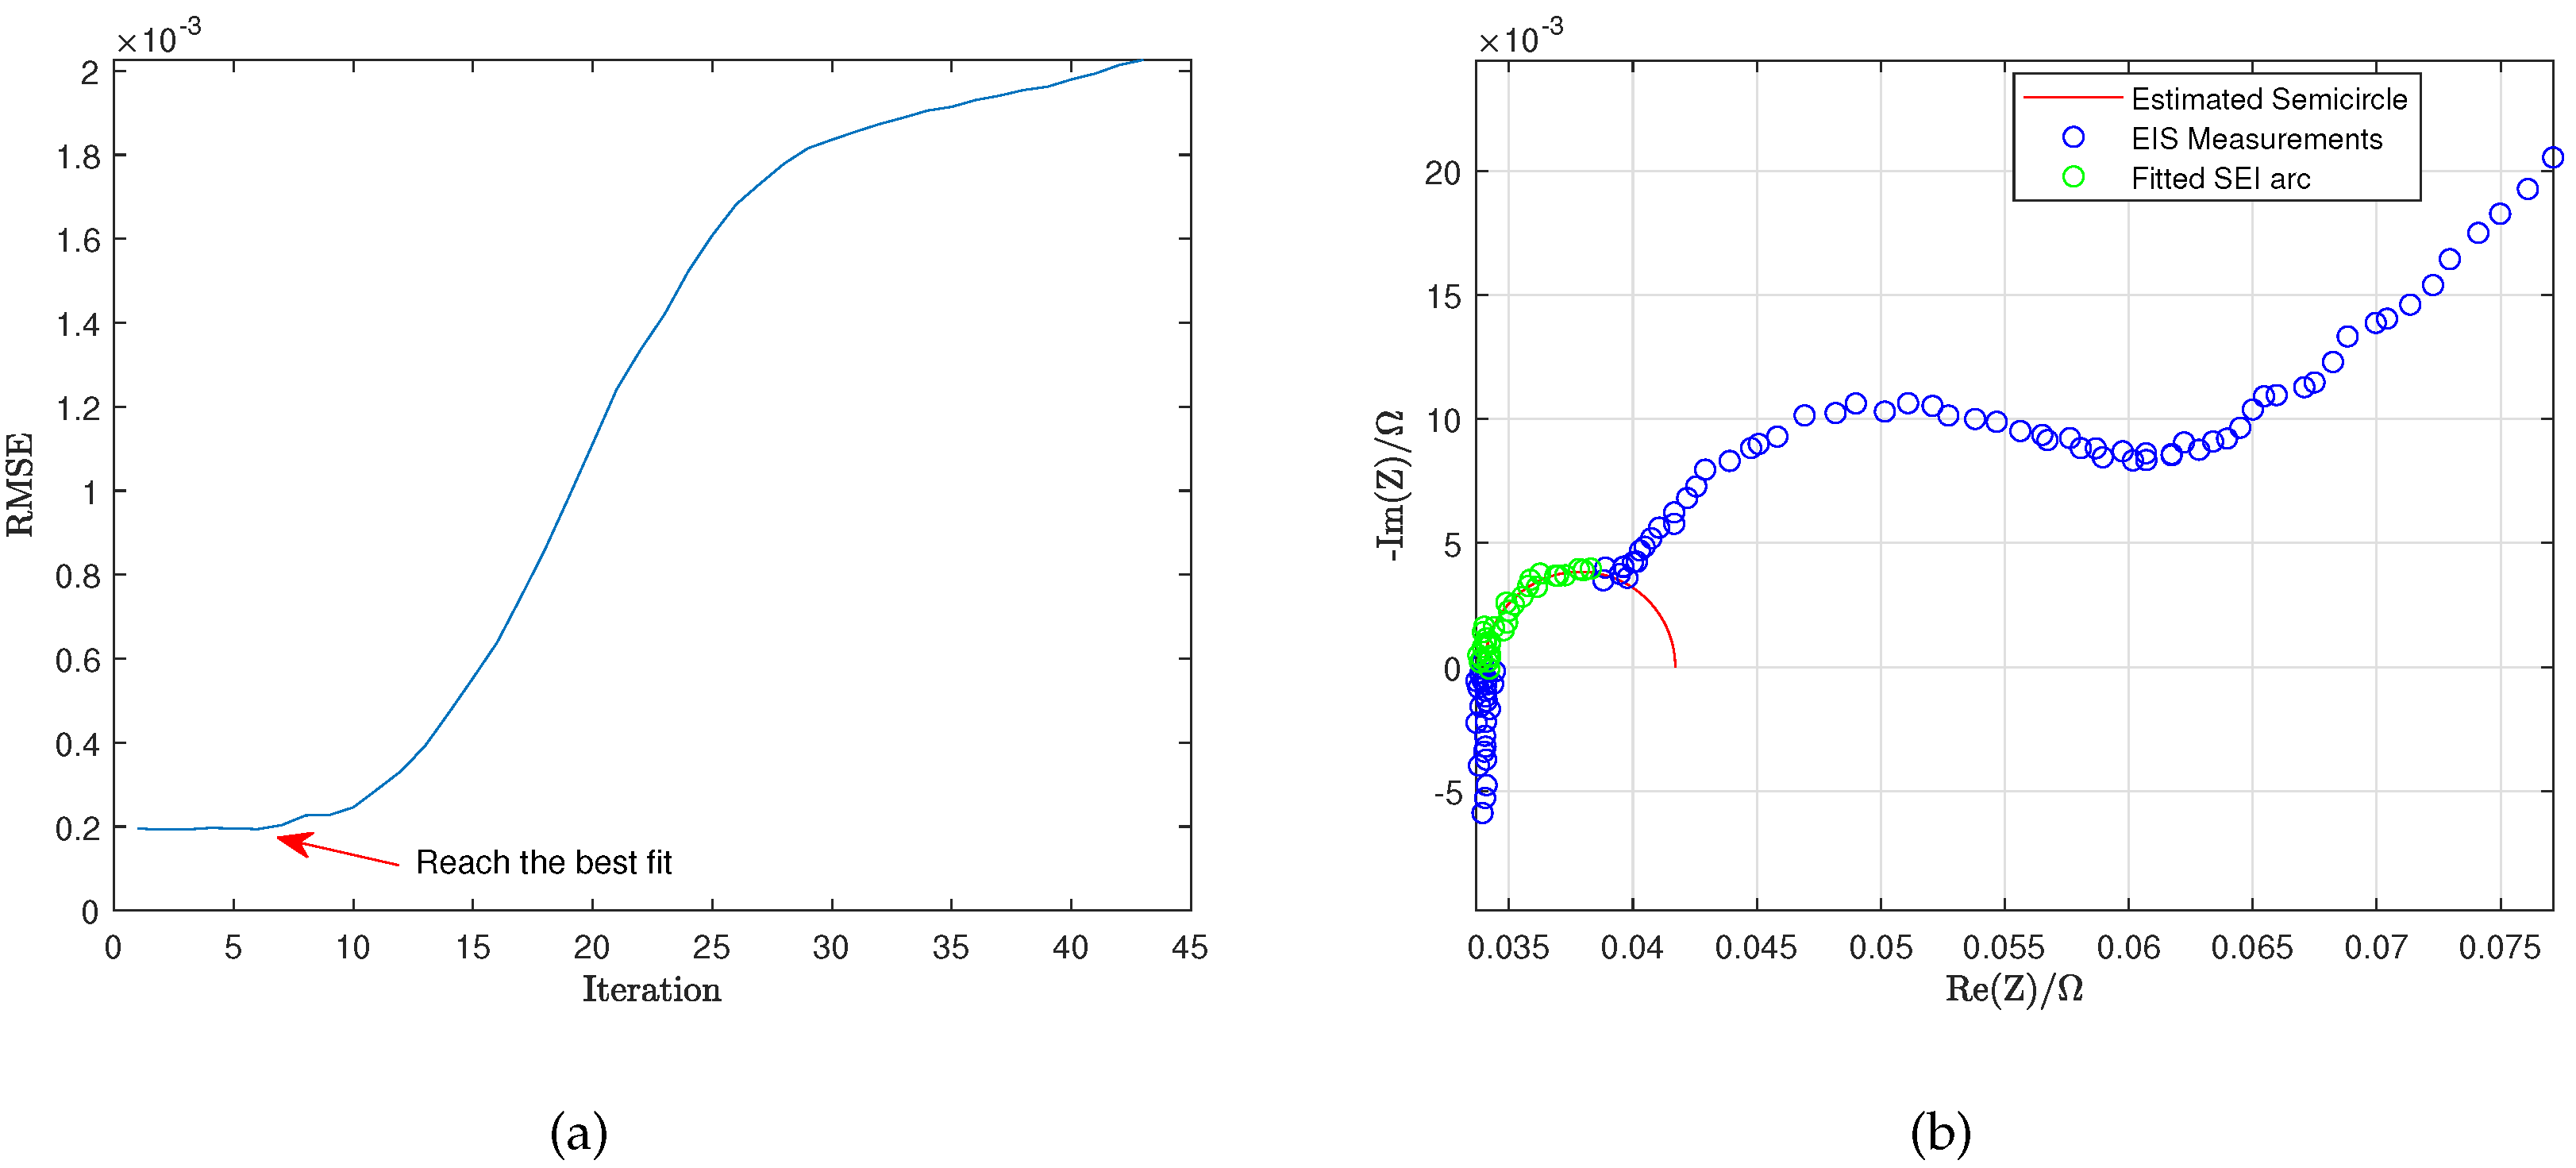
Figure 6.
Fitted CT arc using LS approach. (a) RMSE of the fitted CT arc. (b) Best fitting of CT arc.
Figure 6.
Fitted CT arc using LS approach. (a) RMSE of the fitted CT arc. (b) Best fitting of CT arc.
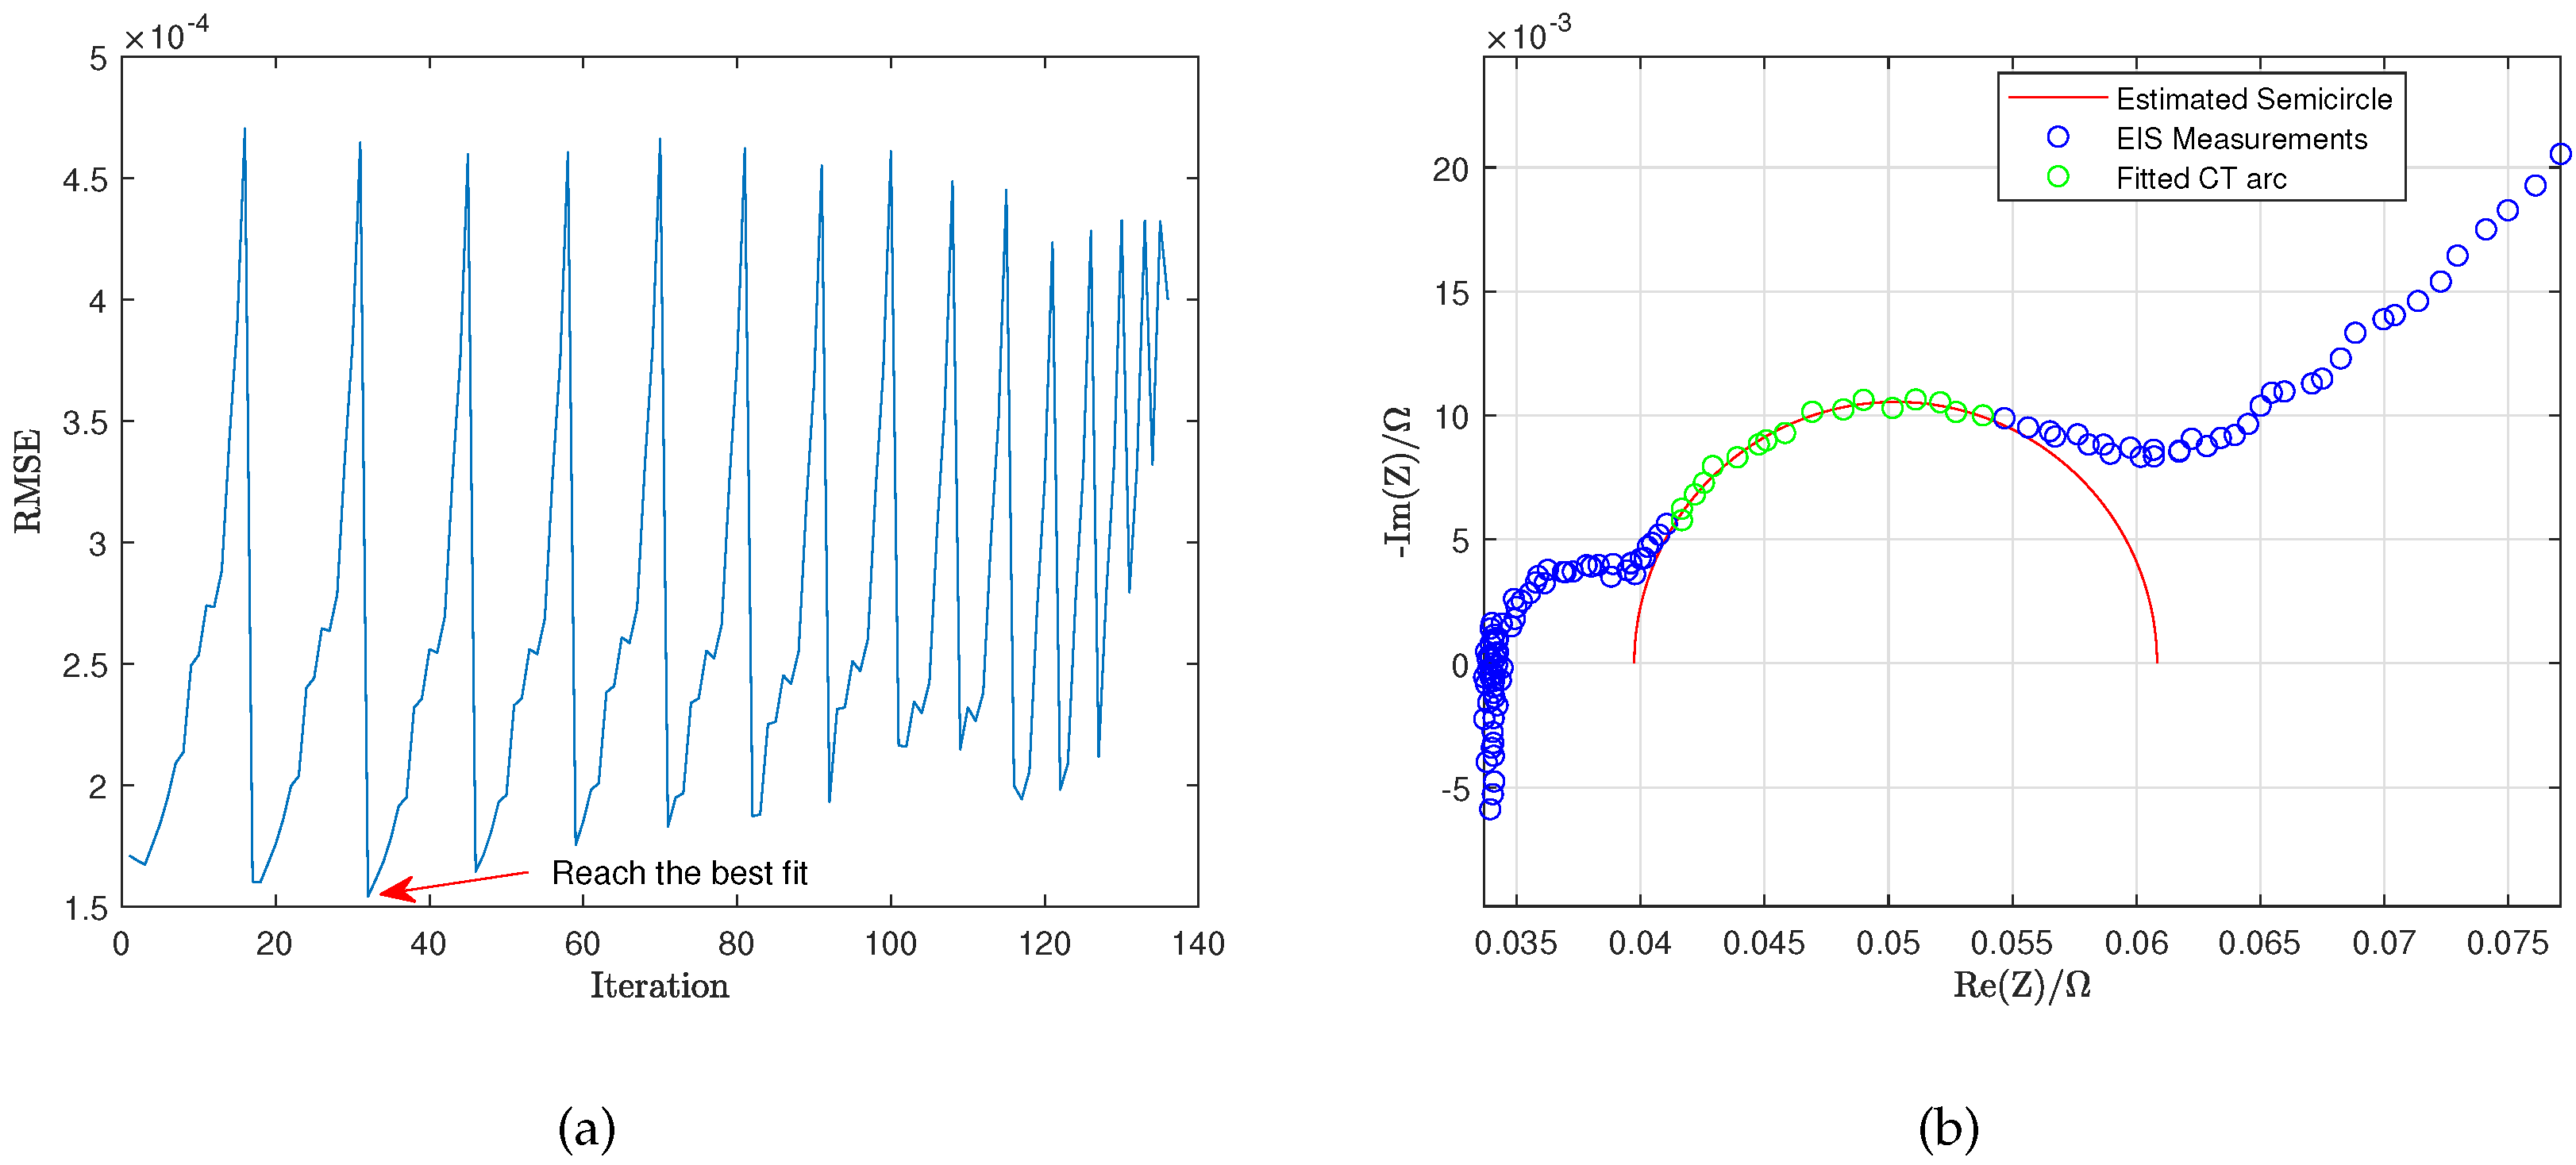
Figure 7.
Geometrical distance between measured EIS data point and predicted EIS data point.
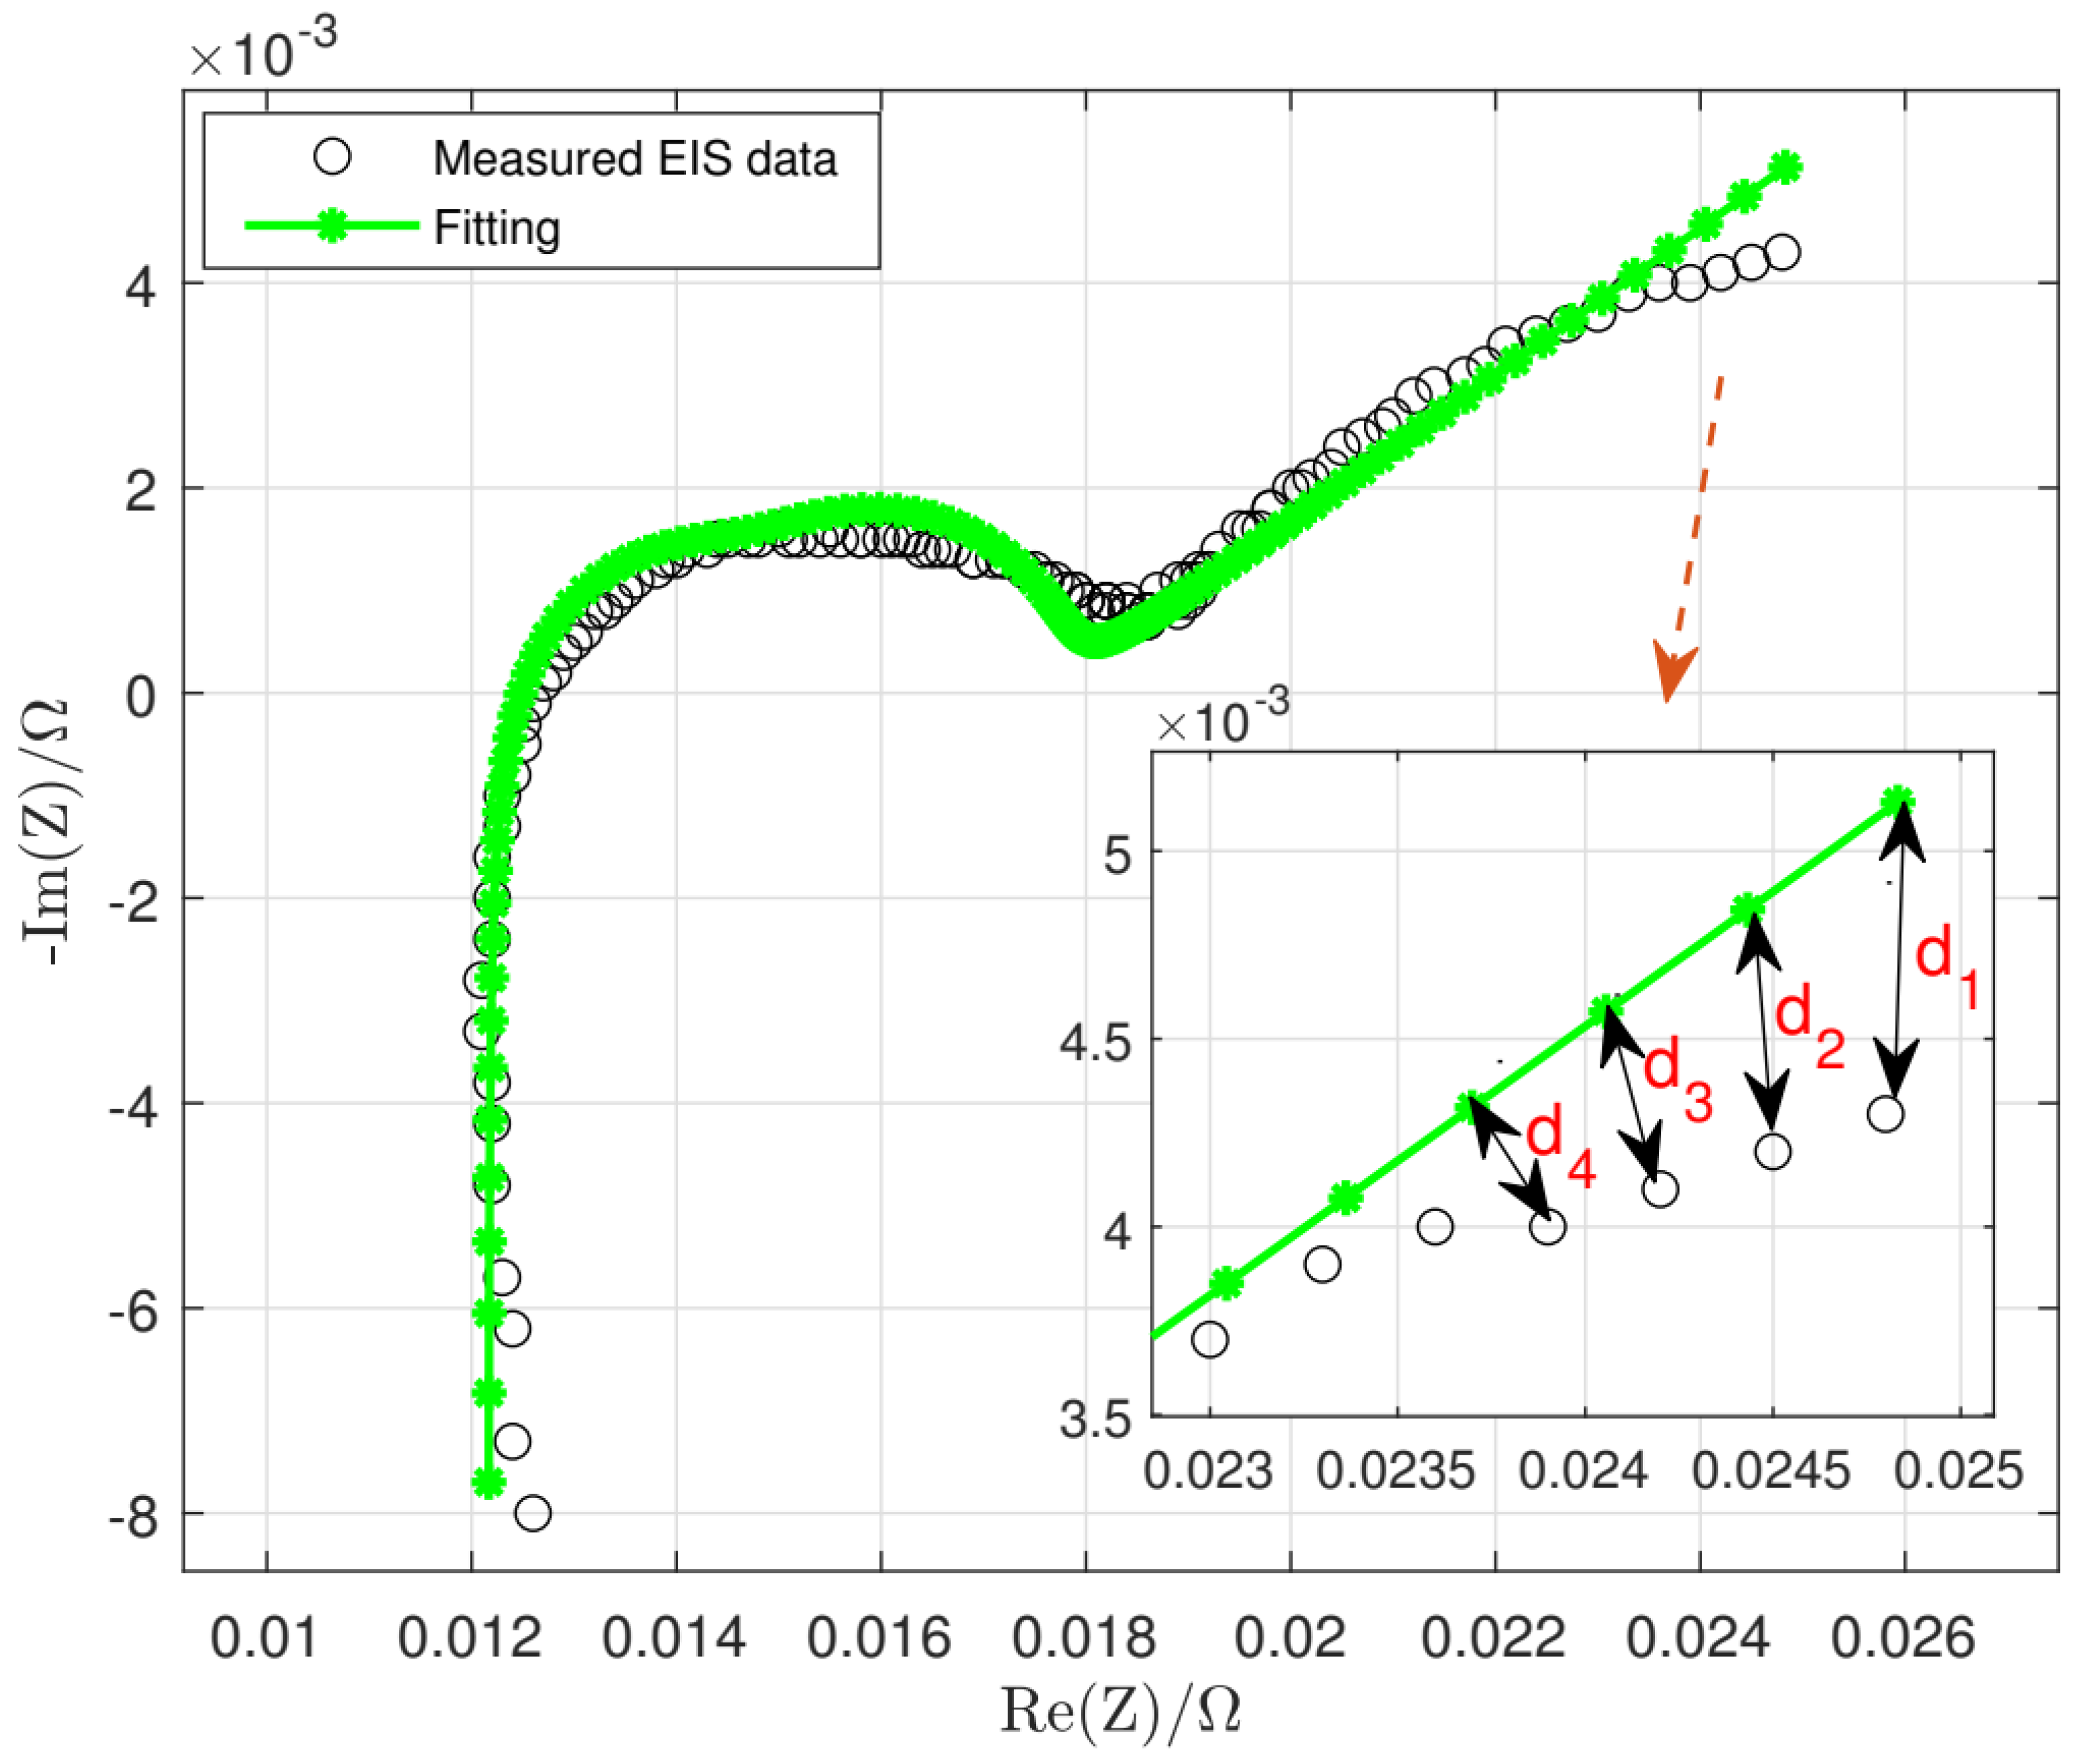
Figure 8.
The principle of ES approach.
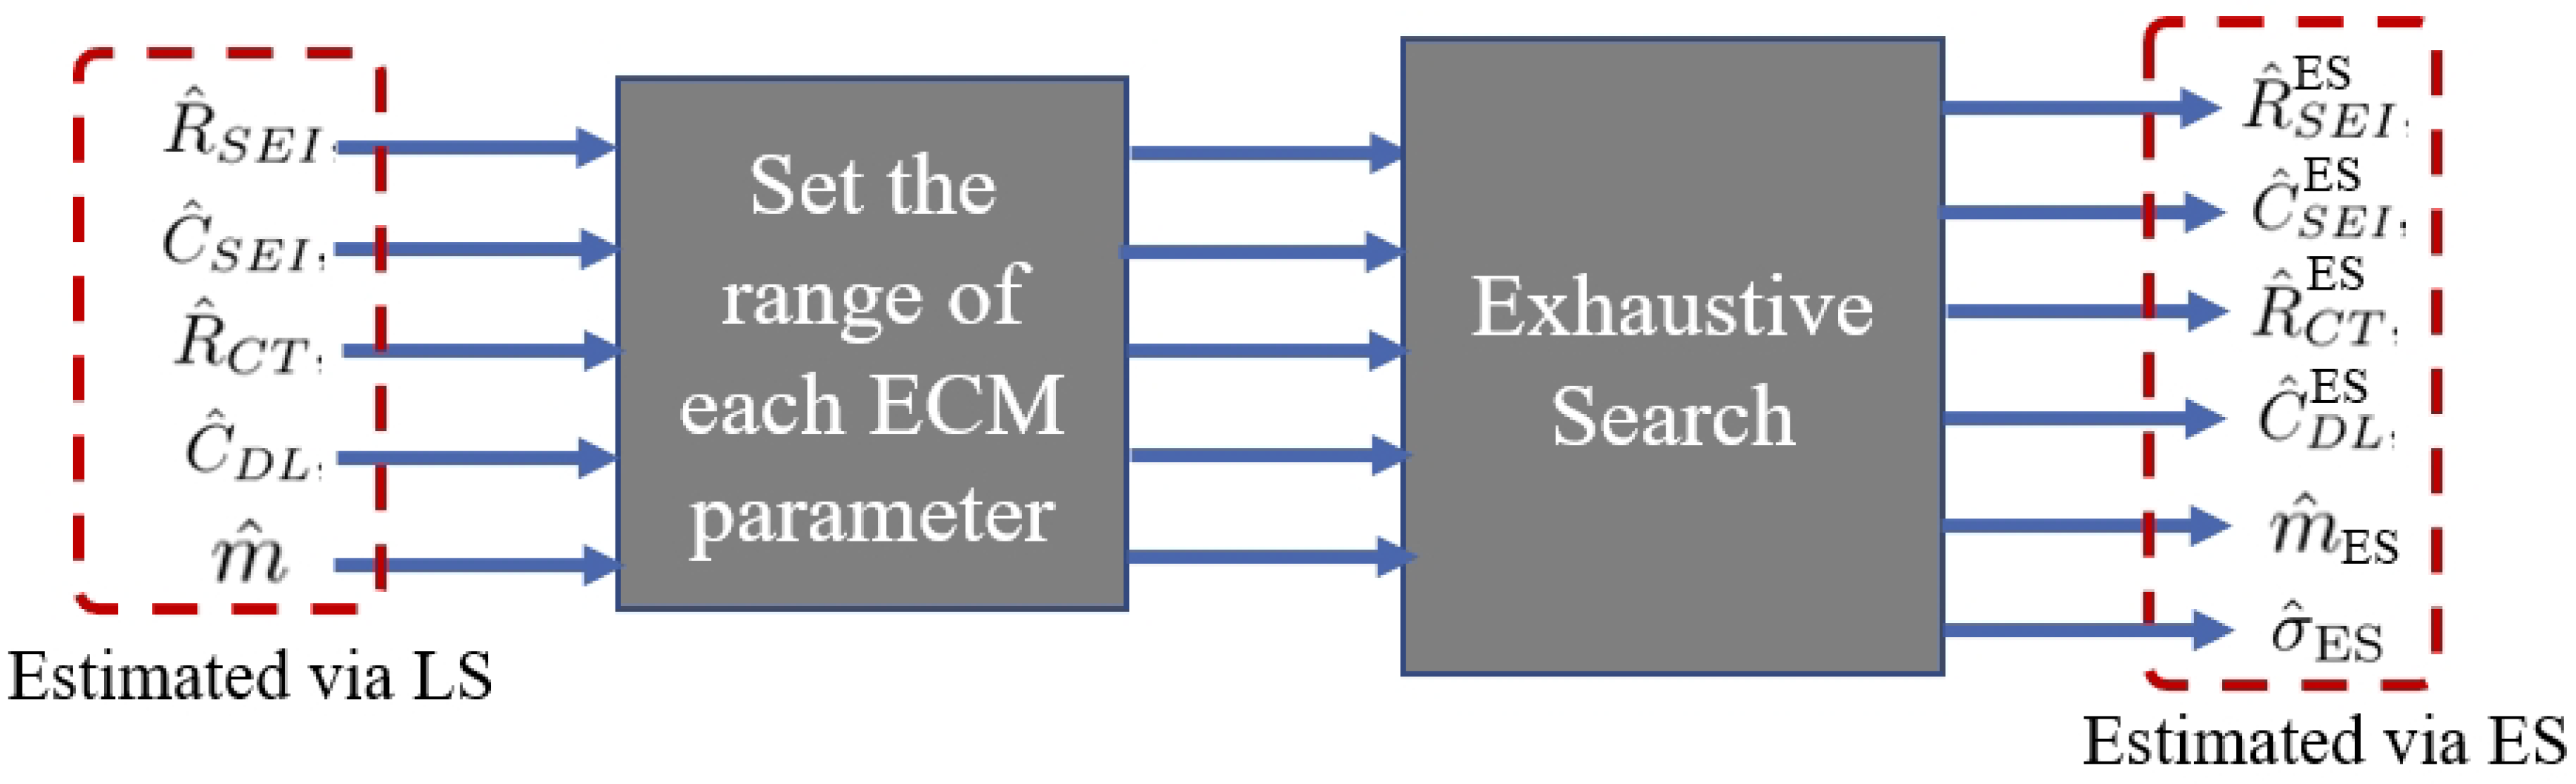
Figure 9.
Find the lowest MAE of ES approach .
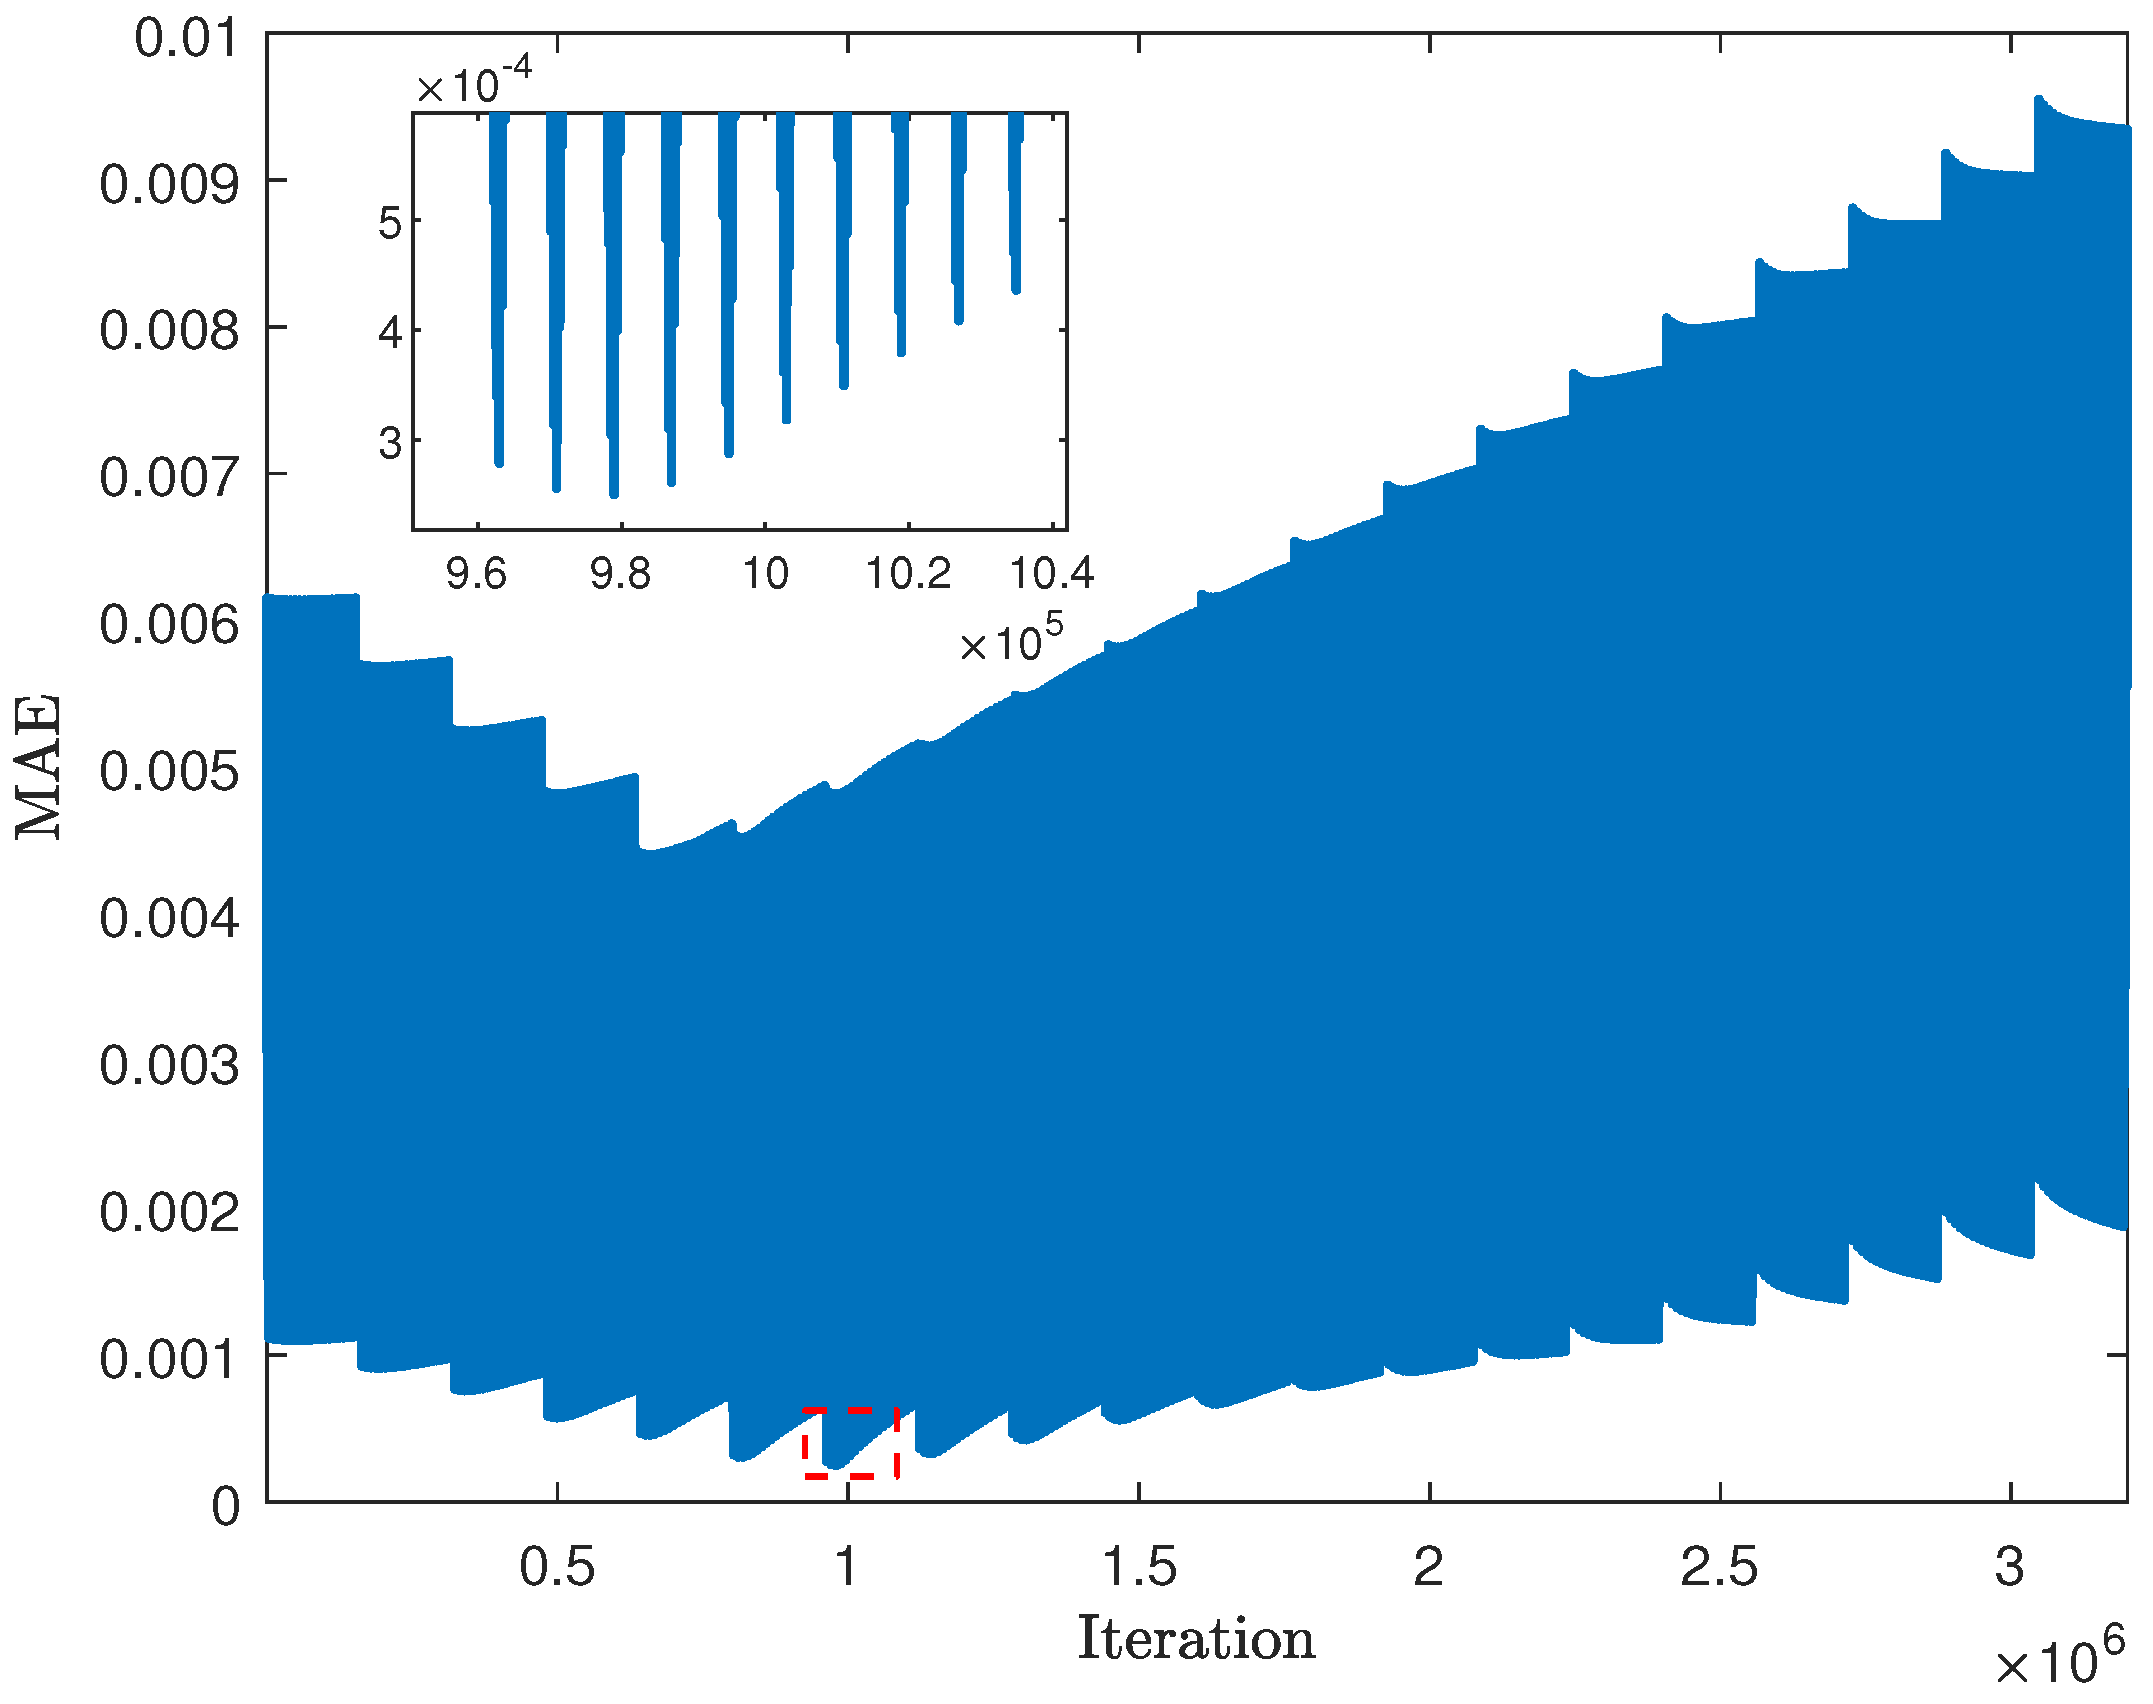
Figure 10.
Monte-Carlo based Nonlinear Least Sqaures Approach.
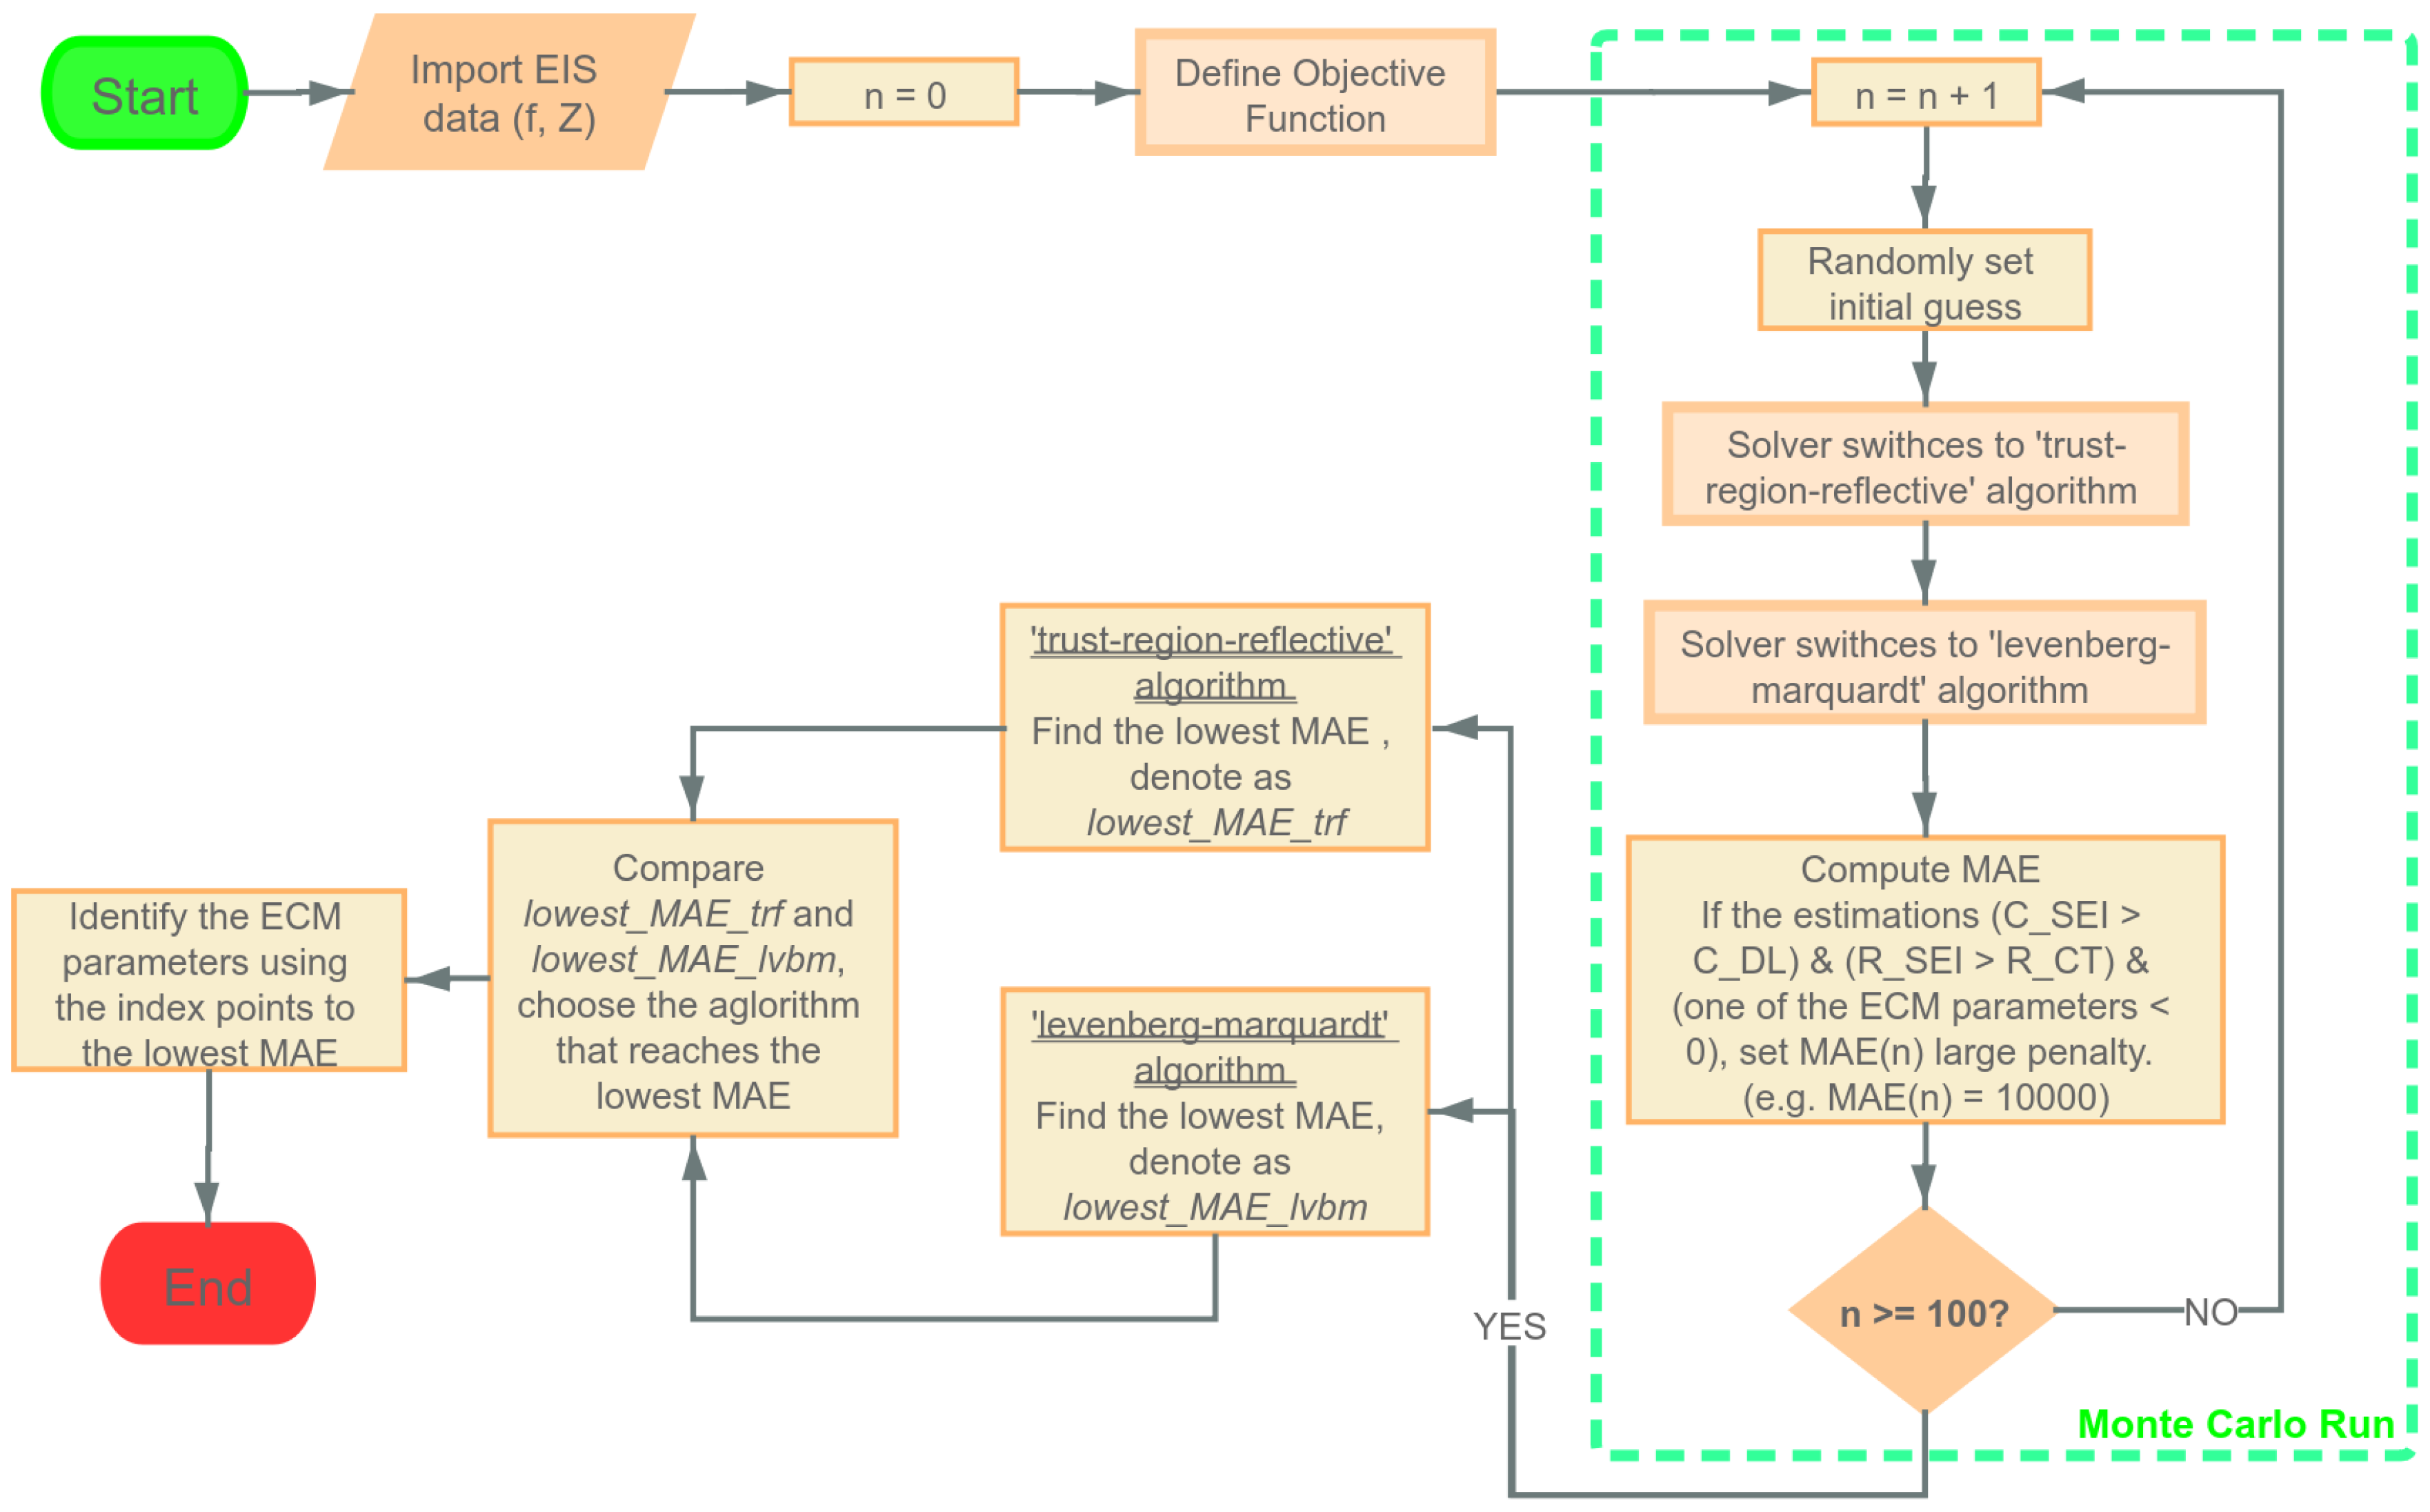
Figure 11.
Fitting simulated EIS measurements via LS, ES, and NLS approaches at different noise levels. (a) = 0.6046 . (b) = 0.3400 . (c) = 0.1912 . (d) = 0.1075 .
Figure 11.
Fitting simulated EIS measurements via LS, ES, and NLS approaches at different noise levels. (a) = 0.6046 . (b) = 0.3400 . (c) = 0.1912 . (d) = 0.1075 .
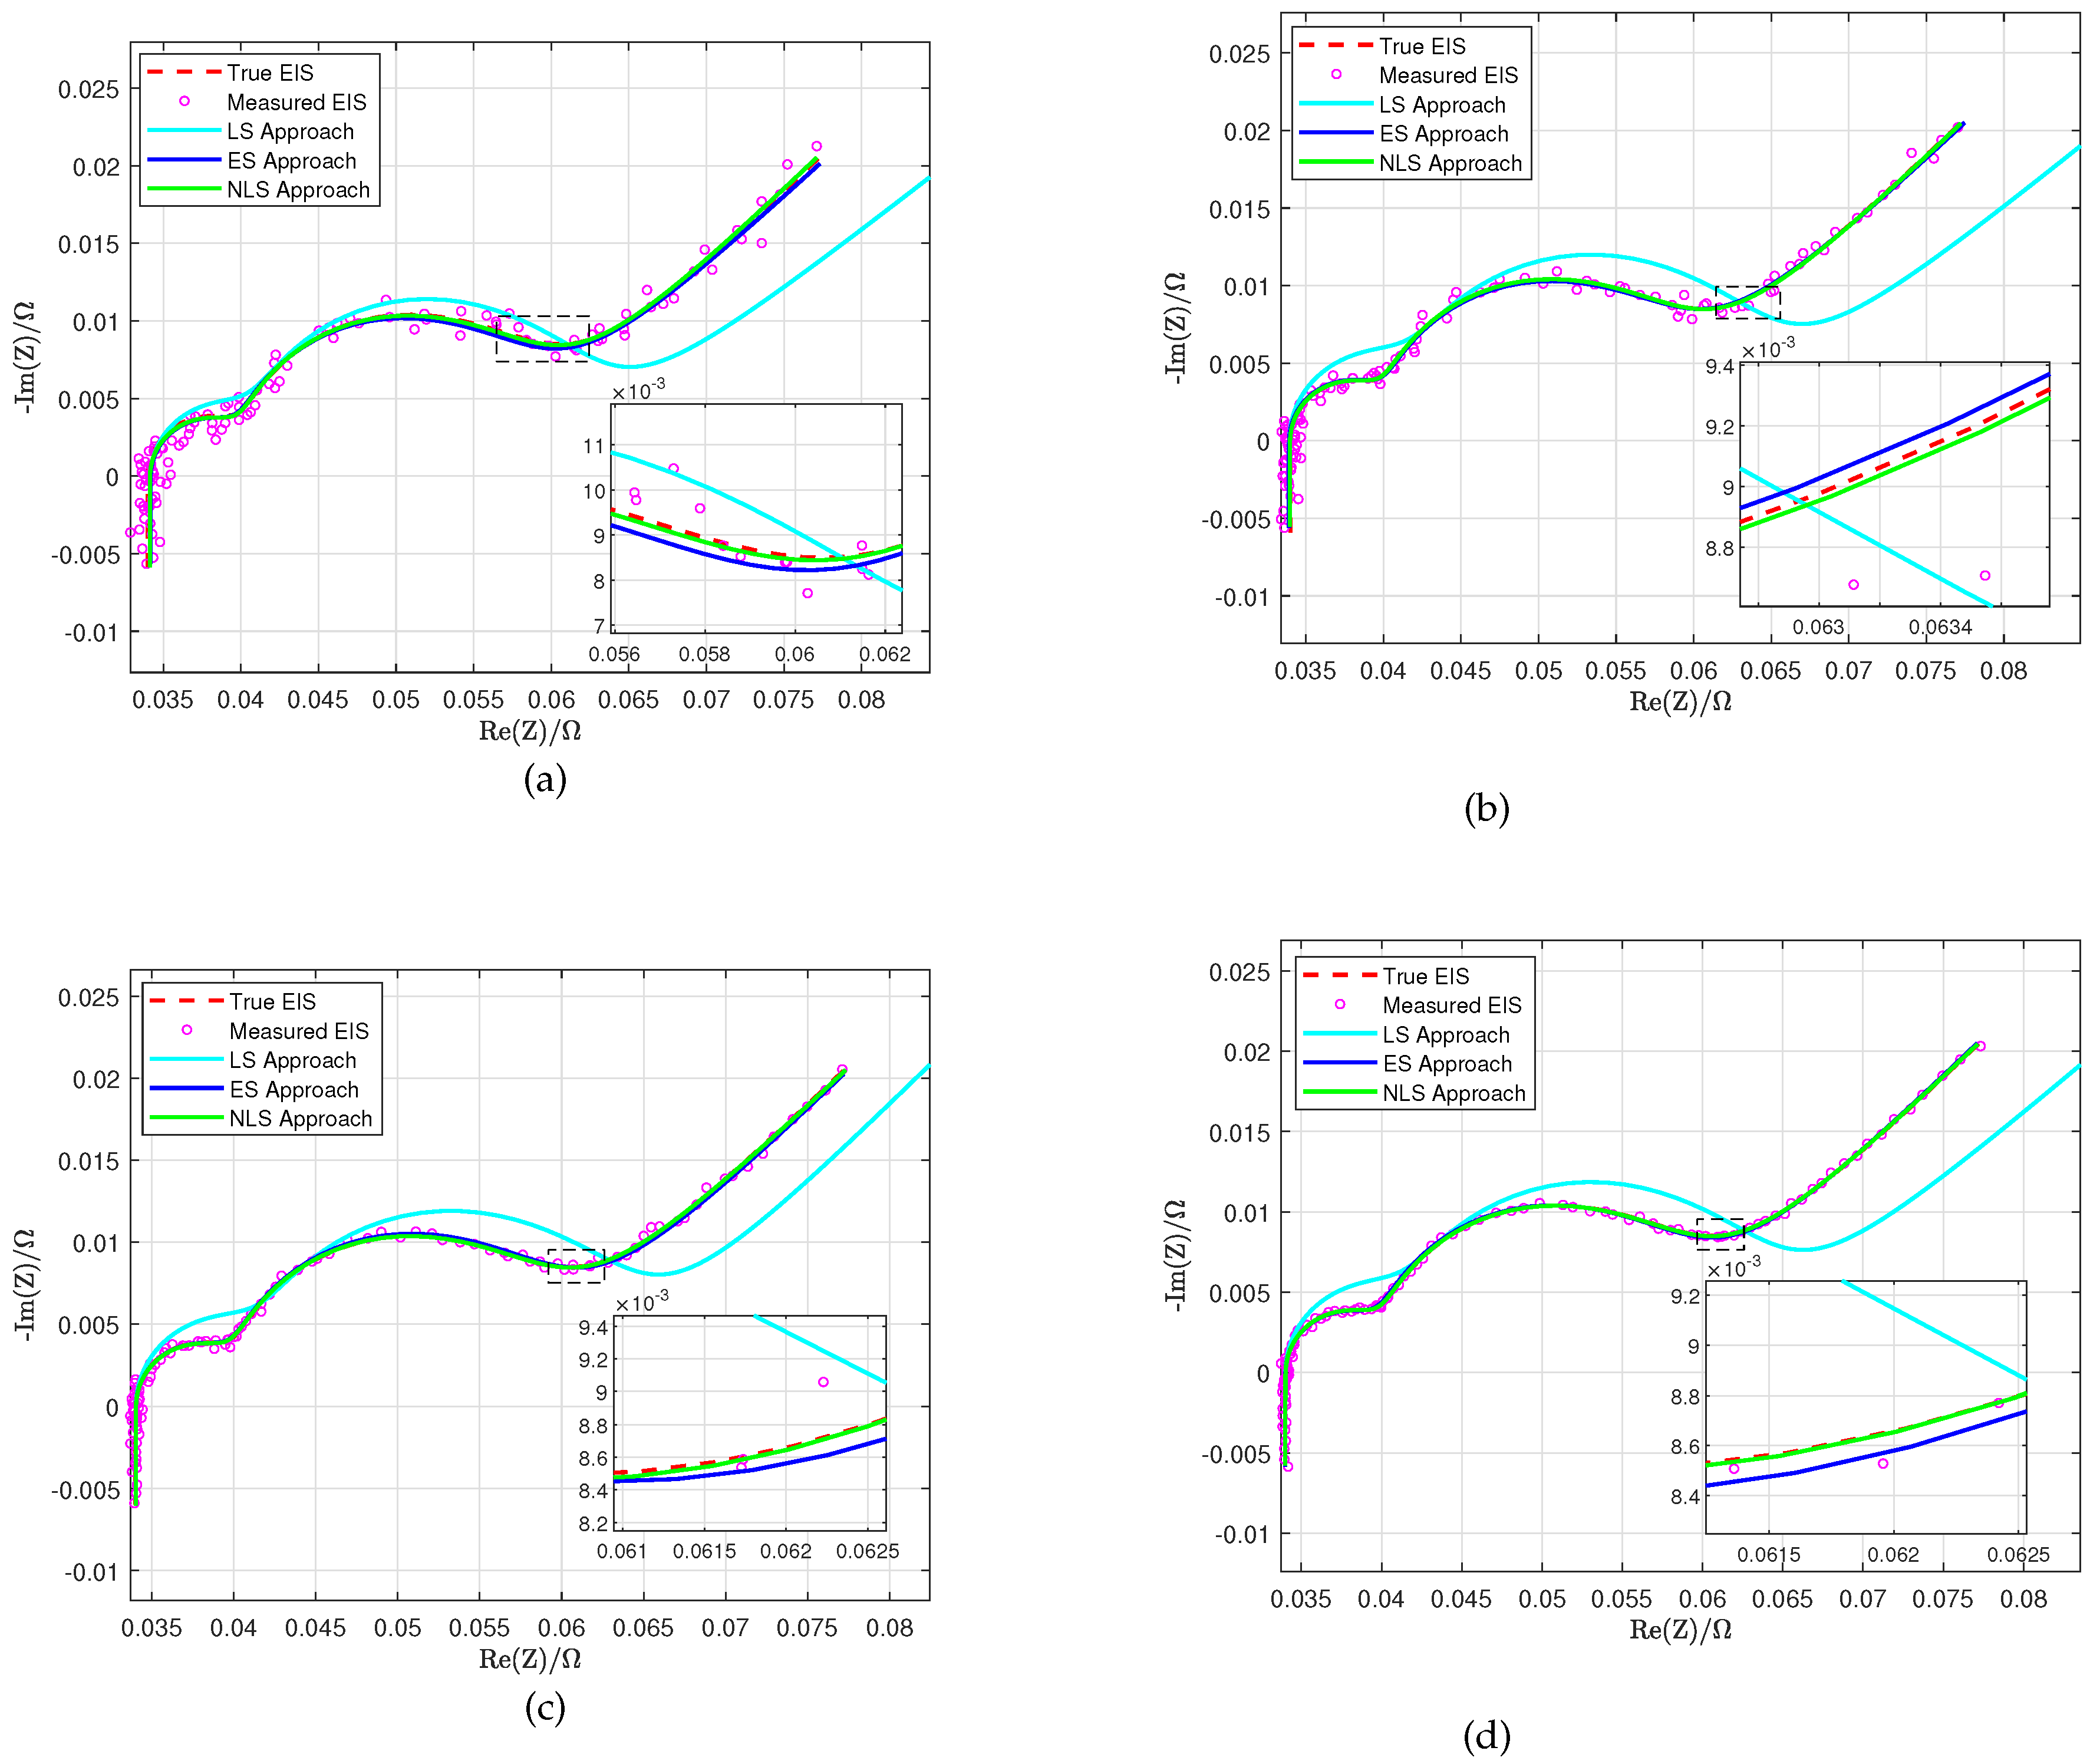
Figure 12.
Percentage difference between true and estimated ECM parameters at different noise levels. (a) = 0.6046 . (b) = 0.3400 . (c) = 0.1912 . (d) = 0.1075 .
Figure 12.
Percentage difference between true and estimated ECM parameters at different noise levels. (a) = 0.6046 . (b) = 0.3400 . (c) = 0.1912 . (d) = 0.1075 .
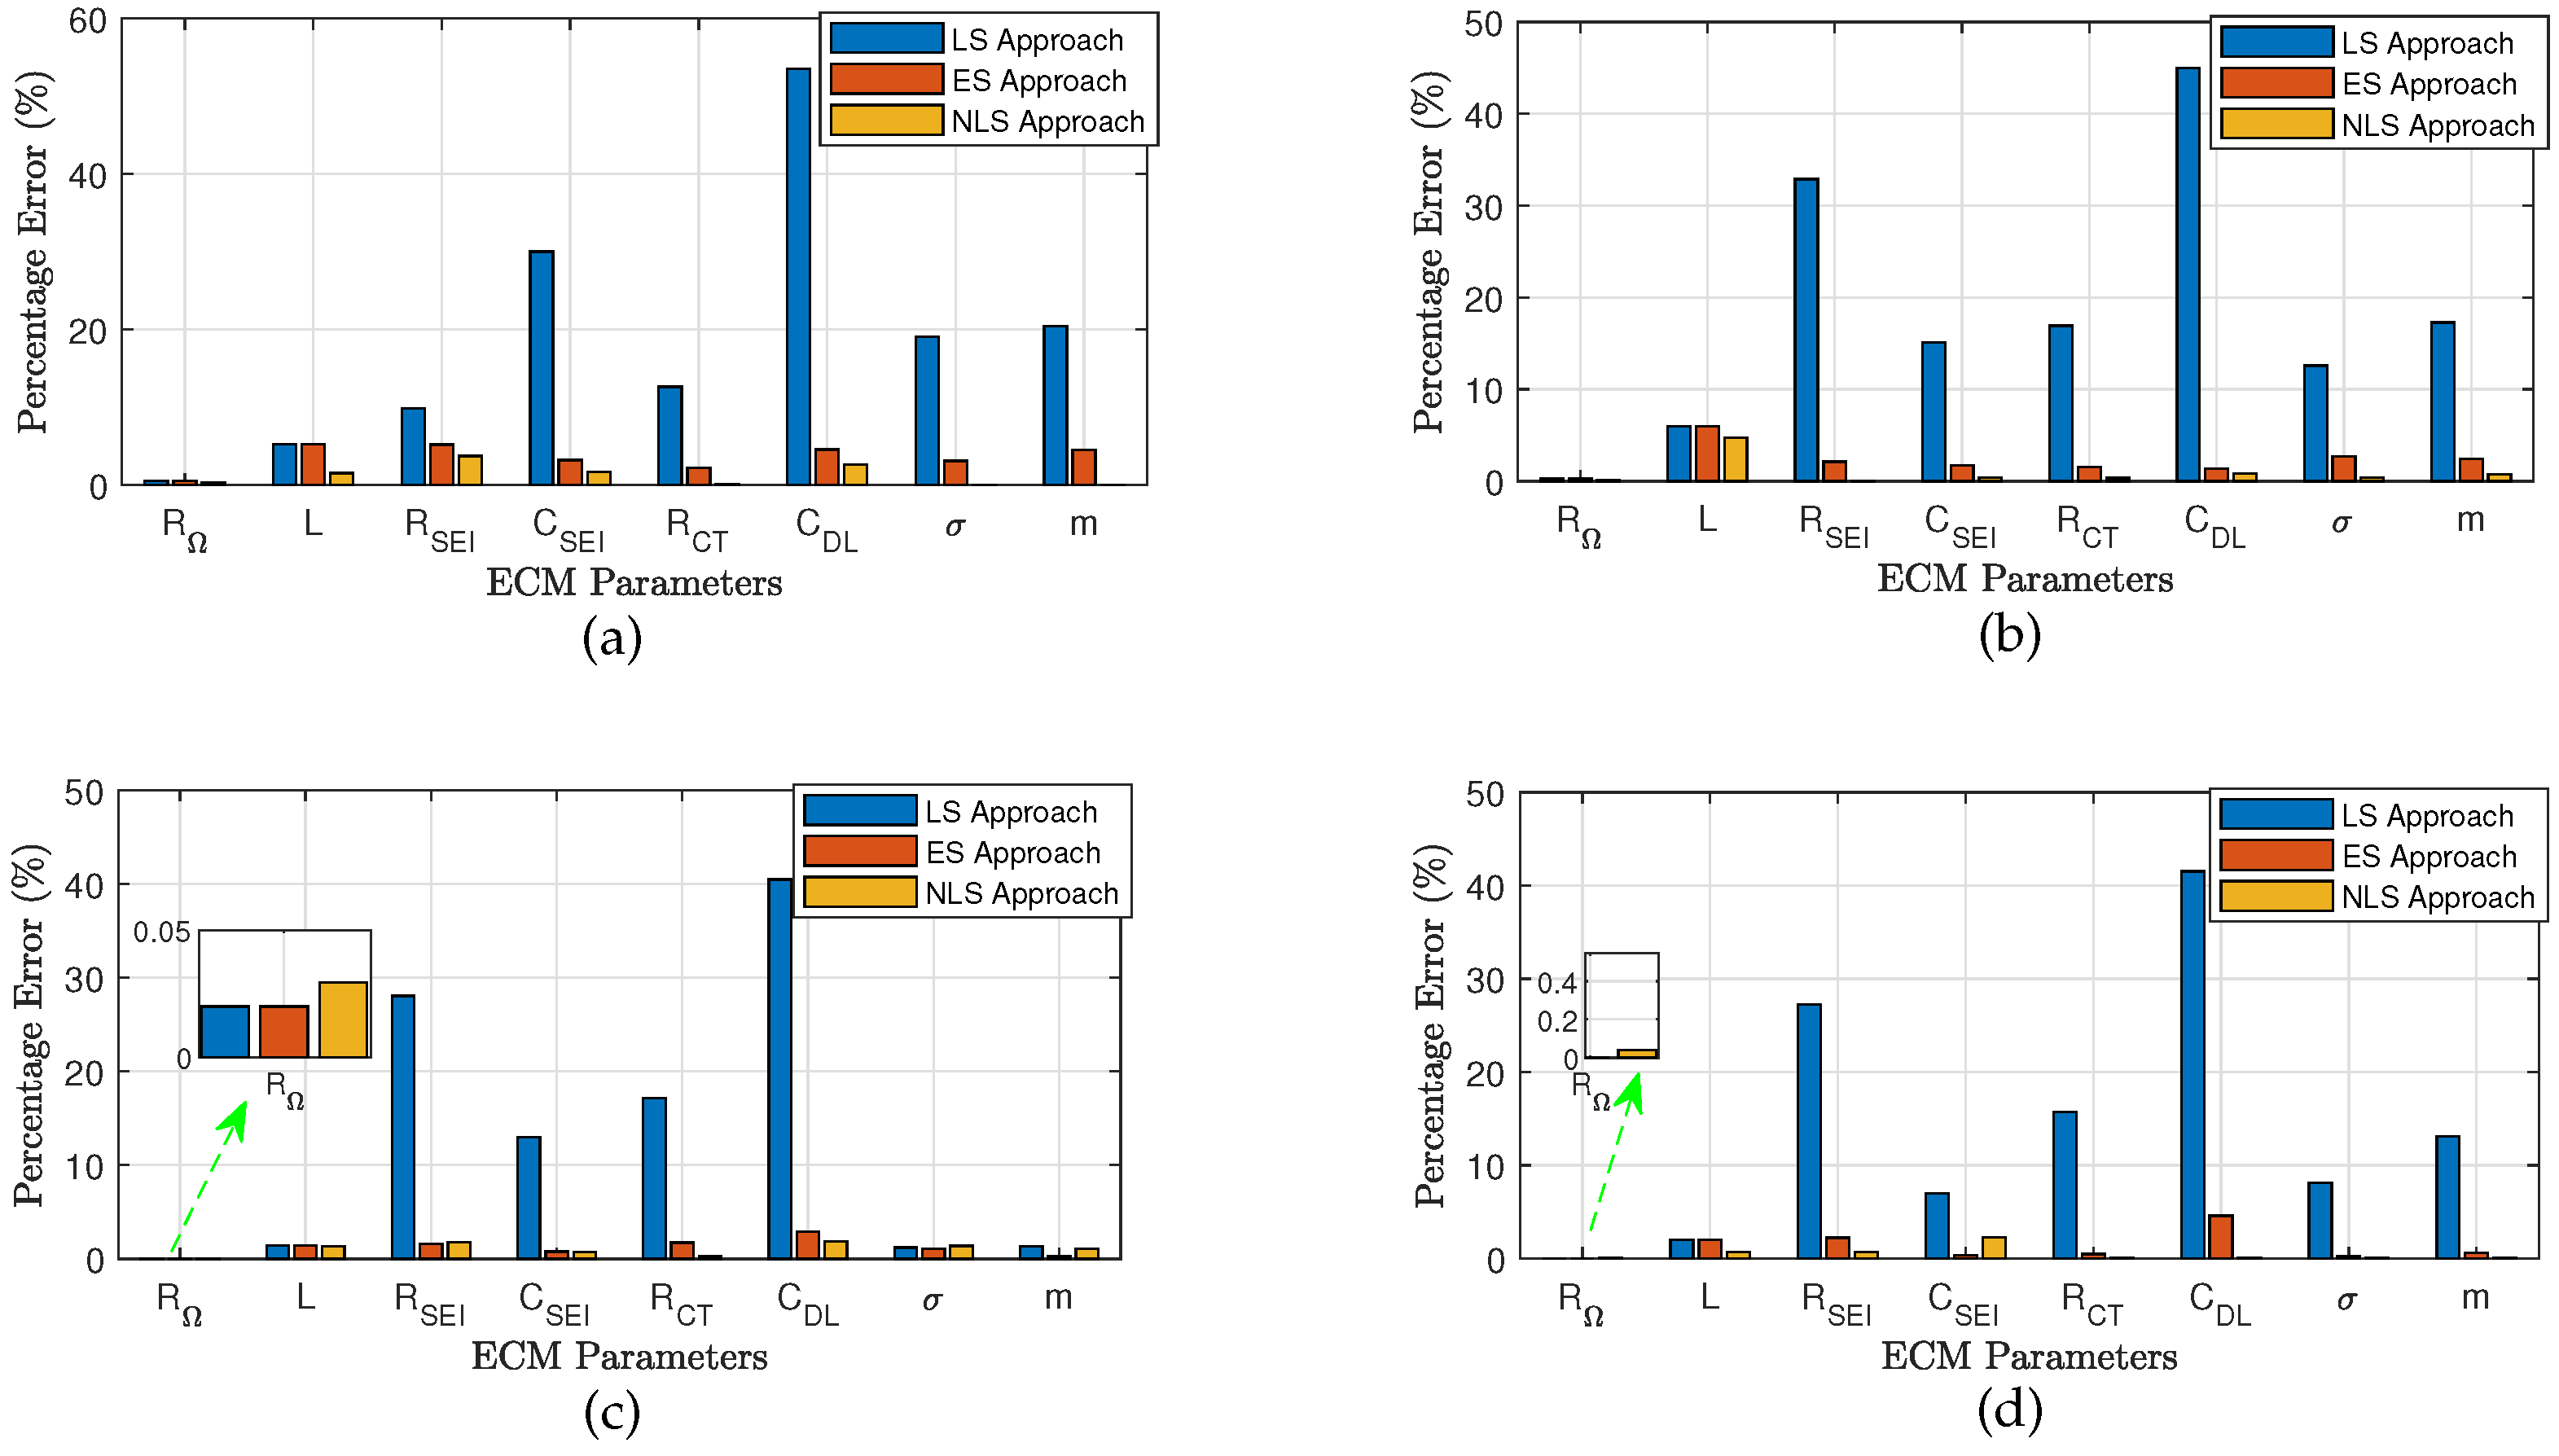
Figure 13.
Fitting real EIS measurements of LG and Molicel batteries at different SOC levels via LS, ES, and NLS approaches. (a) LG battery at 90% SOC. (b) LG battery at 50% SOC. (c) LG battery at 10% SOC. (d) Molicel battery at 90% SOC. (e) Molicel battery at 50% SOC. (f) Molicel battery at 10% SOC.
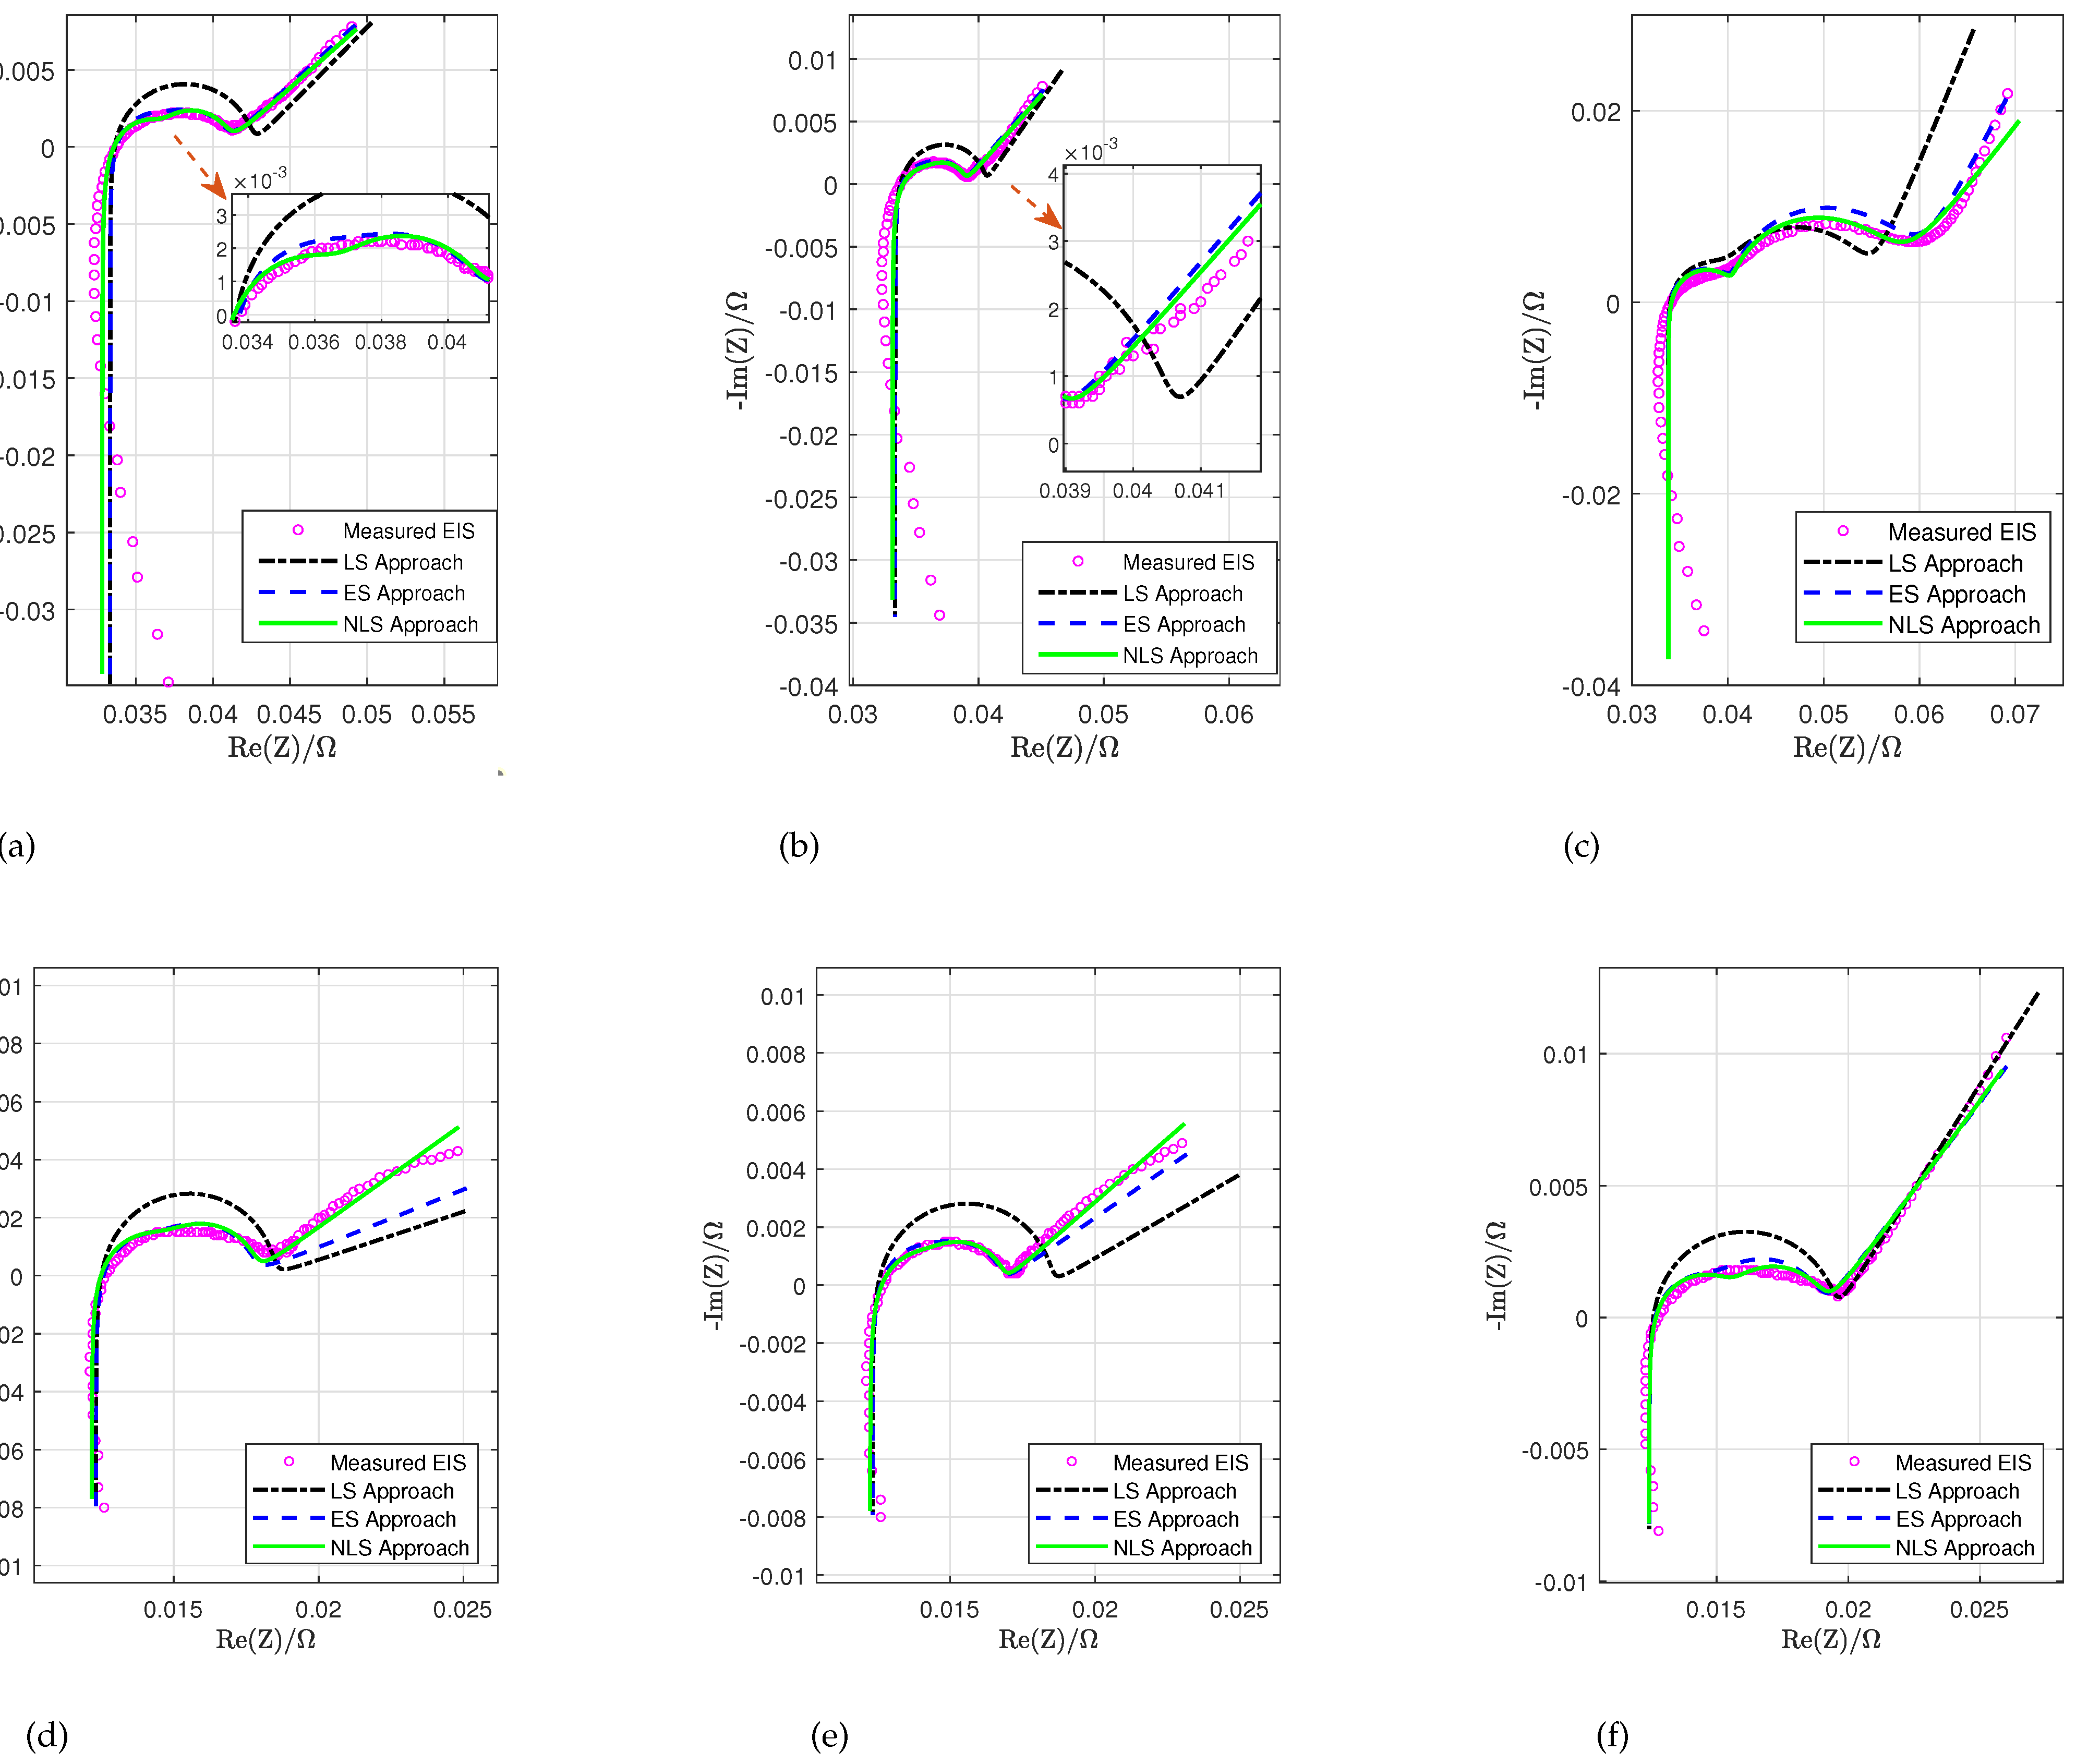

Table 1.
True ECM parameters used for EIS simulation.
| L | m | ||||||
|---|---|---|---|---|---|---|---|
| 34 | 95 | 6 | 1 | 18 | 8 | 5 | 1 |
Table 2.
Esitmated ECM parameters, computational time, and accuracy of using LS, ES and NLS approaches to fit simulated EIS data
Table 2.
Esitmated ECM parameters, computational time, and accuracy of using LS, ES and NLS approaches to fit simulated EIS data
|
|
|
L
|
|
|
|
|
|
m |
|
|
|
|---|---|---|---|---|---|---|---|---|---|---|---|
| LS | 34.1732 | 90.0059 | 6.5913 | 0.7001 | 20.2695 | 3.7199 | 5.9541 | 0.7955 | 0.8179 | 36 | |
| 0.6046 | ES | 34.1732 | 90.0059 | 5.6893 | 1.0318 | 17.6020 | 7.6356 | 5.1542 | 0.9546 | 132.5195 | 7.7635 |
| NLS | 34.1513 | 94.9926 | 5.8394 | 0.9940 | 17.9632 | 7.9505 | 4.9704 | 1.0083 | 2.4578 | 7.5761 | |
| LS | 33.9115 | 89.3443 | 7.9729 | 0.8487 | 21.0450 | 4.4013 | 5.6291 | 0.8273 | 1.3832 | 37 | |
| 0.3400 | ES | 33.9115 | 89.3443 | 6.1266 | 0.9827 | 17.7220 | 8.1076 | 5.1341 | 0.9754 | 150.6105 | 4.3921 |
| NLS | 33.9639 | 91.2816 | 5.9986 | 0.9877 | 18.0590 | 7.9177 | 4.9947 | 1.0035 | 2.4566 | 4.2861 | |
| LS | 34.0076 | 93.6538 | 7.6838 | 0.8704 | 21.0861 | 4.7606 | 5.0606 | 1.0132 | 0.8481 | 31 | |
| 0.1912 | ES | 34.0076 | 93.6538 | 5.9044 | 1.0078 | 18.3116 | 7.7674 | 4.9456 | 1.0025 | 133.6487 | 2.5021 |
| NLS | 34.0100 | 96.2899 | 5.8936 | 1.0074 | 17.9556 | 7.8518 | 5.0690 | 0.9891 | 2.0977 | 2.2978 | |
| LS | 33.9983 | 93.1031 | 7.6353 | 0.9300 | 20.8236 | 4.6782 | 5.4055 | 0.8688 | 0.7761 | 32 | |
| 0.1075 | ES | 33.9983 | 93.1031 | 5.8671 | 1.0034 | 18.0840 | 7.6328 | 4.9885 | 1.0060 | 134.4532 | 1.6276 |
| NLS | 33.9979 | 93.9546 | 5.9664 | 1.0366 | 17.9481 | 7.9246 | 5.0128 | 0.9960 | 2.0583 | 1.3904 |
Table 3.
Esitmated ECM parameters, computational time, and accuracy of using LS, ES and NLS approaches to fit real EIS data collected from LG 18650 battery while discharging
Table 3.
Esitmated ECM parameters, computational time, and accuracy of using LS, ES and NLS approaches to fit real EIS data collected from LG 18650 battery while discharging
|
|
|
L |
|
|
|
|
|
m |
|
|
|
|---|---|---|---|---|---|---|---|---|---|---|---|
| LS | 33.3308 | 555.2298 | 4.8670 | 0.3253 | 4.1876 | 0.7179 | 1.9801 | 1.0186 | 0.729 | 16 | |
| 90 | ES | 33.3308 | 555.2298 | 3.7399 | 0.3253 | 3.6366 | 2.1536 | 2.1423 | 0.9221 | 133.9269 | 4.8733 |
| NLS | 32.8162 | 544.9949 | 3.9102 | 0.1691 | 4.0532 | 1.9840 | 2.1418 | 0.8933 | 1.8634 | 3.9978 | |
| LS | 33.3500 | 550.4295 | 3.9987 | 0.2971 | 3.0794 | 0.4795 | 1.5624 | 1.4540 | 0.7036 | 16 | |
| 50 | ES | 33.3500 | 550.4295 | 2.6938 | 0.2971 | 2.6742 | 1.2366 | 1.6223 | 1.1632 | 131.8468 | 4.1756 |
| NLS | 33.1436 | 529.4929 | 2.8149 | 0.1890 | 2.8303 | 1.2932 | 1.5826 | 1.1364 | 1.7841 | 4.012 | |
| LS | 33.7480 | 548.8295 | 6.3127 | 0.2972 | 14.3045 | 1.7628 | 2.8718 | 2.4868 | 0.7296 | 31 | |
| 10 | ES | 33.7480 | 548.8295 | 6.6449 | 0.2972 | 18.4450 | 5.1029 | 2.6614 | 1.9894 | 133.3339 | 12 |
| NLS | 33.7766 | 593.9607 | 6.6475 | 0.2611 | 16.1871 | 5.2409 | 3.5550 | 1.3235 | 2.1813 | 9.3198 |
Table 4.
Esitmated ECM parameters, computational time, and accuracy of using LS, ES and NLS approaches to fit real EIS data collected from Molicel 21700 battery while discharging
Table 4.
Esitmated ECM parameters, computational time, and accuracy of using LS, ES and NLS approaches to fit real EIS data collected from Molicel 21700 battery while discharging
|
|
|
L
|
|
|
|
|
|
m |
|
|
|
|---|---|---|---|---|---|---|---|---|---|---|---|
| LS | 12.3167 | 128.0069 | 3.4751 | 0.1814 | 2.5873 | 0.3466 | 1.6716 | 0.3333 | 0.763 | 12 | |
| 90 | ES | 12.3167 | 128.0069 | 2.3411 | 0.1814 | 2.9278 | 1.0399 | 1.8852 | 0.4000 | 137.6328 | 5.8928 |
| NLS | 12.1632 | 124.6571 | 2.5830 | 0.1318 | 2.9435 | 0.9523 | 1.7920 | 0.7169 | 1.8859 | 3.2337 | |
| LS | 12.3167 | 128.0069 | 3.2931 | 0.1772 | 2.7962 | 0.3224 | 1.6401 | 0.5792 | 0.7237 | 15 | |
| 50 | ES | 12.3167 | 128.0069 | 2.2185 | 0.1772 | 2.1339 | 0.8994 | 1.6279 | 0.6950 | 135.3571 | 2.7111 |
| NLS | 12.2259 | 126.3043 | 2.0331 | 0.1294 | 2.4749 | 0.7420 | 1.5924 | 0.8763 | 1.891 | 1.3862 | |
| LS | 12.4444 | 129.6070 | 3.8936 | 0.1900 | 3.0673 | 0.3903 | 1.9573 | 1.5757 | 0.7366 | 12 | |
| 10 | ES | 12.4444 | 129.6070 | 2.6230 | 0.1900 | 3.7937 | 1.1708 | 1.7966 | 1.3269 | 134.0528 | 3.3286 |
| NLS | 12.4349 | 126.2317 | 3.1777 | 0.1418 | 3.3352 | 1.9094 | 1.7361 | 1.3533 | 1.9071 | 2.7548 |
Disclaimer/Publisher’s Note: The statements, opinions and data contained in all publications are solely those of the individual author(s) and contributor(s) and not of MDPI and/or the editor(s). MDPI and/or the editor(s) disclaim responsibility for any injury to people or property resulting from any ideas, methods, instructions or products referred to in the content. |
© 2024 by the authors. Licensee MDPI, Basel, Switzerland. This article is an open access article distributed under the terms and conditions of the Creative Commons Attribution (CC BY) license (http://creativecommons.org/licenses/by/4.0/).
Copyright: This open access article is published under a Creative Commons CC BY 4.0 license, which permit the free download, distribution, and reuse, provided that the author and preprint are cited in any reuse.