
Submitted:
24 July 2025
Posted:
25 July 2025
You are already at the latest version
Abstract
The growing need for efficient battery reuse and recycling requires rapid, reliable methods to assess the State of Health (SoH) of lithium-ion cells. Conventional SoH estimation based on full charge-discharge cycling is slow, energy-intensive, and unsuitable for dismantled cells with unknown histories. This work presents an automated diagnostic approach using Electrochemical Impedance Spectroscopy (EIS) combined with Electrical Equivalent Circuit (EEC) modeling for fast, non-invasive SoH estimation. A correlation between fitted EIS parameters and cell degradation stages was established through controlled aging tests on NMC-based lithium-ion cells. The methodology was implemented in custom software (BaterurgIA) integrated into a robotic testing bench, enabling automatic EIS acquisition, data fitting, and SoH determination. The system achieves SoH estimation with 5–10% accuracy for cells in intermediate and advanced degradation stages, while additional parameters improve sensitivity during early aging. Compared to conventional cycling methods, the proposed approach reduces diagnostic time from hours to minutes, minimizes energy consumption, and offers predictive insights into internal degradation mechanisms. This enables fast and reliable cell grading for reuse, reconditioning, or recycling, supporting the development of scalable solutions for battery second-life applications and circular economy initiatives.
Keywords:
lithium-ion batteries
; state of health estimation
; electrochemical impedance spectroscopy
; battery second life
1. Introduction
Li-ion batteries play a critical role into the renewable energy sources transition and to fulfil the ambitions of the European Green Deal [1]. However, a main drawback of this technology lies in its limited lifetime and the potential risks associated with cells approaching the end of their service life. These risks include short circuits, thermal runaway, swelling, and other failure modes that may compromise safety and system reliability [2]. In addition to the hazards, the inability to accurately assess cell condition hinders the proper reuse and recycling of batteries.
Given these challenges, determining the State of Health (SoH) and Remaining Useful Life (RUL) at cell/module level is essential for effective and safe battery management. SoH indicates the overall condition of a battery and its ability to store and deliver energy compared to its original capacity at the beginning of life. Derived from SoH, RUL represents the estimated time or number of cycles remaining before the battery reaches the end of its usable life.
It is important to note that SoH is not associated with a single physical property. Different Battery Management Systems (BMS) may use various parameters—individually or in combination—to compute an arbitrary SoH value. Common parameters include capacity, voltage, internal resistance, impedance, conductance, age, number of cycles, and temperature, among others [3,4]. Throughout the battery’s lifetime, these parameters are continuously monitored and estimated in real time by the BMS of the device or vehicle. This information is used both to inform users about the current State of Charge (SoC) and SoH, and to actively manage the battery’s operation, protecting the cells from overcharge, over-discharge, excessive currents, and overheating.
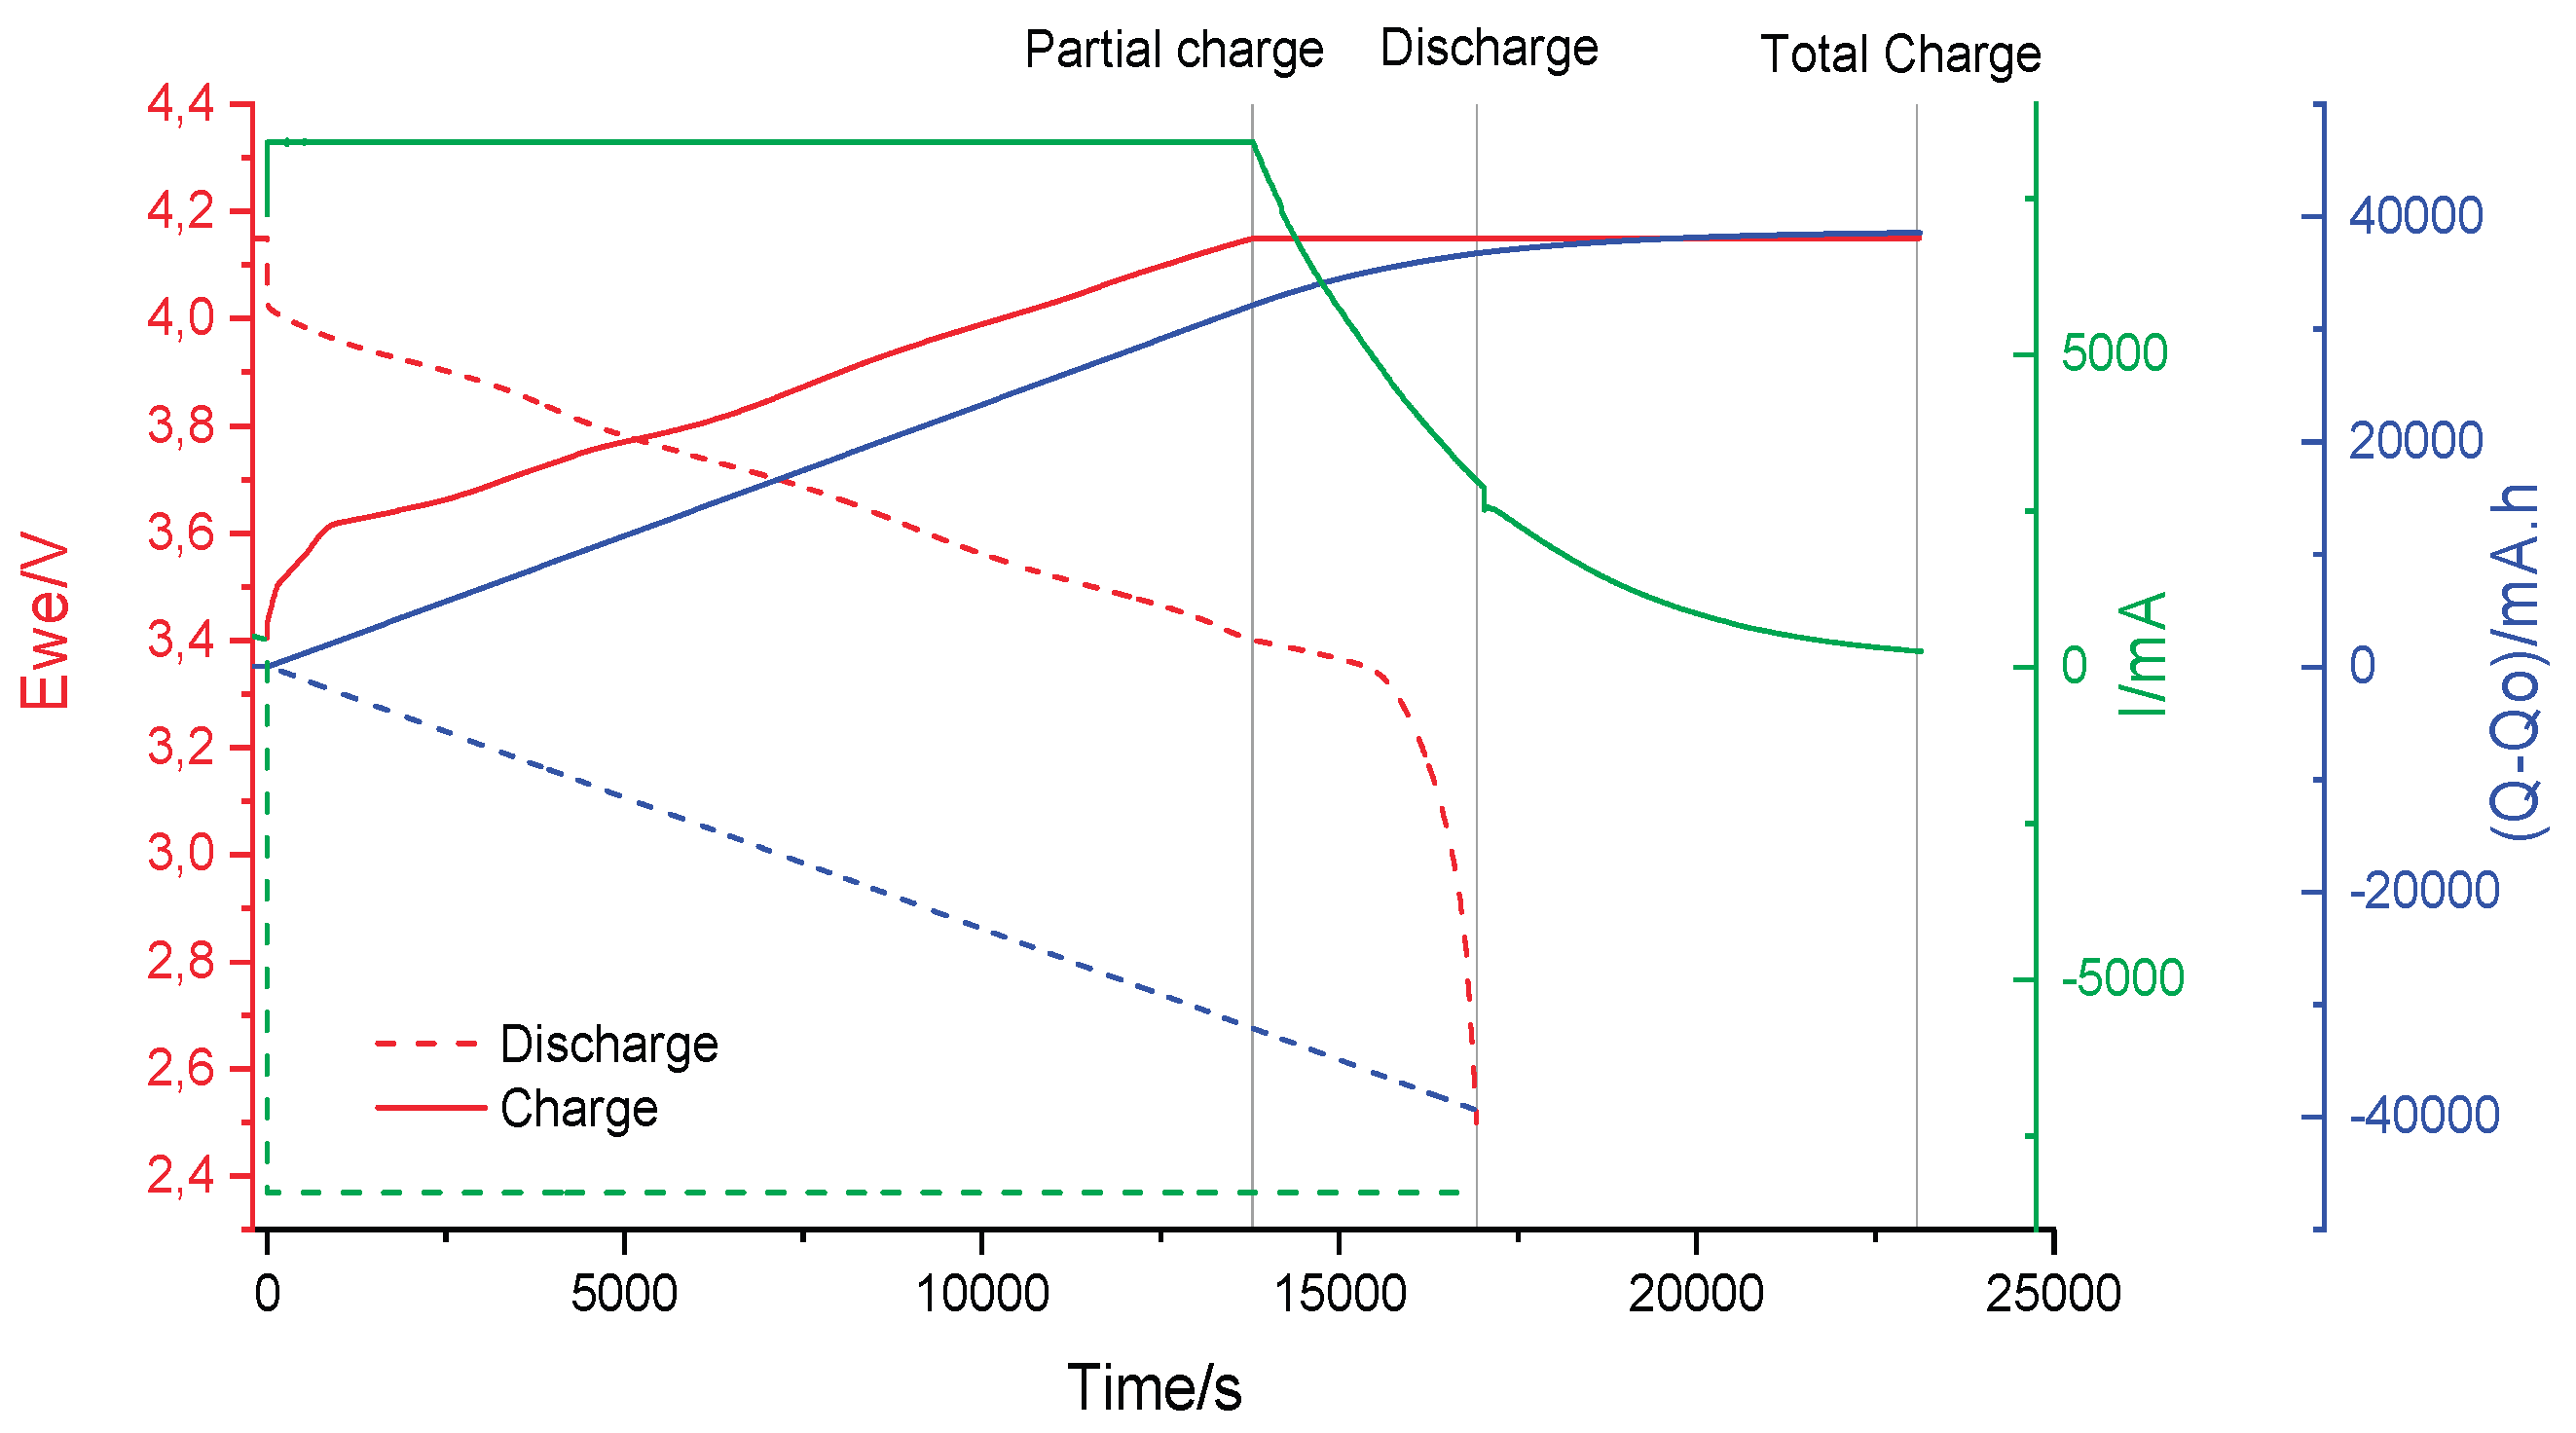
One of the most commonly used SoH evaluation methods is based on comparing the battery’s initial capacity—typically measured during the first full charge/discharge cycle (see Figure 1) with the capacity at a given cycle n, measured under identical operating conditions and a defined C-rate [5]. This capacity degradation trend is relatively straightforward to monitor during normal battery operation.
However, significant challenges arise when evaluating batteries that have been dismantled or are operating off-grid. In such cases, accurate capacity determination depends on performing a complete charge-discharge cycle, which imposes specific operational and technical requirements that must be met to ensure reliable SoH estimation:
• Requirement for Cycler Equipment: The testing equipment must be capable of handling increasing charge-discharge power levels proportional to the capacity of the module under evaluation. As module capacity scales up, so does the need for more robust and higher-power cyclers.
• Time Consumption: Standard testing protocols typically require charge and discharge rates between 1C and 0.2C, which corresponds to a duration of approximately 1 to 5 hours per cycle. This results in significant time investment for each complete test.
• Energy Consumption and Efficiency: During the charging phase, energy is drawn from the grid to charge the cell. In the discharge phase, unless advanced energy recovery systems are employed, the energy released by the cell is typically dissipated as heat and consequently lost, resulting in low overall energy efficiency.
• Safety Considerations: Full cycling of cells and modules involves high current and voltage levels, necessitating rigorous safety measures. These include thermal management, electrical isolation, and overcurrent/overvoltage protections to mitigate risks of fire, short circuits, and thermal runaway.
Figure 1.
Battery Capacity Determination test.
In this study, Electrochemical Impedance Spectroscopy (EIS) is proposed as a rapid, reliable and non-invasive technique for determining the SoH of dismantled lithium-ion cells and modules.
The primary objective is to develop both the methodology and the necessary tools to enable EIS-based SoH estimation under real-operating conditions, particularly for cells and modules with unknown histories and degradation profiles. Compared to conventional methods such as full charge-discharge cycling, EIS offers several key advantages as:
• Significantly Reduced Time Requirements: EIS measurements can be completed in under five minutes per cell, whereas standard capacity determination through galvanostatic cycling typically requires over two hours per cycle.
• Minimal Energy Consumption: EIS involves the application of low-amplitude alternating current signals, resulting in energy consumption several orders of magnitude lower than that of full cycling tests. The absence of charge and discharge processes also enhances operational safety.
• Insight into Degradation Mechanisms: Beyond providing a quantitative SoH percentage, EIS spectra reflect internal electrochemical and physical changes within the cell. These measurements can be used to identify and analyze degradation pathways such as solid electrolyte interphase (SEI) growth, lithium plating, or loss of active material.
• Predictive Failure Diagnostics: Variations in EIS indicators often precede catastrophic failures, allowing for early detection of latent defects or emerging failures. This predictive capability can be critical for the safe second-life deployment of used Li-ion cells.
This diagnostic approach is based on the Galvanostatic Electrochemical Impedance Spectroscopy (GEIS) technique combined with Electrical Equivalent Circuit (EEC) modeling to interpret the resulting impedance spectra. This method demonstrates a fast characterization of the electrochemical phenomena occurring within lithium-ion cells although the procedure is adaptable to a wide range of cell chemistries and form factors, making it an innovative and versatile tool for battery analysis.
Recent studies have demonstrated the suitability of this technique for SoH assessment, underscoring its capability to identify and distinguish between various internal degradation mechanisms. These mechanisms are generally classified into three main categories: loss of conductivity, loss of lithium ions and loss of active material [6,7,8]. By analyzing shifts in impedance characteristics, the method offers valuable insights into the dominant aging processes affecting cell performance, contributing to more accurate diagnostics and predictive maintenance strategies.
EIS is a diagnostic technique based on the application of a small-amplitude current perturbation across a wide range of frequencies to a battery cell. The resulting voltage response is used to calculate the impedance spectrum, which comprises both the real and imaginary components of the cell’s impedance [9]. This spectrum contains rich information about various electronic conduction and ionic transport phenomena, which occur at different time scales. Notable processes that can be identified and characterized through EIS include the ohmic resistance (related to electronic conductivity), charge transfer resistance at the electrode-electrolyte interfaces, and mass transport limitations associated with ion diffusion within the electrodes and electrolyte [10,11].
To extract quantitative electrochemical parameters from the impedance data, the impedance spectrum is fitted using Electrical Equivalent Circuit (EEC) modelling. This approach involves representing the complex electrochemical behavior of the cell with an equivalent network of ideal electrical elements—such as resistors, capacitors, inductors—and more advanced components such as constant phase elements (CPEs) or Warburg elements, which emulate diffusion processes [12]. EEC modelling is often considered the most technically challenging aspect of EIS analysis. It requires substantial prior knowledge of the EIS technique itself, as well as the specific chemistry and design (geometry, electrode configuration) of the battery cell under investigation. To address these limitations, the method developed in this study aims to simplify and automate the EIS data analysis process. This is achieved by selecting a limited set of standard EEC models and by implementing a custom-built software tool capable of autonomously performing curve fitting and extracting the associated electrochemical parameters.
The core principle of this method is to replace conventional SoH determination—typically performed via time-consuming charge-discharge cycling—with a rapid EIS measurement, focused on the high-to-mid frequency domain. The acquired EIS data are automatically analyzed, and the resulting fitted parameters are used to estimate an approximate SoH value for a cell with unknown aging history.
This SoH estimation is enabled by a pre-established empirical correlation between EEC parameters and the aging state of the cell. This correlation is derived from a reference database built through extensive testing of a single cell model, subjected to a defined cycling profile and a fixed cell configuration. Once the initial database is validated, the approach can be extended to accommodate more realistic and complex cycling profiles (e.g., dynamic load profiles), various cell chemistries, and more intricate configurations, such as multi-cell assemblies.
2. Materials and Methods
The proposed empirical correlation method is structured into three main stages:
1. Ageing Process and Data Collection: The procedure begins with the controlled ageing of a brand-new cell, conducted in increments of 50 charge-discharge cycles. At the end of each segment, EIS measurements are performed. This stage aims to monitor the evolution of the cell’s performance, particularly focusing on capacity fade as a function of cycling.
2. Data Analysis and Correlation: The acquired EIS spectra are analyzed to define and fit the Equivalent Electrical Circuit (EEC) model across all ageing stages. Specific EIS parameters extracted from the fitted models are then correlated with the cell’s SoH creating a relationship that links the impedance response to ageing-induced degradation.
3. Method Validation using Cells in unknown SoH: To validate the proposed EIS-SoH correlation, the method is applied to used cells of the same type but in an unknown SoH. The estimated SoH obtained through the EIS-based correlation is then compared with the actual SoH, independently determined using the benchmark capacity determination (BCD) method.
A comprehensive description of each stage is presented in the subsequent sections.
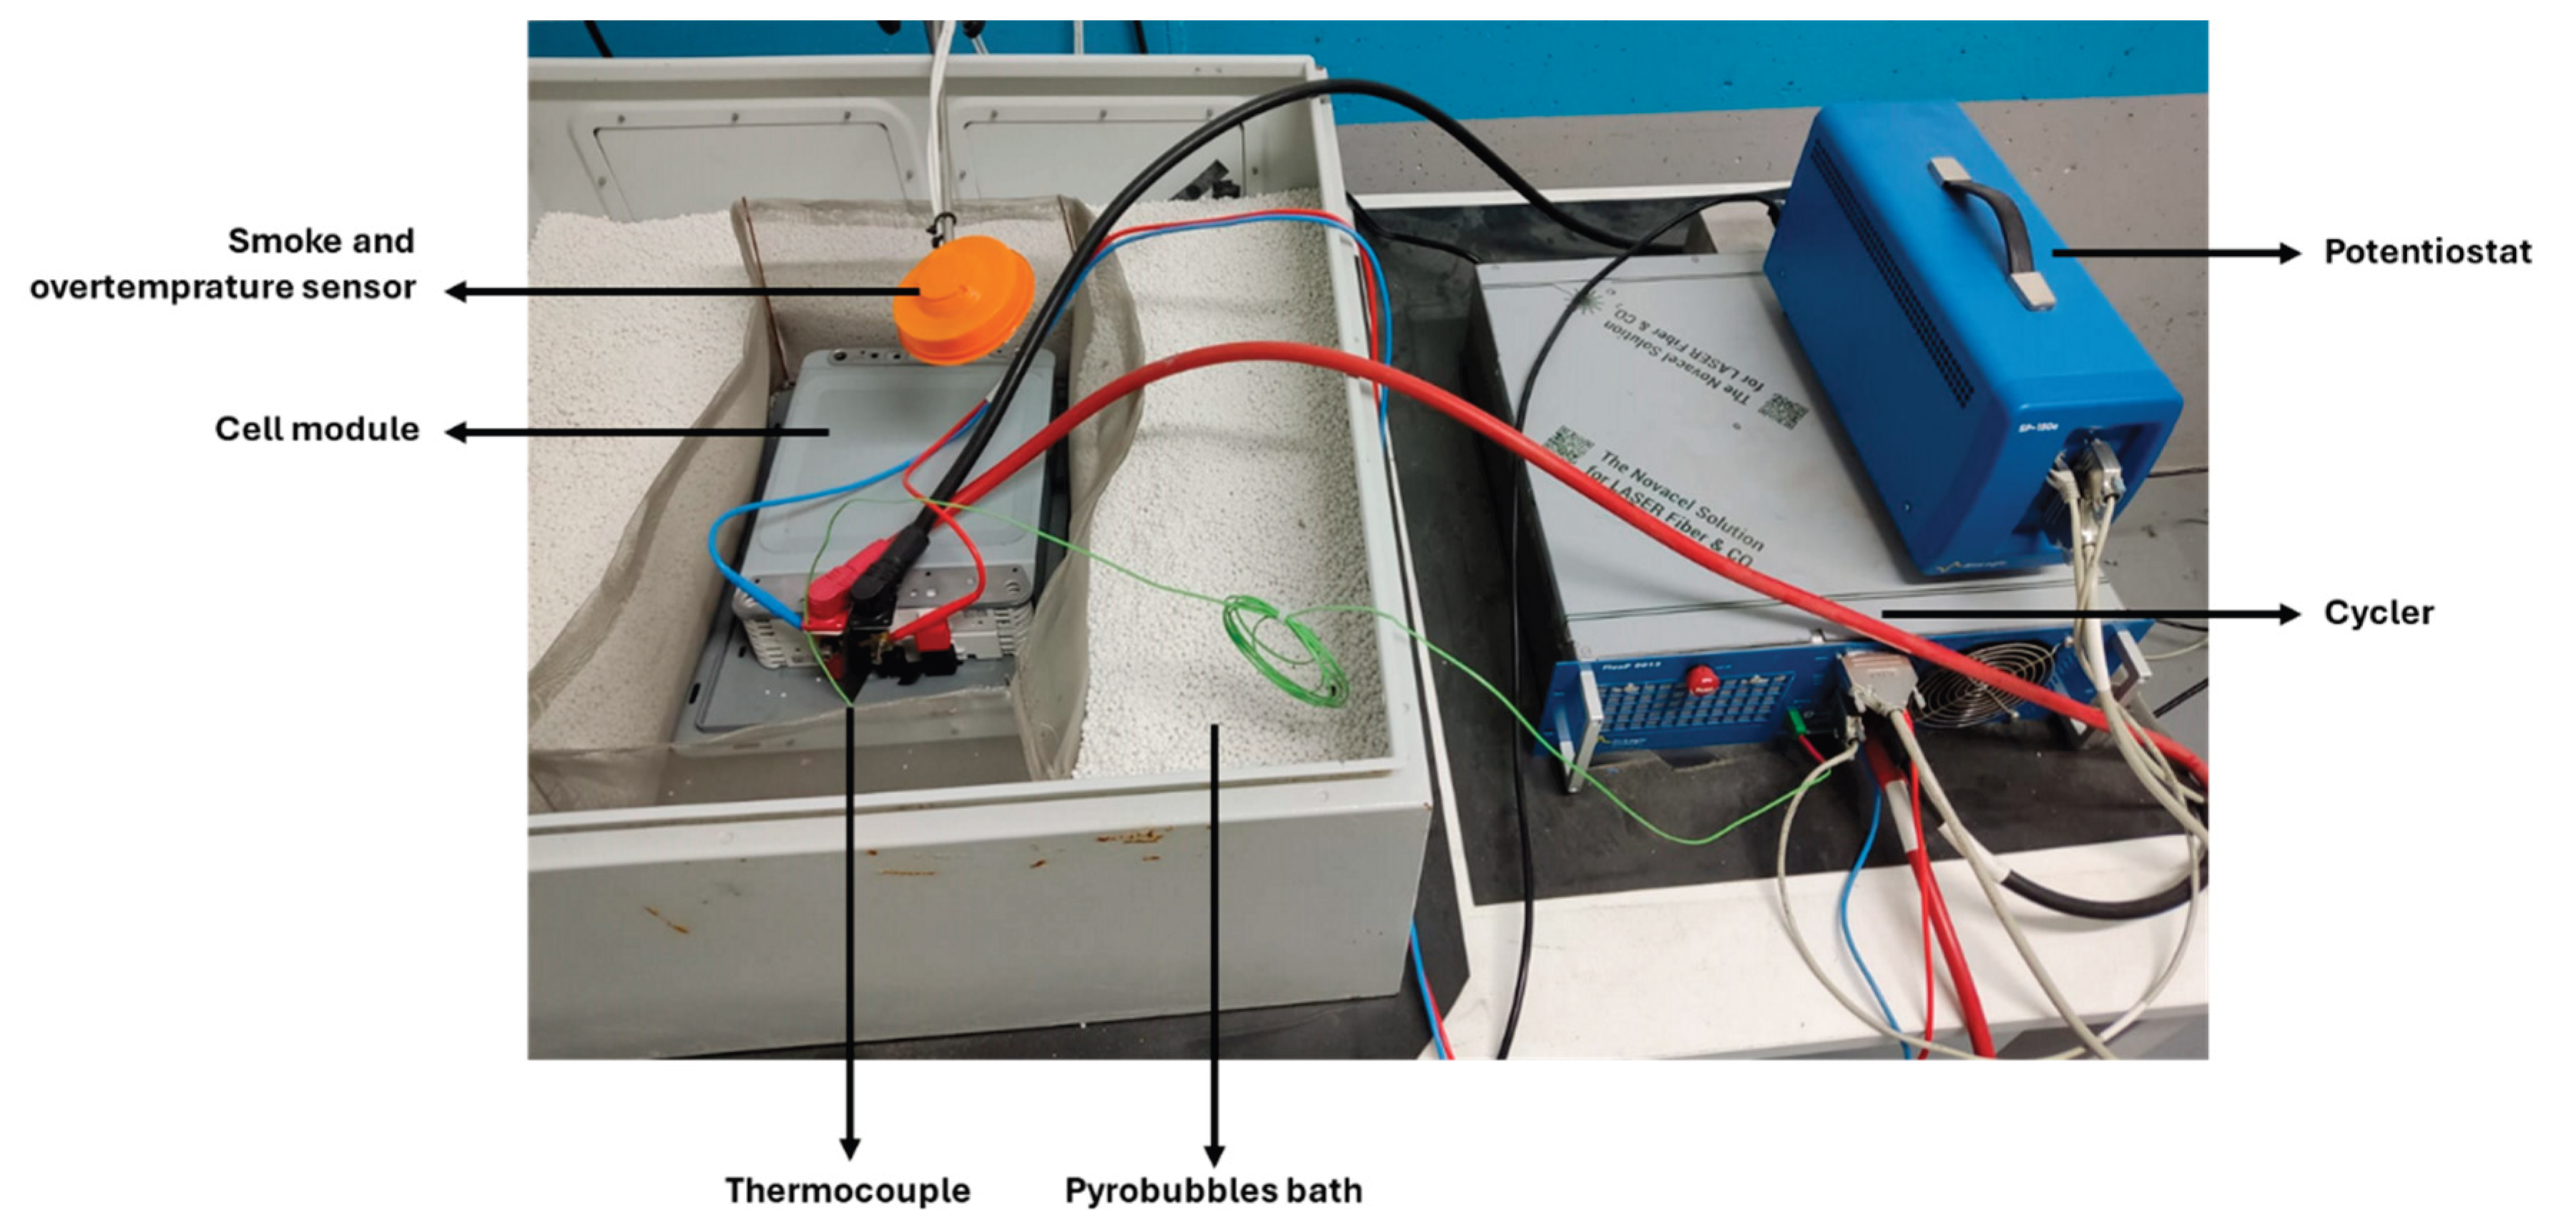
The following equipments were utilized during the study. A Potentiostat SP-150 from BioLogic®, which controls the cycling process and performs EIS measurements (see Figure 2, top right), a Booster FlexP0012 also from BioLogic® with a capacity of ±200 A and 10 V to extend the functionality of the potentiostat, enabling it to operate as a high-current cycler (Figure 2, bottom right). Electrical connections between the cycler and the cell module follow the configuration shown in Figure 2. Two large-diameter cables (13.5 mm), capable of handling currents up to 200 A, are used to apply charge and discharge currents. Two smaller-diameter cables (4 mm) are dedicated to EIS measurements.
Additionally, a thermostatic cooling unit (Cryostat from Lauda®) is employed to dissipate the heat generated by the booster during high-current cycling operations.
Given the risks involved in working with battery modules, additional safety measures are considered. Thus, the setup includes temperature and smoke sensors integrated into the facility’s emergency system, as well as appropriate fire suppression methods (Pyrobubbles® acquired from DENIOS).
Figure 2.
Laboratory setup for module characterization.
3. Results and Discussion
3.1. Ageing Cycling
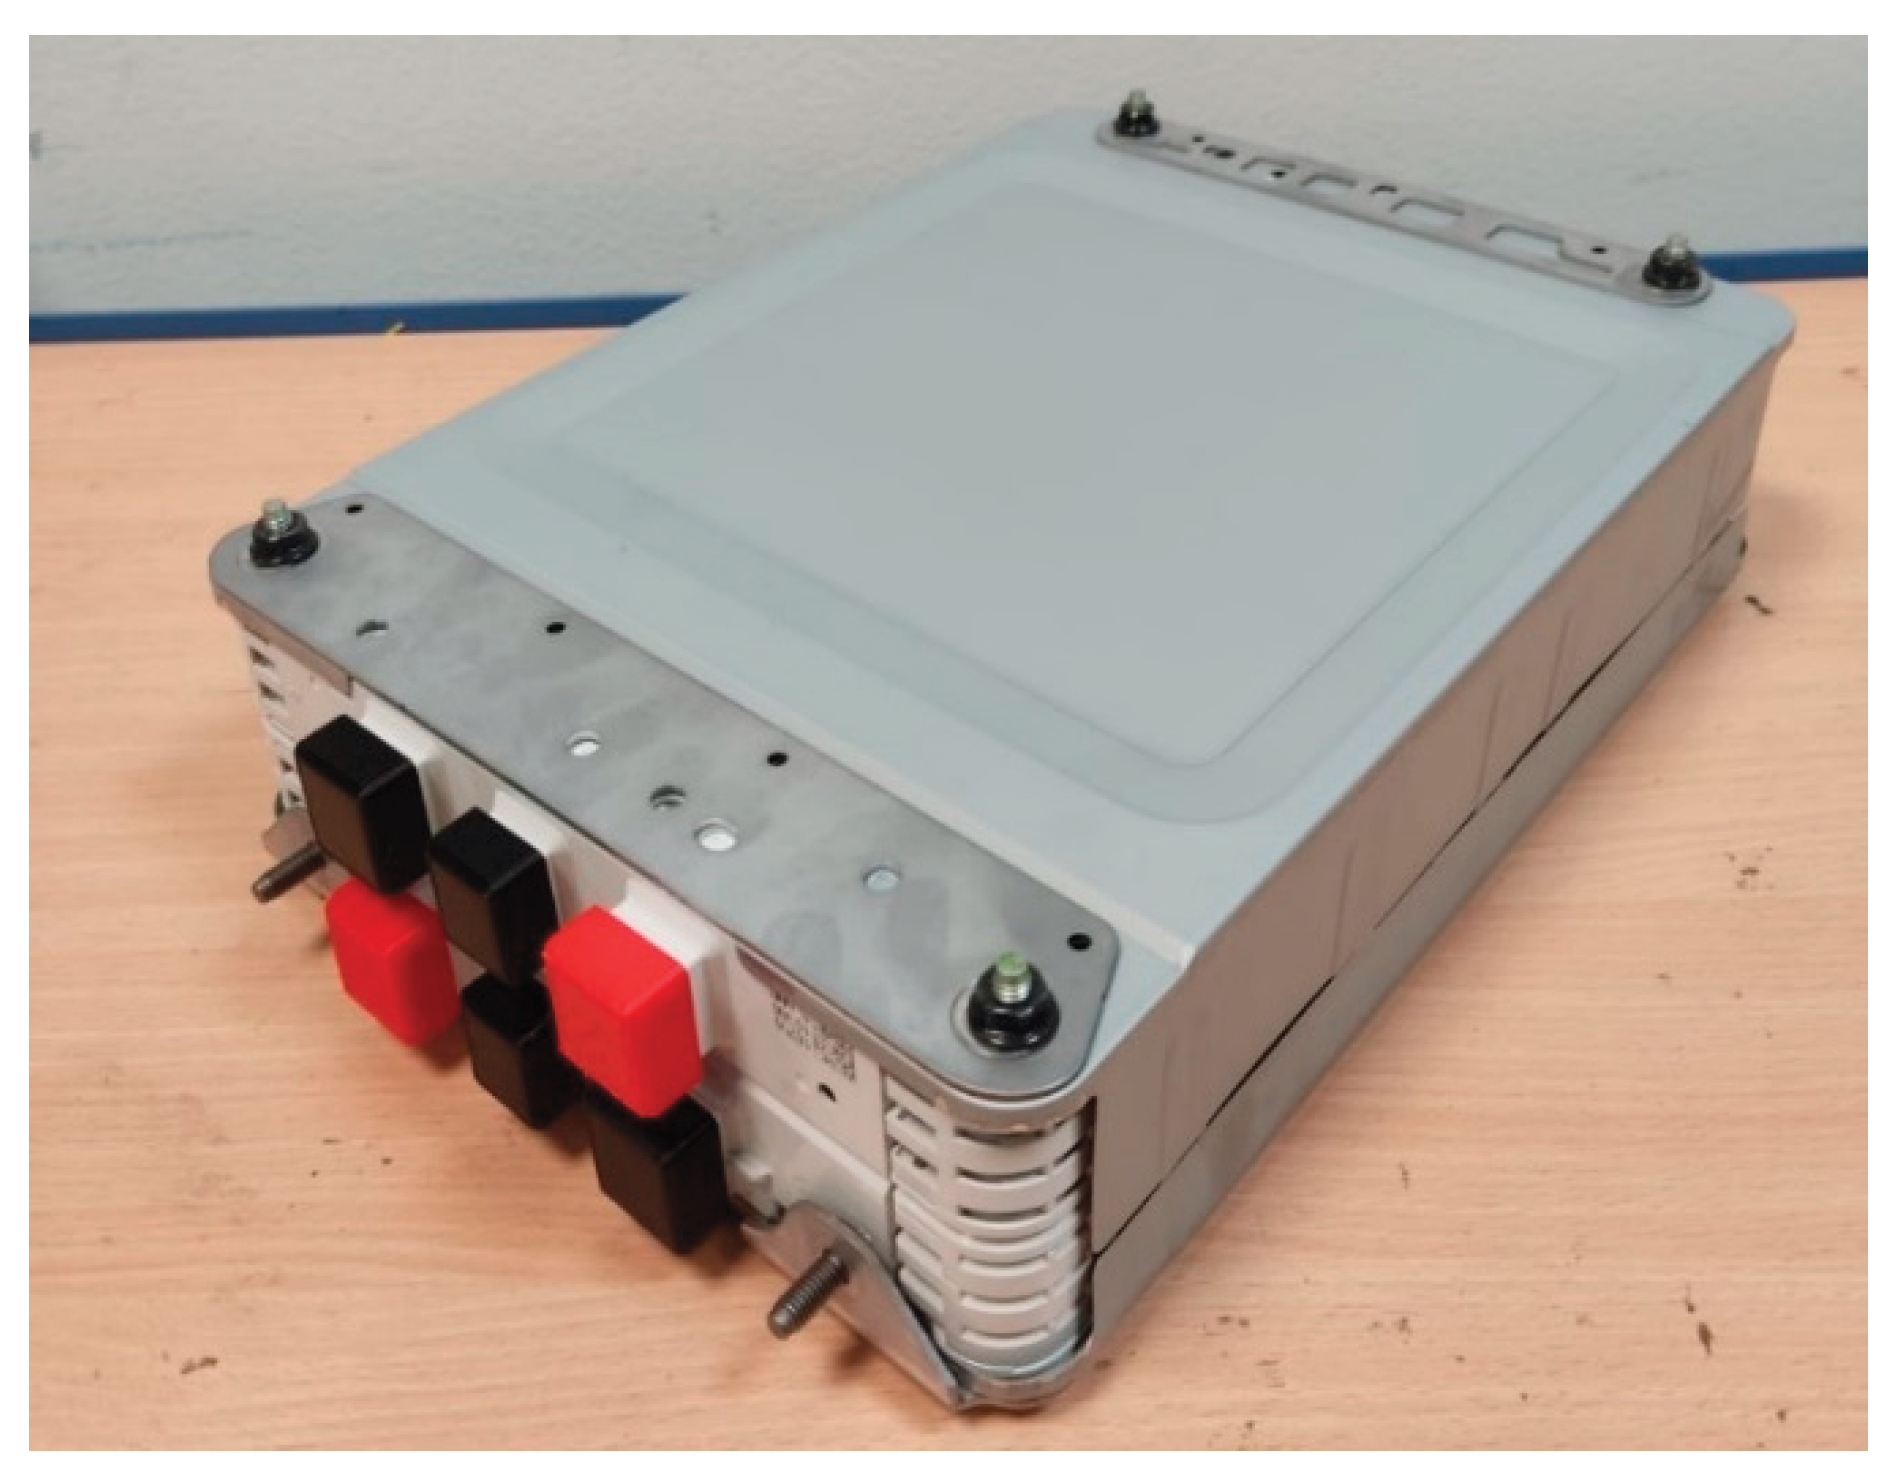
For the initial phase of this study, two different galvanostatic profiles were employed. Each profile was applied to an individual, brand-new lithium-ion cell to ensure consistent baseline conditions and to avoid cross-influence of cycling history. The selected cells were extracted from a NISSAN LEAF battery module (Figure 3).
The cells exhibit a pouch-type architecture. According to the available specifications, the cathode material is a lithium nickel manganese cobalt oxide (LiNixMnyCozO2, NMC), while the anode consists of graphite. No further proprietary or structural details were disclosed by NISSAN or the original cell manufacturer, AESC. The technical specifications of the cells are summarized as follows (Error! Reference source not found.):

Table 1.
Technical specifications of the studied cells.
| Parameter | 2s2p Module performance | 2s Cells performance |
| Nominal capacity | 83.4 Ah | 83.4 Ah |
| Nominal voltage | 7.5V | 3.75 V |
| Maximun charge voltage | 8.3 V | 4.15V |
| Typical Watt hour | 625 Wh | 312.5 Wh |
| End of discharge voltage | 5.0 V | 2.5 V |
| Maximum continuous charge current | 125 A | 125 A |
| Maximum continuous discharge current | 250 A | 250 A |
| Operation temperature range | -25_60ºC -40_60ºC |
|
| Storage temperature range | ||
| Mass | 8.4 kg | |
Figure 3.
Battery module (2 x 2s2p cells).
The first current profile implemented in this study employs the upper limit values specified for these cells. This accelerated cycling approach is intended to shorten the duration of the experimental phase, enabling a faster preliminary validation of the proposed technology.
Subsequent phases of the study will involve alternative current profiles. These include a nominal cycling profile, based on the standard charge and discharge values indicated in the cell specifications, and a use-case-specific profile derived from the Worldwide Harmonised Light Vehicles Test Procedure (WLTP) [13], which will be adapted to reflect the electrical and thermal characteristics of the individual cells. These additional ageing protocols are expected to more accurately represent realistic operating conditions, providing a deeper understanding of the cell behavior under typical application scenarios.
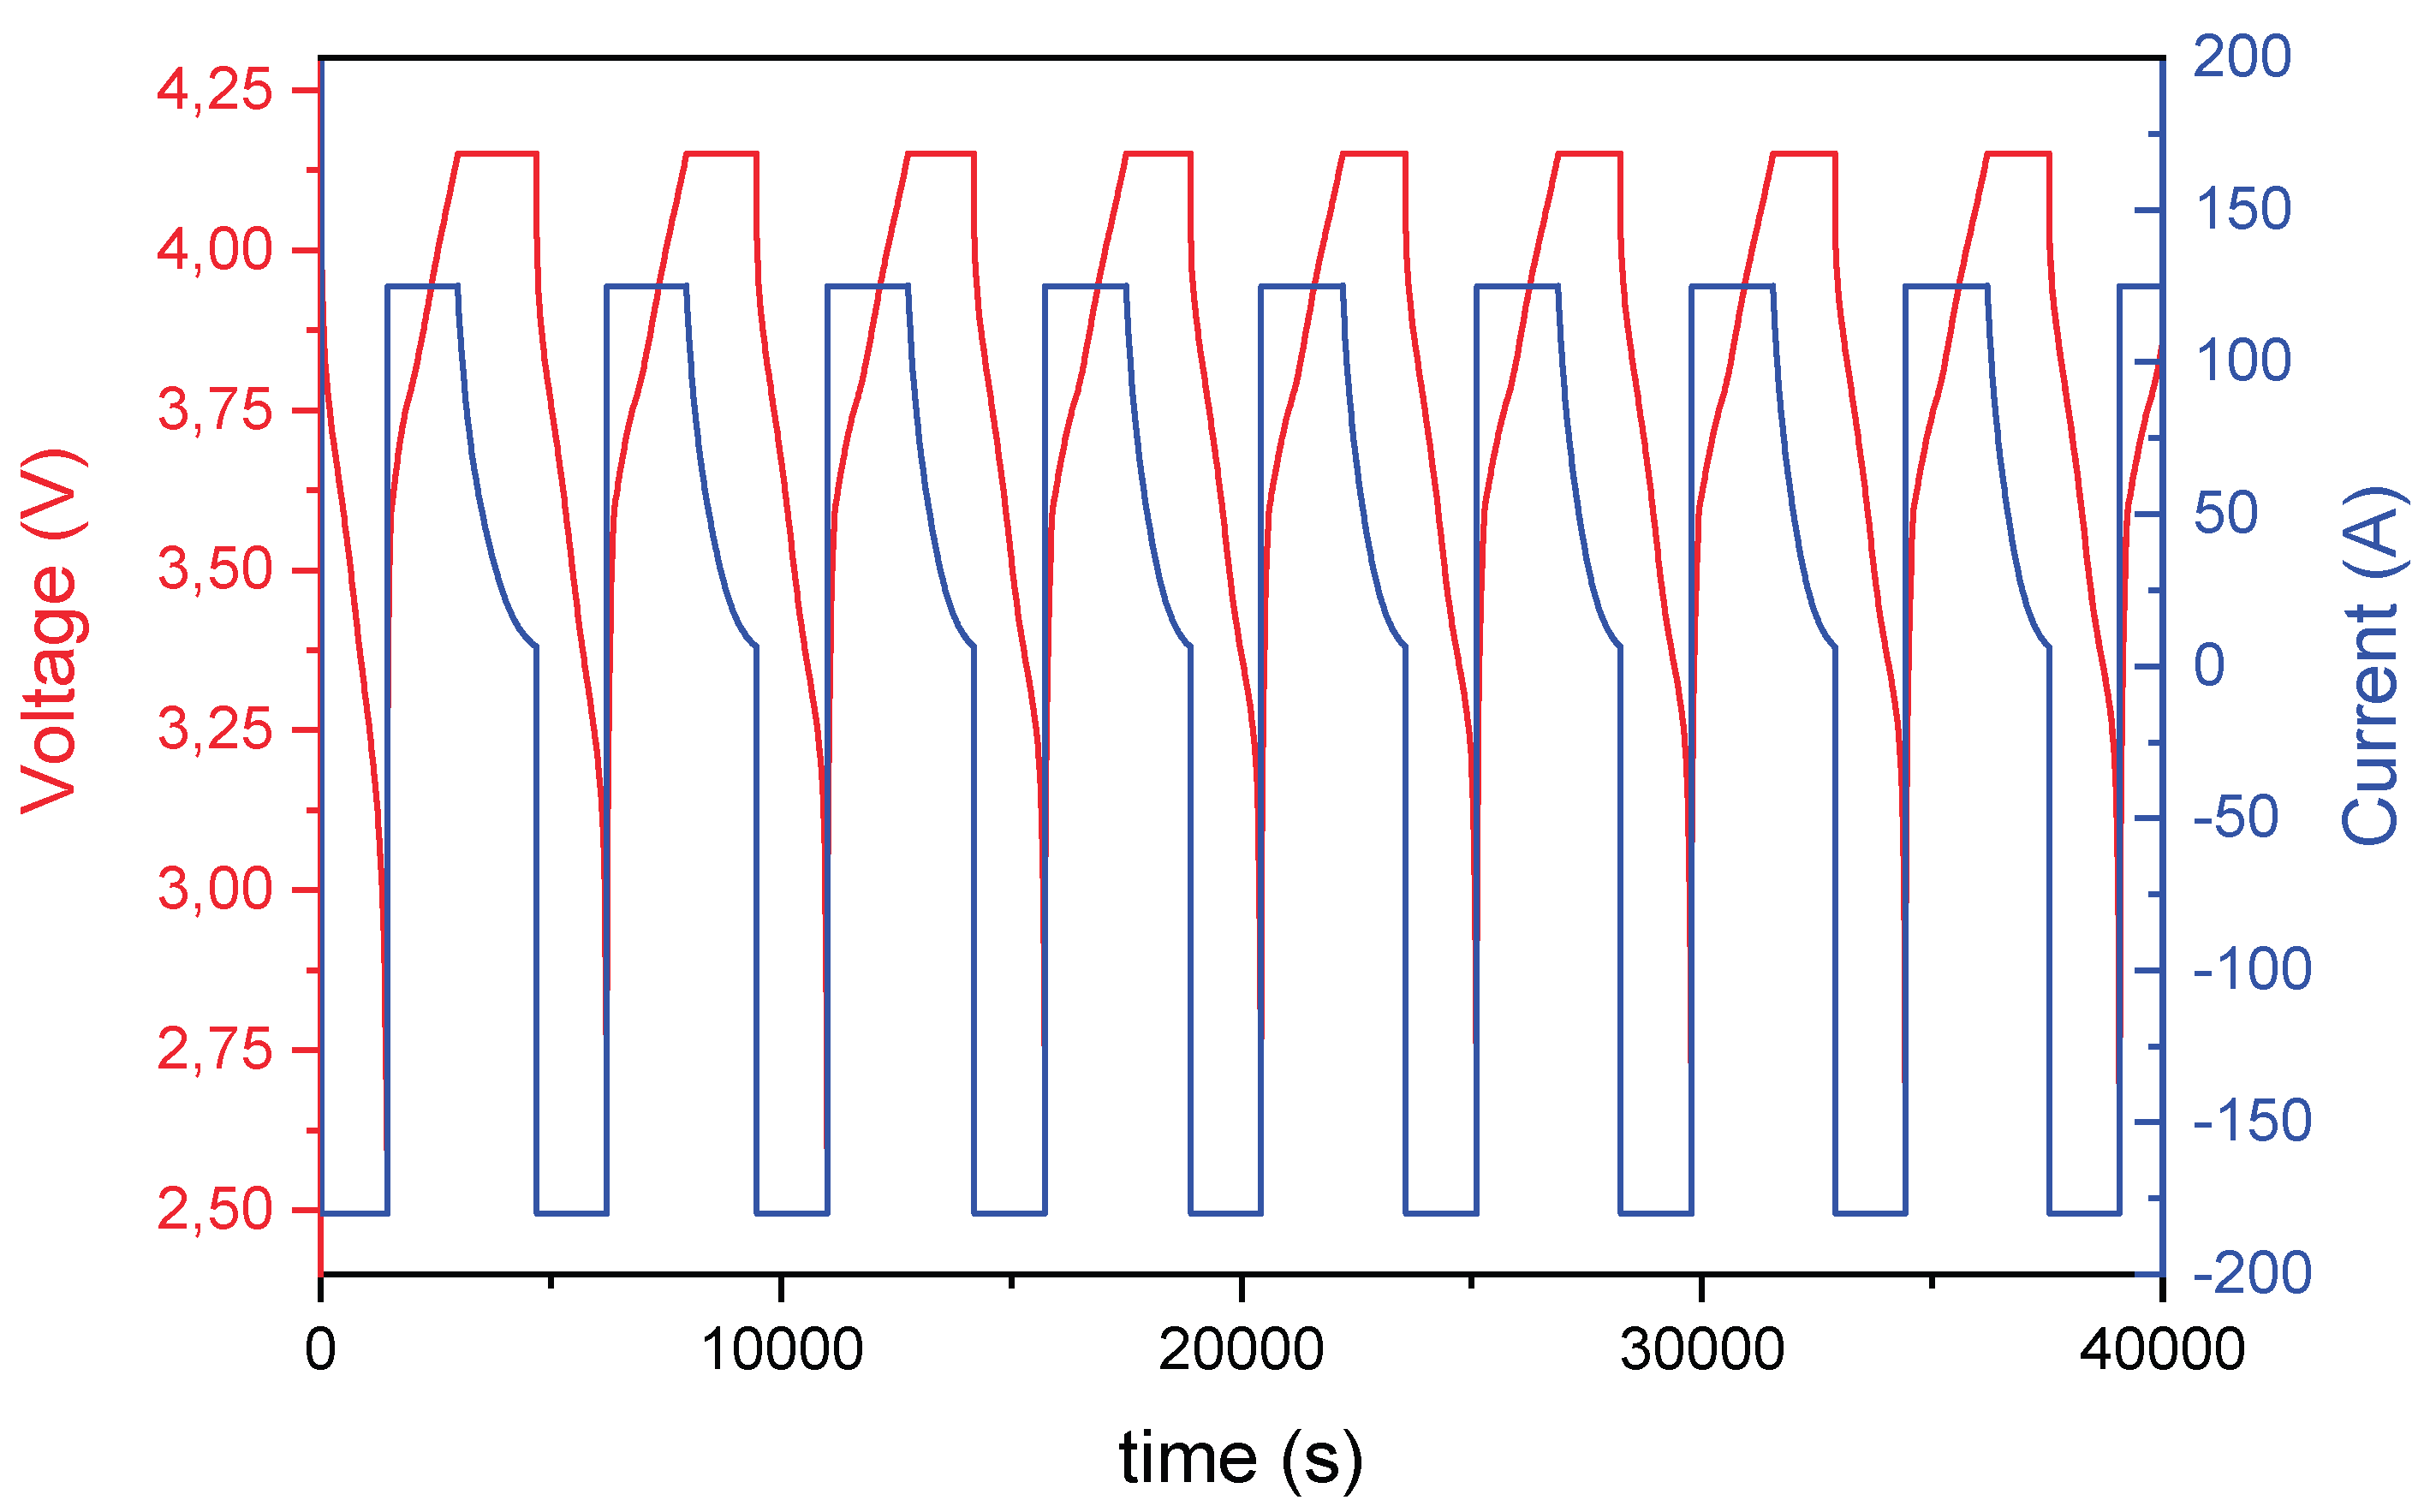
The cycling protocol and periodic EIS measurements were conducted according to the following procedure, also illustrated in Figure 4:
1. Charging: Cells were charged using a constant current (CC) of 1.5 C (125 A) until reaching the upper voltage limit of 4.15 V. Upon reaching this voltage, the charging protocol switched to constant voltage (CV) mode, maintaining 4.15 V until the current decayed to 5% of the initial charging current.
2. Discharging: Cells were discharged at constant current. For the standard accelerated cycling profile, the discharge current was set at 2.16 C (−180 A), which corresponds to the maximum output of the test equipment. For Profile B (nominal or moderate cycling), the discharge current was limited to 0.2 C (−16.68 A). Discharge was cut off upon reaching the lower voltage limit of 2.5 V.
All cycling was carried out within a voltage range of 4.15 V (upper limit) and 2.5 V (lower limit) and impedance spectra were acquired every 50 full charge/discharge cycles to monitor cell degradation over time. EIS measurements were recorded using a frequency range from 10 kHz to 10 mHz with an excitation amplitude of 4 A at multiple SoC levels (0%, 20%, 40%, 60%, 80%, and 100%). To achieve each SoC level, the cells were charged or discharged using a low current of 4 A (0.05 C), followed by a 30-minute rest period to ensure voltage stabilization prior to each EIS measurement.
Figure 4.
Charging-discharging cycle applied on 2s cells.
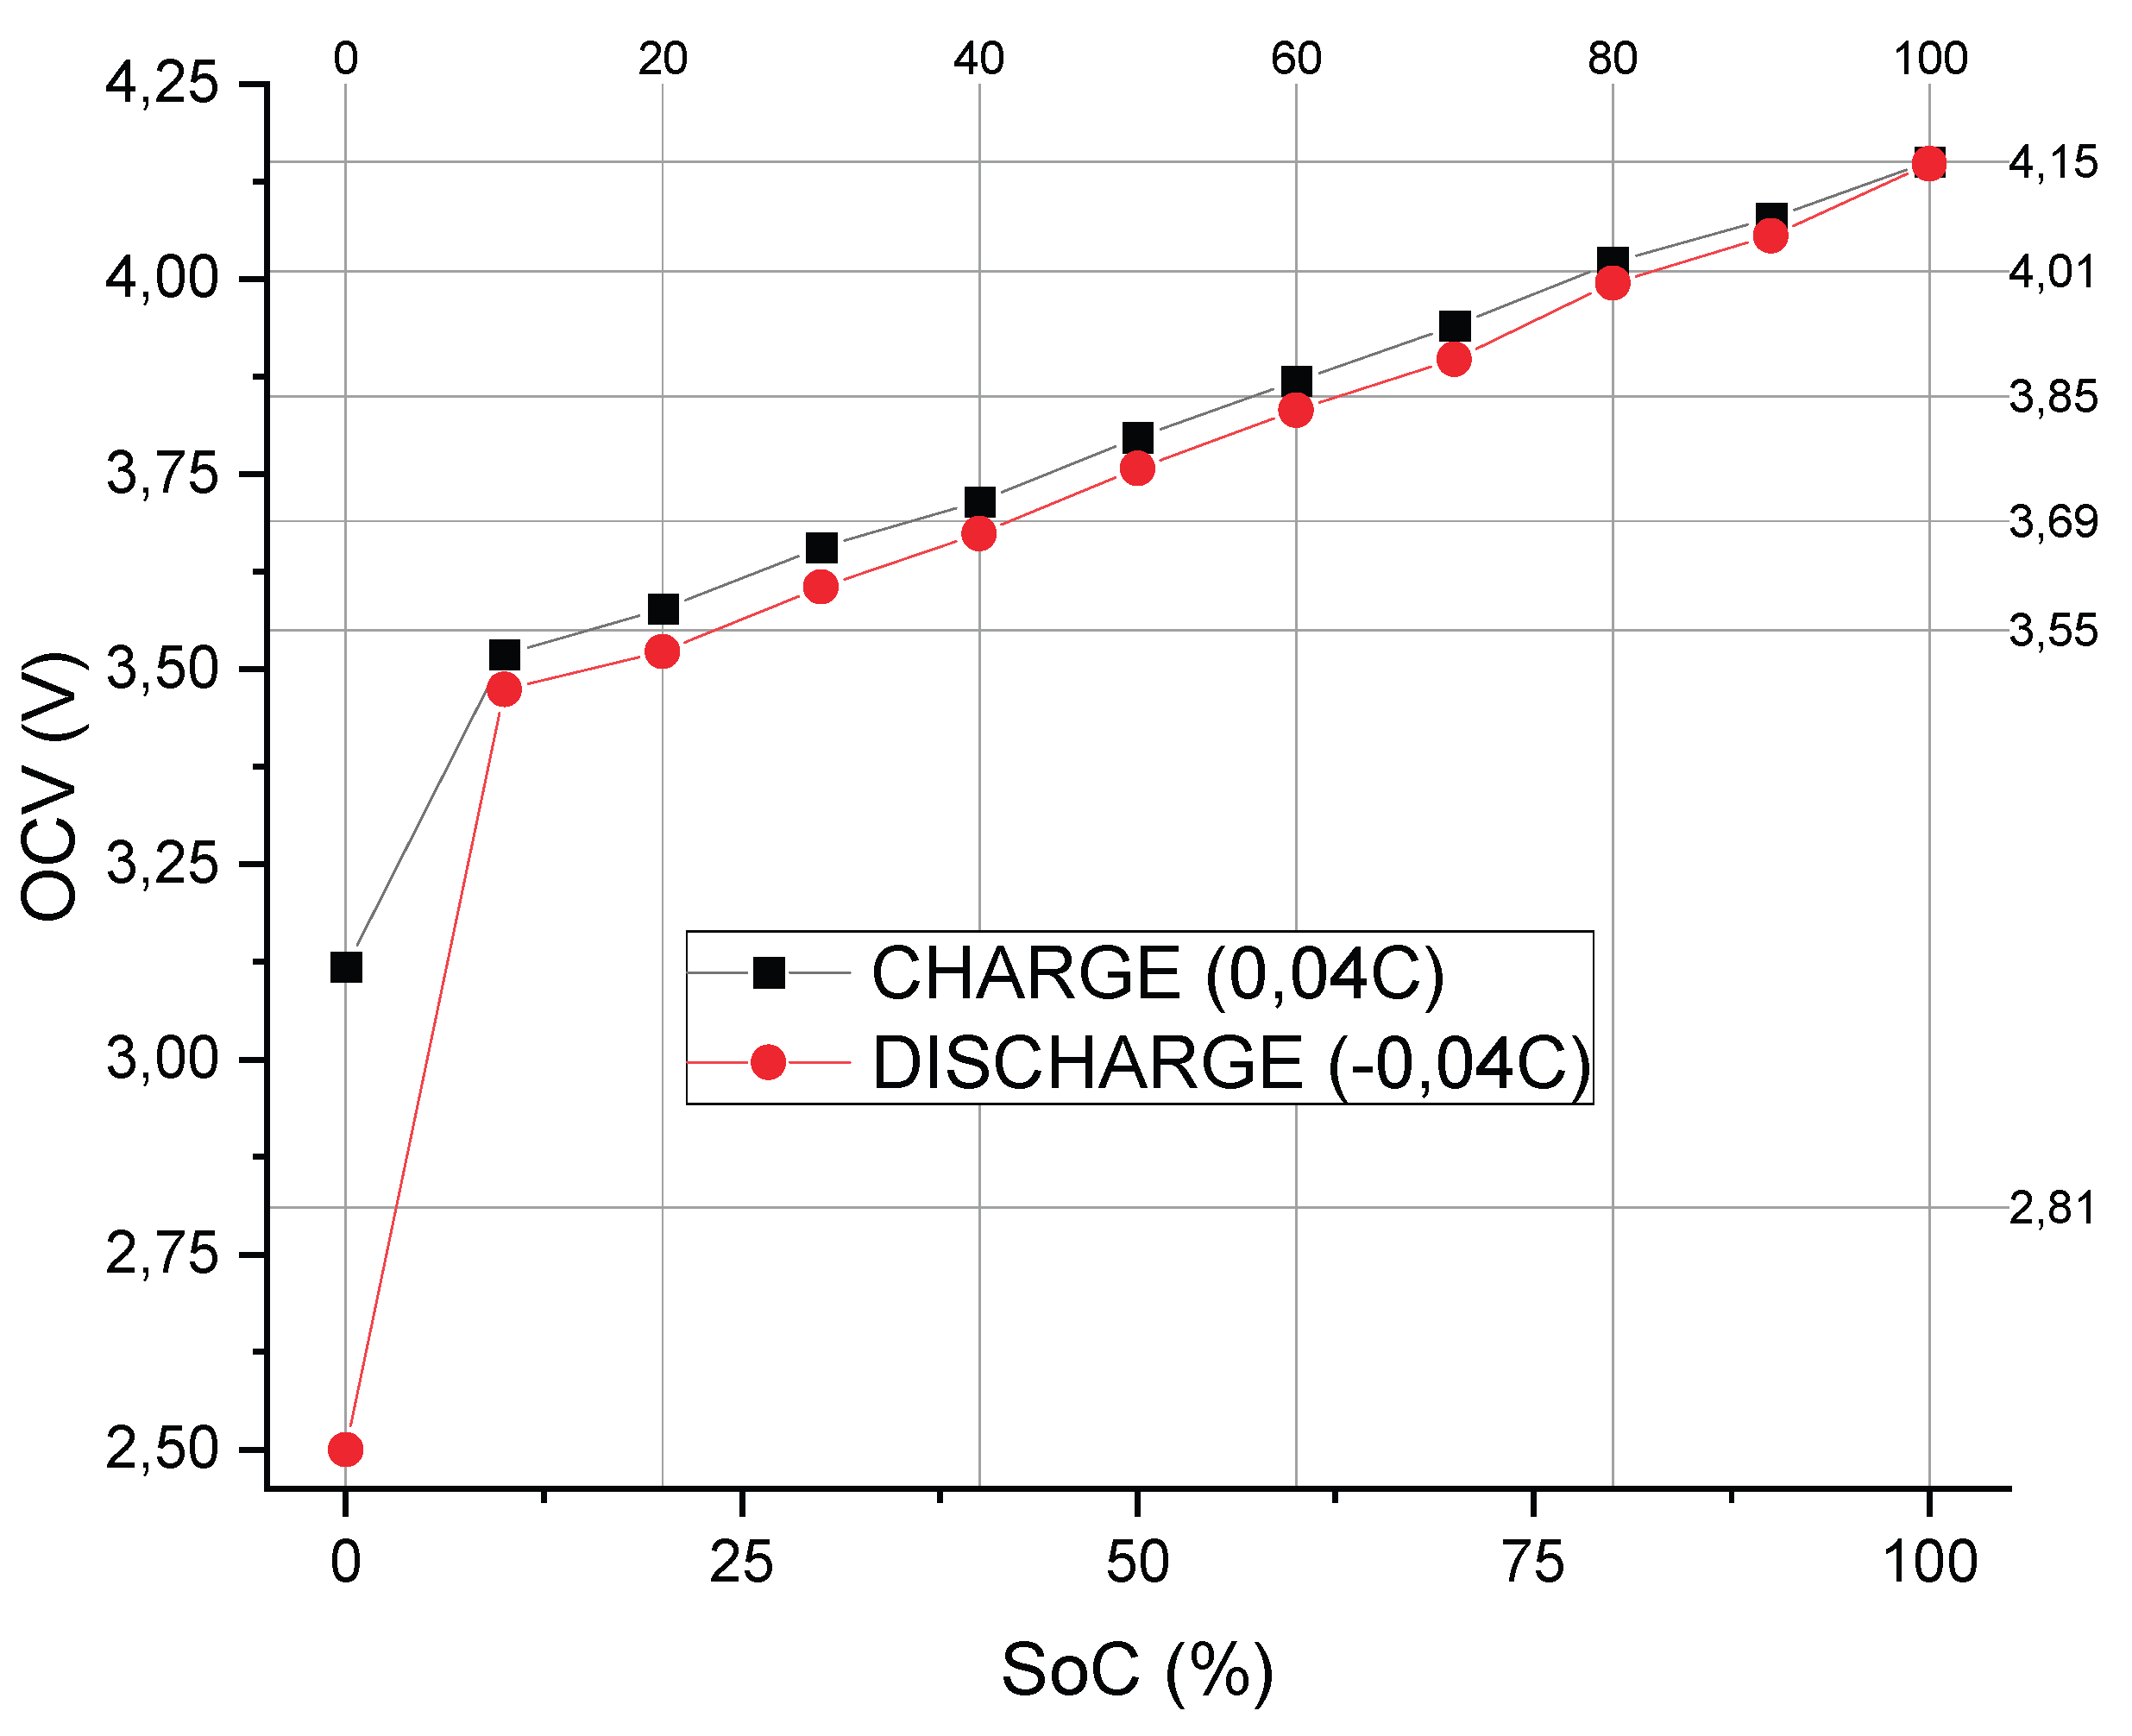
SoC intervals were established based on a preliminary full charge–discharge cycle performed on a paired set of cells (2s). This cycle was carried out at a very low current to minimize polarization effects, allowing for a precise correlation between the energy stored or delivered by the cells and their corresponding open-circuit voltage (OCV) values, as illustrated in Figure 5.
Using this approach, six distinct SoC segments were defined according to the observed OCV ranges. Figure 6 presents the EIS spectra obtained at these six SoC levels during the first cycle, demonstrating the variation in impedance characteristics across the defined charge states.
Figure 5.
EIS spectrums obtained at multiple SoC%.
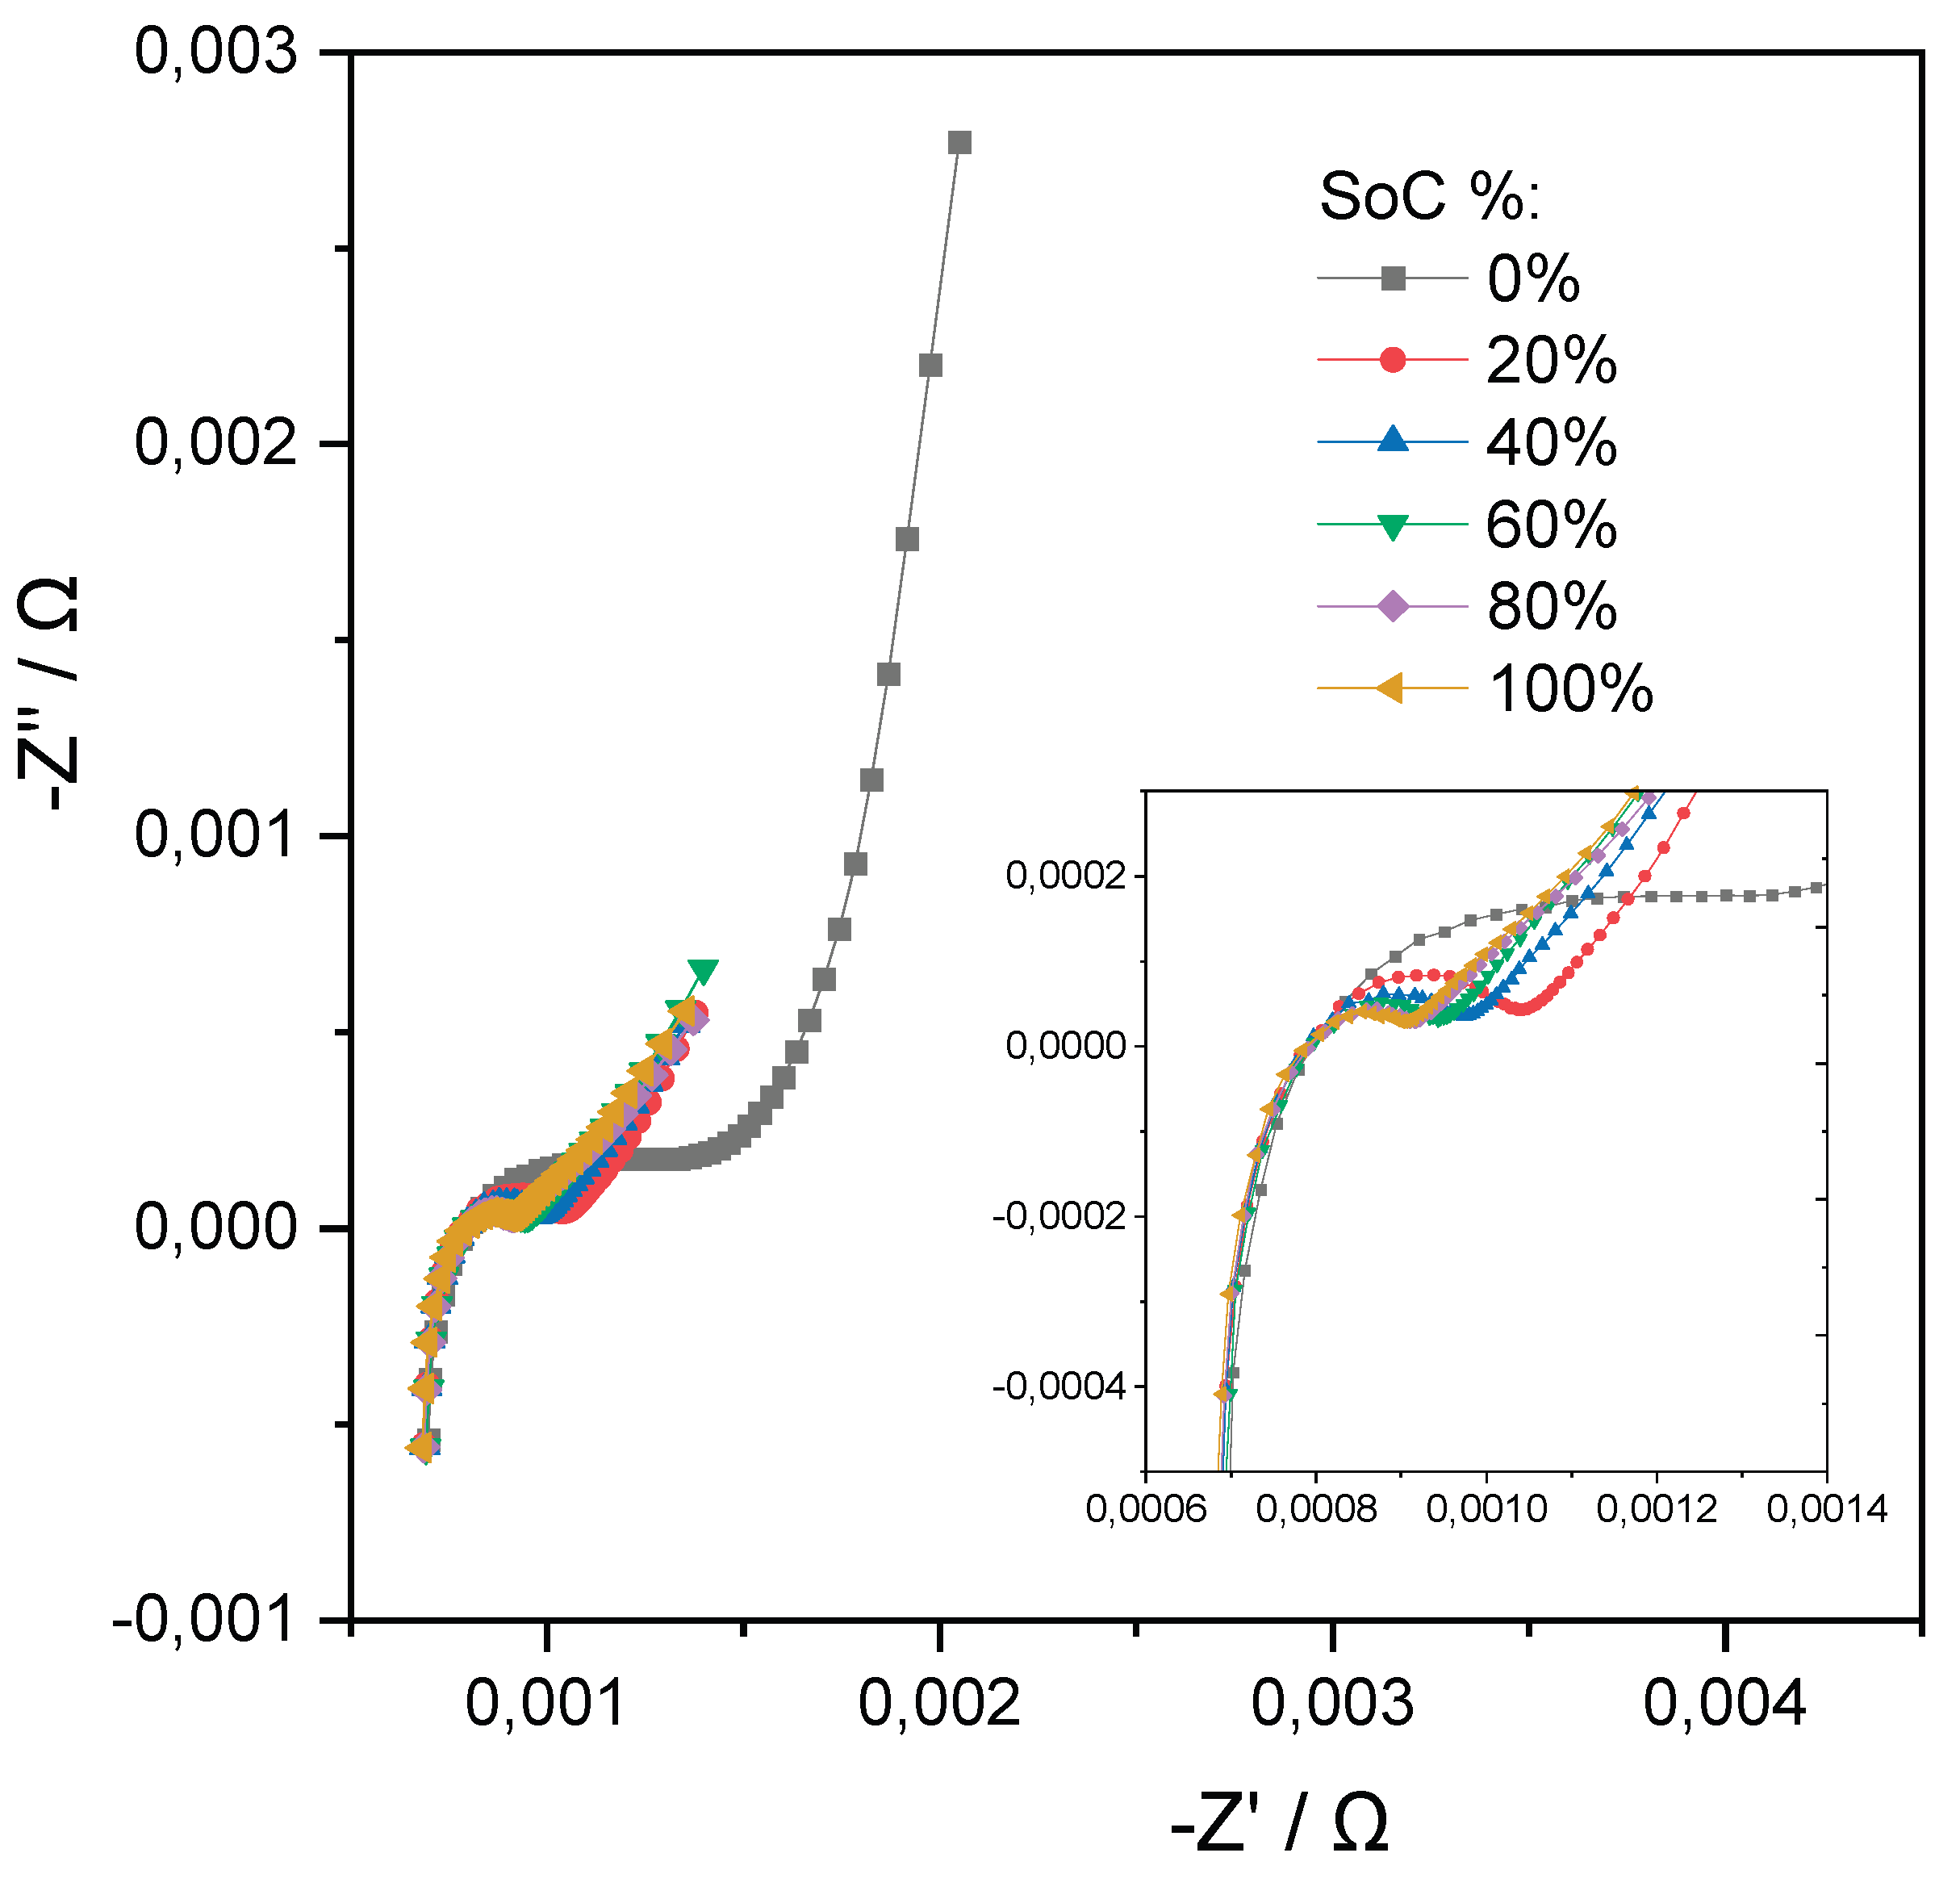
Figure 6.
Correlative model between Open Circuit Potential and SoC.
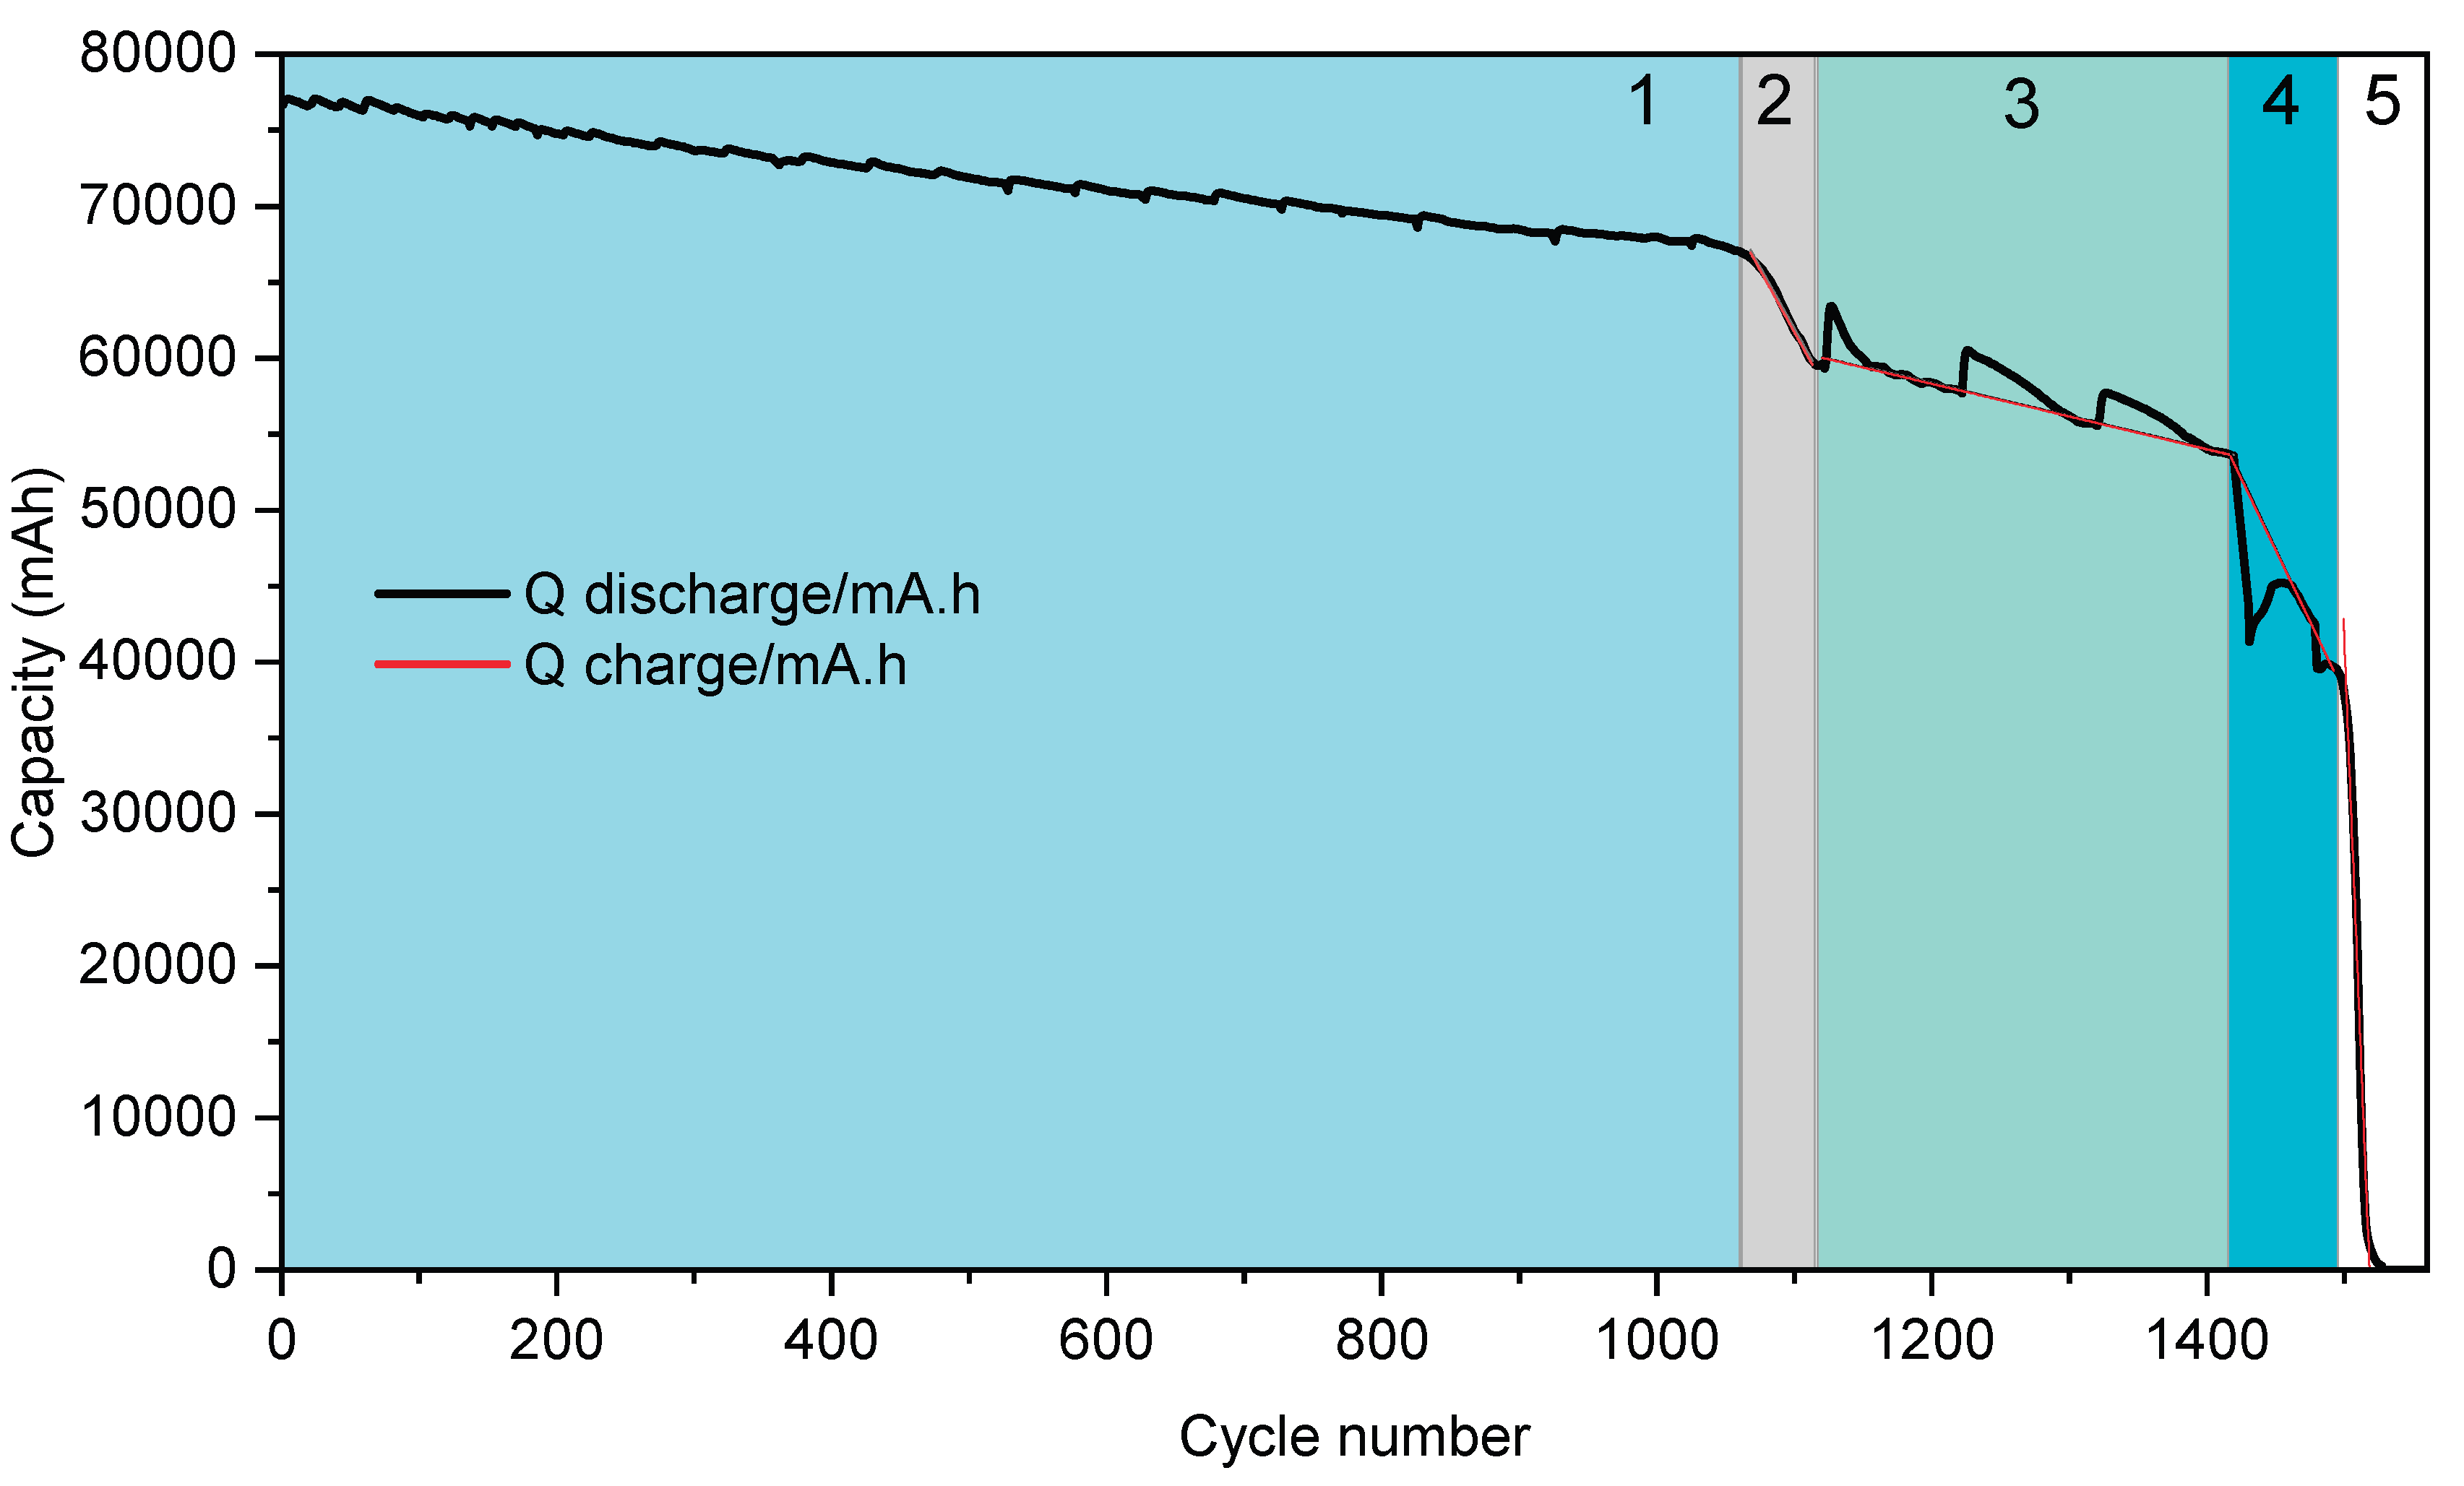
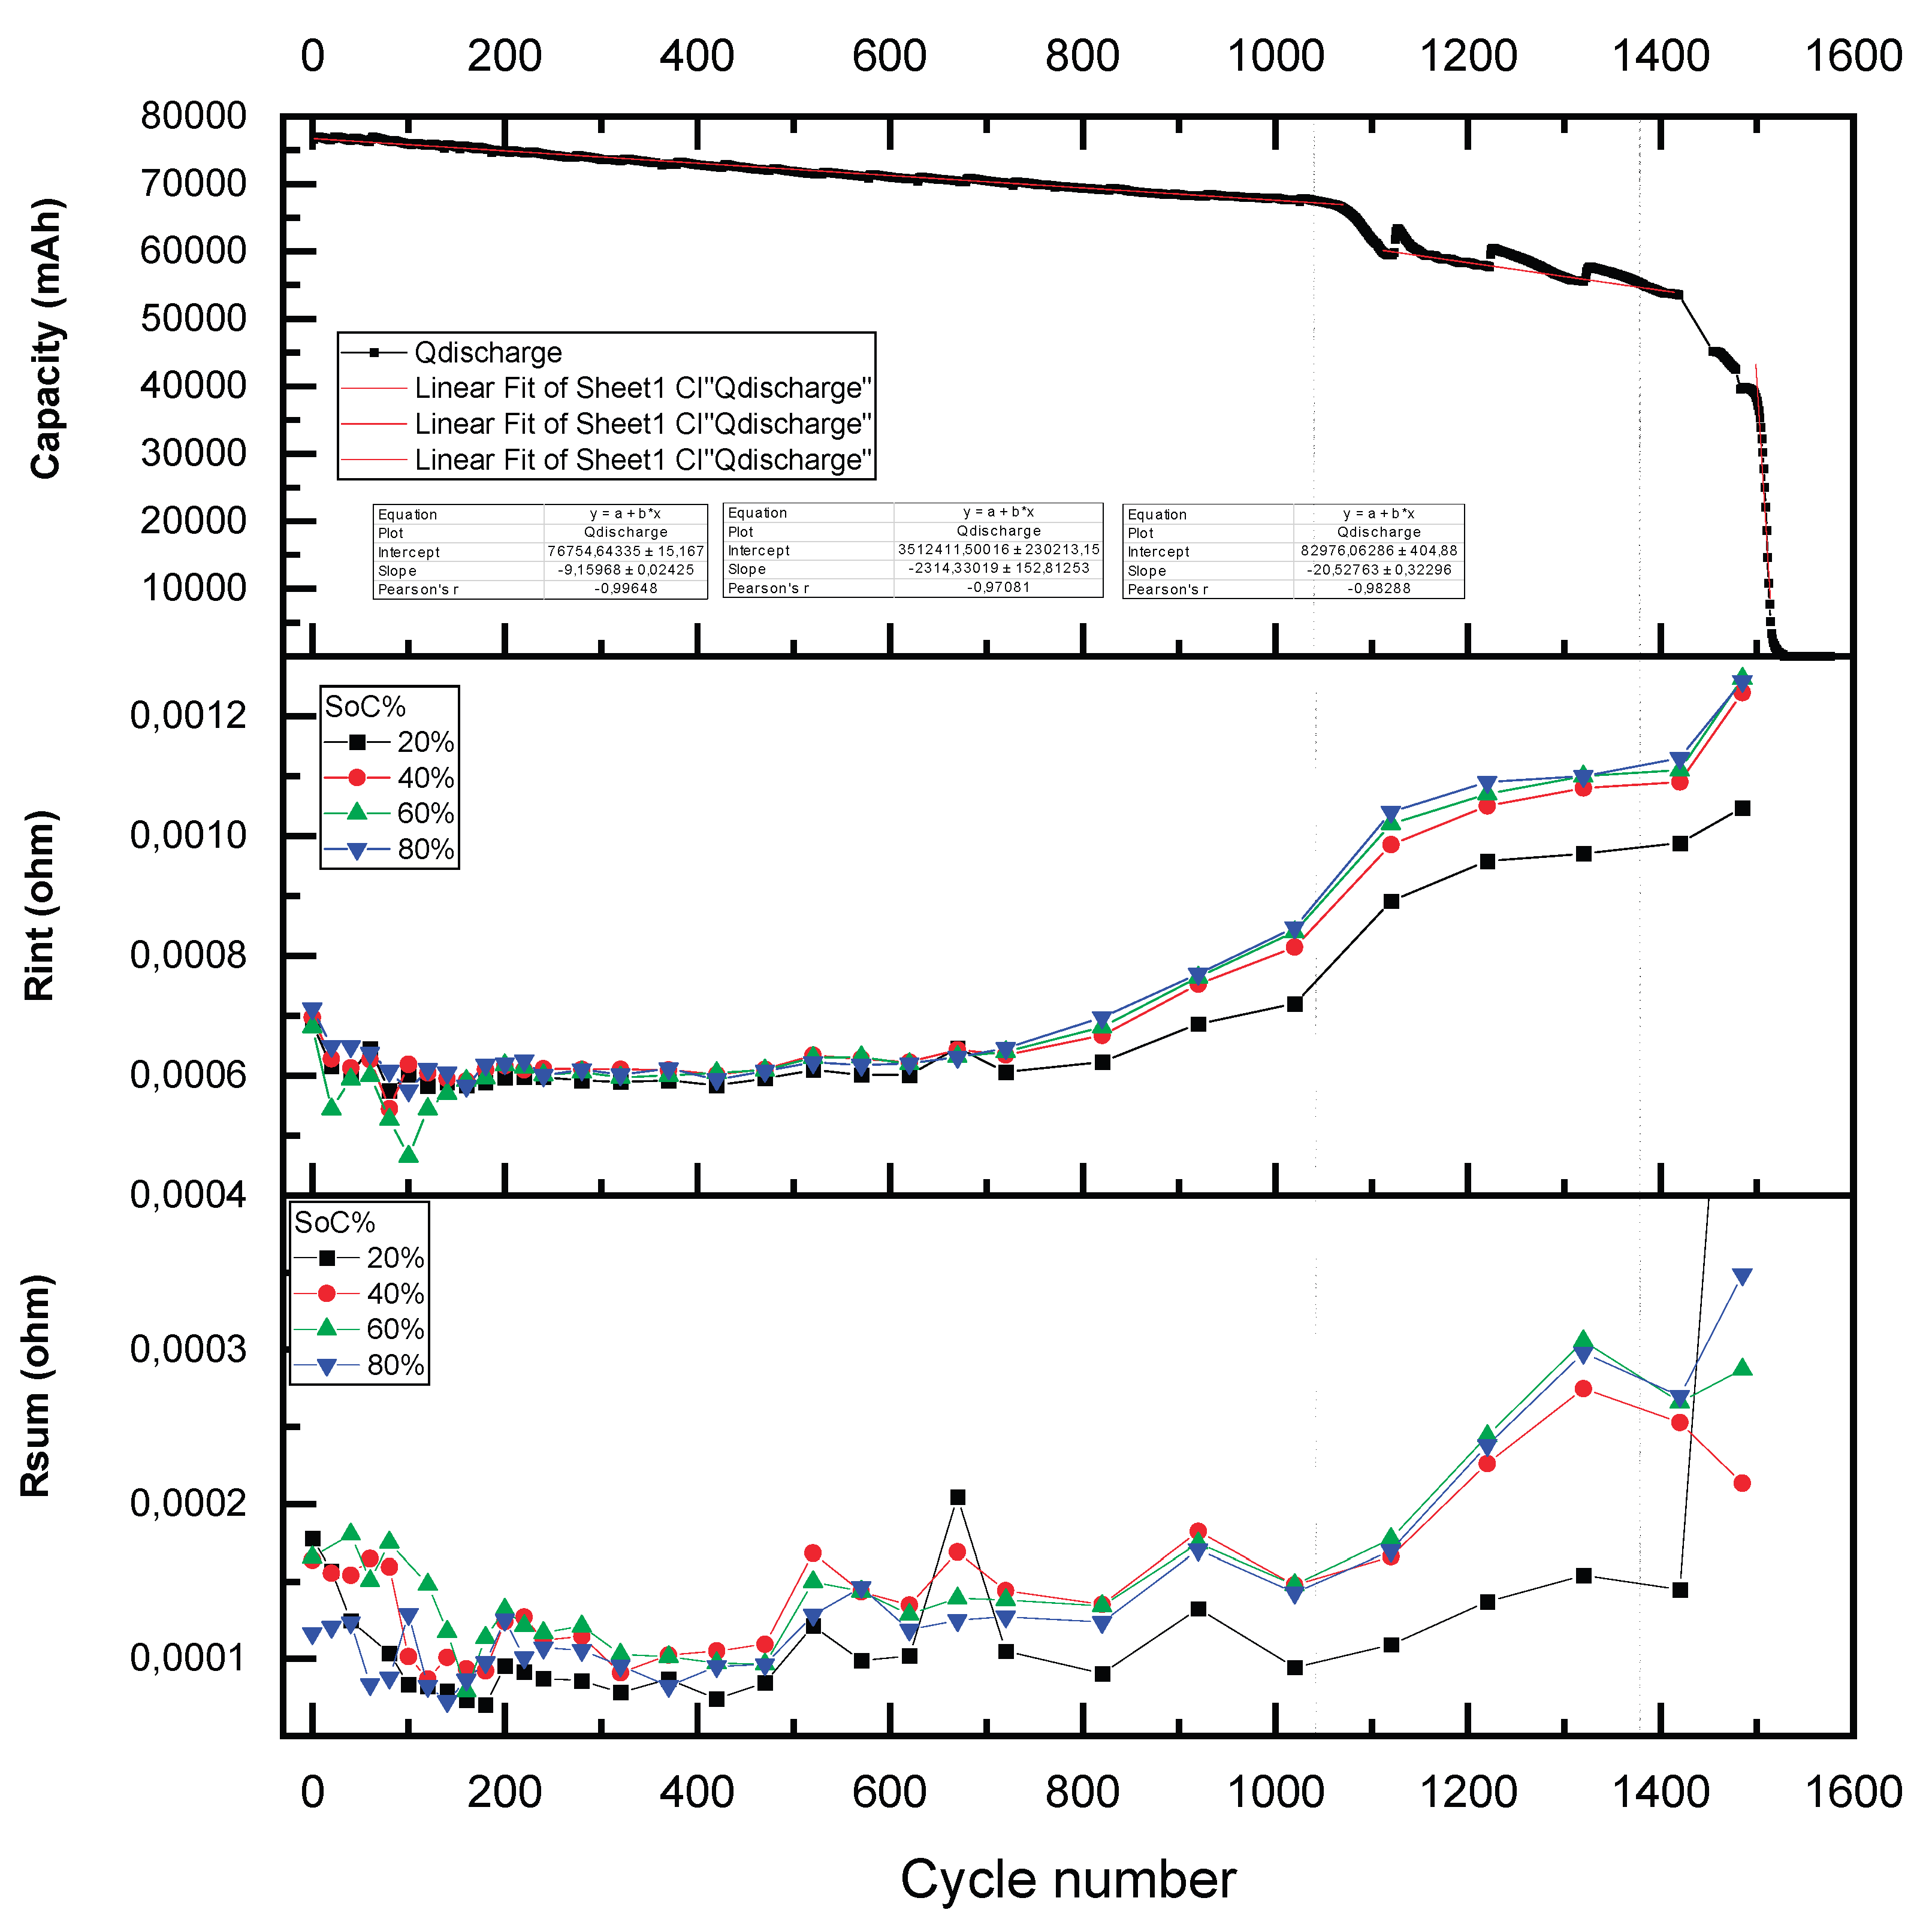
The degradation behavior of a lithium-ion cell under continuous charge-discharge cycling was systematically investigated, revealing five distinct stages of capacity fade as shown in Figure 7. These stages were identified based on changes in the rate of capacity loss per cycle, quantified through linear and segmented regression analyses of experimental data. The cell was cycled using a discharge current of –180 A (2.4C, ~25 minutes per cycle) and a charge current of 125 A (1.5C, ~40 minutes per cycle). Over a total of 1.570 cycles, the capacity fade exhibited an approximately linear decline until complete loss of energy retention capability.
During the initial stage of cycling (Stage 1, Figure 7), extending from cycle 0 to approximately cycle 1.050, the cell exhibited a gradual and homogeneous decline in capacity. The degradation followed a linear trend with a slope of –9.15 mAh per cycle, indicative of slow and stable capacity loss over time. Minor capacity recoveries were occasionally observed at the start of successive charge-discharge sequences, producing slight fluctuations in the capacity curve. Despite these small deviations, the overall trend remained consistent and uniform, suggesting a relatively controlled degradation mechanism during this phase, primarily attributed to gradual degradation mechanisms such as the progressive loss of active material, initial formation of the solid electrolyte interphase (SEI), and mechanical/electrochemical stress during cycling. These processes occur evenly across the electrode surface under stable operating conditions, leading to a consistent decline in performance over time.
Subsequently, a marked transition into accelerated degradation was observed between cycles 1.050 and 1.110 (Stage 2, Figure 7), where the rate of capacity fade increased sharply to –152 mAh per cycle. This accelerated capacity drop corresponds to the cumulative effects of irreversible degradation mechanisms. Contributing factors likely include the growth of the SEI, depletion of cyclable lithium, and structural breakdown of both cathode and anode materials [14]. During this brief interval of 60 cycles, approximately 9.4% of the cell’s initial capacity was lost, signifying the beginning of pronounced electrochemical and structural instability within the cell.
In the third stage of degradation (Stage 3, Figure 7) spanning cycles 1.110 to 1.420, the rate of capacity loss stabilized at approximately –21 mAh per cycle. Despite this relative stabilization, the capacity trajectory exhibited irregular behavior, with periodic recoveries ranging from 70 to 130 mAh occurring at the start of each ~100-cycle sequence. These transient recoveries are attributed to temporary charge redistribution phenomena, a behavior similarly reported in other battery aging studies [15]. Nonetheless, the underlying degradation trend remained consistently negative, reflecting ongoing irreversible changes in cell chemistry and structure.
The fourth stage (Stage 4, Figure 7), occurring between cycles 1.420 and 1.520, was defined by a substantial increase in the degradation rate to –190 mAh per cycle. Following a brief stabilization period lasting approximately 25 cycles, the slope suffers two more exponential slope increasements, between stages 3 to 4 and 4 to 5. This rapid and abrupt capacity fade is known as knee point. It marks the onset of accelerated degradation due to a combination of lithium inventory loss, active material degradation, and slowed reaction kinetics, as described by [16].
Finally, in the fifth and terminal stage (Stage 5,Figure 7), occurring from cycle 1.520 to 1.570, the cell’s capacity dropped sharply from 39,500 mAh to 0 mAh in fewer than 50 cycles, corresponding to an average capacity loss rate of –2,260 mAh per cycle. While this fall was massive, the transition occurred progressively within the stage. This terminal phase was marked by the onset of instantaneous charge and discharge behavior, indicative of severely compromised internal resistance and electrochemical activity. Additionally, visible cell swelling was observed during this phase, posing significant safety concerns associated with thermal runaway or mechanical rupture. The primary factors contributing to the capacity fade were associated with intrinsic electrochemical degradation processes. Notably, the formation of gaseous by-products due to electrolyte decomposition and side reactions involving transition metal dissolution contributed to internal pressure buildup, leading to observable cell swelling [14]. Concurrently, the continuous growth of the SEI layer and lithium plating on the anode surface—particularly under high charge rates—further accelerated the loss of active lithium and decline in electrode performance. These degradation pathways were intensified by elevated internal temperatures caused by Joule heating during high-current operation as was observed in [16].
Importantly, external stressors such as excessive ambient temperatures, overcharging, or deep discharging were excluded under the controlled experimental conditions, thereby confirming that the observed degradation originated from the intrinsic cycling parameters and internal cell dynamics [17].
The results of this analysis highlight that the rate of capacity loss per cycle is inherently non homegeneus. Distinct phases of accelerated degradation mark the onset of critical internal failure mechanisms, indicating that the SoH of a cell is not directly proportional to its remaining useful life. In particular, once the SoH falls below 50%, the cell retains fewer than 100 additional cycles, severely limiting its applicability.
Figure 7.
Full aging test on 2s cells, with each degradation phase (characterized by a different slope) highlighted in a different color.
Figure 7.
Full aging test on 2s cells, with each degradation phase (characterized by a different slope) highlighted in a different color.
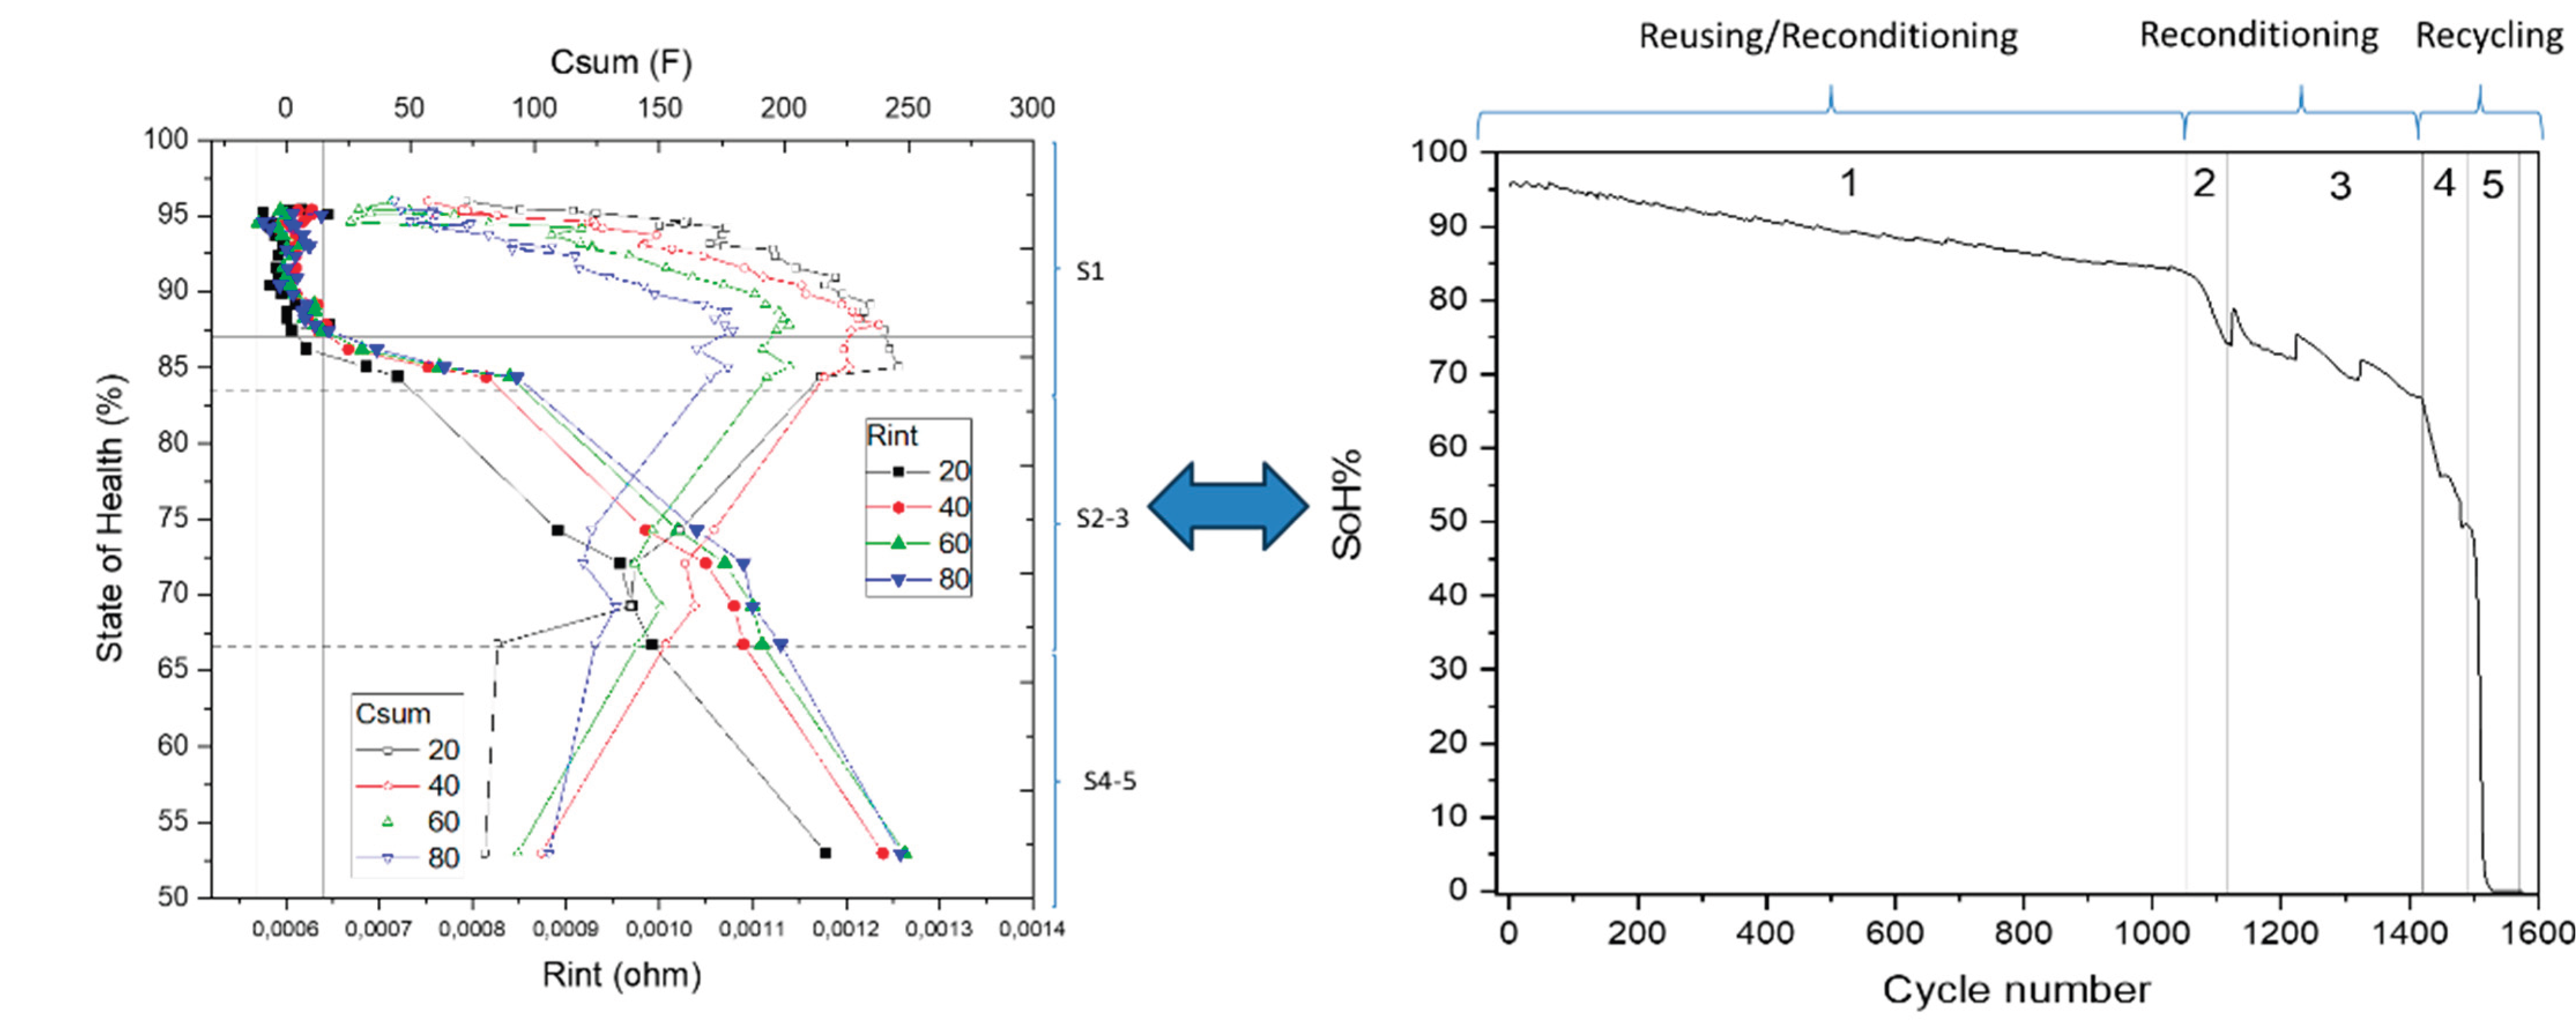
From a second-life utilization perspective, cell reuse is viable primarily within the early stage of degradation (SoH between 100% and 83%), where cells can continue operating in electric vehicle (EV) applications or be repurposed for stationary energy storage. In the intermediate range (SoH between 83% and 67%), limited reuse may still be possible in low-demand stationary systems. However, cells exhibiting a SoH below 67% are considered unsuitable for further deployment due to compromised performance, safety risks, and rapid degradation.
3.2. Data Analysis by Electrical Equivalent Circuit Fitting
Once EIS spectra were obtained across the full range of SoC (SoC: 0%, 20%, 40%, 60%, 80%, 100%) and SoH (SoH: 96% to 0%), the next step involved the development and validation of an Equivalent Electrical Circuit (EEC) model. This model aims to accurately represent the cell’s impedance behavior within the frequency range covered in the study and for each analyzed SoC condition.
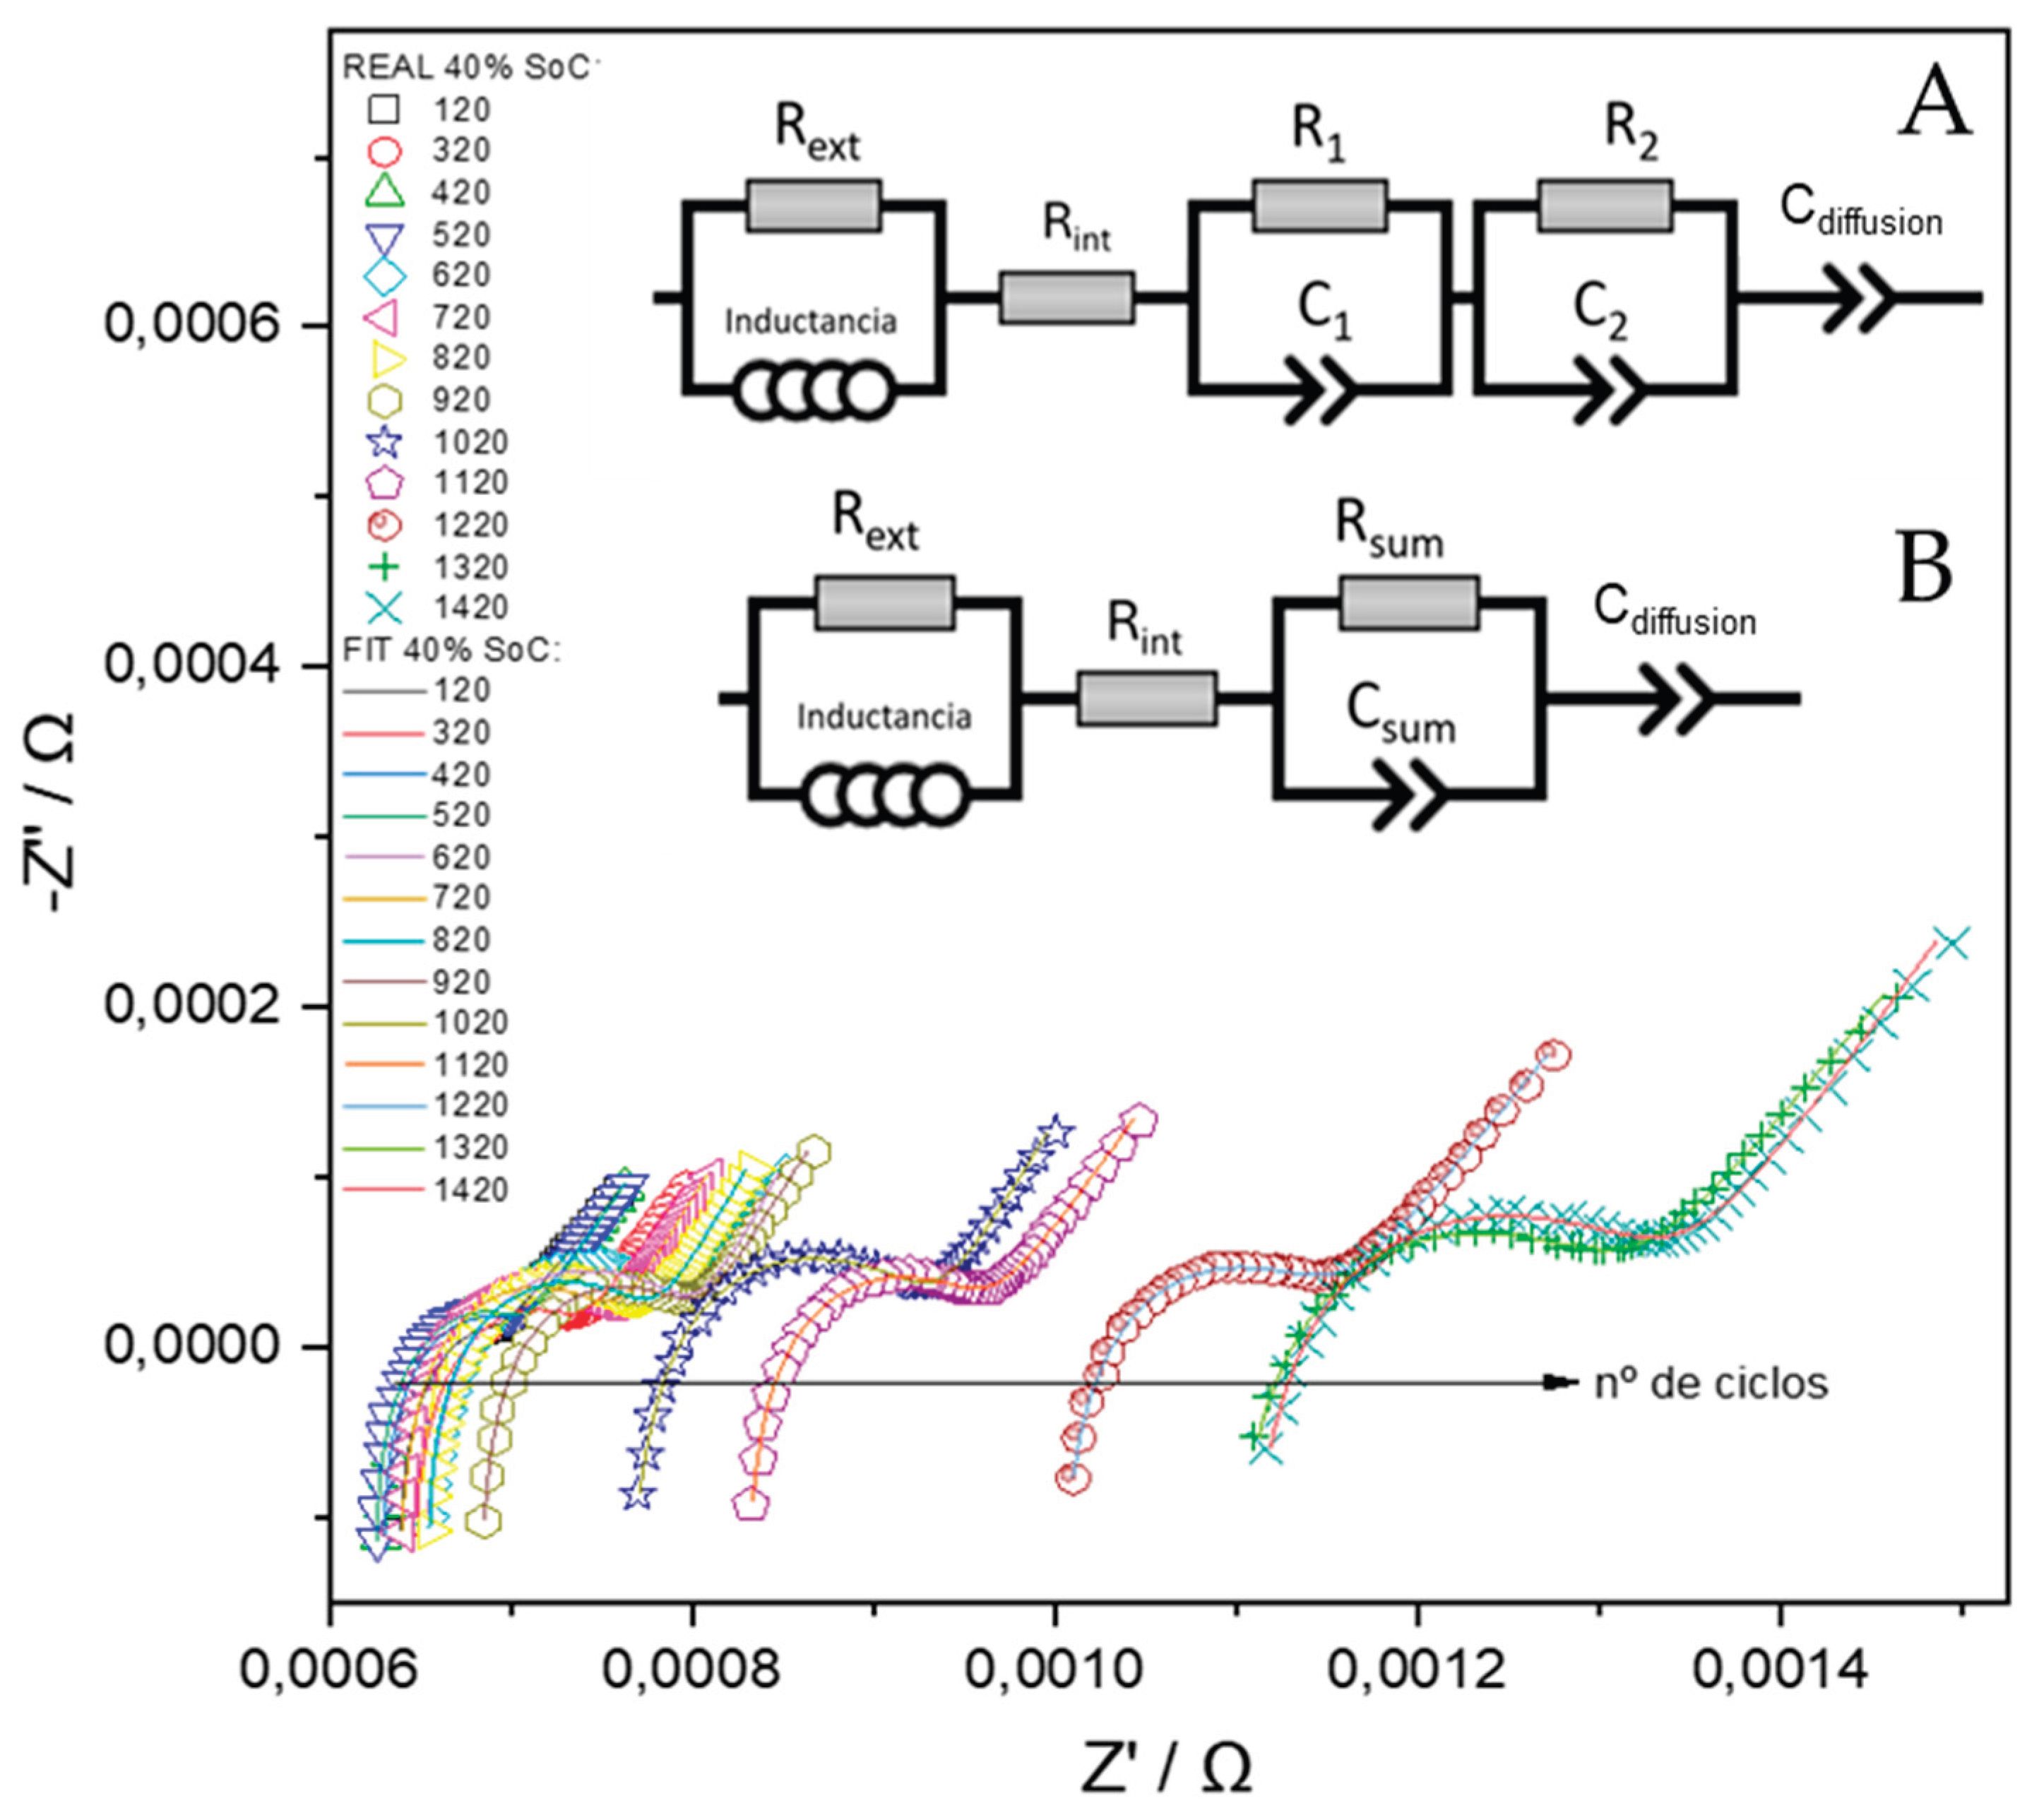
To this end, the RELAXIS® software (version 3.0.18.15, rhd-instruments 2013-2024, Germany) was used to process the EIS data, applying the Simplex optimization method to fit the experimental spectra to the proposed model. The development of the EEC was informed by previous studies that employed similar approaches for modeling lithium-ion cells [7,11,18], (Figure 8 (top)). The circuit adopted is structured into four distinct sections, each representing a different frequency domain within the impedance spectrum:
- Ultra-high frequency region (10 kHz-100 Hz): the impedance response is primarily influenced by the inductive and resistive characteristics of the external components of the system. To account for these effects, the equivalent circuit includes an inductance element (L) and a parallel resistance (Rext), which represent the parasitic inductance of the current collectors and connecting cables, as well as the ohmic contributions from the external electrical circuit. Although these elements do not provide information directly related to the internal electrochemical state of the cell and are not utilized for diagnostic or monitoring purposes, their inclusion is essential for accurate fitting of the impedance spectra. Proper modeling of this region ensures that the contributions from the mid- and low-frequency components—where electrochemical processes dominate—are not distorted during parameter extraction and analysis.
- High-frequency region (100-50 Hz): Impedance in this frequency range is dominated by the cell’s ohmic resistance (Rint), which models the instantaneous voltage drop due to the resistance of the current collectors, contact resistances between the binder and active material particles, and the ionic conductivity of the electrolyte. This region is typically observed as the high-frequency intercept of the Nyquist plot with the real axis and provides a baseline measure of the cell’s internal resistance under operational conditions.
- Medium-Frequency Region (50 – 1 Hz): This region reflects the combined effects of two overlapping processes: i) The resistance of the SEI in parallel with a constant phase element (CPE), representing the capacitive behavior of the SEI layer and the lithium-ion intercalation into the anode material. These parallel resistance and capacitance will be identified as R1-C1, from now on and ii) the charge transfer resistance in parallel with a double-layer capacitance, associated with lithium-ion insertion into the cathode (e.g., lithium cobalt oxide), these are named as R2-C2.
Due to the proximity of their time constants at room temperature, these two parallel processes tend to overlap in the impedance spectrum. To simplify the modeling and enable automated fitting, the two sub-circuits are combined into a single equivalent parallel element: Rsum – Csum, where Rsum = R1+R2 and Csum = C1C2/(C1+C2).
The associated time constant, τ, represents the overall rate of charge transfer across the anode-electrolyte and cathode-electrolyte interfaces.
- Low-Frequency Region (1 – 0.01 Hz): At low frequencies, the impedance is governed by the solid-state diffusion of lithium ions within the bulk of the electrode materials. This process is typically modeled using a Warburg diffusion element, which appears as a 45° line in the Nyquist plot. However, due to the frequency limitations of most EIS measurements (typically reaching only 10–50 mHz), the diffusion behavior is not fully captured. Consequently, the Warburg element is replaced by a CPE, denoted as Cdiffusion, which mimics the impedance response of a non-ideal diffusion layer. In the impedance plot, this element manifests as a straight line with a variable slope, approximating the semi-infinite diffusion behavior under limited measurement bandwidth.
As previously outlined, the initial equivalent circuit model (referred to as Circuit A) was refined into a more streamlined and computationally efficient representation (Circuit B), as depicted in Figure 8. This simplification maintains the fidelity required to accurately characterize the electrochemical phenomena evident in the impedance spectra, while significantly reducing model complexity. Such a reduction facilitates automated parameter extraction and accelerates subsequent analytical procedures. Leveraging the full spectrum of EIS measurements, which were systematically acquired across diverse SoH and SoC, a comprehensive database was established.
Figure 8.
Evolution of the Nyquist spectra (measured and fitted at SoC of 40%) during cycling, along with the corresponding EEC used.
Figure 8.
Evolution of the Nyquist spectra (measured and fitted at SoC of 40%) during cycling, along with the corresponding EEC used.
This repository consolidates all extracted EIS parameters—including resistive, capacitive, and constant phase elements—each explicitly associated with the corresponding SoH condition at the time of measurement.
To enable focused analysis and optimize model training workflows, the database was partitioned into six distinct subgroups, each representing a specific SoC level (0%, 20%, 40%, 60%, 80%, and 100%). This segmentation facilitates an isolated examination of the influence of charge state on impedance characteristics, independently of aging effects. Moreover, it underpins the development of robust predictive models for SoH estimation based on EIS-derived parameters. Figure 8 shows the impedance spectra obtained at 40% SoC recorded every 100 cycles, along with their corresponding fits using the B equivalent circuit model.
3.3. SoH – EIS Correlation Model Development
The evolution of the extracted circuit elements from these fits is analyzed and compared against the capacity fade trends observed over the cycling period. This comparison enables the assessment of each element’s effectiveness and reliability as an indicator for SoH.
The SoH% of the battery cells is conventionally defined by the following equation [4]:
where C0 represents the initial cell capacity and Cn denotes the capacity after n cycles, the cells received in the first battery module are estimated to have an initial SoH of approximately 96%.
The ohmic resistance (Rint) remains stable during the first 650 cycles. Beyond this point, it exhibits an exponential increase, as illustrated in Figure 9. This parameter is largely unaffected by variations in temperature or SoC; however, it is highly sensitive to the quality of the electrical contacts between the measurement apparatus and the cell terminals. Although the observed increase in Rint is on the order of 0.1 mΩ, electrical contacts resistances typically range between 0.01 and 0.001 Ω. Therefore, factors such as connection reproducibility, contact pressure, conductivity, and contact area are critical for accurate assessment of this parameter. The observed rise in Rint is primarily attributed to electrolyte degradation, accumulation of decomposition products (such as gases and residues of active material), and a loss of electrical conductivity or contact between cell components—including the current collector, binder, electrode, and electrolyte. Similar trends have been reported in other battery aging studies [7,19]. These degradation effects are especially pronounced under conditions of elevated temperature and high charge/discharge rates.
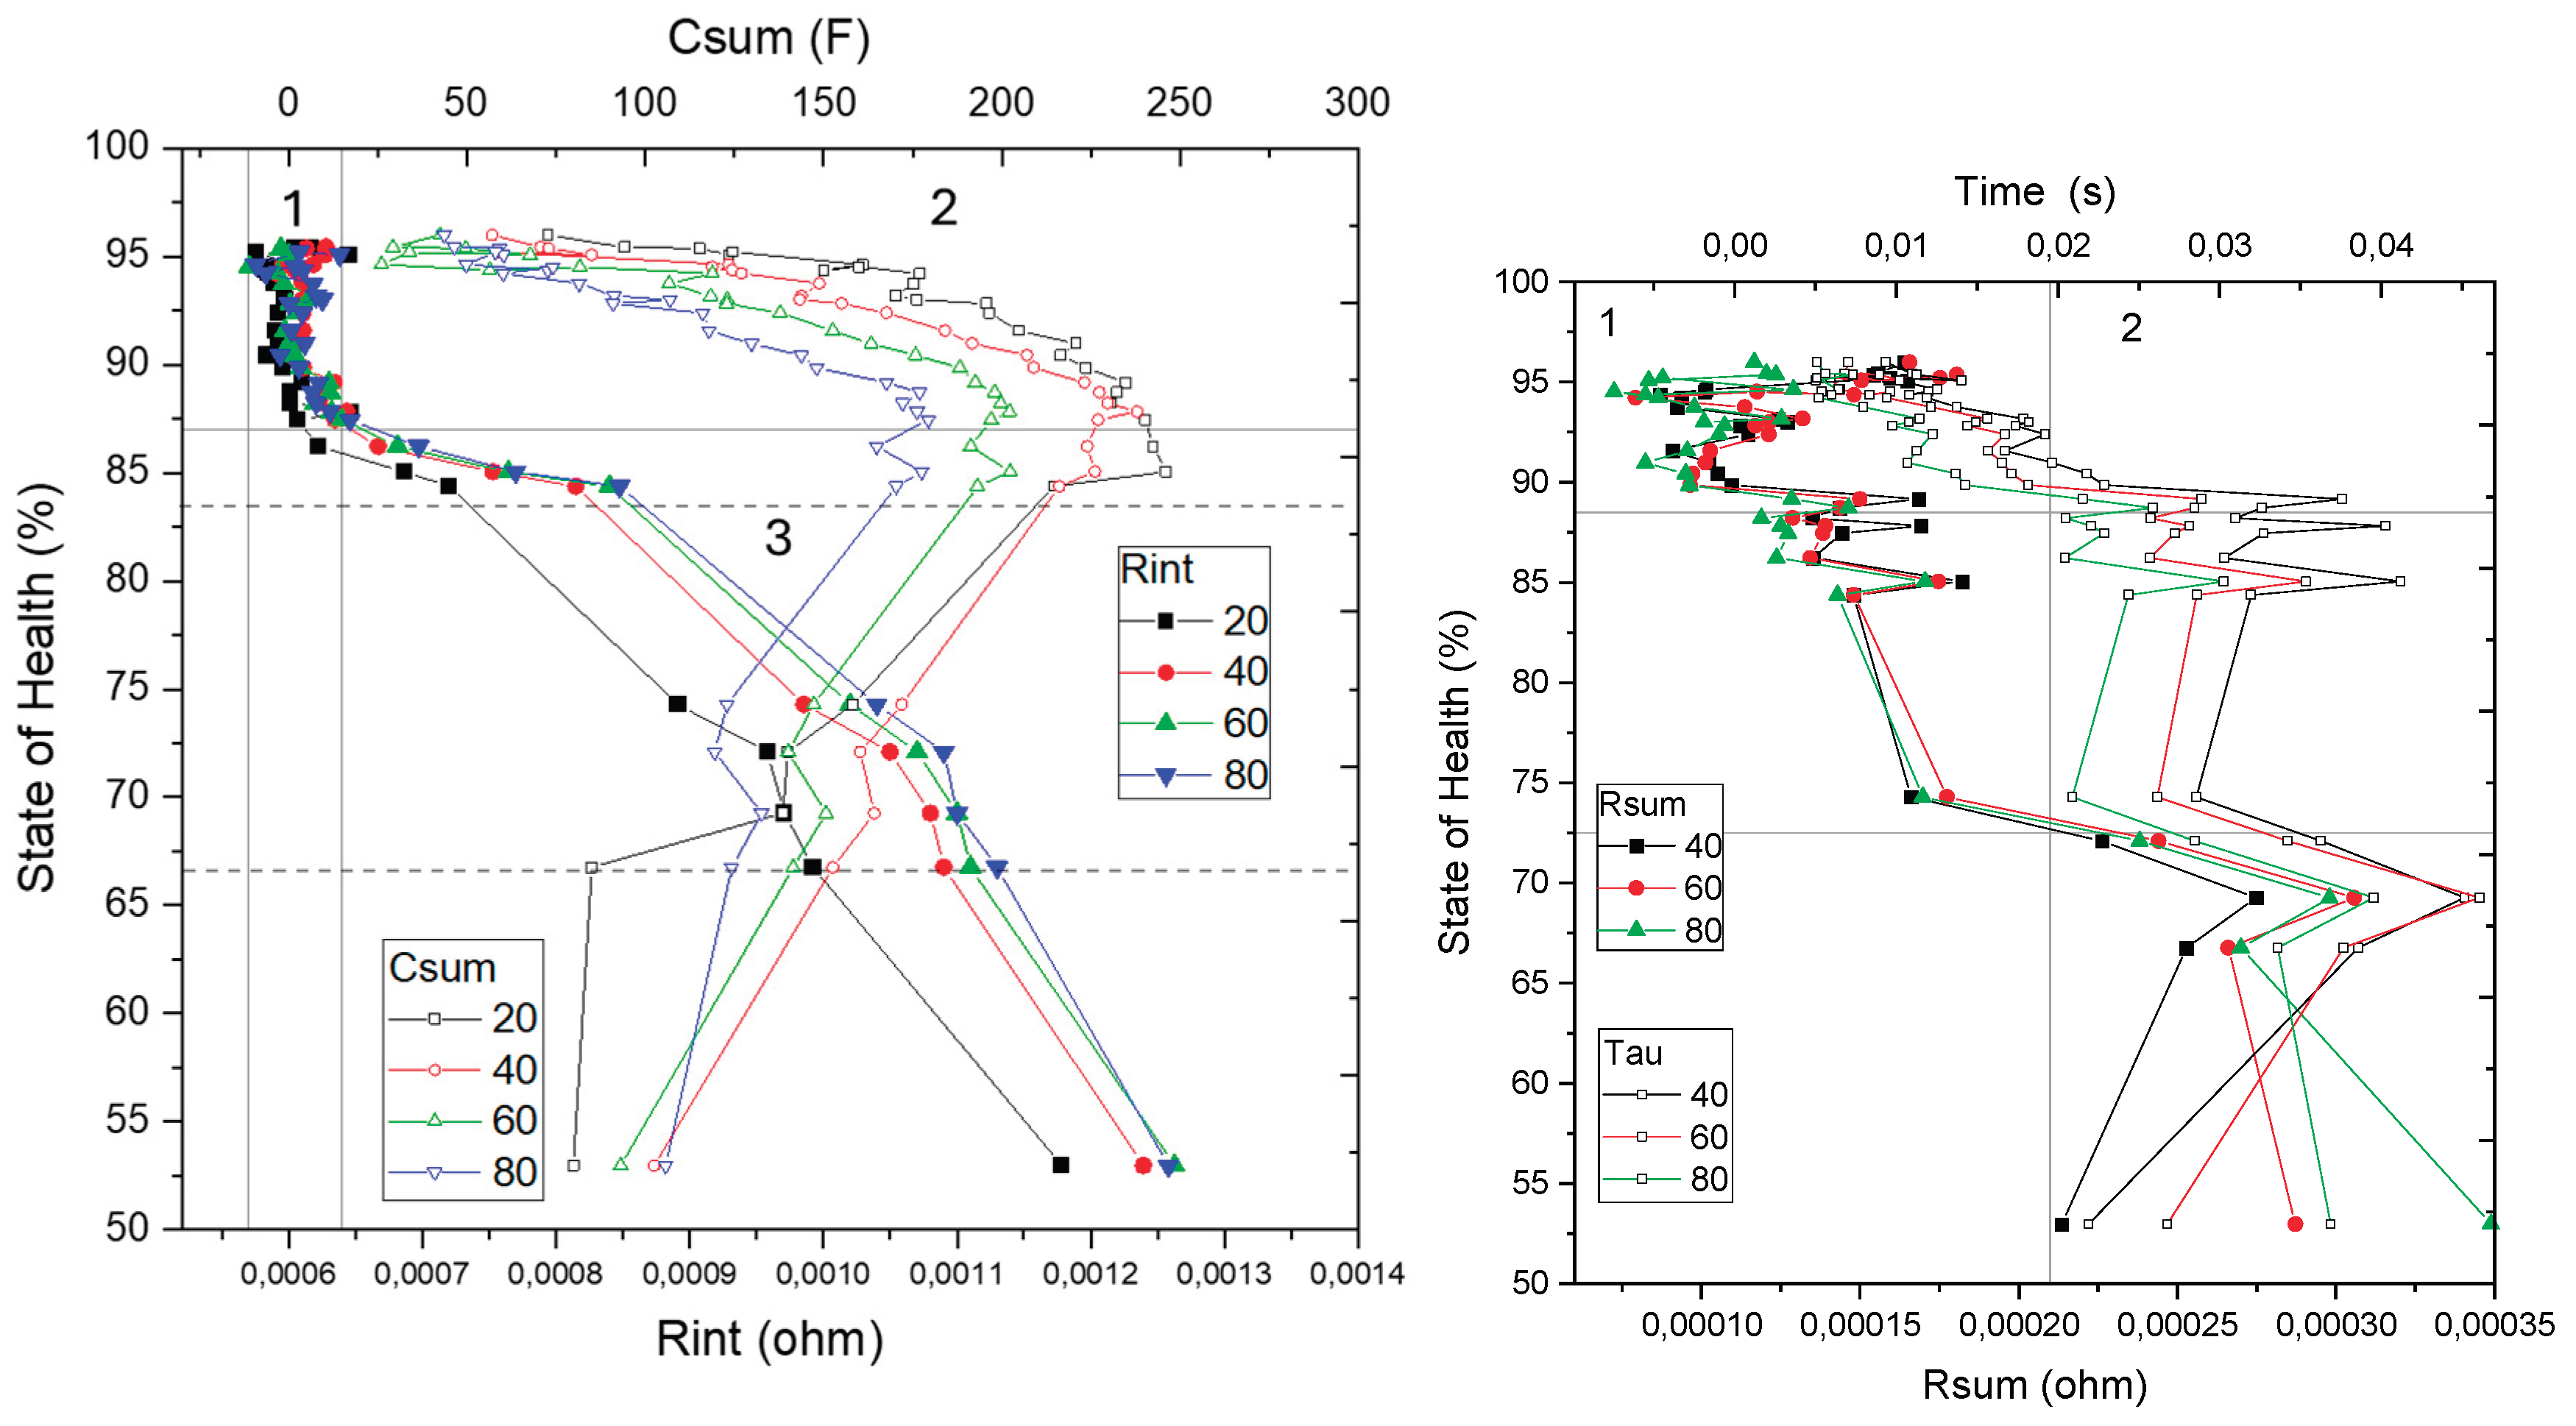
While the absolute magnitude of Rint is largely dictated by the quality of the electrical contacts, the progressive increase over time can be exclusively linked to internal degradation mechanisms within the cell. The first stable 650 cycles for Rint correspond to a SoH range from 96% to 86%, as illustrated in quadrant 1 of Figure 12. In the subsequent phase, represented by quadrant 2, Rint exhibits an inverse correlation with capacity loss and SoH decline. Specifically, between 86% and 78% SoH, Rint increases in a stepwise manner, with an approximate rise of 0.07 mΩ per 1% decrease in SoH. This behavior establishes Rint as a robust indicator of SoH within this intermediate degradation range.
Following this, during the next 100 cycles, the cells experience a pronounced capacity reduction, corresponding to a SoH decrease from 84% to 75%. The relationship between resistance and SoH during this period is characterized by a consistent slope maintained throughout the remaining cycles, with Rint increasing by roughly 0.014 mΩ per 1% loss in SoH (Figure 9).
Based on these observations, during quadrant 3 (Figure 12), Rint serves as a reliable metric for SoH assessment, offering valuable insights into the distinct aging stages described in Section 3.1. These stages include:
- Stage 1: 100% to 83% SoH, with Rint values ranging from 0.0006 Ω to 0.0008 Ω
- Stage 2: 83% to 75% SoH, with Rint values between 0.0008 Ω and 0.0010 Ω
- Stage 3: 75% to 67% SoH, where Rint increases to the range of 0.0010 Ω to 0.0011 Ω
- Stage 4: 67% to 53% SoH, with Rint spanning 0.0011 Ω to 0.00125 Ω
- Stage 5: Below 53% SoH, characterized by Rint exceeding 0.00125 Ω
It is important to note that these resistance values correspond to the specific tested system, encompassing both the cells and the contact resistances inherent to the connection with the potentiostat. Therefore, for different measurement setups and fixtures, the contribution of contact resistance must be independently determined and accounted to normalize and accurately interpret the obtained Rint values.
The sum of resistances (Rsum), defined as the combined contribution of the charge transfer resistance (R1) and the resistance of the solid electrolyte interphase (R2), exhibits a gradual and irregular increase beginning after approximately 400 cycles as shown in Figure 9. This parameter is notably sensitive to temperature variations, as both its absolute magnitude—represented by the diameter of the corresponding semicircle in the Nyquist plot—and the number of observable time constants vary significantly with ambient temperature.
The peaks observed in the Rsum evolution aligned with measurements performed at lower temperatures, highlighting the strong thermal dependence of interfacial resistance mechanisms. The progressive increase in Rsum is attributed to lithium-ion loss, as the continual growth of the SEI layer on the anode surface impedes ion transport between the electrodes and reduces the effective concentration of lithium ions available for charge transfer [7]. Moreover, additional degradation processes—such as cathode-electrolyte interphase (CEI) instability, cathode material loss, and mechanical cracking of the cathode surface—further contribute to the observed resistance growth [10].
Under the temperature conditions used in this study (20–30 °C), the characteristic time constants associated with the anode and cathode tend to overlap, making it difficult to resolve their individual electrochemical signatures. Consequently, the increasing trend in Rsum is interpreted as a superimposed effect of degradation phenomena occurring simultaneously at both the anode and cathode interfaces.
This parameter displays erratic behavior during the first 1000 cycles (Quadrant 1 of Figure 12, 100–75% SoH) and shows irregular growth in the rest of stages. In general, this parameter does not provide a direct and precise SoH value. However, it is useful for detecting damaged or aged cells, which fits with Rsum values over 0,00022 Ω. Over this limit, remanent useful life (RUL) of the cell is not enough for reusing, and cell would be destined for recycling.
Figure 9.
Evolution of capacitance and time constant vs capacity of the cells trough the ageing cycle.
Figure 9.
Evolution of capacitance and time constant vs capacity of the cells trough the ageing cycle.
The total capacitance (Csum), defined as the combined contribution of the double-layer capacitances at the cathode–electrolyte (C2) and anode–electrolyte (C1) interfaces, exhibits a distinct two-phase evolution throughout the cycling process. During the initial stage, extending up to approximately 600 cycles, Csum increases progressively, reaching values nearly 300% higher than its initial baseline, as illustrated in Figure 10. This initial rise is attributed to the degradation and loss of active material at the electrode interfaces, a process that coincides with the relatively stable behavior of Rsum in the same period. In contrast, in the subsequent stage, Csum undergoes a gradual decline. This behavior is associated with the formation and thickening of the SEI and CEI layers. These phenomena contribute to the reduction in effective electrode surface area and pore accessibility, which negatively impacts the overall interfacial capacitance. Notably, this phase overlaps with the sharp increase in interfacial resistances, indicating the onset of more advanced degradation mechanisms.
A well-defined correlation between Csum and the SoH is observed during Quadrant 2 of the analysis (see Figure 12). Within the SoH range of 96% to 88%, Csum acts as a reliable direct indicator of battery condition. However, in Quadrant 3—corresponding to SoH values below 88%—the capacitance values tend to stabilize or even decline, reducing their utility as an aging signal in this regime. Therefore, while Csum is not a suitable indicator for advanced aging stages (SoH < 86%), it is valuable in complementing Rint during the early degradation phase (100–88% SoH), where resistance-based indicators often lack sensitivity or consistency.
Finally, the time constant (τ), defined as the product of Rsum by Csum, increases progressively throughout cycling, as shown in Figure 10. This parameter reflects the combined effects of increasing charge transfer resistances and double-layer capacitances. From cycle 100 onward, τ exhibits an irregular but consistent growth, reaching a 100–200% increase by cycle 600. Since τ depends on Rsum, it is also significantly influenced by ambient temperature. The time constant (τ), expressed in seconds, demonstrates an almost linear evolution during Quadrant 1 (Figure 12) and could serve as a parameter for SoH determination within the range of 100–88%. Beyond 88% SoH, τ becomes increasingly irregular and lacks a clear upward trend, discarding it as a direct indicator. Nevertheless, τ remains useful for distinguishing between two SoH ranges: below values of 0,02 it corresponds to 100–88 SoH% (Stage 1, destined for reusing) and when values are equal or higher to 0,02 it will indicate that SoH% is below 88%, belonging to stage 2-3-4-5. These criteria should be use as the last resource when the values of Rint and Csum are not in the expected range.
Figure 11.
SoH vs EEC fitted parameters.
After a comparative analysis of the behavior and diagnostic reliability of the four evaluated parameters, the internal resistance (Rint) emerges as the most robust and consistent indicator for assessing the SoH of lithium-ion cells. Its progressive and quantifiable increase throughout the cycling process provides a clear correlation with cell degradation, particularly in intermediate and advanced aging stages.
However, due to its limited sensitivity during the early stages of aging, Rint can be complemented by Csum for Stage 1 graded cells (SoH between 100% and 88%). Within this range, Csum demonstrates a well-defined correlation with SoH and helps compensate for the diagnostic limitations of Rint during initial degradation.
It is important to highlight that accurate interpretation of Rint measurements requires precise calibration of the experimental setup, given the significant influence of connection resistances and contact quality on the measured values. Minor deviations in contact pressure, terminal cleanliness, or fixture conductivity can introduce errors on the same order of magnitude as the degradation signal itself.
In cases where Rint or Csum yield anomalous or inconsistent values—due to measurement artifacts or system variability—alternative parameters such as the time constant (τ\tauτ) or the sum of interfacial resistances (Rsum) may be used. Although less precise, these parameters can still provide valuable insight into the electrochemical condition of the cell, particularly when used in conjunction with other indicators.
3.4. SoH Determination Procedure
Once the relationships between the fitted parameters and the SoH have been established, and the two most reliable parameters for SoH estimation identified, a mathematical procedure is implemented to estimate the SoH of a cell under unknown conditions based on its fitted impedance parameters. This procedure is fully automated via a Python script, which follows the steps detailed below:
- 1. Initial SoC Estimation: The first step involves determining an approximate SoC using the Open Circuit Potential (OCP) to SoC correlation method as described in the experimental procedure. This estimation guides the subsequent analysis.
- 2. Database Subgroup Selection: Based on the estimated SoC, the appropriate subgroup from the database—one of six predefined SoC levels—is selected to ensure that the parameter comparison and interpolation occur within the relevant operating conditions.
- 3. Primary Parameter Evaluation: The internal resistance value (Rint) is analyzed to classify the cell into one of the aging stages defined in Section 2, based on the incremental increase of Rint. This classification enables the identification of the cell’s current degradation stage. For aging stages 2 through 5, interpolation within the defined resistance ranges allows for a State of Health (SoH) estimation with an expected error margin of 5–10%.
- 4. Complementary Parameter Usage – Csum: For cells classified in stage 1, where Rint exhibits limited sensitivity and stability over most of the useful life, the total capacitance (Csum) serves as the primary SoH indicator. In this case, the fitted Csum value from the EEC model is interpolated within the Csum database to estimate SoH, achieving an accuracy of approximately 10%.
- 5. Alternative Indicators - Rsum and τ: When fitted values of Rint and Csum fall outside the established database boundaries—potentially due to severe internal degradation, extreme operating temperatures, or measurement anomalies—alternative parameters such as the sum of resistances (Rsum) and the characteristic time constant (τ) are employed as secondary indicators. Although these parameters provide less precision, they enable broad classification of the cell’s condition into two categories: suitability for reuse (Figure 12, Quadrant 1, SoH between 100% and 72.5%) and designation for recycling (Figure 12, Quadrant 2, SoH below 72.5%).
Figure 12.
Correlative model between Csum and Rint with State of Health (left) and evolution of SoH vs cycle number (right) where degradation stages and cell grading are marked.
Figure 12.
Correlative model between Csum and Rint with State of Health (left) and evolution of SoH vs cycle number (right) where degradation stages and cell grading are marked.
This structured, automated approach ensures consistent, repeatable SoH estimation from impedance spectroscopy data, adaptable to varying SoC conditions and degradation stages.
Based on the aging behaviour and the evolution of the fitted parameters, the degradation state is identified in 5 different stages, and specific EEC parameters are identified as main SoH indicator for each one of the stages, as shown in next table:
Table 2.
Correlative model resume.
| Stage | SoH | Cycle number | Capacity (mAh) | Slope (mAh/cycle) | Grade | SoH indicator |
| 1 | 83 | 0-1061 | 66972,6 | -9,16 | Reuse/ reconditioning | Csum |
| 2 | 75 | 1061-1114 | 59678,1 | -163 | Reconditioning | Rint |
| 3 | 67 | 114-1415 | 53696,7 | -21,7 | ||
| 4 | 53 | 1415-1495 | 39422,17 | -190 | Recycling | |
| 5 | 0 | 1495-1580 | 0 | -2258 |
The model is integrated in a Python Script and implemented in software for the automated impedance measurement and SoH determination.
4. Software Architecture and System Implementation
To enable the practical deployment of the impedance-based diagnostic methodology developed in this study, a fully automated software platform was implemented for the measurement, analysis, and classification of lithium-ion cells with unknown SoH. The software tool, named BaterurgIA, was specifically designed to operate within a pilot-scale robotic diagnostic station developed under the framework of the project.
This web-based application automates the complete diagnostic workflow, including EIS acquisition, spectral fitting using EEC, and SoH estimation for cells with unknown degradation profiles. The platform has been successfully integrated into a robotic pilot plant, constituting the core of a fully automated station for battery disassembly, evaluation, and grading.
BaterurgIA is implemented as a responsive web application utilizing Python/Django for backend logic, with HTML and JavaScript for the frontend interface, and a SQLite database for data management. The user interface (Figure 13) is accessible from any browser-enabled device connected to the same local network—desktop, tablet, or smartphone—and is deployable on both Linux and Windows servers. The system architecture supports multi-user access and concurrent sessions, with no licensing restrictions for commercial use, except for one open-source, license-free fitting module. The interface is fully bilingual (Spanish and English).
The web-based application is structured around three primary user interfaces, each supporting a distinct function within the diagnostic workflow:
- Main Interface: Serves as the central dashboard, providing access to all system functionalities, including language selection for multilingual support (Figure 13).
- Database Interface: Facilitates the upload and management of reference datasets correlating EIS measurements with SoH. These datasets must be provided in Excel format and are essential for the classification process.
- Results Interface: Enables the import of new EIS measurements either manually or via an automated scan-and-load feature. Upon upload, data fitting and classification are executed in real time. The interface displays comprehensive visual outputs, including Nyquist plots (both experimental and fitted), the extracted electrochemical parameters, the estimated SoH, the identified degradation stage, and the final classification outcome.
The automated data import function identifies the latest EIS file from a predefined directory and selects the corresponding reference dataset. This minimizes manual input and accelerates high-throughput analysis. After classification, a "View Details" option provides full insight into fitted values, model performance, and interpretation.
The diagnostic workflow initiates with the acquisition of EIS data as described in the Methodology section. This measurement can be triggered manually or executed automatically as part of the robotic protocol implemented in the pilot facility.
Figure 14.
EEC fitting performed by software and main parameters results.
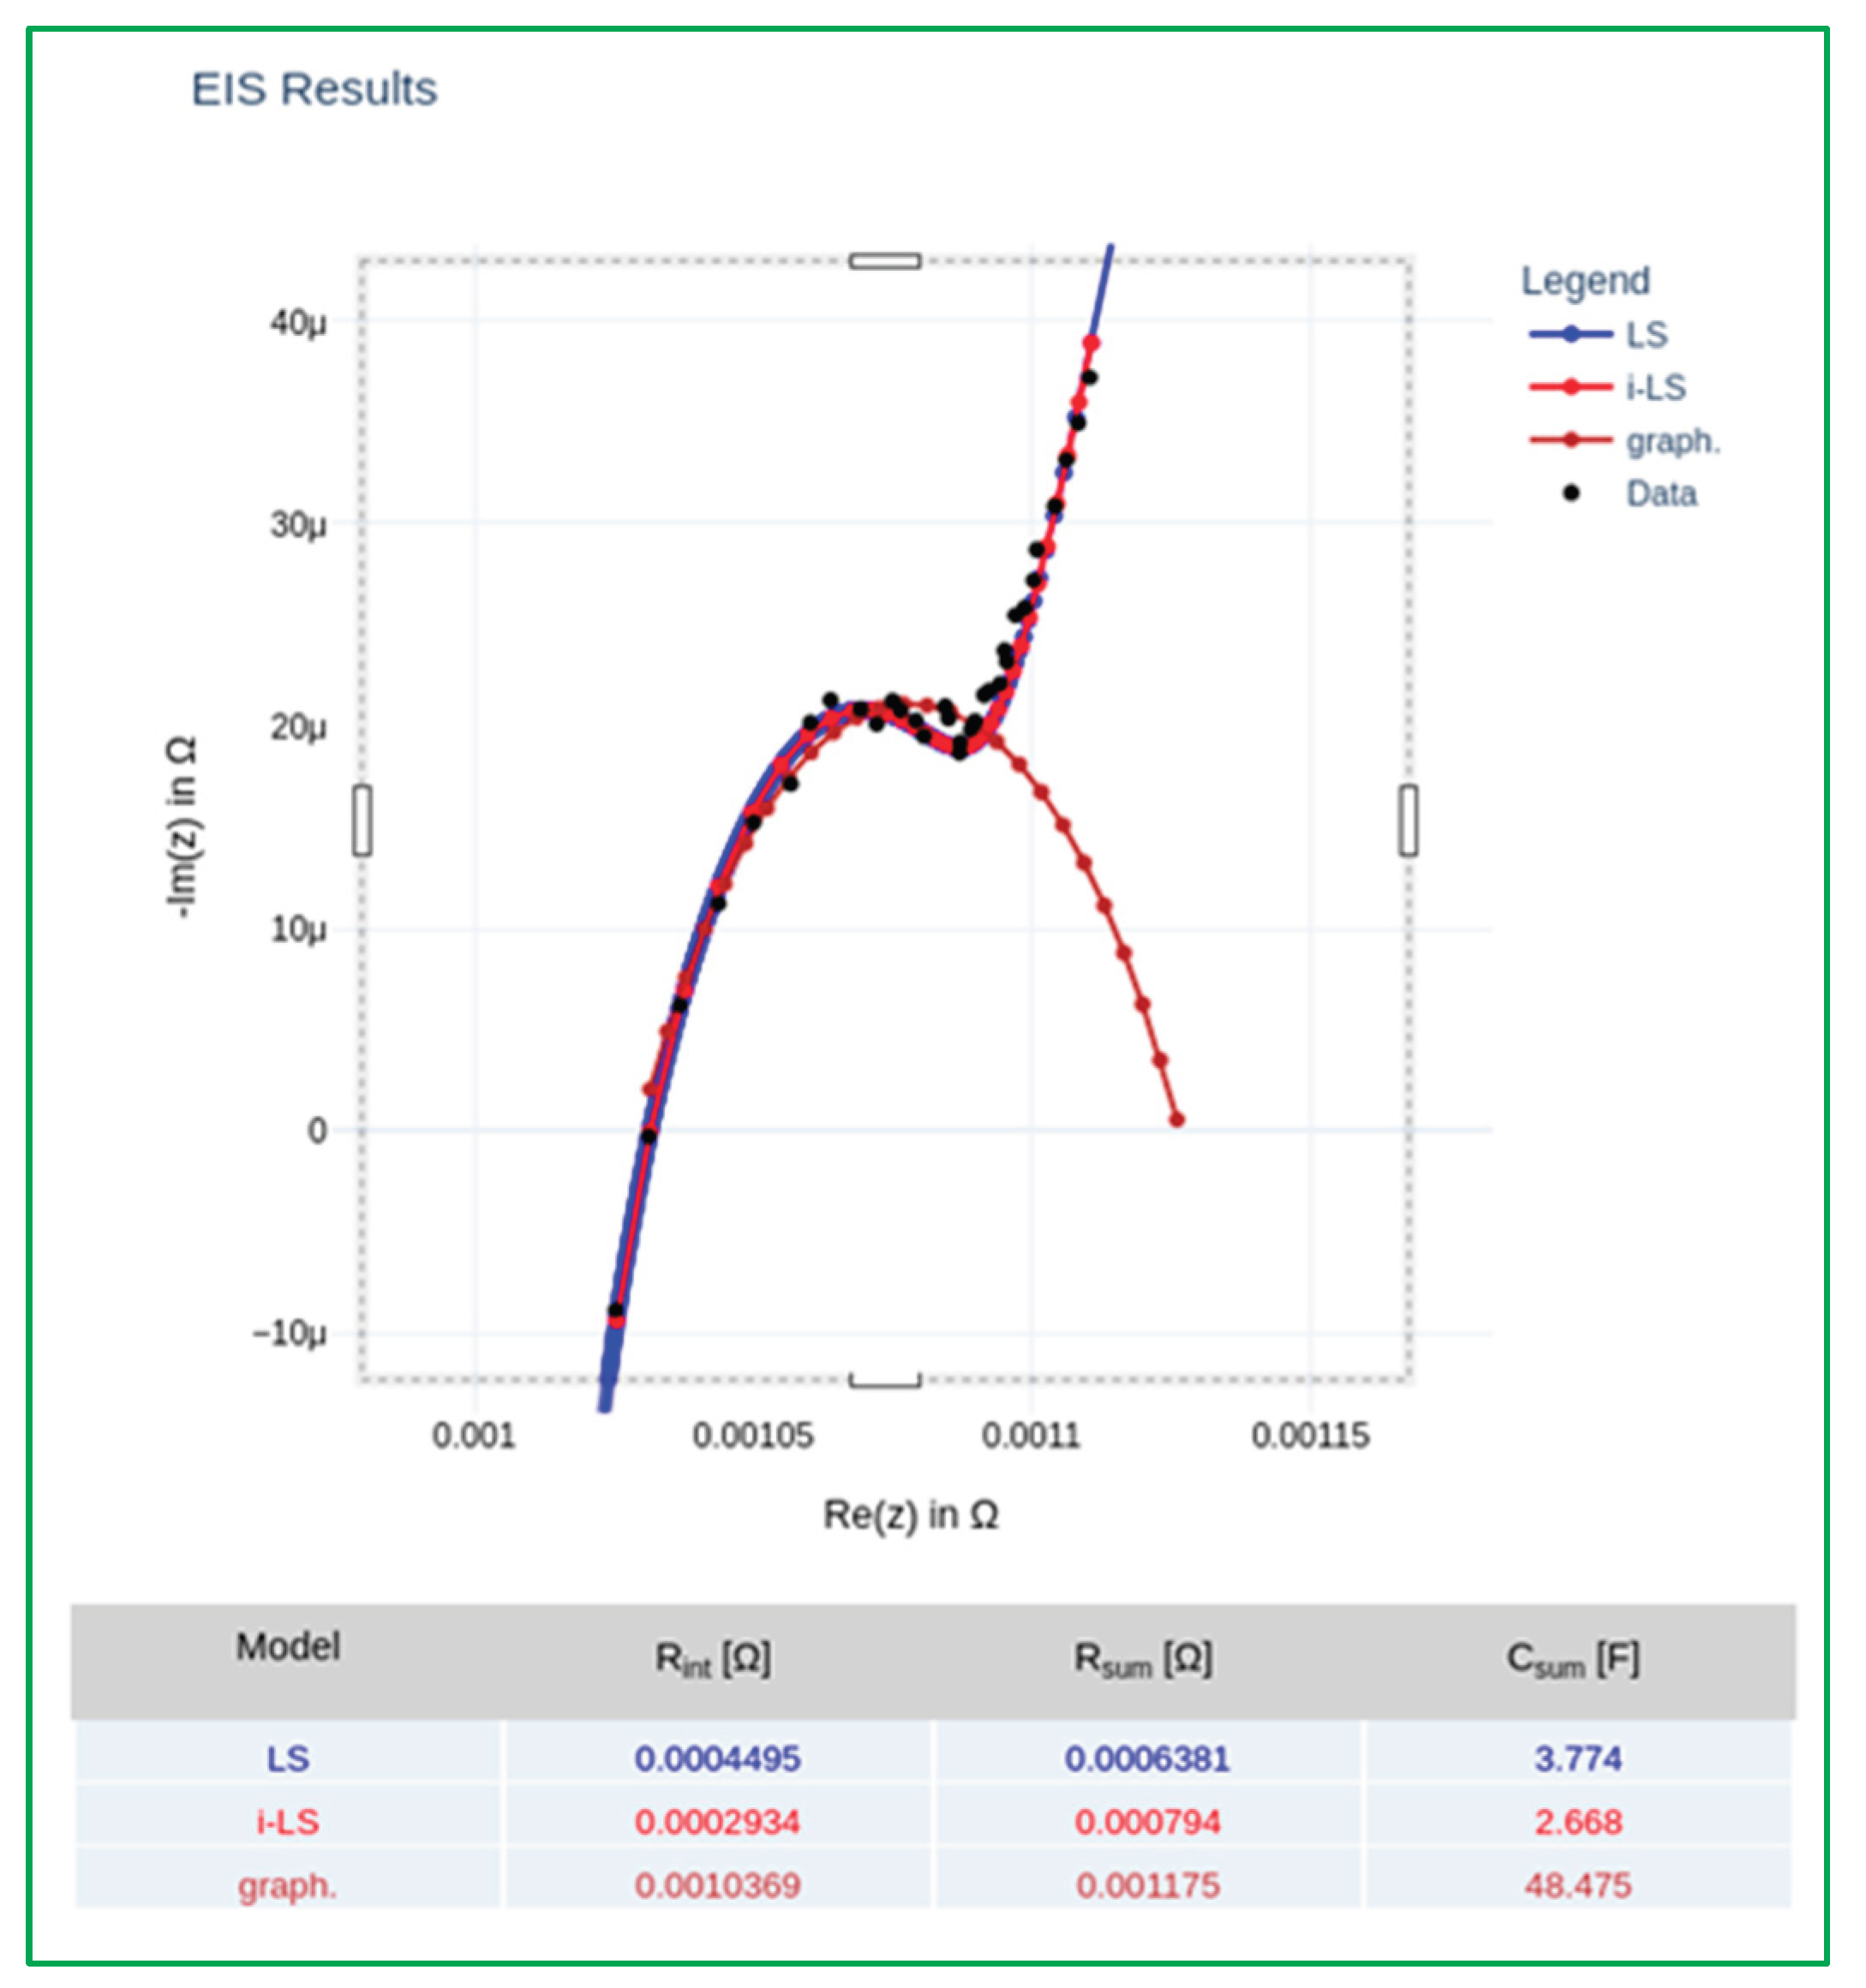
Figure 15.
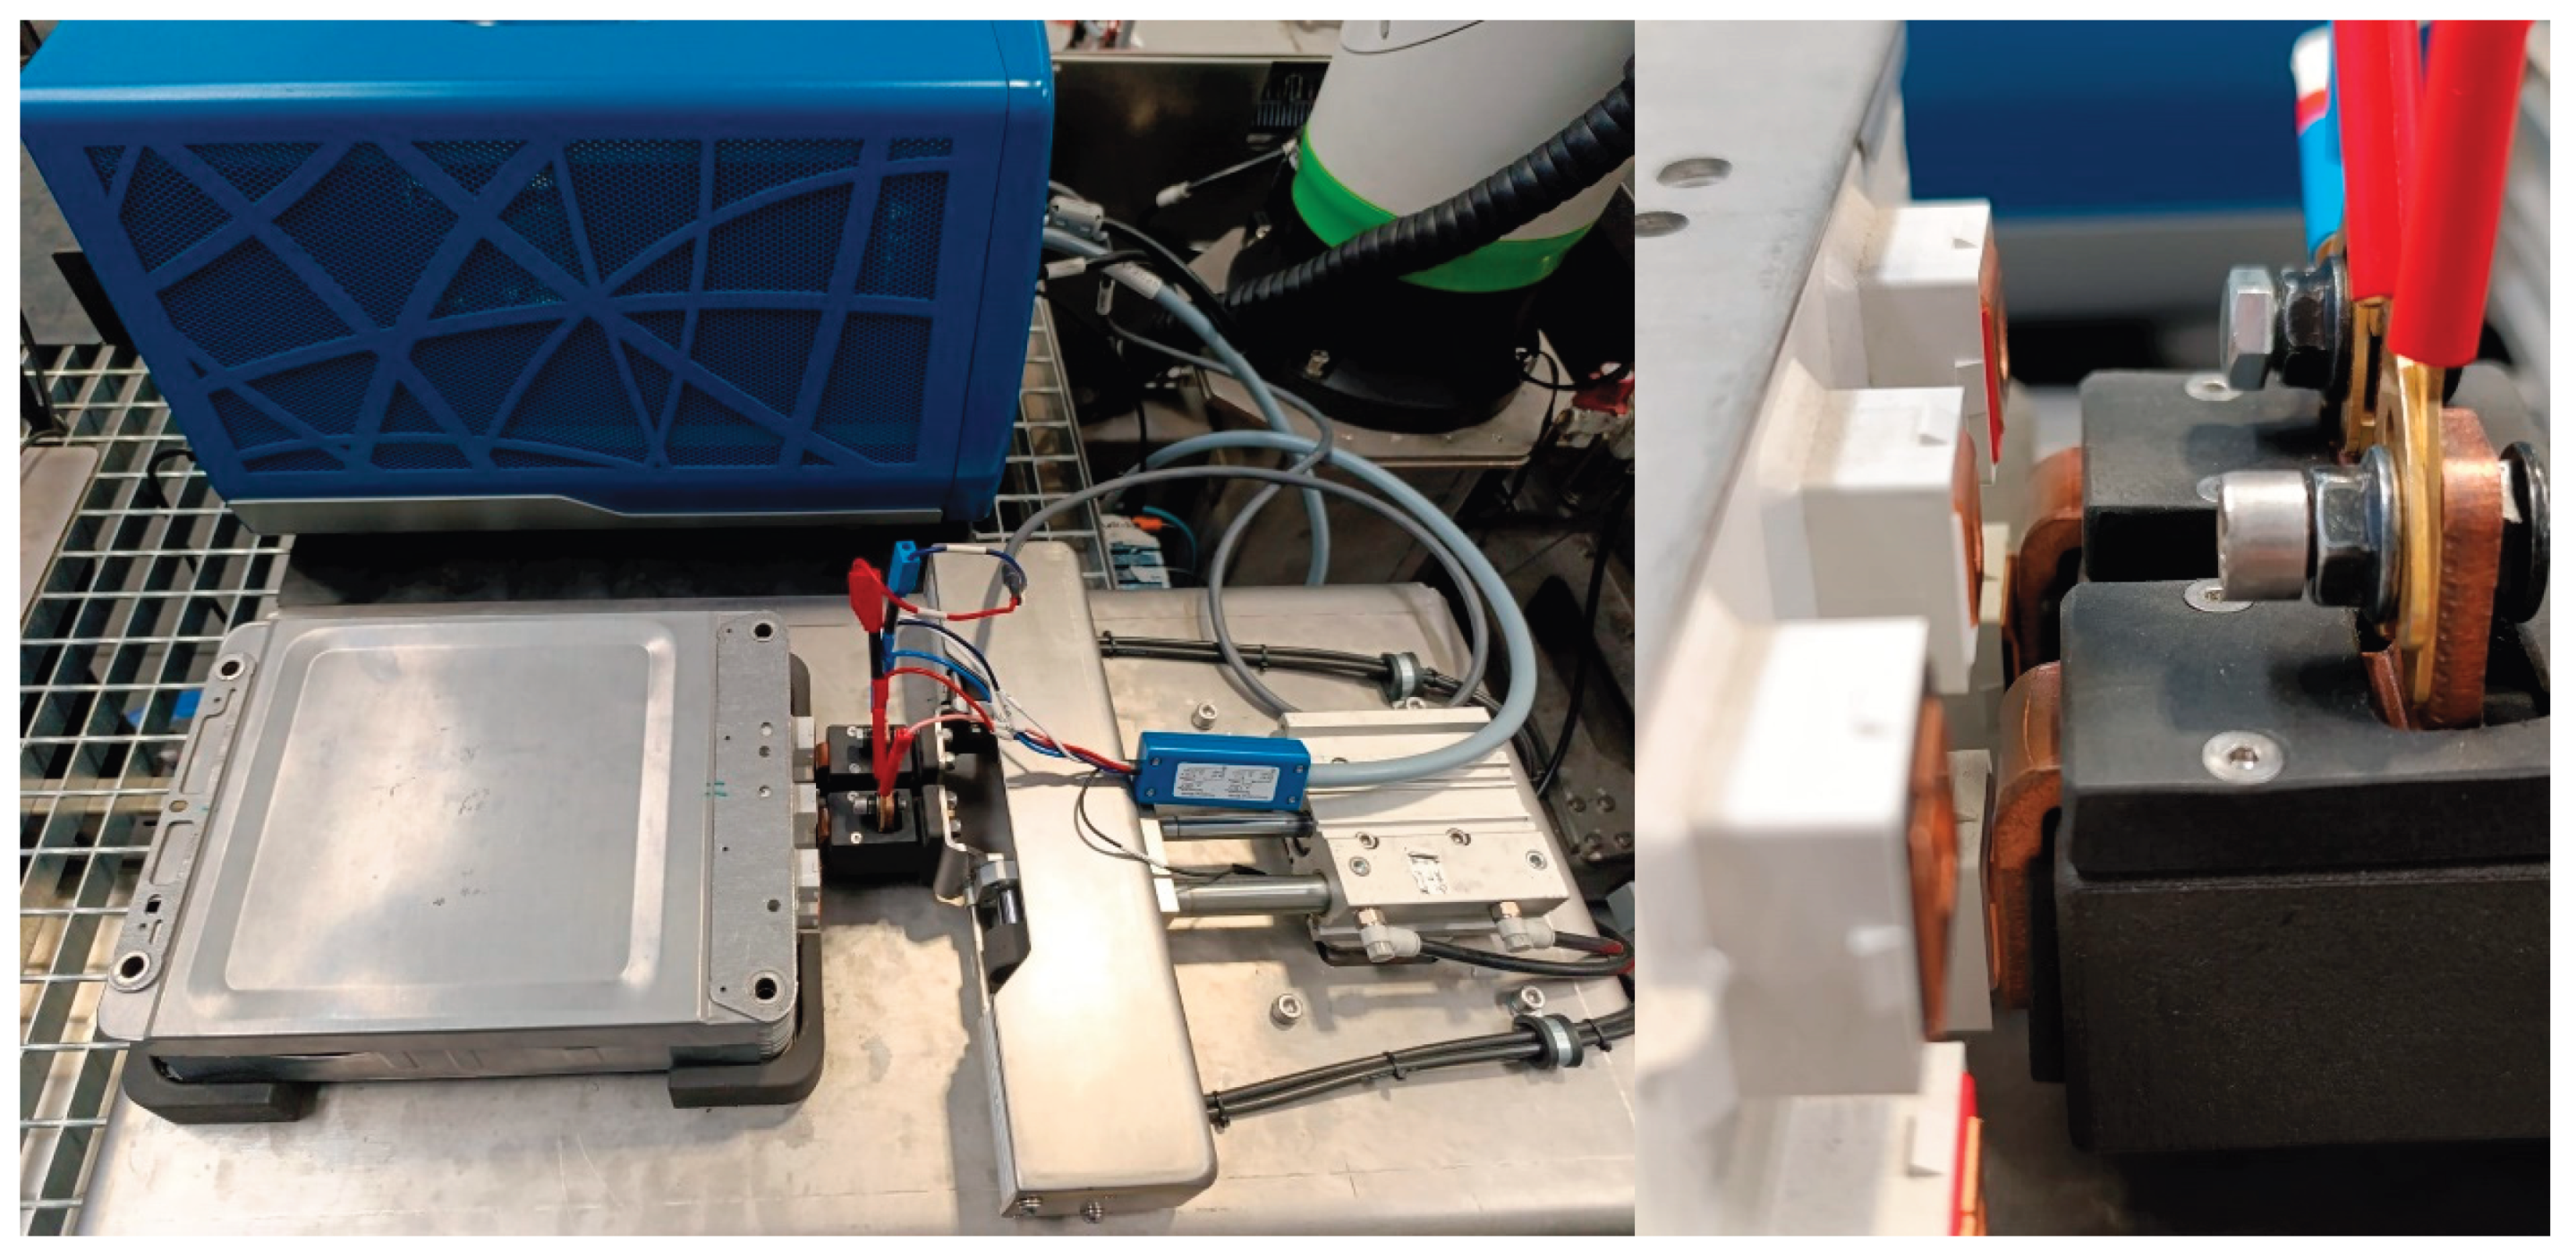
Measurement system: potentiostat, module, probe head and pistons.
Following data acquisition, the impedance spectrum is processed using a fitting engine capable of employing both Least Squares and L-BFGS (Limited-memory Broyden–Fletcher–Goldfarb–Shanno) optimization algorithms. The impedance response is interpreted using a simplified yet representative EEC, from which four primary parameters are extracted, as illustrated in Figure 16: Rint (internal ohmic resistance), Rsum (combined SEI and charge transfer resistance), Csum (equivalent double-layer capacitance) and τ (time constant, τ = Rsum × Csum), previously defined.
The extracted parameters are benchmarked against a reference database constructed from controlled aging experiments, as previously described. The SoH is estimated by evaluating the correlation between the fitted electrochemical parameters and established degradation profiles. In cells exhibiting advanced aging, Rint emerges as the most robust indicator of degradation, whereas in early-stage aging, Csum provides higher sensitivity and resolution. In instances where parameter uncertainty or anomalous behavior is observed, Rsum and τ are utilized as auxiliary classification features.
A Random Forest machine learning classifier is employed to categorize each tested cell into one of three operationally actionable states, based on the estimated SoH:
- Reuse (SoH > 83%): Cells are deemed suitable for direct deployment in second-life applications without the need for refurbishment.
- Reconditioning (SoH 67–83%): Cells are eligible for limited reuse, contingent upon minimal reconditioning procedures.
- Recycle (SoH < 67%): Cells are considered at end-of-life and are directed toward materials recovery and recycling processes.
5. Automated Testing Bench
The final outcome of this work is the development of a fully functional pilot-scale testing bench. This system integrates mechanical automation, advanced electrochemical impedance diagnostics, and custom software to evaluate the electrochemical condition of used battery modules with minimal operator involvement.
At the core of the system lies a pneumatically actuated probe head, mounted within a modular fixture, both shown in Figure 17 left. The probe head features two spring-loaded copper pistons capable of switching among six distinct contact configurations (Figure 17, right). This design enables direct electrical connection to any of the four cell pairs (2s) or to the complete module (2s2p configuration) without requiring manual repositioning. The use of compressed air for actuation ensures consistent and controlled contact pressure, which is critical for achieving reliable and reproducible impedance measurements while preventing mechanical damage to cell terminals.
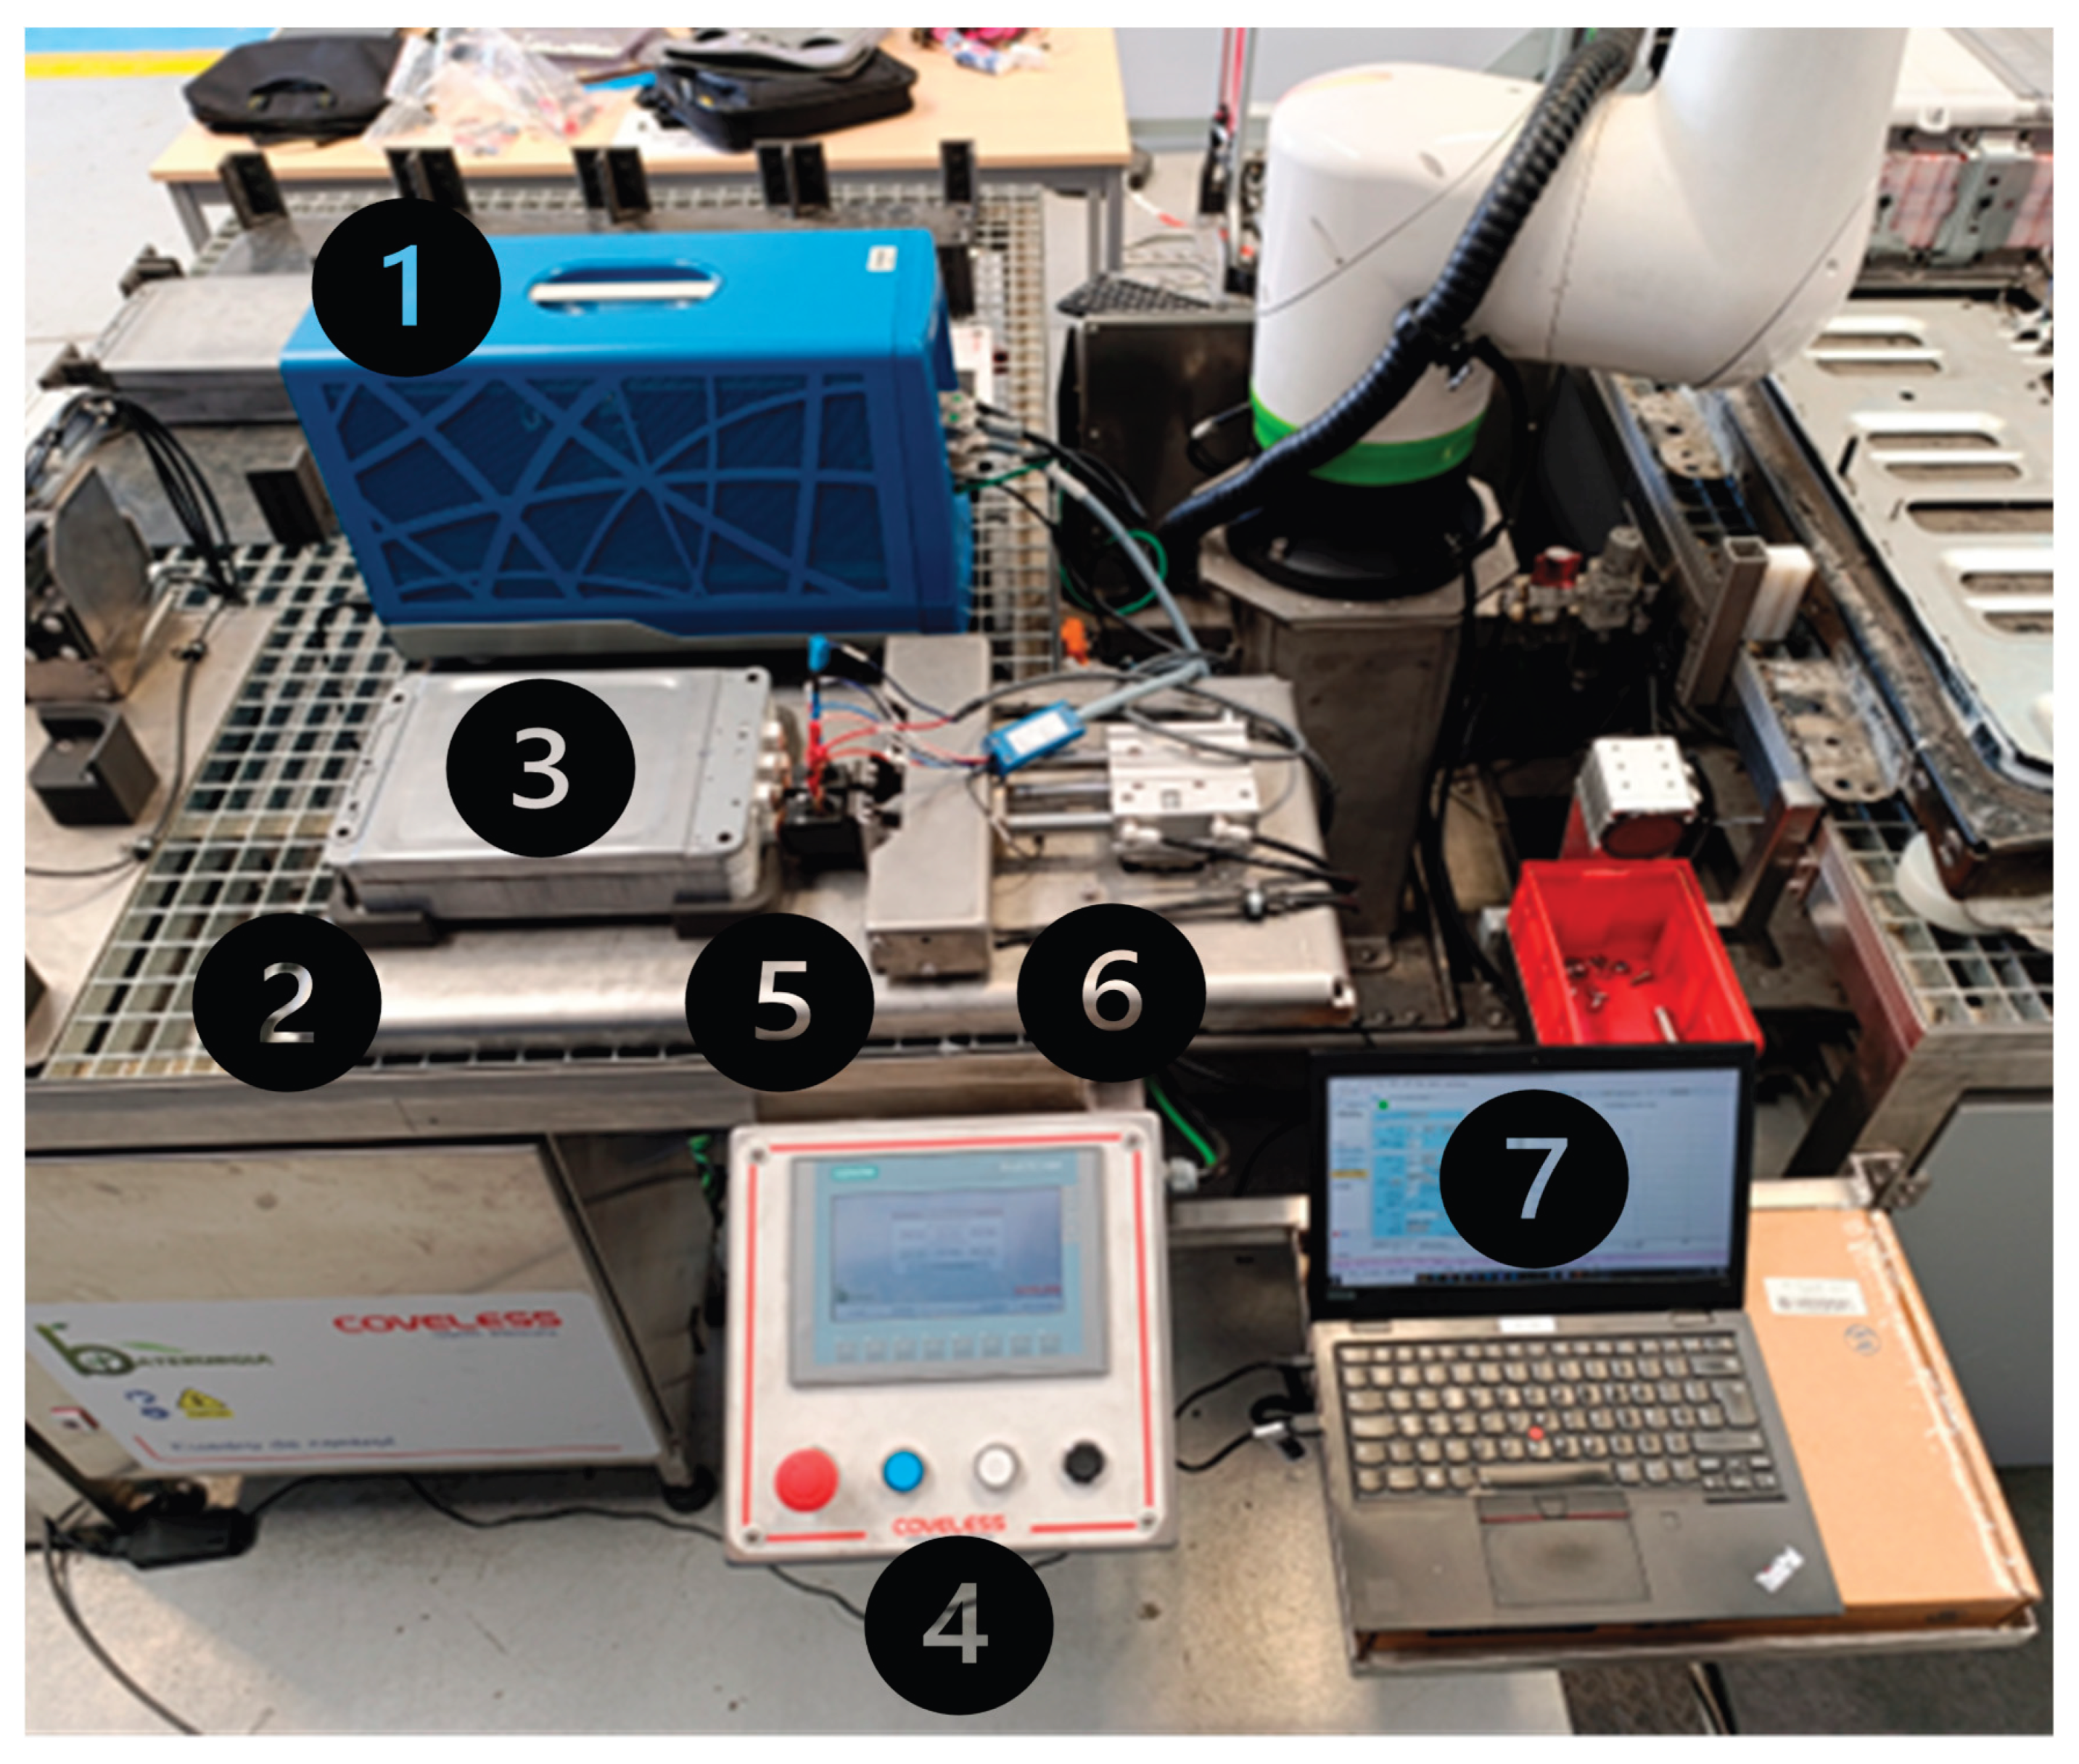
The copper pistons are directly interfaced with the potentiostat via banana plug connectors, intentionally avoiding the use of intermediary relay boxes, soldered joints, or additional circuitry that could introduce parasitic impedance. This direct connection approach effectively reduces the overall contact resistance to below 0.3 mΩ, a threshold suitable for detecting sub-mΩ variations in internal resistance (Rint) which serve as key indicators of electrochemical ageing. The residual resistance introduced by the probe system was experimentally characterized and incorporated into the diagnostic software as a correction factor. This calibration ensures high accuracy in the estimation of the SoH across a range of ageing conditions. Figure 18 shows the full system including the potentiostat (1), connected directly to the probe head, a 3D printed frame (2) for securing the battery module in place, the battery module composed by 2x 2s2p cells (3) to be tested, a touchscreen control interface (4) for selecting cell pairs and actuating pistons, a custom copper-based piston assembly (5) for low-resistance, automated contact, a mobile pneumatic probe head (6), a PC-based software environment (7) (BaterurgIA) for impedance fitting and SoH estimation and an air-cooled resistive load system for controlled discharge of non-reusable cells, allocated under the table.
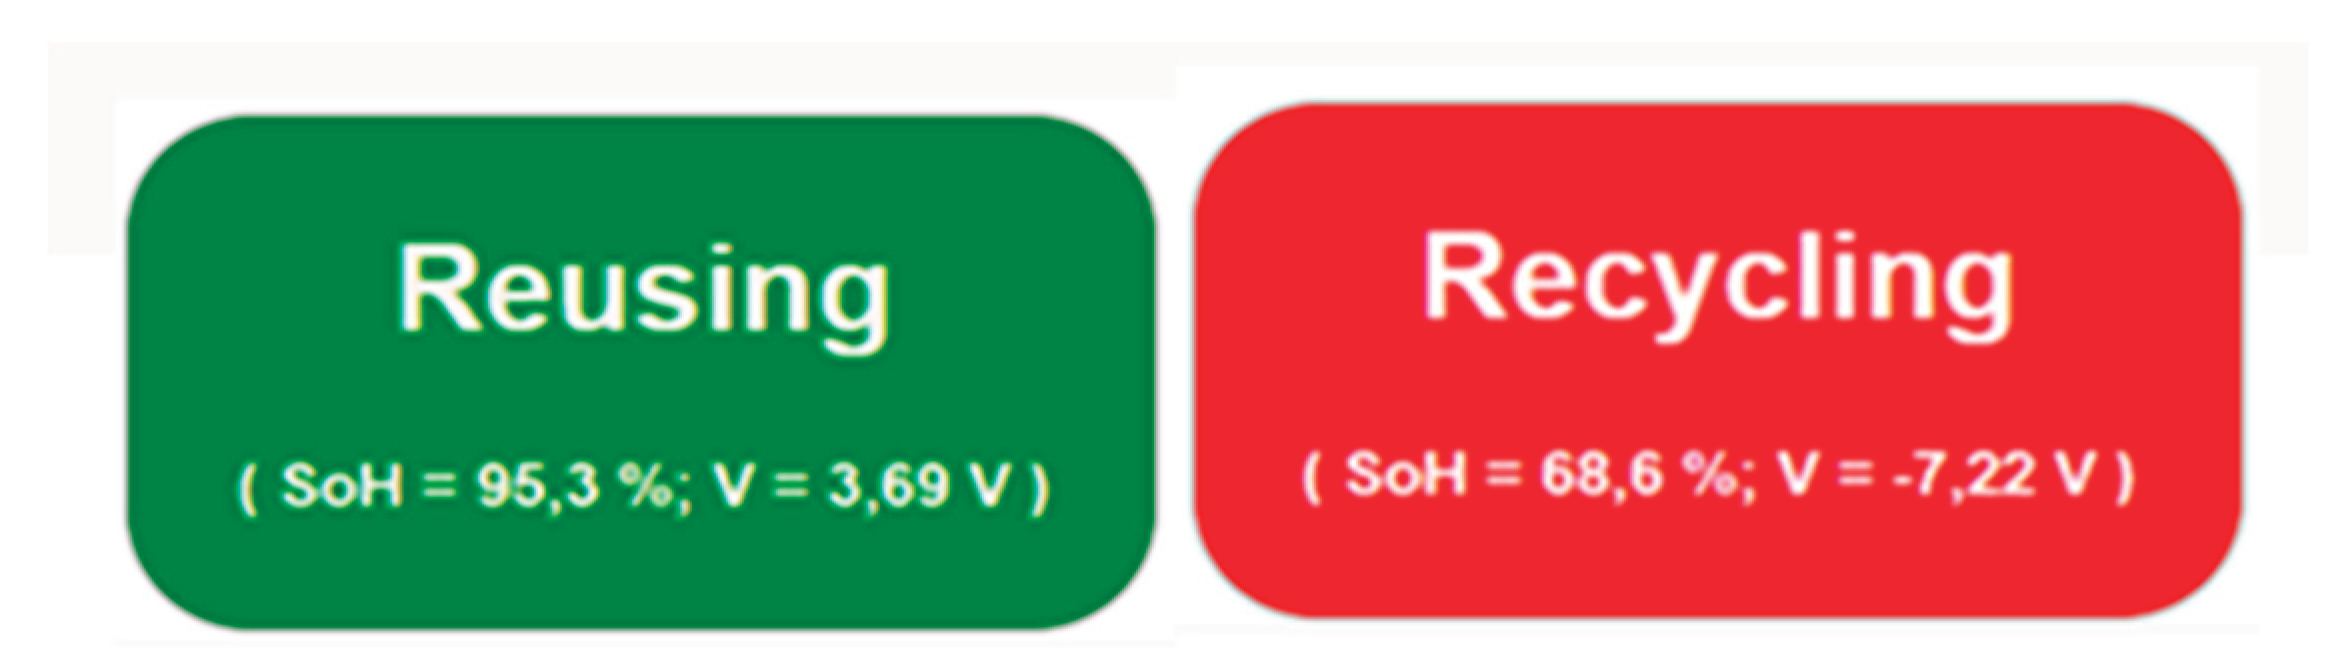
The operational sequence proceeds as follows: a 2s2p module is first manually positioned in the test fixture. The operator then selects the target cell pair via the touchscreen interface. Next, the pistons are pneumatically actuated to establish the electric contact. Once contact is confirmed, EIS measurement is initiated (time consumed: 5min.). The acquired impedance data are automatically processed by BaterurgIA software, which performs parameter fitting and estimates the state of health (SoH) of the cells. Based on this analysis, the cells can be classified into categories of reuse/reconditioning, or recycling, shown with the next indicators (Figure 19):
Figure 17.
SoH, OCP and instruction indicators.
If the cell is classified as end-of-life, a controlled discharge is performed via the resistive load, ensuring safe handling before further processing.
6. Conclusions
This study demonstrates the feasibility and effectiveness of using EIS as a rapid, non-invasive diagnostic tool for assessing the SoH of lithium-ion cells, particularly in scenarios where conventional cycling methods are impractical or too time-consuming. By developing and validating a simplified EEC model and correlating its fitted parameters with experimentally determined capacity loss, it is developed a robust methodology for SoH estimation.
Among the analyzed parameters, internal resistance (Rint) proves to be the most consistent indicator across intermediate and advanced degradation stages, while double-layer capacitance (Csum) provides greater sensitivity during early-stage aging. When primary indicators yield ambiguous results, auxiliary parameters such as Rsum and τ offer additional diagnostic value.
The proposed approach has been implemented in an integrated software platform, BaterurgIA, capable of automating the complete diagnostic workflow—from EIS data acquisition and EEC fitting to SoH classification—via an user friendly web interface. This system has been successfully deployed and validated within a pilot station for autonomous battery disassembly and grading, achieving classification times under five minutes per cell.
The results support the potential of EIS-based diagnostics as a scalable solution for second-life battery grading, offering a balance between speed, accuracy, and operational safety. Future work will extend this methodology to a wider range of cell chemistries and real-world use profiles, further enhancing its applicability across the battery recycling and reuse value chain.
Author Contributions
Ignacio Ezpeleta: Writing, Methodology, Investigation, Formal analysis, Data curation, Conceptualization. Lorena Freire: Writing, Methodology, Supervision, Conceptualization. Javier Fernandez: Software, Methodology. David Giraldez: Supervision, Methodology. All authors have read and agreed to the published version of the manuscript.
Funding
This research was funded the Program Misiones Ciencia e Innovación 2022, as part of the project BATERURGIA
Conflicts of Interest
The authors declare no conflicts of interest
References
- C. Fetting, THE EUROPEAN GREEN DEAL, 2020.
- Y. Li, S. Ding, L. Wang, W. Wang, C. Lin, X. He, On safety of swelled commercial lithium-ion batteries: A study on aging, swelling, and abuse tests, ETransportation 22 (2024). [CrossRef]
- N. Noura, L. Boulon, S. Jemeï, A review of battery state of health estimation methods: Hybrid electric vehicle challenges, World Electric Vehicle Journal 11 (2020) 1–20. [CrossRef]
- Z. Gao, C.S. Chin, J.H.K. Chiew, J. Jia, C. Zhang, Design and implementation of a smart lithium-ion battery system with real-Time fault diagnosis capability for electric vehicles, Energies (Basel) 10 (2017). [CrossRef]
- M. Dubarry, G. Baure, D. Anseán, Perspective on State-of-Health Determination in Lithium-Ion Batteries, Journal of Electrochemical Energy Conversion and Storage 17 (2020). [CrossRef]
- C. Pastor-Fernández, T.F. Yu, W.D. Widanage, J. Marco, Critical review of non-invasive diagnosis techniques for quantification of degradation modes in lithium-ion batteries, Renewable and Sustainable Energy Reviews 109 (2019) 138–159. [CrossRef]
- E. Teliz, C.F. Zinola, V. Díaz, Identification and quantification of ageing mechanisms in Li-ion batteries by Electrochemical impedance spectroscopy., Electrochim Acta 426 (2022). [CrossRef]
- M. Galeotti, L. Cinà, C. Giammanco, S. Cordiner, A. Di Carlo, Performance analysis and SOH (state of health) evaluation of lithium polymer batteries through electrochemical impedance spectroscopy, Energy 89 (2015) 678–686. [CrossRef]
- K. Technologies, Advanced Electrochemical Impedance Spectroscopy (EIS) for Battery Testing, n.d. www.keysight.com.
- P. Iurilli, C. Brivio, V. Wood, On the use of electrochemical impedance spectroscopy to characterize and model the aging phenomena of lithium-ion batteries: a critical review, J Power Sources 505 (2021). [CrossRef]
- I. Ezpeleta, L. Freire, C. Mateo-Mateo, X.R. Nóvoa, A. Pintos, S. Valverde-Pérez, Characterisation of Commercial Li-Ion Batteries Using Electrochemical Impedance Spectroscopy, ChemistrySelect 7 (2022). [CrossRef]
- D. Andre, M. Meiler, K. Steiner, H. Walz, T. Soczka-Guth, D.U. Sauer, Characterization of high-power lithium-ion batteries by electrochemical impedance spectroscopy. II: Modelling, J Power Sources 196 (2011) 5349–5356. [CrossRef]
- S. Micari, S. Foti, A. Testa, S. De Caro, F. Sergi, L. Andaloro, D. Aloisio, S.G. Leonardi, G. Napoli, Effect of WLTP CLASS 3B Driving Cycle on Lithium-Ion Battery for Electric Vehicles, Energies (Basel) 15 (2022). [CrossRef]
- C.R. Birkl, M.R. Roberts, E. McTurk, P.G. Bruce, D.A. Howey, Degradation diagnostics for lithium ion cells, J Power Sources 341 (2017) 373–386. [CrossRef]
- T. Osaka, S. Nakade, M. Rajamäki, T. Momma, Influence of capacity fading on commercial lithium-ion battery impedance, in: J Power Sources, 2003: pp. 929–933. [CrossRef]
- W. Diao, S. Saxena, B. Han, M. Pecht, Algorithm to determine the knee point on capacity fade curves of lithium-ion cells, Energies (Basel) 12 (2019). [CrossRef]
- J.S. Edge, S. O’Kane, R. Prosser, N.D. Kirkaldy, A.N. Patel, A. Hales, A. Ghosh, W. Ai, J. Chen, J. Yang, S. Li, M.C. Pang, L. Bravo Diaz, A. Tomaszewska, M.W. Marzook, K.N. Radhakrishnan, H. Wang, Y. Patel, B. Wu, G.J. Offer, Lithium ion battery degradation: what you need to know, Physical Chemistry Chemical Physics 23 (2021) 8200–8221. [CrossRef]
- S. Zhang, M.S. Hosen, T. Kalogiannis, J. Van Mierlo, M. Berecibar, State of health estimation of lithium-ion batteries based on electrochemical impedance spectroscopy and backpropagation neural network, World Electric Vehicle Journal 12 (2021). [CrossRef]
- P. Shafiei Sabet, A.J. Warnecke, F. Meier, H. Witzenhausen, E. Martinez-Laserna, D.U. Sauer, Non-invasive yet separate investigation of anode/cathode degradation of lithium-ion batteries (nickel–cobalt–manganese vs. graphite) due to accelerated aging, J Power Sources 449 (2020). [CrossRef]
Figure 10.
Evolution of resistive parameters vs capacity of the cells trough the ageing cycle.
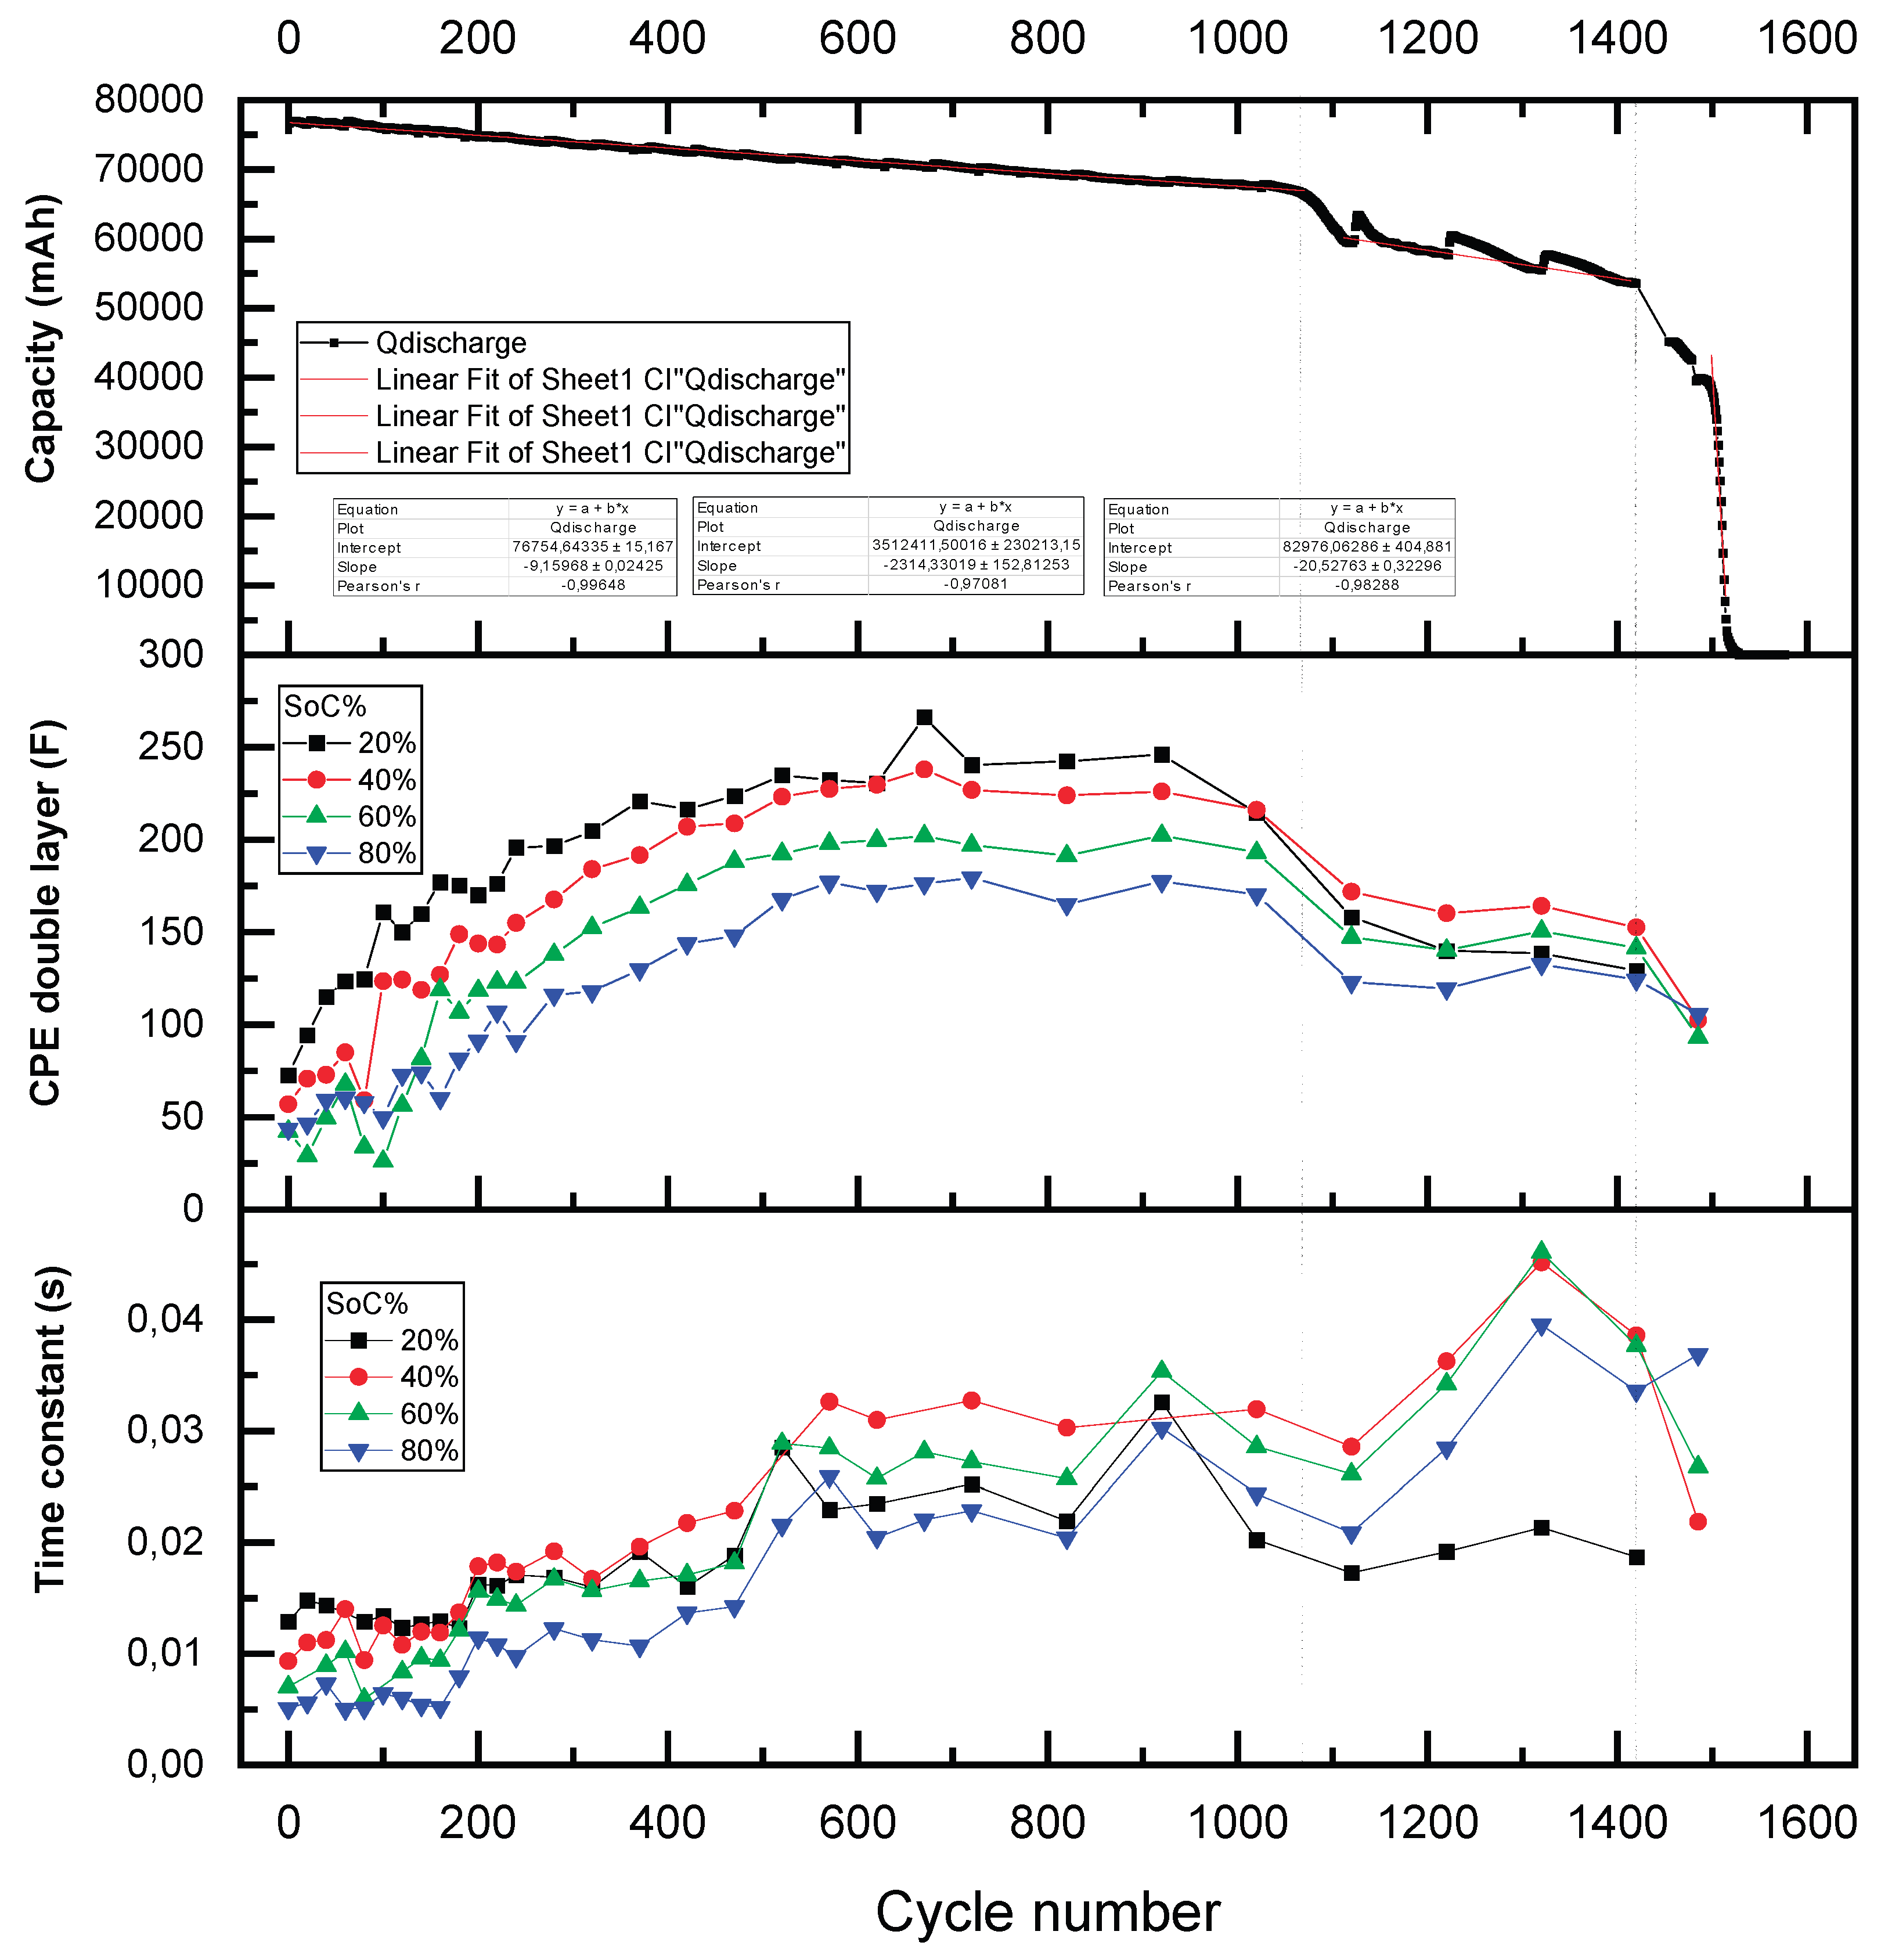
Figure 13.
Main BaterurgIA interface.

Figure 16.
Testing bench for autonomous module grading.
Disclaimer/Publisher’s Note: The statements, opinions and data contained in all publications are solely those of the individual author(s) and contributor(s) and not of MDPI and/or the editor(s). MDPI and/or the editor(s) disclaim responsibility for any injury to people or property resulting from any ideas, methods, instructions or products referred to in the content. |
© 2025 by the authors. Licensee MDPI, Basel, Switzerland. This article is an open access article distributed under the terms and conditions of the Creative Commons Attribution (CC BY) license (http://creativecommons.org/licenses/by/4.0/).
Copyright: This open access article is published under a Creative Commons CC BY 4.0 license, which permit the free download, distribution, and reuse, provided that the author and preprint are cited in any reuse.


