
Submitted:
27 August 2024
Posted:
28 August 2024
You are already at the latest version
Abstract
Conventional biochemical methods for studying cellular signaling cascades have relied on destructive cell disruption. In contrast, live cell imaging of fluorescent-tagged transfected proteins offers a non-invasive approach to understanding signal transduction events. One strategy involves monitoring the phosphorylation-dependent shuttling of a fluorescent-labeled kinase between the nucleus and cytoplasm using nuclear localization, export signals, or both. This paper introduces a simple method to visualize intracellular signal transduction in live cells by exploring the translocation properties of PKC from the cytoplasm to the membrane. We fused bait protein to PKC, allowing the bait (RFP-labeled) and target (GFP-labeled) proteins to co-translocate from the cytoplasm to the membrane. However, in non-interacting protein pairs, only the bait protein was translocated to the plasma membrane. To verify our approach, we examined the Raf–MEK–ERK signaling cascade (ERK pathway) and directly observed the Raf1/MEK2 interaction. We also identified ternary complexes containing the KSR1 scaffold protein. Additionally, the MEK/ERK interaction was dependent on the exogenous expression of KSR1.
Keywords:
ERK pathway
; Raf–MEK–ERK signaling cascade
; scaffold protein
; visualizing protein interaction
; cell-based assay
1. Introduction
The mitogen-activated protein kinase (MAPK) pathway is a key signaling pathway that regulates a wide variety of cellular processes, including cell proliferation, survival, differentiation, development, transformation, stress responses, metabolism, and apoptosis. In mammalian cells, three MAPK families have been characterized: extracellular signal-regulated kinase (ERK), C-Jun N-terminal kinase (JNK), and p38 kinase [1,2]. Particularly, the Raf–MEK–ERK signaling cascade, often called the ERK pathway, is a well-characterized MAPK pathway. The three-layered MAPK signaling cascade is initiated upon receptor tyrosine kinase (RTK) and Ras activation [3]. For example, many receptors induce the activation of Ras, a small GTPase that binds to GTP, allowing Ras to interact directly with its target proteins (including Raf kinase). Upon its activation, Ras recruits cytosolic Raf to the plasma membrane. This interaction triggers Raf activation, initiating the signal cascade downstream to MEK and ERK.
In addition, scaffold proteins are essential regulators of many key signaling pathways. Despite their diverse functions, they commonly interact and bind with multiple pathway components to form complexes. By organizing these complexes, scaffolds control signal transduction and facilitate the localization of pathway components to specific cellular regions. Several scaffold proteins have also been found to be integral in ERK pathway activation and signaling [4,5,6,7]. One of the best-studied ERK pathway scaffolds, the kinase suppressor of Ras1 (KSR1), was initially identified as a key component in ERK signaling. Induced by epidermal growth factor (EGF), KSR1 translocates to the plasma membrane, where it activates ERK [8,9]. The KSR1 has emerged as a major facilitator of the ERK cascade by binding all three kinases in the pathway (Raf, MEK, and ERK). KSR1 not only binds to these kinases but also regulates their activation. For instance, MEK binding to KSR1 stimulates its binding to Raf, resulting in the allosteric activation of Raf kinase activity towards MEK. Similarly, KSR1 preferentially binds to ERK and directs them to cytosolic substrates [10,11].
Fluorescence imaging technology has enabled a new approach to studying intracellular signal transduction, allowing for analyzing biomolecule behavior in live cells under physiological conditions. Fluorescent biosensors have been remarkably improved in recent years, making them indispensable tools for studying intracellular signal transduction due to their ability to monitor signaling dynamics in real time within living cells [12,13,14]. Fluorescent biosensor imaging techniques such as fluorescence resonance energy transfer (FRET), bimolecular fluorescence complementation (BiFC), and translocation-based biosensors have been developed to analyze the cellular signaling and behavior in live cells [15,16,17]. Although it obtains robust FRET and BiFC signals, these techniques require a tedious optimization procedure to determine the relative locations of fluorophores and binding pairs as well as appropriate linker domains.
Translocation-based biosensors (redistribution approach), a cell-based assay technique utilizing protein movement as the readout, have been applied for studying cellular signaling pathways, protein-protein interactions (PPIs), and other intracellular events [18,19,20]. These methods employ a fluorescent-tagged protein that relocates within the cell upon stimulation. Translocation-based cellular assays are robust, fast, and flexible, with high signal-to-noise ratios and minimal construct optimization requirements, making them ideal for high-content drug screening. Despite these advantages, most reported experimental applications have focused on regulated transport between the cell nucleus and the cytoplasm using nuclear localization, export signals, or both [2,15,21].
Previously, we developed a translocation-based cellular assay to visualize PPI and its inhibition of PPI. The assay relies on the membrane translocation property of protein kinase C (PKC). PKC is well known to translocate from the cytoplasm to the plasma membrane in response to physiological stimuli and exogenous ligands such as phorbol esters (e.g., phorbol 12-myristate 13-acetate (PMA)). The bait protein was fused to PKCδ, allowing both the bait and target proteins to co-translocate from the cytoplasm to the membrane. In contrast, only the bait protein was translocated to the plasma membrane when chemical inhibitors inhibited the bait/target interaction [22,23].
In this study, we expanded the capabilities of our developed translocation-based cellular assay to image intracellular signal transduction. Given its essential role in most RTK functions, the Raf–MEK–ERK signaling cascade was chosen. We initially analyzed the interaction between Raf and MEK, as well as between MEK and ERK. However, we did not observe a direct interaction between MEK and ERK under non-exogenously overexpressed scaffold proteins. To visualize the complete ERK pathway, we introduced the scaffold protein KSR1, known to interact with both MEK and ERK, enabling visualization of the entire pathway.
2. Results and Discussion
A study using a green fluorescent protein (GFP)-tagged PKC revealed that the dynamics of PKC translocation from cytoplasm to the plasma membrane in response to different stimuli can be monitored in real-time in live cells [24]. Most PKC consists of an N-terminal regulatory and C-terminal catalytic (kinase) domain. The regulatory region is divided into an autoinhibitory domain (pseudosubstrate) and typically includes one or two membrane-targeting domains, such as C1 and C2. These domains often bind to diacylglycerol (DAG) and Ca2+, respectively, but their specificities can vary. The novel PKC subfamily (δ, ε, η, θ) has a C1 domain that binds DAG but an impaired C2 domain that does not bind Ca2+. Consequently, this subfamily responds to cellular DAG increases but is insensitive to Ca2+ [25,26]. Therefore, we used a PKCδ fused to bait protein to co-translocate the target protein from the cytoplasm to the plasma membrane [22,23].
Firstly, we imaged the Raf–MEK–ERK signaling cascade in living cells without scaffold proteins. The fusion constructs PKCδ–mRFP–MEK2 and eGFP–Raf1 (or ERK2) were prepared and co-expressed in cells. In the absence of serum stimulation, only MEK protein was translocated to the plasma membrane, whereas neither Raf nor ERK protein co-translocated to the plasma membrane (Figure S1A, B top row). Conversely, in the presence of EGF, a serum stimulus induced the ERK pathway, resulting in the co-translocation of Raf to the plasma membrane (Figure 1 top row and Figure S1A bottom row). However, the ERK protein was not co-translocated to the plasma membrane (Figure 1 bottom row and Figure S1B bottom row). The co-immunoprecipitation assay also confirmed these results (Figure S2). In studies using co-immunoprecipitation (Co-IP) to investigate Raf/MEK interaction [5], C-Raf (Raf1)/MEK interaction required exogenous overexpression. Regarding the B-Raf/MEK interaction, it was found that when MEK was exogenously overexpressed, binding to endogenous B-Raf was observed independent of KSR1. However, under endogenous conditions, binding of MEK to B-Raf was only detected in cells expressing KSR1. Despite exogenous overexpression, we were unable to detect MEK/ERK binding. Consistent with previous studies, this implies that overexpression of scaffold proteins is essential for visualizing the MEK/ERK interaction in this experimental context.
Recently, scaffold proteins have been implicated in the regulation of signaling cascades in mammals. The primary role of scaffold proteins is to assemble proteins essential for specific signal transduction events into close proximity, thereby facilitating their interaction. KSR1 functions as a scaffold protein in the Raf–MEK–ERK signaling cascade, independent of its kinase activity. Thus, it was demonstrated that KSR1 is associated with MEK in quiescent cells, but not with Raf or ERK kinases. KSR1 can bind all kinase members of the ERK pathway, but whereas MEK is associated constitutively, Raf and ERK might bind in a stimulus-dependent manner. Furthermore, Raf and the inactive KSR/MEK complex are localized in a quiescent cell in the cytosolic region. Upon stimulation and Ras activation, Ras activation recruits the Raf to the plasma membrane. The KSR/MEK complex also moves to the membrane, where it interacts with Raf, leading to enhanced MEK activation. Simultaneously, ERKs are recruited to the activated complex, facilitating their phosphorylation and activation (Figure 2) [4,5,6,7,8,9,10,11].
KSR scaffold protein is usually cytoplasmic and constitutively bound to MEK and 14-3-3 protein (Figure 2) [7]. We prepared the PKCδ–mRFP–KSR1 and eGFP–MEK2 (or 14-3-3ζ) fusion constructs and co-expressed them in cells. Figure 3A shows that the KSR scaffold protein binds to MEK and 14-3-3 protein, respectively (Figure S3A, B), and there is no direct interaction between MEK and 14-3-3 protein (Figure 3A bottom row and Figure S3C). Furthermore, the KSR scaffold protein-containing ternary complex, MEK2/KSR1/14-3-3ζ, was co-translocated to the plasma membrane (Figure 3B). We further confirmed that the KSR/MEK protein complex can translocate to the plasma membrane in response to RTK and Ras activation. Additionally, we imaged overexpressed MEK/KSR/14-3-3 cells after EGF treatment. However, we did not observe a change in the subcellular localization of the KSR/MEK protein complex under our experimental condition (Figure S4).
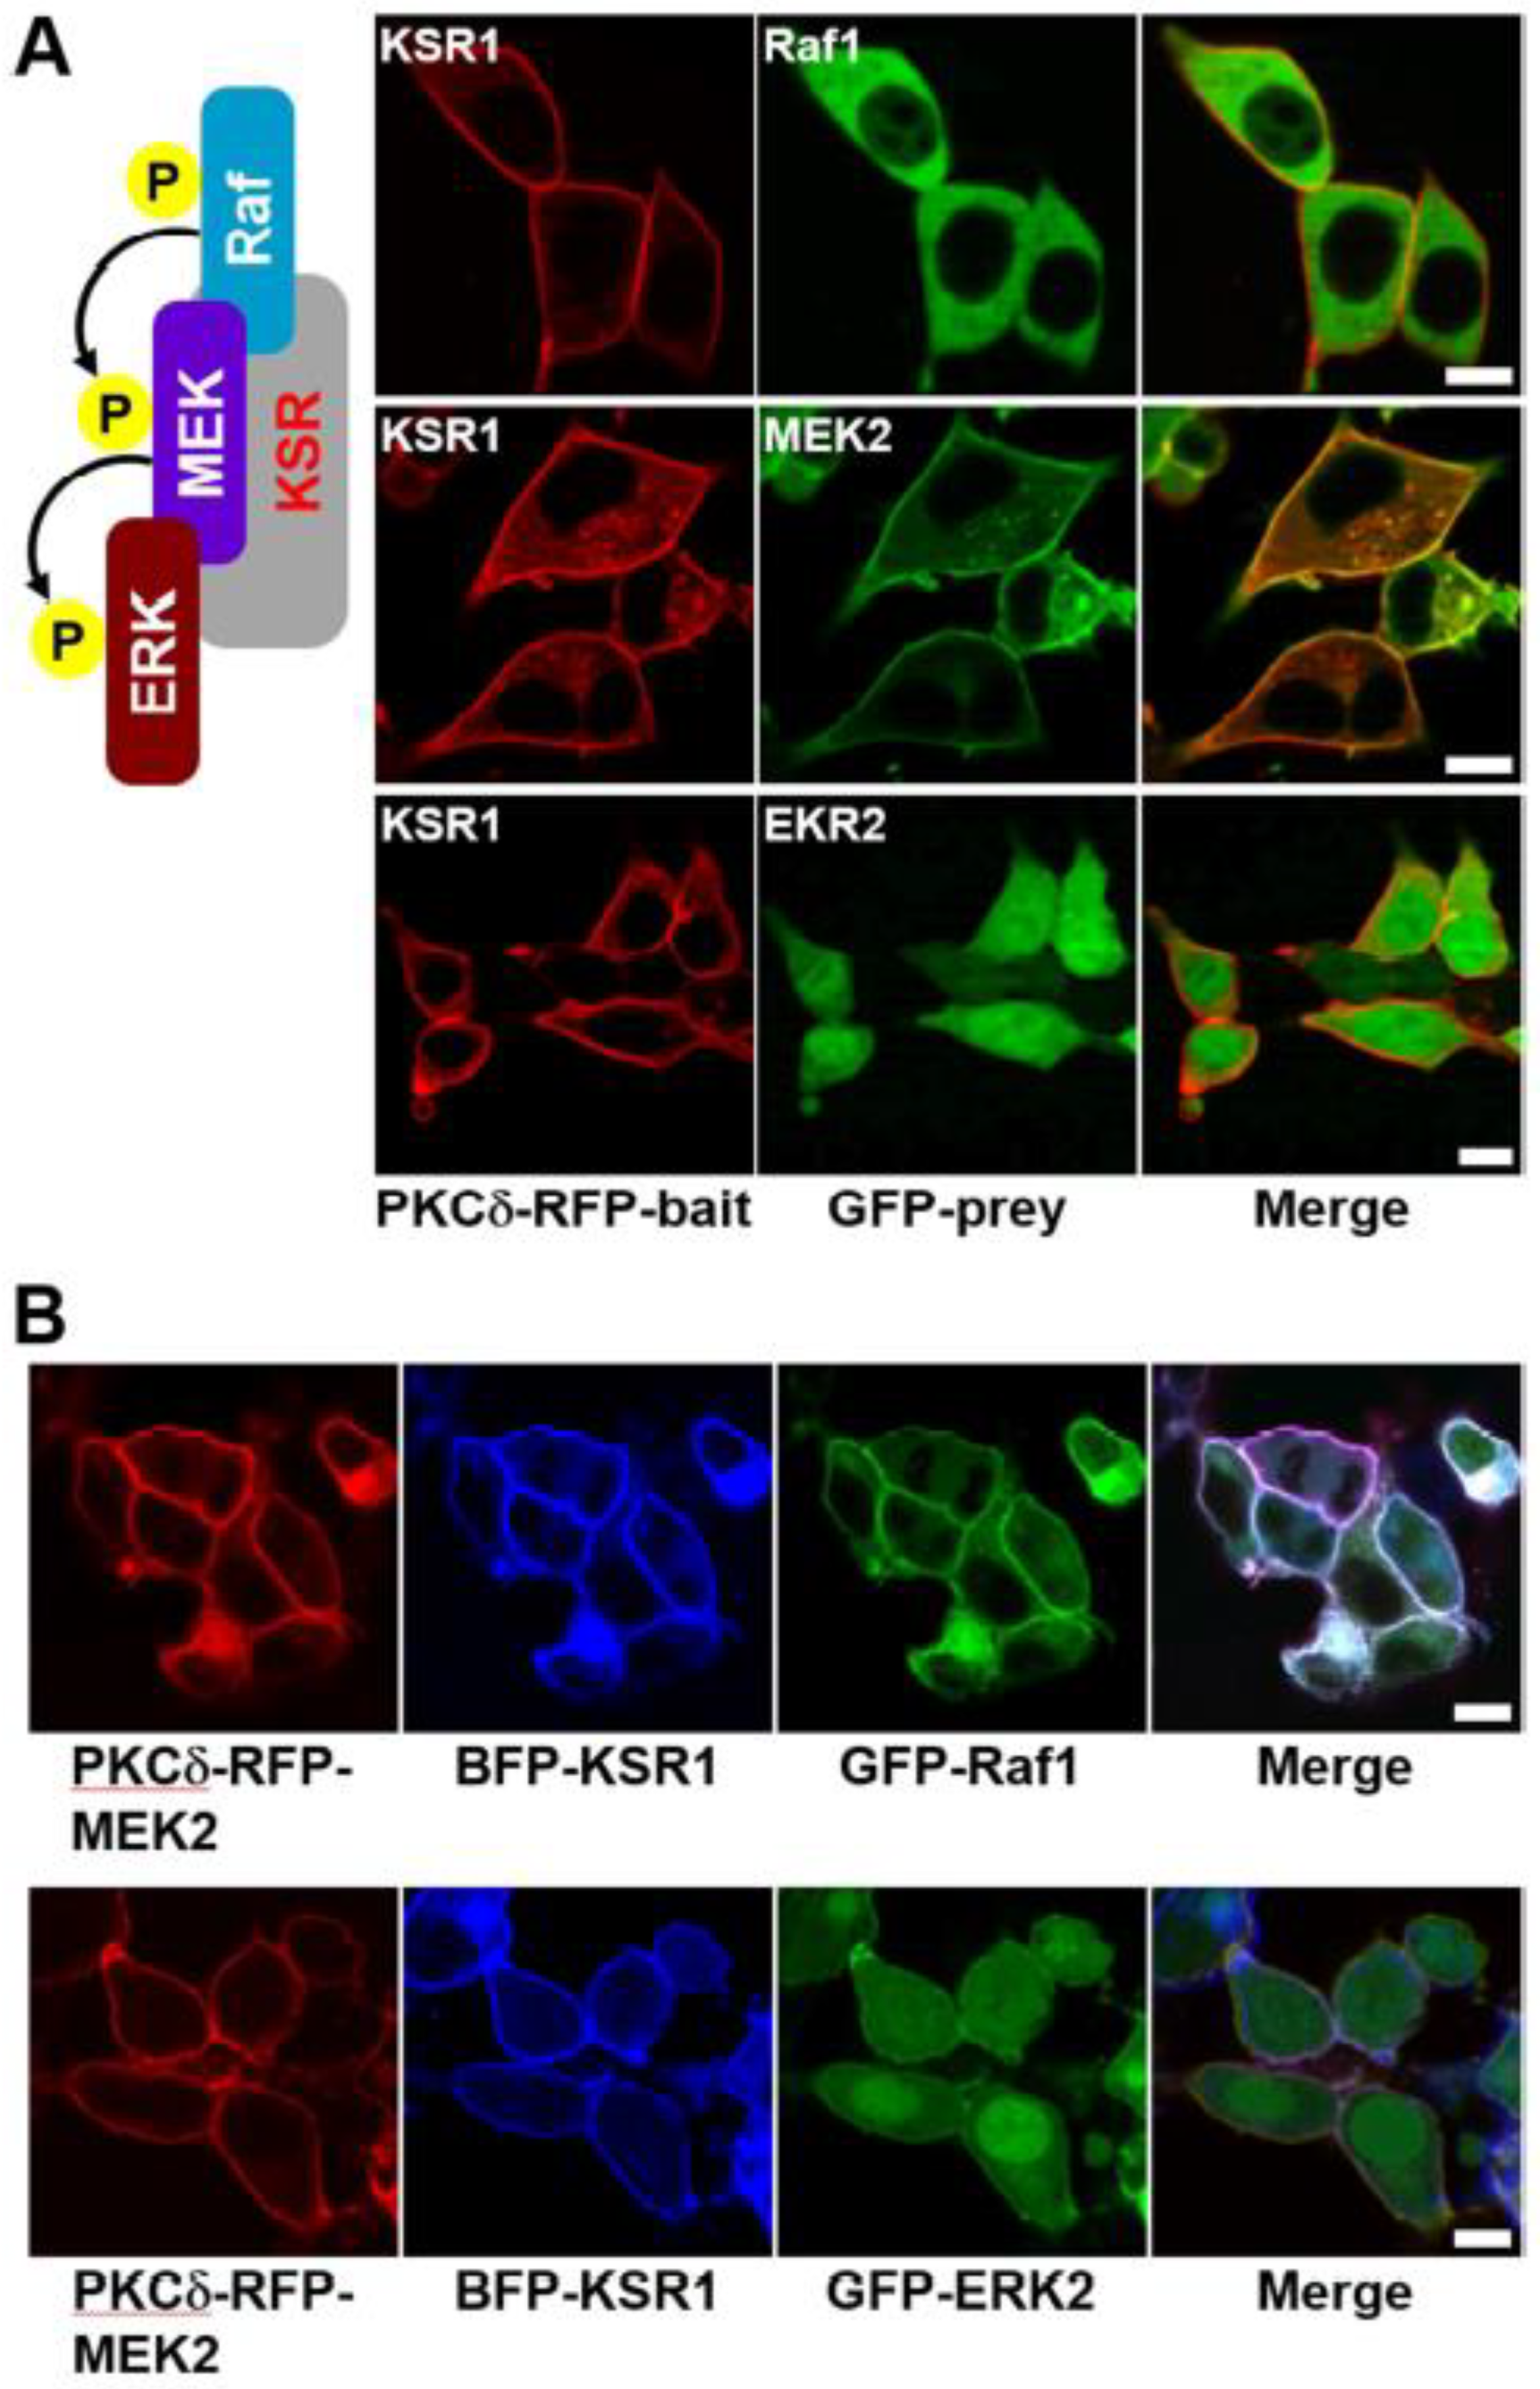
Next, we investigated the role of KSR1 in the Raf–MEK–ERK signaling cascade to determine whether it is required for the observed MEK/ERK interaction in our experimental system. We first imaged the interactions between KSR1 and each of Raf1 and ERK2. No direct interaction was observed between KSR1 and either Raf1 or ERK2 (Figure 4A and Figure S5), but the addition of MEK2 protein facilitated interactions between KSR and both Raf1 and ERK2 (Figure 4B). GST pull-down assays also confirmed these results (Figure S6). Additionally, in the absence of serum stimuli, only the KSR/MEK protein complex was co-translocated to the plasma membrane (Figure S7 second row). Together, these results confirm that KSR1 acts as a scaffold protein, facilitating MEK/ERK interaction and thereby enhancing signal transduction in signaling cells.
3. Materials and Methods
Construction of Bait/Prey Expression Vectors
The wild type genes, PKCδ (BC043350), Raf1 (BC018119), MEK2 (BC018645), ERK2 (M64300), KSR1 (BC167812), and 14-3-3ζ (BC003623) were obtained from Open Biosystems (Thermo Fisher Scientific Inc.), mRFP (DQ903889) was kindly supported by MeDiscove Inc., and was amplified by the polymerase chain reaction (PCR).
To make the pPKCδ-mRFP-C3 plasmid, the eGFP gene was removed from the peGFP-C3 (Clontech Inc.). The PCR-amplified mRFP gene was then inserted into the modified vector using AgeI and BglII restriction sites. Subsequently, the PCR-amplified PKCδ gene was cloned into pmRFP-C3 using NheI and AgeI restriction sites, as previously reported [22]. Finally, PKCδ–mRFP–bait (MEK2 and KSR1) expression vectors were constructed using a pPKC-mRFP-C3. The eGFP–prey expression vectors, each of the PCR-amplified Raf1, MEK2, ERK2, and 14-3-3ζ genes were cloned into either peGFP-C3 or peGFP-N1. For the expression vectors of TagBFP–KSR1 and GST–KRS1, the PCR-amplified KSR1 gene was cloned into pTagBFP-N1 (Evrogen) and pEBG (Addgene), respectively.
Co-Expression of the Bait/Prey Protein Pair in Cultured Cells
HEK-293T cells were grown on 25 mm round coverslips (Paul Marienfeld GmbH & Co. KG) in a 6-well culture plate to 50−70% confluence. Transient co-transfection of the desired bait/prey protein pair (Raf1/MEK2, MEK2/ERK2, KSR1/Raf1, KSR1/MEK2, KSR1/ERK2, KSR1/14-3-3ζ, MEK2/KSR1/14-3-3ζ, Raf1/KSR1/MEK2, and MEK2/KSR1/ERK2, etc.) was conducted using a TurboFect (Thermo Fisher Scientific Inc.) according to the manufacturer’s standard protocol.
Confocal Imaging
Transiently co-transfected cells were serum starved for 16–18 h in serum-free DMEM before stimulation with EGF (Invitrogen). The serum-starved cells on round coverslips were mounted on a homemade perfusion chamber, connected to a temperature controller set at 37 oC. The cells were washed with serum-free DMEM (without phenol red) pre-warmed to 37 oC and then treated with 100 ng/ml of EGF for 5 min. Sequential images of the same cell were collected at 10 sec intervals using a laser-scanning confocal microscope (LSM 800, Carl Zeiss) with a C-Apochromat 40X/1.2 water immersion lens at the Korea Basic Science Institute (Ochang). During imaging, PMA (total concentration of PMA in the serum-free medium was 1 μM, PMA was obtained from Sigma-Aldrich) was added to the chamber.
Co-Immunoprecipitation (Co-IP) and GST Pull-Down Assays
For Co-IP, HEK-293T cells were transiently co-transfected with either mRFP–Raf1/eGFP–MEK2 or mRFP–MEK2/eGFP–ERK2. Transiently co-transfected cells were serum starved overnight in serum-free DMEM and then stimulated with 100 ng/mL of EGF for 5 min. Cells were washed once with cold PBS and resuspended in NP-40 lysis buffer for 30 min at 4 oC. Cells were disrupted and centrifuged to remove insoluble debris. Lysates were incubated for 3 h with GFP antibody (Santa Cruz Biotechnology), followed by protein A-Sepharose beads (Cytiva) for 1 h at 4 oC. For GST pull-down, HEK-293T cells were transiently co-transfected with either GST–KSR1/mRFP–Raf1/eGFP–MEK2 or GST–KSR1/mRFP–MEK2/eGFP–ERK2. Transiently co-transfected cells were serum starved overnight and then stimulated with EGF. Cells were washed once with cold PBS and resuspended in NP-40 lysis buffer for 30 min at 4 oC. Cells were disrupted and centrifuged to remove insoluble debris. Lysates were incubated with glutathione Sepharose 4B beads (Cytiva) at 4 oC for 3 h. Immune complexes were washed and analyzed by immunoblotting.
4. Conclusions
In this work, we developed a translocation-based cellular assay to visualize the Raf–MEK–ERK signaling cascade in living cells. This assay enables the co-translocation of specific interacting protein pairs, such as Raf, MEK, and ERK, from the cytoplasm to the plasma membrane in response to an exogenous stimulus, with the scaffold protein KSR1 regulating cascade activation. We successfully visualized direct Raf1/MEK2 interaction and KSR1-containing ternary complexes (Figure 1A and Figure 4B). Moreover, the interaction of MEK/ERK was dependent on the exogenous expression of KSR1(Figure 4B). We are confident that this method would serve as a valuable platform for the image analysis of signaling cascades within living systems. We are currently exploring other pathways.
Supplementary Materials
The following supporting information can be downloaded at the website of this paper posted on Preprints.org, Figure S1–S7.
Author Contributions
Conceptualization, Z.-W.L. and K.-B.L.; investigation / experimental part, Y.-C.S, M.C. and J.M.H.; writing—original draft preparation, Y.-C.S, M.C. and J.M.H.; writing—review and editing, K.M., H.-S.K., H.-A.S., Z.-W.L. and K.-B.L.; funding acquisition, K.M. and K.-B.L. All authors have read and agreed to the published version of the manuscript.
Funding
This research was supported by the Bio & Medical Technology Development Program of the National Research Foundation (NRF) funded by the Korean Government (MSIT) (NRF-2022M3H9A2096197) to K.-B.L. This work was also supported by the Institute for Basic Science (IBS-R022-D1) to K.M.
Institutional Review Board Statement
Not applicable.
Informed Consent Statement
Not applicable.
Data Availability Statement
Data are contained within the article and supplementary materials.
Conflicts of Interest
The authors declare no conflicts of interest.
References
- Zhang, W.; Liu, H.T. MAPK signal pathways in the regulation of cell proliferation in mammalian cells. Cell Res. 2002, 12, 9–18. [CrossRef]
- Ma, M.; Bordignon P.; Dotto, G.P.; Pelet, S. Visualizing cellular heterogeneity by quantifying the dynamics of MAPK activity in live mammalian cells with synthetic fluorescent biosensors. Heliyon 2020, 6, e05574. [CrossRef]
- Ullah, R.; Yiu, Q.; Snell, A.H.; Wan, L. RAF–MEK–ERK pathway in cancer evolution and treatment. Semin. Cancer Biol. 2022, 85, 123–154. [CrossRef]
- Martin-Vega, A.; Cobb, M.H. Navigation the ERK1/2 MAPK cascade. Biomolecules 2023, 13, 1555.
- McKay, M.M.; Ritt, D.A.; Morrison, D.K. Signaling dynamics of the KSR1 scaffold complex. Proc. Natl. Acad. Sci. U.S.A. 2009, 106, 11022–11027. [CrossRef]
- Meister, M.; Tomasovic, A.; Banninb, A.; Tikkanen, R. Mitogen-activated protein (MAP) kinase scaffolding proteins: a recount. Int. J. Mol. Sci. 2013, 14, 4854–4884. [CrossRef]
- Kolch, W. Coordination ERK/MAPK signaling through scaffolds and inhibitors. Nat. Rev. Mol. Cell Biol. 2005, 6, 827–837. [CrossRef]
- Parvathaneni, S.; Li, Z.; Sacks, D.B. Calmodulin influences MAPK signaling by binding KSR1. J. Biol. Chem. 2021, 296, 100577. [CrossRef]
- Shaul, Y.D.; Seger, R. The MEK/ERK cascade: From signaling specificity to diverse functions. Biochim. Biophys. Acta 2007, 1773, 1213–1226. [CrossRef]
- Liu, Z.; Krstic, A.; Neve, A.; Casalou, C.; Rauch, N.; Wynne, K.; Cassidy, H.; McCann, A.; Kavanagh, E.; McCann, B.; Blanco, A.; Rauch, J.; Kolch, W. Kinase suppressor of RAS 1 (KSR1) maintains the transformed phenotype of BRAFV600E mutant human melanoma cells. Int. J. Mol. Sci. 2023, 24, 11821. [CrossRef]
- Maloney, R.C.; Zhang, M.; Liu, Y.; Jang, H.; Nussinov, R. The mechanism of activation of MEK1 by B–Raf and KSR1. Cell. Mol. Life Sci. 2022, 79, 281. [CrossRef]
- Lyons, A.C.; Mehta, S.; Zhang, J. Fluorescent biosensors illuminate the spatial regulation of cell signaling across scales. Biochem. J. 2023, 480, 1693–1717. [CrossRef]
- Newman, R.H.; Fosbrink, M.D.; Zhang, J. Genetically encodable fluorescent biosensors for tracking signaling dynamics in living cells. Chem. Rev. 2011, 111, 3614–3666. [CrossRef]
- Tomida, T. Visualization of the spatial and temporal dynamics of MAPK signaling using fluorescence imaging techniques. J. Physiol. Sci. 2015, 65, 37–49. [CrossRef]
- Peterson, A.F.; Ingram K, Huang, E.J.; Parksong, J.; McKenney, C.; Bever, G.S.; Regot, S. Systematic analysis of the MAPK signaling network reveals MAP3K-driven control of cell fate. Cell Syst. 2022, 13, 885–894. [CrossRef]
- Weeks, R.; Mehta, S.; Zhang, J. Genetically encodable biosensors for Ras activity. RSC Chem. Biol. 2024, 5, 312–320. [CrossRef]
- Zaver, S.A.; Johnson, C.J.; Berndt, A.; Simpson, C.L. Live imaging with genetically encoded physiological sensors and optogenetic tools. J. Invest. Dermatol. 2023, 143, 353–361. [CrossRef]
- Heydorn, A.; Lundholt, B.K.; Praestegaard, M.; Pagliaro, L. Protein translocation assays: key tools for accessing new biological information with high-throughput microscopy. Methods Enaymol. 2006, 414, 513–530.
- Piljić, A.; Schultz, C. Analysis of protein complex hierarchy in living cells. ACS Chem. Biol. 2008, 3, 749–755. [CrossRef]
- Mentrup, T.; Häsler, R.; Fluhrer, R.; Saftig, P.; Schröder, B. A cell-based assay reveals nuclear translocation of intracellular domains released by SPPL proteases. Traffic 2015, 16, 871–892. [CrossRef]
- Jain, R.; Saini D.K. Imaging cellular signalling: many ‘moving tales’ in MAP kinase odyssey. Curr. Sci. 2013, 105, 1512–1523.
- Lee, K.B.; Hwang, J.M.; Choi, I.S.; Rho, J.; Choi, J.S.; Kim, G.H.; Kim, S.I.; Kim, S.; Lee, Z.W. Direct monitoring of the inhibition of protein-protein interaction in cells by translocation of PKCδ fusion proteins. Angew. Chem. Int. Ed. 2011, 50, 1314–1317.
- Hwang, J.M.; Lee, K.B.; Choi, J.S.; Rho, J.; Kim, G.H.; Kim, S.I.; Kim, S.; Lee, Z.W. Novel technology for protein-protein interaction-based targeted drug discovery. J. Anal. Sci. Technol. 2011, 2, A61–A65. [CrossRef]
- Wang, Q.J.; Bhattacharyya, D.; Garfield, S.; Nacro, K.; Marquez, V.E.; Blumberg, P.M. Differential localization of protein kinase C δ by phorbol esters and related compounds using a fusion protein with green fluorescent protein. J. Biol. Chem. 1999, 274, 37233–37239. [CrossRef]
- Lim, P.S.; Sutton, C.R.; Rao, S. Protein kinase C in the immune system: from signalling to chromatin regulation. Immunology 2015, 146, 508–522. [CrossRef]
- Kawano, T.; Inokuchi, J.; Eto, M.; Murata, M.; Kang, J.H. Protein kinase C (PKC) isozymes as diagnostic and prognostic biomarkers and therapeutic targets for cancer. Cancers 2022, 14, 5425. [CrossRef]
Figure 1.
Confocal images of the Raf–MEK–ERK signaling cascade in living cells without exogenous expression of scaffold proteins. HEK-293T cells were co-transfected with PKCδ–mRFP–MEK2 (bait) and either eGFP–Raf1 or eGFP–ERK2 (prey). Transiently co-transfected cells were serum starved for 16-18 h in serum-free DMEM before stimulation with EGF. After induction with 100 ng/mL of EGF for 5 min, cells were treated with PMA (final concentration 1 μM) in serum-free DMEM. Raf1 was co-translocated with MEK2 to the plasma membrane due to the translocation property of PKCδ (top row), whereas only ERK2 protein from the MEK2/ERK2 pair was translocated to the plasma membrane (bottom row). The scale bar is 10 μm.
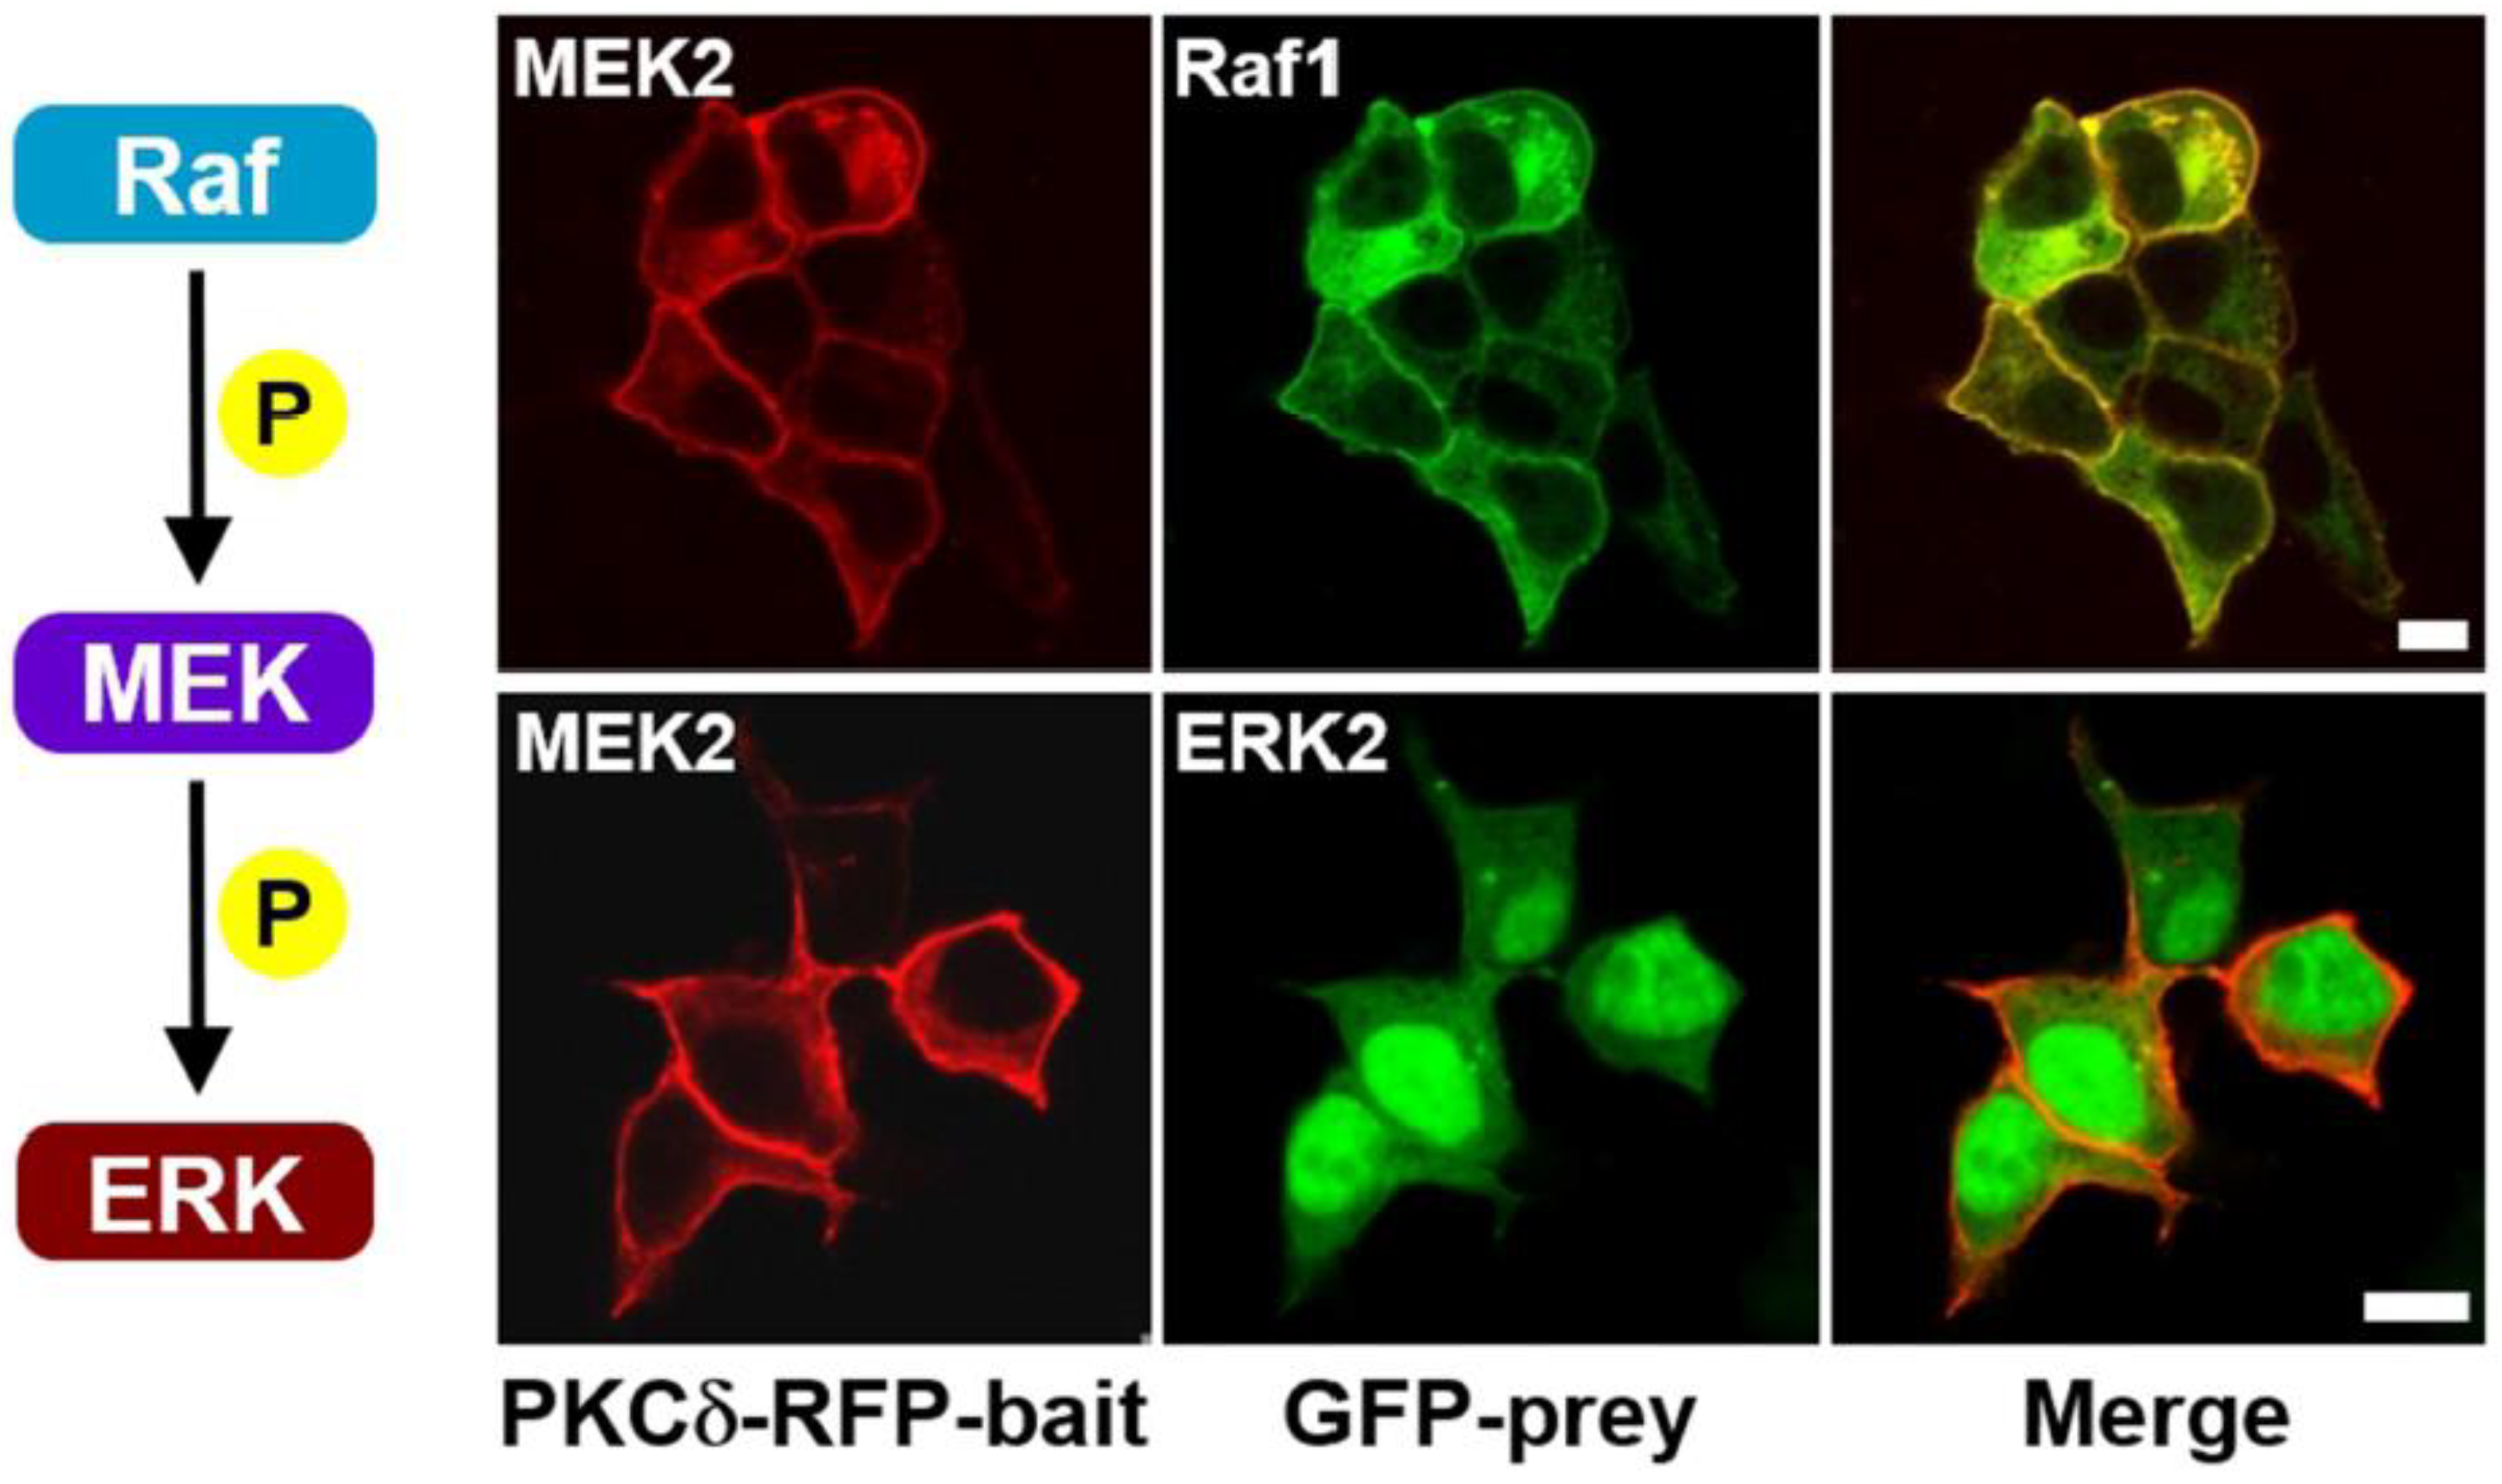
Figure 2.
A schematic representation of the Raf–MEK–ERK signaling cascade with the KSR scaffold protein in cells. In quiescent cells, the KSR scaffold protein is typically cytoplasmic and constitutively bound to MEK and 14-3-3. Upon receptor tyrosine kinase (RTK) stimulation, signaling cells initially utilize KSR to potentiate signal transmission from Raf to MEK by facilitating the Raf/MEK interaction. Subsequently, KSR attenuates signaling by docking activated ERK. Overall, KSR regulates the intensity and duration of Raf–MEK–ERK signaling cascade activation.

Figure 3.
Confocal images of the KSR1/MEK2/14-3-3ζ ternary protein complex in quiescent cells. (A) HEK-293T cells were transiently co-transfected with the following protein pairs: PKCδ–mRFP–KSR1/eGFP–MEK2, PKCδ–mRFP–KSR1/eGFP–14-3-3ζ, and PKCδ–mRFP–MEK2/eGFP–14-3-3ζ. After PMA treatment resulted in co-translocation of KSR1 and MEK2 to the plasma membrane, with evidence of constitutive interaction between them (top row); co-translocation of KSR1 and 14-3-3ζ to the plasma membrane, with their interaction (middle row); and translocation of MEK2 alone to the plasma membrane, with no interaction with 14-3-3ζ (bottom row). (B) HEK-293T cells were transiently co-transfected with PKCδ–mRFP–MEK2, TagBFP–KSR1, and eGFP–14-3-3ζ. The ternary protein complex, MEK2/KSR1/14-3-3ζ, was co-translocated to the plasma membrane after PMA treatment. The scale bar is 10 μm.
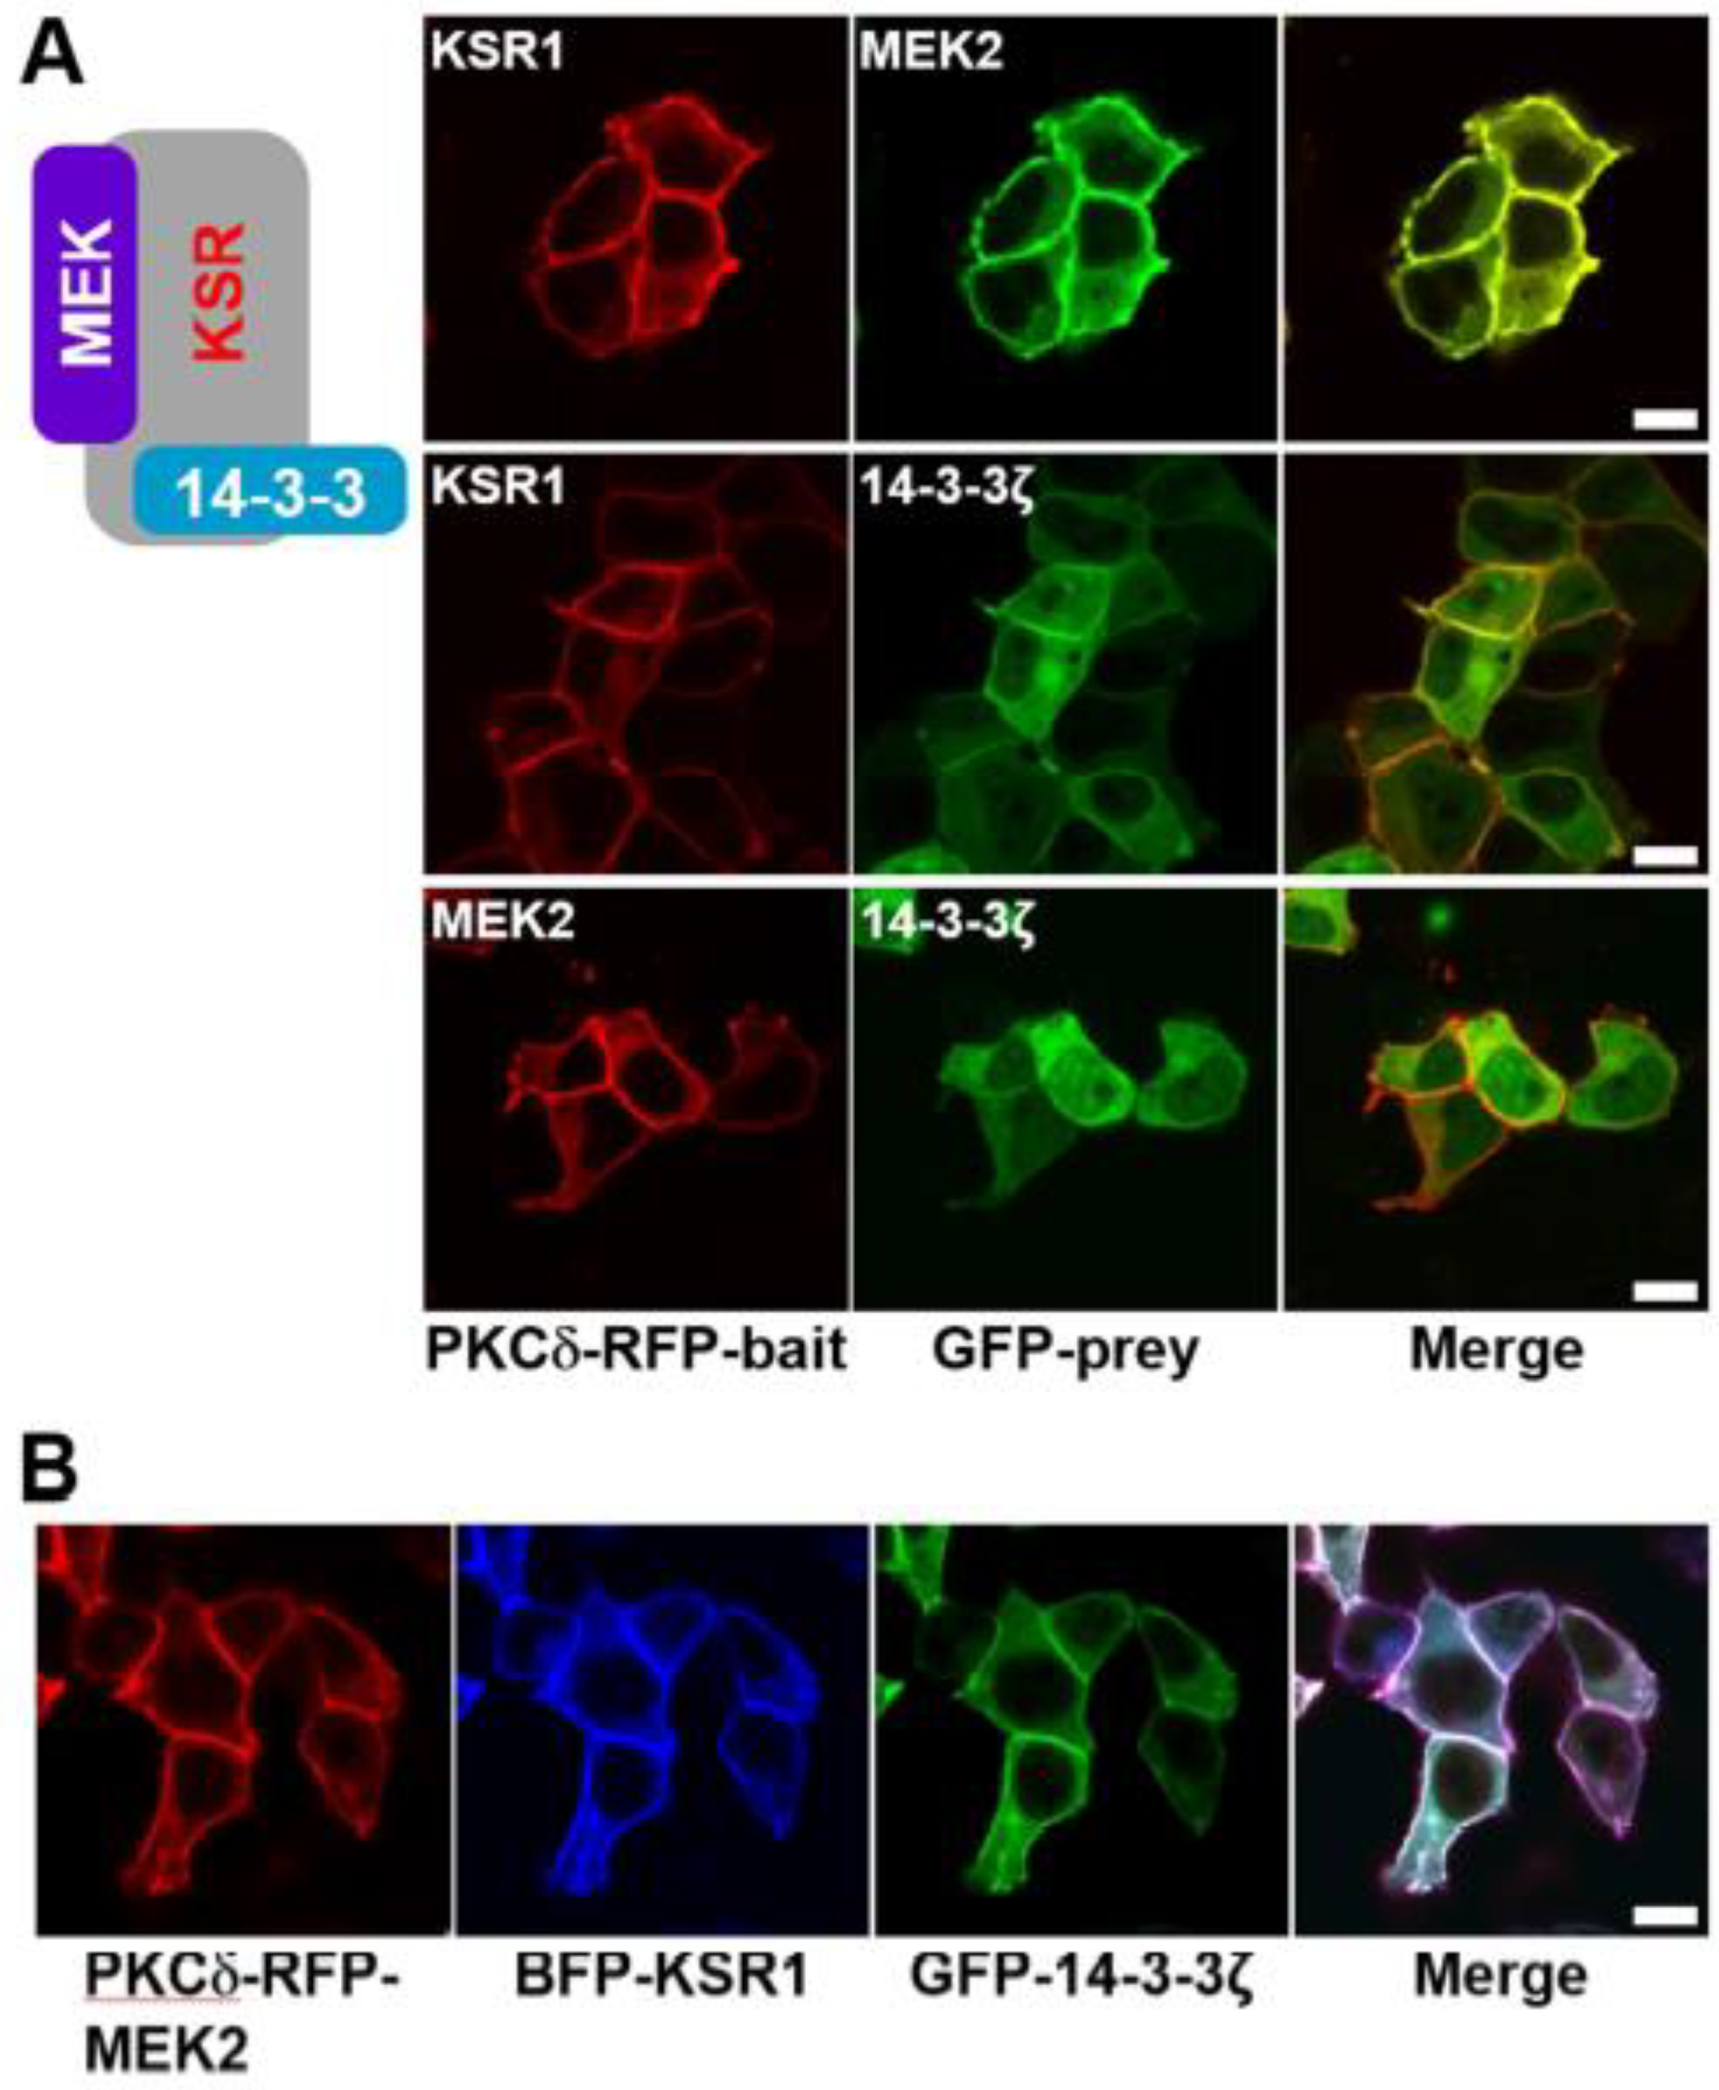
Figure 4.
Confocal images of the Raf–MEK–ERK signaling cascade in living cells with exogenous expression of KSR1 scaffold protein. (A) HEK-293T cells were transiently co-transfected with PKCδ–mRFP–KSR1 and each of eGFP–Raf1, eGFP–MEK2, and eGFP–ERK2. The cells were then serum starved, stimulated with EGF, and treated with PMA. KSR1 translocation to the plasma membrane was observed, with or without interaction with Raf1, MEK2, or ERK2 as indicated (top, middle, and bottom rows, respectively). (B) HEK-293T cells were transiently co-transfected with either PKCδ–mRFP–MEK2/TagBFP–KSR1/eGFP–Raf1 or PKCδ–mRFP–MEK2/TagBFP–KSR1/eGFP–ERK2. The cells were then serum starved, stimulated with EGF, and treated with PMA. The ternary protein complexes, both Raf1/KSR1/MEK2 and MEK2/KSR1/ERK2, were co-translocated to the plasma membrane. The scale bar is 10 μm.
Disclaimer/Publisher’s Note: The statements, opinions and data contained in all publications are solely those of the individual author(s) and contributor(s) and not of MDPI and/or the editor(s). MDPI and/or the editor(s) disclaim responsibility for any injury to people or property resulting from any ideas, methods, instructions or products referred to in the content. |
© 2024 by the authors. Licensee MDPI, Basel, Switzerland. This article is an open access article distributed under the terms and conditions of the Creative Commons Attribution (CC BY) license (http://creativecommons.org/licenses/by/4.0/).
Copyright: This open access article is published under a Creative Commons CC BY 4.0 license, which permit the free download, distribution, and reuse, provided that the author and preprint are cited in any reuse.


