
Submitted:
02 October 2024
Posted:
09 October 2024
You are already at the latest version
Abstract
Cells compartmentalize biochemical processes taking advantage of physical barriers in the form of membranes. Eukaryotes have a wide diversity of membrane-based compartments that can be used in this context, with the main ones being the extracellular membrane, which separates the inside from the outside of the cell, and the nuclear membrane, that separates the nucleus from the cytoplasm. The nuclear membrane not only isolates and protects the DNA and the transcription and replication processes from the other processes that are taking place in the cytoplasm, but also has an active role in the regulation of cellular signaling. The TGF-ß pathway is one of the most important and conserved signaling cascades, and it takes advantage of compartmentalization using a well-tuned balance between import and export rates of active and inactive forms of key proteins. Thus, compartmentalization serves as an additional regulatory mechanism, physically isolating transcription factors from their targets, influencing the dynamics and strength of signal transduction. his contribution focuses on this biophysical layer of regulation. It begins with an in-depth review of the TGF-ß pathway and the main regulatory processes underlying this compartmentalization mechanism. Next, we focus on several contributions that study how this compartmentalization shapes the dynamics and ultimately the cell response, and how this separation can be used as readout of several cellular responses. Finally, we introduce a simplified mathematical approach to study this process derived using a generalized formulation.
Keywords:
signaling pathway
; mathematica modeling
The development and organization of multicellular organisms are mainly regulated by intercellular communication in the form of signaling molecules [1]. These molecules trigger intracellular events that are processed by the cell in the form of signaling pathways that ultimately lead to changes in the expression, regulation, and dynamics of proteins. Most of these regulatory events are biochemical in nature, e.g., reversible covalent addition of a phosphate group (phosphorylation), sugar molecules (glycosylation), ubiquitin proteins (ubiquitination), acetyl groups (acetylation), and methyl groups (methylation). These postranslational modifications can alter many aspects of the target proteins: phosphorylation can activate or deactivate enzymes and signaling proteins, acetylation of histones can alter DNA-protein interactions, glycosylation can affect protein folding and stability, methylation can affect the dynamics of protein-protein interactions, and ubiquitination can target a protein for degradation [2].
In addition to these biochemical mechanisms, there are other type of regulatory mechanism that involve physical constraints. One of the most studied is protein compartmentalization, i.e., intracellular proteins can be directed to specific organelles or regions within the cell, such as the nucleus or the cell membrane. In addition to providing and maintaining organization at the cellular level, this physical separation of processes is highly dynamic (proteins can change location due to specific signals) and has a strong biological regulatory impact [3]. For instance, constraining a given enzyme to a specific region results in a localized increase in concentration, enhancing its efficiency. One of the most important cases is the compartmentalization of glucokinase, which can shift location in response to substrate availability [4]. In brief, a fraction of the glucokinase can translocate from the nucleus to the cytoplasm after stimulation, resulting in reduction in its nuclear to cytoplasmic ratio. Another important protein subjected to compartmentalization is Rubisco, a crucial enzyme in photosynthesis and carbon fixation. This compartmentalization has been shown to affect its catalytic efficiency and, in consequence, the overall photosynthetic rate in plants [5]. Interestingly, Compartmentalization is suggested to restrict the conformational variability of the protein, shaping the evolution of all living organisms that harvest energy via photosynthesis [6].
In our lab, we have focused on this concept of compartmentalization in the context of dimensionality reduction [7,8,9,10]. This concept refers to the transition from moving in a three-dimensional space (the cytoplasm) to a two dimensional space when molecules are embedded or associated with the cell membrane [10]. This shift from 3D to 2D movement results in a important change in local concentration, increasing by orders of magnitude the probability of molecular encounters and interactions, and in consequence, the rate of biochemical reactions [9].
This way, the association of a protein or ligand to a receptor in the membrane catalyzes subsequent reactions by restricting the movement of the ligand to the membrane surface, resulting in an effective increase in its local concentration because the volume in which the molecules can move is significantly reduced; this mechanism of action drives the dynamics of activation of erythropoietin (EPO) [10], and it is the basis of our design of drugs that can selectively affect tumor cells versus normal cells [7,8,9].
The bidirectional movement of transcription factors between the nucleus and cytoplasm in eukaryotic cells is a common example of intracellular compartmentalization. This exchange of proteins that are dynamically excluded from the cytoplasm or the nucleus is essential for various cellular functions, including gene expression, signal transduction, and cell cycle regulation. Dysregulation of nuclear translocation has been shown to be directly involved in a variety of pathological conditions, with a critical role in maintaining cellular homeostasis.
One of the most important pathways that take advantage of this nucleocytoplasmic shuttling to modulate signal transduction is the transforming growth factor (TGF-), involved in the regulation of a wide range of signaling functions, from tissue-specific control of development, morphogenesis, cell proliferation and differentiation, tissue homeostasis, regeneration, and even cell-specific or tissue-specific motility [11]. It also has been shown to have a growth-inhibitory effect on epithelial cells, suggesting a tumor suppressor role in carcinomas and cell fate determination [12].
In this review, we focus on the effect of transcription factor compartmentalization in the context of the TGF-, and how this physical regulation is utilized to modulate signal transduction. We start with a review of the main aspects of the pathway, followed by several key studies that investigated how this nucleocytoplasmic translocation shapes the dynamics of the signal. We finalize with an illustration of how mathematical modeling can be applied in the context of protein compartmentalization to study these type of biophysical aspects of biological regulation.
The TGF- Pathway Signaling Dynamics and Regulation
The TGF- signaling pathway takes its name from the main extracellular signal that activates the cascade of downstream events: the human transforming growth factor (TGF-) ligand superfamily. These dimeric polypeptide growth factors involves thirty-three secreted cytokines [13,14], and the different family members have been given various names according to their molecular identification history: TGF-s (three isoforms of TGF-s: TGF-1, TGF-2 and TGF-3), Activins, Bone Morphogenetic Proteins (BMPs), Growth Differentiation Factors (GDFs), Nodal and Müllerian Inhibiting Substance (MIS) [15]. Interestingly, this superfamily of signaling molecules is one of the most conserved throughout the animal kingdom, and it is believed to have originated in the early stages of multicellular evolution [16].
Canonical TGF- signaling starts by the reversible binding of one of these dimeric ligands to two transmembrane receptors (TGFRII). Afetr binidng, these receptor molecules undergo a conformational change that facilitates their interaction with two other transmembrane receptors (TGFRI) [1]. The result is the formation of a heterotetrameric complex composed of two TGFRII and two TGFRI molecules, represented as (TGFRII)-(TGFRI) [17]. Once the receptor complex is formed [18], the type-II receptors phosphorylate and activate the type-I kinase receptor, following endocytosis inside vesicles characterized by the presence of the Smad Anchor for Receptor Activation protein (SARA) on their membrane. Once inside the endosomes, the type-I receptors phosphorylate and activate downstream proteins (Figure 1).
These Smad proteins, which give name to the endosomes, are themselves the main effectors of the signaling events mediated by TGF- ligand stimulation. The Smads are a family of transcription factors (i.e., they bind directly to DNA) highly conserved throughout evolution, and come in three flavours: The first type is R-Smad (receptor-regulated Smads), which includes Smad1, 2, 3, 5, and 8. [16]. The second type is Co-Smad (common mediator Smads) or Smad4, which serves as cofactor of the R-Smads [20,21]. The third type is I-Smads (inhibitory Smads), including Smad6 and 7, that inhibit R-Smads activation by interfering with their phosphorylation by the receptor complexes [20,22].
R-Smads Nucleocytoplasmatic Shuttling as a Modulation of Signal Transduction
As mentioned before, the R-Smads constitute the direct substrates of TGF- family receptors and the key mediators of the TGF- pathway. They serve as key mediators of the TGF- pathway, translating receptor activation into changes in gene expression levels. All R-Smads share a common molecular structure, consisting of two conserved globular domains: N-terminal MH1 (Mad Homology 1), responsible mainly for direct DNA binding, and C-terminal MH2 (Mad Homology 2) domain, responsible mainly for receptor interaction. Both domains are connected by a linker region that is not conserved, but contains multiple phosphorylation sites for various kinases that regulate the function and activation of the different R-Smads. Two main sets of R-Smads can be identified depending on their specific receptor: Smad2 and Smad3 are activated via TGF- and Activin/Nodal [23], while the rest are mainly activated by BMP receptors [16,19,24,25,26].
One of the main characteristics of R-Smads is their ability to translocate from the cytoplasm to the nucleus, depending on their phosphorylation state and organization as monomers or complexes. The sequence of events in this well characterized process, commonly refereed as Smad nucleocytoplasmic shuttling, occurs as follows: (a) Unphosphorilated R-Smads are mainly located in the cytoplasm as monomers,; (b) after activation by the type-I receptor, two R-Smads typically assemble with one Co-Smad in the form of heterotrimers, also known as the activated Smad complex (the complex is stabilized by the phosphorylated serines at the C-terminal); (c) these complexes then translocate into the nucleus where they act as transcription factors [27,28]; (d) These complexes are then dephosphorylated via interaction with PPM1A and other phosphatases [29], and this dephosphorylation has been linked to destabilization of the trimer complex complex [30]; (e) Once dephosphorylated, the complexes disassemble, (f) finally, the monomeric R-Smads and Smad4 are exported separately back to the cytoplasm by distinct mechanisms [30].
The two main processes involved in this shuttling are nuclear import and nuclear export through the nuclear pore complex (NPC), a large protein structure embedded in the nuclear envelope that serves as a gateway for selective transport of molecules between the nucleus and cytoplasm. In brief, the NPCs act as hydrophobic channels [31] that [32] allow proteins smaller than 20–30 kDa to pass by diffusion, While larger proteins require active transport mediated by importin and exportin receptors [33,34,35].
Dynamics and Regulation of Export and Import of the R-Smads
Over the past years, several studies have used this different levels of R-Smad protein in the nucleus or cytoplasm to study the mechanisms that regulate this process [29]. These studies have shown that the import activity of the R-Smad complexes rely on the interaction of importins with the MH1 domain (specifically importin-1 [36], but also importin 7 and 8 [37], in a process that depends on the RanGTP/GDP gradient across the nuclear membrane. On the other hand, it has been proposed that Smad2 can also enter the nuclei via direct interaction of proteins of the NPCs with its MH2 domain [30]. Additionaly, several experimental studies propose that not only multimeric Smads (i.e., as part of complexes) can enter the nuclei, but also monomeric Smads can be imported into the nucleus through a mechanism different than the R-Smad complexes [30].
Regarding nuclear export, it has been proposed that R-Smads monomers exit the nucleus mediated by exportin 4 [16,38,39], but not exporting 1 (the target of Leptomycin B [40]). The export mechanism of the R-Smads has been shown to depend on a Ran-GTPase and Ran-BP3, which recognizes unphosphorylated R-Smad protein resulting from the activity of nuclear R-Smad phosphatases, such as PPM1A [41]. Similarly to the import process, Smad2 has been proposed to be able to also exit the nucleus by direct interaction with the proteins of the NPCs [42,43]. This is consistent with the lack of the Lys-rich KKLKK sequence in its MH1 domain that is critical for nuclear export of Smad3 [44].
As a result of this complex regulation, R-Smads at the cytoplasm are mainly in the form of unphosphorylated monomers, while after activation, they primarily locate inside the nucleus, mostly in the form of complexes. The concentration of R-Smads monomers or complexes in each compartment is determined by the differences in their import and export rates. This way, the higher concentration in the cytoplasm of R-Smads unphosphorylated monomers results from a slower import rate and a faster export rate, compared to the complexes [45]. Each of these rates depends on the ability of R-Smads to interact with NPCs, importins, and exportins in monomer or complex configuration [45,46].
On the other hand, the Smad4 monomer can be found in both the nucleus and the cytoplasm [47] due to similar rates of movement into and out of the nucleus, while when part of a complex, it is mainly located inside the nucleus, following the dynamics dictated by the other components of the complex (R-Smads) [48]. Interestingly. other studies show that inhibition of CRM1 or exportin 1 leads to rapid accumulation of Smad4 in the nucleus, suggesting that also Smad4 is actively translocating [40], therefore the mechanisms of Smad4 translocation and its impact in the translocation of the active complex needs further study.
Taking Advantage of Nucleoplasmatic Shutting to Study the TFG- Pathway
An advantage of these differential R-Smad levels in cellular compartments is that they can be used as simplified readouts of changes in TGF- pathway activation, measurable by microscopy. These type of studies relay on direct visualization of the R-Smads or Co-Smads with fluorescence or photoactivatable fusion proteins [49], or the use of highly reliable and specific antibodies that can be used to measure changes in relative levels and compare this way experimental conditions in fixed sample. For instance, the seminal contribution by the lab of Caroline Hill [46] used FLAG tagged Smad4 and antibodies against Smad2 and Smad3 to shown that inhibition of CRM1-mediated nuclear export results in very fast Smad4 nuclear accumulation, while endogenous Smad2 and Smad3 remained completely unaffected. Another contribution from the same lab [29,50], developed a fusion of Smad2 with GFP to follow in vivo the difference in translocation in unstimulated versus TGF--stimulated cells. This study showed that the nuclear accumulation of the active form of Smad2 is due to a decrease in the rate of nuclear export of the protein, rather than an increase in import [29]. Moreover, it suggests that the import rate of phosphorylated R-Smads (in complex configuration) and unphosphorylated R-Smads (mainly in monomer configuration) is similar, indicating that import proteins act similarly in activated and deactivated states. If this is correct, the import rate of R-Smads as complexes should be twice as fast as the R-Smads as monomers, since each complex is composed of two molecules of R-Smad. On the other hand, the fact that the rate of export of the phoshorylated form of the R-Smads is much smaller than the rate of export when unphosphorilated suggests that maybe the configuration as complexes prevents the binding with exportin 4.
Another important example that utilizes the nucleocytoplasmic shuttling was performed by the Liu lab [51], where they study how variable dose levels of ligand are translated into intracellular signaling dynamics, and how continuous ligand doses can be translated into discontinuous cellular fate decisions. In this study, They show that the pathway processes continuous and pulsating TGF- ligand levels differently, displaying varied sensitivities to short and long pulses, also showing that it displays different sensitivities in response to short and long pulses of ligand. These two types of dynamic responses may be crucial for the role of the TGF- pathway in mediating stem cell differentiation.
The differential concentration of R-Smads as a readout is also used [52] to study the temporal signals by the TGF- pathway and its implications for embryonic patterning. This time, authors take advantage of the nuclear accumulation dynamics of a GFP-Smad4 fusion protein to measure TGF- pathway activity in response to different types of ligand stimulation. The same fusion protein was used to show pulsatile behaviors in Smad4 nuclear localization [48]. Similarly, quantitative measurements of Smad2/3 nuclear localization have illustrated that the TGF- pathway exhibits fold-change detection properties [53], i.e., cells respond to relative rather than absolute levels of TGF-. In other context, the accumulation of the R-Smads in the nucleus was the main readout to study the crosstalk between oncogenic Ras and TGF- signaling [54], since Ras activation inhibits the TGF--induced nuclear accumulation of Smad2 and Smad3.
In our lab, we have studied how different R-Smad accumulations influence the role of the TGF- signaling cascade in vertebrate spinal cord formation [55,56]. In these studies, In this way, we quantified changes in the nuclear localization of the two R-Smads to explore the effects of the interplay between Smad2 and Smad3. We showed that the heterotrimers Smad2-Smad3-Smad4 induce cooperation and antagonism in the activation of the targets of the two R-Smads and that this dual role strongly influences the balance between neural stem cell proliferation and differentiation [55]. Using immunofluorescence and confocal imaging, we visualized and quantified R-Smad expression patterns at different developmental stages, showing pathway activation (i.e., R-Smads become more nuclear) in the transition zone (where stem cells cycle and perform interkinetic nuclear migration) and the differentiated zone (where differentiated neurons migrate after exiting the cell cycle). The study was complemented by numerical simulations, which allowed us to interpret the dual antagonism and cooperativity arising from heterotrimer assembly [55].
Mathematical Modeling of Regulatory Compartmentalization
Mathematical modeling in molecular biology is a complementary approach to the more time consuming and expensive experimental approach, that can help explain results, make predictions and test hypotheses that will complement experimental studies. In the context of the TFG- signaling, several key contributions have combined modeling approaches with experimental results to try to understand different aspects of the regulation of compartmentalization as a physical regulation of gene expression [51,55,57].
One of the earliest approaches to studying the TFG- pathway dynamics using numerical simulations focused on the dynamics in experimets of fluorescent recovery after photobleaching (FRAP) [57]. Their results support the hypothesis that there is a dynamic maintenance of Smad nuclear accumulation during signaling [57]. In another study, the authors develop a model that shows how cells can integrate repeated pulses and maintain the phosphorylated Smad2 concentration [51]. Their main conclusion derived from teh model is that the pathway is able to respond with different sensitivity to different ligand doses and time scales [51].
One main caveat of these early approaches is that the models used are composed of around 20 ordinary differential equations to make the predictions, making them very difficult to interpret. More recent examples have opted for more simplified mathematical formulations, for instance using the “pseudo-steady-state” approximation, or “rapid equilibrium assumption” to reduce the network signalling reactions based on an analysis of the different time scales of the individual reactions [58]. This model predicted a critical role of potential positive and delayed negative feedback loops on the regulation of the TGF- signalling system.
In line with simplified models, composed of the minimal set of equations required for explaining experimental observations, we developed a mathematical model based on differential equations to support the hypothesis that the heterotrimer Smad2-Smad3-Smad4 was being formed during vertebrate neurogenesis and that its formation could explain the fact that Smad2 and Smad3 antagonize in some targets, while cooperate in activating transcription of others [55]. The model prediction was then validated using immunoprecipitation [55].
In this section, we propose in the same philosophy of simple modeling approaches, a very simple yet powerful mathematical approach to study the dynamics of this nucleocytoplasmic shuttling. The model is designed with ordinary differential equations derived using the mass action law, and is used to reproduce the dynamics of a R-Smad protein in and out of the nuclei. From this simplified system, it is easy to study the main mechanisms and parameters that affect this dynamic equilibrium without needing to perform complicated calculations or simulations.
To build the model, let’s consider a R-Smad protein inside of a cell, that can enter and exit the nucleus. These two potential states of the R-smad protein will be represented in the model as C (for cytoplasmic) and N (for nuclear). Based on the molecular details of the process reviewed above, we know that the processes crossing the NPCs are actively mediated by interaction with other proteins, that we will call (for import) and (for export). This way, to enter into the nucleus, a cytoplasmic molecule C must be linked to the import enzyme , and form a complex . This complex, is then allowed to enter the nucleus. Once in the nucleus, the complex gets disassembled into one molecule N (since now the R-Smad molecule is inside the nucleus) and the enzyme.
Similarly, the export process follows the same rationale: the nuclear molecule N binds to export enzyme , forming the complex. This complex is now able to cross the NPCs and translocate to the cytoplasm. Once in the cytoplasm, the complex is disassembled, giving one C (our molecule is now in cytoplasmic configuration again) and the enzyme . The rates of the nuclear import and export processes for , and complexes are , , respectively. The formation rates of and are and , respectively. We will include in the model the fact that the complex formation is a reversible process, which means that the complex can spontaneously disassemble before crossing the NPCs. Dissociation rates of and are labeled as and , respectively. On the other hand, the dissociation of each complex once it crosses the NPCs is considered to be instantaneous, while and transport enzymes can translocate freely between the nucleus and cytoplasm (they are not limiting reagents) [59,60]. The whole system of interactions can be illustrated using a chemical reaction formalism as:
The scheme of the interaction is illustrated in Figure 2.
Using the Mass Action Law to Model a Biological System
To translate this system of interactions into differential equations, we will use the the mass action law formalism, a fundamental principle in the mathematical modeling of chemical and biological systems. In brief, the law of mass actions states that the rate of change of a species involved in a chemical interaction with other species is directly proportional to the product of the masses of the reactants, each raised to a power equal to the coefficient used in the chemical equation. Initially proposed for chemical systems by Cato Guldberg and Peter Waage in 1864 [61] based on previus work by Claude Louis Berthollet [62], and further clarified by Jacobus van ’t Hoff in 1877 [63], it also provides a simplified yet effective framework for quantifying biological interactions.
To illustrate the process of using the mass action to derive differential equations, let’s consider first a general system in which several n species interact with each other by means of a set of m chemical reactions, with rate constants . The concentration of the species is expressed as . We start with the definition of a column vector that contains the concentrations of all species at a given time point. This vector is labeled as the state vector.
Next, we define a square matrix of () that contains all the rate constants in its diagonal. This matrix K is as follows:
Next, we define two matrices A and B, that contain the stochiometric coefficients of reactants and products, respectively. In this matrices value of the element is the stochiometric coefficient of the species j as reactant in reaction i, while the value of the element is the stochiometric coefficient of the species j as a product in reaction i (in the sub indices notation, i and j denote rows and columns, respectively). If any of these coefficients does not appear in the reactions, then it is set to zero. For example, in the system:
the species concentration vector and the rate constants matrices are:
and, since and do not appear as reactants in reaction 1, we set . In a similar manners, since and do not appear as reactants in reaction 2, we set . The same rationale is applied to construct matrix B, giving the following stoichiometric matrices:
Finally, we define a column vector of m rows, that contains in each row the product of all the species raised to the power of the corresponding A matrix coefficient. This way the i-th row of this vector can be calculated as:
As an example, this vector for the previous reaction can be calculated as:
With all these definitions, the mass action law states that the temporal evolution of the concentration of the species is given by:
where the elements of the , which is a matrix, are given by
Now, let’s apply the previous recipe to our system of nuclear translocation. To do that, we first need to separate each reaction as an individual process, in a way that each reversible interaction is equivalent to two irreversible interactions. This way, the system of interactions for import and export can be decompose as the following six coupled processes:
The next step is to apply the mass action law, to obtain six ordinary differential equations (ODEs, one for each species in the system) that will show the temporary evolution of the concentration of the species once solved. We have 6 reactions and 6 species, therefore we first define the state vector as:
containing the concentration of the species and a diagonal matrix K containing the rates of the reactions (in the order shown above):
Considering the order of the reactions in K and the order of the species as they appear in , we can define matrices A and B as:
Now, we compute the vector for this systems as:
Next, we calculate the transpose matrix of , which is denoted as :
Finally, to obtain the ODE system we use the mass action law in Equation 2, yielding to:
The numerical solution of this set of ODEs, starting from a given initial species concentration and parameter values (e.g., rate constants for each reaction), provides the temporal evolution of the concentration of all involved species. One important point to take into account is the units of the rate constants: if the time is measured in seconds (s) and the concentrations in mol/L (molar, M), each equation will provide the speed of change of the reactants in units of . therefore, for the equations to be consistent in terms of dimensions, the units of rate constants , , and have to be in s-1 (firts order reactions), while whereas and are measured in (M·s)-1 (second order reactions).
Figure 3A-C illustrates three different numerical solutions of the system, for a similar set of initial conditions, but using the parameter values listed as sets 1, 2 and 3 in Table 1, respectively. In all cases, the concentrations of the species change during the first seconds until they reach a steady state. Both and decrease while and increase (complexes are forming). The enzymes and also decrease as well due to complex formation. Due to the different parameter values used, three different steady states are reached: in Figure 3A the final concentration of in the equilibrium is larger than the concentration of of , meaning that most protein is located at the cytoplasm for this values of the rate constants. The opposite scenario is shown in Figure 3C, where now the nuclear concentration is higher. Figure 3B corresponds to a intermediate situation, where parameters have been tuned to obtain an equilibrium condition where the concentration in the nucleus and in the cytoplasm is similar equivalent (case B) or smaller (case C). If we imagine an hypothetical situation where our molecule can me seen using immunofluorescence or by direct fusion with a fluorescence protein, case (A) would correspond to a cell that is brighter in the cytoplasm, case (C) would correspond to a cell with a brighter nuclei, and case (B) would correspond to a cell with homogeneous brightness. Note that the different cases were obtained by varying only the values of and , meaning that efficiency of the nuclear import and export processes ultimately controls the balance between nuclear and cytoplasmic configuration.
Simplifying the ODEs System Using the Mass Conservation Law
To obtain simplifications and relations in the resulting ODEs system, it is often very useful to use the mass conservation law [64], stated by Antoine Lavoisier in 1789 [65]. Let’s define a row matrix C of length n. This vector contains n constants that will give the relationships between the concentrations of the species at any time. To obtain those relations, we have to use the following linear system:
We will get a set of n linear equations with n unknown variables. Using these equations, we must find the non-trivial relationship between all the coefficients. For example, if the system we get is
so, we have a relation between the coefficients of and as = . Also there is a relation between the coefficients of and as = -. Given this values, the conservation law states that for a closed system, the following relation between the amounts of the reacts is always true:
This way, if we substitute the relations obtained using equation 4 for the values of the coefficients , the Equation 8 can be used to simplify the system of equations that describe a given system of interactions. To illustrate this with the previous example:
using the relations calculated above becomes
This is true for all values of and . So, if we set and we obtain the following the relation
while if we set and we obtain the following the relation
Now, it is important to realize that if this relation between the amounts of the species involved in Equations 9-10 is true at all times, it means that it is also true at the initial time point (t=0). This is useful because we normally know the initial conditions of the system. This way, we can write:
which can be used to calculate one of the variables as a function of the other, plus or minus some constant values that are known. This way:
Going back to our nuclear translocation model, in the previous step we dealt with a system composed of six ODEs. In these these type of systems, some equations are redundant or the dynamics of change is too fast or too slow. In this conditions, simplification of the system is a good way to produce a more transparent and easier to interpret set of equations, with less free parameters. In this case, we will start by applying the mass conservation law to reduce the number of equations from 6 to 4. We start again by defining a row vector C with six constants (,..., -one per species) and calculate expression 4 for this particular system:
This relation gives us linear system of equations. Removing the independent equations and simplifying, we reach the following equivalences:
The mass conservation law states that the following expression has a constant value over time:
which, after applying the relations between the coefficients above gives us:
So, we have three independent variables, and the previous equation is true for all values of the three. This way, following the same rationale as in the example, we set each one to a value of 1, while the others are set equal to 0. This way we obtain the three constant relations as:
In particular, these relations are true at all time points, therefore they are true at the initial time point. This way, if we set and the constant values as the value at (initial conditions) we obtain
The first relation corresponds to the fact that total amount of Smad in all possible configurations (nuclear, cytoplasmic, alone or in complex) has to remain constant. The second and third relations corresponds to the fact that the total amount of Import and Export proteins has to remain constant. One additional simplification can me introduced, taking into account that at the initial time point, there is no complexes, since we start with all proteins as monomers and monitor their interaction. This way, we can assume , so, the relations result in:
The next step is to calculate the concentrations of some reactants as a function of the other. In this case, since we often focus on the amounts of the R-Smads and not in the amount of Import and Export proteins, it makes sense that we use organize the relations in such a way that we eliminate the variables and :
Finally, we substitute these relations in the system of ODEs, as:
which gives a more simple set of 4 ODEs. Numerical integration of this set will five you the temporal evolution of , and the complexes and . If needed, the temporal evolution of the enzymes can be simply calculated as and . This means that we can calculate the concentration of all six species over time just solving four ODEs instead of the six that we obtained initially. Numerical solution or these four ODEs is shown in Figure 4, for the same parameters and initial conditions as before.
Non-Dimensionalization of the Model
To increase the predictive capability of the model, a common potential approach is to remove the dimensions of the concentrations and the time, expressing both of them as a factor in an appropriate scale for the system of study. In this type of adimensional systems, it is easier to compare parameter values and to interpret the results from the ODEs, since they will show relative changes from a maximum to a minimum value, instead of absolute values.
In order to make the concentrations non-dimensional, we will rewrite the model in terms of new variables with no units. This is achieved by multiplying each equation by a scaling factor (with concentration units), in such a way that now the concentration of the species (dimensional) will now be represented by (adimensional), related via the scaling factor [59]:
The scaling factor for each species is chosen as its maximum value. This way, the non-dimensional species concentration associated will fall between the range . The maximum amount of molecules in the cytoplasm that we can have is , and as one molecule of C can only produce one molecule of N, then the maximum value for the latter is as well (supposing that ). In the case of the enzymes, the maximum concentration for each will be also its initial concentration. For the scaling factor of the complexes and , we cannot use their initial concentration as it is zero. Therefore, we must find which is the maximum concentration that they can reach over time ( and ), which will happen at a particular time point (this value of the time can be different for and ):
Next, these expressions can be furter simplified by making some assumptions. As the dynamics of the complexes are very fast, and are much larger than the other rate constants. Considering that, we can assume that , and therefore:
Then, the new non-dimensional variables are defined as:
Substituting these values in the ODEs system, we obtain the new partially non-dimensional ODEs system:
It is important to highlight that the mass conservation law in this case is different from the dimensional system. Calculations in the case are not shown, but they are analogous to those in the previous case.
To remove the dimensionalization in time, a scaling factor is required in order to define a new dimensionless time variable as:
In any system, we have several reaction rate constants that have different values. To obtain the scaling factor, one option is to choose the fastest one, as then the dimensionless time will be a factor indicating “how many times the fastest reaction has taken place”. In any case, we can rewrite our ODEs system, taking into account that,
and obtain:
In our example, let’s suppose is the fastest rate (which is a biologically plausible assumption). As is measured in (M·s)-1, it cannot be the scaling factor itself because then will have dimensions of M·s2. Looking at the simplified ODEs system using the mass conservation law, we can see that this rate appears multiplied by a constant, , measured in M. The product is measured in s-1, so we can choose our scaling factor to be:
Numerical integration of this adimensional version for the same parameters is now shown in Figure 5, where vertical axis now moves from 0 to 1 and the horizontal axis represents multiples of the value.
Pseudo-Steady State Approximation
So far we have an ODEs system with 4 coupled equations. Although in this case the numerical solution of this system is relatively easy to achieve, this might not be the case in any other systems. To further simplify our mathematical model, a common approach is to take advantage of the so-called pseudo-steady state approximation.
A biologically acceptable approximation will be to consider that the dynamics of the intermediate complexes are very fast, compared with the rest of the species. This means that the translocation processes ( and moving from one compartment to another via diffusion or another active process, plus their disassemble) are slow compared to the association and dissociation reactions ( and formation and disassembly). Mathematically, this translates in and being much smaller than the rest of the rate constants, and thus we can consider that
This assumption is known as Michaelis-Menten approximation [59], in which the concentration of the enzymes and complexes are considered to be in equilibrium while and change rapidly. With this mathematical condition, we can then obtain the concentration of the complexes over time as:
With this definitions, then the new simplified system that gives the concentration of all the species over time is:
which just has two coupled ODEs. Lastly, using the definition of the Michaelis-Menten constant for each of the two processes (C/ and N/), we can rewrite the ODEs as:
with:
Now, we can compare the initial system with the pseudo-state approximation system that we have just obtained. As shown in Figure 6, the approximation is not valid for the values of the rates of the set 1 (Table 1), but it is for the values of set 4. The rate constants for the system must fulfill the approximation assumptions in order to be able to use the approximation.
Conclusions
Here we presented a comprehensive revision on how the different compartments in a cell are often utilized as physical barriers to modulate the biochemical processes that shape the response of cells to external stimuli. The TFG is often view as an almost linear cascade, where events at the receptor level correspond to direct phosphorylation and activation of transcription factors. This oversimplified view leaves out important processes that can fully dictate the response, such as regulation via compartmentalization of the R-Smads, that are actively maintained in and out of the nucleus depending on their activation state. In principle, inactive unphosphorylated R-Smads do not form complexes and do not bind to DNA, so the fact that there is an extra layer that keeps this inactive proteins from entering the nucleus seems unnecessary. But we know from experience that everything that happens inside the cells serves often many purposes. Therefore, this biophysical regulation at least adds an extra safety layer that prevents such important proteins to wrongly activate expression of their targets when not needed. We believe that this is just one of many ways that the physical aspects of the cells and organelles shape influence biological responses, and perhaps some still waiting to be discovered and studied. Physics and biophysics have already helped to understand many of the most important aspects of how living systems operate, and for sure will play a central role in future discoveries.
Author Contributions
ANH, DP and DGM performed research and wrote the manuscript. DP performed numerical simulations. DMG and ANH provided funding.
Acknowledgments
We acknowledge all CBMSO (Centre for Molecular Biology Severo Ochoa, CSIC–UAM) facilities. This work was supported by grants from the Ministerio de Ciencia e Innovacion, Spain (RTI2018-096953-B-I00, PID2022-140421NB-I00, PDC2022-133147-I00, an FPI fellowship. Institutional fellowships to the IFIMAC (Maria de Maeztu unit of excellence) and CBMSO (Severo Ochoa). ML acknowledges a Margarita Salas fellowship from the Ministerio de Ciencia e Innovacion (CA4/RSUE/2022-00236).
Conflicts of Interest
Authors declare no Competing Intensest.
References
- Heldin, C.H.; Moustakas, A. Signaling Receptors for TGF-beta Family Members. Cold Spring Harbor Perspectives in Biology 2016, 8, a022053. [Google Scholar] [CrossRef] [PubMed]
- Zhong, Q.; Xiao, X.; Qiu, Y.; Xu, Z.; Chen, C.; Chong, B.; Zhao, X.; Hai, S.; Li, S.; An, Z.; Dai, L. Protein posttranslational modifications in health and diseases: Functions, regulatory mechanisms, and therapeutic implications. MedComm 2023, 4, Not. [Google Scholar] [CrossRef] [PubMed]
- Editorial : Ebb and Tide of Glucokinase FRANZ M. MATSCHINSKY. 2008.
- Jetton, T.L.; Shiota, M.; Knobel, S.M.; Piston, D.W.; Cherrington, A.D.; Magnuson, M.A. Substrate-induced Nuclear Export and Peripheral Compartmentalization of Hepatic Glucokinase Correlates with Glycogen Deposition. Journal of Diabetes Research 2001, 2, 173–186. [Google Scholar] [CrossRef]
- Erb, T.J.; Zarzycki, J. A short history of RubisCO: the rise and fall (?) of Nature’s predominant CO2 fixing enzyme. Current Opinion in Biotechnology 2018, 49, 100–107. [Google Scholar] [CrossRef]
- Amritkar, K.; Cuevas-Zuviría, B.; Kacar, B. Ancestral structure prediction reveals the conformational impact of the RuBisCO small subunit across time. bioRxiv 2024. [Google Scholar]
- Ruiz-Herrero, T.; Estrada, J.; Guantes, R.; Miguez, D.G. A Tunable Coarse-Grained Model for Ligand-Receptor Interaction. PLoS Computational biology 2013, 9, e1003274–e1003274. [Google Scholar] [CrossRef] [PubMed]
- Doldán-Martelli, V.; Míguez, D.G. Synergistic Interaction between Selective Drugs in Cell Populations Models. PLOS ONE 2015, 10, e0117558. [Google Scholar] [CrossRef] [PubMed]
- Doldán-Martelli, V.; Guantes, R.; Míguez, D.G. A mathematical model for the rational design of chimeric ligands in selective drug therapies. CPT: pharmacometrics & systems pharmacology 2013, 2, e26–e26. [Google Scholar] [CrossRef]
- Míguez, D.G. The role of asymmetric binding in ligand-receptor systems with 1:2 interaction ratio. Biophysical Chemistry 2010, 148, 74–81. [Google Scholar] [CrossRef]
- Xu, X.; Zheng, L.; Yuan, Q.; Zhen, G.; Crane, J.L.; Zhou, X.; Cao, X. Transforming growth factor-β in stem cells and tissue homeostasis. Bone Research 2018, 6, 2. [Google Scholar] [CrossRef] [PubMed]
- Papanikolaou, S.; Vourda, A.; Syggelos, S.; Gyftopoulos, K. Cell Plasticity and Prostate Cancer: The Role of Epithelial–Mesenchymal Transition in Tumor Progression, Invasion, Metastasis and Cancer Therapy Resistance. Cancers 2021, 13, 2795. [Google Scholar] [CrossRef] [PubMed]
- Derynck, R.; Budi, E.H. Specificity, versatility, and control of TGF-beta family signaling. Science Signaling 2019, 12, eaav5183. [Google Scholar] [CrossRef] [PubMed]
- Deng, Z.; Fan, T.; Xiao, C.; Tian, H.; Zheng, Y.; Li, C.; He, J. TGF-beta signaling in health, disease and therapeutics. Signal Transduction and Targeted Therapy 2024, 9, 61. [Google Scholar] [CrossRef]
- Goebel, E.J.; Hart, K.N.; McCoy, J.C.; Thompson, T.B. Structural biology of the TGFβ family. Experimental Biology and Medicine 2019, 244, 1530–1546. [Google Scholar] [CrossRef]
- Tzavlaki, K.; Moustakas, A. TGF-beta Signaling. Biomolecules 2020, 10, 487. [Google Scholar] [CrossRef]
- Huang, T.; David, L.; Mendoza, V.; Yang. ; De, K.; Sun, L.; Fang.; Wrana, J.L.; Hinck, A.P. TGF-beta signalling is mediated by two autonomously functioning TBRI:TBRII pairs. The EMBO Journal 2011, 30, 1263–1276. [Google Scholar] [CrossRef]
- Mitchell, H.; Choudhury, A.; Pagano, R.E.; Leof, E.B. Ligand-dependent and -independent Transforming Growth Factor-β Receptor Recycling Regulated by Clathrin-mediated Endocytosis and Rab11. Molecular Biology of the Cell 2004, 15, 4166–4178. [Google Scholar] [CrossRef]
- Derynck, R.; Zhang, Y.E. Smad-dependent and Smad-independent pathways in TGF-β family signalling. Nature 2003, 425, 577–584. [Google Scholar] [CrossRef]
- Kim, M.S.; Jin, W. TrkB-Induced Inhibition of R-SMAD/SMAD4 Activation is Essential for TGF-beta-Mediated Tumor Suppressor Activity. Cancers 2020, 12, 1048. [Google Scholar] [CrossRef]
- Budi, E.H.; Duan, D.; Derynck, R. Transforming Growth Factor-β Receptors and Smads: Regulatory Complexity and Functional Versatility. Trends in Cell Biology 2017, 27, 658–672. [Google Scholar] [CrossRef] [PubMed]
- Miyazawa, K.; Miyazono, K. Regulation of TGF-beta Family Signaling by Inhibitory Smads. Cold Spring Harbor Perspectives in Biology 2017, 9, a022095. [Google Scholar] [CrossRef]
- Aykul, S.; Maust, J.; Thamilselvan, V.; Floer, M.; Martinez-Hackert, E. Smad2/3 Activation Regulates Smad1/5/8 Signaling via a Negative Feedback Loop to Inhibit 3T3-L1 Adipogenesis. International Journal of Molecular Sciences 2021, 22, 8472. [Google Scholar] [CrossRef]
- Baburajendran, N.; Jauch, R.; Tan, C.Y.Z.; Narasimhan, K.; Kolatkar, P.R. Structural basis for the cooperative DNA recognition by Smad4 MH1 dimers. Nucleic Acids Research 2011, 39, 8213–8222. [Google Scholar] [CrossRef] [PubMed]
- Xin, X.; Cheng, X.; Zeng, F.; Xu, Q.; Hou, L. The Role of TGF-beta/SMAD Signaling in Hepatocellular Carcinoma: from Mechanism to Therapy and Prognosis. International Journal of Biological Sciences 2024, 20, 1436–1451. [Google Scholar] [CrossRef] [PubMed]
- Hata, A.; Chen, Y.G. TGF-beta Signaling from Receptors to Smads. Cold Spring Harbor Perspectives in Biology 2016, 8, a022061. [Google Scholar] [CrossRef] [PubMed]
- Xu, F.; Liu, C.; Zhou, D.; Zhang, L. TGF-beta/SMAD Pathway and Its Regulation in Hepatic Fibrosis. Journal of Histochemistry & Cytochemistry 2016, 64, 157–167. [Google Scholar] [CrossRef]
- Bai, H.; Lester, G.M.; Petishnok, L.; Dean, D. Cytoplasmic transport and nuclear import of plasmid DNA. Bioscience Reports 2017, 37, BSR20160616. [Google Scholar] [CrossRef]
- Schmierer, B.; Hill, C.S. Kinetic Analysis of Smad Nucleocytoplasmic Shuttling Reveals a Mechanism for Transforming Growth Factor β-Dependent Nuclear Accumulation of Smads. Molecular and Cellular Biology 2005, 25, 9845–9858. [Google Scholar] [CrossRef]
- Hill, C.S. Nucleocytoplasmic shuttling of Smad proteins. Cell Research 2009, 19, 36–46. [Google Scholar] [CrossRef]
- Paci, G.; Caria, J.; Lemke, E.A. Cargo transport through the nuclear pore complex at a glance. Journal of Cell Science 2021, 134, jcs247874. [Google Scholar] [CrossRef]
- Otsuka, S.; Ellenberg, J. Mechanisms of nuclear pore complex assembly – two different ways of building one molecular machine. FEBS Letters 2018, 592, 475–488. [Google Scholar] [CrossRef] [PubMed]
- Timney, B.L.; Raveh, B.; Mironska, R.; Trivedi, J.M.; Kim, S.J.; Russel, D.; Wente, S.R.; Sali, A.; Rout, M.P. Simple rules for passive diffusion through the nuclear pore complex. Journal of Cell Biology 2016, 215, 57–76. [Google Scholar] [CrossRef]
- Oka, M.; Yoneda, Y. Importin α: functions as a nuclear transport factor and beyond. Proceedings of the Japan Academy, Series B 2018, 94, 259–274. [Google Scholar] [CrossRef]
- Yang, Y.; Guo, L.; Chen, L.; Gong, B.; Jia, D.; Sun, Q. Nuclear transport proteins: structure, function and disease relevance. Signal Transduction and Targeted Therapy 2023, 8, 425. [Google Scholar] [CrossRef] [PubMed]
- Kurisaki, A.; Kose, S.; Yoneda, Y.; Heldin, C.H.; Moustakas, A. Transforming Growth Factor-β Induces Nuclear Import of Smad3 in an Importin-β1 and Ran-dependent Manner. Molecular Biology of the Cell 2001, 12, 1079–1091. [Google Scholar] [CrossRef] [PubMed]
- Chen, X.; Xu, L. Mechanism and Regulation of Nucleocytoplasmic Trafficking of Smad. Cell & Bioscience 2011, 1, 40. [Google Scholar] [CrossRef]
- Kırlı, K.; Karaca, S.; Dehne, H.J.; Samwer, M.; Pan, K.T.; Lenz, C.; Urlaub, H.; Görlich, D. A deep proteomics perspective on CRM1-mediated nuclear export and nucleocytoplasmic partitioning. eLife 2015, 4, e11466. [Google Scholar] [CrossRef] [PubMed]
- Abdel Mouti, M.; Pauklin, S. TGFB1/INHBA Homodimer/Nodal-SMAD2/3 Signaling Network: A Pivotal Molecular Target in PDAC Treatment. Molecular Therapy 2021, 29, 920–936. [Google Scholar] [CrossRef]
- Watanabe, M.; Masuyama, N.; Fukuda, M.; Nishida, E. Regulation of intracellular dynamics of Smad4 by its leucine-rich nuclear export signal. EMBO reports 2000, 1, 176–182. [Google Scholar] [CrossRef]
- Dai, F.; Lin, X.; Chang, C.; Feng, X.H. Nuclear Export of Smad2 and Smad3 by RanBP3 Facilitates Termination of TGF-β Signaling. Developmental Cell 2009, 16, 345–357. [Google Scholar] [CrossRef] [PubMed]
- Xu, L.; Kang, Y.; Çöl, S.; Massagué, J. Smad2 Nucleocytoplasmic Shuttling by Nucleoporins CAN/Nup214 and Nup153 Feeds TGFβ Signaling Complexes in the Cytoplasm and Nucleus. Molecular Cell 2002, 10, 271–282. [Google Scholar] [CrossRef] [PubMed]
- Kofler, M.; Kapus, A. Nuclear Import and Export of YAP and TAZ. Cancers 2023, 15, 4956. [Google Scholar] [CrossRef] [PubMed]
- Kurisaki, A.; Kurisaki, K.; Kowanetz, M.; Sugino, H.; Yoneda, Y.; Heldin, C.H.; Moustakas, A. The Mechanism of Nuclear Export of Smad3 Involves Exportin 4 and Ran. Molecular and Cellular Biology 2006, 26, 1318–1332. [Google Scholar] [CrossRef]
- Song, R.; Tikoo, S.; Jain, R.; Pinello, N.; Au, A.Y.M.; Nagarajah, R.; Porse, B.; Rasko, J.E.J.; J. -L. Wong, J. Dynamic intron retention modulates gene expression in the monocytic differentiation pathway. Immunology 2022, 165, 274–286. [Google Scholar] [CrossRef]
- Pierreux, C.E.; Nicolás, F.J.; Hill, C.S. Transforming Growth Factor β-Independent Shuttling of Smad4 between the Cytoplasm and Nucleus. Molecular and Cellular Biology 2000, 20, 9041–9054. [Google Scholar] [CrossRef]
- Zou, M.L.; Chen, Z.H.; Teng, Y.Y.; Liu, S.Y.; Jia, Y.; Zhang, K.W.; Sun, Z.L.; Wu, J.J.; Yuan, Z.D.; Feng, Y.; Li, X.; Xu, R.S.; Yuan, F.L. The Smad Dependent TGF-beta and BMP Signaling Pathway in Bone Remodeling and Therapies. Frontiers in Molecular Biosciences 2021, 8, 593310. [Google Scholar] [CrossRef]
- Warmflash, A.; Zhang, Q.; Sorre, B.; Vonica. ; Brivanlou, A.H. Dynamics of TGF-beta signaling reveal adaptive and pulsatile behaviors reflected in the nuclear localization of transcription factor Smad4. Proceedings of the National Academy of Sciences 2012, 109. [Google Scholar] [CrossRef]
- Li, Y.; Luo, W.; Yang, W. Nuclear Transport and Accumulation of Smad Proteins Studied by Single-Molecule Microscopy. Biophysical Journal 2018, 114, 2243–2251. [Google Scholar] [CrossRef]
- Nicolás, F.J.; De Bosscher, K.; Schmierer, B.; Hill, C.S. Analysis of Smad nucleocytoplasmic shuttling in living cells. Journal of Cell Science 2004, 117, 4113–4125. [Google Scholar] [CrossRef]
- Zi, Z.; Feng, Z.; Chapnick, D.A.; Dahl, M.; Deng, D.; Klipp, E.; Moustakas, A.; Liu, X. Quantitative analysis of transient and sustained transforming growth factor-β signaling dynamics. Molecular Systems Biology 2011, 7, 492. [Google Scholar] [CrossRef] [PubMed]
- Sorre, B.; Warmflash, A.; Brivanlou, A.; Siggia, E. Encoding of Temporal Signals by the TGF-β Pathway and Implications for Embryonic Patterning. Developmental Cell 2014, 30, 334–342. [Google Scholar] [CrossRef]
- Frick, C.L.; Yarka, C.; Nunns, H.; Goentoro, L. Sensing relative signal in the Tgf-β/Smad pathway. Proceedings of the National Academy of Sciences 2017, 114, Not. [Google Scholar] [CrossRef]
- Kretzschmar, M.; Doody, J.; Timokhina, I.; Massague, J. A mechanism of repression of TGFbeta / Smad signaling by oncogenic Ras. Genes & Development 1999, 13, 804–816. [Google Scholar] [CrossRef]
- Míguez, D.G.; Gil-Guiñón, E.; Pons, S.; Martí, E. Smad2 and Smad3 cooperate and antagonize simultaneously in vertebrate neurogenesis. Journal of Cell Science. [CrossRef]
- Sanz, A.L.; Míguez, D.G. Dual R-Smads interplay in the regulation of vertebrate neurogenesis. Neurogenesis 2014, 1, e29529. [Google Scholar] [CrossRef]
- Schmierer, B.; Tournier, A.L.; Bates, P.A.; Hill, C.S. Mathematical modeling identifies Smad nucleocytoplasmic shuttling as a dynamic signal-interpreting system. Proceedings of the National Academy of Sciences 2008, 105, 6608–6613. [Google Scholar] [CrossRef]
- Khatibi, S.; Zhu, H.J.; Wagner, J.; Tan. ; Burgess, A.W. Mathematical model of TGF- beta signalling: feedback coupling is consistent with signal switching. BMC Systems Biology 2017, 11, 48. [Google Scholar] [CrossRef]
- Chen, W.W.; Niepel, M.; Sorger, P.K. Classic and contemporary approaches to modeling biochemical reactions. Genes & Development 2010, 24, 1861–1875. [Google Scholar] [CrossRef]
- Hangos, K.M.; Szederkényi, G. Mass action realizations of reaction kinetic system models on various time scales. Journal of Physics: Conference Series 2011, 268, 012009. [Google Scholar] [CrossRef]
- CM Guldberg, P Waage, Ueber die chemische Affinität. 1. Einleitung ( 1879.
- Berthollet, C.L. Essai de statique chimique; A Paris: Chez Firmin Didot, 1803. [Google Scholar]
- Van’T Hoff, J.H. Die Grenzebene, ein Beitrag zur Kenntniss der Esterbildung. Berichte der deutschen chemischen Gesellschaft 1877, 10, 669–678. [Google Scholar] [CrossRef]
- Weiss, L. A simple demonstration of the law of conservation of mass. Journal of Chemical Education 1943, 20, 579. [Google Scholar] [CrossRef]
- Schummer, J. , Ed.; Springer Netherlands: Dordrecht, 2006; pp. 19–39. doi:10.1007/1-4020-3261-7_2.Chemistry. In Philosophy Of Chemistry: Synthesis of a New Discipline; Baird., *!!! REPLACE !!!*, Ed.; Springer Netherlands: Dordrecht, 2006; Springer Netherlands: Dordrecht, 2006; pp. 19–39. [Google Scholar] [CrossRef]
Figure 1.
Signaling through TGF- superfamily ligands (adapted from Ref. [19]. Explain .
Figure 1.
Signaling through TGF- superfamily ligands (adapted from Ref. [19]. Explain .
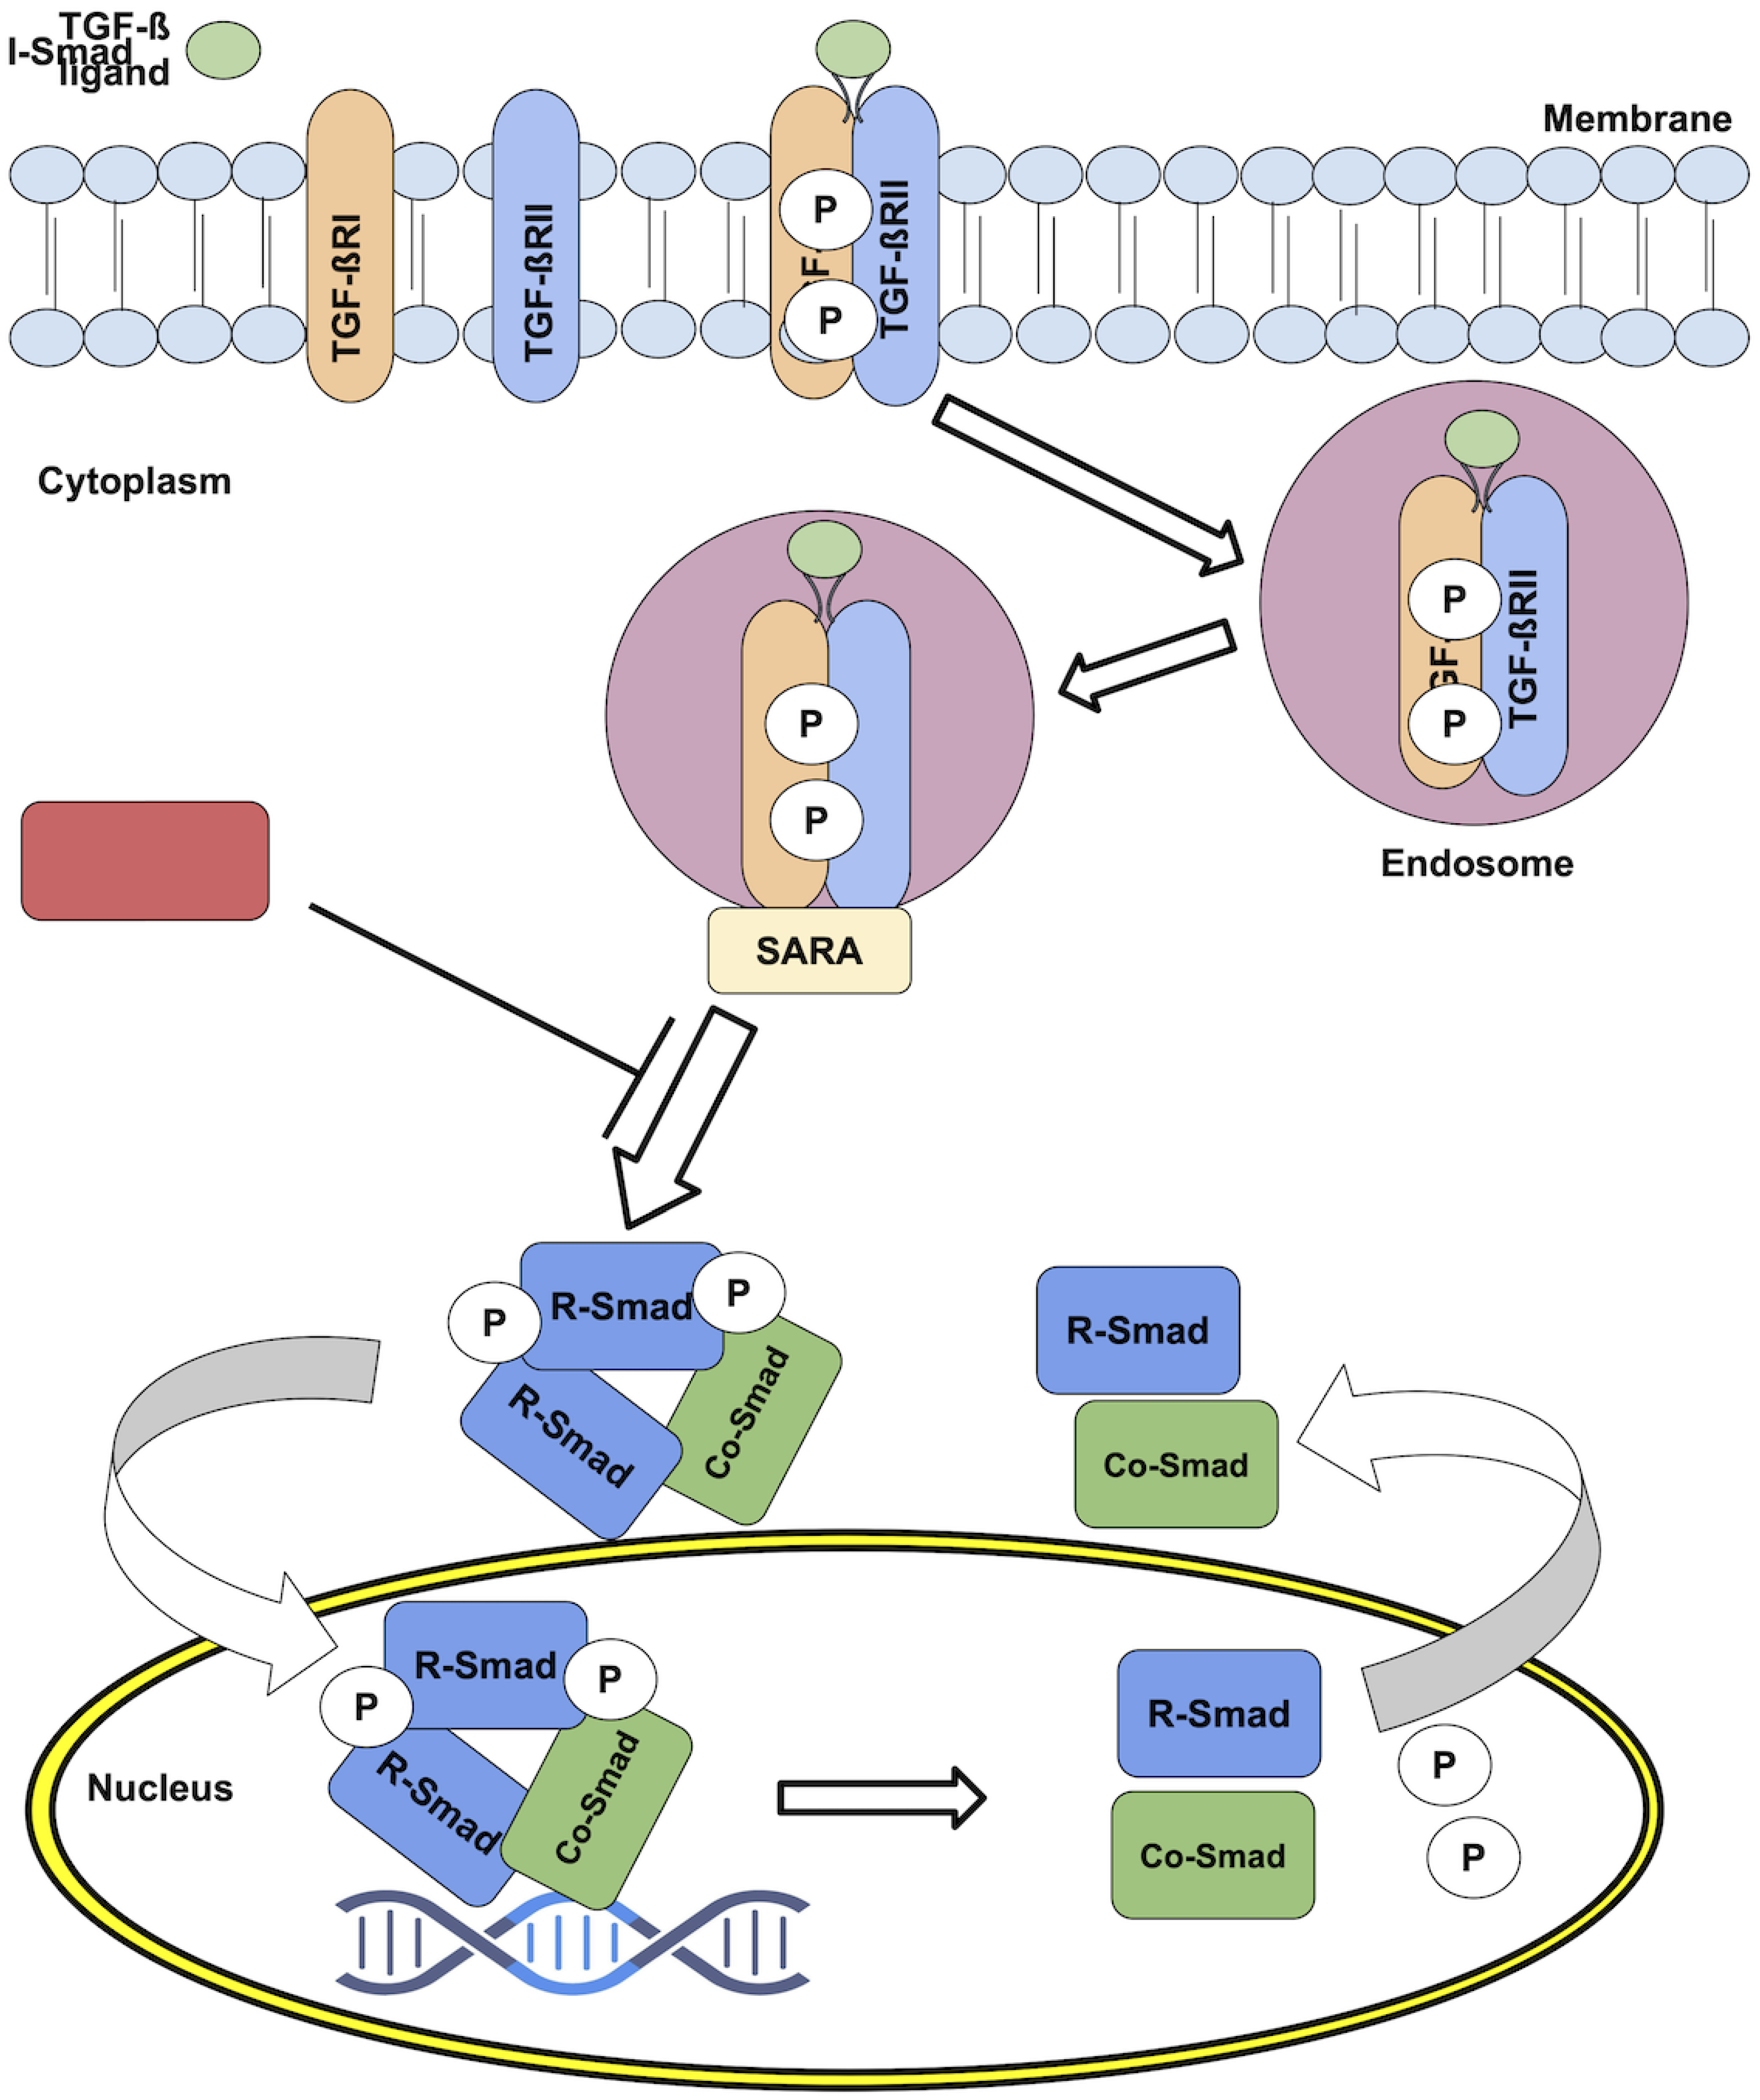
Figure 2.
Schematic representation of the nuclear import-export process of a molecule inside a cell. The molecule in the cytoplasm is represented by C, and in the nucleus by N. To be imported inside the nucleus, the one C molecule must bind one molecule of the import enzyme Imp. Then, the complex can enter the nucleus, where it disassembles into N (former C) and . The export process is analogous, involving the formation of a complex (one molecule of N and one export enzyme ) and then the disassembly of this complex in the cytoplasm yielding one molecule of C and one molecule of .
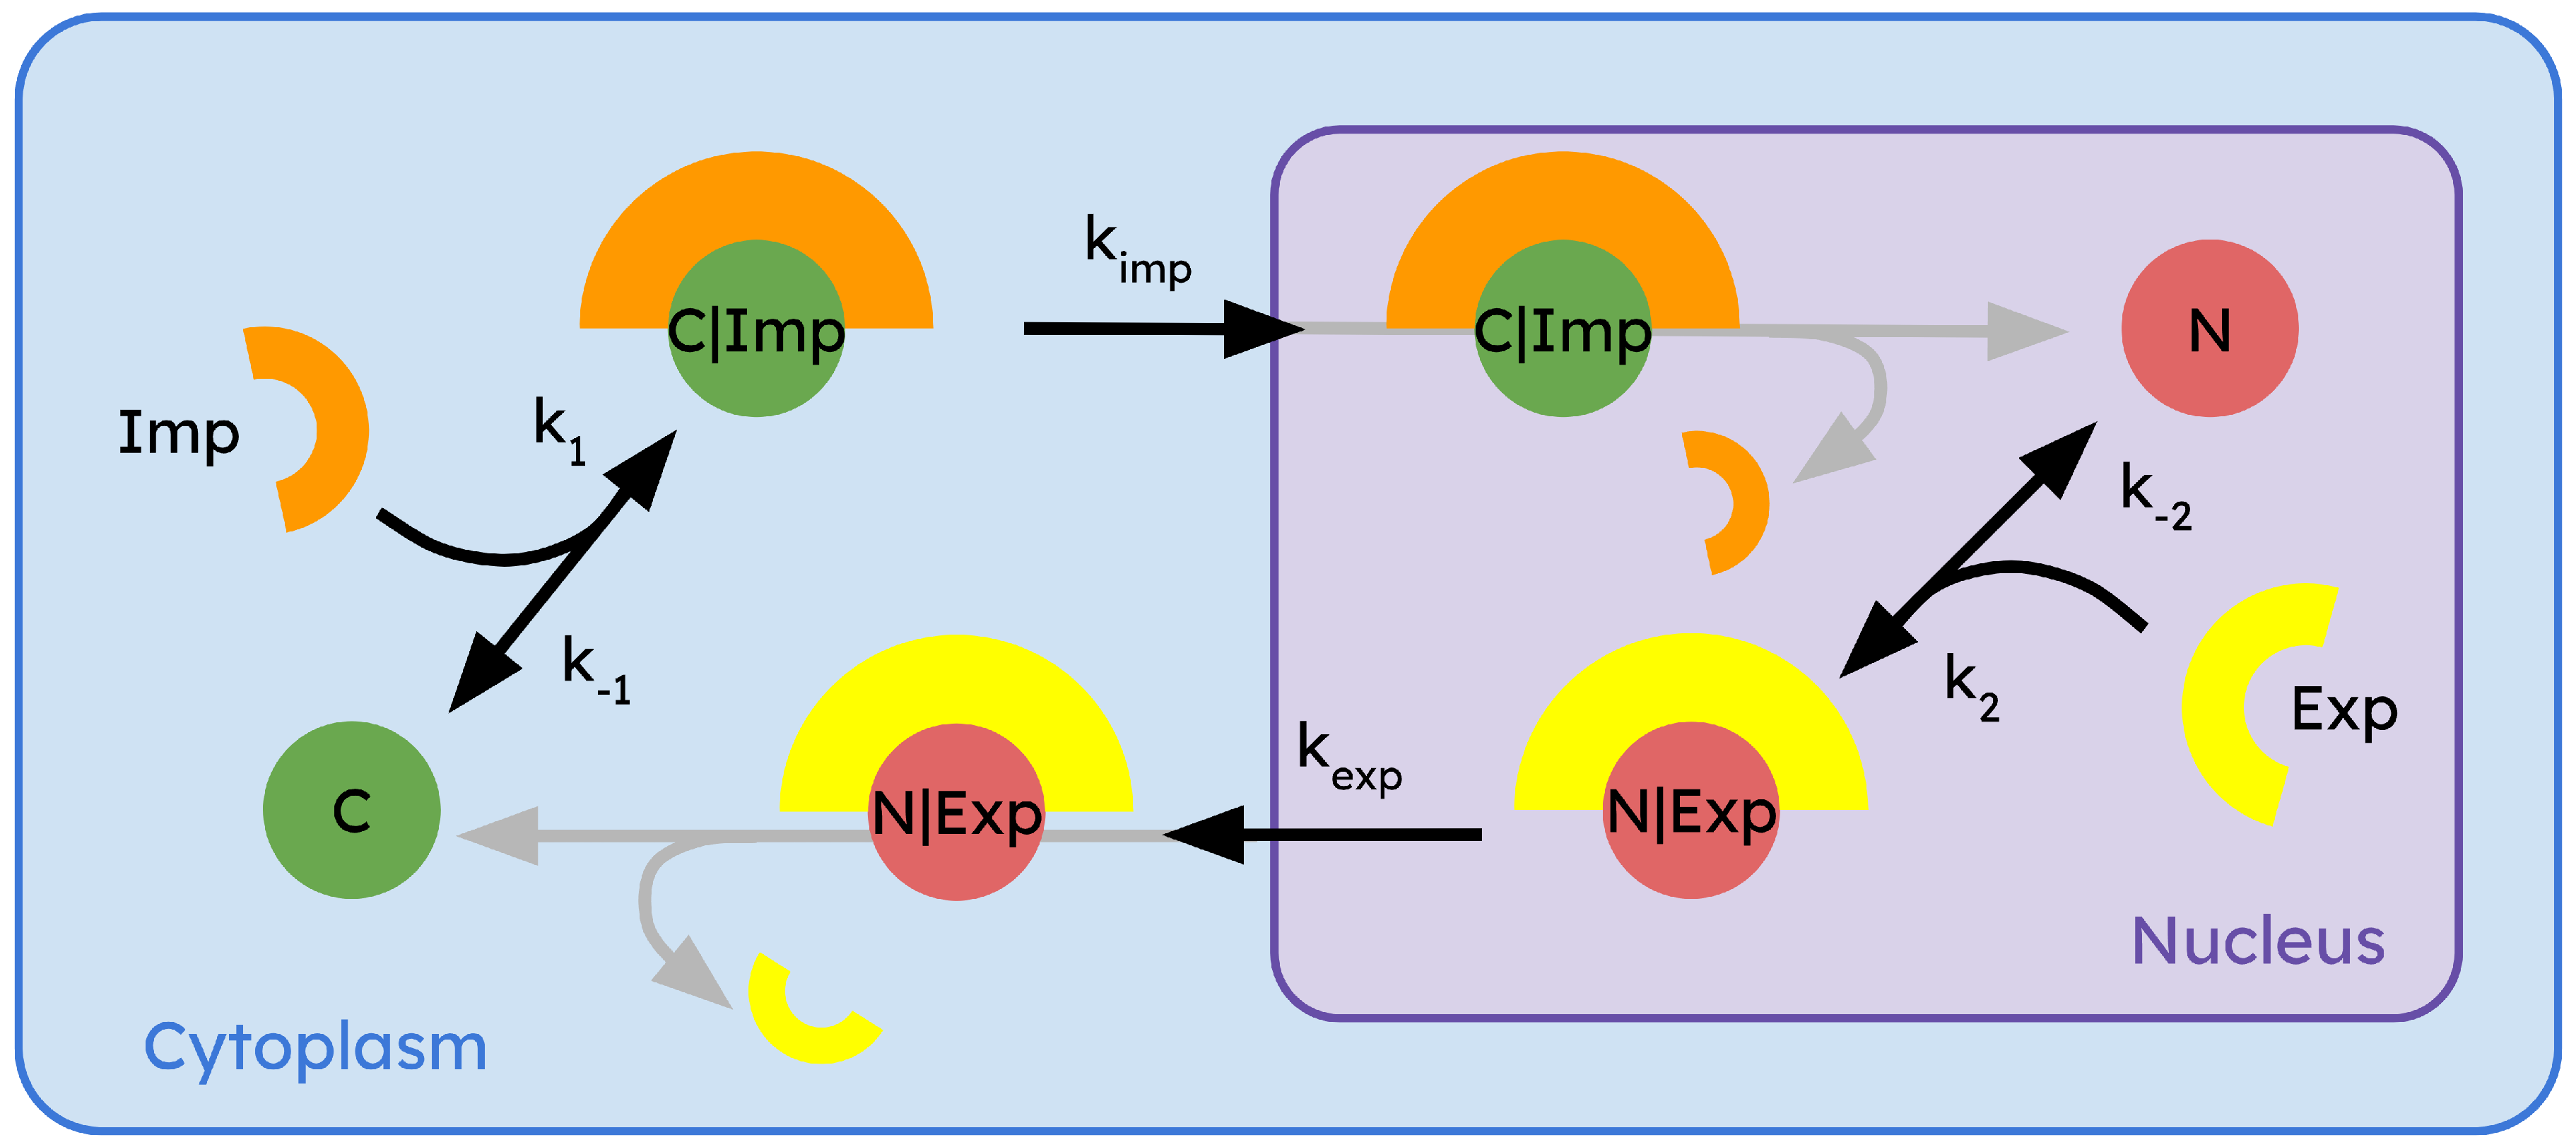
Figure 3.
Simulation of the ODEs system. Three different sets 1, 2 and 3 (from Table 1) of rate constants are used for the different cases A, B and C, respectively. The initial condition for the species are = = = 0.002 M, = 0.001 M and = = 0 M in all cases. The concentrations change during the first seconds until they reach a steady state: in equilibrium is bigger (A), equivalent (B) or smaller than in equilibrium. In general, , , and tend to decrease initially as and are formed.
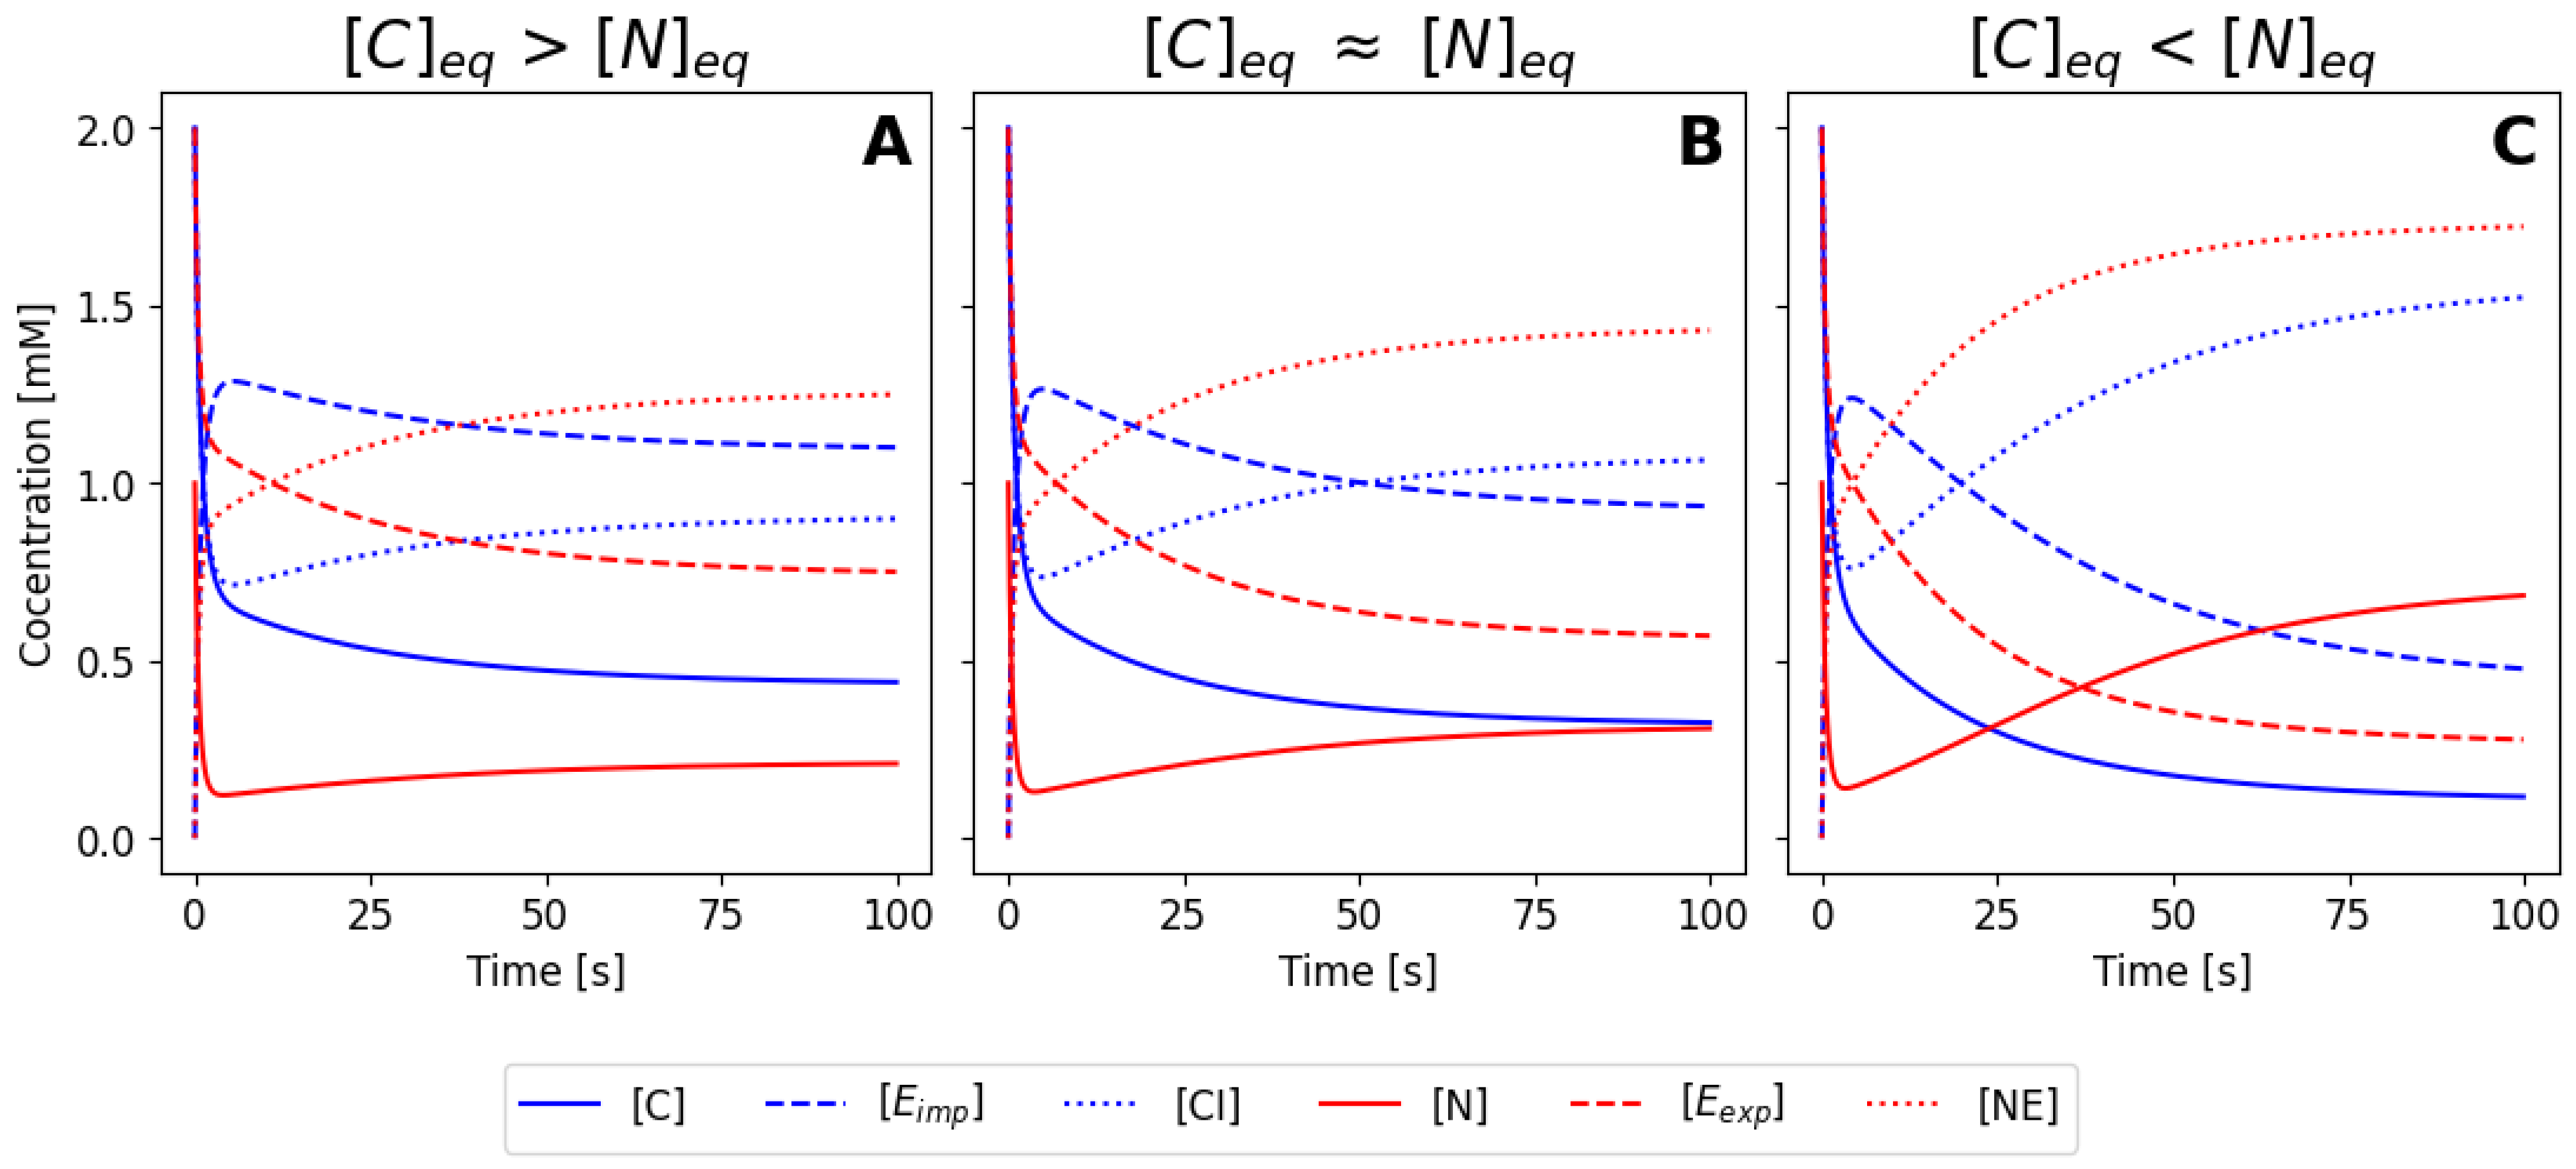
Figure 4.
Simulation of the ODEs system after using the mass conservation law. The simulation parameters are the same as those in Figure 3. The curves shown in this figure only correspond to the solution of the ODEs, which are the same as in Figure 3. The and curves are not shown, but they have the same behaviour as in Figure 3.
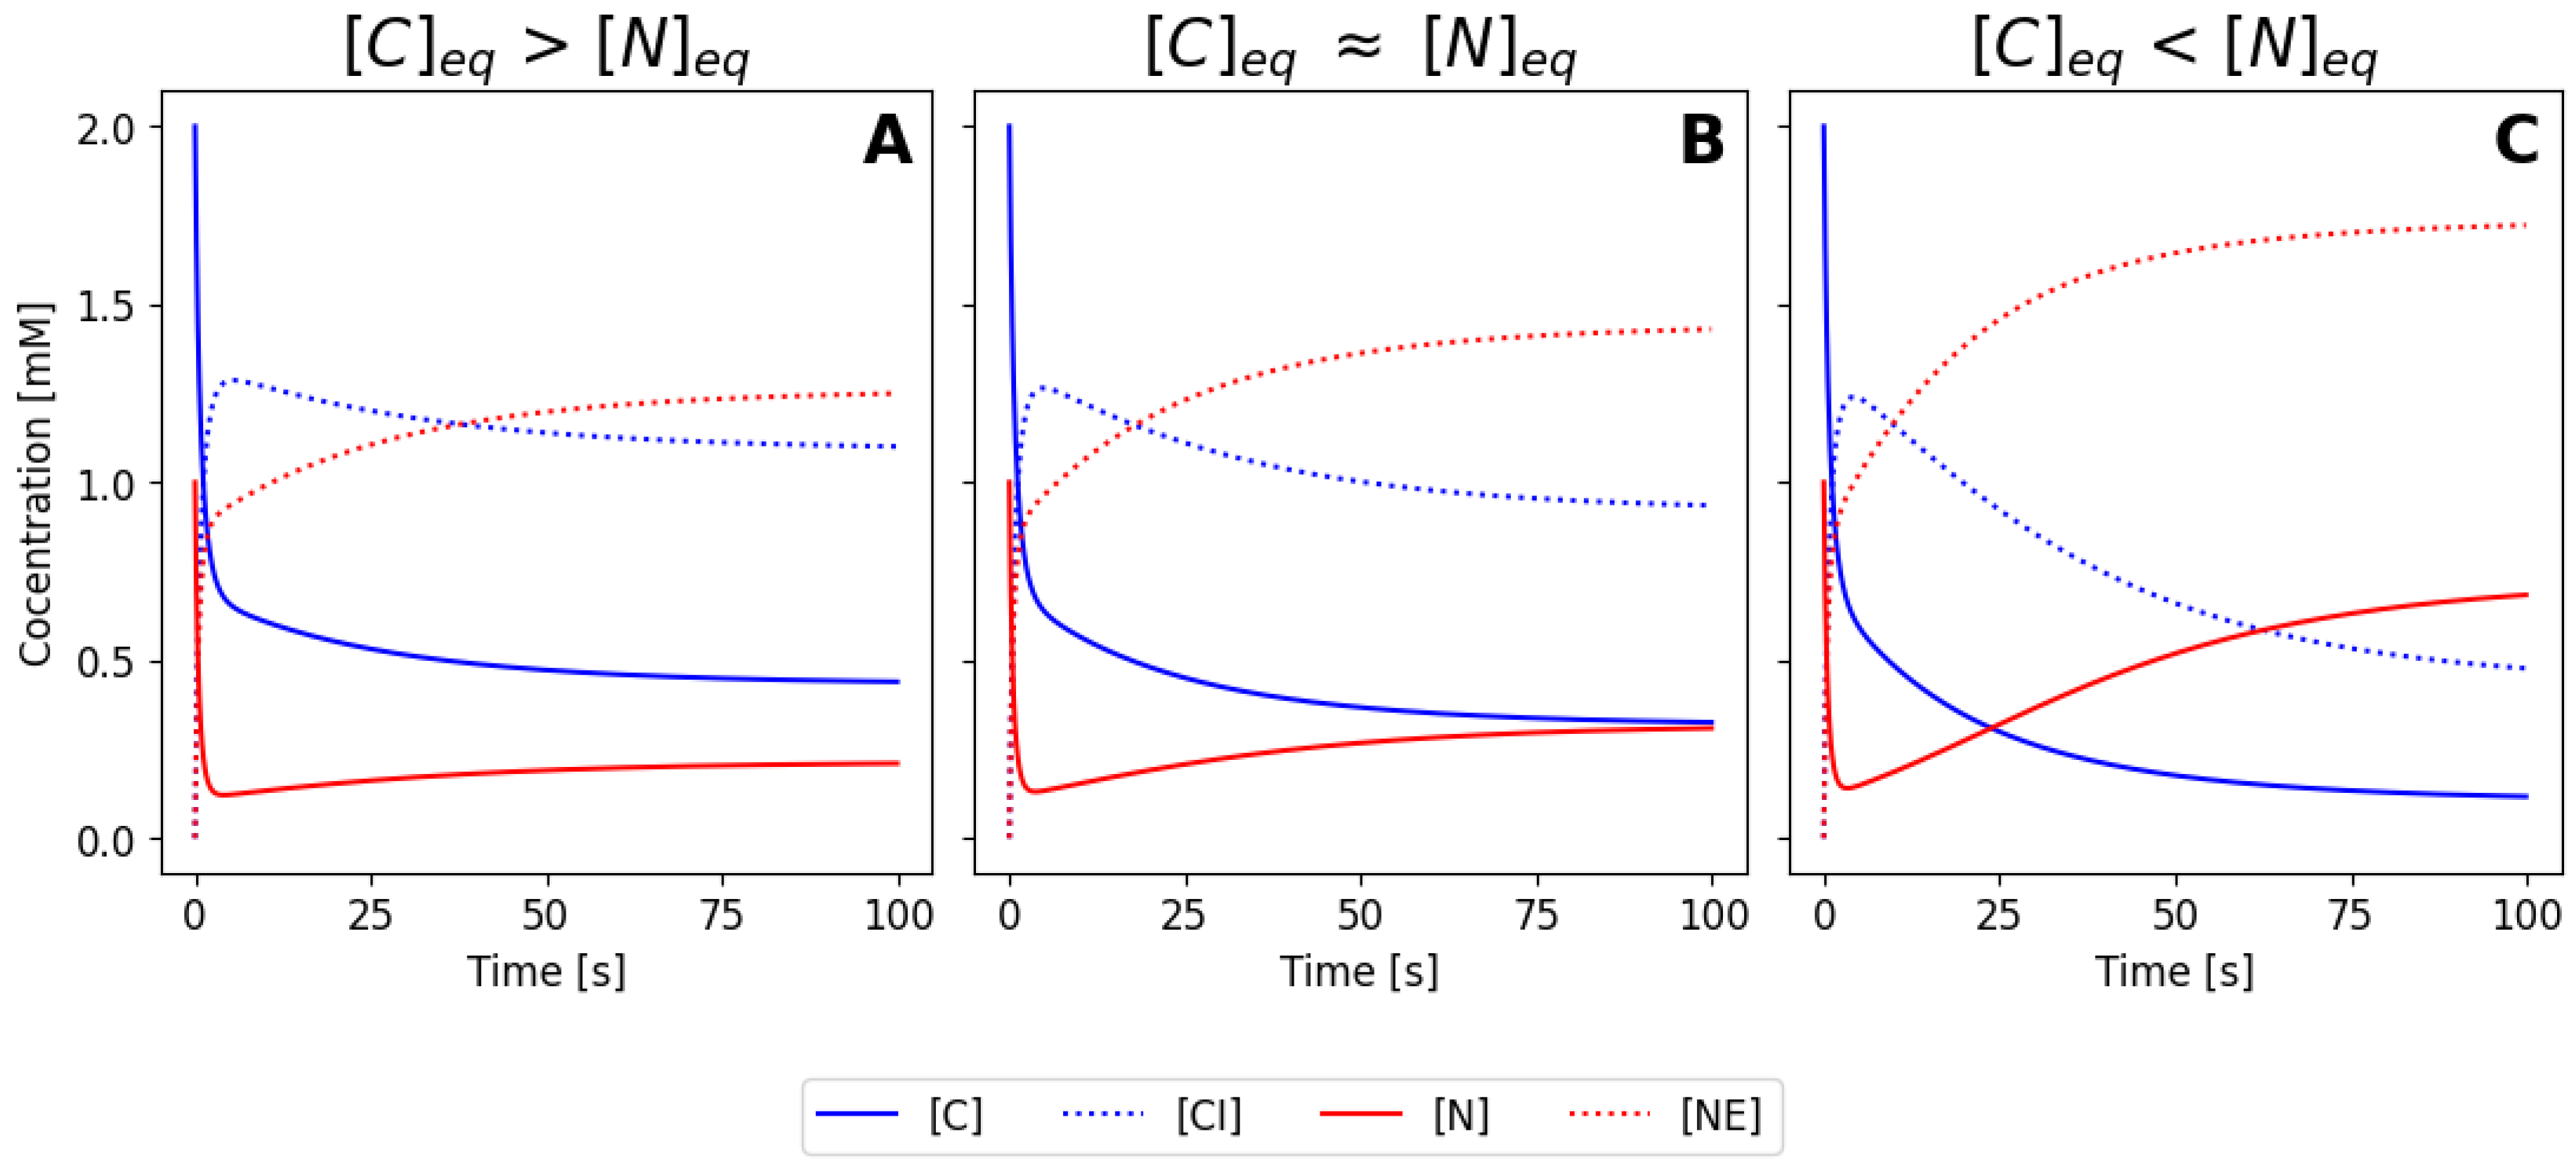
Figure 5.
Simulation of the ODEs system after using the non-dimensionalization. The same rate constants and initial conditions as in Figure 3 have been used for all the insets. Note that the concentrations are ranged in [0, 1], and during the simulation the curves indicate the present fraction of the initial concentration of each species in the system.
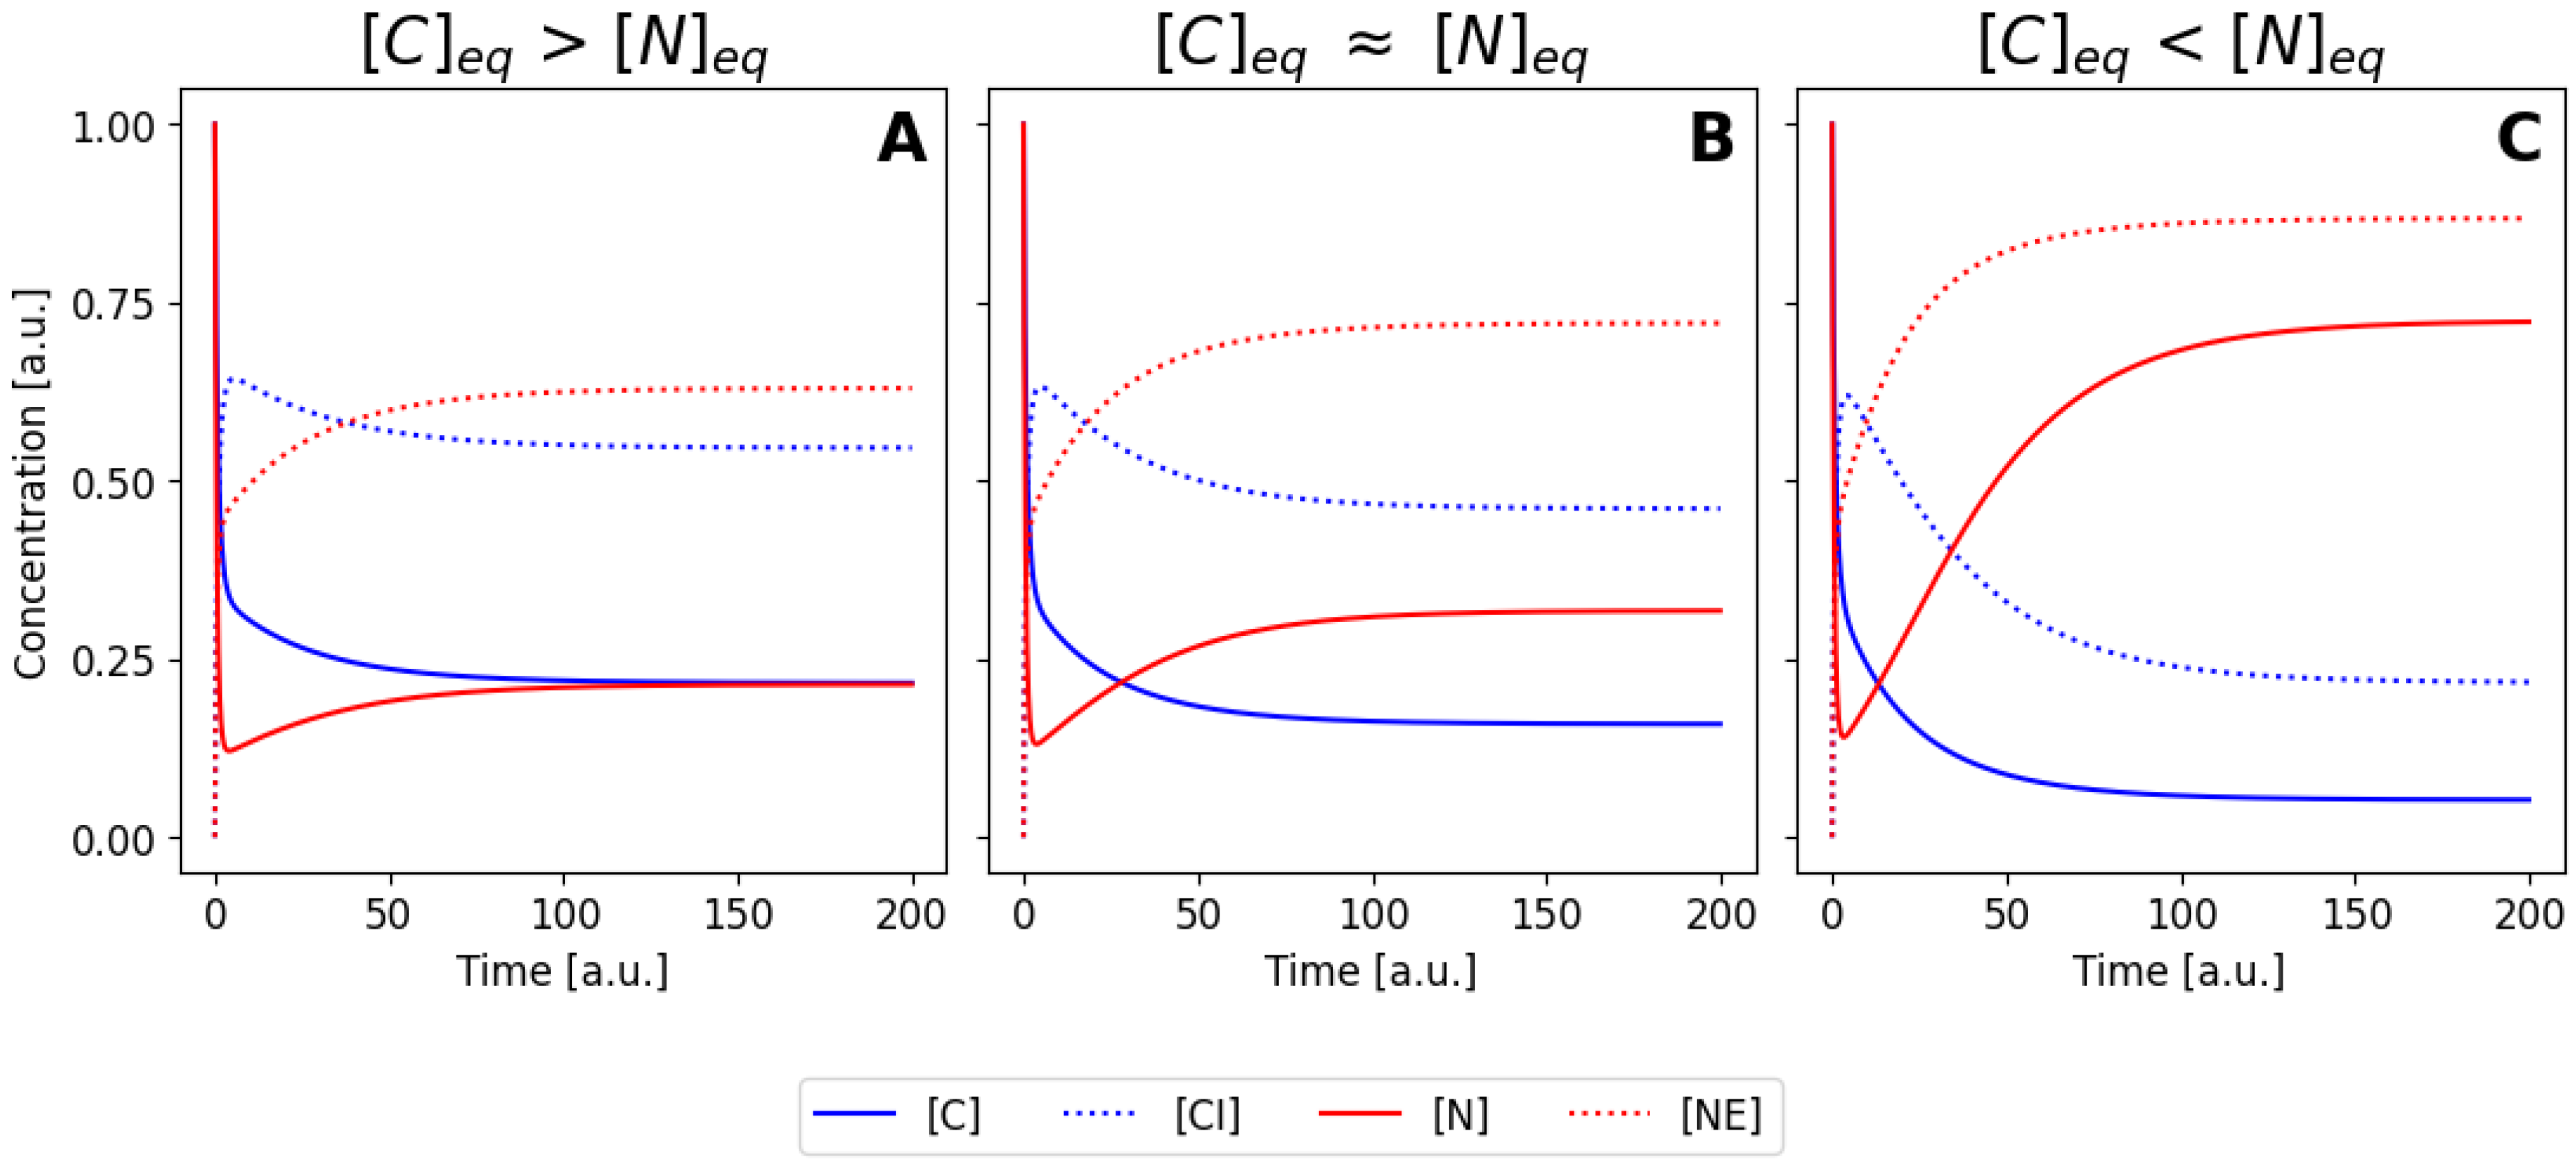
Figure 6.
Comparison of the raw model and the pseudo-steady state approximation model. The concentration of the C and N molecules are show as dashed lines for the original ODEs ( and ) and as solid lines for the pseudo-state approximation (Michaelis-Menten, and ). In both insets, the initial concentration values are the same as in Figure 3. The rate constants used in A and B are set 1 and 4 (from Table 1), respectively. For case A, there is a considerable discrepancy between the approximation (solid curves) and the original system (dashed curves). When the rate constants are chosen in a way that the approximation assumptions are fulfilled (set 4), the steady-state approximation becomes valid and can be used to simplify the analysis of the system.
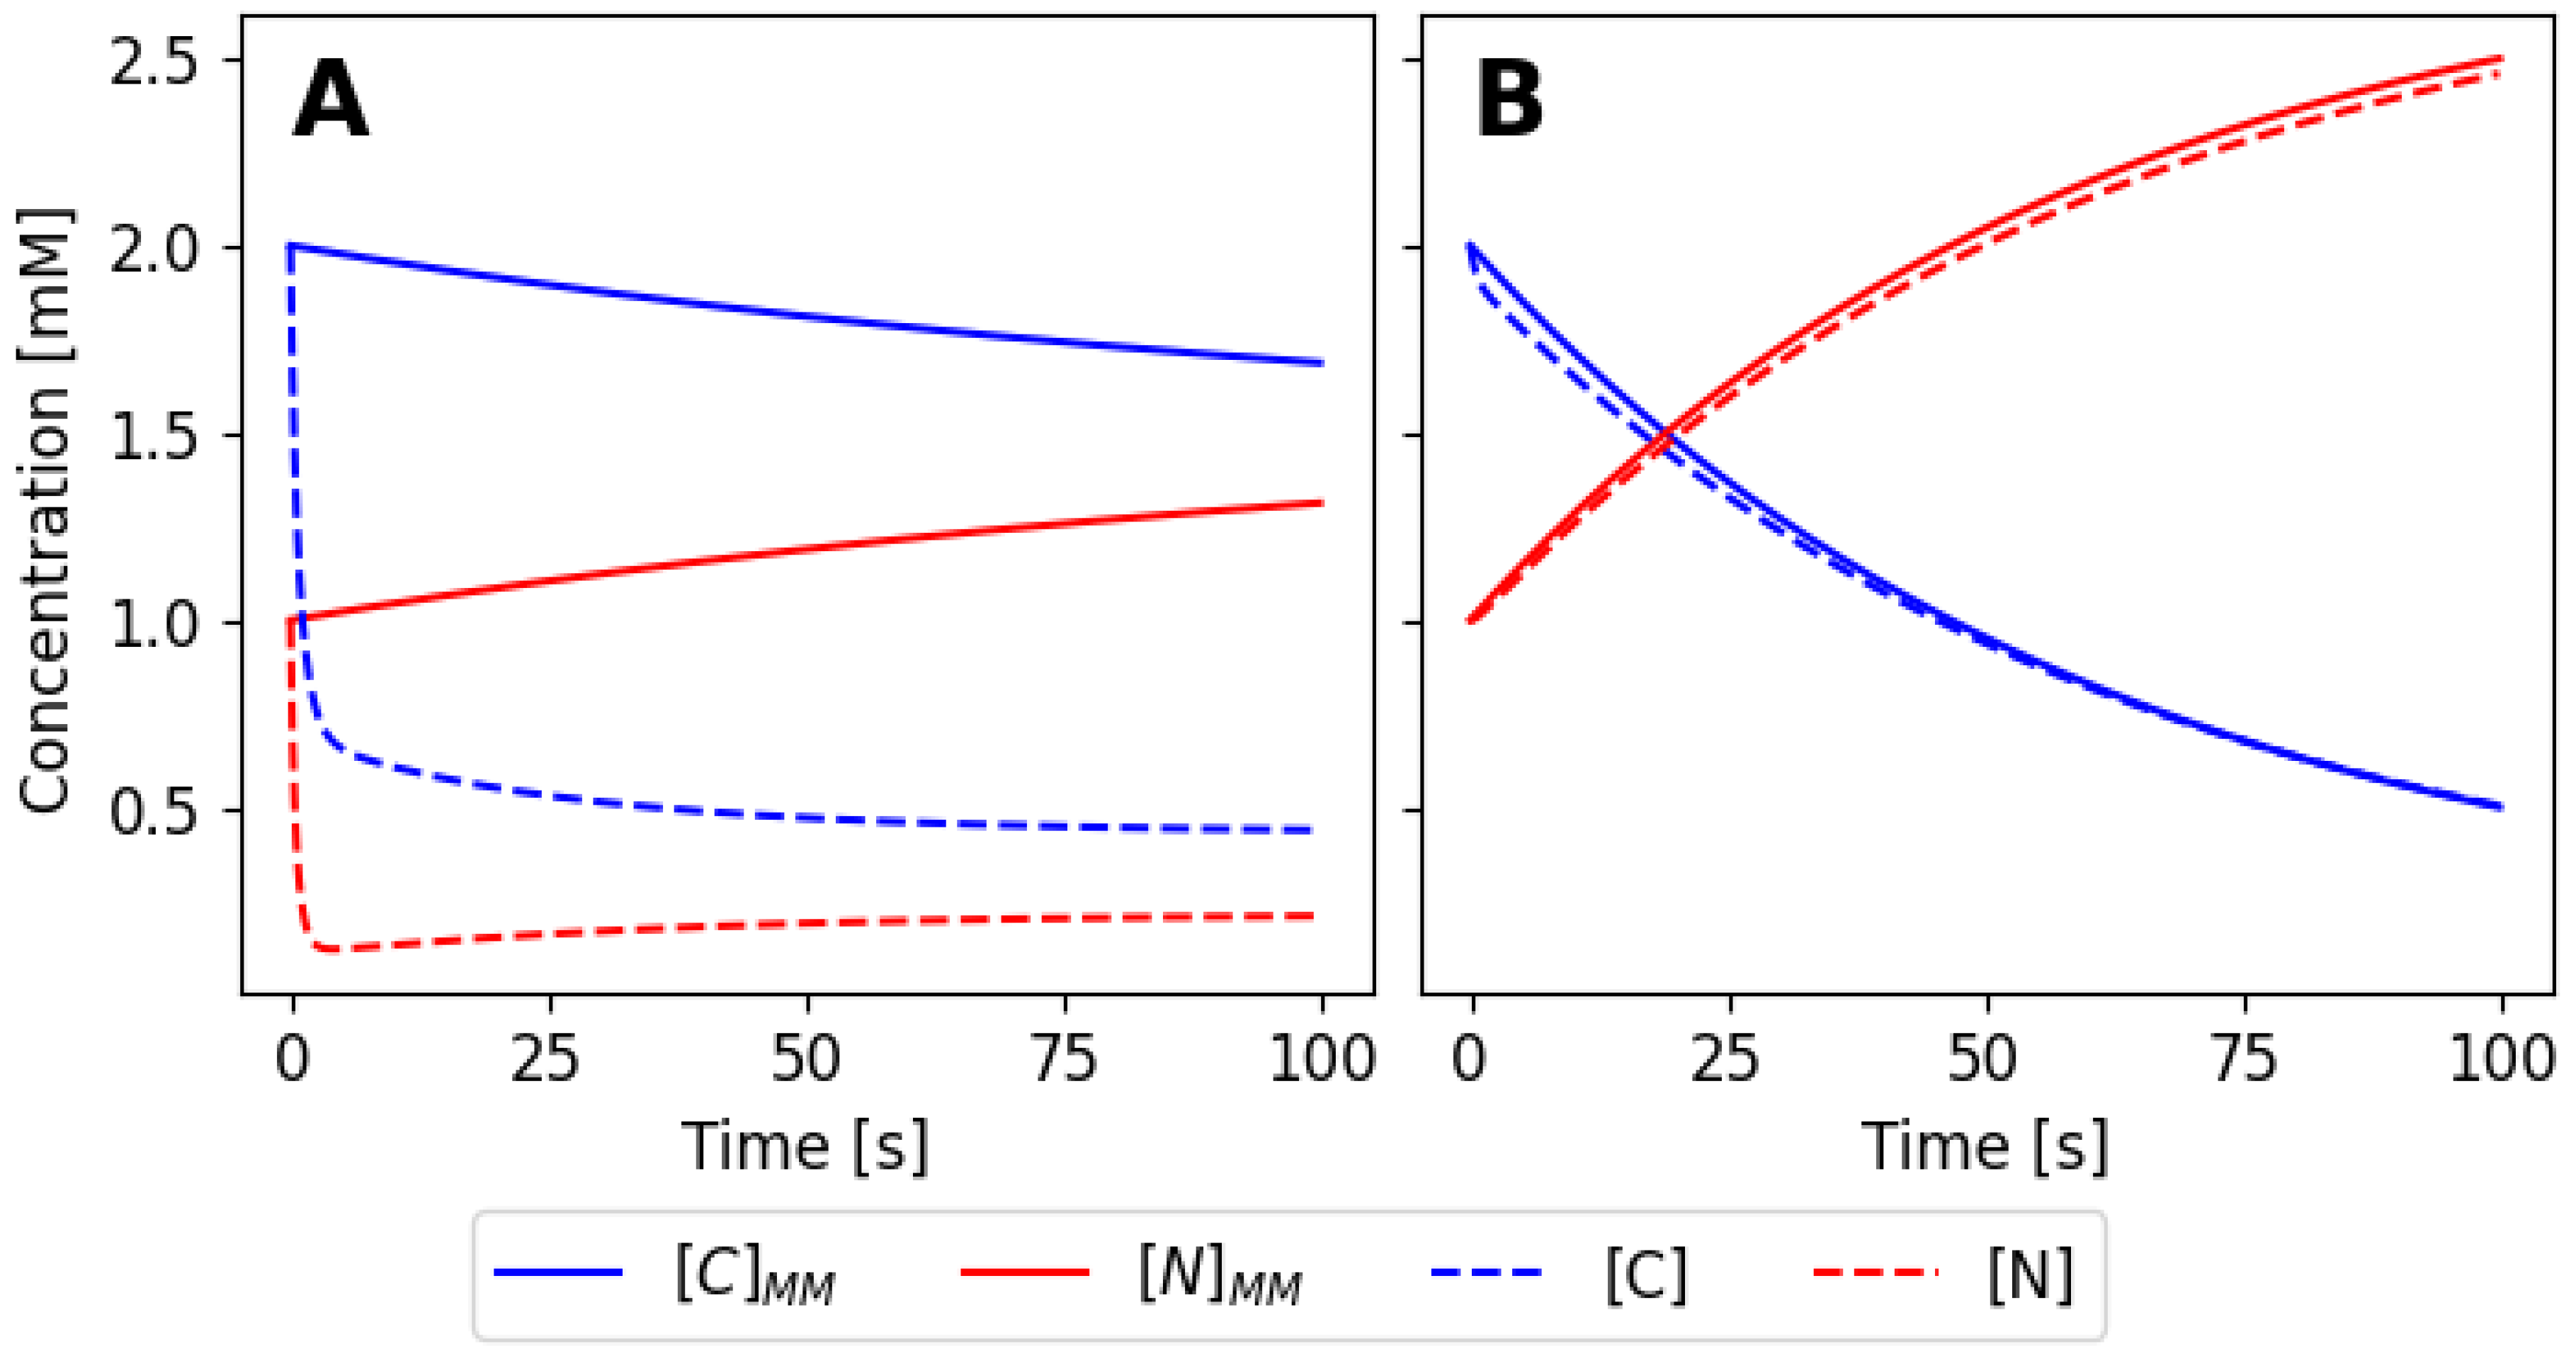

Table 1.
Values of the constant rates for the different sets used in the simulations
| Rates | Set 1 | Set 2 | Set 3 | Set 4 |
|---|---|---|---|---|
| 500 (M·s)-1 | 500 (M·s)-1 | 500 (M·s)-1 | 50 (M·s)-1 | |
| 0.15 s-1 | 0.15 s-1 | 0.15 s-1 | 1.5 s-1 | |
| 0.03 (M·s)-1 | 0.036 (M·s)-1 | 0.04 (M·s)-1 | 0.03 (M·s)-1 | |
| 1000 s-1 | 1000 s-1 | 1000 s-1 | 1 s-1 | |
| 0.1 s-1 | 0.1 s-1 | 0.1 s-1 | 0.3 s-1 | |
| 0.026 s-1 | 0.023 s-1 | 0.01 s-1 | 0.3 s-1 |
Disclaimer/Publisher’s Note: The statements, opinions and data contained in all publications are solely those of the individual author(s) and contributor(s) and not of MDPI and/or the editor(s). MDPI and/or the editor(s) disclaim responsibility for any injury to people or property resulting from any ideas, methods, instructions or products referred to in the content. |
© 2024 by the authors. Licensee MDPI, Basel, Switzerland. This article is an open access article distributed under the terms and conditions of the Creative Commons Attribution (CC BY) license (http://creativecommons.org/licenses/by/4.0/).
Copyright: This open access article is published under a Creative Commons CC BY 4.0 license, which permit the free download, distribution, and reuse, provided that the author and preprint are cited in any reuse.


