
Submitted:
10 September 2024
Posted:
11 September 2024
You are already at the latest version
Abstract
This study examines stress distributions in adhesive joints under various loading and temperature conditions. Finite element analysis (FEA) was employed to compute the peel and shear stresses at the adhesive interface and bondline mid-section. Dependency analysis shows that mid-section peel stress significantly impacts the experimental shear strength of SLJs more than shear stress. This insight highlights the need to carefully analyze peel stress and bending moment factors. The analytical solutions proposed by Goland and Reissner were analyzed with modifications by Hart-Smith and Zhao. Hart-Smith’s approach performed more effectively, especially when the adhesive layer thickness (ta) is 0.5 mm and the overlap length to thickness ratio (c/ta) is ≥20. FEA revealed stress distributions at the adhesive/adherend interface and bondline mid-section. DP490 adhesive joints exhibited lower stresses than EA9696. Temperature variations significantly affected joint behavior, particularly above the adhesive’s glass transition temperature (Tg). Both EA9696 and DP490 adhesive joints displayed distinct responses to stress and temperature changes. The parabolic and biquadratic solutions for functionally graded adhesive (FGA) joints were compared. The biquadratic solution consistently yielded higher shear and peel stress values, with an increase ranging from 15% to 71% compared to the parabolic solution at various temperatures because of larger gradient of the Young's modulus distribution near the overlap ends. The ratio of peak peel stress to peak shear stress suggests selecting an adhesive with a superior peel strength or primarily reducing the peak peel stress by functionally grading is advisable, particularly if the adhesive is brittle. Comparison of stress distributions emphasize the importance of selecting adhesives based on stress type, temperature, and solution methods in optimizing adhesive bonding applications. These findings provide valuable insights for thermomechanical applications where thermal stimuli may be used for controlled debonding.
Keywords:
stress distribution
; adhesive bonding
; temperature effects
; finite element analysis
; analytical solutions
1. Introduction
The demand for adhesive bonding in structural application is growing in various industries. Adhesives can vary in terms of their ductility, brittleness, temperature resistance, water absorption and whether they are made of thermoset or thermoplastic polymers [1]. Epoxy adhesives are widely utilized for structural purposes due to their excellent bonding capabilities to various materials and ease of processing [2]. The market value of epoxy was $5.9 billion in 2019 and is projected to reach $10.3 billion by 2027 [3]. Despite their widespread use and economic importance, the non-biodegradable nature of epoxy adhesives raises environmental concerns especially when adhesively bonded structures reach their end-of-life (ELV) [3,4]. Typically, polymers and composite materials end up in landfills or are incinerated, which are the least favored methods of disposal according to the waste management hierarchy [5]. By 2050, it is estimated that the world will face up to 43 million tons of waste from decommissioned wind turbine blades which are predominantly made of glass fiber reinforced polymers (GFRP) [6]. With the electric vehicle market growing, structural adhesives play a significant role in assembling battery packs. This growth could lead to an increase in battery waste. For example, 1 million electric vehicles could generate 250,000 tons of used batteries [7]. With over 16 million electric vehicles as of 2022, it is important to adopt a circular economy now to manage waste and recover valuable battery materials before it becomes unmanageable. These statistics and projections underscore the urgency for the development of modern adhesives exhibiting switchable (i.e., reversible) adhesion characteristics while maintaining high performance and strength properties under service conditions, as depicted in Figure 1 [8]. This approach helps preventing damage and support the reusing, recycling and repurposing of materials, aligning with the principles of the waste management hierarchy.
The linear economic model, as illustrated in Figure 2 (a), relies on fundamentally unsustainable production processes due to their lack of material recycling and reuse. The future development and testing of products will focus heavily on the disassembly processes of adhesively bonded items as depicted in Figure 2, with a particular focus on enabling raw material recovery and facilitating repairs [9]. Upcoming product designs should include explicit disassembly requirements in their specifications to align with the principles of the circular economy and contribute positively to the ecological balance. Thus, the selection of adhesives should not only be based on their mechanical and thermal properties, but also on their reusability, recyclability and degradability without causing harm to the environment. Incorporating such considerations early in the design phase could lead to the development of innovative adhesive materials that are both robust for use and sustainable for end-of-life processing.
Numerous technologies are currently being developed to facilitate debonding-on-demand, employing various types of triggers (Figure 3). In the Circular Bonding initiative, various debonding methods, namely convection, induction, thermally expandable particles (TEP), electric, microwave, and ultraviolet treatments were examined for their application at a laboratory scale for smartphones [10]. The use of electricity was by far the most cost-effective method [11]. This cost-effectiveness is a critical factor in the commercial viability and potential widespread adoption of such technologies. Based on their ranking for each debonding technique across various criteria, induction, TEPs, electricity and convection were identified as the only debonding technologies with the market potential [12]. These four techniques require heat generation necessary for thermal debonding process.
When incorporating thermal stimuli techniques into composite materials like GFRP, it is vital to thoroughly understand the thermal and structural performance of the materials. This ensures the debonding process does not cause thermal and/or mechanical deformation, which could affect the structural integrity and durability of the GFRP joints under service conditions. Apart from the geometrical and mechanical properties of the adherend materials, the mechanical properties of the adhesive, such as ductility, stiffness, and toughness, play a significant role in stress distribution along the bondline. One of the key issues here is the occurrence of peak stresses at the overlap ends, particularly for brittle adhesives [13]. These peak stresses can lead to premature joint failures. To address this issue, bi-adhesive (functionally graded) and flat joggle flat (FJF) joints have been identified as effective methods [14,15]. The common method of making functionally graded adhesive joints (FGA) is using two adhesives with different stiffness such as Hysol® EA 9696 and 3M™ DP490 epoxy adhesives which have gained widespread acceptance by various industries in structural applications, with the former being particularly renowned for its exceptional toughness, an important characteristic for the adhesion of different materials as indicated in [16]. Conversely, DP490 has been characterized as a more brittle structural adhesive, as detailed in [17]. Both adhesives exhibit high temperature resistance with distinct stiffness at both room and elevated temperatures. Silva et al. [18] found that graded adhesive joints using both a low-temperature adhesive (LTA) and a high-temperature adhesive (HTA) exhibited improved performance, including increased load capacity, in comparison to using HTA at low temperatures or LTA at high temperatures individually. However, the mixed joints did not surpass the performance of LTA alone at low temperatures or HTA alone at high temperatures. Stein et al. [19] introduced a novel computational method to optimize the distribution of thermal and mechanical stresses in FGA joints. The new analytical approach presented by them is significant for evaluating stress in composite adhesive lap joints under different loading conditions. Their results, confirmed by FEA, demonstrate the framework's ability to predict stress distributions and identify the most effective grading functions for lightweight FGA joint design.
To improve bonding and debonding characteristics of adhesive joints, fillers are commonly employed to functionalize the adhesive bondline. According to Gupta et al. [20], neat epoxy typically exhibits explicit brittleness and poor fracture toughness, leading to catastrophic failure. It continues to state that the incorporation of nanoparticles, also called fillers, can enhance both properties. In our previous studies, different approaches were employed such as interleaving three carbon fiber veils to facilitate Joule heating of the EA9696 structural film adhesive [21]. In another study, thermally expandable particles (TEPs) with varying weight content were mixed with DP490 two-part epoxy adhesive to induce stress concentration at high temperatures [22]. Iron oxide (Fe3O4) particles were incorporated into the DP490 adhesive to enable electromagnetic induction heating of dissimilar joints [23].
An alternative approach to the fabrication of FGA joints involves the incorporation of filler materials within the bondline. This method allows for the tailoring of thermal and mechanical properties to meet specific requirements of the joint. Incorporating fillers into the joints can enable them to outperform both use of LTAs at low temperatures and HTAs at elevated temperatures. However, the challenge lies in the uniform distribution of these filler materials to avoid weak spots that could compromise the integrity of the joint. To address this challenge, recent studies have focused on the development of advanced mixing techniques that can ensure a more homogeneous dispersion of fillers within the adhesive. Jia et al. [24] introduced graphene nanoplatelets (GNP) into epoxy resin to create composite adhesives with increased modulus. They formed a bondline with a gradient in modulus by placing high-modulus adhesives containing GNP at the center and medium-modulus neat epoxy at the edges. The FGA joints with a lateral size configuration of high-modulus edge region: medium-modulus center region: high-modulus edge region in a ratio of 1:3:1 demonstrate remarkable enhancements of 210.1%, 350%, and 1118.58% in failure load, elongation at break, and toughness, respectively. In their study, Kumar et al. [25] observed that by adjusting the stiffness at the center and compliance at the edges of the adhesive joints, they achieved significant improvements in strength and toughness without compromising joint stiffness. Both the center stiffness and edge compliance tailored adhesive designs exhibited over a 100% increase in strength and a 150% increase in toughness compared to non-tailored (with added stiffness/compliance) and constant modulus counterparts. These improvements were attributed to a reduction in peak peel and shear strains at the ends of the adhesive. Considering these studies, stress analysis at elevated temperatures is as crucial as room temperature analysis for evaluating FRP joints bonded with various epoxy adhesives and fillers. Understanding the behavior of these materials under thermal stress is key to ensuring the reliability and safety of structures with these bonded joints. This approach to thermal stimuli debonding, combined with stress analysis across temperatures, marks an important step forward in adhesive technology and the use of composite materials.
Bending moment plays an important role in the analysis of adhesive joints, particularly in understanding stress distribution and failure mechanisms. An early study by Volkersen [26] introduced the shear lag theory account for only shear stresses, prompting the development of more comprehensive stress analysis methods by Goland and Reissner [27] which incorporate bending moments at the ends of the overlap region as boundary conditions. Redmann et al. [28] demonstrated the significance of testing both single lap joint samples and block shear samples. Block shear samples exhibited more than 100% strength compared to single lap samples. This was because bending in the overlap region was eliminated during the tests, leading to pure shear. To address the issue of insufficient determination of the bending moment, Hart-Smith [29] developed a novel bending moment factor. Zhao et al. [30] proposed a new method for accurately determining the bending moments joints of similar adherends, surpassing Goland and Reissner's method and Hart-Smith's method for overlap lengths up to 25 mm.
Timoshenko [31] predicted that stress concentrations occur at the free edge of a bi-metal interface. Subsequent studies have similarly indicated that failure initiation tends to occur at the bi-material corner within the adhesive bondline, where singularities manifest as locus of failure at room temperature [32,33] and under thermal loading [34,35]. Adhesive joints typically involve multiple materials, resulting in nonlinear behavior under applied loads. Finite Element Analysis (FEA) is a valuable numerical technique for predicting stress-strain distribution including the singularity at the adhesive/adherend interface, particularly in the presence of nonlinearities such as geometry, material properties, and boundary conditions.
This comprehensive study presents a critical examination of the behavior of adhesive joints under thermal and mechanical loading. Understanding underlying mechanism is essential for the success of debonding-on-demand applications. This study considers the concept of on-demand debonding facilitated by thermomechanical stimuli, a technique that holds promise for applications requiring reversible adhesion. This aspect of the research explores a new frontier in adhesive technology, potentially paving the way for advancements in material design and structural engineering. By investigating how different thermal and mechanical loadings can cause different stress distributions, this study aims to provide insights into the performance and disassembly of bonded GFRP joints under a variety of temperature regimes, thereby contributing to the broader understanding of adhesive joint behavior in practical applications. Peel stress at the mid-section is more critical than shear stress as well as peel stress at the interface in determining SLJ shear strength, emphasizing the need to carefully analyze peel stress and the bending moment factor in SLJ design. The study also explores the analytical solutions proposed by Goland and Reissner, with modifications by Hart-Smith (HS) and Zhao, to understand the limitations and discrepancies when compared to FEA results. Through finite element analysis (FEA), we were able to obtain detailed mappings of the stress concentrations that occur both at the adhesive/adherend interface, as well as at the mid-section of the bondline thickness of the adhesive. This analysis has enabled a clearer visualization of how both shear and peel stresses are distributed across these critical points in the bonding area. By mapping out stress distributions, the study emphasizes the importance of adhesive selection based on stress type, temperature, and solution methods in optimizing adhesive bonding applications. The insights deduced from this research aim to guide the development of modern adhesives, balancing high performance with environmental considerations, contributing to the advancement of sustainable adhesive technologies.
Lastly, this study explores the concept of FGA joints and assess their effects on stress distribution. By adjusting the stiffness of these FGA joints using the experimental data from two structural epoxy adhesives, we computationally considered the incorporation of fillers at different weight percentages (wt.%). This comprehensive exploration of the FGA joints’ potential can reveal innovative strategies to significantly enhance the performance and extend the longevity in real world applications. The exploration of FGA joints leads us to consider the adaptability of adhesive technologies in response to changing environmental conditions, potentially revolutionizing the way we approach the design and reusing of composite materials.
2. Materials and Methods
2.1. Materials
The GFRP laminates and epoxy adhesives play a critical role in the behavior of adhesive joints under thermal and mechanical loading. To comprehensively analyze the performance of these materials, a series of mechanical tests were conducted as reported in our previous studies [21,22,23] including tensile testing, shear testing, and thermomechanical analysis.
GFRP laminates are made of G17500 unidirectional glass fiber prepregs (delivered by Weihai GuangWei Composites Co., Ltd., China). The composite adherends are manufactured unidirectionally by consolidating 20 and 25 layers of prepregs under 120°C, 0.08 MPa vacuum pressure, resulting in a laminate thickness of 2.5 or 3.3 mm. This process is conducted in an autoclave following the supplier’s recommended curing cycle, as detailed in our previous study [22]. The properties of GFRP were assumed to be isotropic in Table 1. This simplification was adopted to maintain consistency with the Goland and Reissner's method [27]. A study by Haghani [36] has shown that using a linear-elastic model for the adhesive material and an isotropic material model for laminates can provide sufficiently accurate prediction of maximum strain in the adhesive joints under investigation. While an orthotropic material model for laminates resulted in lower shear strain and higher peel strain compared to an isotropic model, a comparison with empirical results revealed that the isotropic model provided more accurate predictions for both shear and peel strains. This indicates that the strain distribution in the adhesive layer is minimally influenced by the transverse properties of the composite laminate. This observation justified implementation of an isotropic laminate material model for numerical and analytical simulations, despite the inherently orthotropic nature of GFRP laminates.
Hysol EA9696 is a structural epoxy film adhesive known for its exceptional toughness and ability to withstand high service temperatures, as indicated in Table 2.
3M™ Scotch-Weld™ DP490 is a two-part epoxy adhesive that is designed for use in high-temperature applications, as depicted in Table 3. It is resistant to a temperature resistance, water, solvents, and chemicals.
2.2. Analytical Methods
In single lap joints, eccentricity occurs when the load is not applied in line with the centroid of the adhesive. This can happen due to misalignment. The eccentricity introduces a moment and transverse force into the joint, which affects its load-carrying capacity and failure modes. This eccentricity in a single lap joint can lead to several failure modes. The specific response depends on factors such as the magnitude and direction of the eccentricity, adhesive properties, adherend materials, and joint geometry. Thus, it is crucial to determine the bending moment accurately. This section addresses the determination of shear and peel stress for single lap joints with balanced, identical adherends under a bending moment. The analysis implements three distinct analytical methods from Goland and Reissner, Hart-Smith, and Zhao to obtain the bending moment factor and incorporates finite element analysis (FEA) for comparison and validation.
In their work, Goland and Reissner [27] incorporated peel stress and shear stress analysis into the study of single lap joints. The stress analysis begins by determining the bending moments at the ends of the overlap region by solving the equilibrium equations. The distribution of shear stress at the bondline mid-section, denoted as τ, is obtained using the following equation:
where is the tensile load per unit width, c is half of the overlap length, t is the adherend thickness, x is the distance from the origin located in the middle and k is the bending moment factor:
where is the shear modulus of the adhesive, is the adhesive thickness, E is Young’s (elastic) modulus of adherend and is Poisson’s ratio of the adherend.
The peel stress distribution, σ, is given by:
It has been observed that the Goland and Reissner approach tends to underestimate the bending moment for composite laminate adherends [40], while overestimating it for metal adherends [30]. To address this issue, Zhao et al. [30] introduced a new method for determining the bending moments based on the premise that the overlap region remains undeformed under applied loads. This assumption stems from the recognition that the bending stiffness of the overlap section significantly exceeds that of individual adherends, given that bending stiffness is proportional to the cube of thickness. Furthermore, experimental evidence supported their assumption, showing minimal deformation in the overlap region during loading. This method aims to overcome the overestimation of the bending moment factor in joints with a 25 mm overlap length. The proposed solution is below:
Hart-Smith [29] introduced a novel formula for calculating the bending moment factor. The formula is as follows:
It was assumed that the shear modulus of modified adhesives is proportional to their Young's modulus. The properties of both adherends and adhesives can be found in Table 1, Table 2, Table 3, Table 4 and Table 5. The bending moment factor was calculated using equations: 2, 14 and 17, enabling the determination of shear stress and peel stress in the overlap region accordingly.
FGA joints involve using adhesives with varying material properties to create a smooth transition in the bondline. The strategic placement of a flexible adhesive at the overlap ends enhances the distribution of stresses and strains along the bonded interface. The adhesive properties are tailored to gradually transition from one region to another, improving performance and stress distribution. Thus, it was included a model of FGA joints to observe the effect on the stress distribution.
The parabolic distribution of Young’ modulus, , is given by [41,42]:
where and are the maximum and minimum adhesive Young’s modulus, respectively.
Similarly, the biquadratic distribution of Young’ modulus, , is computed using the following equation [41,42]:
The room temperature model takes into account a load of 300 N/mm, whereas the elevated temperature model considered a load of 150 N/mm.
2.3. FEA Method
The mechanical properties obtained from the experimental data were integrated into finite element models using Autodesk Inventor Nastran®. The FEA models simulated the behavior of the adhesive joints under varying mechanical loading conditions depending on the temperature properties. A nonlinear static model was employed where the model consisted of 311,589 nodes and 181,956 elements using parabolic meshes. An investigation on mesh convergence was conducted to ensure that the results at mid-section were consistent and not affected by the mesh size used in the simulations. The interface conditions were used to simulate perfect bonding between adhesive and adherends. The boundary conditions for the model can be seen in Figure 4. The adhesive thickness was assumed to be 0.5 mm, with an overlap length and width of 25 mm, while the adherend's length was 100 mm for all joints. The prescribed thickness for the adherends in EA9696 adhesive joints was 2.5 mm, while for DP490 adhesive joints and FGA joints it was 3.3 mm as demonstrated in Figure 4. The tensile strength of the modified adhesives was assumed to be the same as that of neat epoxy at both room temperature and elevated temperatures.
3. Results and Discussion
Figure 5, Figure 6, Figure 7 and Figure 8 show the peel stress and shear stress computed by finite element analysis at two locations: the adhesive/adherend interface and the mid-section of the bondline thickness. The load applied to various joint configurations ranges from 40 N/mm to 300 N/mm, with EA9696 and its combinations with CN34, CN10, and N34 were simulated at room temperature under 300 N/mm load, while the same configurations at 100°C were modelled at reduced loads of 150 N/mm for EA9696 and EA9696+CN10, and 40 N/mm for EA9696+CN34 and EA9696+N34. These adjustments in the loading conditions were made in light of the findings presented in [21], which detailed the performance outcomes of single lap joint experiments.
The joint configurations using DP490 adhesive and its variants with 5, 10, and 15 wt.% TEPs at room temperature conditions are modelled under a load of 240 N/mm, while the same configurations at 145°C were simulated at a reduced load of 60 N/mm. This reduction in the applied load during high-temperature testing was based on the empirical results documented in [22].
The presence of load eccentricity in the joint results in substantial rotations, leading to significant peak stresses at specific locations. In other words, the uneven distribution of the load causes pronounced rotations within the joint, causing high stress concentrations at those specific locations. The stress distributions are asymmetric at the interface, with a singularity at the square edge corner. At the mid-section, the stress distributions are relatively symmetric, with decreasing peak stresses. The conventional analytical models assume a symmetrical distribution of adhesive displacement with respect to the central axis. However, empirical observations reveal that displacement is greater on the load application side (actuator side) compared to the stationary grip side [43]. Additionally, in high-temperature configurations, it is anticipated that the thermal mismatch between different materials will introduce additional stress singularities at the interface [31].
It has been observed that shear stresses at the overlap edge are higher than at the center due to differential shearing. Peel stresses exhibited the similar behavior. This phenomenon is a primary contributor to the delamination in FRP adherends. As reported in [14,15], reinforcing the adhesive layer leads to reduction in percentage of delamination of composites and percentage of cohesive failure. The stress distribution for both neat DP490 and EA9696 joints at room temperature as shown in Figure 5 and Figure 7, respectively, indicate the peak peel stresses for both neat DP490 and EA9696 were higher than the remaining configurations. This observation further supports the benefits of reinforcing the adhesive layer in SLJs. Consistently, when we reinforced the adhesive layer with either TEPs or by interleaving carbon fiber veil, we observed an increase in the average percentage of adhesive residue and decrease in percentage of light-fiber-tearing (i.e., delamination) [21,22]. This highlights the benefits of reinforcing adhesive layers in terms of reducing delamination and improving overall joint performance, specifically improving static strength and extending fatigue life by delaying the onset of crack initiation associated with stress singularities [44].
Analysis of Figure 6 and Figure 8 reveals a significant decrease in peak peel stresses at elevated temperatures across all joint configurations. For DP490 joint configurations, the peak peel stresses at the adhesive/adherend interface reduced by 85.7% (0 wt.% TEPs), 75.5% (5 wt.% TEPs), 81.9% (10 wt.% TEPs) and 83.5% (15 wt.% TEPs). This reduction correlates with the absence of fiber-tearing observed in experimental tests, as reported in [22]. In the case of EA9696 configurations, the results were more varied. Neat EA9696 and EA9696+CN10 joints exhibited a reduction in peak peel stresses at the adhesive/adherend interface of 48.9% and 36.1%, respectively, which corresponded to a noticeable decrease in light-fiber-tearing, as reported in [21]. More pronounced effects were observed in EA9696+CN34 and EA9696+N34 joints, where peak peel stresses at the adhesive/adherend interface dropped by 86.6% and 84.6%, respectively, resulting in no observable fiber-tearing.
Evaluation of Figure 5 and Figure 6 unveiled that the shear stress of the joints initially decreases and subsequently increases with the increment of TEPs wt.%. This behavior suggests that the shear stress is related to the shear modulus and Young’s modulus of the adhesive, as detailed in Table 4.
The ratios of peak peel stresses at the interface, to experimental shear strength, [22 for 0, 5, 10 and 15 wt.% TEPs at room temperature are 8.17, 5.79, 6.45 and 7.06, respectively. The ratios of peak peel stress at the bondline mid-section, , to [22] for the same weight percentages of TEPs are consistently at 2.42, regardless of the amount of TEPs added. The ratios of peak shear stresses at the interface, to [22] for 0, 5, 10 and 15 wt.% TEPs at room temperature are 5.69, 5.74, 5.53 and 6.09, respectively. The ratios of peak shear stress at the bondline mid-section, , to [22] for the same wt.% TEPs at room temperature are 3.06, 3.31, 3.22 and 3.18, respectively.
The ratios of peak peel stresses at the interface, to [22] for 0, 5, 10 and 15 wt.% TEPs at 145℃ are 8.71, 6.06, 8.71 and 8.71, respectively. The ratios of peak peel stress at the bondline mid-section, , to [22] remain unchanged at 3.52 across all configurations for the different percentages of TEPs. The ratios of peak shear stresses at the interface, to [22 for 0, 5, 10 and 15 wt.% TEPs at 145℃ are 5.00, 4.96, 4.85 and 4.85, respectively. The ratios of peak shear stress at the bondline mid-section, , to [22] for 0, 5, 10 and 15 wt.% TEPs at 145℃ are 2.95, 2.92, 2.99 and 2.92, respectively.
The observed variations in stress-to-strength ratios clearly indicate that the concentration of TEPs and temperature variations have a significant impact on the magnitude of stresses experienced. This intricate interplay suggests that adjusting TEP levels could be a key factor in tailoring the performance of adhesive joints. Notably, the stress-to-strength ratios measured at the bondline mid-section exhibited an upward trend with rising temperatures. This implies that the bondline mid-section has more significant effect on the strength of the adhesive at higher temperatures. This observation also confirms that rotation angle was lowered at 145℃ (Figure 10) compared to room temperature (Figure 9). This evidence emphasizes the importance of monitoring temperature variations when determining the debonding temperature of the adhesive joints.
As the stiffness of the adherend increases, there is a corresponding decrease in the ratio of peak peel stress to peak shear stress, [45]. This trend indicates that stiffer adherends tend to redistribute stresses in a way that reduces the relative magnitude of peel stresses compared to shear stresses within the joint. In neat DP490 joints, the ratio of was 2.06 at room temperature, decreasing to 1.74 at 145°C. This decrease indicates that as temperature rises above Tg of GFRP (135°C), GFRP loses its stiffness significantly as detailed in Table 1. Conversely, neat EA9696 joints demonstrated ratio of 1.48 at room temperature, which slightly increased to 1.52 at 100°C - below Tg of GFRP, thus maintaining its stiffness and showing no significant change in the ratio. Although the adherends were 32% thicker in the use of neat DP490 case compared to the use of neat EA9696 joint and hence stiffer, DP490 joints exhibited a higher ratio of because DP490 is stiffer than EA9696 under room temperature conditions (see Table 4 and Table 5). Compared to EA9696 adhesive joints, DP490 adhesive joints exhibited lower peel and shear stresses because lower Young's modulus of DP490 and using thicker adherends which improves the load-bearing capacity of the SLJ [46]. However, using thicker adherend increases both cost and the weight of structures. A comparison of tests conducted at room temperature to those performed at elevated temperatures revealed a substantial decrease in both peel and shear stresses experienced by the joints. When operating at temperatures above Tg, such as when using DP490 adhesive, the adhesive properties underwent a significant decrease, leading to heightened sensitivity of the joint's behavior to even minor temperature variations within this temperature range. This significant reduction in stress levels can be attributed to several influential factors. Firstly, the lower Young's modulus of the materials employed in the joints plays a crucial role in reducing the stresses. Moreover, the diminished levels of joint rotation observed under the different conditions also help reduce stress. Additionally, it is worth emphasizing that the applied load during these tests was notably lower (see Table 4 and Table 5), which further contributes to the overall decrease in stress levels within the joints. An increase in temperature has two effects: it reduces the yield stress of the adherend material and leads to a reduction in the failure envelope. Consequently, as the temperature rises, the stress required for failure decreases due to the decreased yield stress and the resulting shrinkage in the failure envelope [47].
The aforementioned findings indicate that the peel stress plays a dominant role in determining the experimental strength of SLJ accurately. The analytical prediction of peel stress depends on the precise calculation of the bending moment factor. Thus, three different methods for determining bending moment factors were considered to identify the most accurate one.
Figure 9, Figure 10, Figure 11 and Figure 12 illustrate comparisons of the peel stress and shear stress distributions in identical joints using both analytical and FEA solutions. The study evaluates three analytical methods - Goland and Reissner's, Hart-Smith's, and Zhao's - against FEA results for different adhesive types and temperature conditions. When comparing the outcomes for 10 wt.% TEPs-epoxy adhesive joints analyzed through Goland and Reissner's technique, Hart-Smith's procedure resulted in an 8.5% increase in peak peel stress and a 2.9% rise in peak shear stress, whereas Zhao's method led to a decrease of 0.9% in peak peel stress and 0.3% in shear stress under room temperature conditions, as shown in Figure 9a-b. Furthermore, in comparison to the findings for 10 wt.% TEPs-epoxy adhesive joints using Goland and Reissner's method, Hart-Smith's approach demonstrated an 11.1% increase in peak peel stress and a 0.6% rise in peak shear stress, while Zhao's method exhibited a reduction of 0.4% in peak peel stress and 0.02% in peak shear stress at a temperature of 145°C (Figure 10a-b).
Compared to the findings for CN34 epoxy adhesive joints using Goland and Reissner’s method, Hart-Smith's approach led to a 4.2% increase in peak peel stress and a 1.8% increase in peak shear stress, while Zhao's approach resulted in a decrease of 3.3% in peak peel stress and 1.5% in peak shear stress under room temperature conditions, as illustrated in Figure 11a-b. At an elevated temperature of 100℃, Hart-Smith's approach led to a 16.9% increase in peak peel stress and a 9.4% increase in peak shear stress, while Zhao's approach resulted in a decrease of 0.3% in peak peel stress and 0.1% in peak shear stress, as illustrated in Figure 12a-b.
Alternative methods proposed by Hart-Smith and Zhao to determine the bending moment factor showed some improvements compared to the original Goland and Reissner model. However, these modifications had a marginal impact on stress due to the neglect of transverse deflection in the overlap region, which led to an underestimation of the bending behavior [41]. The analytical solutions generally aligned well with FEA results at the adhesive joint's mid-section. However, FEA revealed significant stress differences between the interface and mid-section of the adhesive bondline, particularly at the corner interface where stress singularity was observed. Note that it is not typically taken into account in the design of adhesive joints [32]. The stress concentration at the corners can be attributed to the assumption of perfect elasticity in the solutions. The results from the Goland and Reissner solutions, including the modified approaches by Hart-Smith and Zhao, showed good agreement with peel stress around central overlap length obtained from the FEA analysis. However, there was a significant difference in the maximum shear stress. When subjected to different loads at a temperature of 100°C, the disparity between the peak shear stress predicted by the Goland and Reissner solutions and the FEA models increased. It is important to note that the analyses conducted in this study did not consider bond damage behavior, such as the use of the cohesive zone modelling (CZM) approach. The thickness of the GFRP adherend in a single lap joint significantly influences the stress distribution and the behavior of joint under bending moment and load eccentricity. When the thickness of adherend is increased, the bending stress decreases due to a reduction in the applied bending moment. Zhao 's [30] study indicated that thicker adherends (up to 6.35mm) exhibit higher stiffness, resulting in reduced bending compared to thinner adherends, leading to more accurate results for thicker adherends. The elastic solutions proposed by Goland and Reissner, as well as by Hart-Smith, exhibit a considerable degree of overlap for both adhesives. However, it is important to note that these models tend to underestimate the results from FEA across different adhesives and joint configurations. Still, the results using the methods of Goland and Reissner, Hart-Smith, and Zhao will be invaluable for the analysis of failure criteria, especially since the thickness of the adhesive layer (ta) is 0.5 mm and the ratio of overlap length to adhesive layer thickness (c/ta≥20), in accordance with the findings from both studies [48,49].
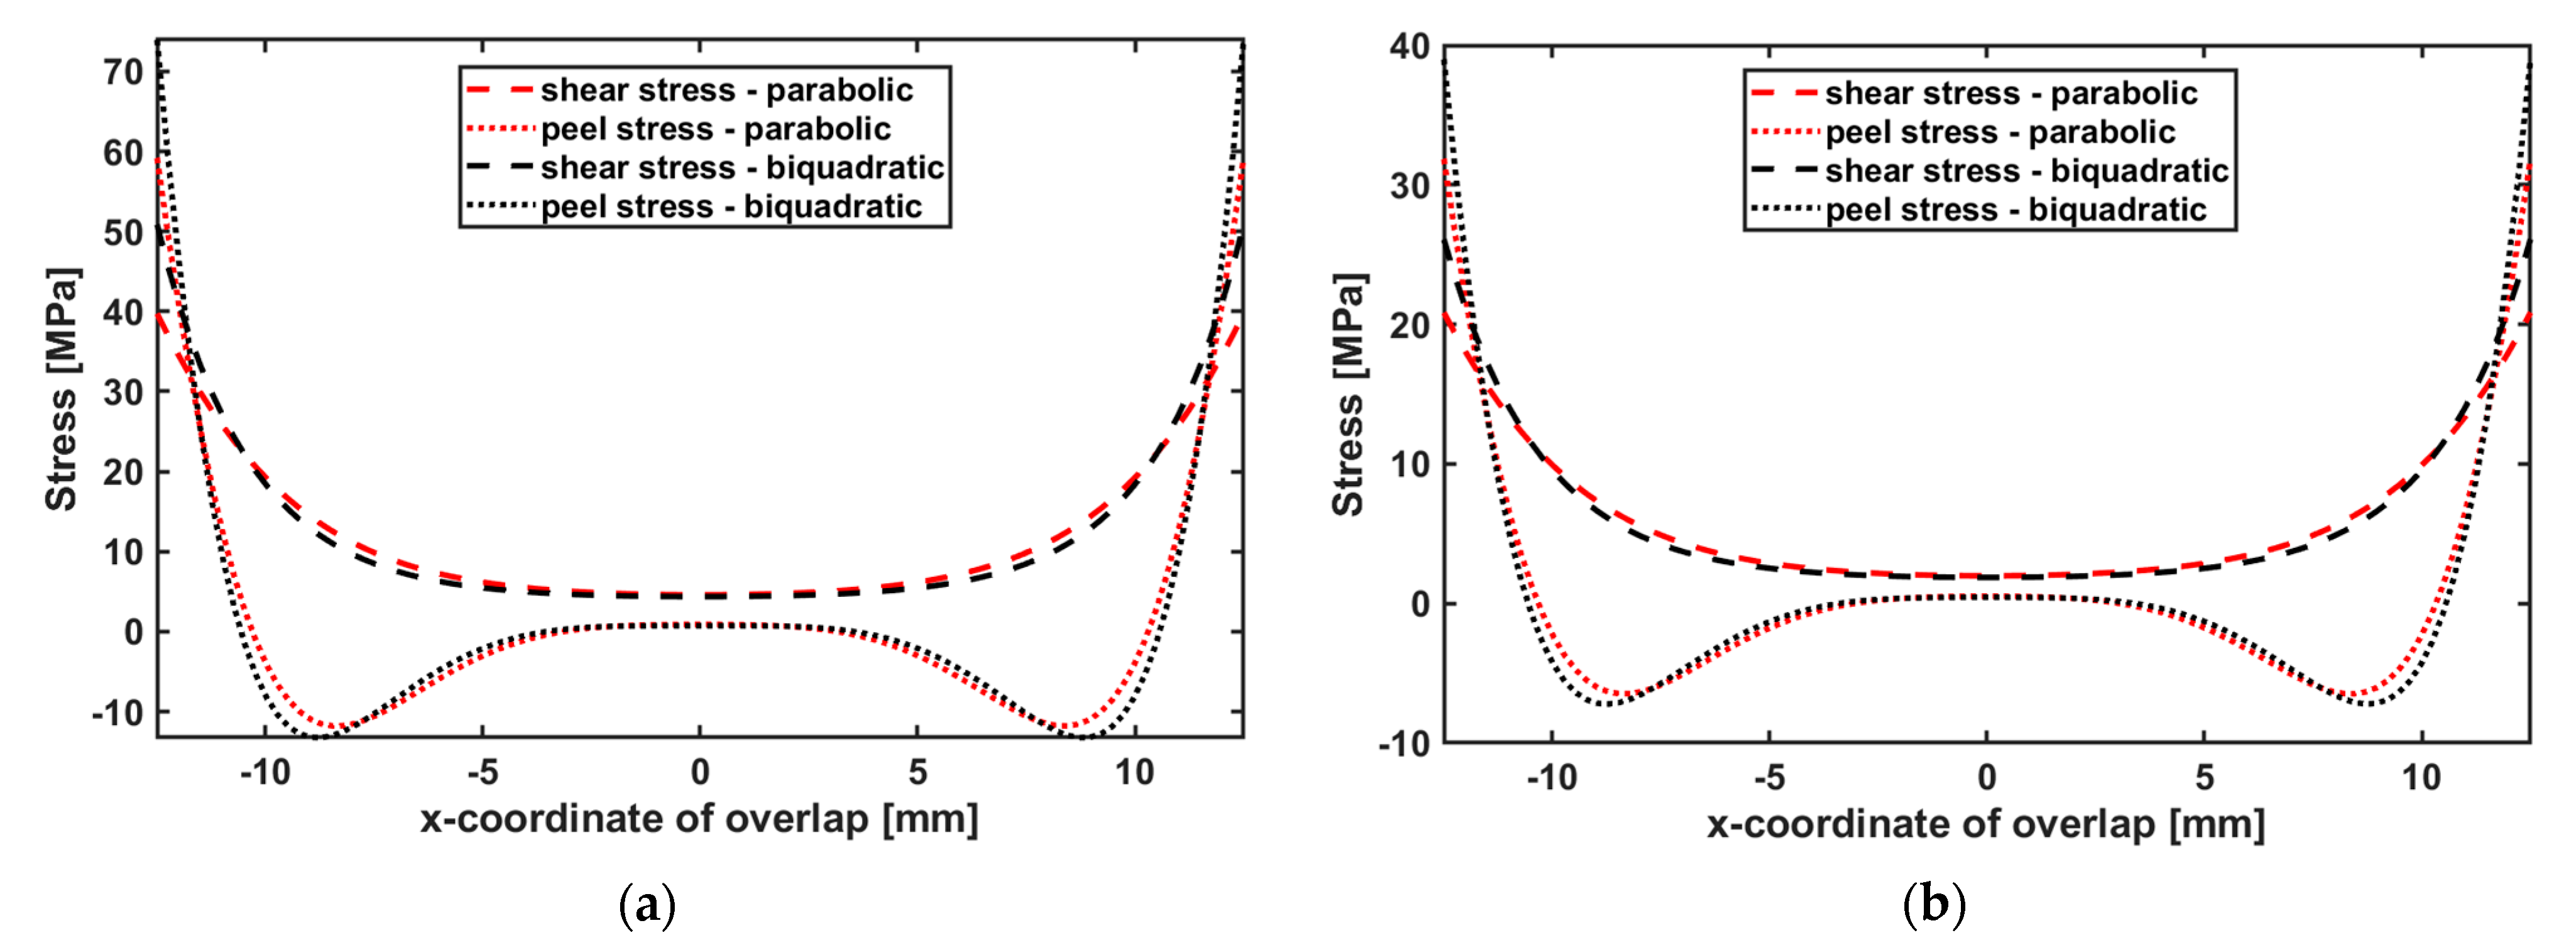
As demonstrated in Figure 13a, for adhesive joints of DP490 at room temperature (RT) and under peel stress, the parabolic solution yielded a stress of 45.2 MPa, while the biquadratic solution resulted in a slightly higher value of 52.0 MPa, indicating a difference of -15.38%. Similarly, for the shear stress type at room temperature, the parabolic solution produced a stress of 30.8 MPa, and the biquadratic solution yielded 36.1 MPa, showing a difference of -14.15%. This trend continued to be observed for the cases with an elevated temperature of 145°C as indicated in Figure 13b. In the peel stress type, the parabolic solution yielded a stress of 2.86 MPa, whereas the biquadratic solution provided a higher stress of 4.46 MPa, resulting in a difference of -55.15%. In the shear stress type at the same elevated temperature, the parabolic solution yielded a stress of 2.49 MPa, while the biquadratic solution resulted in a slightly greater stress of 3.47 MPa, demonstrating a difference of -28.17%. Comparing these results, it is evident that at both room temperature and elevated temperature, the biquadratic solution consistently provided higher stress values compared to the parabolic solution for both peel and shear stress types. The percentage differences between the two solutions indicate the extent to which these stress values diverged, with the largest difference observed at 145°C in the peel stress type.
As shown in Figure 14a, for adhesive joints of EA9696 at RT and under peel stress, the parabolic solution exhibited a stress measurement of 53.3 MPa, whereas the biquadratic solution yielded a notably higher value of 73.9 MPa, indicating a substantial variance of -38.91%. Likewise, in the shear stress category at room temperature, the parabolic solution resulted in a stress reading of 35.5 MPa, while the biquadratic solution yielded a significantly higher value of 51.3 MPa, illustrating a considerable difference of -44.45%. Upon increasing the temperature to 100°C as shown in Figure 14b, the comparative trends persisted. For the peel stress type, the parabolic solution yielded a stress level of 13.6 MPa, while the biquadratic solution resulted in a significantly higher value of 38.9 MPa, leading to a notable discrepancy of -64.91%. Similarly, within the shear stress category at the same temperature, the parabolic solution yielded a stress measurement of 7.70 MPa, whereas the biquadratic solution resulted in a significantly higher value of 26.3 MPa, indicating a substantial variance of -70.68%. Comparing the results at both room temperature and elevated temperature, the biquadratic solution consistently provided higher stress values compared to the parabolic solution for both peel and shear stress types.
Overall, the comparison indicates that both adhesives, DP490 and EA9696, displayed different behaviors in response to stress and temperature as presented in Figure 13 and Figure 14. While EA9696 consistently exhibited higher stress values, particularly under the biquadratic solution, DP490 generally showed smaller differences between solution methods. The results suggest that the parabolic solution is beneficial in reducing peak stresses at room and elevated temperatures because parabolic solution creates relatively a more gradual change in Young’s modulus distribution near the overlap [42]. This smoother transition in material properties mitigates the stress concentrations in these critical areas. Conversely, the biquadratic solution led to higher peak stresses. While this may initially appear to be a drawback, it presents a notable advantage in easier crack initiations, leading to easier debonding at elevated temperature. These observations underscore the importance of adhesive selection based on the specific stress type, temperature conditions, and solution method to ensure accurate and reliable results in adhesive bonding but also optimizing the debonding process.
4. Conclusions
This comprehensive study investigated the complex stress behaviors in GFRP joints bonded with different epoxy adhesives and fillers under a variety of temperature conditions. The analytical and FEA analysis highlighted the significant impact of load eccentricity on joint rotations, resulting in pronounced stress concentrations at specific locations. The meticulous comparison revealed the performance of joints bonded with EA9696 and DP490 adhesive systems, thereby underscoring the key role played by Young's modulus of the adhesives in the mitigation of stress. The dependency analysis reveals that the peel stress, particularly at the mid-section, plays a more critical role in influencing the experimental shear strength of the SLJ compared to the shear stress. This is an important insight for designing and evaluating SLJs, suggesting that peel stress and bending moment factor should be carefully analyzed. The ratio of peak peel stress to peak shear stress () suggests selecting an adhesive with a high peel strength or mainly lowering the peak peel stress by functionally grading is advisable, especially when using brittle adhesives. Aiming for a ratio as close to 1 as possible can be recommended, as this indicates a more favorable stress state in cases where the ratio of overlap length to adhesive layer thickness (c/ta≥20). The analytical stress solutions proposed by Goland and Reissner were examined, along with modified approaches by Hart-Smith and Zhao. Hart-Smith’s approach provides a more accurate determination in our case, particularly when the adhesive layer thickness (ta) is 0.5 mm and the ratio of overlap length to adhesive layer thickness (c/ta) is greater than or equal to 20. Zhao’s approach, on the other hand, seems more suitable for scenarios involving thicker adherends, such as 6 mm, as highlighted in their study. The results highlight the critical role of eccentricity in single lap joints, where misalignment-induced moments affect the joint's load-bearing capacity and failure modes. The findings underscore the importance of accurately quantifying bending moments to fully understand joint behavior under various loading conditions. FEA revealed discrepancies in stress solutions attributed to factors such as interface corner singularities. Visual representations provide insights into stress distributions across various joint configurations, highlighting differences between peel and shear stresses. FEA provided detailed stress distribution maps at the adhesive/adherend interface and mid-section of bondline thickness, enhancing our understanding of stress concentration in these areas. Overall, our findings underscore the necessity of rigorous adhesive selection, considering stress type, temperature conditions, and solution methods. The observed differences in stress behavior between EA9696 and DP490 adhesive joints further highlight the need for customized approaches in adhesive bonding applications. A crucial aspect of our findings was the optimization of FGA layers, which centers on manipulation of Young’s modulus of adhesive within the bondline. The biquadratic solution consistently showed higher shear and peel stress values than the parabolic solution across various temperatures. This is due to the steeper gradient of Young’s modulus at the overlap ends in the biquadratic solution, leading to more pronounced stress concentrations. By strategically adjusting the adhesive’s stiffness, one can customize how the joint responds to handling stress concentrations resulting in stronger and more reliable bonds. This careful adjustment of material properties allows the adhesive to be more flexible in high stress areas and stiffer in low stress regions effectively spreading the load across the bonded surface. Consequently, this increases the threshold at which failure happens and significantly reduces the risk of delamination in composite adherend materials. This is particularly important for composite structures which are prone to interlaminar failure by nature. Building on the concept of FGA joints, future research could explore the development of smart adhesives that change properties in response to various stimuli, thereby offering dynamic adaptability to varying thermal conditions. This study contributes valuable insights into the design and optimization of adhesive bonding and debonding applications. As adhesive bonding continues to play a key role in diverse industries, our insights provide valuable guidance for enhancing the performance and reusability of adhesive joints in real-world applications, facilitating the transition from a linear to circular economy model. In future research, the focus will be on investigating the failure criterion of adhesive joints, both in mono and functionally graded adhesive configurations.
Author Contributions
Conceptualization, H.C. and S.I.; methodology, H.C.; software, H.C.; validation, H.C.; formal analysis, H.C.; investigation, H.C.; resources, S.I.; data curation, H.C.; writing—original draft preparation, H.C.; writing—review and editing, H.C. and S.I.; visualization, H.C.; supervision, S.I., M.S. and C.K.S; project administration, S.I.
Funding
This research received no external funding.
Acknowledgments
HC thanks Nanyang Technological University, Singapore for the financial support in the form a SINGA scholarship. We acknowledge the use of ChatGPT (OpenAI, https://chat.openai.com) and Claude (Anthropic, https://claude.ai/) to assist with paraphrasing and structuring the paragraphs in the initial draft. We would like to thank The Noun Project (https://thenounproject.com/) for providing the graphics used in Figure 2 and Figure 3.
Conflicts of Interest
The authors declare no conflicts of interest.
References
- Da Silva, L.F.; Öchsner, A.; Adams, R.D. Handbook of adhesion technology. Springer Science & Business Media; 2011. [CrossRef]
- Zhao, L.; Li, H.; Qiao, Y.; Bai, X.; Wang, D.; Qu, C.; Xiao, W.; Liu, Y.; Zhang, J. Accelerated-curing epoxy structural film adhesive for bonding lightweight honeycomb sandwich structures. Journal of Applied Polymer Science. 2023. [CrossRef]
- Mulcahy, K.R.; Kilpatrick, A.F.; Harper, G.D.; Walton, A.; Abbott, A.P. Debondable adhesives and their use in recycling. Green Chemistry, 24(1):36-61. 2022. [CrossRef]
- Lu, Y.; Broughton, J.; Winfield, P. A review of innovations in disbonding techniques for repair and recycling of automotive vehicles. International Journal of Adhesion and Adhesives. 2014 Apr 1;50:119-27. [CrossRef]
- Environmental sustainability status in the Aviation Maintenance and Production Organisation (M&P) Domain - Study – Assessment of the environmental sustainability status in the Aviation Maintenance and Production Organisation (M&P) Domain | EASA. Available online: https://www.easa.europa.eu/en/document-library/research-reports/study-assessment-environmental-sustainability-status-aviation (accessed on 31 Jul 2024).
- Liu, P.; Barlow, C.Y. Wind turbine blade waste in 2050. Waste Management, 62, pp.229-240. 2017. [CrossRef]
- Scott, S.; Islam, Z.; Allen, J.; Yingnakorn, T.; Alflakian, A.; Hathaway, J.; Rastegarpanah, A.; Harper, G.D.; Kendrick, E.; Anderson, P.A.; Edge, J. Designing lithium-ion batteries for recycle: The role of adhesives. Next Energy, 1(2), p.100023. 2023. [CrossRef]
- Liu, Z.; Yan, F. Switchable adhesion: on-demand bonding and debonding. Advanced Science, 9(12), p.2200264. 2022. [CrossRef]
- Groß, A.; Mayer, B; Haag, K. Circular Economy and Adhesive Bonding Technology, Part 3. adhesion ADHESIVES+ SEALANTS, 19(2), pp.14-17. 2022. [CrossRef]
- Circular Bonding COOCK, M5: Circularity potential of circular bonding technologies. Available online: https://circularbonding.be/sites/circularbonding/files/downloads/Circular%20potential%20debonding%20technologies.pdf (accessed on 31 Jul 2024).
- Vanderreydt, I.; De Smet, S.; Pals, E.; Parchomenko, A.; Van Opstal, W. The circular economy potential of reversible bonding in smartphones. Sustainable Production and Consumption, 41, pp.362-378. 2023. [CrossRef]
- Circular bonding COOCK project - Report on reversible adhesive bonding technologies. Available online: https://circularbonding.be/sites/circularbonding/files/downloads/Overview%20of%20reversible%20bonding%20technologies.pdf (accessed on 31 Jul 2024).
- Fernandes, T.A.; Campilho, R.D.; Banea, M.D.; da Silva, L.F. Adhesive selection for single lap bonded joints: experimentation and advanced techniques for strength prediction. The Journal of Adhesion, 91(10-11), pp.841-862. 2015. [CrossRef]
- Akhavan-Safar, A.; Eisaabadi B.G.; Jalali, S.; Beygi, R.; da Silva, L.F. Impact fatigue life improvement of bonded structures using the bi-adhesive technique. Fatigue & Fracture of Engineering Materials & Structures, 45(5), pp.1379-1390. 2022. [CrossRef]
- Ramezani, F.; Simões, B.D.; Carbas, R.J.; Marques, E.A.; da Silva, L.F. Developments in laminate modification of adhesively bonded composite joints. Materials, 16(2), p.568. 2023. [CrossRef]
- de Freitas, S.T.; Sinke, J. Failure analysis of adhesively-bonded metal-skin-to-composite-stiffener: Effect of temperature and cyclic loading. Composite Structures, 166, pp.27-37. 2017. [CrossRef]
- Chiminelli, A.; Breto, R.; Izquierdo, S.; Bergamasco, L.; Duvivier, E.; Lizaranzu, M. Analysis of mixed adhesive joints considering the compaction process. International Journal of Adhesion and Adhesives, 76, pp.3-10. 2017. [CrossRef]
- Da Silva, L.F.; Adams, R.D. Joint strength predictions for adhesive joints to be used over a wide temperature range. International Journal of Adhesion and Adhesives, 27(5), pp.362-379. 2007. [CrossRef]
- Stein, N.; Rosendahl, P.L.; Becker, W. Homogenization of mechanical and thermal stresses in functionally graded adhesive joints. Composites Part B: Engineering, 111, pp.279-293. 2017. [CrossRef]
- Gupta, S.K.; Shukla, D.K.; Kaustubh Ravindra, D. Effect of nanoalumina in epoxy adhesive on lap shear strength and fracture toughness of aluminium joints. The Journal of Adhesion, 97(2), pp.117-139. 2021. [CrossRef]
- Caglar, H.; Idapalapati, S.; Sharma, M.; Chian, K.S. Debonding of carbon fiber veil interleaved adhesively bonded GFRP joints via Joule heating. Composites Part B: Engineering, 230, p.109544. 2022. [CrossRef]
- Caglar, H.; Idapalapati, S.; Sharma, M.; Chian, K.S. Debonding of bonded composite joints with TEP modified epoxy adhesives. The Journal of Adhesion, 99(10), pp.1626-1649. 2023. [CrossRef]
- Caglar, H.; Aksoy, Y.A.; Idapalapati, S.; Caglar, B.; Sharma, M.; Chian, K.S. Debonding-on-demand Fe3O4-epoxy adhesively bonded dissimilar joints via electromagnetic induction heating. The Journal of Adhesion, 100(8), pp.734-764. 2024. [CrossRef]
- Jia, Z.; Yu, J.; Liu, Q.; Yu, S.; Wang, Z. Functionally graded adhesive joints with exceptional strength and toughness by graphene nanoplatelets reinforced epoxy adhesives. International Journal of Adhesion and Adhesives 125, 103402. 2023. [CrossRef]
- Kumar, S.; Wardle, B.L.; Arif, M.F. Strength and Performance Enhancement of Bonded Joints by Spatial Tailoring of Adhesive Compliance via 3D Printing. ACS Appl. Mater. Interfaces 9, 884–891. 2017. [CrossRef]
- Volkersen, O. Die Nietkraftverteilung in zugbeanspruchten Nietverbindungen mit konstanten Laschenquerschnitten. Luftfahrtforschung, vol. 15, no. 1/2. 1938.
- Goland, M.; Reissner, E. The stresses in cemented joints. 1944. [CrossRef]
- Redmann, A.; Damodaran, V.; Tischer, F.; Prabhakar, P.; Osswald, T.A. Evaluation of Single-Lap and Block Shear Test Methods in Adhesively Bonded Composite Joints. J. Compos. Sci. 5, 27. 2021. [CrossRef]
- Hart-Smith, L.J. Adhesive-bonded single-lap joints (No. NASA-CR-112236). 1973.
- Zhao, X.; Adams, R.D.; Da Silva, L.F.M. A new method for the determination of bending moments in single lap joints. International Journal of Adhesion and Adhesives 30, 63–71. 2010. [CrossRef]
- Timoshenko, S. Analysis of Bi-Metal Thermostats. J. Opt. Soc. Am. 11, 233. 1925. [CrossRef]
- Tang, J.H.; Sridhar, I.; Srikanth, N. Static and fatigue failure analysis of adhesively bonded thick composite single lap joints. Composites Science and Technology 86, 18–25. 2013. [CrossRef]
- Tsai, M.Y.; Morton, J. An evaluation of analytical and numerical solutions to the single-lap joint. International Journal of Solids and Structures 31, 2537–2563. 1994. [CrossRef]
- Tsai, M.Y.; Morton, J. A stress analysis of a thermally loaded bimaterial interface: A localized hybrid analysis. Mechanics of Materials 13, 117–130. 1992. [CrossRef]
- Chen, W.T.; Nelson, C.W. Thermal Stress in Bonded Joints. IBM J. Res. & Dev. 23, 179–188. 1979. [CrossRef]
- Haghani, R. Analysis of adhesive joints used to bond FRP laminates to steel members – A numerical and experimental study. Construction and Building Materials 24, 2243–2251. 2010. [CrossRef]
- Dang, N.H.; Idapalapati, S.; Srikanth, N. Fracture behavior of cross-ply fibre reinforced composite laminates with cracks under biaxial loading conditions. In Proceedings of the 20th International Conferences on Composite Materials (ICCM20), Copenhagen, Denmark (pp. 19-24). 2015.
- Henkel Corporation. LOCTITE EA 9696 AERO. Available online: https://www.aero-consultants.ch/view/data/3285/Aero%20Consultings/PDF/LOCTITE_EA_9696_AERO.pdf (accessed on 6 August 2024).
- Tomblin, J.; Seneviratne, W.; Escobar, P.; Yoon-Khian, Y., Shear stress-strain data for structural adhesives. US Department of Transportation Federal Aviation Administration Office of Aviation Research, Washington, DC, Rapport technique DOT/FAA/AR-02/97. 2002.
- 3M. DP490 Scotch-Weld™ Adhesive. Available online: https://multimedia.3m.com/mws/media/82790O/dp490-scotch-weld-tm-adhesive.pdf (accessed on 6 August 2024).
- Talmon l’Armée, A.; Stein, N.; Becker, W. Bending moment calculation for single lap joints with composite laminate adherends including bending-extensional coupling. International Journal of Adhesion and Adhesives 66, 41–52. 2016. [CrossRef]
- Stein, N.; Mardani, H.; Becker, W. An efficient analysis model for functionally graded adhesive single lap joints. International Journal of Adhesion and Adhesives 70, 117–125. 2016. [CrossRef]
- Vijaya kumar, R.L.; Bhat, M.R.; Murthy, C.R.L. Analysis of composite single lap joints using numerical and experimental approach. Journal of Adhesion Science and Technology, 28(10), pp.893-914. 2014. [CrossRef]
- Malekinejad, H.; Carbas, R.J.C.; Akhavan-Safar, A.; Marques, E.A.S.; Castro Sousa, F.; Da Silva, L.F.M. Enhancing Fatigue Life and Strength of Adhesively Bonded Composite Joints: A Comprehensive Review. Materials 16, 6468. 2023. [CrossRef]
- Reis, P.N.B.; Ferreira, J.A.M.; Antunes, F. Effect of adherend’s rigidity on the shear strength of single lap adhesive joints. International Journal of Adhesion and Adhesives 31, 193–201. 2011. [CrossRef]
- Özel, A.; Aydin, M.; Temiz, Ş. The effects of overlap length and adherend thickness on the strength of adhesively bonded joints subjected to bending moment. Journal of Adhesion Science and Technology 18, 313–325. 2004. [CrossRef]
- Grant, L.D.R.; Adams, R.D.; Da Silva, L.F.M. Effect of the temperature on the strength of adhesively bonded single lap and T joints for the automotive industry. International Journal of Adhesion and Adhesives 29, 535–542. 2009. [CrossRef]
- Quispe Rodríguez, R.; De Paiva, W.P.; Sollero, P.; Bertoni Rodrigues, M.R., De Albuquerque, É.L. Failure criteria for adhesively bonded joints. International Journal of Adhesion and Adhesives 37, 26–36. 2012. [CrossRef]
- Da Silva, L.F.M.; Das Neves, P.J.C.; Adams, R.D.; Wang, A.; Spelt, J.K. Analytical models of adhesively bonded joints—Part II: Comparative study. International Journal of Adhesion and Adhesives 29, 331–341. 2009. [CrossRef]
Figure 1.
The timeline of notable progress in the field of adhesives [8].
Figure 1.
The timeline of notable progress in the field of adhesives [8].
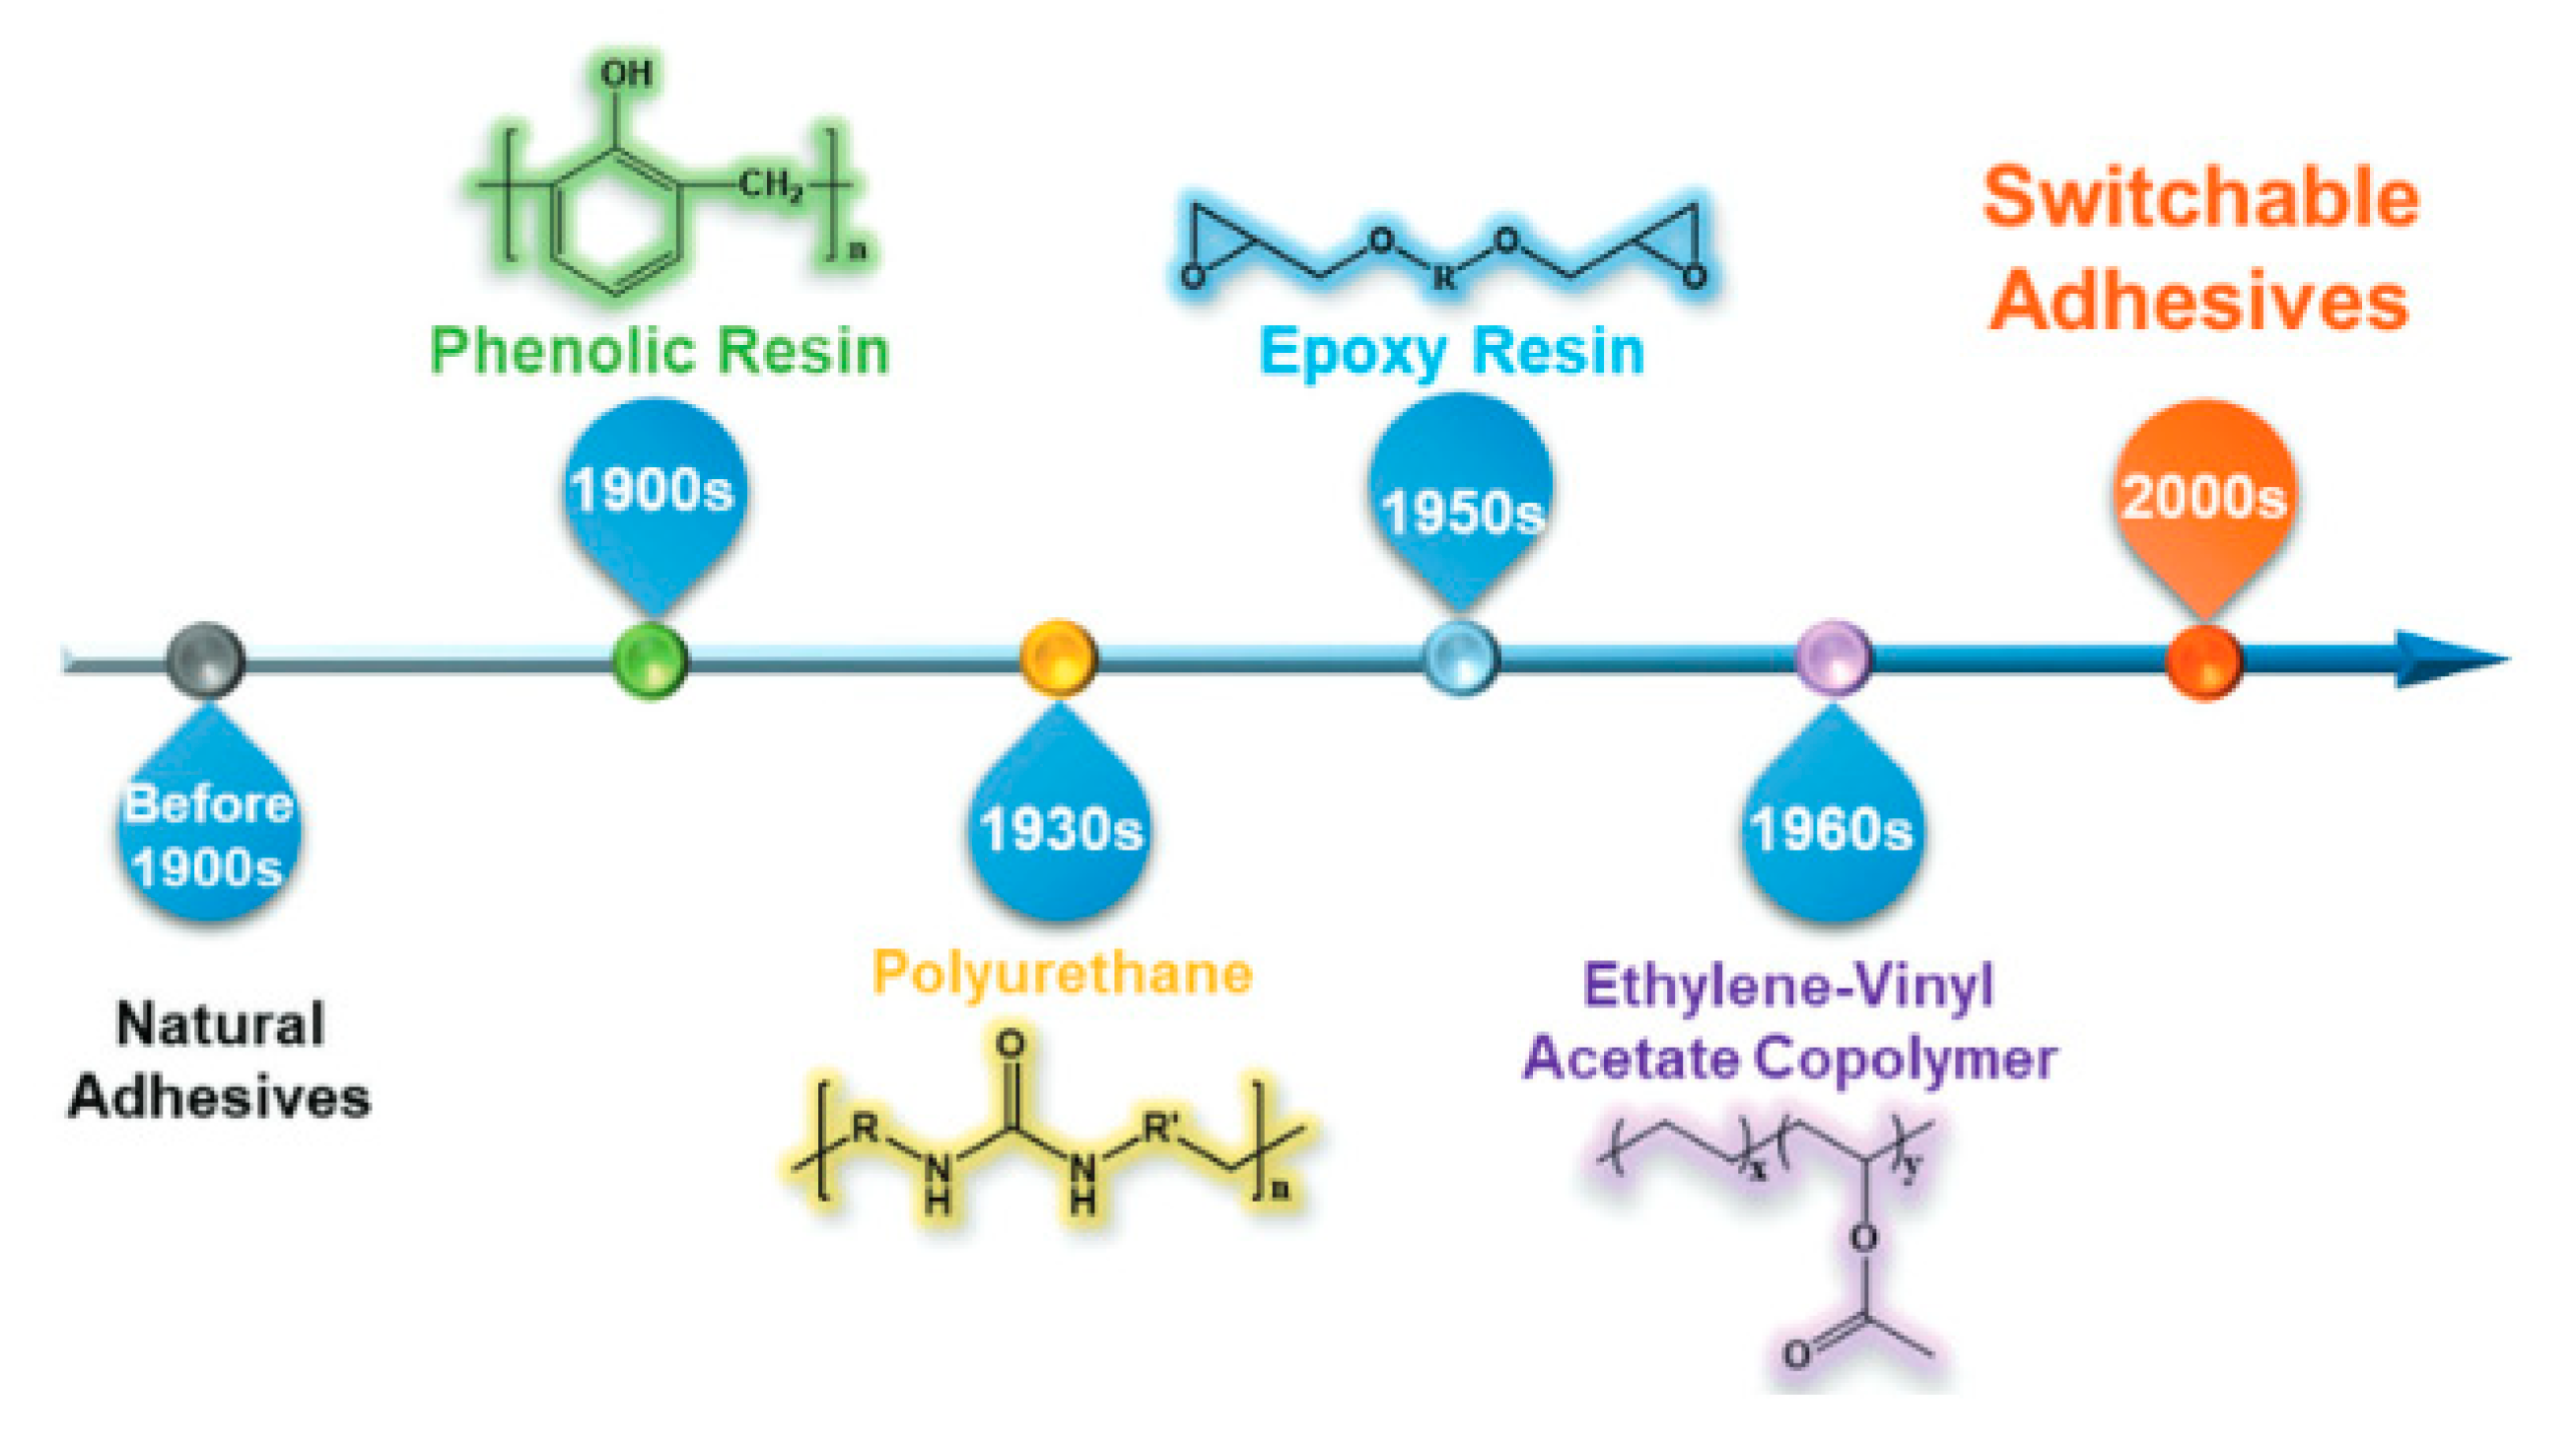
Figure 2.
(a) Linear economy model and (b) a circular economy approach incorporating design for manufacturing, assembly and disassembly (DfMAD).
Figure 2.
(a) Linear economy model and (b) a circular economy approach incorporating design for manufacturing, assembly and disassembly (DfMAD).
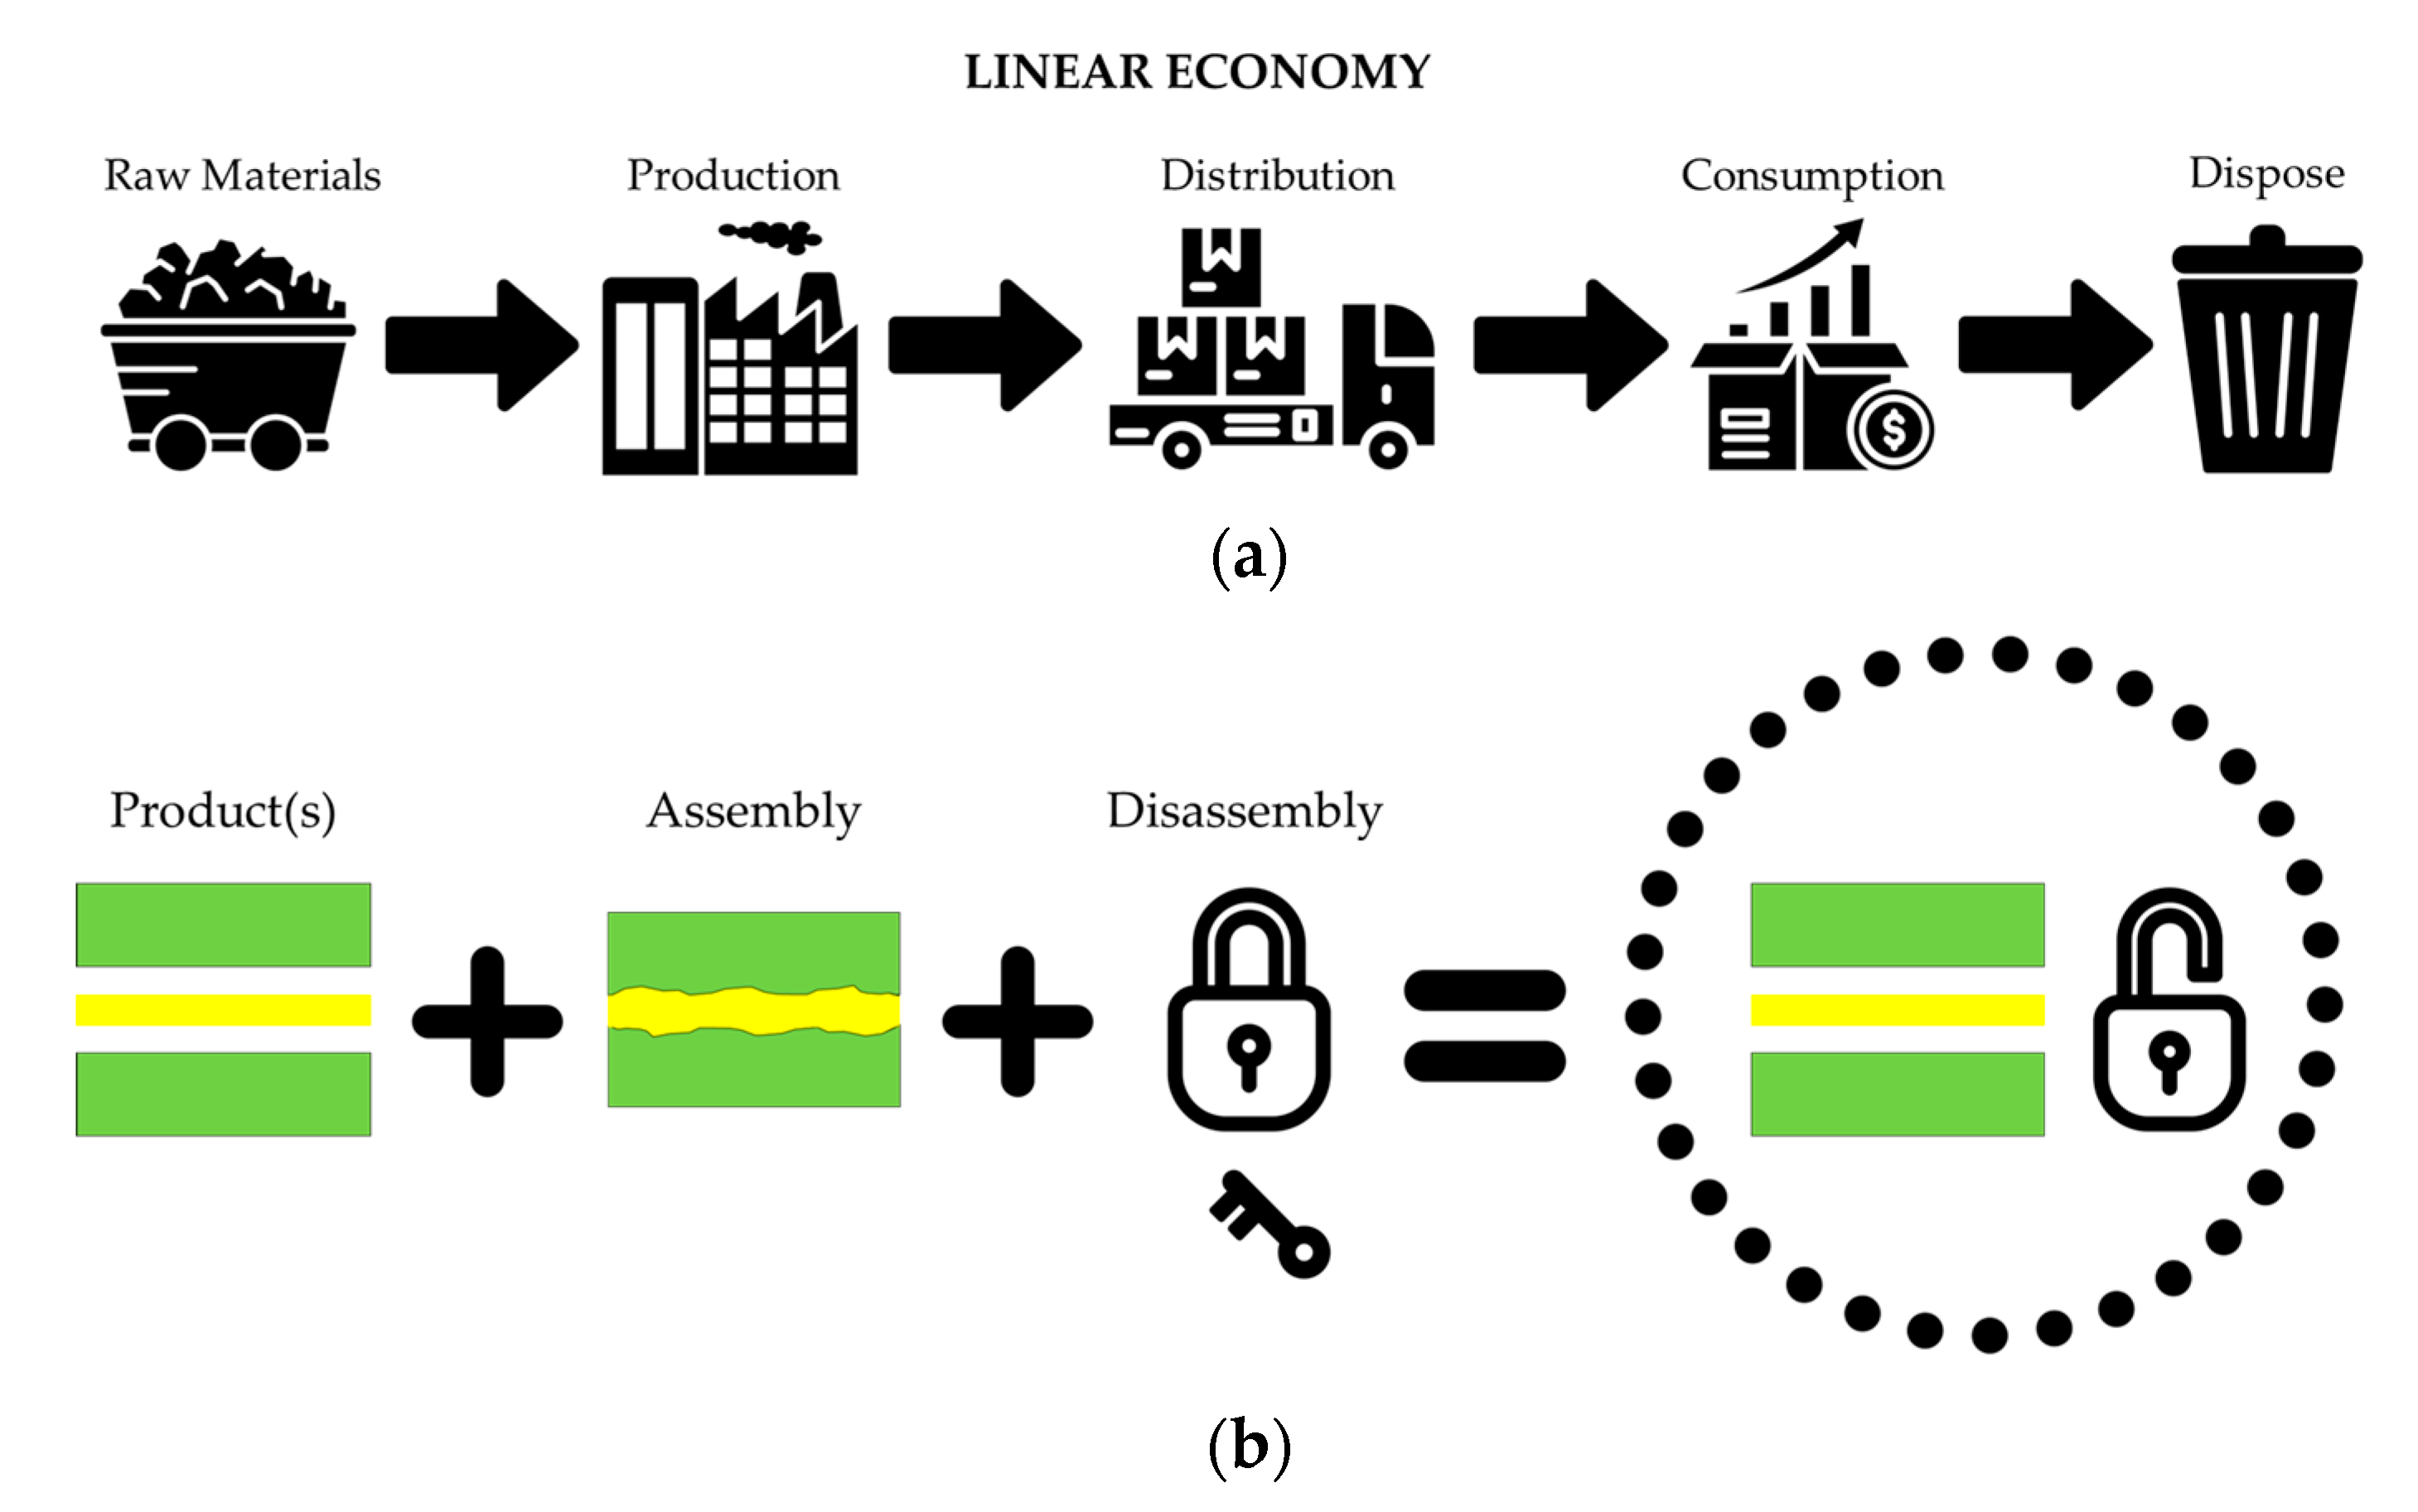
Figure 3.
The diagram demonstrates the different debonding methods.
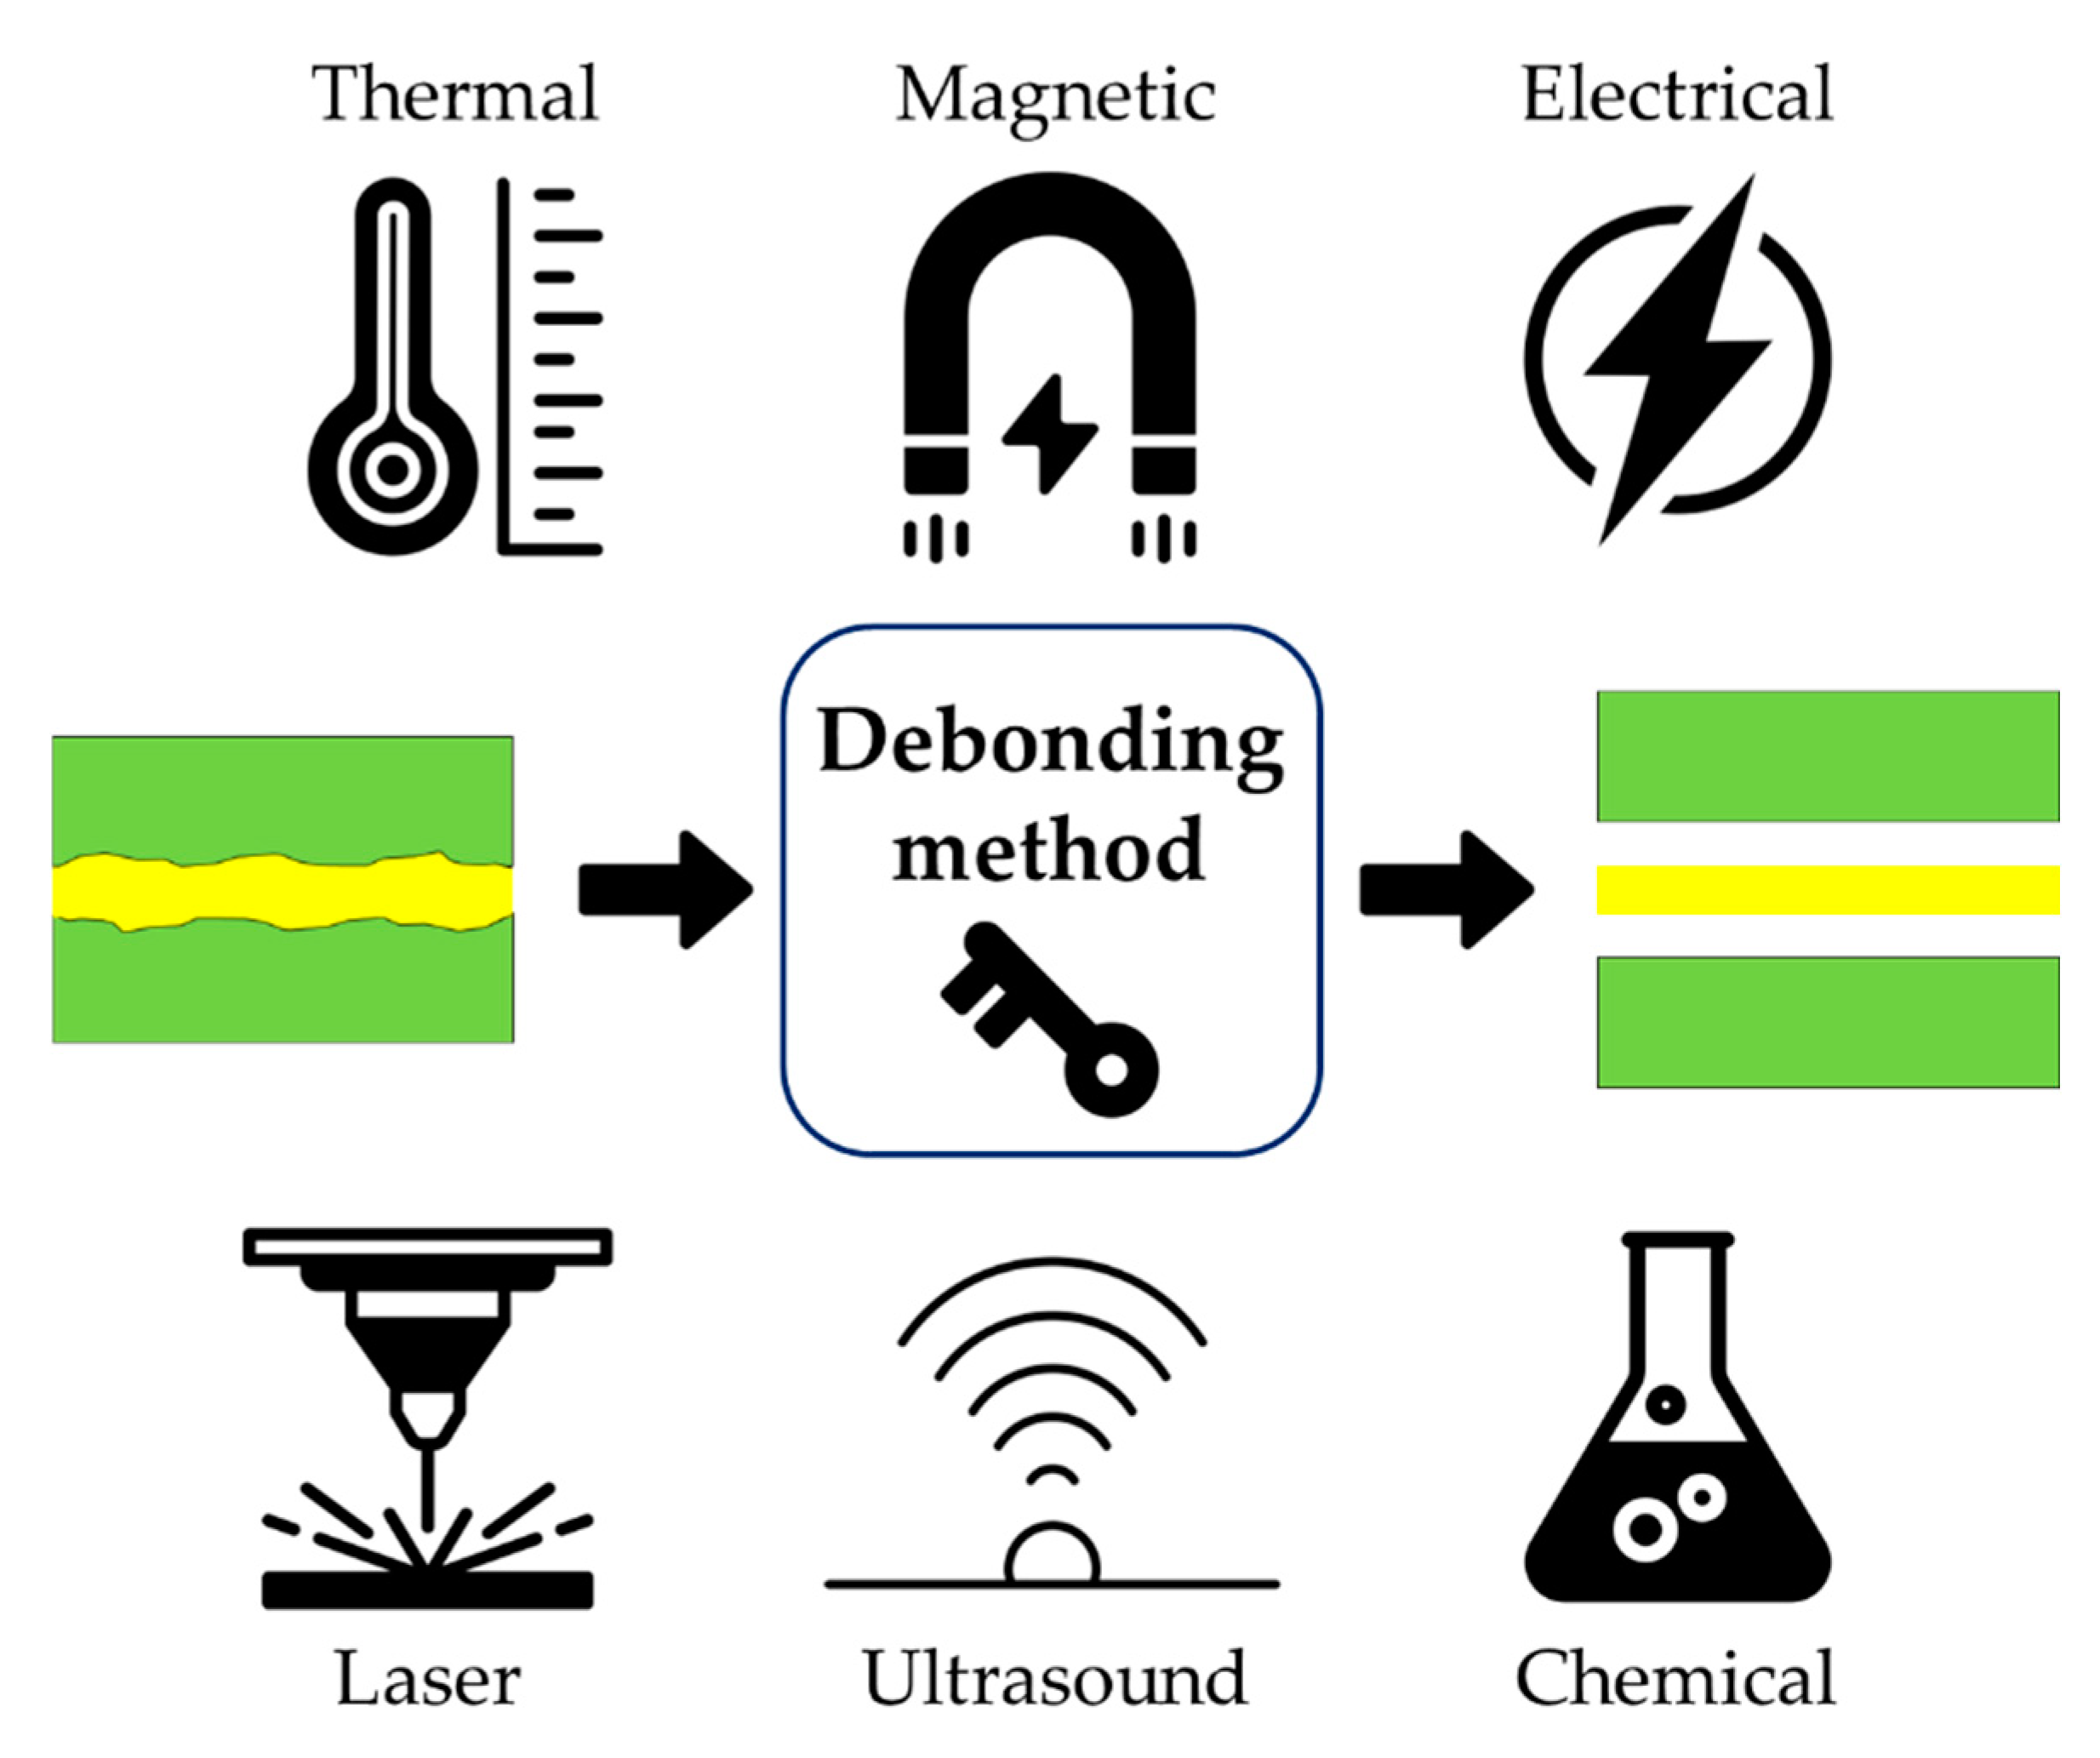
Figure 4.
(a), (b) the single lap joint with details of geometry and boundary conditions and (c) the representative mesh used for the stress analysis.
Figure 4.
(a), (b) the single lap joint with details of geometry and boundary conditions and (c) the representative mesh used for the stress analysis.
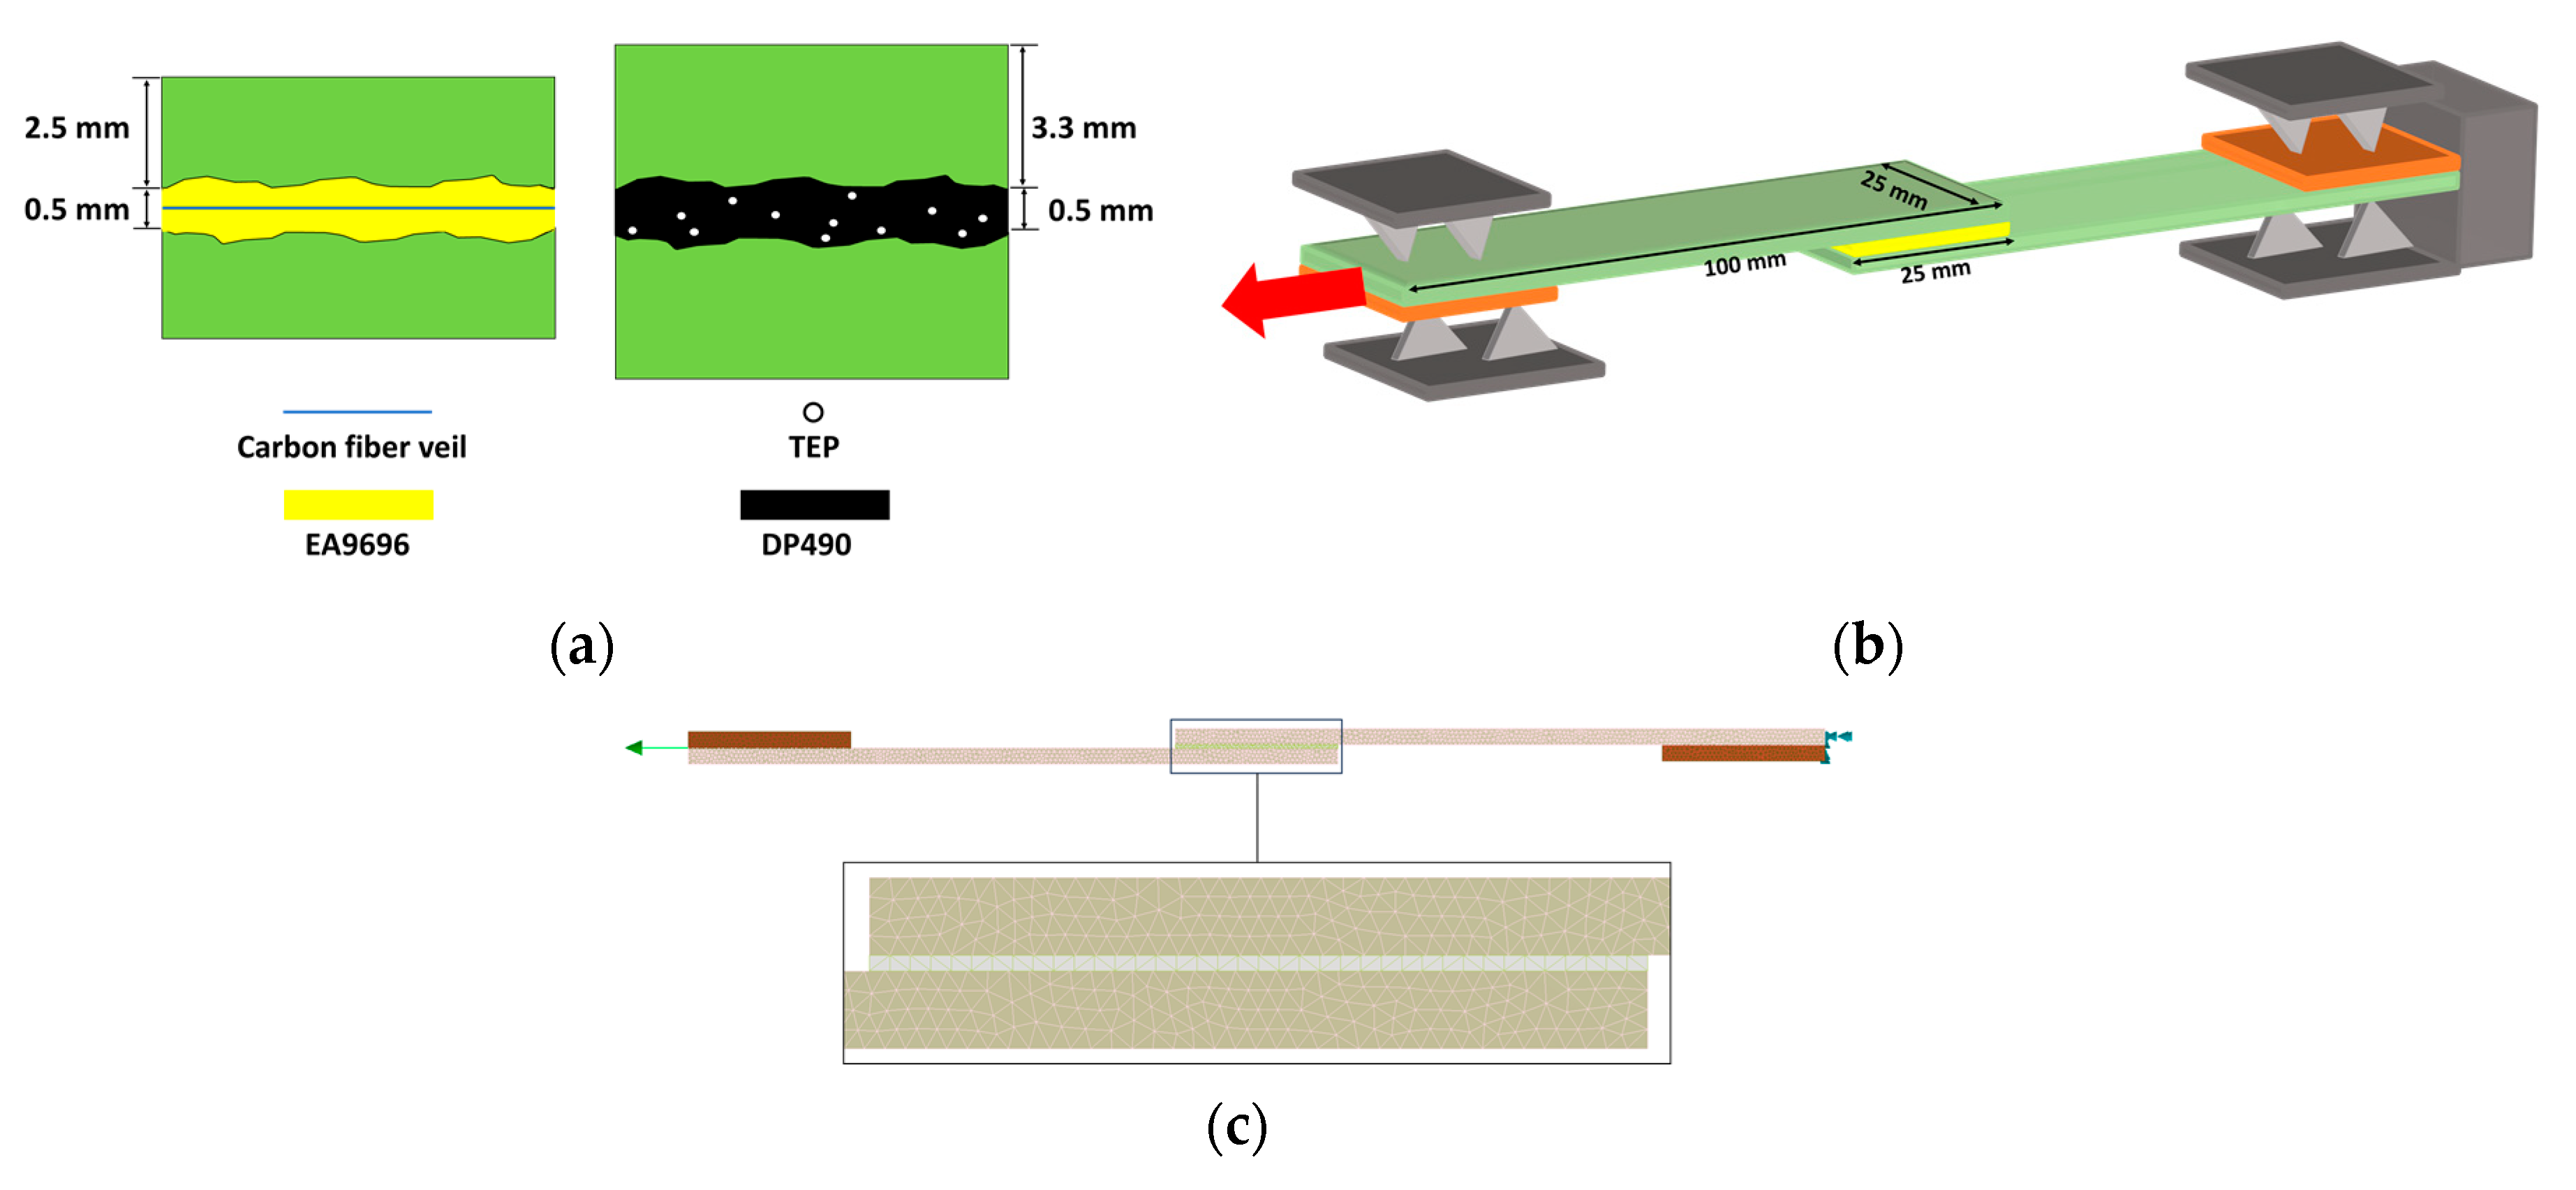
Figure 5.
(a) peel and (b) shear stresses distributions in DP490 adhesively bonded joints at room temperature, respectively.
Figure 5.
(a) peel and (b) shear stresses distributions in DP490 adhesively bonded joints at room temperature, respectively.
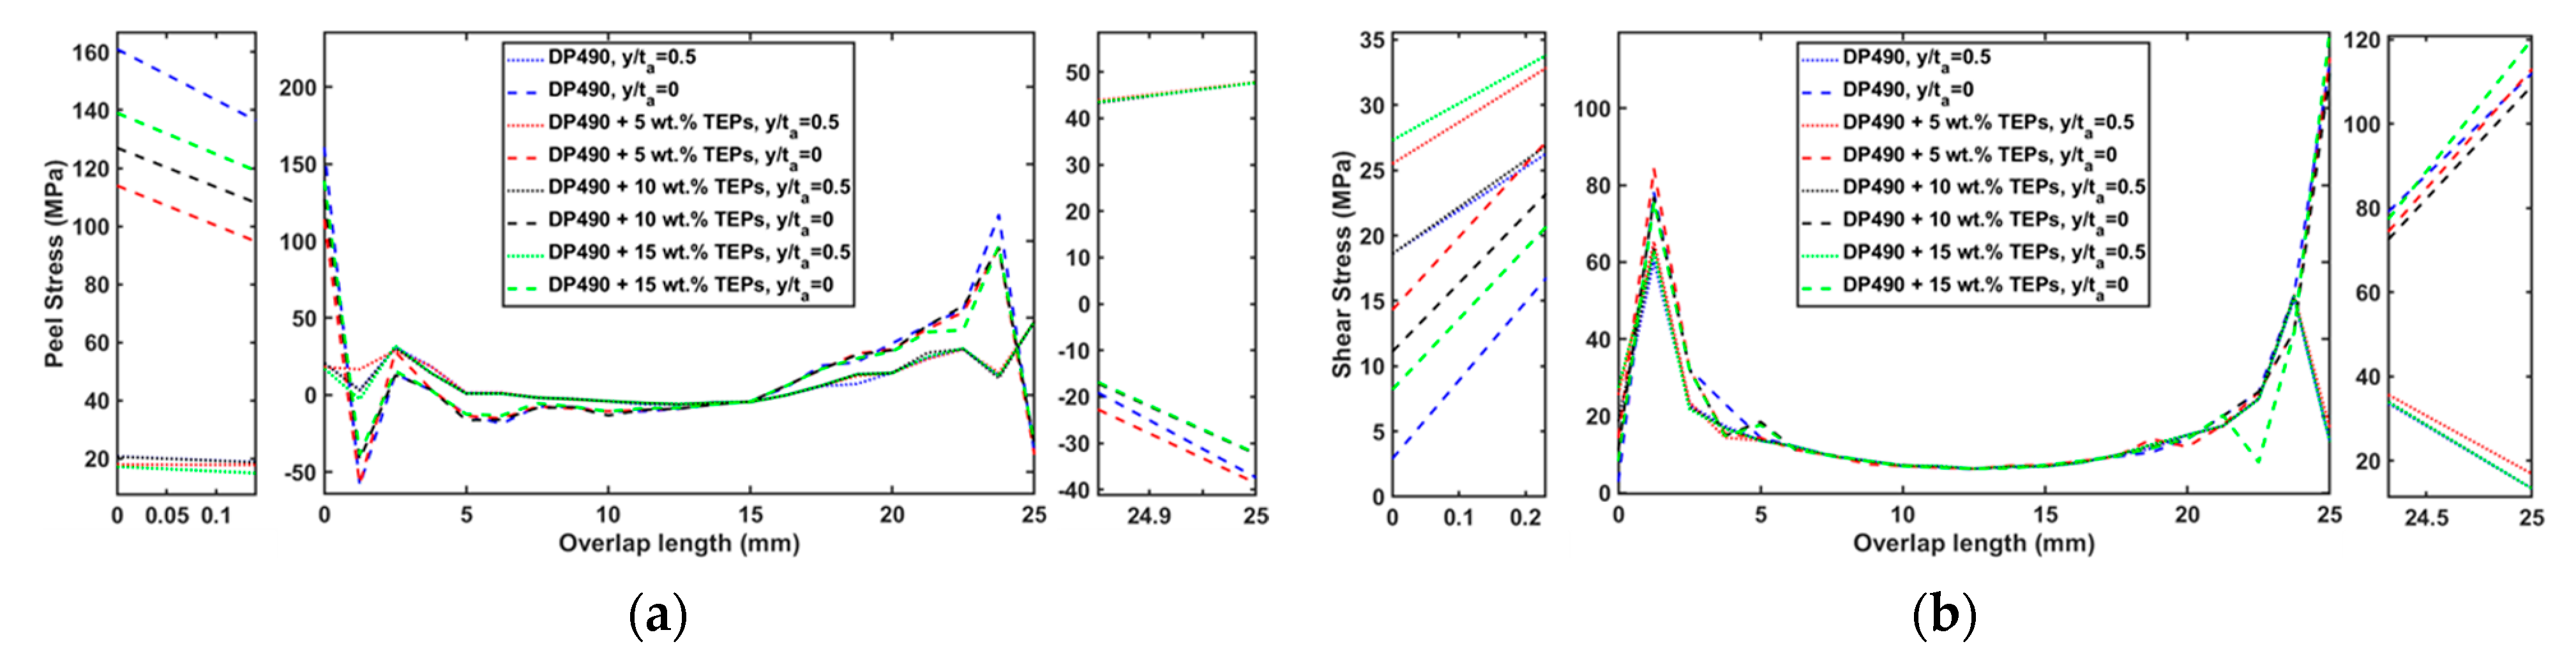
Figure 6.
(a) peel and (b) shear stresses distributions in DP490 adhesively bonded joints at 145℃, respectively.
Figure 6.
(a) peel and (b) shear stresses distributions in DP490 adhesively bonded joints at 145℃, respectively.
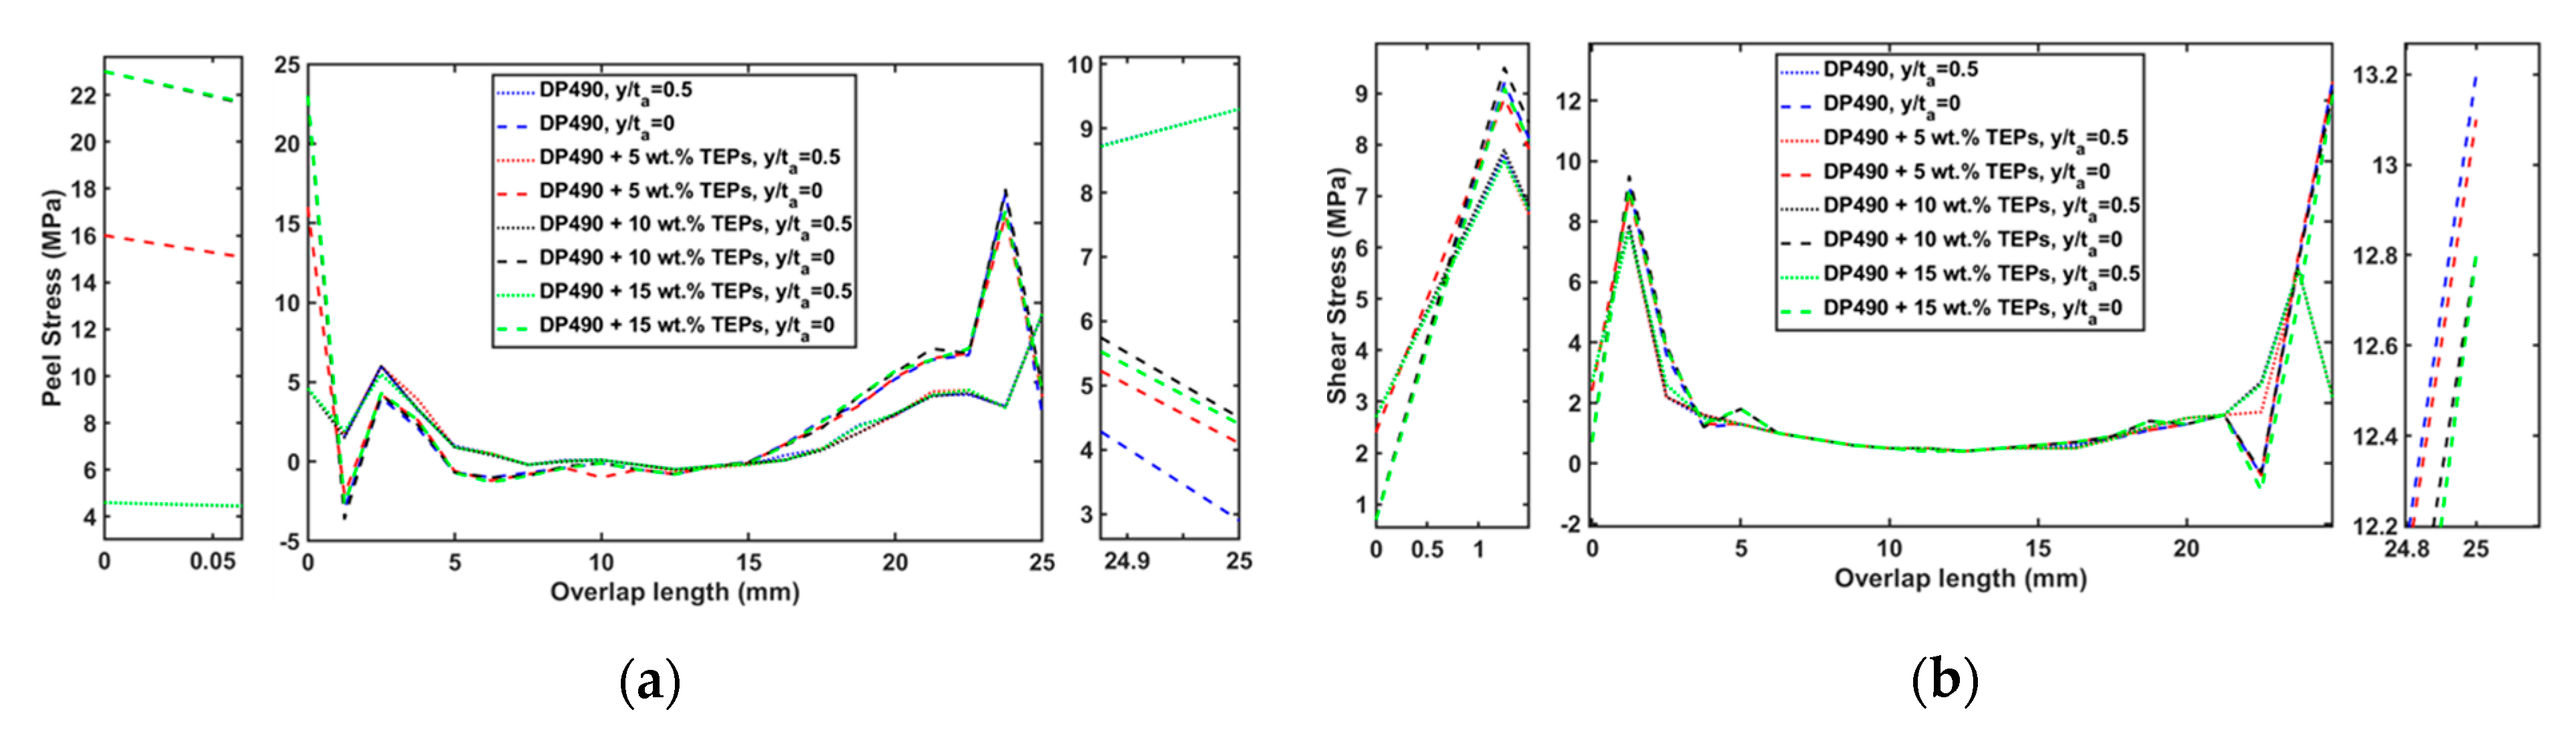
Figure 7.
(a) peel and (b) shear stresses distributions in EA9696 adhesively bonded joints at room temperature, respectively.
Figure 7.
(a) peel and (b) shear stresses distributions in EA9696 adhesively bonded joints at room temperature, respectively.
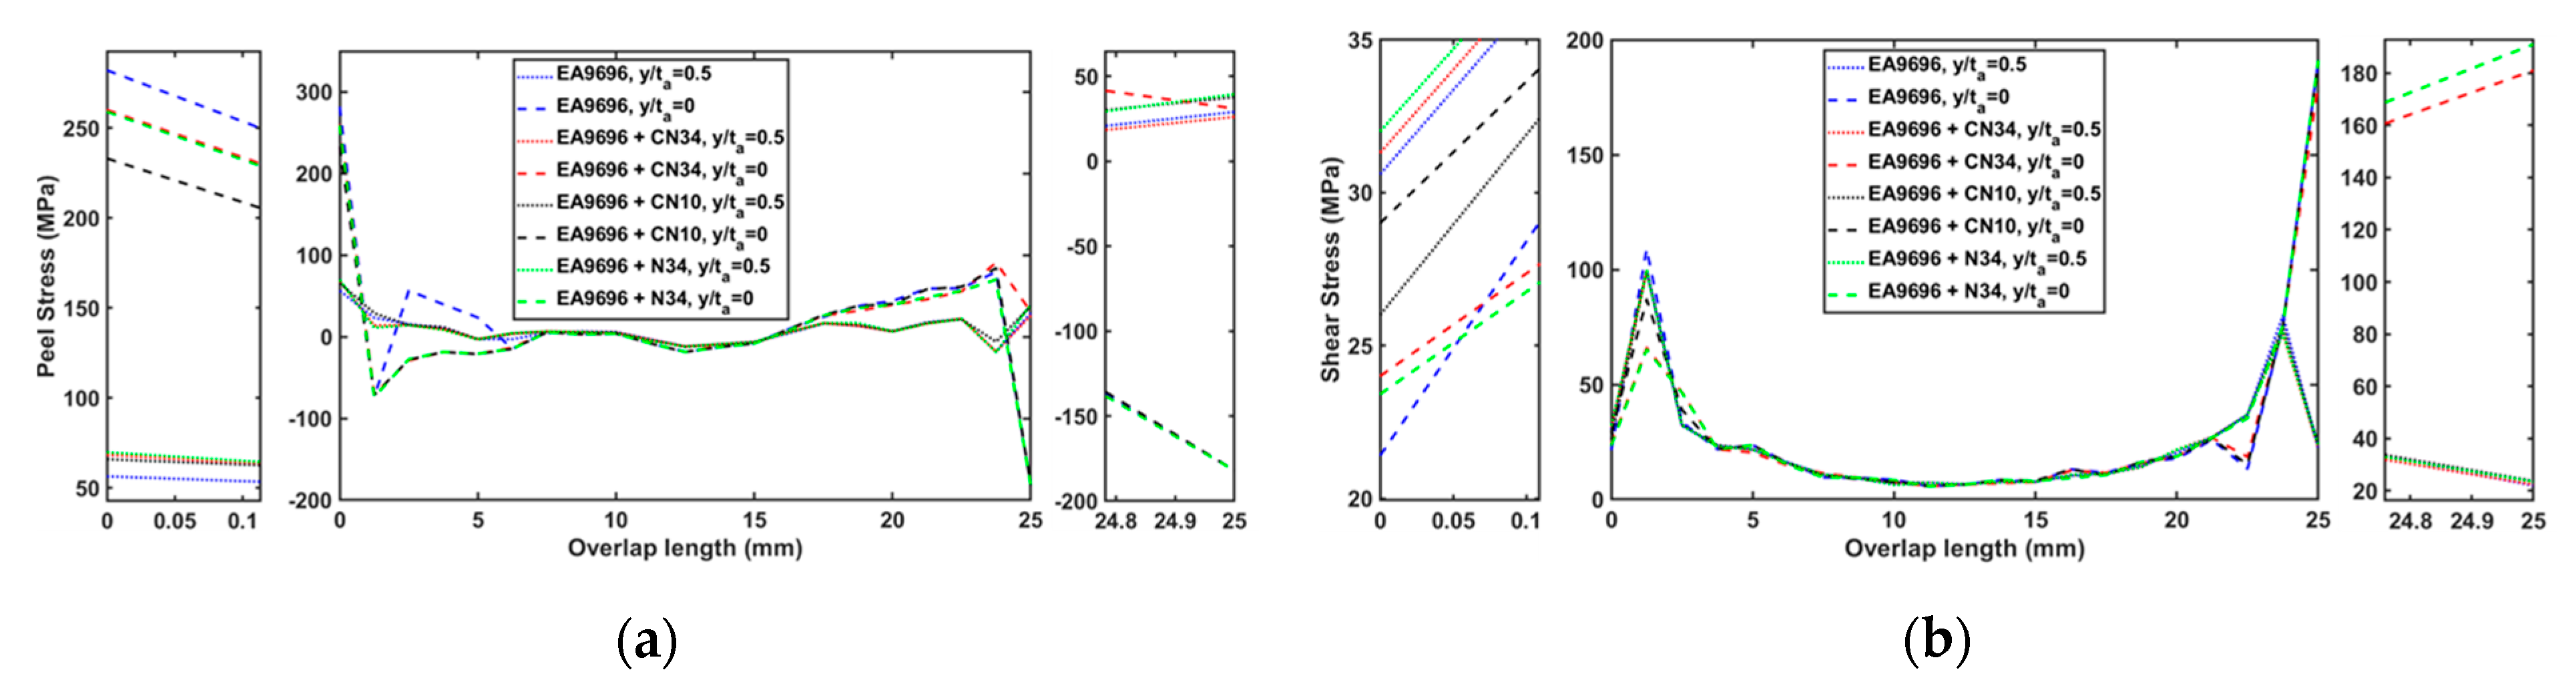
Figure 8.
(a) peel and (b) shear stresses distributions in EA9696 adhesively bonded joints at 100℃, respectively.
Figure 8.
(a) peel and (b) shear stresses distributions in EA9696 adhesively bonded joints at 100℃, respectively.
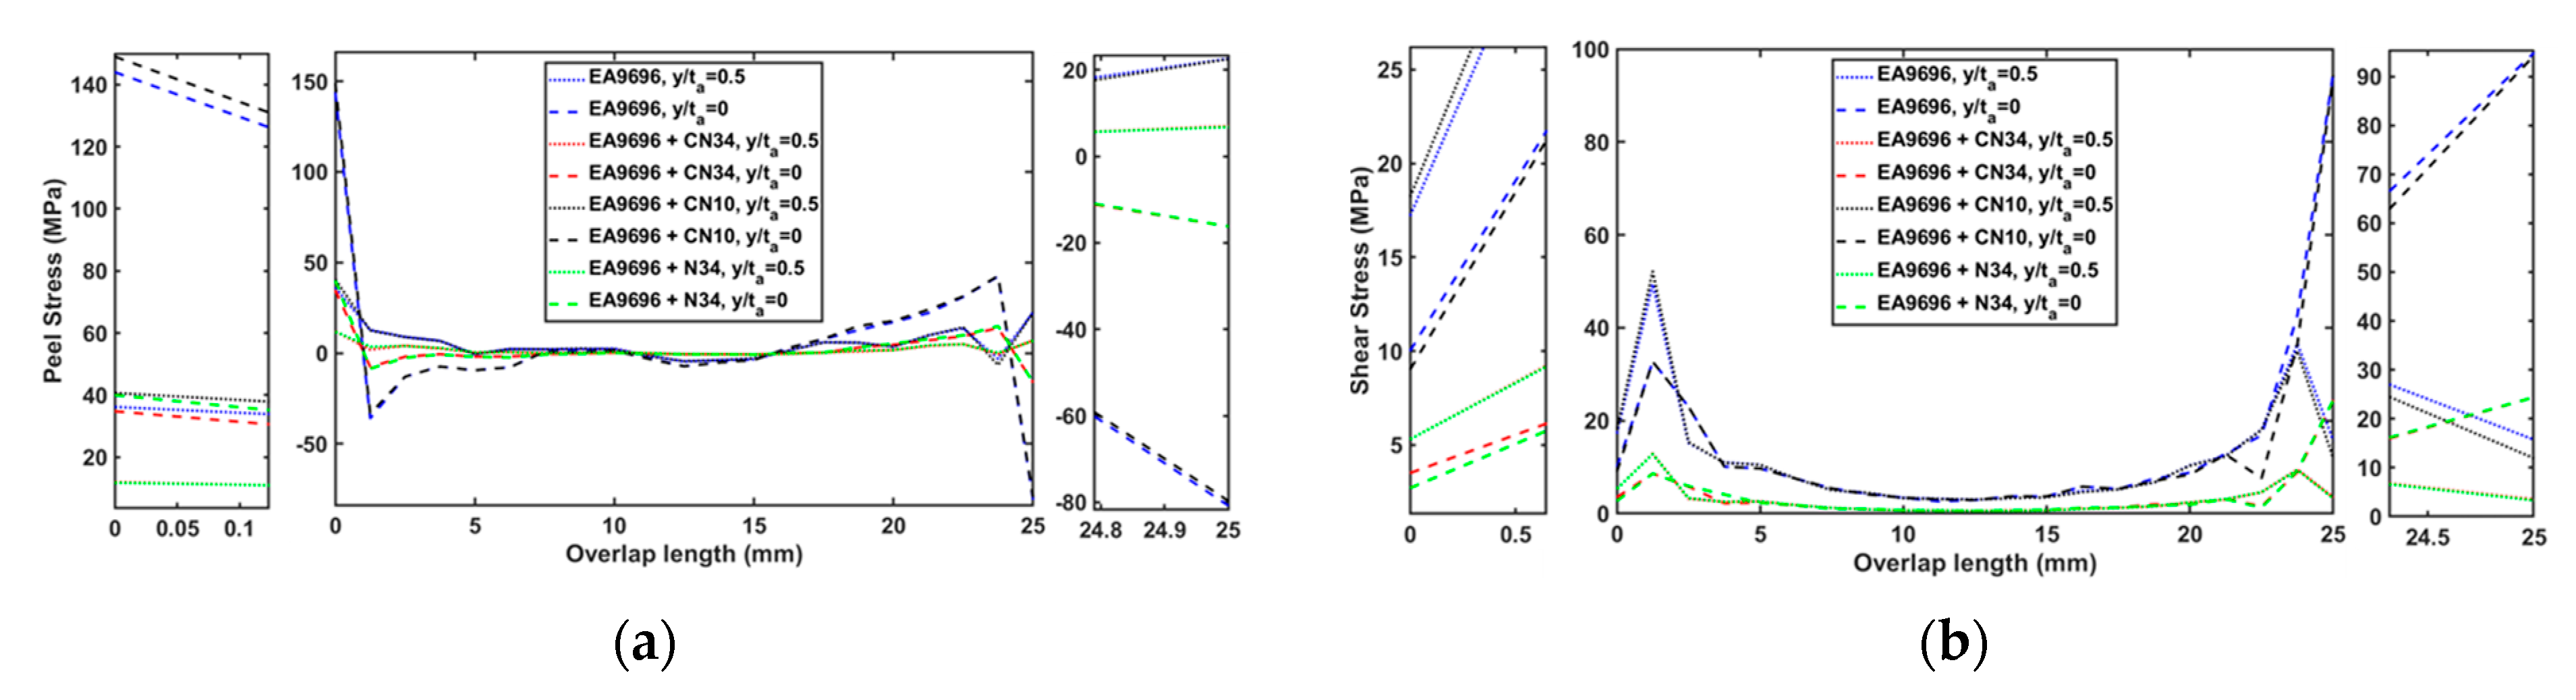
Figure 9.
Comparison of (a) peel and (b) shear stresses distributions under 240 N/mm between finite element analysis (FEA) and Goland and Reissner (GR) theory results at the interface and mid-section of 10 wt.% TEPs-epoxy adhesive bondline. (c) peel and (d) shear stresses distributions in FEA. *k-HS [29] and k-Zhao [30] refer to the bending moment factors, which were calculated based on their respective solutions.
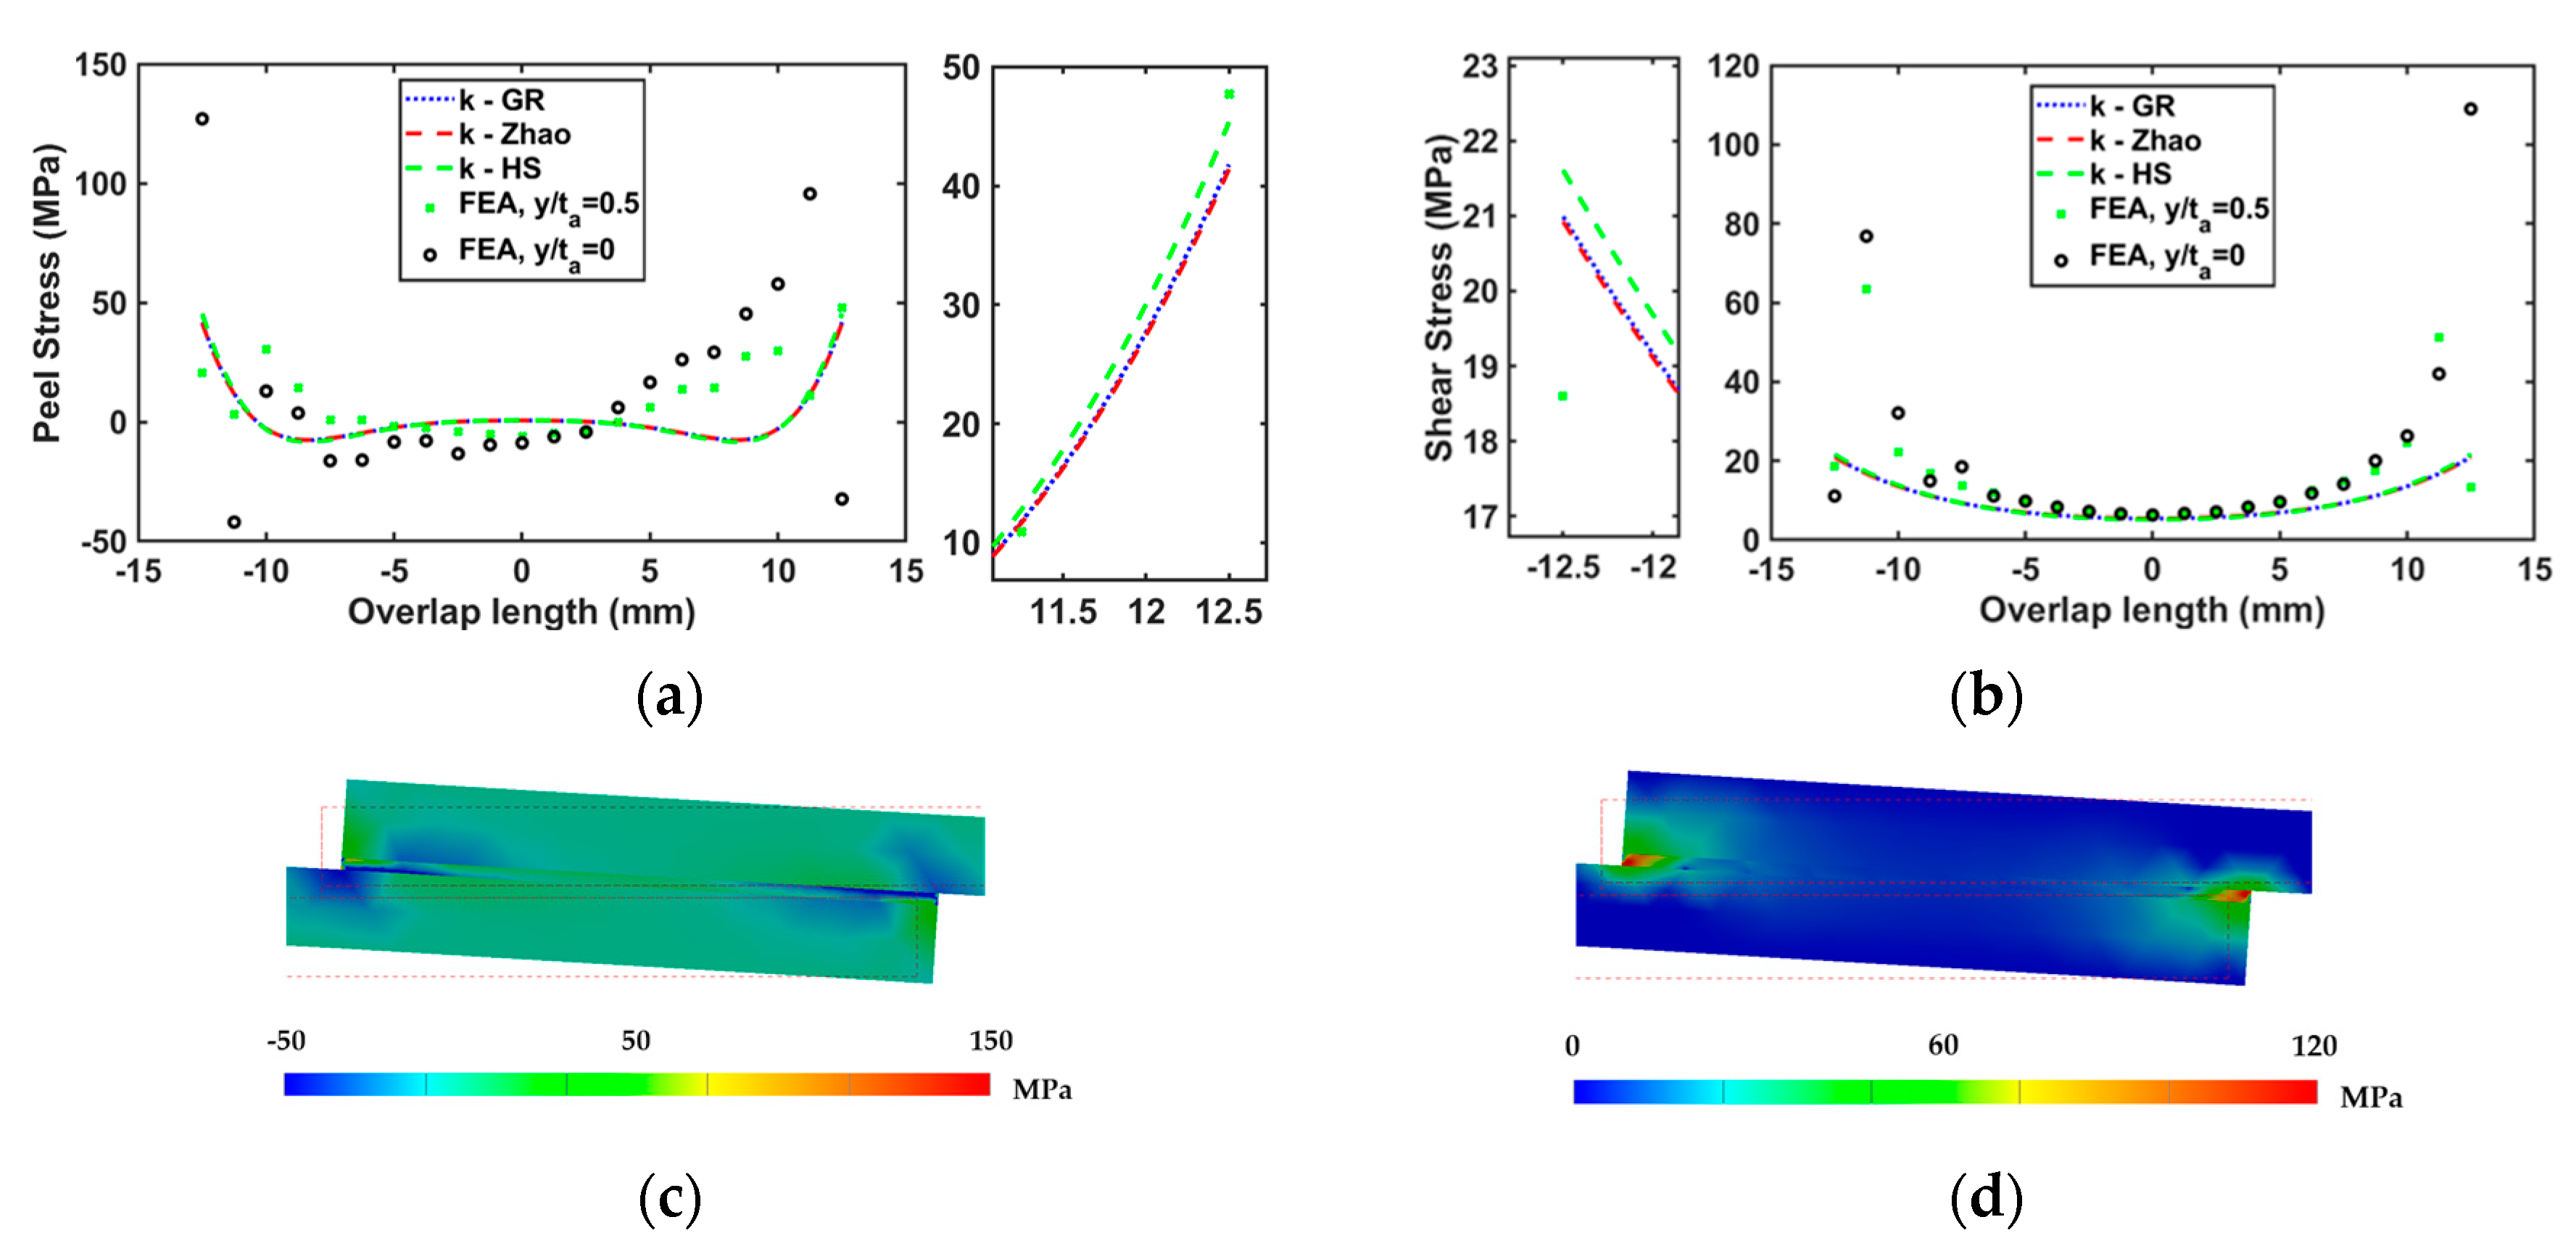
Figure 10.
Comparison of (a) peel and (b) shear stresses distributions under 60 N/mm between finite element analysis (FEA) and Goland and Reissner (GR) theory results at the interface and mid-section of 10 wt.% TEPs-epoxy adhesive bondline at 145°C. (c) peel and (d) shear stresses distributions in FEA. *k- HS [29] and k-Zhao [30] refer to the bending moment factors, which were calculated based on their respective solutions.
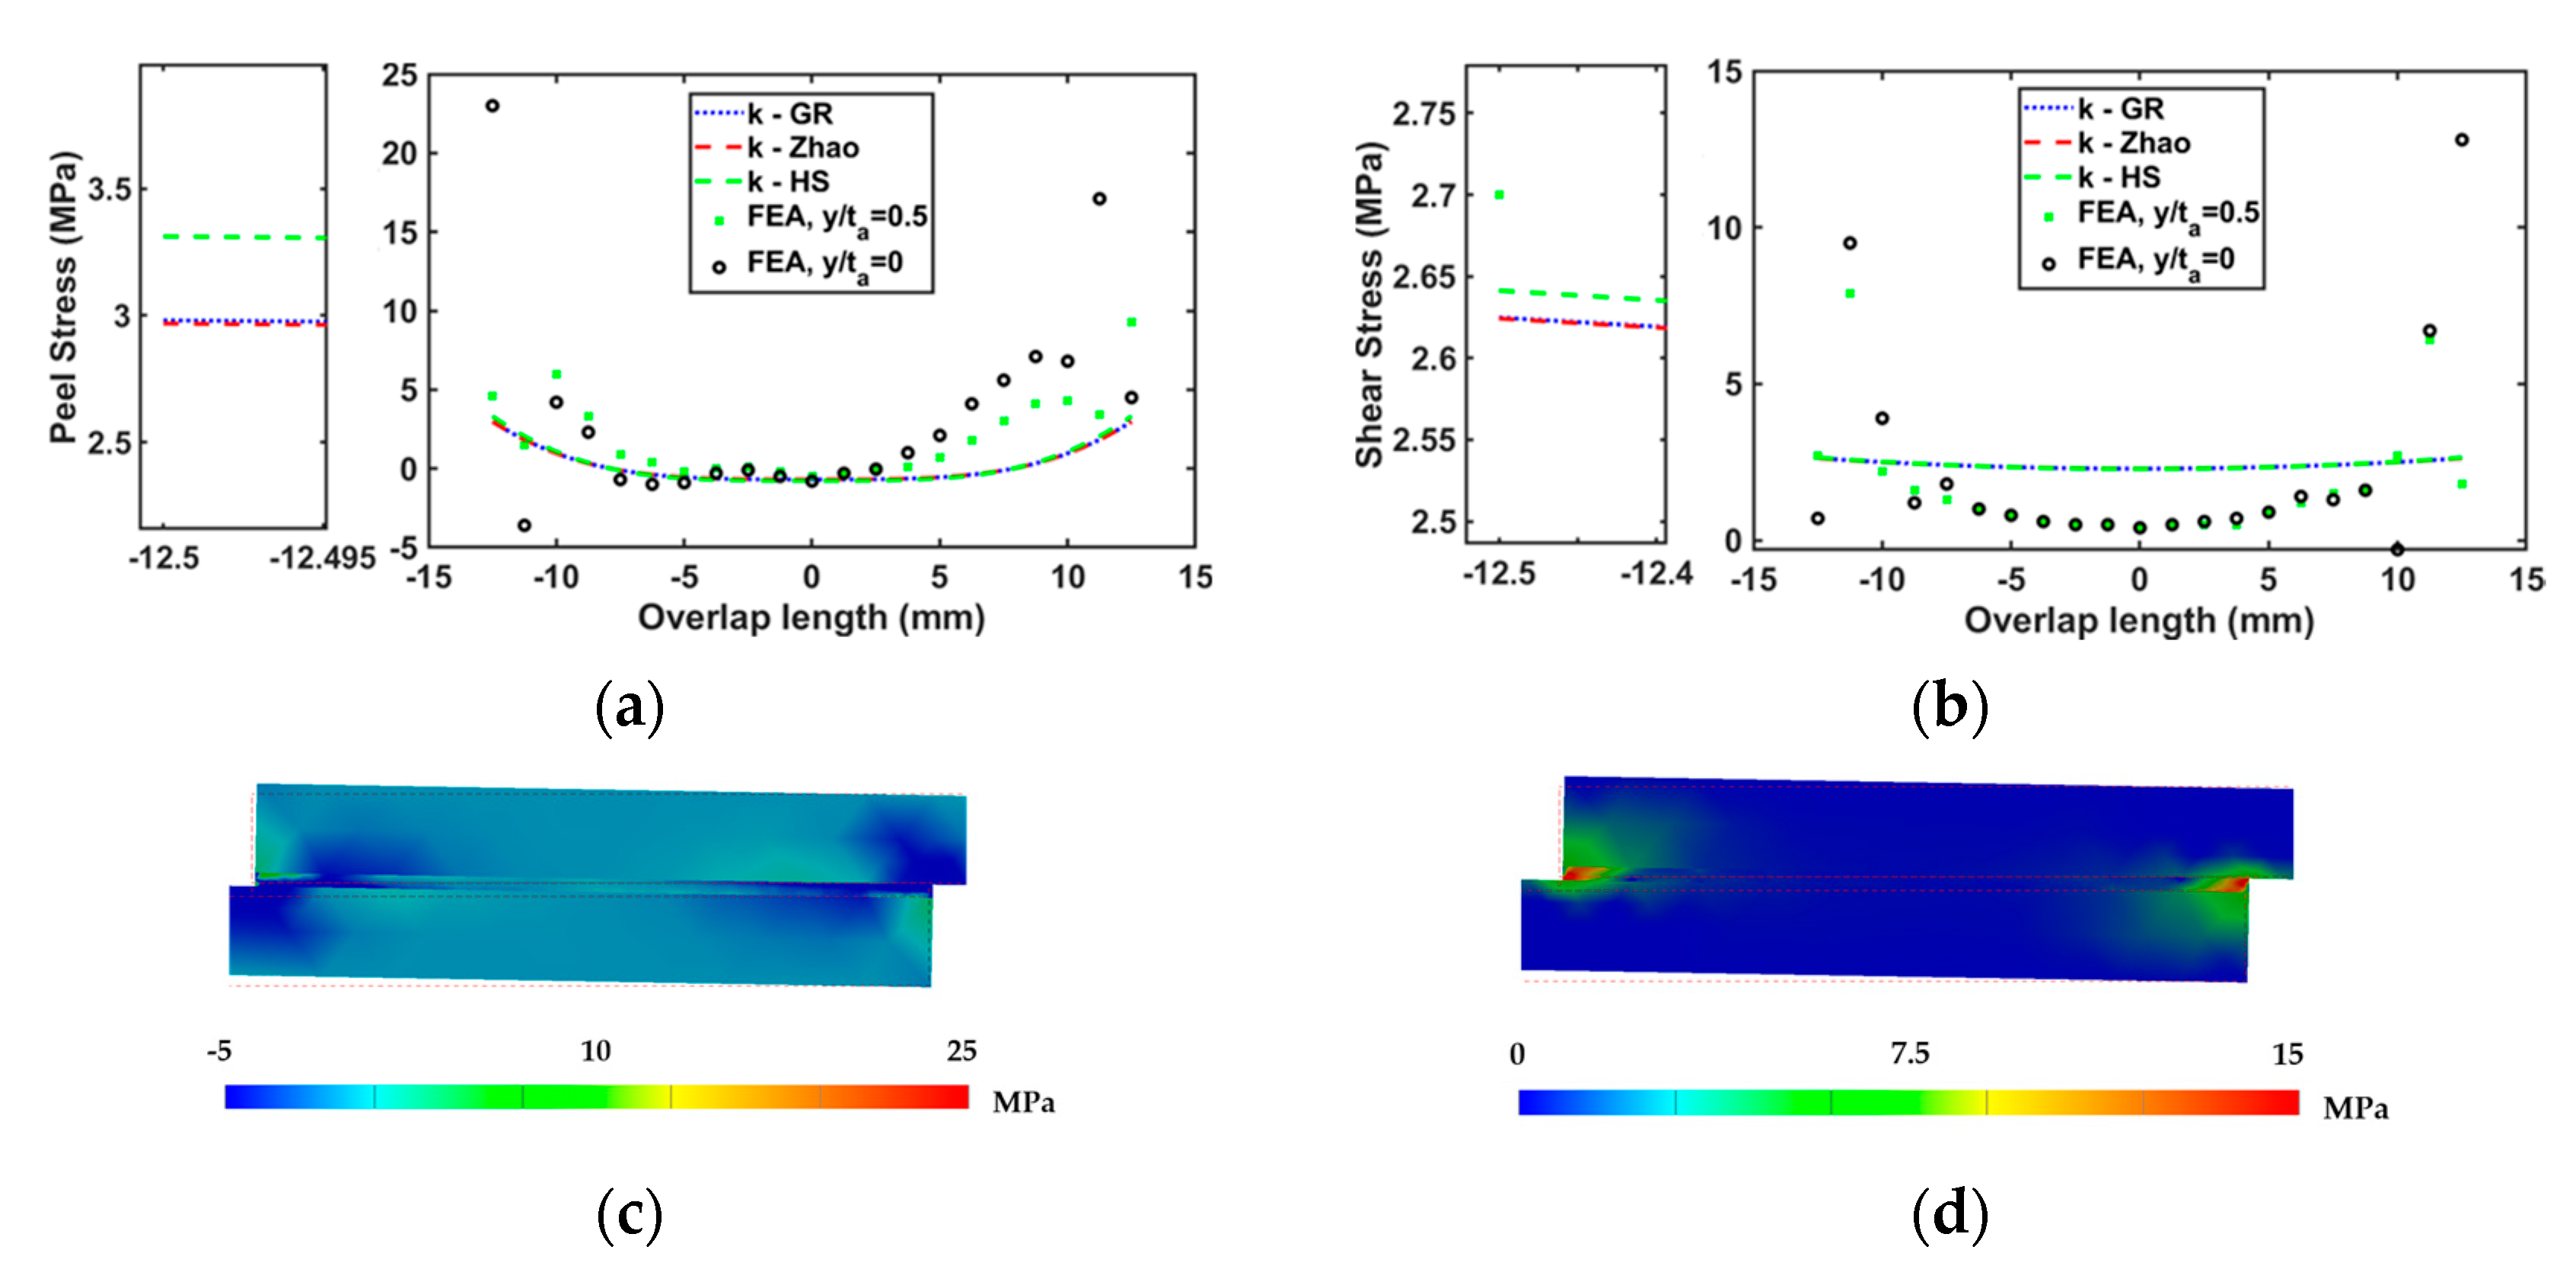
Figure 11.
Comparison of (a) peel and (b) shear stresses distributions under 300 N/mm between finite element analysis (FEA) and Goland and Reissner (GR) theory results at the interface and mid-section of CN34 interleaved epoxy adhesive bondline. (c) peel and (d) shear stresses distributions in FEA. *k- HS [29] and k-Zhao [30] refer to the bending moment factors, which were calculated based on their respective solutions.
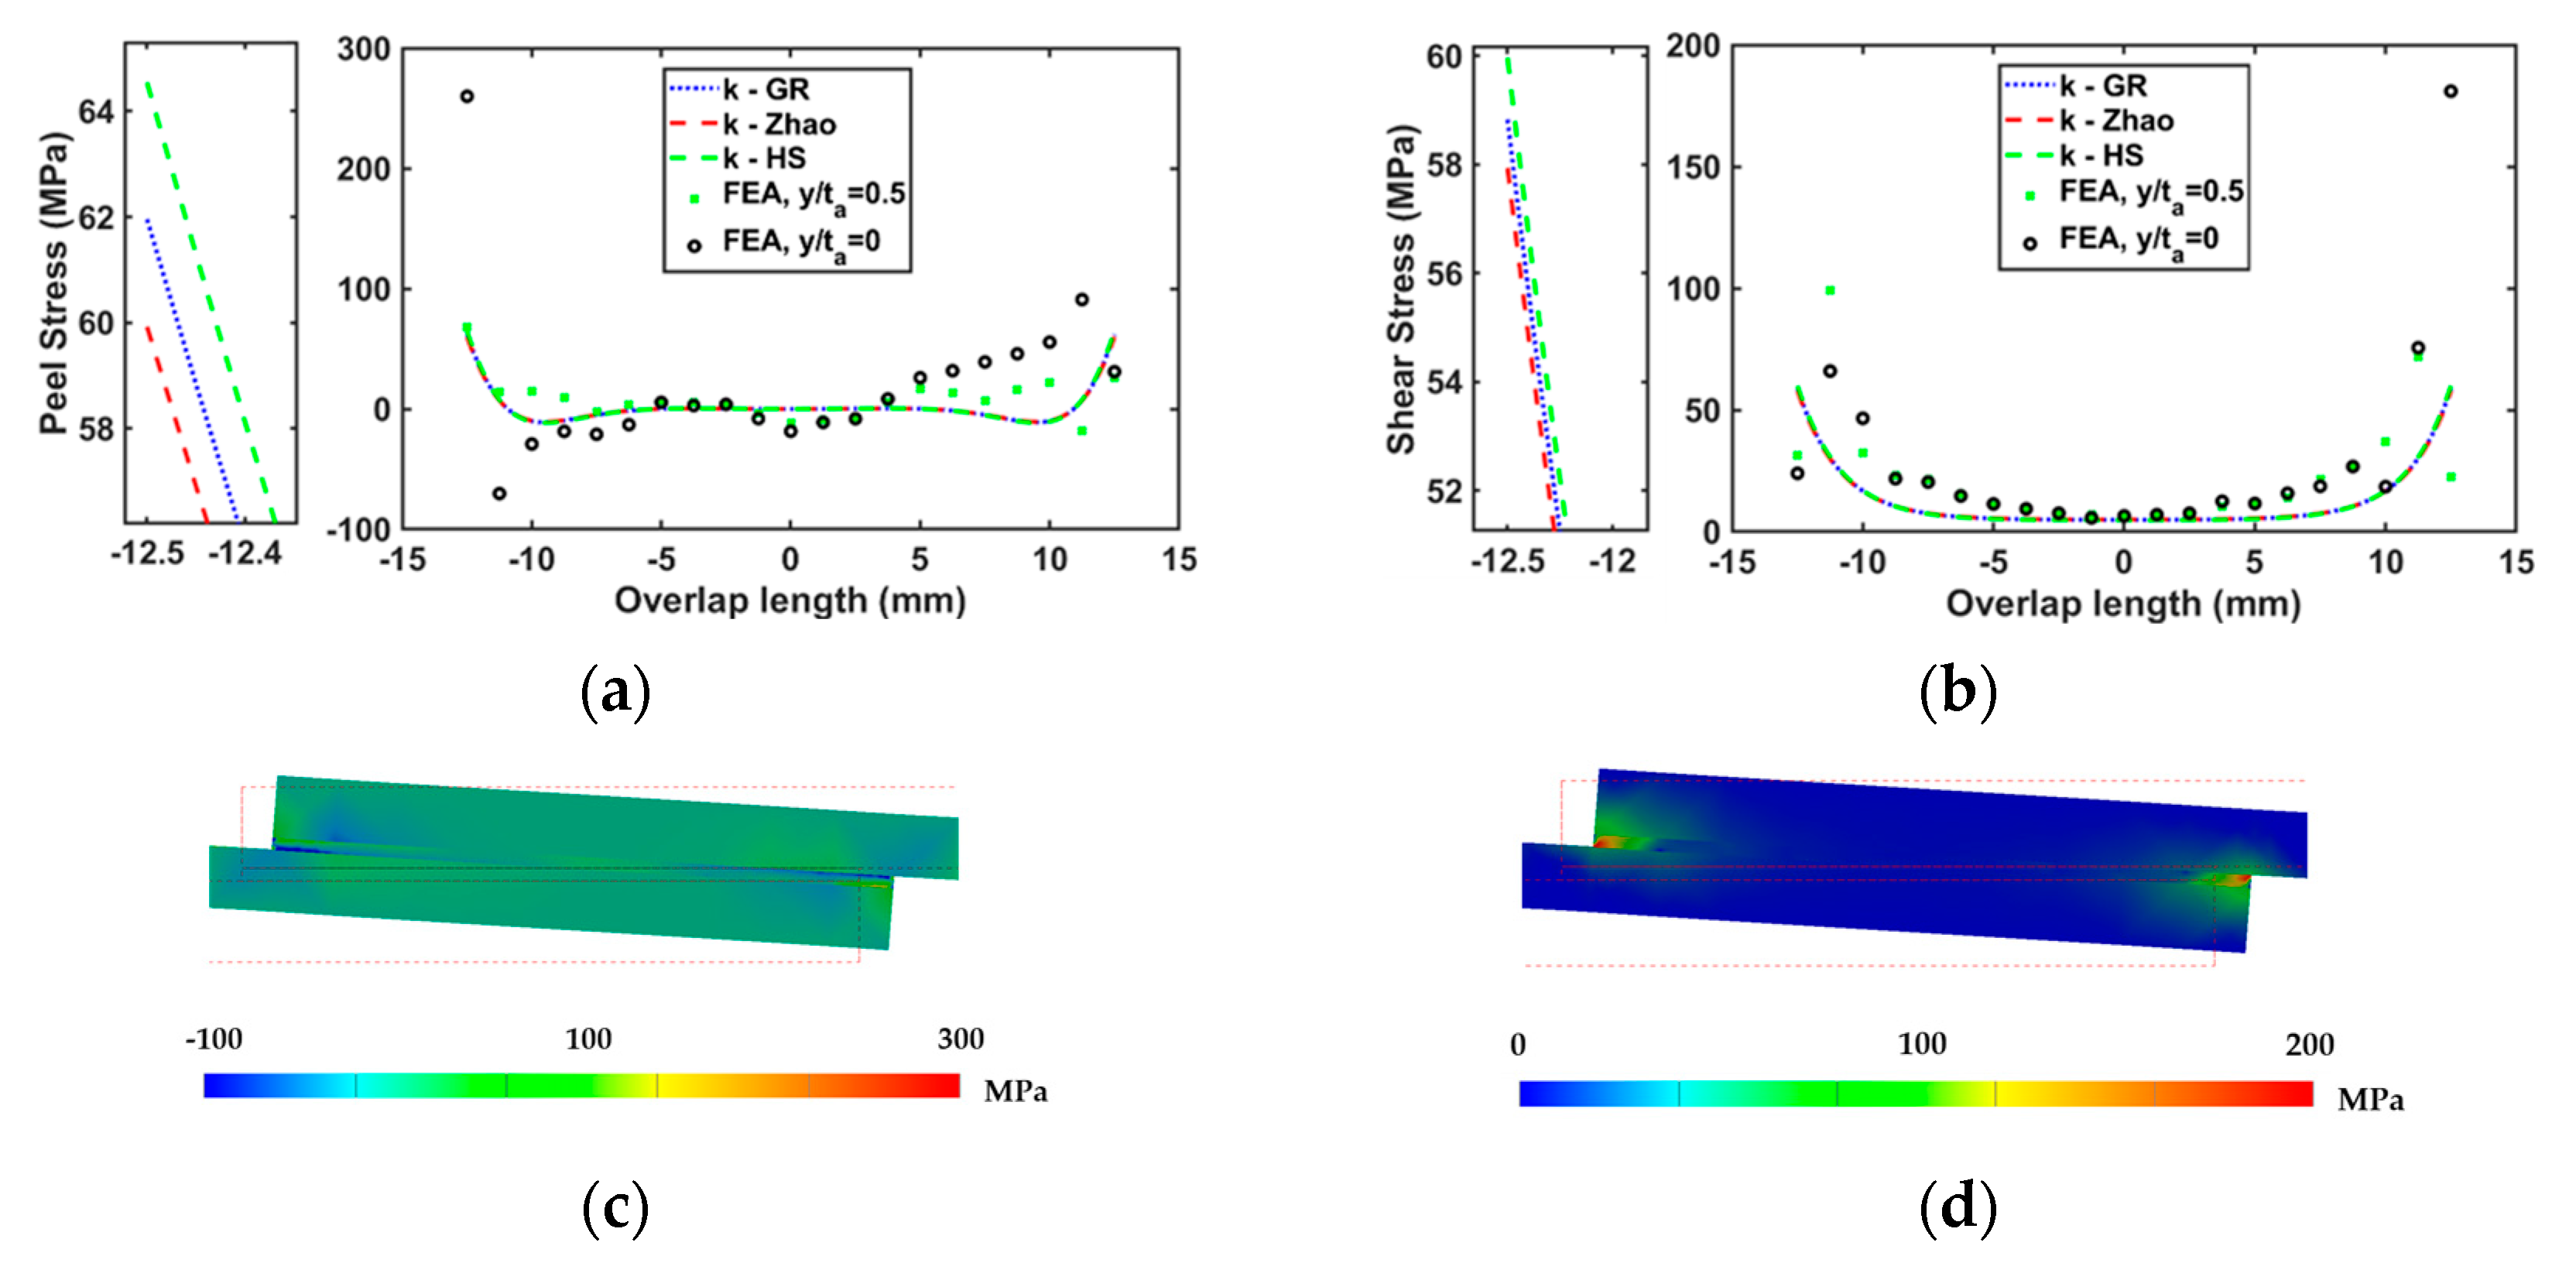
Figure 12.
Comparison of (a) peel and (b) shear stresses distributions under 40 N/mm between finite element analysis (FEA) and Goland and Reissner (GR) theory results at the interface and mid-section of CN34 interleaved epoxy adhesive bondline at 100°C. (c) peel and (d) shear stresses distributions in FEA. *k- HS [29] and k-Zhao [30] refer to the bending moment factors, which were calculated based on their respective solutions.

Figure 13.
Stress distribution of DP490 adhesive joints (a) at room temperature and (b) at 145°C.
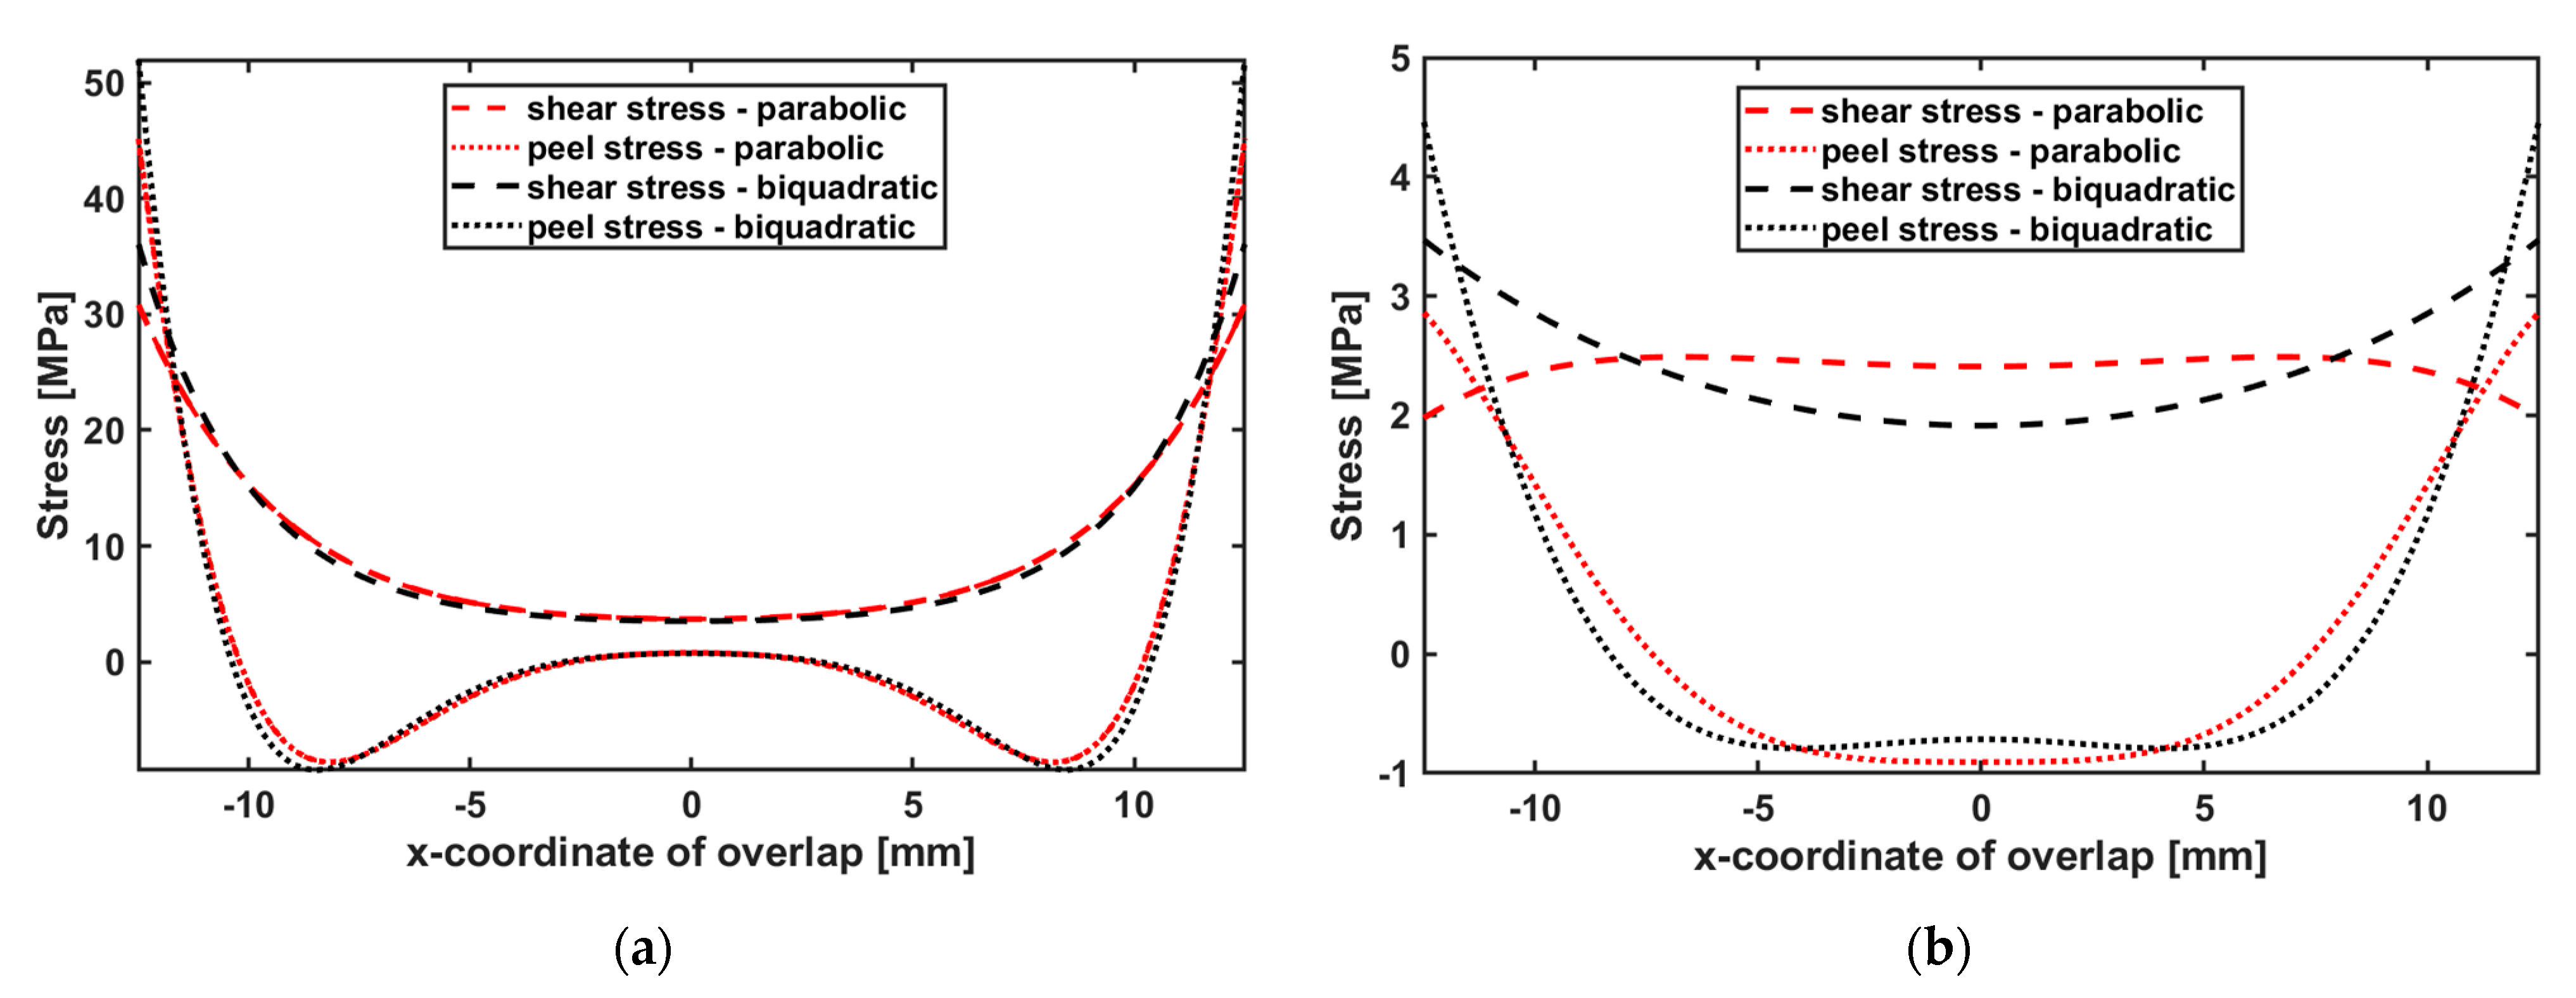
Figure 14.
Stress distribution of EA9696 adhesive joints (a) at room temperature and (b) at 100°C.

| Young’s modulus (GPa) @RT | Young’s modulus (GPa) @100°C | Young’s modulus (GPa) @145°C | Poisson’s ratio | Tg (°C) |
|---|---|---|---|---|
| 21.9 | 21.5 | 9.89 | 0.26 | 135 |
| Young’s modulus (GPa) | Shear modulus (MPa) | Tensile strength at RT (MPa) | Tensile strength at 100°C (MPa) | Poisson’s ratio | Single lap shear strength (MPa) | CTE for 50-90°C (µm/m°C) | CTE for 170-210°C (µm/m°C) |
|---|---|---|---|---|---|---|---|
| 1.91 | 813 | 47.2 | 19.85 | 0.361 | 42.9 | 98.4 | 153 |
Table 3.
The material properties of DP490 epoxy adhesive [39].
Table 3.
The material properties of DP490 epoxy adhesive [39].
| Temperature (oC) | Shear strength (longitudinal) (MPa) | Shear strength (transverse) (MPa) | Peel strength (DaN/cm) |
|---|---|---|---|
| -55 | 23.7 | 31.6 | - |
| 23 | 30.2 | 28.7 | 9.24 |
| 80 | 11.9 | 12.7 | 7.32 |
| 120 | 2.8 | 3.2 | - |
| 150 | 1.9 | 1.7 | - |
| Joint configuration | Load (N/mm) | Shear modulus (MPa) | Young’s modulus (MPa) | Tensile strength (MPa) | Poisson’s ratio | Tg (°C) |
|---|---|---|---|---|---|---|
| DP490 | 240 | 239 | 1847 | 25.4 | 0.38 | 115 |
| DP490 + 5 wt.% TEPs | 240 | 183 | 1411 | 25.4 | 0.38 | 118 |
| DP490 + 10 wt.% TEPs | 240 | 211 | 1631 | 25.4 | 0.38 | 118 |
| DP490 + 15 wt.% TEPs | 240 | 227 | 1751 | 25.4 | 0.38 | 117 |
| DP490 @145°C | 60 | 8.8 | 67.7 | 1.41 | 0.38 | - |
| DP490 + 5 wt.% TEPs @145°C | 60 | 4.1 | 31.3 | 1.41 | 0.38 | - |
| DP490 + 10 wt.% TEPs @145°C | 60 | 5.1 | 39.6 | 1.41 | 0.38 | - |
| DP490 + 15 wt.% TEPs @145°C | 60 | 4.9 | 37.6 | 1.41 | 0.38 | - |
Table 5.
The properties of EA9696 epoxy adhesive joint configurations used in the models [21].
Table 5.
The properties of EA9696 epoxy adhesive joint configurations used in the models [21].
| Joint configuration | Load (N/mm) | Shear modulus (MPa) | Young’s modulus (MPa) | Tensile strength (MPa) | Poisson’s ratio | Tg (°C) |
|---|---|---|---|---|---|---|
| EA9696 | 300 | 813 | 1710 | 47.2 | 0.43 | 111 |
| EA9696+ CN34 | 300 | 1246 | 2620 | 47.2 | 0.43 | 97.3 |
| EA9696+ CN10 | 300 | 1070 | 2250 | 47.2 | 0.43 | 102 |
| EA9696+ N34 | 300 | 1108 | 2330 | 47.2 | 0.43 | 98.9 |
| EA9696 @100°C | 150 | 761 | 1600 | 19.85 | 0.43 | - |
| EA9696+ CN34 @100°C | 40 | 1117 | 2350 | 19.85 | 0.43 | - |
| EA9696+ CN10 @100°C | 150 | 922 | 1940 | 19.85 | 0.43 | - |
| EA9696+ N34 @100°C | 40 | 1046 | 2200 | 19.85 | 0.43 | - |
Disclaimer/Publisher’s Note: The statements, opinions and data contained in all publications are solely those of the individual author(s) and contributor(s) and not of MDPI and/or the editor(s). MDPI and/or the editor(s) disclaim responsibility for any injury to people or property resulting from any ideas, methods, instructions or products referred to in the content. |
© 2024 by the authors. Licensee MDPI, Basel, Switzerland. This article is an open access article distributed under the terms and conditions of the Creative Commons Attribution (CC BY) license (http://creativecommons.org/licenses/by/4.0/).
Copyright: This open access article is published under a Creative Commons CC BY 4.0 license, which permit the free download, distribution, and reuse, provided that the author and preprint are cited in any reuse.


