
Submitted:
07 August 2024
Posted:
08 August 2024
You are already at the latest version
Abstract
This study aimed to evaluate the impact of the built environment (i.e., walk, transit, and bike scores) on the location and transportation or “alternative transportation” credit (LTc1) in Leadership in Energy and Environmental Design for Existing Buildings version 4 (LEED-EB-v4) Platinum (n1 = 24), Gold (n2 = 112), Silver (n3 = 46), and Certified (n4 = 34) office buildings in the USA. Spearman’s test was used to estimate the correlation between built environment scores and LTc1 scores for each certification level. The Wilcoxon–Mann–Whitney test was used to estimate pairwise comparison between unpaired Platinum, Gold, Silver, and Certified groups. The Platinum, Gold, and Silver certification levels showed positive and significant correlations between the built environment and LTc1 (0.44 ≤ r ≤ 0.74, p ≤ 0.0312). By contrast, Certified certification levels showed a non-significant correlation (0.18 ≤ r ≤ 0.33, p ≥ 0.0579). Pairwise comparison showed that Platinum and Gold groups outperformed Certified groups in terms of built environment and LTc1 scores (Cliff’s δ ≥ 0.37, p ≤ 0.0099). Thus, for LEED-EBv4-certified projects located in downtown areas, LTc1 can be seen as a significant lever to achieve high levels of LEED certification.
Keywords:
LEED‐EB‐v4
; transportation alternative
; walk score
; transit score
; bike score
; USA
1. Introduction
1.1. LEED Mission
The United States Green Building Council (USGBC) was founded in 1993 with the mission “to transform the way buildings and communities are designed, built and operated, enabling an environmentally and socially responsible, healthy, and prosperous environment that improves the quality of life” [1]. This mission has been realized through developing and improving the Leadership in Energy and Environmental Design (LEED) green building rating system. LEED-certified buildings are proven to save money, improve efficiency, lower carbon emissions, and create healthy living environments [2]. The LEED green building rating system includes four certification levels that certify buildings based on expected environmental performance scores: Certified 40–49, Silver 50–59, Gold 60–79, or Platinum 80–110. An increase in LEED scores is associated with a decrease in environmental damage from buildings [3].
1.2. LEED Different Systems
The most common LEED systems are LEED for New Construction (LEED-NC), LEED for Existing Buildings (LEED-EB), and LEED for Commercial Interiors (LEED-CI) [4,5]. LEED-NC, LEED-EB, and LEED-CI consider the performance of new commercial and residential buildings, the operation of existing commercial and residential buildings, and the performance of indoor commercial spaces, respectively. Each of these systems includes the latest version 4 (v4) [6,7,8].
Table 1 lists the LEED categories with their maximum points for building certification, namely LEED-NC, LEED-EB, and LEED-CI for v4.
LEED-NC v4, LEED-EB v4, and LEED-CI v4 include six main categories: location and transportation (LT), sustainable sites (SS), water efficiency (WE), energy and atmosphere (EA), materials and resources (MR), indoor environmental quality (EQ), and two additional categories: innovation (IN) and regional priorities (RP) [6,7,8]. LEED-NC v4 and LEED-CI v4 include an additional category called the integration process (IP) [6,8].
For these certification systems, the LT category has significant weight with 16, 15, and 18 points in LEED-NC, LEED-EB, and LEED-CI, respectively (Table 1). Green building locations and transport accessibility in cities are pressing issues due to the high environmental pollution levels caused by conventional vehicles [9]. The LEED-EB system is the most sustainable of these three systems because certifying existing buildings significantly reduces the need for new resources and increases the recycling and reuse of building materials, fulfilling the definition of green building and paving the way for the future [10]. Therefore, in this study, we focused on the LT category of LEED-EB v4 certified buildings.
2. Literature Review
The relevant literature revealed two main directions of improvement for LEED transportation credits and the built environment’s impact on LEED scores.
2.1. Suggested Improvements for LEED Transportation Credits
Researchers have analyzed LEED transportation credits in projects/systems through the lens of other sustainable mobility issues. For example, Holzer and Lockrem [11] analyzed two projects, BG Group Place and BP Helios Plaza, located in Houston, Texas, USA. The projects have the same Platinum certification under LEED core and shell (LEED C-and-S). However, the BG Group Place is located in a high-rise development zone oriented toward pedestrian and transit transportation modes, whereas the BP Helios Plaza is located in a low-rise development zone oriented toward car transportation modes. In this respect, the authors noticed that according to the Walk Score database, the BG Group Place scored 95 for both walk and transit. By contrast, the BP Helios Plaza scored 46 for walk and 42 for transit. Using these examples of two equally certified buildings with different transportation options, the authors argue that LEED transportation credits should be mandatory for all projects. It should be noted that walk, transit, and bike scores range from 0 to 100 points. Section 3.1.3 presents more detailed properties of walk, transit, and scores.
Ewing et al. [12] created a predictive model for travel mode choice (walking, transit, or private car) and average trip duration for 239 different mixed-use properties in the cities of Atlanta, Boston, Houston, Portland, Sacramento, and Seattle (USA). The model was applied to 12 LEED Neighborhood Development (LEED-ND) pilot projects to predict estimated vehicle miles driven per person. The authors claim that their model improves the LEED-ND credit rating system and makes it less subjective.
Litman [13] suggested recommendations for improving LEED-NC transportation and parking credits. The authors proposed several new credits to reduce vehicle trips and improve parking management efficiency. Among them is the Green Transit Incentives Program (GreenTRIP), which rewards projects for reducing traffic and greenhouse gas emissions [14].
Zuniga-Teran et al. [15] analyzed walkability credits in the LEED-ND through the lens of connectivity, traffic safety, land use, density, parking, surveillance, greenspace, experience, and community (walkability framework (WF)). The authors suggested an improved LEED-ND version called the LEED-NDW+. Examples of such improvements include childcare facilities within a quarter mile (400 m) of homes and outdoor furniture such as benches and trash cans.
2.2. Impact of Built Environment on LEED Scores
Wu et al. [16] studied 55 LEED-ND v3 Silver-, Gold-, and Platinum-certified plans worldwide and found a positive significant correlation between 11 individual LEED credits and overall LEED scores. It should be noted that 27 out of 55 LEED-certified plans were located in the USA and were, consequently, based on two databases [17,18] from which the influence of walk, transit, and bike scores on overall LEE-ND v3-certified plans can be estimated. The post publication analysis of US-LEED-ND v3-certified plans showed that increased levels of LEED certification from Certified to Silver and Gold are associated with an increase in walk scores (median = 69, 75, and 87, respectively), transit scores (median = 38, 50, and 64, respectively), and bike scores (median = 67, 72, and 76, respectively). LEED-ND v3 platinum-certified plans were not considered because there were only two LEED-certified plans.
Pushkar [19] analyzed LEED-CI v4 Gold-certified office buildings in California, USA, and found that LEED-certified projects with low scores in the LT category (group 1, median = 3.0) were located in cities with a low percentage using public transportation, whereas LEED-certified buildings with high scores in the LT category (group 2, median = 17.0) were located in cities with a high percentage using public transportation. Post-publication analysis showed that low scores in the LT category (group 1) are associated with low walk, transit, and bike scores (median = 36, 39, and 69, respectively) while high scores in the LT category (group 2) are associated with high walk, transit, and bike scores (median = 99, 100, and 87, respectively).
Recently, Goodarzi and Berghorn [20] were the first to show the significant impact of walk, transit, and bike scores on the overall score of LEED-ND-certified buildings. They indicated that the four factors of transit score, walk score, bike score, and density explain 60% of overall LEED score variability. However, a limitation of this study is that the authors combined the four LEED certification levels (Platinum, Gold, Silver, and Certified (i.e., four independent groups)) into one group. In this case, correlation analysis may lead to erroneous statistical conclusions. Extensive practice using statistical analysis to evaluate LEED-certified projects has shown that each of the four LEED certification levels has a unique LEED certification strategy (e.g., [21,22,23]).
Based on the literature review, it can be concluded that the impact of walk, transit, and bike scores on the “alternative transportation” credit score from the LT category in LEED-EB v4-certified projects has not been well studied.
2.3. Hypothesis, Goal, Scientific Novelty, and Contribution
The hypothesis of the study was that the built environment (assessed with walk, transit, and bike scores) allows for achieving a high LT category, thereby moving projects toward a higher certification level.
Therefore, the purpose of this study was to evaluate the impact of the built environment (i.e., walk score, transit score, and bike score calculated with the Walk Score database [17]) on the location and transportation credit (LTc1) or “transportation alternative” credit scores in LEED-EB v4 Platinum, Gold, Silver, and Certified projects using a correlation analysis and pairwise comparison of the four unpaired groups.
Significant positive nonparametric Spearman’s rank correlations were found between the built environment (i.e., walk score, transit score, and bike score) and the LTc1, “alternative transportation” credit scores in LEED-EB v4-certified office projects.
This study suggests that LEED stakeholders can use the built environment (i.e., walk, transit, and bike scores) to achieve higher LTc1 scores in LEED-EB v4-certified office projects.
3. Materials and Methods
3.1. Data Collection
3.1.1. LEED Data Collection
The USGBC database was used to collect 216 LEED-EB v4-certified projects in the United States [18]. The Green Building Information Gateway database showed that these projects belong to the office space type [24].
Table 2 shows the distribution of LEED-EB v4-certified office projects according to certification level in the United States.
3.1.2. Built Environment Data Collection
The Walk Score database was used to collect three built environment scores (i.e., walk, transit, and bike) for each LEED-certified project according to address [17]. The Walk Score database includes Walk Score™ (a measure of walkability to neighborhood resources), Transit Score™ (a measure of transit access) [25], and Bike ScoreTM (a measure of environmental characteristics associated with cycling) [26]. Schmid-Querg et al. [27] showed that Lowry et al. [28] and Nielsen [29] formulated a more detailed definition of bikeability. However, an expanded definition of bikeability is beyond the scope of this study. The scoring methodology for “walk”, “transit”, and “bike” is interpreted in Section 3.1.3.
3.1.3. Scoring Methodology for Walk, Transit, and Bike
3.2. Data Analysis
3.2.1. Quadrant Analysis
Figure 1 demonstrates four types of relationships between the LTc1 and built environment score.
Quadrant analysis was applied to estimate the four types of relationships between the LTc1 and environment scores. The criterion for dividing by four quadrants was 50% of the score maximum.
3.2.2. Gauss–Markov Assumptions for Linear Correlation Analysis
A linear correlation analysis was performed using either the parametric Pearson’s test or the nonparametric Spearman’s test. The choice between these two tests was based on the satisfaction of at least four Gauss–Markov assumptions [32,33].
Pearson’s test is used when the four Gauss–Markov assumptions are met. Spearman’s test is used when at least one of the four Gauss–Markov assumptions is not met.
Table 4 shows that in only one out of 16 pairs, namely, at the Certified level, LTc1 vs. transit score, all four Gauss–Markov assumptions are met. Thus, Pearson’s test was used for this pair, and Spearman’s test for the remaining pairs.
3.2.3. Interpretation of Linear or Monotonic Correlation Analysis
Linear correlation analysis was used to assess (1) the strength of the relationship between the LTc1 score and built environment score using correlation coefficient (r) and (2) whether the relationship between the independent variable (i.e., built environment score) and the dependent variable (i.e., LTc1 score) is significant using a two-tailed p-value [34].
Five intervals of absolute |r| values were used to estimate the strength of the relationship between the LTc1 score and built environment score: Very Weak, 0.00–0.19; Weak, 0.20–0.39; Moderate, 0.40–0.59; Strong, 0.60–0.79; Very Strong, 0.80–1.00 [35].
3.2.4. Pairwise-Comparison Unpaired Four Groups
LEED-certified office buildings were considered four unpaired groups: Platinum, Gold, Silver, and Certified. Median and interquartile range (IQR)/median ratio (IQR/M) were used, as well as the Wilcoxon–Mann–Whitney (WMW) test since the assumption of normality was not met for LEED data [36]. WMW statistics were used to calculate the two-tailed p-value [37]. The Cliff’s δ test was used to estimate the substantive significance (effect size) [38].
3.2.5. Interpretation of p-Value and Cliff δ Value
Three-valued logic was used to interpret p-value [39,40]. A more detailed explanation of three-valued logic was provided in [36]. Cliff’s δ ranged between −1 and +1 with three defined levels of effect size: small, |0.147|; medium, |0.33|; and large, |0.474| [41]. Cohen [42] noted that to a careful observer, the medium effect size is noticeable. A small effect is smaller than medium but cannot be considered insignificant. The distance between the large and medium effect sizes is the same as the distance between the medium and small effect sizes. It was noted that effect size is not a “fixed criterion” but merely a guideline that can be followed in the absence of knowledge about the area [43,44].
4. Results and Discussion
4.1. LEED-Certified Buildings and Built Environment Scores
Table 5 shows that walk, transit, and bike scores (i.e., built environment scores) can influence the percentage distribution of LEED-certified buildings in the United States’ urban areas.
High built environment scores may be the reason why LEED-certified buildings have achieved high certification levels such as Platinum and Gold. By contrast, low built environment scores may be the reason why LEED-certified buildings have achieved low certification levels such as Silver and Certified. Braun and Bienert [45] noted that LEED Gold- and Platinum-certified projects are primarily located in downtown areas, while LEED Certified- and Silver-certified projects are primarily located in suburban areas. Assuming that business districts are associated with higher levels of walk scores, transit scores, and bike scores compared to suburban areas, this may partially explain the percentage distribution (%) of LEED-EB v4-certified office buildings across built environment indicators and certification levels. To test this hypothesis, the results of quadrant analysis, correlation coefficient, and p-value are presented in Section 4.2.
4.2. Relationship between LTc1 and Built Environment Scores
Figure 2 shows that the majority of built environment scores and LTc1 scores in LEED Platinum-certified office buildings are high (Quadrant I). At the Platinum certification level, Spearman’s correlation results showed a moderate positive and significant correlation between each of the three built environment scores as well as the sum of the three built environment scores and LTc1 scores.
Figure 3 shows that the majority of built environment and LTc1 scores in LEED Gold-certified office buildings are distributed between two quadrants: either high built environment scores and high LTc1 scores (Quadrant I) or low built environment scores and high LTc1 scores (Quadrant II). At the Gold certification level, Spearman’s correlation results showed a strong positive and significant correlation between walk scores and LTc1 scores, between transit scores and LTc1, and between the sum of three built environment scores and LTc1 scores, indicating a moderate positive and significant correlation between bike scores and LTc1 scores.
Figure 4 shows that the majority of built environment scores and LTc1 scores in LEED Silver-certified office buildings are distributed among three quadrants: high built environment scores and high LTc1 scores (Quadrant I), low built environment scores and high LTc1 scores (Quadrant II), and low built environment scores and low LTc1 scores (Quadrant III). At the Silver certification level, Spearman’s correlation results showed a moderate positive and significant correlation between walk scores and LTc1 scores, between transit scores and LTc1 scores, between bike scores and LTc1 scores, and between the sum of three built environment scores and LTc1 scores.
In Figure 5, LEED Certified office buildings show approximately equal distributions of built environment and LTc1 scores among four quadrants: high built environment scores and high LTc1 scores (Quadrant I), low built environment scores and high LTc1 scores (Quadrant II), low built environment scores and low LTc1 scores (Quadrant III), and high built environment scores and low LTc1 scores (Quadrant IV). At the Certified level, Spearman’s correlation results showed a very weak or very weak positive and non-significant correlation between built environment and LTc1 scores.
According to the literature, quadrat analysis is widely used to analyze both LEED-certified project distributions and LEED certification strategies. For example, Shuang et al. [46] used quadrant analysis to estimate the spatial distribution of LEED-certified buildings across 31 provinces in China from 2006 to 2022. They showed that a “Matthew effect” occurred between provinces with high green building development and provinces with low green building development over time. Consequently, high green building development increased and low green building development significantly decreased. Consistent with the six-shear layer concept of Brand [47] and the two-layer concept of Shaviv [48], Pushkar and Verbitsky [49] used quadrant analysis to examine the distribution of LEED credits between the Building (including credits responsible for Site, Structure, Skin) and Service layers (including credits responsible for Service, Space, and Stuff) in LEED-EB Silver and Gold projects in the United States. They found that LEED-EB Silver projects are associated with higher scores in the Service layer and lower scores in the Building layer. By contrast, LEED-EB Gold projects have higher scores in both the Service and Building layers.
Analyses of the quadrants in Figure 2, Figure 3, Figure 4 and Figure 5 show that as the certification level decreases from Platinum to Certified, through Gold and Silver, the built environment scores and LTc1 scores shift from Quadrant I with high values to Quadrant III with low values.
Spearman’s rank correlation analysis is widely used to examine both the relationship between LEED credit scores and the influence of architectural factors on LEED credit scores. For example, the relationship between LEED credit scores is presented in two studies. Pushkar [50] studied the LT category in LEED-CI v4-certified projects in California, USA. The author found that at the three certification levels—Certified, Silver, and Gold—there were strong or very strong positive correlations between the two LT credits “surrounding density and diverse uses” and “access to quality transit” (0.77 ≤ r ≤ 0.88). Pushkar [51] found a negative correlation between the “optimize energy performance” credit scores from the EA category and the sum of credits from the EA, SS, and EQ categories in LEED-EB v4 Gold-certified projects in Spain (r = -0.71).
The influence of architectural factors on LEED credit scores is presented in one study. For example, Smith and Bereitschaft [52] investigated the influence of two urbanization measures, namely night-time light (NTL) intensity scores and the percentage of impervious land cover (PILC), on LEED-ND “smart location and linkages” (SLL) LEED-ND-SSL-certified project scores. They found a positive correlation between the SLL category scores and NTL scores and between the SLL category scores and PILC (r = 0.35 and 0.58, respectively).
The results of Spearman’s rank correlation in Figure 2, Figure 3 and Figure 4 showed the significant influence of built environment scores (i.e., walk score, transit score, and bike score) on LTc1 scores in LEED-EB v4 Platinum, Gold, and Silver-certified office buildings. However, Figure 5 shows no correlation between built environment scores and LTc1 scores. This finding can be explained as follows: if the built environment scores show high values, a monotonic increase in LTc1 scores occurs with an increase in these scores. However, if the built environment scores show low values, a monotonic increase or decrease in LTc1 scores is not observed.
To clarify and validate these explanations, a pairwise comparison analysis was conducted across four LEED certification levels using three built environment scores (i.e., walk, transit, and bike scores) and LTc1 scores.
4.3. Pairwise Comparison of LEED Certification Levels
Table 6 shows that as the LEED certification level decreases, walk, transit, bike, and LTc1 median scores decrease and the IQR/M ratio increases. An increase in IQR/M may indicate increased heterogeneity in LEED data.
Table 6 also shows that, for bike and LTc1 scores, LEED Platinum, Gold, and Silver projects outperformed Certified projects with large effect sizes. Similarly, LEED Platinum and Gold outperformed Certified projects with medium/large effect sizes in walk and transit scores.
A literature review identified at least four studies examining the differences between adjacent certification levels in projects within the same system, specifically LEED-NC-certified projects. In comprehensive studies, Wu et al. [53,54] found that EA was the primary factor driving the transition from Certified to Silver, Silver to Gold, and Gold to Platinum in both LEED v2.2 and LEED v3 2009 certified projects. However, as shown in Table 7, the difference in EA scores between adjacent certification levels depends on the LEED system version.
Pushkar and Verbitsky [55] found that EA scores depend on green building policies at the state level. Table 8 shows significant differences in EA scores between LEED Silver and Gold projects in two US states using the same LEED system [55].
Pham et al. [56] studied the performance of the capacious EAc1, “optimize energy performance” credit (max score = 19) in LEED-NC v3 2009-certified projects at the Silver, Gold, and Platinum certification levels. Pham et al. [56] demonstrated that differences between the EAc1 credit in the Gold group and EAc1 in the Silver group, as well as differences between EAc1 in the Platinum group and EAc1 in the Gold group had large effect sizes (Cliff’s δ = 0.61 and 0.73, respectively). Due to a lack of descriptive statistics in Pham et al.‘s study [56], the differences between adjacent certification levels could not be analyzed in tabular form.
Therefore, differences in walk, transit, bike, and LTc1 scores should be explained in terms of the four LEED certification levels.
The correlation analysis of each certification level and comparisons between certification levels suggest that high built environment scores strongly influence LEED certification strategies by increasing LTc1 achievements at the Platinum, Gold, and Silver levels. As a result of the low walk, transit, bike, and LTc1 scores at the Certified level, low built environment scores do not impact the LEED certification strategy.
5. Conclusions
For the LEED-EB v4 system, the LT category has significant weight, accounting for 15 of the total 110 points. Thus, this category can significantly contribute to increasing certification levels. This study compared the built environment (through walk, transit, and bike score evaluations) and LTc1 achievements at each of the four certification levels for LEED-EB v4-certified office projects in the United States.
For LEED-EBv4-certified projects located in downtown areas, LTc1 can be seen as a significant tool to achieve higher LEED certification levels. On the contrary, LTc1 can be seen as a significant obstacle to achieving high LEED certification levels in suburban areas. LEED designers should look for possible compensation credits for projects in areas with low built environment scores to increase total sustainability levels.
References
- Foundations of LEED https://www.usgbc.org/resources/foundations-leed. (accessed on 13 July 2024).
- USGBC brand https://www.usgbc.org/about/brand. (accessed on 13 July 2024).
- Ade, R.; Rehm, M. The unwritten history of green building rating tools: A personal view from some of the ‘founding fathers’. Build. Res. Inf. 2020, 48, 1–17. [Google Scholar] [CrossRef]
- Fuerst, F. Building momentum: an analysis of investment trends in LEED and Energy Star-certified properties. J Retail Leis. Prop. 2009, 8, 285–97. [Google Scholar] [CrossRef]
- Talen, E.; Allen, E.; Bosse, A.; Ahmann, J.; Koschinsky, J.; Wentz, E.; Anselin, L. LEED-ND as an urban metric. Landsc. Urban Plan. 2013, 119, 20–34. [Google Scholar] [CrossRef]
- LEED. LEED v4 for Building Design and Construction. 2018. Available online: https://www.usgbc.org/resources/leed-v4-building-design-and-construction-current-version (accessed on 26 February 2024).
- LEED-EBv4 2019. LEED v4 for Existing Buildings. Available online: https://www.usgbc.org/resources/leed-v4-building-operations-and-maintenance-current-version (accessed on 12 February 2024).
- LEED-CIv4 2019. LEED v4 for Interior Design and Construction. Available online: https://www.usgbc.org/resources/leed-v4-interior-design-and-construction-current-version (accessed on 16 February 2024).
- Yang, Z.; Li, J. Towards Green and Smart Cities: Urban Transport and Land Use. Sustainability 2024, 16, 595. [Google Scholar] [CrossRef]
- Keeton, J.M. The Road to Platinum Using the Usgbc’s Leed-EB® Green Building Rating System to Retrofit the U.S. Environmental Protection Agency’s Region 10 Park Place Office Building. J. Green Build. 2010, 5, 55–75. [Google Scholar] [CrossRef]
- Holzer, R.; Lockrem, Z. Complete streets and livable centers: Why location matters. J. Green Build. 2011, 6(3), 21–32. [Google Scholar] [CrossRef]
- Ewing, R.; Greenwald, M.J.; Zhang, M.; Bogaerts, M.; Greene, W. Predicting Transportation Outcomes for LEED Projects. J. Plan. Educ. Res. 2013, 33(3), 265–279. [Google Scholar] [CrossRef]
- Litman, T.; Recommendations for Improving LEED Transportation and Parking Credits. Victoria Transport Policy Institute. 2015. Available online: https://www.vtpi.org/leed_rec.pdf (accessed on 15 March 2024).
- Green Transit Incentives Program (GreenTRIP) https://www.alberta.ca/greentrip. (accessed on 13 July 2024).
- Zuniga-Teran, A.A.; Orr, B.J.; Gimblett, R.H.; Chalfoun, N.V.; Going, S.B.; Guertin, D.P.; Marsh, S.E. Designing healthy communities: A walkability analysis of LEED-ND. Front. Archit. Res. 2016, 4(5), 433–452. [Google Scholar] [CrossRef]
- Wu, P.; Song, Y.; Hu, X.; Wang, X. A Preliminary Investigation of the Transition from Green Building to Green Community: Insights from LEED ND. Sustainability 2018, 10, 1802. [Google Scholar] [CrossRef]
- WalkScore https://www.walkscore.com/cities-and-neighborhoods/. (accessed on 13 July 2024).
- LEED project directory https://www.usgbc.org/projects. (accessed on 13 July 2024).
- Pushkar, S. Life-Cycle Assessment in the LEED-CI v4 Categories of Location and Transportation (LT) and Energy and Atmosphere (EA) in California: A Case Study of Two Strategies for LEED Projects. Sustainability 2022, 14, 10893. [Google Scholar] [CrossRef]
- Goodarzi, M.; Berghorn, G. Research of key LEED-ND criteria for effective sustainability assessment. J. Green Build. 2024, 19(1), 283–306. [Google Scholar] [CrossRef]
- Pushkar, S. Evaluating LEED commercial interior (LEED-CI) projects under the LEED transition from v3 to v4: The differences between China and the US. Heliyon 2020, 6, e04701. [Google Scholar] [CrossRef] [PubMed]
- Chi, B.; Lu,W. ; Ye, M.; Bao, Z.; Zhang, X. Construction waste minimization in green building: A comparative analysis of LEED-NC 2009 certified projects in the US and China. J. Clean. Prod. 2020, 256, 120749. [Google Scholar] [CrossRef]
- Pham, D.H.; Kim, B.; Lee, J.; Ahn, Y. An Investigation of the Selection of LEED Version 4 Credits for Sustainable Building Projects. Appl. Sci. 2020, 10, 7081. [Google Scholar] [CrossRef]
- The Green Building Information Gateway. Available online: http://www.gbig.org (accessed on 13 July 2024).
- Chaiyachati, K.H.; Hom, J.K.; Hubbard, R.A.; Wong, C.; Grande, D. Evaluating the association between the built environment and primary care access for new Medicaid enrollees in an urban environment using walk and transit scores. Prev. Med. Rep. 2018, 9, 24–28. [Google Scholar] [CrossRef]
- Winters, M.; Teschke, K.; Brauer, M.; Fuller, D. Bike Score®: Associations between urban bikeability and cycling behavior in 24 cities. Int. J. Behav. Nutr. Phys. Act. 2016, 13, 18. [Google Scholar] [CrossRef]
- Schmid-Querg, J.; Keler, A.; Grigoropoulos, G. The Munich Bikeability Index: A Practical Approach for Measuring Urban Bikeability. Sustainability 2021, 13, 428. [Google Scholar] [CrossRef]
- Lowry, M.B.; Callister, D.; Gresham, M.; Moore, B. Assessment of communitywide bikeability with bicycle level of service. Transp. Res. Rec. 2012, 2314, 41–48. [Google Scholar] [CrossRef]
- Nielsen, T.A.S.; Skov-Petersen, H. Bikeability—Urban structures supporting cycling. Effects of local, urban and regional scale urban form factors on cycling from home and workplace locations in Denmark. J. Transp. Geogr. 2018, 69, 36–44. [Google Scholar] [CrossRef]
- Sandeep Ahuja 2024 https://help.covetool.com/en/articles/3703323-walk-score-transit-score-bike-score. (accessed on 13 July 2024).
- How Walk Score Works https://www.walkscore.com/how-it-works/. (accessed on 13 July 2024).
- Boldina, I.; Beninger, P.G. Strengthening statistical usage in marine ecology: Linear regression. J. Exp. Mar. Biol. Ecol. 2016, 474, 81–91. [Google Scholar] [CrossRef]
- Pushkar, S. Relationship between Project Space Types, Optimize Energy Performance Credit, and Project Size in LEED-NC Version 4 (v4) Projects: A Case Study. Buildings 2022, 12, 862. [Google Scholar] [CrossRef]
- McDonald, J.H. Handbook of Biological Statistics, 2rd ed.; Sparky House Publishing: Baltimore, MA, USA, 2009; pp. 207–220. [Google Scholar]
- Evans, J.D. Straightforward Statistics for the Behavioral Sciences; Brooks/Cole Publishing: Pacific Grove, CA, USA, 1996. [Google Scholar]
- Pushkar, S. Leadership in Energy and Environmental Design Commercial Interior Version 4 (LEED-CI v4) Gold-Certified Office Space Projects: A Pairwise Comparative Analysis between Three Mediterranean Countries. Buildings 2024, 14, 815. [Google Scholar] [CrossRef]
- Bergmann, R.; Ludbrook, J.; Spooren, W.P. Different outcomes of the Wilcoxon-Mann-Whitney test from different statistics packages. Am. Stat. 2000, 54, 72–77. [Google Scholar]
- Cliff, N. Dominance statistics: Ordinal analyses to answer ordinal questions. Psychol. Bull. 1993, 114, 494–509. [Google Scholar] [CrossRef]
- Hurlbert, S.H.; Lombardi, C.M.; Final collapse of the Neyman-Pearson decision theoretic framework and rise of the neoFisherian. Ann. Zool. Fenn. 2009, 46, 311–349. Available online: https://www.jstor.org/stable/23736900 (accessed on 13 July 2024).
- Hurlbert, S.H.; Lombardi, C.M. Lopsided reasoning on lopsided tests and multiple comparisons. Aust. N. Z. J. Stat. 2012, 54, 23–42. [Google Scholar] [CrossRef]
- Romano, J.; Corragio, J.; Skowronek, J. Appropriate statistics for ordinal level data: Should we really be using t-test and Cohen’s d for evaluating group differences on the NSSE and other surveys? In Proceedings of the Annual Meeting of the Florida Association of Institutional Research, Cocoa Beach, FL, USA, 1–3 February 2006; Florida Association for Institutional Research: Cocoa Beach, FL, USA, 2006; pp. 1–33. [Google Scholar]
- Cohen, J. A power primer. Psychol. Bull. 1992, 112, 155–159. [Google Scholar] [CrossRef] [PubMed]
- Volker, M.A. Reporting effect size estimates in school psychology research. Psychol. Schools 2006, 43, 653–672. [Google Scholar] [CrossRef]
- Durlak, J.A. How to select, calculate, and interpret effect sizes. J. Pediatr. Psychol. 2009, 34, 917–928. [Google Scholar] [CrossRef] [PubMed]
- Braun, T.; Bienert, S. Is Green (still) a Matter of Prime? Stylized Facts about the Location of Commercial Green Buildings, J. Sustain. Real Estate, 2015, 7(1), 160–182.
- Shuang, H.; Luo, J. Gan, X.; Xiang, S. LEED certification system for green buildings in China: Examining spatial differences, temporal evolution, and spatial overflow. J. Clean. Prod. 2024, 458, 142479. [Google Scholar] [CrossRef]
- Brand, S. How Buildings Learn: What Happens after They’re Built; Viking Press: New York, NY, USA, 1994; 243p, ISBN 978-0-670-83515-7. [Google Scholar]
- Shaviv, E. Applications of Simulation and Cad Tools in the Israeli “Green Building” Standard for Achieving Low Energy Architecture . In Proceedings of the Building Simulation 2011: 12th Conference of International Building Performance Simulation Association, Sydney, Australia, 14–16 November 2011. [Google Scholar]
- Pushkar, S.; Verbitsky, O. Strategies for LEED certified projects: The building layer versus the service layer. Can. J. Civ. Eng. 2018, 45, 1065–1072. [Google Scholar] [CrossRef]
- Pushkar, S. The LEED-commercial interiors (V4) projects in California. J. Green Build. 2021, 16, 57–72. [Google Scholar] [CrossRef]
- Pushkar, S. Impact of “Optimize Energy Performance” Credit Achievement on the Compensation Strategy of Leadership in Energy and Environmental Design for Existing Buildings Gold-Certified Office Space Projects in Madrid and Barcelona, Spain. Buildings 2023, 13, 2656. [Google Scholar] [CrossRef]
- Smith, R.M.; Bereitschaft, B. Sustainable Urban Development? Exploring the Locational Attributes of LEED-ND Projects in the United States through a GIS Analysis of Light Intensity and Land Use. Sustainability 2016, 8, 547. [Google Scholar] [CrossRef]
- Wu, P.; Mao, C.; Wang, J.; Song, Y.Z.; Wang, X.Y. A decade review of the credits obtained by LEED v2.2 certified green building projects. Build. Environ. 2016, 102, 167–178. [Google Scholar] [CrossRef]
- Wu, P.; Song, Y.; Shou,W. ; Chi, H.; Chong, H.Y.; Sutrisna, M. A comprehensive analysis of the credits obtained by LEED 2009 certified green buildings. Renew. Sustain. Energy Rev. 2017, 68 Pt 1, 370–379. [Google Scholar] [CrossRef]
- Pushkar, S.; Verbitsky, O. LEED-NC 2009 Silver to Gold certified projects in the US in 2012–2017: An appropriate statistical analysis. J. Green Build. 2019, 14, 83–107. [Google Scholar] [CrossRef]
- Pham, D.H.; Kim, B.; Lee, J.; Ahn, A.C.; Ahn, Y. A Comprehensive Analysis: Sustainable Trends and Awarded LEED 2009 Credits in Vietnam. Sustainability 2020, 12, 852. [Google Scholar] [CrossRef]
Figure 1.
Quadrant analysis of the relationship between the LTc1 “transportation alternative” score and the built environment score.
Figure 1.
Quadrant analysis of the relationship between the LTc1 “transportation alternative” score and the built environment score.

Figure 2.
Impact of built environment scores on LTc1 “transportation alternative” scores in LEED Platinum-certified office buildings.
Figure 2.
Impact of built environment scores on LTc1 “transportation alternative” scores in LEED Platinum-certified office buildings.
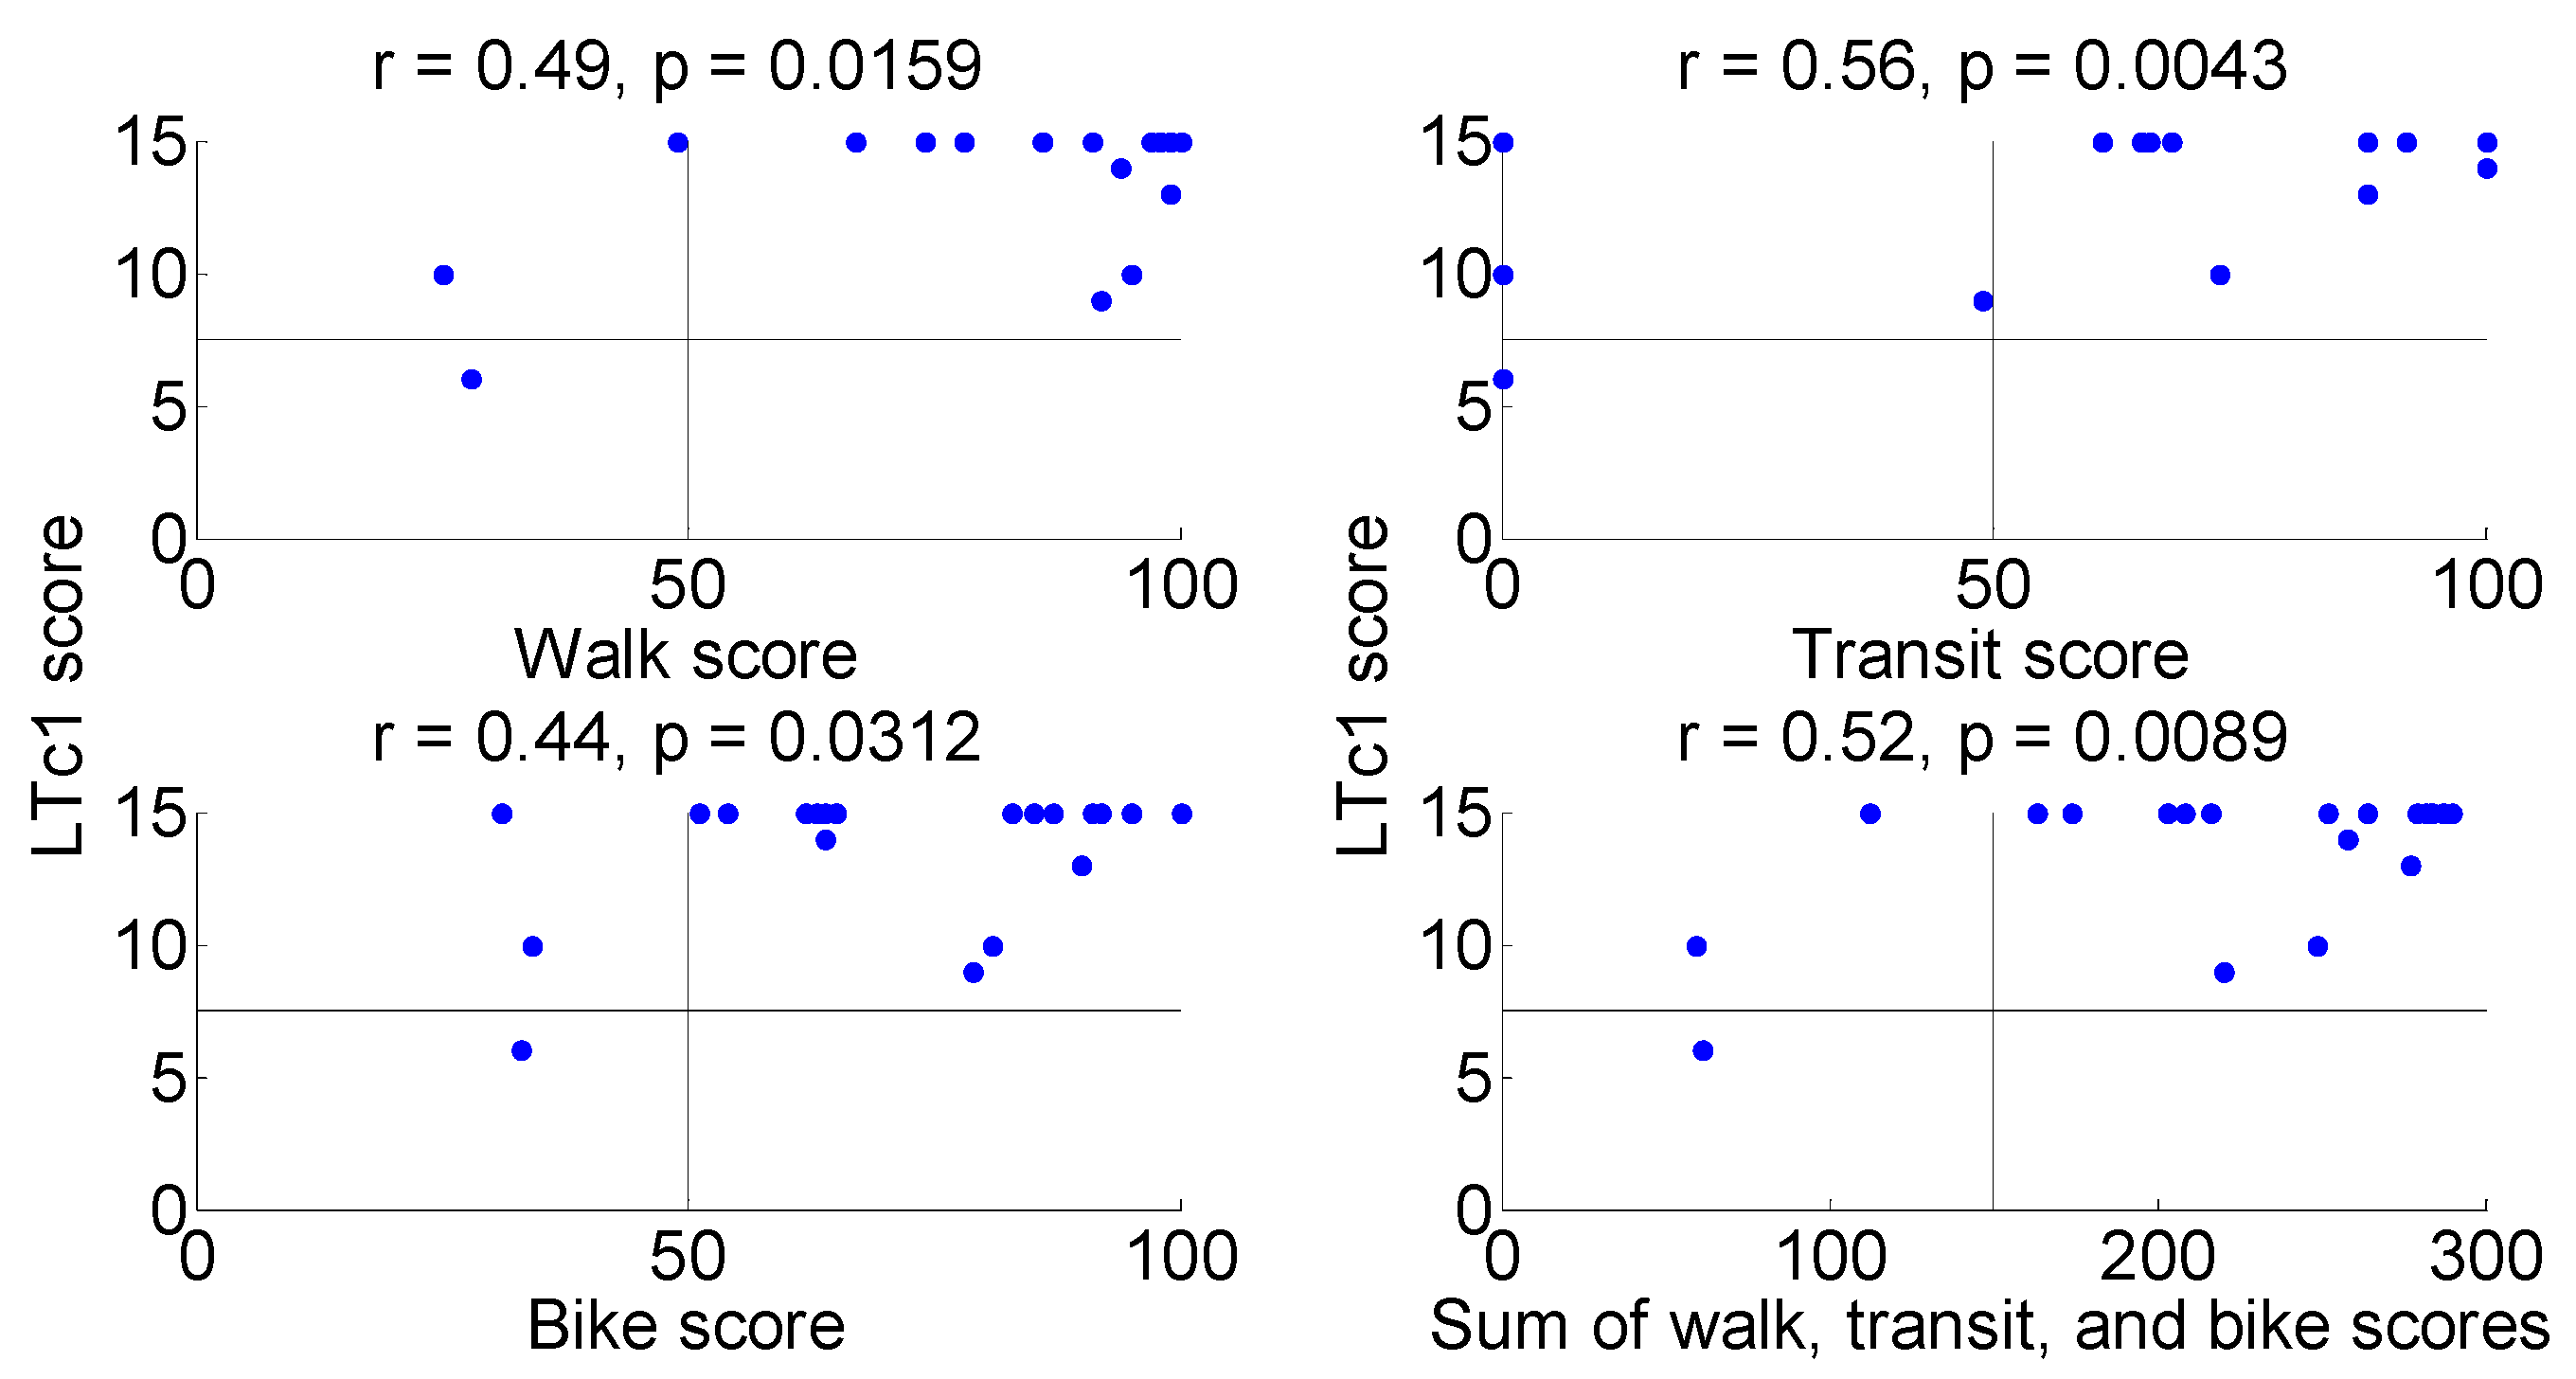
Figure 3.
Impact of built environment scores on LTc1 “transportation alternative” scores in LEED Gold-certified office buildings.
Figure 3.
Impact of built environment scores on LTc1 “transportation alternative” scores in LEED Gold-certified office buildings.
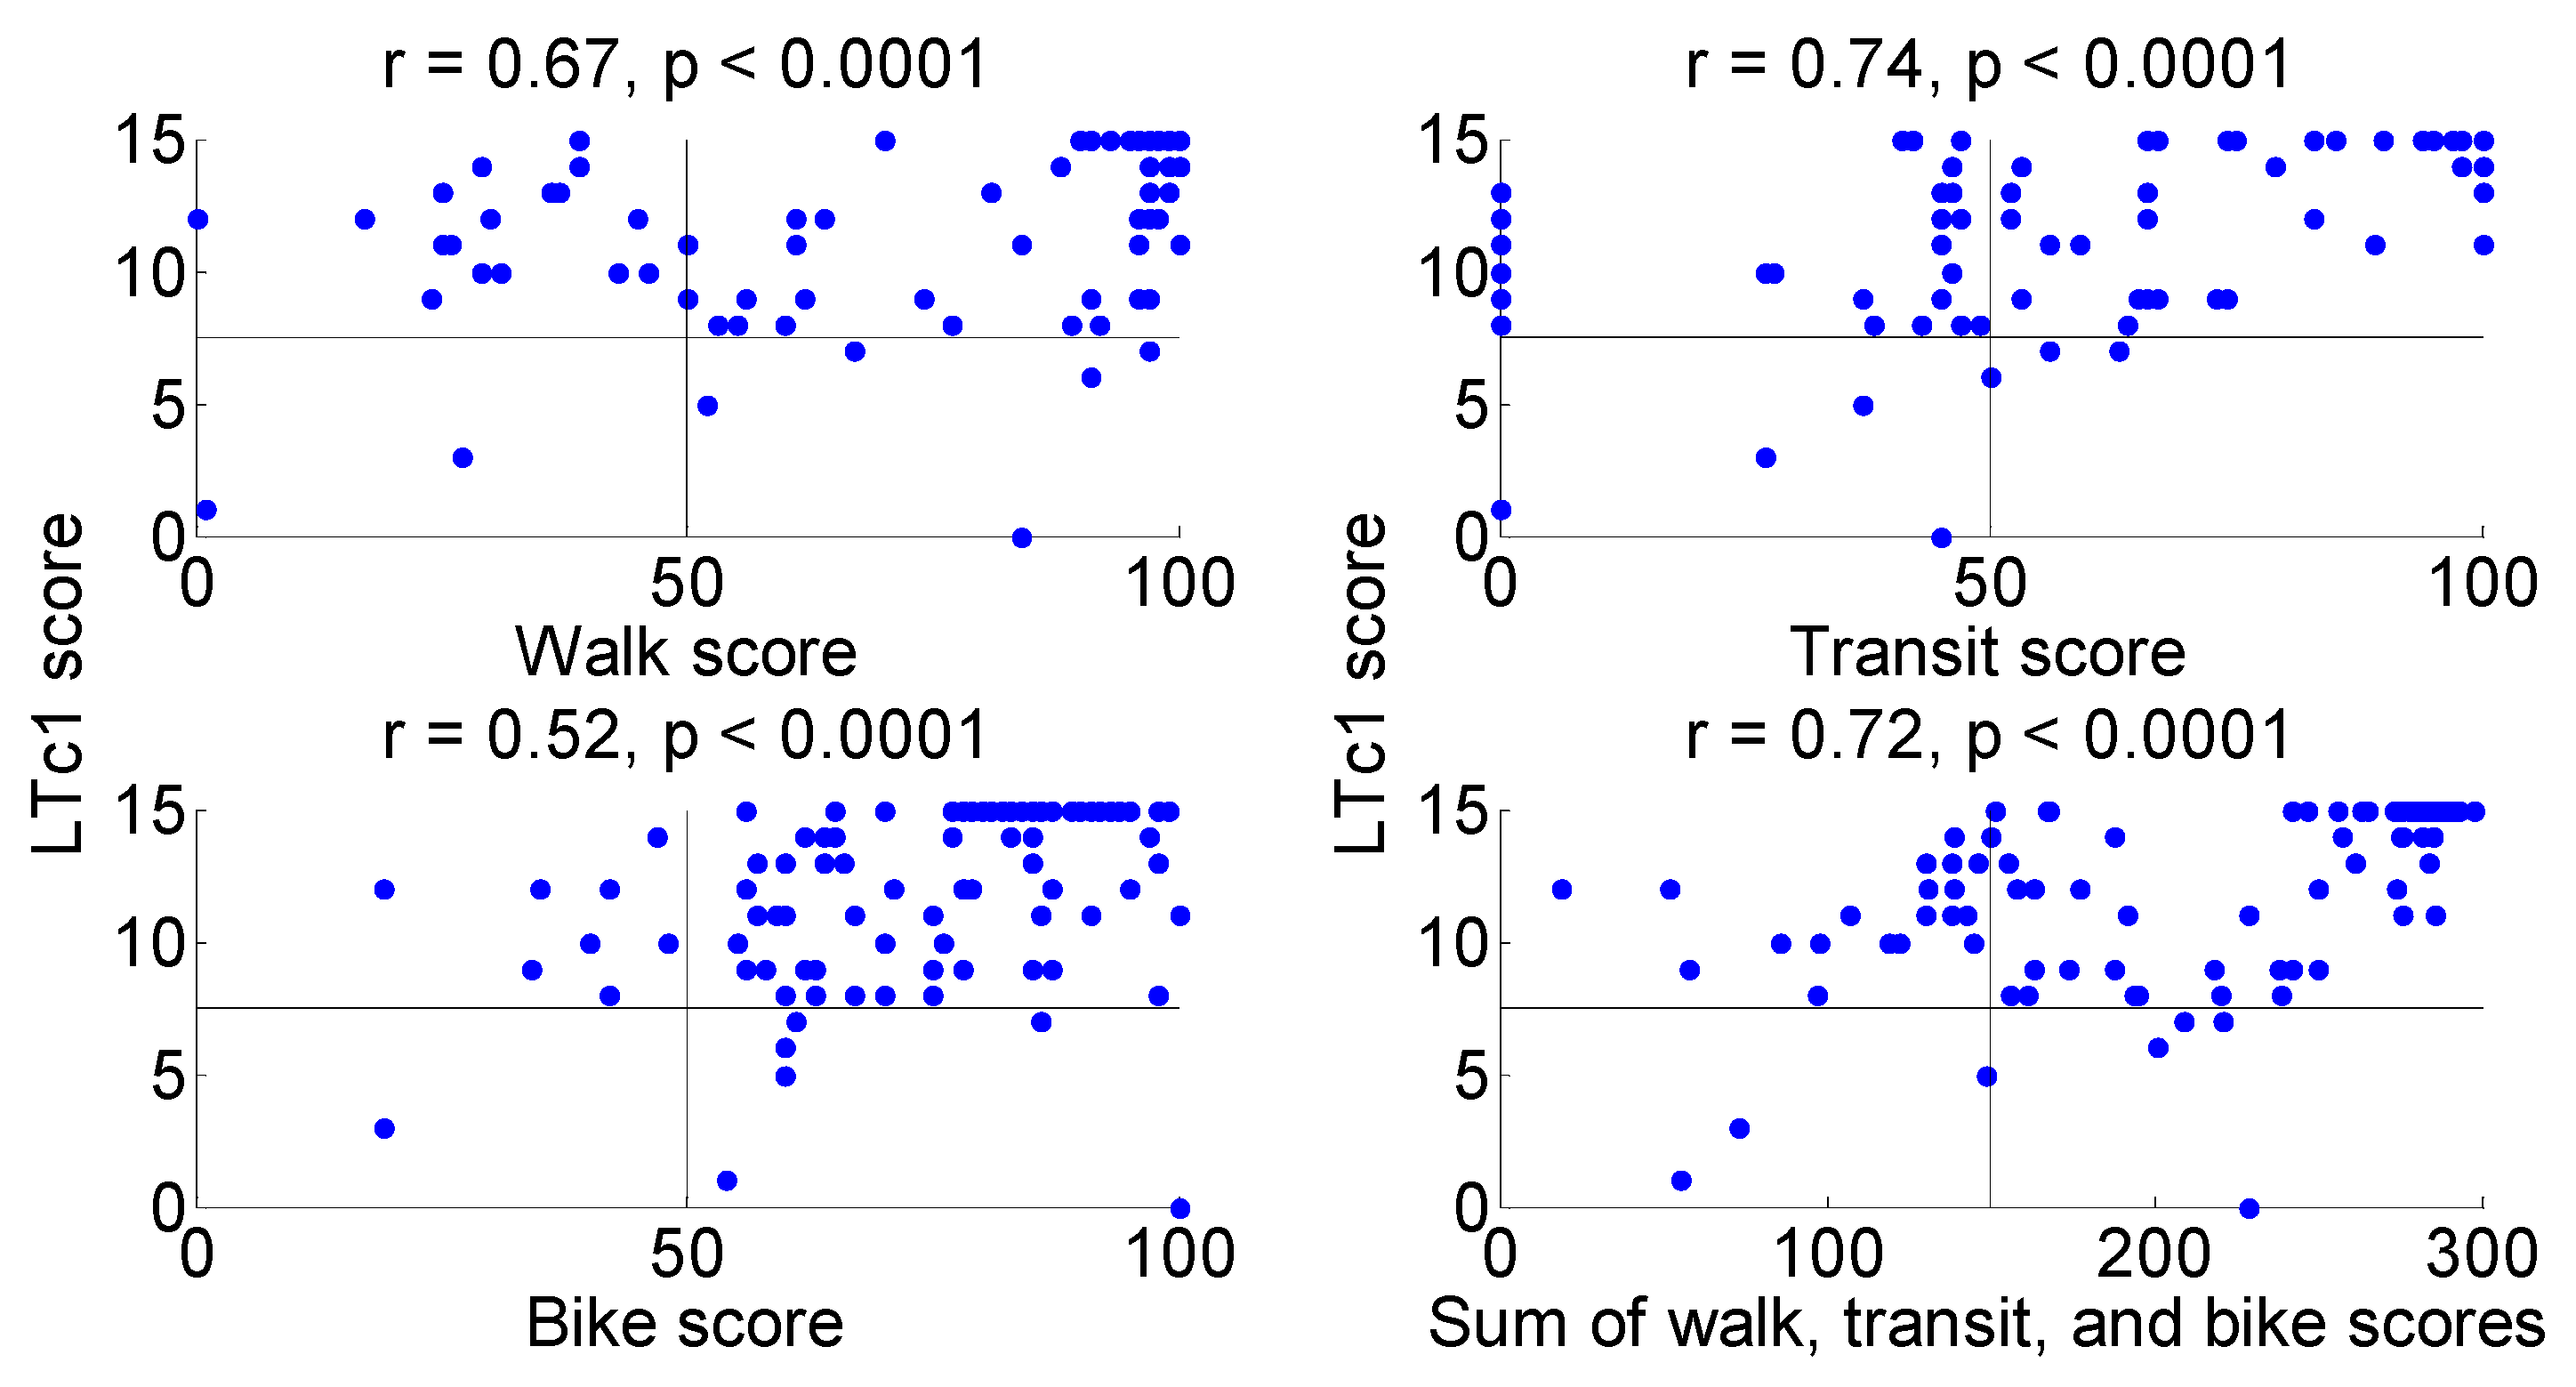
Figure 4.
Impact of built environment scores on LTc1 “transportation alternative” scores in LEED Silver-certified buildings.
Figure 4.
Impact of built environment scores on LTc1 “transportation alternative” scores in LEED Silver-certified buildings.
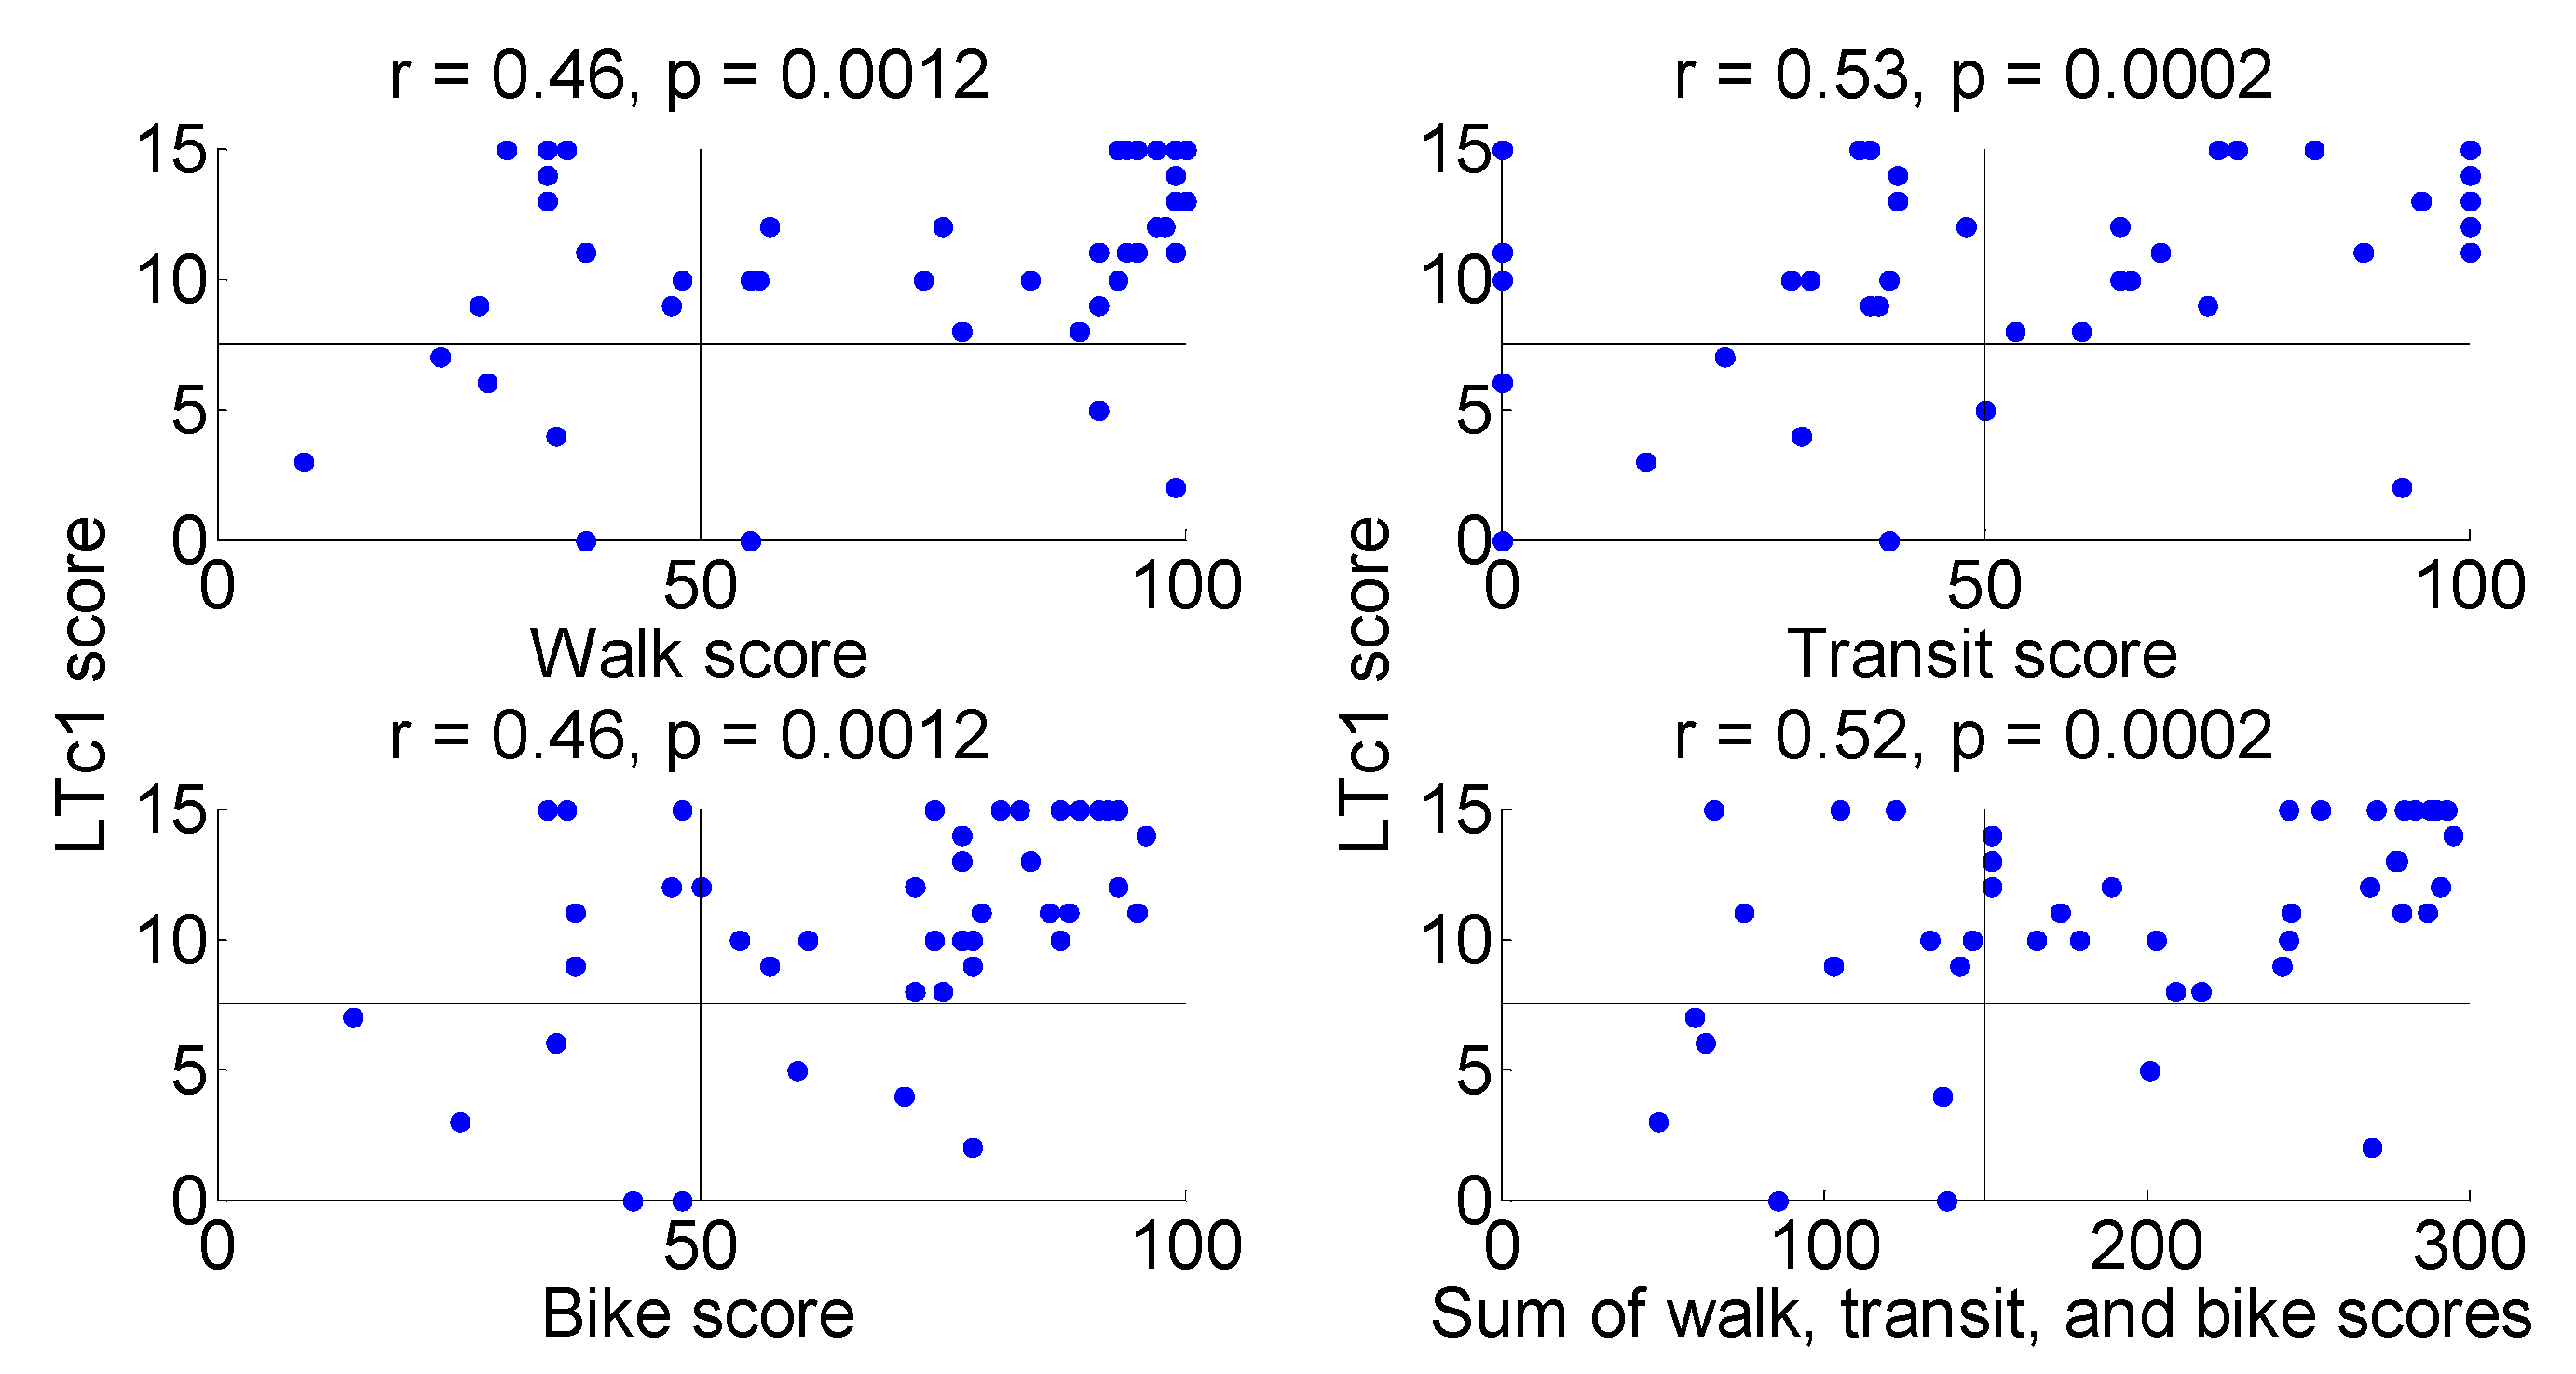
Figure 5.
Impact of built environment scores on LTc1 “transportation alternative” scores in LEED Certified office buildings.
Figure 5.
Impact of built environment scores on LTc1 “transportation alternative” scores in LEED Certified office buildings.
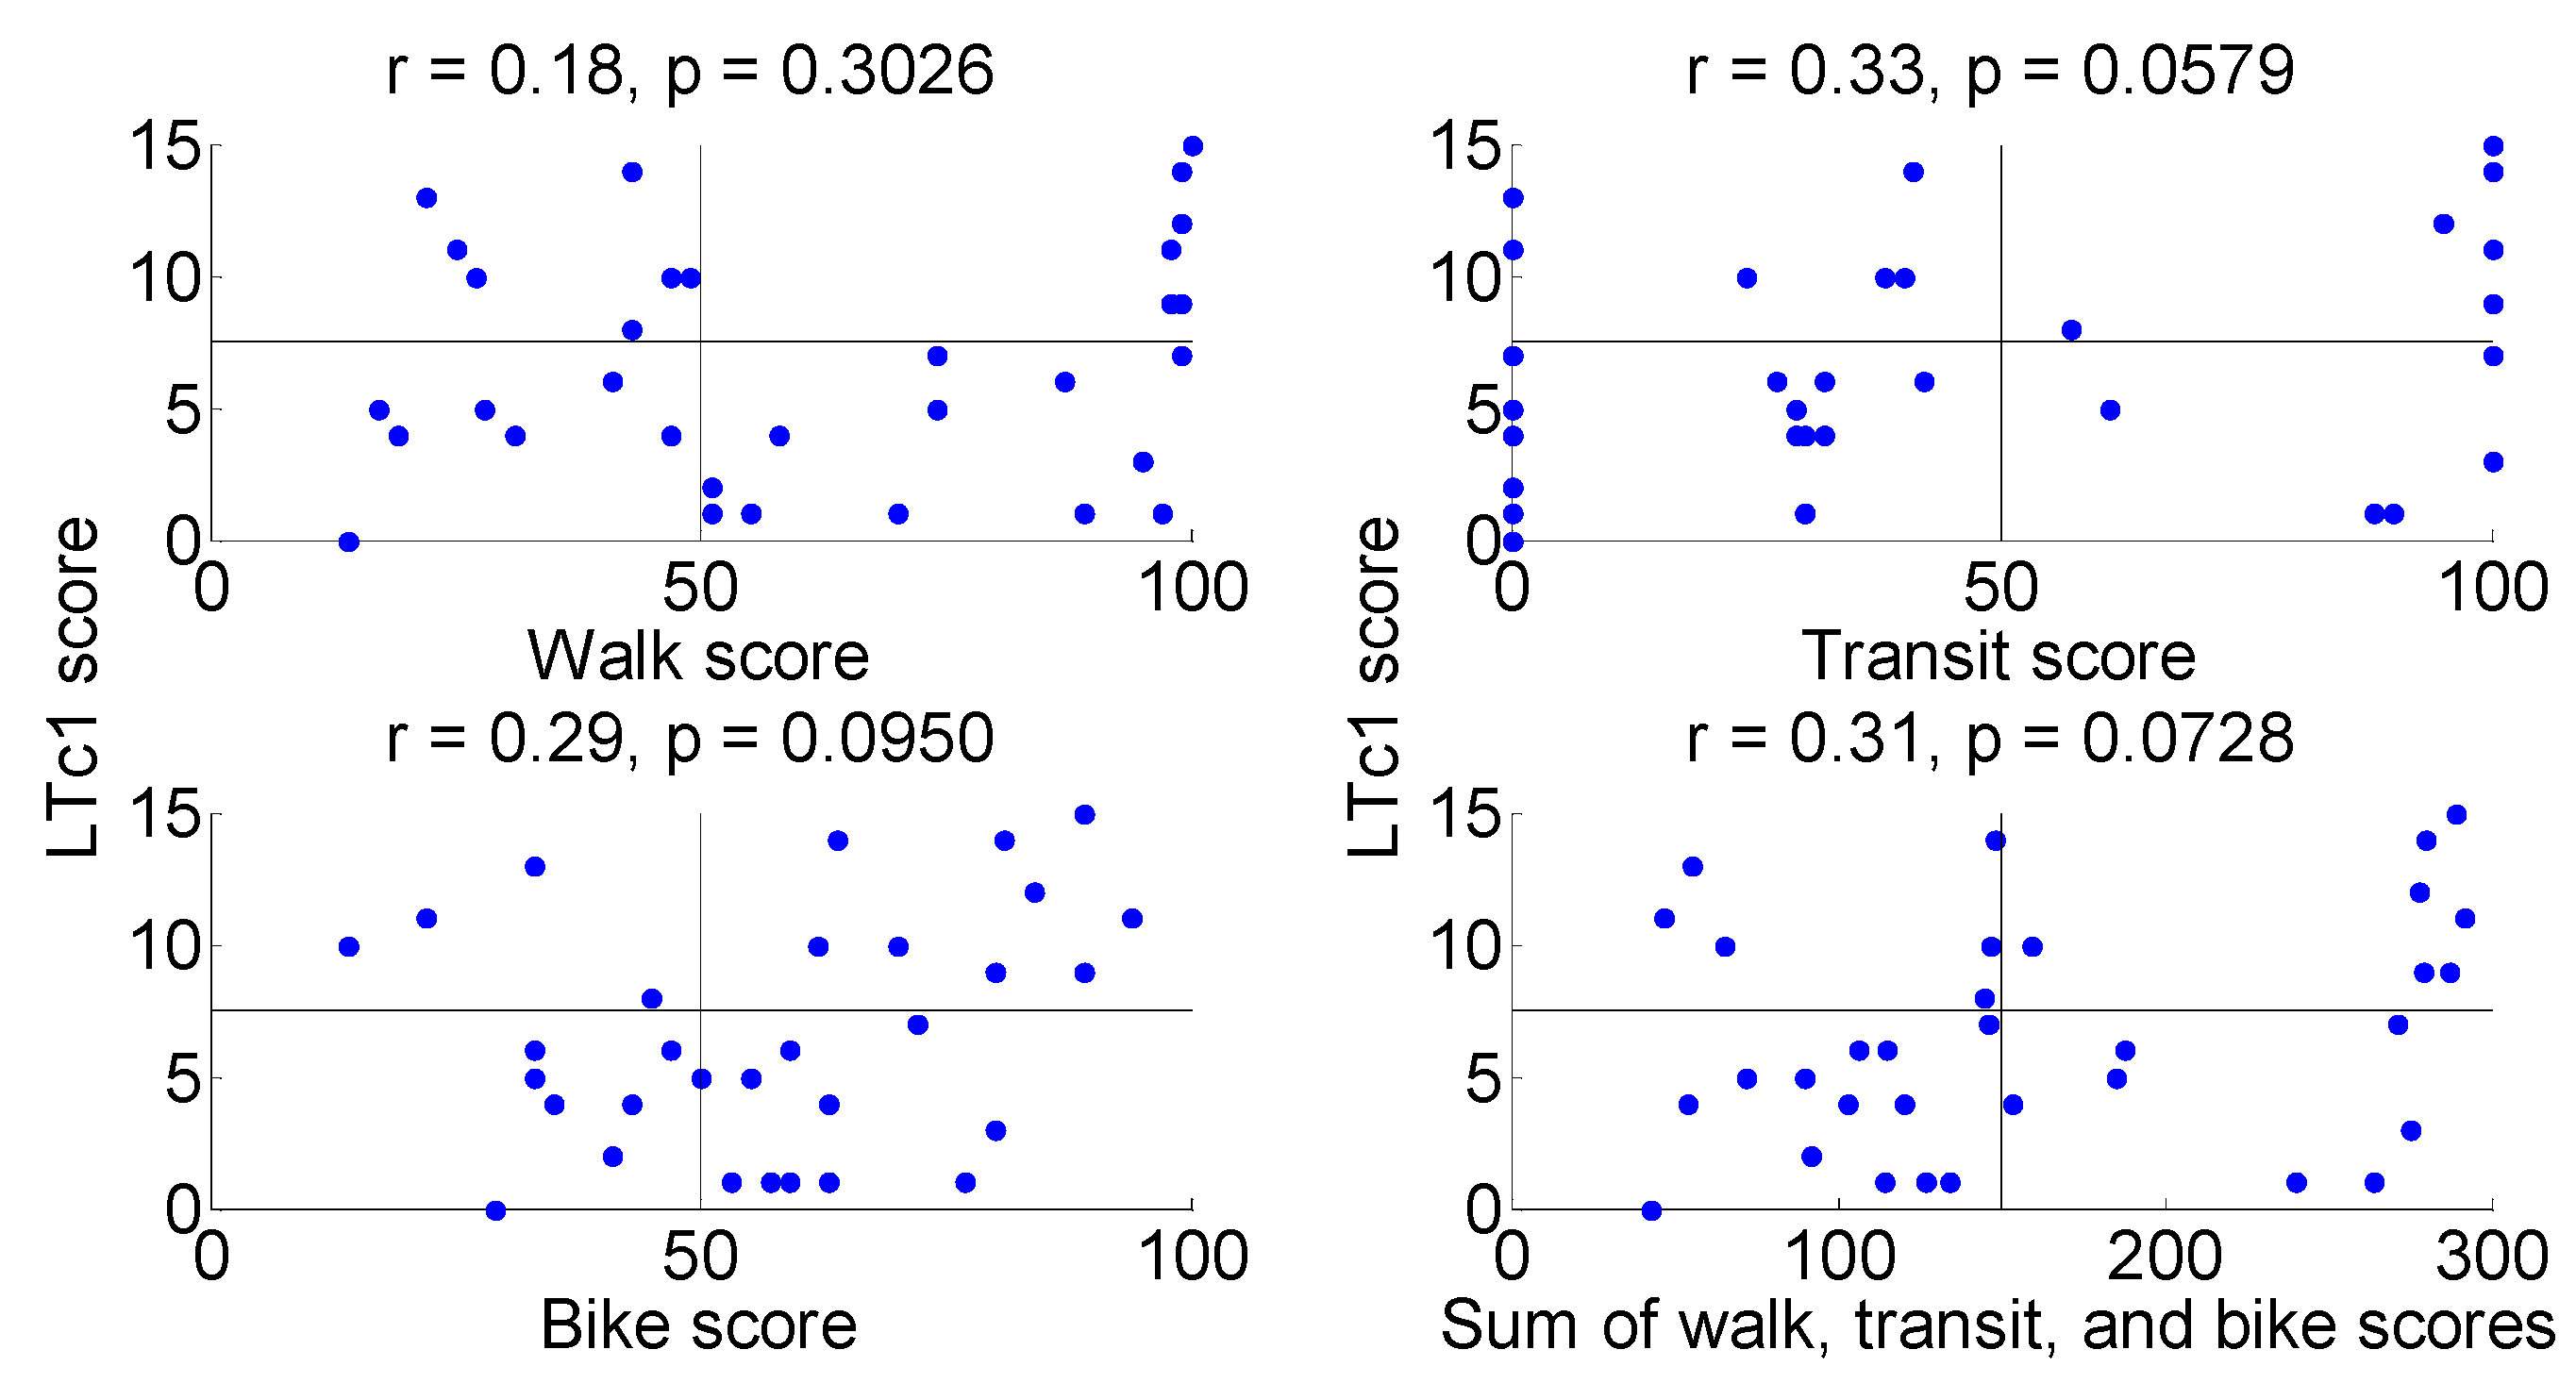

Table 1.
LEED-(ND)-(EB)-(CI) v4 possible scores by category/overall level.
| LEED category | LEED-NC | LEED-EB | LEED-CI |
| v4 | v4 | v4 | |
| Integrative process (IP) | 1 | - | 2 |
| Location and transportation (LT) | 16 | 15 | 18 |
| Sustainable sites (SS) | 10 | 10 | - |
| Water efficiency (WE) | 11 | 12 | 12 |
| Energy and atmosphere (EA) | 33 | 38 | 38 |
| Materials and resources (MR) | 13 | 8 | 13 |
| Indoor environmental quality (EQ) | 16 | 17 | 17 |
| Innovation (IN) | 6 | 6 | 6 |
| Regional priority (RP) | 4 | 4 | 4 |
| LEED total | 110 | 110 | 110 |
Table 2.
Distribution of LEED-EB v4-certified office space projects according to certification level in the United States ([18,24] accessed on 13 June 2024).
| Certification level | Platinum | Gold | Silver | Certified |
| Sample size | 24 | 112 | 46 | 34 |
Table 3.
Walk, transit, and bike scores [31].
Table 3.
Walk, transit, and bike scores [31].
| Score | Description | Variable |
| Walk | ||
| 90–100 | Walker’s Paradise | Daily errands do not require a car. |
| 70–89 | Very Walkable | Most errands can be accomplished on foot. |
| 50–69 | Somewhat Walkable | Some errands can be accomplished on foot. |
| 25–49 | Car-Dependent | Most errands require a car. |
| 0–24 | Car-Dependent | Almost all errands require a car. |
| Transit | ||
| 90–100 | Rider’s Paradise | World-class public transportation. |
| 70–89 | Excellent Transit | Transit is convenient for most trips. |
| 50–69 | Good Transit | Many nearby public transportation options. |
| 25–49 | Some Transit | A few nearby public transportation options. |
| 0–24 | Minimal Transit | It is possible to board a bus. |
| Bike | ||
| 90–100 | Biker’s Paradise | Daily errands can be accomplished on a bike. |
| 70–89 | Very Bikeable | Biking is convenient for most trips. |
| 50–69 | Bikeable | Some bike infrastructure. |
| 0–49 | Somewhat Bikeable | Minimal bike infrastructure. |
Table 4.
P-values of four Gauss–Markov assumptions (A1–A4).
| Certification level | LTc1 score vs. built environment score | A1 | A2 | A3 | A4 | |
| Platinum | LTc1 vs. | Walk score | 0.2676 | 0.7737 | 0.0071 | 0.0005 |
| Transit score | 0.9603 | 0.3430 | 0.0342 | 0.0051 | ||
| Bike score | 0.4147 | 0.2774 | 0.1208 | 0.0010 | ||
| Sum of Walk, Transit, and Bike scores | 0.1331 | 0.2388 | 0.0131 | 0.0040 | ||
| Gold | LTc1 vs. | Walk score | 0.0046 | 0.1181 | < 0.0001 | < 0.0001 |
| Transit score | 0.9991 | 0.2549 | < 0.0001 | < 0.0001 | ||
| Bike score | 0.4920 | 0.0034 | < 0.0001 | < 0.0001 | ||
| Sum of Walk, Transit, and Bike scores | 0.1389 | 0.0008 | < 0.0001 | < 0.0001 | ||
| Silver | LTc1 vs. | Walk score | 0.3781 | 0.3922 | 0.0307 | 0.0194 |
| Transit score | 0.3979 | 0.1618 | 0.0023 | 0.0196 | ||
| Bike score | 0.2239 | 0.1006 | 0.0089 | 0.0315 | ||
| Sum of Walk, Transit, and Bike scores | 0.2458 | 0.1780 | 0.0041 | 0.0301 | ||
| Certified | LTc1 vs. | Walk score | 0.1063 | 0.0013 | 0.1670 | 0.1414 |
| Transit score | 0.4277 | 0.7277 | 0.1292 | 0.5953 | ||
| Bike score | 0.9714 | 0.0362 | 0.0059 | 0.1559 | ||
| Sum of Walk, Transit, and Bike scores | 0.0344 | 0.1396 | 0.0535 | 0.3474 | ||
Note: A1, no correlation between residuals and independent variables; A2, absence of autocorrelation in residuals; A3, homoscedasticity; A4, normality in residual distribution.
Table 5.
Percentage distribution (%) of LEED-EB v4-certified office buildings across the three built environment scores and four LEED certification levels.
Table 5.
Percentage distribution (%) of LEED-EB v4-certified office buildings across the three built environment scores and four LEED certification levels.
| Variable | Score | Platinum | Gold | Silver | Certified |
| Walk | |||||
| Daily errands that do not require a car | 90–100 | 71 | 61 | 50 | 26 |
| Most errands can be accomplished on foot | 70–89 | 13 | 10 | 13 | 15 |
| Some errands can be accomplished on foot | 50–69 | 4 | 11 | 6.5 | 12 |
| Most errands require a car | 25–49 | 4 | 15 | 24 | 35 |
| Almost all errands require a car | 0–24 | 8 | 3 | 6.5 | 12 |
| Transit | |||||
| World-class public transportation | 90–100 | 50 | 44 | 30 | 26 |
| Transit is convenient for most trips | 70–89 | 12 | 8 | 9 | 3 |
| Many nearby public transportation options | 50–69 | 17 | 16 | 22 | 6 |
| A few nearby public transportation options | 25–49 | 4 | 22 | 22 | 35 |
| It is possible to board a bus | 0–24 | 17 | 10 | 17 | 30 |
| Bike | |||||
| Daily errands can be accomplished on a bike | 90–100 | 25 | 24 | 17 | 3 |
| Biking is convenient for most trips | 70–89 | 33 | 43 | 46 | 29 |
| Some bike infrastructure | 50–69 | 29 | 25 | 15 | 29 |
| Minimal bike infrastructure | 0–49 | 13 | 8 | 22 | 39 |
Table 6.
A pairwise comparison of walk, transit, bike, and LTc1 scores in LEED-EB v4-certified office projects.
Table 6.
A pairwise comparison of walk, transit, bike, and LTc1 scores in LEED-EB v4-certified office projects.
| Walk score | ||||
| Certification | Platinum | Gold | Silver | Certified |
| Median | 97.0 | 96.0 | 90.0 | 51.0 |
| IQR/M | 0.18 | 0.40 | 0.67 | 1.25 |
| Cliff’s δ (p-value) | ||||
| Platinum | X | 0.10 (0.4252) | 0.28 (0.0577) | 0.49 (0.0016) |
| Gold | X | 0.16 (0.1107) | 0.37 (0.0009) | |
| Silver | X | 0.23 (0.0768) | ||
| Certified | X | |||
| Transit score | ||||
| Certification | Platinum | Gold | Silver | Certified |
| Median | 90.0 | 74.0 | 62.0 | 32.0 |
| IQR/M | 0.41 | 0.74 | 1.02 | 2.81 |
| Cliff’s δ (p-value) | ||||
| Platinum | X | 0.13 (0.3234) | 0.26 (0.0732) | 0.40 (0.0092) |
| Gold | X | 0.18 (0.0706) | 0.39 (0.0005) | |
| Silver | X | 0.24 (0.0631) | ||
| Certified | X | |||
| Bike score | ||||
| Certification | Platinum | Gold | Silver | Certified |
| Median | 82.0 | 81.0 | 77.0 | 58.0 |
| IQR/M | 0.32 | 0.32 | 0.47 | 0.53 |
| Cliff’s δ (p-value) | ||||
| Platinum | X | -0.03 (0.8483) | 0.14 (0.3436) | 0.46 (0.0034) |
| Gold | X | 0.18 (0.0701) | 0.52 (< 0.0001) | |
| Silver | X | 0.34 (0.0099) | ||
| Certified | X | |||
| LTc1, Alternative Transportation score | ||||
| Certification | Platinum | Gold | Silver | Certified |
| Median | 15.0 | 14.0 | 11.0 | 6.0 |
| IQR/M | 0.03 | 0.36 | 0.55 | 1.00 |
| Cliff’s δ (p-value) | ||||
| Platinum | X | 0.29 (0.0178) | 0.49 (0.0005) | 0.86 (< 0.0001) |
| Gold | X | 0.24 (0.0161) | 0.71 (< 0.0001) | |
| Silver | X | 0.54 (0.0001) | ||
| Certified | X | |||
Table 7.
Difference in mean EA scores when comparing adjacent certification levels in LEED-NC-certified projects worldwide.
Table 7.
Difference in mean EA scores when comparing adjacent certification levels in LEED-NC-certified projects worldwide.
| LEED version (v) | Certified–Silver | Silver–Gold | Gold–Platinum |
| LEED-NC v2.2 [53] | 1.53 | 2.72 | 5.78 |
| LEED-NC v3 [54] | 3.51 | 5.46 | 11.59 |
Table 8.
Difference in median EA scores comparing Silver and Gold levels for LEED-NC-certified projects in two US states from 2012 to 2017.
Table 8.
Difference in median EA scores comparing Silver and Gold levels for LEED-NC-certified projects in two US states from 2012 to 2017.
| State | 2012 | 2013 | 2014 | 2015 | 2016 | 2017 |
| California | 10.00 | 8.00 | 10.50 | 10.00 | 10.00 | 8.50 |
| Texas | 3.00 | 7.50 | 3.00 | 4.00 | 1.00 | 4.00 |
Disclaimer/Publisher’s Note: The statements, opinions and data contained in all publications are solely those of the individual author(s) and contributor(s) and not of MDPI and/or the editor(s). MDPI and/or the editor(s) disclaim responsibility for any injury to people or property resulting from any ideas, methods, instructions or products referred to in the content |
© 2024 by the authors. Licensee MDPI, Basel, Switzerland. This article is an open access article distributed under the terms and conditions of the Creative Commons Attribution (CC BY) license (http://creativecommons.org/licenses/by/4.0/).
Copyright: This open access article is published under a Creative Commons CC BY 4.0 license, which permit the free download, distribution, and reuse, provided that the author and preprint are cited in any reuse.


