
Submitted:
30 October 2025
Posted:
30 October 2025
You are already at the latest version
Abstract
The purpose of this study was to evaluate LEED for Existing Buildings version 4.1 (LEED-EB v4.1) gold-certified office projects in San Francisco, New York City, and Washington, D.C., using the exact Wilcoxon–Mann–Whitney, Cliff’s δ, and Spearman’s correlation tests. This study finds that San Francisco outperforms New York City in “indoor environmental quality” (IEQ) for office projects (p = 0.009). San Francisco also outperforms New York City and Washington, D.C., in overall LEED score (p = 0.001 in both cases). “Energy”, “transportation”, and “IEQ” were correlated with the overall LEED score in San Francisco (r = 0.80 and p = 0.003; r = 0.69 and p = 0.018; and r = 0.61 and p = 0.049, respectively); “energy” and “waster” were correlated with the overall LEED score in Washington, D.C. (r = 0.62 and p = 0.014, r = 0.71 and p = 0.003, respectively); and “energy” was correlated with the overall LEED score in New York City (r = 0.61 and p = 0.001). This study concludes that higher environmental sustainability in LEED-certified buildings can be achieved if a broader range of LEED-EB v4.1 key performance indicators show a positive and strong correlation with the overall LEED score.
Keywords:
LEED-EB v4.1
; San Francisco
; New York City
; Washington
; D.C
1. Introduction
1.1. Energy Consumption and Share of Fossil Fuels in the US Building Sector
According to the U.S. Energy Information Administration, total energy consumption in the building sector (the sum of residential and commercial) fell from 40.2% to 36.9% of the total U.S. energy consumption between 2010 and 2024 [1]. Additionally, the share of fossil fuels (the sum of natural gas, petroleum, and coal) fell from 92.8% to 91.4% of total energy consumption in the US building sector between 2010 and 2024 [2].
Although the building sector’s share of total US energy consumption and the share of fossil fuels in the US building sector’s total energy consumption declined between 2010 and 2024, the share of fossil fuels remains significant. The use of fossil fuels to meet energy needs can lead to the depletion of natural resources and climate change, resulting in the deterioration of people’s quality of life [3,4]. In this context, the Leadership in Energy and Environmental Design (LEED) green building rating system, developed and actively used in the USA, is a valuable tool for reducing the use of fossil fuels [5,6].
1.2. Development of LEED Systems
The LEED program is constantly evolving through the introduction of new systems and/or new versions. [7]. Below are two examples describing both a new application of an “old” system and the replacement of the “old” version with a “new” one.
LEED for Existing Buildings (LEED-EB) was originally designed as a program for following up on LEED for New Construction and Major Renovation (LEED-NC)-certified buildings. However, LEED-EB has evolved into a standalone certification system for existing buildings, aimed at improving the environmental sustainability of buildings without major renovations [8].
Before explaining the differences between the two versions (v4 and v4.1 for the LEED-EB system), it is worth noting that both versions include five key indicators: “transportation” (from the location and transportation (LT) category), “energy” (from the energy and atmosphere (EA) category, “water” (from the water efficiency (WE) category), “materials and resources” or “waste” (from the materials and resources (MRs) category), and “indoor environmental quality” (IEQ) (from the indoor environmental quality (EQ) category). Recently, the author of this study presented a detailed description of two versions (v4 and v4.1) of the LEED-EB system in two studies [9,10]. LEED-EB v4.1 contains the following performance indicators: “transportation” – 14 pts, “water” -15, “energy” – 33 pts, “waste” - 8 pts, and IEQ – 20 pts. Additionally, LEED-EB v4.1 contains 10 binary LEED credits, with each credit worth a maximum of 1 point. LEED-EB v4.1 has four certification levels: certified (40-49 points), silver (50-59 points), gold (60-79 points), and platinum (80-100 points) [10].
1.3. LEED-EB v4 vs. v4.1
Yezioro and Capeluto applied a “prescriptive–descriptive” and “performance” approach for the Israeli Energy Standard (IS5282) [11]. It is important to note that LEED-EB v4 (the “old” version) primarily uses a “prescriptive–descriptive” approach (i.e., recording scores through measurement of pre-set requirements related to performance), while LEED-EB v4.1 (the “new” version) primarily uses a “performance” approach (i.e., recording scores through direct measurement of performance). In LEED-EB v4, three indicators, transport, materials and resources, and indoor environmental quality, use a “prescriptive–descriptive” approach, while two indicators, water and energy, use a “performance” approach. In LEED-EB v4.1, four indicators (transportation, water, energy, and waste) use a “performance” approach, while one indicator (indoor environmental quality) uses a “performance” approach to determine 50% of the points and a “prescriptive–descriptive” approach to determine the remaining 50% of the points [12].
2. Literature Review
2.1. A Comparative Analysis of LEED-Certified Projects in the United States
2.1.1. At the Country Level
Several studies (2009–2019) by Cidell and Beata [13], Wu et al. [14], Wu et al. [15], and Pushkar and Verbitsky [16] used descriptive and inferential statistics to estimate the difference between LEED-certified strategies for LEED v2.2-, v3-, and v4-certified projects in the United States. They found that the LEED certification strategies depended on both internal properties (e.g., certification level and building type) and external properties (e.g., climate, location, and U.S. state-level green policies). In 2025, Ahmad et al. [17] used descriptive and inferential statistics to estimate the difference in LEED-NC v4-certified projects across nine U.S. climate regions (i.e., nine independent groups). Thus, the analysis of each new version (e.g., v4) using standard statistical methods (e.g., nonparametric significance and effect size tests) is a relevant scientific approach [17].
2.1.2. At the Level of Two Countries
Da Silva and Ruwanpura [18] used descriptive statistics to compare LEED-certified projects between the US and Canada. Wu et al. [19], Pushkar [20], and Chi et al. [21] used descriptive and inferential statistics to compare LEED-certified projects between the US and China. They found that differences between countries are driven by, for example, differences in climate, regional priorities, infrastructure, and the experience of LEED professionals. In this context, two countries are represented as two independent groups.
2.1.3. At the Building Type Level
Rokde et al. [22] studied LEED-NC 2009 v3-certified fire station projects in the United States and showed that they scored poorly in both the MR and EA categories. They also found that 95 LEED-certified fire stations were evenly distributed across the United States, with no significant regional trends. Goodarzi et al. [23] studied LEED NC v2009-certified hotel projects with normalized guest satisfaction scores in the United States. They found that the EA and IEQ categories were the most influential LEED categories in predicting satisfaction at the certified and silver certification levels, but not at the gold and platinum levels. Goodarzi and Berghorn [24] surveyed residents of LEED-certified communities and showed that green building characteristics were more significant factors in satisfaction than neighborhood design characteristics. Lee [25] examined five art museums in the United States certified under both LEED and the Sustainable Development Goals (SDGs) and showed that LEED and SDGs act as complementary frameworks to promote the environmental, social, and economic sustainability of museums.
2.1.4. At the US State and City Levels
Pushkar [26] studied LEED-CI v4 gold-certified office projects in California and showed that cities with accessible public transportation (e.g., San Francisco) had high scores in the LT category and low scores in the EA category and vice versa for cities with non-accessible public transportation (e.g., Sunnyvale). Pushkar [27] studied LEED-CI v4 gold-certified office projects in New York City and found consistently good scores for the LT category, while the EA category had both low and high scores. A critical analysis of the above studies showed that a comparison of LEED-certified projects at the city level is lacking.
2.1.5. Summary of the Key Studies Analyzed
Table 1 contains four approaches that reveal the different LEED certification strategies in the United States. Climate zones can be used as a factor influencing the choice of LEED certification strategy. However, this approach does not consider the influence of green building policies on the choice of LEED certification strategy at both the state and city levels in the United States. LEED certification level can be used as a factor when choosing an environmentally and economically sustainable model for hotels. However, this approach does not consider the city in which LEED-certified hotels are located from a green building policy perspective. Transport accessibility (low or high) can significantly influence the choice of LEED certification strategy. Finally, the energy efficiency of a building (low or high) can be a key determinant of its green building performance, even within a single city [28]. Thus, the LEED certification strategy of comparing cities across the US has not yet been studied.
2.2. A Correlation Analysis of LEED-Certified Projects in the United States
This subsection analyzes six studies that assessed the linear correlation between LEED category scores and overall LEED scores in the United States. Some studies used the correlation coefficient (r) to assess correlation, while others used the coefficient of determination (R2). In this context, R2 was transformed into r to maintain consistency with the format used in the present study.
2.2.1. At the Country Level
Ahmad et al. [17, p.14] analyzed 1252 LEED-NC v4-certified projects and found that the EA score has a strong positive correlation with the overall LEED score (r = 0.61). The regional priority (RP) score moderately positively correlated with the overall LEED score (r = 0.40), while the MRs, IEQ, SS, LT, and WE scores weakly positively correlated with the overall LEED score (r = 0.39, 0.37, 0.36, 0.35, and 0.30, respectively). This correlation value reflects a general trend in the United States, while climate regions or city-level LEED certification strategies remain unexplored. Ahmad et al. [17, p.13] noted “that in certain [climate] regions, building practices may foster stronger connections [i.e., moderate correlation] between specific categories”. Combining the four LEED certification levels (i.e., four independent groups) into one group also obscures the LEED certification strategies used for each LEED certification level.
2.2.2. At the Building Type Level
Goodarzi et al. [29] analyzed 87 LEED-NC v3 2009-certified university residence hall projects. They found a very strong positive correlation between the EA score and the overall LEED score (r = 0.80). The SS score moderately positively correlated with the overall LEED score (r = 0.45), while the MRs, IEQ, and WE category scores weakly positively correlated with the overall LEED score (r = 0.35, 0.28, and 0.28, respectively).
Goodarzi [30] examined 802 LEED-NC v3 209-certified multifamily residential projects. They discovered the following relationships: a strong positive correlation between the EA category scores and the overall LEED score (r = 0.68) and a moderate positive correlation between the SS score and the overall LEED score (r = 0.40). The EQ, WE, and MRs scores weakly positively correlated with the overall LEED score (r = 0.26, 0.25, and 0.23, respectively).
Goodarzi et al. [31] examined the correlation between RP credits and overall LEED points in 878 LEED-NC 2009 v3-certified multifamily residential projects. They showed a weak positive correlation between the RP score and overall LEED score (r = 0.38).
Goodarzi and Garshasby [32] examined 75 LEED-NC v4-certified multifamily residential projects. They found that the EA, EQ, and LT scores moderately positively correlated with the overall LEED score (r = 0.52, 0.43, and 0.43, respectively), while the SS, WE, and MRs scores positively weakly correlated with the overall LEED score (r = 0.28, 0.23, and 0.20, respectively).
Parekh [33] examined 120 LEED-HC v4.1-certified healthcare projects and found a strong positive correlation between the EA score and the overall LEED score (r = 0.60). The WE and SS scores moderately positively correlated with the overall LEED score (r = 0.58 and 0.46, respectively). The IEQ and MRs scores weakly positively correlated with the overall LEED score (r = 0.39 and 0.33, respectively). It clearly indicated that LEED-certified projects at different certification levels were pooled into one group. Thus, the r values presented do not reflect the strength of the association between individual and overall LEED scores in each of the four certification groups. This study design does not allow for an examination of LEED certification strategy at the city level.
2.2.3. Summary of the Key Studies Analyzed
Table 2 shows that the correlation between the EA score and the overall LEED score varies widely from r = 0.52 for LEED-NC v4-certified multifamily residential projects to r = 0.80 for LEED-NC v3-certified university residence hall projects. Table 1 also shows that the correlation between the WE score and the overall LEED score varies widely from r = 0.23 for LEED-HC v4-certified multifamily residential projects [32] to r = 0.58 for LEED-HC v4.1-certified healthcare projects [33].
It should be noted that LEED-NC v4-certified projects across all building types demonstrate approximately average correlation coefficients when assessing the correlation between individual LEED category scores and the overall LEED score. Thus, no studies have examined city-level LEED-certified projects in the United States to identify the LEED certification strategies used in specific cities.
2.3. LEED-Certified Projects and Urban–Rural Classification
According to Ingram and Franco [34], the National Center for Health Statistics’ (NCHS) six-level urban–rural classification, presented in Table 3, is commonly used to study the relationship between a place of residence’s level of urbanization and residents’ health status, and to monitor the health status of urban and rural residents.
Smith [35], who first analyzed the distribution of LEED-certified projects the National Center for Health Statistics (NCHS) urban–rural classification in the United States and found that these LEED-certified projects were distributed as follows: 57.1% in “Large central metro”, 16.1% in “Large fringe metro”, 15.6% in “Medium metro”, 7.6% in “Small metro”, 1.8% in “Micropolitan”, and 1.8% in “Noncore”. Recently, Pushkar [36] studied LEED-EB v4-certified office projects in the United States and showed that these projects are predominantly located in “Large central metro” counties compared to “Large fringe metro” counties: 75.0—22.8% at the platinum level, 89.3—8.9% at the gold level, 78.3—17.3% at the silver level, and 79.4—17.7% at the certified level. In rare cases, LEED-EB v4-certified office projects are found in “Medium metro”, “Small metro”, “Micropolitan”, and “Noncore” cities. However, when evaluating LEED-certified projects, the urban–rural classification should be considered.
2.4. Research Gap
The 2025 studies by Ahmad et al. [17] and Pushkar [10] are the closest analogs of the current study. Ahmad et al. [17] used both comparative analysis (i.e., comparison across nine climate zones) and correlation analysis (i.e., correlation analysis within each of the nine climate zones) to study LEED-NC v4-certified projects in the United States. Pushkar [10] used comparative analysis (i.e., comparison across six countries) to study LEED-EB v4.1 gold-certified projects in the European and Mediterranean regions. However, a comparative analysis between US cities and a correlation analysis between individual indicators and overall LEED performance in each US city for LEED-EB v4.1-certified projects have not yet been conducted.
2.5. Purpose and Objectives of this Study
The purpose of this study is to reduce the environmental impact of the building sector in the United States. The first objective of this study is to conduct a pairwise comparison of LEED-EB v4.1-certified projects located in three US cities: San Francisco, New York City, and Washington, DC. The second objective of this study is to conduct a correlation analysis between individual LEED performance indicators and the overall LEED performance indicator for LEED-EB v4.1-certified projects within San Francisco, New York City, and Washington, DC.
2.6. Novelty and Contribution
The novel contribution of this study is the identification and description of new LEED certification strategies for LEED-EB v4.1-certified projects at the city level in the United States, showing that the application of new knowledge by LEED professionals can significantly assist in choosing the optimal LEED certification strategy at the city level.
3. Materials and Methods
3.1. Flow Chart of the Study Design
Figure 1 presents a step-by-step flow chart of the study design. The study design includes data collection, data selection, and data analysis.
The data collected include 316 LEED-EB v4-certified office projects in the United States. Data selection involved three stages. In the first stage, 201 LEED-certified projects with dominant certification levels (“silver” and “gold”) and a dominant location in the metropolitan county (“large central metro”) were selected. In the second stage, 54 LEED silver-certified and 147 LEED gold-certified projects were divided into two groups. In the third phase, LEED silver-certified projects were primarily distributed in four cities (4 projects each in Atlanta and San Diego, 5 projects in New York City, and 6 projects in Washington, DC), while LEED gold-certified projects were primarily distributed in three cities (11 projects in San Francisco, 26 projects in New York City, and 15 projects in Washington, DC). Thus, office projects in San Francisco, New York City, and Washington, D.C., that are LEED v4.1 gold-certified were statistically analyzed using significance tests. The study design and data collection, selection, and analysis are presented in more detail in Sections 3.2–3.5, respectively.
3.2. Study Design
Conducting a pairwise comparison between different cities or a correlation analysis within a single US city in terms of LEED-certified projects required the following design criteria: the cities must be in the same country (i.e., the US) and “metropolitan county” (i.e., a “large central metro”) and have the same LEED system (i.e., LEED-EB), LEED version (i.e., v4.1), and certification level (i.e., gold or silver). In this context, to obtain reliable statistical inferences, the minimum sample size required was n1 = n2 > 10, where n1 + n2 > 23 for pairwise comparison [37] and n > 14 for correlation analysis [38].
3.3. Data Collection
Table 4 shows that 316 LEED-EB v4.1-certified office projects were collected in the United States [39,40]. LEED data were divided into four certification levels and six urban and rural classification types. LEED data showed that projects were generally gold-certified and located in medium, large fringe, and large central metropolitan counties.
3.4. Data Selection
Table 5 focused on the most popular cities in terms of LEED-EB v4.1 silver- and gold-certified office projects. At the silver level, all five cities have sample sizes in the range of 2 to 6, which is significantly smaller than the sample size that can be used to draw reliable statistical conclusions. At the gold level, three cities, namely San Francisco, New York City, and Washington, DC, have sample sizes of 11, 26, and 15, respectively, which are within the sample size range that can be used to draw reliable statistical inferences for pairwise comparison. However, in San Francisco, the sample size is below the minimum required to draw reliable statistical conclusions when conducting correlational analysis. Therefore, the results of the correlation analysis for San Francisco should be treated with caution. Two complete lists of cities with at least one LEED-EB v4.1 silver- or gold-certified projects in one of the metropolitan counties (i.e., medium metro, large fringe metro, and large central metro) are presented in Appendix A, Table A1 and Table A2.
3.5. Data Analysis
In the current study, a comparative analysis of independent groups and a correlation analysis of two variables were conducted. MATLAB 2024a was used to analyze descriptive and inferential statistics [41].
3.5.1. Comparative Analysis of Independent Groups
Recently [10,17], it was shown that the normality assumption does not hold for LEED data. In this context, nonparametric statistics, including the median, 25th–75th percentiles, and interquartile range-to-median ratio (IQR/M), were used to analyze LEED data in terms of descriptive statistics. The exact Wilcoxon–Mann–Whitney [42] and Cliff’s δ effect size [43] tests were used to compare two independent groups with LEED data in terms of the p-value (i.e., statistical significance) and effect size magnitude (i.e., substantive significance), respectively.
3.5.2. Correlation Analysis of Two Variables
To determine which type of correlation (e.g., parametric Pearson’s correlation or nonparametric Spearman’s correlation) to use to detect the relationship between two variables containing interval data, the five Gauss–Markov assumptions (i.e., linearity in form, no correlation between residuals and independent variables, absence of autocorrelation in residuals, homoscedasticity, and normality in residual distribution) must be tested [44]. Linearity in form was determined by superimposing a locally weighted scatterplot smoothing (LOESS) curve on the residuals versus fitted values plot. If the LOESS curve is approximately clustered around the zero horizontal line, then the relationship between the two variables is linear [45]. The results showed that the assumption of linearity in form was met in all cases (Appendix, Figure A1, Figure A2 and Figure A3).
The next step was to test the remaining four Gauss–Markov assumptions. If these four assumptions are met, then the Pearson test can be applied; if at least one of them is not met, then the Spearman test can be applied. If judgment regarding any assumption is suspended, it is interpreted as not met (Appendix A, Table A3).
3.5.3. Effect Size Interpretation
Table 6 shows the bounds for the effect sizes of Cliff’s δ. Cliff’s d ranges between -1 and +1.
Cohen [47] defined effect size (i.e., practical significance) as follows: a medium effect is visible to the naked eye of an attentive observer, while a small effect is noticeably smaller than the medium effect but not negligible, and a large effect is the same distance above the medium as a small effect is below it. Some authors noted that effect size is not a strict criterion, especially in conditions of limited knowledge [48,49]. In particular, the interpretation of effect sizes in the field of LEED-certified projects requires further research.
3.5.4. Spearman’s Correlation Coefficient Interpretation
Spearman’s correlation coefficient measures the strength and direction of monotonic association between two ranked variables [50]. A coefficient ranges from +1 to -1, where +1 indicates a perfect positive relationship, -1 indicates a perfect negative relationship, and 0 indicates no relationship. Table 7 shows the absolute strength of a relationship between two variables and its interpretation using five levels of strength.
3.5.5. Median and IQR/M Interpretation
The median value of LEED-EB v4.1 performance indicators can be represented as low, medium, and high, corresponding to the maximum possible points. IQR/M ≤ 0.30 and IQR/M > 0.30 indicate low and high heterogeneity/homogeneity, respectively.
3.5.6. p-Value Interpretation
The generally accepted interpretation of the p-value includes a dichotomous decision: a significant difference when p > 0.05, or an insignificant difference when p ≤ 0.05, assuming a significance level of α = 0.05 [52]. However, Fisher suggested that the fixed significance level may instead be viewed on an individual basis, dependent on specific evidence and ideas [53]. Perhaps the precise p-value will allow other researchers to decide for themselves how important the results are [54]. It was noted that the interpretation of the p-value should not be based on Occam’s razor [55]. It was noted that for p-values such as 0.055 or 0.045, the solution should be more similar than different [56]. In this context, it has been recommended to use three-valued logic to interpret the two-sided p-value [57,58] in combination with the effect size [59].
For comparative analysis, “it appears to be positive” indicates that there appears to be a difference between two cities, “it appears to be negative” indicates that there does not seem to be a difference between two cities, and “judgment is suspended” signifies that the conclusion on the difference between two cities is suspended. For correlation analysis, “it appears to be positive” indicates that there appears to be a correlation between individual LEED indicators and overall LEED indicators, “it appears to be negative” suggests that there does not appear to be a correlation, and “judgment is suspended” signifies that the conclusion is suspended.
4. Results
4.1. Comparative Analysis of LEED Project Size in LEED-Certified Projects
Table 8 shows that LEED-certified project size has high IQR/M values (1.08, 0.99, and 0.55) in San Francisco, New York City, and Washington, D.C., respectively. New York City and Washington, D.C., outperform San Francisco in project size (the difference appears to be positive; p <0.001 in both comparisons with a large effect size, δ = 0.80 and 0.76, respectively). New York City slightly outperforms Washington, D.C., in project size (the difference appears to be negative; p = 0.133 with a small effect size, δ = 0.29).
4.2. Comparative Analysis of LEED Performance Indicators in LEED-Certified Projects
4.2.1. Transportation
Table 9 shows that “transportation” had high achievement levels (13.0, 12.0, and 12.0) and low IQR/M values (0.13, 0.08, and 0.17) in San Francisco, New York City, and Washington, D.C, respectively. When comparing San Francisco, New York, and Washington, D.C., in terms of “transportation”, the difference appears to be negative with a medium effect size.
4.2.2. Water
Table 10 shows that “water” had moderate achievement levels (9.0, 8.0, and 8.0) and high IQR/M values in San Francisco (0.50) and low IQR/M values in New York City and Washington, D.C. (0.25 and 0.22, respectively). San Francisco slightly outperforms New York City and Washington, D.C., in terms of “water” (the difference appears to be negative; p = 0.153 and 0.243, with small effect sizes, δ = 0.30 and 0.27, respectively). The difference between New York City and Washington, D.C., in terms of “water” appears to be negative (p = 0.918 with a negligible size effect, δ = 0.02).
4.2.3. Energy
Table 11 shows that “energy” had transition points between high-to-moderate achievement levels (23.0, 20.0, and 19.0) and low IQR/M values in New York City and Washington, D.C. (0.24, 0.25, and 0.26, respectively). San Francisco slightly outperforms New York City and Washington, D.C., in terms of “energy” (the difference appears to be negative; p = 0.280 and 0.403 with a small effect size, δ = 0.23 and 0.20, respectively). The difference between New York City and Washington, D.C., in terms of “energy” appears to be negative (p = 0.877 with a negligible effect size, δ = 0.03).
4.2.4. Waste
Table 12 shows that “waste” had moderate achievement levels (5.0, 5.0, and 6.0) and high IQR/M values (0.50, 0.40, and 0.33) in San Francisco, New York City, and Washington, D.C., respectively. Washington, D.C., slightly outperforms New York City in terms of “waste” (the difference appears to be negative; p = 0.188 with a small effect size, δ = 0.25). The difference between Washington, D.C., and San Francisco, and between San Francisco and New York City, in terms of “waste” appears to be negative (p = 0.594 with a negligible effect size, δ = 0.13 and p = 0.750 with a negligible effect size, δ = 0.07, respectively).
4.2.5. Indoor Environmental Quality (IEQ)
Table 13 shows that “IEQ” had high achievement levels (18.0, 16.0, and 16.0) and low IQR/M values (0.10, 0.19, and 0.11) in San Francisco, New York City, and Washington, D.C., respectively. San Francisco significantly outperforms New York City in terms of “IEQ” (the difference appears to be positive; p = 0.009, with a large effect size, δ = 0.53). San Francisco lightly outperforms Washington, D.C., in terms of “IEQ” (the difference appears to be negative; p = 0.090, with a medium effect size, δ = 0.38). Washington, D.C., lightly outperforms New York City, in terms of “IEQ” (the difference appears to be negative; p = 0.283, with a small effect size, δ = 0.20).
4.2.6. Overall LEED
Table 14 shows that “overall LEED” significantly exceed the minimum (60.0) required to achieve gold certification in San Francisco (69.0) and slightly exceed minimum in New York City (62.0) and Washington, D.C. (62.0), and IQR/M showed low values (0.13, 0.11, and 0.15) in San Francisco, New York, and Washington, DC, respectively. San Francisco significantly outperforms New York City and Washington, D.C., in terms of “overall LEED” (p = 0.001 with a large effect size, δ = 0.66 and p = 0.001 with a large effect size, δ = 0.59, respectively). The difference between Washington, D.C., and New York City in terms of “overall LEED” appears to be negative (p = 0.491 with a negligible effect size, δ = 0.13).
4.3. Analysis of the Correlation Between Overall LEED Performance and Individual LEED Performance in LEED-Certified Projects
4.3.1. San Francisco
Table 15 shows that “energy”, “transportation”, and “IEQ” showed very strong or strong positive correlations with “overall LEED” (“it appears to be positive”: r = 0.81 and p = 0. 003, r = 0.69 and p = 0.018, and r = 0.61 and p = 0.049, respectively). “Water” showed a weak negative correlation with “overall LEED” (“it appears to be negative”: r = -0.35 and p = 0.294), and “waste” showed a weak positive correlation with “overall LEED” (“it appears to be negative”: r = 0.20 and p = 0.555).
4.3.2. New York City
Table 16 shows that the correlation between “energy” and “overall LEED” has a strong positive correlation (“it appears to be positive”: r = 0.61 and p = 0.001). Judgment is suspended due to the moderate positive correlation between “waste” and “overall LEED” (r = 0.40 and p = 0.044, respectively). “Transportation,” “water,” and “IEQ” showed weak correlations with “overall LEED” (“it appears to be negative”: r = 0.34 and p = 0.093; r = 0.32 and p = 0.116; and r = 0.24 and p = 0.245, respectively).
4.3.3. Washington, D.C.
Table 17 shows that “energy” and “waste” showed very strong or strong positive correlations with “overall LEED” (“it appears to be positive”: r = 0.83 and p = <0.001 and r = 0.65 and p = 0.009, respectively). “Transportation”, “water”, and “IEQ” showed weak or very weak positive correlations with “overall LEED” (“it appears to be negative”: r = 0.30 and p = 0.275; r = 0.07 and p = 0.816; and r = 0.07 and p = 0.801, respectively).
5. Discussion
Table 18 shows the three-valued logic (i.e., “it appears to be positive,” “judgment suspended,” and “it appears to be negative”) based on the exact p-value and effect size for LEED project size, five individual LEED-EB v4.1 indicators, and “overall LEED” of LEED-EB v4.1 gold-certified projects certified in San Francisco, New York, and Washington, D.C. The data in Table 18 are based on the summarized results of Table 8, Table 9, Table 10, Table 11, Table 12, Table 13 and Table 14.
It should be noticed that project size in San Francisco differed from project size in New York City and Washington, D.C. Despite this difference between project size, there was no difference between three cites (“it seems to be negative”) in five individual LEED-EB v4.1 indicators: “transportation”, “water”, “energy”, “waste”, and “IEQ”. The only exception was in the “IEQ” indicator, in which San Francisco outperformed New York City. As a result, San Francisco surpassed New York and Washington in terms of overall LEED score.
According to LEED-EB v4.1 [12], four of five indicators are completely based on measurements of their performance flows. “Transportation” indicator measures occupant-related traveled distances. Depending on the transportation mode (convenient car or public transportation), these traveling kilometers are then converted into CO2 emissions. The “water” indicator measures potable water consumption for a year per resident and per unit area. The “energy” indicator measures occupants’ energy consumption during a year. Then, depending on the energy source (non-renewable or renewable), this consumption is converted into greenhouse gas (GHG) emissions. The “waste” indicator measures waste quantities (the total waste generated, including recycled and nonrecycled) of plastic, glass, and paper during a year.
The fifth indicator, “IEQ”, measures CO2 emissions and total volatile organic compounds (TVOC) over a year. However, in addition, this indicator also requires conducting an occupant satisfaction survey. The measured CO2 and TVOC, and the results of the occupant survey, are then converted into LEED points [12]. Thus, given residents’ subjective assessment of indoor air quality, the IEQ indicator showing that San Francisco outperformed New York City should be interpreted with caution.
The similar results across all five individual indicators were expected, since the same type of project (office), all located in large central metro areas, according to urban–rural classification, was chosen for comparison across all three cities (Table 4). However, despite this similarity in all five individual indicators, their medians in San Francisco were somewhat higher (“transportation: 13.0, “water”: 9.0, “energy”: 23, “waste”: 5.0, and “IEQ”: 18.0 points) than the corresponding medians in New York City and Washington, D.C. (“transportation: 12.0, “water”: 8.0, “energy”: 20.0/19.0, “waste”: 5.0/6.0, and “IEQ”: 16.0 points) (Table 9, Table 10, Table 11, Table 12 and Table 13). As a result, “overall LEED” in San Francisco was higher (median: 69.0 points) compared to “overall LEED” in New York City and Washington, D.C. (median: 62.0 in both sites) (Table 14).
San Francisco’s higher overall LEED score scores contrast with the much lower overall LEED scores (median: 62-65 points) from previous research that studied projects certified under previous LEED-EB versions (3 and 4) [60]. However, the San Francisco result aligns with the LEED-EB v4.1 gold certification results previously observed in some European countries, such as Ireland, Germany, Italy, and Spain (median: 69.5–70.5 points) [10]. It can be supposed that the approach of measuring all main LEED-EB v4.1 indicators has promising results due to addressing key factors such as “transportation”, “water”, “energy”, “waste”, and “IEQ”. This contrasts with the previous LEED-EB v4 version, where only “water” and “energy” were measurable indicators.
Table 19 shows the three-valued logic (i.e., “it appears to be positive,” “judgment suspended,” and “it appears to be negative”) based on the exact p-value and r for correlations between each of the five main LEED-EB v4.1 indicators and “overall LEED” for San Francisco, New York City, and Washington, D.C. In general, it can be supposed that the correlation between individual indicators and “overall LEED” can be explained by the availability of local green policies related to this indicator [16].
The dominant significant positive correlation was noticed in all three sites between “energy” and “overall LEED”. The correlations between “energy” and “overall LEED” have been well-established in the literature [17,29,30,32;33]. This is due to the largest number of maximum points allowed by this credit [17]. Regarding this indicator, San Francisco has a local energy efficiency code, such as the Green Building Code (launched in 2008), which is connected to the LEED system; in addition, this city prioritizes renewable energy due to the current Renewables Portfolio Standard practiced in California since 2013 [61]. Aiming for full decarbonization, California has set a goal to reach 90% renewable energy use by 2035 [62]. New York City follows New York State energy-related policies that aim to reduce emissions by 40% by 2030 [63]. Since 2014, Washington, D.C., has been a member of the Carbon Neutral Cities Alliance (CNCA) governance network, which is a pioneer of urban “deep decarbonization” [61].
The three additional correlations were between “transportation” and “overall LEED” in San Francisco, “waste” and “overall LEED” in Washington, D.C., and “IEQ” and “overall LEED” in San Francisco. However, in the literature, there are few studies on the correlation between these main LEED indicators and “overall LEED” [32]. For example, Lee et al. [64] found that a decrease in the LT category resulted in a decrease in overall LEED scores.
Regarding the “transportation” indicator, in 2006, California launched the Global Warming Solutions Act to reduce its GHG emissions by 40% by 2030. Transportation emissions comprise a significant portion of total emissions. In this respect, Kim et al. [65] found that in San Francisco, CO2 emissions decreased by about 8% during 2018-2020. The authors concluded that this result stemmed from policy-driven changes decreasing transportation-related GHG emissions. Jin et al. [66] studied 12 major American cities in terms of their status as a 15-minute walking city and concluded that San Francisco and New York City are the most suitable. A 15-minute travel time for daily activities through walking, cycling, or public transit trips helps to greatly decrease CO2 emissions related to transportation.
Regarding the “waste” indicator, an increase in this indicator was correlated with “overall LEED” only in Washington, D.C. In the US, many municipalities initiate policies to decrease solid waste going into landfills. For example, New York City aims to send zero waste to landfills by 2030 [67]. However, Tonjes et al. [68] analyzed municipal solid waste in 2021 at 11 locations in New York State and concluded that only 18.2% of paper–glass–metal–plastic waste was recycled. This is reflected in the relatively low results obtained by LEED-EB v4.1-certified projects revealed in this study.
“IEQ” is a very important indicator that improves occupants’ quality of life and increases property value [69]. However, in our study, “IEQ” was only correlated with “overall LEED” in one of the three cities, San Francisco. As mentioned earlier, the IEQ score depends not only on CO2 and TVOC measurements (objective measures, 50% of IEQ score), but also on occupant satisfaction ratings (subjective measures, 50% of IEQ score) [12]. The effectiveness of subjective assessments depends not only on the quality of the survey design (what questions are asked) but also on how and when these questions are asked [70]. In conclusion, it should be noted that the IEQ value may vary across projects due to differences in subjective perception between different people in the building, despite the same physical measurements.
6. Conclusions
The purpose of this study was to evaluate LEED-EB v4.1 gold-certified office projects in the United States at the city level. Based on the comparative analysis between the three cities and the correlation analysis within each city, the following conclusions were drawn:
- Comparative analysis found that New York City and Washington, D.C., outnumbered San Francisco in LEED-EB v4.1 project size by 4.9 and 2.7 times, respectively. Despite significant differences in project sizes between New York City, Washington, D.C., and San Francisco, there were no significant differences in four (i.e., “transportation”, “water”, “energy”, and “waste”) of the five key indicators. San Francisco outperforms New York City in indoor environmental quality for office projects that achieve LEED-EB v4.1 gold certification. San Francisco also outperforms New York City and Washington, D.C., in overall LEED scores, demonstrating the higher environmental sustainability of LEED-certified buildings.
- Correlation analysis found that three indicators (i.e., energy”, “transportation”, and “indoor environmental quality”) showed a positive significant correlation with overall LEED scores in San Francisco; two indicators (“energy” and “waster”) showed a positive significant correlation with overall LEED scores in Washington, D.C.; and one indicator (“energy”) showed a positive significant correlation with overall LEED scores in New York City. The fact that a wider range of LEED-EB v4.1 key performance indicators is positively correlated with an increased overall LEED score is associated with the higher environmental sustainability of LEED-certified buildings.
7. Limitations
This study contains at least two limitations. The first is the small sample size, as it studied only three cities and one LEED-EB system in the United States. The second is that LEED-certified projects were studied without considering the associated built environment factors.
8. Future Research
Future research could apply network analysis to LEED-certified projects to provide LEED professionals with an effective decision-making framework for green building certification [71].
Appendix A

Table A1.
LEED-EB 4.1 silver-certified office projects in the US cities (listed alphabetically).
| City, US State | Medium metron | Large fringe metro | Large central metro |
|---|---|---|---|
| Albuquerque, New Mexico | 1 | 0 | 0 |
| Arlington, Virginia | 0 | 1 | 0 |
| Atlanta, Georgia | 0 | 0 | 4 |
| Austin, Texas | 0 | 0 | 1 |
| Bala Cynwyd, Pennsylvania | 0 | 1 | 0 |
| Bellevue, Washington | 0 | 0 | 1 |
| Boston, Massachusetts | 0 | 0 | 1 |
| Boulder, Colorado | 1 | 0 | 0 |
| Broomfield, Colorado | 0 | 1 | 0 |
| Cambridge, Massachusetts | 0 | 1 | 0 |
| Charlotte, North Carolina | 0 | 0 | 1 |
| Chelmsford, Massachusetts | 0 | 1 | 0 |
| Chicago, Illinois | 0 | 0 | 1 |
| Columbia, Maryland | 0 | 1 | 0 |
| Downers Grove, Illinois | 0 | 1 | 0 |
| Fairfax, Virginia | 0 | 2 | 0 |
| Falls Church, Virginia | 0 | 1 | 0 |
| Golden Valley, Minnesota | 0 | 0 | 1 |
| Hillsboro, Oregon | 0 | 1 | 0 |
| Houston, Texas | 0 | 0 | 2 |
| Indianapolis, Indiana | 0 | 0 | 2 |
| Jersey City, New Jersey | 0 | 0 | 1 |
| Littleton, Colorado | 0 | 1 | 0 |
| McLean, Virginia | 0 | 1 | 0 |
| Miami, Florida | 0 | 0 | 1 |
| Minneapolis, Minnesota | 0 | 0 | 1 |
| Morrisville, North Carolina | 2 | 0 | 0 |
| Nashville, Tennessee | 0 | 0 | 1 |
| Needham, Massachusetts | 0 | 1 | 0 |
| New York City, New York | 0 | 0 | 5 |
| Norfolk, Virginia | 0 | 0 | 2 |
| Oakland, California | 0 | 0 | 2 |
| Oregon, United States | 0 | 0 | 1 |
| Park Ridge, Illinois | 0 | 0 | 1 |
| Pinellas Park, Florida | 0 | 0 | 1 |
| Plainsboro, New Jersey | 0 | 1 | 0 |
| Quincy, Massachusetts | 0 | 2 | 0 |
| Raleigh, North Carolina | 2 | 0 | 0 |
| Reston, Virginia | 0 | 3 | 0 |
| Richmond, Virginia | 0 | 1 | 0 |
| Rosemont, Illinois | 0 | 0 | 1 |
| Roswell, Georgia | 0 | 0 | 1 |
| San Antonio, Texas | 0 | 0 | 2 |
| San Diego, California | 0 | 0 | 4 |
| San Francisco, California | 0 | 0 | 2 |
| San Jose, California | 0 | 0 | 2 |
| Santa Clara, California | 0 | 0 | 2 |
| Sarasota, Florida | 1 | 0 | 0 |
| Scottsdale, Arizona | 0 | 0 | 1 |
| Sugar Land, Texas | 0 | 2 | 0 |
| Tampa, Florida | 0 | 0 | 3 |
| Washington, D.C. | 0 | 0 | 6 |
| Weston, Florida | 0 | 4 | 0 |
Table A2.
LEED-EB 4.1 gold-certified office projects in the US cities (listed alphabetically).
| City, US State | Medium metron | Large fringe metro | Large central metro |
|---|---|---|---|
| Alexandria, Virginia | 0 | 2 | 0 |
| Anaheim, California | 0 | 0 | 1 |
| Arlington, Virginia | 0 | 2 | 0 |
| Atlanta, Georgia | 0 | 5 | 2 |
| Austin, Texas | 0 | 0 | 9 |
| Baltimore, Maryland | 0 | 0 | 1 |
| Bethesda, Maryland | 0 | 1 | 0 |
| Beverly Hils, California | 0 | 0 | 2 |
| Blaine, Minnesota | 0 | 1 | 0 |
| Boca Raton, Florida | 0 | 1 | 0 |
| Boston, Massachusetts | 0 | 0 | 3 |
| Bradenton, Florida | 1 | 0 | 0 |
| Burlington, Massachusetts | 0 | 1 | 0 |
| Cambridge, Massachusetts | 0 | 1 | 0 |
| Chandler, Arizona | 0 | 0 | 1 |
| Charlotte, North Carolina | 0 | 0 | 2 |
| Chicago, Illinois | 0 | 0 | 3 |
| Cincinnati, Ohio | 0 | 0 | 1 |
| Clearwater, Florida | 0 | 0 | 1 |
| Colorado Springs, Colorado | 1 | 0 | 0 |
| Dallas, Texas | 0 | 0 | 3 |
| Decatur, Georgia | 0 | 1 | 0 |
| Denver, Colorado | 0 | 0 | 4 |
| Fairfax, Virginia | 0 | 1 | 0 |
| Franklin, Tennessee | 0 | 1 | 0 |
| Golden Valley, Minnesota | 0 | 0 | 2 |
| Greenbrae, California | 0 | 2 | 0 |
| Hillsboro, Oregon | 0 | 1 | 0 |
| Honolulu, Hawaii | 1 | 0 | 0 |
| Houston, Texas | 0 | 0 | 1 |
| Indianapolis, Indiana | 0 | 0 | 2 |
| Irving, Texas | 0 | 0 | 1 |
| Lake Mary, Florida | 0 | 3 | 0 |
| Las Vegas, Nevada | 0 | 0 | 2 |
| Lehi, Utah | 6 | 0 | 0 |
| Los Angeles, California | 0 | 0 | 6 |
| McLean, Virginia | 0 | 3 | 0 |
| Miami, Florida | 0 | 0 | 5 |
| Milwaukee, Wisconsin | 0 | 0 | 1 |
| Minneapolis, Minnesota | 0 | 0 | 2 |
| Miramar, Florida | 0 | 4 | 0 |
| Morrisville, North Carolina | 9 | 0 | 0 |
| Mountain View, California | 0 | 0 | 1 |
| Needham, Massachusetts | 0 | 1 | 0 |
| New York City, New York | 0 | 0 | 26 |
| Newton, Massachusetts | 0 | 1 | 0 |
| Norfolk, Virginia | 0 | 0 | 1 |
| Oakland, California | 0 | 0 | 3 |
| Orlando, Florida | 0 | 0 | 2 |
| Palo Alto, California | 0 | 0 | 2 |
| Pasadena, California | 0 | 0 | 5 |
| Phoenix, Arizona | 0 | 0 | 1 |
| Pittsburgh, Pennsylvania | 0 | 0 | 2 |
| Pleasanton, California | 0 | 0 | 1 |
| Portland, Oregon | 0 | 0 | 2 |
| Raleigh, North Carolina | 2 | 0 | 0 |
| Reston, Virginia | 0 | 7 | 0 |
| Richardson, Texas | 0 | 0 | 2 |
| Richfield, Minnesota | 0 | 0 | 1 |
| Rock Hill, South Carolina | 0 | 1 | 0 |
| Salt Lake City, Utah | 0 | 0 | 1 |
| San Diego, California | 0 | 0 | 6 |
| San Francisco, California | 0 | 0 | 11 |
| San Jose, California | 0 | 0 | 1 |
| Sandy Springs, Georgia | 0 | 0 | 1 |
| Sarasota, Florida | 2 | 0 | 0 |
| Seattle, Washington | 0 | 0 | 4 |
| St. Petersburg, Florida | 0 | 0 | 1 |
| Sterling, Virginia | 0 | 1 | 0 |
| Sugar Land, Texas | 0 | 1 | 0 |
| Tampa, Florida | 0 | 0 | 3 |
| Washington, DC | 0 | 0 | 15 |
| Watertown, Massachusetts | 0 | 1 | 0 |
Figure A1.
LEED-EB v4.1 gold-certified office projects in San Francisco: residuals vs. fitted values plot. The curved line is a calculated LOESS curve, which shows the directions of the distortions from linearity.
Figure A1.
LEED-EB v4.1 gold-certified office projects in San Francisco: residuals vs. fitted values plot. The curved line is a calculated LOESS curve, which shows the directions of the distortions from linearity.
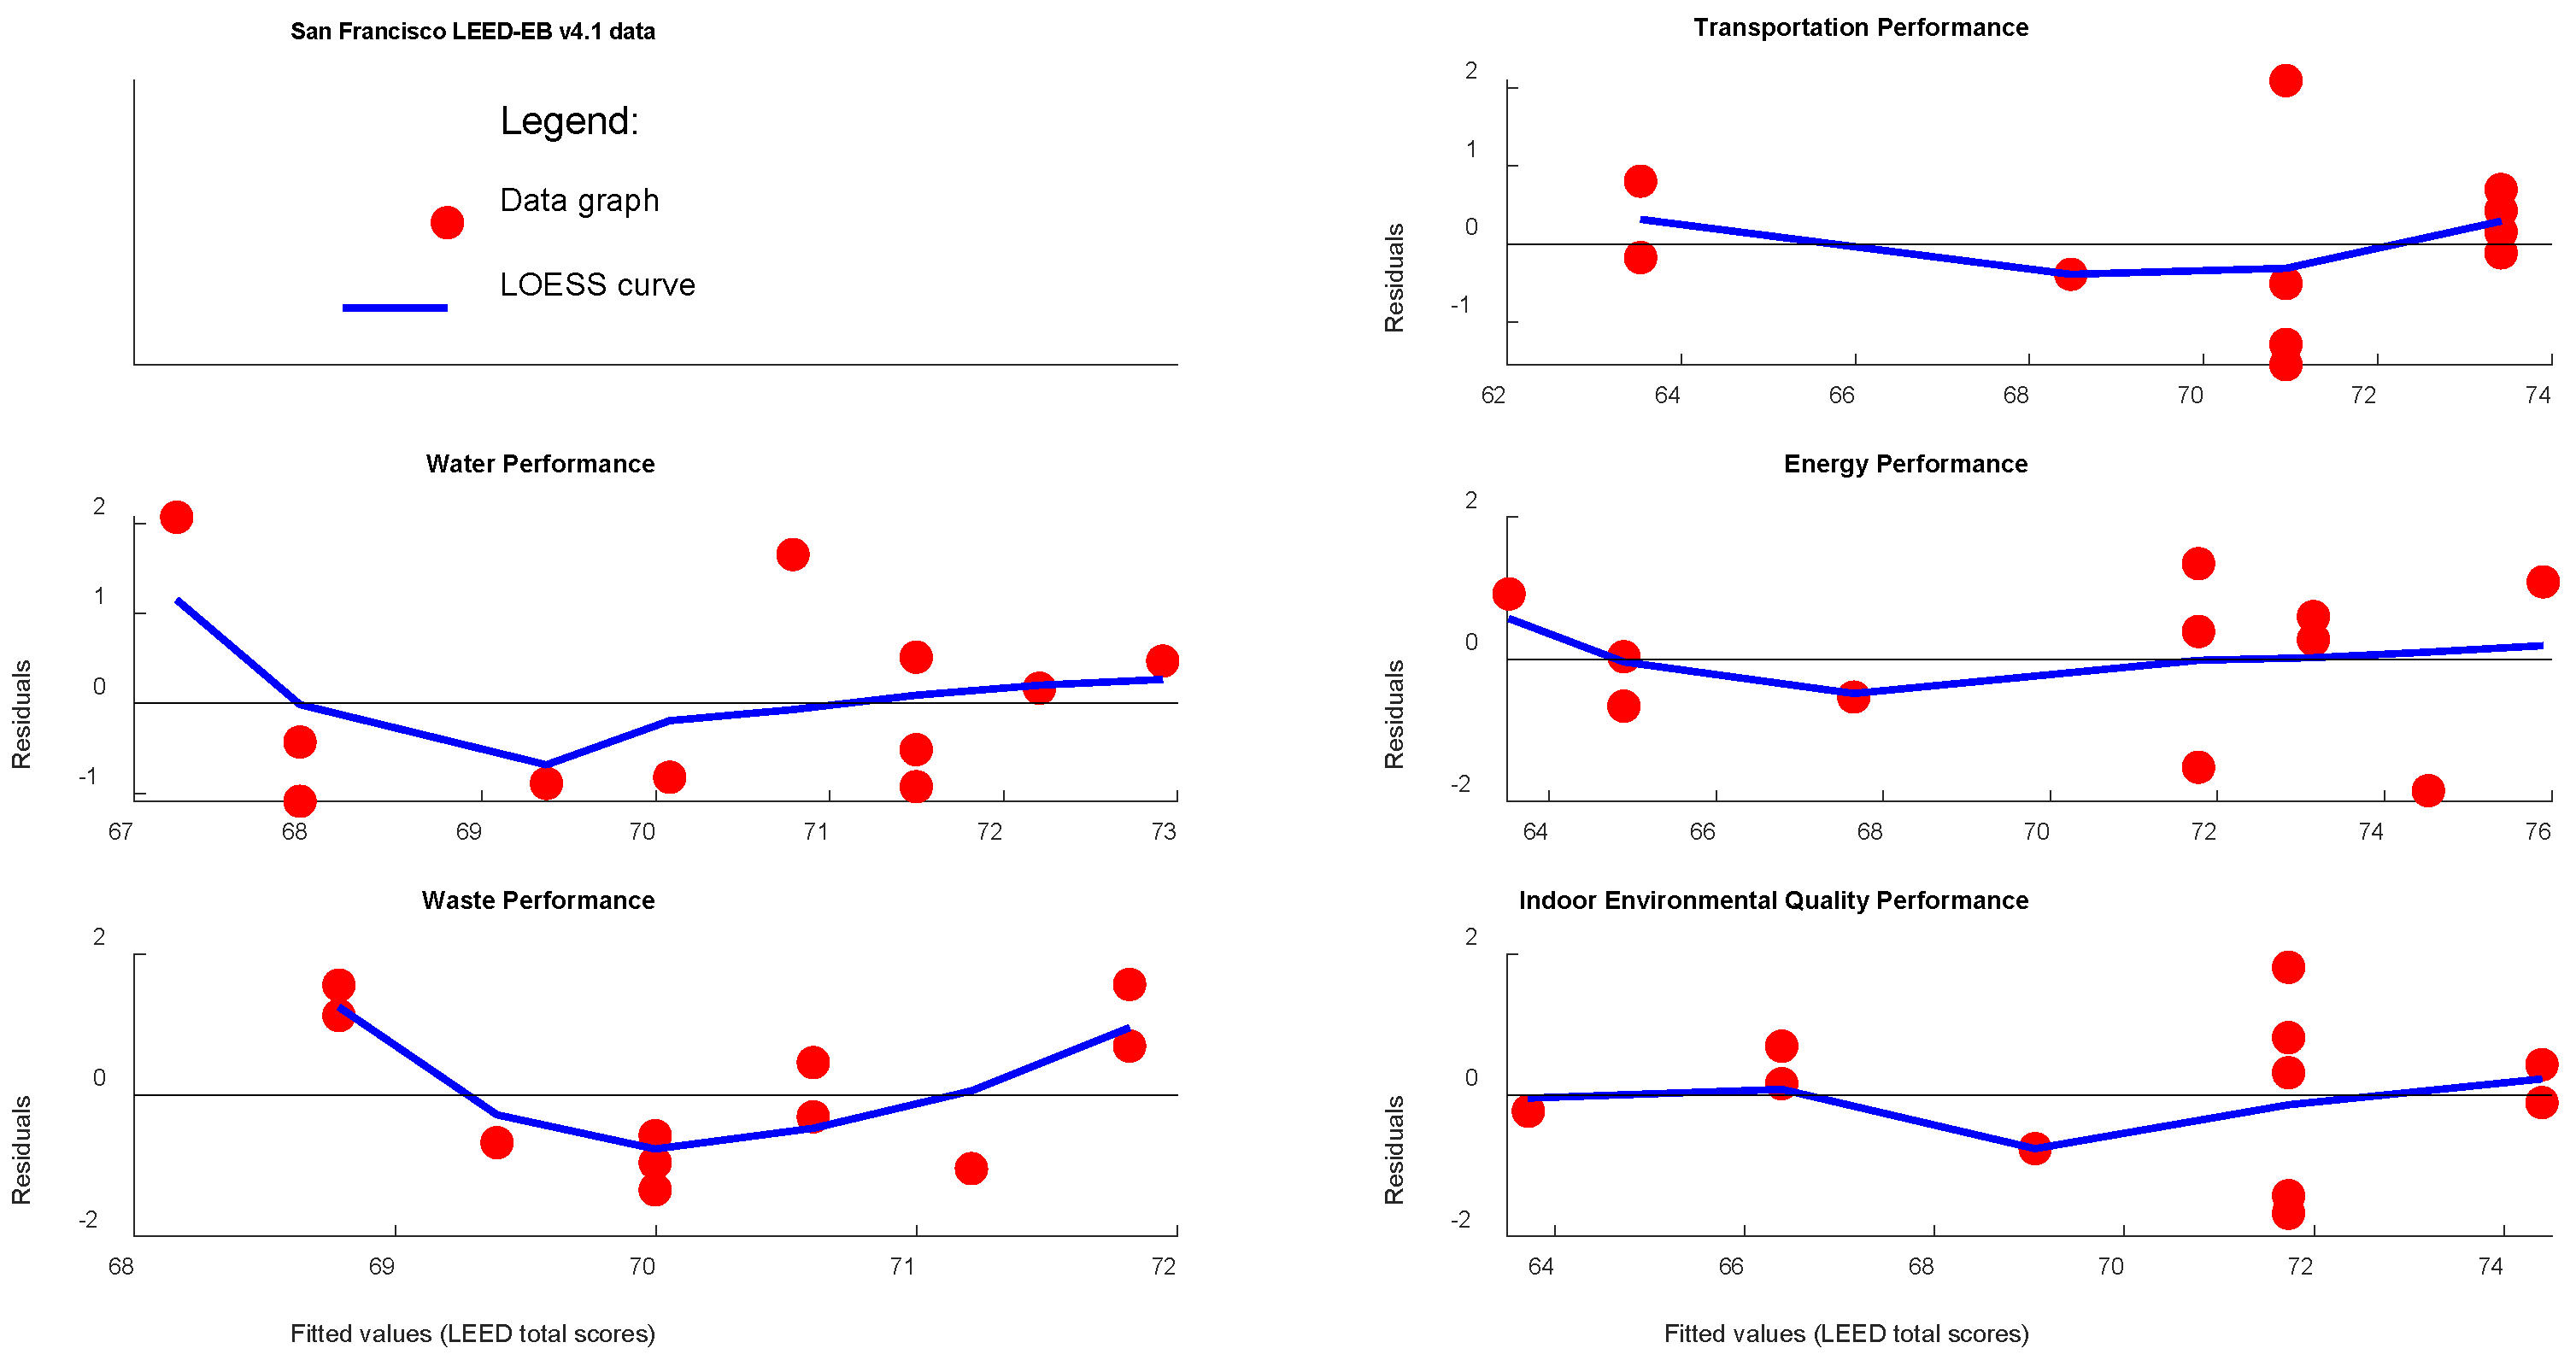
Figure A2.
LEED-EB v4.1 gold-certified office projects in New York City: residuals vs. fitted values plot. The curved line is a calculated LOESS curve, which shows the directions of the distortions from linearity.
Figure A2.
LEED-EB v4.1 gold-certified office projects in New York City: residuals vs. fitted values plot. The curved line is a calculated LOESS curve, which shows the directions of the distortions from linearity.
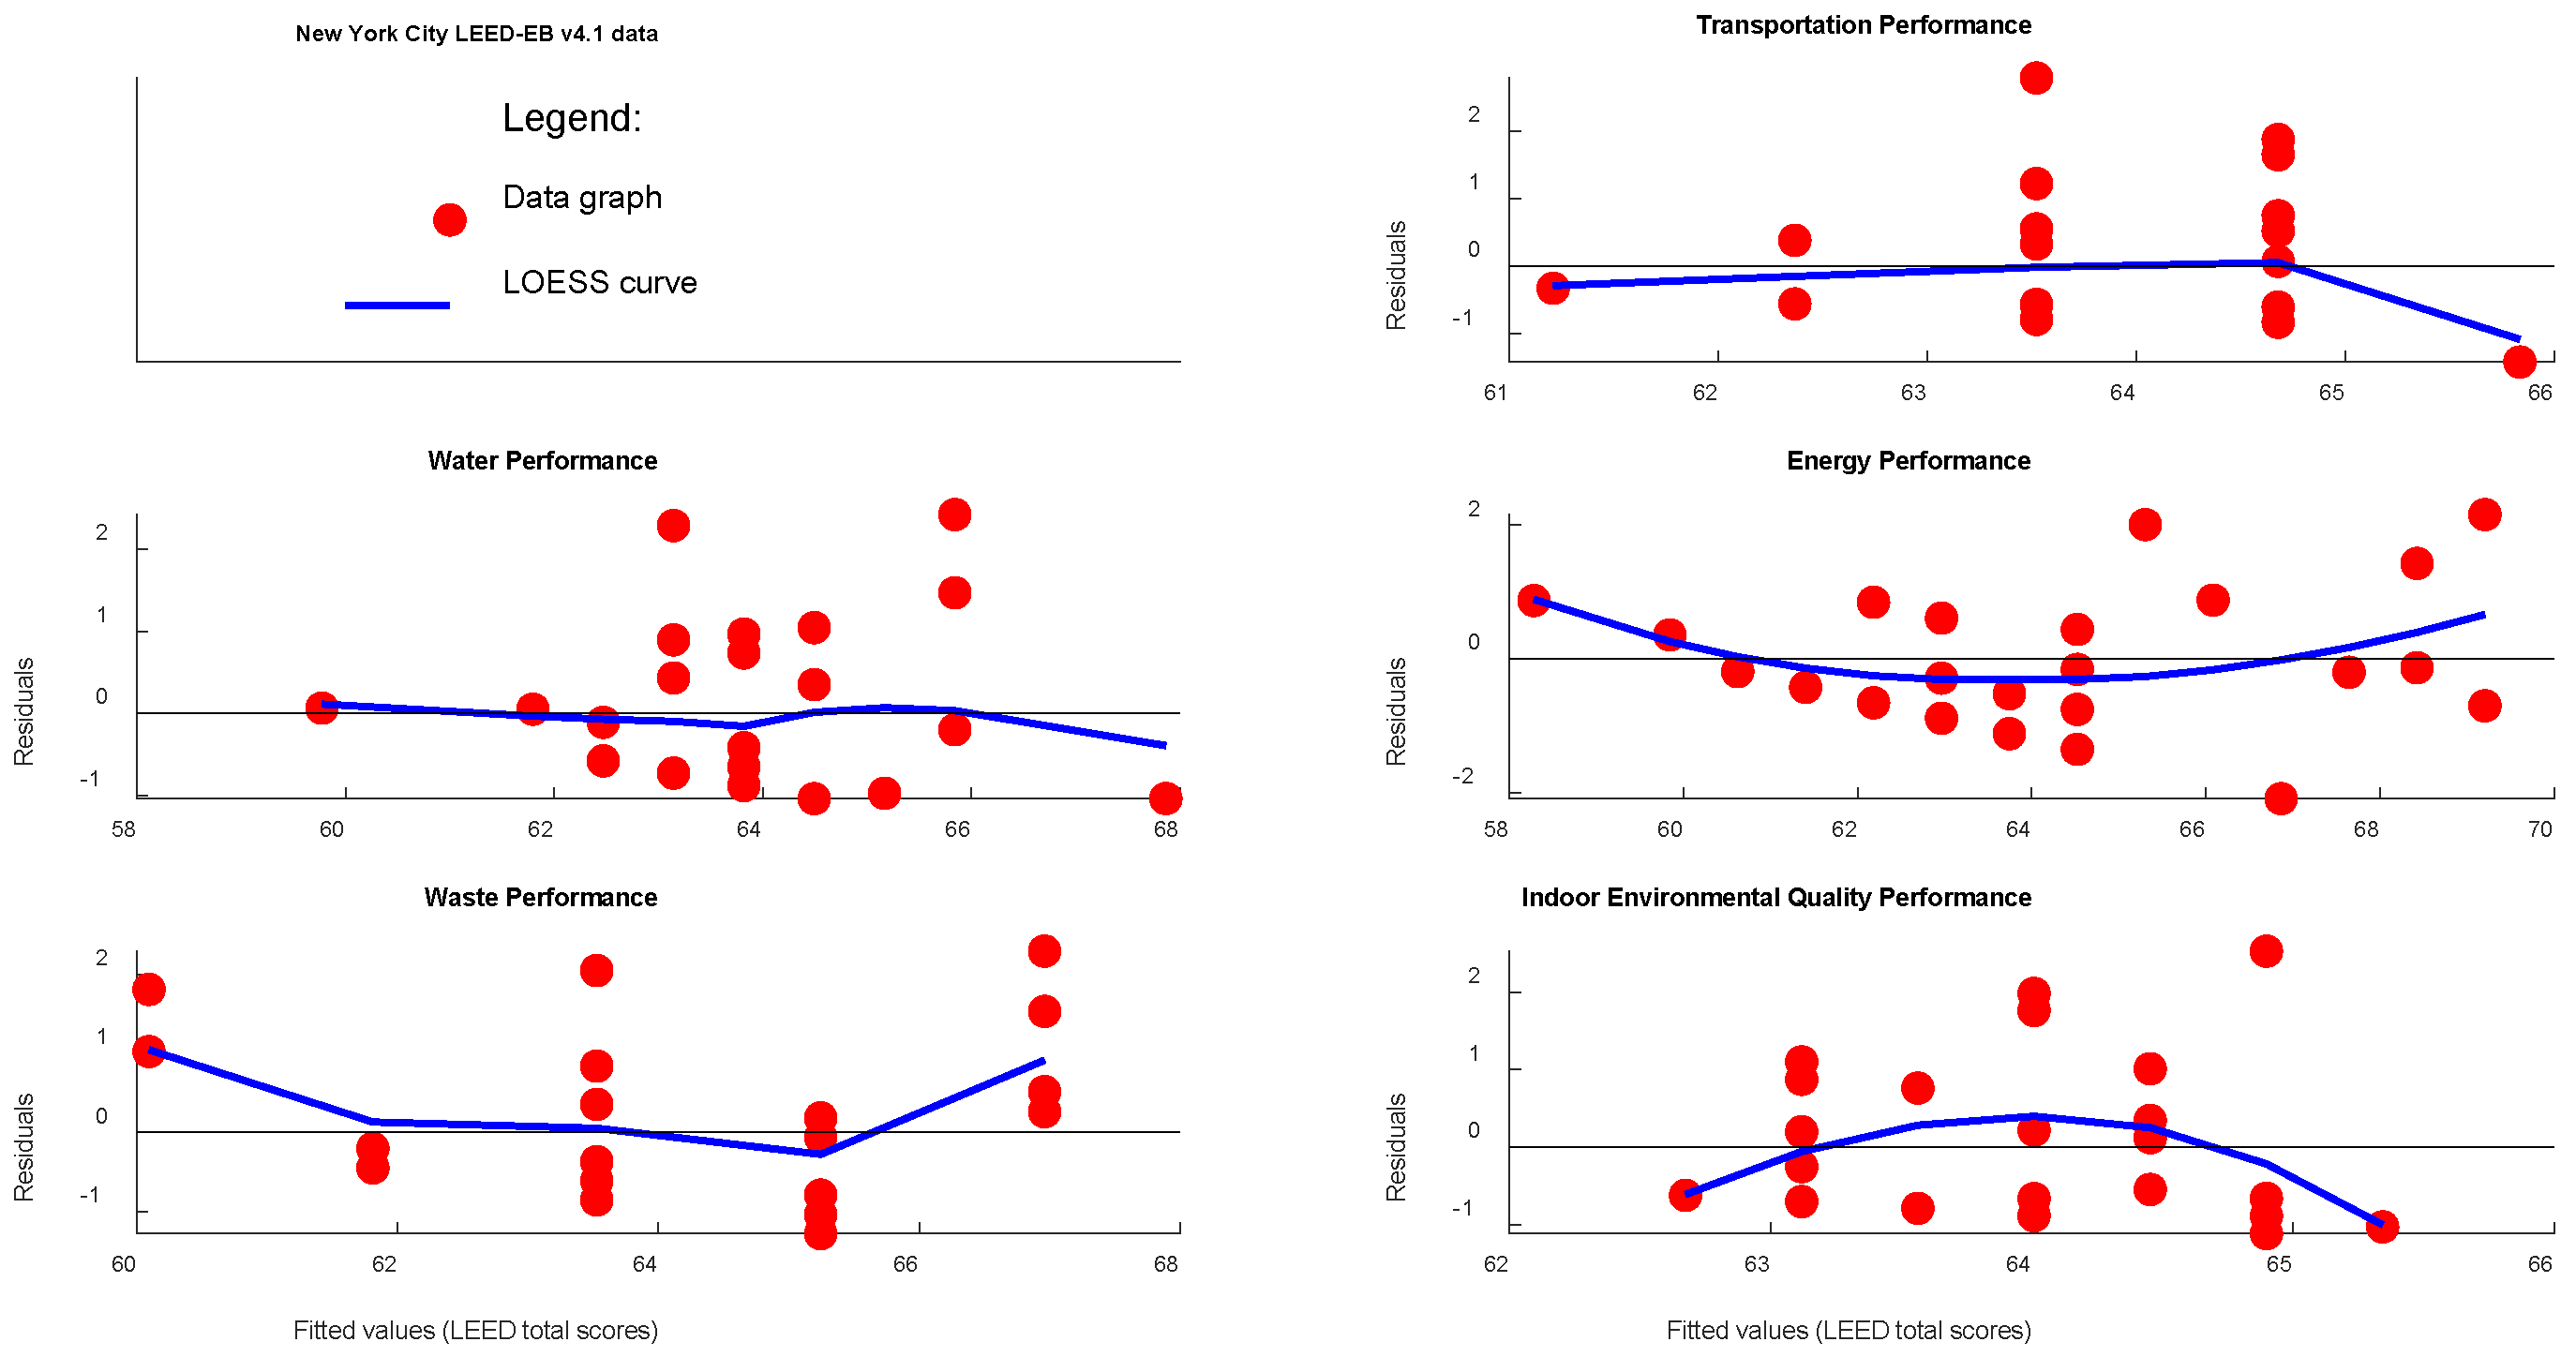
Figure A3.
LEED-EB v4.1 gold-certified office projects in Washington, D.C.: residuals vs. fitted values plot. The curved line is a calculated LOESS curve, which shows the directions of the distortions from linearity.
Figure A3.
LEED-EB v4.1 gold-certified office projects in Washington, D.C.: residuals vs. fitted values plot. The curved line is a calculated LOESS curve, which shows the directions of the distortions from linearity.
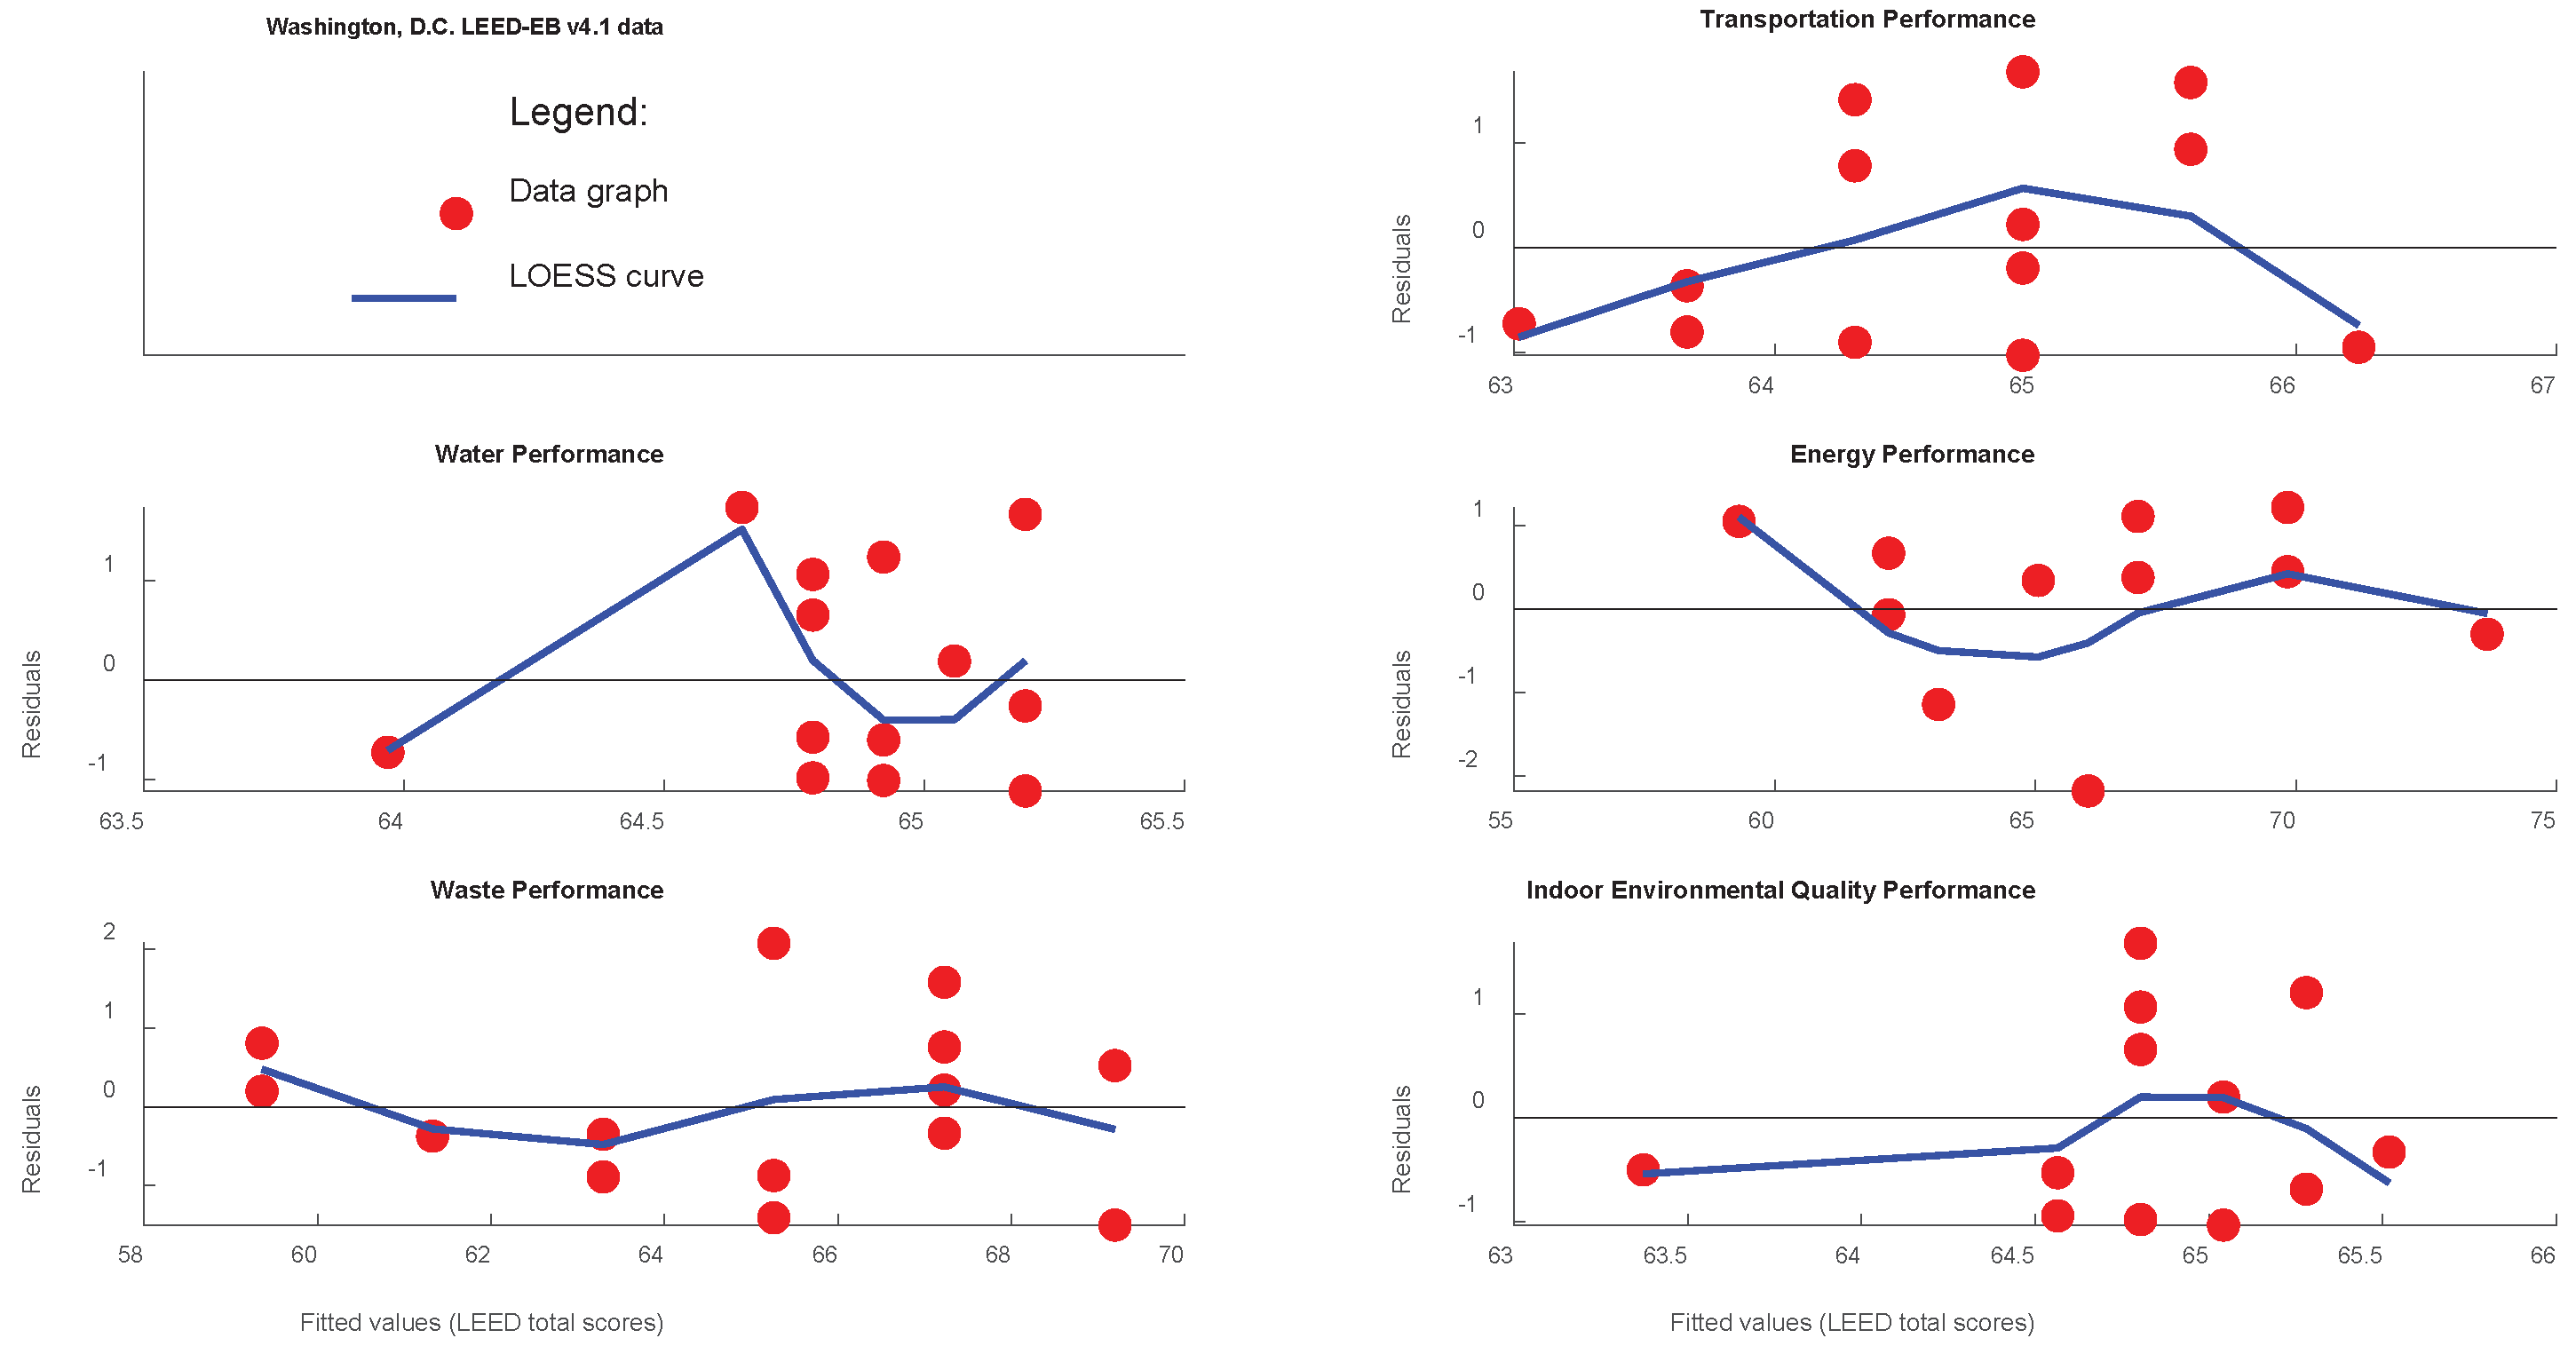
Table A3.
p-values of the remaining four Gauss–Markov assumptions (A1–A4).
| Performance | A1 | A2 | A3 | A4 | ||
|---|---|---|---|---|---|---|
| US city | Variable 1 | Variable 2 | ||||
| San Francisco | Overall LEED vs. | Transportation | 0.576 | 0.269 | 0.758 | 0.525 |
| Water | 0.252 | 0.989 | 0.120 | 0.060 | ||
| Energy | 0.612 | 0.432 | 0.148 | 0.514 | ||
| Waste | 0.524 | 0.064 | 0.649 | 0.240 | ||
| IEQ | 0.026 | 0.040 | 0.099 | 0.850 | ||
| New York City | Overall LEED vs. | Transportation | 0.194 | 0.327 | 0.572 | 0.003 |
| Water | 0.985 | 0.379 | 0.147 | 0.005 | ||
| Energy | 0.342 | 0.762 | 0.037 | 0.809 | ||
| Waste | 0.665 | 0.281 | 0.338 | 0.031 | ||
| IEQ | 0.100 | 0.631 | 0.153 | 0.002 | ||
| Washington, D.C. | Overall LEED vs. | Transportation | 0.563 | 0.741 | 0.408 | 0.015 |
| Water | 0.440 | 0.432 | 0.632 | 0.032 | ||
| Energy | 0.238 | 0.158 | 0.901 | 0.116 | ||
| Waste | 0.390 | 0.251 | 0.298 | 0.584 | ||
| IEQ | 0.356 | 0.774 | 0.800 | 0.029 | ||
Note: A1, no correlation between residuals and independent variables; A2, absence of autocorrelation in residuals; A3, homoscedasticity; and A4, normality in residual distribution. Bold font: apparently, the Gauss–Markov assumption does not hold; ordinal font: apparently, the Gauss–Markov assumption holds.; italic font: judgment is suspended.
References
- Monthly Energy Review, Energy consumption by sector, Tables 2.1a, and 2.1b https://www.eia.gov/tools/faqs/faq.php?id=86&t=1.
- Monthly Energy Review, Energy consumption by fuel, Tables 2.2, and 2.3. https://www.eia.gov/tools/faqs/faq.php?id=86&t=1.
- Huo, J.; Peng, C. Depletion of natural resources and environmental quality: Prospects of energy use, energy imports, and economic growth hindrances. Resour. Policy 2023, 86, 104049. [Google Scholar] [CrossRef]
- Khan, S.A.R.; Zia-Ul-Haq, H.M.; Ponce, P.; Janjua, L. Re-investigating the impact of non-renewable and renewable energy on environmental quality: A roadmap towards sustainable development. Resour. Policy 2023, 81, 103411. [Google Scholar] [CrossRef]
- Vosoughkhosravi, S.; Dixon-Grasso, L.; Jafari, A. The impact of LEED certification on energy performance and occupant satisfaction: A case study of residential college buildings. J. Build. Eng. 2022, 59, 105097. [Google Scholar] [CrossRef]
- Worden, K.; Hazer, M.; Pyke, C.; Trowbridge, M. Using LEED Green Rating Systems to Promote Population Health. Build. Environ. 2020, 172, 106550. [Google Scholar] [CrossRef]
- Ade, R.; Rehm, M. The unwritten history of green building rating tools: A personal view from some of the ‘founding fathers’. Build. Res. Inf. 2020, 48, 1–17. [Google Scholar] [CrossRef]
- Fuerst, F. Building momentum: An analysis of investment trends in LEED and energy star-certified properties. J. Retail Leis. Prop. 2009, 8, 285–297. [Google Scholar] [CrossRef]
- Pushkar, S. Leadership in Energy and Environmental Design for LEED Version 4 (LEED-EB v4) Gold Certification Strategies for Existing Buildings in the United States: A Case Study. Buildings 2025, 15, 1080. [Google Scholar] [CrossRef]
- Pushkar, S. Leadership in Energy and Environmental Design for Existing Buildings Version 4.1 (LEED-EB v4.1) Gold-Certified Office Space Projects in European and Mediterranean Countries: A Pairwise Comparative Analysis. Buildings 2025, 15, 2972. [Google Scholar] [CrossRef]
- Yezioro, A.; Capeluto, I.G. Energy Rating of Buildings to Promote Energy-Conscious Design in Israel. Buildings 2021, 11, 59. [Google Scholar] [CrossRef]
- LEED-EB v4. LEED-EB v4.1. Operation and Maintenance. 2018. Available online: https://dcqpo543i2ro6.cloudfront.net/sites/default/files/file_downloads/LEED%20v4.1%20O%2BM%20Guide.pdf (accessed on 18 October 2025).
- Cidell, J.; Beata, A. Spatial variation among green building certification categories: Does place matter? Landsc. Urban Plan. 2009, 91, 142–151. [Google Scholar] [CrossRef]
- Wu, P.; Mao, C.; Wang, J.; Song, Y.Z.; Wang, X.Y. A decade review of the credits obtained by LEED v2.2 certified green building projects. Build. Environ. 2016, 102, 167–178. [Google Scholar] [CrossRef]
- Wu, P.; Song, Y.; Shou, W.; Chi, H.; Chong, H.Y.; Sutrisna, M. A comprehensive analysis of the credits obtained by LEED 2009 certified green buildings. Renew. Sustain. Energy Rev. 2017, 68 Pt 1, 370–379. [Google Scholar] [CrossRef]
- Pushkar, S.; Verbitsky, O. LEED-NC 2009 Silver to Gold certified projects in the US in 2012–2017: An appropriate statistical analysis. J. Green Build. 2019, 14, 83–107. [Google Scholar] [CrossRef]
- Ahmad, T.; Shoaib, M.; Abdul Kadar, R. LEED v4 Adoption Patterns and Regional Variations Across US-Based Projects. Sustainability 2025, 17, 7403. [Google Scholar] [CrossRef]
- Da Silva, L.; Ruwanpura, J.Y. A review of the LEED points obtained in Canadian building projects to lower costs and optimize benefits. J. Archit. Eng. 2009, 15, 38–54. [Google Scholar] [CrossRef]
- Wu, P.; Song, Y.; Wang, J.; Wang, X.; Zhao, X.; He, Q. Regional Variations of Credits Obtained by LEED 2009 Certified Green Buildings—A Country Level Analysis. Sustainability 2018, 10, 20. [Google Scholar] [CrossRef]
- Pushkar, S. Evaluating LEED commercial interior (LEED-CI) projects under the LEED transition from v3 to v4: The differences between China and the US. Heliyon 2020, 6, e04701. [Google Scholar] [CrossRef]
- Chi, B.; Lu, W.S.; Ye, M.; Bao, Z.K.; Zhang, X.L. Construction waste minimization in green building: A comparative analysis of LEED-NC 2009 certified projects in the US and China. J. Clean. Prod. 2020, 256, 120749. [Google Scholar] [CrossRef]
- Rokde, P.; Valdes-Vasquez, R.; Mosier, R. The green status of fire stations in the United States: An analysis of LEED-NC v3. J. Green Build. 2019, 14, 137–153. [Google Scholar] [CrossRef]
- Goodarzi, M.; Naseri, S.; Tafazzoli, M. Beyond the Green Label: How LEED Certification Levels Shape Guest Satisfaction in USA Hotels. Buildings 2025, 15, 2108. [Google Scholar] [CrossRef]
- Goodarzi, M.; Berghorn, G.H. Pathways to Project Effectiveness in Sustainable Communities: Insights from a Residential Satisfaction Evaluation Model. J. Archit. Eng. 2025, 31, 04025014. [Google Scholar] [CrossRef]
- Lee, S. Designing for the future: how LEED and SDGs drive sustainable art museum architecture. Open House International 2025, 50(4), 793–812. [Google Scholar] [CrossRef]
- Pushkar, S. Life-Cycle Assessment in the LEED-CI v4 Categories of Location and Transportation (LT) and Energy and Atmosphere (EA) in California: A Case Study of Two Strategies for LEED Projects. Sustainability 2022, 14, 10893. [Google Scholar] [CrossRef]
- Pushkar, S. LEED-CI v4 Projects in Terms of Life Cycle Assessment in Manhattan, New York City: A Case Study. Sustainability 2023, 15, 2360. [Google Scholar] [CrossRef]
- Amiri, A.; Ottelin, J.; Sorvari, J. Are LEED-Certified Buildings Energy-Efficient in Practice? Sustainability 2019, 11, 167. [Google Scholar] [CrossRef]
- Goodarzi, M.; Shayesteh, A.; Attallah, S. Assessing the Consistency Between the Expected and Actual Influence of LEED-NC Credit Categories on the Sustainability Score, Proc. 59th Annu. Assoc. Sch. Constr. Int. Conf. 2023, 614–622. [Google Scholar]
- Goodarzi, M. Assessing LEED Credit Weighting: A Dual Perspective on Sustainable Construction and Educational Implications, 2024 ASEE Annu. Conf. 2024, 1–12. [Google Scholar]
- Goodarzi, M.; Naseri, S.; Garshasby, M.; Tafazzoli, M. A Data-Driven Study of Regional Priority Credits and Their Impact on LEED Certification in Multifamily Residential Projects. Proc. 61th Annu. Assoc. Sch. Constr. Int. Conf. 2025, 6, 371–380. [Google Scholar]
- Goodarzi, M.; Garshasby, M. Identifying the Leading Credit Categories in Determining the Overall LEED NC Score of Multifamily Residential Projects. Proc. 60th Annu. Assoc. Sch. Constr. Int. Conf. 2024, 5, 387–395. [Google Scholar]
- Parekh, R. Trends and challenges in LEED v4.1 certification: a comprehensive analysis of U.S. hospital scores in 2024. World J Adv Eng Technol Sci. 2024, 12, 726–40. [Google Scholar] [CrossRef]
- Ingram, D.D.; Franco, S.J. NCHS urban-rural classification scheme for counties. Vital Health Stat. 2012, 154, 1–65. [Google Scholar]
- Smith, R.M. Planning for urban sustainability: The geography of LEED®–Neighborhood Development™ (LEED®–ND™) projects in the United States. Int. J. Urban Sustain. Dev. 2015, 7, 15–32. [Google Scholar] [CrossRef]
- Pushkar, S. LEED-EB v4-certified projects and the built environment in the U.S.A. J. Green Build. 2026, 21. (in press). [Google Scholar]
- Pushkar, S. Leadership in Energy and Environmental Design Commercial Interior Version 4 (LEED-CI v4) Gold-Certified Office Space Projects: A Pairwise Comparative Analysis between Three Mediterranean Countries. Buildings 2024, 14, 815. [Google Scholar] [CrossRef]
- Yoshida, S.; Rudan, I.; Cousens, S. Setting health research priorities using the CHNRI method: VI. Quantitative properties of human collective opinion, J. Glob. Health 2016, 6, 010503. [Google Scholar]
- USGBC Projects Site. https://www.usgbc.org/projects (accessed 19 July 2025).
- GBIG Green Building Data. http://www.gbig.org (accessed 19 July 2025).
- MATLAB and Statistics Toolbox Release 2024a; The Math Works, Inc.: Natick, MA, USA, 2024.
- Bergmann, R.; Ludbrook, J.; Spooren, W.P.J.M. Different outcomes of the Wilcoxon-Mann-Whitney test from different statistics packages. Am. Stat. 2000, 54, 72–77. [Google Scholar]
- Cliff, N. Dominance statistics: Ordinal analyses to answer ordinal questions. Psychol. Bull. 1993, 114, 494–509. [Google Scholar] [CrossRef]
- Boldina, I.; Beninger, P.G. Strengthening statistical usage in marine ecology: Linear regression. J. Exp. Mar. Biol. Ecol. 2016, 474, 81–91. [Google Scholar] [CrossRef]
- Cleveland, W.S.; Devlin, S.J. Locally weighted regression: an approach to regression analysis by local fitting, J. Am. Stat. Assoc. 1988, 83, 596–610. [Google Scholar] [CrossRef]
- Romano, J.; Corragio, J.; Skowronek, J. Appropriate statistics for ordinal level data: Should we really be using t-test and Cohen’s d for evaluating group differences on the NSSE and other surveys? In Proceedings of the Annual Meeting of the Florida Association of Institutional Research, Cocoa Beach, FL, USA, 1–3 February 2006; Florida Association for Institutional Research: Cocoa Beach, FL, USA, 2006; pp. 1–33. [Google Scholar]
- Cohen, J. A power primer. Psychol. Bull. 1992, 112(1), 155–159. [Google Scholar] [CrossRef]
- Volker, M.A. Reporting effect size estimates in school psychology research. Psychol. Sch. 2006, 43, 653–672. [Google Scholar] [CrossRef]
- Durlak, J.A. How to select, calculate, and interpret effect sizes. J. Pediatr. Psychol. 2009, 34, 917–928. [Google Scholar] [CrossRef] [PubMed]
- McDonald, J.H. Handbook of Biological Statistics, 2rd ed., Sparky House Publishing: Baltimore, Maryland, U.S.A. 2009.
- Evans, J.D. Straightforward Statistics for the Behavioral Sciences, Brooks/Cole Publishing: Pacific Grove, CA, USA, 1996.
- Di Leo, G.; Sardanelli, F. Statistical significance: p value, 0.05 threshold, and applications to radiomics—reasons for a conservative approach. Eur. Radiol. Exp. 2020, 4, 1–8. [Google Scholar] [CrossRef]
- Fisher, R.A. Statistical Methods and Scientific Inference; Oliver & Boyd: Edinburgh, UK, 1956. [Google Scholar]
- Gotelli, N.J.; Ellinson, A.M. A Primer of Ecological Statistics, 2nd ed.; Sinauer Associates: Sunderland, MA, USA, 2004; ISBN 9781605350646. [Google Scholar]
- Beninger, P.G.; Boldina, I.; Katsanevakis, S. Strengthening statistical usage in marine ecology. J. Exp. Mar. Biol. Ecol. 2012, 426–427, 97–108. [Google Scholar] [CrossRef]
- Altman, D.G. Practical Statistics for Medical Research; Chapman and Hall: London, UK, 1991. [Google Scholar]
- Hurlbert, S.H.; Lombardi, C.M. Final collapse of the Neyman-Pearson decision theoretic framework and rise of the neoFisherian. Ann. Zool. Fenn. 2009, 46, 311–349. [Google Scholar] [CrossRef]
- Hurlbert, S.H.; Lombardi, C.M. Lopsided reasoning on lopsided tests and multiple comparisons. Aust. N. Z. J. Stat. 2012, 54, 23–42. [Google Scholar] [CrossRef]
- Kennedy-Shaffer, L. Before p < 0.05 to beyond p < 0.05: Using history to contextualize p-values and significance testing. Am. Stat. 2019, 73, 82–90. [Google Scholar]
- Pushkar, S. Impact of “Optimize Energy Performance” Credit Achievement on the Compensation Strategy of Leadership in Energy and Environmental Design for Existing Buildings Gold-Certified Office Space Projects in Madrid and Barcelona, Spain. Buildings 2023, 13, 2656. [Google Scholar] [CrossRef]
- Tozer, L. The urban materials politics of decarbonization in Stockholm, London and San Francisco. Geoforum. 2019, 102, 106–115. [Google Scholar] [CrossRef]
- Shen, Y.; Benke, B.; Roberts, M.; Carlisle, S.; Chafart, M.; Simonen, K. A novel whole-life carbon assessment of thirty buildings in California. J. Build. Eng. 2025, 110, 113074. [Google Scholar] [CrossRef]
- Wu, Y.; Waite, M.; Conlon, T.; Modi, V. The role of electrification induced peak loads and gas infrastructure constraints on decarbonization pathways in New York State. Energy Strat. Rev. 2022, 44, 100985. [Google Scholar] [CrossRef]
- Lee, J.H.; Celik, B.G.; Kurzinski, S.; Ghanem, A. Exploring the Performance Trends in LEED-Certified Schools in Massachusetts: Analyzing Scorecards for Sustainability Insights. Proc. of the 23rd CIB World Building Congress, 19th – 23rd May 2025, Purdue University, West Lafayette, USA, 2025.
- Kim, J.; Turner, A.J.; Fitzmaurice, H.L.; Delaria, E.R.; Newman, C.; Wooldridge, P.J.; Cohen, R.C. Observing Annual Trends in Vehicular CO2 Emissions. Environ. Sci. Technol. 2022, 56, 3925–3931. [Google Scholar] [CrossRef] [PubMed]
- Jin, T.; Wang, K.; Xin, Y.; Shi, J.; Hong, Y.; Witlox, F. Is a 15-Minute City Within Reach? Measuring Multimodal Accessibility and Carbon Footprint in 12 Major American Cities. Land Use Policy. 2024, 142, 107180. [Google Scholar] [CrossRef]
- Ventola, V.; Brenman, E.; Chan, G.; Ahmed, T.; Castaldi, M.J. Quantitative analysis of residential plastic recycling in New York City. Waste Manag. Res. 2021, 39(5), 703–712. [Google Scholar] [CrossRef]
- Tonjes, D.J.; Manzur, S.; Wang, Y.; Firmansyah, F.; Rahman, M.; Walker, G.; Lee, S.; Thomas, T.; Johnston, M.; Ly, M.; et al. Composition of New York State (United States) Disposed Waste and Recyclables in 2021: An Advanced Analysis of Waste Sort Data. Recycling 2024, 9, 87. [Google Scholar] [CrossRef]
- Ghorbani, S.; Zhao, T. LEED Certification in Residential Buildings: Assessing Economic Implications and Occupant Experiences. Proc. 61th Annu. Assoc. Sch. Constr. Int. Conf. 2025, 6, 360–370. [Google Scholar]
- Awolesi, O.; Ghafari, F.; Reams, M. Indoor Environmental Quality Assessment in the Built Environment: A Critical Synthesis of Methodologies and Energy Integration Practices. Energy Built Environ 2025, (in press). [Google Scholar] [CrossRef]
- Goodarzi, M. Shayesteh, A.; Garshasby, M.; JJ Son, J.J. Mapping sustainable synergies: a network analysis of LEED-NC v3 credits in multifamily residential projects. Smart Sustain. Built Environ. 2025. https://www.emerald.com/insight/2046-6099.htm.
Figure 1.
Flow chart of the study design. Boxes with dotted lines indicate sample sizes that are inappropriate for significance tests. Boxes with solid lines indicate sample sizes appropriate for significance tests.
Figure 1.
Flow chart of the study design. Boxes with dotted lines indicate sample sizes that are inappropriate for significance tests. Boxes with solid lines indicate sample sizes appropriate for significance tests.
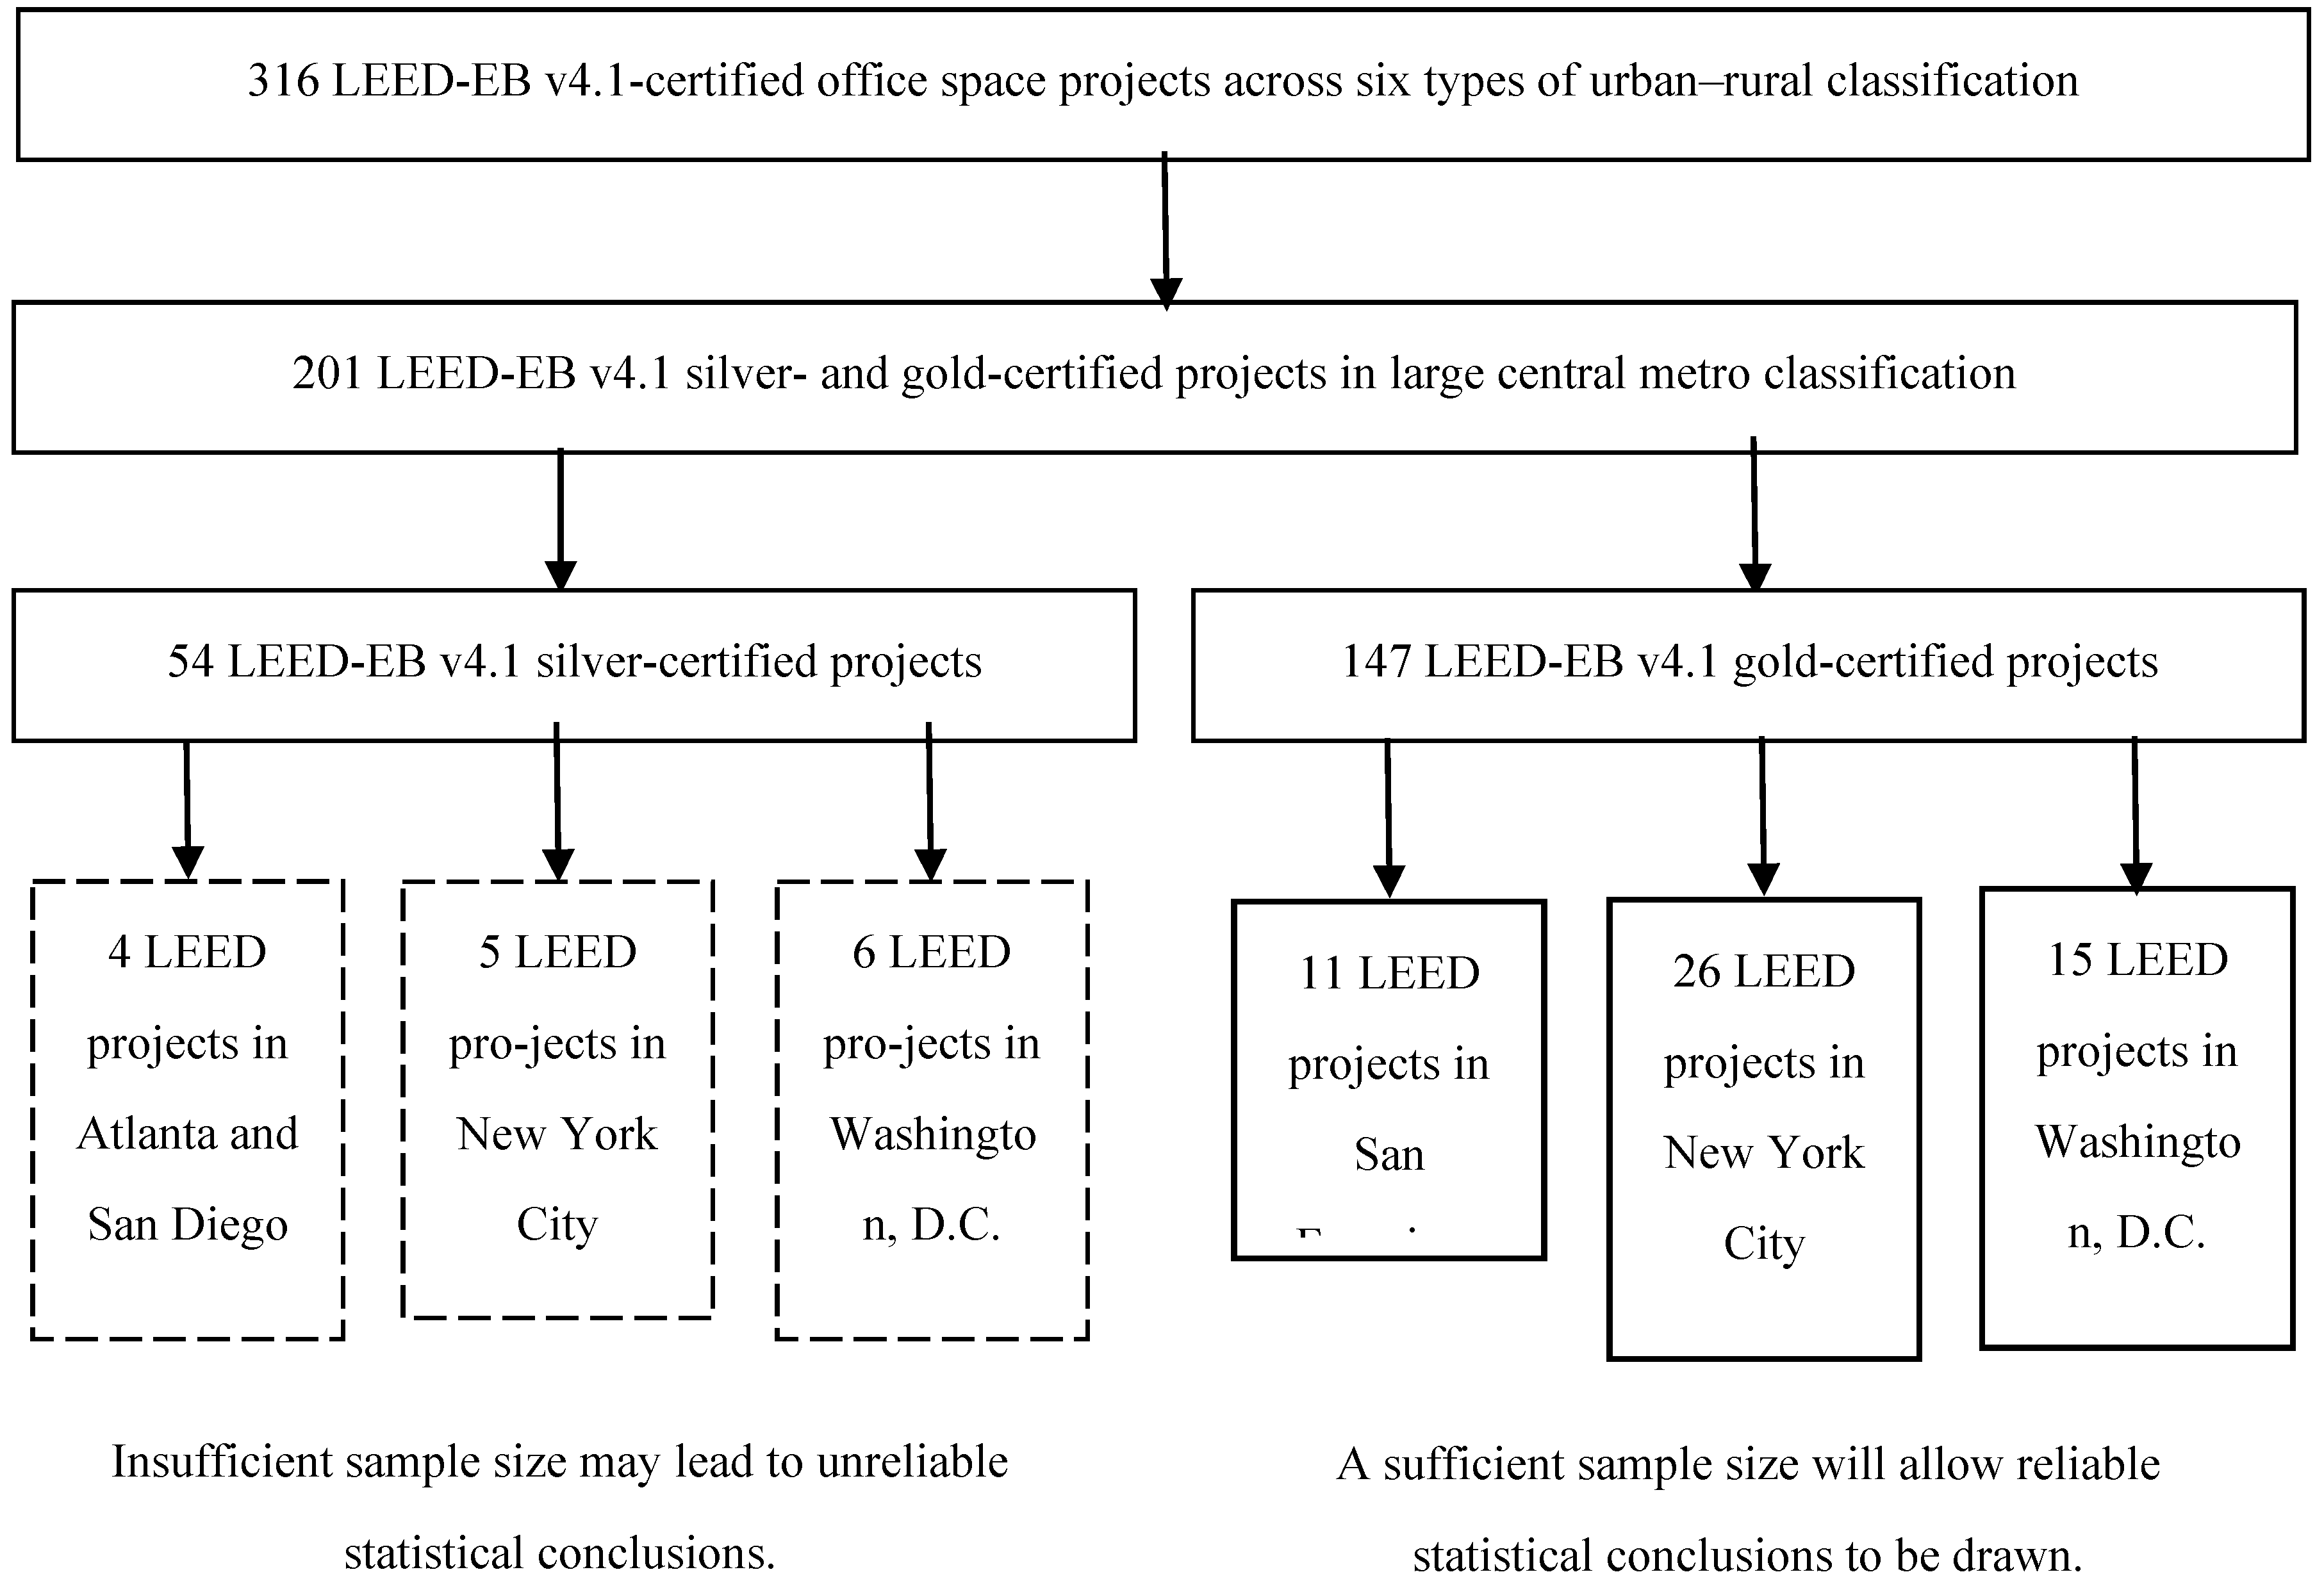
Table 1.
Four types of comparison of LEED-certified projects in the US.
| LEED-NC v4-certified projects | Comparison of independent groups | [Ref] |
|---|---|---|
| LEED-NC v4-certified projects encompass all building types | Nine U.S. climate regions | [17] |
| LEED NC v2009-certified hotel projects | Four certification levels | [23] |
| LEED-CI v4 gold-certified office projects in California | Low vs. High Transport Accessibility | [26] |
| LEED-CI v4 gold-certified office projects in New York City | Low vs. High energy performance in building | [27] |
Table 2.
A summary of the correlation results between individual LEED category scores and overall LEED scores in the United States using the correlation coefficient (r) across six publications.
Table 2.
A summary of the correlation results between individual LEED category scores and overall LEED scores in the United States using the correlation coefficient (r) across six publications.
| LEED-Certified Projects | LT | SS | WE | EA | MRs | IEQ | RP | Ref. |
|---|---|---|---|---|---|---|---|---|
| LEED-NC v4-certified projects encompass all building types | 0.35 | 0.36 | 0.30 | 0.61 | 0.39 | 0.37 | 0.40 | [17] |
| LEED-NC v3-certified university residence hall projects | – | 0.45 | 0.28 | 0.80 | 0.35 | 0.28 | – | [29] |
| LEED-NC v3-certified multifamily residential projects | – | 0.40 | 0.25 | 0.68 | 0.23 | 0.26 | – | [30] |
| LEED-NC 2009 v3-certified multifamily residential projects | – | – | – | – | – | – | 0.38 | [31] |
| LEED-NC v4-certified multifamily residential projects | 0.43 | 0.28 | 0.23 | 0.52 | 0.20 | 0.43 | – | [32] |
| LEED-HC (healthcare) v4.1-certified projects | – | 0.46 | 0.58 | 0.60 | 0.33 | 0.39 | – | [33] |
Table 3.
National Center for Health Statistics’ (NCHS) urban–rural classification in the United States.
Table 3.
National Center for Health Statistics’ (NCHS) urban–rural classification in the United States.
| NCHS Urban–Rural Group | Classification Rules | |
|---|---|---|
| Metropolitan counties | Large central metro | Counties in MSAs 1 with a population of 1 million or more |
| Large fringe metro | Counties in MSAs 1 with a population of 1 million or more that do not qualify as large central metro counties | |
| Medium metro | Counties in MSAs 1 with populations of 250,000–999,999 | |
| Small metro | Counties in MSAs 1 with populations less than 250,000 | |
| Nonmetropolitan counties | Micropolitan | Counties in micropolitan statistical areas |
| Noncore | Nonmetropolitan counties that do not qualify as micropolitan | |
1 MSAs are metropolitan statistical areas.
Table 4.
Distribution of LEED-EB v4.1-certified office projects across six types of urban–rural classification.
Table 4.
Distribution of LEED-EB v4.1-certified office projects across six types of urban–rural classification.
| Certification level | Nonmetropolitan counties | Metropolitan counties | ||||
|---|---|---|---|---|---|---|
| Noncore | Micropolitan | Small metro | Medium metro | Large fringe metro | Large central metro | |
| Certified | 0 | 0 | 0 | 2 | 3 | 5 |
| Silver | 0 | 0 | 1 | 7 | 27 | 54 |
| Gold | 0 | 0 | 1 | 22 | 43 | 147 |
| Platinum | 0 | 0 | 0 | 0 | 1 | 3 |
Table 5.
Distribution of LEED-EB v4.1 silver- and gold-certified office projects among most popular cities located in “large central metro” counties.
Table 5.
Distribution of LEED-EB v4.1 silver- and gold-certified office projects among most popular cities located in “large central metro” counties.
| Certification level | Atlanta | San Diego | San Francisco | New York City | Washington, D.C |
|---|---|---|---|---|---|
| Silver | 4 | 4 | 2 | 5 | 6 |
| Gold | 2 | 6 | 11 | 26 | 15 |
Table 6.
Cohen’s d and Cliff’s δ effect sizes in absolute value.
| Negligible | Small | Medium | Large | Reference |
|---|---|---|---|---|
| |δ| < 0.147 | 0.147 ≤ |δ| < 0.33 | 0.33 ≤ |δ| < 0.474 | |δ| ≥ 0.474 | [46] |
Table 7.
Interpretation of the correlation coefficient in absolute value (|r|).
| Coefficient | Very Weak | Weak | Moderate | Strong | Very Strong | Reference |
|---|---|---|---|---|---|---|
| |r| | 0.00–0.19 | 0.20–0.39 | 0.40–0.59 | 0.60–0.79 | 0.80–1.00 | [51] |
Table 8.
LEED-EB v4.1-certified office project sizes in three US cities.
| LEED-EB v4.1 gold-certified office projects | San Francisco | New York City | Washington, D.C. | San Francisco vs. New York City | San Francisco vs. Washington, D.C. | New York City vs. Washington, D.C. | ||||||
|---|---|---|---|---|---|---|---|---|---|---|---|---|
| Median, 25–75th Percentiles (IQR/M) | δ | p-value | δ | p-value | δ | p-value | ||||||
| Project size (m2) | 9,369, 7,912–18,054 (1.08) | 45,766, 19,449–64,824 (0.99) | 25,448, 21,300–35,343 (0.55) | -0.80 | <0.001 | -0.76 | <0.001 | 0.29 | 0.133 | |||
Table 9.
“Transportation” of LEED-EB v4.1-certified office project in three US cities.
| Performance | Max Points | San Francisco | New York City | Washington, D.C. | San Francisco vs. New York City | San Francisco vs. Washington, D.C. | New York City vs. Washington, D.C. | ||||||
|---|---|---|---|---|---|---|---|---|---|---|---|---|---|
| Median, 25–75th Percentiles (IQR/M) | δ | p-value | δ | p-value | δ | p-value | |||||||
| Transportation | 14 | 13.0, 12.2–14.0 (0.13) | 12.0, 12.0–13.0 (0.08) | 12.0, 11.0–13.0 (0.17) | 0.33 | 0.092 | 0.33 | 0.151 | 0.20 | 0.283 | |||
Table 10.
“Water” of LEED-EB v4.1 gold-certified office space projects in three US cities.
| Performance | Max Points | San Francisco | New York City | Washington, D.C. | San Francisco vs. New York City | San Francisco vs. Washington, D.C. | New York City vs. Washington, D.C. | ||||||
|---|---|---|---|---|---|---|---|---|---|---|---|---|---|
| Median, 25–75th Percentiles (IQR/M) | δ | p-value | δ | p-value | δ | p-value | |||||||
| Water | 15 | 9.0, 8.0–12.5 (0.50) | 8.0, 7.0–9.0 (0.25) | 8.0, 7.2–9.0 (0.22) | 0.30 | 0.153 | 0.27 | 0.243 | -0.02 | 0.918 | |||
Table 11.
“Energy” of LEED-EB v4.1 gold-certified office space projects in three US cities.
| Performance | Max Points | San Francisco | New York City | Washington, D.C. | San Francisco vs. New York City | San Francisco vs. Washington, D.C. | New York City vs. Washington, D.C. | ||||||
|---|---|---|---|---|---|---|---|---|---|---|---|---|---|
| Median, 25–75th Percentiles (IQR/M) | δ | p-value | δ | p-value | δ | p-value | |||||||
| Energy | 33 | 23.0, 18.5–24.0 (0.24) | 20.0, 18.0–23.0 (0.25) | 19.0, 18.0–23.0 (0.26) | 0.23 | 0.280 | 0.20 | 0.403 | -0.03 | 0.877 | |||
Table 12.
“Waste” of LEED-EB v4.1 gold-certified office space projects in three US cities.
| Performance | Max Points | San Francisco | New York City | Washington, D.C. | San Francisco vs. New York City | San Francisco vs. Washington, D.C. | New York City vs. Washington, D.C. | ||||||
|---|---|---|---|---|---|---|---|---|---|---|---|---|---|
| Median, 25–75th Percentiles (IQR/M) | δ | p-value | δ | p-value | δ | p-value | |||||||
| Waste | 8 | 5.0, 4.2–6.8 (0.50) | 5.0, 4.0–6.0 (0.40) | 6.0, 5.0–7.0 (0.33) | 0.07 | 0.750 | -0.13 | 0.594 | -0.25 | 0.188 | |||
Table 13.
“IEQ” of LEED-EB v4.1 gold-certified office space projects in three US cities.
| Performance | Max Points | San Francisco | New York City | Washington, D.C. | San Francisco vs. New York City | San Francisco vs. Washington, D.C. | New York City vs. Washington, D.C. | ||||||
|---|---|---|---|---|---|---|---|---|---|---|---|---|---|
| Median, 25–75th Percentiles (IQR/M) | δ | p-value | δ | p-value | δ | p-value | |||||||
| IEQ | 20 | 18.0, 16.2–18.0 (0.10) | 16.0, 14.0–17.0 (0.19) | 16.0, 16.0–17.8 (0.11) | 0.53 | 0.009 | 0.38 | 0.090 | -0.20 | 0.283 | |||
Table 14.
“Overall LEED” of LEED-EB v4.1 gold-certified office space projects in three US cities.
| Performance | Min Points 1 | San Francisco | New York City | Washington, D.C. | San Francisco vs. New York City | San Francisco vs. Washington, D.C. | New York City vs. Washington, D.C. | ||||||
|---|---|---|---|---|---|---|---|---|---|---|---|---|---|
| Median, 25–75th Percentiles (IQR/M) | δ | p-value | δ | p-value | δ | p-value | |||||||
| LEED total | 60 | 69.0, 66.0–74.8 (0.13) | 62.0, 60.0–67.0 (0.11) | 62.0, 60.5–69.5 (0.15) | 0.66 | 0.001 | 0.59 | 0.001 | -0.13 | 0.491 | |||
1 Minimum points required to achieve gold certification level.
Table 15.
Correlation between “overall LEED” and each of the five “individual LEED” in LEED-EB v4.1 gold-certified office projects in San Francisco.
Table 15.
Correlation between “overall LEED” and each of the five “individual LEED” in LEED-EB v4.1 gold-certified office projects in San Francisco.
| Country | Performance | r | p-value | |
|---|---|---|---|---|
| Variable 1 | Variable 2 | |||
| San Francisco | Overall LEED vs. | Transportation | 0.69 a | 0.018 |
| Water | -0.35 b | 0.294 | ||
| Energy | 0.81 a | 0.003 | ||
| Waste | 0.20 a | 0.555 | ||
| IEQ | 0.61 b | 0.049 | ||
Notes: a Pearson’s correlation test and b Spearman’s correlation test.
Table 16.
Correlation between “overall LEED” and each of the five “individual LEED” in LEED-EB v4.1 gold-certified office projects in New York.
Table 16.
Correlation between “overall LEED” and each of the five “individual LEED” in LEED-EB v4.1 gold-certified office projects in New York.
| Country | Performance | r | p-value | |
|---|---|---|---|---|
| Variable 1 | Variable 2 | |||
| New York City | Overall LEED vs. | Transportation | 0.34 b | 0.093 |
| Water | 0.32 b | 0.116 | ||
| Energy | 0.61 b | 0.001 | ||
| Waste | 0.40 b | 0.044 | ||
| IEQ | 0.24 b | 0.245 | ||
Note: b Spearman’s correlation test.
Table 17.
Correlation between “overall LEED” and each of the five “individual LEED” in LEED-EB v4.1 gold-certified office projects in Washington, D.C.
Table 17.
Correlation between “overall LEED” and each of the five “individual LEED” in LEED-EB v4.1 gold-certified office projects in Washington, D.C.
| Country | Performance | r | p-value | |
|---|---|---|---|---|
| Variable 1 | Variable 2 | |||
| Washington DC | Overall LEED vs. | Transportation | 0.30 b | 0.275 |
| Water | 0.07 b | 0.816 | ||
| Energy | 0.83 a | <0.001 | ||
| Waste | 0.65 a | 0.009 | ||
| IEQ | 0.07 b | 0.801 | ||
Notes: a Pearson’s correlation test and b Spearman’s correlation test.
Table 18.
Pairwise comparative analysis in project size, five main LEED-EB v4.1 indicators, and overall LEED between three cities in terms of “it seems to be positive” (A), “judgment is suspended” (B), and “it seems to be negative” (C).
Table 18.
Pairwise comparative analysis in project size, five main LEED-EB v4.1 indicators, and overall LEED between three cities in terms of “it seems to be positive” (A), “judgment is suspended” (B), and “it seems to be negative” (C).
| Indicators | San Francisco vs. New York City | San Francisco vs. Washington, D.C. | New York City vs. Washington, D.C. | ||||||
|---|---|---|---|---|---|---|---|---|---|
| A | B | C | A | B | C | A | B | C | |
| Project size | ✓ | ✓ | ✓ | ||||||
| Transportation | ✓ | ✓ | ✓ | ||||||
| Water | ✓ | ✓ | ✓ | ||||||
| Energy | ✓ | ✓ | ✓ | ||||||
| Waste | ✓ | ✓ | ✓ | ||||||
| IEQ | ✓ | ✓ | ✓ | ||||||
| Overall LEED | ✓ | ✓ | ✓ | ||||||
✓ This indicates that one of three decisions was made regarding the effect size and p-value.
Table 19.
Frequency analysis of inferential conclusions for correlations between five main LEED-EB v4.1 indicators and overall LEED in terms of “it seems to be positive” (A), “judgment is suspended” (B), and “it seems to be negative” (C) in three sites.
Table 19.
Frequency analysis of inferential conclusions for correlations between five main LEED-EB v4.1 indicators and overall LEED in terms of “it seems to be positive” (A), “judgment is suspended” (B), and “it seems to be negative” (C) in three sites.
| City | Energy | Transportation | Waste | IEQ | Water | ||||||||||
|---|---|---|---|---|---|---|---|---|---|---|---|---|---|---|---|
| A | B | C | A | B | C | A | B | C | A | B | C | A | B | C | |
| San Francisco | ✓ | ✓ | ✓ | ✓ | ✓ | ||||||||||
| New York City | ✓ | ✓ | ✓ | ✓ | ✓ | ||||||||||
| Washington, D.C. | ✓ | ✓ | ✓ | ✓ | ✓ | ||||||||||
✓ This indicates that one of three decisions was made regarding the r and p-value.
Disclaimer/Publisher’s Note: The statements, opinions and data contained in all publications are solely those of the individual author(s) and contributor(s) and not of MDPI and/or the editor(s). MDPI and/or the editor(s) disclaim responsibility for any injury to people or property resulting from any ideas, methods, instructions or products referred to in the content. |
© 2025 by the authors. Licensee MDPI, Basel, Switzerland. This article is an open access article distributed under the terms and conditions of the Creative Commons Attribution (CC BY) license (http://creativecommons.org/licenses/by/4.0/).
Copyright: This open access article is published under a Creative Commons CC BY 4.0 license, which permit the free download, distribution, and reuse, provided that the author and preprint are cited in any reuse.


