Submitted:
28 July 2024
Posted:
31 July 2024
You are already at the latest version
Abstract
In previous investigations, drones have been used for visual inspections of heritage elements. We now propose the use of aerial thermography to complement the information obtained with standard drones, which perform purely visual inspections. Thus, after a brief overview of the contribution of aerial thermography to heritage, we will use a drone with a thermographic camera to inspect three unique and important heritage elements: the Roman Bridge of Alcántara, the Roman Aqueduct of Segovia and the Roman Bridge of Alconétar. The three monuments were previously visually inspected with a drone with a camera. These operations will enable us to draw conclusions about the applicability of this technology to heritage: the inspections will demonstrate the usefulness of thermography for the diagnosis of damage to stone at a deeper level, which is already in an advanced stage of development in the interior of the element when it appears on the surface. Detecting such damage early can be the key when trying to adopt less aggressive and expensive early treatment, thus avoiding further risk to the constituent elements of the monument.
Keywords:
aerial thermography
; drones
; inspection
; heritage preservation
; joints and efflorescences
1. Introduction
This research article aims to complement a paper presented at the REHABEND 2022 Congress [1] which analysed the use of drones for inspecting elements of architectural heritage, unique constructions and ancient or delicate structures. Several Roman constructions of great importance and fame were analysed. Many other experiments in the field have been reproduced with identical and successful results, mainly in ancient bridges made of stone materials [2,3,4,5].
However, the inspection of several ancient constructions that was carried out for experimental purposes on that occasion was an inspection in accordance with current regulations [6]. In other words, it was a purely visual inspection, because it analysed only the visible elements that made up the constructions. This was an important limitation, since there may be harmful phenomena that are invisible to the human eye and, therefore, escape the recognition and scope of a visual inspection.
Here a relatively new technology emerges and gains importance: thermography. Thermography is a recognition technique based on the detection of radiation emitted by bodies, transforming the captured information into images that incorporate valuable data on the surface temperature of the photographed bodies. Such is its importance that it has not only become the subject of detailed study in the field of heritage and ancient buildings [7], but has now come to be considered a fundamental instrumental auscultation technique in the field of monument conservation [8,9].
A normal camera (photographic camera), such as the one built into any mobile phone today, detects the visible light emitted by objects and is able to capture this visible light on a sheet of paper, thus generating photographs that anyone can see. In other words, a camera detects the visible light emitted by objects and is able to capture it in a photograph. A thermal camera, on the other hand, detects infrared emissions: the frequency of infrared rays is lower than the frequency of visible light, which is why the human eye is unable to detect them. However, these infrared rays can be perceived organoleptically in the form of heat. The human eye is insensitive to the infrared radiation emitted by an object, but the skin is sensitive to this radiation. Therefore, a thermal camera is responsible for capturing the surface temperature of objects and recording it on a thermal image (or thermogram).
The reduction in the cost of cameras over the last few years and their incorporation into drones as an additional element (Figure 1) has opened the doors to a new and highly useful microtechnology that can be used to monitor monuments and the materials they are made of. For this reason, this contribution and how best to use it will be analysed in the following sections.
2. Objectives
Starting from the idea, once again, that the inspection of any construction is essential, providing the data needed to monitor its functional status, resistance and appearance, the main objective of this article is to verify the applicability of aerial thermography as a complement to standard inspections in the heritage field, assessing what it can contribute as a complement to exclusively visual inspections.
The author's experience and the analysis of his aerial thermography inspections of three constructions of considerable heritage value (the Alcántara Roman Bridge, the Aqueduct of Segovia and the Alconétar Roman Bridge), previously subjected to a detailed main inspection using a standard drone, will serve as a basis to verify compliance with the objective established here.
3. Use of Thermography in Heritage Conservation
As indicated in the Introduction, thermography is a technique used to detect possible defects in old buildings, since it enables, through the infrared radiation emitted by bodies, the surface temperature of the elements to be measured. As already mentioned, the device used in thermography for this measurement is the infrared camera.
3.1. Terrestrial Thermography
Thermographic photographs are mainly used to locate the so-called “hot spots”. These are the points of an element where its temperature is higher (or lower) compared to the surrounding surface temperatures and, thanks to this, they stand out in the thermal image. Thus, the author has used infrared thermography, for example, to locate covered structural metal elements (Figure 2) or buried installation pipes (Figure 3), to give just a few examples. It is very important to emphasize that it is not a technique that, as certain erroneous approaches have led us to believe, allows us to discover hidden objects or see the inside of objects. It is a technique that diagnoses surface temperatures quantitatively. However, it is true that, when a hidden object transmits a significant thermal oscillation to the surrounding surface, this oscillation will be captured by the thermographic camera (Figure 3 b)).
Nowadays, thermography has become a fundamental instrument for carrying out an adequate analysis of the real state of the building envelope, especially in terms of locating possible thermal bridges, possible insulation defects, the presence of moisture and many other types of damage that can affect it. Part of its interest lies in the characteristics of thermography as an instrumental diagnostic technique [10,11]:
- It is not an invasive auscultation technique, since it obtains information remotely.
- It can capture the observed element in an image, enabling thermal analysis.
- It allows rapid visualization of stationary objects.
- It results in thermograms, images that provide full information regarding surface temperature, thermal patterns and anomalies existing in them.
Every object with a surface temperature above absolute zero (0°K = -273.15 °C) emits infrared radiation (IR). The human eye is unable to perceive this radiation, because it is blind to its wavelength (Figure 4). However, a thermal imaging camera is not blind to this wavelength. This is possible thanks to the central core of an infrared camera, the infrared detector, which is sensitive to infrared radiation. Based on the intensity of the infrared radiation, the infrared detector is able to determine the surface temperature of the object, making it visible to the human eye in the thermogram. This entire process is what is known as thermography: for infrared radiation to be visible, the detector must detect it. Once diagnosed, the detector converts the infrared radiation into an electrical signal, assigning each signal a specific colour, which will appear on the camera screen. In a way, you could say that a thermal imaging camera translates the wavelengths of the infrared spectrum into wavelengths that are perceptible to the human eye (and it does this in the form of colours).
The radiation recorded by a thermal imaging camera is the result of the sum of the emitted radiation (ε), the reflected radiation (ρ) and the transmitted radiation (τ), originating from the objects that are present in the field of view of the camera [12] (Figure 5).
These elements are analysed individually below (Figure 7):
- Transmission (τ) is essentially the ability of a material to allow infrared radiation to pass through it; in other words, the ability to transmit infrared radiation. Thus, for example, a thin plastic sheet has high transmissivity, so that if one tries to measure the temperature of the wall of an old building that has a thin plastic sheet placed in front of it, the result of the measurement will not be the temperature of the plastic sheet, but the temperature of the wall of the building. In general terms, materials do not usually allow infrared radiation to pass through, hence the transmissivity in most of them is practically zero and, therefore, can be ignored for calculation purposes.
- Emissivity (ε) is the capacity of a material to emit infrared radiation. This capacity is always expressed in percentage terms and, as with transmission, depends on the material itself, but also on the surface properties of the material. Thus, the sun, for example, has an emissivity of 100%, although this is a value that never appears in normal work. In the field of civil engineering and construction, one of the materials that registers one of the highest emissivity values is concrete, which reaches 93% emissivity.
- If we accept that 93% of infrared radiation comes from the concrete in a shot of a wall, the remaining 7% would be the reflection (ρ) from the surroundings of the material or object to be measured. In other words, the reflection would be the temperature that is reflected by the object to be analysed.
The thermal imaging camera generates a thermogram, which is an image in which each pixel contains a diagnosed surface temperature value. The emissivity data and the reflected temperature data can be entered into a thermal imaging camera. This allows for the most accurate thermal image possible. In addition, thermograms are coded in colour levels (pseudocolour), with the coldest colours (blue) usually representing the lowest temperatures and the warmest colours (red) usually representing the highest temperatures.
However, thermography can be used as a diagnostic and heritage auscultation technique of great interest, since it can contribute to the characterization of materials of diverse origin, when materials with different characteristics coexist in the same monument. Thus, below we can observe the case of the Torre del Oro in Seville, where limestone ashlars from different periods coexist with mortar in the lower part of the monument, showing, depending on their age and exposure to external agents, a clearly differentiated appearance to the naked eye (Figure 6), which can also be clearly seen in the image captured by the thermographic camera (Figure 7).
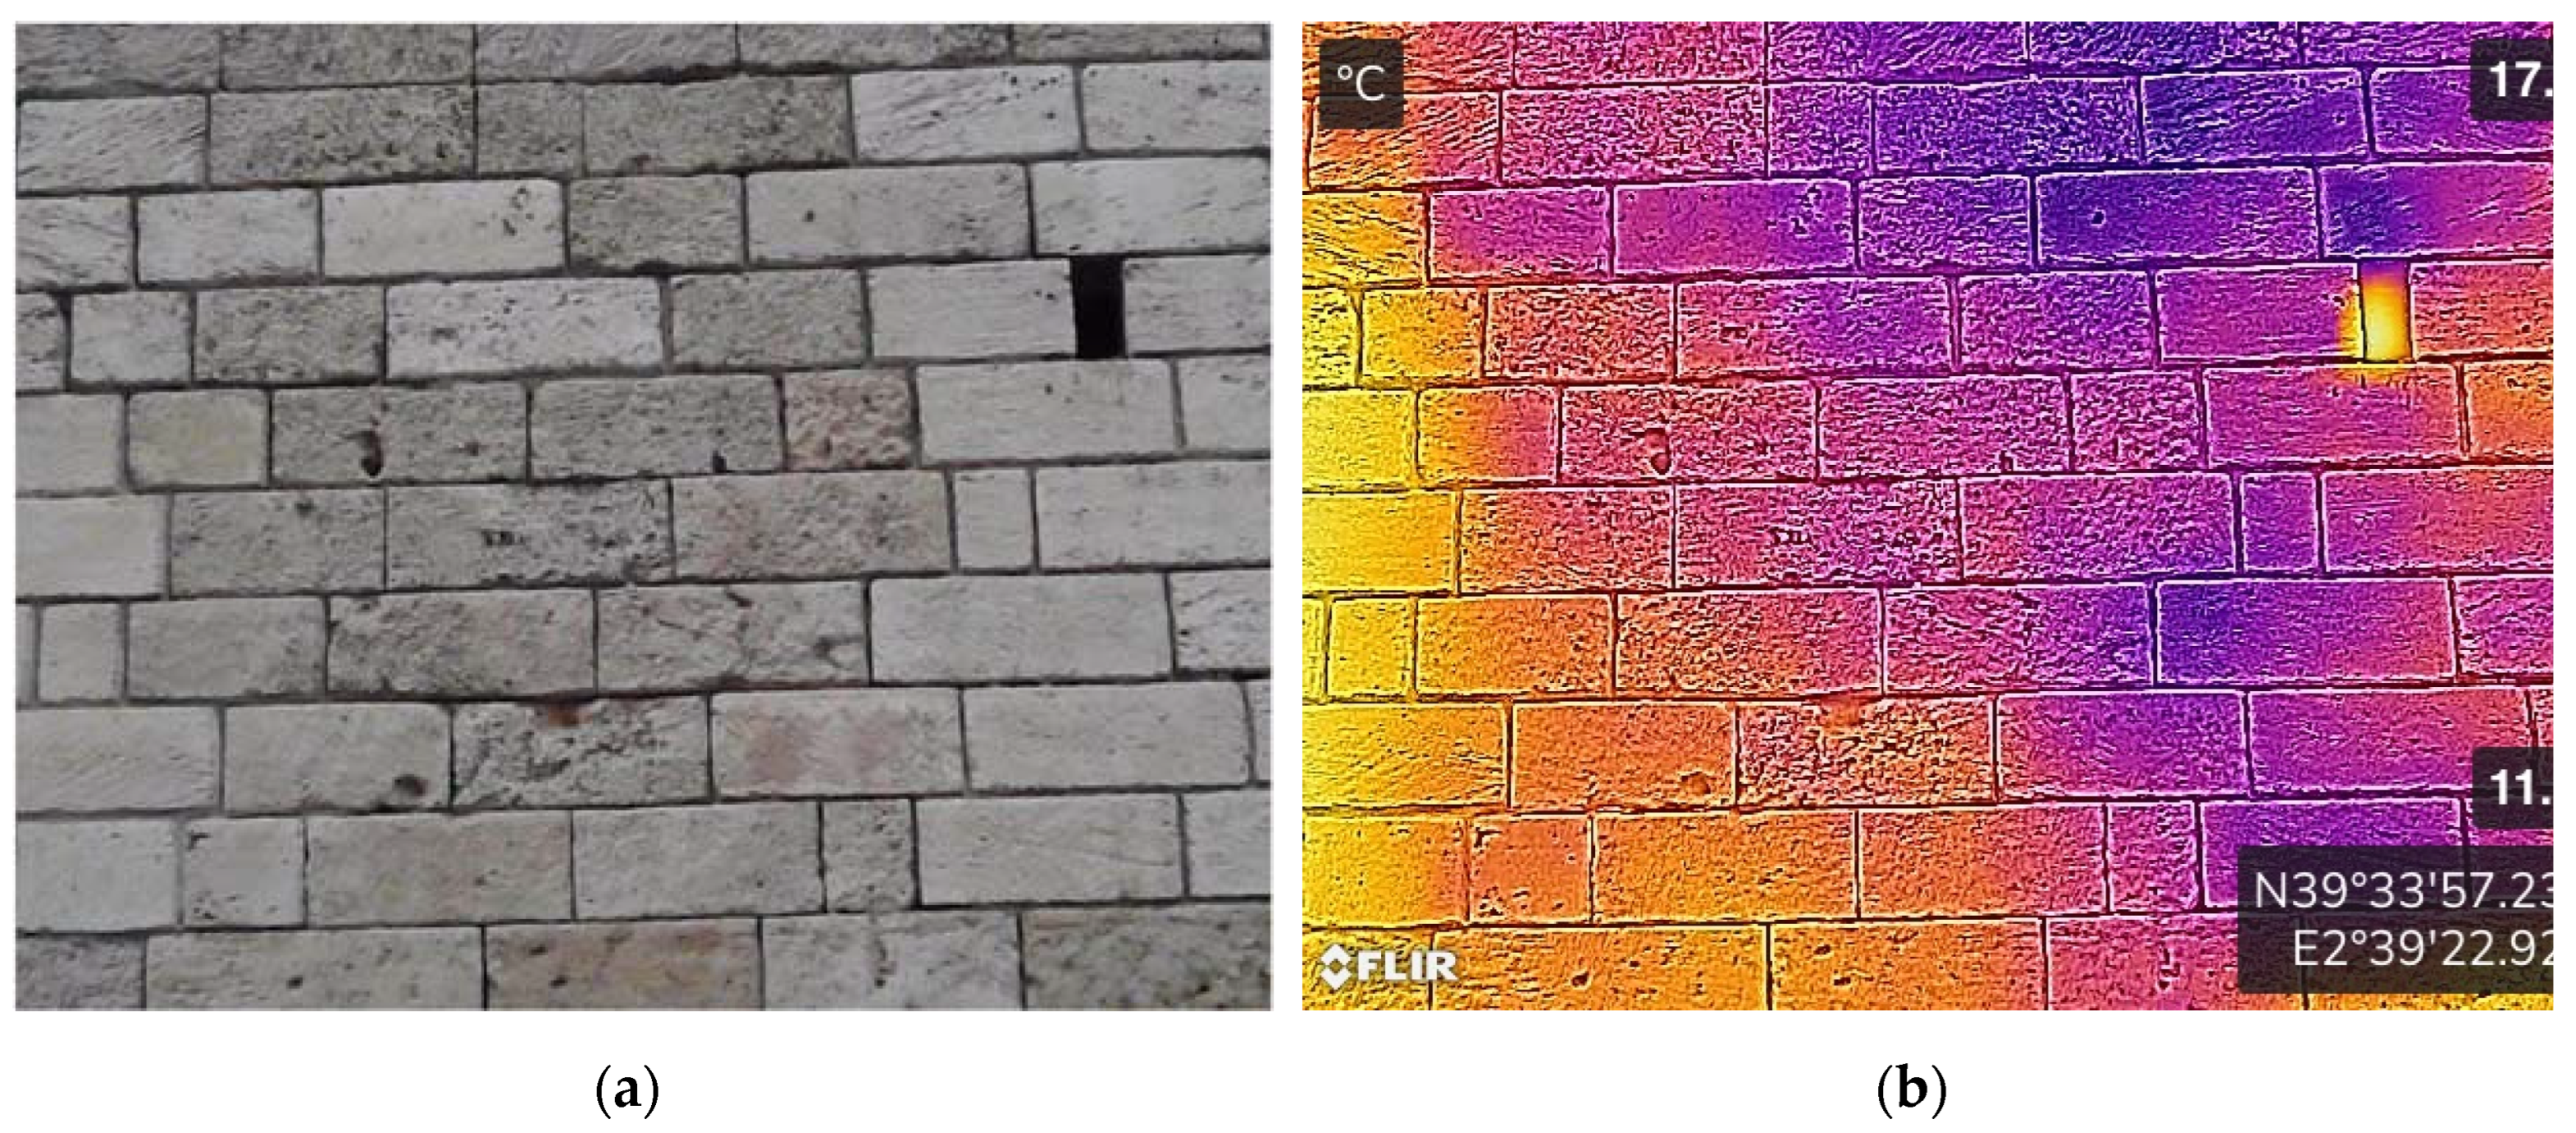
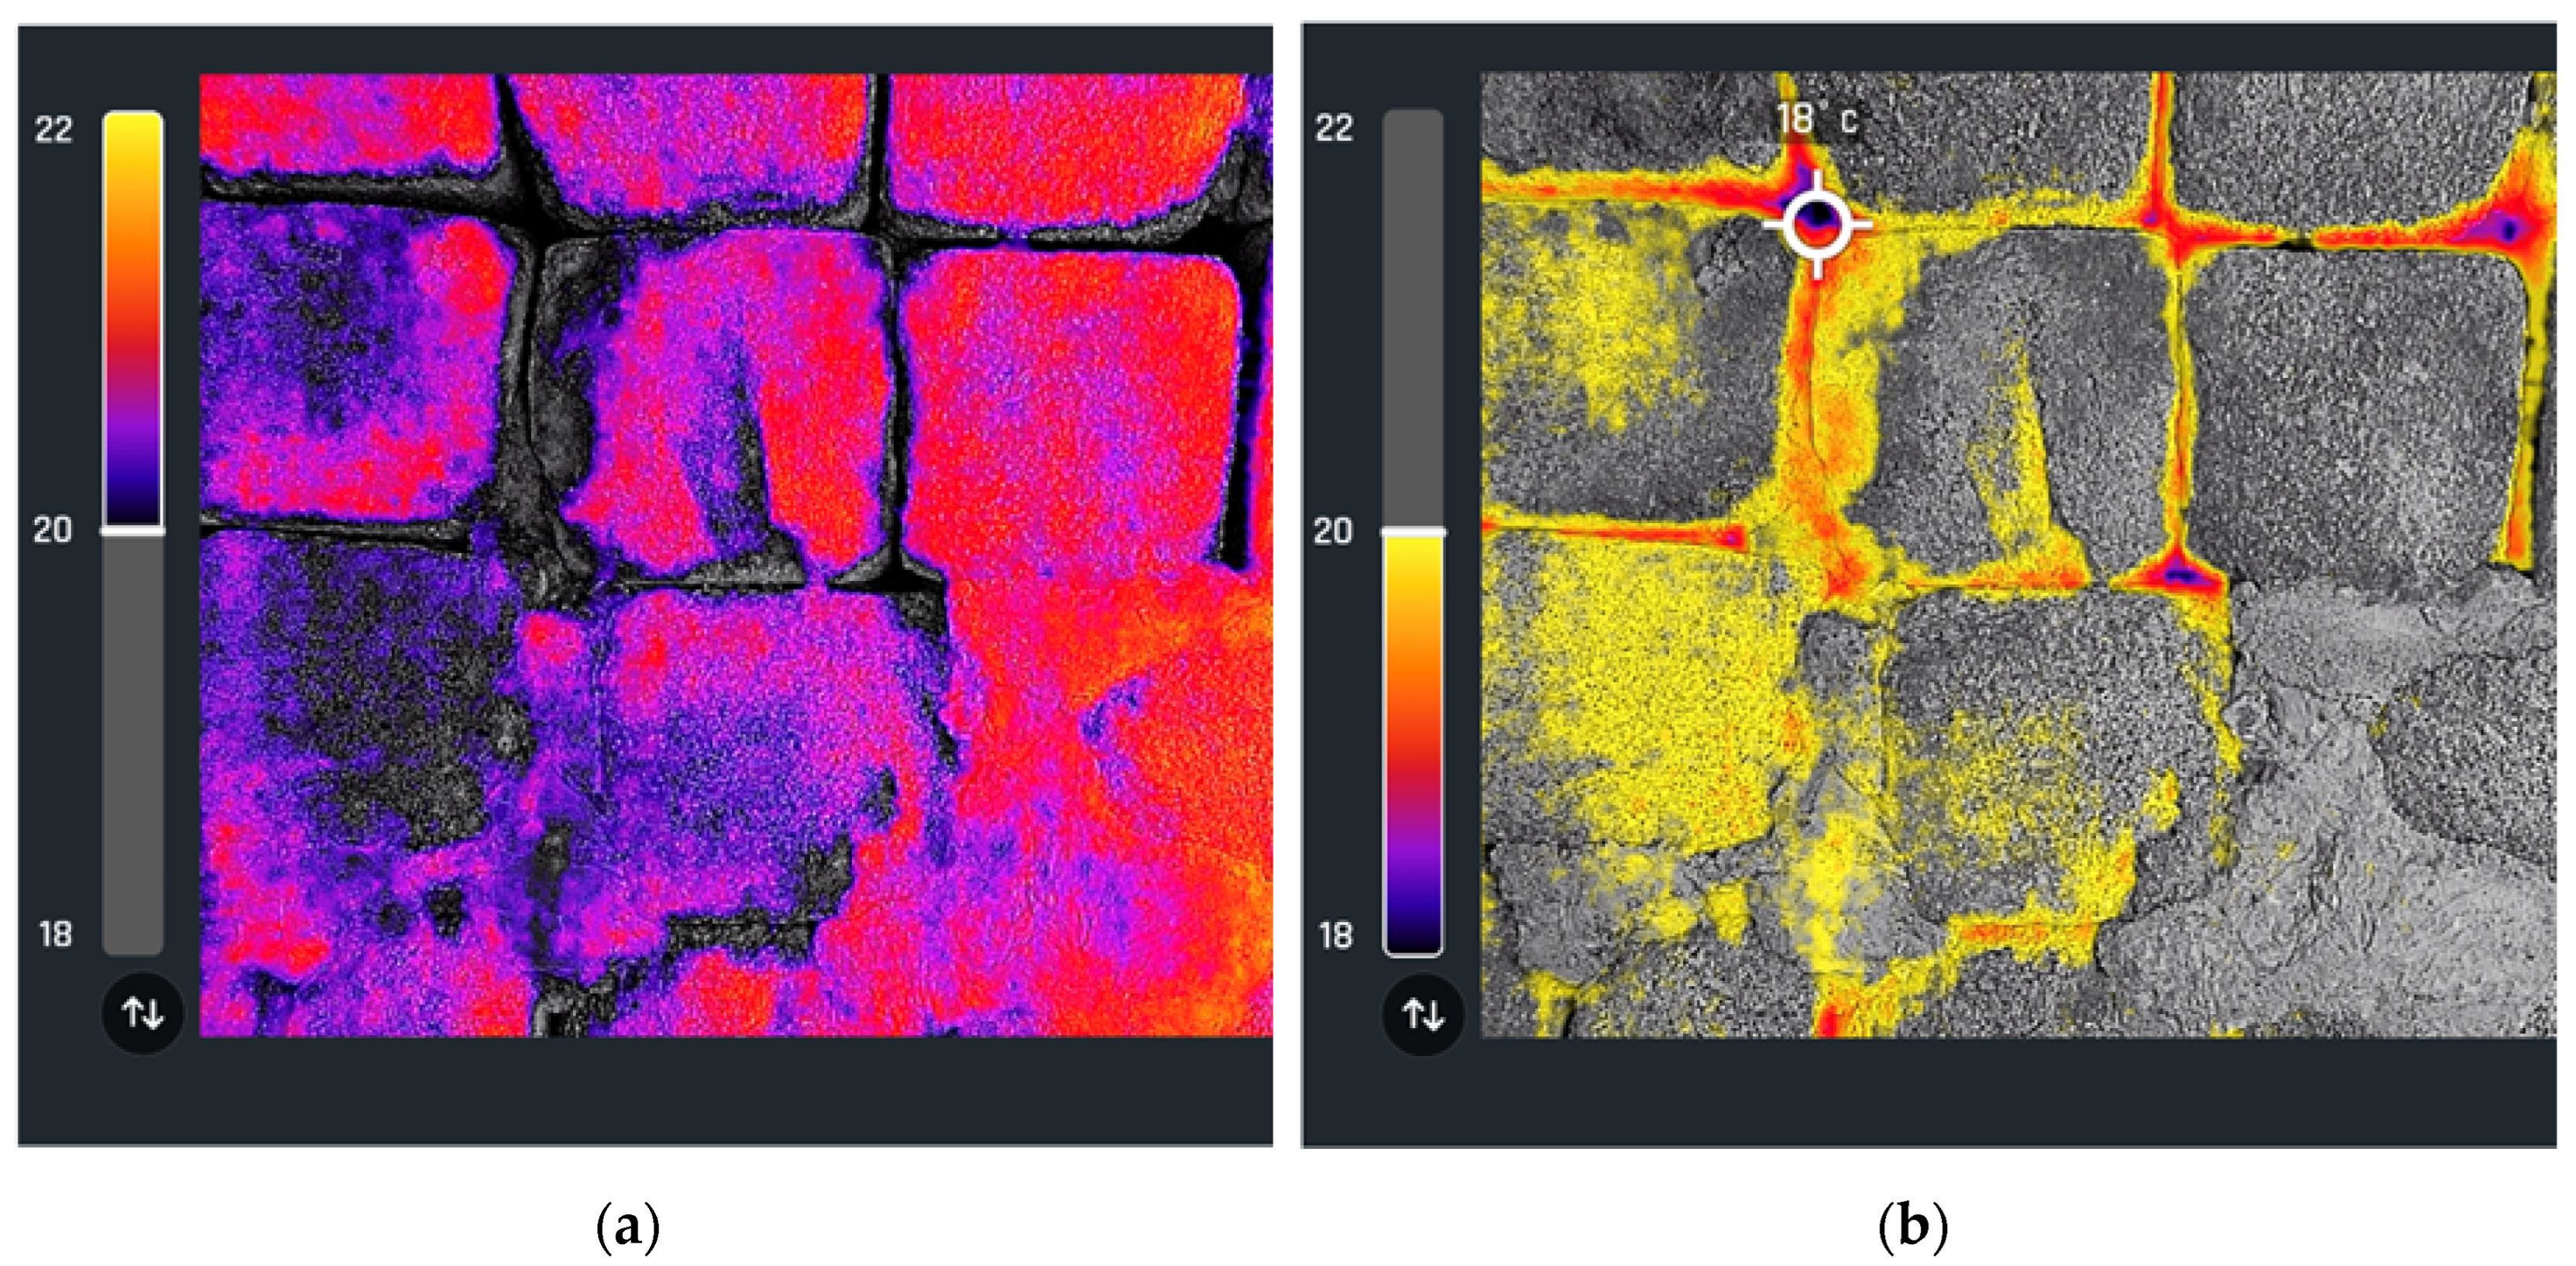
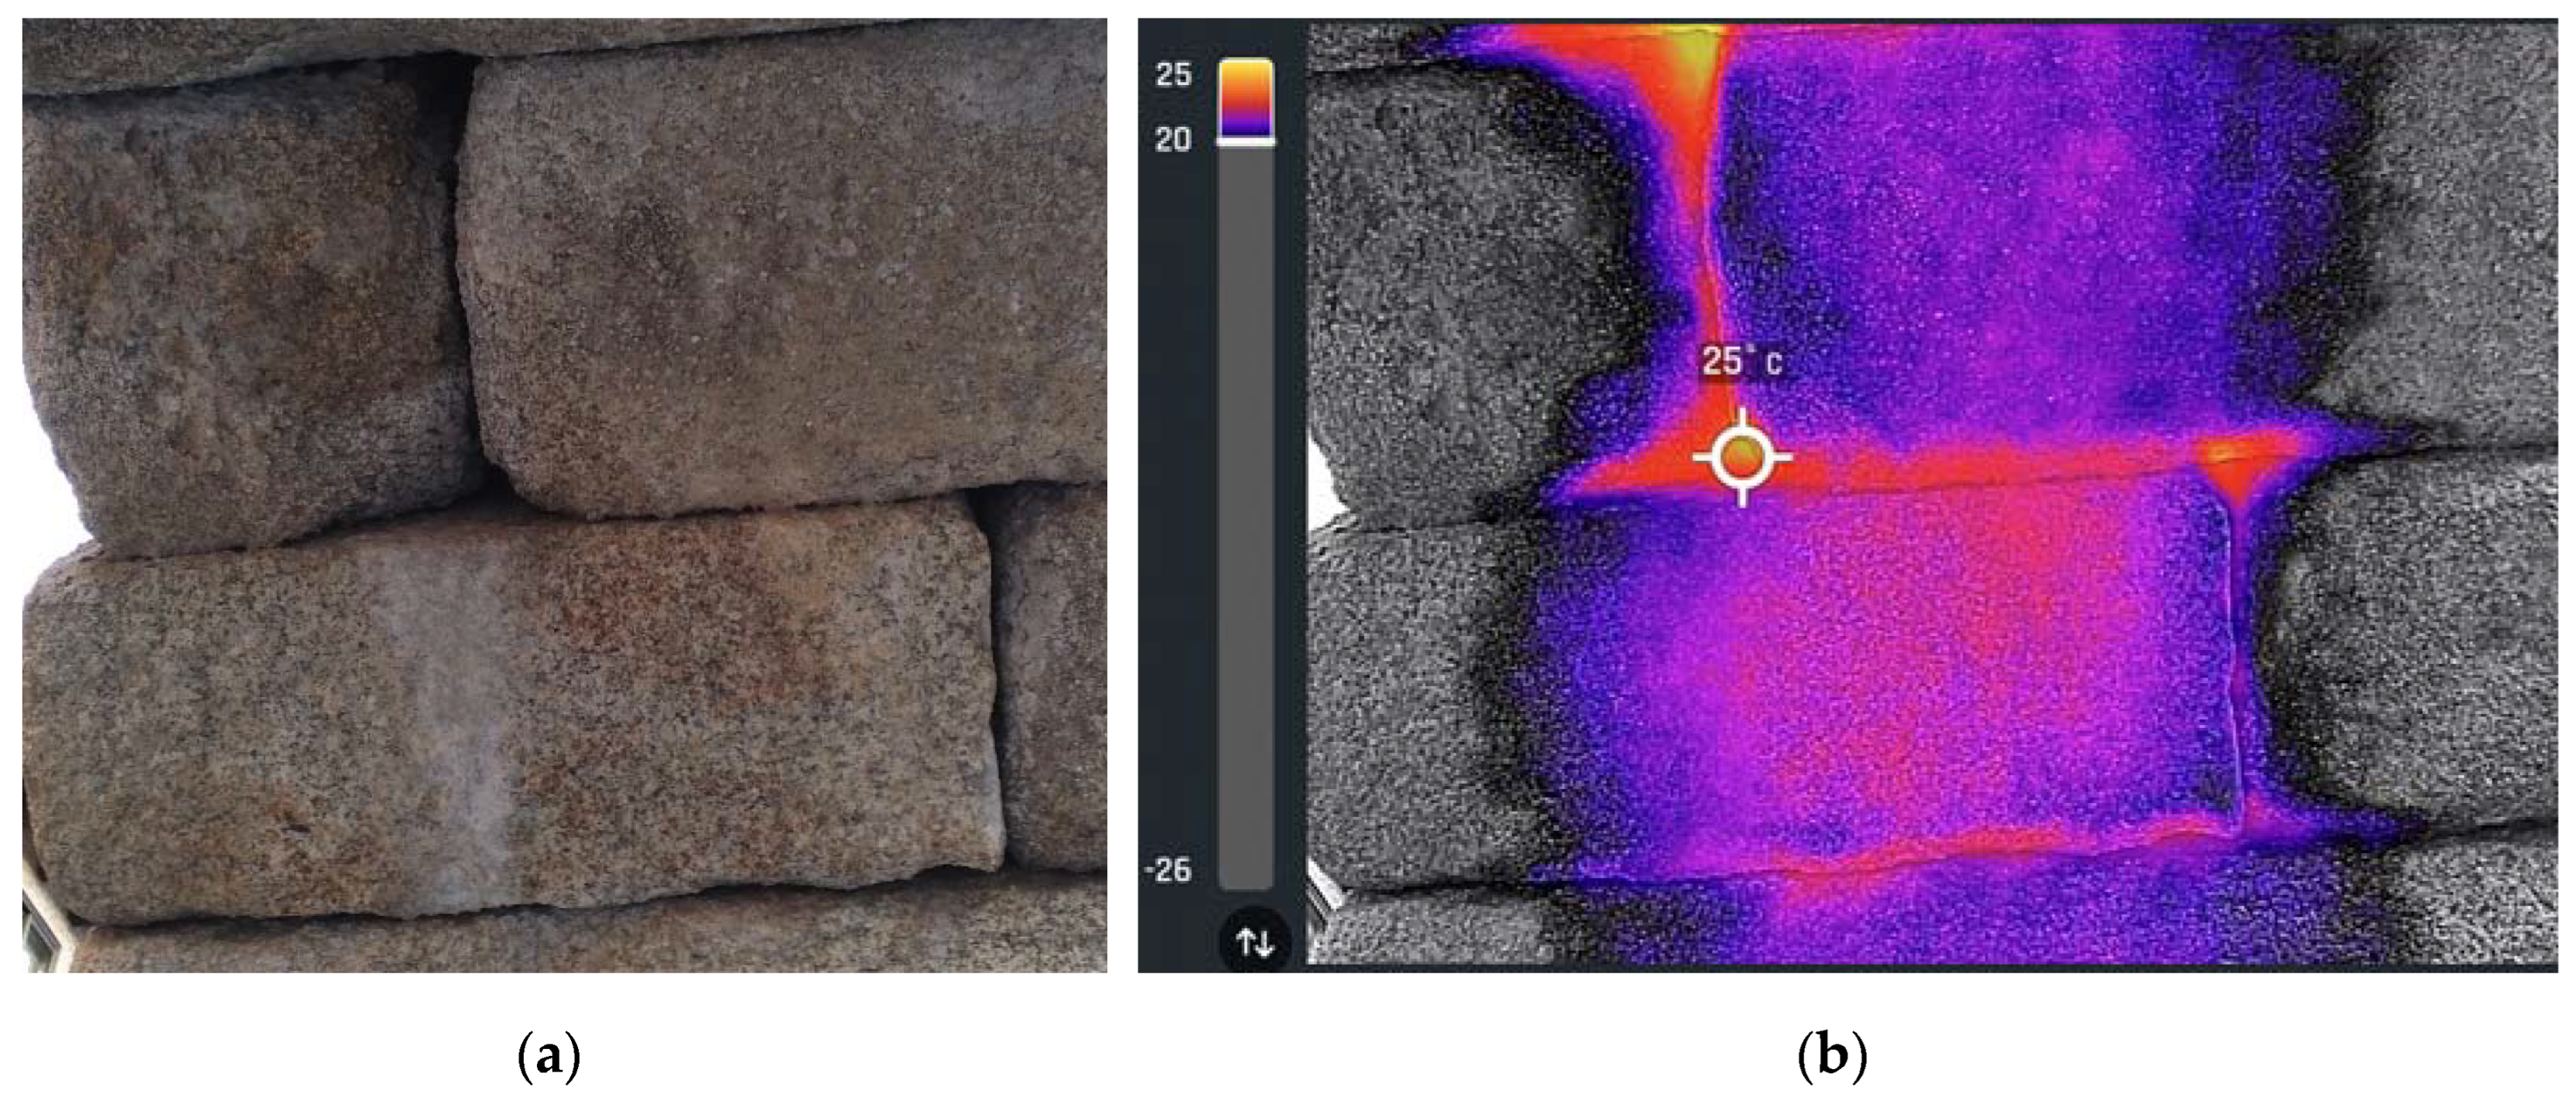
However, experience shows that the above observation cannot be extrapolated to all materials and situations: an example is the enclosure walls of Palma Cathedral (Mallorca, Spain). There, a camera is able to distinguish, by their chromatic and textural differentiation, the youngest ashlars of the Marés sandstone from the oldest ones (Figure 7 (a)), in which there are also signs of alveolisation [10]; however, in the thermogram this distinction is not so evident (Figure 7 (b)). The opposite case can be observed in the granite ashlars of the protective envelope of the Roman lighthouse of the Tower of Hercules [14], in which the differentiation is much more evident in the thermogram (Figure 8 (a)) than in the image captured by the photographic camera (Figure 8 (b)).
Figure 7.
Detail of the southern enclosure wall of the Cathedral of Palma de Mallorca: (a) image captured by a camera, where different ashlars of Marés can be seen; (b) thermogram on the photograph in Figure 7 (a), where the differentiation between the different ashlars is practically non-existent (photographs by the author).
Below, we can also see the lower part of the east façade of the Giralda, the tower that serves as a bell tower for the Cathedral of Seville. Despite its recent restoration [15], the problems of the constituent fabric (especially the brick) linked to moisture are still present, as can be seen with the naked eye in the image captured by a photographic camera (Figure 9 (a)). Analysing the same image captured by a thermographic camera, we can see even more clearly the areas of moisture in the perimeter wall. According to the functioning of thermography as an auscultation technique, it is logical to think that the damp areas must be warmer than the dry areas [16], due to evaporation loss, as shown here (Figure 9 (b)).
However, this is not always the case, as sometimes the thermal history can mask the signals that are truly useful for this purpose, as is the case with the example of the first courses of the bell tower of the Cathedral of Valencia, the Miguelete Tower (Figure 10 (a)). There, these first ashlars serve as a base: the unfortunate restoration actions, using unsuitable materials, result in different degrees of wetting, which the thermal imaging camera is able to capture (Figure 10 (b)).
3.2. Aerial Thermography
With thermal imaging cameras it is often not possible to adopt suitable positions to have the right point of view. However, drones, thanks to their versatility of movement and positioning, can position a camera at points of view that are difficult to access.
Due to the small size and low weight of current thermal imaging cameras, any multirotor drone is now capable of carrying a thermal camera. This is how aerial thermography was born: the combination of thermography and aerial piloting of the drone allows for obtaining specific information from a thermal camera from viewpoints that are very difficult to obtain manually. Thus, for example, for an adequate analysis of any thermal anomaly, it is recommended that the thermal imaging camera be positioned with a viewing angle of between 70° and 90°, measured with respect to the surface being analysed. If a manual camera were used, it would be very difficult to meet this condition; however, a drone with a thermal camera is able to meet this condition with ease (Figure 11).
The main limiting factor during the measurement of values is usually the hydrometeorological conditions, as they can significantly influence the accuracy of the measurement. It is advisable to carry out survey campaigns at dawn or dusk, as this is when it is easier to see the presence of heterogeneous zones, which will dissipate heat in different ways. At this time, the cameras can locate possible construction defects on the materials that make up the monument. The ideal conditions for measurement are an ambient temperature of 25°C, with a solar intensity of 1,000 Wm-2 and some clouds. In this case, the contrast will be high enough to reveal all the defects. Unfortunately, this is not always possible.
Any element with a surface temperature higher than absolute 0 (0 °K or –273.15 °C) emits electromagnetic energy that is located in the infrared range (0.75 μm – 100 μm). According to the Stefan – Boltzmann law [17], the emitted infrared radiation increases with the temperature acquired by the bodies. The Stefan – Boltzmann law [18,19] is applicable to black bodies, which are perfect emitters of infrared radiation; in other words, black bodies are bodies that have an emission capacity (ε) of practically 100%. In addition, bodies have emission capacity, so that, in addition to emitting infrared radiation, they reflect a part of the incident infrared radiation. Therefore, if we consider that W is the emitted radiation expressed in W m-2, T the absolute temperature expressed in ºK and σ the Stefan – Boltzmann constant (5.67 10-8 W m -2 K-4) the total infrared radiation that a thermal imaging camera detects will be the sum of:
- the radiation emitted by the observed object:
- and the radiation reflected by the observed object:
always considering that the absorption of infrared radiation by the air mass existing between the object studied and the camera sensor is not significant (when the existing distance is a few meters or the infrared sensor works in the range of 3 – 5 or 7 – 14 μm, where the transitivity of the atmosphere to infrared is maximum).
When there is a greater distance between the object and the camera, as is often the case in aerial thermography, we need to consider the atmospheric emission (Watm) and the transmissivity of the atmosphere to radiation:
Nowadays, most thermal imaging camera software includes these corrections by default, which allows for more accurate temperature measurements of the observed objects. However, the values for emissivity, relative humidity and air temperature, the distance to the object and the temperature reflected by the surrounding environment must be entered. This parameter can be estimated by measuring the temperature reflected by an irregular piece of aluminium foil placed between the camera and the object to be measured, using the maximum emissivity value (ε = 100%).
4. Examples of Experimental Inspections with Aerial Thermography
The examples presented in section 3.1 demonstrated the suitability of using thermography as a complement to visual inspection, although all of them corresponded to terrestrial, not aerial, thermography. For this reason, the inspections carried out on three important monuments will now be analysed, in order to more rigorously substantiate the conclusions of this article. As all three are large monuments, only certain singular points of them have been inspected for experimental purposes, using a quadcopter drone (Figure 1 and Figure 12), Parrot Anafi model, which incorporated a thermographic camera that could oscillate vertically on its own axis, allowing greater adjustment for the arrangement of the viewing angle between 70° and 90° with respect to the surface to be analysed.
4.1. Alcántara Bridge
The Alcántara Bridge was subjected to a visual inspection two years ago [1]. At that time, the emphasis was placed on the two-thousand-year-old character of this prodigious work, to justify the many things that could be said about this monument of six arches of unequal height supported by five pillars that rise at different levels. This monument has been partially destroyed and rebuilt on several occasions, some of which are documented [18]. In addition, it is one of the oldest and best-preserved bridges, which also continues to fulfil its function of supporting road traffic to cross the river.
The main deficiencies diagnosed were linked to the use of lime mortar in previous restoration works [21], to fill the joints between ashlars (Figure 13). It is interesting to observe, in the analysis of the thermograms, the difference in temperature that can be observed between the ashlars and the mortar of the joints: while the most exposed faces of the ashlars register the lowest temperatures (Figure 14 (b)), the mortar joints register the highest temperatures (Figure 14 (a)), and only the remains of runoff water on the ashlars allow them to reach a temperature similar to that registered by the mortar joints.
This value reached by the runoff water mark, together with the vegetation that has taken root in some deteriorated joints (Figure 13) and the temperature record that locates the thermogram on the rooted plant (Figure 14 (a)), leaves no doubt that moisture is the fundamental cause of this thermal difference.
Also linked to moisture is the slight proliferation of efflorescence that was diagnosed during the visual inspection carried out months ago on the intrados of the vaults (Figure 15). Indeed, efflorescence usually appears around areas where there is a high concentration of moisture.
As this is a bridge spanning a river with considerable flow, it is in a location with high moisture. Thermographic analysis of the intrados of the vaults allowed us to confirm this, although it was important to bear in mind the differential effect that this implies, for the establishment of maximum (Figure 16 (a)) and minimum (Figure 16 (b)) temperature values, since the upstream side is elevated east (east side), while the downstream side is elevated west (west side).
4.2. Aqueduct of Segovia
Few works of Roman engineering can boast the beauty, importance and excellent preservation of the Segovia Aqueduct. The 813-metre-long stretch of granite ashlars that cross the capital of Segovia, forming a total of 79 single and 44 double arches, are only a few years younger than the Alcántara Bridge [22].
As the purpose of the aircraft flight was experimental, the area chosen to carry out the inspection was not the most representative area of the monument (Plaza del Azoguejo, Plaza Oriental and surroundings), given the high capacity that usually exists in that area and how complicated it would be to legally carry out a flight in those conditions. For this reason, the flight was carried out along Calle Almira, in the section before Plaza de Día Sanz, which is where the two-story alignment begins; therefore, work was done on an area where the Aqueduct is only made up of single arches.
For the thermographic auscultation, the observations made in the visual inspection a few months before were taken into account, as well as the information obtained by the thermograms in the thermographic auscultation of the Alcántara Bridge. Fortunately, here we have a construction of large granite ashlars, practically lacking mortar in its joints [23]. This, together with the absence of a river (therefore, less moisture), makes the location of an efflorescence less probable (Figure 17 (a)) but, when found, it can be much more worrying. Once again, the thermogram showed a coincidental observation: the joints show the maximum temperature values, this value being especially high in the joints between ashlars where, precisely because of the absence of mortar, cavities are recorded (Figure 17 (b)). However, it should be noted that the exteriorization of the efflorescence is not recorded on the thermogram.
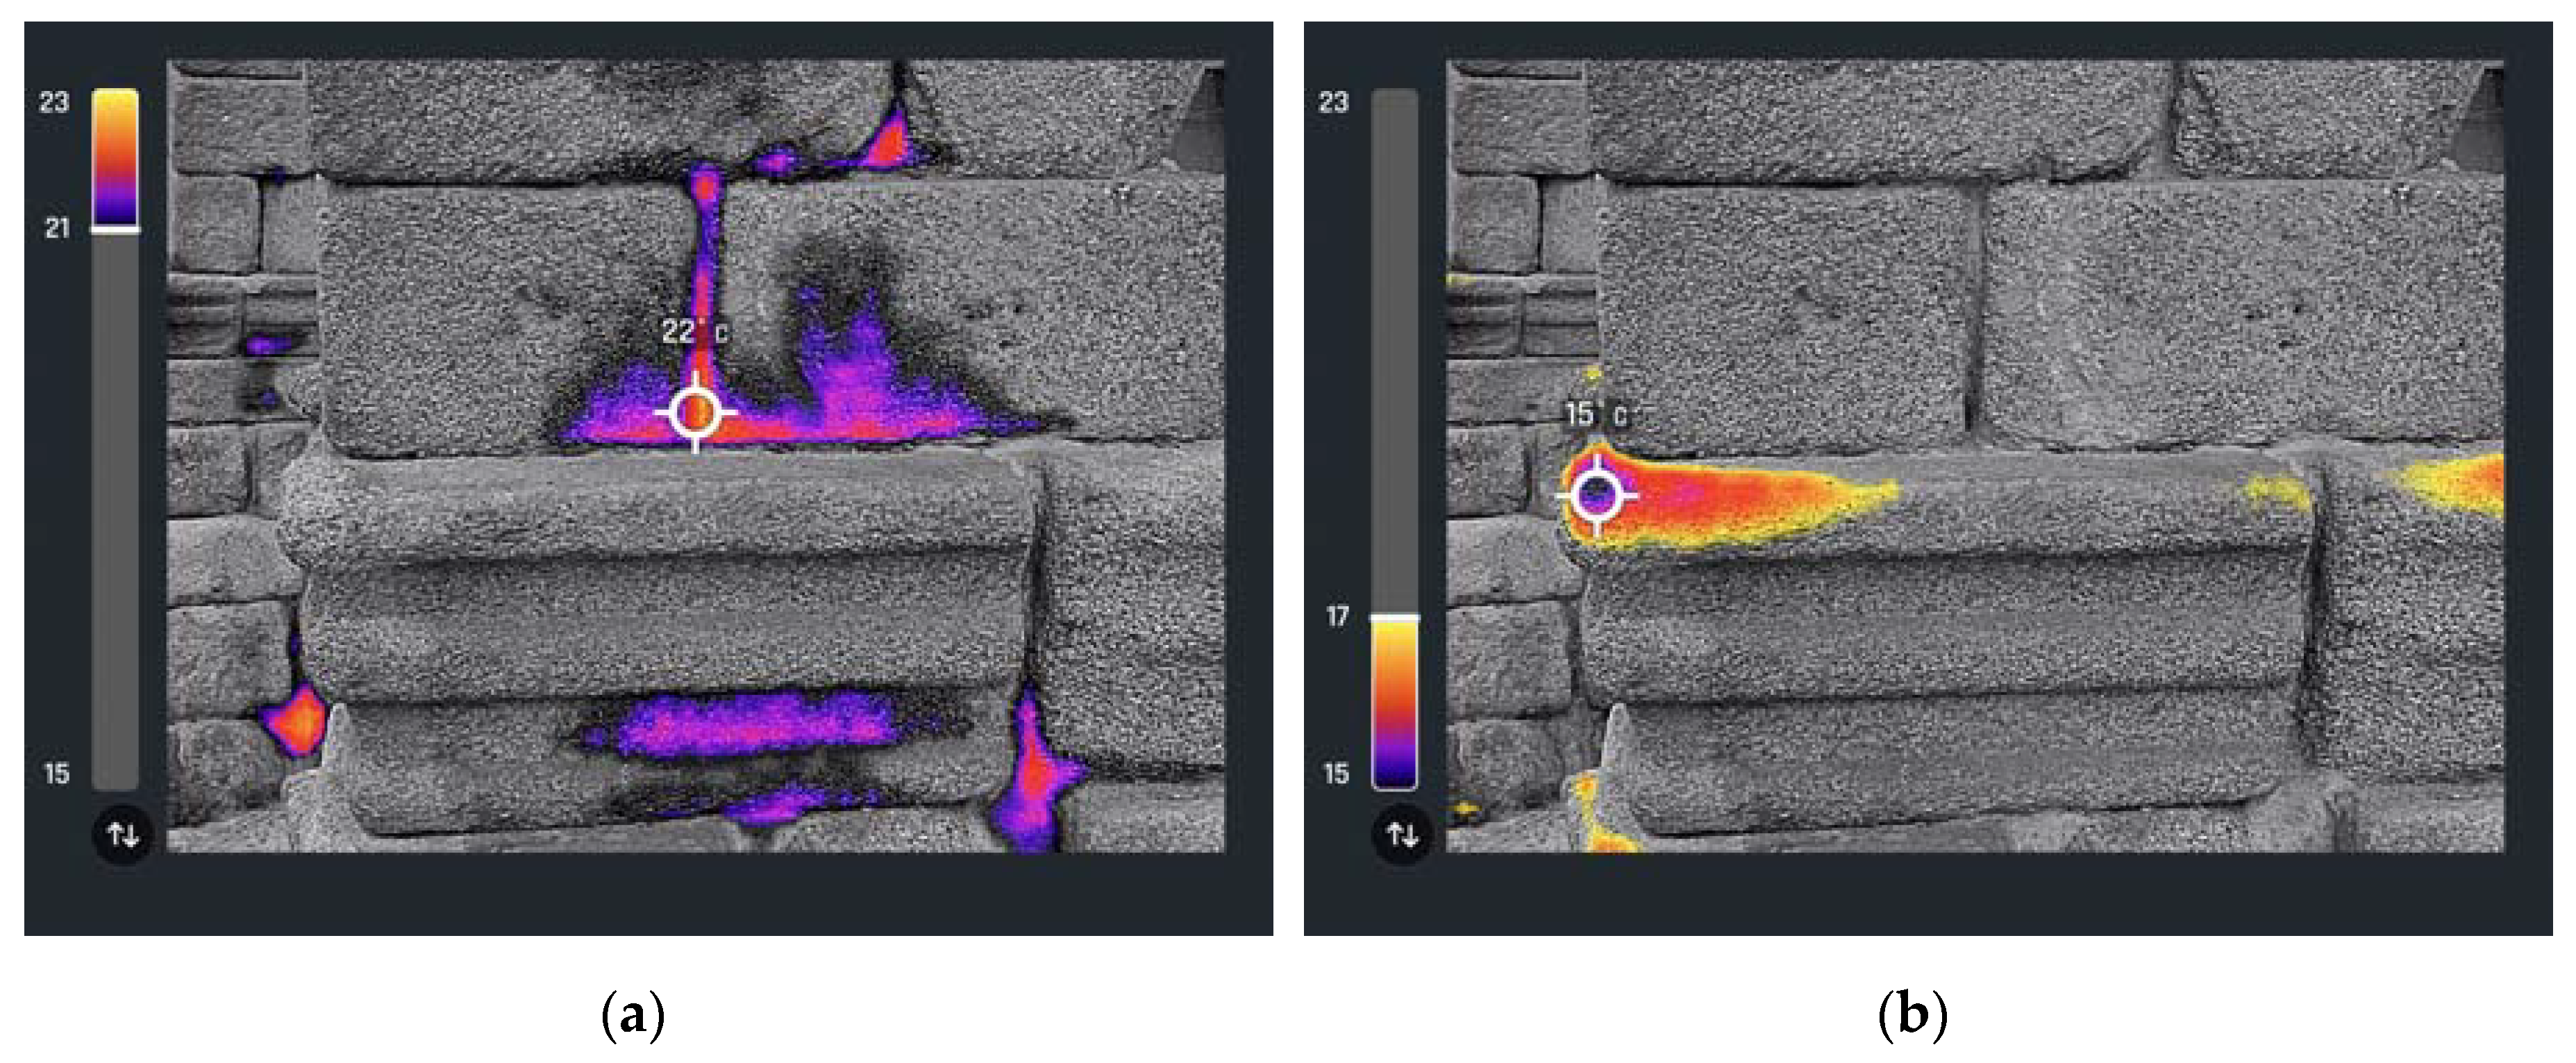
Regardless of the observation of other possible efflorescences in similar points, the usual pattern of the seven arches examined confirmed the above: the maximum temperature values are always recorded in the joints between the voussoirs or the ashlars (Figure 25 and Figure 26). As occurred in the Alcántara Bridge, the minimum values are recorded on the most exposed exterior face of the ashlars (Figure 28 and Figure 30), while the joints always show the maximum temperature inside (Figure 27 and Figure 29). The cause, once again, is related to moisture.
Figure 18.
Location of the maximum temperature values between the interior ashlars of an arcade of the Aqueduct, at two different points (photographs by the author).
Figure 18.
Location of the maximum temperature values between the interior ashlars of an arcade of the Aqueduct, at two different points (photographs by the author).
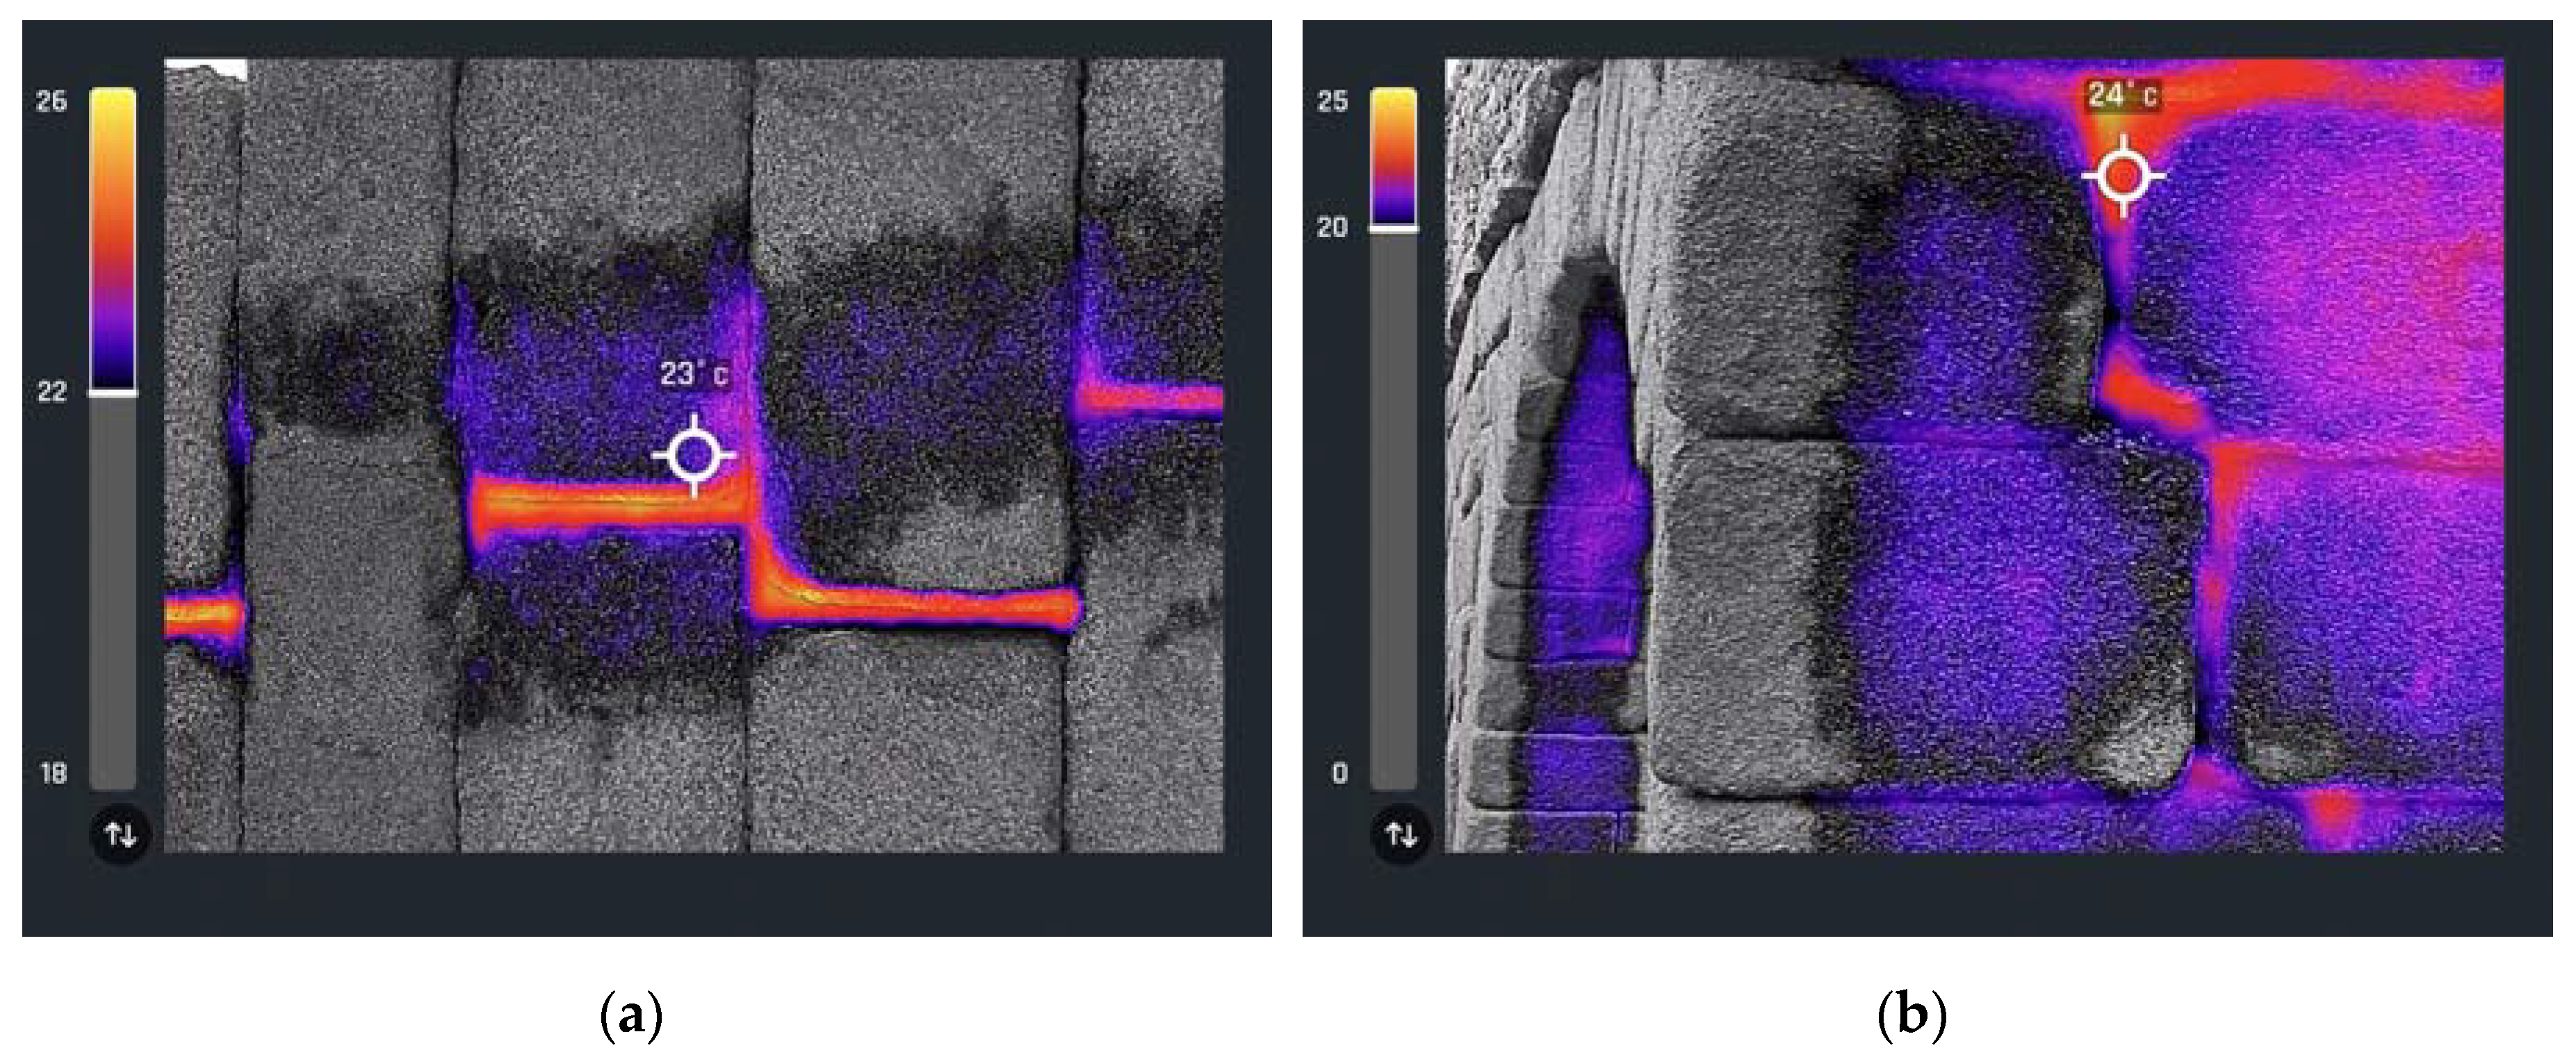
Figure 19.
Location of extreme temperature values between the interior ashlars of an arch: (a) maximum values and (b) minimum values (photographs by the author).
Figure 19.
Location of extreme temperature values between the interior ashlars of an arch: (a) maximum values and (b) minimum values (photographs by the author).
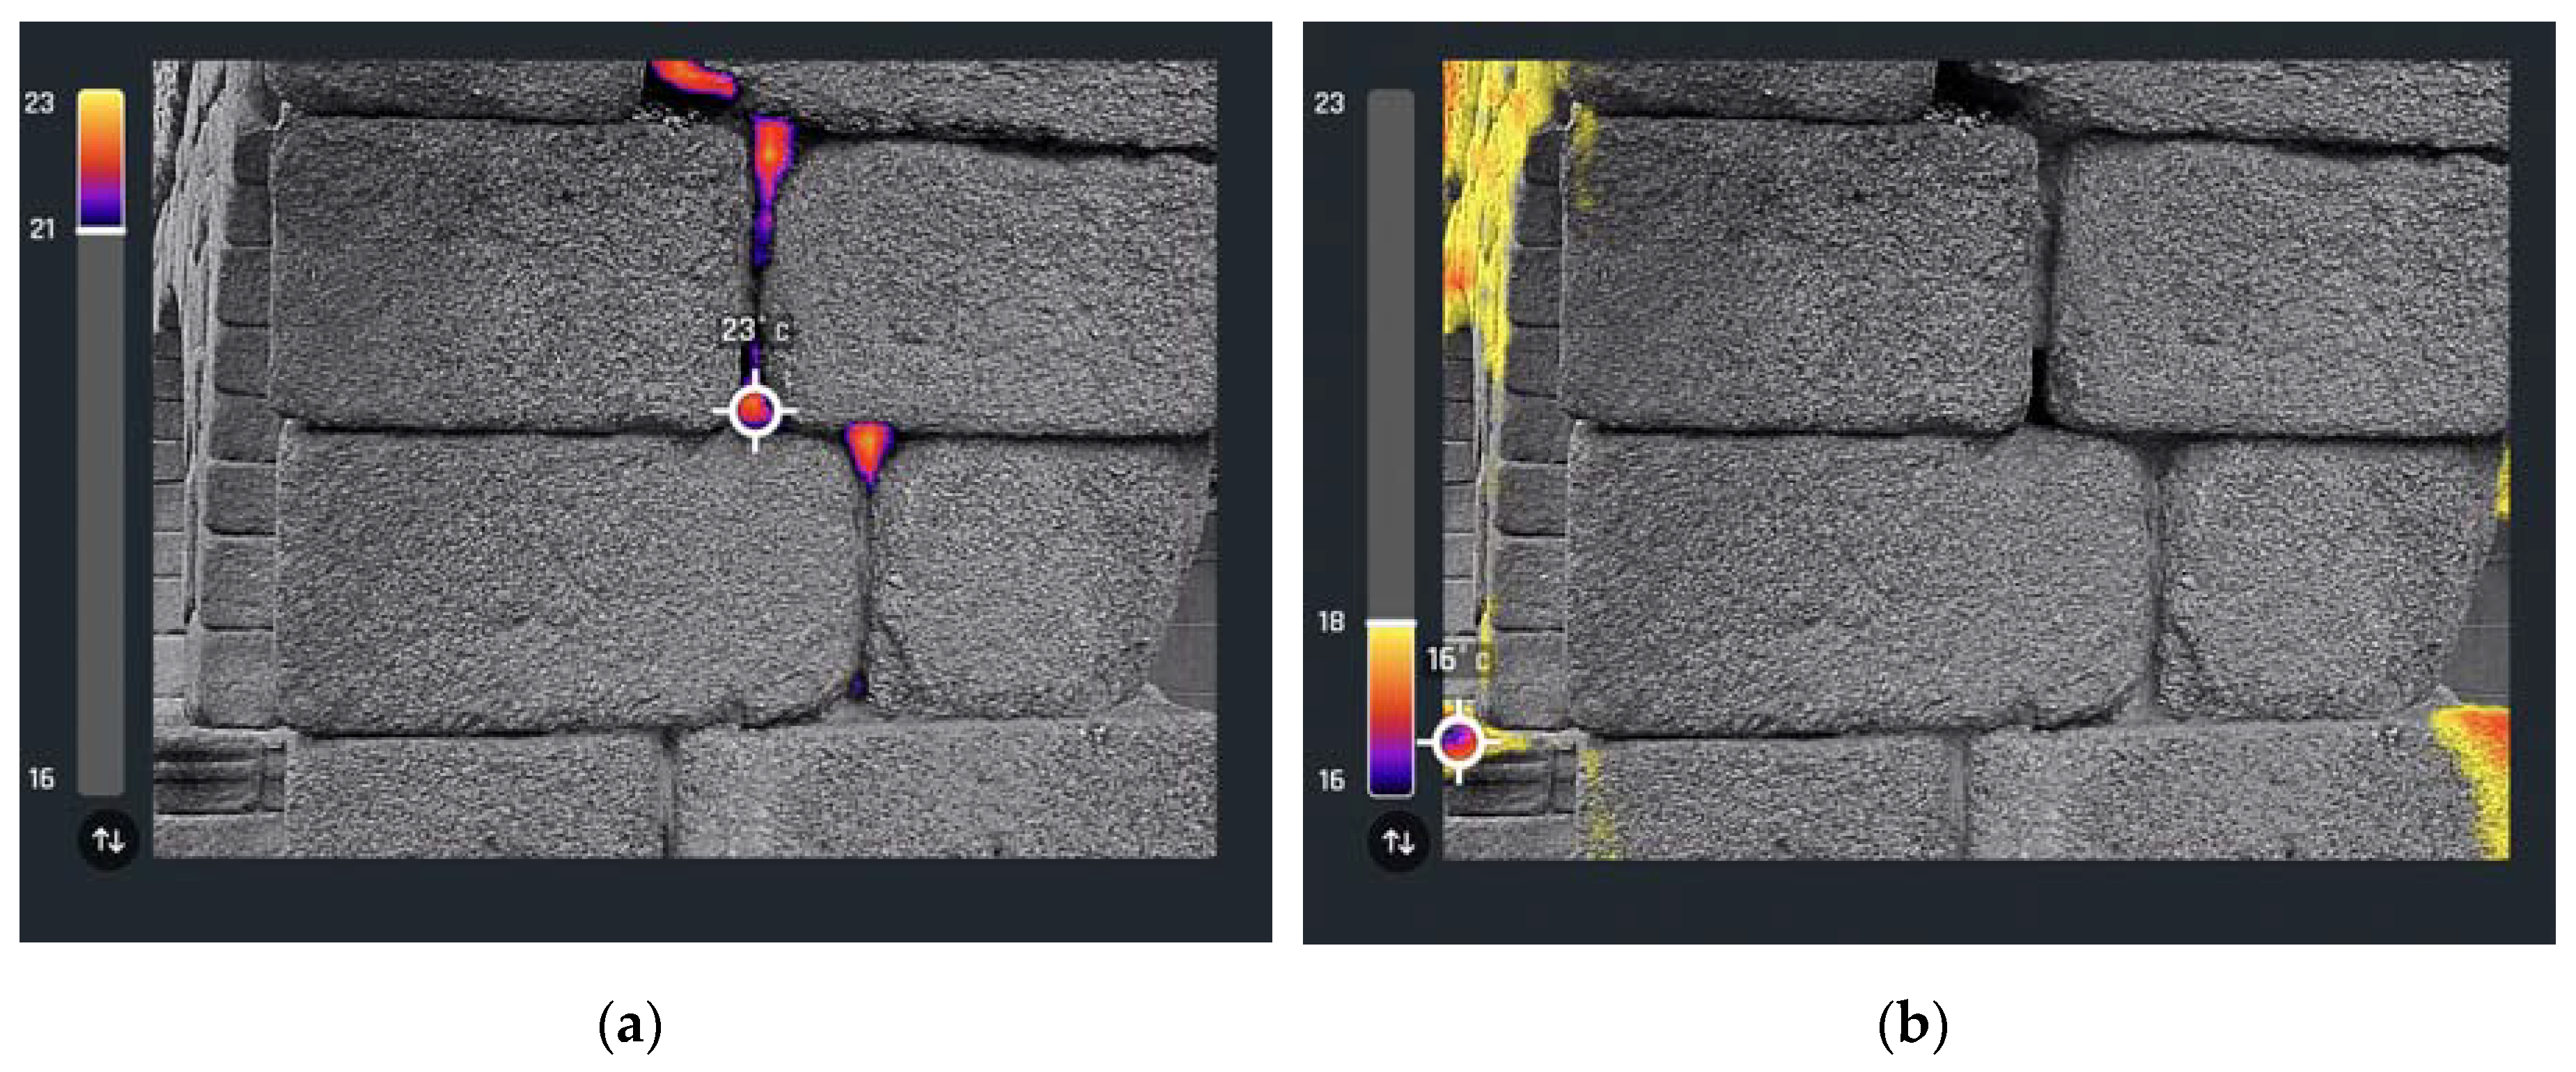
Figure 20.
Location of extreme temperature values between the inner ashlars of a starting support: (a) maximum values and (b) minimum values (photographs by the author).
Figure 20.
Location of extreme temperature values between the inner ashlars of a starting support: (a) maximum values and (b) minimum values (photographs by the author).
4.3. Alconétar Bridge
The Alconétar Bridge is not in its original location but was moved so that it could be preserved [24]. The most interesting thing about it, without a doubt, is the characteristic Roman dry-set ashlar masonry, lacking mortar, with the bare blocks joined by friction. In the previous the visual inspection [1], the most noteworthy thing was the two initial vaults, not only because they are originally Roman [21,24], but because, given how low they are, it is difficult for workers to access their interior, highlighting the value of drones for observation. In addition, the drone allowed the analysis of the elements that made up the intrados of these vaults, which are made of granite. The vaults were made up of dry-set ashlars and voussoirs, highlighting the rounding of their vertices, so characteristic of the alteration of granite [10]. In addition, along with the alteration of the granite, remains of cement mortar were discovered, arranged randomly, as a result of some unfortunate one-off intervention in times past.
On this occasion, it was also decided that the drone would enter those first two vaults (Figure 21) and, once inside, proceed to the reconnaissance analysis of the intrados. Obviously, the photographic camera corroborated the observations made in the previous inspection (Figure 34), but the thermal camera provided a very interesting result: as in the other two monuments analysed, the thermograms of the interior of the vaults also found extreme temperature values in the joints between ashlars and on the outer face of the ashlars. However, here the location of the maximum and minimum values was reversed with respect to the other two monuments: while in the Alcántara Bridge and in the Segovia Aqueduct the maximum values were recorded in the joints between ashlars, in Alconétar the minimum values were recorded in the joints between voussoirs (Figure 36). Similarly, contrary to the two earlier inspections, in Alconétar the maximum temperature values were recorded on the outer face of the ashlars (Figure 35).
Figure 21.
Quadcopter drone with thermal imaging camera used in the inspection, entering the first vault for the inspection of its intrados (photograph by the author).
Figure 21.
Quadcopter drone with thermal imaging camera used in the inspection, entering the first vault for the inspection of its intrados (photograph by the author).
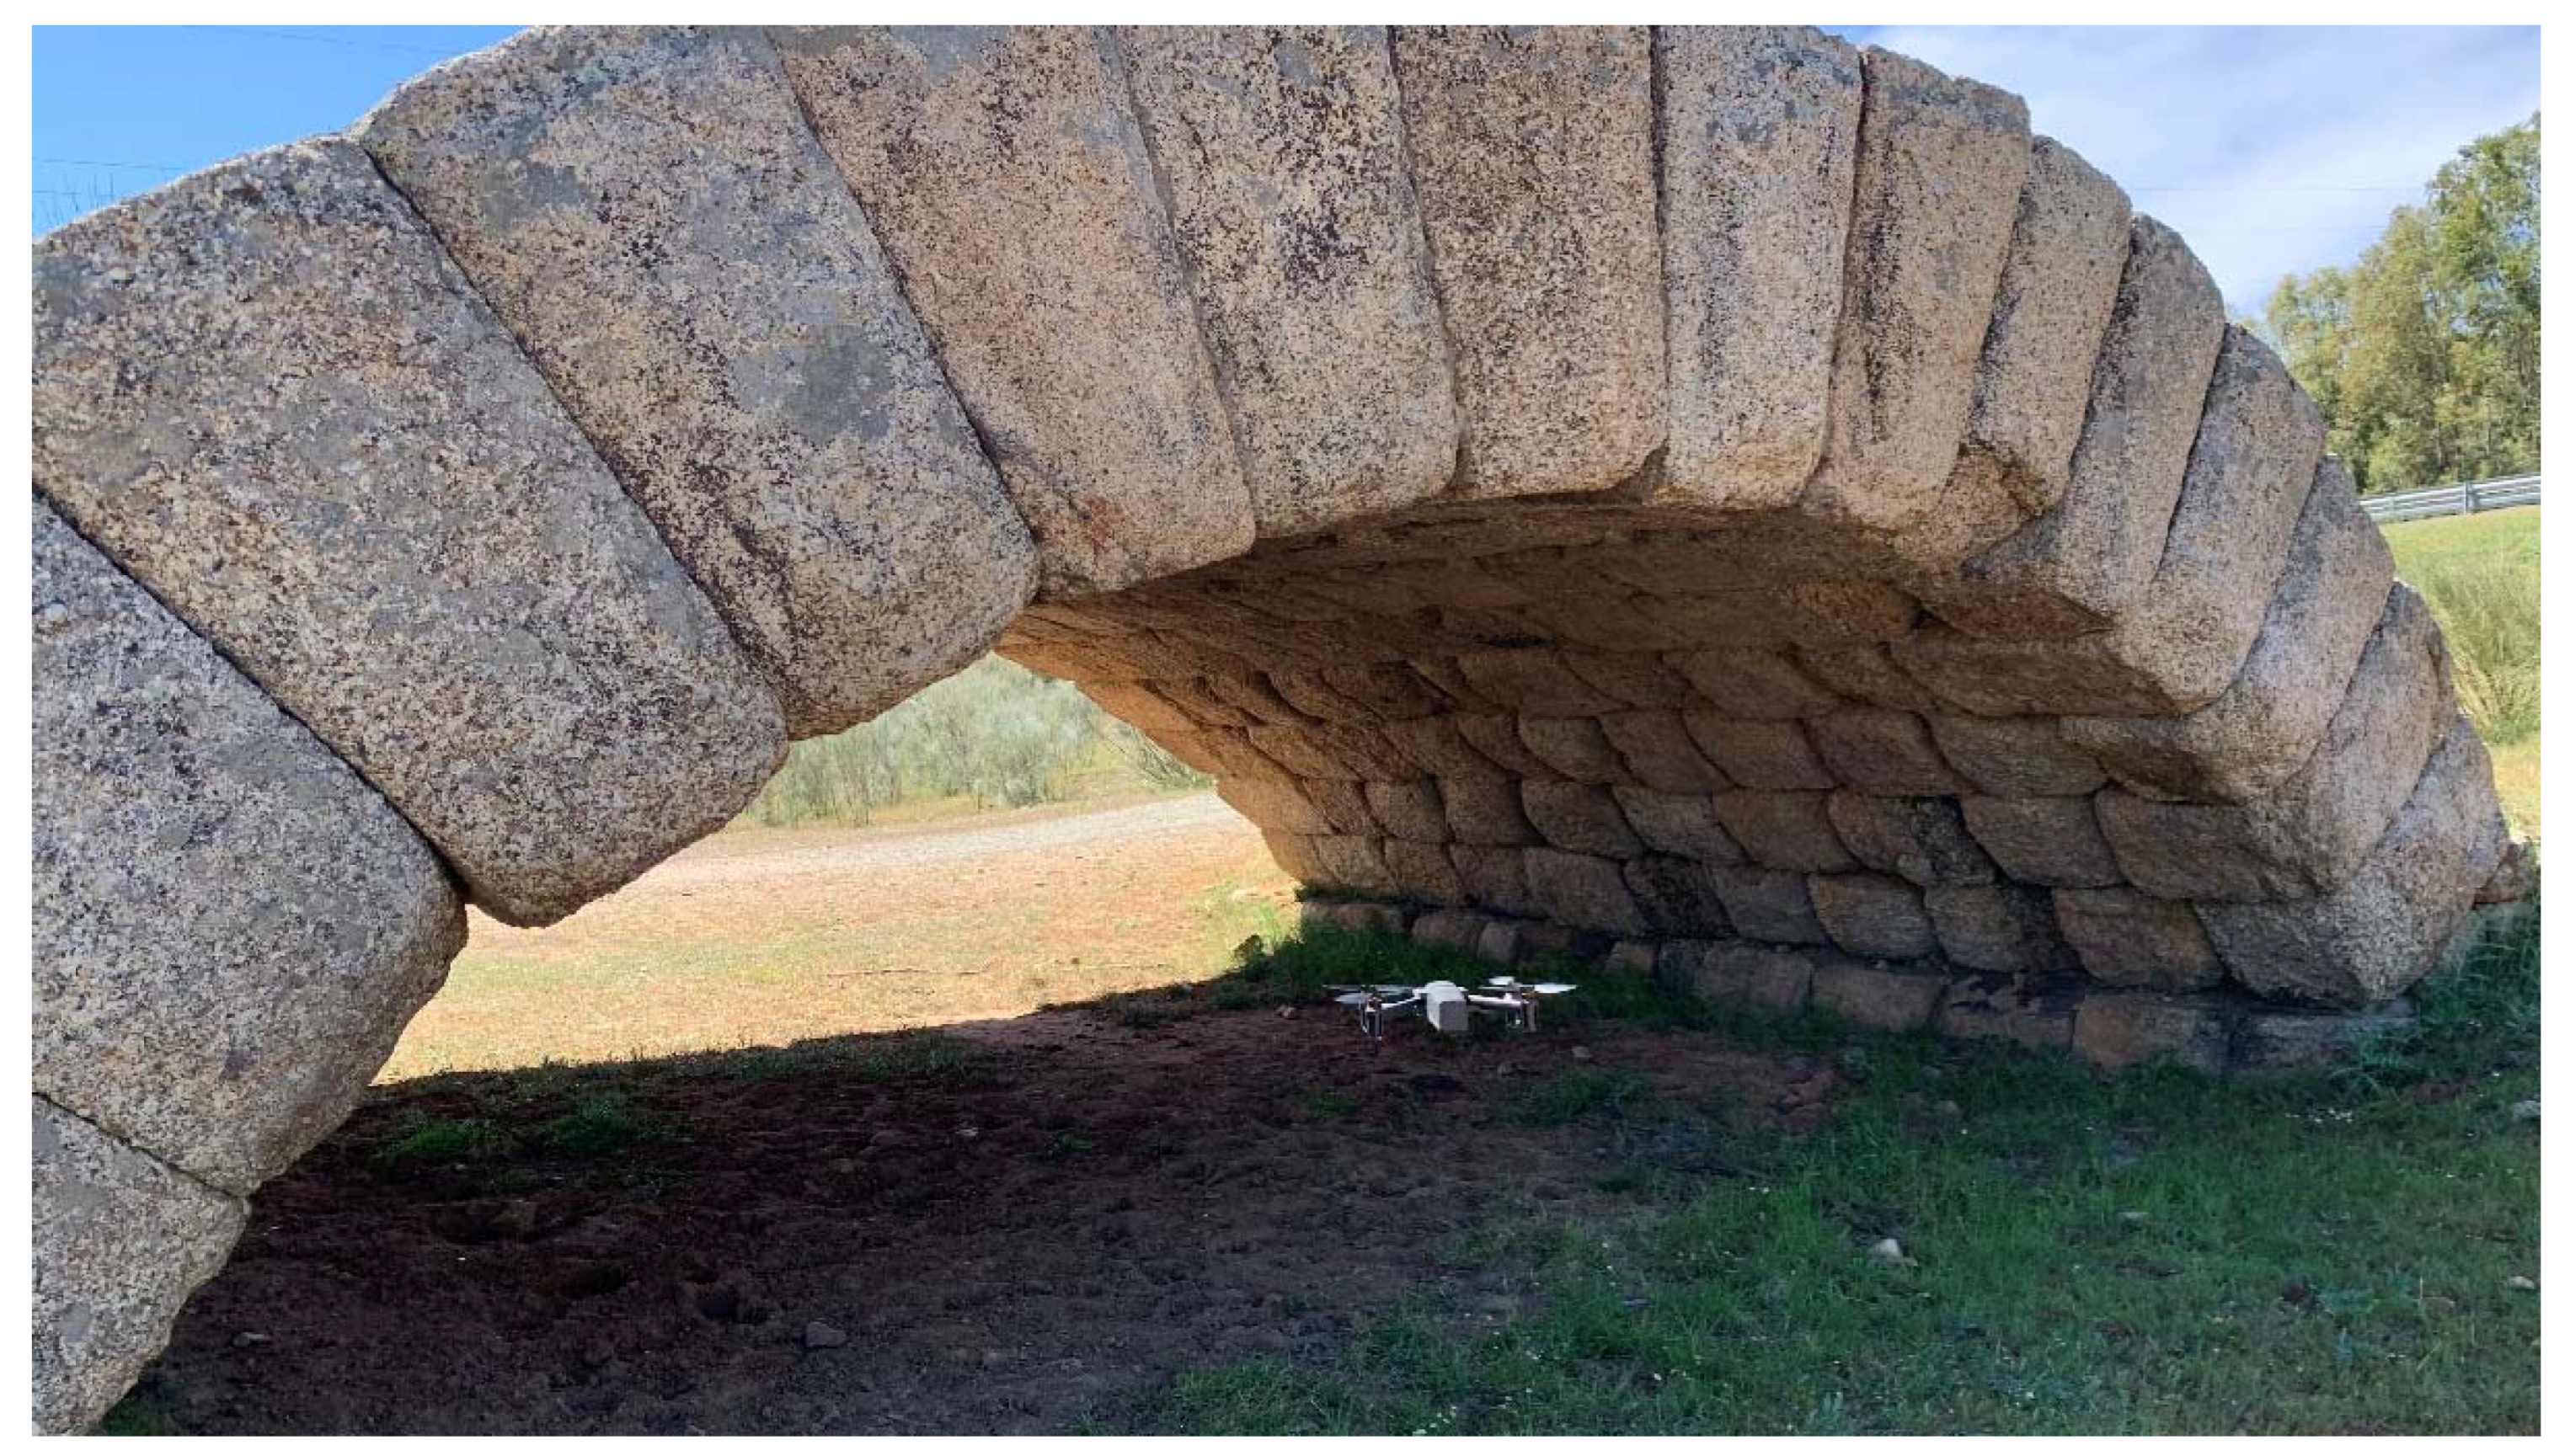
Figure 22.
View of the intrados of the first lowered vault, in a photographic image taken with the drone, where altered granite elements and remains of cement mortar were found (photograph by the author).
Figure 22.
View of the intrados of the first lowered vault, in a photographic image taken with the drone, where altered granite elements and remains of cement mortar were found (photograph by the author).
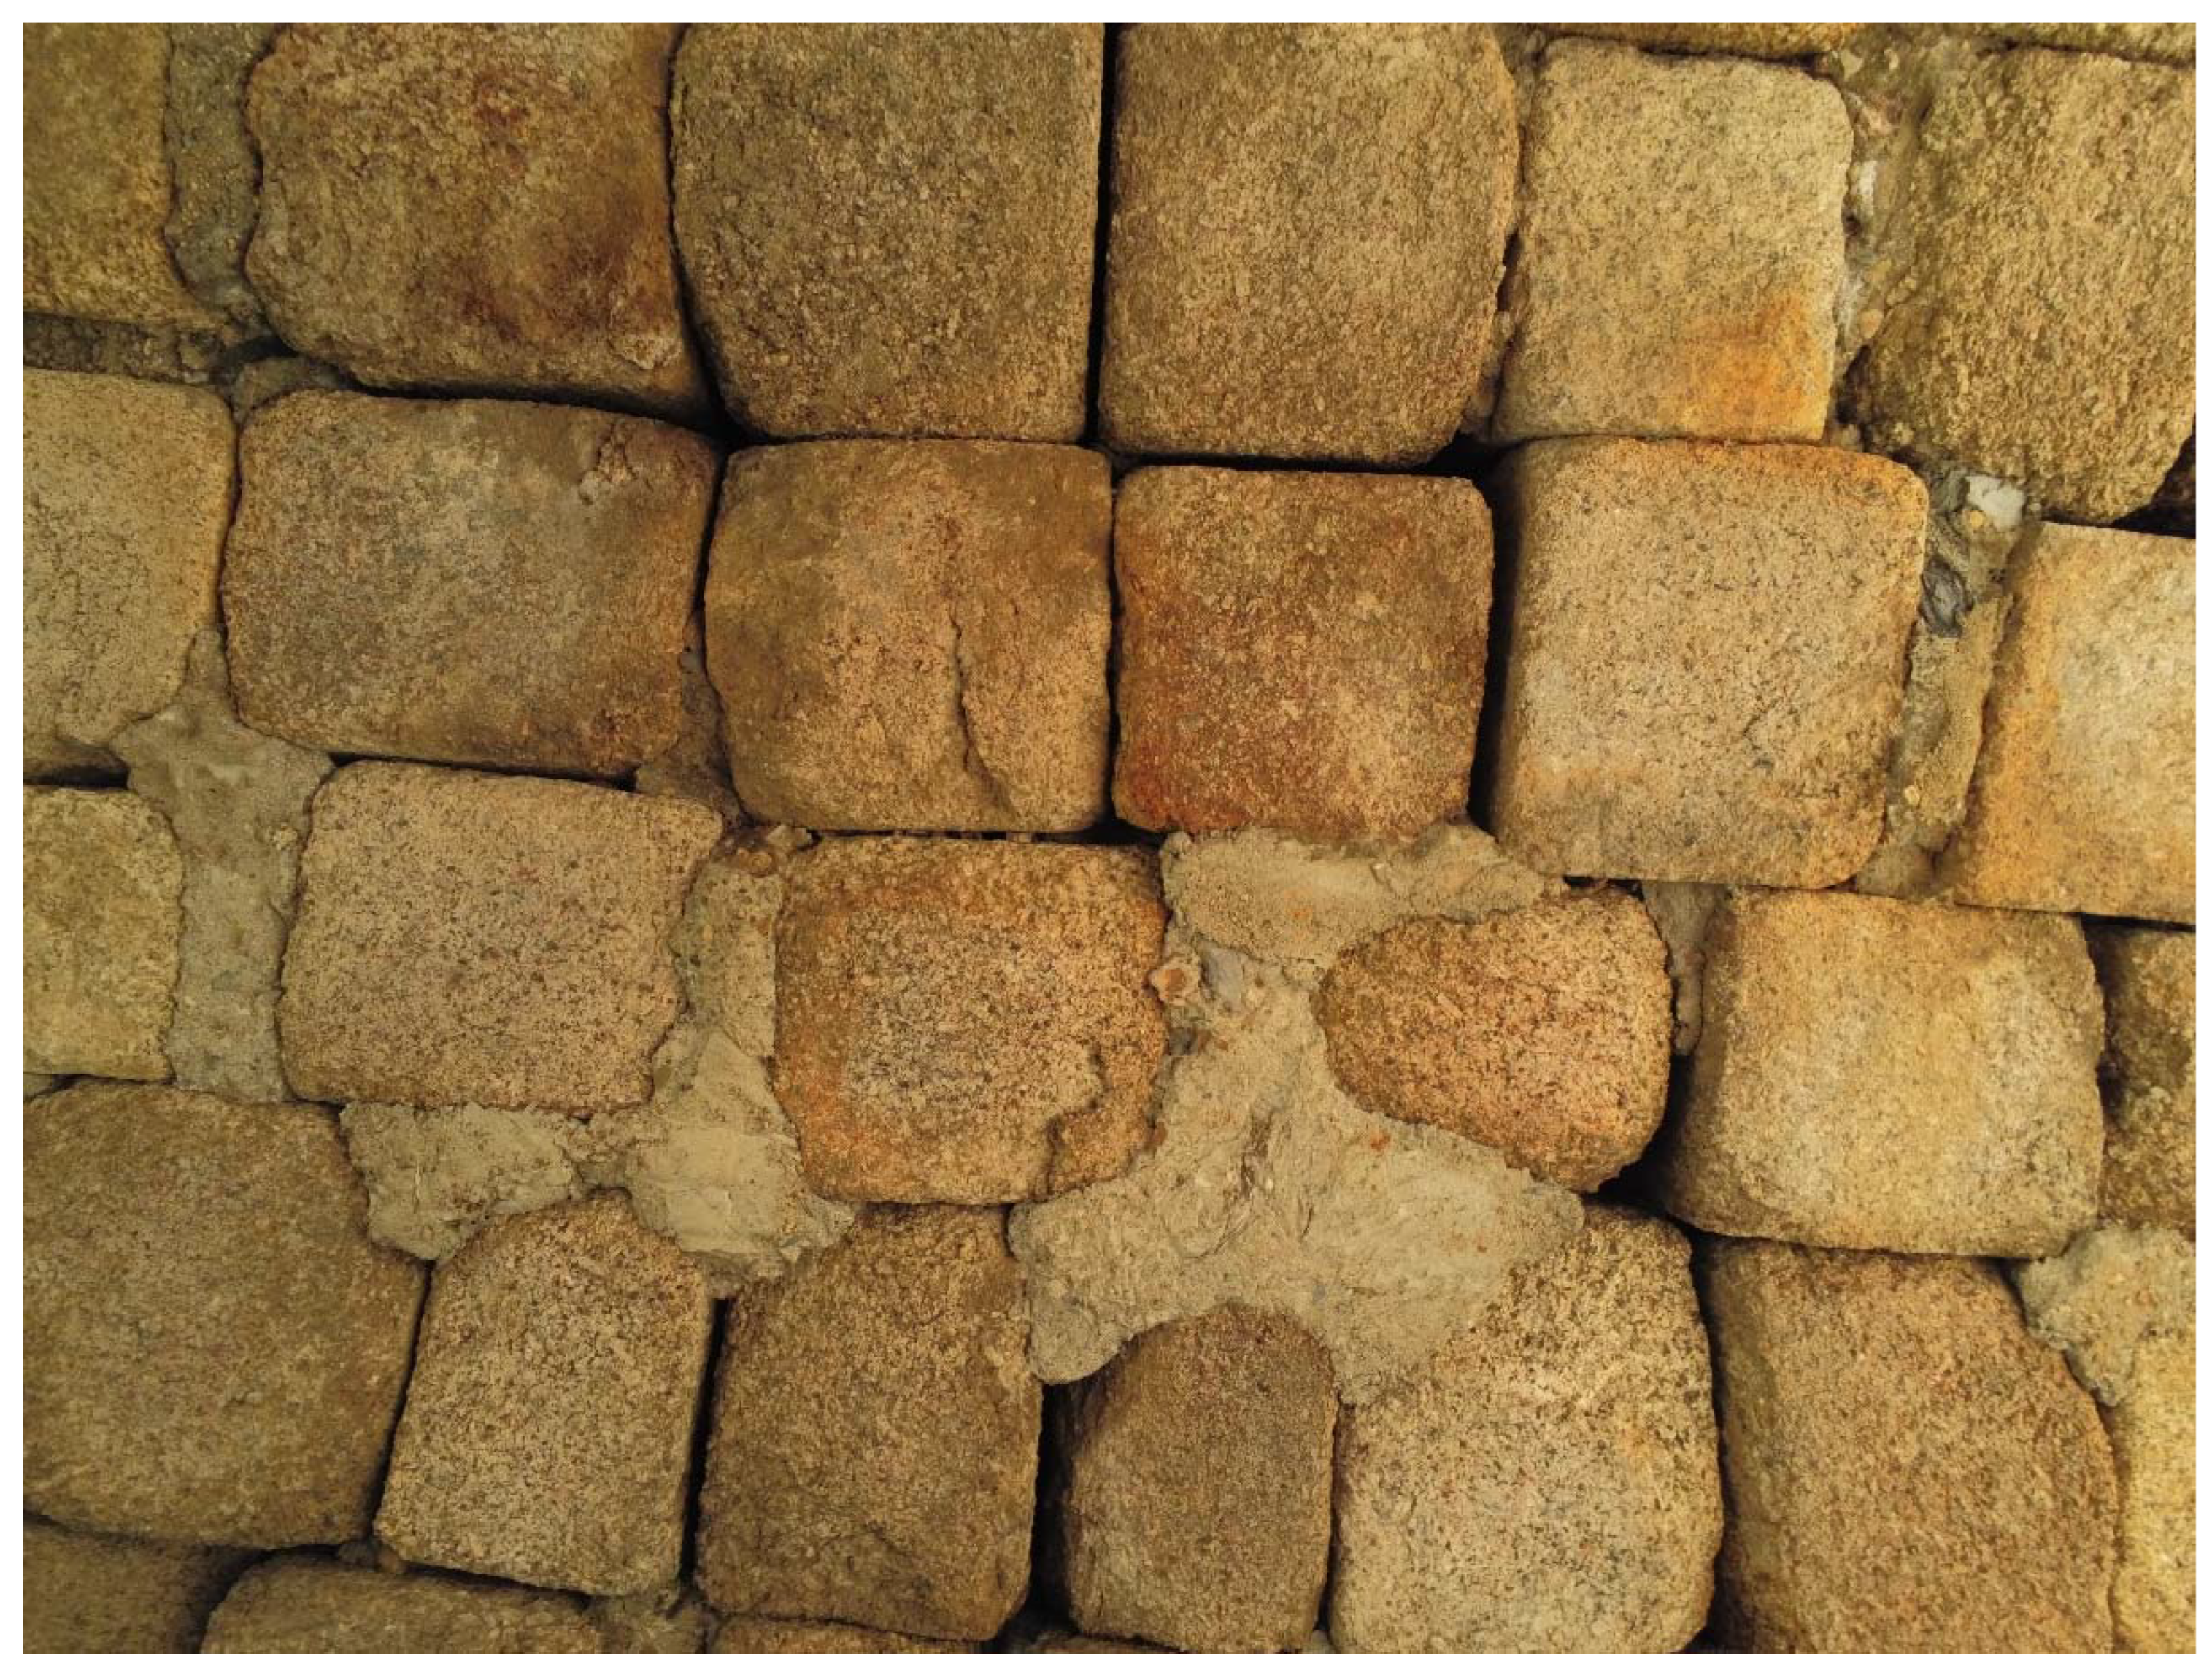
Figure 23.
Location of extreme temperature values on the photograph in Figure 22: (a) maximum values and (b) minimum values (photographs by the author).
Figure 23.
Location of extreme temperature values on the photograph in Figure 22: (a) maximum values and (b) minimum values (photographs by the author).
This was undoubtedly due to the lack of exposure to the elements (and therefore to solar action) for the intrados of these vaults, given their geometric characteristics, in contrast to the vaults and walls of the Alcántara Bridge and the supports and arches of the Segovia Aqueduct.
In any case, it is undeniable that, although in an inverted manner, the extreme values are recorded at the same points, and this constitutes a risk in the face of phenomena such as the crystallization of salts or the freezing and thawing of interstitial water within the constituent material, which also demonstrates the great utility of exploring the monument with a thermographic camera.
5. Conclusions
Following the inspections carried out, it can be stated that thermography (and especially aerial thermography) is a tool that can be used to obtain information regarding the temperature of a heritage element, without the need for physical contact with it. Therefore, it is a non-destructive technique that can complement other information (or be complemented by other information) obtained from other sources. This makes it possible to have real data on the state of the different constituent elements of a heritage construction and on the existence of possible damage to said elements.
Thermography makes it possible to obtain information to predict future thermal behaviour and anomalies that may occur in some areas of the monument, in order to make an adequate pathological diagnosis or, in the best of cases, to verify the good condition of the ancient construction.
Aerial thermographic inspection is a complement that can help technicians in charge of property inspection and pathological diagnosis to obtain a new, highly relevant point of view, given the angle and distance at which the photographs and measurements are taken. Similarly, when it comes to an inspection of significant dimensions, the time spent on it can be reduced, which will undoubtedly result in economic benefits for all the agents involved.
Needless to say, the experiences of the experimental inspections carried out for the preparation of this article can be extrapolated to many other works of similar nature, which opens up an infinite range of opportunities for these small devices that, without a doubt, are here to stay and to change how we inspect certain elements. The fact that all bodies emit heat opens up a very wide range of applications for this technology.
This article has focused exclusively on the use of drones with thermal imaging cameras in the field of inspection of heritage buildings. The damages that have been diagnosed or foreseen, complementing the visual inspection, have been efflorescences and crypto-efflorescences, as well as possible dirt marks linked to runoff water and surface deterioration linked to the action of water. All of these are related to moisture. More in-depth and long-term investigations will also enable analysis and evolutionary study by thermography of other damage such as patinas, vesiculation of the building material, and the appearance of crusts, disaggregation or pulverization.
References
- Rodríguez Elizalde R. Use of Remotely Piloted Aircraft (Drones) for The Inspection of Architectural Heritage and Ancient Structures. Proceeding of 9th REHABEND Congress, Construction Pathology, Rehabilitation Technology and Heritage Management. Granada (Spain), September 13th – 16th, 2022.
- Rodríguez Elizalde R. Use of RPAS (drones) for masonry arch bridges inspection: application on Grajal Bridge. International Journal of Current Research, 2022, 14 (7), pp. 21954-21960. Available online on: http://journalcra.com/sites/default/files/issue-pdf/43791.pdf (accessed on July 7, 2024).
- Rodríguez Elizalde R. Utilisation de Systèmes d'Aéronefs Télépilotés pour l'Inspection d'Anciennes Constructions (in French). Current Opinion, 2022, vol. 2, no 6. Available online on: https://www.currentopinion.be/index.php/co/article/download/121/52 (accessed on July 7, 2024).
- Rodríguez Elizalde R. Use of RPAS (Drones) for Old Bridges Inspection: Application on Ponte Olveira Bridge. International Journal of Innovation Scientific Research and Review, 2022, Vol. 04, Issue, 10, pp.3487-3493. Available online on: http://journalijisr.com/sites/default/files/issues-pdf/IJISRR-1035.pdf (accessed on July 7, 2024).
- Rodríguez Elizalde R. Use of Unmanned Aircraft (Drones) for the Inspection of Architectural Monuments and Ancient Constructions. Journal of Engineering Research 3 (18), 2023. [CrossRef]
- VVAA. Guía para la realización de inspecciones principales de obras de paso en la Red de Carreteras del Estado (in Spanish). Madrid, España: Secretaría General Técnica, Ministerio de Fomento; 2012: 355 p. Available online on: https://www.mitma.gob.es/recursos_mfom/0870250.pdf (accessed on July 7, 2024).
- Rodríguez Elizalde R. Thermography applied to damage diagnosis over monuments and ancient constructions. J Mat Sci Eng Technol, 2023, vol. 1, no 1, p. 1-6. Available online on: https://oaskpublishers.com/assets/article-pdf/thermography-applied-to-damage-diagnosis-over-monuments-and-ancient-constructions.pdf (accessed on July 7, 2024).
- Rodríguez Elizalde R. Auscultation Techniques of Constituent Materials of Monuments and Ancient Constructions: Immediate Techniques and Instrumental Techniques. Journal of Materials and Polymer Science, 2022, vol. 2, p. 1-14. [CrossRef]
- Rodríguez Elizalde R. Auscultation techniques for heritage buildings. Asian Journal of Science and Technology, 2022, Vol. 13, Issue, 10, pp. 12199-12210. Available online on: https://journalajst.com/sites/default/files/issues-pdf/9079.pdf (accessed on July 7, 2024).
- García de Miguel J.M. Tratamiento y conservación de la piedra, el ladrillo y los morteros en monumentos y construcciones. Madrid, España: Consejo General de la Arquitectura Técnica de España; 2009: 684 p.
- Ley Urzaiz J. Auscultación de puentes de fábrica. In Los puentes de piedra (o ladrillo) antaño y hogaño, pp. 169 – 182. Fundación Juanelo Turriano. 2017 Available online on: https://biblioteca.juaneloturriano.com/Record/Xebook1-11095 (accessed on July 7, 2024).
- Usamentiaga, R; Venegas, P: Guerediaga, J; Vega, L; Molleda, J; & Bulnes, FG. Infrared thermography for temperature measurement and non-destructive testing. Sensors, 2014, 14 (7), 12305-12348. [CrossRef]
- Scarpatti J. Infrared radiation (IR). Available online on: https://www.techtarget.com/searchnetworking/definition/infrared-radiation (accessed on July 7, 2024).
- Rodríguez Elizalde, R.. Analysis of the Tower of Hercules, the World’s Oldest Extant Lighthouse. Buildings, 2023, vol. 13, no 5, p. 1219. [CrossRef]
- Rodríguez Elizalde, R. Structural Analysis of “La Giralda”, Bell Tower of the Seville Cathedral. Journal of Engineering and Applied Sciences Technology, 2022, 5 (1): p 1 – 14. [CrossRef]
- Carlomagno, GM; Di Maio, R; Meola, C; & Roberti, N. Infrared thermography and geophysical techniques in cultural heritage conservation. Quantitative InfraRed Thermography Journal, 2005, 2(1), 5-24.
- Giddings, SB. Hawking radiation, the Stefan–Boltzmann law, and unitarization. Physics Letters B, 2016, 754, 39-42. DOI: . [CrossRef]
- Wellons, M. The Stefan-Boltzmann Law. Physics Department, The College of Wooster, Wooster, Ohio, 2007, 44691, 25. Available online on: https://physics.wooster.edu/wp-content/uploads/2021/08/Junior-IS-Thesis-Web_2007_Wellons.pdf (accessed on July 7, 2024).
- Montambaux, G. Generalized Stefan–Boltzmann Law. Foundations of Physics, 2018, 48 (4), 395-410. [CrossRef]
- Liz Guiral J. El Puente de Alcántara: Arqueología e Historia (in Spanish). Madrid, España: Centro de Estudios Históricos de Obras Públicas y Urbanismo (CEHOPU), Fundación San Benito de Alcántara; 1988: 251 p.
- Durán Fuentes M. La Construcción de Puentes Romanos en Hispania (in Spanish). Santiago de Compostela, España: Dirección Xeral de Patrimonio Cultural, Consellería de Cultura e Deporte (Xunta de Galicia); 2005: 366 p. Available online on: https://www.traianvs.net/pdfs/2005_duran.pdf (accessed on July 7, 2024).
- Fernández Casado C. Acueductos Romanos en España (in Spanish). Madrid, España: Colegio de Ingenieros de Caminos, Canales y Puertos, Editorial Doce Calles; 2008: 283 p.
- Olabarrieta B. Materiales y Métodos Constructivos: Del Hormigón a la Bóveda. Ingeniería Romana en España (in Spanish). Revista del Ministerio de Fomento, nº 564, Extra Julio – Agosto 2007. Pp. 6 – 19. Available online on: https://apps.fomento.gob.es/CVP/detallepublicacion.aspx?idpub=RP0056 (accessed on July 7, 2024).
- Fernández Casado C. Historia del Puente en España: Puentes Romanos. Madrid, España: Colegio de Ingenieros de Caminos, Canales y Puertos, Editorial Doce Calles; 2008: 602 p.
Figure 1.
General view of the four-rotor drone with a thermal imaging camera used in one of the inspections, that of the Segovia Aqueduct, at a time when it was inspecting the ashlars and voussoirs that make up one of the arches, on the inside of the monument (photograph by the author).
Figure 1.
General view of the four-rotor drone with a thermal imaging camera used in one of the inspections, that of the Segovia Aqueduct, at a time when it was inspecting the ashlars and voussoirs that make up one of the arches, on the inside of the monument (photograph by the author).
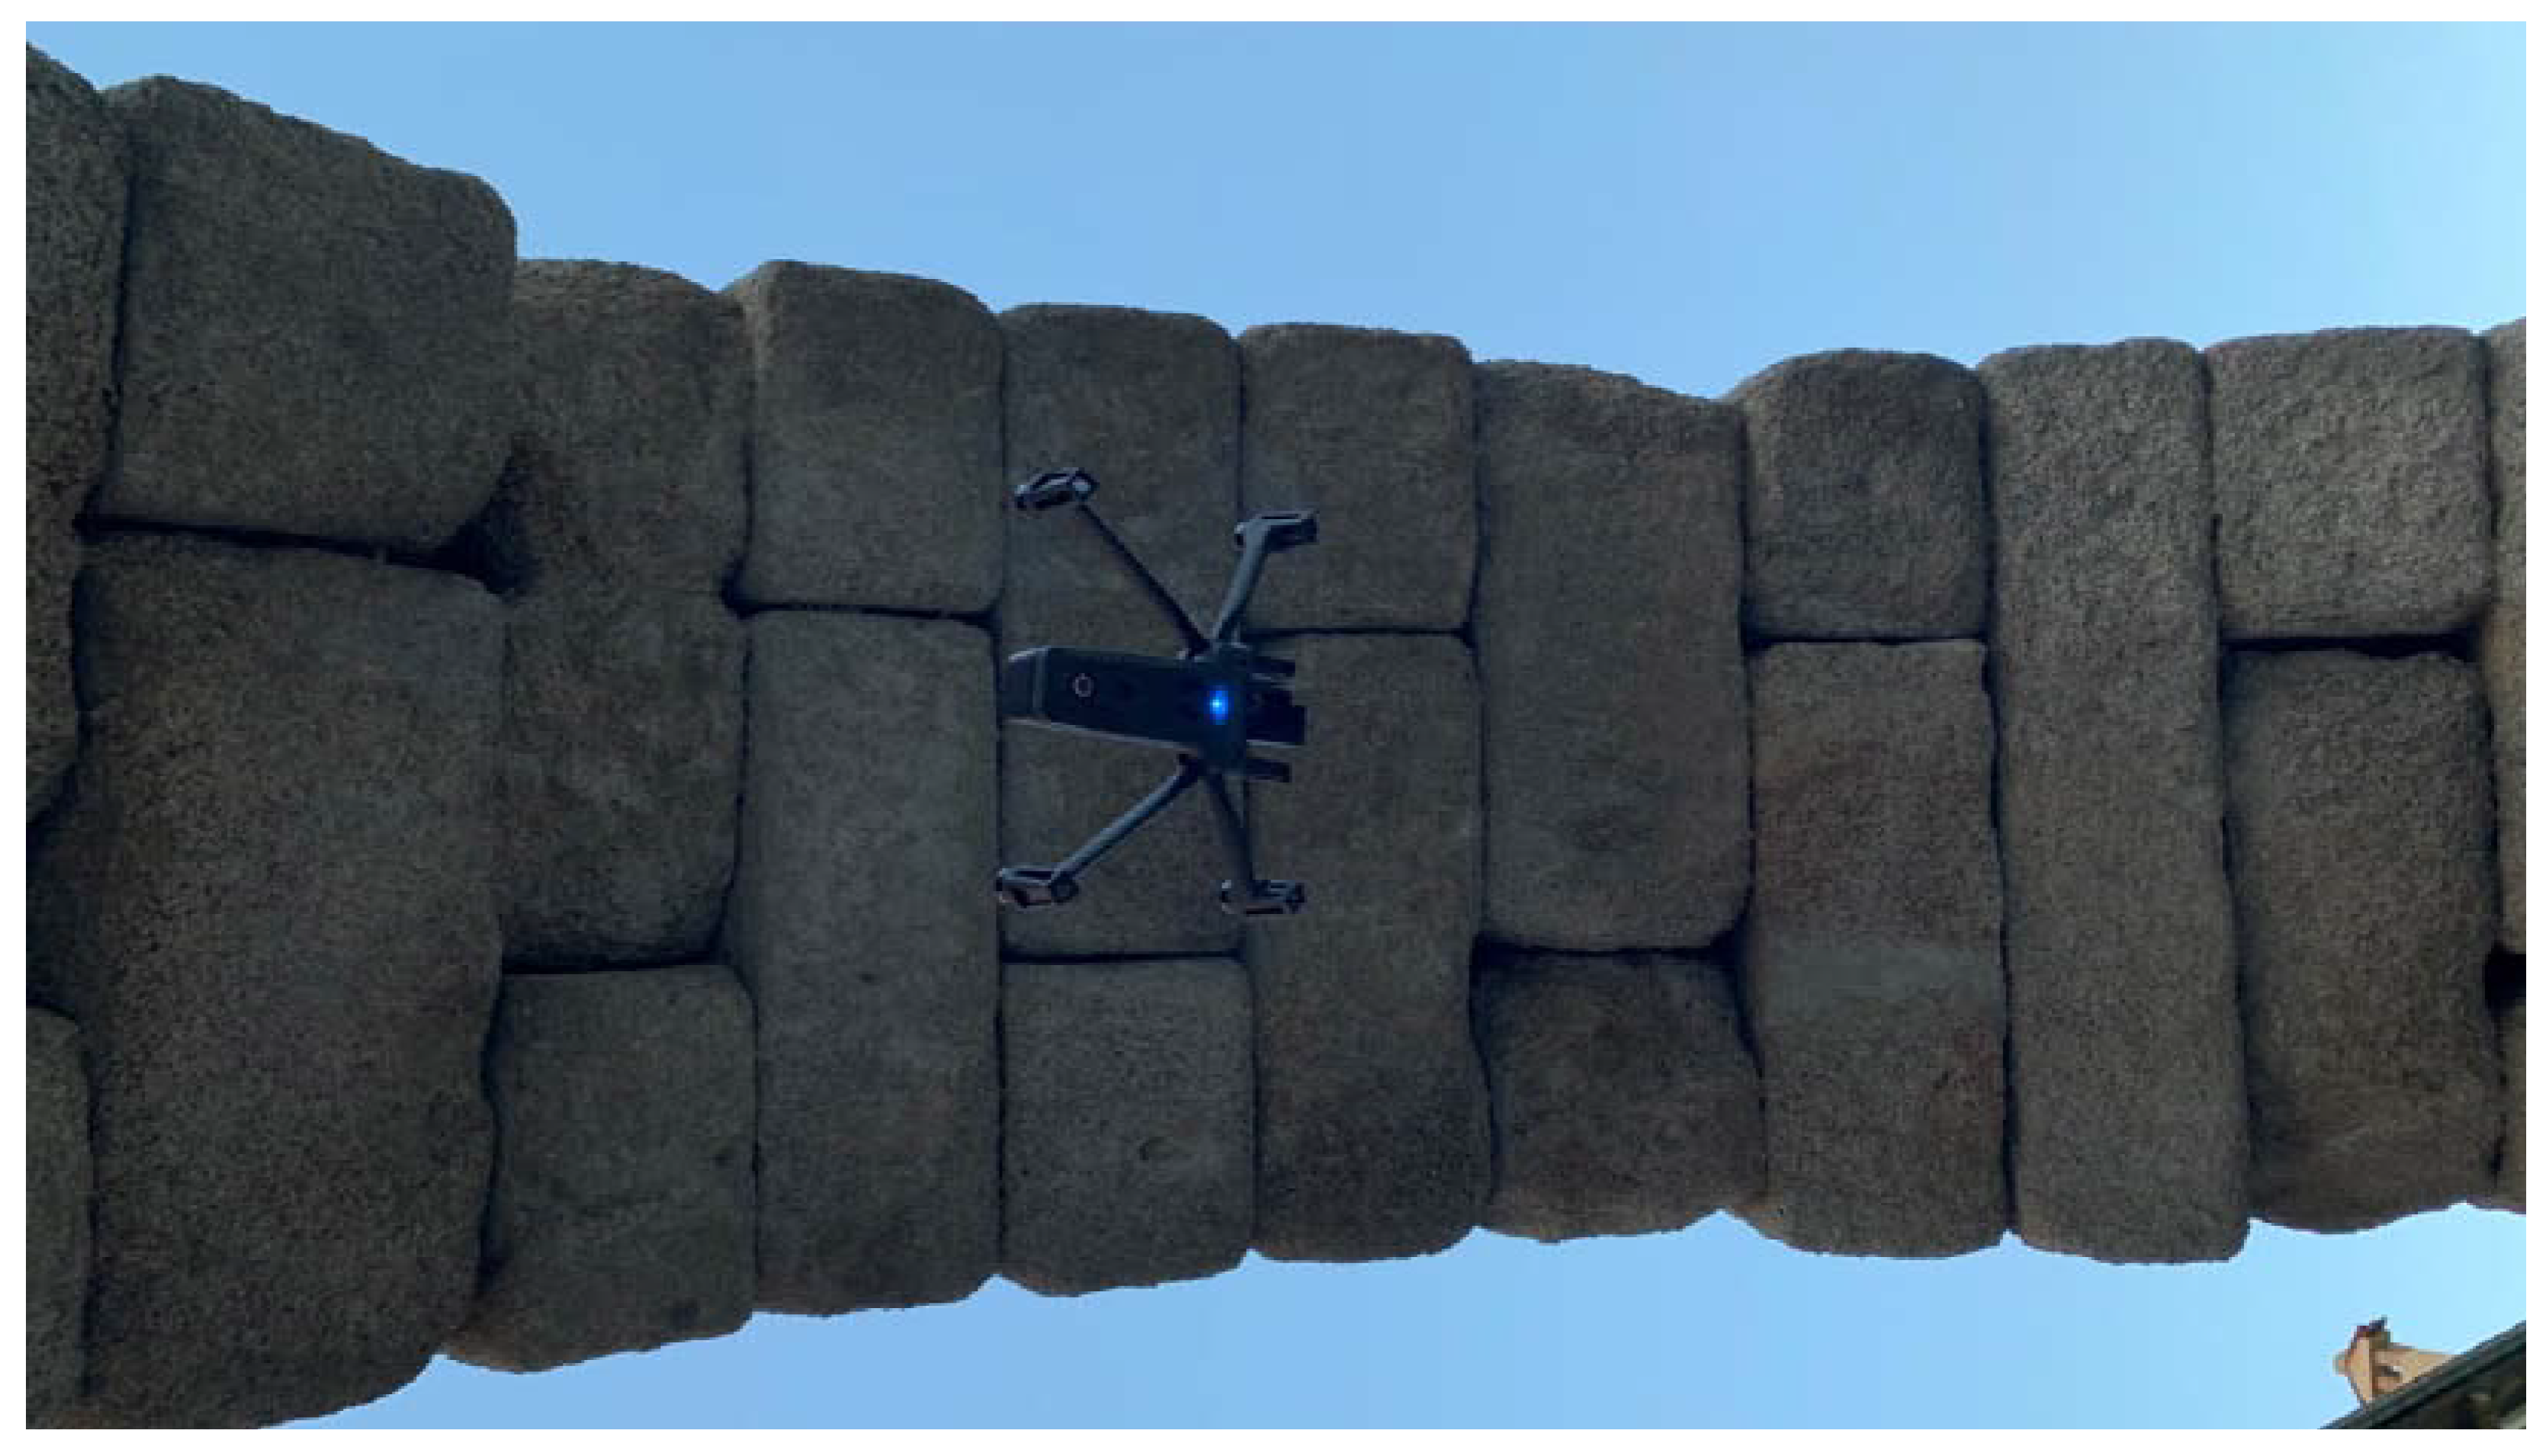
Figure 2.
View from below of a top-floor dwelling with a skylight: (a) image captured by a camera; (b) Thermographic analysis in Figure 2 (a), to locate hidden beams and battens and heat losses in the skylight (photographs by the author).
Figure 2.
View from below of a top-floor dwelling with a skylight: (a) image captured by a camera; (b) Thermographic analysis in Figure 2 (a), to locate hidden beams and battens and heat losses in the skylight (photographs by the author).
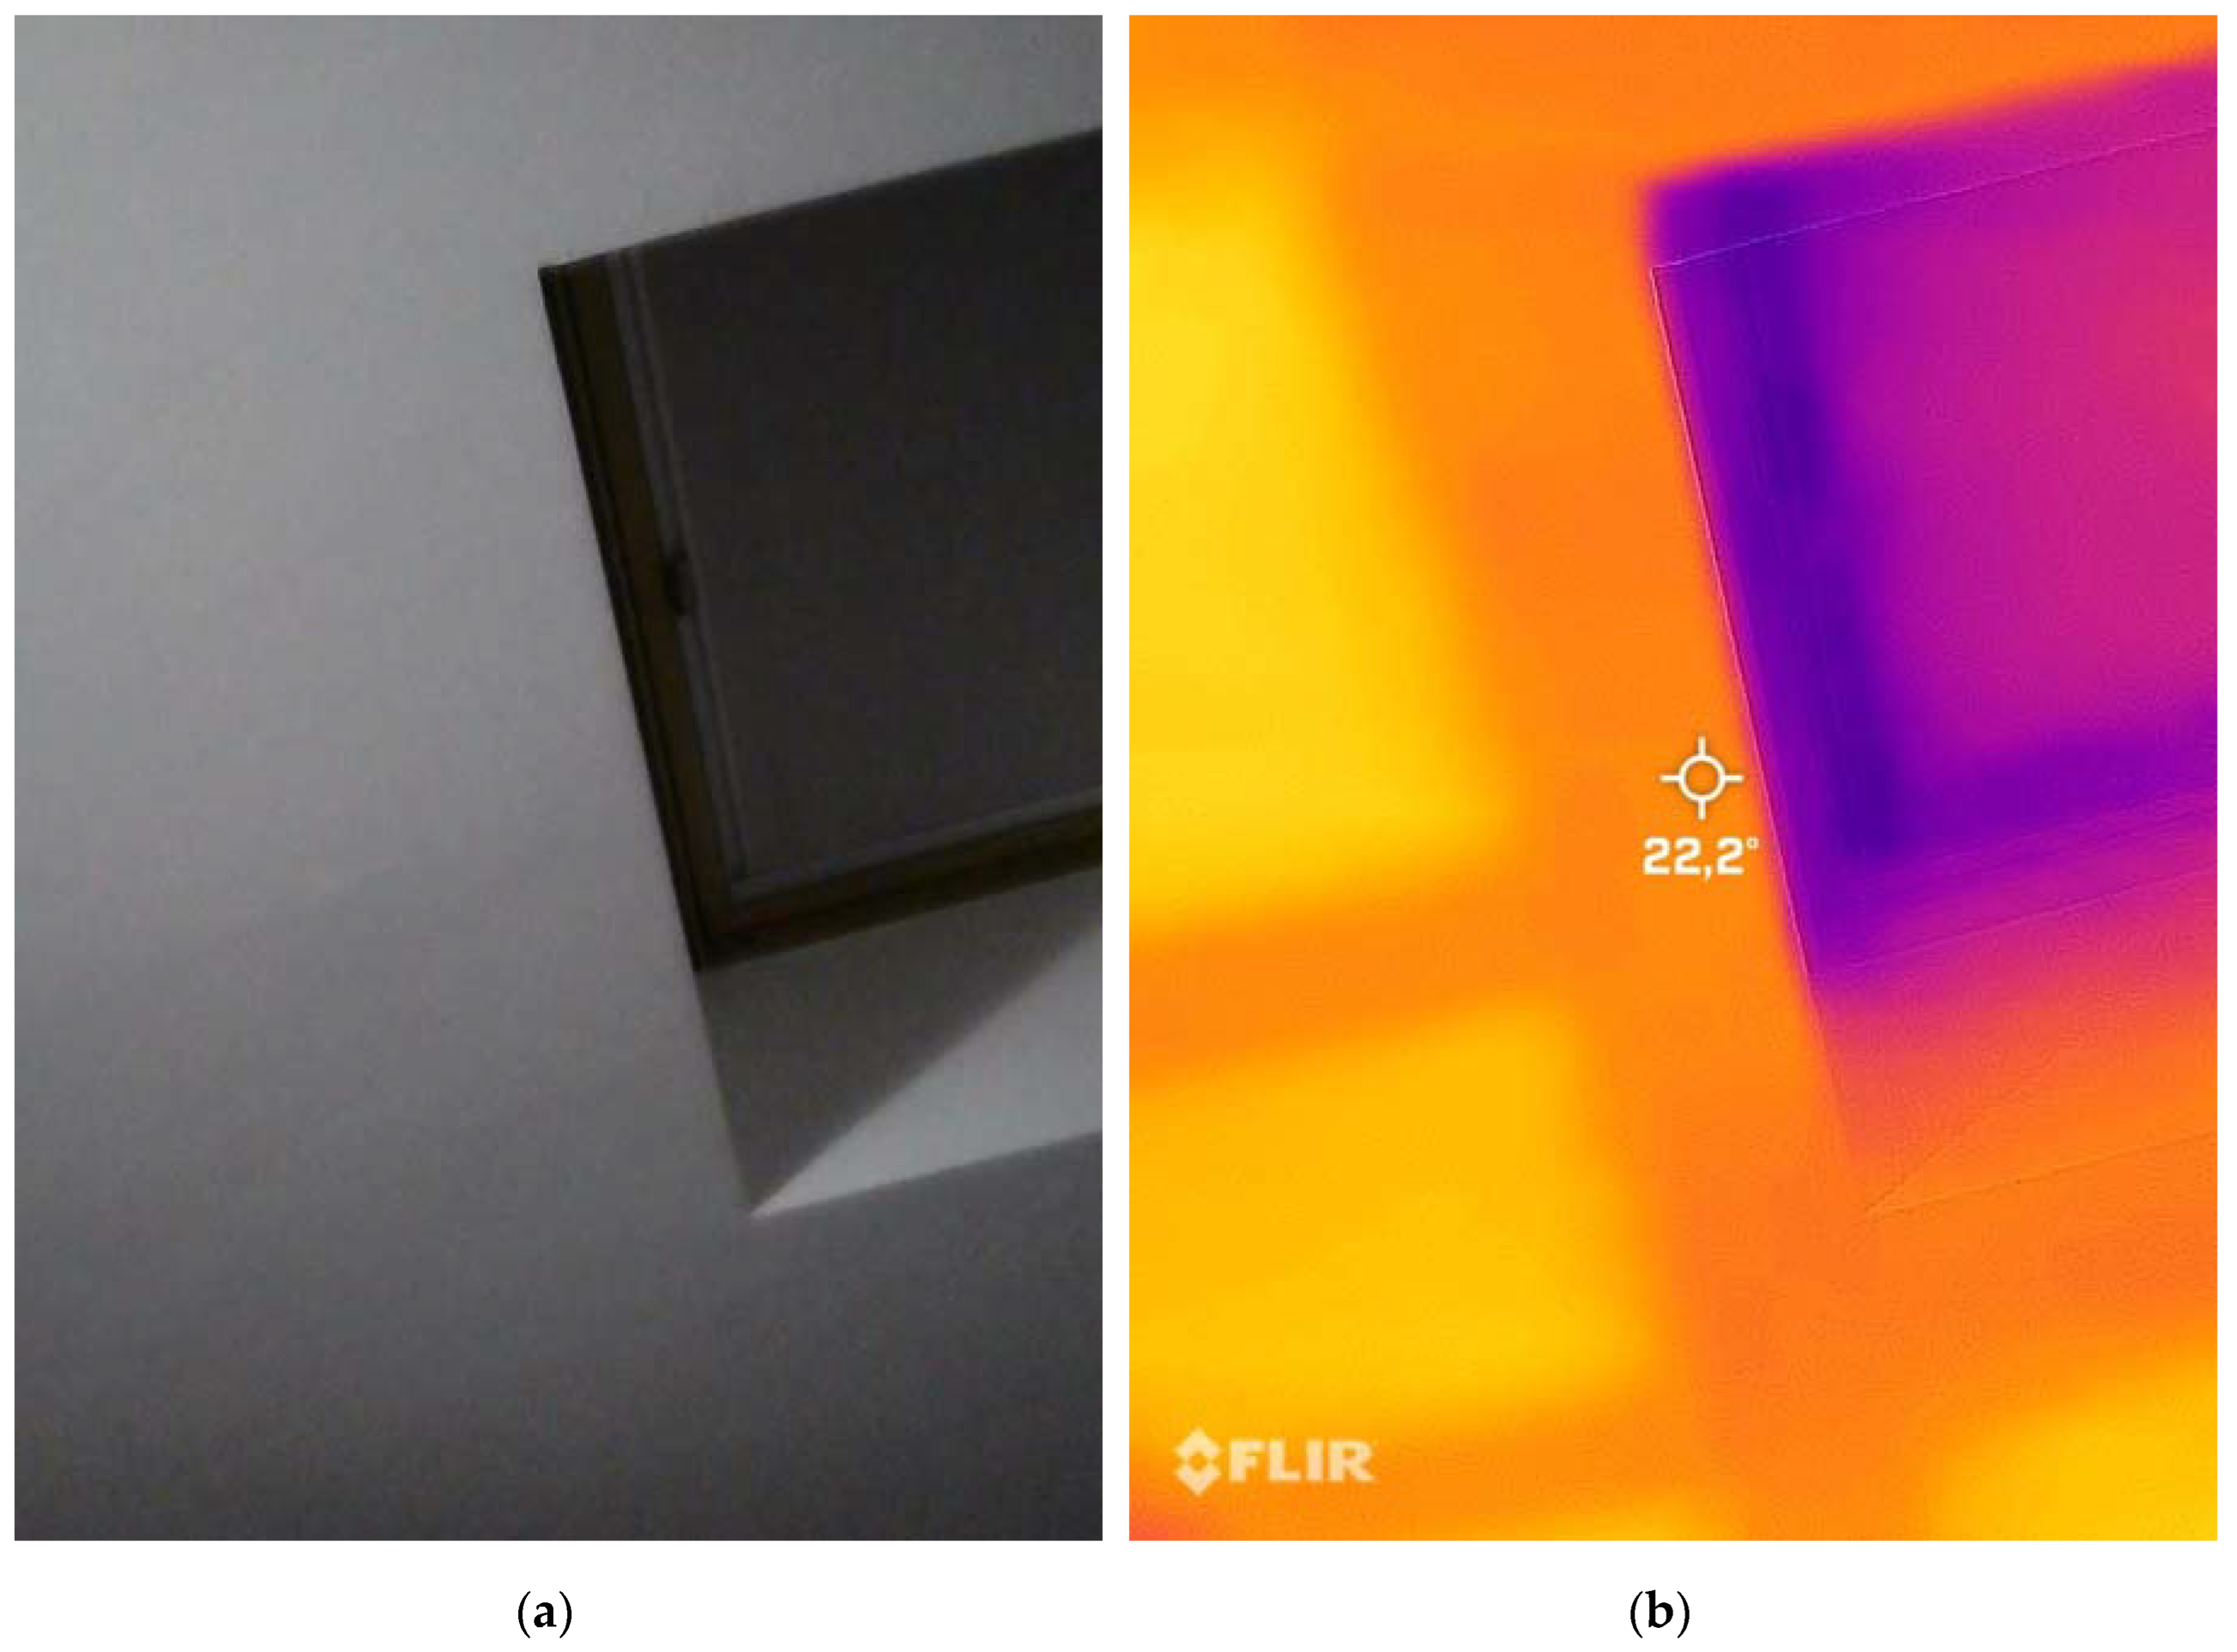
Figure 3.
General view of a corner of an office building: (a) image captured during operation of the air conditioning equipment; (b) thermogram showing the location of the heat conduction supply to the heating radiator, in the image shown in Figure 3 (a) (photographs by the author).
Figure 3.
General view of a corner of an office building: (a) image captured during operation of the air conditioning equipment; (b) thermogram showing the location of the heat conduction supply to the heating radiator, in the image shown in Figure 3 (a) (photographs by the author).
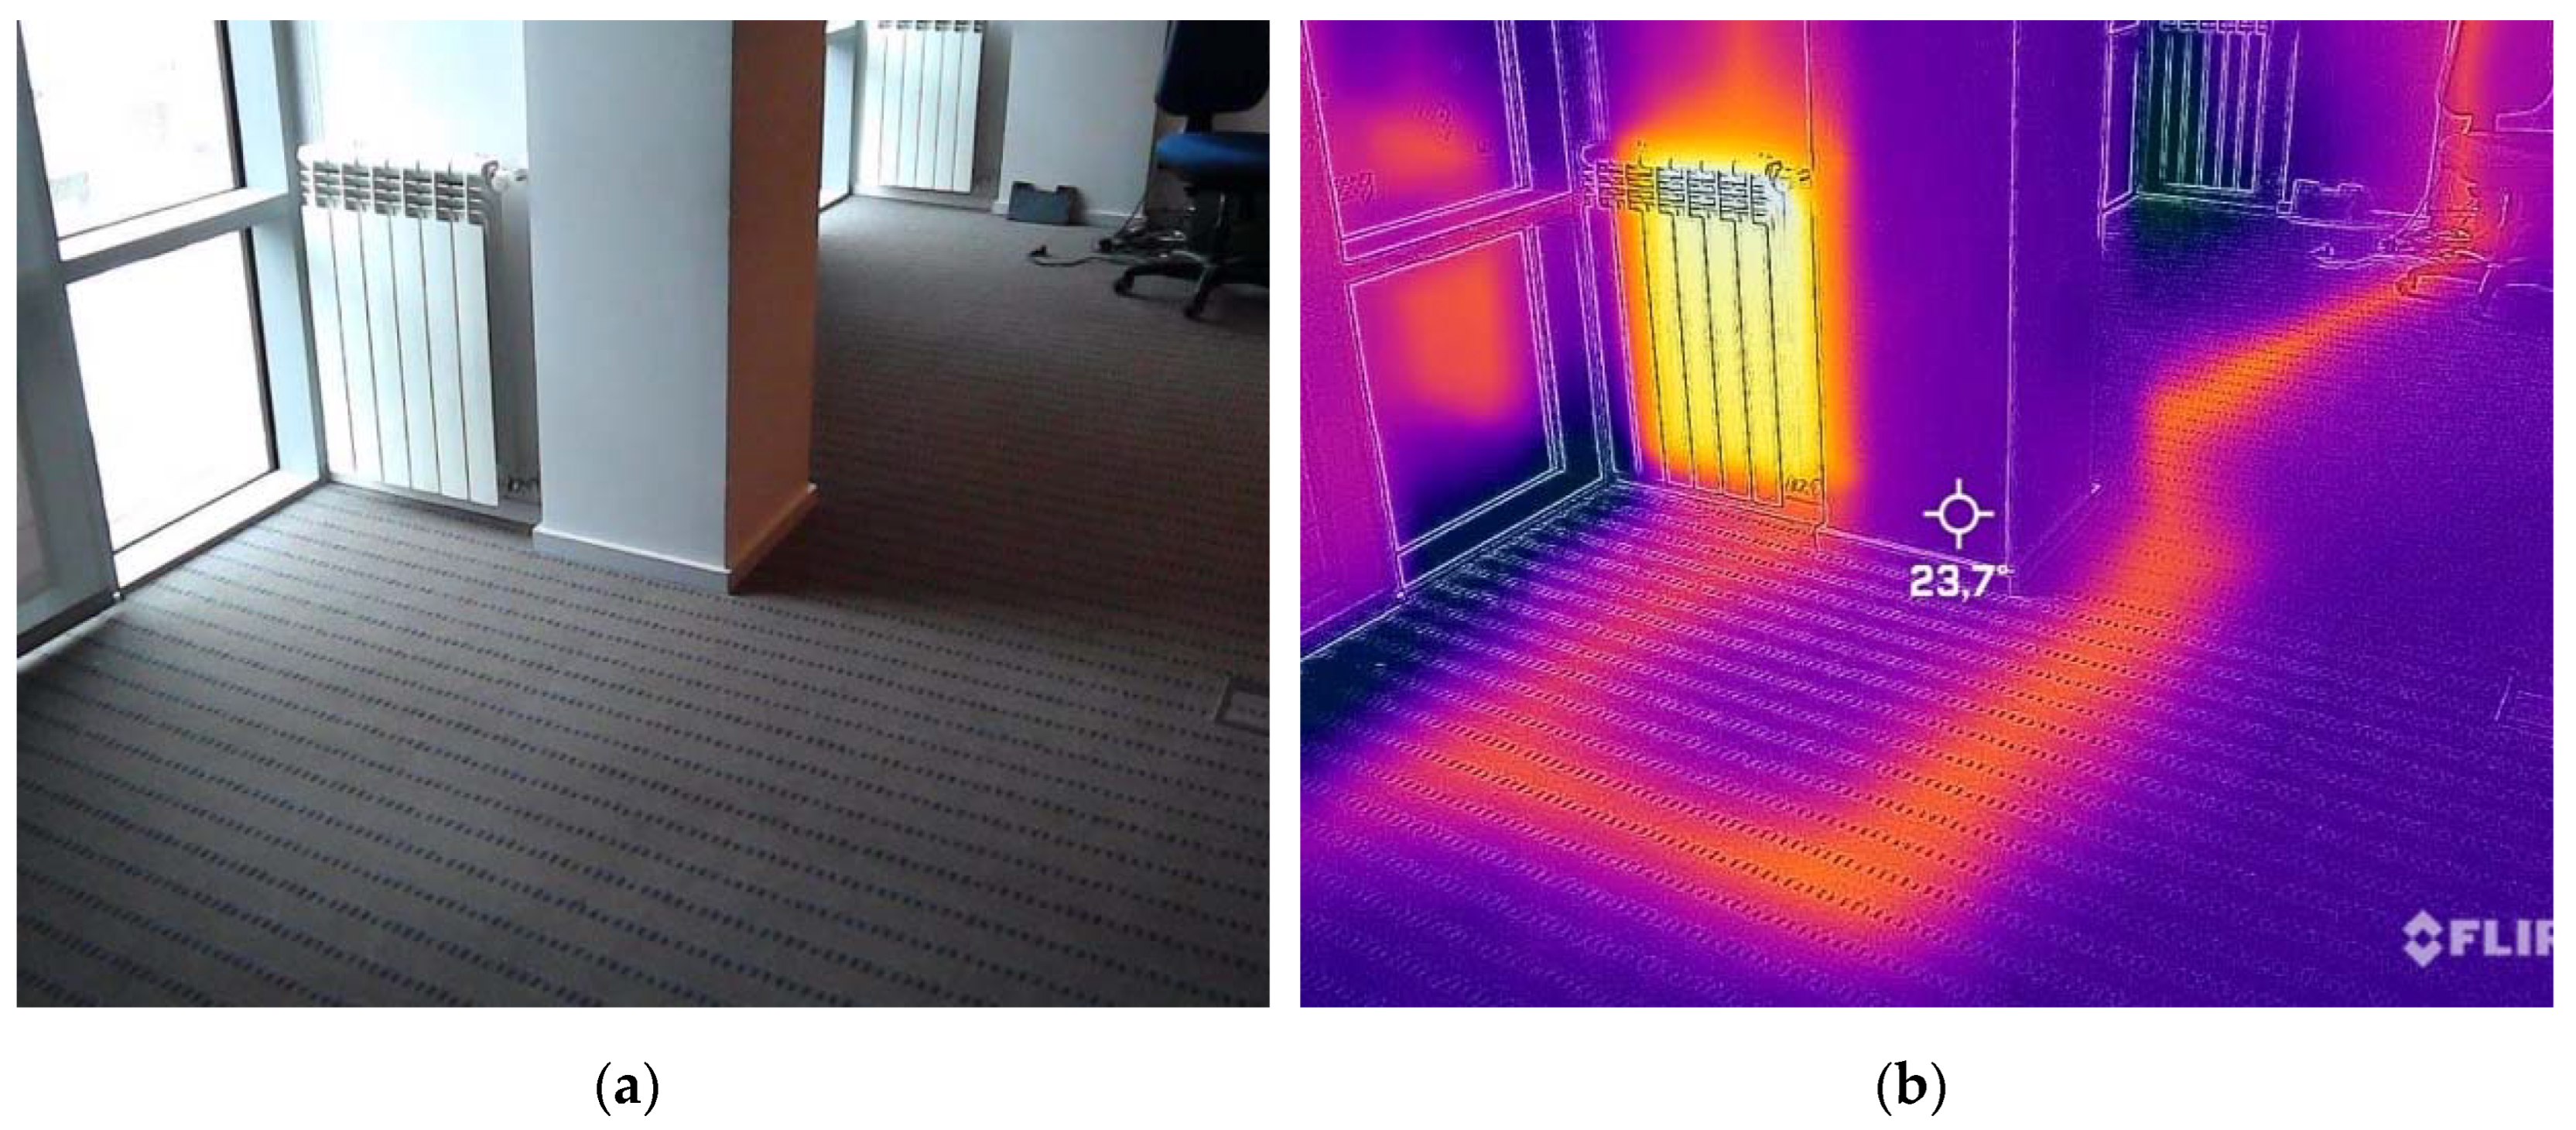
Figure 4.
Visible light and invisible light [13].
Figure 4.
Visible light and invisible light [13].
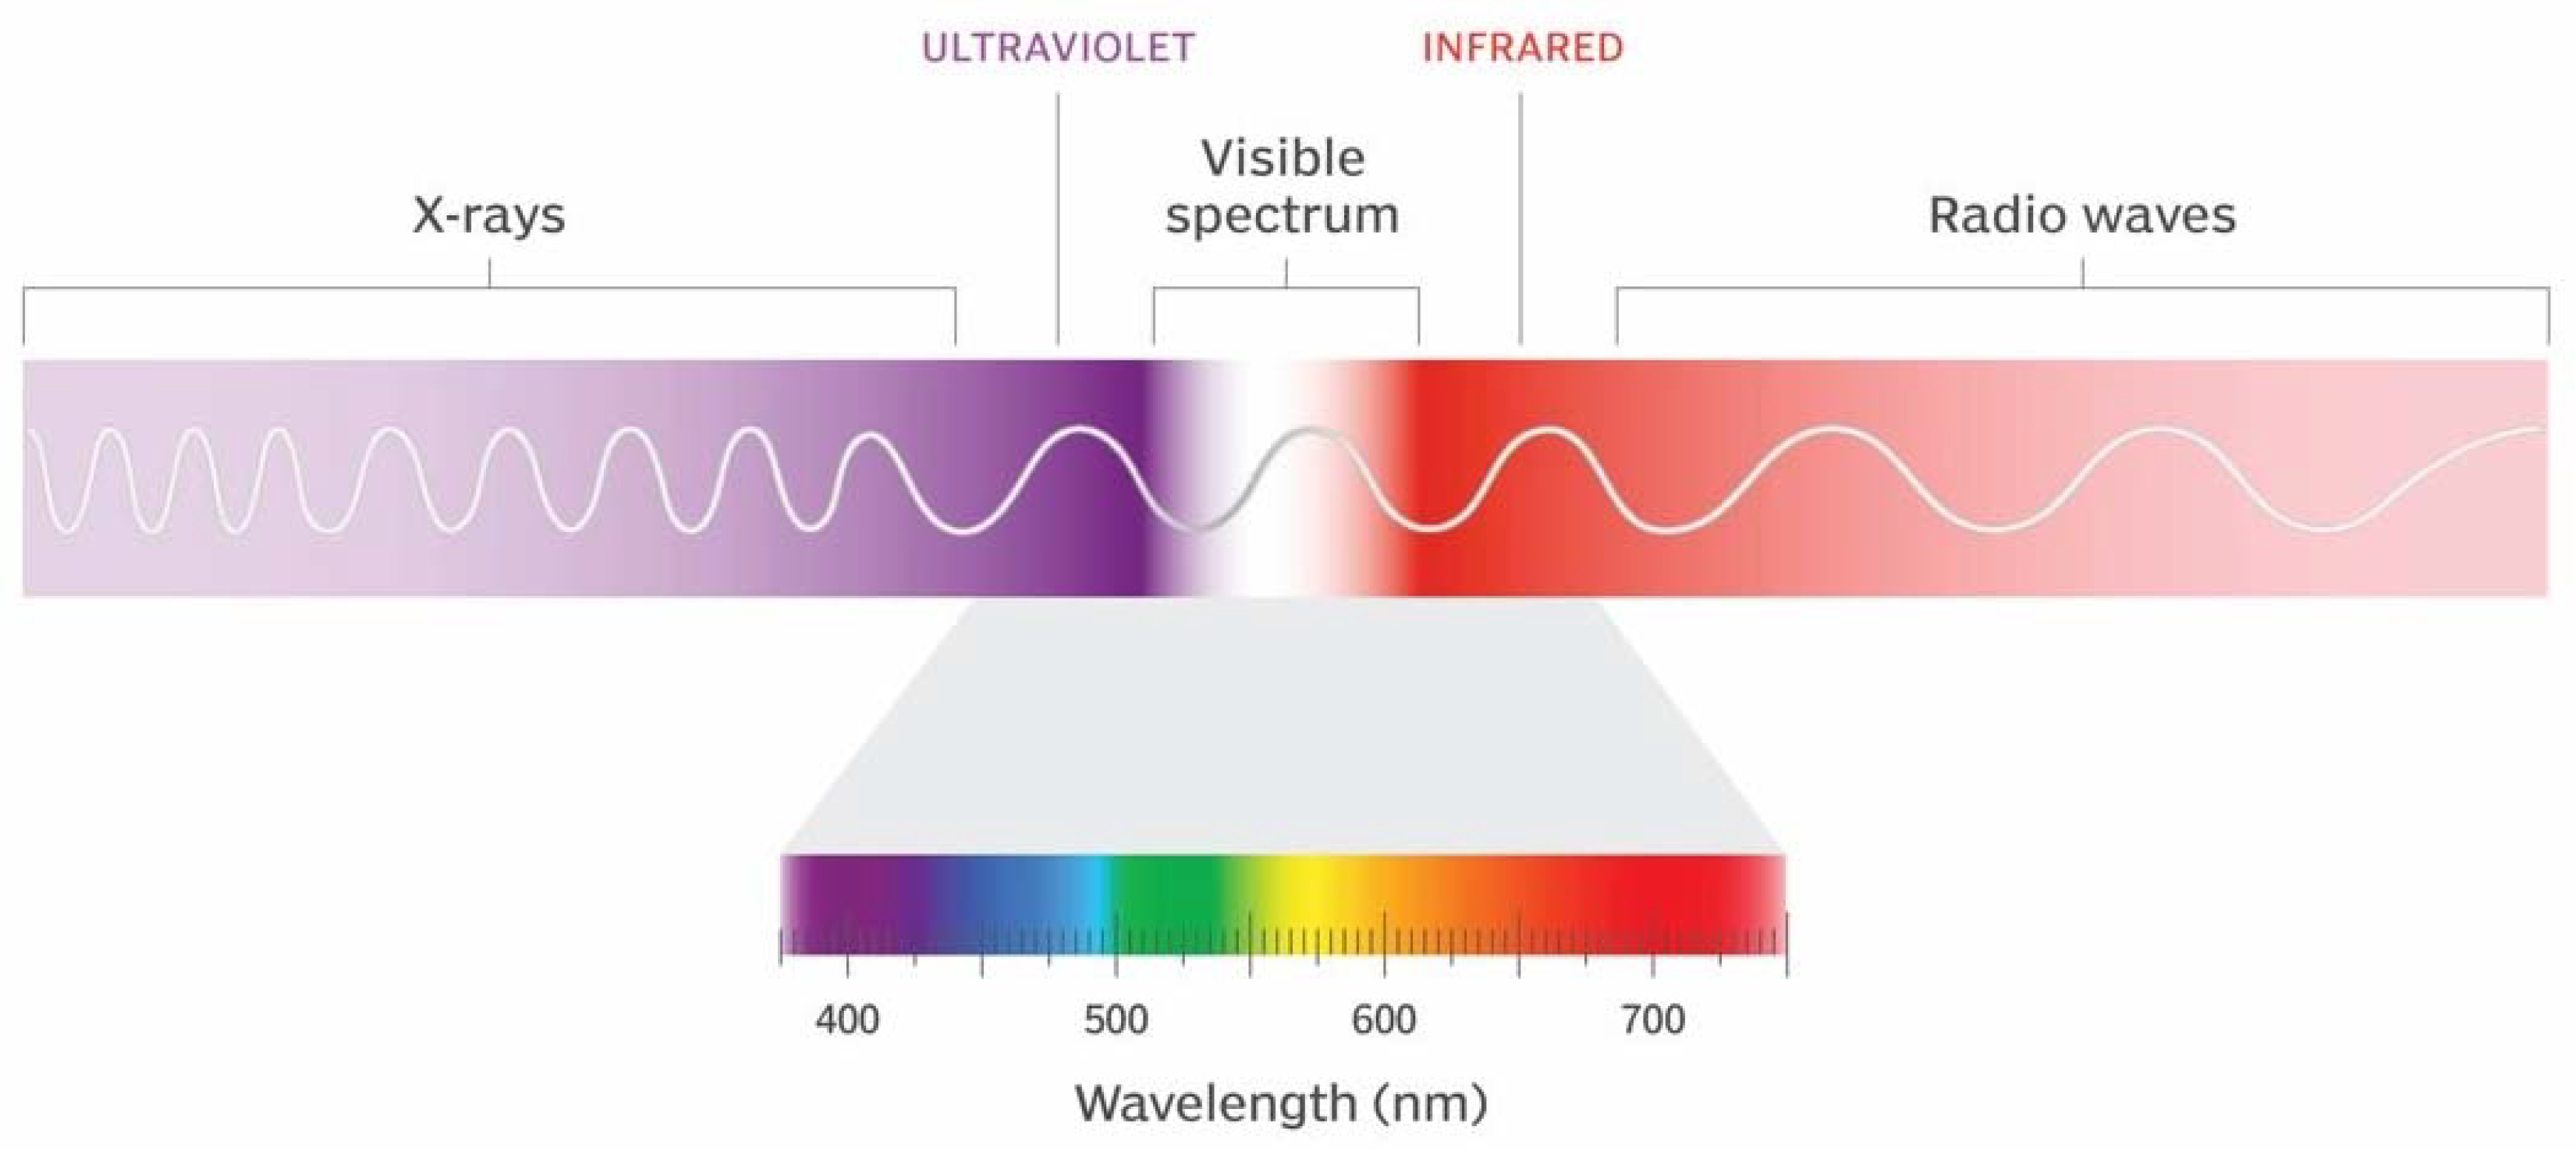
Figure 5.
Radiation emitted (ε), radiation reflected (ρ) and radiation transmitted (τ) from an object, recorded by a thermal imaging camera (diagram by the author).
Figure 5.
Radiation emitted (ε), radiation reflected (ρ) and radiation transmitted (τ) from an object, recorded by a thermal imaging camera (diagram by the author).
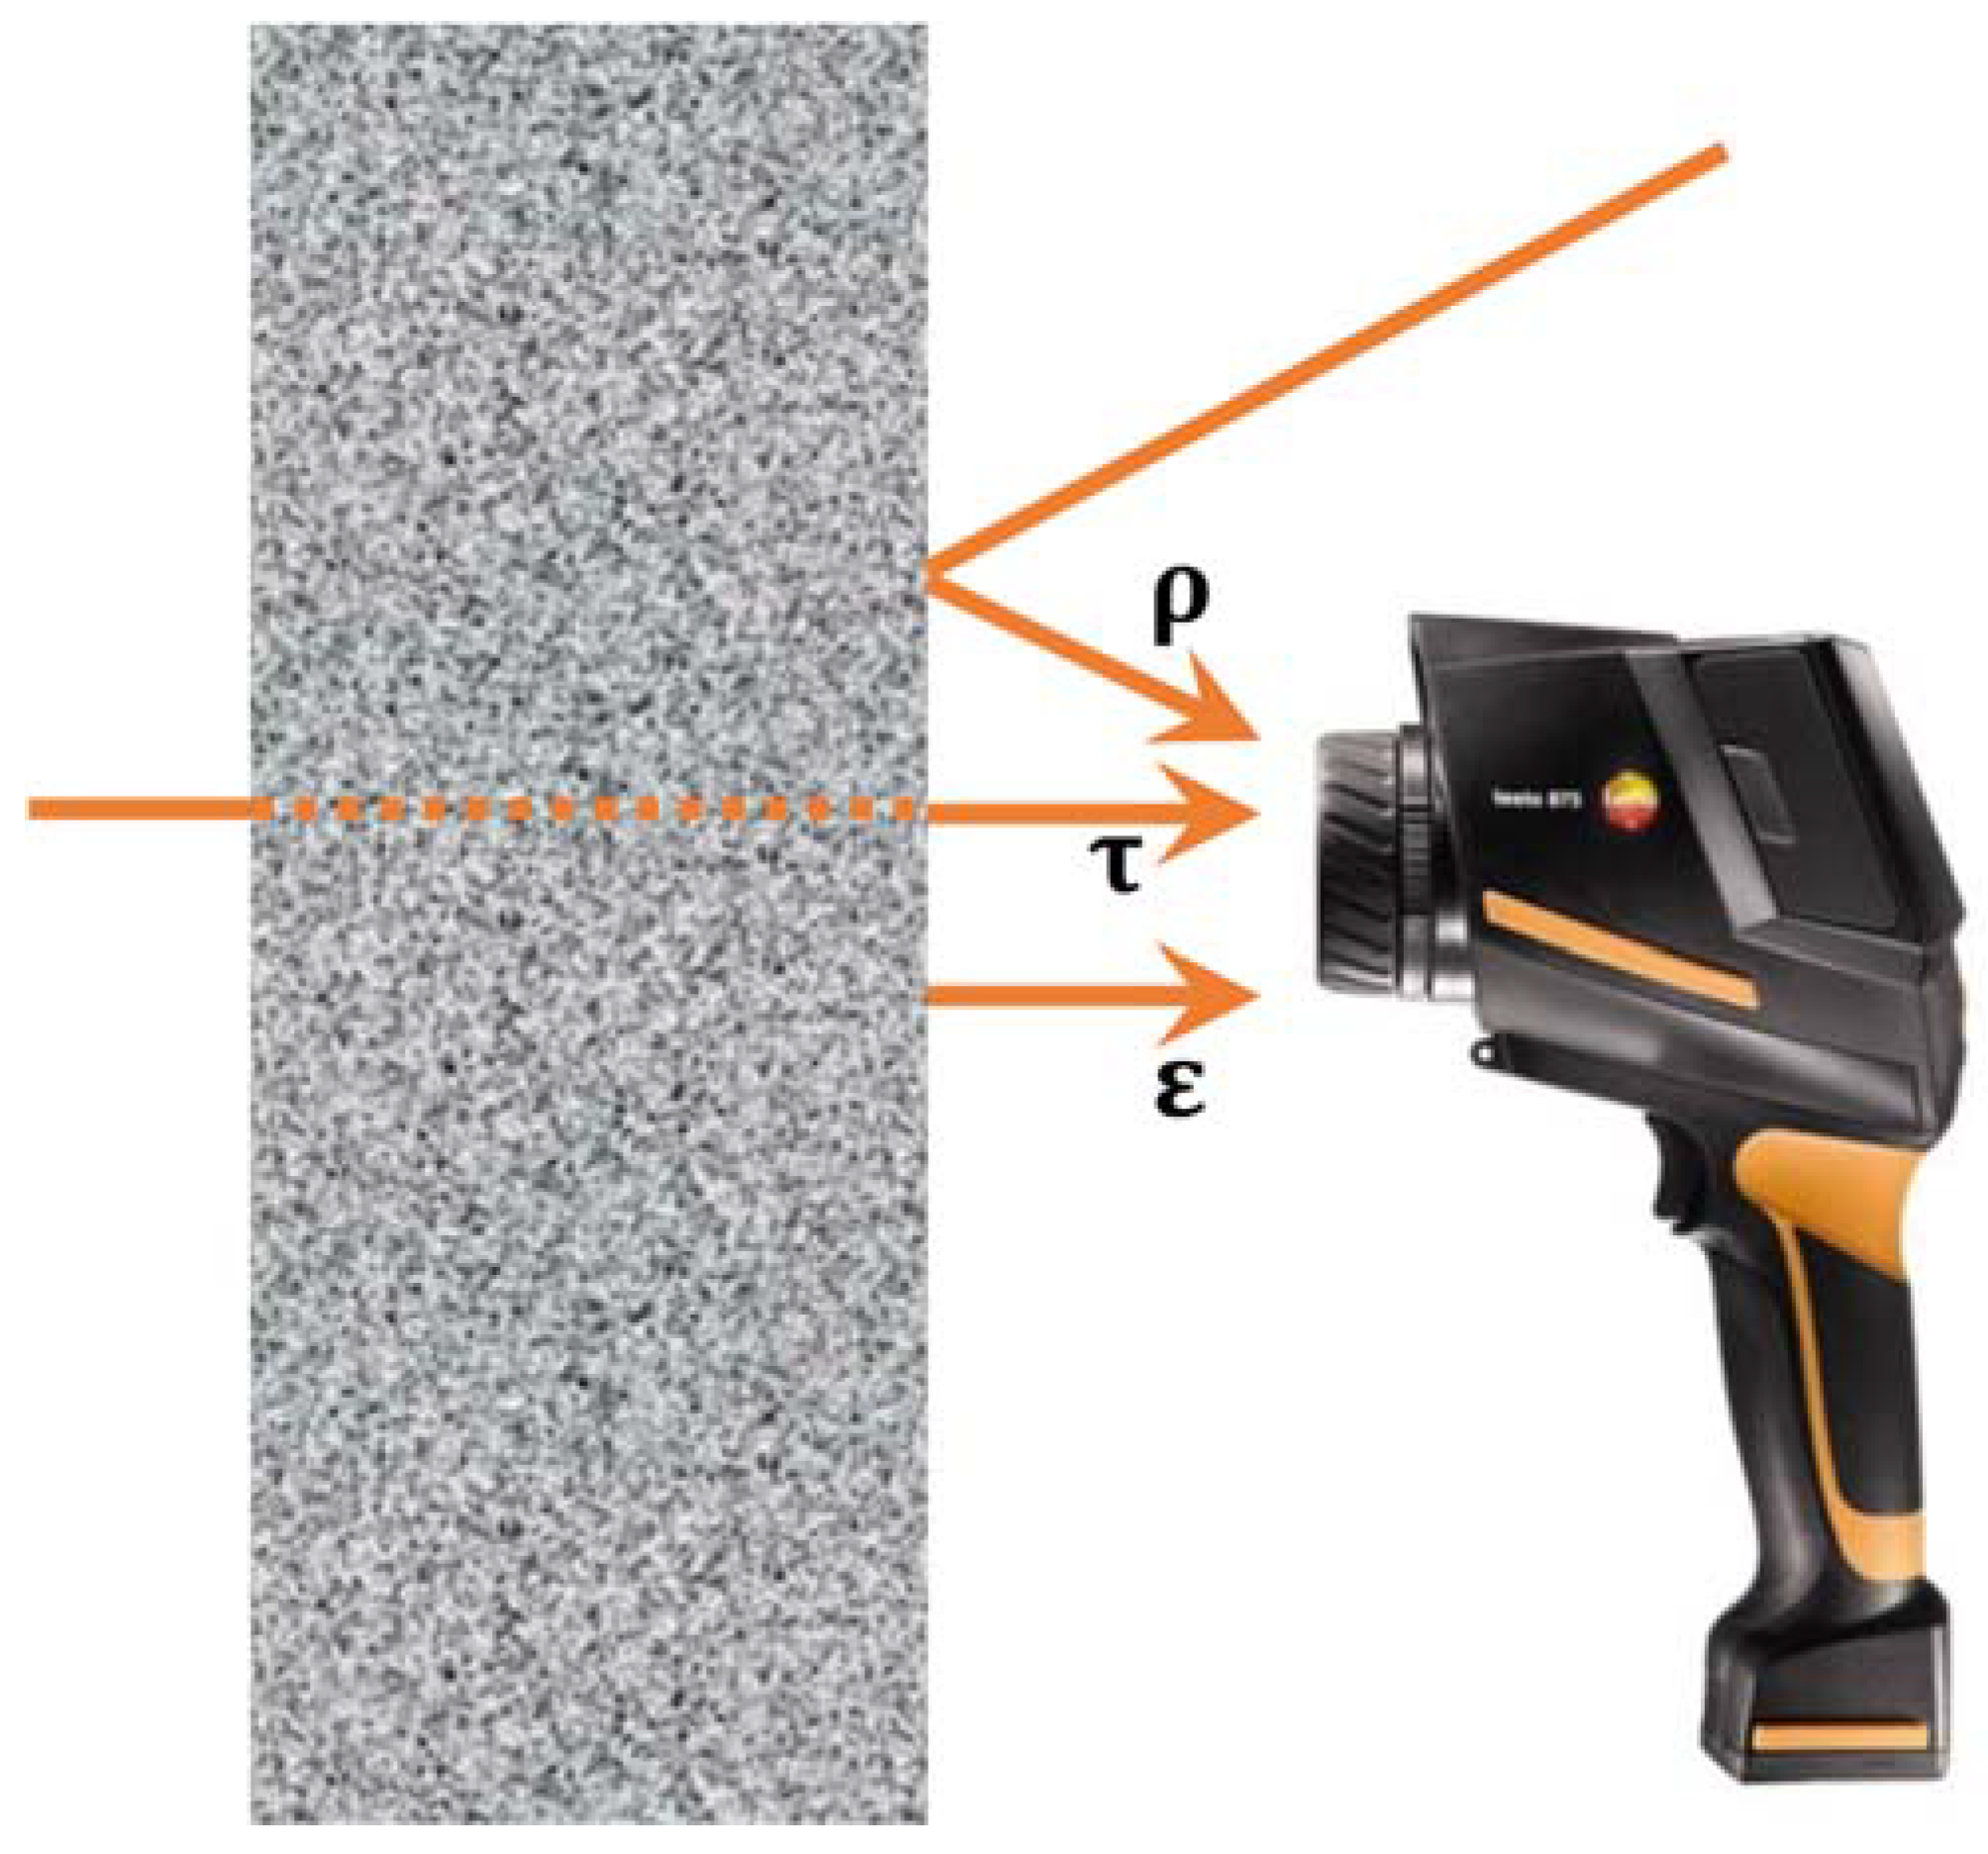
Figure 6.
The Torre del Oro, in Seville: (a) photographic image of the south façade; (b) thermogram superimposed on the photograph in Figure 6 (a), where the different types of materials used can be seen (photographs by the author).
Figure 6.
The Torre del Oro, in Seville: (a) photographic image of the south façade; (b) thermogram superimposed on the photograph in Figure 6 (a), where the different types of materials used can be seen (photographs by the author).
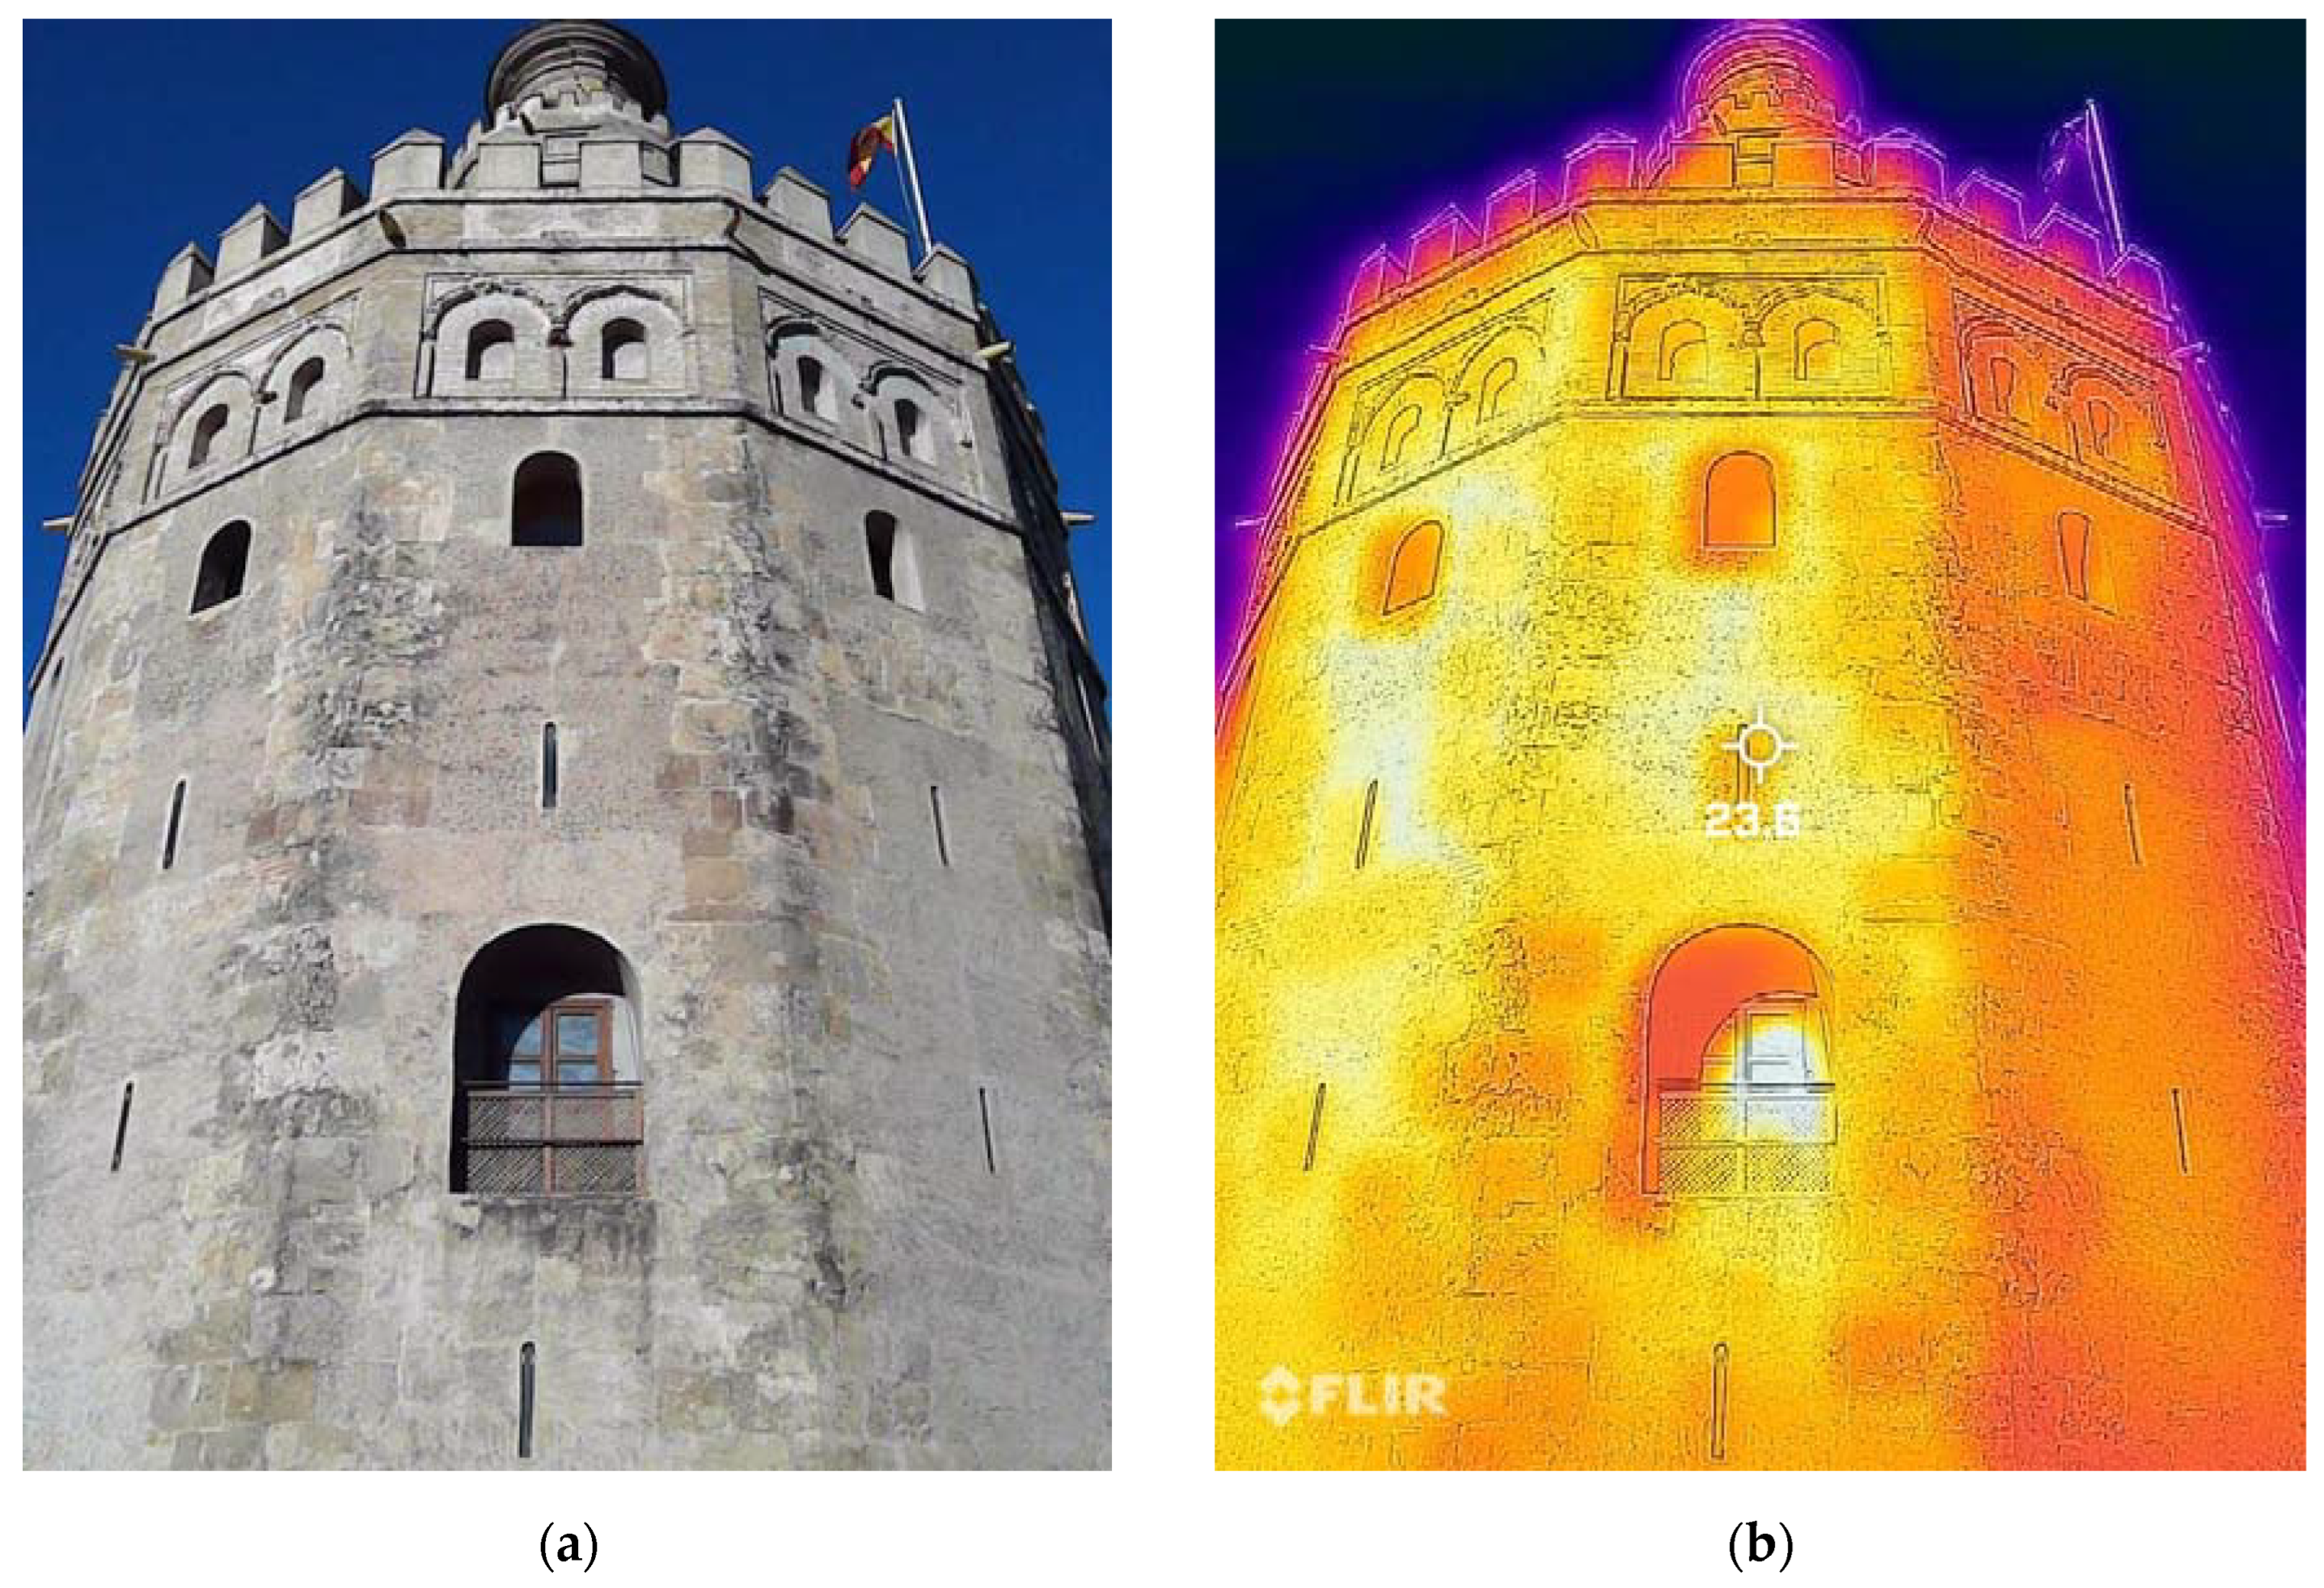
Figure 8.
Detail of the western enclosure wall of the Tower of Hercules: (a) image captured by a camera, where the constituent materials can be observed: granite with mortar; (b) thermogram where the differentiation between the different ashlars of the wall can be clearly observed.
Figure 8.
Detail of the western enclosure wall of the Tower of Hercules: (a) image captured by a camera, where the constituent materials can be observed: granite with mortar; (b) thermogram where the differentiation between the different ashlars of the wall can be clearly observed.
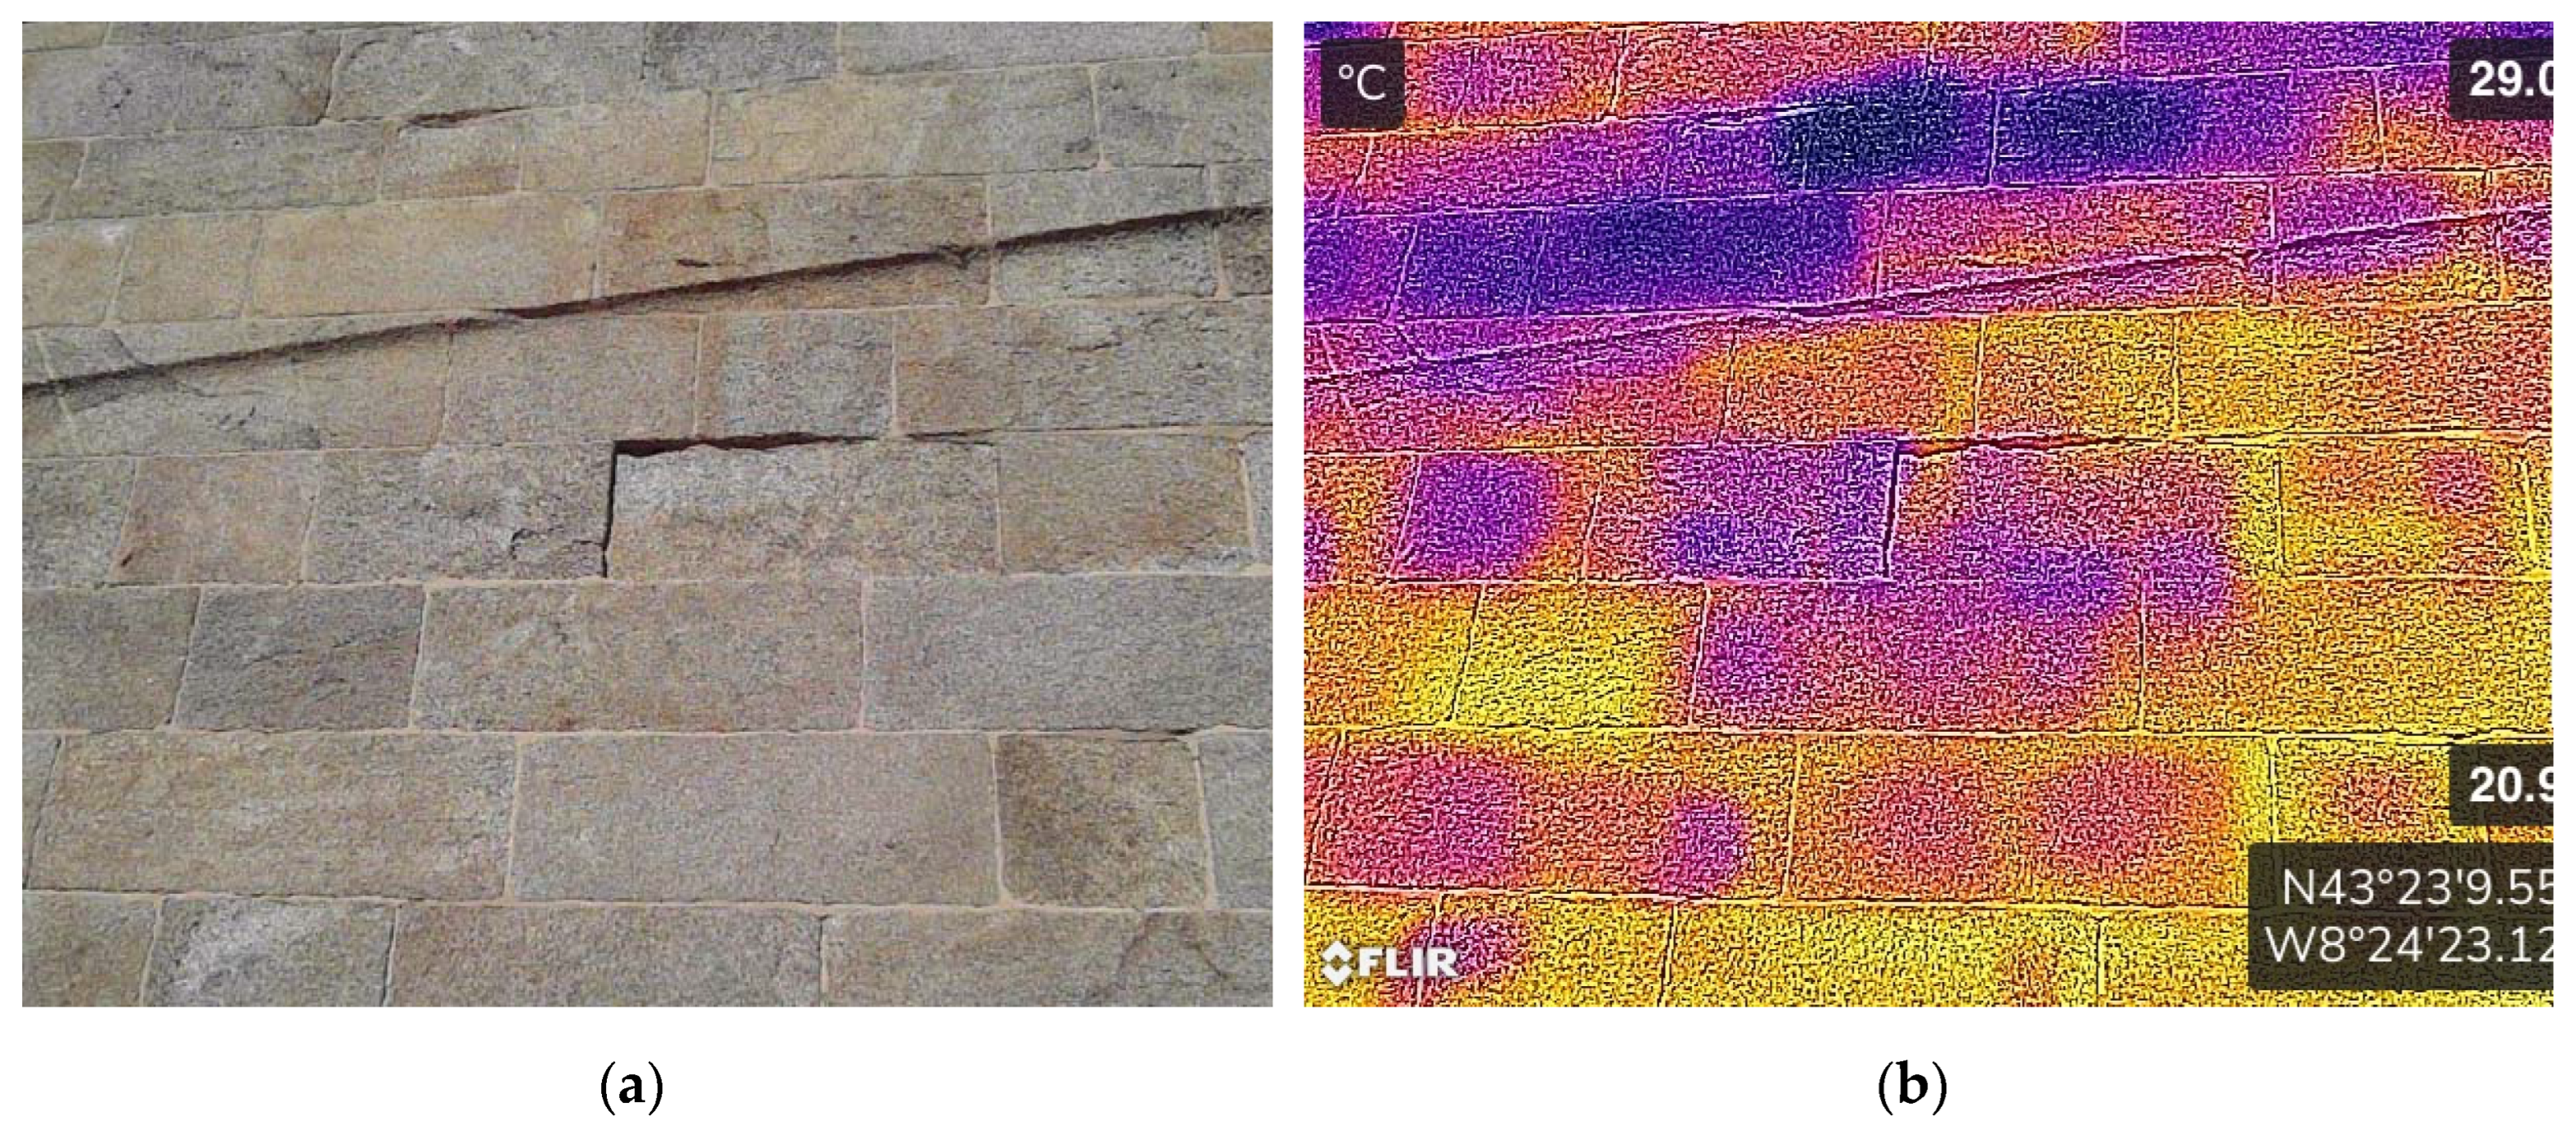
Figure 9.
Detail of the east facade of the Giralda tower, bell tower of the Cathedral of Seville: (a) image captured by a photographic camera, where moisture can be observed; (b) thermogram on the photograph in Figure 9 (a), where the thermographic camera has been able to capture the different degrees of moisture in the brick (photographs by the author).
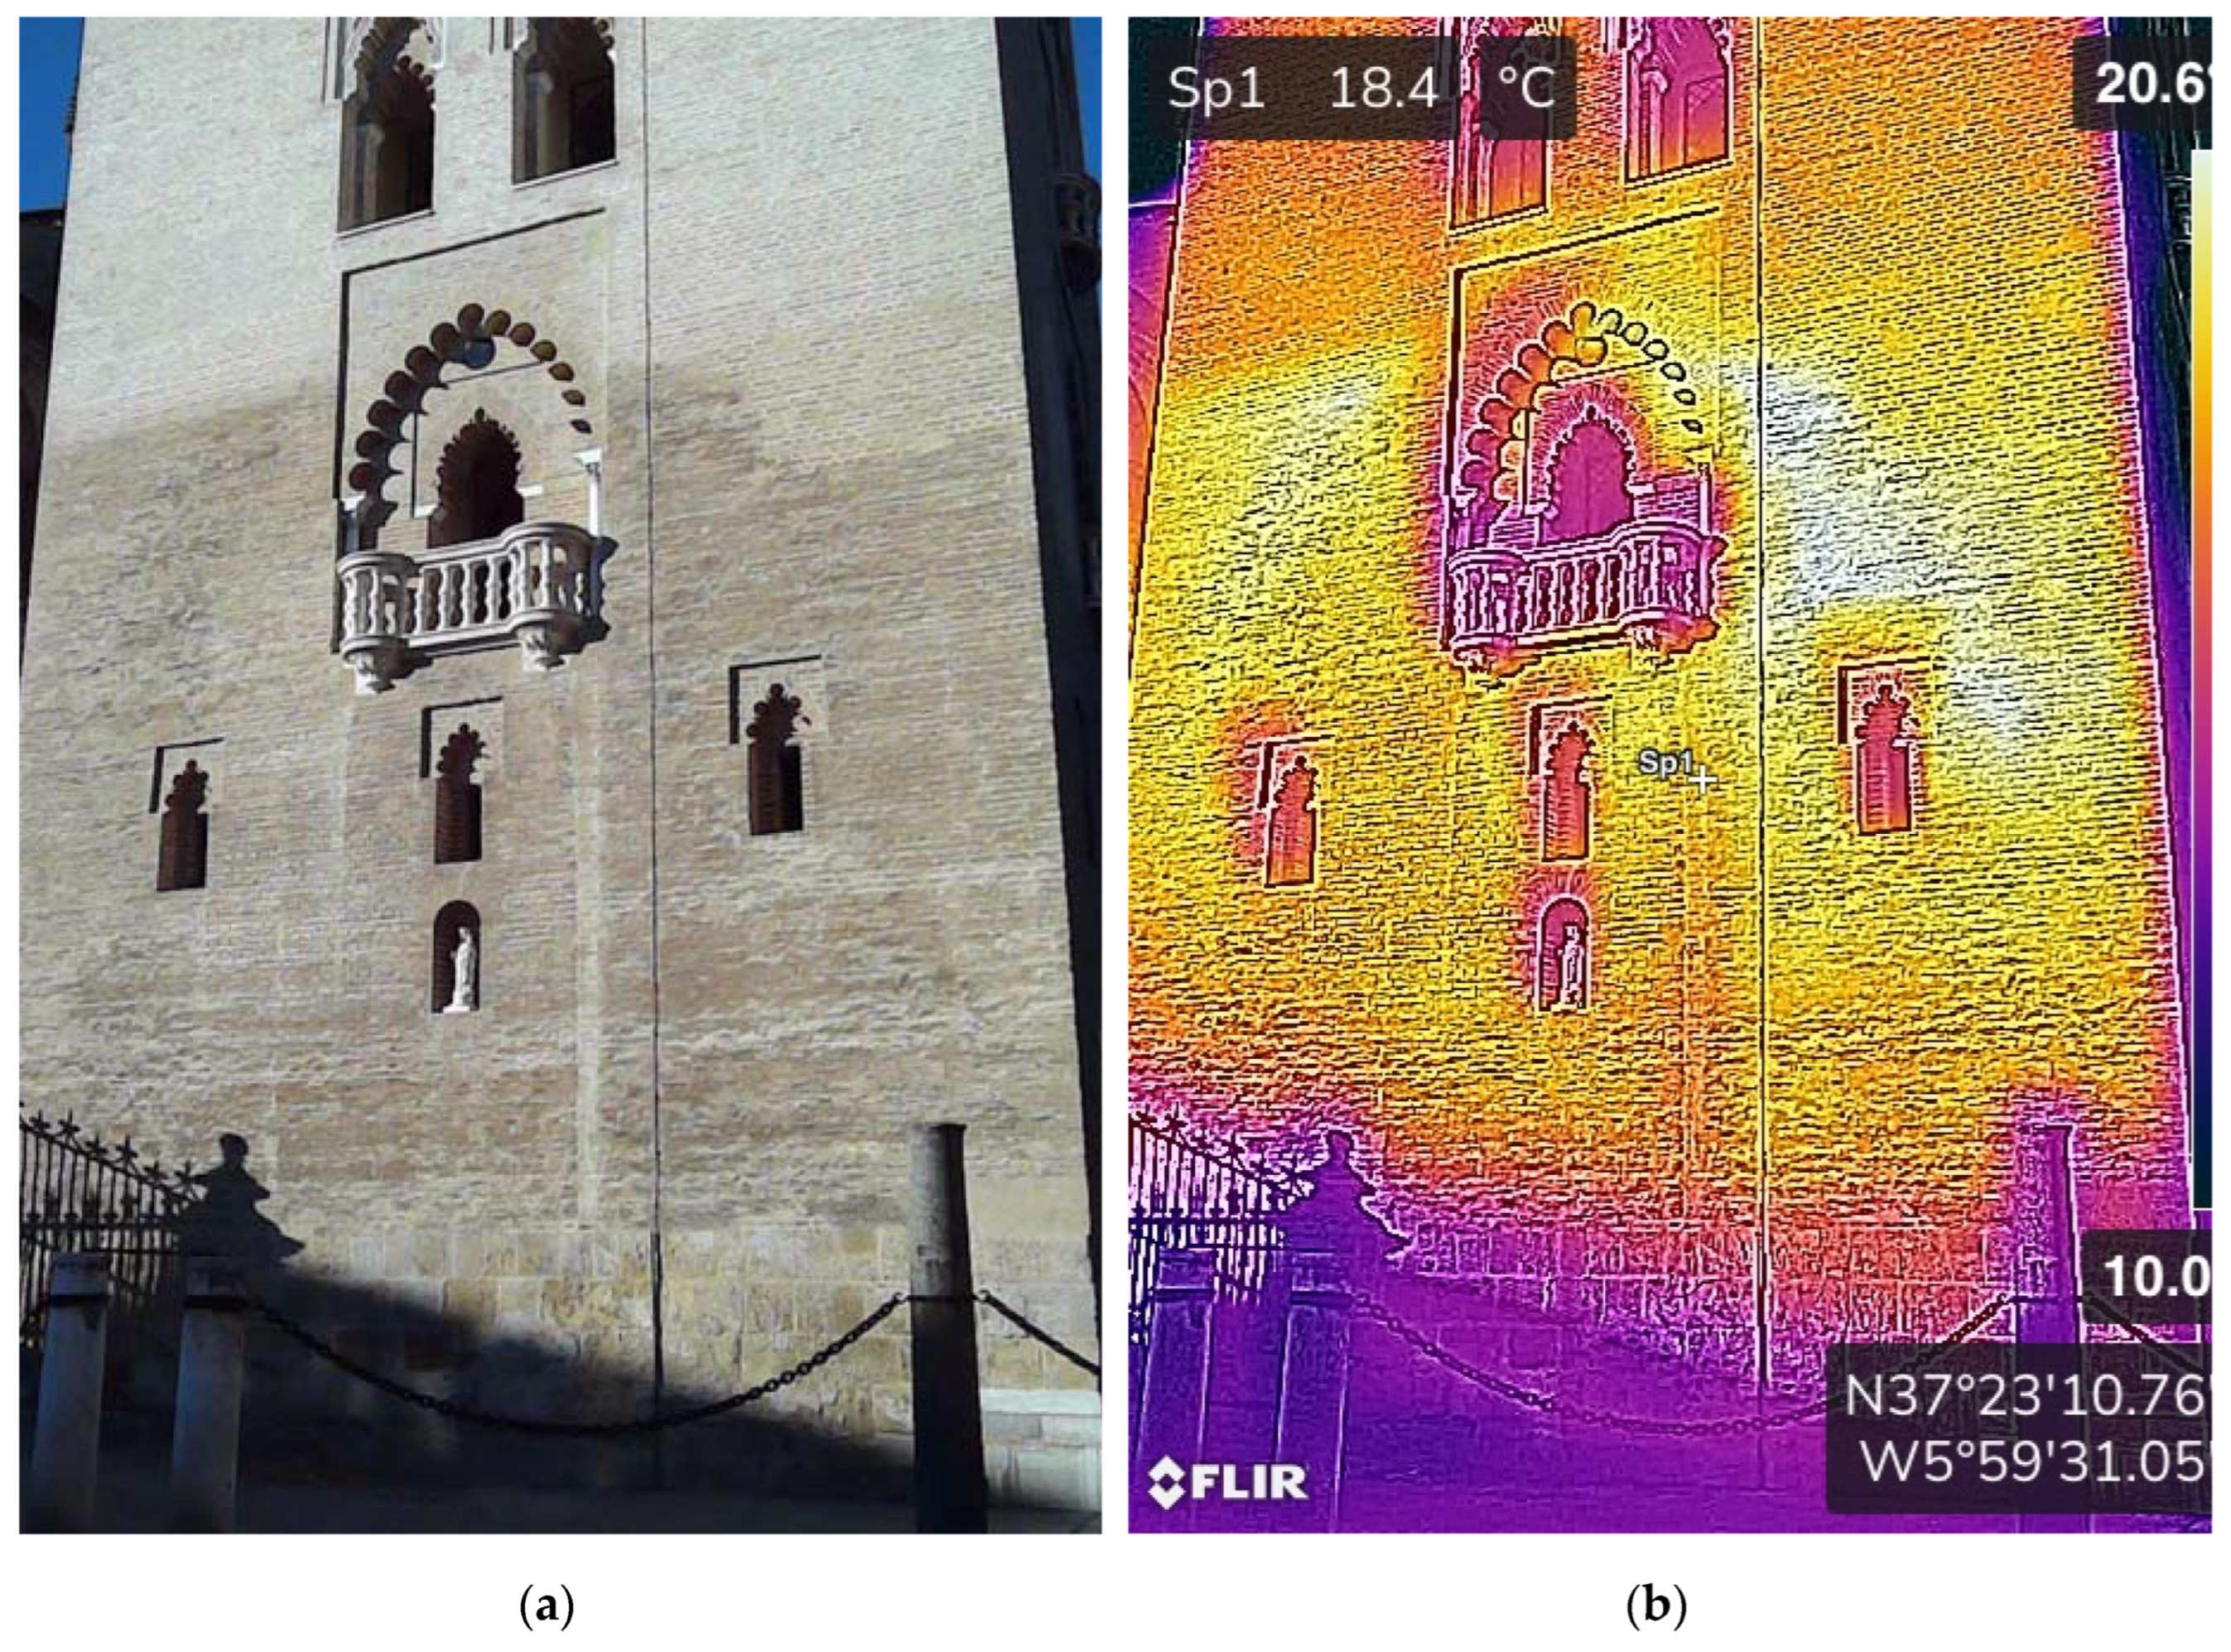
Figure 10.
Detail of the enclosure wall at the base of the southeast façade of the Miguelete Tower, bell tower of the Valencia Cathedral (a) with diverse materials and in different states of deterioration; (b) detailed thermographic analysis of the constituent materials, where the thermographic camera is able to capture the differences between them (photographs by the author).
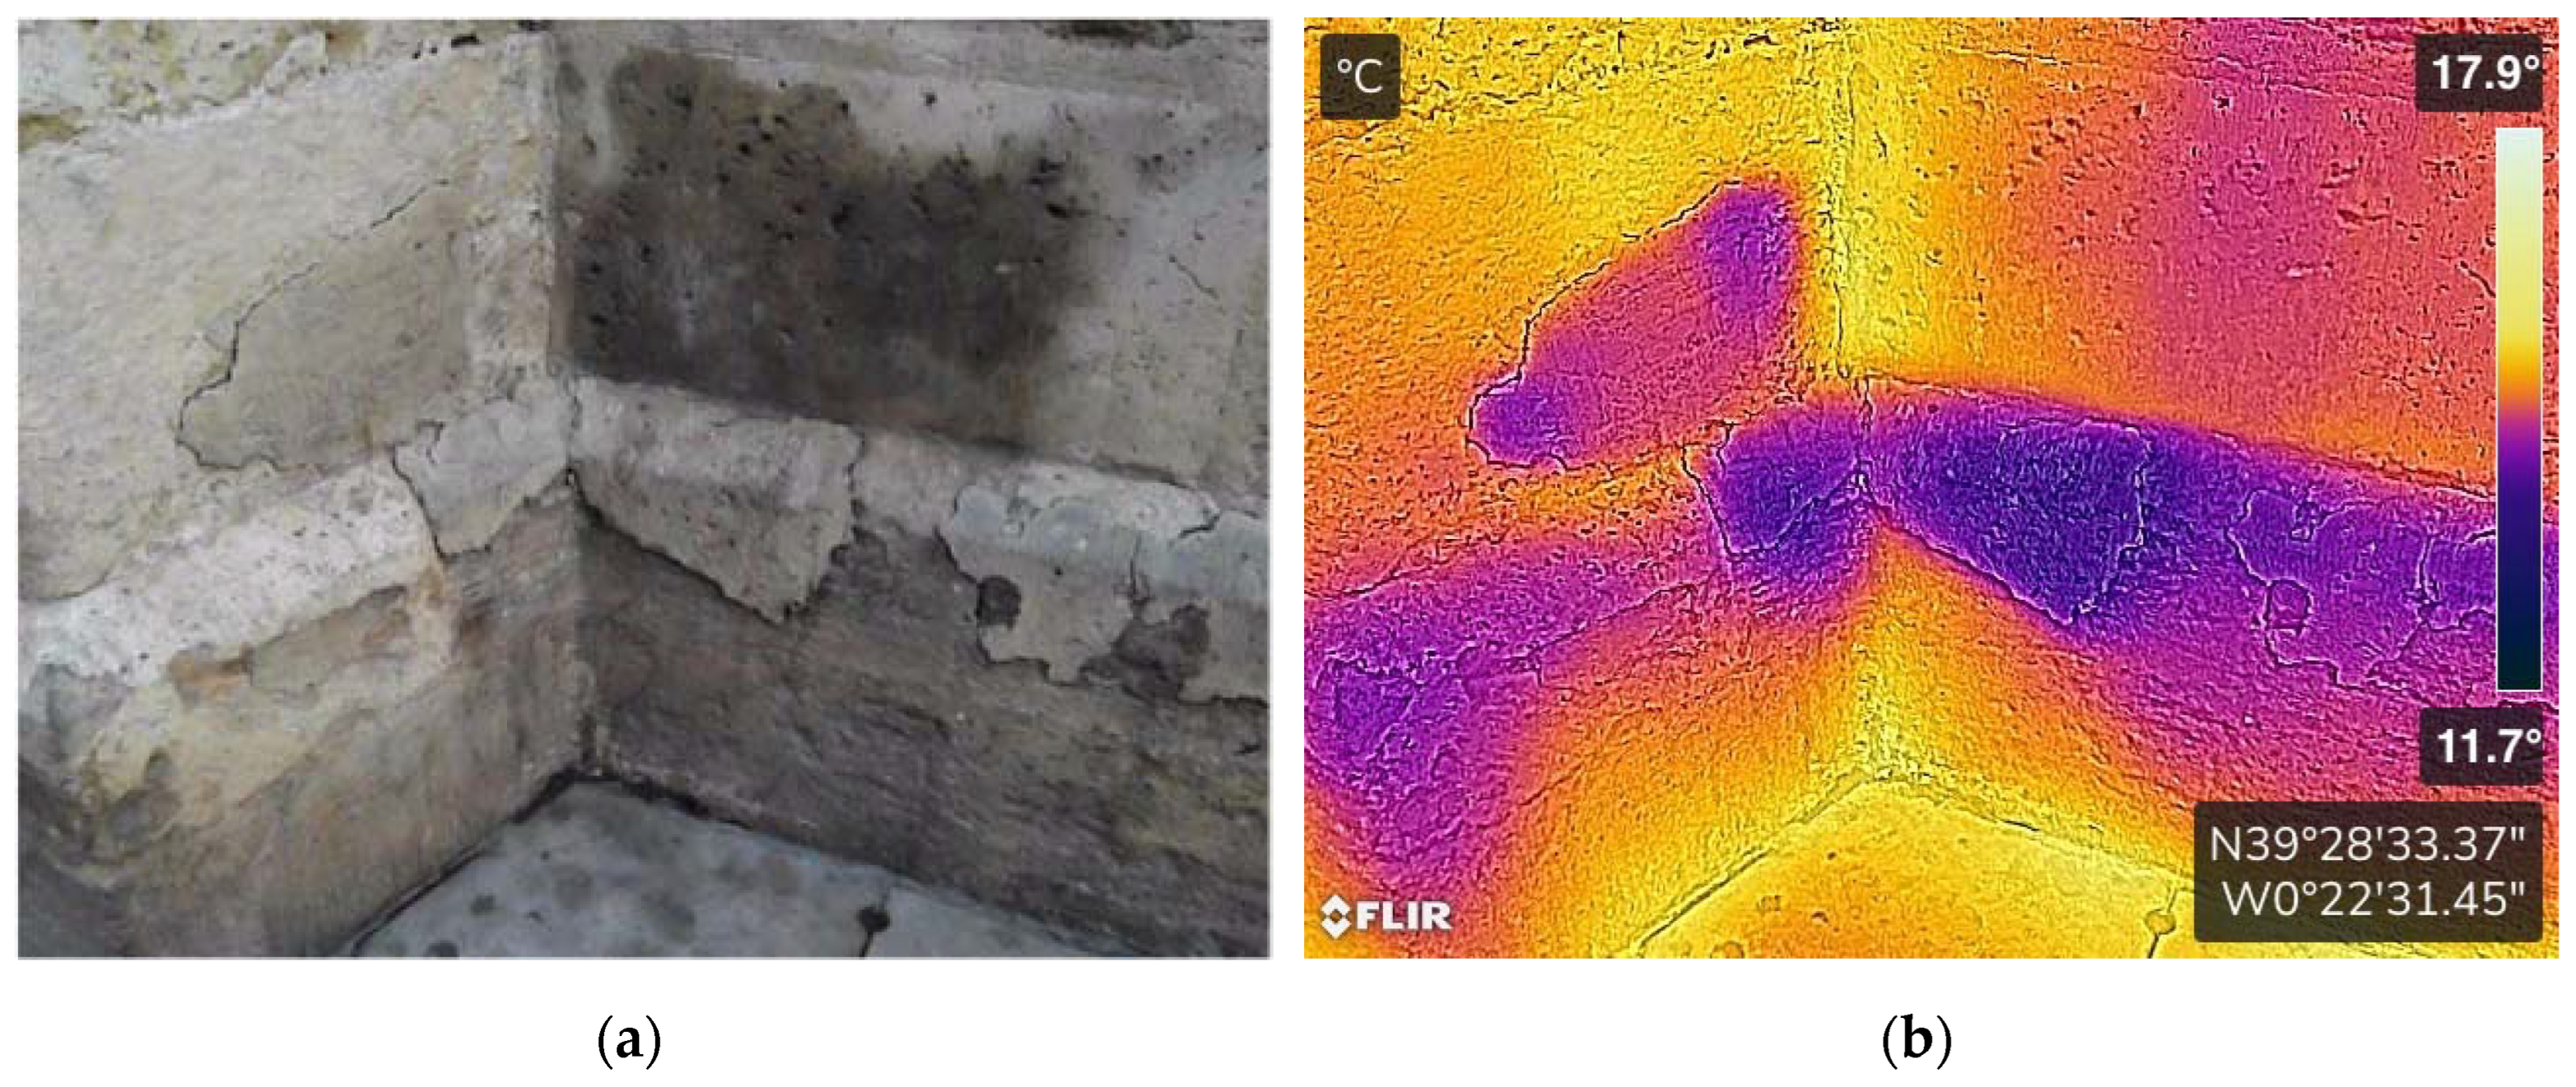
Figure 11.
Comparative analysis between the rigidity of terrestrial thermography and the flexibility of aerial thermography (diagram by the author).
Figure 11.
Comparative analysis between the rigidity of terrestrial thermography and the flexibility of aerial thermography (diagram by the author).
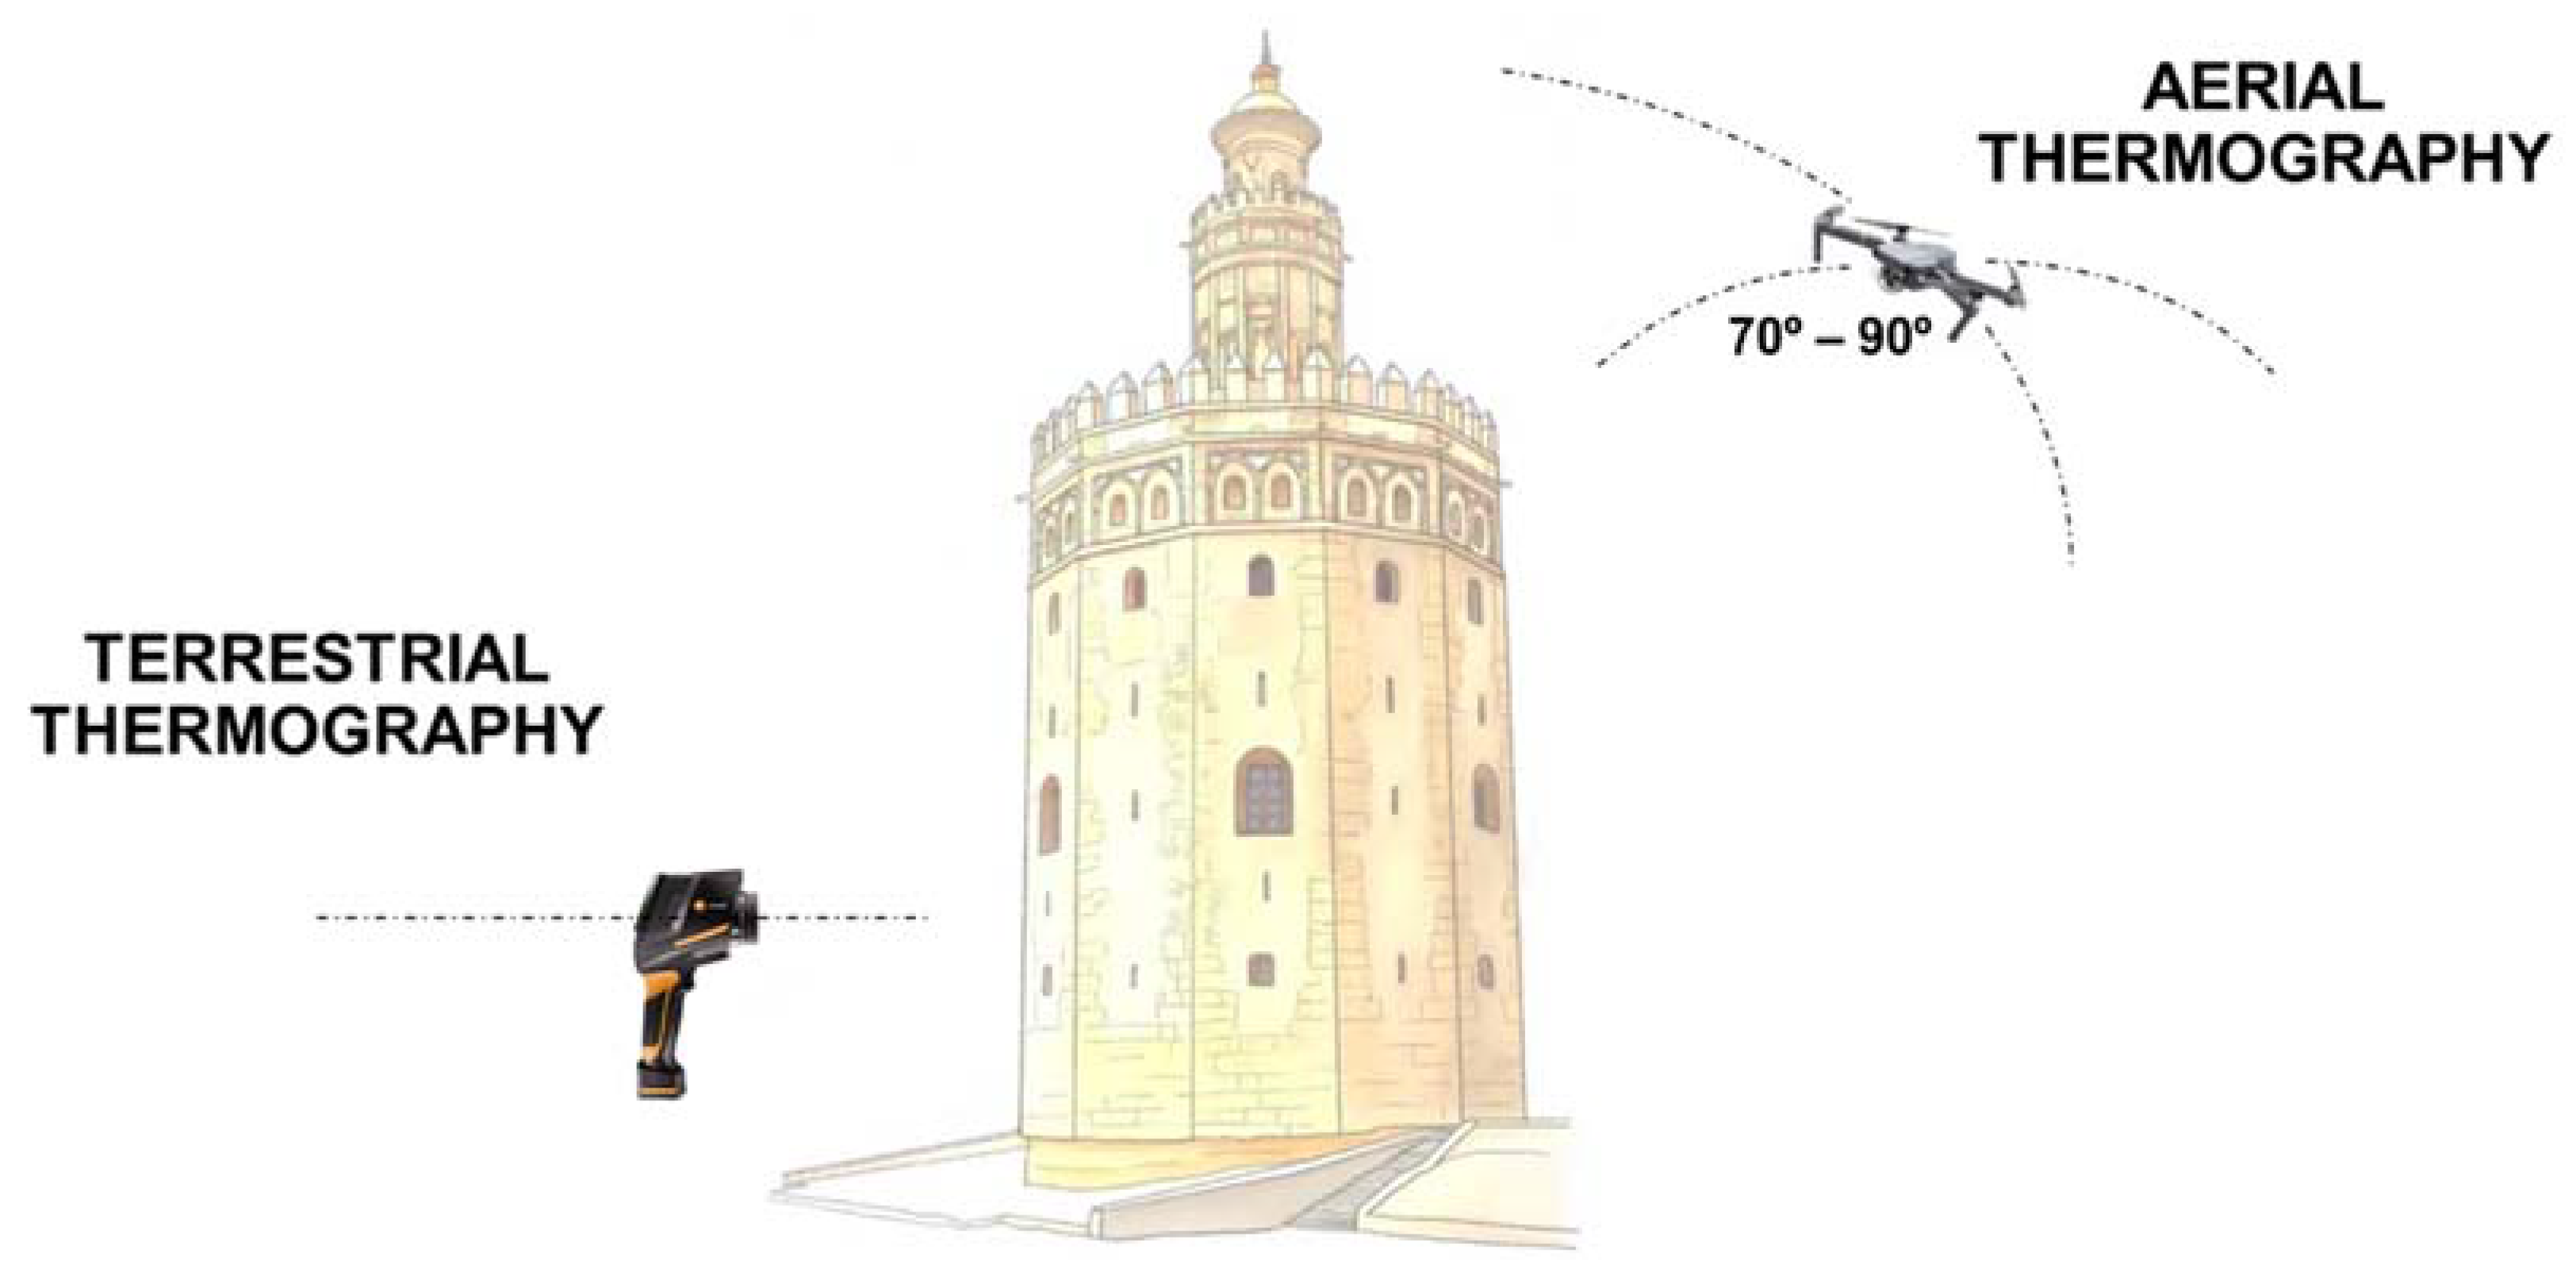
Figure 12.
General view of the quadcopter drone with a thermal imaging camera used during the inspection of the first pier of the Alcántara Bridge, on its west side (photograph by the author).
Figure 12.
General view of the quadcopter drone with a thermal imaging camera used during the inspection of the first pier of the Alcántara Bridge, on its west side (photograph by the author).
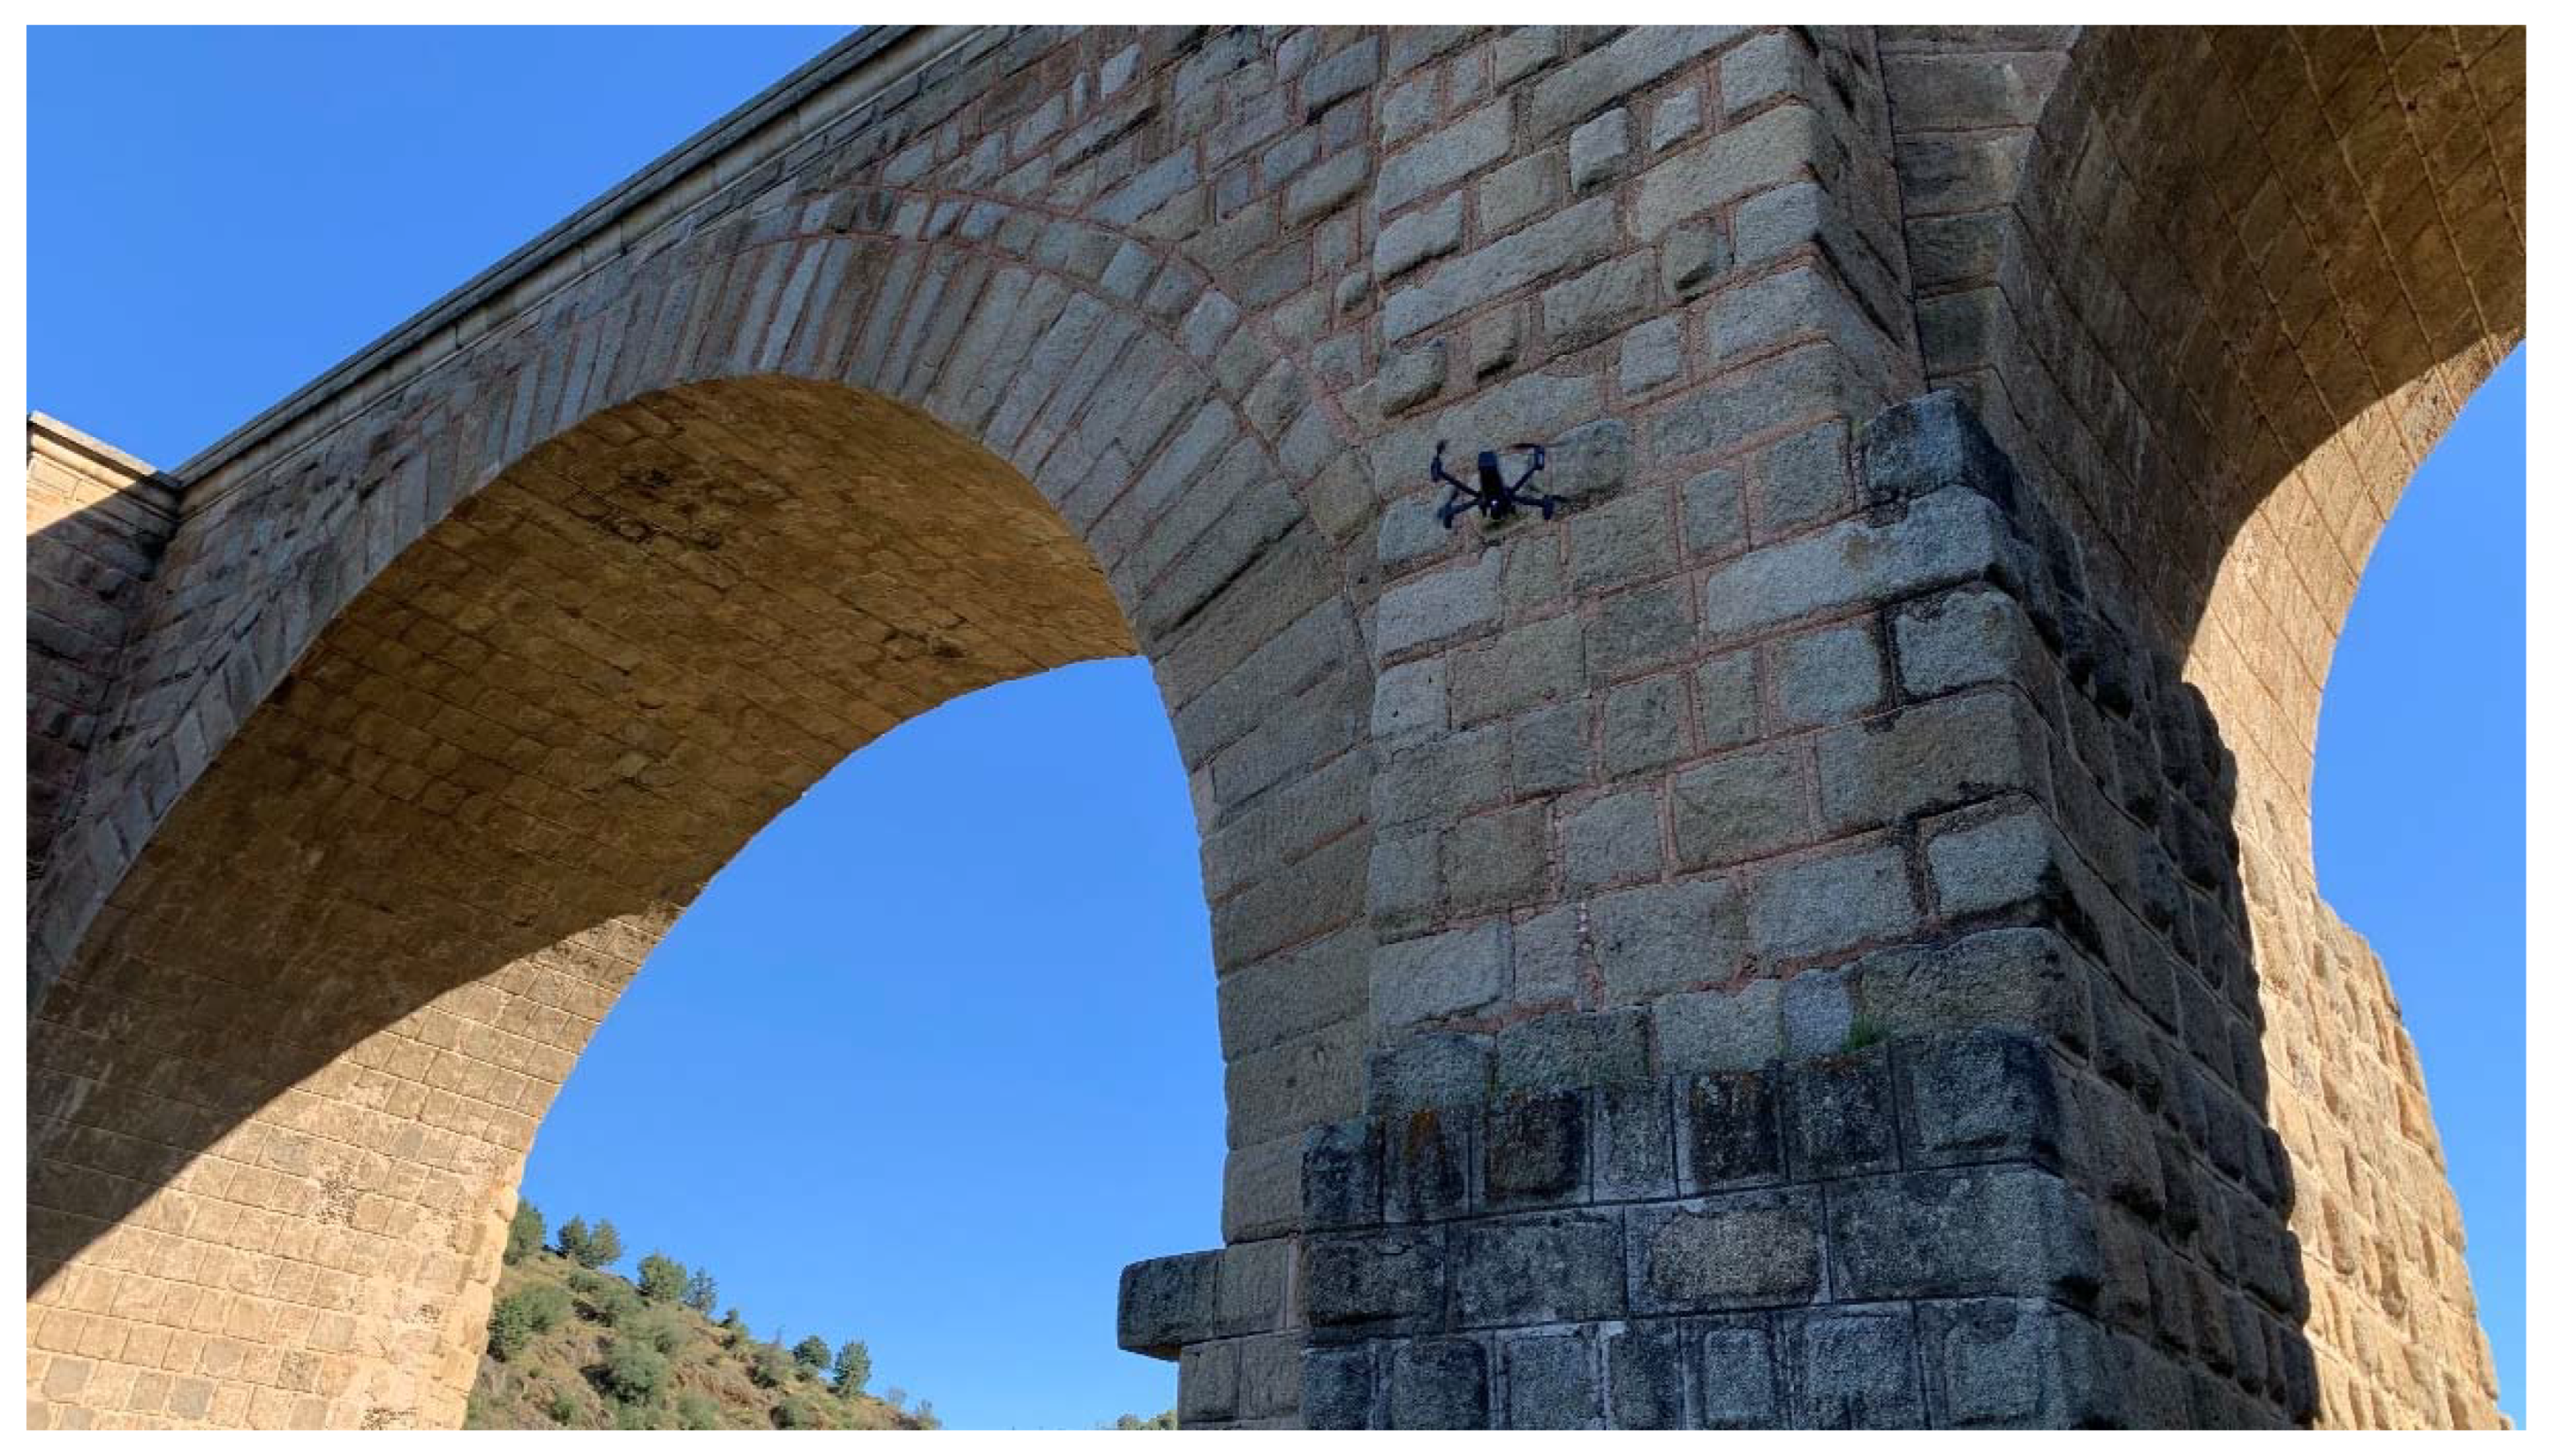
Figure 13.
Photographic image captured by the drone during the flight, ascending 15 m above the position shown in Figure 12, where the lime mortar joints and the presence of organic matter and vegetation can be observed (photograph by the author).
Figure 13.
Photographic image captured by the drone during the flight, ascending 15 m above the position shown in Figure 12, where the lime mortar joints and the presence of organic matter and vegetation can be observed (photograph by the author).
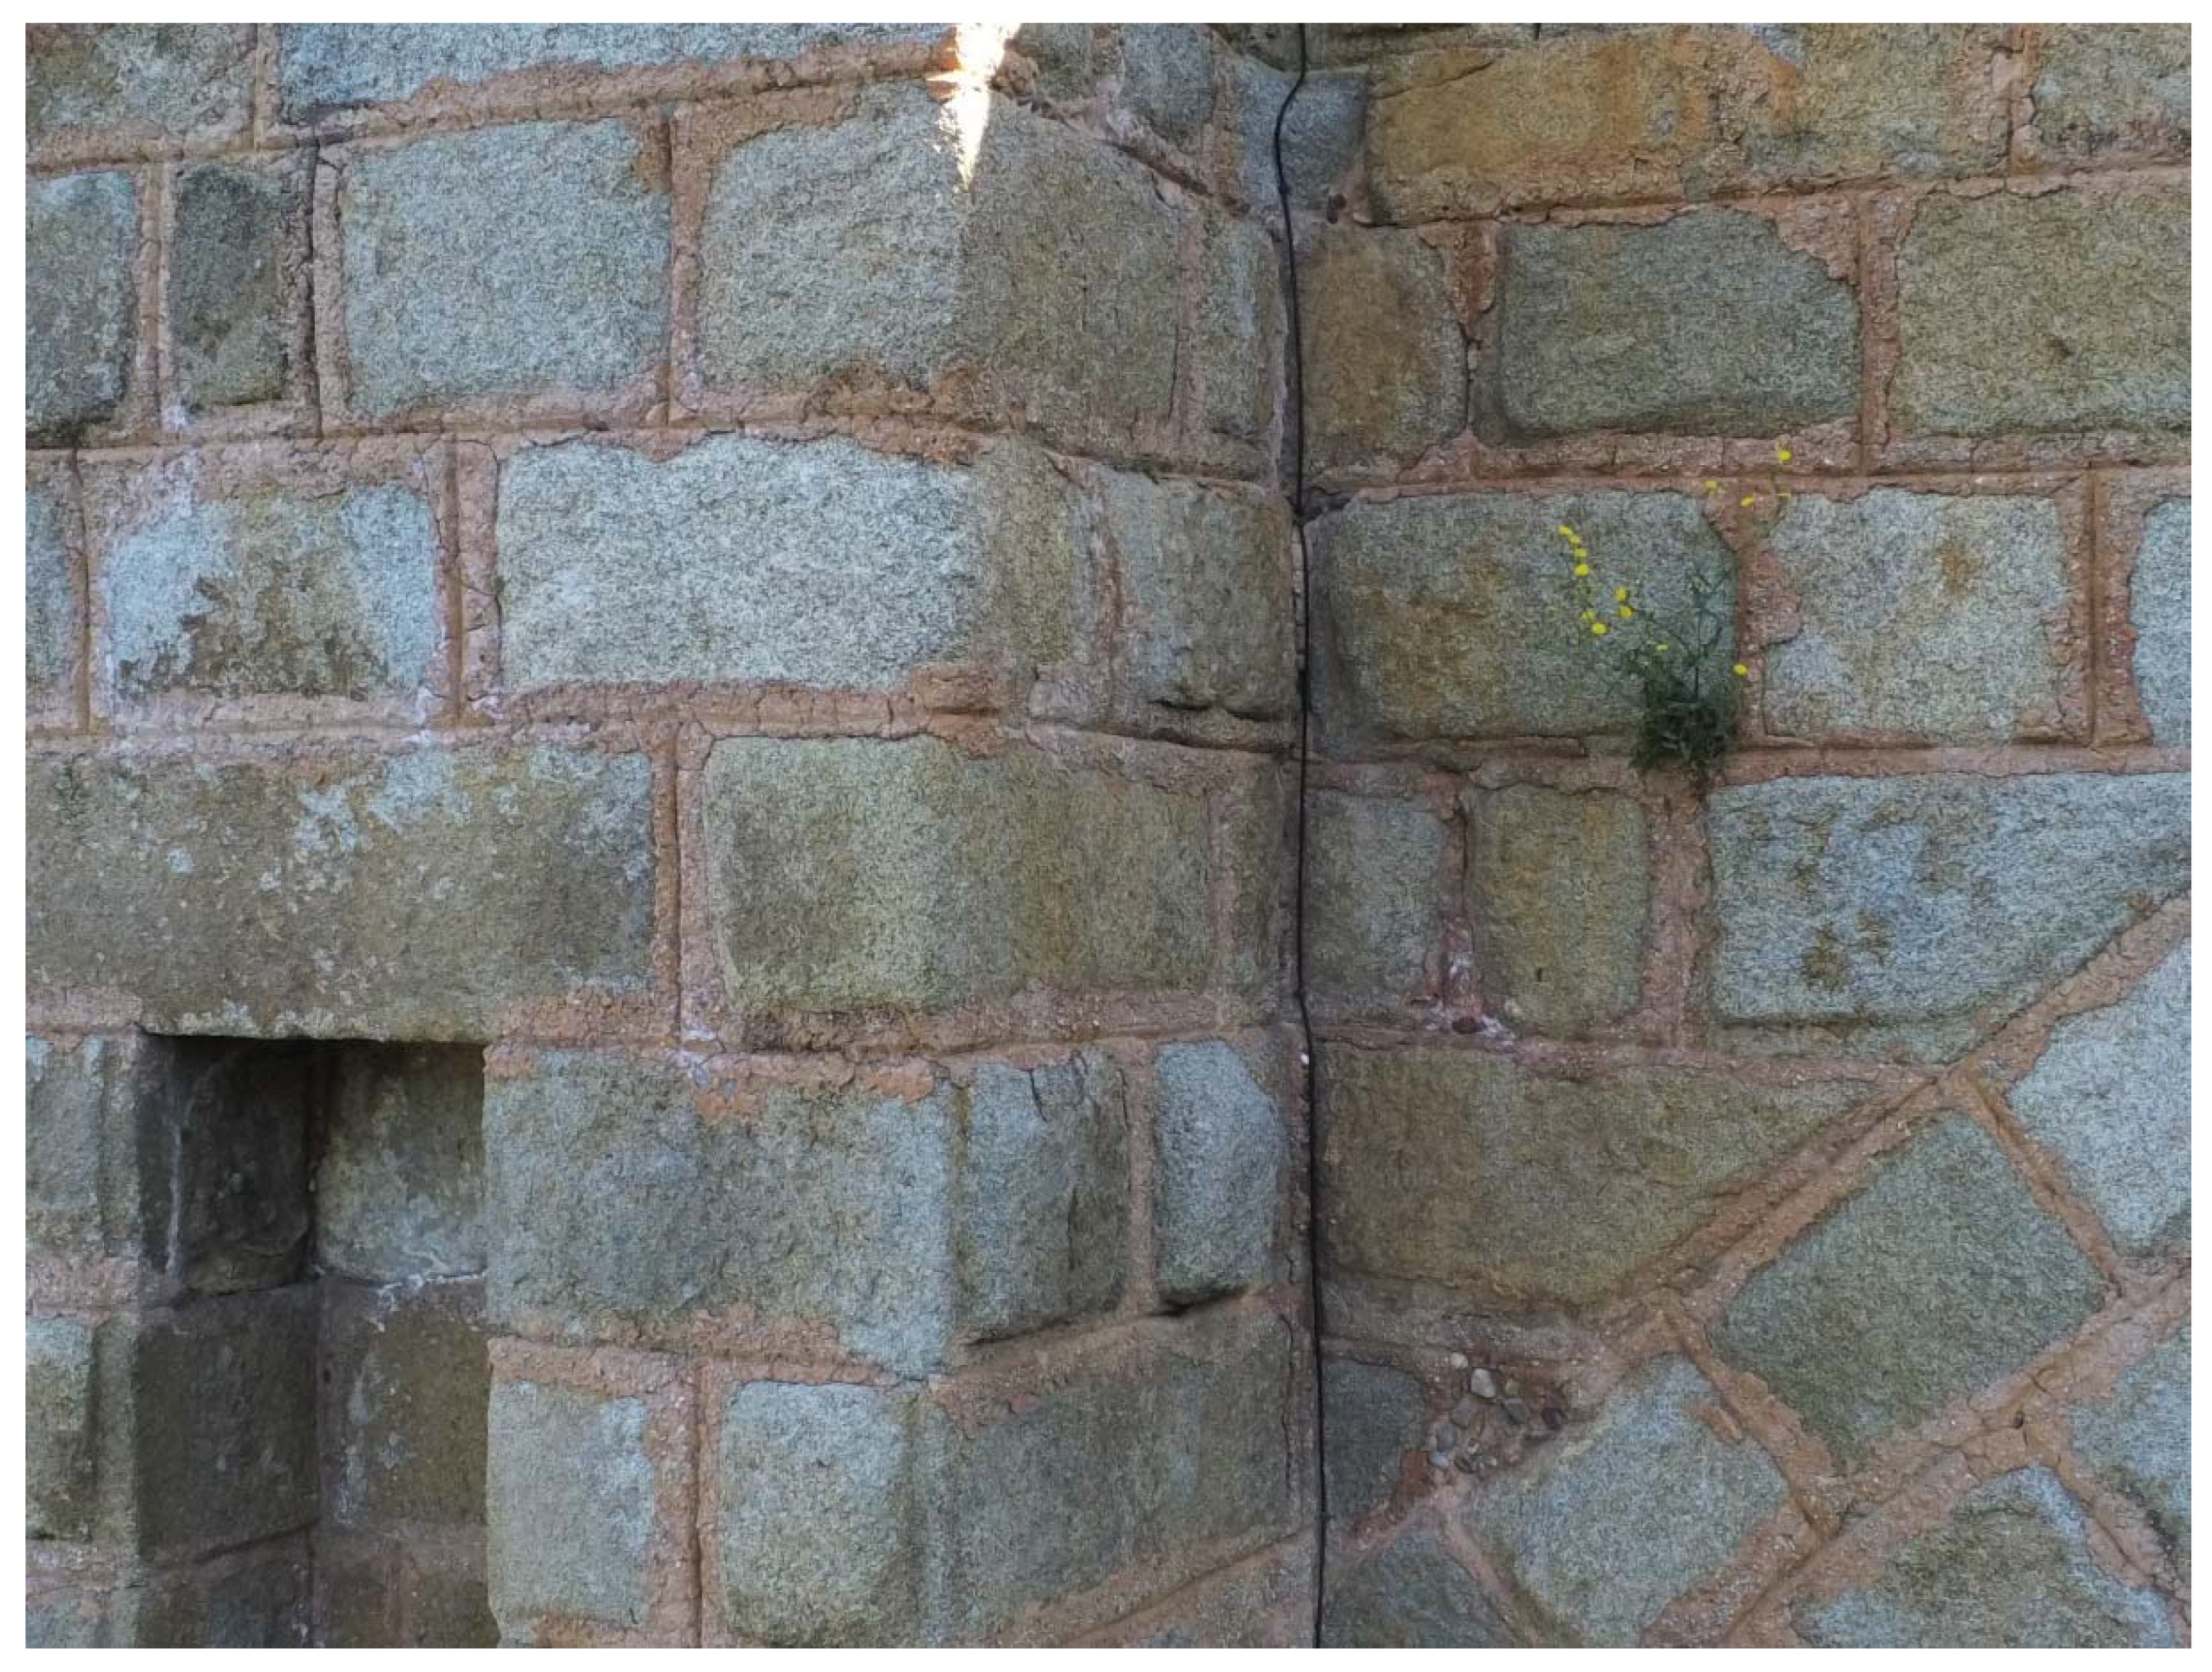
Figure 14.
Thermogram of the previous photograph (Figure 13): (a) location of the maximum temperature values; (b) location of the minimum temperature values (photographs by the author).
Figure 14.
Thermogram of the previous photograph (Figure 13): (a) location of the maximum temperature values; (b) location of the minimum temperature values (photographs by the author).
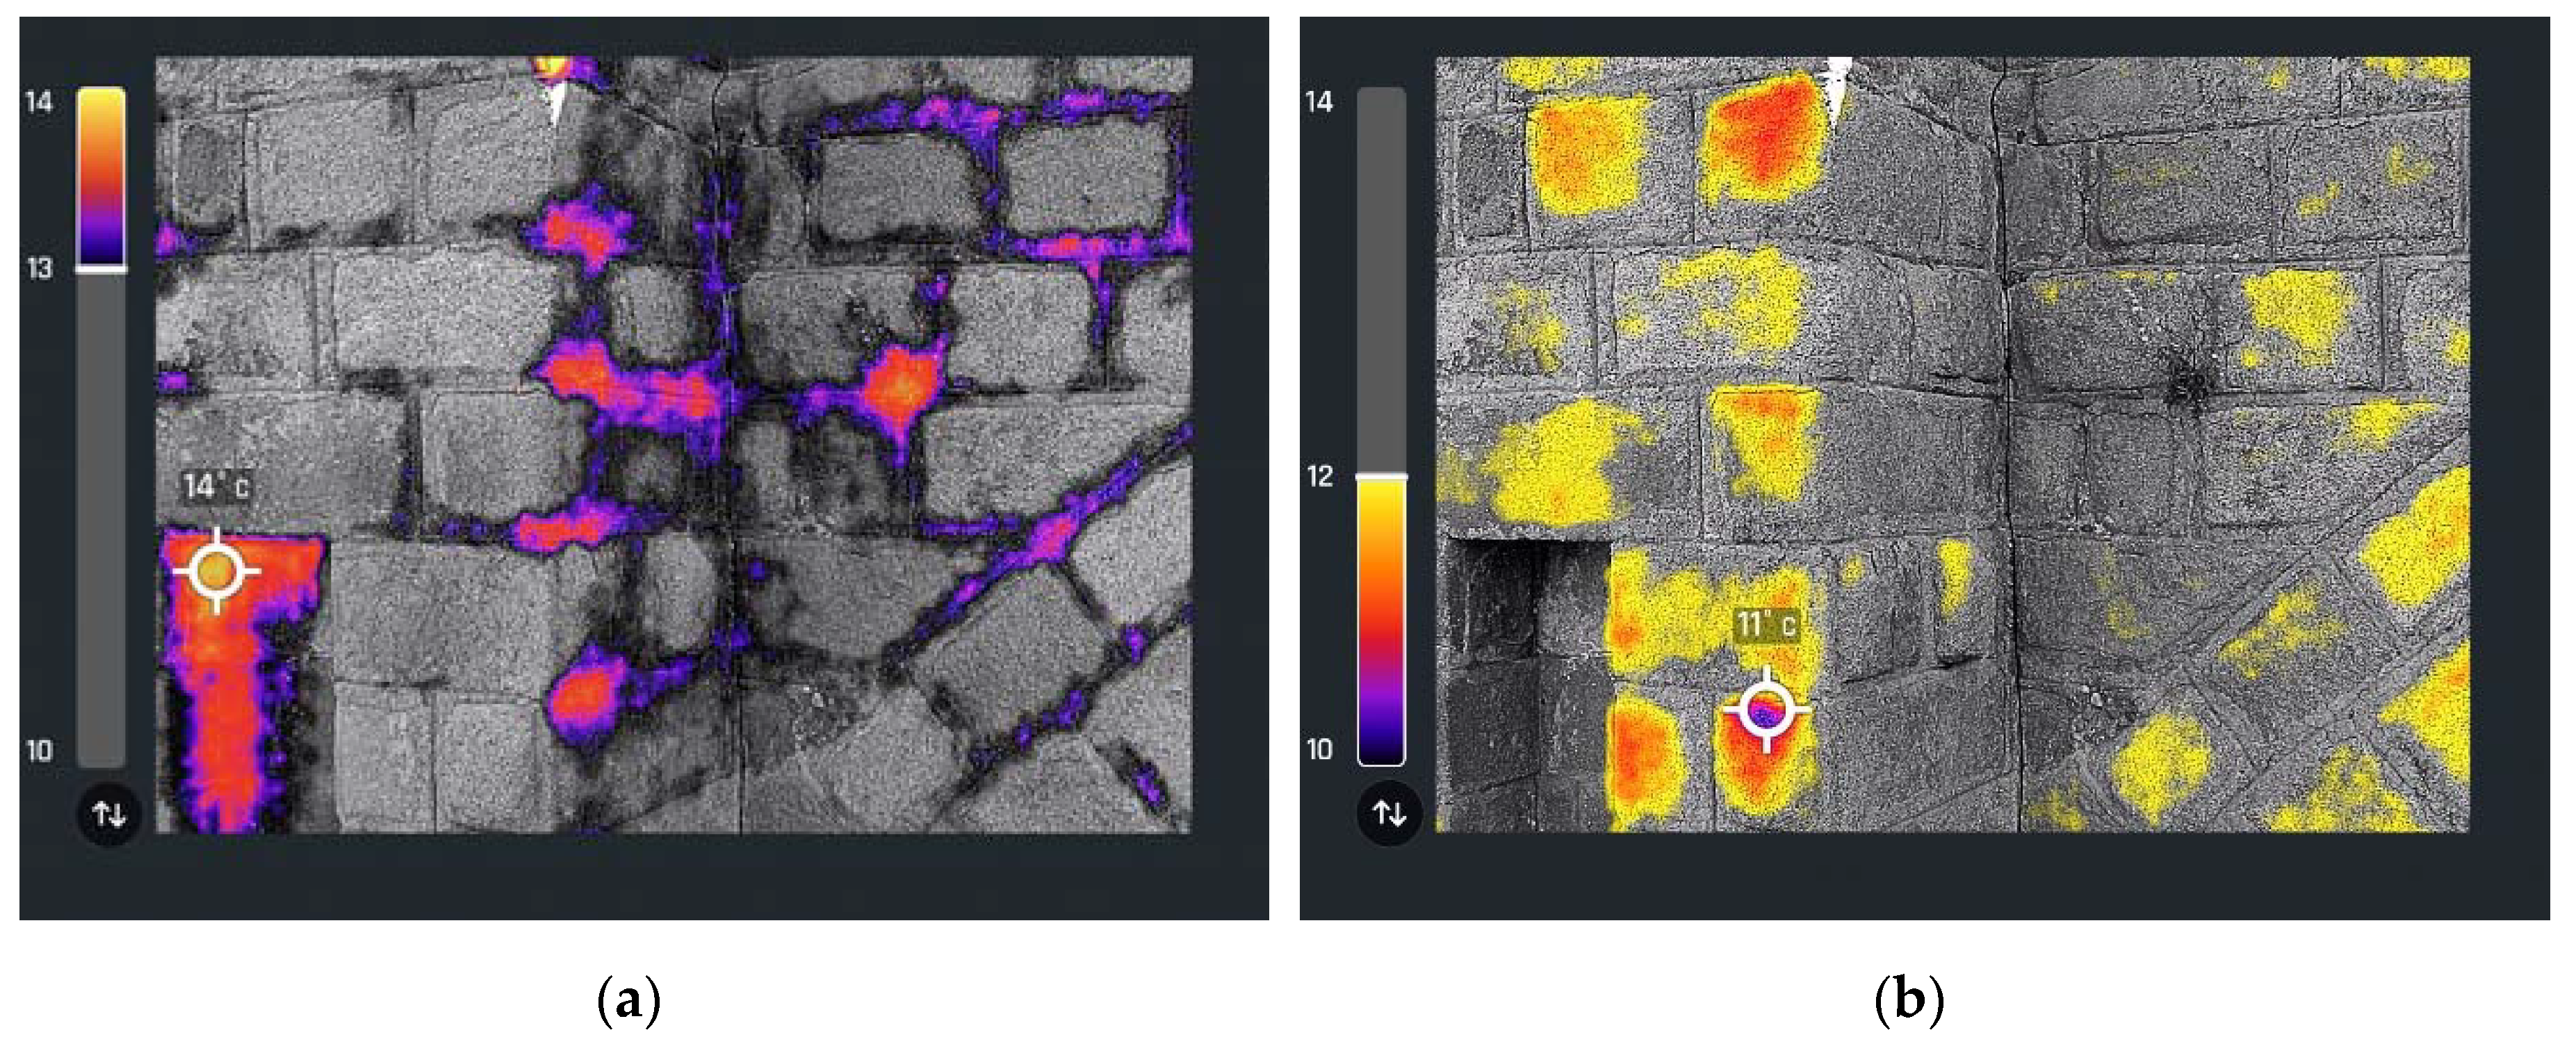
Figure 15.
View of the intrados of the first vault, in a photographic image taken with the drone, where some minor runoff and a black crust were located around its drainage point (photograph by the author).
Figure 15.
View of the intrados of the first vault, in a photographic image taken with the drone, where some minor runoff and a black crust were located around its drainage point (photograph by the author).
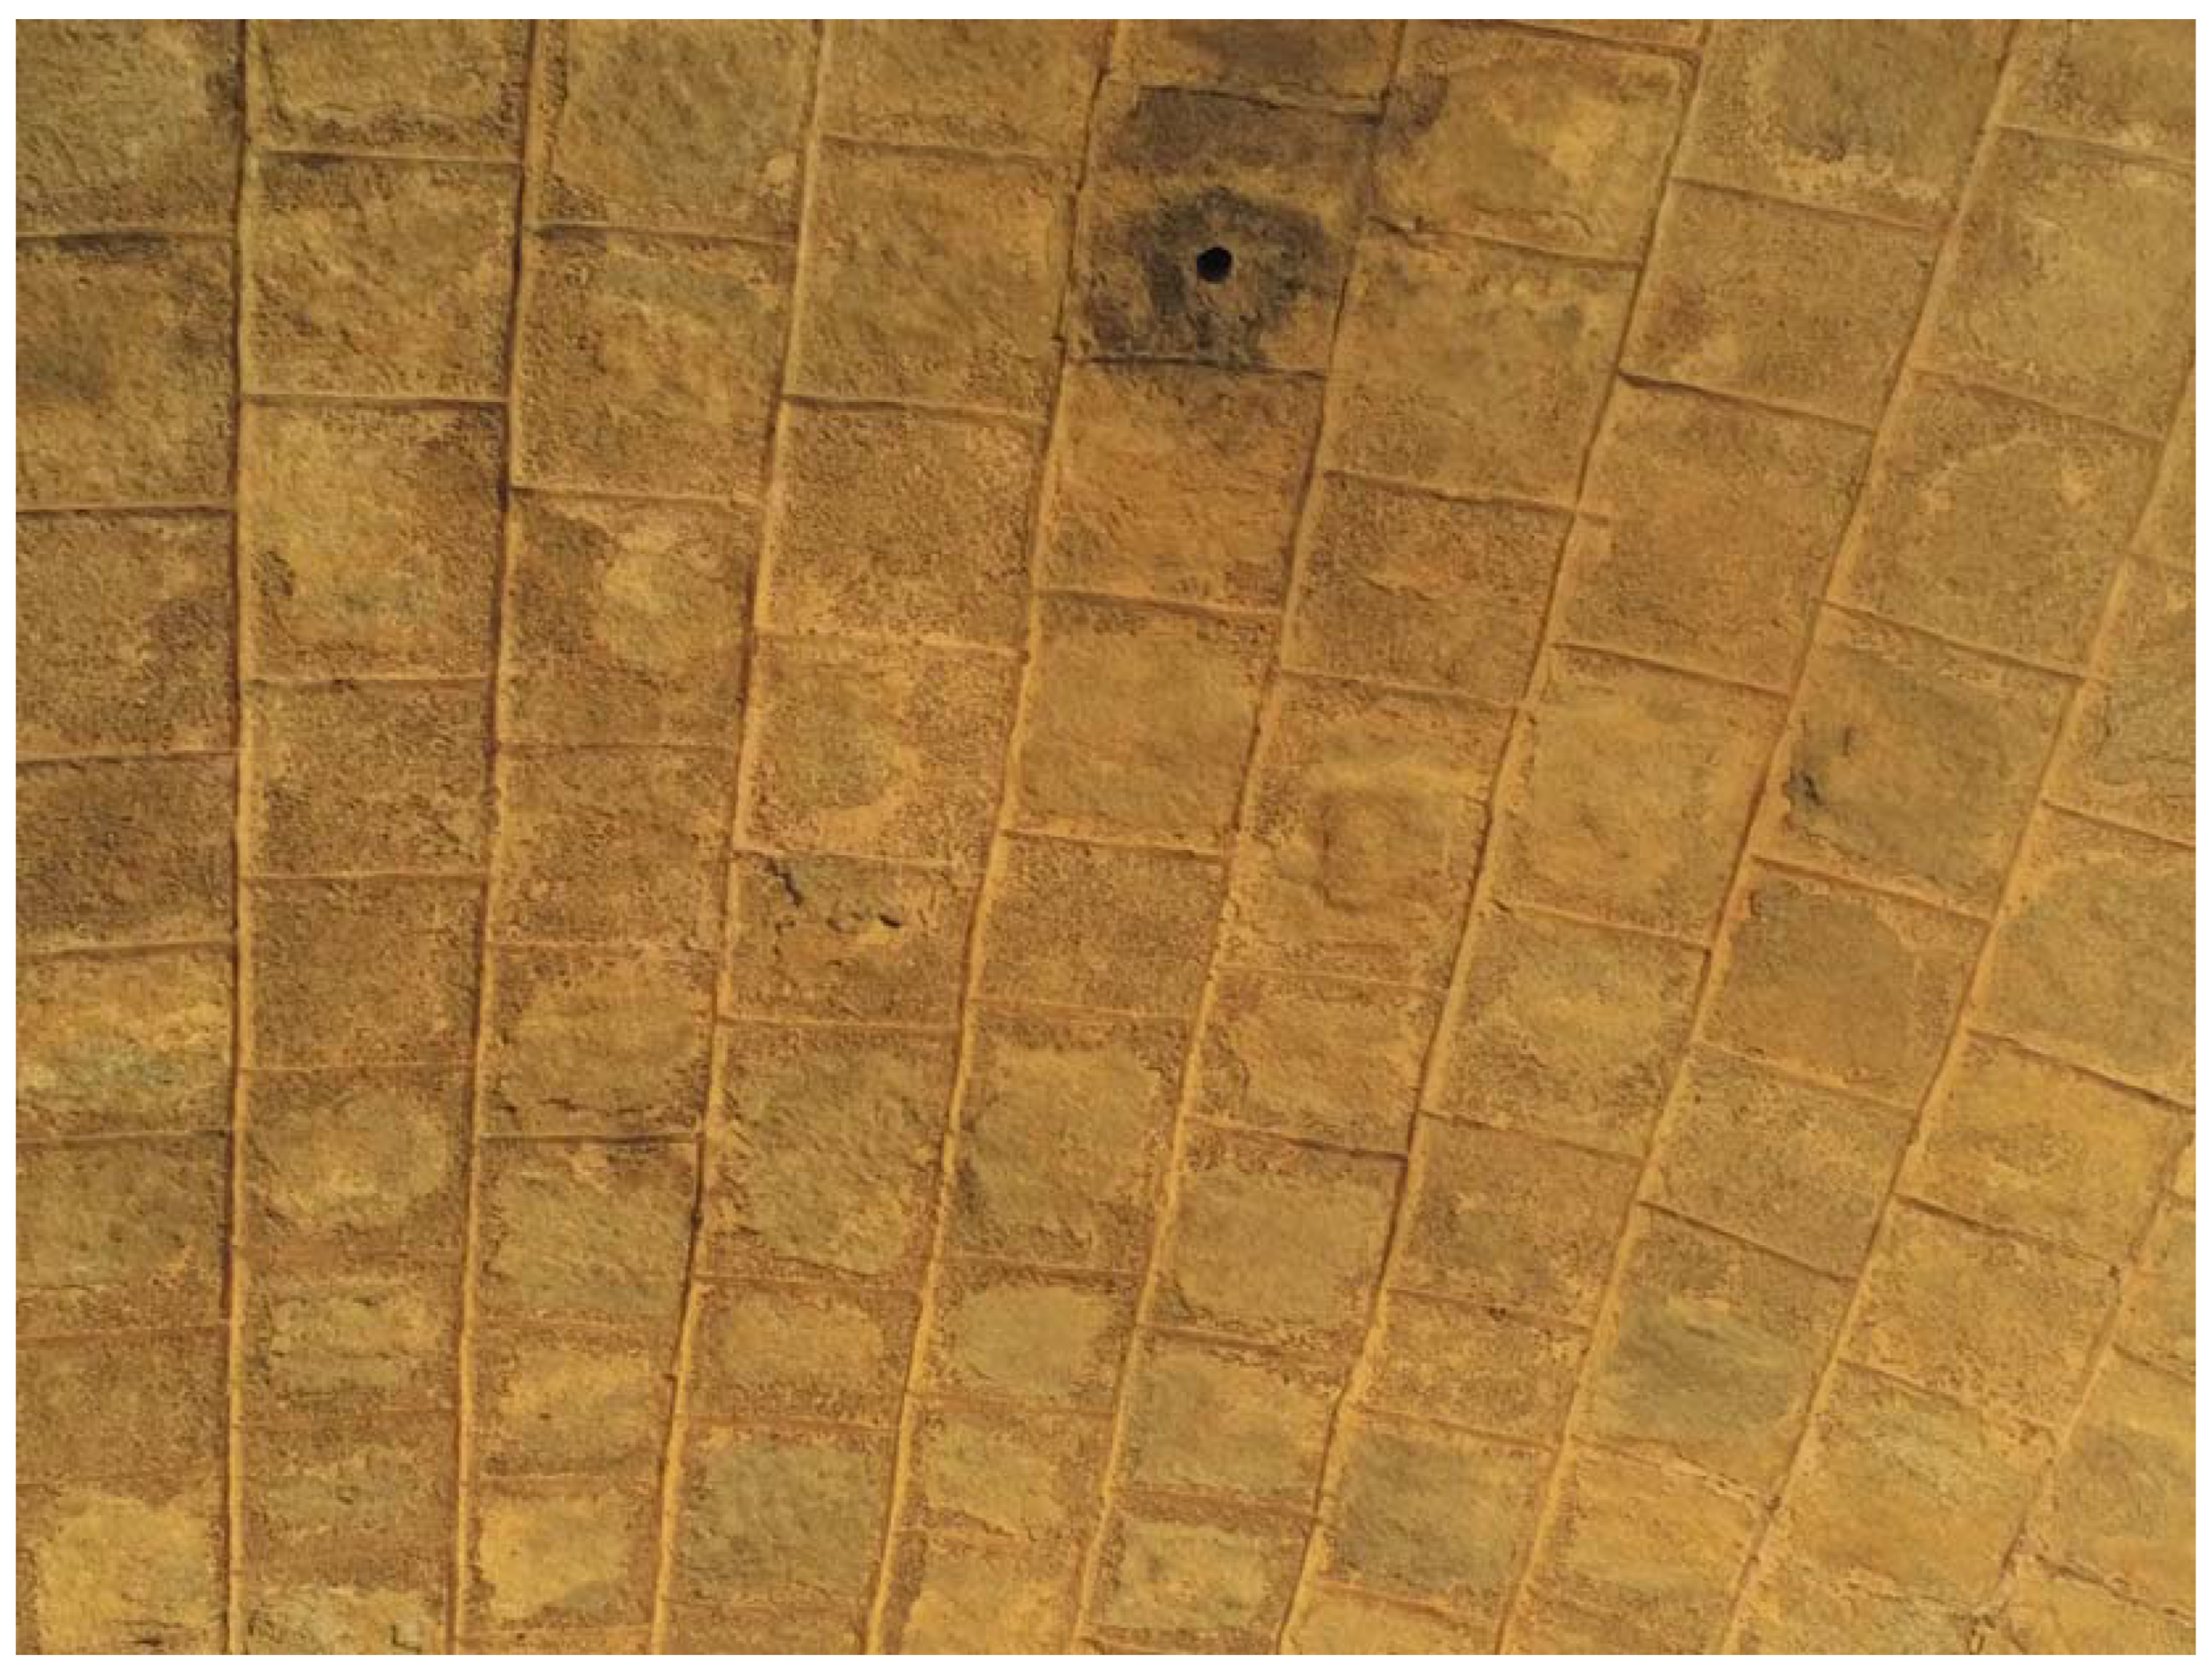
Figure 16.
Thermogram of the previous photograph (Figure 15): (a) location of the maximum temperature values; (b) location of the minimum temperature values (photographs by the author).
Figure 16.
Thermogram of the previous photograph (Figure 15): (a) location of the maximum temperature values; (b) location of the minimum temperature values (photographs by the author).
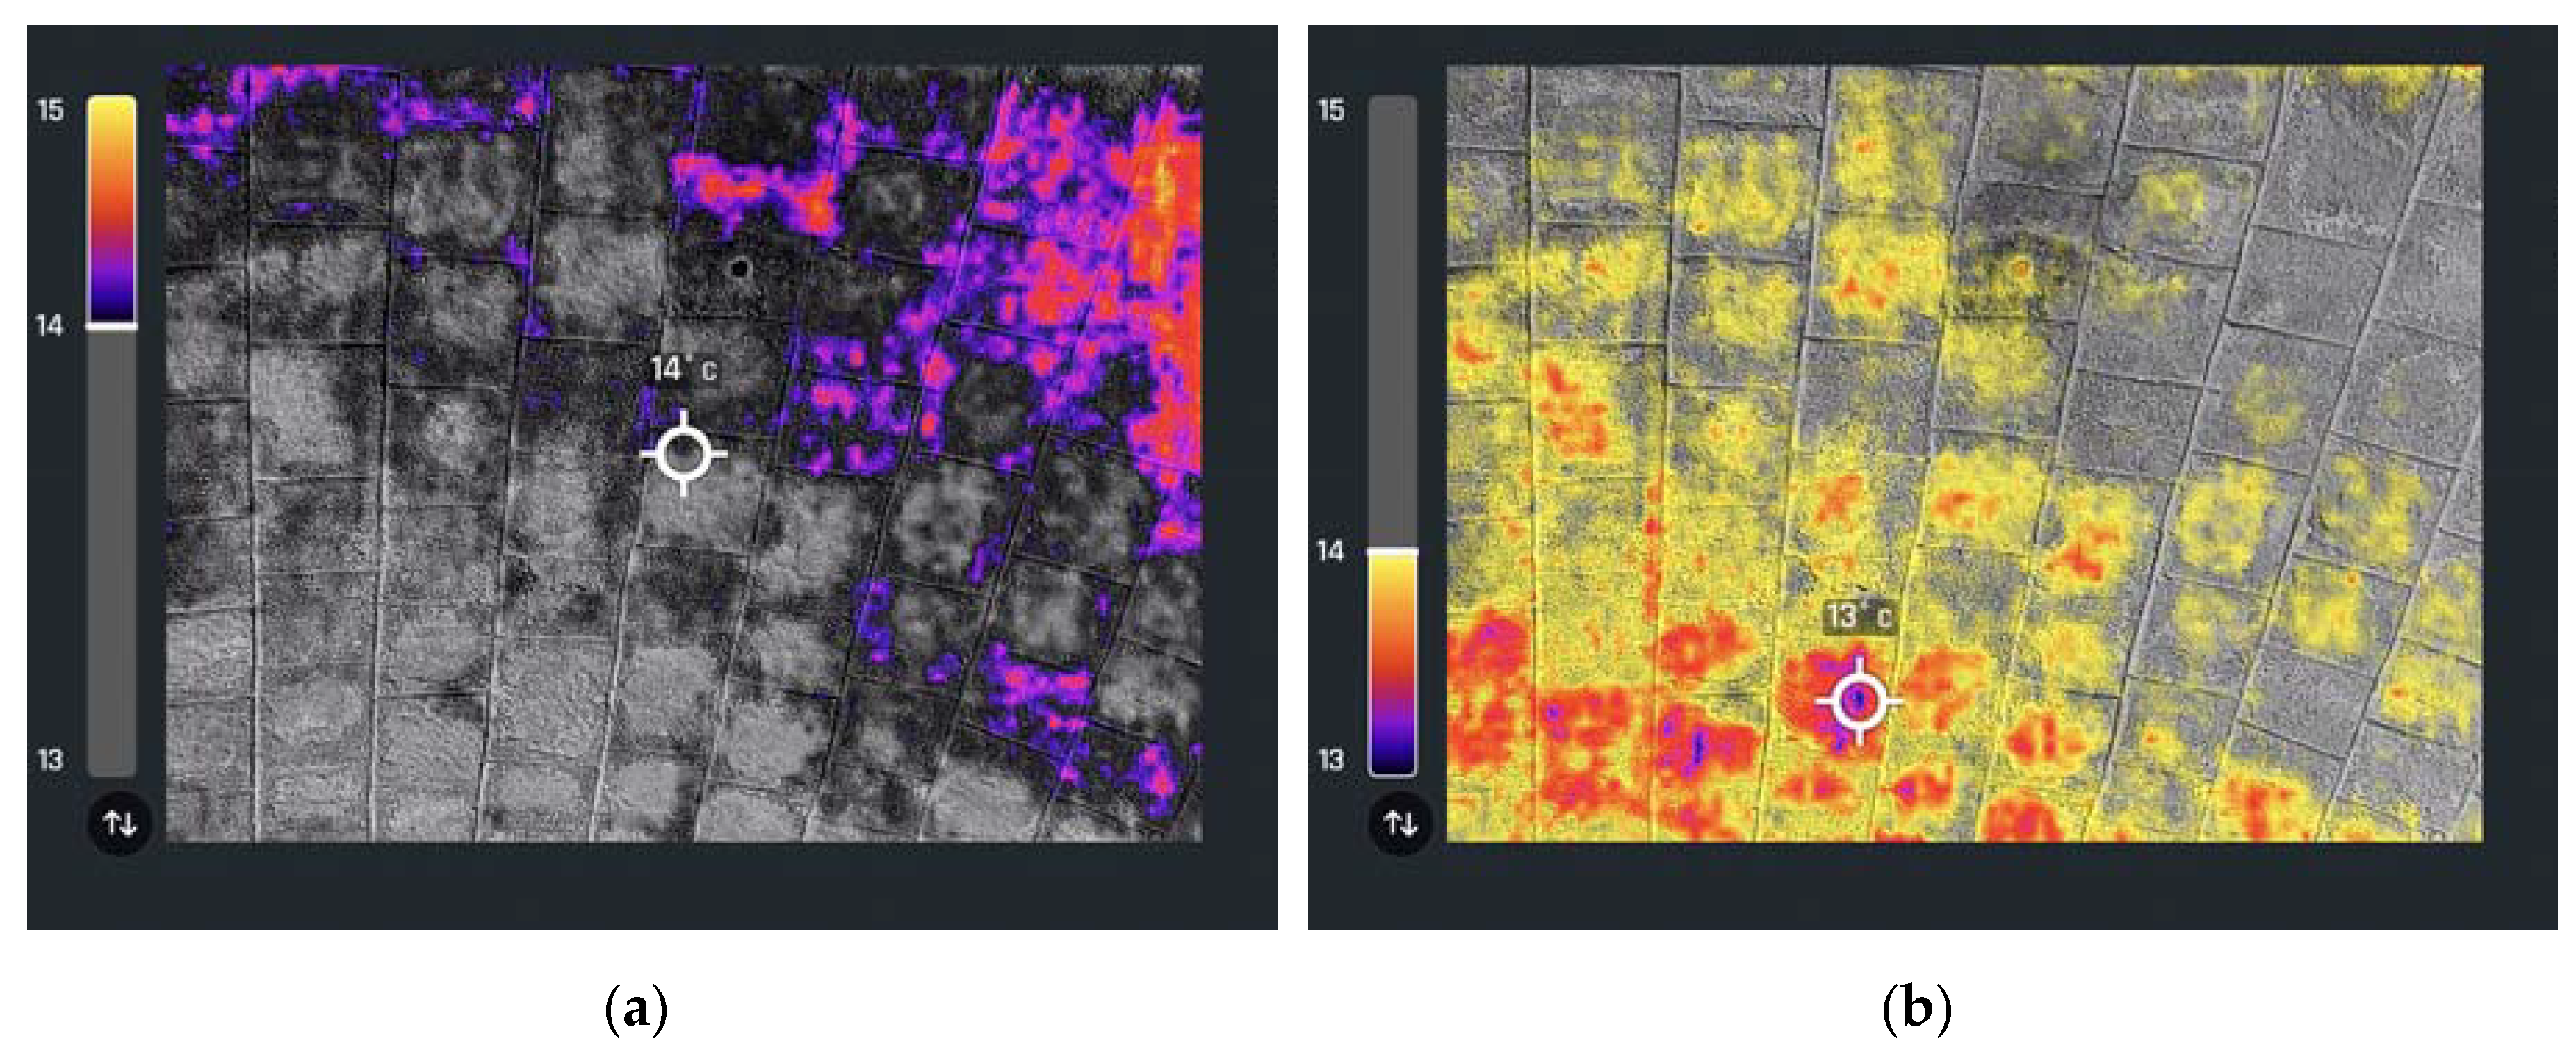
Figure 17.
View of a group of voussoirs forming an arcade, where efflorescence was observed: (a) photograph; (b) thermogram corresponding to this photograph, where the point where the highest temperature was recorded can be observed (photographs by the author).
Figure 17.
View of a group of voussoirs forming an arcade, where efflorescence was observed: (a) photograph; (b) thermogram corresponding to this photograph, where the point where the highest temperature was recorded can be observed (photographs by the author).
Disclaimer/Publisher’s Note: The statements, opinions and data contained in all publications are solely those of the individual author(s) and contributor(s) and not of MDPI and/or the editor(s). MDPI and/or the editor(s) disclaim responsibility for any injury to people or property resulting from any ideas, methods, instructions or products referred to in the content. |
© 2024 by the author. Licensee MDPI, Basel, Switzerland. This article is an open access article distributed under the terms and conditions of the Creative Commons Attribution (CC BY) license (http://creativecommons.org/licenses/by/4.0/).
Copyright: This open access article is published under a Creative Commons CC BY 4.0 license, which permit the free download, distribution, and reuse, provided that the author and preprint are cited in any reuse.


