
Submitted:
18 July 2024
Posted:
19 July 2024
You are already at the latest version
Abstract
Gelsolin is an actin-binding protein that is competitively bound by lysophosphatidic acid (LPA), a possible biomarker for the early detection of ovarian cancer. Our group has previously shown the usage of gelsolin 1-3 (a fragment of gelsolin composed of the first three of its six subdomains) along with actin to detect the presence of lysophosphatidic acid. This histidine-tagged gelsolin 1-3 fragment is synthesized in our lab using bl21 Rosetta cells but required further characterization. This study aims to provide sufficient characterization of gelsolin 1-3 synthesized in our lab via both sodium dodecyl sulfate polyacrylamide gel electrophoresis (SDS-PAGE) and mass spectrometry using a Fourier-transform ion cyclotron resonance mass spectrometer (FTICR-MS). Both techniques show the presence of protein at the expected mass of approximately 41 kDa. Additionally, the dissociation of a smaller fragment of the complex when introduced into the gas phase which was equivalent to the approximate mass of one subdomain of gelsolin 1-3 further supports this conclusion.
Keywords:
gelsolin
; SDS-PAGE
; FTICR-MS
; mass spectrometry
; protein characterization
1. Introduction
Gelsolin is an 82 kDa calcium-dependent actin-binding protein that regulates cell motility and morphology through actin filament assembly and disassembly. Actin is a protein that forms microfilaments in the cell cytoskeleton and is therefore the most abundant protein in most eukaryotic cells [1]. Gelsolin binds actin monomers, severs actin filaments, and nucleates actin polymerization to form new filaments. For this to occur, actin can bind to gelsolin at two different sites. The affinity for this binding is heavily dependent on the binding site and the presence and type of salts, with Kd measured to be as low as 4.5 pM and as high as 400 μM [2,3,4]. Gelsolin consists of six homologous domains, 1-6, each containing a five-stranded β-sheet flanked by two α-helices: one parallel to the strands and one perpendicular [5]. The subdomains form two identical complexes (domains 1-3 and 4-6) [6,7,8] (Figure 1). Lysophosphatidic acid, a promising ovarian cancer biomarker, is a regulator of actin-gelsolin binding. It binds to the PIP 2-binding domain of gelsolin with a Kd of 6 nM, causing the release of actin [6,9]. Interestingly, each half of gelsolin can individually bind to LPA [6,9].
Our group has previously shown the application of the interactions between gelsolin, actin, and lysophosphatidic acid in a fluorescence-based optical biosensor for the early detection of ovarian cancer [12]. We found that using one half of the full protein complex (gelsolin 1-3) works just as well, if not better than, using full-length gelsolin, while taking up less space on the biosensor surface. Currently, we are working on new biosensors taking advantage of this same system but with different detection methods such as electrochemistry, chemiluminescence, and electromagnetic piezoelectric acoustic sensors (EMPAS) [13,14]. This work aims to further confirm and characterize the recombinant gelsolin 1-3 synthesized and used for these biosensors through gel electrophoresis in combination with mass spectrometry (MS).
Polyacrylamide gel electrophoresis (PAGE) is a well-established technique commonly used to assess the size of proteins and other molecules. Briefly, proteins or other molecules are charged and added to wells of a polyacrylamide gel. A current is applied across the gel, attracting the charged molecules to the opposite side. The speed at which they travel through the gel is directly proportional to the size of the molecule or complex. The two types of gels often run for proteins are denaturing gels and non-denaturing gels, where the former denatures the protein prior to running it through the gel, and the latter leaves the protein in its native state. Leaving it in its native state can allow other factors such as conformation, charged state, and quaternary protein structure to affect the migration through the gel, complicating results. For this study, as done previously [2,4], denaturing gels were used to assess the size and molecular weight of the gelsolin 1-3 produced along with the purity of the samples from each step in the purification process. In this particular case, the widely used sodium dodecyl sulfate polyacrylamide gel electrophoresis (SDS-PAGE) technique was used.
Gel electrophoresis on its own is not enough to identify a protein – while it gives information on total mass, many proteins or other complexes can have the same mass; thus, complementary techniques must be employed. MS has become a valuable technique for this endeavour as it is a powerful analytical tool that gives detailed structural and identifying information about chemical compounds and complexes [15]. Initially, harsh ionization methods restricted gas-phase characterization to small, highly volatile organic analytes [16,17,18,19]. This would provide information about their amino acid composition while losing precious structural insights. It wasn’t until the 1980s when the development of gentle ionization techniques allowed for the analysis of proteins and their complexes with little to no fragmentation [20,21]. MS has been evidenced to be a great complementary technique to traditional tools for biomolecule analysis such as gel electrophoresis and antibody capture assays [22]. This work aims to use MS as a complementary technique to confirm the successful production of gelsolin 1-3 using Fourier transform ion cyclotron resonance MS (FTICR-MS). FTICR-MS is the ideal instrumentation for this purpose due to its high resolving power, mass accuracy, and ability to be coupled with versatile fragmentation techniques [15,21]. While mass spectrometry has been performed on gelsolin isoforms previously, it has only been done on the peptides of trypsin-digested gelsolin; this work represents the first instance of the undigested protein gelsolin 1-3 being sprayed whole and analyzed with FTICR-MS [23,24]. The results from both gel electrophoresis and MS confirm through mass and structural information the successful synthesis of gelsolin 1-3.
2. Materials and Methods
2.1. Materials
Plasmids containing histidine-tagged gelsolin 1-3 were provided by Professor Robert Robinson of the University of Singapore. Lysogeny broth (LB), bl21 cells, DNase I (Thermo Scientific), and InvitrogenTM BenchMarkTM Prestained Protein Ladder were purchased from MedStore at the University of Toronto (Toronto, ON). All other chemicals and materials were purchased from Sigma Aldrich (Oakville, ON).
2.2. Expression and Synthesis of Gelsolin 1-3
Cell stocks of bl21 Rosetta cells containing the plasmid encoded with the DNA for histidine-tagged gelsolin 1-3 are stored at -30˚ C in 200 μL aliquots. To produce gelsolin 1-3, one aliquot of cells was thawed and grown in 30 mL of LB buffer (25 g/L LB, 100 mg/L ampicillin) at 37˚ C overnight. The solution was then diluted into 2 L of LB buffer and grown at 37˚ C until an optical density of 0.5 at 600 nm is achieved. At this point, protein production is induced with the addition of isopropyl β-D-1-thiogalactopyranoside (IPTG) to obtain a final concentration of 1 mM. Protein production was allowed to continue overnight at room temperature. Cells were then pelleted by centrifugation for 20 minutes at 4800 RPM and then re-suspended in 4 mL of lysis buffer (20 mM imidazole, 20 mM Tris pH 7.2, 300 mM NaCl, 0.1% Triton-X, 5% glycerol, 1 mg/mL lysozyme, and 1 protease inhibitor tablet) and sonicated for 30 min. Then, 2 μL DNAse I was added to the suspension before rocking it gently for 30 min. The suspension was then centrifuged for 45 min at 14,500 RPM. Histidine-tagged gelsolin 1-3 was isolated from the supernatant using a Ni-NTA agarose affinity column and then dialyzed into storage buffer (20 mM HEPES pH 7.8, 3 mM CaCl2).
2.3. SDS-PAGE
A separating gel (12% w/v acrylamide, 0.4 M TRIS pH 8.8, 0.1% SDS) was prepared and polymerized with 10% APS (60 μL), and tetramethylethylenediamine (TEMED, 10 μL). A stacking gel (4.2% w/w acrylamide, 0.4 M TRIS pH 6.8, 0.1% SDS) was prepared, polymerized with 10% w/v APS (30 μL) and TEMED (10 μL), and added on top of the separating gel with a comb to form the sample wells. Samples of 10 μL were taken from each step of the purification process of gelsolin 1-3. 2 μL of loading dye (0.1 M TRIS pH 8.8, 3.6% SDS, 27% glycerol, 0.02% w/v bromophenol blue, 1.8% β-mercaptoethanol) were added to each sample. These samples, along with 10 μL of InvitrogenTM BenchMarkTM Prestained Protein Ladder, were run on the gel at 120 V for 1 hour. The gel was stained by submerging it in Coomassie blue stain (40% methanol, 10% glacial acetic acid, 0.5% w/v Coomassie R-250) and incubating at 37˚ C for 30 minutes. It was then destained by submersion in strong destain (40% methanol, 10% glacial acetic acid) for 10 minutes followed by weak destain (10% methanol, 10% glacial acetic acid) for 30 minutes, both with gentle agitation of the sample. A photo of the gel was taken with a smartphone camera.
2.4. Mass Spectrometry
The HEPES buffer which the gelsolin 1-3 was stored in was removed using a 3K molecular weight cut-off (MWCO) Amicon® ultra centrifugal filter (UFC5003 from Sigma, Oakville, ON). After three washes with 10 mM ammonium acetate, the desalted synthesized gelsolin was diluted in 10 mM ammonium acetate to a concentration of 5 μM.
A 7T FT-ICR mass spectrometer (Bruker Apex Qe, Bruker Daltonics, Billerica, MA) was used for mass spectral characterization. Positive nano-electrospray ionization (nano-ESI) was used to spray gelsolin (1:3) out of borosilicate capillary tips (Sutter Instrument, o.d. 1.0 mm, i.d. 0.75 mm) pulled to a 2.5 μm opening using a micropipette puller (Model P97, Sutter Instrument, Novato, CA). A platinum wire was inserted into the capillary tip to serve as the grounded electrode, while the mass spectrometer inlet was operated at an 800V potential drop to act as the counter electrode. The ions passed through a heated capillary with counter drying nitrogen gas to aid desolvation as they entered the mass spectrometer. The pressure at the first pumping stage was raised to 4.50 mbar to aid with collisional cooling of ions and increase ion signal. Instrumental parameters were carefully optimized using cytochrome C and myoglobin to ensure gentle conditions that would facilitate the vaporization and ionization of intact gelsolin 1-3. A quadrupole filter in the ion path was operated in RF only mode, set either to 1430 m/z to better transmit ions in the low m/z region or 3058 m/z for ions in a higher m/z region. Transmitted ions entered a collision hexapole where ions were accumulated for 1 sec while being collisionally cooled with argon gas. After the accumulation period, ions were pulsed towards the analyzer cell, which is held at ~10-8 mbar, for high resolution mass measurement.
3. Results and Discussion
3.1. SDS-PAGE
The results from the SDS-PAGE experiment in Figure 2 align with what would be expected for gelsolin 1-3. Lane 1 contains the crude sample, taken after lysis and centrifugation and before incubation with the Ni-NTA resin. Lane 2 contains the column flow through, i.e. all liquid initially pushed through the column after incubation with the lysed sample. Lanes 3-5 contain washes 1, 2, and 3 respectively. Lane 6 contains the eluent, i.e. the eluted sample, followed by the water wash in Lane 7. The eluent sample post-dialysis is in Lane 8, and Lane 9 contains the standard protein ladder.
Lanes 1 and 2 containing crude sample and column flow through clearly demonstrate excess soluble cell material and proteins from the sample passing freely through the column. Wash 1 seems to remove most of any leftover material, with a small amount removed by wash 2. By wash 3, all excess material not bound to the column appears to have been removed.
Lanes 6 and 8 are expected to contain the highest concentrations of gelsolin 1-3. The molecular weight of gelsolin 1-3 is approximately 41 kDa, around half that of full-length gelsolin. There is a prominent band just below 49 kDa in these lanes, and while this mass is slightly higher than expected, bands in gels are always approximate masses so some variation is normal. Bands in this range can also be seen in the crude sample, the column flow through and the first wash, indicating either some loss of gelsolin 1-3 or the removal of proteins and cell material with similar molecular weight that did not bind to the column. The presence of other bands in addition to the strong 49 kDa band in Lanes 6 and 8 demonstrate that the sample is not as pure as would be ideal, likely as a result of using only one purification step. This impurity could also indicate that the slightly higher observed mass is due to some aggregation of smaller protein fragments to the gelsolin 1-3 fragment. While other protocols often call for two or more purification steps, for our purposes of creating a biosensor for the detection of lysophosphatidic acid, the sample does not need to be extremely pure or have an accurate concentration and thus there has not been a need for us to add a second purification method.
Some of the bands observed between 82 and 115 kDa in Lanes 6 and 8 are assumed to be from the gelsolin 1-3 dimerizing with itself, a feature we have observed consistently when conducting this synthesis and purification. As stated previously, the 1-3 and 4-6 subdomains of gelsolin are homologous, so some dimerization is not only possible but likely and expected. The strong band at 49 kDa in the eluted and dialyzed samples, as well as the dimer bands between 82 and 115 kDa, indicate that gelsolin 1-3 was synthesized and purified successfully.
3.2. Mass Spectrometry
To further confirm the positive identity of the gelsolin 1-3 protein, it was characterized with mass spectroscopy. Mass spectral characterization of the truncated gelsolin protein revealed the presence of multiple distinct species. Initial experiments tuned for a higher m/z region showed a predominant species of 33.6 kDa as displayed in Figure 3. The 33.6 kDa mass is lower than the expected 41 kDa for the gelsolin 1-3 sample. A second protein fragment of 68.5 kDa is also present, though at a lower concentration. This species is close to double the mass of the previous fragment, meaning it is most likely formed from dimerization of the 33.6 kDa gelsolin 1-3 fragment. This reinforces the gel electrophoresis results which display a faint band in the 82-115 kDa region in addition to a strong band in the 49 kDa region corresponding with the presence of gelsolin 1-3. As stated above, the 1-3 and 4-6 domains are homologous to each other in the full protein, so dimerization is expected.
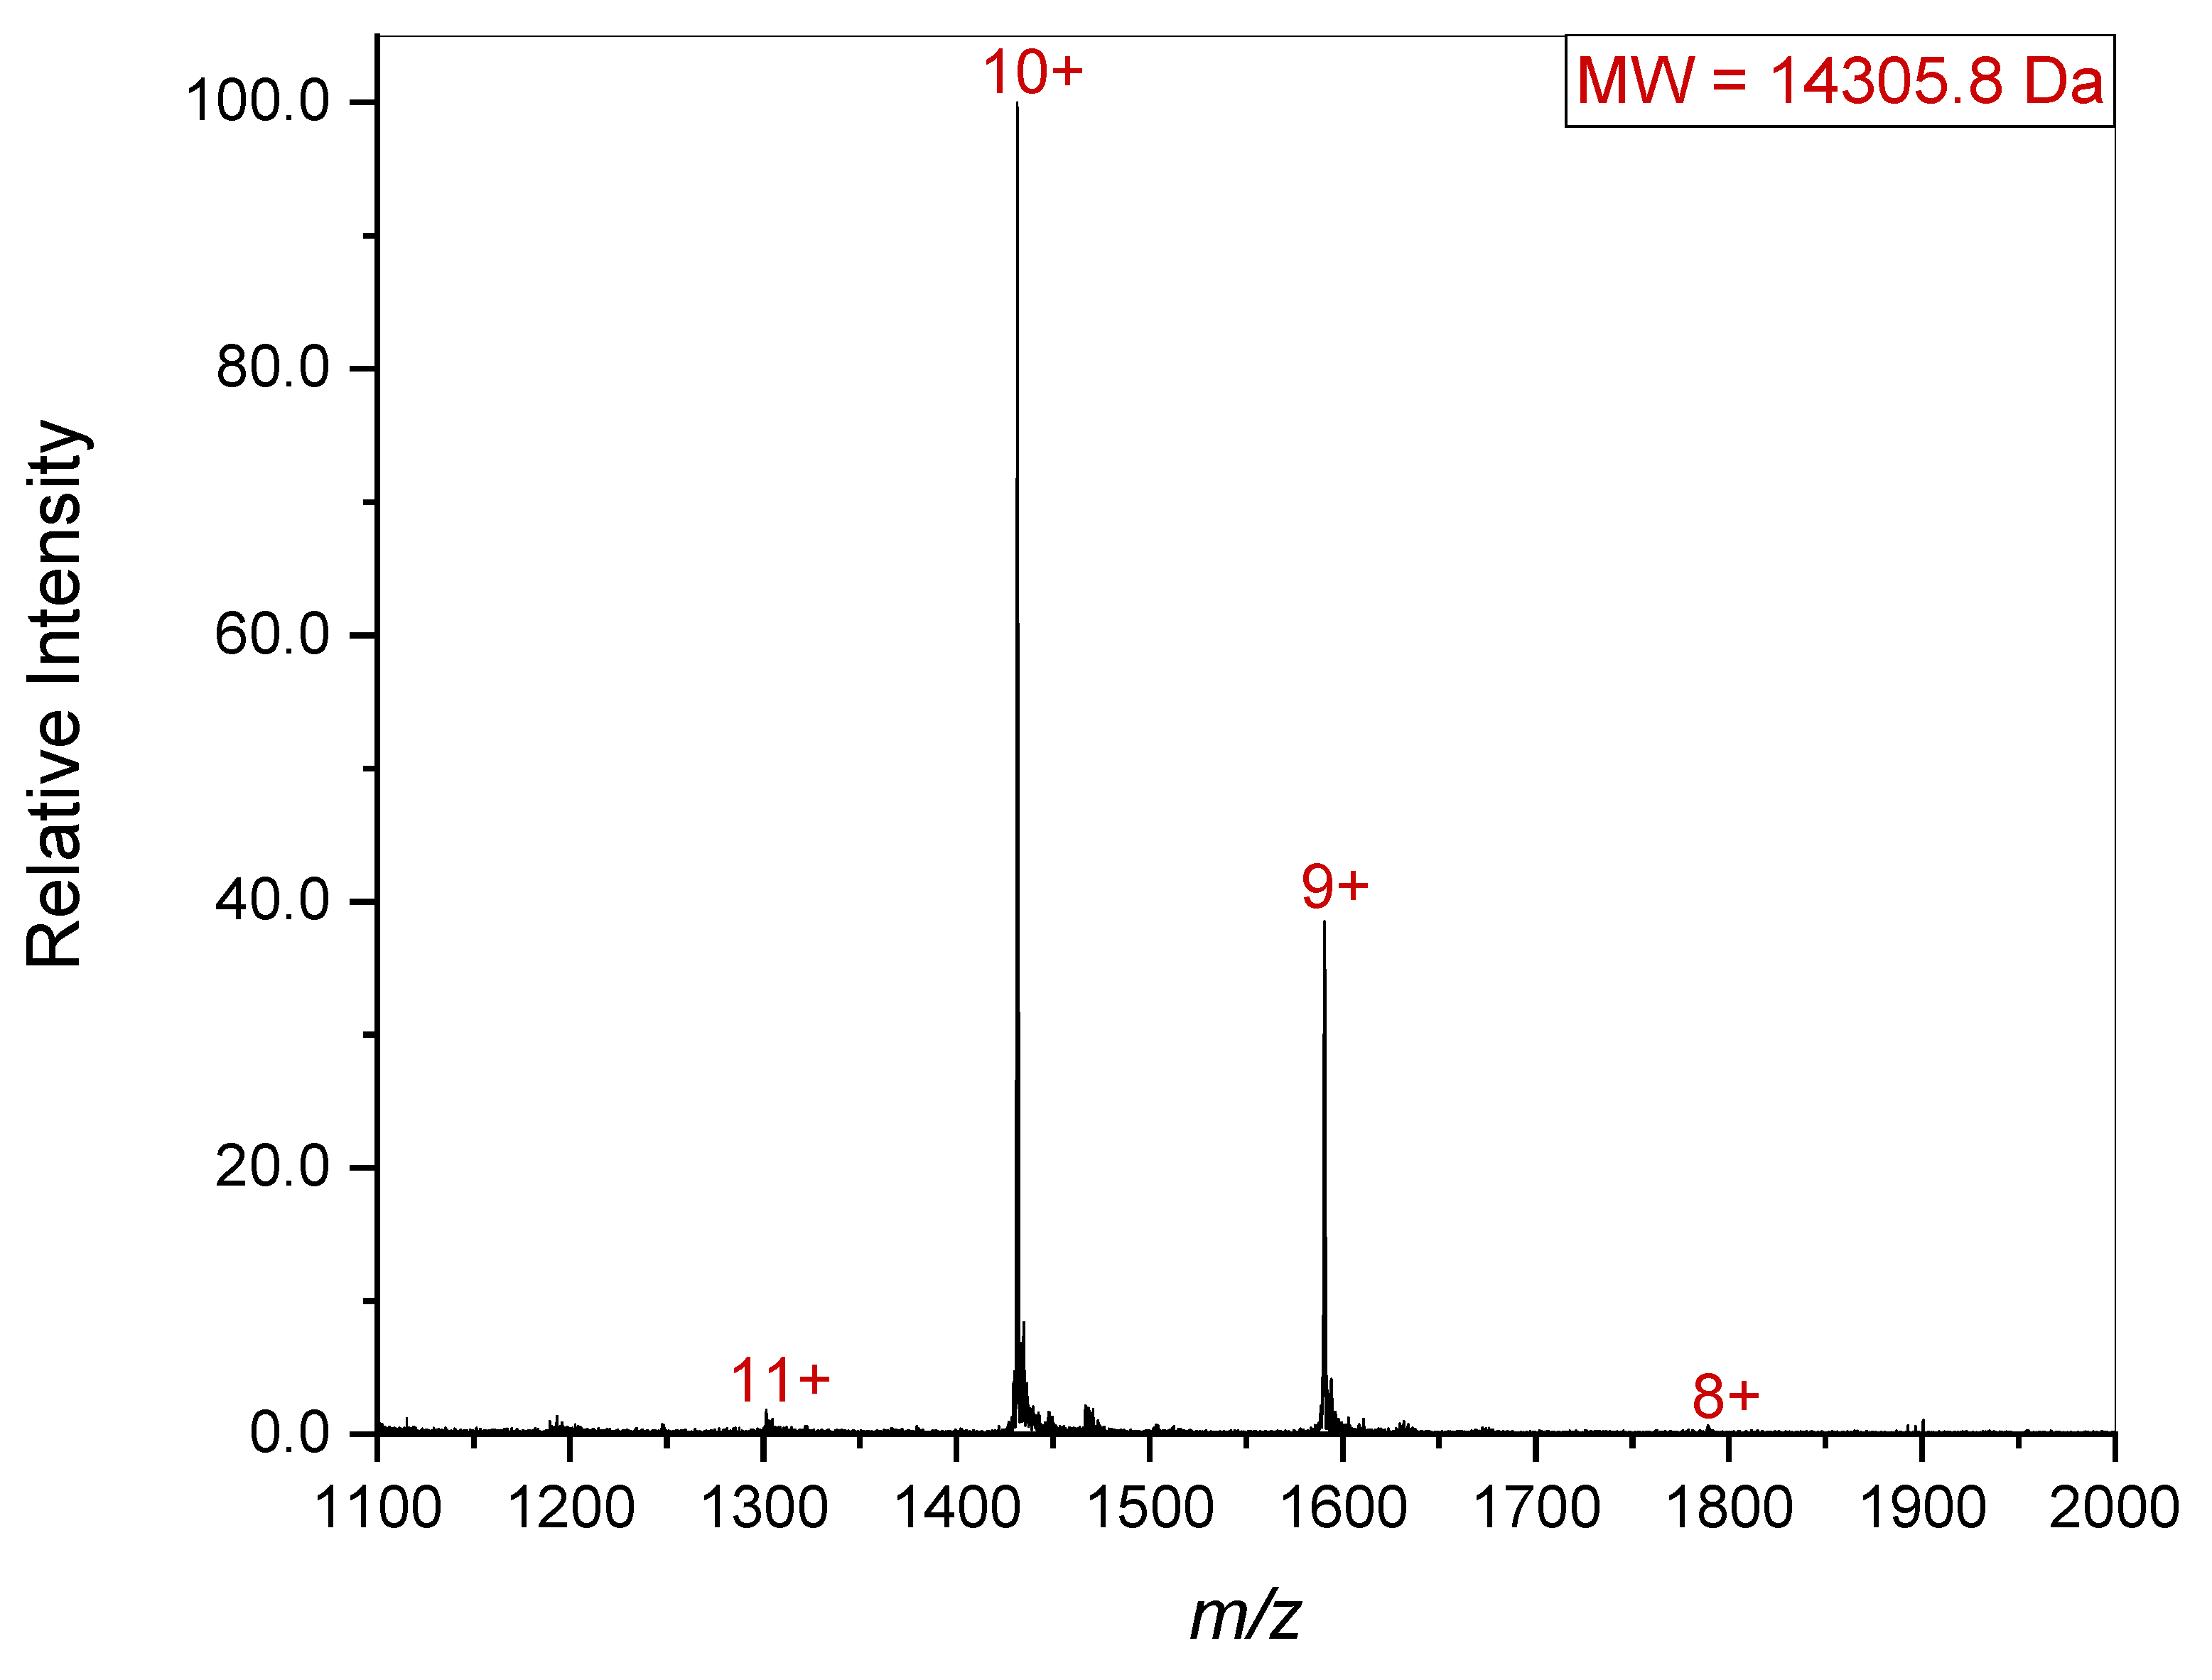
Since it is possible that a quaternary complex might dissociate upon introduction into the gas phase, the lower m/z region was also examined (Figure 4). This revealed the presence of a 14.3 kDa species. The combined masses of the 33.6 kDa and 14.3 kDa species is 47.9 kDa which agrees with the gel electrophoresis results presented in Figure 2. Since gelsolin’s individual subdomains are all homologous, it seems that upon introduction to the gas phase, one of the subdomains separated from the other two, giving the 33.6 and 14.3 kDa species seen in the spectrum. It is worth noting that 68.5 kDa and 14.3 kDa is 82.8 kDa, which is approximately equal to the mass of full-length or dimerized gelsolin (81 kDa). This suggests that the individual subdomain dissociated from the complex upon introduction to the gas phase, especially as it is missing from both the single gelsolin 1-3 and the dimerized gelsolin 1-3. The particular pattern of this dissociation aligning with the masses of gelsolin subdomains also further confirms the identity and presence of gelsolin 1-3.
5. Conclusions
The results from both SDS-PAGE and FTICR-MS of the synthesized sample align to indicate the successful synthesis of gelsolin 1-3. While this has previously been confirmed indirectly by the development of both fluorescence-based and electrochemistry-based biosensors for the detection of lysophosphatidic acid using gelsolin 1-3, this work serves to provide more concrete evidence and structural information about the protein. The total mass was similar to the expected mass of approximately 41 kDa, with a small, but expected, amounts of dimerization being observed. In addition, there was dissociation of a fragment equivalent to the mass of one subdomain from the whole complex. These results combine to support the successful synthesis of gelsolin 1-3, which can now be confidently put to use in future biosensors for the detection of lysophosphatidic acid.
Author Contributions
Conceptualization, N.L.; methodology, B.D.L.F., N.L. and C.M.S..; validation, N.L. and C.M.S.; formal analysis, N.L. and C.M.S.; investigation, N.L. and C.M.S.; resources, M.T. and R.A.J.; writing—original draft preparation, N.L. and C.M.S.; writing—review and editing, N.L., C.M.S., B.D.L.F., M.T. and R.A.J.; visualization, N.L. and C.M.S.; supervision, M.T. and R.A.J.; project administration, N.L.; funding acquisition, M.T. and R.A.J. All authors have read and agreed to the published version of the manuscript.
Funding
This research was funded by the Canadian Institutes of Health Research (CIHR), grant number PJT 18042 to M.T.; the Natural Sciences and Engineering Research Council of Canada (NSERC) Discovery Grant, grant number RGPIN-2020-05828 to R.A.J.; and Canada Foundation for Innovation, grant number 203026 to R.A.J.
Institutional Review Board Statement
Not applicable.
Informed Consent Statement
Not applicable.
Data Availability Statement
The original contributions presented in the study are included in the article/Supplementary Material, further inquiries can be directed to the corresponding author.
Acknowledgments
The authors would like to think Professor Robert C. Robinson of Okayama University for providing the original gelsolin 1-3 plasmids used for this work.
Conflicts of Interest
The authors declare no conflicts of interest. The funders had no role in the design of the study; in the collection, analyses, or interpretation of data; in the writing of the manuscript; or in the decision to publish the results.
References
- Dominguez, R.; Holmes, K.C. Actin Structure and Function. Annu Rev Biophys 2011, 40, 169–186. [Google Scholar] [CrossRef] [PubMed]
- Bryan, J. Gelsolin Has Three Actin-Binding Sites. Journal of Cell Biology 1988, 106, 1553–1562. [Google Scholar] [CrossRef] [PubMed]
- Schoepper, B.; Wegner, A. Rate Constants and Equilibrium Constants for Binding of Actin to the 1:1 Gelsolin-Actin Complex. European Journal of Biochemistry 1991, 202, 1127–1131. [Google Scholar] [CrossRef] [PubMed]
- Gremm, D.; Wegner, A. Co-Operative Binding of Ca2+ Ions to the Regulatory Binding Sites of Gelsolin. European Journal of Biochemistry 1999, 262, 330–334. [Google Scholar] [CrossRef] [PubMed]
- McLaughlin, P.J.; Gooch, J.T.; Mannherz, H.-G.; Weeds, A.G. Structure of Gelsolin Segment 1-Actin Complex and the Mechanism of Filament Severing. Nature 1993, 364, 685–692. [Google Scholar] [CrossRef] [PubMed]
- Nag, S.; Ma, Q.; Wang, H.; Chumnarnsilpa, S.; Lee, W.L.; Larsson, M.; Kannan, B.; Hernandez-Valladares, M.; Burtnick, L.D.; Robinson, R.C. Ca2+ Binding by Domain 2 Plays a Critical Role in the Activation and Stabilization of Gelsolin. Proceedings of the National Academy of Sciences 2009, 106, 13713–13718. [Google Scholar] [CrossRef] [PubMed]
- Burtnick, L.D.; Koepf, E.K.; Grimes, J.; Jones, E.Y.; Stuart, D.I.; McLaughlin, P.J.; Robinson, R.C. The Crystal Structure of Plasma Gelsolin: Implications for Actin Severing, Capping, and Nucleation. Cell 1997, 90, 661–670. [Google Scholar] [CrossRef] [PubMed]
- Kwiatkowski, D.J.; Stossel, T.P.; Orkin, S.H.; Mole, J.E.; Coltens, H.R.; Yin, H.L. Plasma and Cytoplasmic Gelsolins Are Encoded by a Single Gene and Contain a Duplicated Actin-Binding Domain. Nature 1986, 323, 455–458. [Google Scholar] [CrossRef] [PubMed]
- Goetzl, E.J.; Lee, H.; Azuma, T.; Stossel, T.P.; Turck, C.W.; Karliner, J.S. Gelsolin Binding and Cellular Presentation of Lysophosphatidic Acid. Journal of Biological Chemistry 2000, 275, 14573–14578. [Google Scholar] [CrossRef]
- Burtnick, L.D.; Urosev, D.; Irobi, E.; Narayan, K.; Robinson, R.C. Gelsolin Domains G1-G3. 2003. [CrossRef]
- Burtnick, L.D.; Urosev, D.; Irobi, E.; Narayan, K.; Robinson, R.C. Structure of the N-Terminal Half of Gelsolin Bound to Actin: Roles in Severing, Apoptosis and FAF. EMBO J 2004, 23, 2713–2722. [Google Scholar] [CrossRef]
- De La Franier, B.; Thompson, M. Detection of the Ovarian Cancer Biomarker Lysophosphatidic Acid in Serum. Biosensors 2020, 10, 13. [Google Scholar] [CrossRef]
- Ahmadi, S.; Lotay, N.; Thompson, M. Affinity-Based Electrochemical Biosensor with Antifouling Properties for Detection of Lysophosphatidic Acid, a Promising Early-Stage Ovarian Cancer Biomarker. Bioelectrochemistry 2023, 153, 108466. [Google Scholar] [CrossRef]
- Davoudian, K.; Spagnolo, S.; Lotay, N.; Satkauskas, M.; Mészáros, G.; Hianik, T.; Keresztes, Z.; Walker, G.; Thompson, M. Design and Characterization of a Dual-Protein Strategy for an Early-Stage Assay of Ovarian Cancer Biomarker Lysophosphatidic Acid. Biosensors 2024, 14, 287. [Google Scholar] [CrossRef]
- Li, H.; Nguyen, H.H.; Ogorzalek Loo, R.R.; Campuzano, I.D.G.; Loo, J.A. An Integrated Native Mass Spectrometry and Top-Down Proteomics Method That Connects Sequence to Structure and Function of Macromolecular Complexes. Nat Chem 2018, 10, 139–148. [Google Scholar] [CrossRef]
- Jensen, N.; Tomer, K.; Gross, M. Fast Atom Bombardment and Tandem Mass Spectrometry of Phosphatidylserine and Phosphatidylcholine. Lipids 1986, 21, 580–588. [Google Scholar] [CrossRef]
- Rademaker, G.J.; Heerma, W.; Haverkamp, J. The Fast Atom Bombardment Mass Spectrum and Fragmentation Pathway of N-[2-(Acetamido)-2-Deoxy-β-D-Glucopyranosyl]-L-Asparagine. Biological Mass Spectrometry 1992, 21, 667–671. [Google Scholar] [CrossRef]
- Hearn, J.D.; Smith, G.D. A Chemical Ionization Mass Spectrometry Method for the Online Analysis of Organic Aerosols. Anal. Chem. 2004, 76, 2820–2826. [Google Scholar] [CrossRef] [PubMed]
- Byrdwell, W.C. Atmospheric Pressure Chemical Ionization Mass Spectrometry for Analysis of Lipids. Lipids 2001, 36, 327–346. [Google Scholar] [CrossRef] [PubMed]
- Leney, A.C.; Heck, A.J.R. Native Mass Spectrometry: What Is in the Name? J Am Soc Mass Spectrom 2017, 28, 5–13. [Google Scholar] [CrossRef]
- Tamara, S.; den Boer, M.A.; Heck, A.J.R. High-Resolution Native Mass Spectrometry. Chem. Rev. 2022, 122, 7269–7326. [Google Scholar] [CrossRef]
- Rose, R.J.; Labrijn, A.F.; van den Bremer, E.T.J.; Loverix, S.; Lasters, I.; van Berkel, P.H.C.; van de Winkel, J.G.J.; Schuurman, J.; Parren, P.W.H.I.; Heck, A.J.R. Quantitative Analysis of the Interaction Strength and Dynamics of Human IgG4 Half Molecules by Native Mass Spectrometry. Structure 2011, 19, 1274–1282. [Google Scholar] [CrossRef] [PubMed]
- Pottiez, G.; Haverland, N.; Ciborowski, P. Mass Spectrometric Characterization of Gelsolin Isoforms. Rapid Communications in Mass Spectrometry 2010, 24, 2620–2624. [Google Scholar] [CrossRef] [PubMed]
- Sethi, S.; Dasari, S.; Amin, M.S.; Vrana, J.A.; Theis, J.D.; Alexander, M.P.; Kurtin, P.J. Clinical, Biopsy, and Mass Spectrometry Findings of Renal Gelsolin Amyloidosis. Kidney International 2017, 91, 964–971. [Google Scholar] [CrossRef] [PubMed]
Figure 1.
The crystal structure of gelsolin 1-3 obtained from the RCSB Protein Data Bank; PDB ID: 1RGI [10,11].
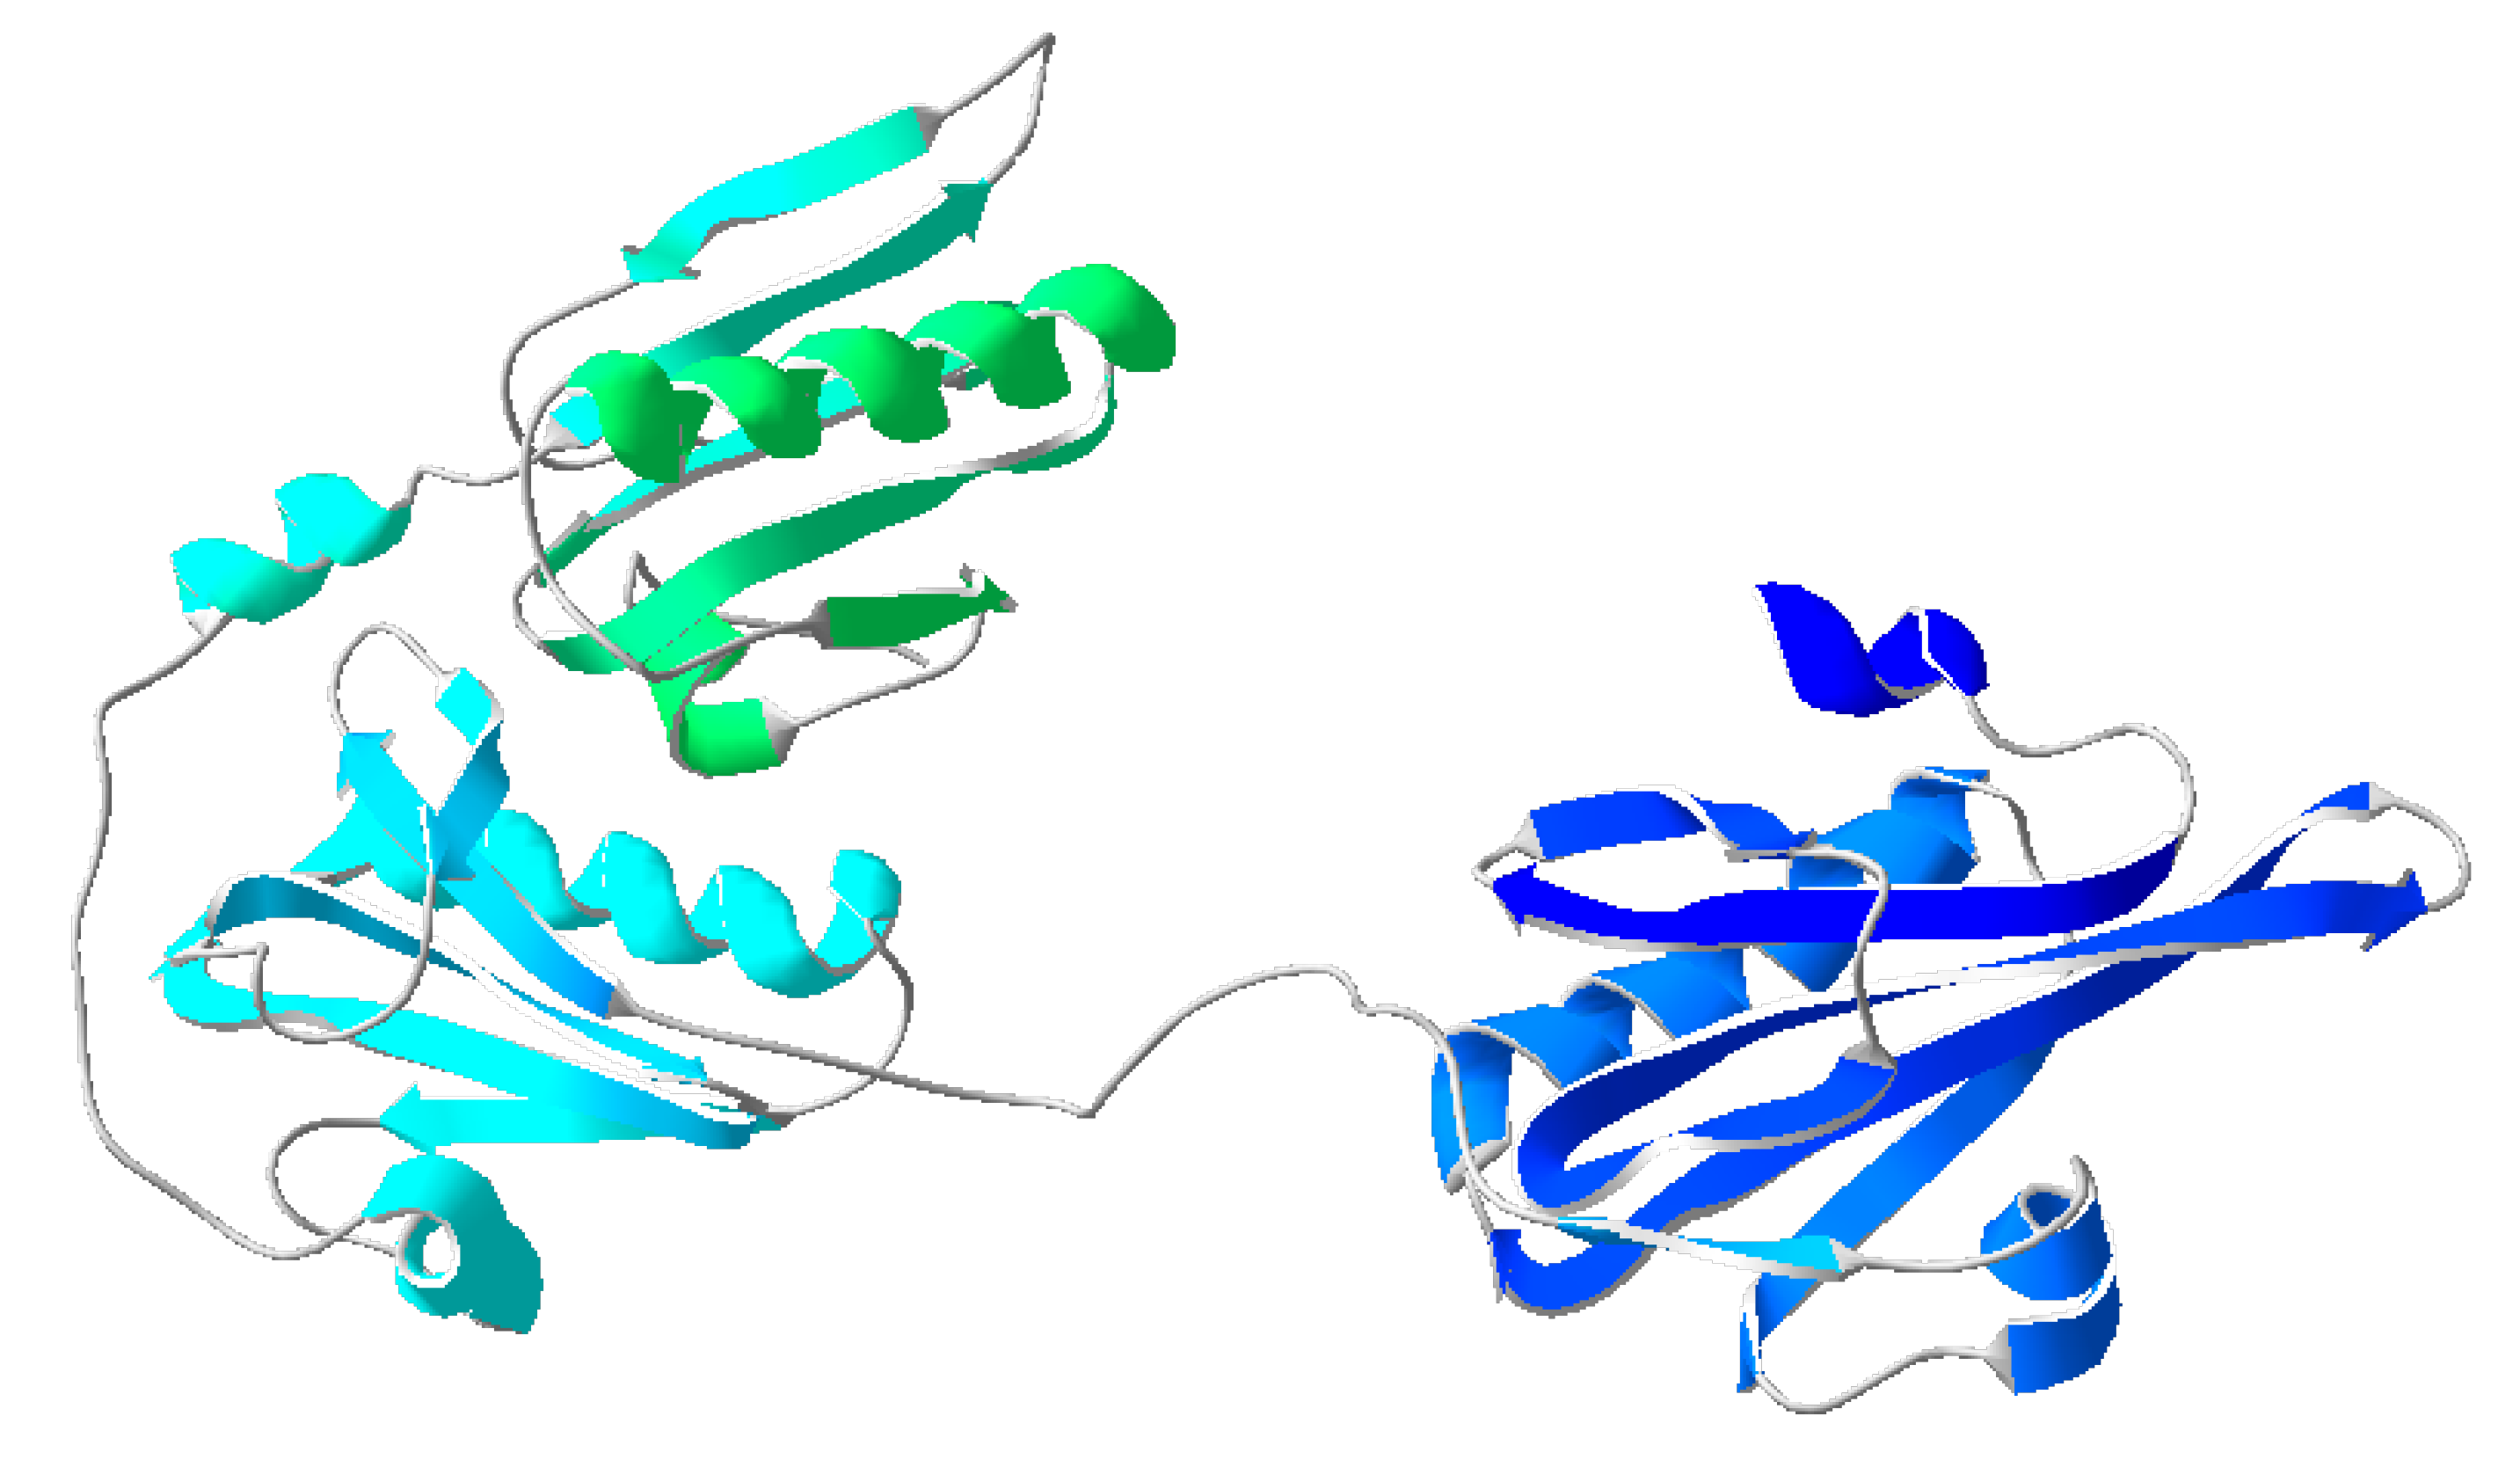
Figure 2.
A smartphone image of the SDS-PAGE from the synthesis and purification of gelsolin 1-3. The lanes represent samples taken from the different stages of the process: (1) crude (taken after lysis and centrifugation); (2) column flow through; (3) wash 1; (4) wash 2; (5) wash 3; (6) eluent; (7) water wash; (8) post-dialysis of eluent; and (9) InvitrogenTM BenchMarkTM Prestained Protein Ladder.
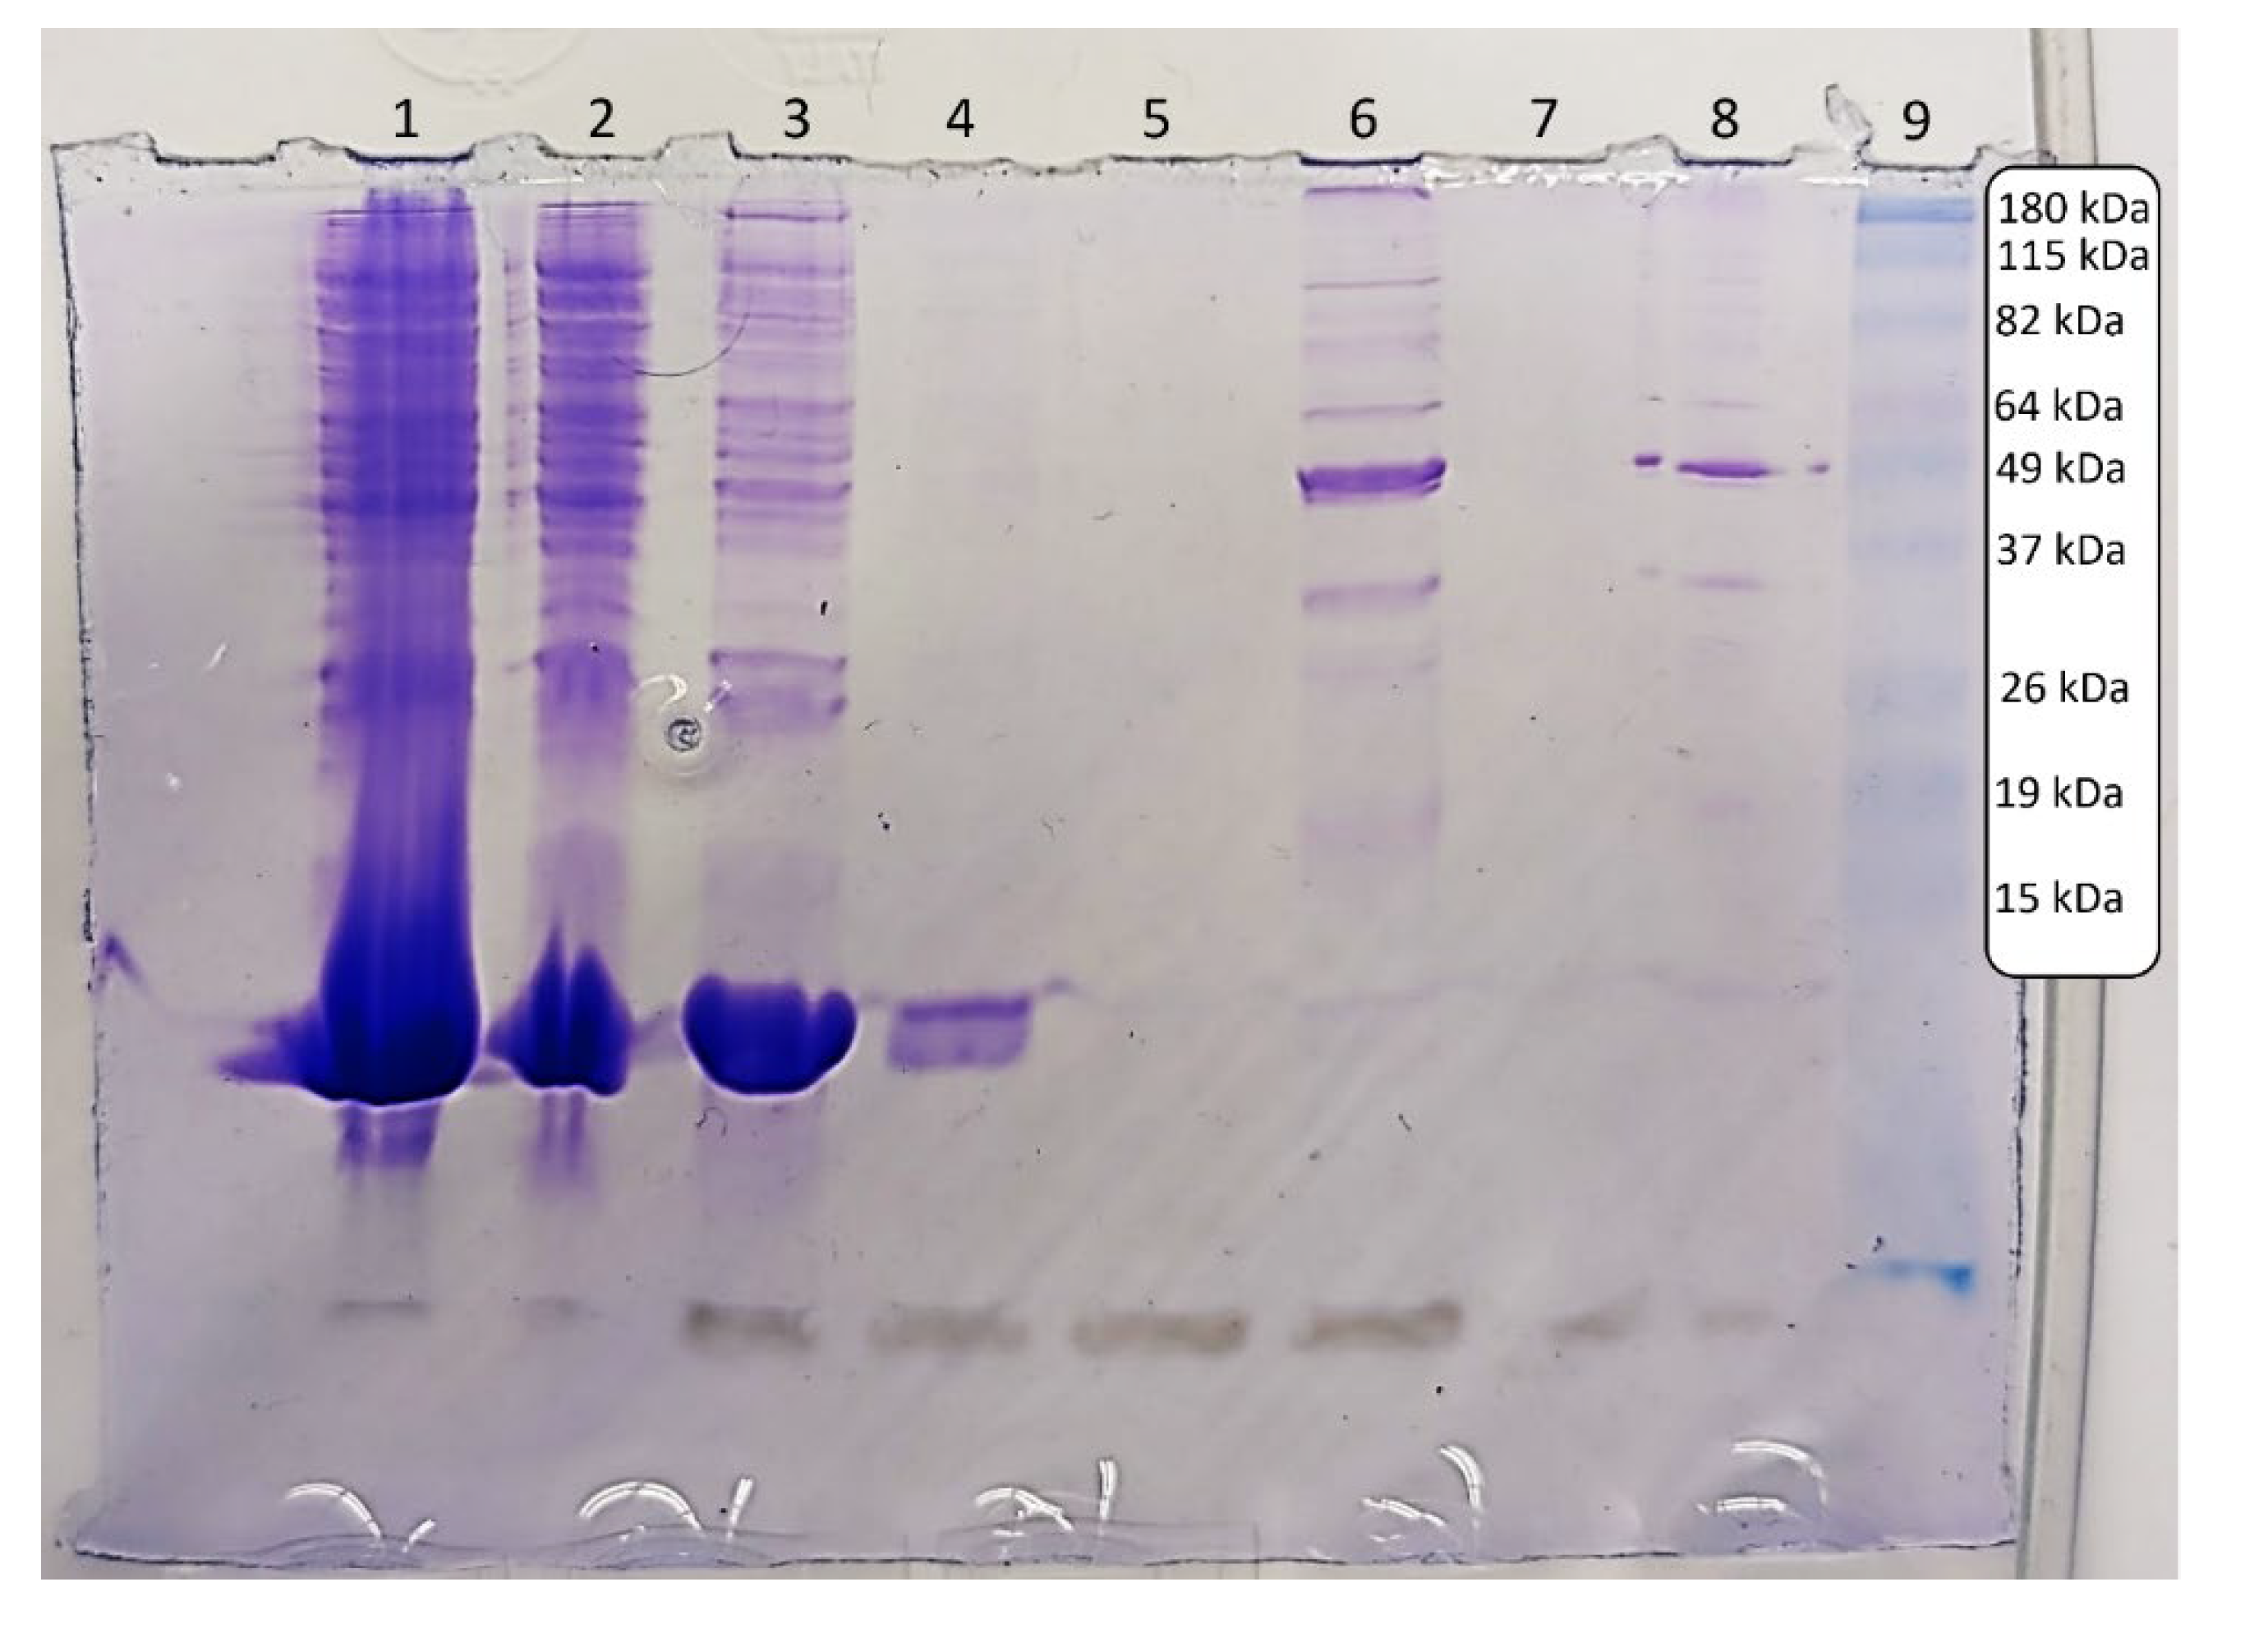
Figure 3.
Positive nano-ESI mass spectrum of the sample. In the higher m/z range, a 33.6 kDa molecular weight species is detected predominantly, with charge states indicated on the plot. Lower intensity peaks of a 68.5 kDa species are also present. This latter species is likely to be a dimer of gelsolin 1-3 that resembles the full gelsolin protein.
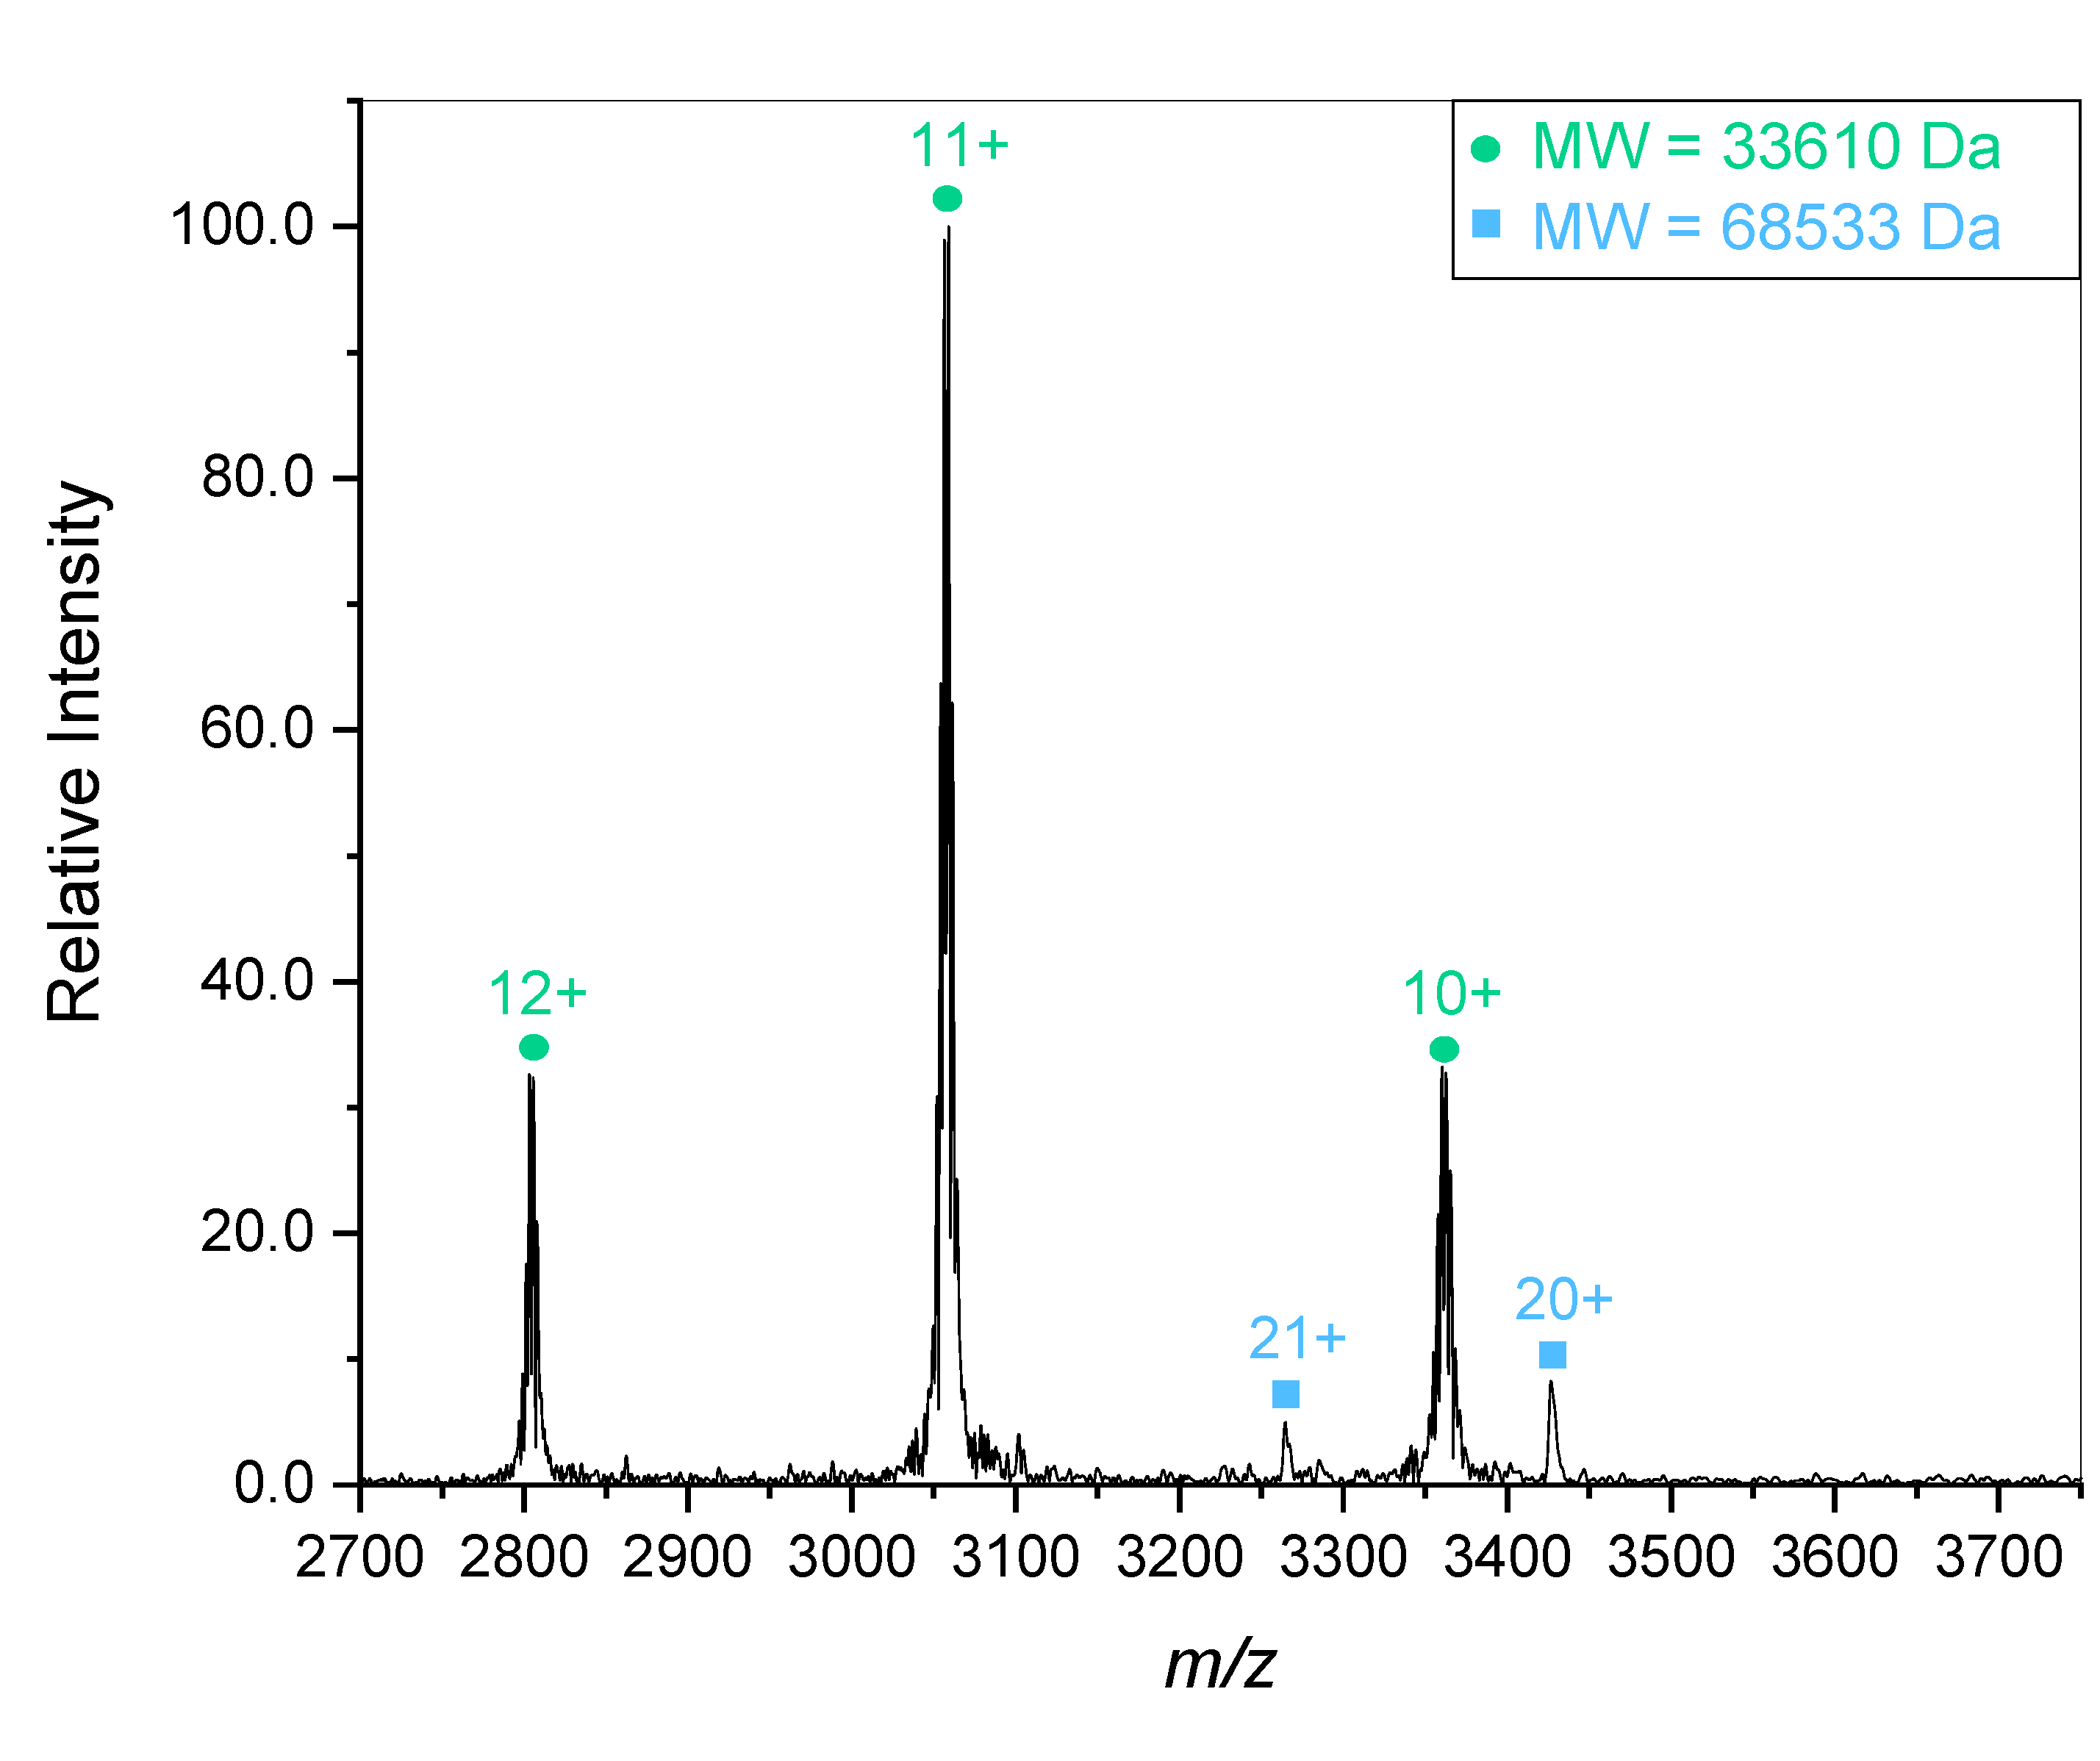
Figure 4.
Positive nano-ESI mass spectrum of the sample tuned to the lower m/z range. Multiple charge states of a species with a molecular weight of 14.3 kDa are indicated.
Figure 4.
Positive nano-ESI mass spectrum of the sample tuned to the lower m/z range. Multiple charge states of a species with a molecular weight of 14.3 kDa are indicated.
Disclaimer/Publisher’s Note: The statements, opinions and data contained in all publications are solely those of the individual author(s) and contributor(s) and not of MDPI and/or the editor(s). MDPI and/or the editor(s) disclaim responsibility for any injury to people or property resulting from any ideas, methods, instructions or products referred to in the content. |
© 2024 by the authors. Licensee MDPI, Basel, Switzerland. This article is an open access article distributed under the terms and conditions of the Creative Commons Attribution (CC BY) license (http://creativecommons.org/licenses/by/4.0/).
Copyright: This open access article is published under a Creative Commons CC BY 4.0 license, which permit the free download, distribution, and reuse, provided that the author and preprint are cited in any reuse.


