Submitted:
17 July 2024
Posted:
19 July 2024
You are already at the latest version
Preprints on COVID-19 and SARS-CoV-2
Abstract
Human existence and development ever demanded suitable shelter, the dual direc-tion relationship of human-residence have always been a material dealt with to enhance residential living conditions. The emersion of COVID-19 pandemic had introduced ab-rupt and dramatic changes in human life protocols, that exerted clear pressure on differ-ent sectors within the built environment. Housing beard great impact due to needs of so-cial distancing and quarantine obligations to increase chances of human existence. In order to measure human adaptation and residence alterations following new residential requirements, Quality of life investigations to promotse better built environment for oc-cupants had been facilitated using theory of residential dissatisfaction already been adopted in current study. Residents’ responses had been extracted regarding their dissat-isfaction applying Likert scale for measurement and evaluation. The study focused on homogenous housing estates in Erbil City precisely apartments have been selected with different plans and building layouts for their widespread use in the city and have been occupied during the three stages of study to go beyond investigating direct impact of the pandemic towards permanence of alterations and adaptation even after pandemic. Rea-sons causing changed dissatisfaction levels have been investigated for better reliability towards formulating final conclusions and recommendations. Findings showed in-creased dissatisfaction during pandemic in most of spaces, apartment layout and space design significantly affected responses and demands. Levels of dissatisfaction after pan-demic were different from stability to slight decline in dissatisfaction. The effect of limited external spaces in apartments had limited the possibility to manage the pressure, a case that might be less demanding in single family housing due to availability of private gar-dens.
Keywords:
COVID-19
; Housing Quality
; Satisfaction
; Pandemic
; Apartment Layout
; Apartment Spaces
; Privacy
1. Introduction
Since the emergence of the COVID-19 pandemic, our lives have undergone significant changes, introducing terms such as distant learning, quarantine, social distancing, and flexible working into our daily routines[1]. Such events have historically reshaped our environments, compelling us to adapt to new ways of living in response to the challenges posed by pandemics[2]. Architects and designers face formidable challenges during pandemics, as they must balance the need to prevent physical interactions with the requirements for quarantine [3]. Before the pandemic, homes primarily served as places for rest and familial interaction. However, with the onset of COVID-19, residences rapidly transformed into multifunctional spaces accommodating work, education, recreation, and commercial activities [4,5,6]. This shift has underscored the importance of adaptable living environments that can meet diverse needs during such crises, necessitating new adaptive and spontaneous typologies to accommodate people’s needs [3] (p. 6).
Research into housing satisfaction intersects with various scientific disciplines, each offering a unique set of definitions. Fundamentally, this concept is perceived as the discrepancy between what individuals expect and need from their living situations and what they actually experience[7]. Housing satisfaction is recognized as a multidimensional entity influenced by a mix of ecological and socio-geographic elements [8]. It necessitates residents’ detailed evaluation of their physical and social environments. The assessment of resident satisfaction crucially hinges on the quality of the interior, a broad term that encompasses different aspects of housing and merges objective with subjective elements [11]. This idea also pertains to the building’s physical condition and additional amenities and services that enhance a location’s appeal, as well as features particular to the residents [12]. Liu [9]described the quality of life as the expression of a set of “wants” which, when supplied together, makes the individual happy or satisfied. This brings forth the question of how these “wants” transformed when people were forced to remain inside for extended periods due to an unprecedented event. In his study [1] investigated factors that were affecting the residential satisfaction and found that factors such as lacking of a view, presence of a garden, number of bathrooms and living rooms, as well as the size and number of balconies affect the residential satisfaction of the participants. Moreover, the study stated that the lack of a storage area was not affecting the satisfaction of the residents rather factors such as ventilation, privacy with noise isolation, flexible spaces, and need for natural day light were the primary concerns of the residents. Kim and Kim (2023) found similar results regarding the dissatisfaction of residents with their living spaces and their study showed that people were dissatisfied with the home due to the inability of their current space to meet the new and changed functions such as need the need for multiple bathrooms and the study revealed that living room, bedroom, and kitchen were among the spaces that residents spent most of their times and these spaces need to be designed in such a way that supports newly absorbed functions into the indoor space.
Numerous studies have examined apartment and housing satisfaction levels through various quality indicators such as construction quality, furnishing quality, ventilation, room size and additional rooms and spaces [9,10,11,12,13]. Hijazi and Attiah [13] revealed that the lack of an extra space in apartments compelled residents to work from kitchens or reception areas, with multiple individuals inside the house sharing these spaces. Hajjar [12] found similar results in Lebanon, where people performed work and study activities in living rooms, dining rooms, and reception areas, lacking privacy. Itma and Monna [15] performed similar research and assessed the suitability of open and closed plans for situations like the COVID-19 pandemic and found that open plan designs are less suited for such situations as compared to traditional closed plan designs since the separated spaces in the closed plans easily allow residents to convert the available spaces to their new needs such as offices or quarantine areas, creating private spaces as well as multi-functional spaces. Concerning isolation and disease prevention during the pandemic, studies have showed the necessity for houses to include separate bathrooms and bedrooms so as an infected individual will be able to safely isolate himself from the healthy occupants during the infection period [5,15,16,17] Moreover, regarding the size of the isolation rooms, studies claimed that the rooms need to be large enough for the infected individual to be able to set up a temporary workstation in the room and carry out their tasks while safely isolating him/herself from other occupants. (Al-ayash, 2020; Spennemann, 2021; Marcel et al., 2020) One more study [19] concerning the space usage during the pandemic in Jeddah, Saudi Arabia found that residents disposed of some furniture to adapt to new needs and allocate spaces for other activities and entertainment. Bettaieb and Alsabban [19] claim that inhabitants incorporated a coffee area in their homes during the pandemic as an alternative to visiting cafes because they were not able to do so in due to strict rules of the pandemic, such adaptation focuses on reconfiguring existing spaces to fulfill new living requirements, illustrating that flexibility often depends more on residents’ perceptions and minor adjustments than on major architectural changes.
The confinement induced by the COVID-19 pandemic has elevated the importance of determining the physical, spatial, social, and urban conditions under which millions of families worldwide choose to live [20]. Consequently, the demand for higher living standards when purchasing or leasing properties has surged. This shift underscores the growing necessity for rigorously developed assessment methods that can comprehensively evaluate housing by considering its multifaceted, conflicting, and often incompatible aspects [21]. In Erbil City, like many other cities around the world, the pandemic compelled residents to repurpose their homes to accommodate a wide range of activities, transforming living spaces into multifunctional hubs for work, education, recreation, and self-care. Therefore, this study aims to evaluate apartments resident’s’ satisfaction in Erbil City during three distinct stages—before, during, and after the COVID-19 pandemic—using five interior space quality indicators: number, area, proportion, privacy, and functional relationship.
2. Materials and Methods
As presented before, to satisfy the main objectives of the current study direct interview with family heads were administered, to ensure write and reliable responses. The sampling method had been carried out depending on some main criteria that had been listed in Table 1, those criterions were belonging to three groups of concern.
First of all were related to users or occupants to guarantee that responses are freely addressed occupants were selected to be owners and had experienced living in their apartments through the three stages of pandemic, criterion of normally distributed family sizes with their social status that represent population living in apartment during three stages had been maintained, as will be described in detail in the following parts of the study.
One more formal issue was the acceptance of both families to participate in such a study in addition to some housing estates where permission to do interview had been hindered due to different reasons.
Apartment distribution through Erbil City municipality boundary had been considered. Covering different layouts of apartments in addition to building typologies were all been respected to increase generality of results.
2.1. Literature Review to Identify Quality Indicators
The research reviewed previous studies on housing quality indictors and housing designs adaptable to different situations mainly the COVID-19 pandemic. Google scholar and MDPI were selected as electronic search databases using key words “Housing quality indicators”, “Apartment satisfaction”, “Housing design and COVID-19”. A number of newly published articles published between 2020 - 2023 were selected and their eligibility was assessed through a full text review and the process resulted in choosing main indicators respecting clear framework for study.
2.2. Project Selection and Preliminary Assessment
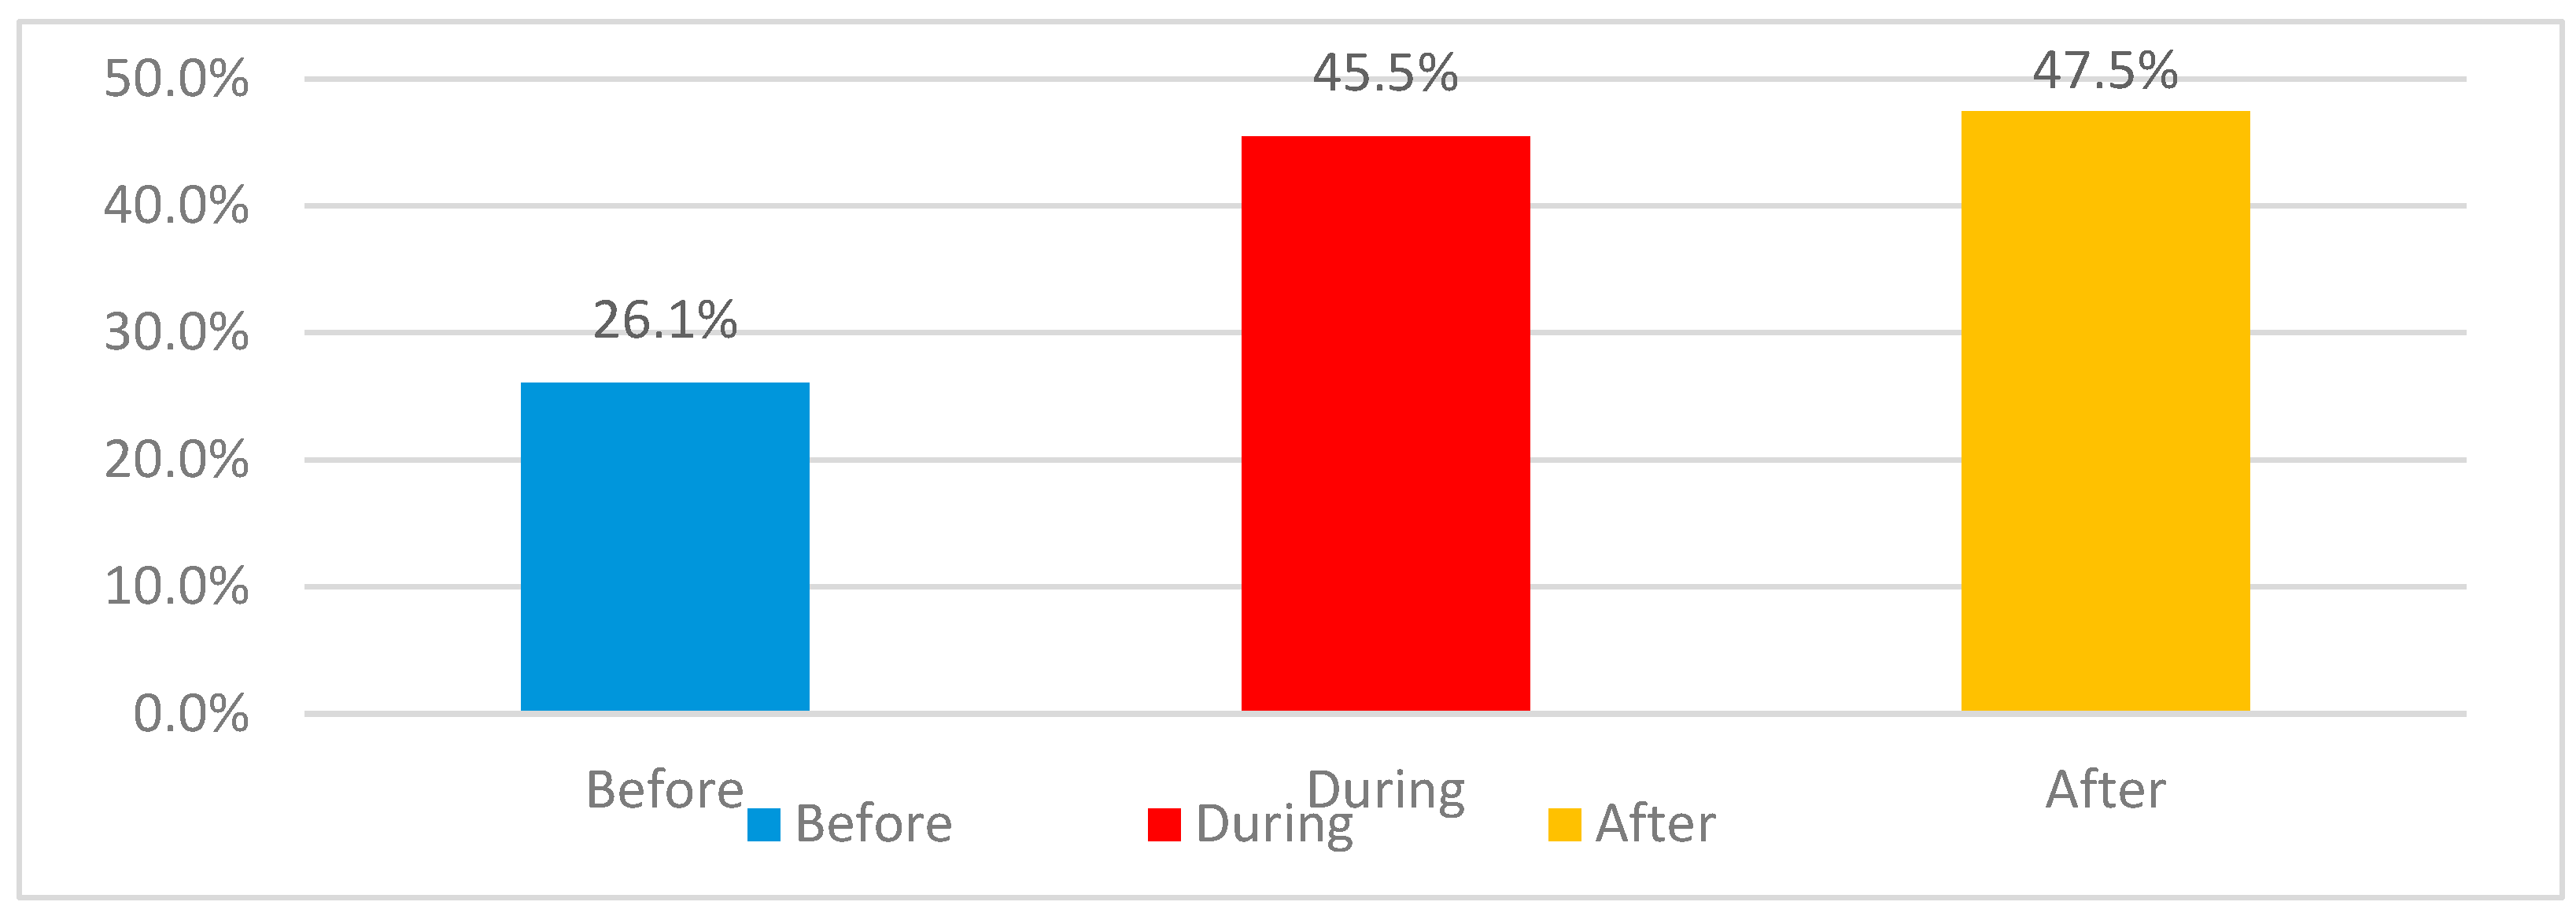
The data collection process started during the COVID-19 pandemic in 2021. First the researcher conducted a thorough survey on the 74 projects in Erbil city and found out that 5.4 % of the projects were in the planning and designing stages, 40.5% were still under construction, and 6.8% were completed but not occupied, percentage of occupied projects contributed with only 47.3% of total estates in 2021 details are presented in Figure 1.
During the field survey, the research faced projects that were not cooperative and did not allow their occupants to be interviewed and they were immediately excluded from the study formed 37.1% of occupied ones. Additionally, the apartments that were below eleven floors were excluded as well as the projects that lacked 2+1 and 3+1 apartment configurations were also excluded. Among the 11 floors and above apartments those that were small of category (1+1) and large (4+1) configurations were also excluded, in addition to those cases that didn’t follow obligations and limitations of study that reached 34.3% of cases. Here the remaining cases that follow study requirements form 28.6% of occupied projects. Precisely 100 % of projects satisfying research objectives been covered in the sampling selection, by adding the non-authorized cases the directly covered projects percentage will approximate 65% of all cases related to study restriction which is far higher than 25% ratio of statistically normally recommended.
2.3. Sample Selection and Size
The samples were randomly selected but with specific conditions from apartment buildings that were higher than 10 floors for 2+1 and 3+1 apartment configurations. Among these, twelve plan types were mainly of category 2+1 out of that number two were of category 2+2, eight were of category 3+1, including one of category 3+2. The second main condition was satisfying the minimum sample of every apartment plan of 5 samples to sustain validity. The third condition was the balanced distribution of samples between the apartments main criteria, including location within building, building typology. Fourth was concern about location of projects within city that can guarantee better representation. The demographic realistic representation of occupants and gender equalization of respondents was the fifth main restriction in selection process.
2.3. Direct Interview and Questionnaire Distribution
The research’s starting point was distribution of the developed questionnaire to a group of expert professors in the field and based on their feedback, the questionnaire was revised for clarity and ease of understanding by the respondents. Since Erbil city is cosmopolitan city, the researcher prepared the questionnaire in Kurdish, Arabic, and English languages and conducted direct interviews with residents of the selected apartment.
2.4. Data Collection and Analysis
Over a period of more than eight months, 142 interviews were conducted using a fixed questionnaire format. After completing the interviews, a Google Form was designed to capture detailed preferences of the residents. The interview had been carried out on 20 types of apartments’ plans related to 10 investment projects that satisfied conditions of current research, obtained results were organized following the sequence of returned responses, starting with demographic background of respondents and their family compositions. Followed by main housing characteristics that reflect their living conditions describing spaces and layouts of their apartments.
The data was regularly entered into an Excel spreadsheet, sometimes daily and other times weekly. Finally, the data was transferred to SPSS software version 26 for analysis. The data was thoroughly analyzed to draw meaningful conclusions. Descriptive analysis in addition to factor analysis are the main processes of statistics that have been facilitated to obtain results in the form of spread sheets and graphs to achieve research objectives.
3. Results
The results are concerned with describing dissatisfaction levels discussing their reasons about 14 items related to interviewed cases as interaction between human and his residence, finding out changes in trends during the three stages of pandemic, before, during and after pandemic, exploring the strength of pandemic impact on residents’ living conditions, as main goals of current study.
3.1. Respondents’ Demographic Characteristicsy
Human needs and responses’ changes had been identified due to COVID-19 pandemic that been assessed by families through the settled three stages. Tables 2A,B and 3, present major indicators of respondents’ social status. Interviewed respondents were almost equal referring to the gender to increase reliability and sharing both gender in outlining results observed in Table 2A.
Distribution of head of families indicates dominance of 30-39 years age group, then followed by 20-29 then 40-49 years age groups. The average age of respondents of head of families responded is 37.84 years almost more young than old respondents due to conditions of apartments ownership. Regarding criteria of education of respondents shown in Table 2B presents highly educated persons profile with majority formed by university graduates, an average higher than Erbil city. The share of working heads formed 94.2 %, Housekeepers formed 4.2%, leaving only 1.6% as retired persons, those results support the profile of age of family heads of middle-aged ones.
Description of respondents’ family structures can be obtained with aid of Table 3, it shows that majority of family sizes are within 3- and 4-persons families then followed by two persons families, while finding out average of household size valued 3.57 persons supports that social stratum is below city average household sizes ranging between 4.90 -5.05 persons for Erbil city urban area. This result is also supported by the availability of 20.4% of families of childless category, with small percentage of extended families of 3.5% that cannot balance the small average size of households who are been interviewed.
3.2. Residences’ Major Characteristics
Apartments’ main characteristics occupied by respondents can be seen in Table 4A. shows the profile of selected cases for current study, cases were distributed through 20 apartment plans belonging to the 10 investment projects distributed through Erbil city occupied during the three stages of pandemic.

Table 4A.
Housing Main Characteristics-part A.
| Table -4 Apartments Main Characteristics part A | |||||
| Project & Apart. Category | Freq. | % | Project and Apart. Category | Freq. | % |
| Empire Wings [2+1] | 6 | 4.23 | Empire Royal [ 3+1] | 12 | 8.45 |
| Park view-D [2+1] | 7 | 4.92 | Park view-B [3+2] | 6 | 4.23 |
| Park view-C [2+2] | 6 | 4.23 | Zanyary-C [3+1] | 10 | 7.04 |
| Zanyary-B [2+1] | 6 | 4.23 | Cihan-arr. Kor. Gar. [3+1] | 23 | 16.18 |
| Cihan-Qaradagh [2+1] | 6 | 4.23 | MRF 2,4,5 [3+1] | 6 | 4.23 |
| Cihan-Pirmam [2+1] | 6 | 4.23 | Roya [A-C] [3+1] | 6 | 4.23 |
| Cihan-Korek [2+2] | 7 | 4.92 | Roya [D] [3+1] | 4 | 2.82 |
| Eskan Tower [2+1] | 6 | 4.23 | Plus Life A[3+1] | 5 | 3.52 |
| Quattro [2+1] | 5 | 3.52 | |||
| FM-Plus Life[2+1] | 5 | 3.52 | |||
| Plus Life C[2+1] | 5 | 3.52 | |||
| Plus Life D[2+1] | 5 | 3.52 | |||
| Subtotal of category 2+1 | 70 | 49.3 | Subtotal for category 3+1 | 72 | 50.7 |
| Total Observed | 142 | 100% | |||
This procedure has been followed to satisfy the exact distribution of apartments between the category of 2-bedrooms and 3-bedrooms as the majority of investment projects had adopted those sizes as presented in Table 4B.
Regarding apartment size or category, apartment size and category 2-bedrooms formed 45.1% of cases or samples while 3-bedrooms contributed 54.9% . Apartments with single living rooms formed 88.0% of samples while 12.0% of surveyed apartments had 2 living areas used as family living in addition to guest room.
Table 4B.
Housing Main Characteristics-part B.
| Table -4 Apartments Main Characteristics part B | |||
| Frequency | % | ||
| Apartment Category | 2+1 | 51 | 35.9% |
| 3+1 | 74 | 52.1% | |
| 2+2 | 13 | 9.2% | |
| 3+2 | 4 | 2.8% | |
| Total | 142 | 100% | |
| Apartment location according to floors | Ground | 2 | 1.4% |
| 1-5 | 28 | 19.7% | |
| 6-10 | 43 | 30.3% | |
| 11-15 | 51 | 35.9% | |
| 16-20 | 9 | 6.3% | |
| 21-25 | 9 | 6.3% | |
| 26-30 | 0 | 0.0% | |
| Total | 142 | 100% | |
| Apartment location according to roof | 1=Near [1-3] floor | 19 | 13.4% |
| 2=Middle [4-5] floor | 19 | 13.4% | |
| Far [>5] floor | 104 | 73.2% | |
| Total | 142 | 100% | |
| Apartment location according to ground | 1=Near [1-3] floor | 12 | 8.5% |
| 2=Middle [3-5] floor | 24 | 16.9% | |
| Far [>5] floor | 106 | 74.6% | |
| Total | 142 | 100% | |
| Apartment location according to elevators | ≤5m | 97 | 68.8% |
| > 5m-10m > | 38 | 27.0% | |
| ≥10m | 6 | 4.3% | |
| Total | 142 | 100% | |
For the reason of having responses from families who had experienced living in their current apartments during the three periods or stages, the available cases within city were mostly located in high rise apartment buildings as been observed in Table 4B, the samples were distributed to cover majority of floors according to their availability to maximize the generality of results.
3.3. Apartments residents’ changed assessments of living conditions
As mentioned before, analysis of the 14 selected items pointed out important findings as is listed below. Results are arranged in a sequence starting from apartment entry door towards service parts at the depth of plan and according to similarity in requirements.
3.3.1. Entrance Lobby
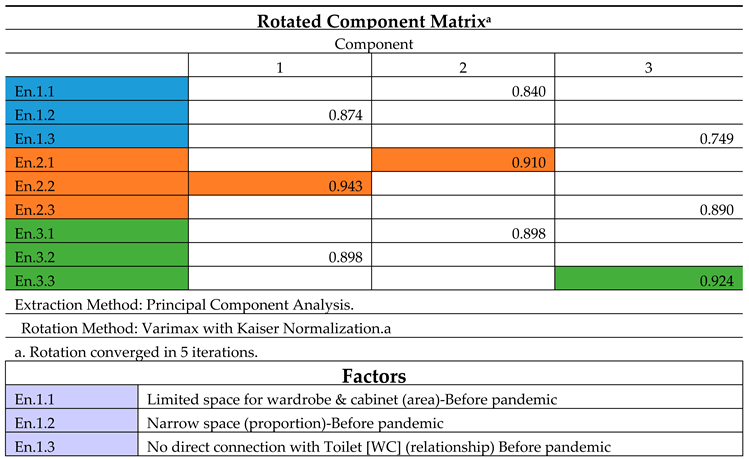
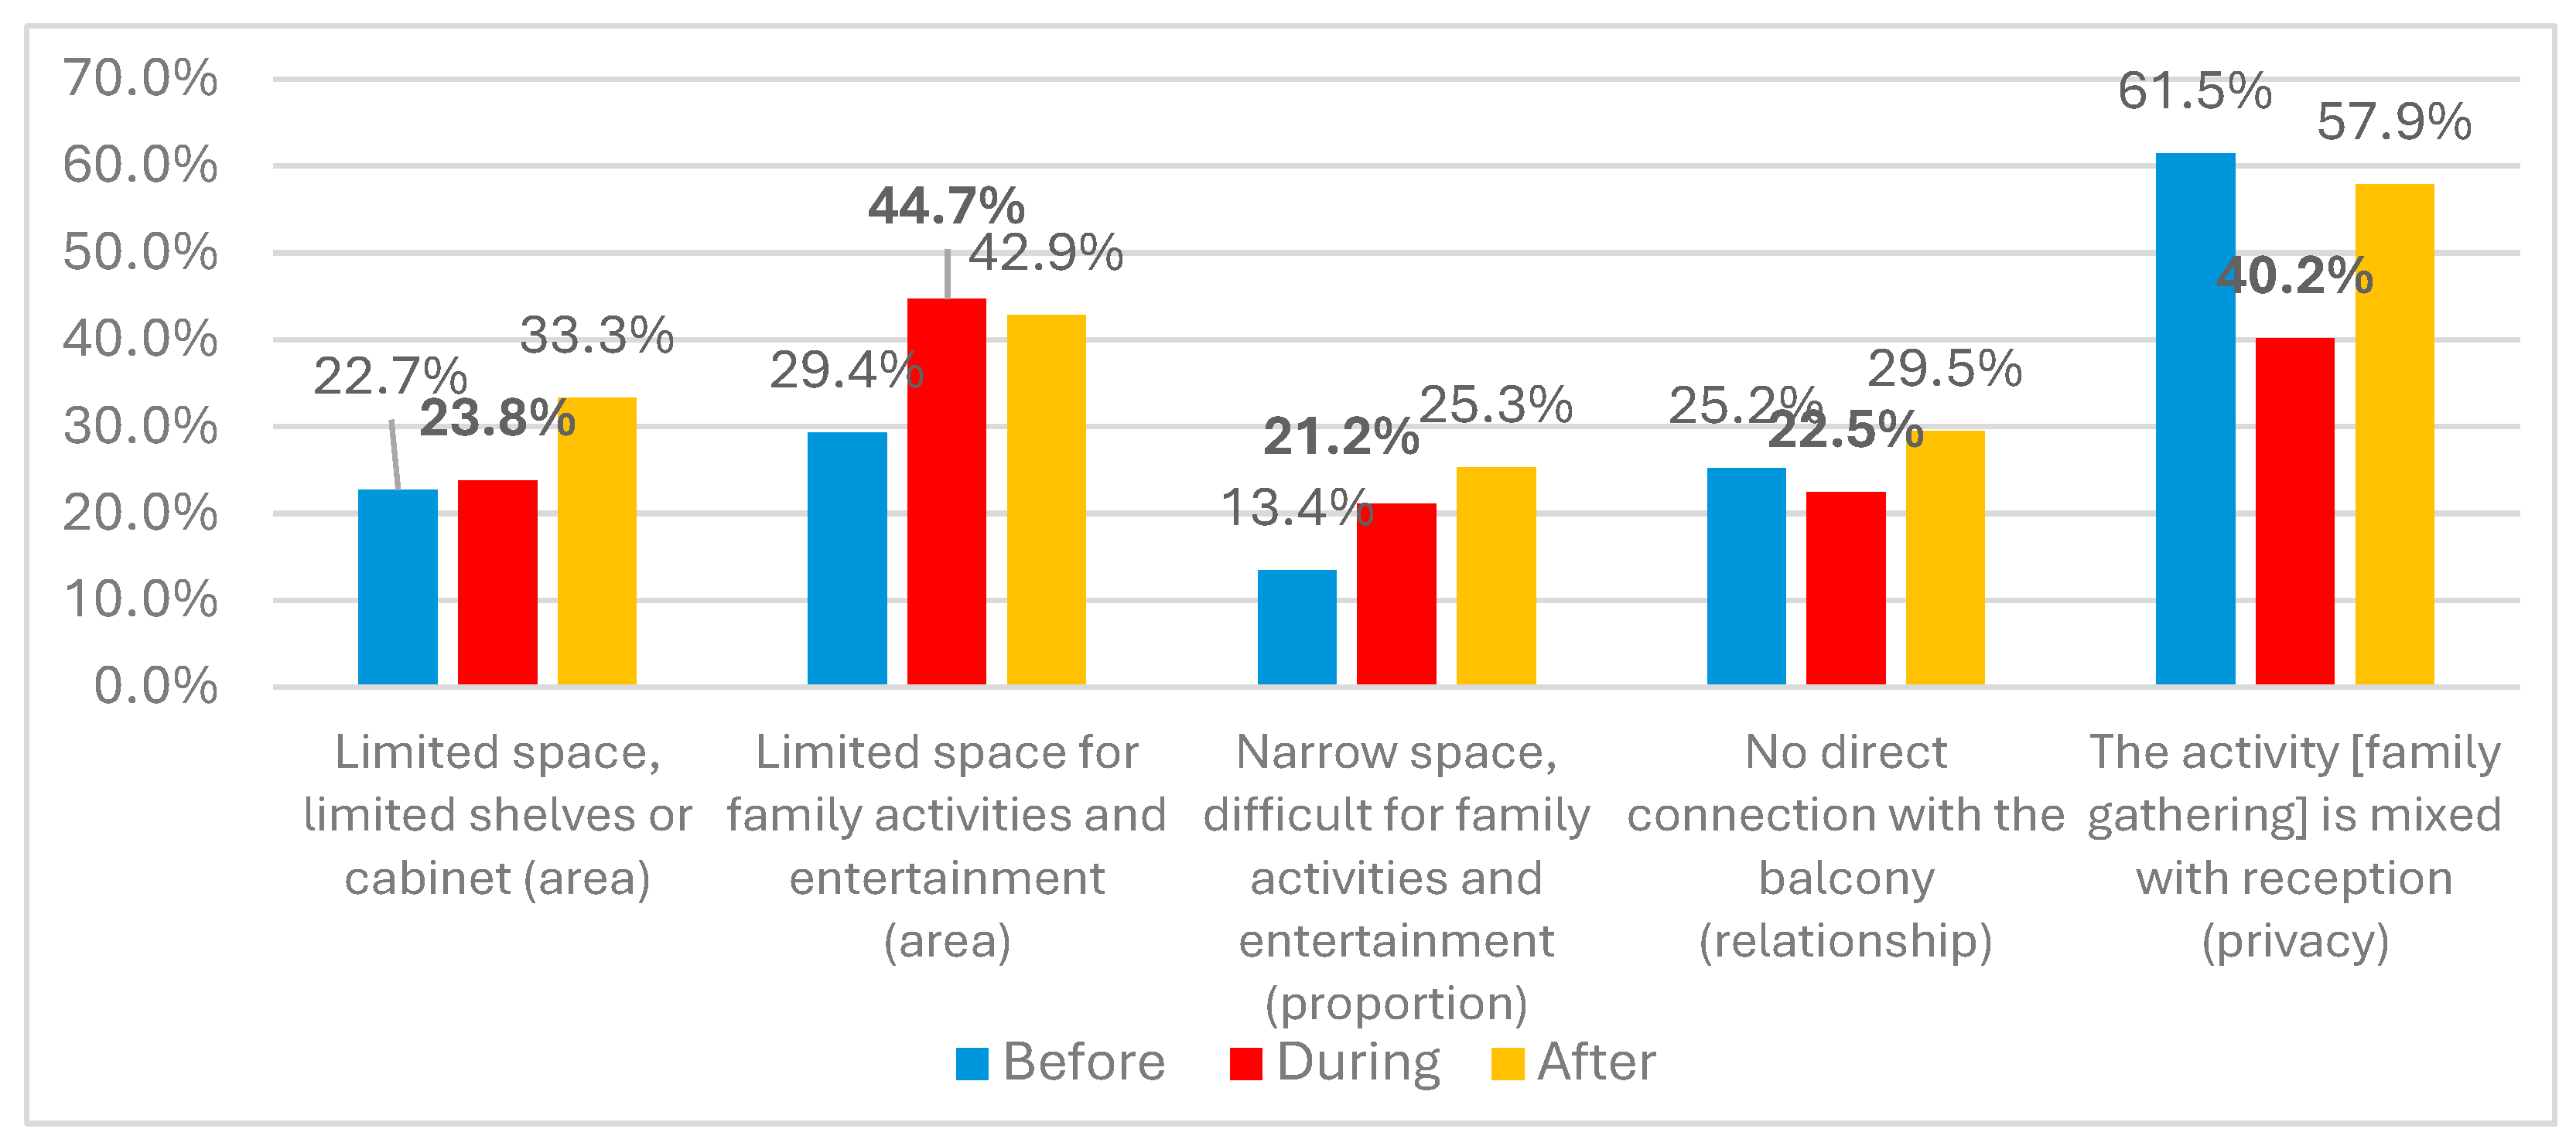
The lobby forms the first space while entering the apartments, 16 types of apartments contained entrance lobby, only 4 missed that space.
Obtained results supported by Figure 3 indicates high jump in dissatisfaction between pre and during pandemic, small decline of residents’ dissatisfaction happened towards after pandemic stage, but result is still 70 % higher than pre-pandemic stage.
The dissatisfaction rate before the pandemic equals 32.5% in dwellings without entrance lobby which is lower than those have an entrance, by a difference of 1.9%. however, during the Pandemic, the amounts were 75.0% for those who don’t have the lobby with 62.7 as shown in Figure 4, the trend moved down for same results to 54.3% and 72.5% respectively. The result indicates increased effect of entrance lobby during and after pandemic through increased dissatisfaction.
Finding out main reasons for dissatisfaction of apartments containing entrance lobby findings concluded from Figure 5 named the proportion as the main reason followed by both area needs and connectivity with entrance toilet.
Viewing the differences between apartments of category 2+1 and 3+1 regarding dissatisfaction levels about entrance lobby with the support of Figure 6, indicators of increased amounts in category 2+1 compared to 3+1, in addition to clear increase in dissatisfaction percentage from pre-pandemic towards pandemic stage, the numbers became almost the double. Slight lowering happened in after pandemic stage.
When combining the effect of availability of entrance lobby to apartment category as shown in Figure 7, category of being of type 2+1 with absence of entrance lobby dominated other 3 possibilities, lowest dissatisfaction occurred in category 3+1 with availability of entrance lobby.
To explain reasons of different dissatisfaction amounts presented in Figure 7. Figure 8 indicates the reasons for both categories 2+1 and 3+1, here reasons corresponding 2+1 category starts high with proportion followed by area then connection to toilet , while in category 3+1 starts with area followed by connection to toilet then proportion of entrance lobby.
Inspecting effect of availability of toilet space within lobby in residents’ dissatisfaction is seen in Figure 8 clear increase is witnessed in during period then in after pandemic for both cases of having toilet and for those who don’t have toilets, there is a margin of about 9-11% increase in cases without toilet.
Referring to Figure 10 for finding differences between factors participating in dissatisfaction variations due to availability or absence of toilet nearby entrance lobby, results clearly showed higher values of residents’ dissatisfactions where no toilet exist in entrance lobby, missing toilet was the highest cause of dissatisfaction while distance of toilet from entrance had the lowest value in causing dissatisfaction.
Proportion comes as the second reason shared the cause for both cases then area came in the third rank. The next interesting finding is that reasons for dissatisfaction had been going down in post pandemic stage in cases where apartments lobbies contained toilets.
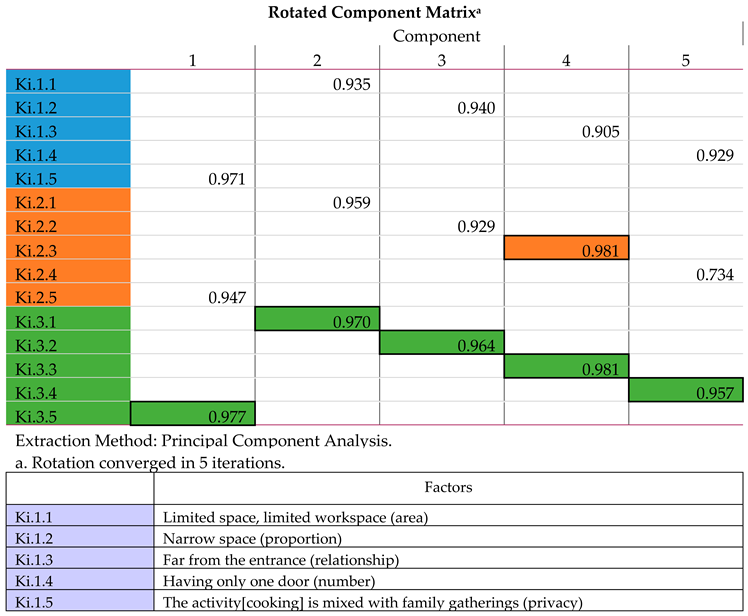
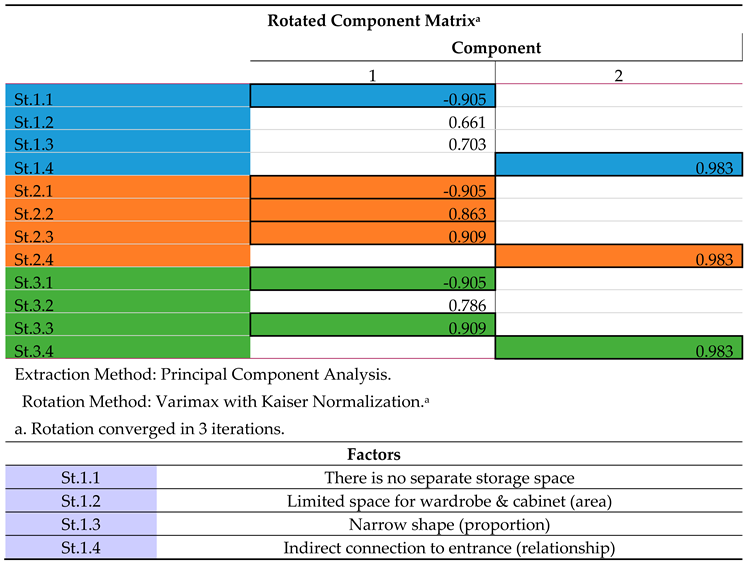
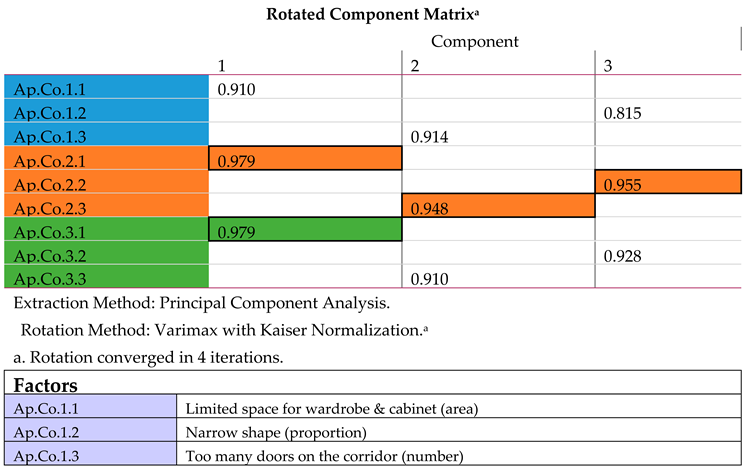
Finding sequences of different reasons or factors for dissatisfaction built up can be obtained in factor analysis processing within SPSS software.
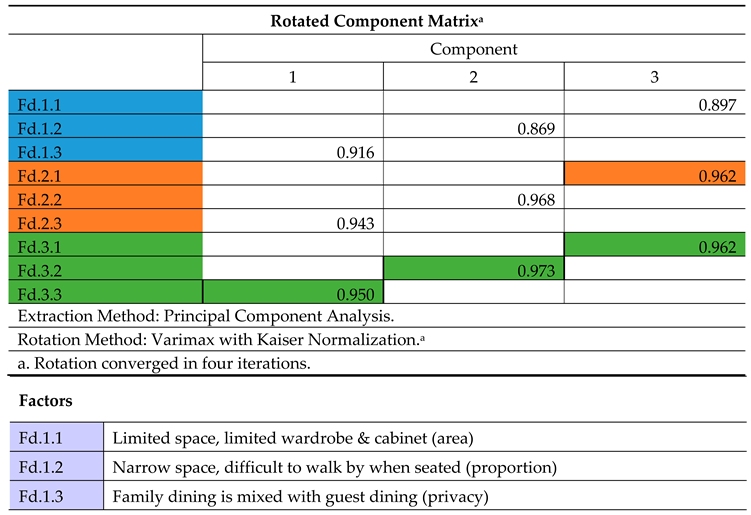
Table 5A,B indicates that reasons ranking form strongest to the weakest is starting with proportion of space and available space for cabinet in stage of during pandemic were the most effective ones on residents’ dissatisfaction followed by availability of toilet within lobby in after pandemic stage. Finding out other factors contributed in dissatisfaction can also be obtained with the use of same table and steps mentioned here.
Table 5A,B.
Factor analysis for entrance lobbies indicating high factor loadings for reasons considered in research.
Table 5A,B.
Factor analysis for entrance lobbies indicating high factor loadings for reasons considered in research.
 |
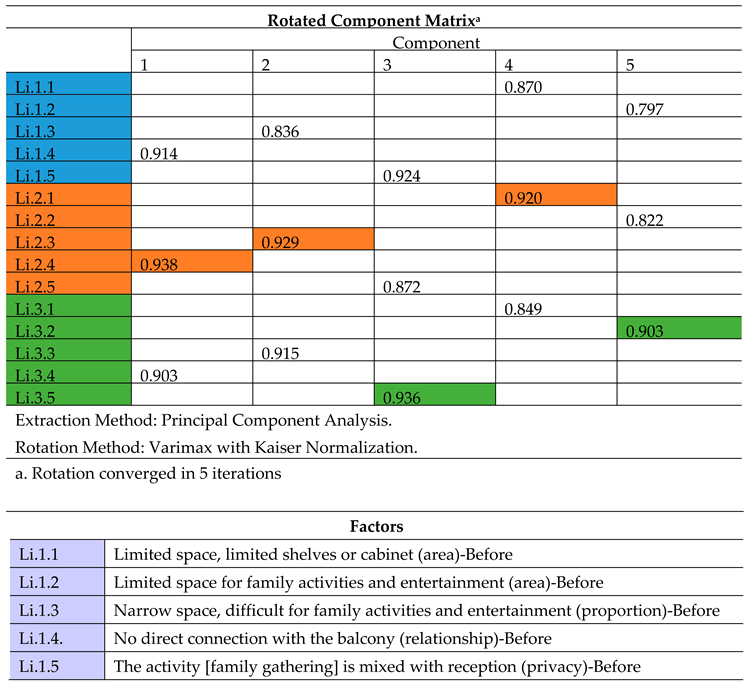
3.3.2. Living Rooms
The Living room means a room used for family gatherings [it could be used for family gatherings and receiving guests if there is no reception in the apartment].
Closed spatial organization for this category means that arrangement where separation of each of living rooms with or absence of dining rooms and reception rooms with or absence of dining rooms existed. While mixing living areas with kitchens and with or without family dining is considered within open spatial organization.
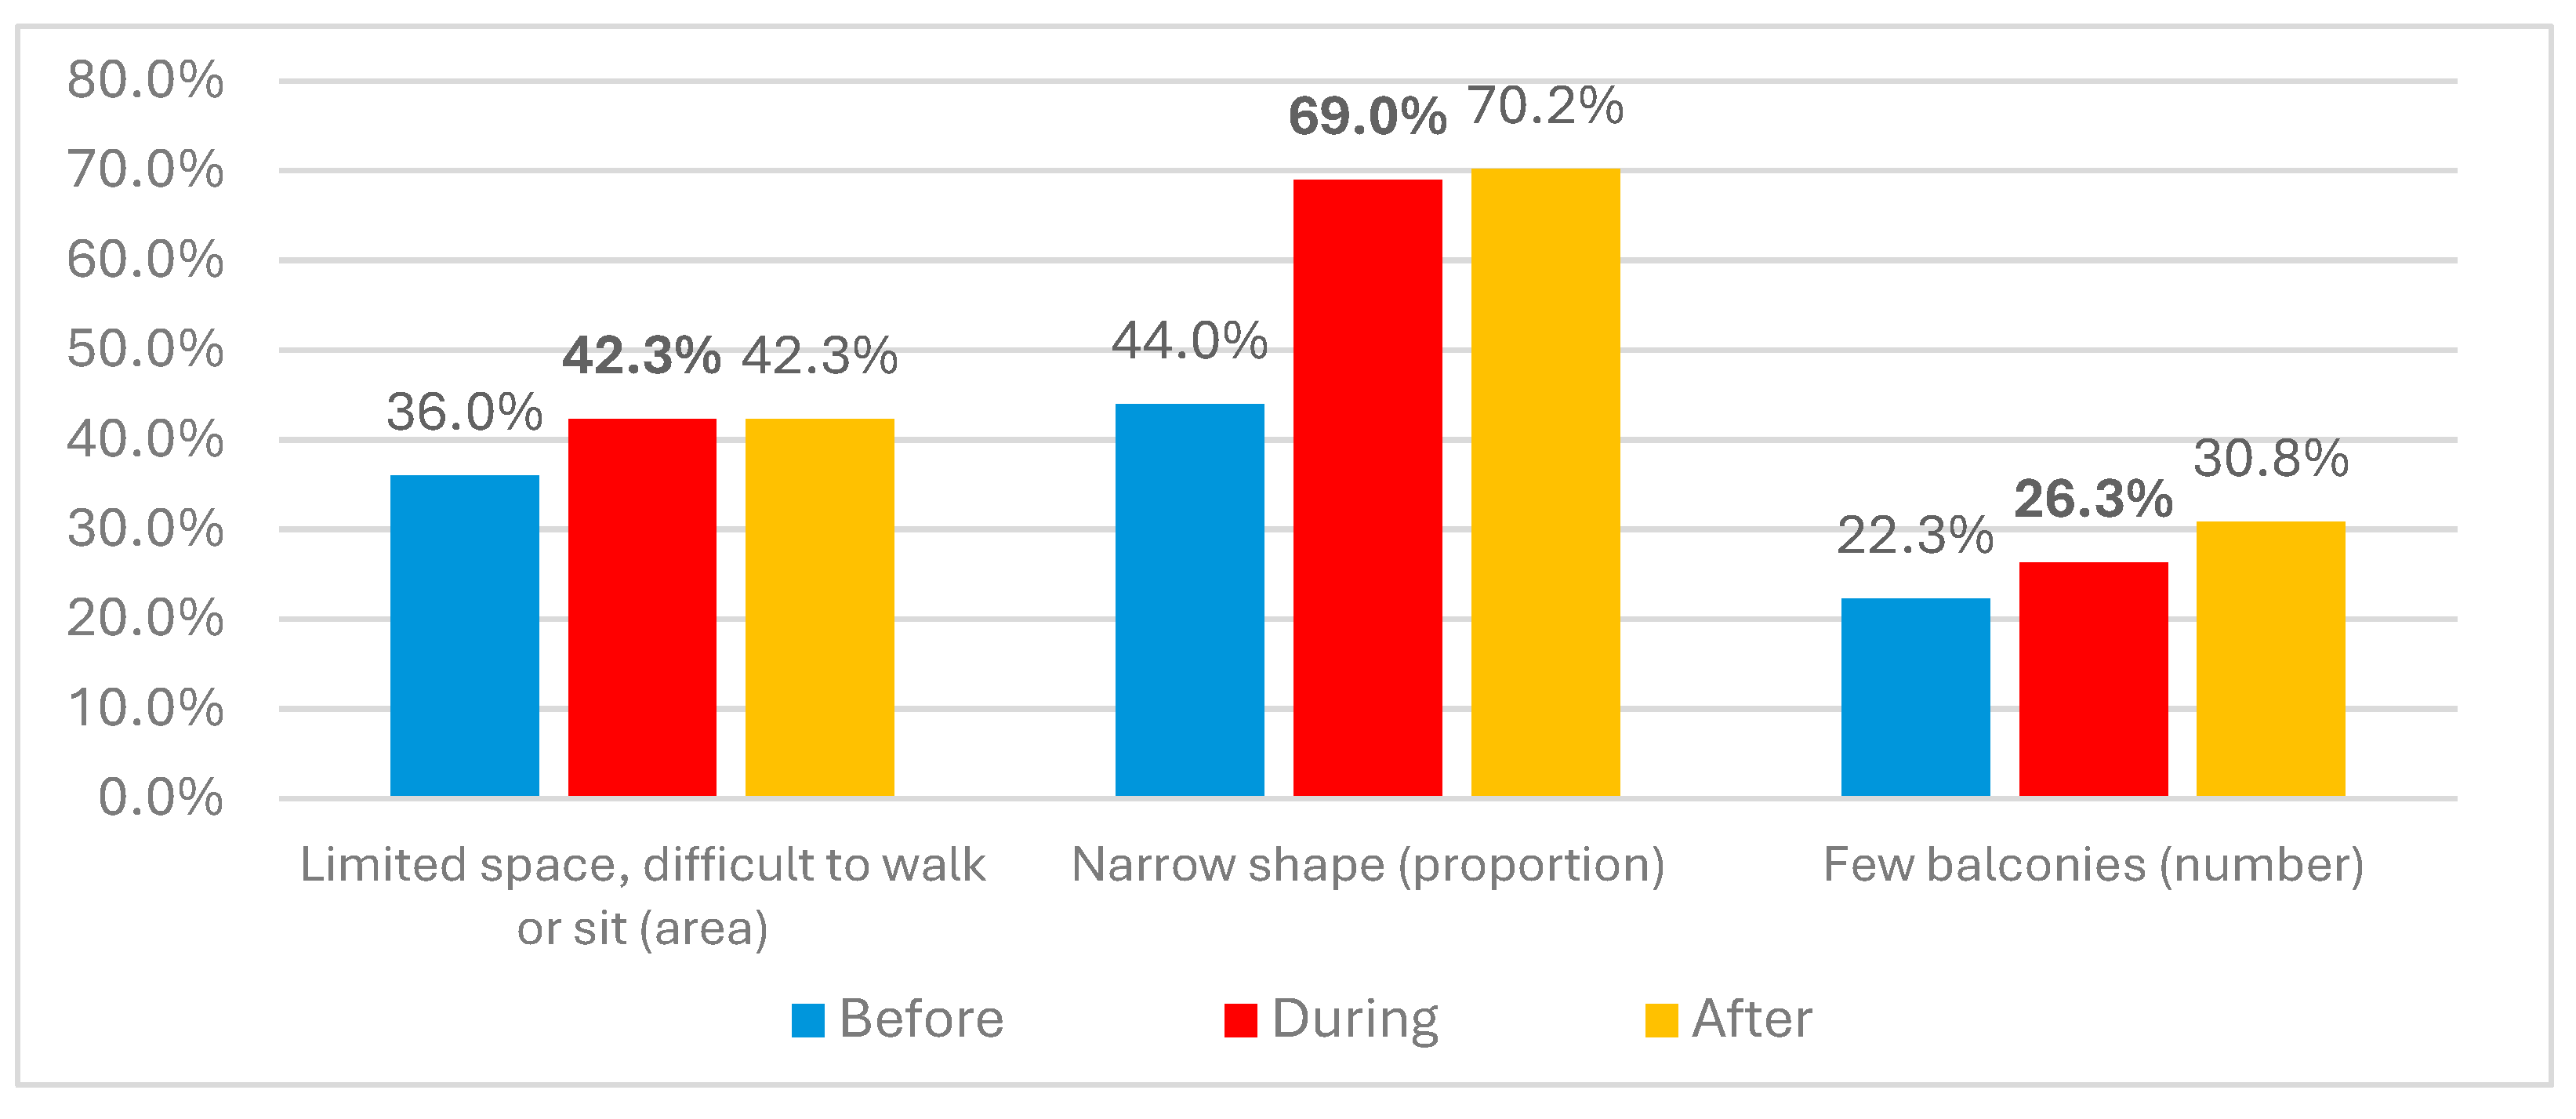
Figure 11 illustrates an increase in dissatisfaction in both stages during and after pandemic regarding the living spaces, the increase is about 19-21%.
Figure 11.
Change in dissatisfaction percentage of living rooms during three stages.
For finding out mean reasons for higher levels of dissatisfaction in living rooms Figure 12 the clear trend of increase timewise as might be expected due to pandemic.
Highest increases are seen to be due to shortage in size reasons 2 regarding limited area, and proportion causing narrow space threatening safety requirements 3, the different trend is observed in reason 5 dissatisfaction goes down during pandemic due to less need for gathering with need to more privacy which goes up again after pandemic.
Figure 12.
Main reasons for Changes in residents’ dissatisfaction of living rooms for all.
Considering differences in dissatisfaction levels within two typologies with the aid of Figure 13, the levels were much higher in the 2+1 dwellings before pandemic, moreover the increase in ratios also were higher for stages of during and after pandemic in comparison with 3+1 cases as regarded larger sizes dwellings with more bedrooms. Privacy requirements in dwellings of type 3+1 showed higher dissatisfaction needs in all stages may be due to higher demands by residents.
Main reasons for higher levels of dissatisfaction in living rooms for both sizes by Figure 14 shows mixing of spaces and limited area as main reasons for dissatisfaction for stages before and after pandemic.
The spatial organization of the living areas pointed mild differences on dissatisfaction levels as seen in Figure 15 , closed organization had 27.9% dissatisfaction in comparison to 23.3% for open organization in stage of pre-pandemic, the case reversed during and after pandemic, the difference became 2-3% in reverse direction.
Comparing reasons for dissatisfaction between closed and open spatial organizing system, for cases of during the pandemic in closed system presented in Figure 16, the space allocated for entertainment activities (area) achieved the highest percentage, at 44.4%, higher than privacy by 18.2%.However, after the pandemic, the difference was 0.5% higher for privacy, and this indicates the ease of achieving privacy in closed system.
While in the open system, the reasons for dissatisfaction during the pandemic were close, and the first reason was privacy and the space allocated for entertainment activities (area), at a rate of 46.1% and 45.6%, respectively, and this percentage increased after the pandemic, with a difference of 14.9% for privacy, and this is due to the difficulty of achieving privacy in the open system as shown in following Figure 17.
The differences in residents’ responses reporting dissatisfaction due to balcony availability before the pandemic was 6.5%, and this difference increased significantly during and after the pandemic to 21.4% for both stages, as shown in Figure 18. These exhibits residents admire for the value of having a living rooms’ balcony in their apartment.
This indicates that the balcony had served as an extension to the family’s openness to the outside world enjoying fresh air source with the needed view of the outdoors. To find main reasons of dissatisfaction for cases of living rooms having access to balconies main reason both Figure 19 and Figure 20 can support the following findings.
In cases of absence of living rooms balconies in Figure 19, the main concern is the area of living space itself, followed by followed by the absence to direct balcony, all percentages are were above 48% for the first and 35% for the second.
While for cases of living had direct balcony observed in Figure 20 the main concern through reasoning by residents was the privacy due to multiple function combination settled at 61.6% in after pandemic stage, the values were dramatically higher against those of other reasons as followed by area concern with 29.2% dissatisfaction percentage.
For a clearer way of understanding the combined effect of spatial organization and availability of living balcony the Figure 21 respecting closed organization and No 22 concerned with open organization supports this task.
For closed spatial organization cases responses obtained shows higher dissatisfaction ratios than apartments who had who had who had has balconies linked to living rooms.
Differentiating reasons for either of cases that are without balconies than those who do have balconies are presented in Figure 22 and Figure 23. It is clear that two main reasons for cases without balcony were areas for both storage activities and for human activities, followed by absence of balcony as the third reason.
Meanwhile for cases who do have balconies seen in Figure 21, indicated the privacy as main concern for negative evaluation in cases who do have balconies. Next comes sufficiency of living areas to carry on human functions there.
For opened spatial organization apartments Figure 24 The effect of availability of balcony on decreased dissatisfaction is clear during pandemic and even after but with less magnitude, this evidence is obvious in Figure 17, while damping the increased effect of dissatisfaction during pandemic.
Variations in reasons for both cases of without balconies than those having balconies are seen using Figure 25 and Figure 26. For cases who don’t have balconies in Figure 22, it is clear that there are two main reasons for cases of apartments without balcony named areas for human activities, followed by absence of balcony as the second reason, then forced gathering due to mix with reception.
Cases of apartments with balcony availability for living rooms the mixing of uses of both of living rooms users and guest users almost is dominant or even single effective reason for residents’ dissatisfaction in open spatial organization with specific balcony for living rooms as shown in Figure 26.
As for the relationship of the factors within the three periods, supported by Table 6A,B ,the strongest indicator was the relationship with the balcony, after which came proportion, then privacy, area-cabinet, and finally area-activities, respectively.
As for the relationship of each factor in three periods separately, study notes that the factors that were most influential during the pandemic were those related to the balcony, proportion, and area-cabinet.
Table 6A,B.
Factor analysis for living rooms indicating high factor loadings for reasons considered in research.
Table 6A,B.
Factor analysis for living rooms indicating high factor loadings for reasons considered in research.
 |
3.3.3. Reception
According to the research procedure, Reception means the room that is used only for receiving guests. Separate reception rooms with or without guest dining or separate living rooms with or without guest dining are considered a closed spatial organization.
There were 17 projects without reception and 3 projects with reception. It has been observed that the difference in dissatisfaction between the samples with and without reception was 8.3% before the pandemic, increased to 12.5% during the pandemic because of this. Due to the lack of visitors during this time, the reception area was utilized for study sessions and recreational activities as well as isolation; however, following the pandemic, this disparity decreased to 8.2%.
Figure 27 shows the dissatisfaction regarding the reception activity no strong signs observed before and after pandemic, slight increase during pandemic which is not the product of visitors due to pandemic social distancing.
For detecting dissatisfaction causes reasoned by family heads Figure 28 shows that mixing activity of family living with guest reception is named as the dominant factor of dissatisfaction responses in the three stages meanwhile the second reason was that lack or substandard size of receiving caused the dissatisfaction during pre and post pandemic stages but highly degraded during the pandemic.
The other interesting factor is that availability of some cases of large guest rooms that couldn’t be used during the pandemic is aware of space or might be a chance for meeting that was prohibited to avoid dispersion of the disease. The small number of dwellings having the activity minimized the detailed outputs in current study.
3.3.4. Family Dining
This study uses the term family dining as an activity located within the kitchen zone. If the dining is mixed with the reception or mixed with the living room, it is considered to be guest dining. The general trend of increasing dissatisfaction is observed in Figure 29. No decline in satisfaction is evident after the pandemic meaning the agreement on essentiality with modifications.
Figure 30 ranks first proportion as having a narrow space with the reason of mixing family dining with guest dining dominates the third reason of availability of cabinets.
To investigate the differences of dissatisfaction status between the two main sizes of apartments with the support of Figure 31, results indicate great discrepancy in the dissatisfaction level in 2+1 apartments in comparison with 3+1 apartments in the stage of pre-pandemic. The 3+1 types of dissatisfaction of residents boomed during pandemic for the demand for such activity in a more luxurious condition. figures stayed high in after pandemic period.
Finding out dissatisfaction for main variants of dwelling sizes, it has been observed that half of the sample projects have a single dining area, while the remaining 50% is distributed between two types 15% of apartments have a guest dining area, while 35% have a family dining area. Differences in reasons for dissatisfaction between 2+1 and 3+1 apartments is clearly viewed in Figure 32, privacy achievement defect in 2+1 dominates while in 3+1 apartments proportion obtaining enough space to turn around seats seems to be the main obstacle to minimize dissatisfaction.
Figure 33 Demonstrates interesting findings when used with Figure 24 concerning apartment type or size, higher complaints are noticed in single space of dining activity before the pandemic pointing out real need for such activity. Both supporting each other, the dissatisfaction remained higher for single activity and smaller apartment sizes.
With the pandemic stage numbers are almost equal the gap re-increased after pandemic to fix the status of real need for more than one space. But the number is moderated due to pandemic.
Figure 34 shows the main reasons for both cases of availability of either family dining or guest dining to be the privacy or mixing problem with other activity the family dining has showed higher dissatisfaction in the after-pandemic stage.
The factor analysis results were found to be in line with the previously indicated findings, with privacy being the most significant element, followed by proportion, then area. The area factor was the most significant both during and after the pandemic, whereas the proportion and privacy factors were the most significant after the pandemic.
This shows that future apartment plans will build a family dining room with consideration for area, proportion, and privacy as shown in the following Table 7A,B.
Table 7A,B.
Factor analysis for family dining indicating high factor loadings for reasons considered in research.
Table 7A,B.
Factor analysis for family dining indicating high factor loadings for reasons considered in research.
 |
3.3.5. Master Bedroom
The Master bedroom is the room that is used only for parents sleeping with or without a bathroom. For finding out dissatisfaction for all master bedrooms of categories 2+1 and 3+1 with the support of Figure 35, it is clear that dissatisfaction in 2+1 apartments master bedrooms is higher through all three stages, all numbers show low dissatisfaction ratios in comparison with other habitable spaces, ratios almost doubled for during pandemic period compared to before pandemic.
As 15% of the samples do not contain a bathroom inside the master bedroom in 2+1 category, however dissatisfaction had decreased as noticed in Figure 36 for considering dissatisfaction for only master bedrooms containing bathroom despite 3+1.
Reasoning for the given dissatisfaction is mainly due to limited space or shortage of area to accommodate all requirements with about 53%-55% category 3+1 has higher value followed by proportion with about 23%-34% higher for 2+1 category as a normal trend, privacy came at the last in rank as been presented in Figure 37.
Considering results of effect of bathroom availability in master bedrooms Figure 38, important finding appears of abrupt increase in dissatisfaction in apartments whose master bedroom don’t contain bathrooms leading to single bathroom in total apartment during pandemic evaluated of high dissatisfaction ratio.
‘ Evaluating effects of availability of balcony on master bedroom dissatisfaction referring to Figure 39, two findings can be derived first, the sudden jump between before and during pandemic for both cases, while the second is the logical impression of having balcony in minimizing the results of residents’ feeling of dissatisfaction.
When considering both factors of apartment category and having balcony together Figure 40 concerned with 2+1 category and Figure 41 concerned with 3+1 category, the availability of balcony in category 3+1 had dramatically lowered the dissatisfaction percentage to get zero increase within the three stages.
The effect of having more than only bedroom balcony in apartments had caused dissatisfaction to be not altered due to pandemic occurrence as seen in Figure 42 as indicators of dissatisfaction been constant during the three stages for both 2+1 and 3+1 category of apartments.
Regarding the proportion of master bedroom effect on degree of dissatisfaction it is clear as seen in Figure 43 that there has been no difference in dissatisfaction during the three stages while in rectangle bedroom shapes the level almost tripled.
Figure 44 shows that for square proportion, area deficit is addressed as the main reason for dissatisfaction same for rectangle proportion, followed by narrow proportion but higher value is within rectangle instead of square as was for area reason.
The spatial organization of the apartment plays a clear role on degree of dissatisfaction as percentages recorded higher values in closed organization also the ratio of increase between before pandemic stage and during pandemic is also higher than that for open spatial organization as seen in Figure 45.
Investigating differences in between different categories of apartments the dissatisfaction as percentages recorded higher values in closed organization especially for 2+1 category of closed spatial organization followed by open organization for same category. The 3+1 category showed lower dissatisfaction values with some increase for closed organization same trend of 2+1 category but with less magnitude as seen in Figure 46.
Through factor analysis, we can observe that the relationship was the strongest factor, with proportion, area, and privacy, respectively. Before and after the pandemic, the most principal factor was the relationship with the bathroom seen in Table 7A,B.
Table 7A,B.
Factor analysis for master bedroom indicating high factor loadings.
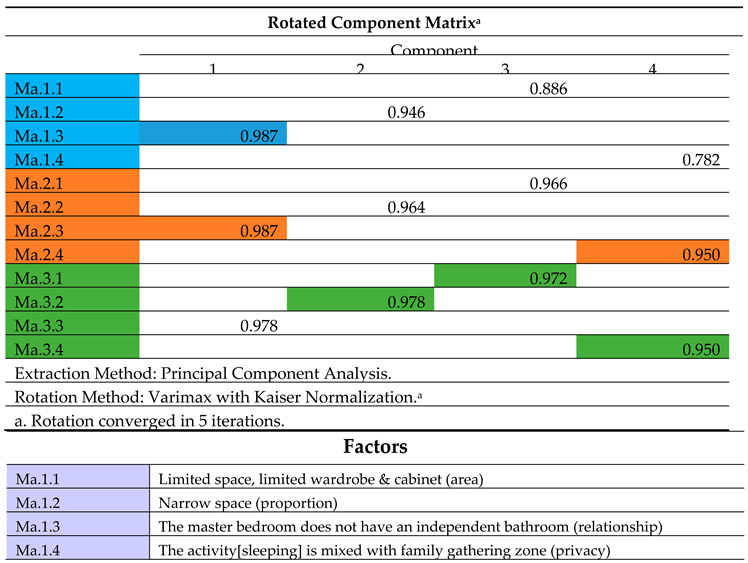 |
After the pandemic, the most important factors were proportion and area; and finally, privacy emerged as the most important factor both during and after the pandemic. We observe that future apartment master bedroom designs must consider proportion, area, and privacy, among other crucial considerations. as illustrated in Table 7A,B.
3.3.6. Children Bedroom
The children’s bedroom is mainly used for sleeping, it can also be used as study-bedroom mainly when the person who lives in this space mostly be a student))
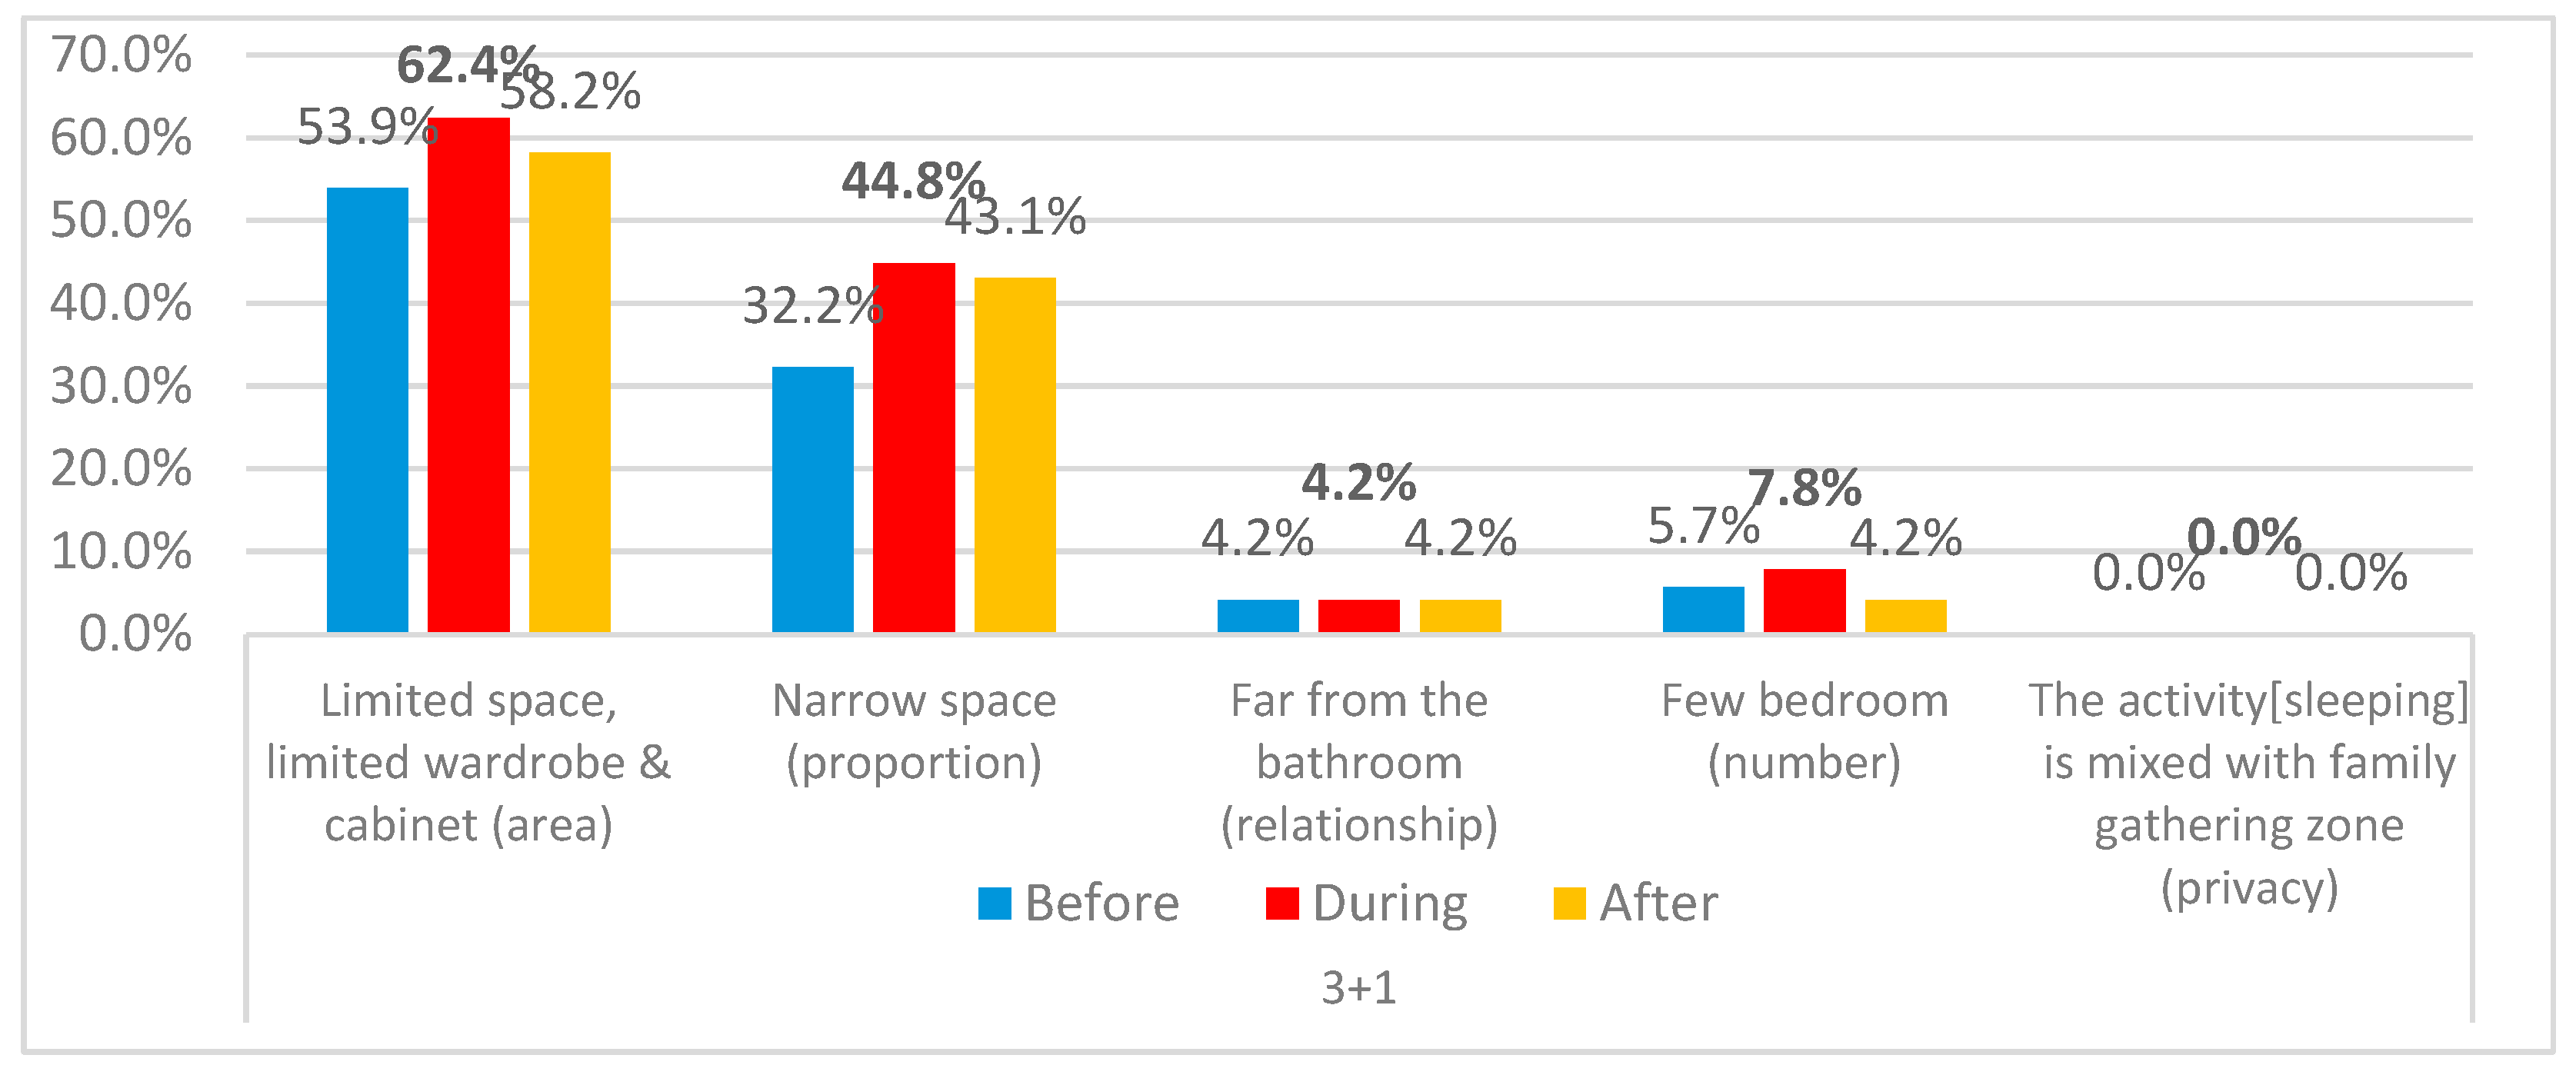
The effect of pandemic on persons using these spaces had increased by about 7.4%. The ratio of increase is less than 25.0 % as seen in Figure 47.
For finding out dissatisfaction trend between different categories Figure 48 indicates residents occupying 3+1 had showed more dissatisfaction than 2+1 cases with rapid increase of about 16.3% the case is opposite for master bedrooms and other living spaces.
To find out the main reasons for such behavior Figure 42 and Figure 43 indicate that in 2+1 category and 3+1 category.
Both categories shared that limited space meaning area concerned deficit forms the highest complain with 44% for the 2+1 and 53.9%-58.2% for 3+1 category which is higher than the first, also the 2+1 didn’t show changes of dissatisfaction during the three stages while 3+1 the change was about 4.3% form pre-pandemic to post- pandemic stage.
The second reason comes the proportion of spaces when extreme narrow spaces participate in increasing dissatisfaction also the same trend of area reasoning trend happened here with fluctuations in 3+1 category against stability in 2+1 apartments category.
Figure 50.
main reasons for dissatisfaction differences for children’s bedrooms for 3+1 category.
The effect of space proportion in forming responses of dissatisfaction shown in Figure 51 indicates that rectangular spaces have been evaluated more negatively by respondents through three stages of pandemic about 2-7-3.0 times higher than square proportions.
The increase form before to during pandemic stages had been increased by 45% for square and 24% of base value for rectangle still rectangle shapes scored higher dissatisfaction levels in after pandemic stage keeping the ratio of about three times. Taking into consideration the balcony availability for such spaces aided by Figure 52, there is clear superiority in bedrooms with balcony during and after pandemic than those without balcony.
Spatial organization differences between open and closed types also participated in forming the dissatisfaction percentages through three stages same as before shown in Figure 53, apartments with open spatial organization layouts had less amounts of dissatisfaction than closed ones, the variations in between increased during and after pandemic.
When comparing apartments categories differences with support of Figure 54 both showed higher increases in closed spatial organizations for 2+1 and 3+1 categories, form the other side of point of view and supporting findings shown in Figure 41 before pandemic dissatisfaction was higher in 2+1 category while in the two stages of during and after pandemic the 3+1 category had a little higher amount of dissatisfaction.
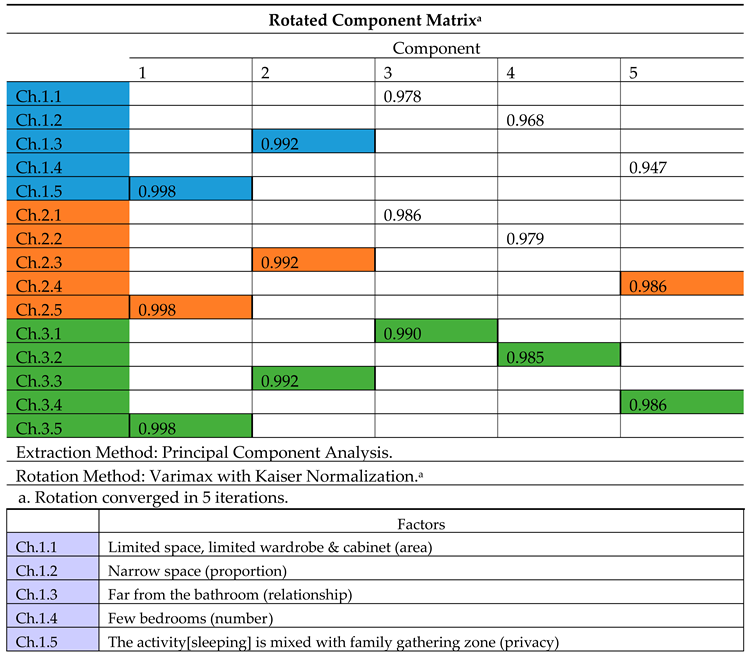
Based on factor analysis, the two Table 8A,B show that privacy was the most influential factor, with the relationship to the bathroom coming in second. Area and proportion came in third and fourth, respectively, and the number of rooms was the least influential factor. The effects of privacy and the proximity to the bathroom were consistent across the three periods, although area and proportion became more significant after the pandemic, and the number of bedrooms remained the most significant both before and after the pandemic. The fact that the five factors had a significant impact after the pandemic suggests that future children’s bedroom designs should take all of these factors into account.
Table 8A,B.
Factor analysis for children bedrooms indicating high factor loadings for reasons considered in research.
Table 8A,B.
Factor analysis for children bedrooms indicating high factor loadings for reasons considered in research.
 |
3.3.7. Kitchen
Kitchen means the room where food preparation takes place, which may or may not have a family dining area. It could be an open system integrated with the living room or a closed system, meaning it’s apart from the living area. In all samples, the percentage of people who were dissatisfied with the kitchen during the pandemic was about 20.7% higher than it was before, stayed almost stable with minor decrease by about 0.6% after the pandemic as seen in Figure 55.
Detecting reasons of that behavior can be concluded with focusing on Figure 56, as it is obvious the main reasons for dissatisfaction is the limited space and the narrow proportion of the space, third reason addressed by residents is the sharing kitchen space by cooking and family gatherings like dining. The other finding is that the change in reasoning within the three stages is not as the same percentage change in dissatisfaction, the fourth and fifth factors were not assessed by users to be so effective in their evaluations despite complain of about 9.2% of respondents about having one door for kitchen.
To check for differences in between two categories of apartments 2+1 and 3+1 results presented in Figure 57 shows higher dissatisfaction in apartments with less bedrooms as was the trend for most of previous discussed spaces, the net increase in dissatisfaction due to pandemic is also higher than 3+1 category, but the ratio of increase in 2+1 apartments is less than 3+1 as numbers scored higher in 2+1 apartments.
Common reasons for both categories are seen in Figure 58 and Figure 59 for 2+1 and 3+1 category are the same three mentioned for combined results despite the mixing obstacle of activities in kitchen is much higher in 2+1 cases than 3+1 ones.
The marginal difference in ascending trend in dissatisfaction from before stage towards after pandemic is that limited spaces showed that trend in 2+1 apartment category but in 3-1 category proportion had that trend. Also 2+1 apartments’ residents’ responses in reasoning due to mixing activities in kitchen space is more than double of 3+1 category.
Variations in dissatisfaction results due to spatial organization is somehow marginal here in kitchens as found in Figure 60, as both indicated increased dissatisfaction in second stage with slight change in stage of after pandemic .
The only difference is that variations in closed organization was 23% while in open organization was about 17% as overall variations is following the general trend observed in Figure 55.
The reasoning of variations in these apartments of different spatial organization is due to five reasons shown in Figure 61 and Figure 62 , in the first one belonging to closed spatial organization dominant reason was the space proportion with percentages around 72%-82 % as higher scoring in dissatisfaction followed by area with numbers around 54%.
While in open spatial organization category cases the main cause was the mixing of cooking and gathering problem with about 64% - 79%. Then comes the area of kitchen limiting space for working with dissatisfaction range between 57.4% and 68.3^%.
The effect of availability against absence of family dining with kitchen main activities on residents’ satisfaction is tested Figure 63 had showed that slight differences had been observed between two cases for stages of during pandemic and post pandemic.
With about 6.6% difference in pre pandemic stage where absence of family dining had participated in that increase, the general trend of dissatisfaction increase is still clear as change is about 15% -21% through the three stages.
Kitchen linked to balconies had less dissatisfaction by respondents living in those apartments especially for pre pandemic period with a significant ratio, the gap been amended in during and after pandemic stages especially in during pandemic where cases of having balconies had showed slightly higher dissatisfactions.
While finding out reasons for those dissatisfaction responses in Figure 64 and Figure 65 cases of without balcony referenced that for area then mixing use of space by ratios approached 70.4% and 65.6% in sequence, while cases of having balcony showed ratios of 77.5% and 51.3% for proportion and area sequentially.
Higher fluctuations been observed analyzing cases of dissatisfaction when combining the effect of spatial organization with availability of balcony, supported by Figure 66.
Before pandemic cases of closed organizations but without balconies had higher dissatisfaction amounts with 14.7% difference. The ratio had been reversed during pandemic with average of 9.9% when cases of with balcony had passed the closed organization without balcony.
While cases of open organization found in Figure 67 shown same trend but with different amounts for stages of pre and during pandemic as closed spatial organization cases, but after pandemic changed in favor of higher dissatisfaction of without balcony apartments after the pandemic the same case of pre-pandemic.
The factor analysis revealed that privacy, space, proportion, relationships, and number had the greatest effects on the three periods. When results compared with separate periods, study discovered that before the pandemic, privacy was the most crucial element, followed by area and proportion, and the link between the kitchen and entrance had the least impact. As can be seen from the Table 9A,B , Except for the factor of relationship with the entrance, which remained the most significant both during and after the pandemic, these five factors were the most influential after the pandemic.
Table 9A,B.
Factor analysis for kitchens indicating high factor loadings for reasons.
 |
3.3.8. Bathrooms
The family bathroom means the separate bathroom, which is not included with bedrooms and is for common use by family members. To investigate the dissatisfaction behavior or trend through three stages of pandemic Figure 68 shows normal trend of increase between pre and during pandemic stages change magnitude is 8.5% then slightly lowered to 39.9% a reduction of only 0.4%.
Adopting Figure 69 for finding out reasons for all stages of dissatisfied residents shows that proportion was the main concern followed by area sufficiency then distance from entrance ratios were ascending in general for all three reasons, proportion showed some higher value during pandemic.
The first two results were above 28% while the third and remaining reasons of shortage of bathrooms and lack of separate toilet fluctuate between 12.5% and 22.5% showing smoothly distributed percentages.
Investigating changes of existence of master bathroom in addition to basic family bathroom with support of Figure 70 it is very clear that dramatic drop in dissatisfaction had been obtained with lowered values of approximately 35% - 44%, this finding can be a bright indicator for the need of two bathrooms.
It is important to note that all apartments of category type 3+1 contain both types of bathrooms, while 2+1 category had cases with family bathroom only and others having the two bathrooms.
In order to differentiate results of reasons for of dissatisfaction in cases of presence of only family bathrooms from those apartments who have master’s bedroom bathroom Figure 71 and Figure 72 can help in that.
The first finding is that 4 reasons of five in family bathroom cases seen in Figure71 had passed the percentage of 55% in dissatisfaction except proportion who showed numbers above 22%.
While for the cases of availability of master bedrooms bathroom added to family bathrooms presented in Figure 72, only two reasons were above 20% and none of them reached 40% while the remaining reasons were almost below 10%, the variation here is clear in number of effective reasons and the strength of effect in terms of percentages.
When comparing dissatisfaction levels for the two main categories of apartments 2+1 and 3+1 with the support of Figure 73 for cases having two bathrooms it is obvious that dissatisfaction had clearly increased in 3+1 cases during pandemic the increase was much less for 2+1 category the dissatisfaction didn’t increase may be to luxurious conditions comparable to other spaces in 2+1 category. No need to differentiate the dissatisfaction for apartment residents of categories 2+1 and 3+1 related to who had only single bathroom as all cases of category 3+1 were of two-bathroom type.
To find detailed differences in reasons between apartments of category 2+1and those of category 3+1 following Figure 74 and Figure 75 support the normal trend of previous findings.
Main reason for dissatisfaction in 2+1 category is proportion with highest value of 50.0 % , while in category 3+1 reasons were distributed within four factors starting from area with 32.1% then proportion, relationship and number of activities at the last by 10.1%
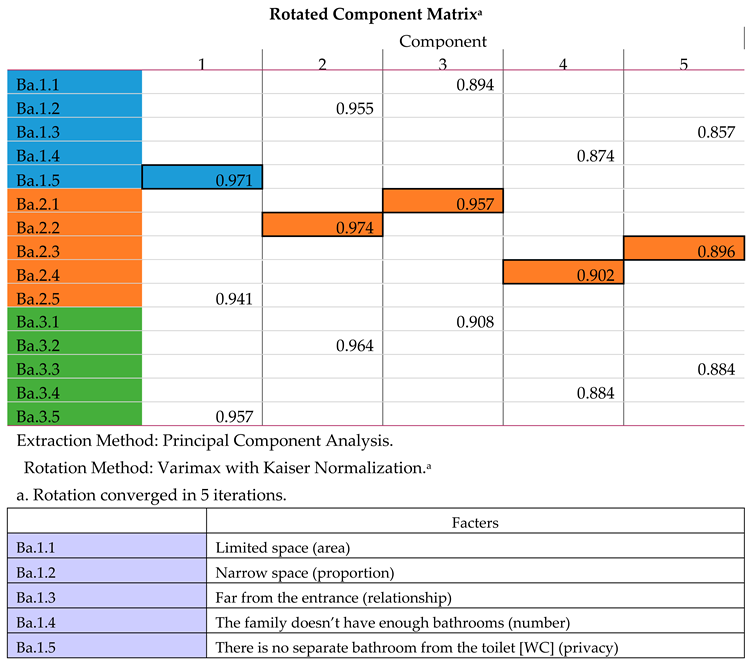
The factor analysis revealed in Table 10A,B that the factors were highly ranked are as follows: privacy, proportion, area, number, and relationship with the entrance were the weakest factors. According to the above tables, before the pandemic, privacy was the most important factor, but during the pandemic, other factors became more important. Nothing had the biggest impact after the pandemic.
Table 10A,B.
Factor analysis for master bathroom indicating high factor loadings for reasons considered in research
Table 10A,B.
Factor analysis for master bathroom indicating high factor loadings for reasons considered in research
 |
3.3.9. Toilets
The toilet means the separate toilet that is not included with the bathroom. Family toilets on the other hand means the separate toilet which is located in the apartment corridor. While Guest toilets mean toilet which is located at the entrance.
One main finding in Figure 76 is the high level of dissatisfaction passing 54% in the stage of pre-pandemic, due to pandemic the percentage increased by 13.3 %.
When making breakdown of cases into two categories adopted in this research with values obtained from Figure 77. It is found that dissatisfaction in apartments of category 2+1 showed more dissatisfaction by their residents in all three stages, the basic score for both categories is high even in stage of before pandemic. Observing the next two stages values are higher by approximately about 13% for both cases following normal trend of current study findings for most spaces.
Relating dissatisfaction about toilet activity focusing on differences of apartments without separate toilet space and those with separate toilet space an important conclusion about very high dissatisfaction in without toilets as values increased from 70.3% before pandemic to 83.9%. a very high scores in comparison with 32.5% to 44,1% for pre and post pandemic stages for apartments having separate toilet Figure 78 clarifies that.
The broad absence of separate toilet in most of apartments of category 2+1 had caused high percentage of dissatisfaction regarding this activity as 75% of residents agreed upon the absence of separate space be superior cause for their negative evaluation. However, in category 3+1 only 12.5% responses were causing absence as the main dissatisfaction reason mainly due to availability of two bathrooms . Figure 79 makes these evidences clear.
Reasoning the dissatisfaction about toilets in apartments who do have separate ones using Figure 80 points out three main reasons all of low to middle score topped by limited space followed by effect of limited number of activities then proportion all ratios are within ranges 11.7% - 23.8% except the fourth reason of relationship to entrance with 5.3%.
Extending details of dissatisfaction regarding toilets for two types, the guest room toilet against the family room toilet aided by Figure 81 the cases of apartments with family toilets had higher percentages of dissatisfaction than those who had guest toilets. Differentiation of reasons of those two cases of family toilet room and guest toilet room is presented in Figure 82 as apartments residents’ evaluation of dissatisfaction who use family toilet had fixed three reasons with amounts within range 22.2% to 37.3%.
While those apartments had guest toilets showed lower percentages and only two significant reasons including single guest toilet used by family members then limited space both reasons scored between 5% up to 25.0% at maximum for shared use.
Factor analysis showed that in Table 11A,B the components were rated differently: the weakest factors were proportion, area, number, and relationship.
Table 11A,B.
Factor analysis for toilets indicating high factor loadings for reasons.
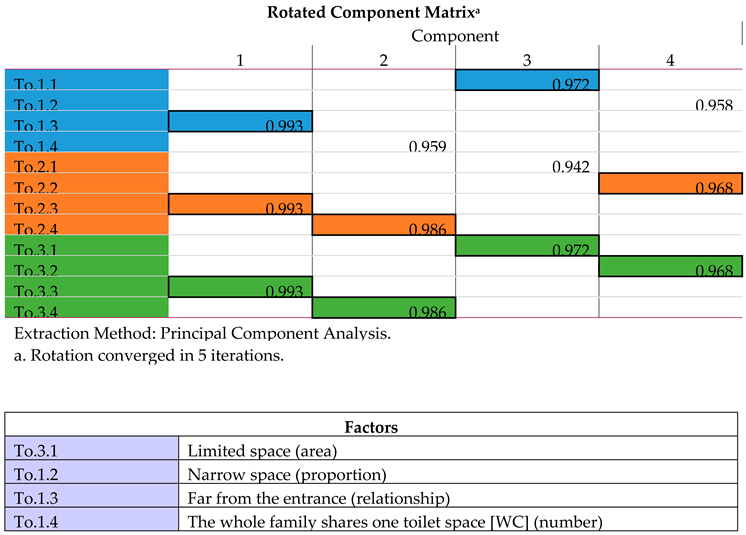 |
The strongest factor during each of the three periods was the relationship with the entrance; the strongest factors during and after the pandemic were the number of toilets and proportion; the strongest factor before and after the pandemic was the area. We see that all after the pandemic factors were significant, and it is best to take them into account when building toilets in new apartments, as indicated by the tables below.
3.3.10. Laundry
The laundry means separate laundry not located in the bathroom and used only for washing clothes. Analyzing residents’ satisfaction starts with overall evaluation of their dissatisfaction as presented in Figure 83. Dissatisfaction levels are so high the pandemic had escalated the percentage to 77.8% despite high dissatisfaction even before pandemic with 67.1%.
Considering availability or absence of specific space within current apartments and their role in dissatisfaction of residents about the activity, Figure 84, clearly shows lowering down the satisfaction level by 31.4% in pre-pandemic stage and 22.5% in post pandemic stage, the base numbers of absence of specific space is extremely high.
To find out differences of residents’ responses who had separate laundry space in their apartments with others who don’t have separate space for activity. Figure 85 indicates that apartment without laundry showed higher dissatisfaction ratios by 11.45 for pre pandemic stage and 8.8% for stages of during and after pandemic supporting previous findings in Figure 82.
Main reason for dissatisfaction of apartments is the complaint from non-existence of separate laundry as 86.7% reported that, while for apartments containing specific laundry are area and proportion with ratios scoring 80.0% for area, then 58.0% for proportion. Further findings about effect of apartment category on residents’ responses is shown in Figure 86 indicating responses for both apartment dwellers who live in 2+1 and 3+1 categories for cases of without specific laundry space it is found that complains in 2+1 category is higher than 3+1 in pre pandemic stage and about 9.1% in post pandemic stage.
Finding differences between 2+1 and 3+1 categories that don’t have specific laundry room presented in Figure 87, main reason for dissatisfaction for 2+1 category is the absence of separate space, while for category 3+1 also the same reason been addressed in addition to area, proportion the last two ones had lower reasoning percentages.
However, apartments containing specific laundry spaces observed in Figure 88, showed lower percentages of dissatisfaction also variations between the two categories within same stage of pandemic are very small, starting with higher dissatisfaction for 2+1 ends with higher dissatisfaction for 3+1 category.
Figure 89 points out reasons for dissatisfaction for apartments having specific laundry room, both categories shared that reasons of area deficiency then space proportion are the highest causes that determine residents’ dissatisfaction. Proportion comes before area in 2+1 category while in 3+1 category area comes before proportion in rank.
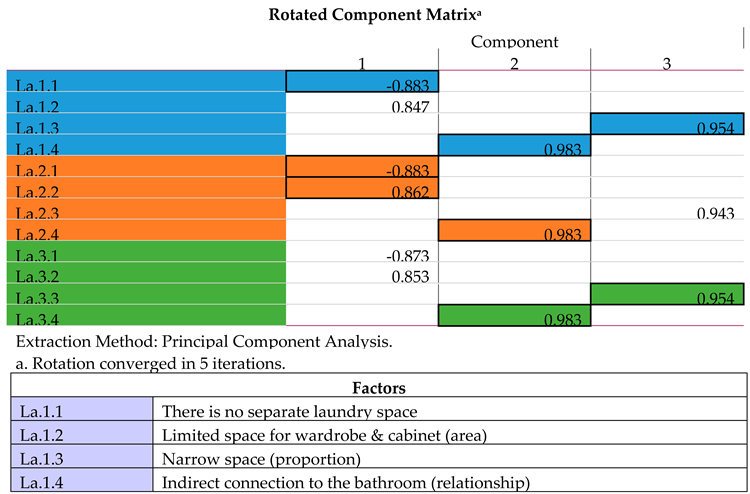
Table 12A,B of the factor analysis indicate that the greatest factor was the existence (absence of separate laundry space), which was followed by area, relationships, and proportion, respectively. According to the tables below, the factors had an identical impact on dissatisfaction over the three periods, area was the strongest factor during pandemic.
The relationship with the bath was the strongest during the three periods, the lack of laundry was the strongest factor before and during the pandemic, and the proportion was the strongest before and after the pandemic.
Here, it is evident that the relationship between laundry and bath and laundry proportion is one of the greatest aspects after the pandemic, and it is best to take this into account when designing laundry rooms in new apartments.
This highlights the value of laundry proportion and its proximity to the bathroom which influences locating the soiled area and simplifying its sterilization.
Table 12A,B.
Factor analysis for laundry indicating high factor loadings for reasons considered in research.
Table 12A,B.
Factor analysis for laundry indicating high factor loadings for reasons considered in research.
 |
3.3.11. Storage
Storage means a separate storage room (not only a cabinet). The storage is not widely spread room in nowadays housing projects despite its being mentioned in standards. To better understand residents’ responses regarding this activity and precisely separately defined space.
Figure 90 shows how high is the residents’ dissatisfaction when all values are above 78.2 % for pre pandemic period increased to extreme value of 92.8% as highest score in spaces in current study in periods of during and after pandemic.
Finding out main reasons for dissatisfaction due to absence of specific space within current apartments affecting dissatisfaction of residents about storage activity, observing Figure 91, clearly shows that majority of dissatisfaction responses had focused on absence of activity as a constant issue fixed by 75% of residents, following that is proportion and area for apartment cases that contain storage.
When analyzing dissatisfaction regarding storage by separation of responses of residents who had storage in their apartments than those who don’t have as indicated in Figure 92. It is clear that 95.6% had claimed dissatisfaction especially during and after pandemic stages. On the other side those who don’t have reported very high dissatisfaction of activity despite having that during the last two stages of pandemic in this study reaching 84.5%.
To investigate results when combining the effect of apartments’ categories to availability of storage space Figure 91 and Figure 92 can clarify the situation. Percentages are very high for cases who don’t contain specific storage space as in Figure 93.
Comparing before percentages of dissatisfaction to cases who already contain a kind of storage space, results in Figure 94 indicates lower numbers however the decline in stages of during and post pandemic is not that much meaning defects in both categories even when space is available.
The difference was significant during pre-pandemic leading to a conclusion of increased importance of this space to be accommodated in apartments.
The whole residents of apartments who don’t have specific storage space have complained about absence of space as seen in Figure 95, meaning no concern about availability of storage activity in form of cabinets or any other type except specific room for activity.
Cases where the space was available in other apartments, both categories 2+1 and 3+1 had nominated area and proportion as main reasons for their residents’ dissatisfaction, still variations between the two categories are very high the differences reached 50% between both categories with highest scores observed within residents of category 2+1 as seen in Figure 96.
The factors that came first in the factor analysis were proportion, the existence of separate storage, and the area; the link between the storage and the entry was the least key component.
The strongest factors during the three periods presented in Table 13A,B were those related to the lack of separate storage space and the storage relationship to the entrance; the area was the strongest during the pandemic, and the proportion factor was the strongest factor both during and after the pandemic.
Those findings demonstrate that the existence of a storage space and how it relates to the entrance and proportion are factors that are best taken into account. When designing the storage spaces for upcoming apartment buildings.
As displayed in the following tables The reason might be that the storage needs to be near the entrance so that materials from outside the apartment can enter and stay inside while keeping the apartment clean, saving them from having to go through the apartment to get to the storage.
Table 13A,B.
Factor analysis for storage space indicating high factor loadings for reasons considered in research.
Table 13A,B.
Factor analysis for storage space indicating high factor loadings for reasons considered in research.
 |
3.3.12. Balcony
The balcony is the area that immediately connects the interior space to the outside environment. one of important balconies in apartments is the living balcony that links the living room with the outside world. So is the kitchen balcony and the bedroom balcony that serves as internal space connection and extension to outside world.
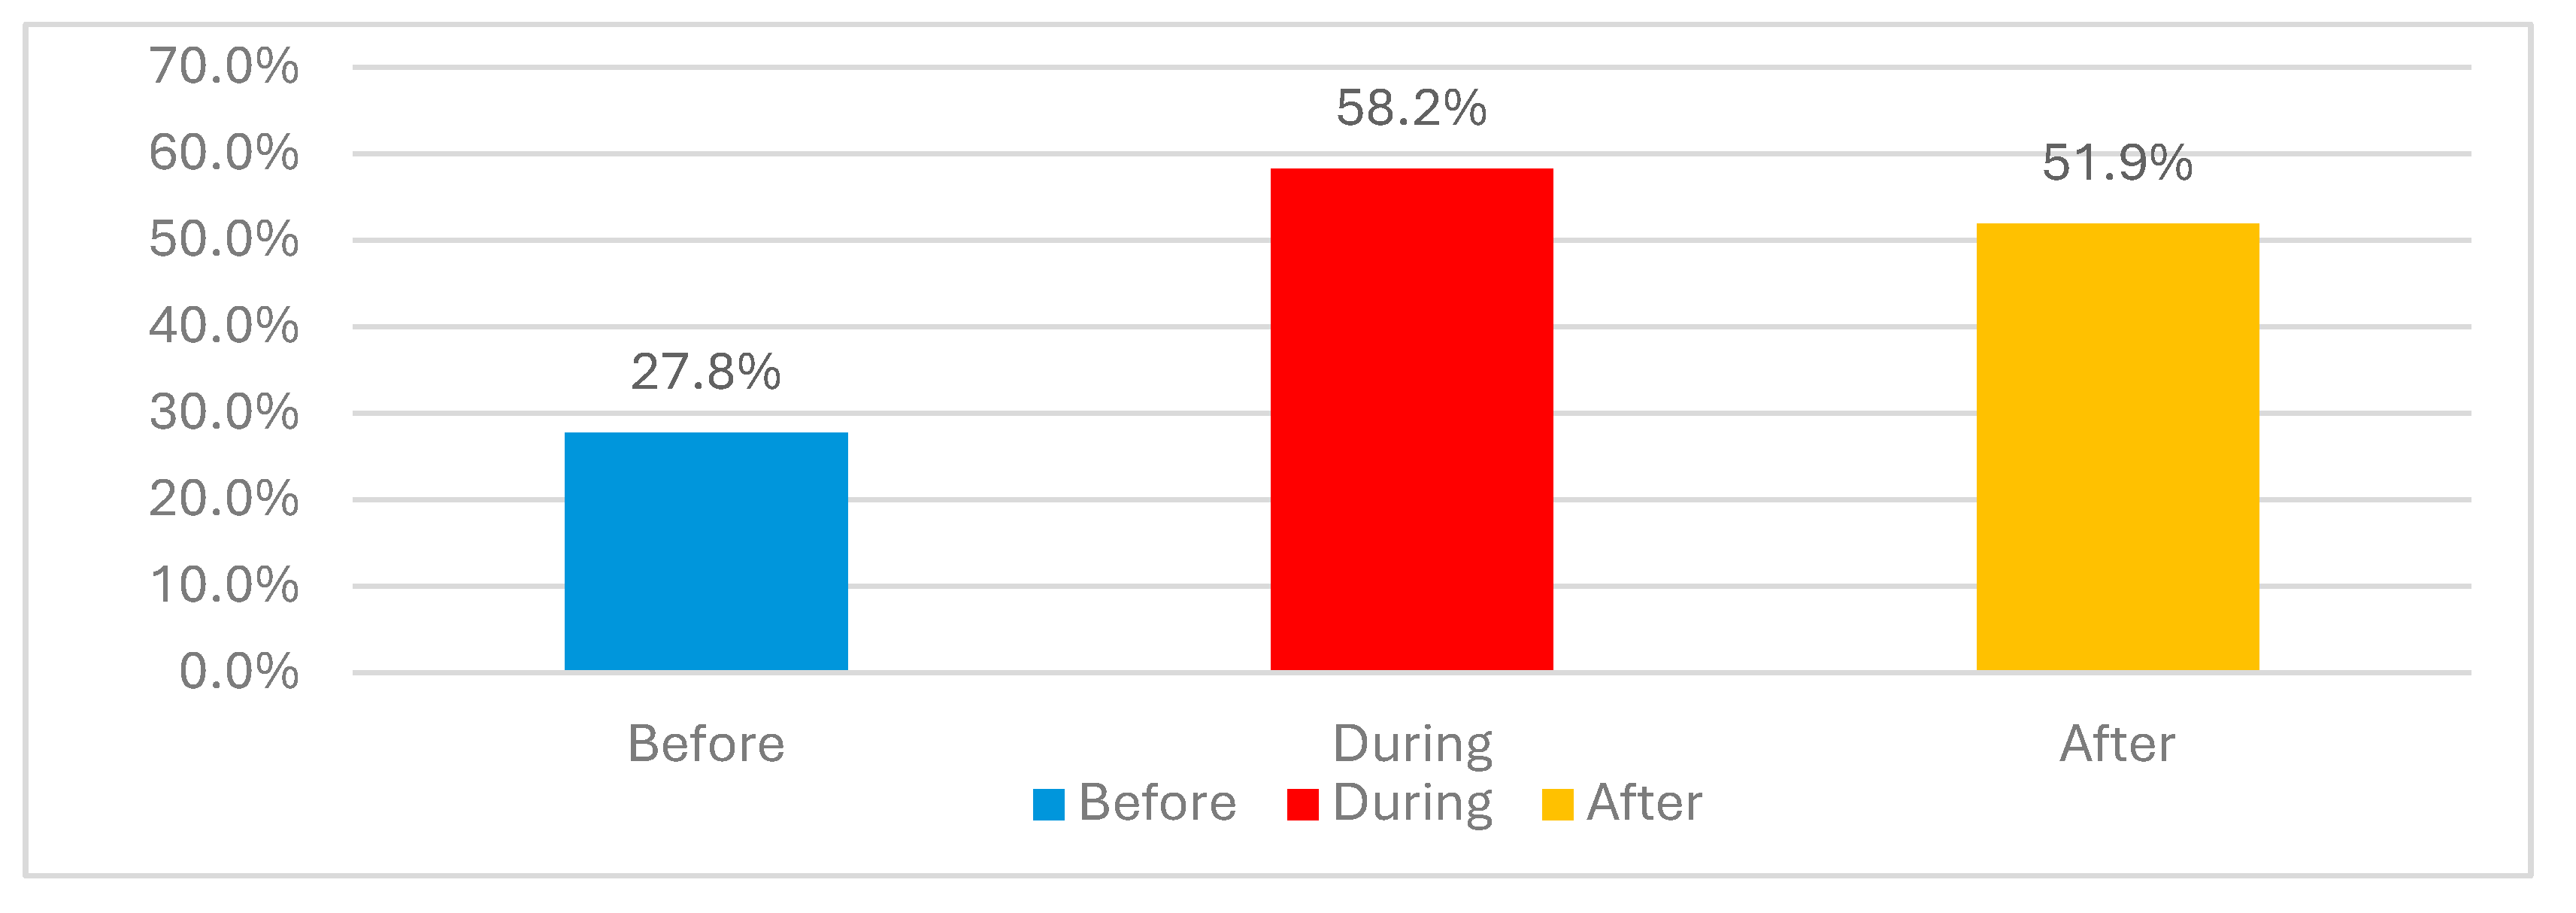
Studying the effect of pandemic on those spaces can be found in Figure 97 the clear shock of sudden increase from 31.8% in pre-pandemic stage to during pandemic with 64.7% is almost more than doubled.
To differentiate responses of residents who are living in apartments having a balcony or more than those who don’t have , Figure 98 shows differences in dissatisfaction. The stage of before pandemic dissatisfaction of residents who didn’t have balconies is about three times those who had balconies, clear increase is registered due to pandemic in both types during and after pandemic.
Finding reasons for residents whose apartments have balconies as presented in Figure 99, had fixed the proportion of balcony to be the first ranked reason for dissatisfaction with increased trend from 41.4% before pandemic to 57.7 % after pandemic, followed by area concern with same trend between 32.3% and 41.2% for post pandemic stage.
A new reason appeared here is the number of separated balconies 27.9 % were dissatisfied due to small number of balconies before pandemic also increased to reach 35.8 % after pandemic. All before indicators points to necessity of availability of more than just one balcony in apartment designs.
Indicators of dissatisfaction differences in between two categories of apartments 2+1 and 3+1 which both have balconies is seen in Figure 100 supports previous findings that 2+1 category residents showed higher dissatisfaction levels than 3+1 category residents during and after pandemic. The thing that differs is that 2+1 didn’t show higher dissatisfaction in pre-pandemic stage as was the case for internal spaces.
For finding reasons for their dissatisfaction despite availability of balconies in categories 2+1 and 3+1 Figure 101 and Figure 102 can explain that. Concerned with category 2+1 apartments ‘residents named the proportion then number of balconies followed by effect of limited space as main reasons for their response most of indicators were moderate with numbers moving between about 28% up to 43%.
For residents of apartments of category 3+1 same three reasons were claimed for dissatisfaction except replacing the second with the third, but numbers were significantly higher than those in 2+1 category moving from about 27% up to more than 75% showing higher sensitivity by those occupants as shown in the following Figure 102.
One of most interesting criteria for residents’ evaluation for their dissatisfaction regarding balconies beyond the case of availability of balcony space is the number of balconies available according to apartments ’designs, Figure 103 indicates decreased dissatisfaction level with the increase of balconies on normal continuous trend form single to double to continuous.
Another interesting indicator for residents needs numbers lowered for same stages by almost half, the stage of pre-pandemic didn’t imply any dissatisfaction sign within apartments having continuous balconies. Another finding is the ratio of increase between pre and during pandemic the ratio is also higher in single balcony apartments.
Considering typology of balconies regarding interior space annex to them Figure 104 presents maximum complaints were through the three stages for kitchen balcony followed by bedroom then living rooms. Almost net score of the increase of dissatisfaction from pre to during pandemic was about 32%.
Reasons of residents’ dissatisfaction for various types of balconies related to spaces confirm the sequence of reasons as noticed in Figure 105, 106 and 107 for living rooms’ balconies, for bedrooms’ and for kitchens’ balconies sequentially.
During the pandemic, the highest rank dissatisfaction was due to shortage in numbers for all cases who had balconies followed by proportion then area of balcony. For type of balcony bedrooms’ balconies got highest dissatisfaction grade followed by kitchens then living rooms in all stages regarding pandemic. The reason for less dissatisfaction with the living rooms’ balconies might be the extra care given in designing those spaces.
Figure 107.
Reasons for dissatisfaction variations regarding bedroom room balconies.
The factors are arranged in strength order, as revealed by the factor analysis in Table 14A,B : the lack of a balcony, the few balconies, the area, the relationship to the kitchen, proportion, and finally the relationship to living as the weakest factor.
Table 14A,B.
Factor analysis for balconies for high factor loadings for reasons in research.
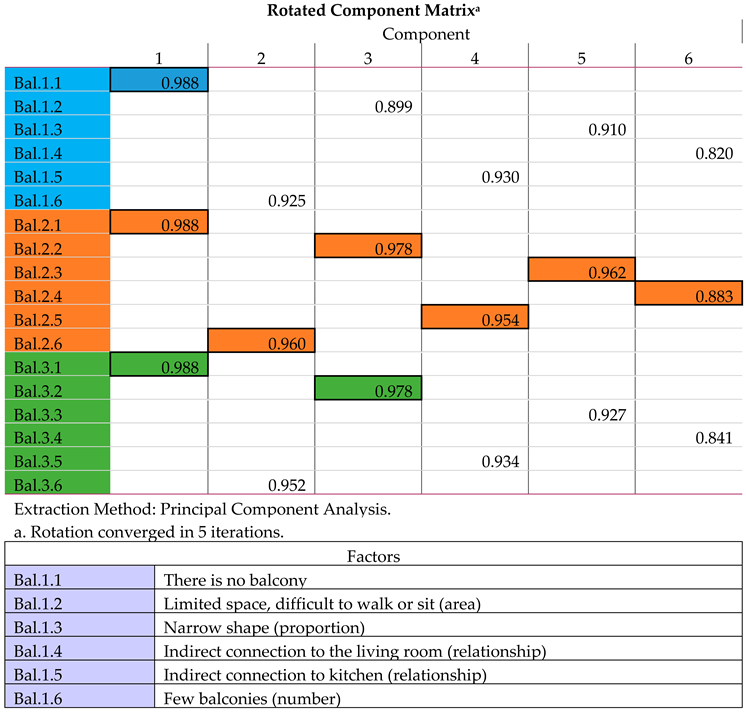 |
It is seen that the absence of a balcony is the greatest influence throughout the three periods, while other factors were most powerful during the pandemic, except for space, which was the most powerful during and after the pandemic.
This shows that the presence of the balcony and the area of the balcony are important factors that must be taken into consideration when designing balconies in future apartments. The balcony’s presence is crucial for apartments as it provides the only means of connecting the interior and exterior. Additionally, residents value the balcony area because small spaces do not allow for the furniture of a table and chairs, as displayed in the following tables.
3.3.13. Apartment Corridor
The apartment corridor means the corridor inside the apartment to be differentiated from in between apartment floor corridor. With support of Figure ,108 The pandemic effect had raised the respondent’s dissatisfaction to more than the double during pandemic, then a slight decrease happened in post pandemic stage.
Figure 108.
Dissatisfaction variations for apartments’ corridors due to pandemic.
Main reason for the dissatisfaction is the narrow space of apartments’ corridors even before the pandemic as more than 50% of residents reported that as shown in Figure 109. The second and third factors are the limited space for needed requirements other than just movement in the corridor precisely are the no capacity for storage and the excessive number of doors that causes confusion in use.
Classifying apartments by the study to the two mentioned categories can generate better understanding and exact conclusions as shown in Figure 110 where apartments residents of category 2+1 had showed higher levels of dissatisfaction, that might be due to limited spaces sizes and lower living conditions. After pandemic results showed an over moderate rate of dissatisfaction questioning the layout and design of apartment corridors.
Checking reasons of dissatisfaction for each of two categories aided by Figure 111, indicates that the proportion of the apartment corridor is the highest effective reason followed by the area for extra needs then disposition of door openings on corridor. Reasons’ percentage of category 2+1 were slightly higher than 3+1 category in pre pandemic stage, altered in post pandemic stage. But even more residents of category 2+1 apartments were dissatisfied but while reasoning residents of 3+1 equalized them.
When analyzing dissatisfaction generation due to type of spatial organization of spaces it seems through observing Figure 112 that in closed organization apartments design, residents had higher levels in pre and post pandemic stages with about 9%.
On contrary of during pandemic when opened organization residents’ dissatisfaction values had exceeded those of closed organization mainly be due pandemic safety requirements and obligations of minimizing contacts.
Causes of different results of dissatisfaction due to different spatial organization is presented in Figure 113, results support findings of Figure 112 as during pandemic opened spatial organization apartment residents showed higher dissatisfaction levels during pandemic while closed ones showed higher levels after pandemic.
The proportion in both organizations dominated other two results especially in closed organization same case of 3+1 category reasons shown in Figure 111 mentioned before. The other interesting finding is the lower value of doors effects on corridor dissatisfaction level in closed organization plan than opened ones might be adaptation other than logic when doors had less impact on movement in corridors with open plan.
Applying factor analysis process to evaluate results observing Tables 15A,B. The area had been appointed to be the greatest component in the factor analysis, followed by the effect of the number of doors in the corridor in second place and proportion in third place.
Comparing the factors throughout the three periods reveals that except for the area, which was the strongest both during and after the pandemic, the three factors were at their highest during the period of the pandemic. This demonstrates how crucial it is to account for the corridor area when designing future apartments. This is because the area is important since vast spaces can be used for storage cabinets.
Table 15A,B.
Factor analysis for apartments corridors indicating high factor loadings for reasons considered in research.
Table 15A,B.
Factor analysis for apartments corridors indicating high factor loadings for reasons considered in research.
 |
3.3.14. Apartment Layout
The apartment layout had been categorized according to literature into the following four types widely available in Erbil City projects;
A) corridor system that arranges rooms in the apartment sequentially on one or both sides of an axis.
B) The circular path, here the floor plan is a circular path that establishes experiential and practical spatial and functional linkages between various rooms, ensuring multiple ways to access every area and room in the residence.
C) The continuous floor design minimizes room boundaries to a small number of carefully placed walls that create distinct zones and make the space dynamic.
D) type is the zoning type which categorizes the common living area (dining, kitchen, living room) and bedroom area (individual rooms, bathroom) differently, ensuring a clear division of functional zones within an apartment.
Finding general satisfaction trend through the three stages of the pandemic is presented in Figure 114 where a sudden increase in residents’ dissatisfaction is observed between pre pandemic and during pandemic stages the value had ben tripled, after pandemic showed slight decrease almost not significant means increased awareness about this important item.
When comparing both categories of apartments 2+1 and 3+1 adding sub-categories of 2+2 and 3+2 with support of Figure 115, again category 2+1 had more dissatisfaction reported by residents than category 3+1.
The new interesting result is concerned with subcategories both of them had extra living space in comparison with original reference that increase had clearly lowered dissatisfaction levels for 2+2 and 3+2 respectively.
To find out spatial organization of spaces effects on form residents’ dissatisfaction Figure 116 shows the great superiority of opened spatial organization in dissatisfaction ratios in stages of during and post pandemic this mainly due to non-welcomed social contact during the pandemic continued fear after the pandemic keeping values very high.
To differentiate spatial organization reasoning the reasons addressed by closed spatial organization apartments are illustrated in Figure 117 the area inflexible to exploit rooms for different activities topped the reasons with 63.4% followed proportion and lack of balconies linking inside with outside spaces all reasons had suffered clear increase during the pandemic, keeping records for post pandemic stage with slight differences.
Reasons of opened spatial organization are more concentrated than those of closed organization the main reason is for number of balconies followed by inability to exploit rooms as shown in Figure 118, the reasons here had the opposite rank compared to reasons of closed organization despite higher magnitude.
Through factor analysis referring to figures 16A and 16B results shows that the existence of a balcony had formed the most important element, area-flexibility was the second-best, area-type, entrance space, and proportion were the third- and fourth-best factors, respectively, while the weakest factor was flexibility.
Comparing the analytical factors for the three periods, the strongest factor before the pandemic was the entrance space while the number and proportion of balconies were the strongest factors during the pandemic; after the pandemic, the biggest factors were the area-flexible, flexible, and area-type.
These findings demonstrate the importance of having rooms for multiple uses, spaces that can be resized to create new ones, and private areas. As a result, these three factors must be considered when designing the layout of the apartment in the future. as demonstrated by the tables below.
Table 16A,B.
Factor analysis for balconies indicating high factor loadings for reasons considered in research.
Table 16A,B.
Factor analysis for balconies indicating high factor loadings for reasons considered in research.
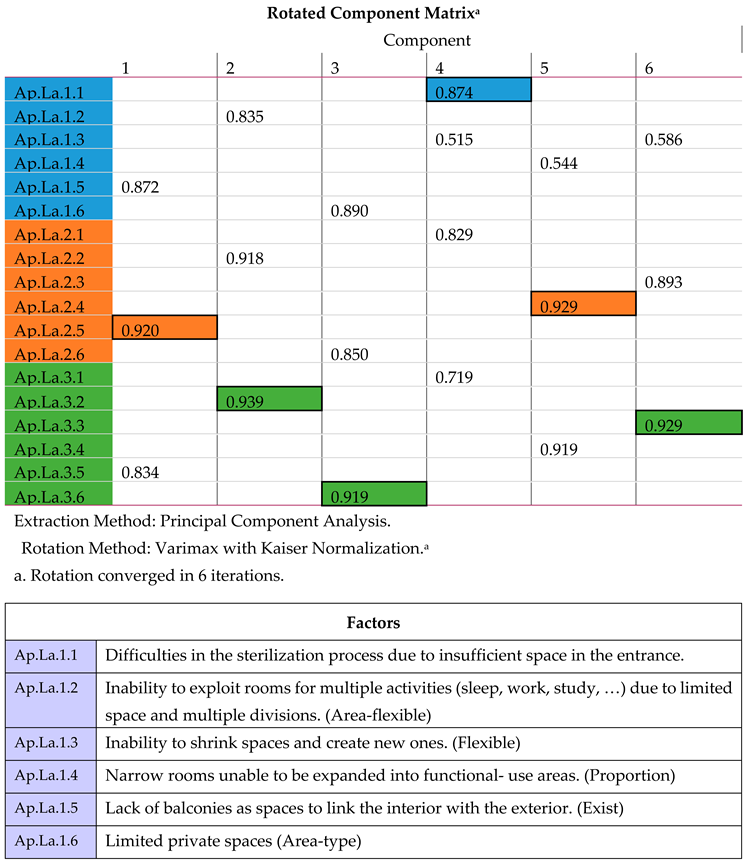 |
4. Discussion
Considering the results, the impact of the COVID-19 pandemic on apartment satisfaction levels in Erbil City revealed significant insights into the importance of interior space quality. The presence of an entrance lobby significantly influenced resident satisfaction during and after the pandemic. Dissatisfaction was markedly higher among those without an entrance lobby, increasing from 32.5% before the pandemic to 75.0% during it, and slightly reducing to 72.5% afterward. In contrast, apartments with entrance lobbies experienced increased a little lesser dissatisfaction rate, from 34.4% before the pandemic to 62.7% during the pandemic. Key reasons for dissatisfaction included the proportion of the lobby, the area, and the connectivity with an entrance toilet. The analysis also highlighted differences between apartment types with smaller units (2+1) showing greater dissatisfaction compared to larger units (3+1), particularly during the pandemic, with dissatisfaction nearly doubling from pre-pandemic levels and then slightly decreasing post-pandemic. Additionally, the availability of a toilet within the lobby significantly impacted dissatisfaction levels, showing a clear increase during the pandemic for apartments without this feature, and a significant impact related to the distance of the toilet from the entrance. The results go in line with those found by Fakhimi [18] and Gür [22] who found out adequate design of entrances and availability of hand washing basins, toilets and dressing rooms close to entrances affects resident satisfaction. These findings underline the critical role of entrance lobbies in enhancing residential satisfaction, especially during health crises, and suggest that both the functionality and design of these spaces are crucial in meeting residents’ expectations and needs.
Living room satisfaction was significantly affected by spatial organization and privacy needs during the COVID-19 pandemic. Dissatisfaction increased notably in living rooms due to limited area and narrow space, especially in closed spatial organizations. This was intensified by the pandemic’s restrictions, which heightened the need for privacy and adequate space. These findings go in line with the findings from Yang et al. [23] who explored satisfaction and residential demand during COVID-19 pandemic and found out that space and area of living rooms are crucial during situations like the pandemic and claims that since activities would more likely be transformed into such as spaces, they have to be designed optimally in relation to space and functions per the residential demands in the long run. Interestingly, dissatisfaction decreased during the pandemic due to a reduced need for gathering but increased again post-pandemic as normal activities resumed. Smaller dwellings (2+1 configurations) experienced higher dissatisfaction levels compared to larger ones (3+1 configurations), suggesting that space limits played a critical role. Furthermore, the availability of a balcony significantly impacted dissatisfaction levels, with an increase from 6.5% pre-pandemic to 21.4% during and after the pandemic. This suggests that balconies became more valued as extensions of living space, providing necessary relief and a connection to the outdoors during lockdowns. The findings are supported by Duarte et al.’s [24] research on home balconies during COVID-19 who found out balconies to be resident’s primary means of connecting with outdoor spaces during COVID-19 restrictions and enable the residents to perform various activities there and it significantly enhance mental and physical well-being. Both closed and open spatial organizations saw different dissatisfaction impacts related to the availability of balconies, with closed systems benefiting more post-pandemic. These findings highlight the need for future living room designs to consider factors such as space proportion, privacy, and the integration of elements like balconies to enhance resident satisfaction, especially in light of potential future lockdowns and restrictions similar to those of COVID-19.
The presence of a dedicated reception room impacted resident satisfaction both during and after the COVID-19 pandemic. Initially, dissatisfaction between dwellings with and without reception rooms increased from 8.3% pre-pandemic to 12.5% during the pandemic. This increase is attributed to the adaptation of reception areas for study, recreational activities, and isolation due to the lack of visitors and social distancing measures. Post-pandemic, this dissatisfaction gap narrowed back to 8.2% as traditional uses of reception rooms resumed. The multifunctional use of the space, rather than visitor frequency, primarily drove dissatisfaction during the pandemic. Residences raised privacy concerns across all the three stages with dissatisfaction rates reach 66.7% which stemmed primarily due the mixing of the family living room and guest reception area. The findings call for better arrangements in designing receptions considering the residential privacy needs.
Family dining spaces which were the main gathering areas for family members before the pandemic experienced a significant dissatisfaction during and after the pandemic 50.3% and 59.4% respectively compared the time before the pandemic which was only 33.6%. findings indicate that residents were primarily dissatisfied with the narrow space of the dining areas and felt difficulty in passing through them when seated and maxing it with guest dining increased dissatisfaction of the residents due to privacy concerns. Dissatisfaction was observed with close values in both 2+1 and 3+1 apartment configurations 50.1% and 54.5% respectively during the pandemic while increasing to 61.7% after the pandemic in small apartments suggesting residents changed needs and reconsideration for more adequate designs considering better spacing and having separate dining spaces for family members and guests. The results go parallels with the findings from other studies [25,26] calling for thoughtful design consideration in designing dining spaces considering residential privacy concerns especially in smaller apartments.
Master bedrooms being the primary resting place of the apartment heads observed significant dissatisfaction with larger apartment categories observing lesser dissatisfaction compared to the smaller ones across all stages. The lack of a private bathrooms in the master bedroom served to be the primary factor behind the high dissatisfaction levels during the pandemic it can be particularly attributed to the fact that the pandemic increased the need for private spaces. Primary factors leading the reduced dissatisfaction levels in the master bedroom was found to be the presence of balconies through which residents were able to get a view of outside and practice several different activities there. Duarte et al. [24] and Yang et al. [23] both support the fact that the presence of balconies and bathrooms within master bedrooms are essential criterions affecting the satisfaction of residents. These findings suggest the critical need for well-designed master bedrooms with adequate space, privacy, and essential amenities like bathrooms and balconies to enhance resident satisfaction, particularly in compact living conditions.
Children bedroom due to their multipurpose uses along being resting place also serving as a study room observed dissatisfaction rates increasing from 29.1% to 36.5%. As the small increase in the dissatisfaction rate shows smaller increase compared to other spaces in which dissatisfaction rates were increased more than 25% and increasing more in smaller apartment configuration compared to larger ones.The main reasons for dissatisfaction were limited space and inadequate room proportions, particularly in 3+1 apartments, where space deficits were cited by 53.9%-58.2% of respondents. Additionally, rectangular room shapes received more negative feedback than square rooms throughout the pandemic, with dissatisfaction rates for rectangular rooms being substantially higher post-pandemic. The presence of a balcony in children’s bedrooms significantly improved satisfaction during and after the pandemic. Open spatial organization resulted in less dissatisfaction compared to closed layouts, and this trend intensified during and after the pandemic, showing a clear preference for more open living arrangements in children’s bedrooms. The findings from other studies [27,28,29] also highlight the critical role of children bedroom and their effects on residential satisfaction as these spaces were not only used for sleeping and resting alone during the pandemic, rather they were used as study and work spaces as well, hence adequate design considering such unexpected conditions like the COVID-19 pandemic shall be come necessary considerations when designing such spaces in the future.
Dissatisfaction with kitchen spaces significantly increased during the pandemic, with a 20.7% rise in dissatisfaction levels, and remained relatively stable afterward with only a minor decrease of 0.6%. This dissatisfaction was primarily due to limited space and narrow proportions of the kitchen, which worsened during the pandemic due to the increased usage of the kitchen for multiple purposes, including family gatherings. The lack of a family dining area within the kitchen also contributed to this dissatisfaction. The study found that smaller apartments (2+1 category) reported higher dissatisfaction compared to larger ones (3+1 category), likely due to more acute space constraints in smaller kitchens. Additionally, the presence of balconies in kitchen areas slightly mitigated dissatisfaction, particularly before the pandemic, but this benefit was less pronounced during and after the pandemic. Other studies highlight that kitchens during the pandemic were merely used for cooking purposes only, rather they were used more of like an office and study rooms [1,29] The findings suggest that improving spatial proportions and providing dedicated areas for dining within the kitchen could enhance resident satisfaction, particularly in smaller apartments.
Dissatisfaction with family bathrooms, used commonly by all family members, showed a typical increase during the pandemic, rising by 8.5% from the pre-pandemic stage, then slightly decreasing post-pandemic. Proportion, area sufficiency, and distance from the entrance were identified as the main reasons for dissatisfaction, with proportion showing the highest increase during the pandemic. The presence of an additional master bathroom significantly reduced dissatisfaction, highlighting the benefits of having more than one bathroom in reducing congestion and enhancing privacy. Apartments with both a family and a master bathroom reported markedly lower dissatisfaction levels, emphasizing the importance of multiple bathrooms in larger dwellings (3+1 categories) compared to those with only one bathroom (2+1 categories). The findings are in parallel with findings from Elrayies [30] and İslamoğlu [1] who found that bathrooms significantly influenced the satisfaction of residents as they were used more than often for the hygiene purposes and apartments having more than one bathroom showed lesser dissatisfaction compared to smaller ones having a single bathroom. This suggests that adequate bathroom designs are crucial for meeting the needs of residents, particularly in larger households or during periods requiring increased isolation, such as a pandemic.
Significant dissatisfaction with toilets was observed, particularly in the pre-pandemic stage, where dissatisfaction exceeded 54%. This dissatisfaction intensified during the pandemic by an additional 13.3%. A deeper analysis revealed that 2+1 apartment categories consistently registered higher dissatisfaction across all stages compared to 3+1 categories, with the disparity growing during the pandemic. The absence of a separate toilet space markedly increased dissatisfaction levels, surging from 70.3% pre-pandemic to 83.9% during the pandemic for apartments lacking separate toilets. In contrast, apartments with separate toilets showed much lower dissatisfaction levels, increasing from 32.5% to 44.1% from pre- to post-pandemic stages. Apartments in the 2+1 category were particularly affected, with 75% of residents citing the lack of a separate toilet space as a primary cause of dissatisfaction, compared to only 12.5% in the 3+1 category, likely due to the latter’s generally higher availability of two bathrooms. Analysis of toilet dissatisfaction reasons for apartments with separate facilities showed that limited space, restricted activity options, and proximity to the entrance were the main concerns, with dissatisfaction percentages ranging modestly from 11.7% to 23.8%, except for the relationship to the entrance which noted only 5.3% dissatisfaction. Similar to the studies concerning bathroom designs Walisinghe [31] reported that main dissatisfaction concern from the residents during COVID-19 was due to the design and size of toilets, similarly İslamoğlu [1] reported that the number of toilets affected the satisfaction of the residents and future apartment designs should consider incorporating more than 1 toilet in the designs. These findings highlight the critical importance of thoughtful toilet placement and adequate space allocation in residential design to enhance residential satisfaction.
Dissatisfaction with laundry spaces significantly escalated during the pandemic, rising from 67.1% pre-pandemic to 77.8% during the pandemic. This high level of dissatisfaction persisted post-pandemic with a slight decrease. The findings from the results indicated that lack of laundry space in apartments significantly affected the satisfaction rate of the residents and those without a separate laundry space observed higher dissatisfaction compared to those with laundry space in their apartments especially smaller apartments which due limited space lacked laundry space in their apartments. While the satisfaction and dissatisfaction rates are close and main reasons behind dissatisfaction stemmed from limited laundry space and improper proportion of the space, future designs should consider dedicating a specific separate space for laundry activities that is both function and accessible to the residents.
Storage spaced which served many needs of the apartments having it observed a significant dissatisfaction from the residents of the apartments. Before the pandemic dissatisfaction rates were lower compared to the time during and after the pandemic. The rates dissatisfaction rate increased to 92.8% during and after the pandemic from 78.2% before the pandemic. Both residents having storage space and those not having the space report high dissatisfaction rates with those lacking it reporting higher dissatisfaction 95.6% compared to those with storage space reporting 84.5%. Reasons that led to the dissatisfaction of residents having storage space in their apartments can be attributed to limited space and proportion of the space primarily. The analysis indicated that dissatisfaction was notably higher in apartments lacking specific storage spaces. Even in apartments with some form of storage, dissatisfaction persisted due to inadequate space and poor proportions and it was observed more in smaller apartments (2+1 category), where space constraints were more acute. The findings of the study are in parallel with findings from other studies [18,19,21,22,23] which highlight the significant role of these space in well-being and comfort of the residents in apartment and residential complexes as the lack sufficient storage area affected the satisfaction level and prevented residents from storing sanitary equipment, exercise equipment, and other appliances. The importance of storage space was underscored, especially during the pandemic, highlighting the need for well-designed storage solutions in future apartment constructions to address these significant dissatisfaction levels effectively.
The presence of balconies in apartments significantly influenced resident satisfaction, particularly during the pandemic. Dissatisfaction escalated sharply from 31.8% pre-pandemic to 64.7% during the pandemic, reflecting the heightened importance of balconies as essential extensions of living space. Residents without balconies experienced dissatisfaction rates three times higher than those with balconies pre-pandemic, which intensified during and after the pandemic. Proportion, area, and the number of balconies were identified as primary dissatisfaction factors. Notably, dissatisfaction concerning balcony proportion and area increased post-pandemic. The findings also highlighted a particular demand for multiple balconies, with dissatisfaction decreasing substantially in apartments with more than one balcony. Balcony-related dissatisfaction varied by apartment type, with 2+1 apartments generally showing higher dissatisfaction levels than 3+1 apartments during the pandemic, though this trend did not extend to the pre-pandemic stage. Other researches while not investing in such detail as the presented study does, Aydin et al. [34] highlights the significant role of balconies during the pandemic and claims that it was recognized as a place for gathering, dancing, playground for children, and eating activities. Peters and Masoudinejad [35] found that apartments with balconies were more proffered by residents and larger balconies especially those facing green areas and natural views were more preferred compared to small and those facing other apartments rather than facing beautiful greeneries and natural views. The analysis highlights the critical need for satisfactory balcony space in apartment design, emphasizing that multiple and well-proportioned balconies can significantly enhance resident satisfaction by offering vital outdoor access and additional living space.
Dissatisfaction with apartment corridors more than doubled during the pandemic, with a slight reduction in the post-pandemic stage. The primary dissatisfaction factors were the narrow space of corridors and inadequate space for other needs beyond movement, such as storage, as well as the confusing layout due to an excessive number of doors. The smaller apartment categories (2+1) due to the small and restricted spaces during the pandemic stage reported higher dissatisfaction compared to larger apartments which significantly affects the proportion of corridor doors and additional space needs. Residents from open and closed designs organizations also reported dissatisfactions with closed designs reporting higher dissatisfactions before the and after the pandemic, and reported lesser dissatisfaction during the pandemic compared to open spatial design due to safety concerns that emerged at that time. The findings highlight the need for future designs to reconsider the design of corridors that serve the functionality and area allocation in unexpected events like the COVID-19 pandemic.
From the results, it was observed that dissatisfaction with the apartment layouts indicated a sharp increase from the pre-pandemic to during-pandemic stages, and it almost rose three time higher compared to the time before the pandemic while it slightly decreased in the post-pandemic stage. Smaller apartments (2+1) showed more dissatisfaction than larger ones (3+1), but additional living space in subcategories (2+2 and 3+2) reduced dissatisfaction levels. Open spatial organizations had higher dissatisfaction during and after the pandemic due to non-welcomed social contact, whereas closed spatial organizations faced inflexibility issues. The presence of balconies was the most significant factor in reducing dissatisfaction, followed by area flexibility, entrance space, and room proportion. Previous studies [5,36] have suggested for the presence of partitions or sliding panel partitions that allow for better individual privacy, wider doorways and corridors to be main the concerns for residential satisfaction during COVID-19. The present researches findings and those from the previous studies call for flexible spaces and adequate apartment layout designs in the future that consider the privacy of individuals.
5. Conclusions
Pandemic had a significant effect on residents housing requirements, most of those effects had permanent affect others had been moderated after pandemic.
The main logical finding is the clear increased contact between residents and their dwellings due to quarantine and social distancing obligations that participated in strengthening the resident-house relationship, leading increased focus despite trends and changes of degree of satisfaction.
Main dissatisfaction trends through the three stages according had showed three paths can be derived in assistance with Table 17 for average percentages pointed out the following conclusions.
There are five spaces, the percentage of dissatisfaction increased during the pandemic, and the percentage were preserved or increased after the pandemic, and this confirms that the pandemic had a clear and stable impact on these spaces [ Living room, Family dining, Children’s bedroom, Laundry, and Storage].
Study found that there are eight spaces [Entrance, Master bedroom, Kitchen, Family bath, Toilet, Apartment corridor, Balcony, and Apartment layout] in which the percentage of dissatisfaction decreased during the pandemic compared to the rate after the pandemic, while maintaining a clear difference in percentage between before and after the pandemic, and this confirms that the effect of the pandemic is still present.
On the other hand, the single space [Reception] where the rate of dissatisfaction before the pandemic was higher than the rate during and after the pandemic, decrease of satisfaction is due to less need for that activity due to quarantine not to alterations in space to minimize dissatisfaction. It is a kind of a shift in residents’ opinions added to non-need for guest reception room.
Out of the 14 spaces and activities tested by this study 9 of them showed dissatisfaction value exceeded 50% of respondents, meaning clear disparity between designs and family needs, results strongly signaled the problem of missing storage and laundry spaces, followed by shortages in requirements belonging to kitchen, separate toilet, balcony, family dining, entrance lobby and apartment corridor with apartment layout configuration.
Less critical cases were agreement in residents’ dissatisfaction been within the range of less than 50% down to 30% are living rooms, bathrooms, children’s bedrooms, reception, followed by master bedrooms.
6. Recommendations
Current study strongly recommends amendments on the way plan layouts are designed and planned, considering importance of specific space requirements ignored during nowadays architects’ engagement in design of apartments and houses. Flexibility issues to be maintained and different layouts that can serve different family structures with a variety of lifestyles to be considered.
Governmental housing institutes need to consider new requirements to guarantee better housing living conditions and be more adaptable to changing requirements due to sudden changes like Pandemics.
Also, it is recommended to expand this study to cover fourth time stage of effect by taking a new reference point of 5-6 years after pandemic to register dissatisfaction levels changes, the issue that was out of reach now by limited time available for current study.
The other important issue is to carry parallel researches on single family housing projects with homogenous typology to comprehend achievements of both typologies, added to current study of multifamily housing projects, to achieve better housing.
Funding
This research received no external funding.
Conflicts of Interest
We, the researchers (Nazik Abdulhamid and Hasan Al-Sanjary), declare that there is no conflict of interest with any official governmental or non-governmental agencies regarding the research submitted to this journal.
Appendix A
Survey questionnaire.
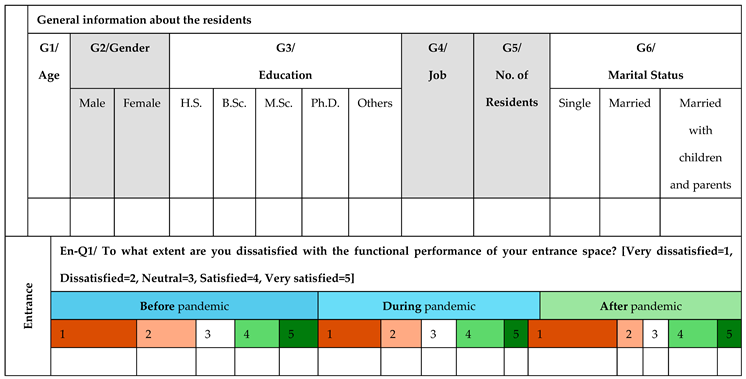
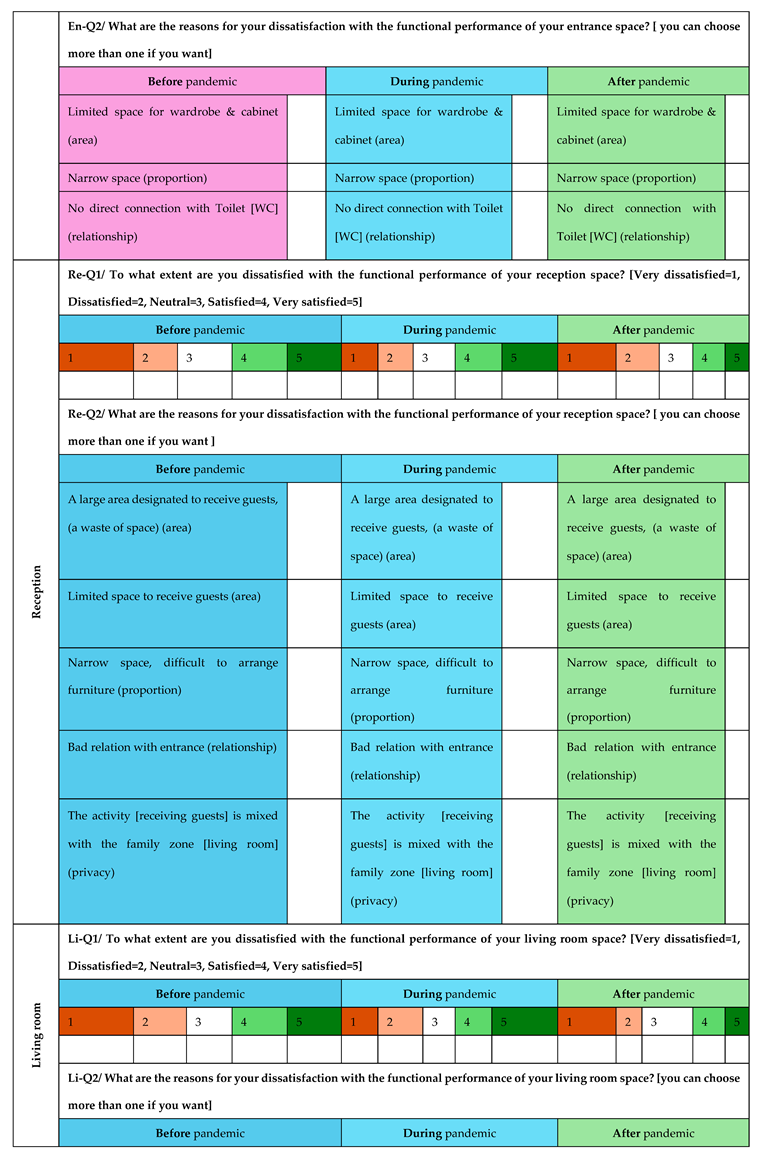
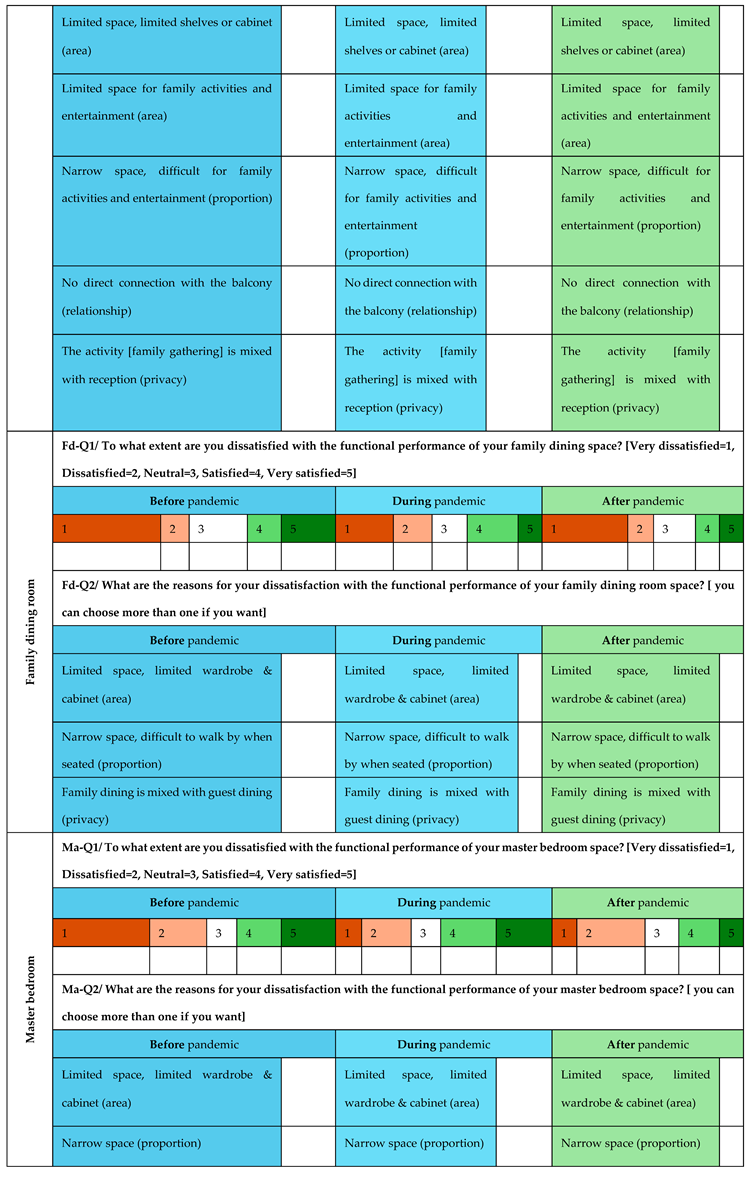
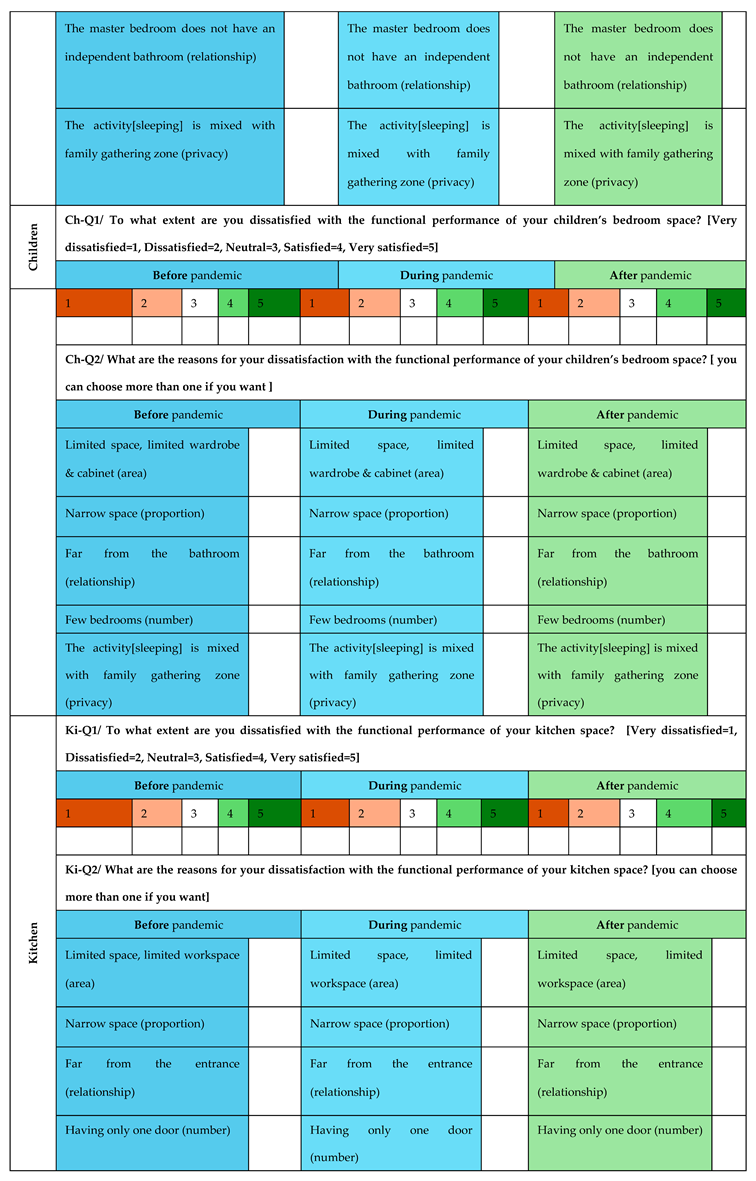
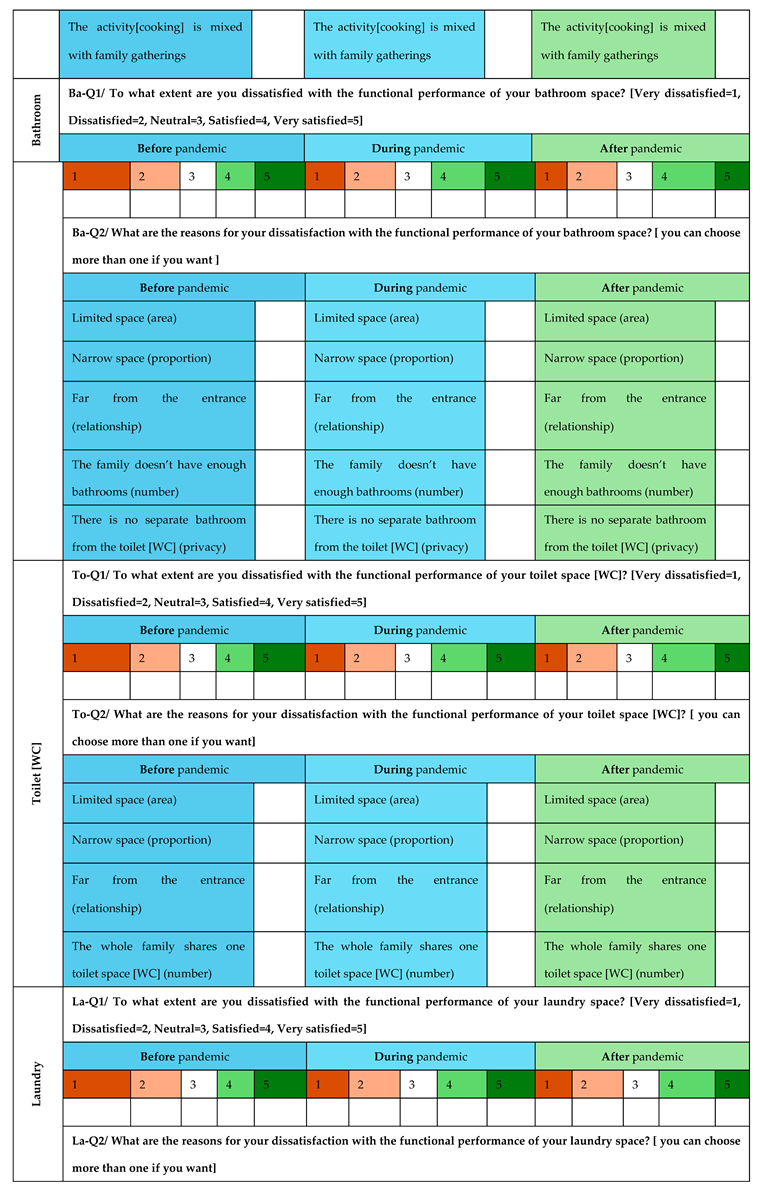
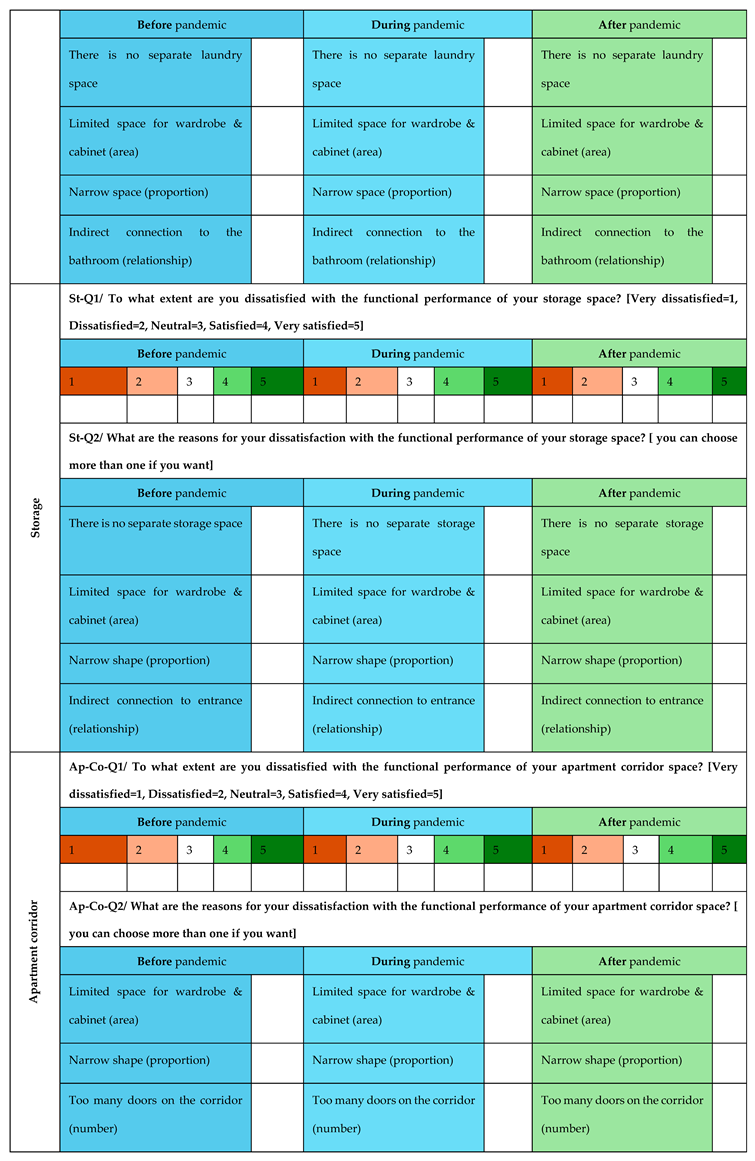
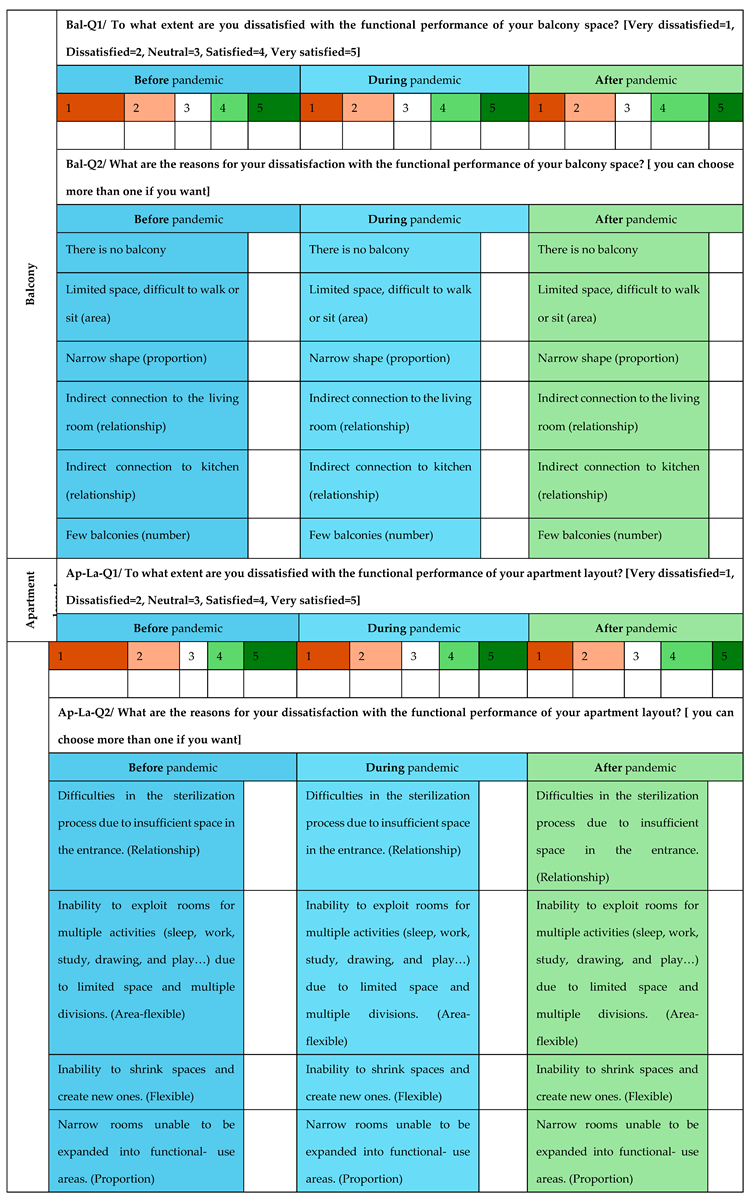

Appendix B
Apartment plans and layouts.
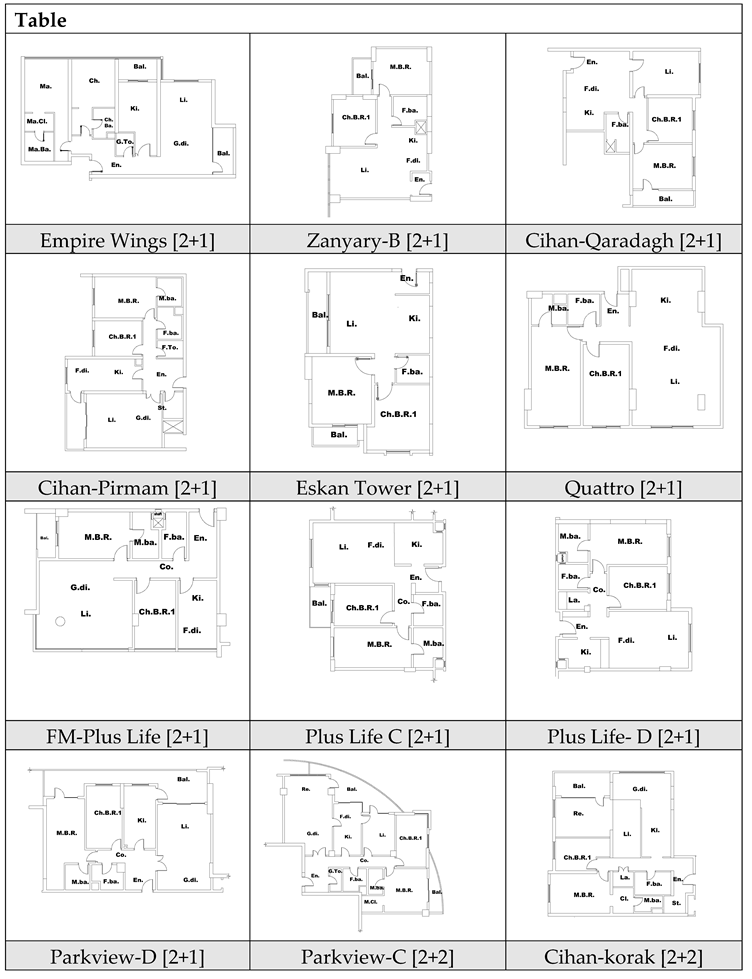
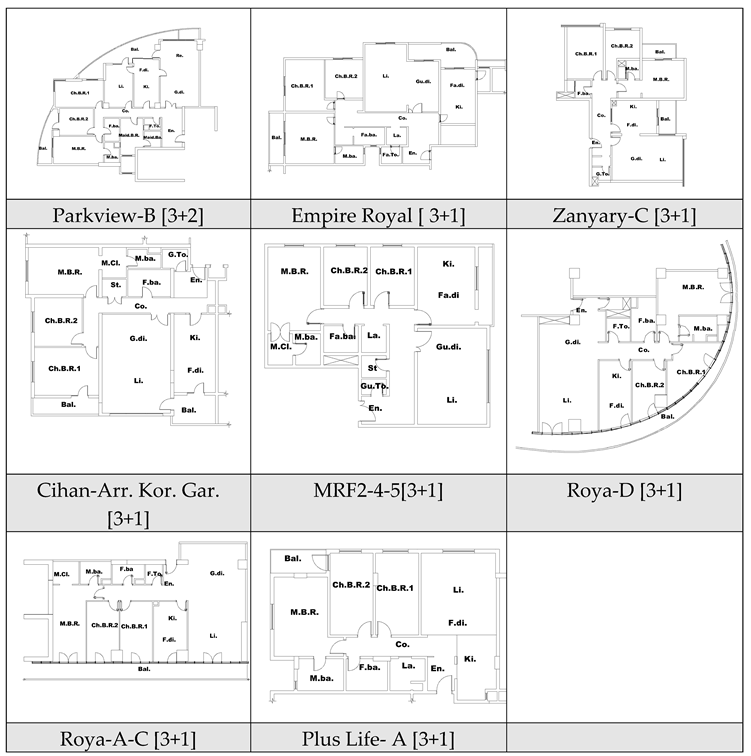
References
- Ö. İslamoğlu, “Determining Female Housing Users Housing Needs and Satisfaction Levels During the Pandemic,” Iconarp International J. of Architecture and Planning, Dec. 2022. [CrossRef]
- G. Ateek, “Future of Sustainable Architecture: Rethinking COVID-19 a Pandemic or turning point?”. [CrossRef]
- S. Abd Elrahman, “The fifth-place metamorphosis: the impact of the outbreak of COVID-19 on typologies of places in post-pandemic Cairo,” Archnet-IJAR: International Journal of Architectural Research, vol. 15, no. 1, pp. 113–130, Mar. 2021. [CrossRef]
- M. Cramer and M. Zaveri, “Working from Home Has Benefits Some Don’t Want to Lose,” The New York Times. Retrieved from www. nytimes. com/2020/05/05/business/pandemic-work-from-home-coronavirus. html, 2020.
- F. Hizra, C. F. Hizra, C. Dewi, and Izziah, “Houses amid COVID-19: Environmental challenges and design adaptation,” in IOP Conference Series: Earth and Environmental Science, IOP Publishing Ltd, Nov. 2021. doi: 10.1088/1755-1315/881/1/012033.
- “The Effect of Housing Conditions on Social Distancing During A Pandemic in Selected Urban Slums in North Central Nigeria,” Civil and Environmental Research, Jul. 2020. [CrossRef]
- S. Šiljeg, I. S. Šiljeg, I. Marić, and B. Cavrić, “Theories of housing quality satisfaction: an overview,” Geoadria, vol. 23, no. 1, pp. 51–84, 2018.
- M. A. Mohit, M. M. A. Mohit, M. Ibrahim, and Y. R. Rashid, “Assessment of residential satisfaction in newly designed public low-cost housing in Kuala Lumpur, Malaysia,” Habitat Int, vol. 34, no. 1, pp. 18–27, 2010.
- B.-C. Liu, “Quality of life: Concept, measure and results,” The American Journal of Economics and Sociology, vol. 34, no. 1, pp. 1–13, 1975.
- Brkanić, “HOUSING QUALITY ASSESSMENT CRITERIA,” Elektronički časopis građevinskog fakulteta Osijek, pp. 37–47, Jul. 2017. [CrossRef]
- N. N. Wimalasena, A. N. N. Wimalasena, A. Chang-Richards, K. I. K. Wang, and K. Dirks, “HOUSING QUALITY INDICATORS: A SYSTEMATIC REVIEW,” in World Construction Symposium, Ceylon Institute of Builders, 2022, pp. 531–544. doi: 10.31705/WCS.2022.43.
- R. M. Hajjar, “EXPLORING A NEW HOUSING DESIGN PARADIGM FOR POST PANDEMIC MULTI-STORY BUILDINGS IN LEBANON,” Architecture and Planning Journal (APJ), vol. 27, no. 1, Mar. 2021. [CrossRef]
- J. Hijazi and D. Attiah, “Saudi residences’ adaptability: How employees worked from home during covid-19 lockdowns,” Civil Engineering and Architecture, vol. 9, no. 3, pp. 915–931, May 2021. [CrossRef]
- Moreira and, H. Moreira and H. Farias, “The Post-COVID Home. How Confinement Altered Domestic Space Use and Living Modes, in Lisbon,” Buildings, vol. 13, no. 5, May 2023. [CrossRef]
- M. Itma and S. Monna, “Responsiveness and Adaptability of Housing Spatial Design to New Emerging Functions: The Case of COVID-19 Pandemic,” International Journal of Sustainable Development and Planning, vol. 17, no. 7, pp. 2173–2181, Nov. 2022. [CrossRef]
- D. H. R. Spennemann, “Designing for COVID-2x: reflecting on future-proofing human habitation for the inevitable next pandemic,” Buildings, vol. 12, no. 7, p. 976, 2022.
- T. Peters and A. Halleran, “How our homes impact our health: using a COVID-19 informed approach to examine urban apartment housing,” Archnet-IJAR: International Journal of Architectural Research, vol. 15, no. 1, pp. 10–27, Mar. 2021. [CrossRef]
- M. M. Fakhimi, “Review of living space design principles and standards during the COVID-19 Pandemic and the Necessity of redefining them in the Post-Covid world.”.
- D. M. Bettaieb and R. Alsabban, “Emerging living styles post-COVID-19: housing flexibility as a fundamental requirement for apartments in Jeddah,” Archnet-IJAR: International Journal of Architectural Research, vol. 15, no. 1, pp. 28–50, Mar. 2021. [CrossRef]
- P. Mercader-Moyano, O. P. Mercader-Moyano, O. Morat-Pérez, and C. Muñoz-González, “Housing evaluation methodology in a situation of social poverty to guarantee sustainable cities: The satisfaction dimension for the case of mexico,” Sustainability, vol. 13, no. 20, p. 11199, 2021.
- E. Natividade-Jesus, J. E. Natividade-Jesus, J. Coutinho-Rodrigues, and C. H. Antunes, “A multicriteria decision support system for housing evaluation,” Decis Support Syst, vol. 43, no. 3, pp. 779–790, 2007.
- M. Gür, “Post-pandemic lifestyle changes and their interaction with resident behavior in housing and neighborhoods: Bursa, Turkey,” Journal of Housing and the Built Environment, vol. 37, no. 2, pp. 823–862, 2022.
- J. Yang, J. J. Yang, J. Xu, T. Hu, and J. Cao, “Satisfaction and Demands of Indoor Space in the High-Density Residential Areas in the COVID-19 Era,” Buildings, vol. 12, no. 5, May 2022. [CrossRef]
- C. C. Duarte, N. D. C. C. Duarte, N. D. Cortiços, A. Stefańska, and A. Stefańska, “Home Balconies during the COVID-19 Pandemic: Future Architect’s Preferences in Lisbon and Warsaw,” Applied Sciences (Switzerland), vol. 13, no. 1, Jan. 2023. [CrossRef]
- M. Mridha, “Looking through the Models: A Critical Review of Residential Satisfaction,” Buildings, vol. 13, no. 5, p. 1183, 2023.
- J. Baker and H. Oppewal, “The effects of floor plan representations on preferences for apartments,” Journal of Housing and the Built Environment, vol. 38, no. 2, pp. 727–752, 2023.
- J. Honey-Rosés and O. Zapata, “The impact of residential densification on perceptions of public space: A field experiment,” Journal of the American Planning Association, vol. 87, no. 2, pp. 282–295, 2021.
- M. Jaimes Torres, M. M. Jaimes Torres, M. Aguilera Portillo, T. Cuerdo-Vilches, I. Oteiza, and M. Á. Navas-Mart\’\in, “Habitability, resilience, and satisfaction in Mexican homes to COVID-19 pandemic,” Int J Environ Res Public Health, vol. 18, no. 13, p. 6993, 2021.
- S. Kim and H.-S. Kim, “A Study on the Effect of Medical Service Quality on Customer Satisfaction during COVID-19 for Foreigners in Korea,” Sustainability, vol. 15, no. 7, p. 5953, 2023.
- G. M. Elrayies, “Prophylactic architecture: formulating the concept of pandemic-resilient homes,” Buildings, vol. 12, no. 7, p. 927, 2022.
- K. W. A. R. Walisinghe and N. C. Wickramaarachchi, “2021 June Sri Lankan Journal of Real Estate Department of Estate Management and Valuation University of.”.
- X. Gao et al., “Neighbourhood satisfaction in rural resettlement residential communities: The case of Suqian, China,” Hous Stud, vol. 37, no. 8, pp. 1497–1518, 2022.
- Hooper, J. Hooper, J. Lee, and C. Schweiker, “Family Child Care Program Closure in Alabama During the COVID-19 Pandemic,” AERA Open, vol. 9, p. 23328584231213084, 2023.
- D. Aydin and G. Sayar, “Questioning the use of the balcony in apartments during the COVID-19 pandemic process,” Archnet-IJAR: International Journal of Architectural Research, vol. 15, no. 1, pp. 51–63, 2021.
- T. Peters and S. Masoudinejad, “Balconies as adaptable spaces in apartment housing,” Buildings & Cities, vol. 3, no. 1, 2022.
- Kleeman and, S. Kleeman and S. Foster, “‘It feels smaller now’: The impact of the COVID-19 lockdown on apartment residents and their living environment–A longitudinal study,” J Environ Psychol, vol. 89, p. 102056, 2023.
Figure 1.
Distribution of investment projects according to construction status- 2021.
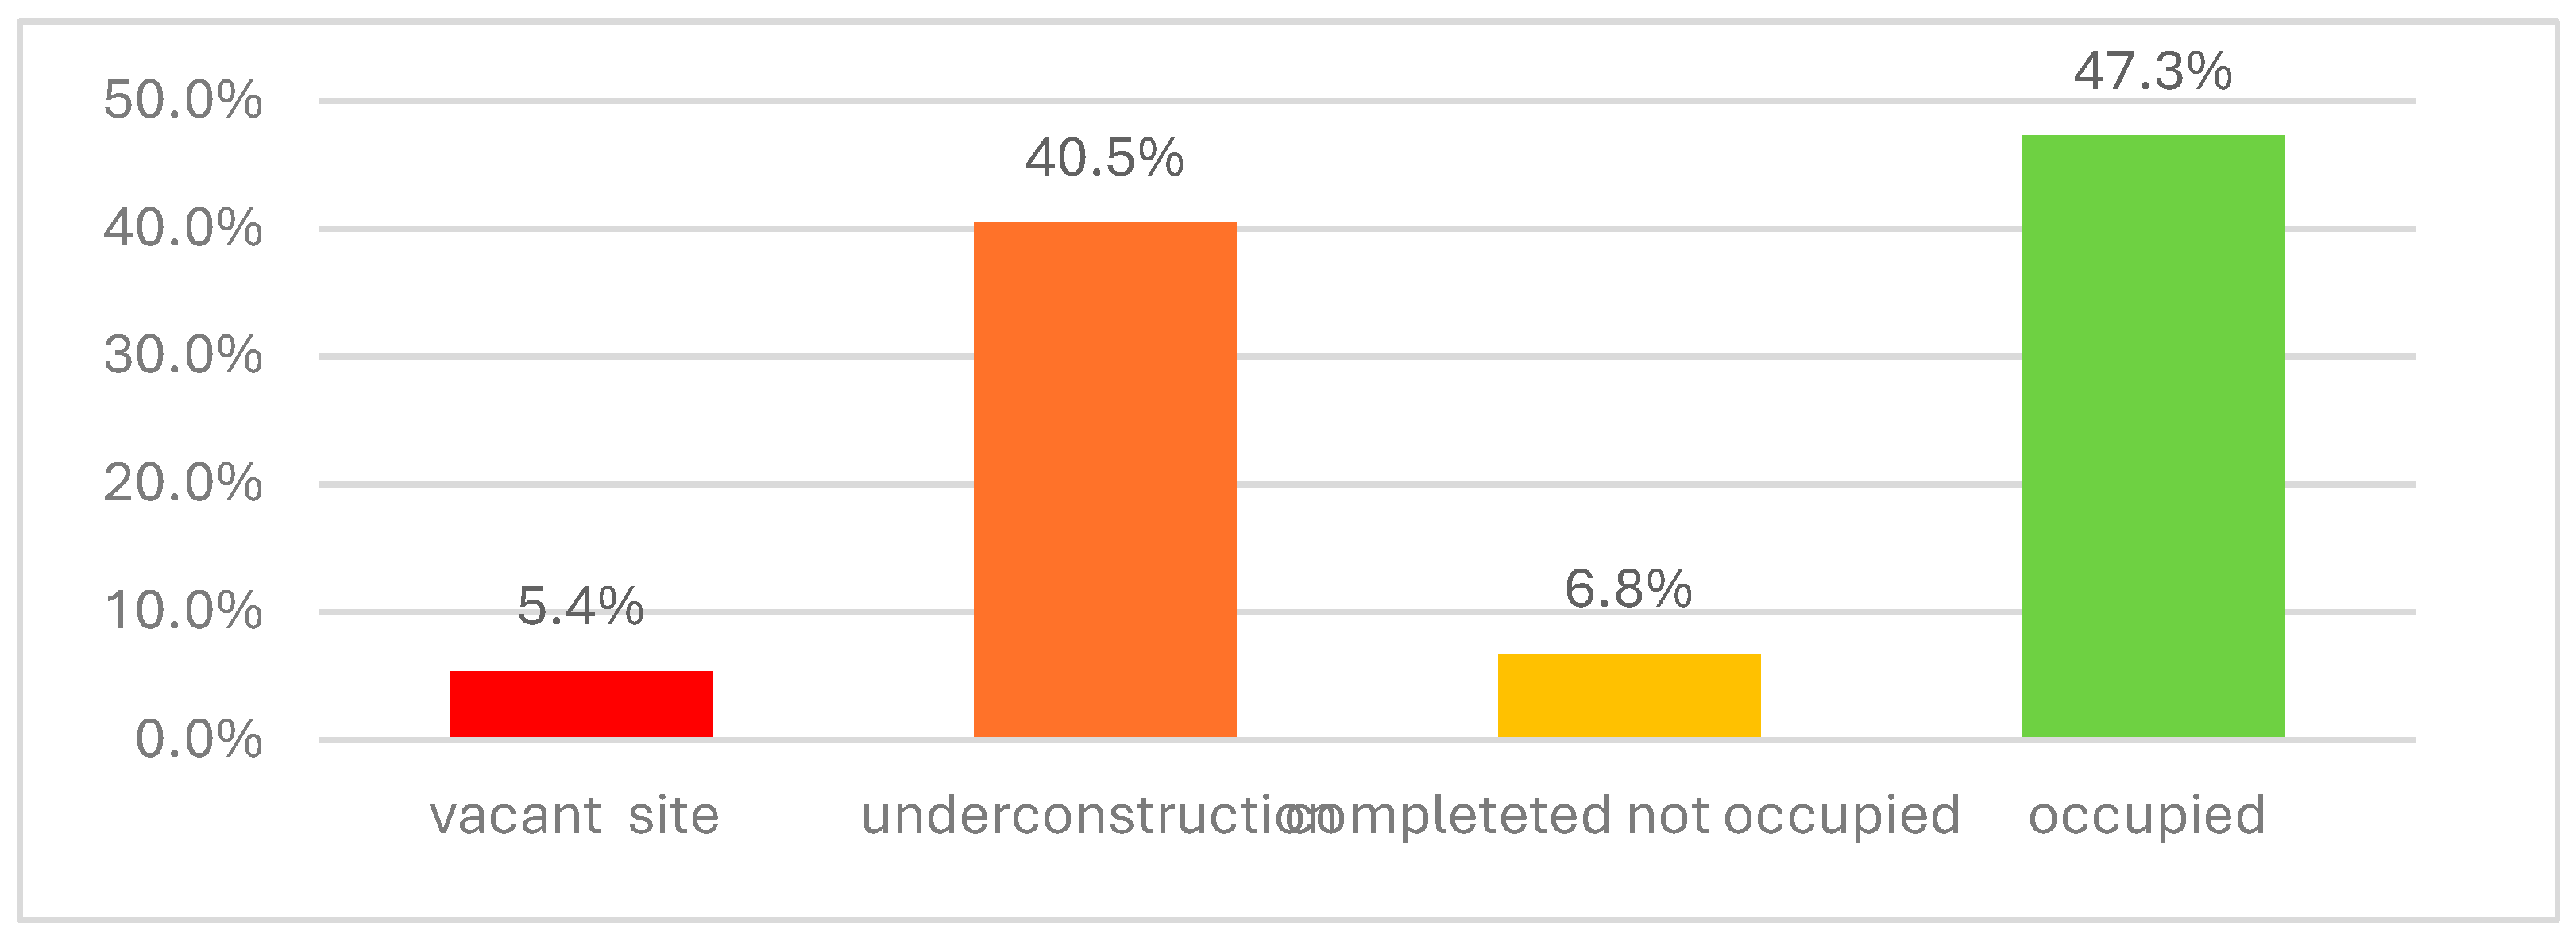
Figure 2.
Distribution of selected projects for study within occupied projects - 2021.
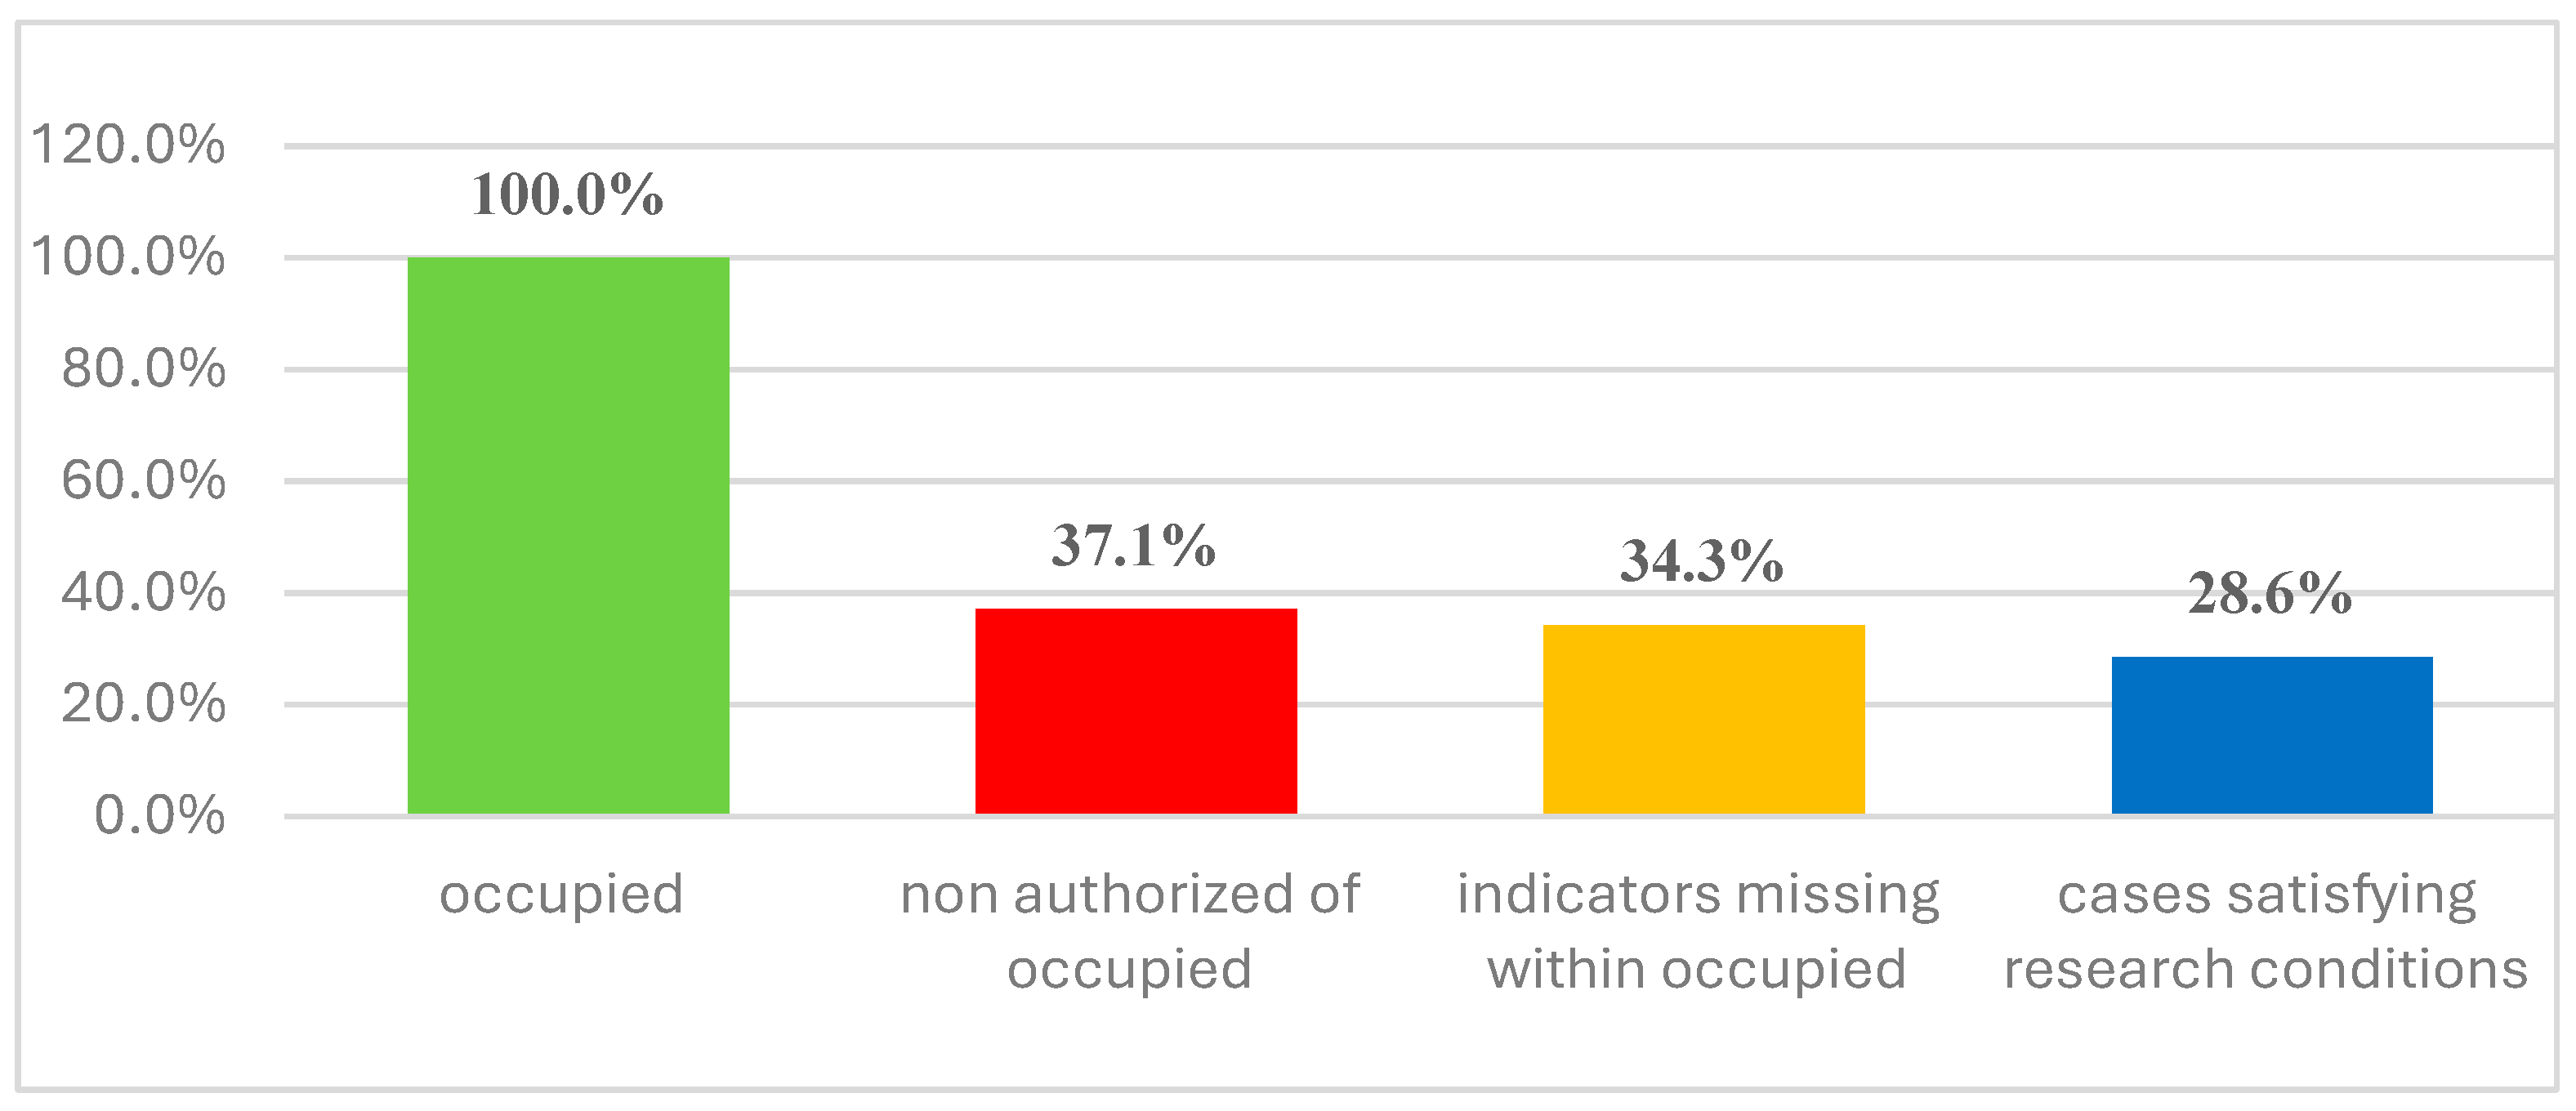
Figure 3.
Change in dissatisfaction percentage of entrance lobby during three stages.
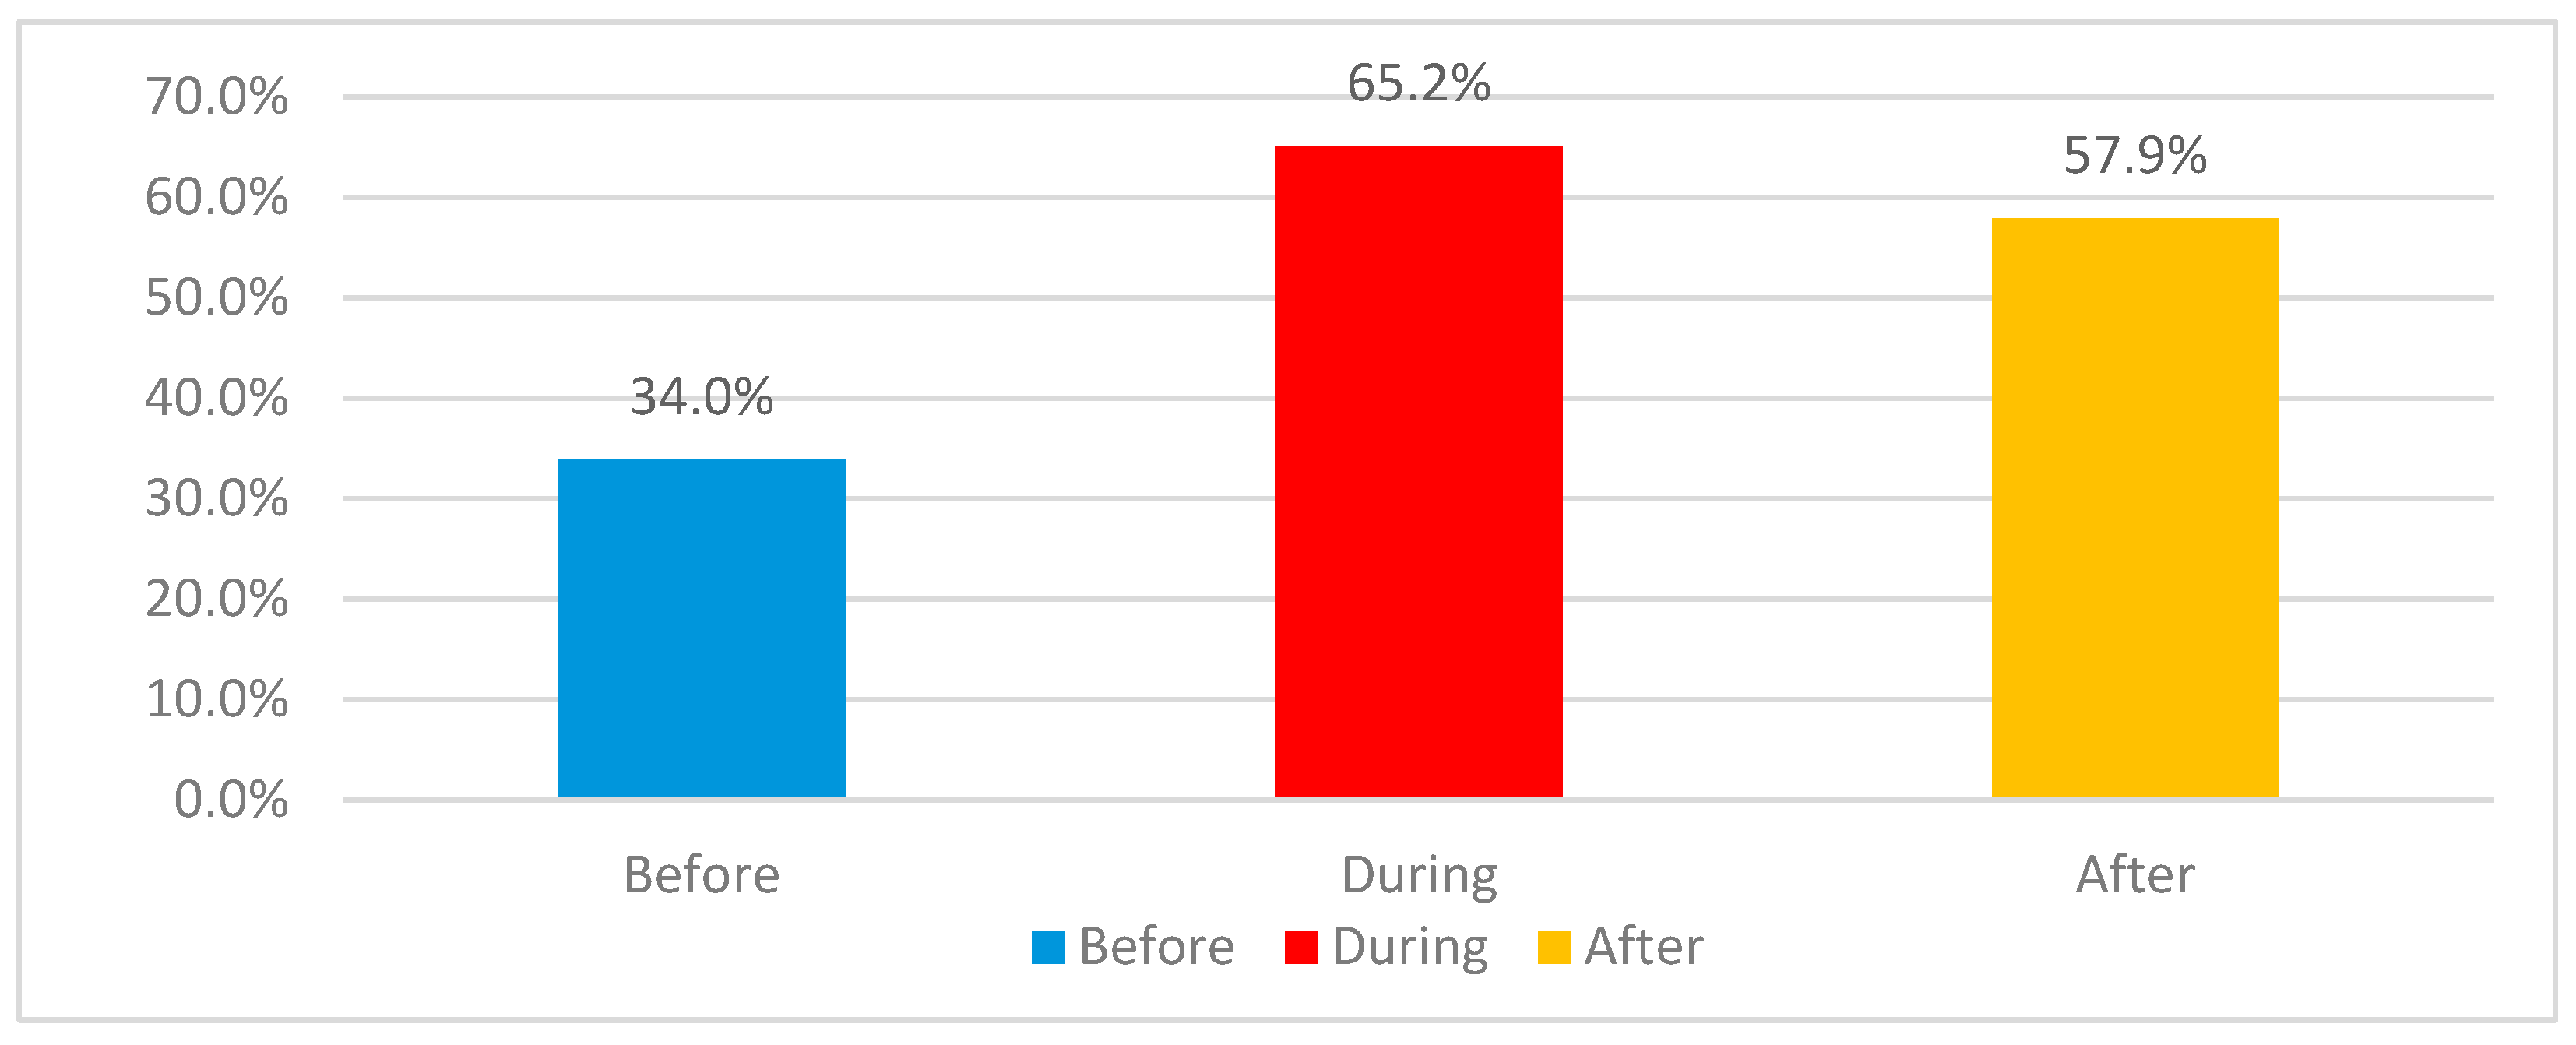
Figure 4.
Change in dissatisfaction percentage due to Entrance lobby availability .

Figure 5.
Reasons for variations in dissatisfaction percentage regarding entrance lobby.
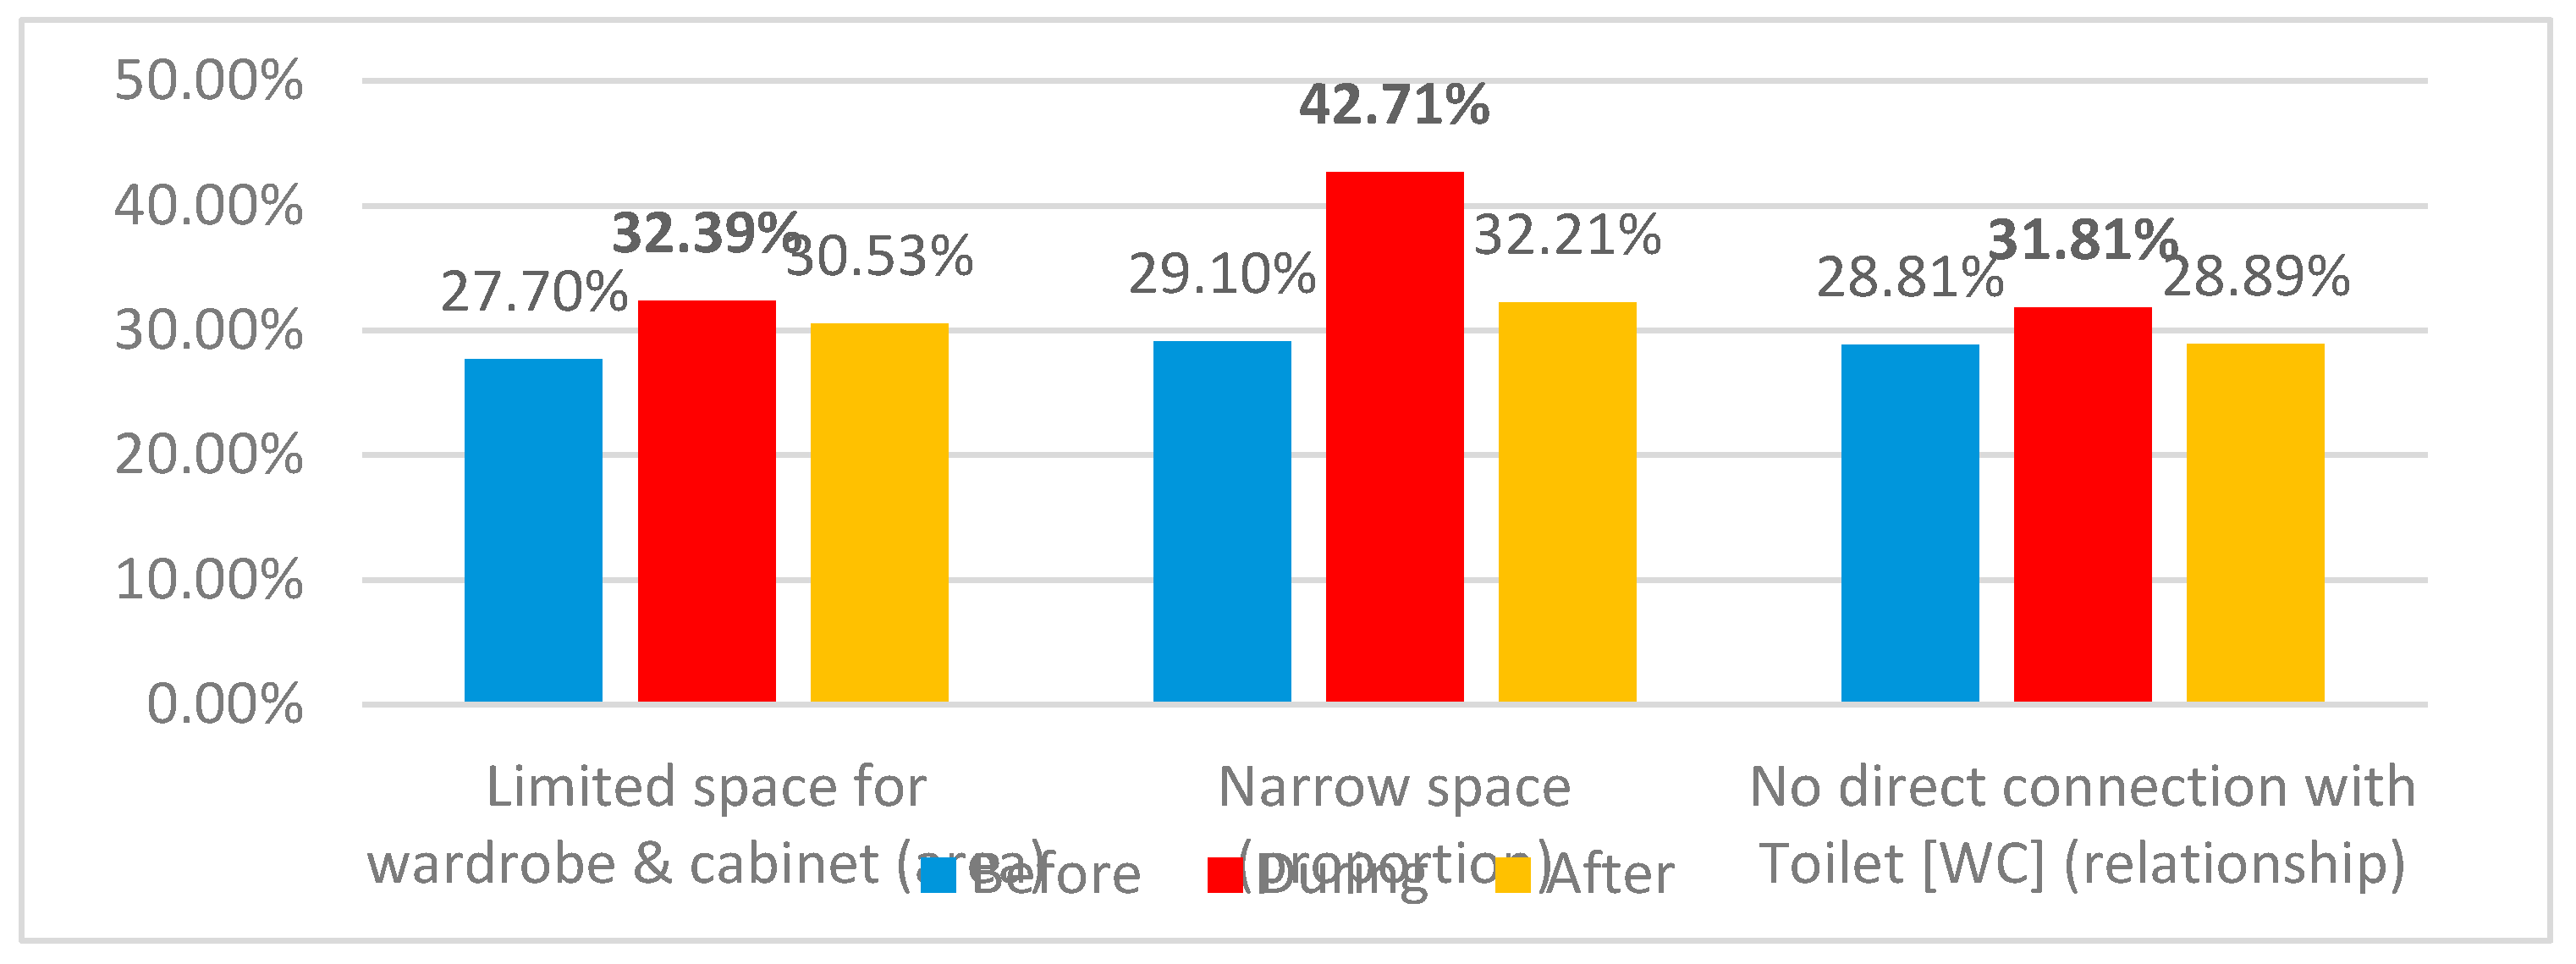
Figure 6.
Variations in dissatisfaction percentage for Entrance lobby availability between 2+1 and 3+1 apartment categories.
Figure 6.
Variations in dissatisfaction percentage for Entrance lobby availability between 2+1 and 3+1 apartment categories.
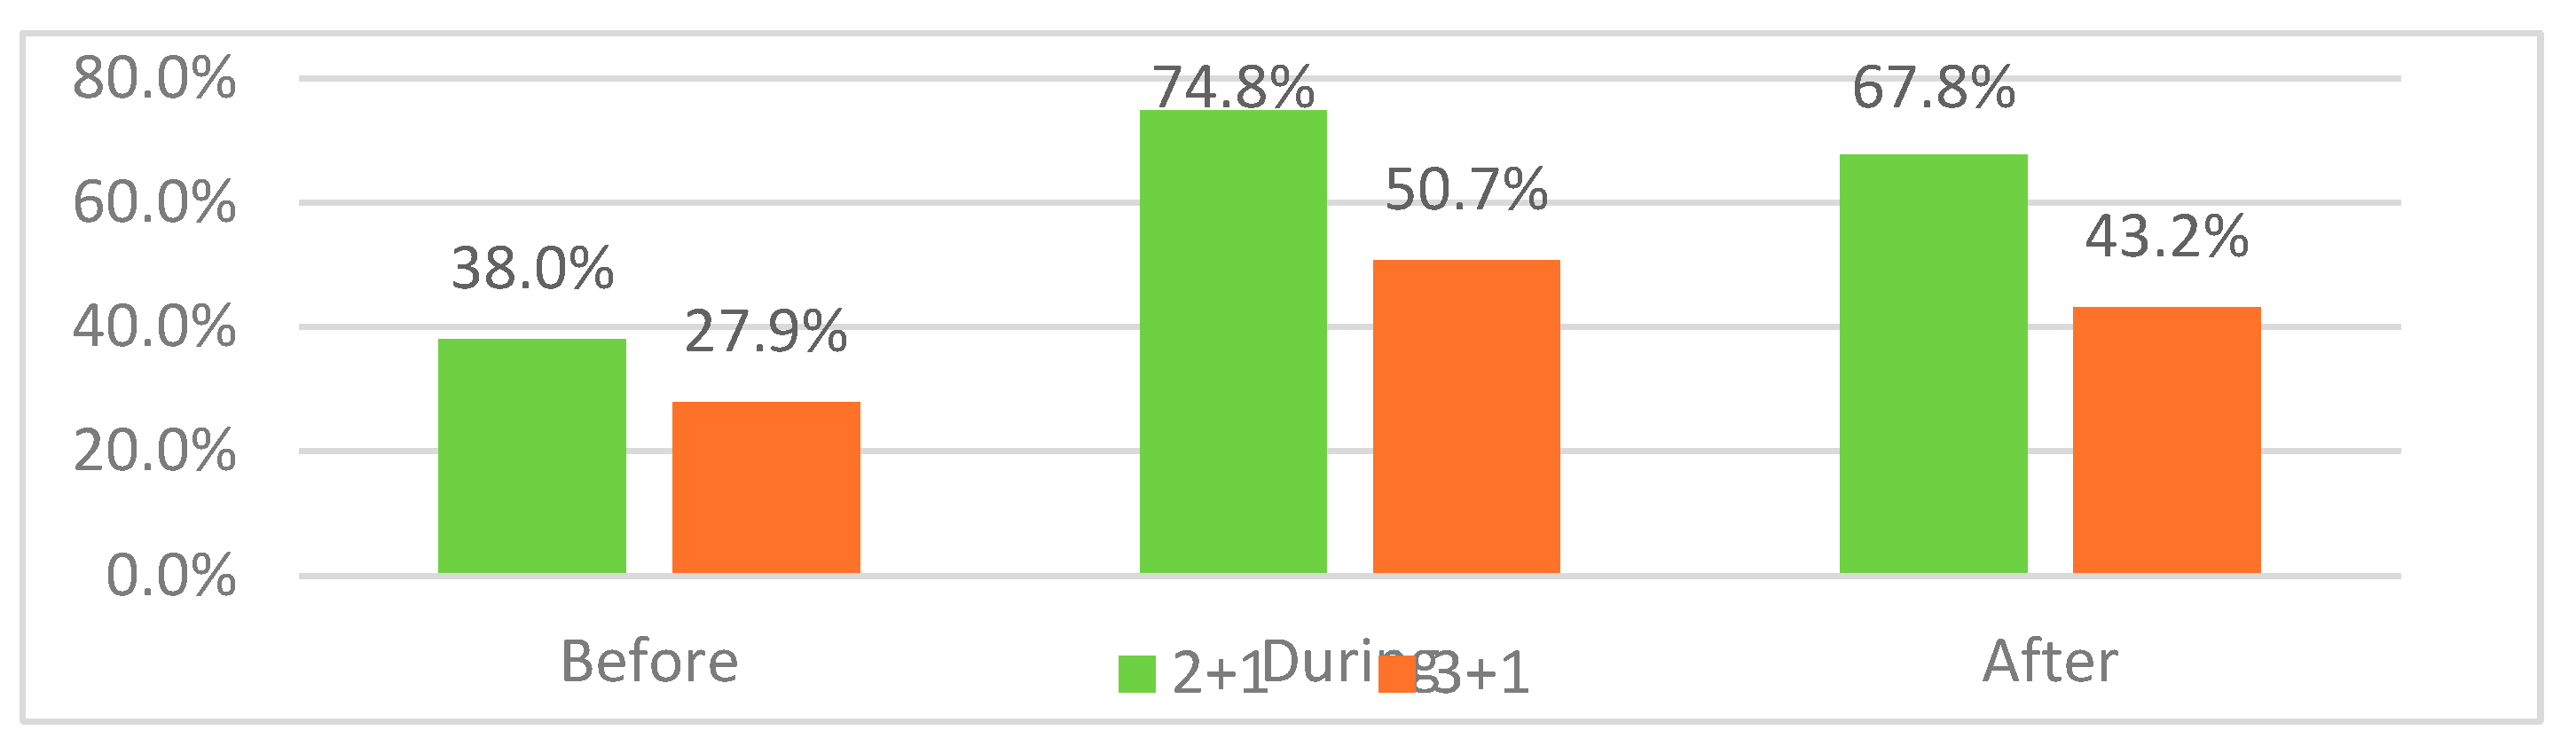
Figure 7.
Variations in dissatisfaction percentages for Entrance lobby due to combined effect of availability and apartment categories.
Figure 7.
Variations in dissatisfaction percentages for Entrance lobby due to combined effect of availability and apartment categories.
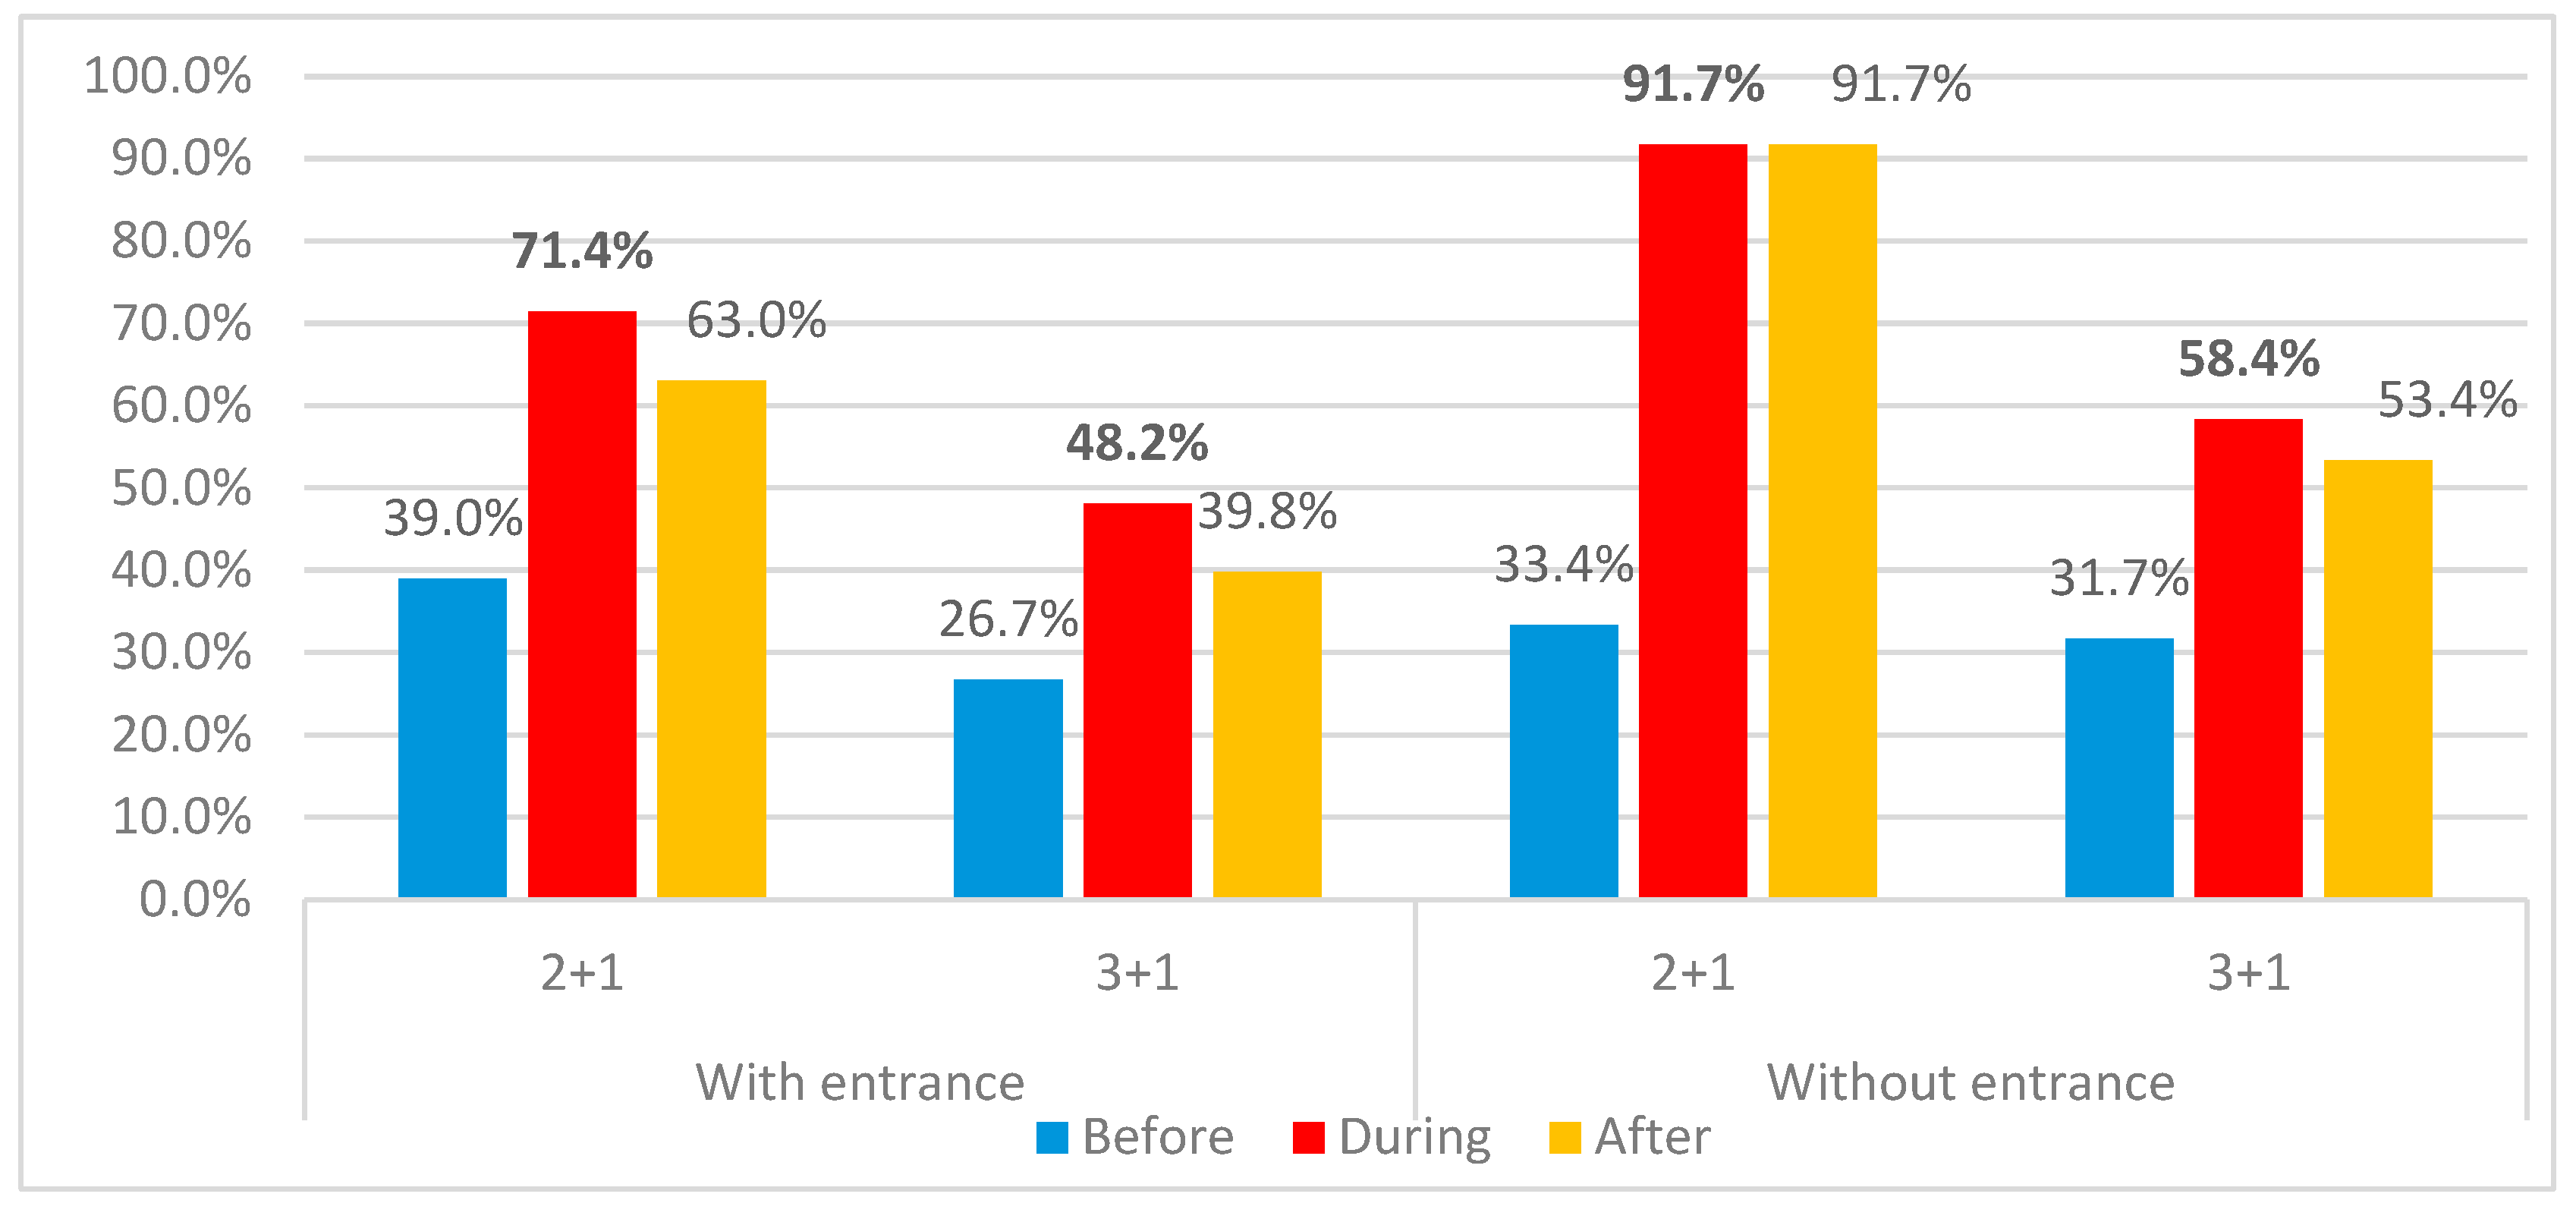
Figure 8.
Reason of variations in dissatisfaction concerned with Entrance lobby for all categories.
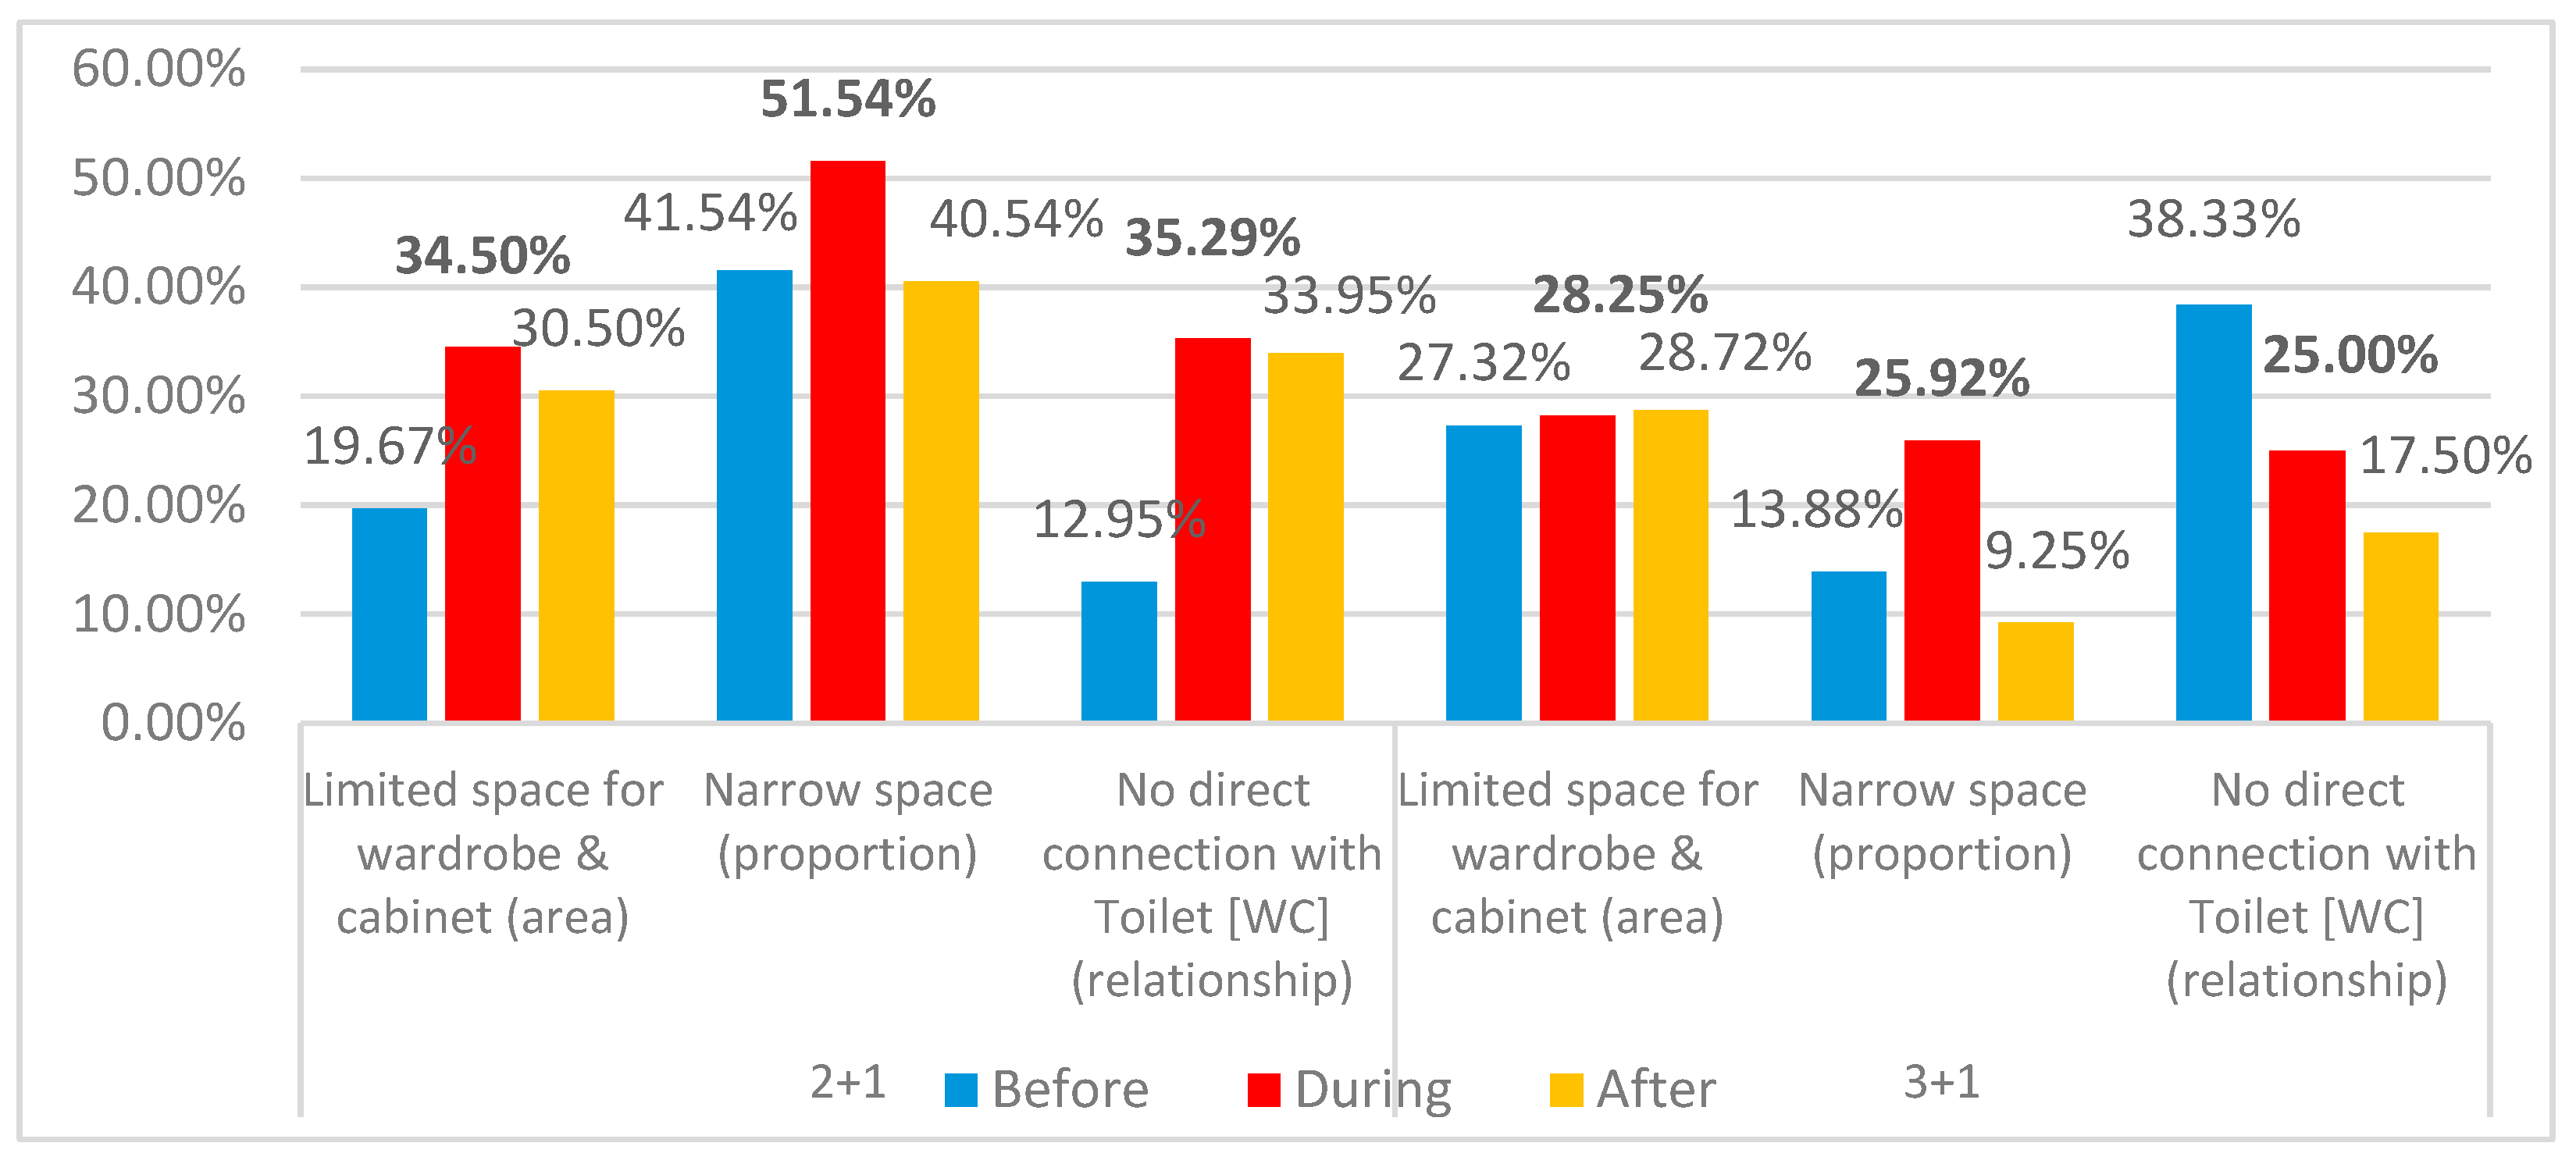
Figure 9.
Change in dissatisfaction percentage due to Entrance toilet availability.
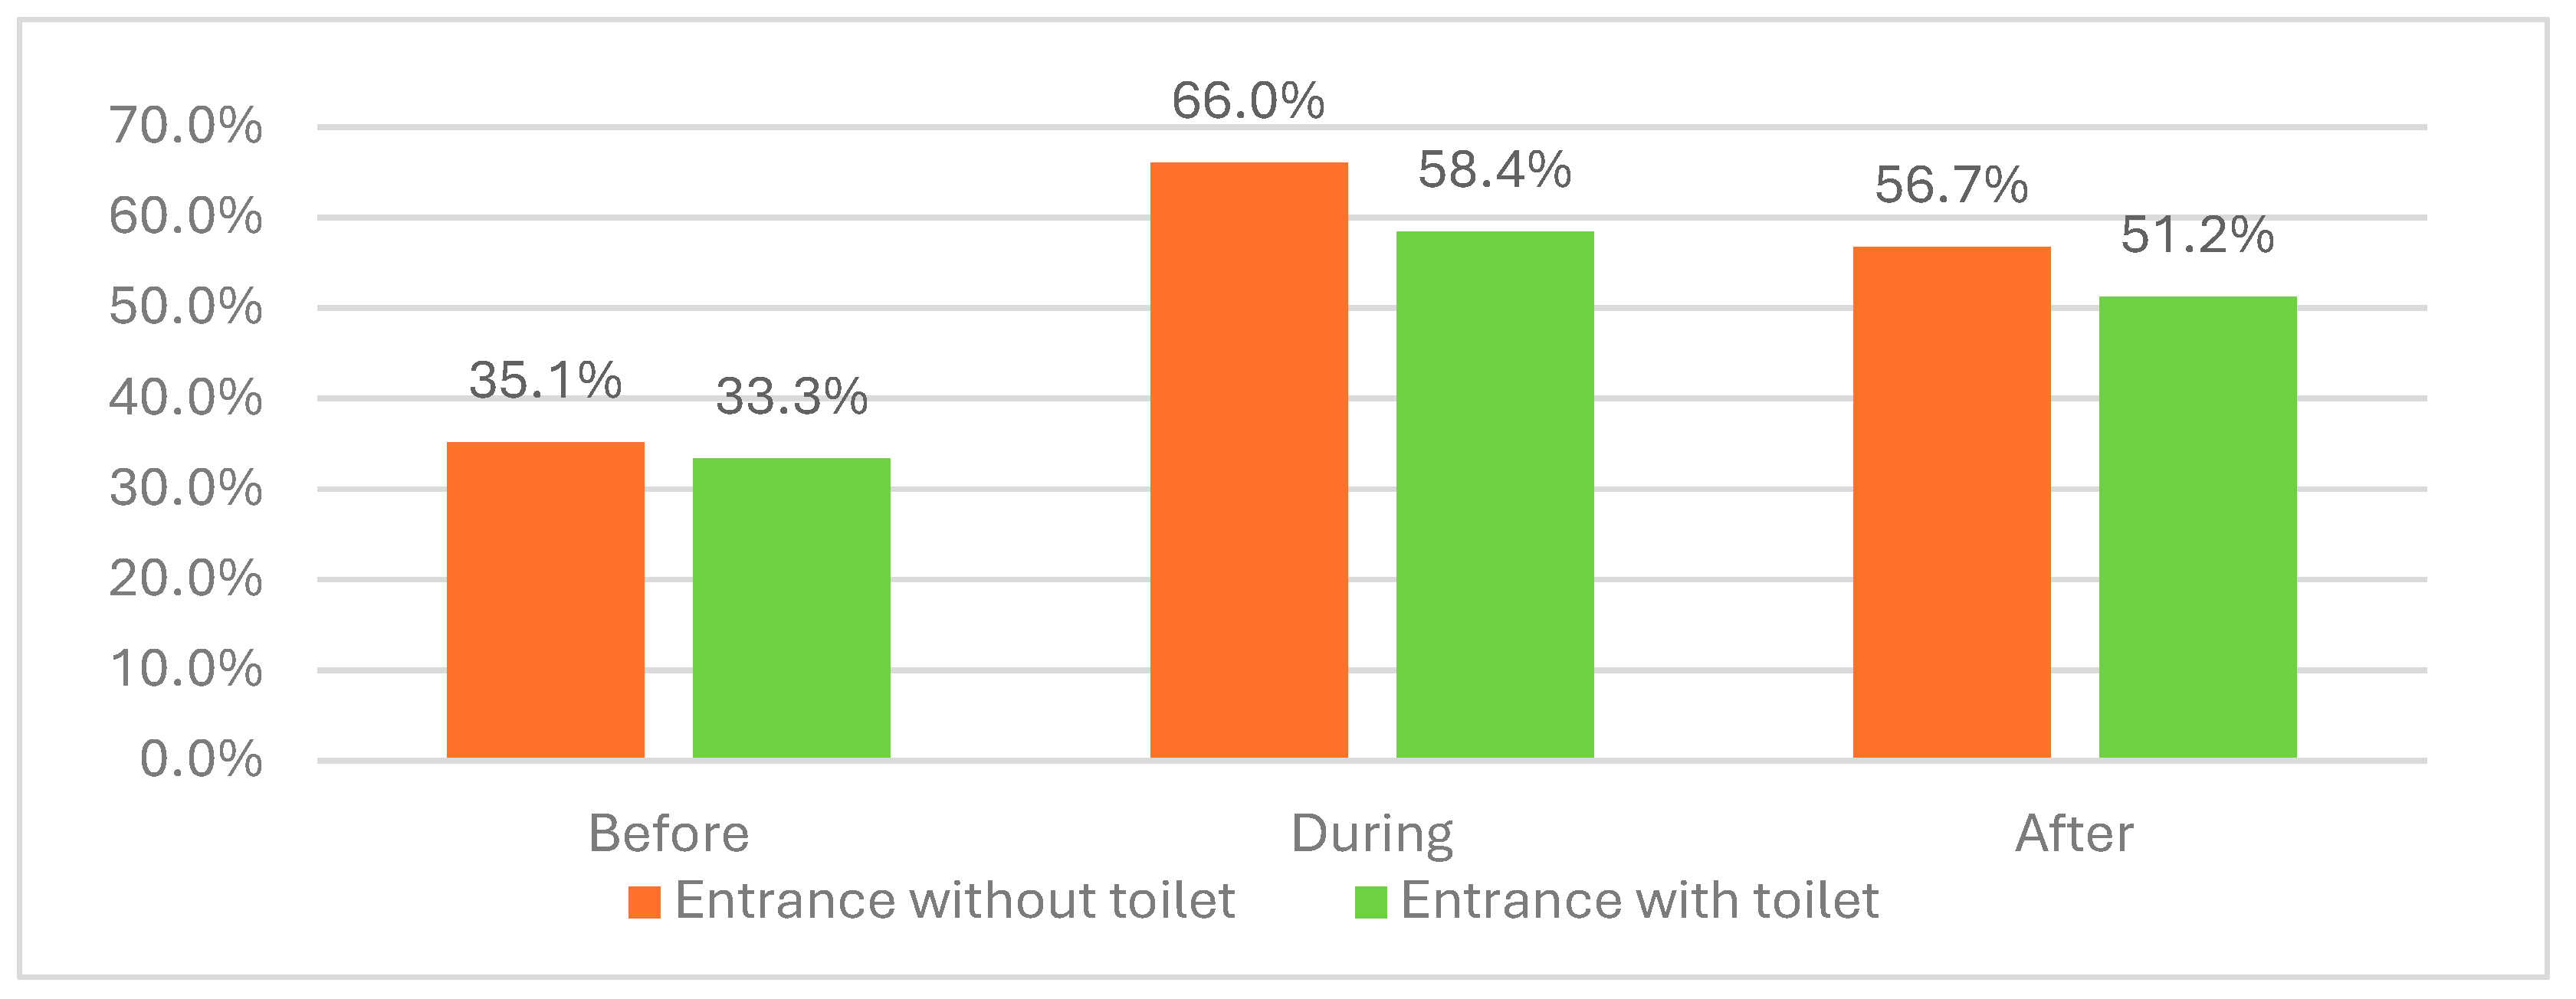
Figure 10.
Reasons of variations in dissatisfaction percentages concerned with Entrance lobby between cases having toilets and those who missed that space .
Figure 10.
Reasons of variations in dissatisfaction percentages concerned with Entrance lobby between cases having toilets and those who missed that space .
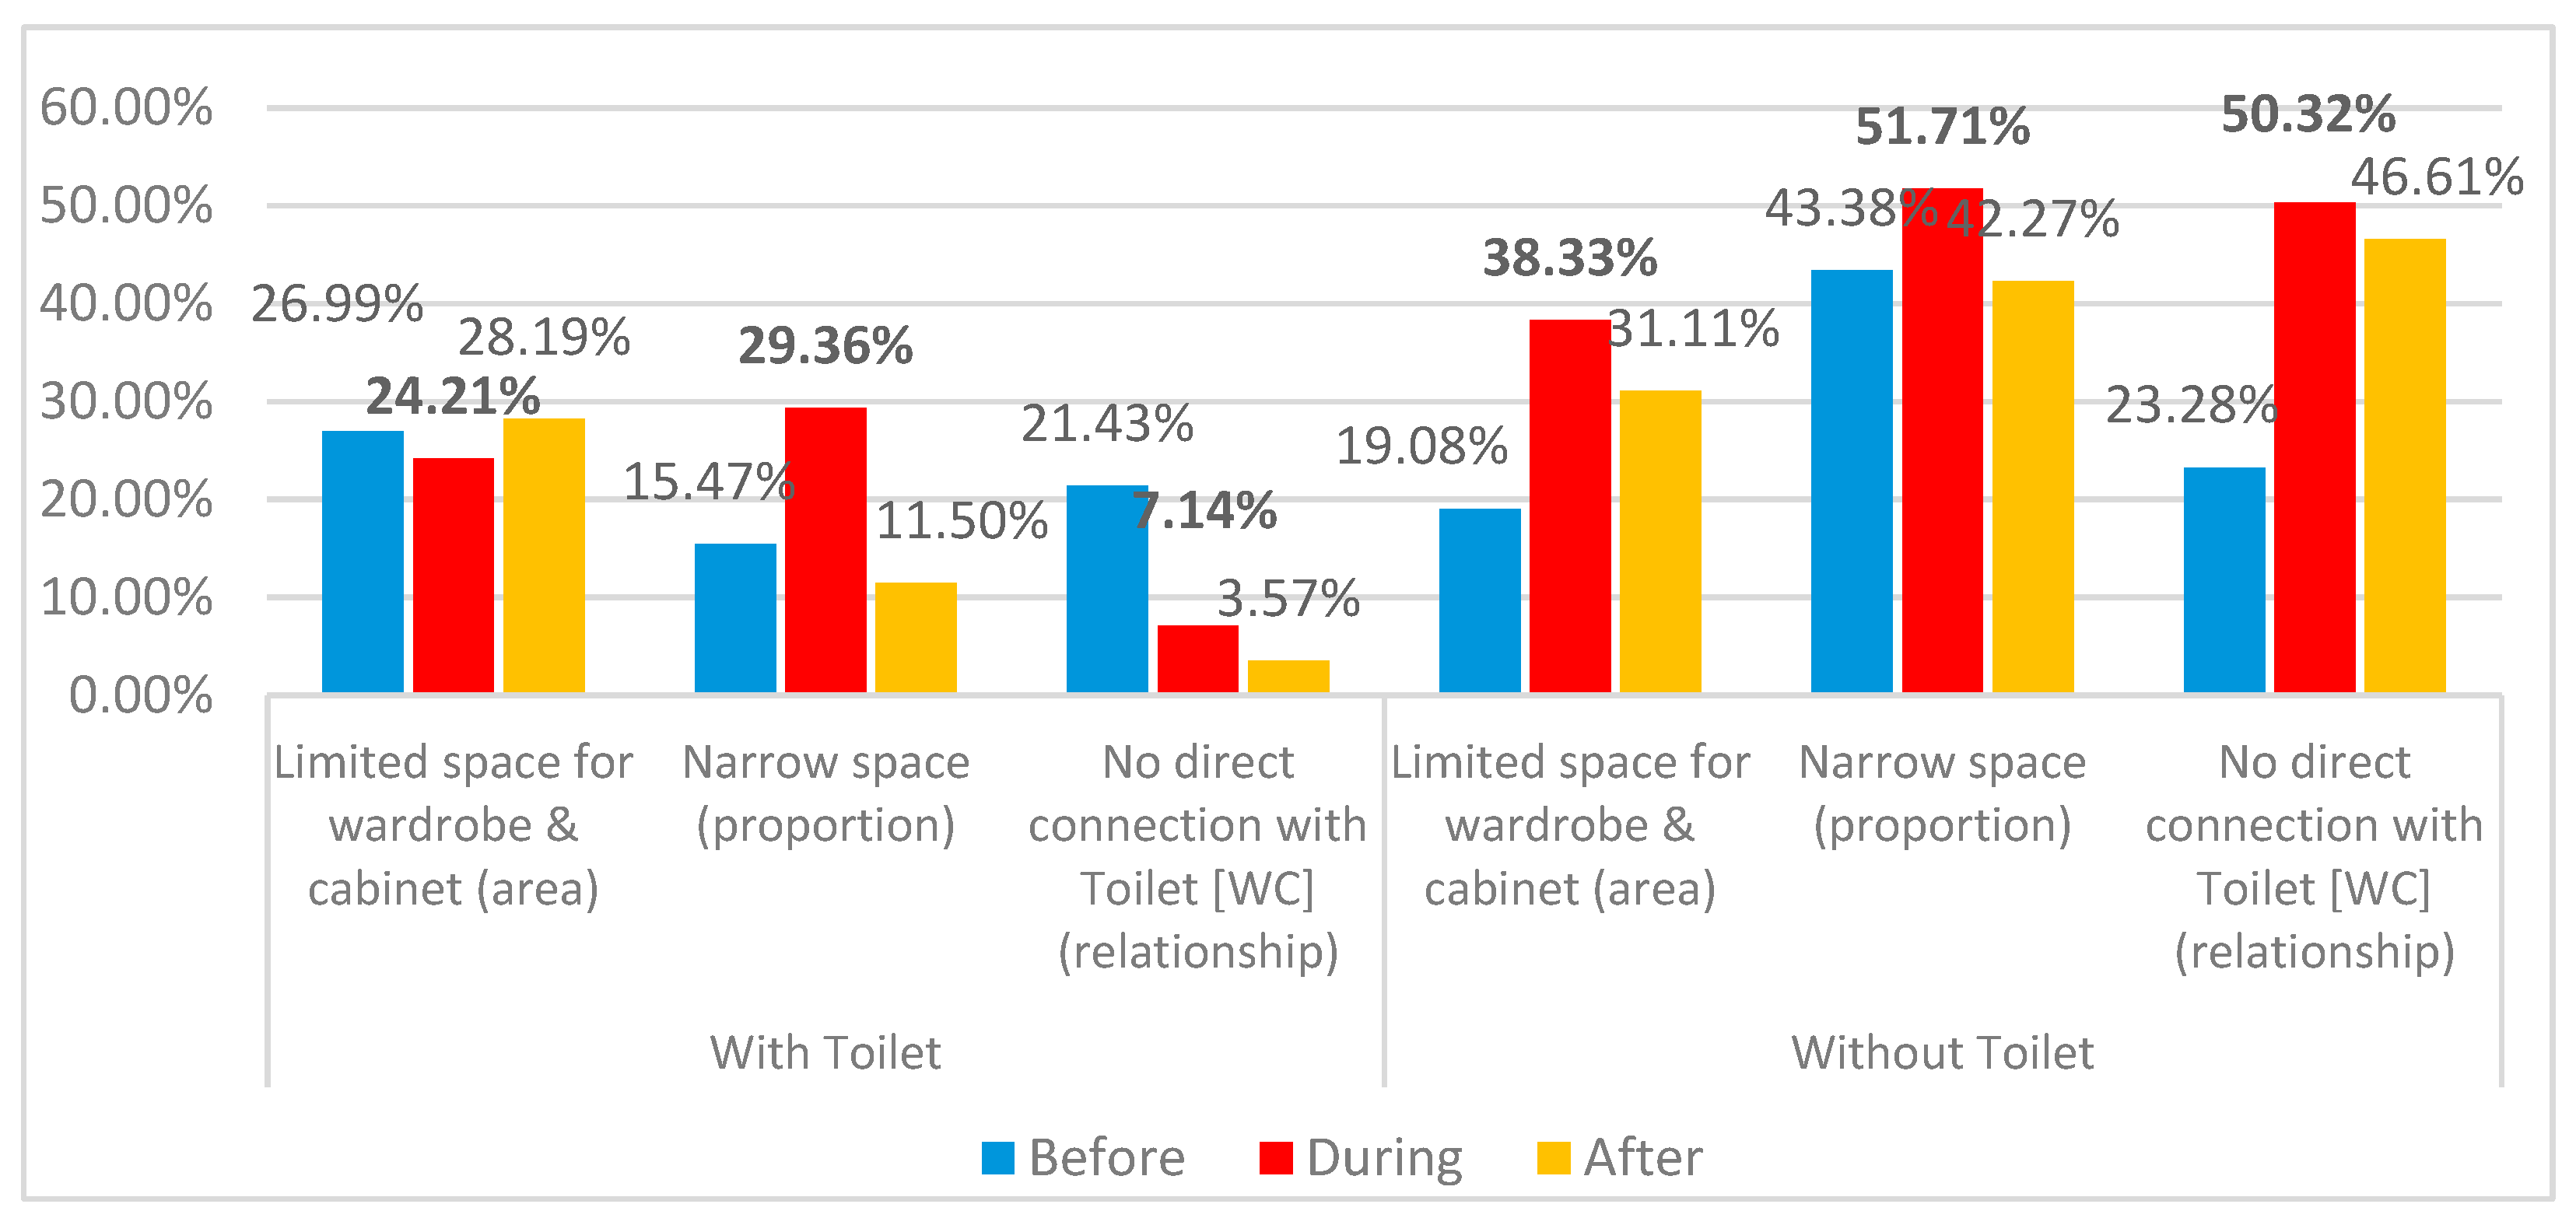
Figure 13.
Differences in dissatisfaction of living rooms for different apartment sizes.
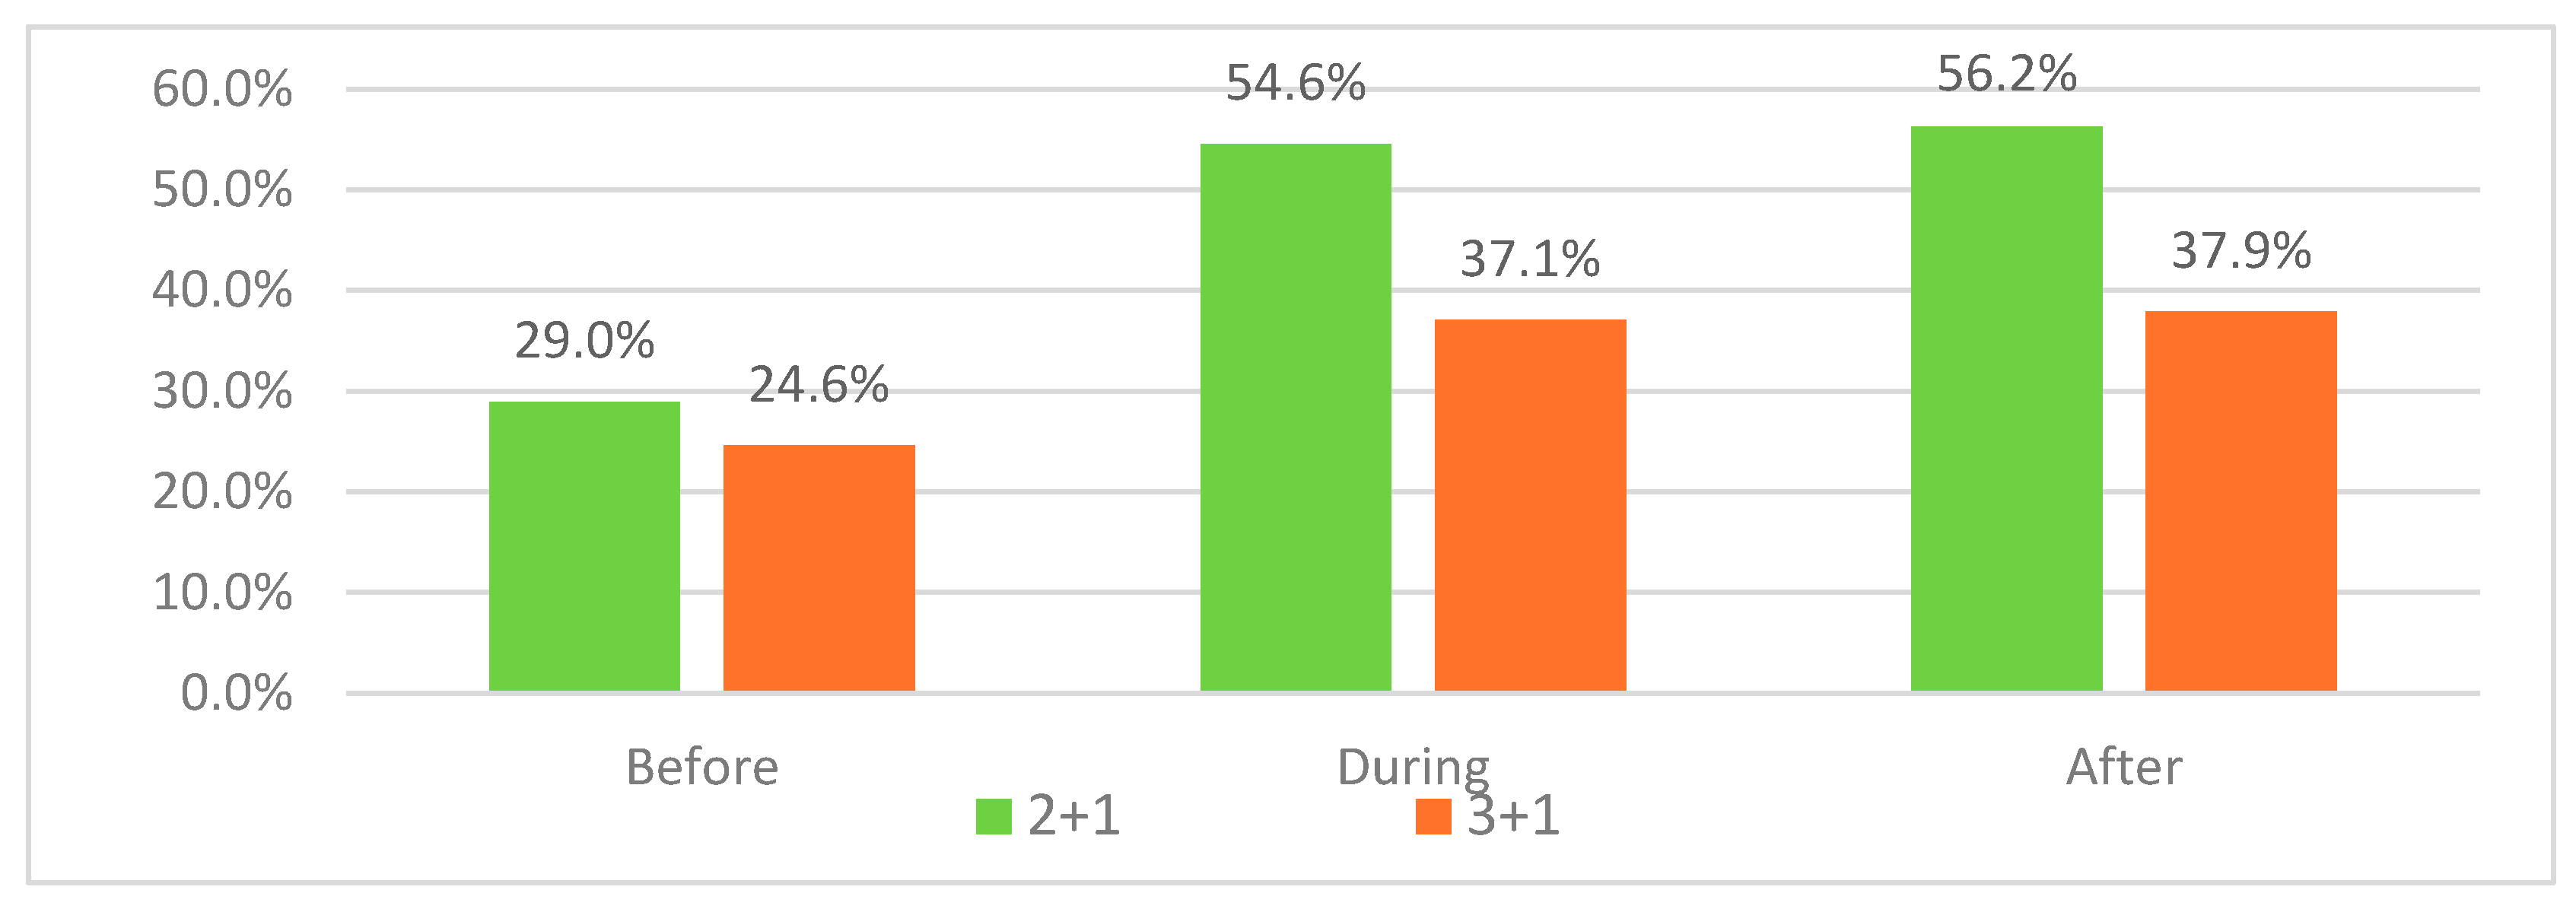
Figure 14.
Main Reasons for Changes in residents’ dissatisfaction of living rooms for both sizes .
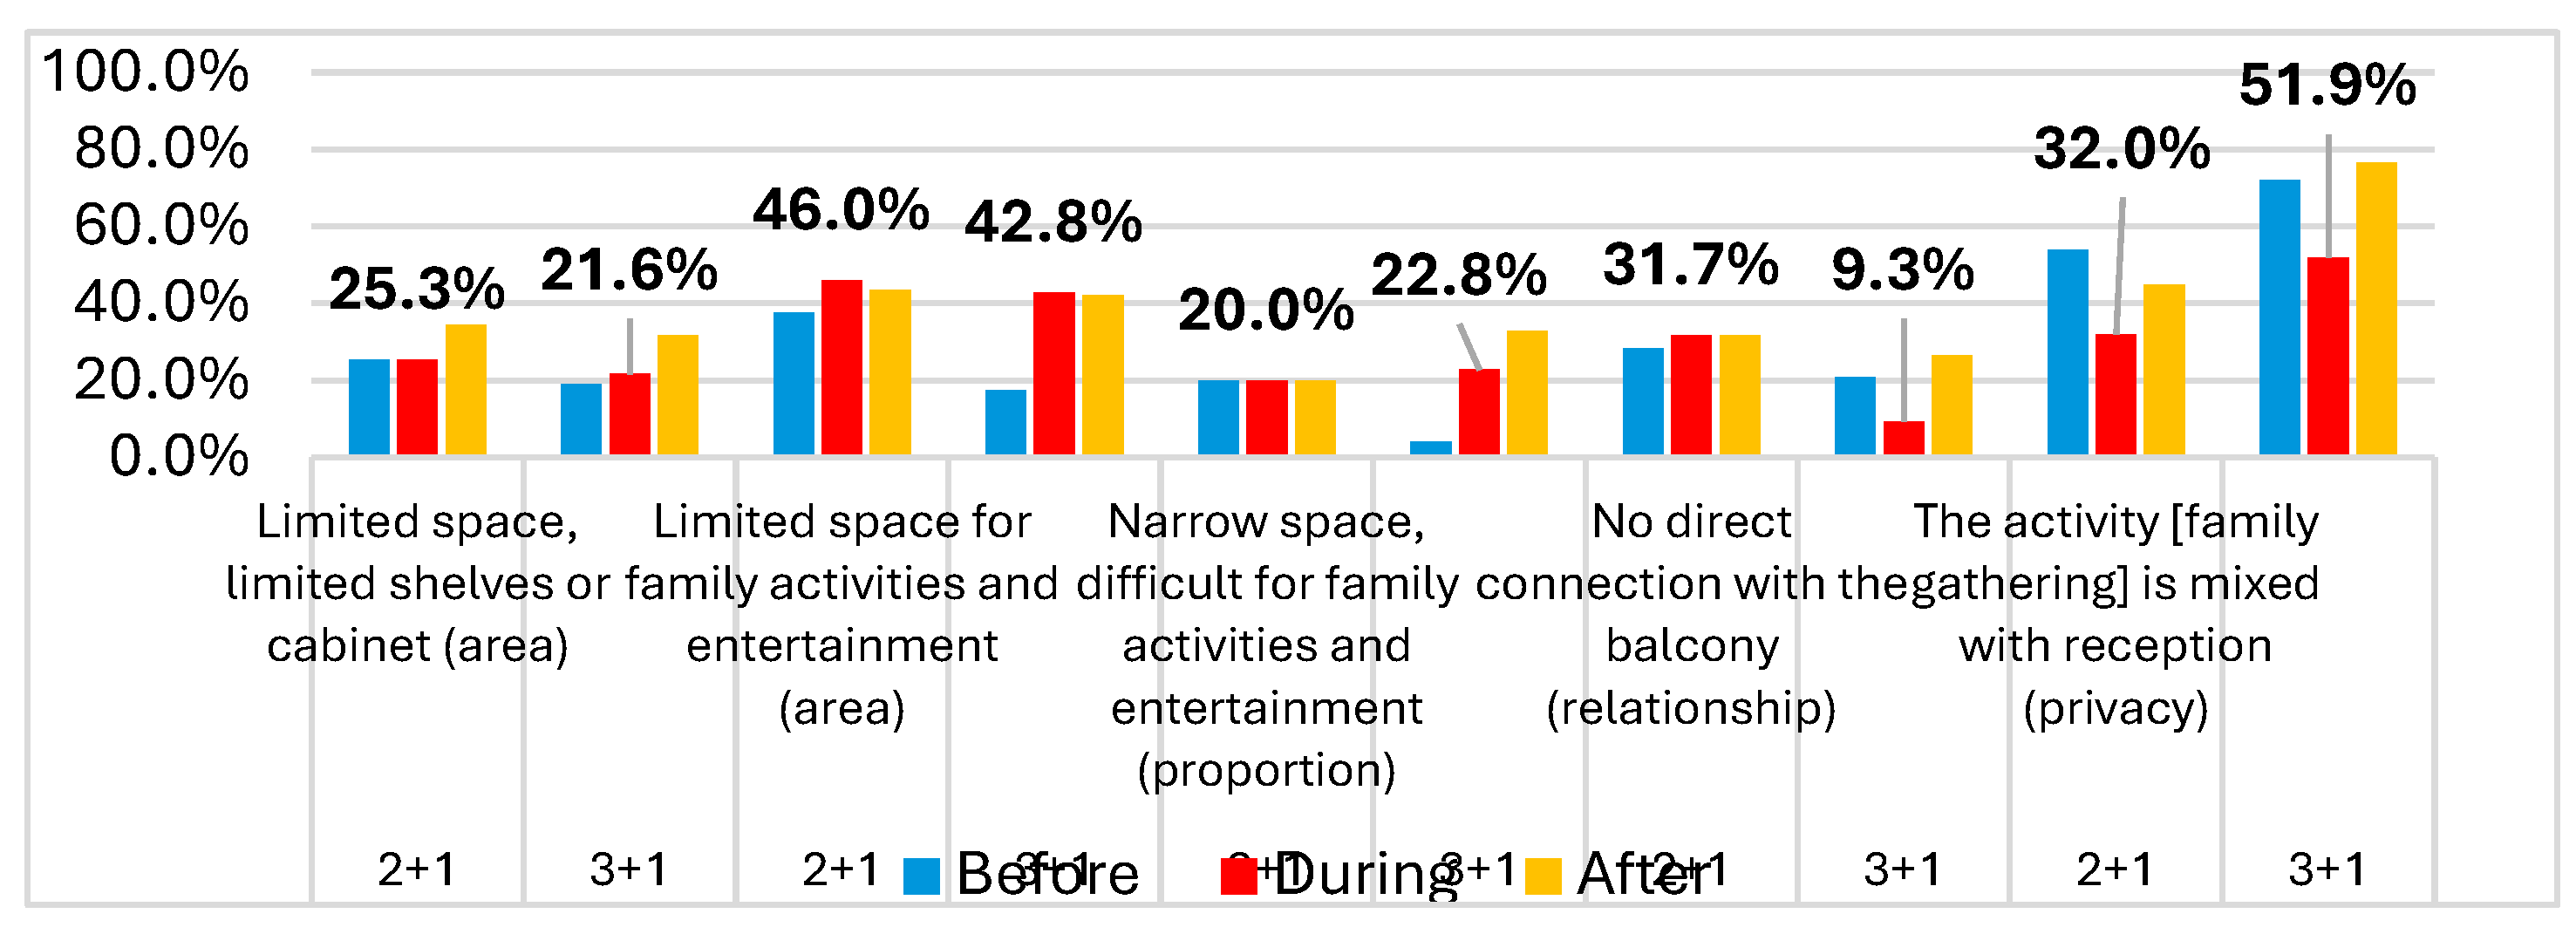
Figure 15.
Change in dissatisfaction percentage in living rooms due to spatial organization.
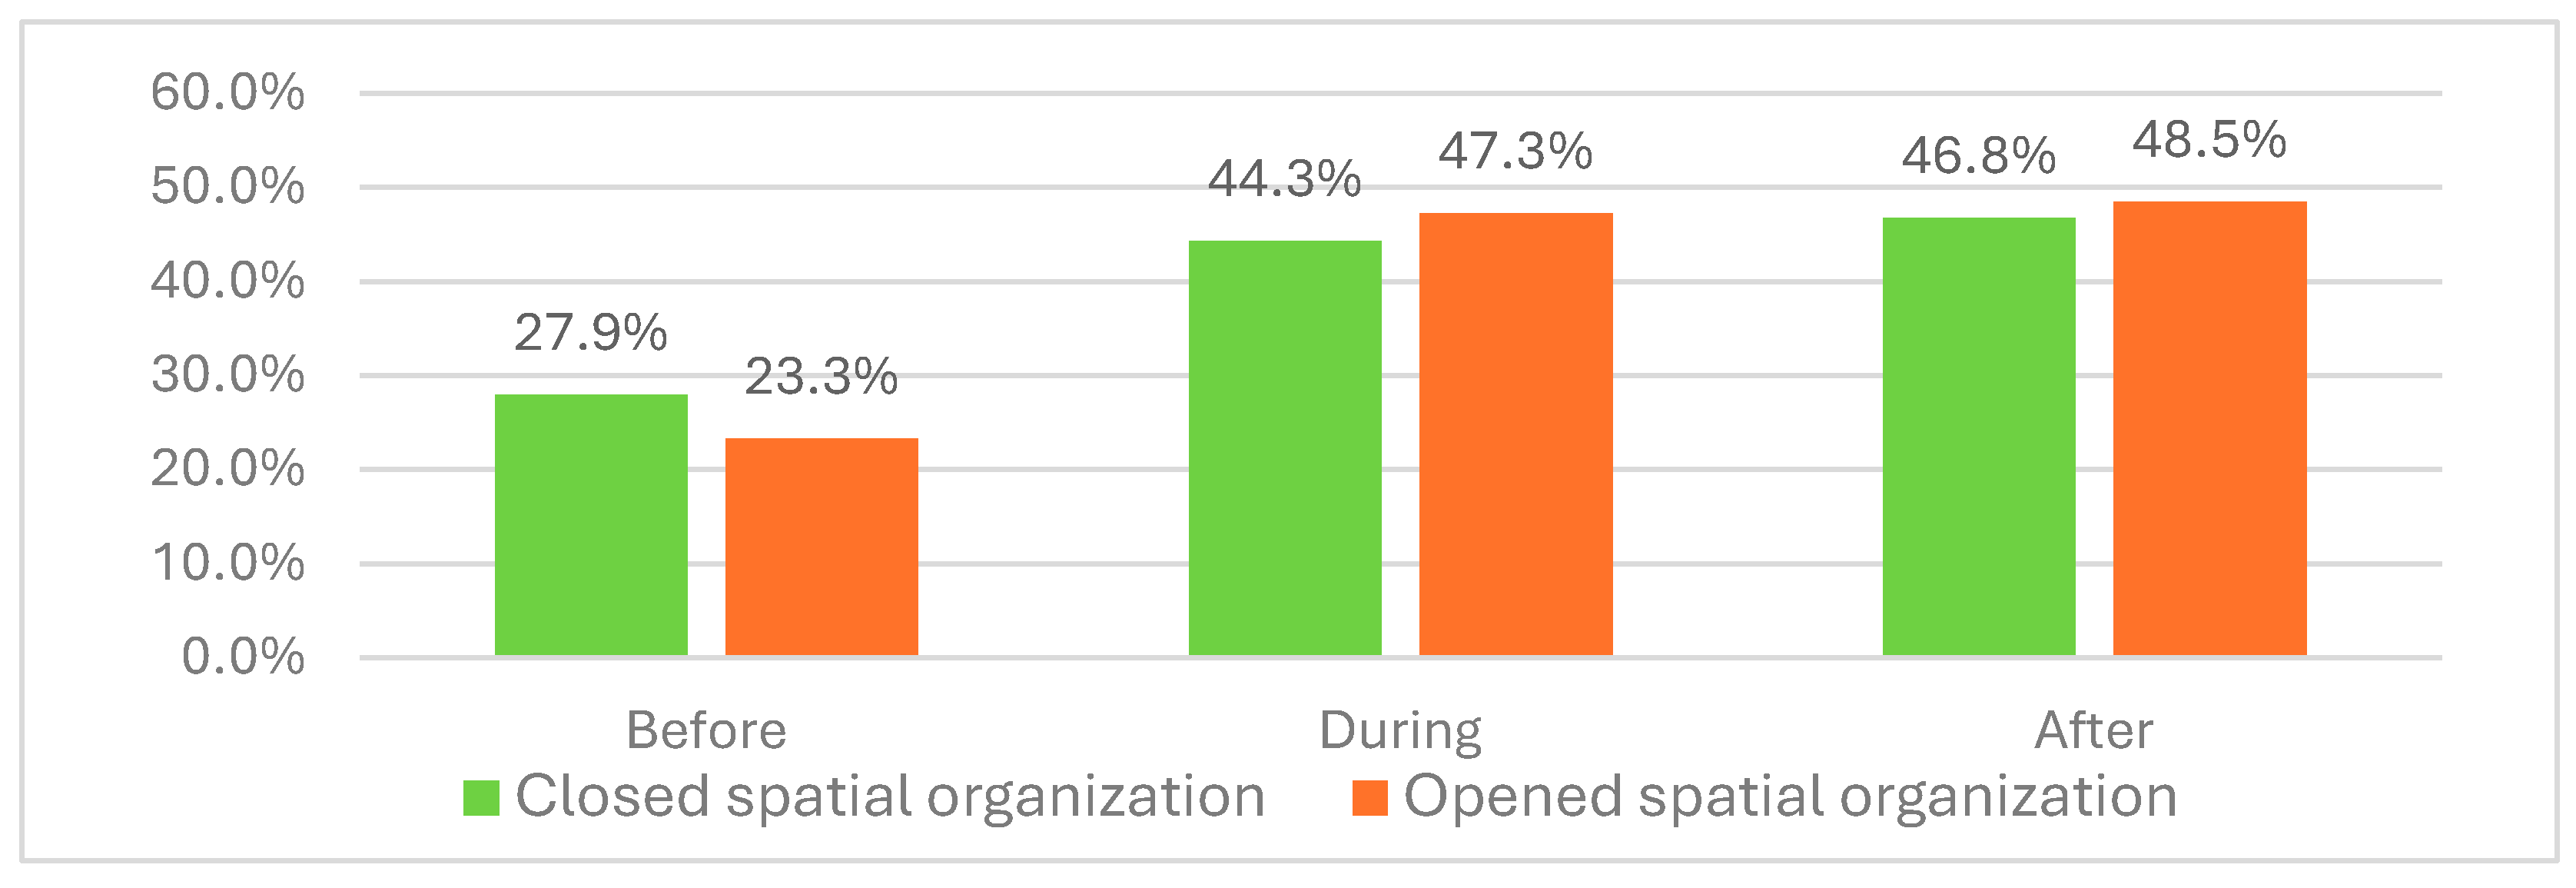
Figure 16.
Reasons for Changes in residents’ dissatisfaction of living rooms for the closed organizing.
Figure 16.
Reasons for Changes in residents’ dissatisfaction of living rooms for the closed organizing.
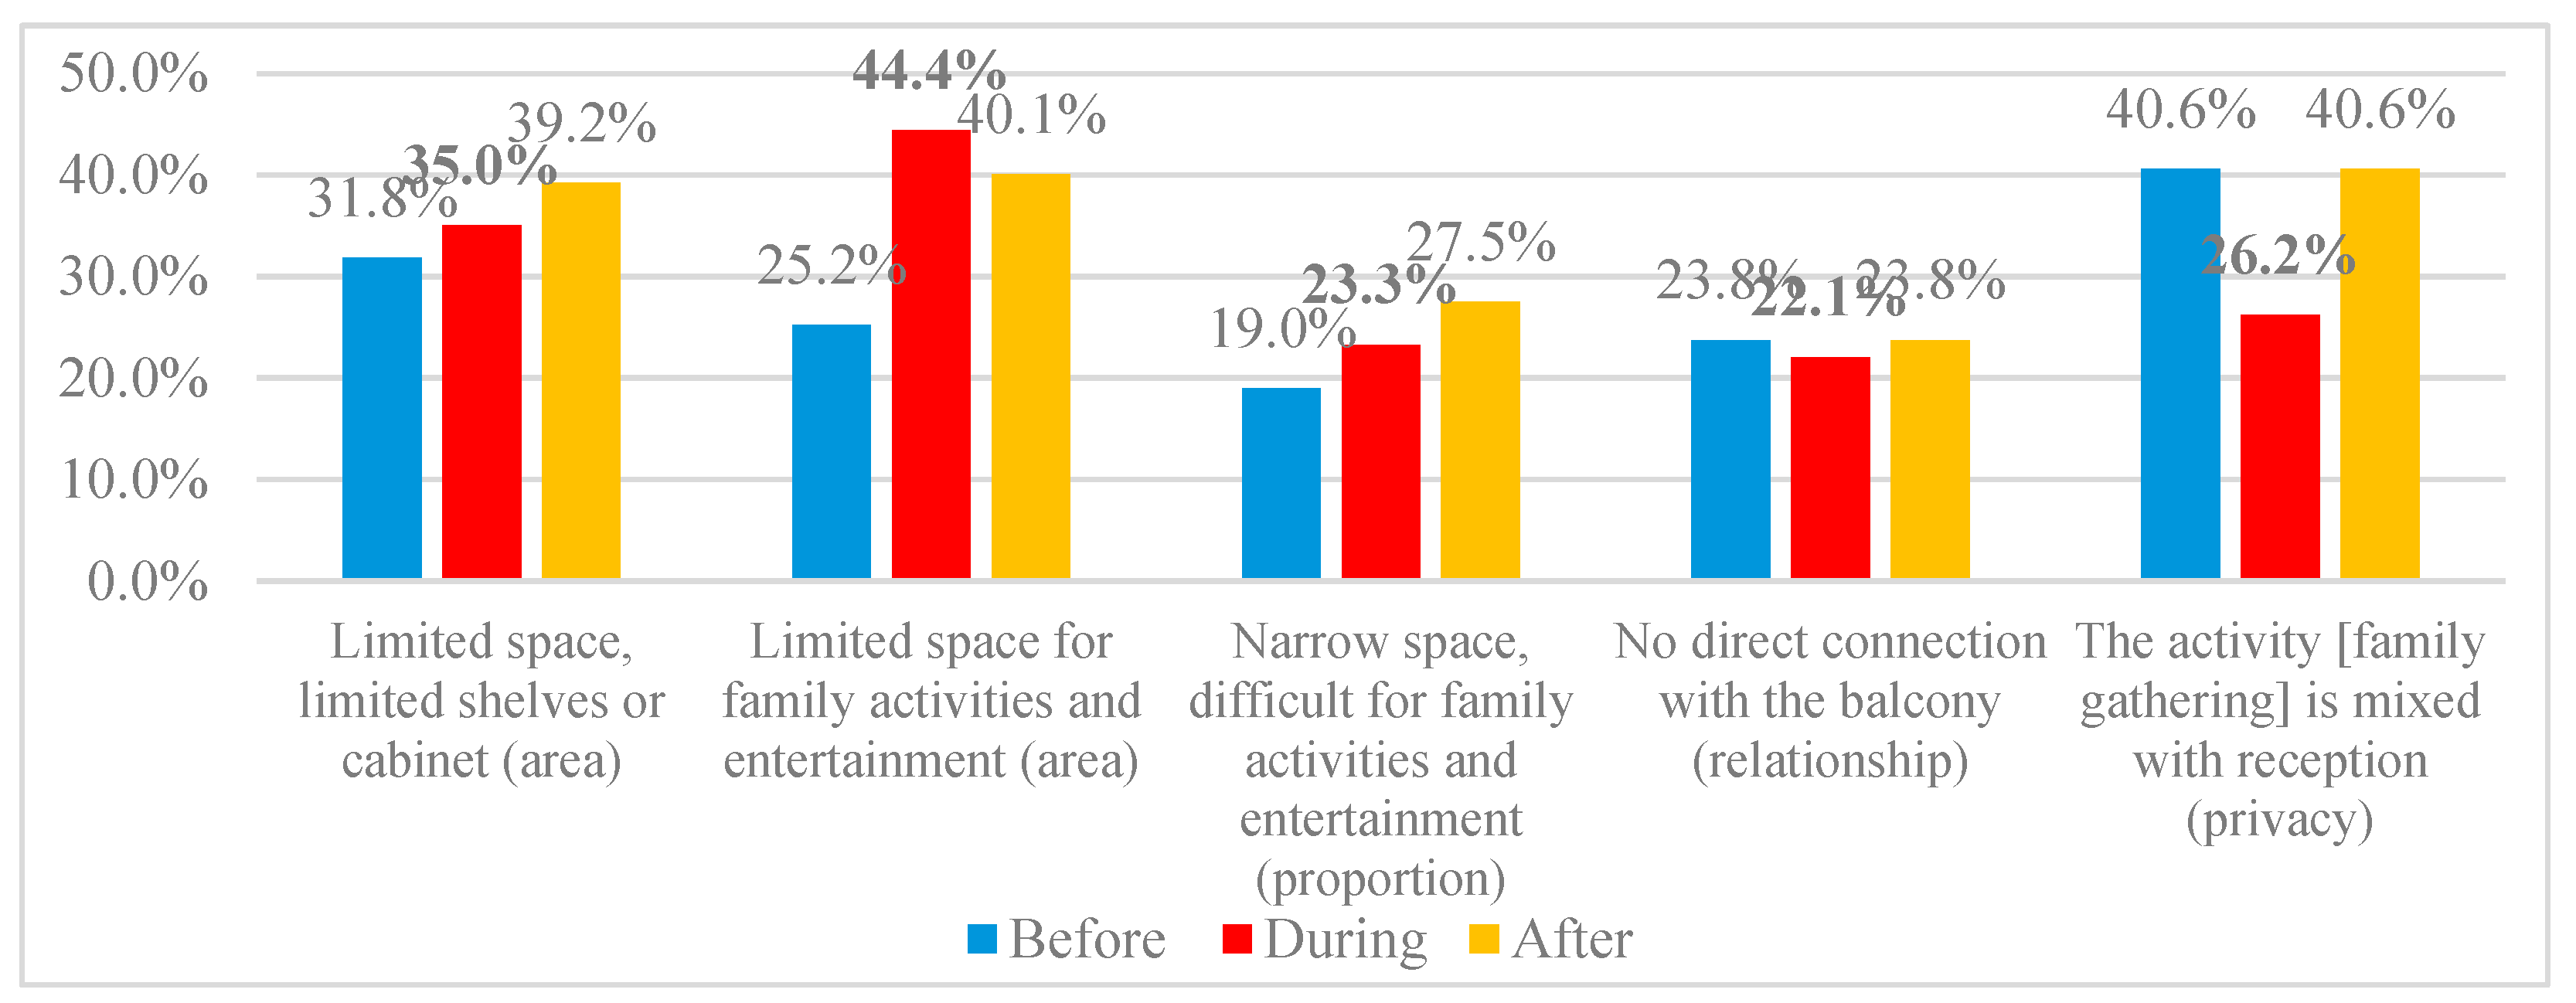
Figure 17.
Reasons for Changes in residents’ dissatisfaction of living rooms for open organizing.
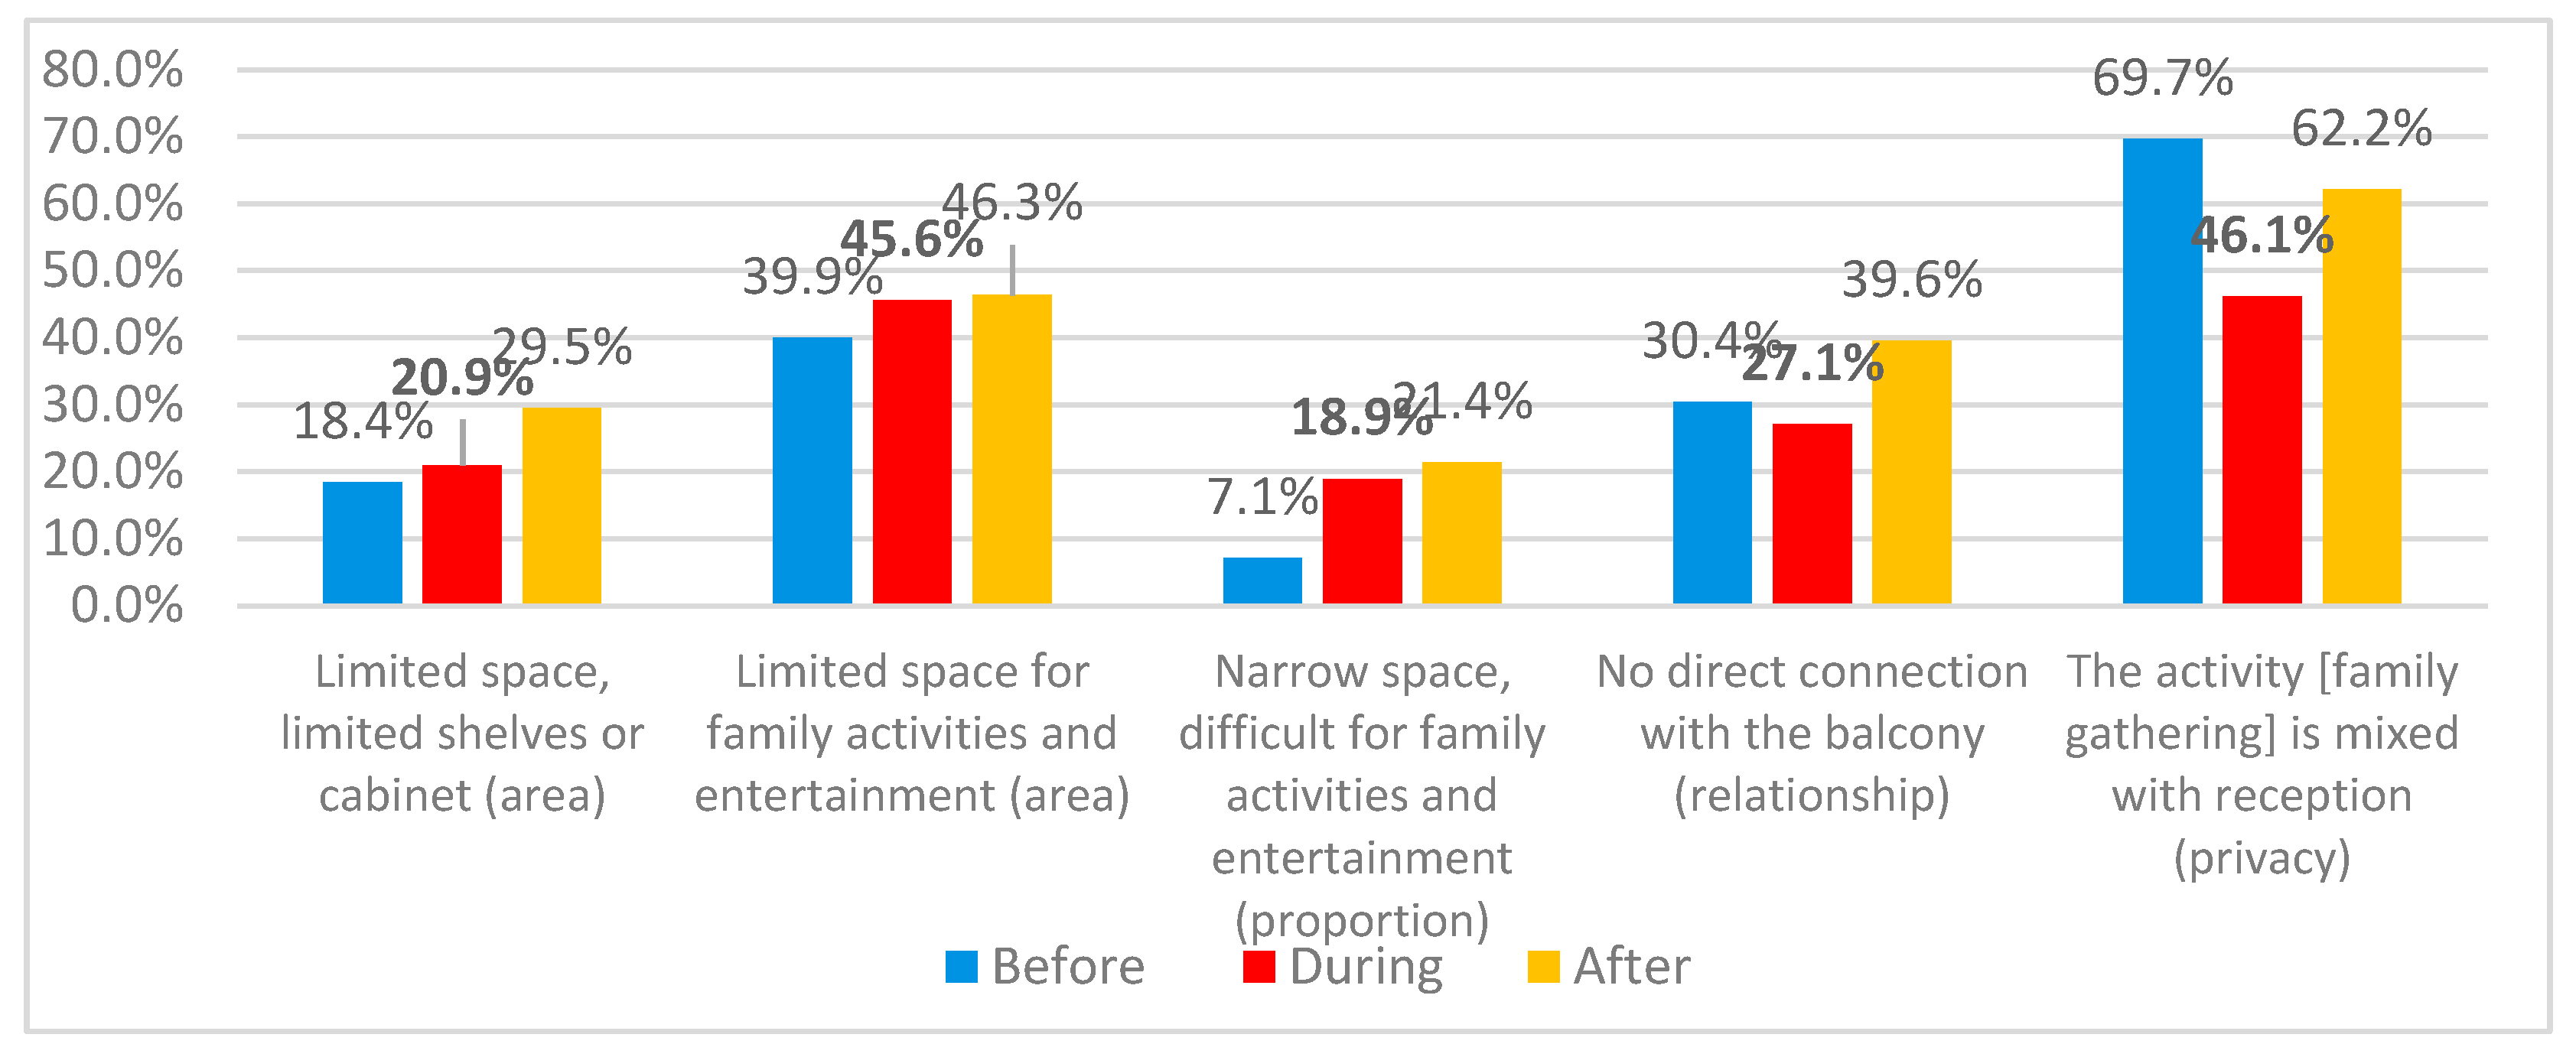
Figure 18.
Change in dissatisfaction due to availability of living rooms’ balcony .
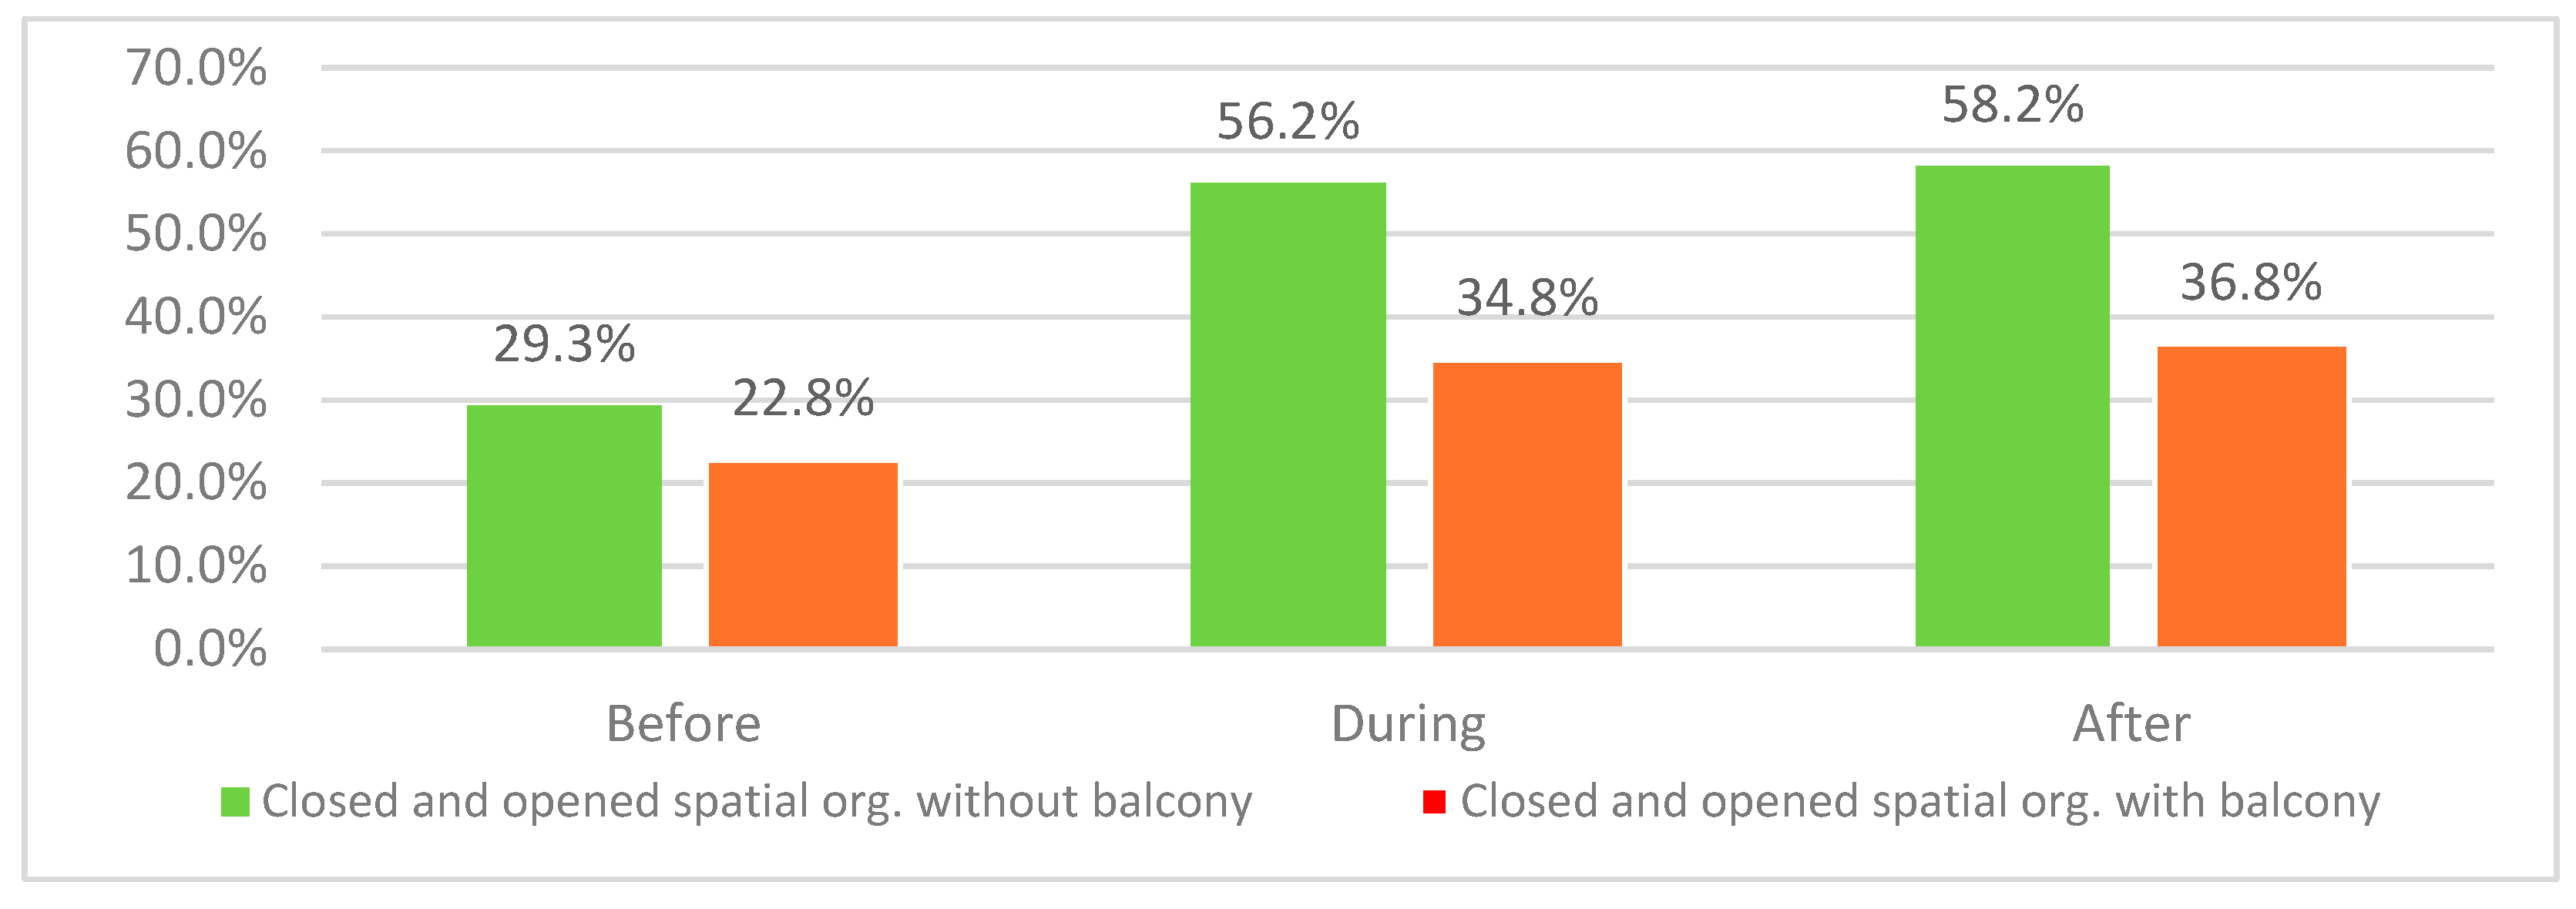
Figure 19.
Reasons for Changes in dissatisfaction of living rooms without balconies.
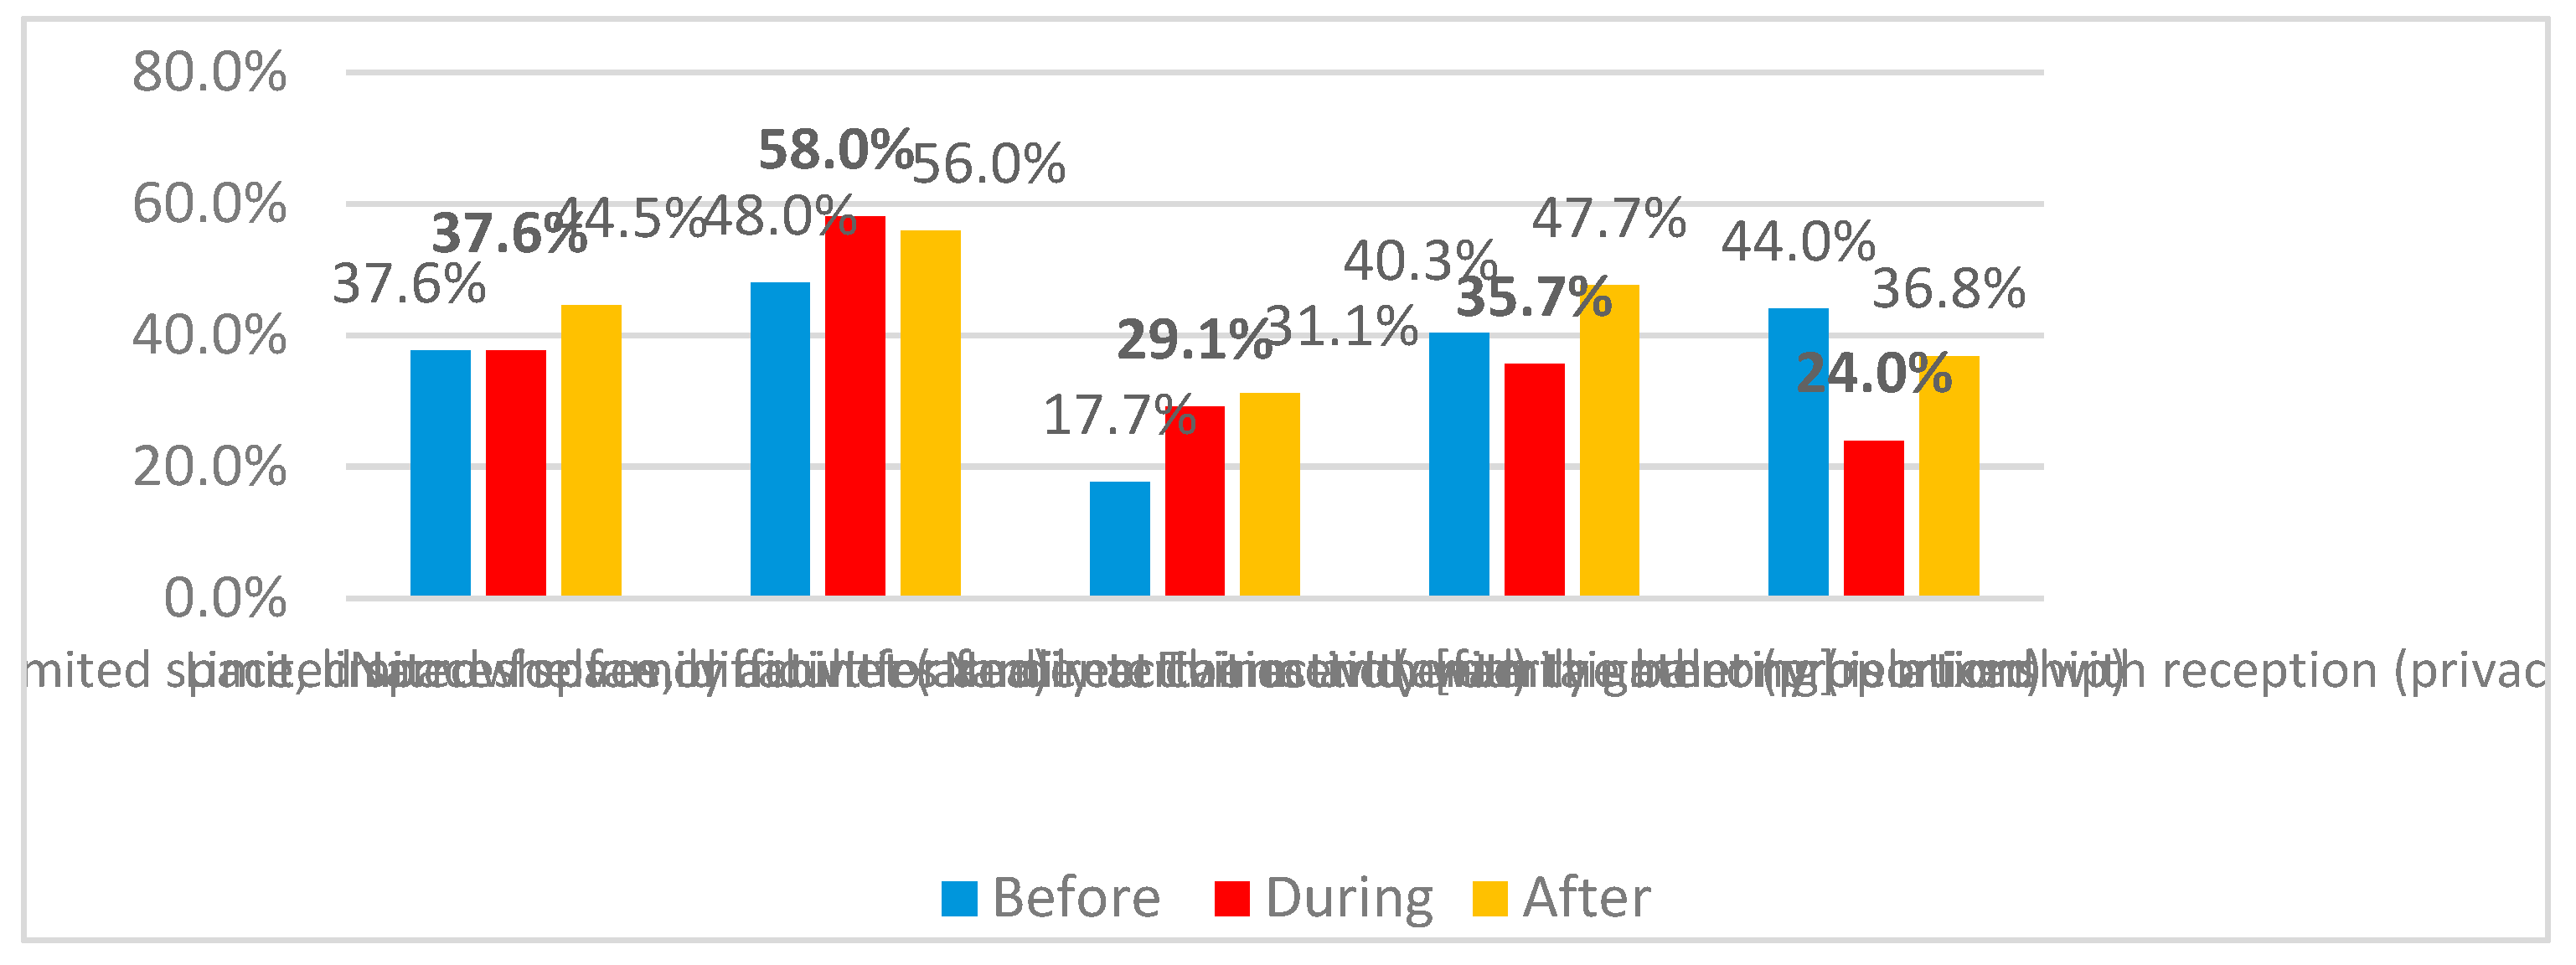
Figure 20.
Reasons for Changes in dissatisfaction of living rooms with balconies.
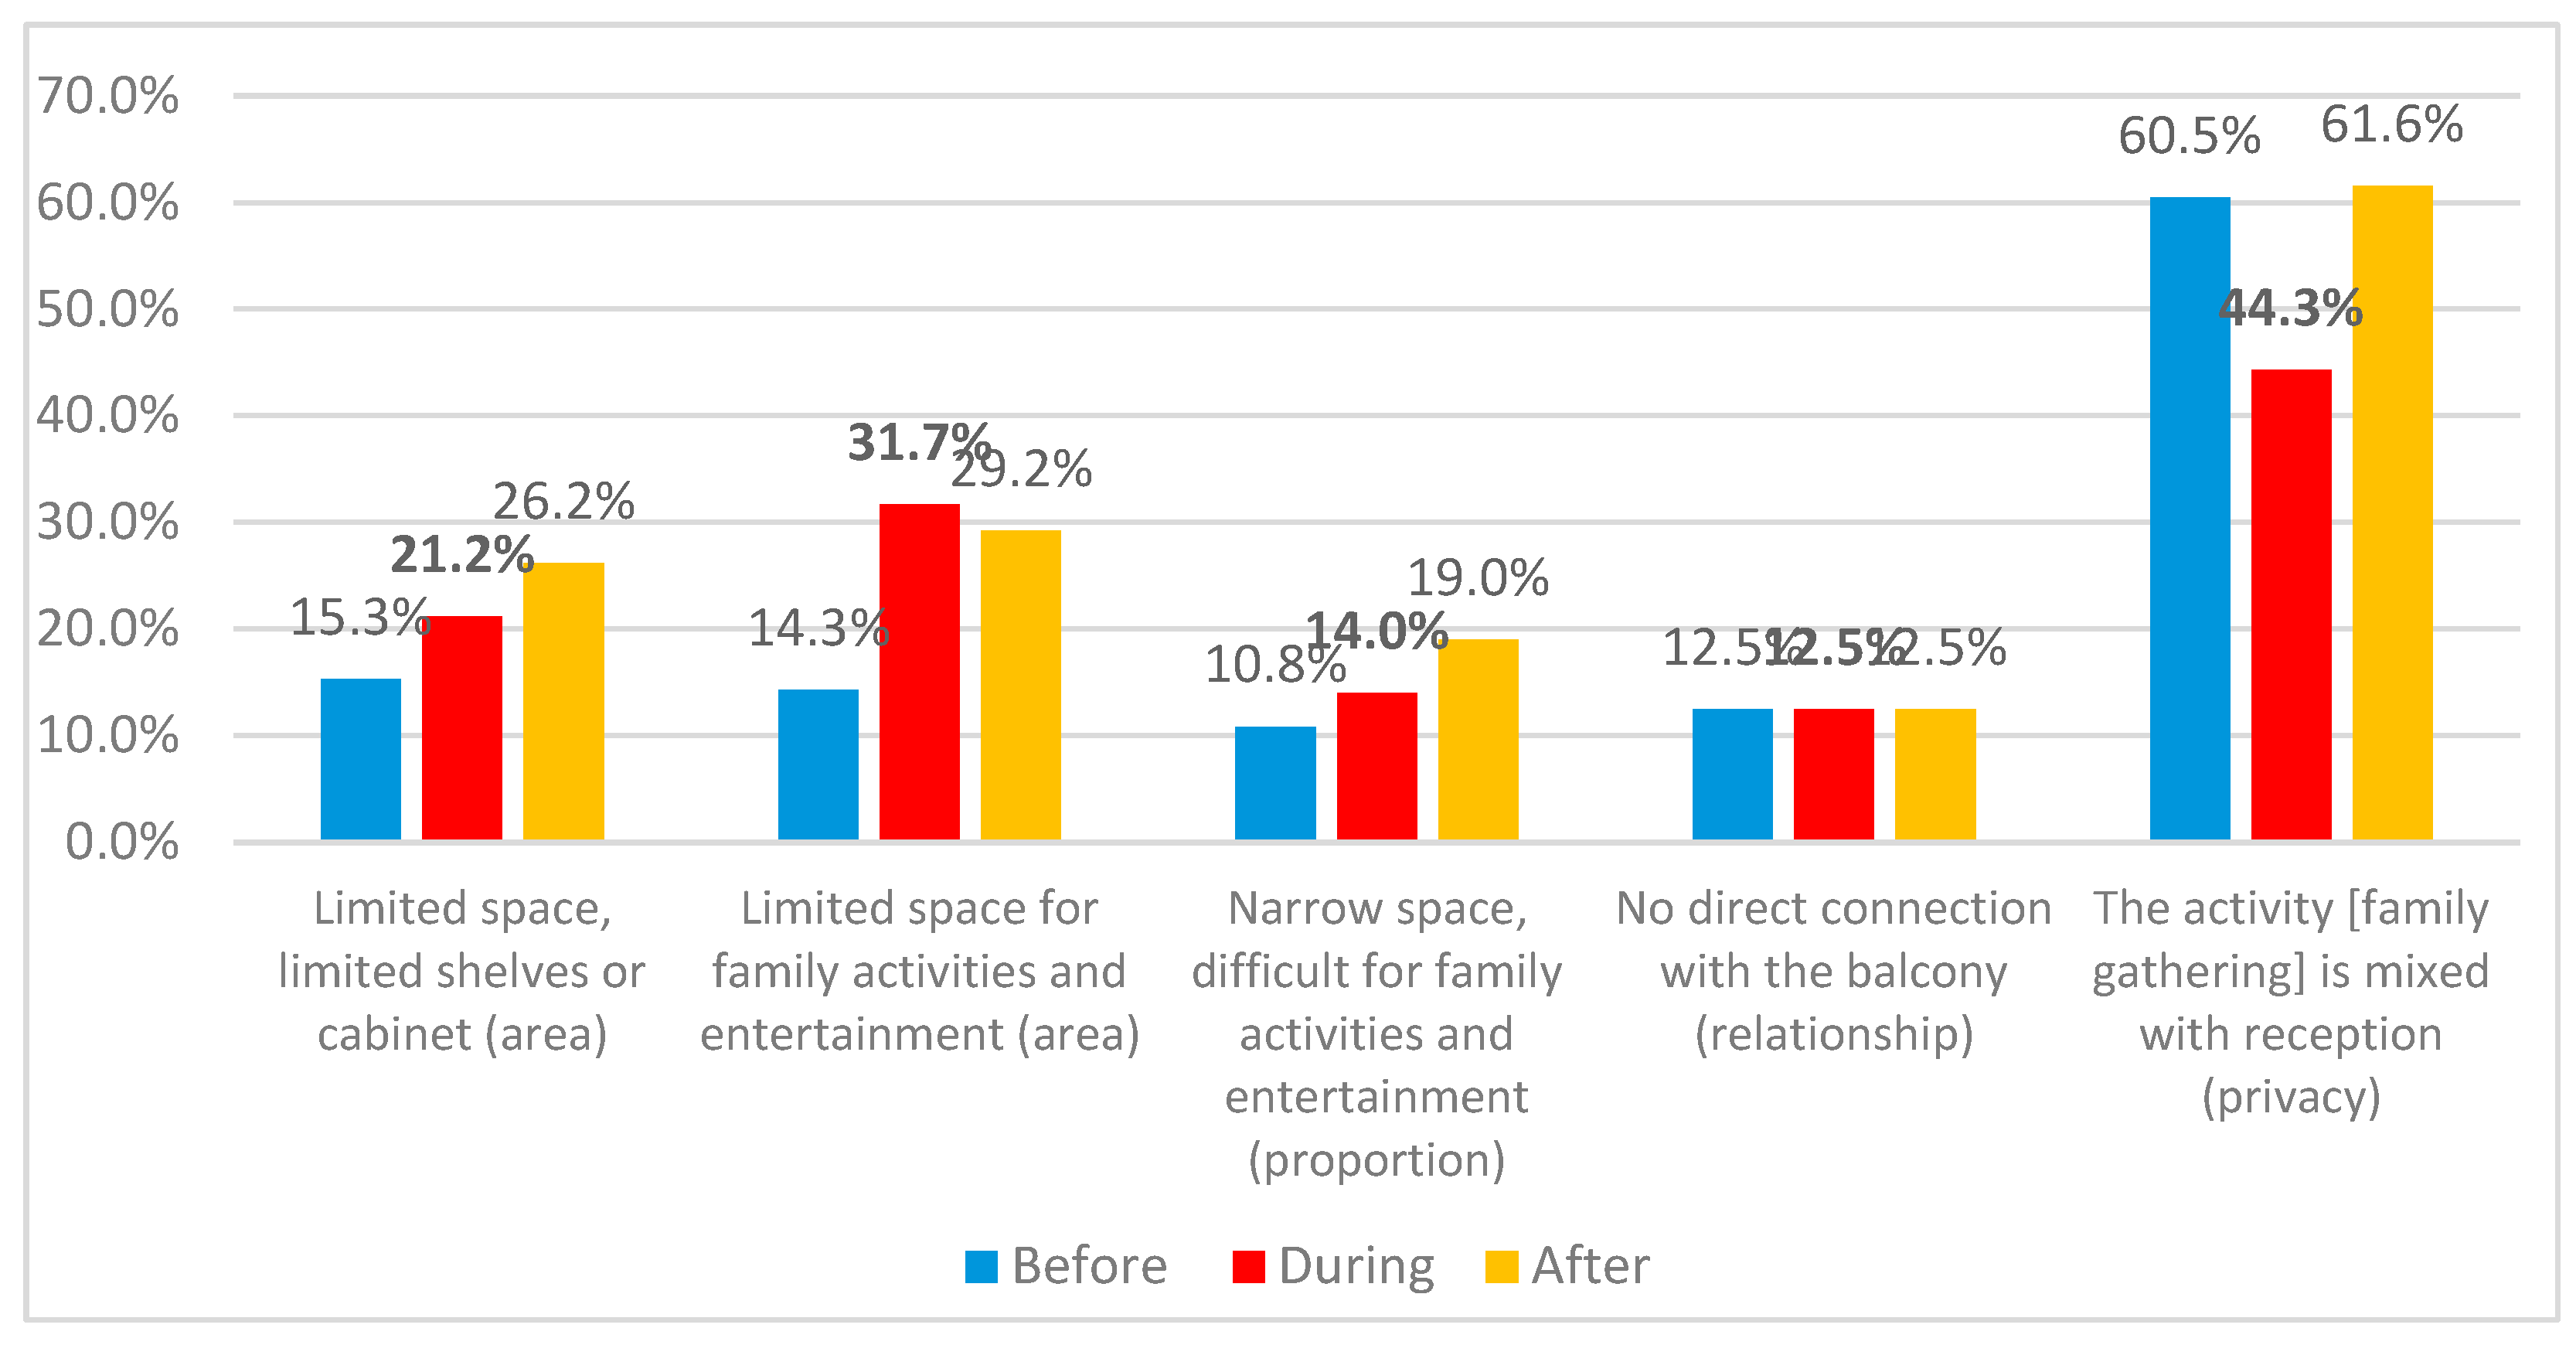
Figure 21.
Change in dissatisfaction due to combined effect of spatial organization and availability of living rooms’ balcony for closed organization. .
Figure 21.
Change in dissatisfaction due to combined effect of spatial organization and availability of living rooms’ balcony for closed organization. .
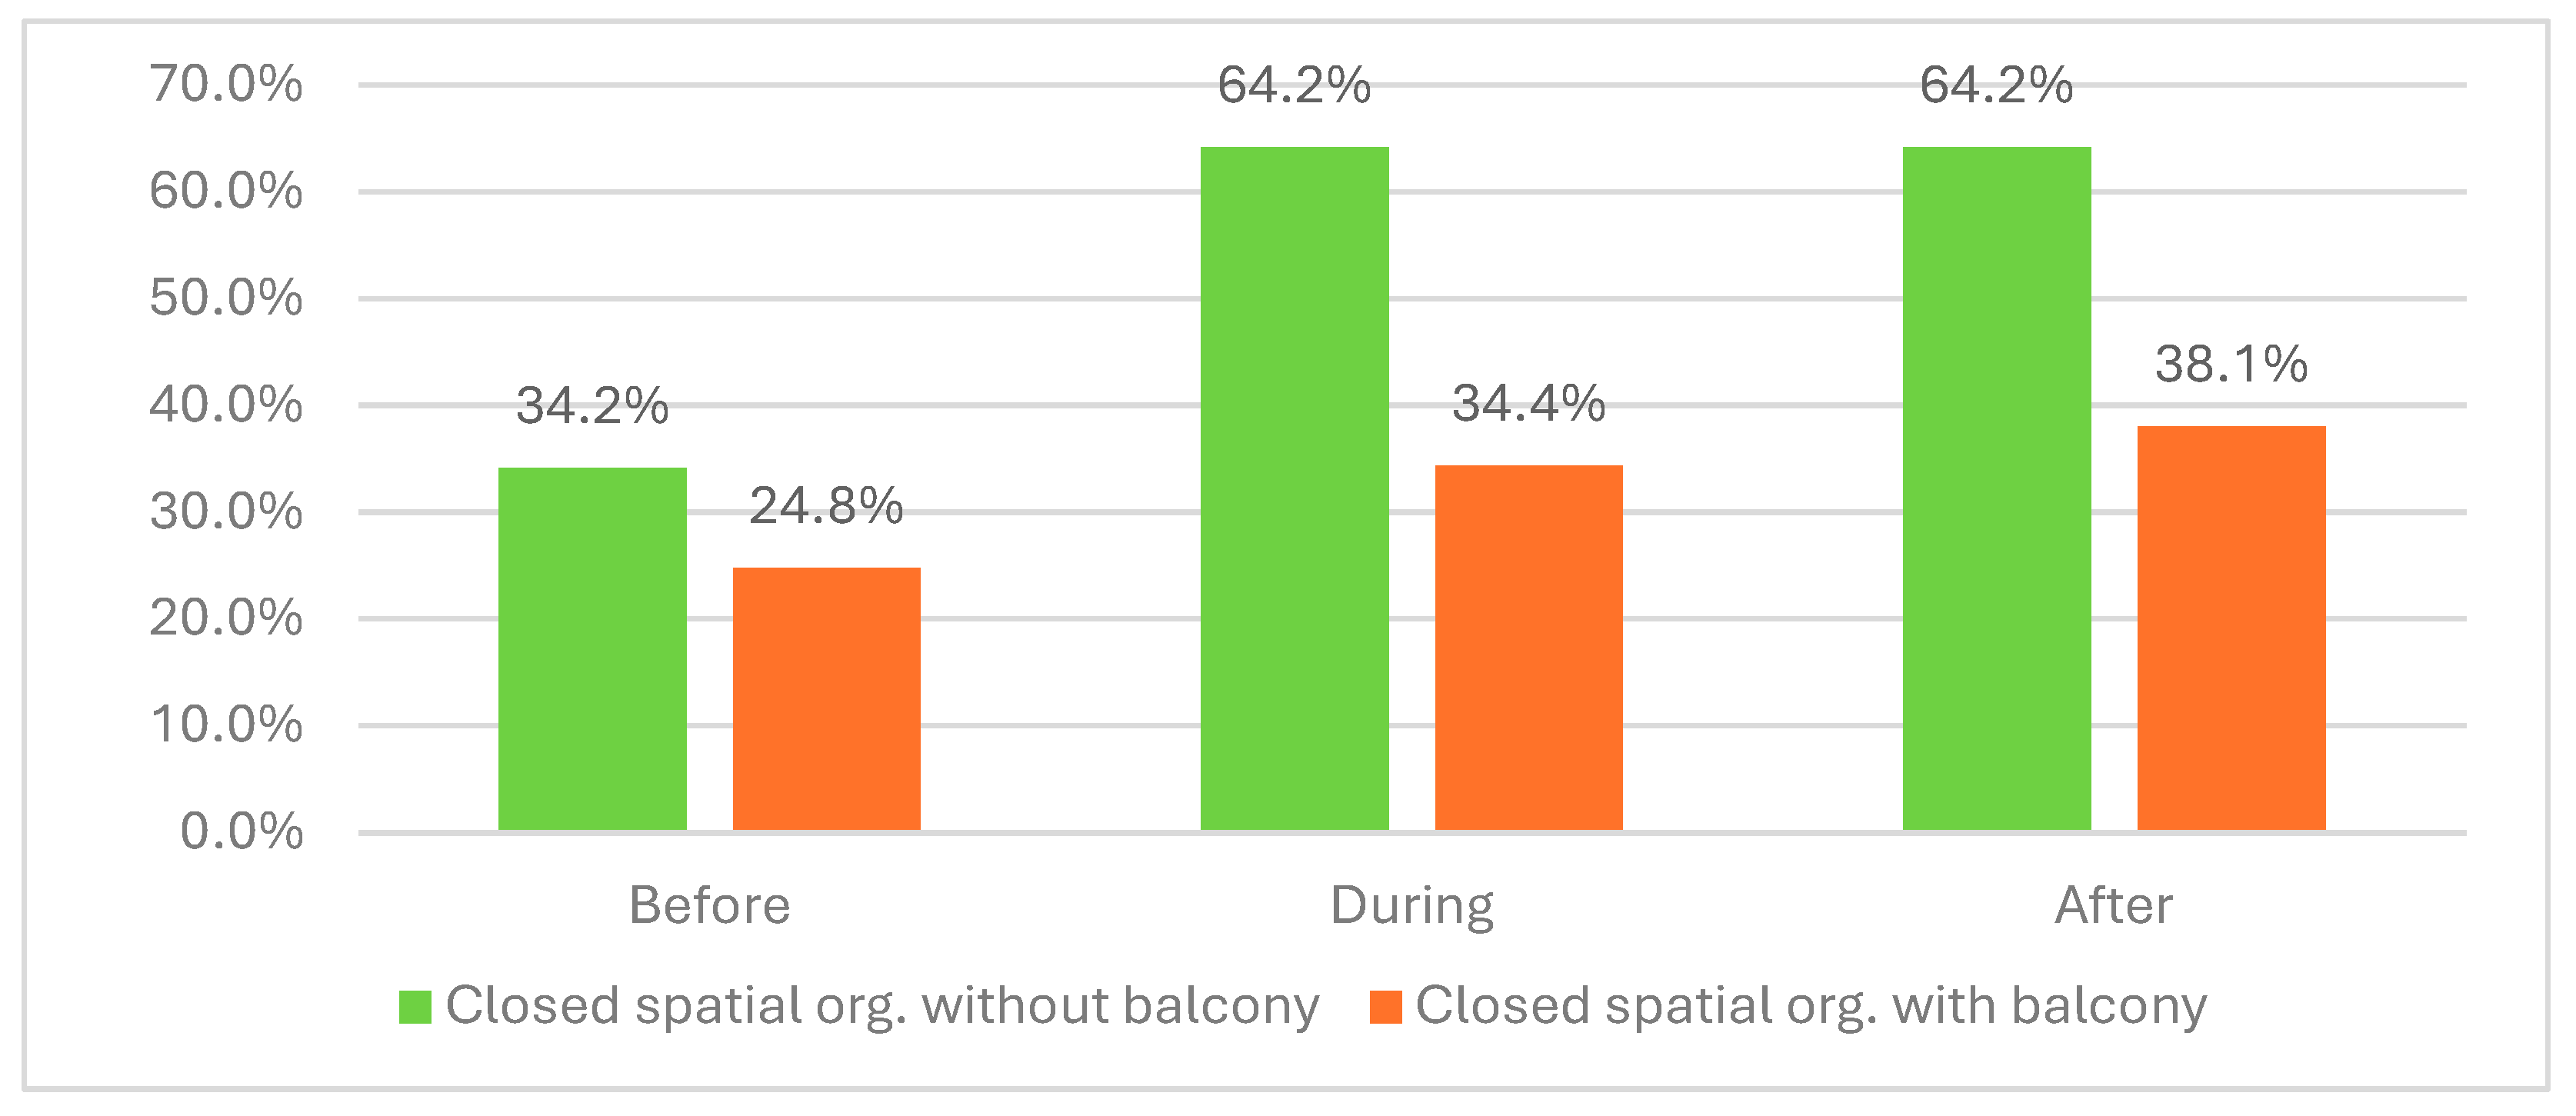
Figure 22.
Reasons for change in dissatisfaction in absence of balconies and closed organization.
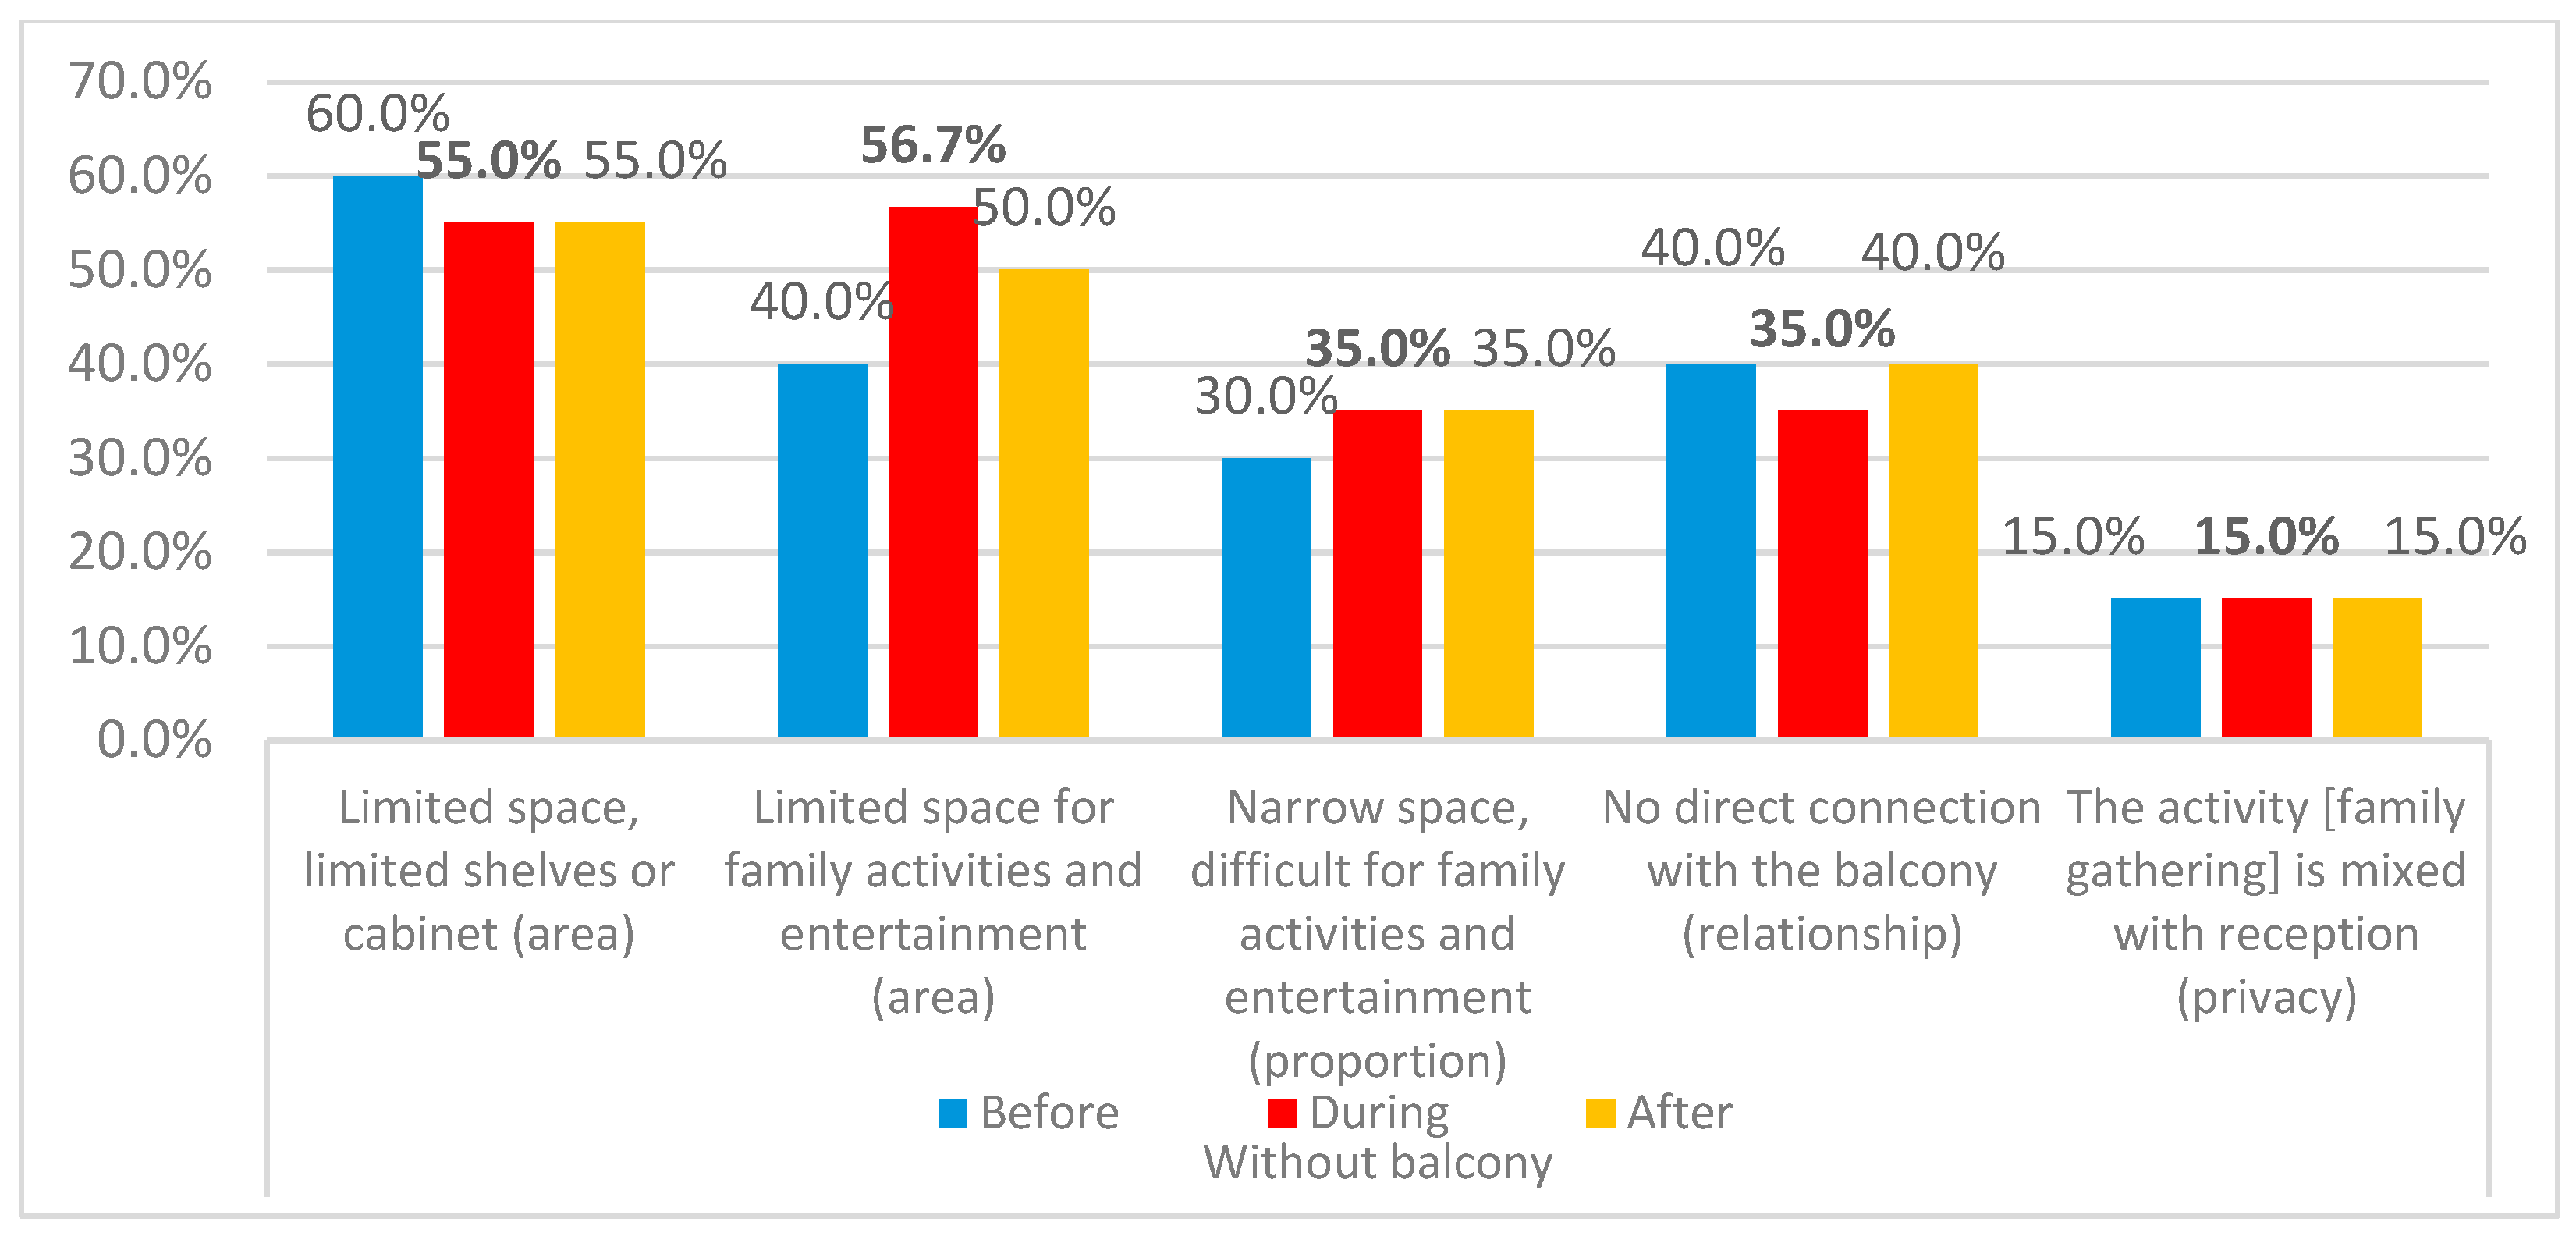
Figure 23.
Reasons for change in dissatisfaction in existence of balconies and closed organization.
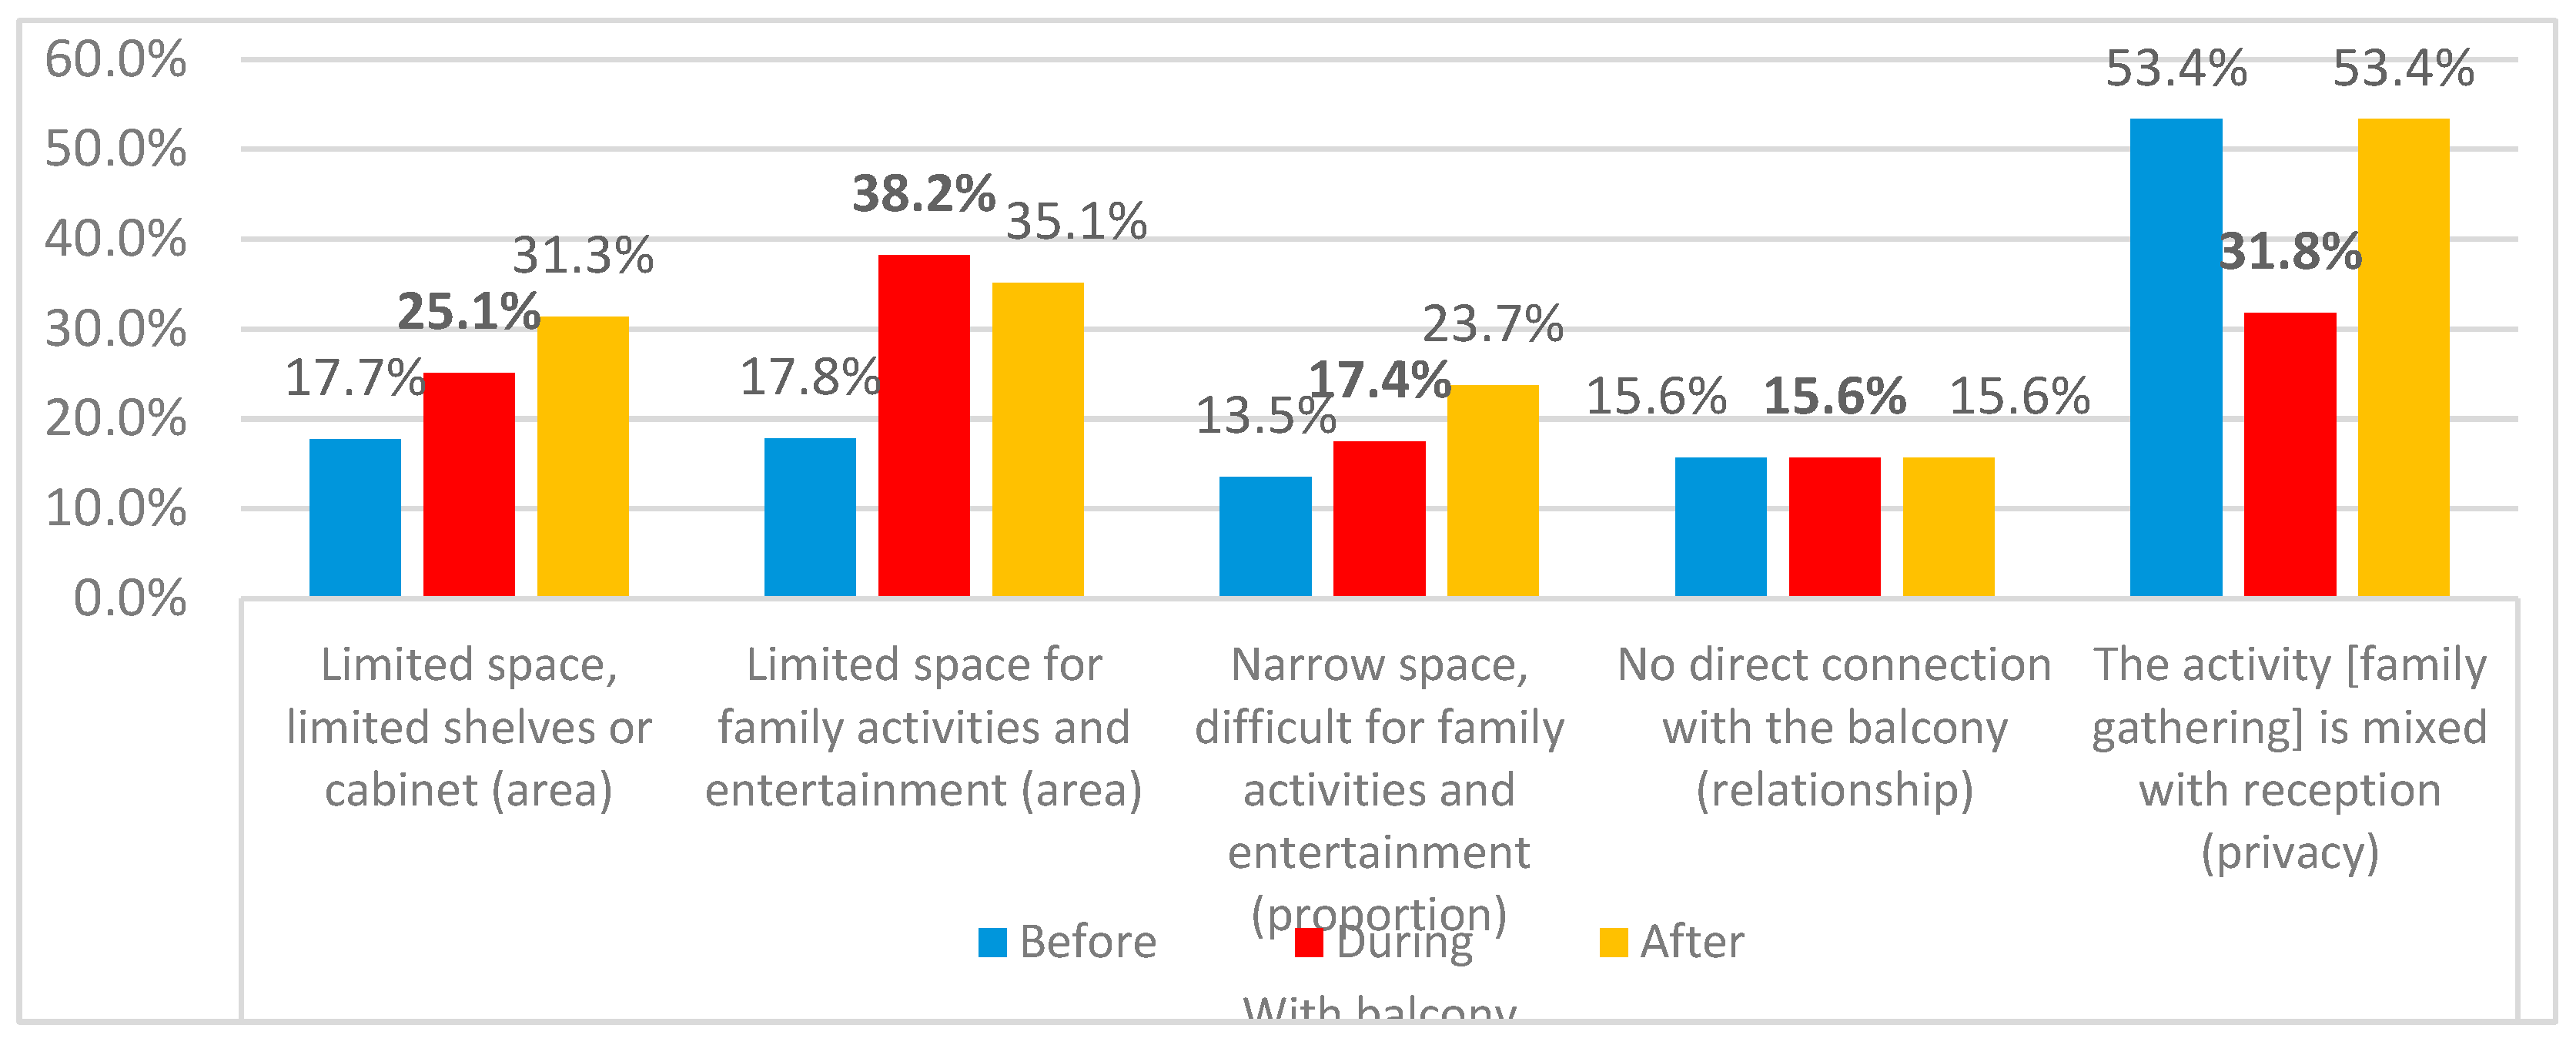
Figure 24.
Change in dissatisfaction due to combined effect of spatial organization and availability of living rooms’ balcony for open organization.
Figure 24.
Change in dissatisfaction due to combined effect of spatial organization and availability of living rooms’ balcony for open organization.
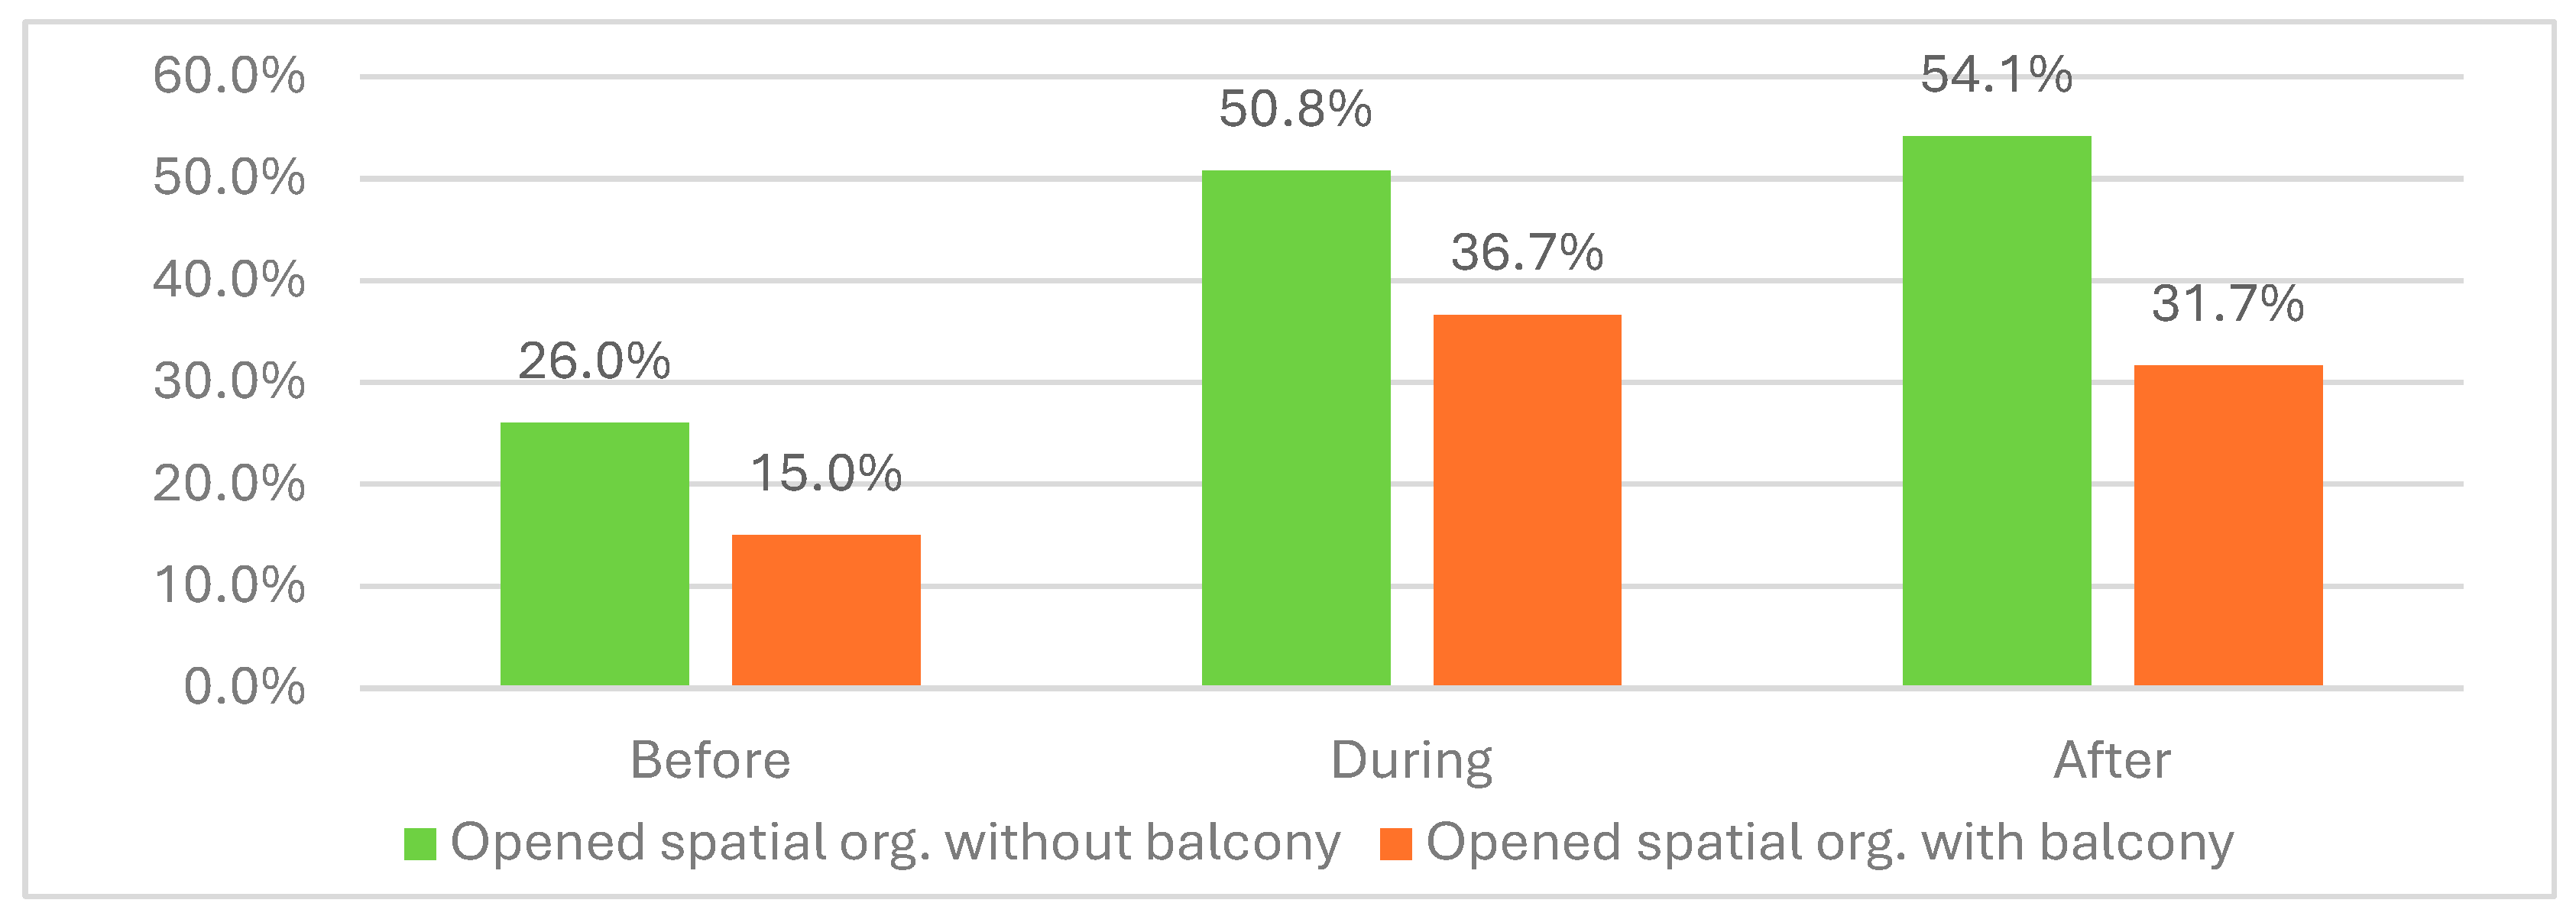
Figure 25.
Reasons for change in dissatisfaction due to absence of balconies and opened organization.
Figure 25.
Reasons for change in dissatisfaction due to absence of balconies and opened organization.

Figure 26.
Reasons for change in dissatisfaction due to absence of balconies and opened spatial organization.
Figure 26.
Reasons for change in dissatisfaction due to absence of balconies and opened spatial organization.

Figure 27.
Dissatisfaction regarding the reception activities and needs.
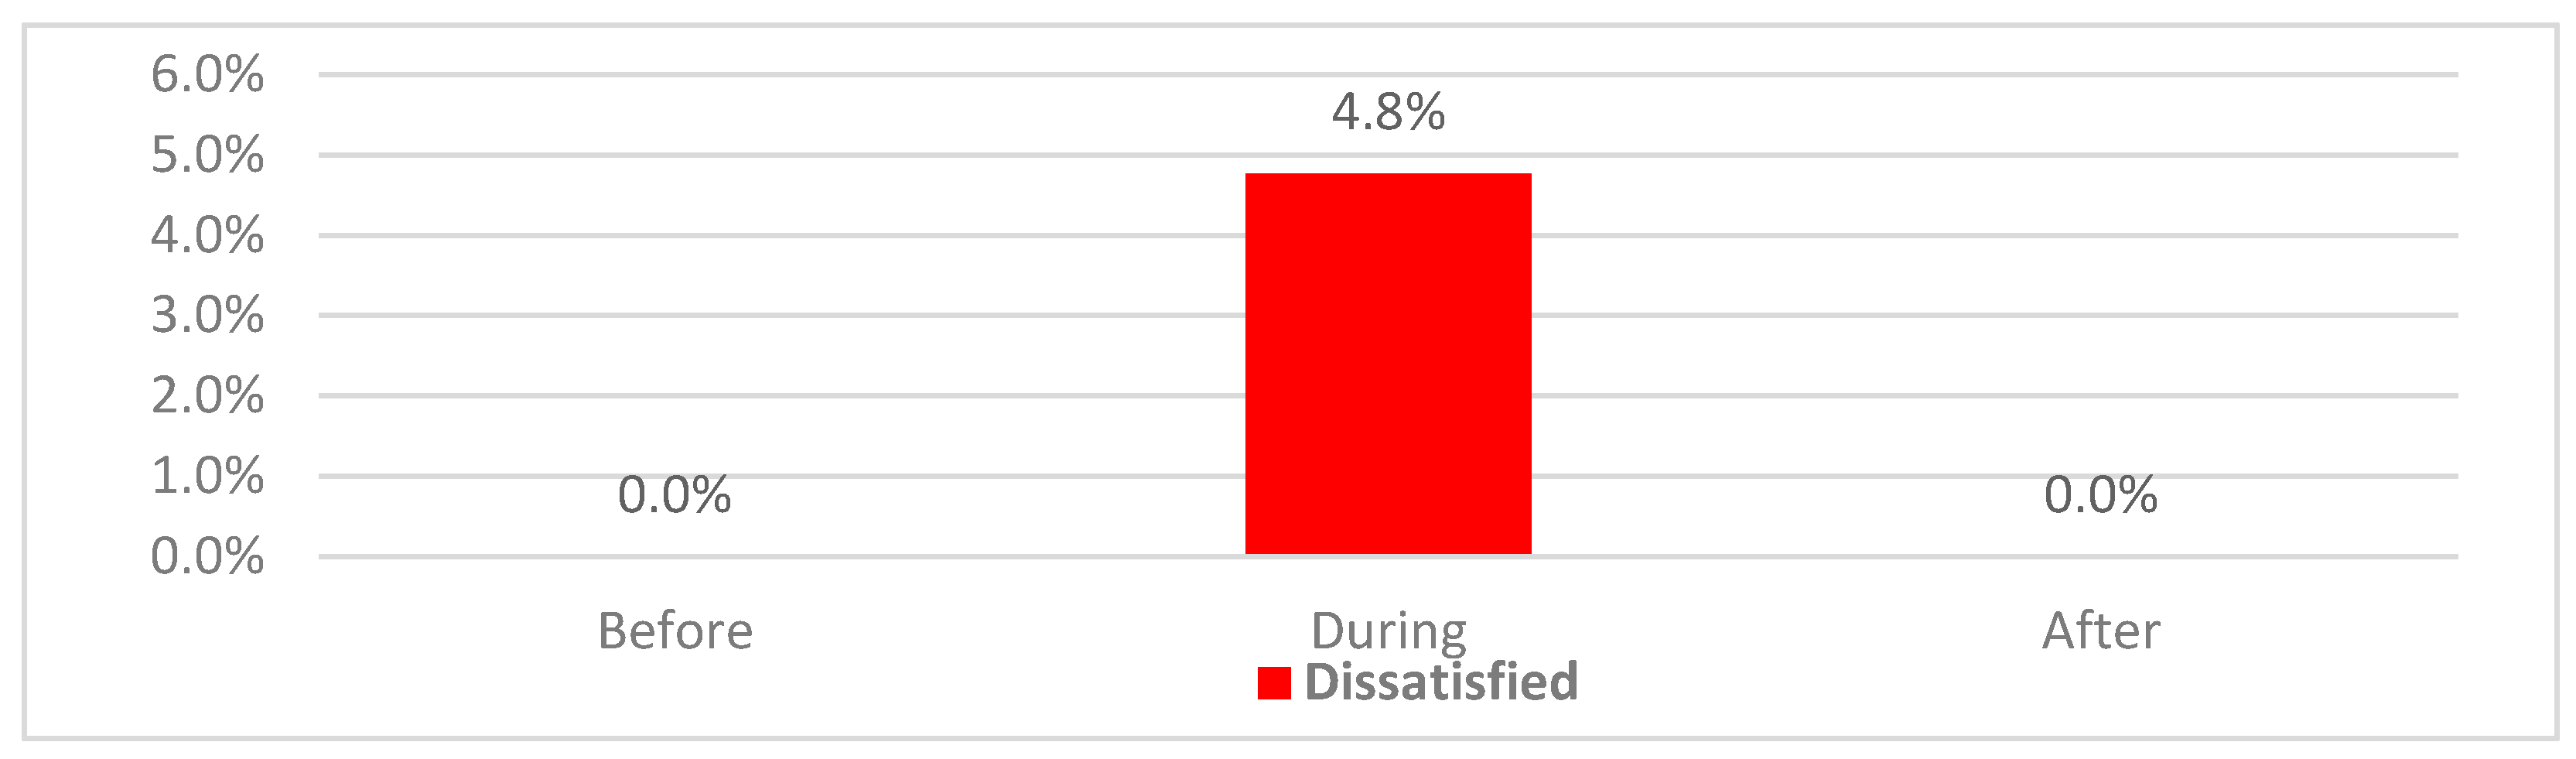
Figure 28.
Main reasons for Changes in residents’ dissatisfaction of reception rooms.
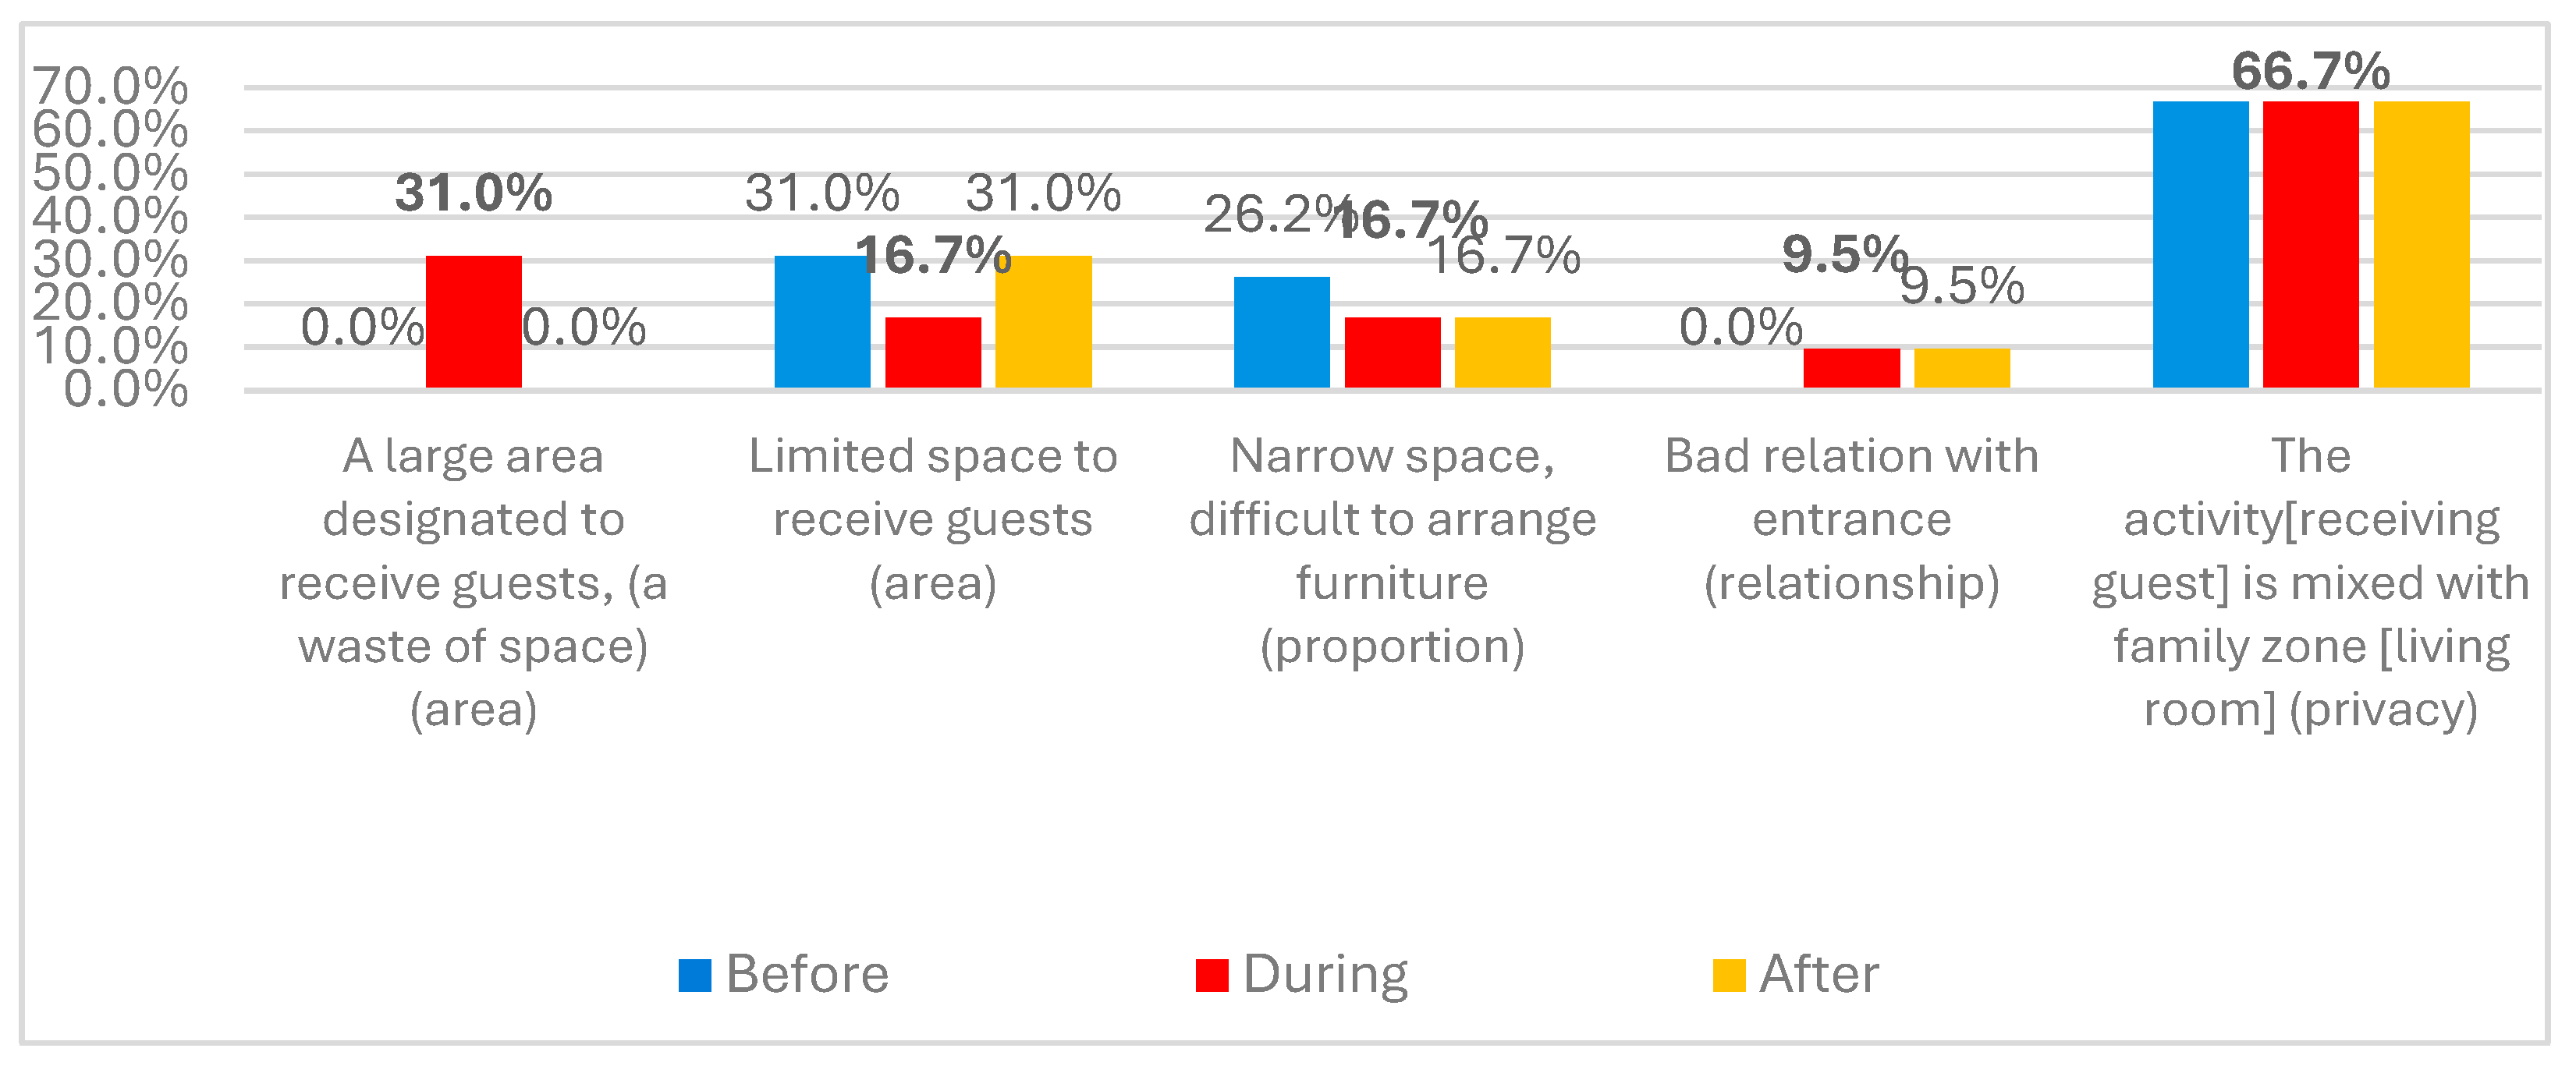
Figure 29.
Change in dissatisfaction percentage of dining activity during the three stages.
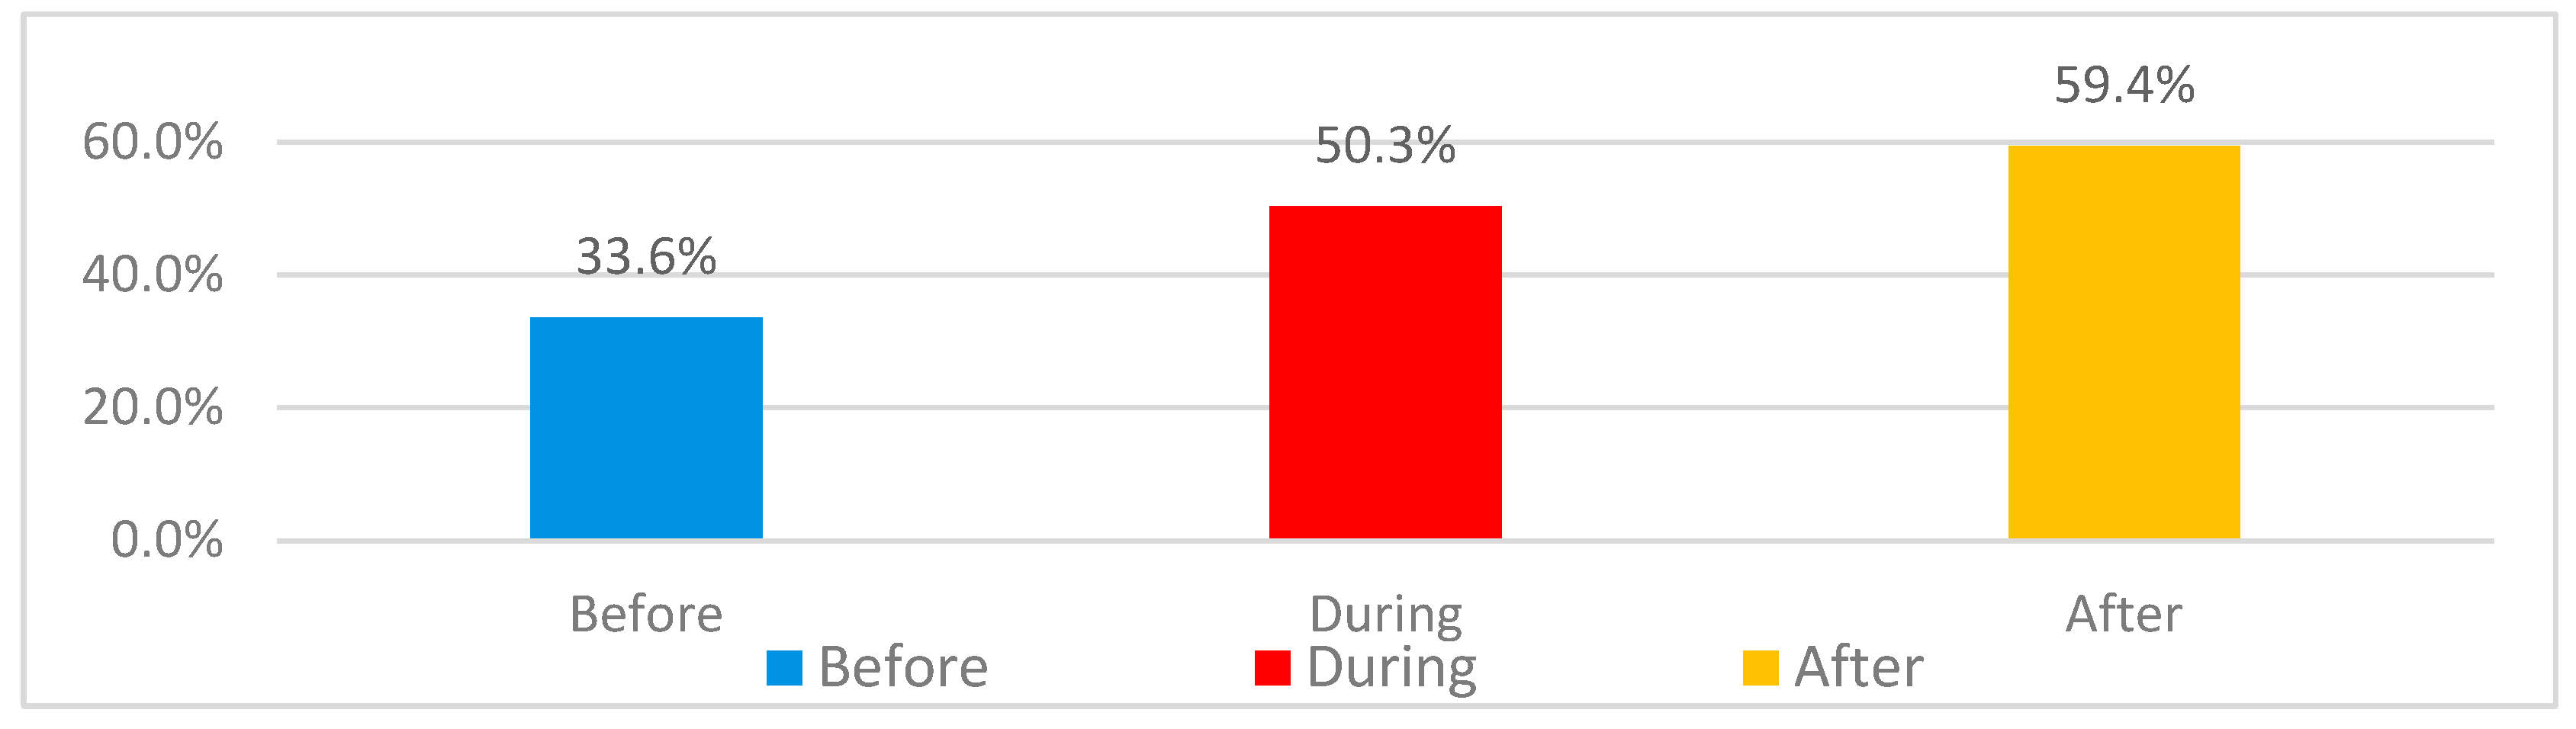
Figure 30.
Main reasons for Changes in residents’ dissatisfaction of family dining space.
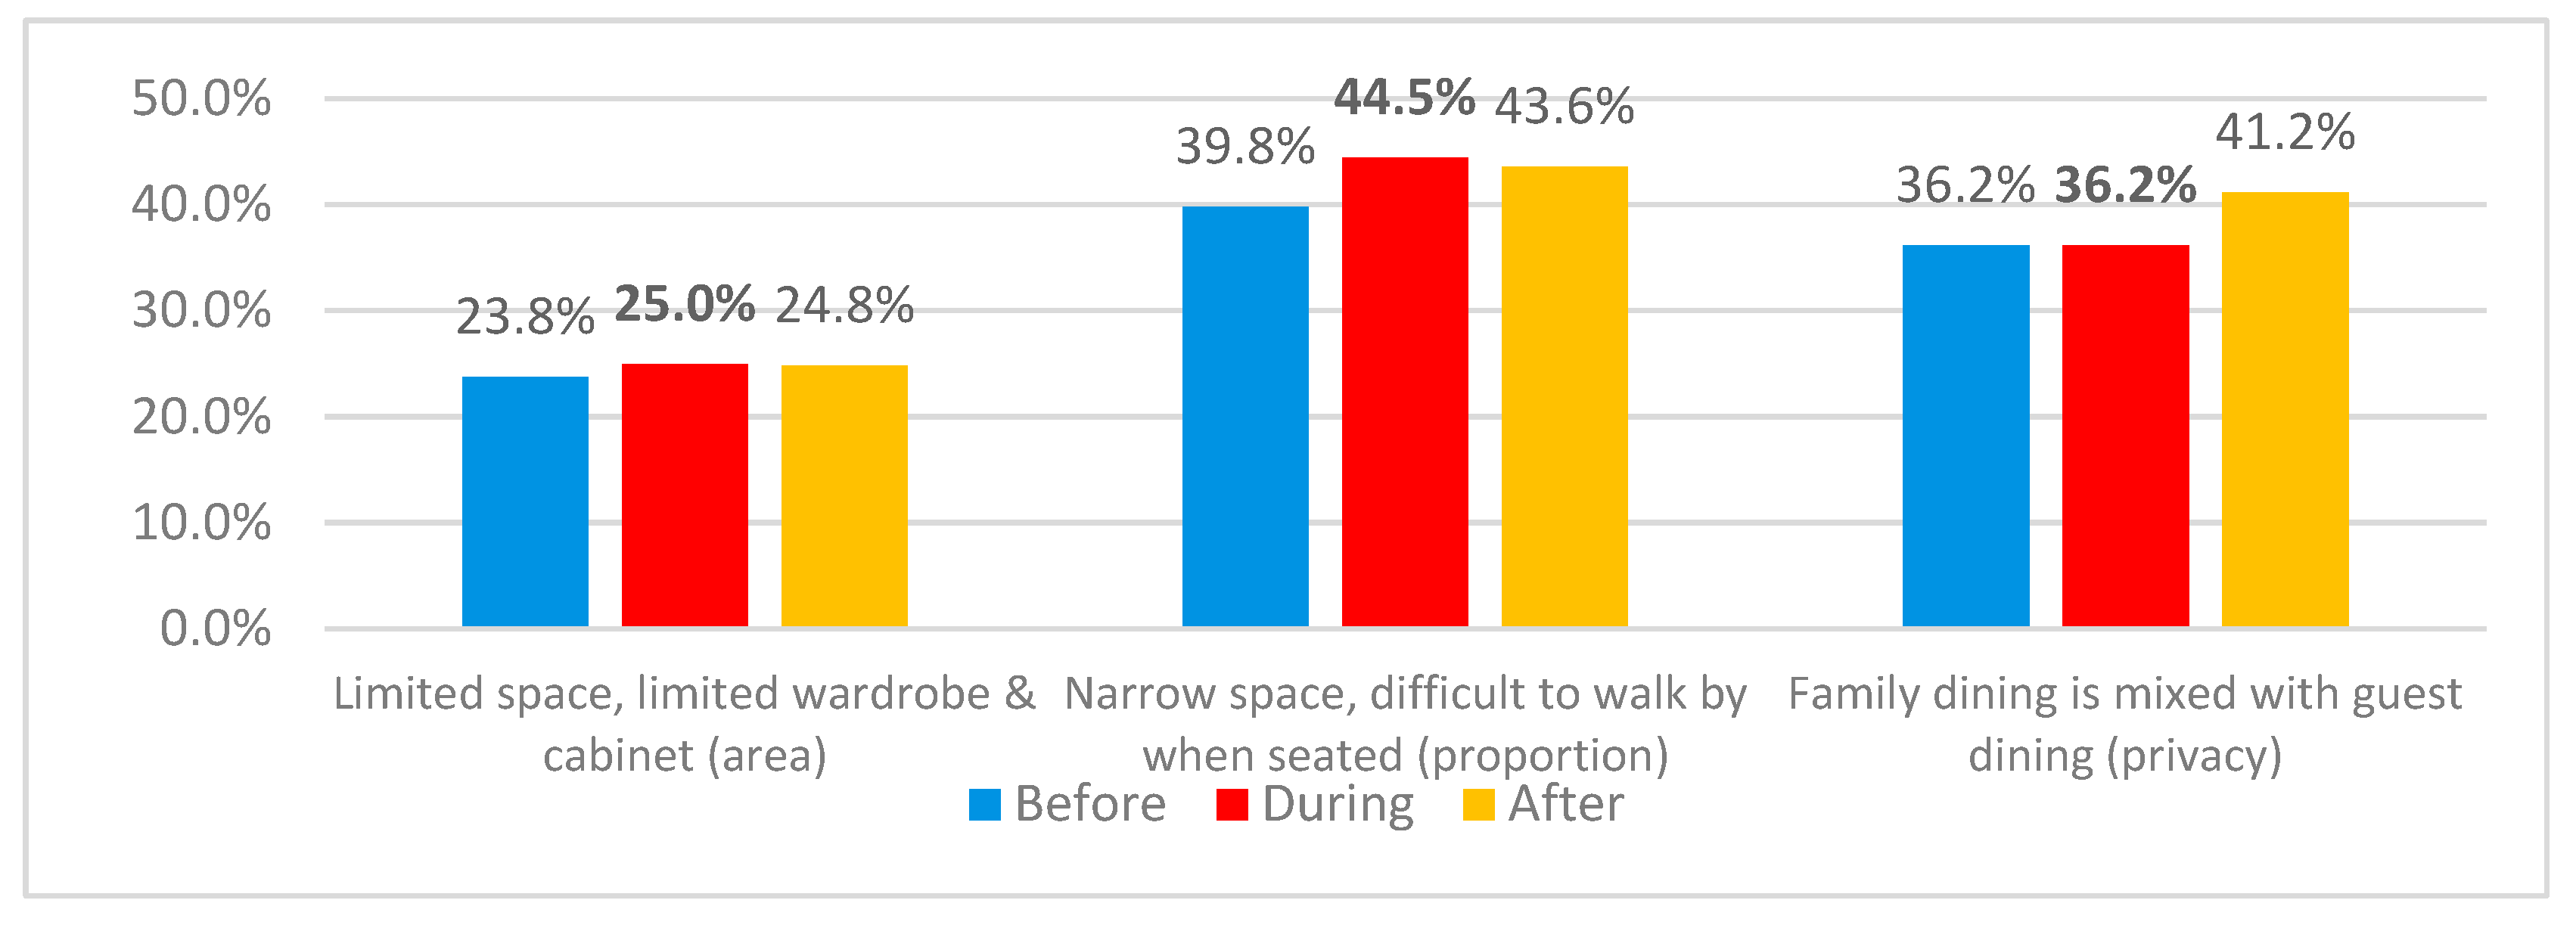
Figure 31.
Dissatisfaction differences for family dining between 2+1 and 3+1 categories.
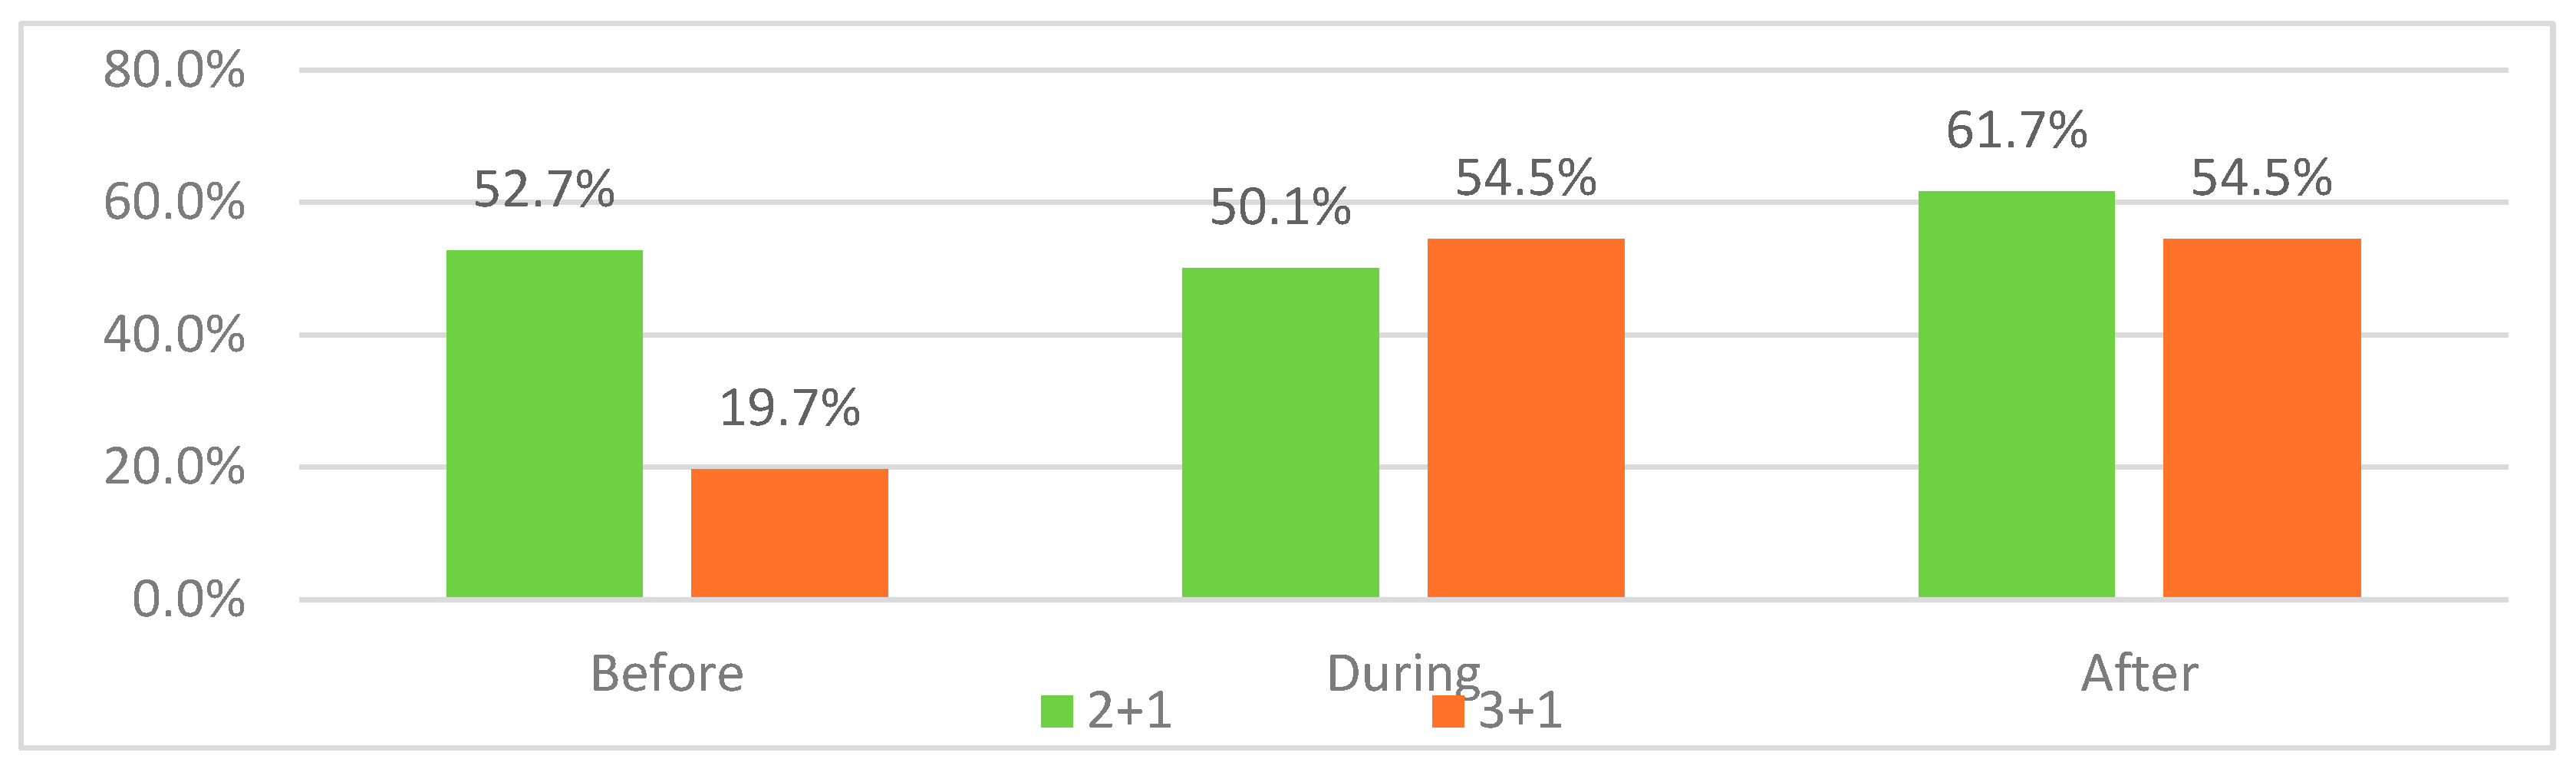
Figure 32.
Reasons for changes in residents’ dissatisfaction of family dining space in both categories.
Figure 32.
Reasons for changes in residents’ dissatisfaction of family dining space in both categories.
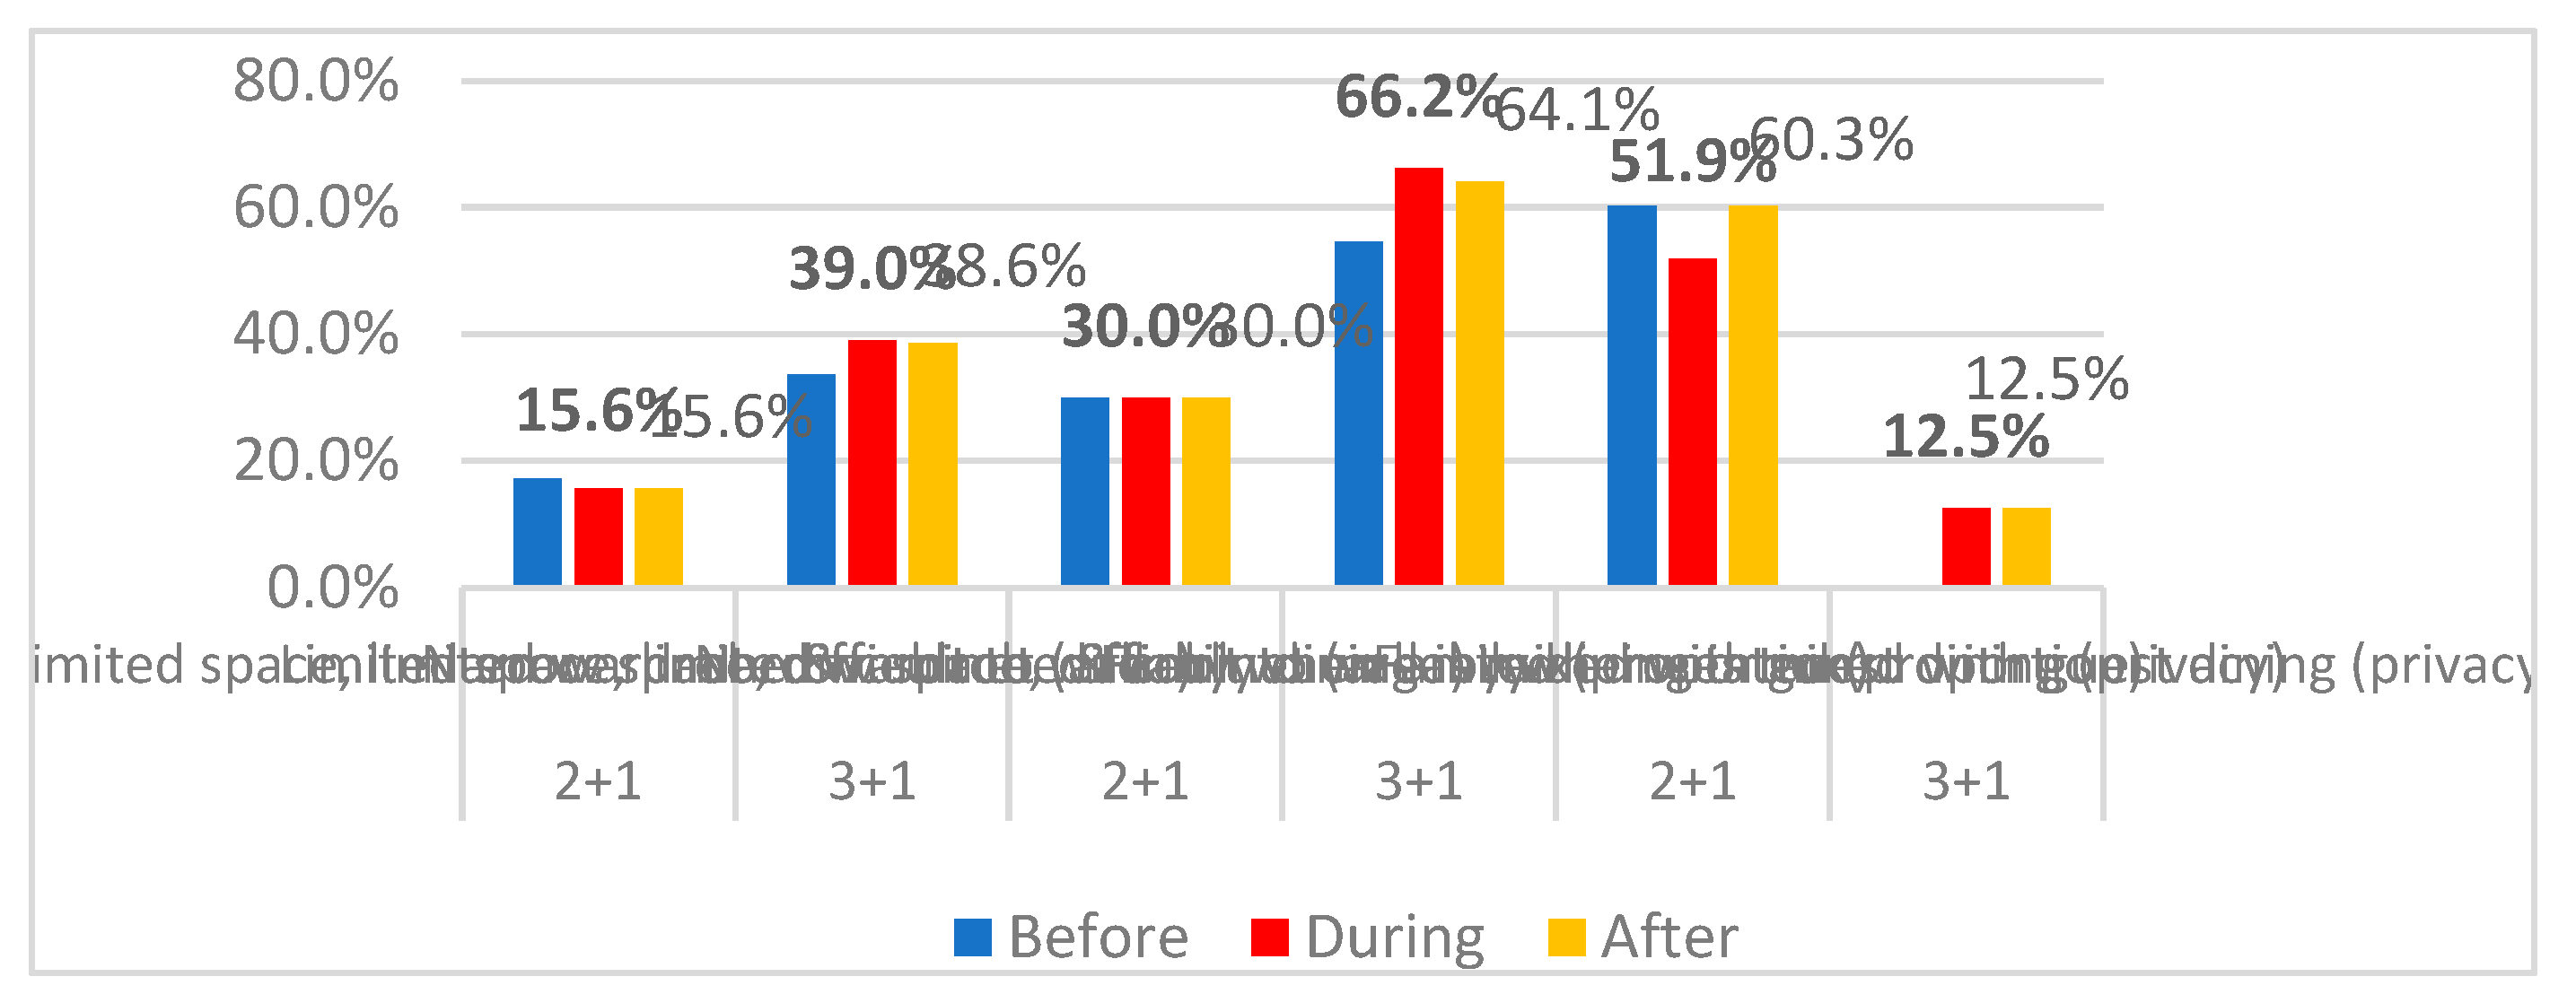
Figure 33.
Dissatisfaction of conditions of single or double family dining.
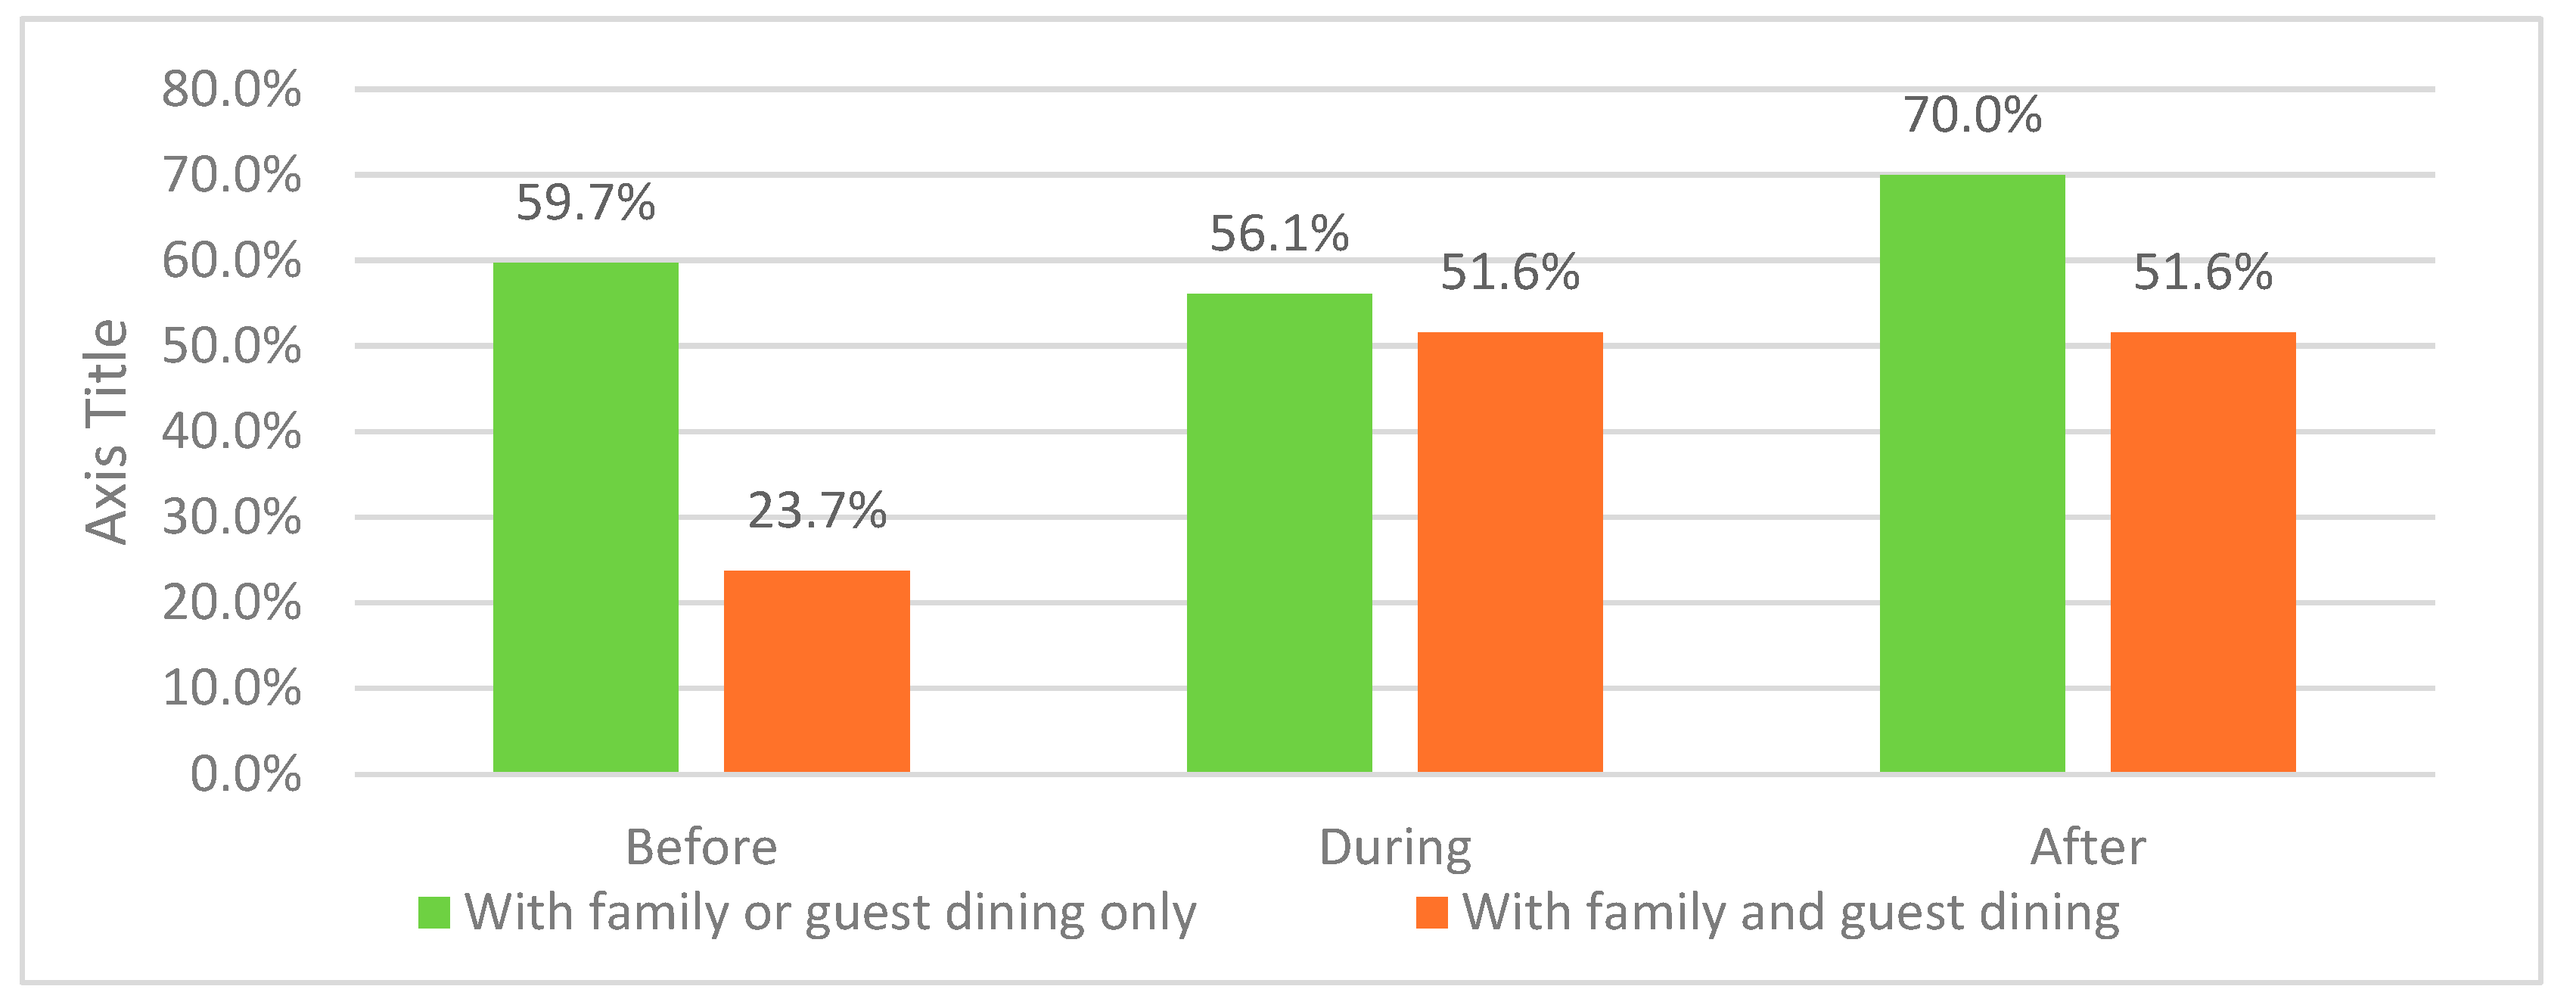
Figure 34.
Main reasons for Changes in residents’ dissatisfaction of family dining space between family dining and guest dining.
Figure 34.
Main reasons for Changes in residents’ dissatisfaction of family dining space between family dining and guest dining.
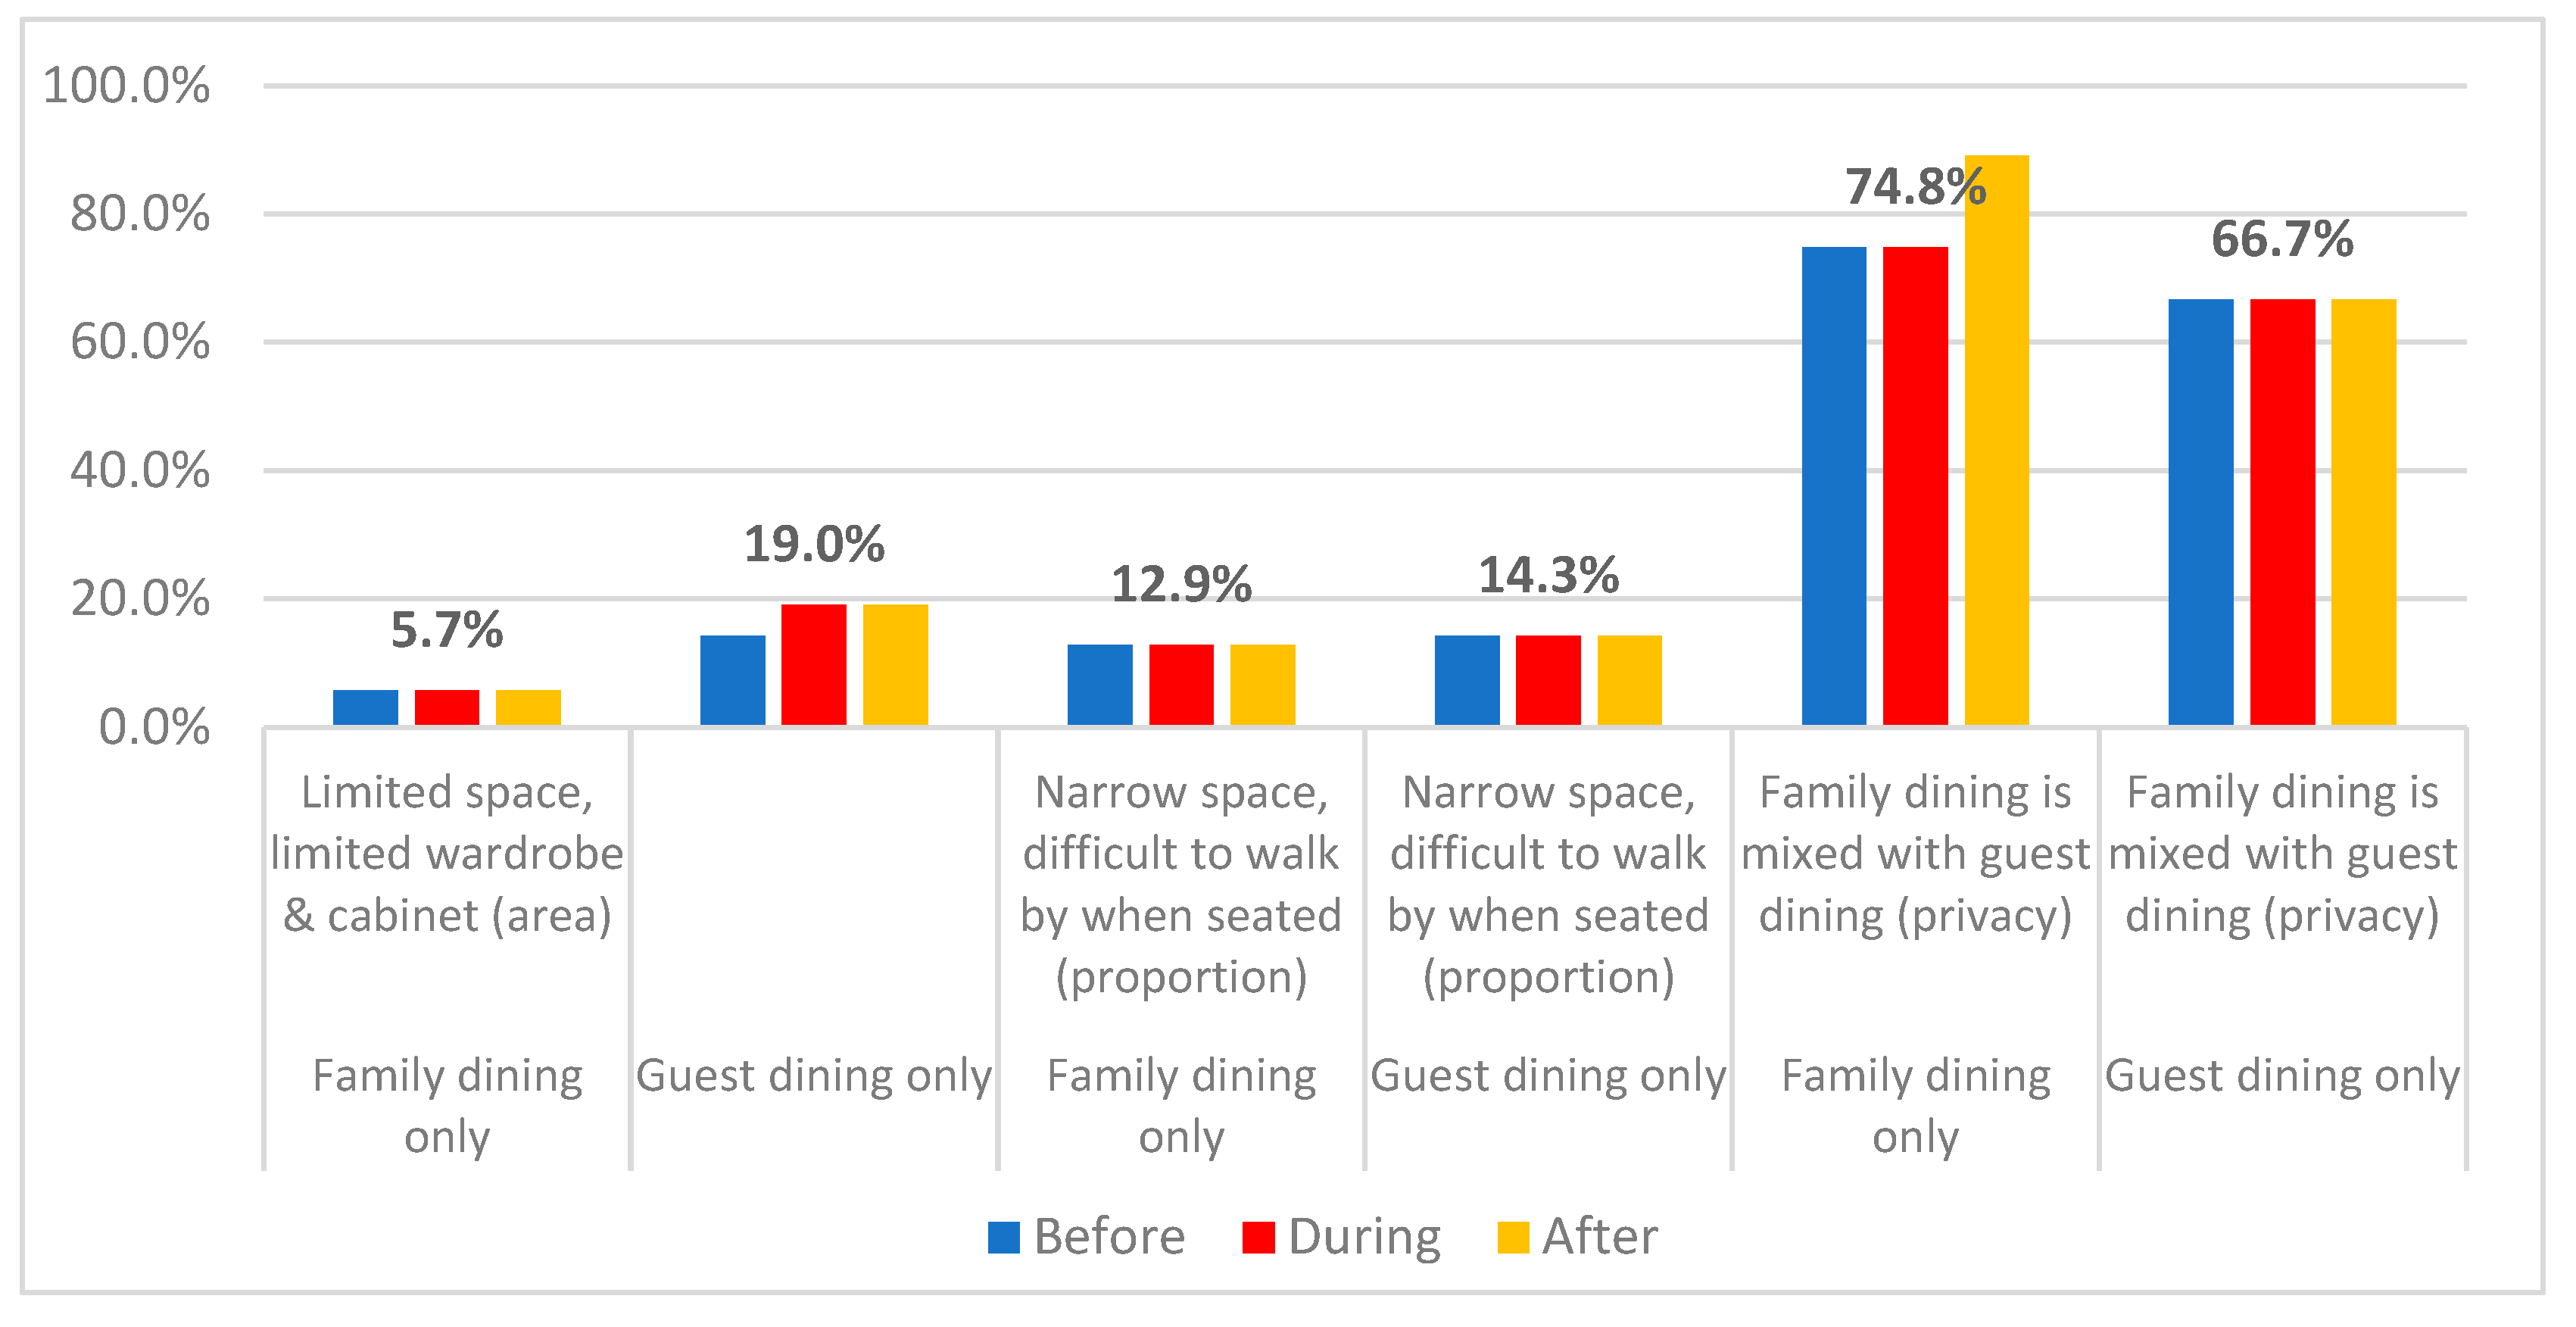
Figure 35.
Dissatisfaction differences for master bedrooms for 2+1 and 3+1 category.
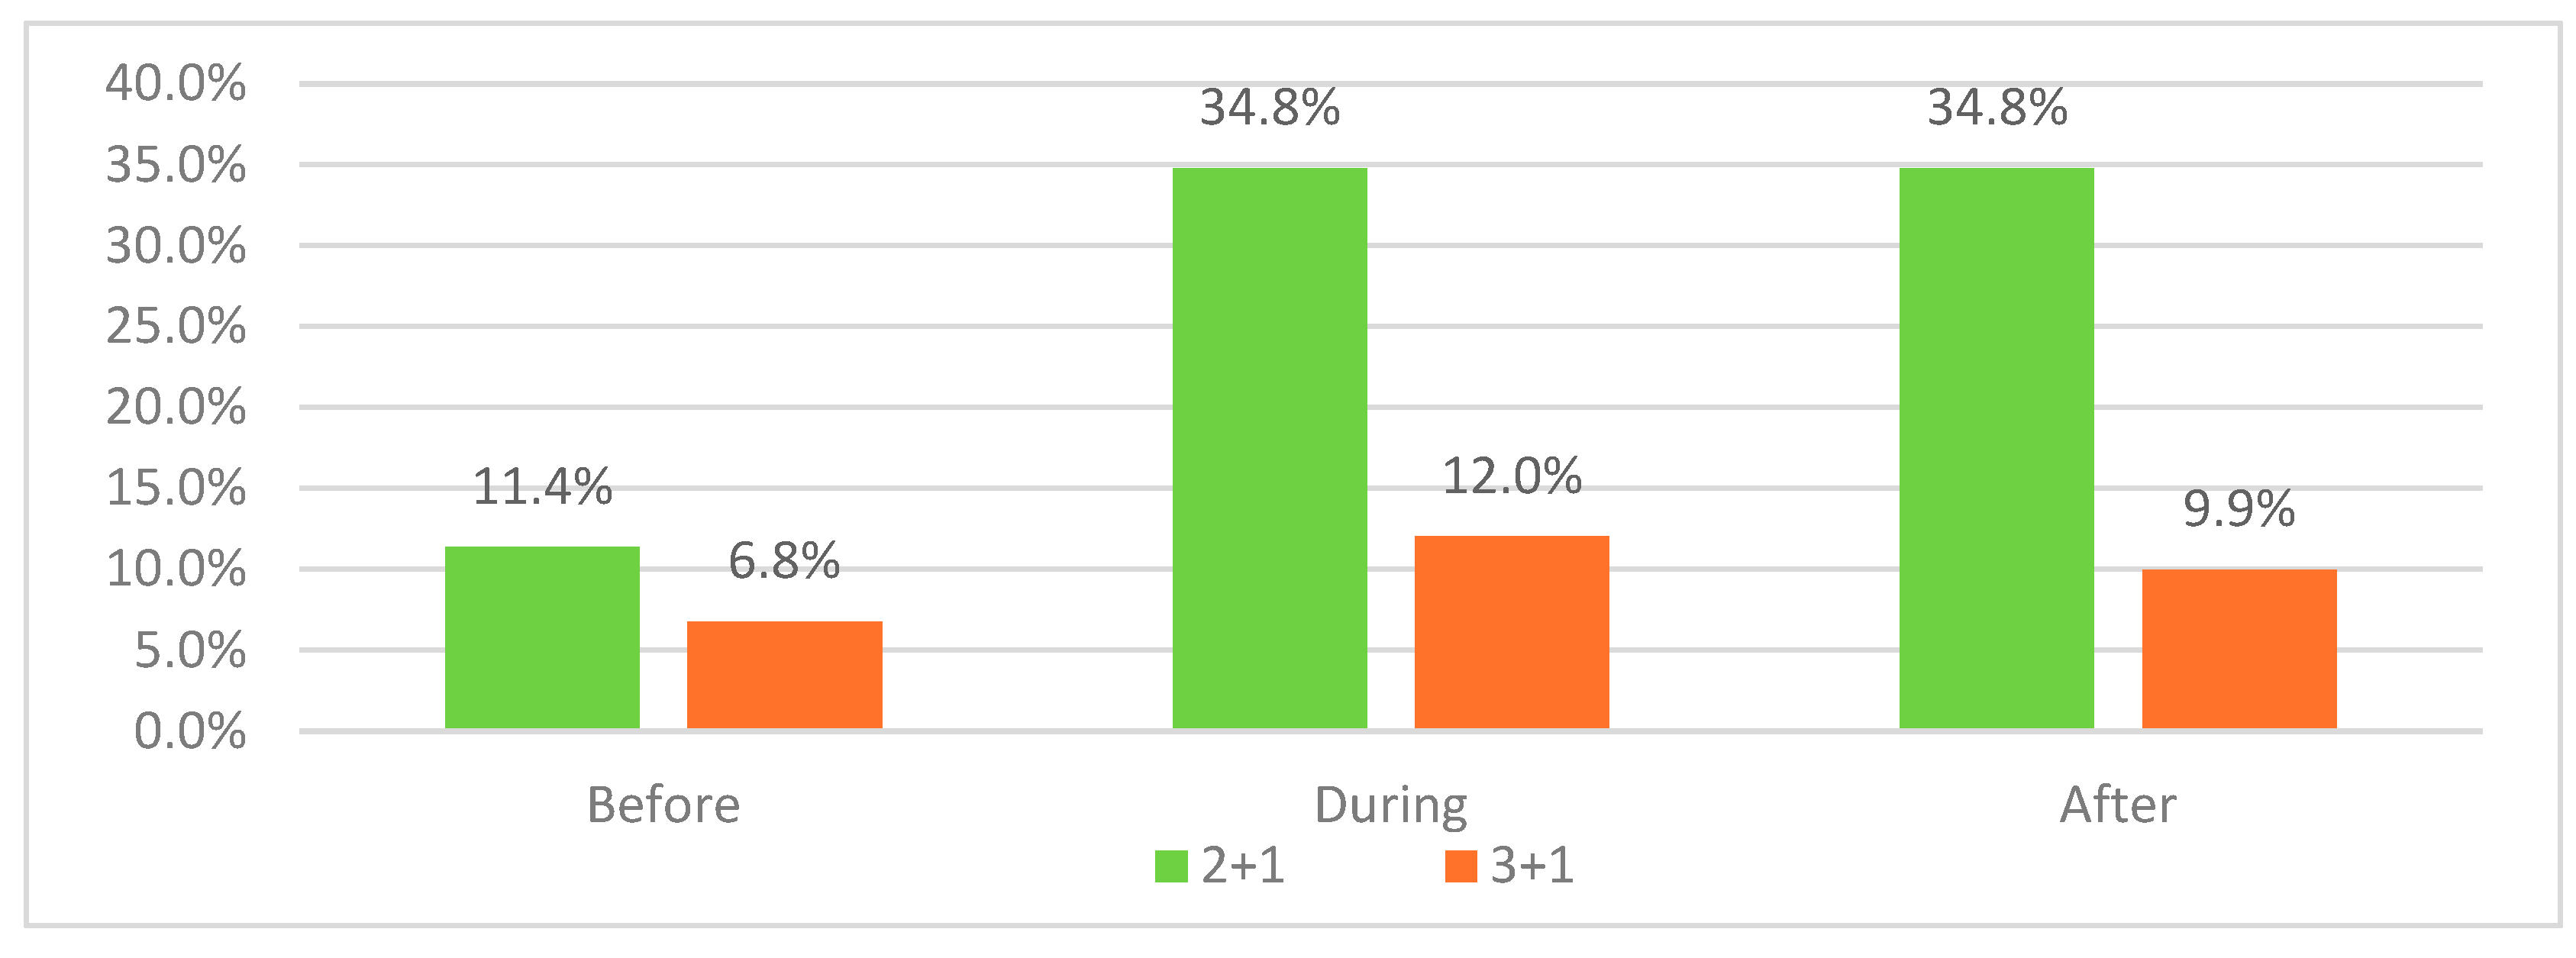
Figure 36.
Dissatisfaction of only master bedrooms containing bathrooms for 2+1 and 3+1 category.
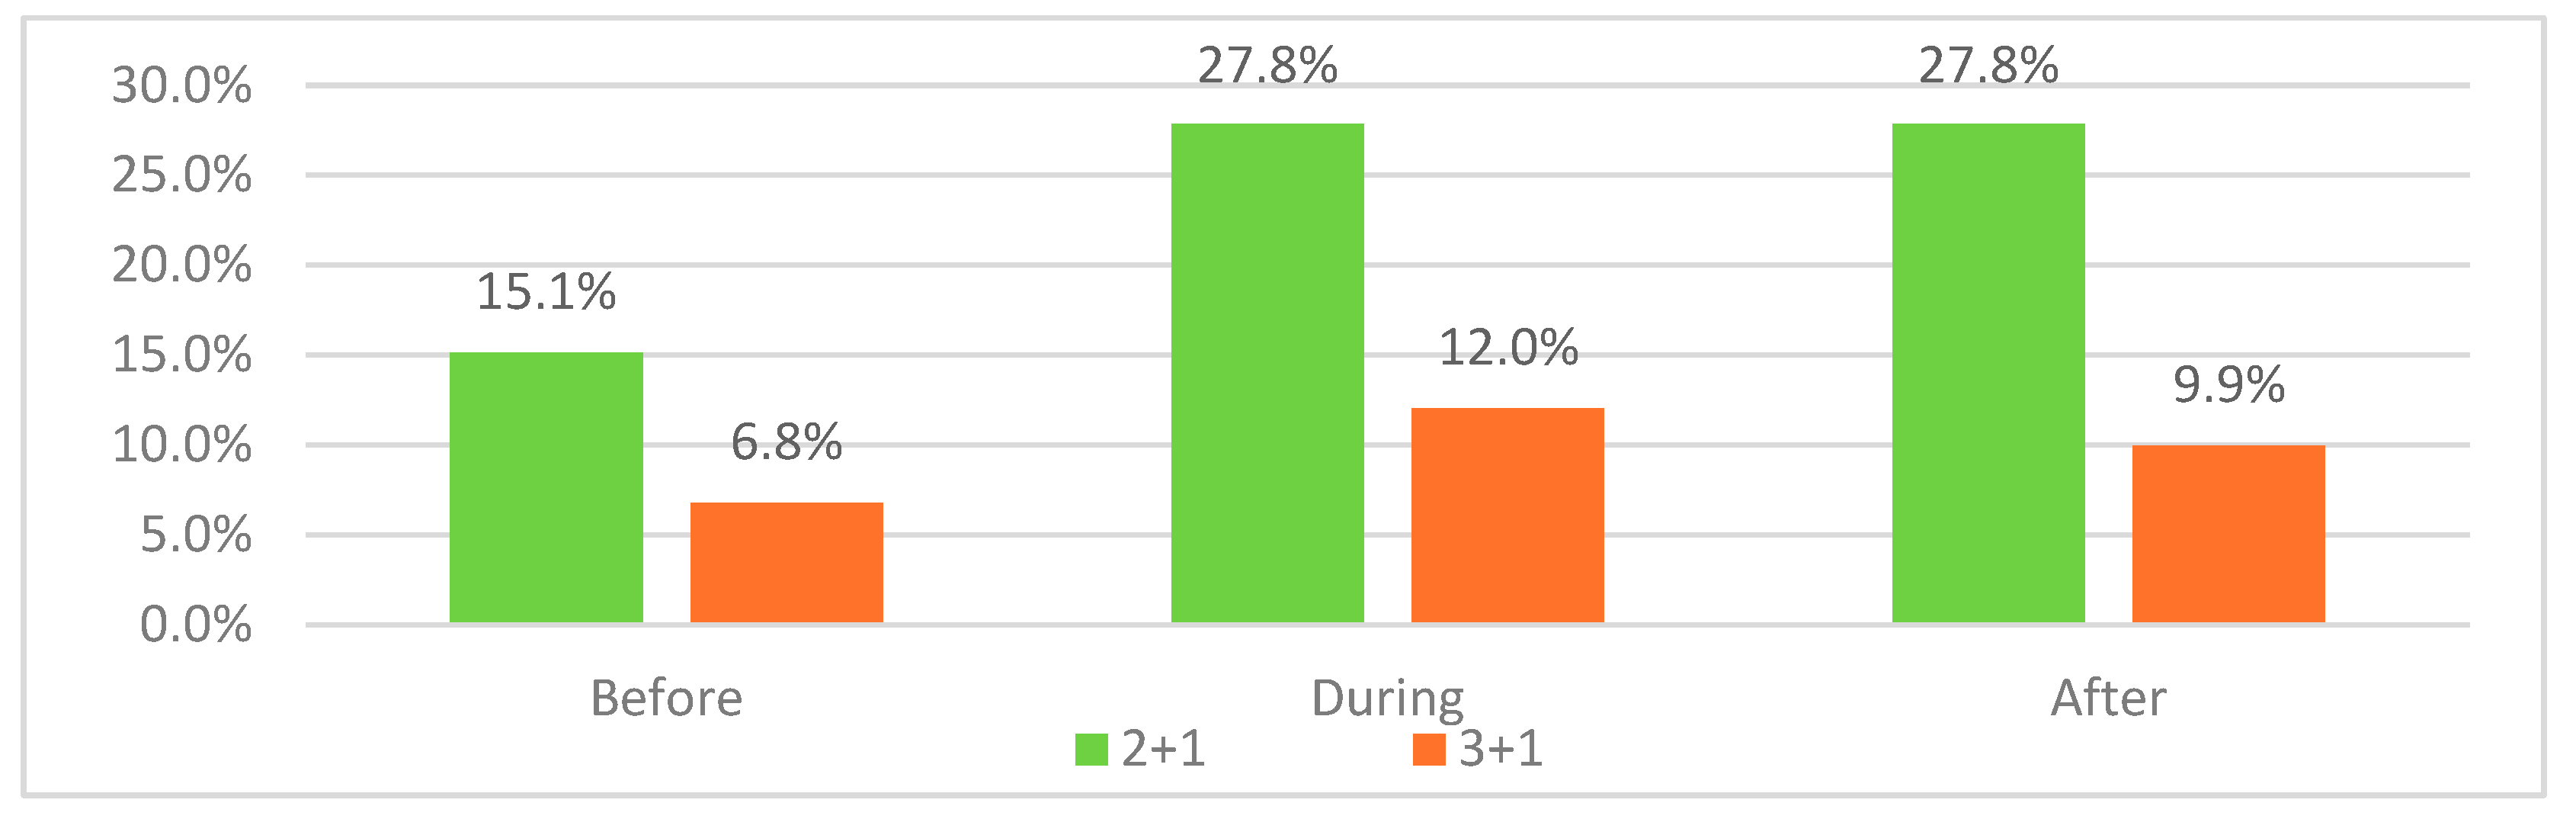
Figure 37.
main reasons for dissatisfaction differences for only master bedrooms containing bathrooms for 2+1 and 3+1 category.
Figure 37.
main reasons for dissatisfaction differences for only master bedrooms containing bathrooms for 2+1 and 3+1 category.
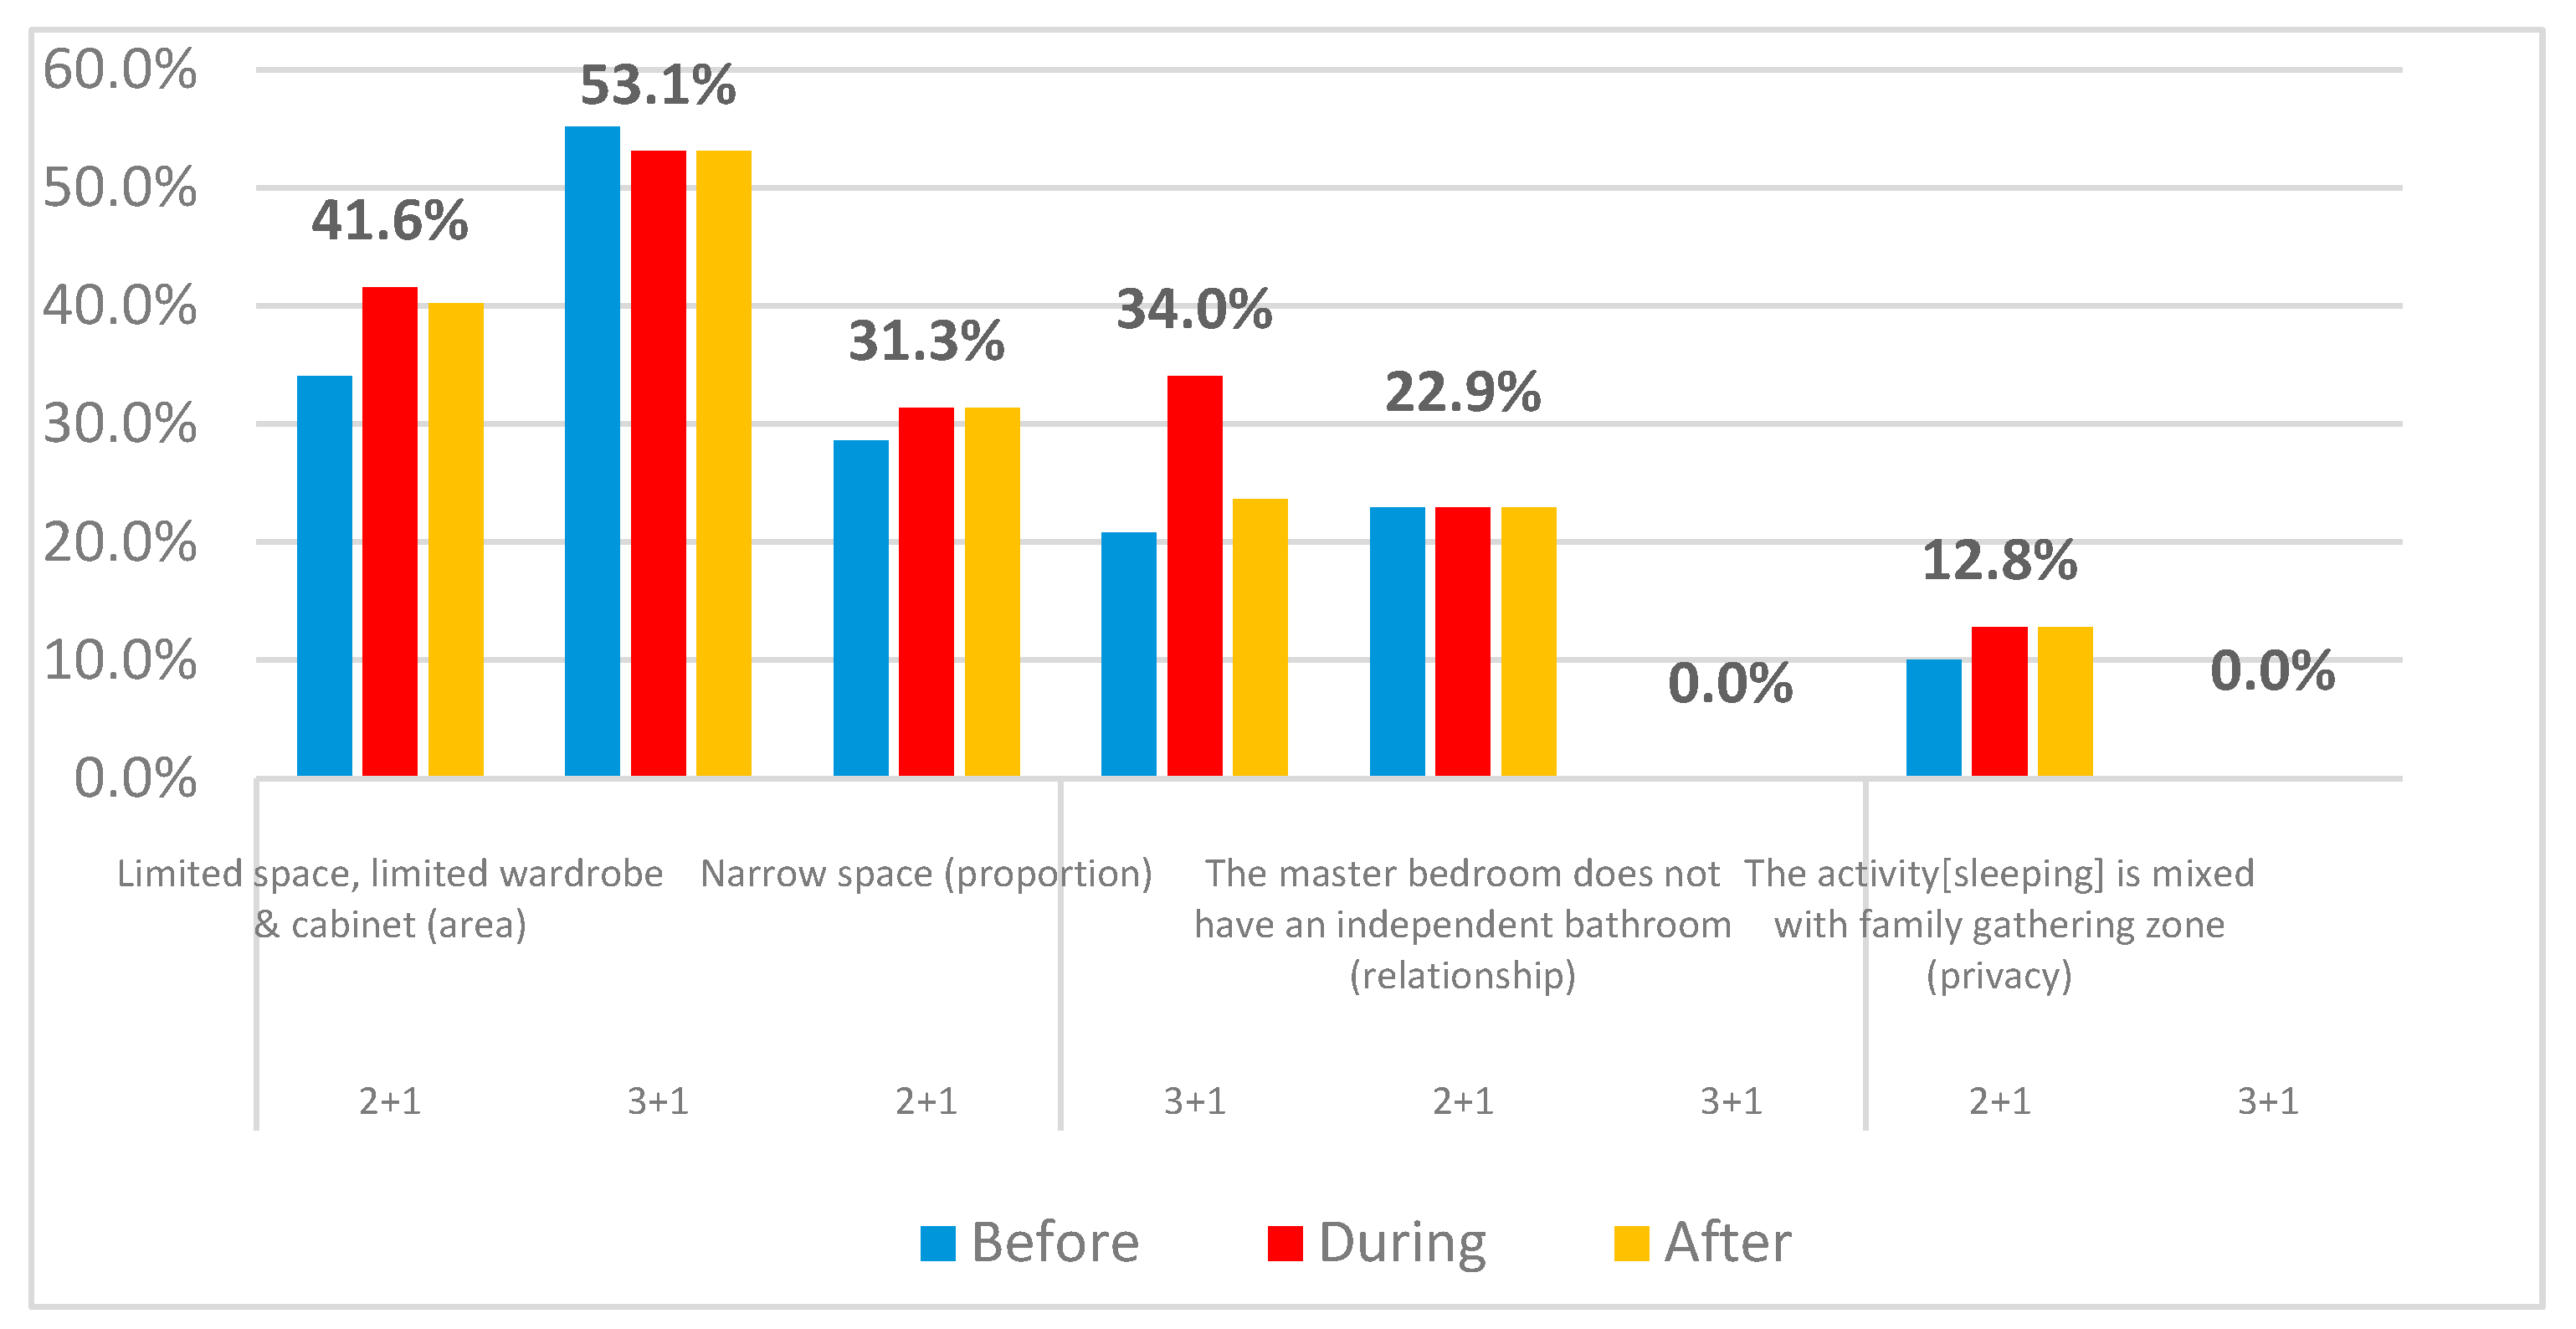
Figure 38.
Dissatisfaction differences for master bedrooms containing or missing bathrooms.
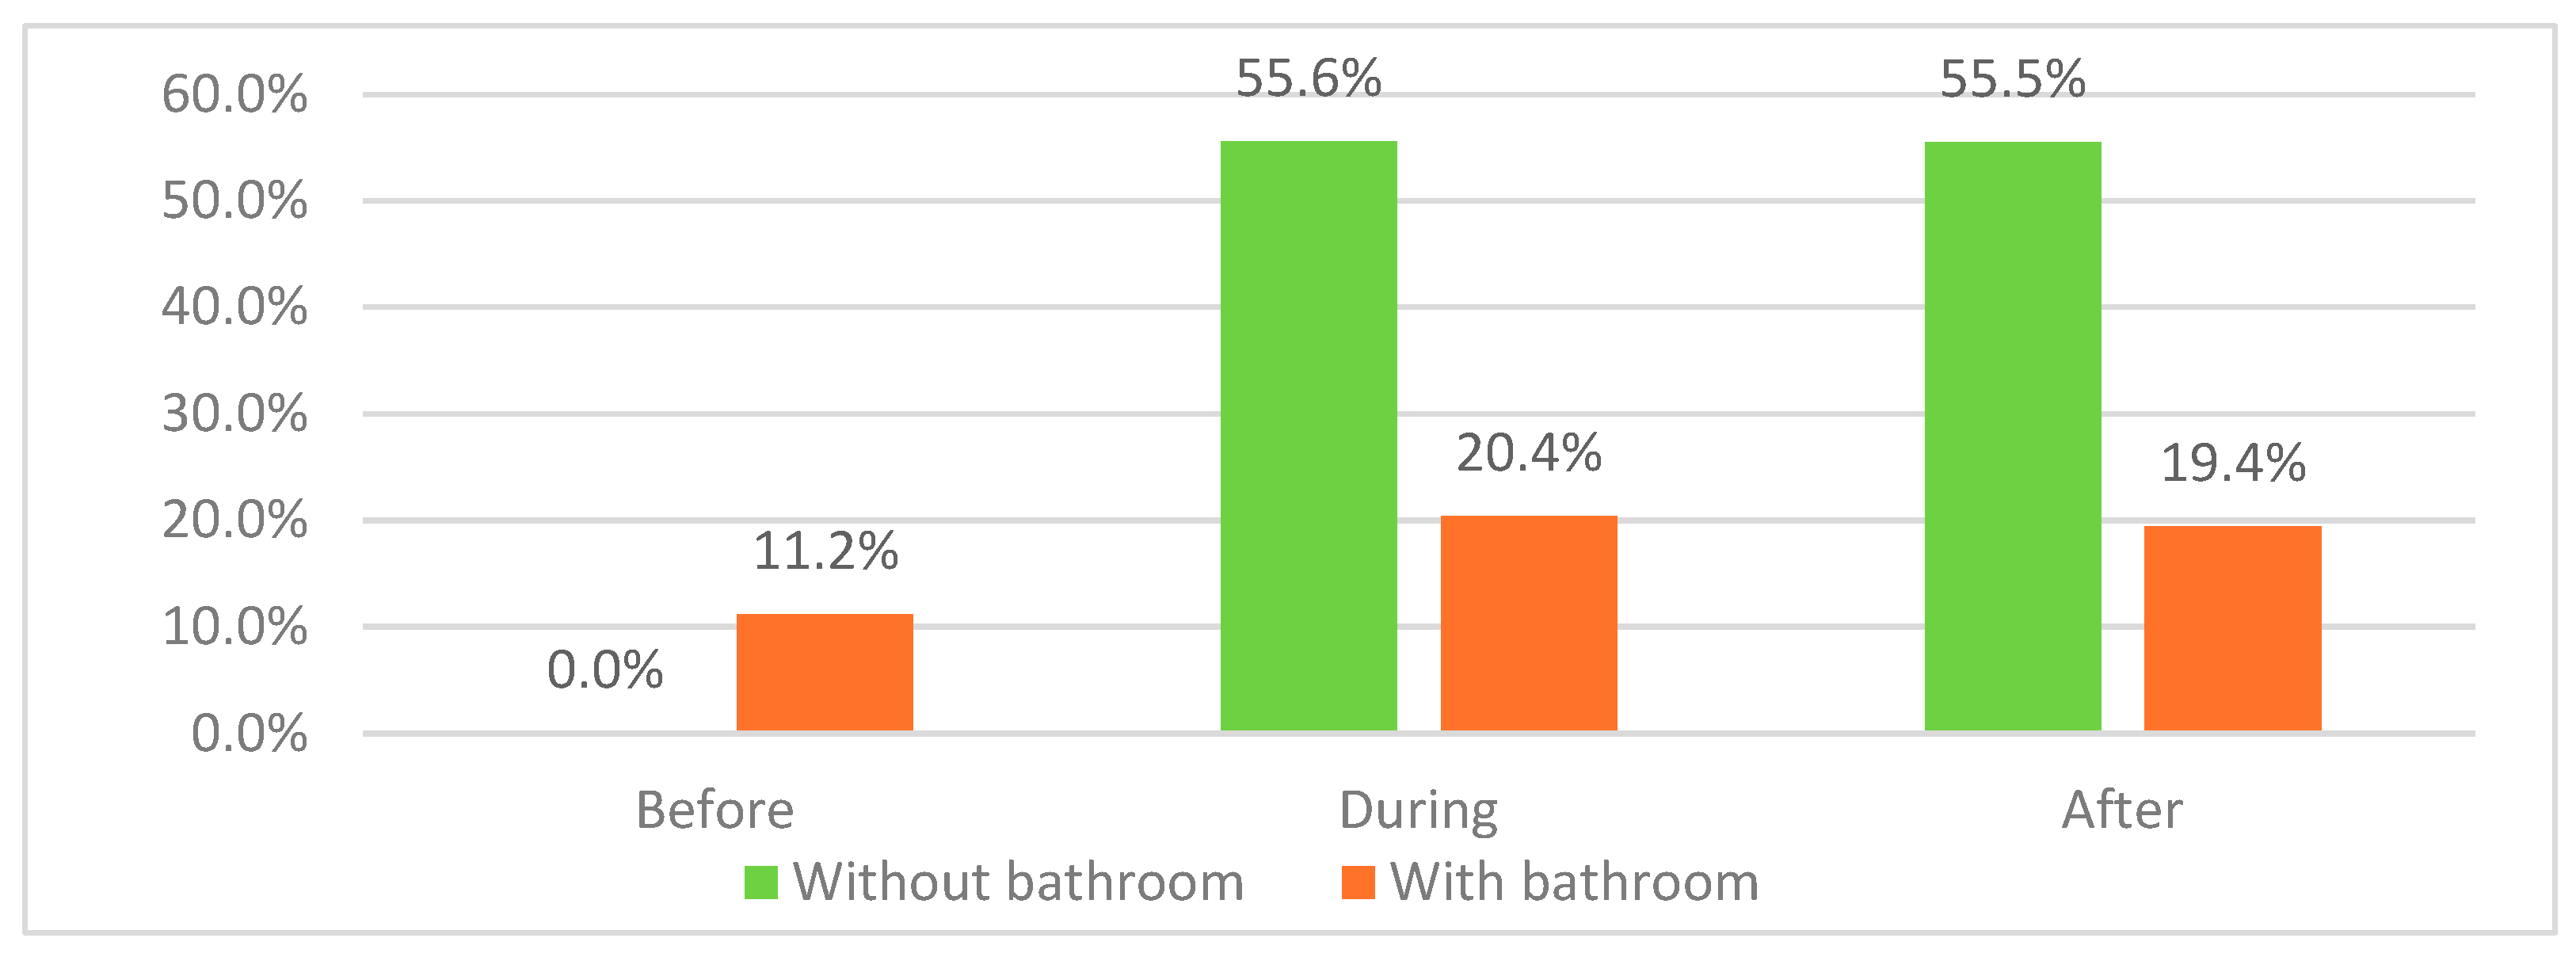
Figure 39.
Dissatisfaction differences of master bedrooms with or without balcony.
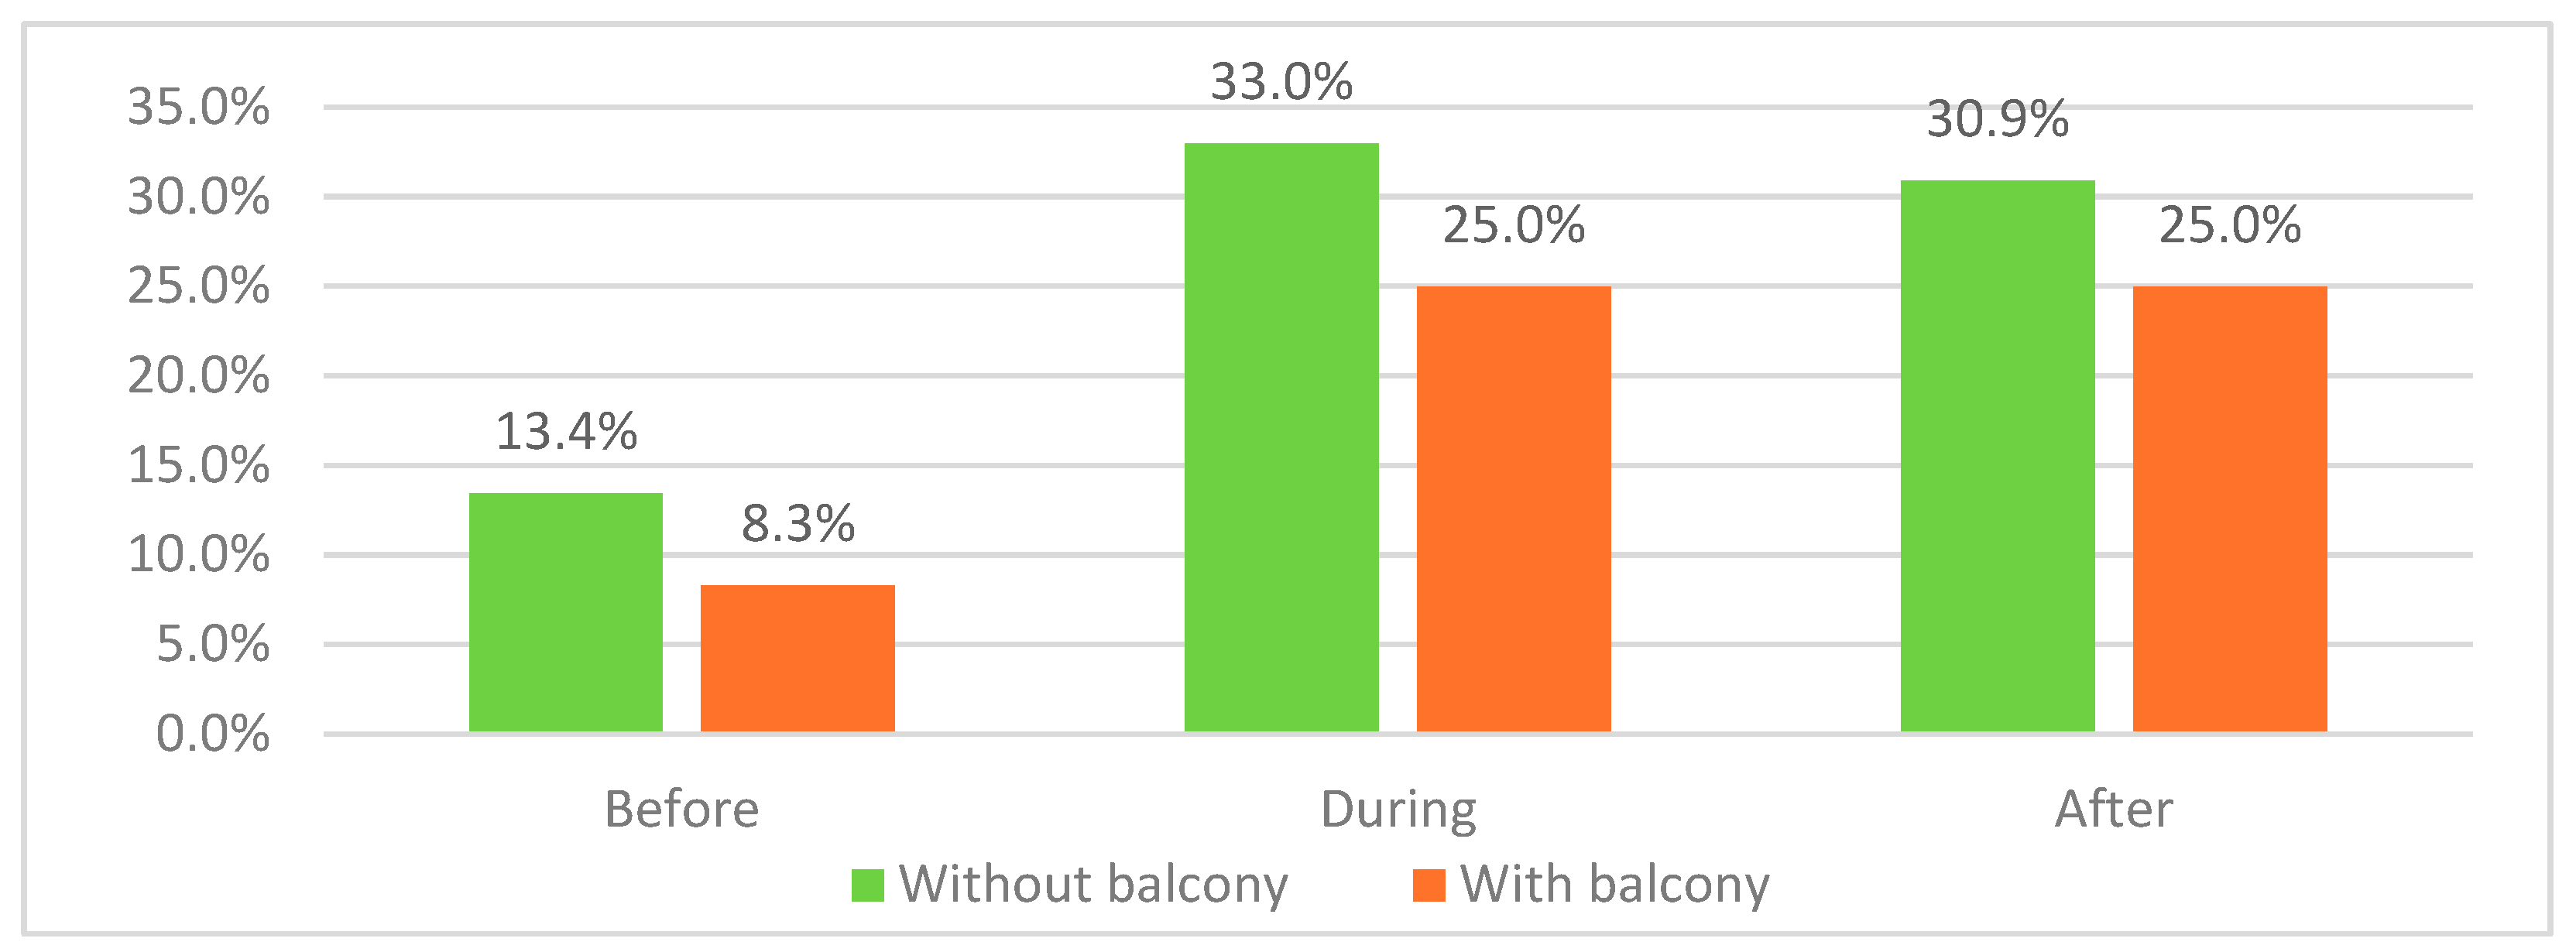
Figure 40.
Apartment 2+1 category Dissatisfaction differences for master bedrooms containing or missing bathrooms.
Figure 40.
Apartment 2+1 category Dissatisfaction differences for master bedrooms containing or missing bathrooms.
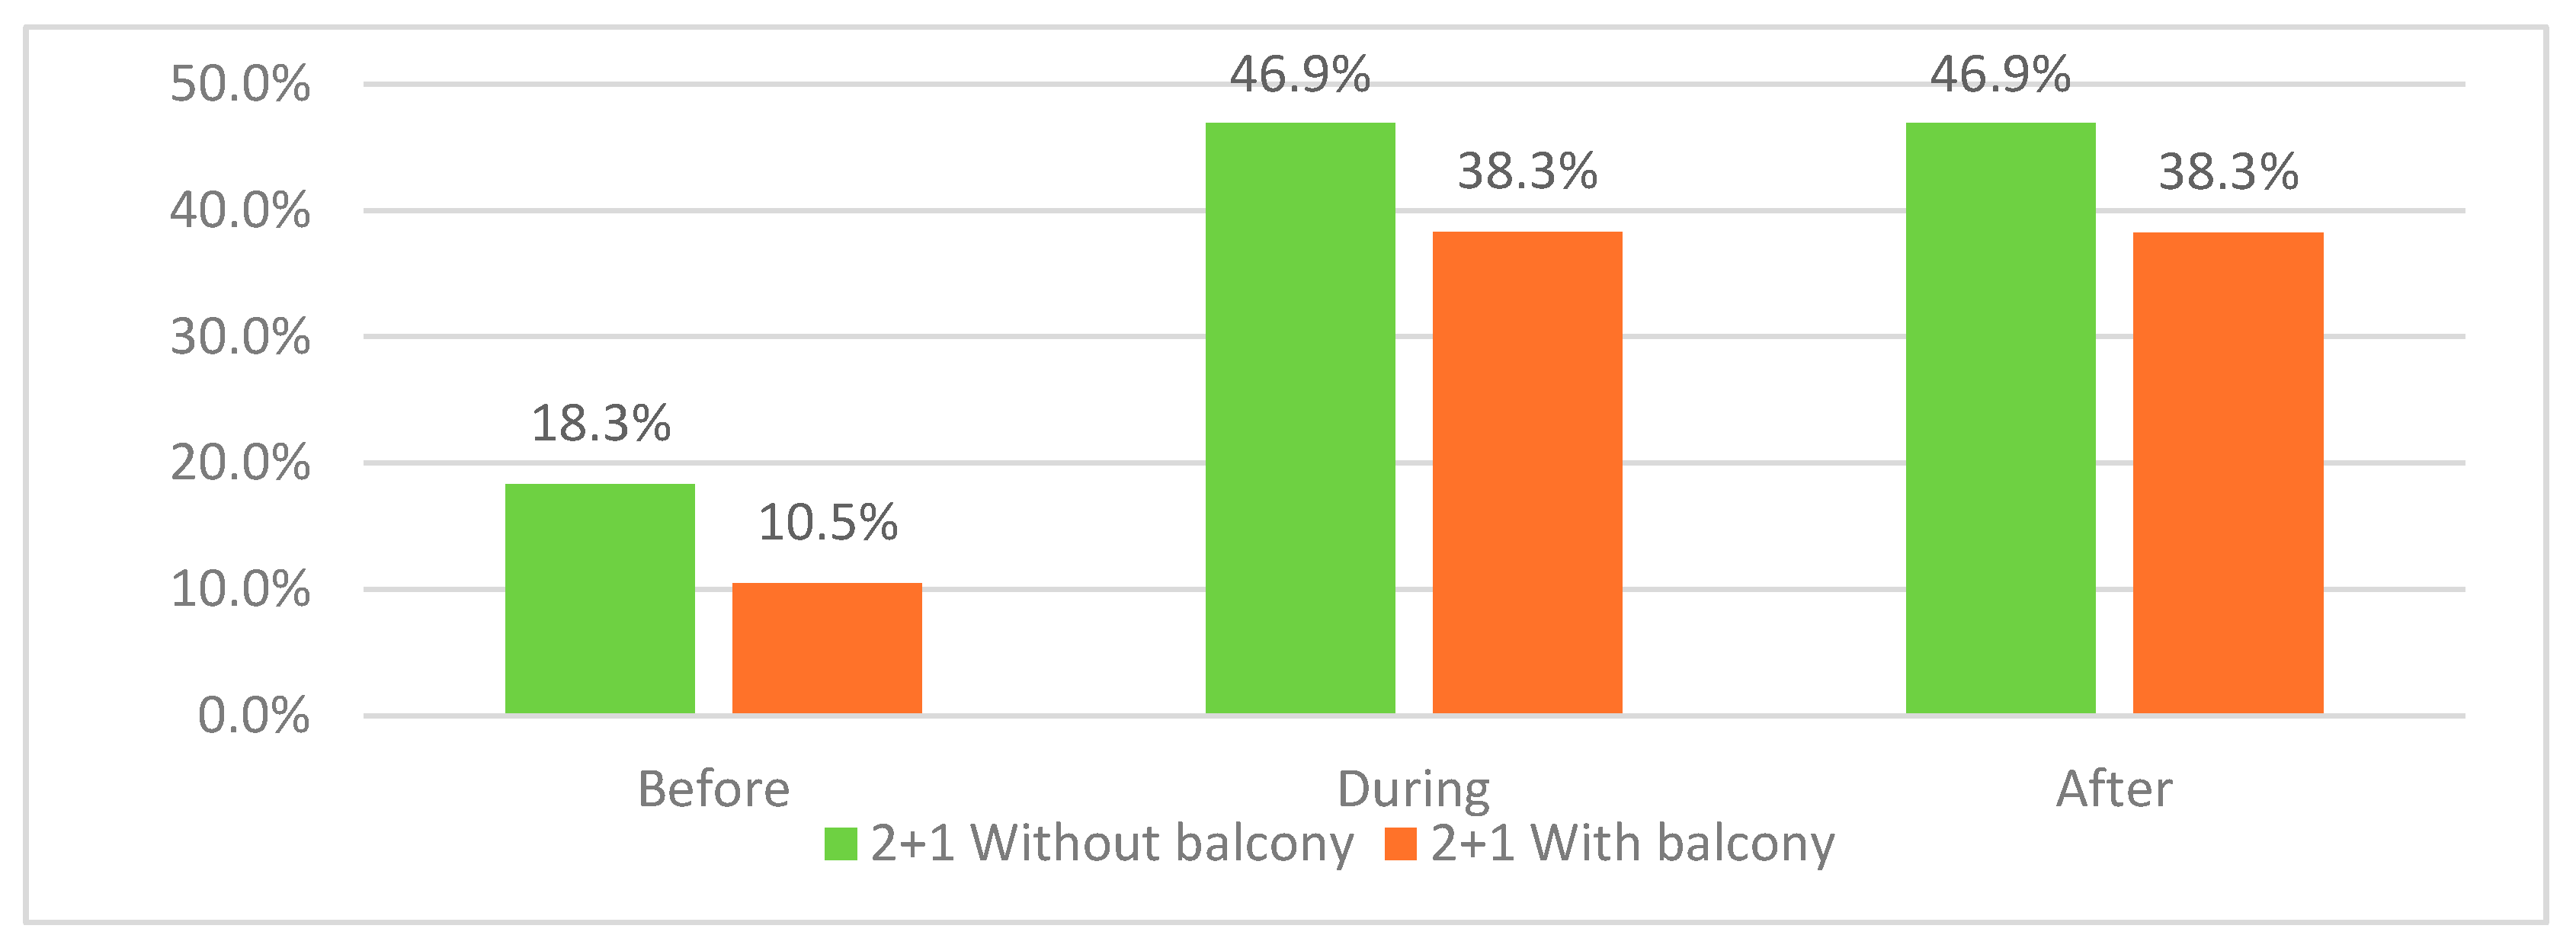
Figure 41.
Apartment 3+1 category Dissatisfaction differences for master bedrooms containing or missing bathrooms.
Figure 41.
Apartment 3+1 category Dissatisfaction differences for master bedrooms containing or missing bathrooms.
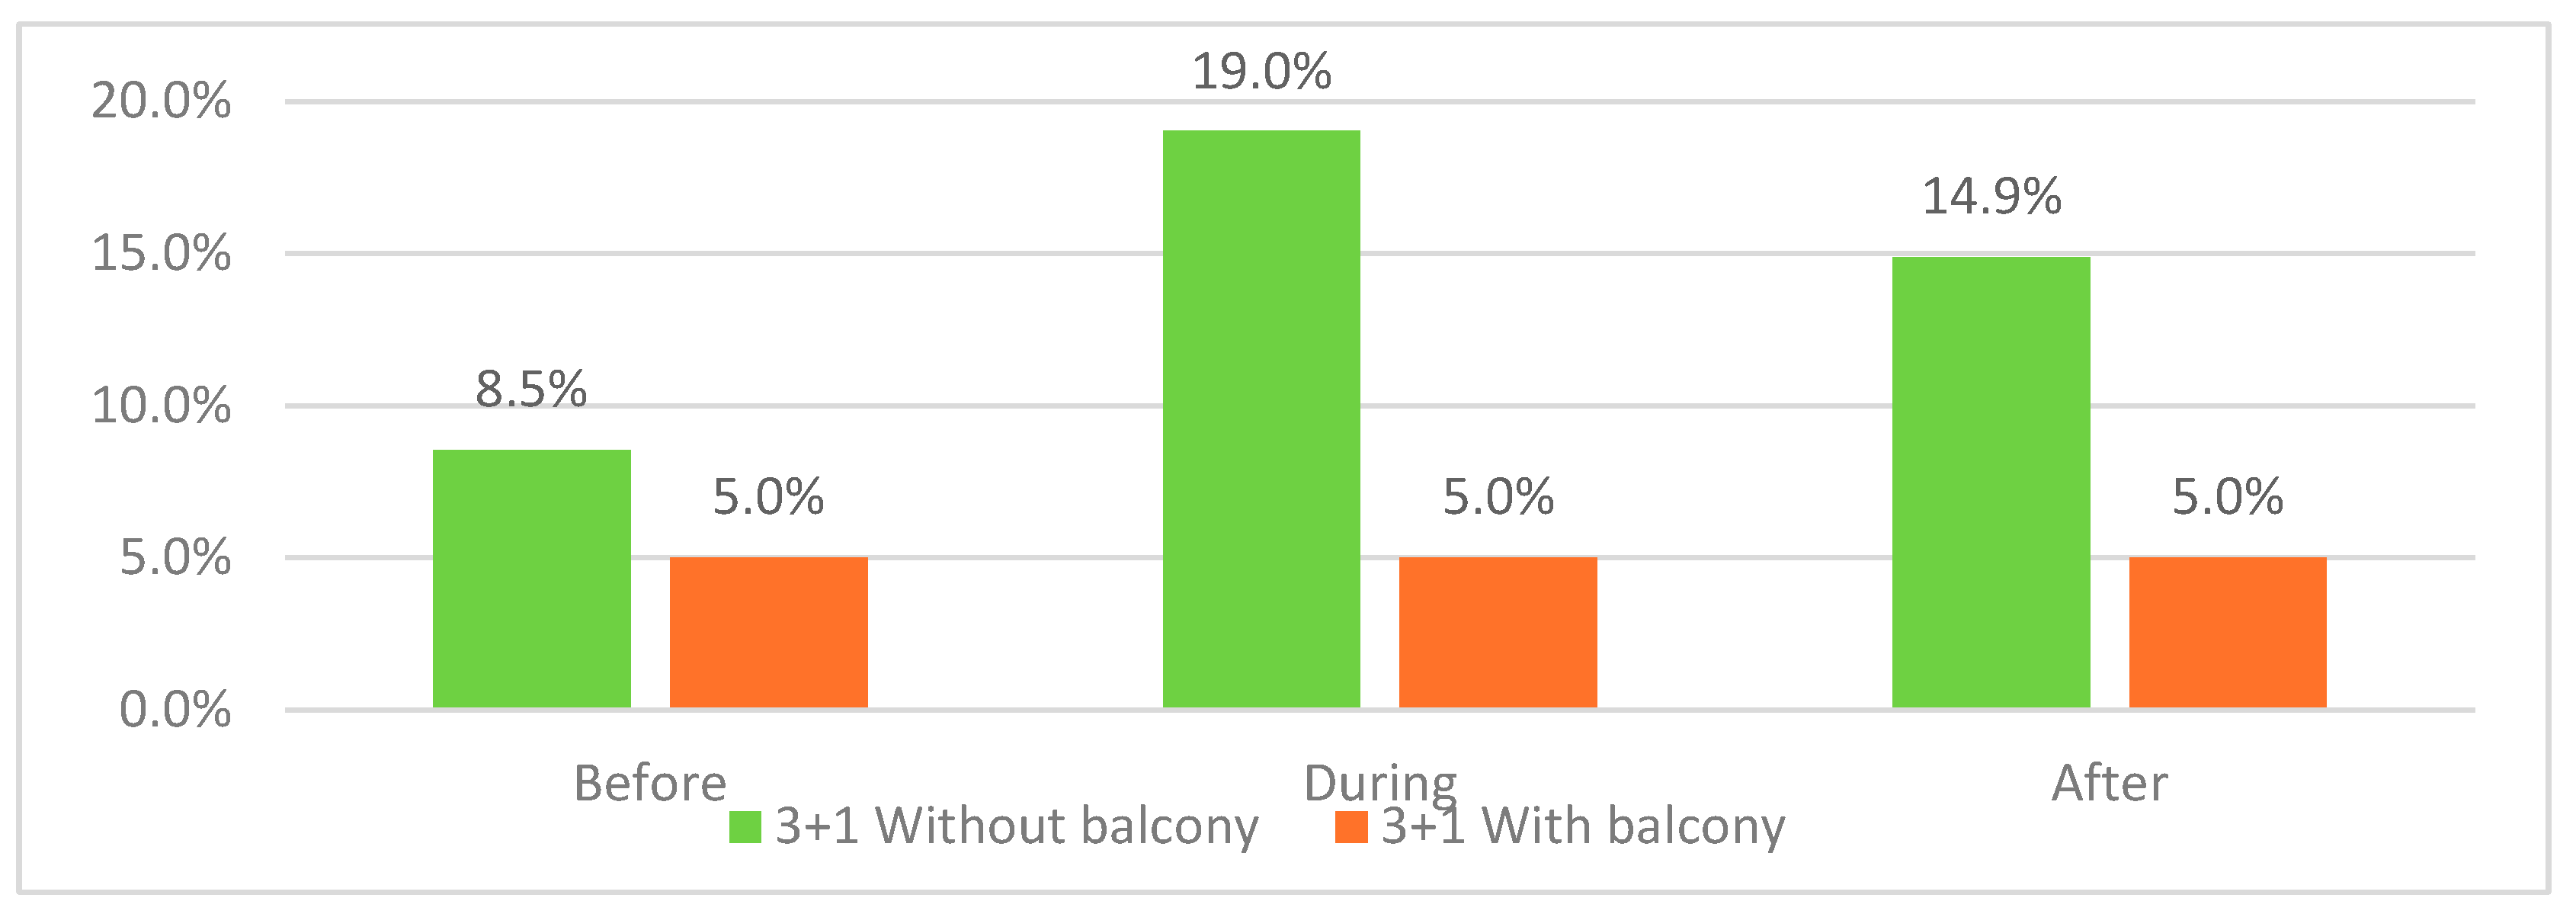
Figure 42.
Dissatisfaction stability due to availability of more than one balcony in both categories.
Figure 42.
Dissatisfaction stability due to availability of more than one balcony in both categories.
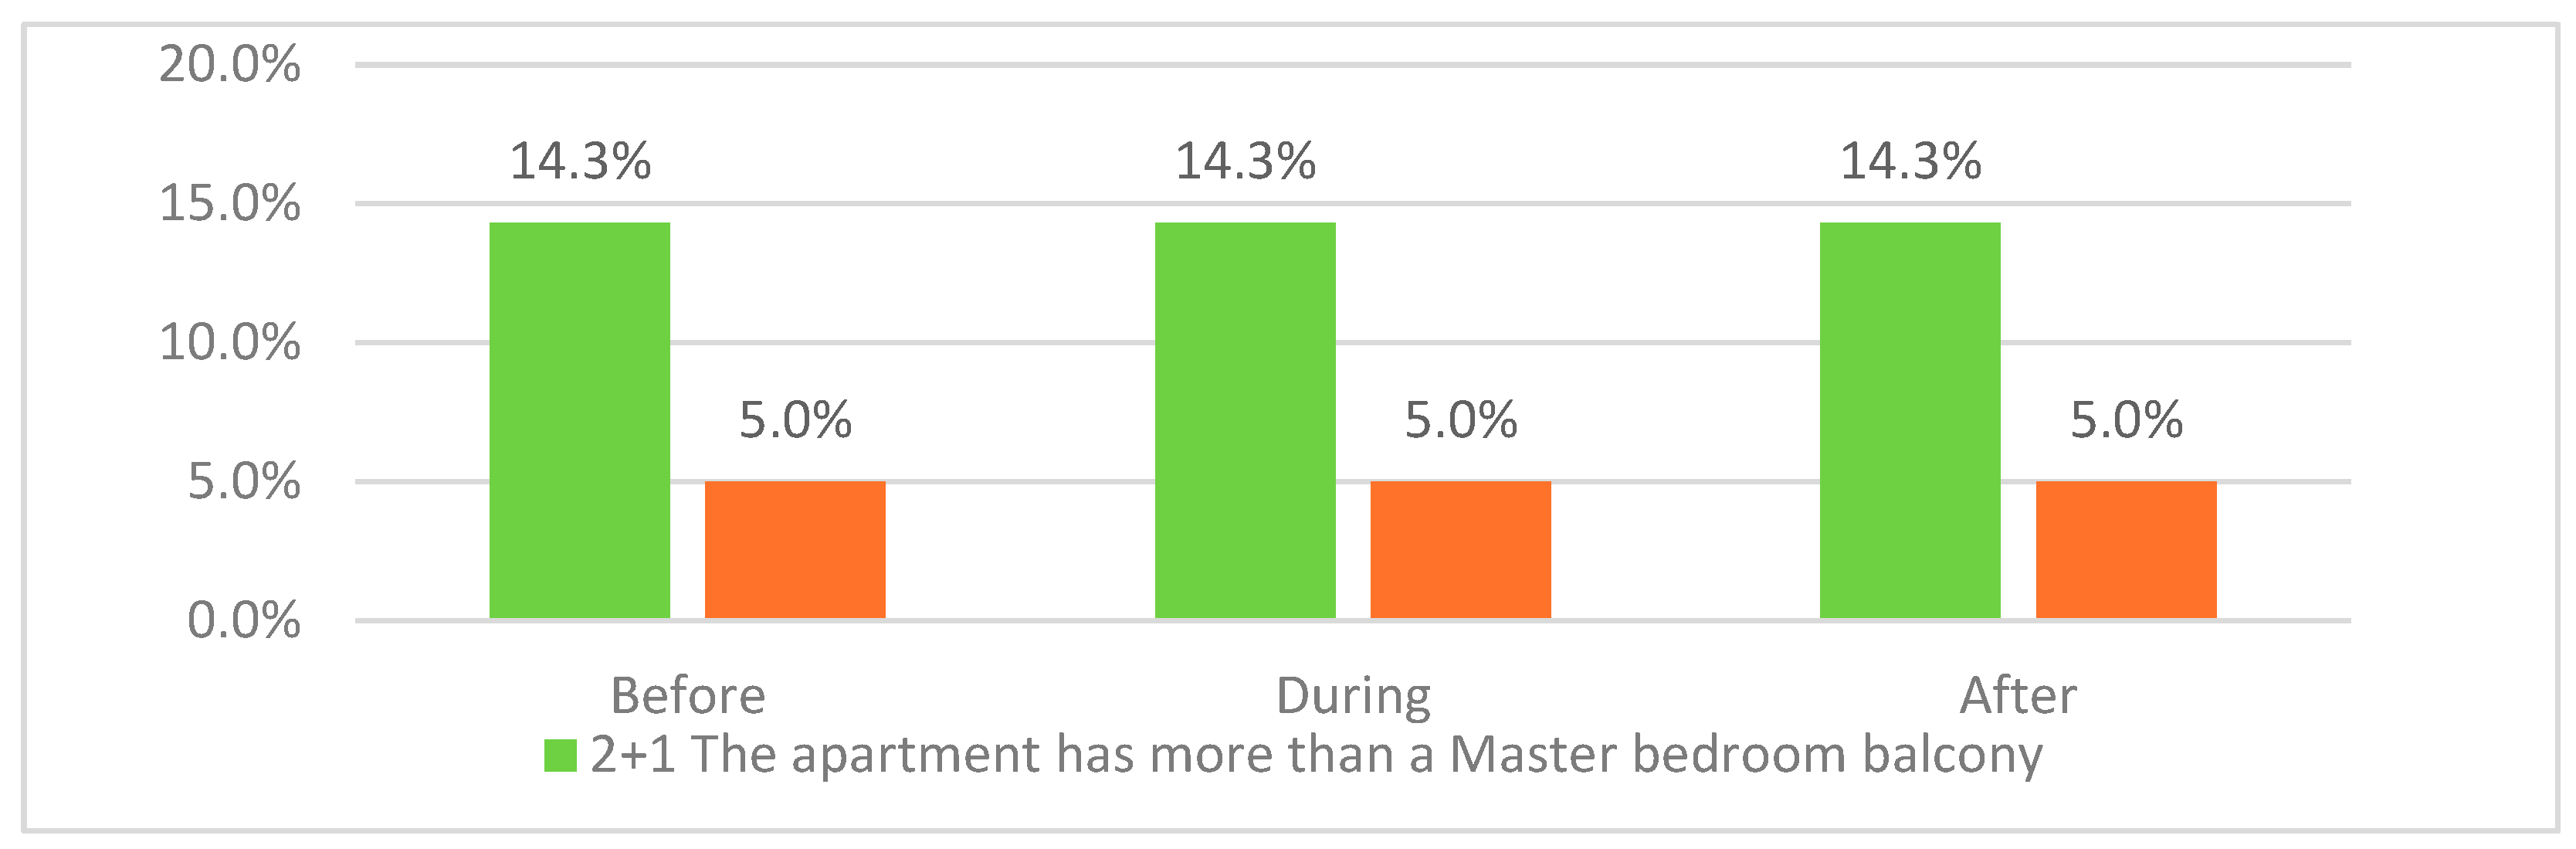
Figure 43.
Dissatisfaction variations due to master bedroom proportion.
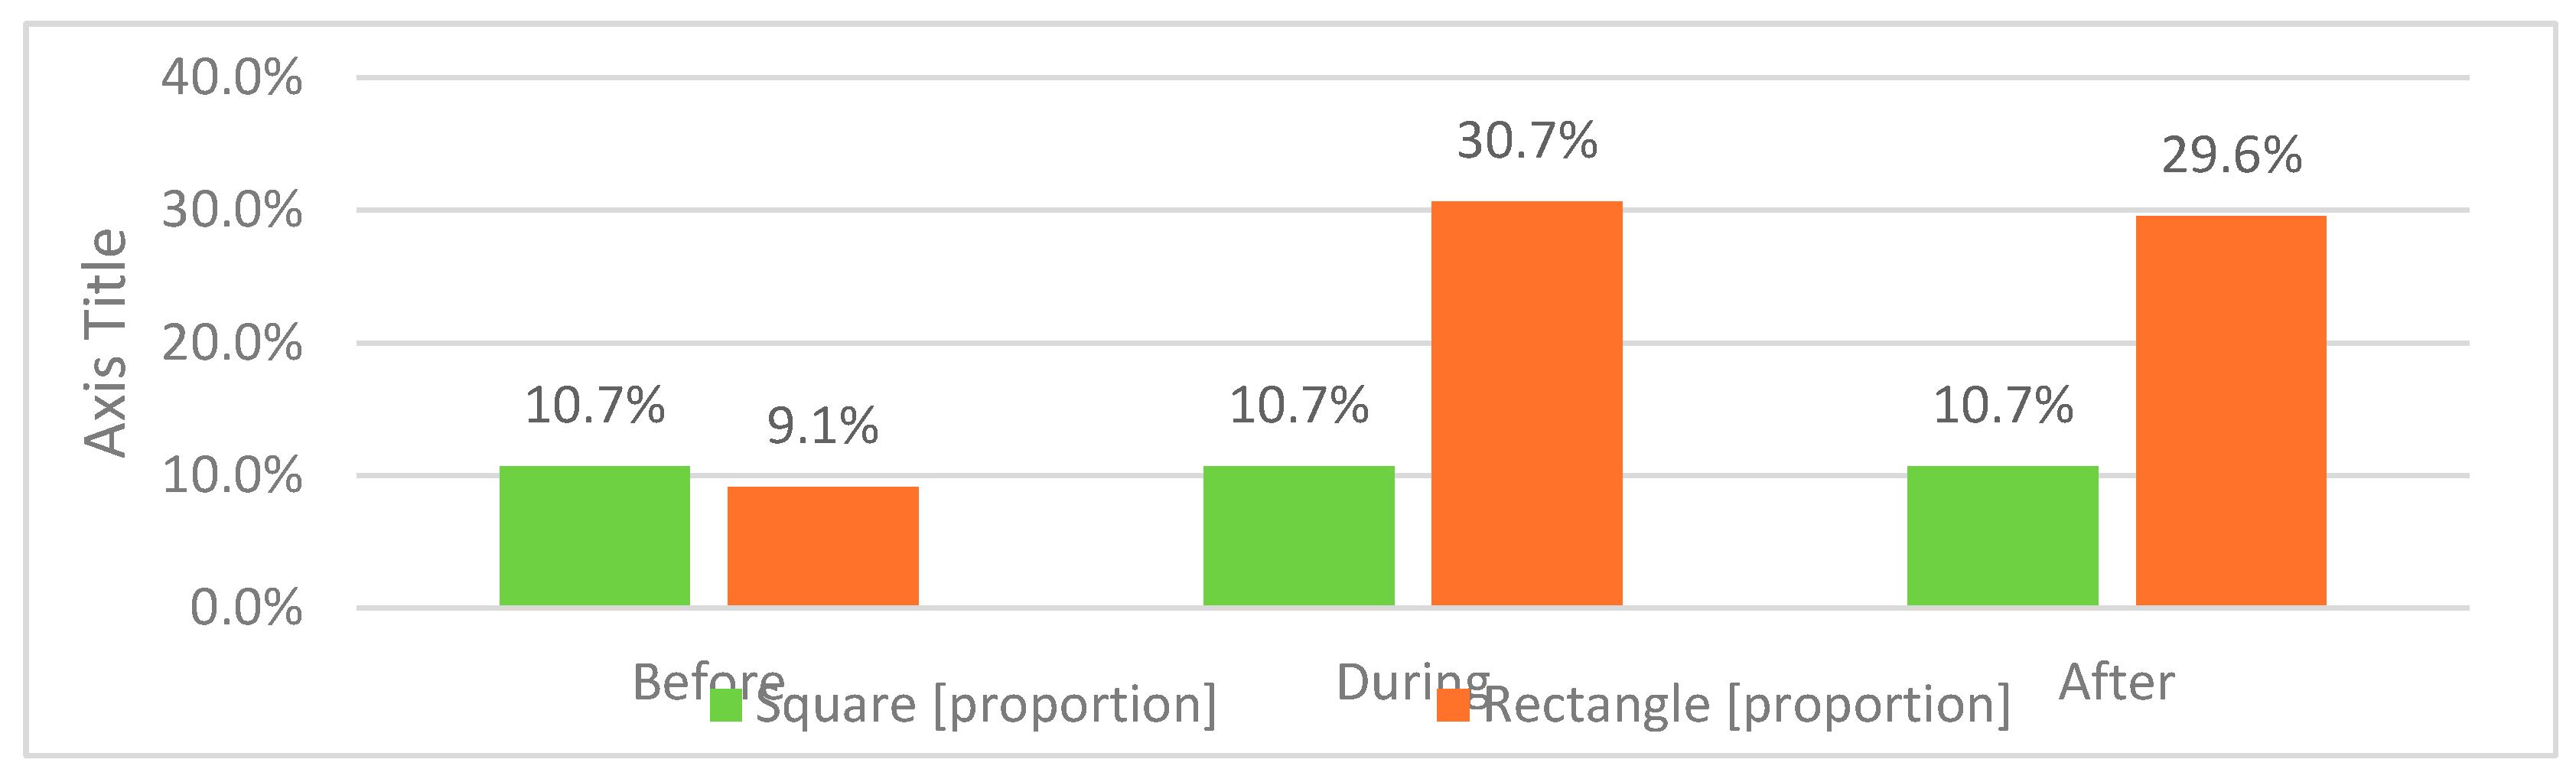
Figure 44.
main reasons for dissatisfaction differences for master bedrooms for both proportions.
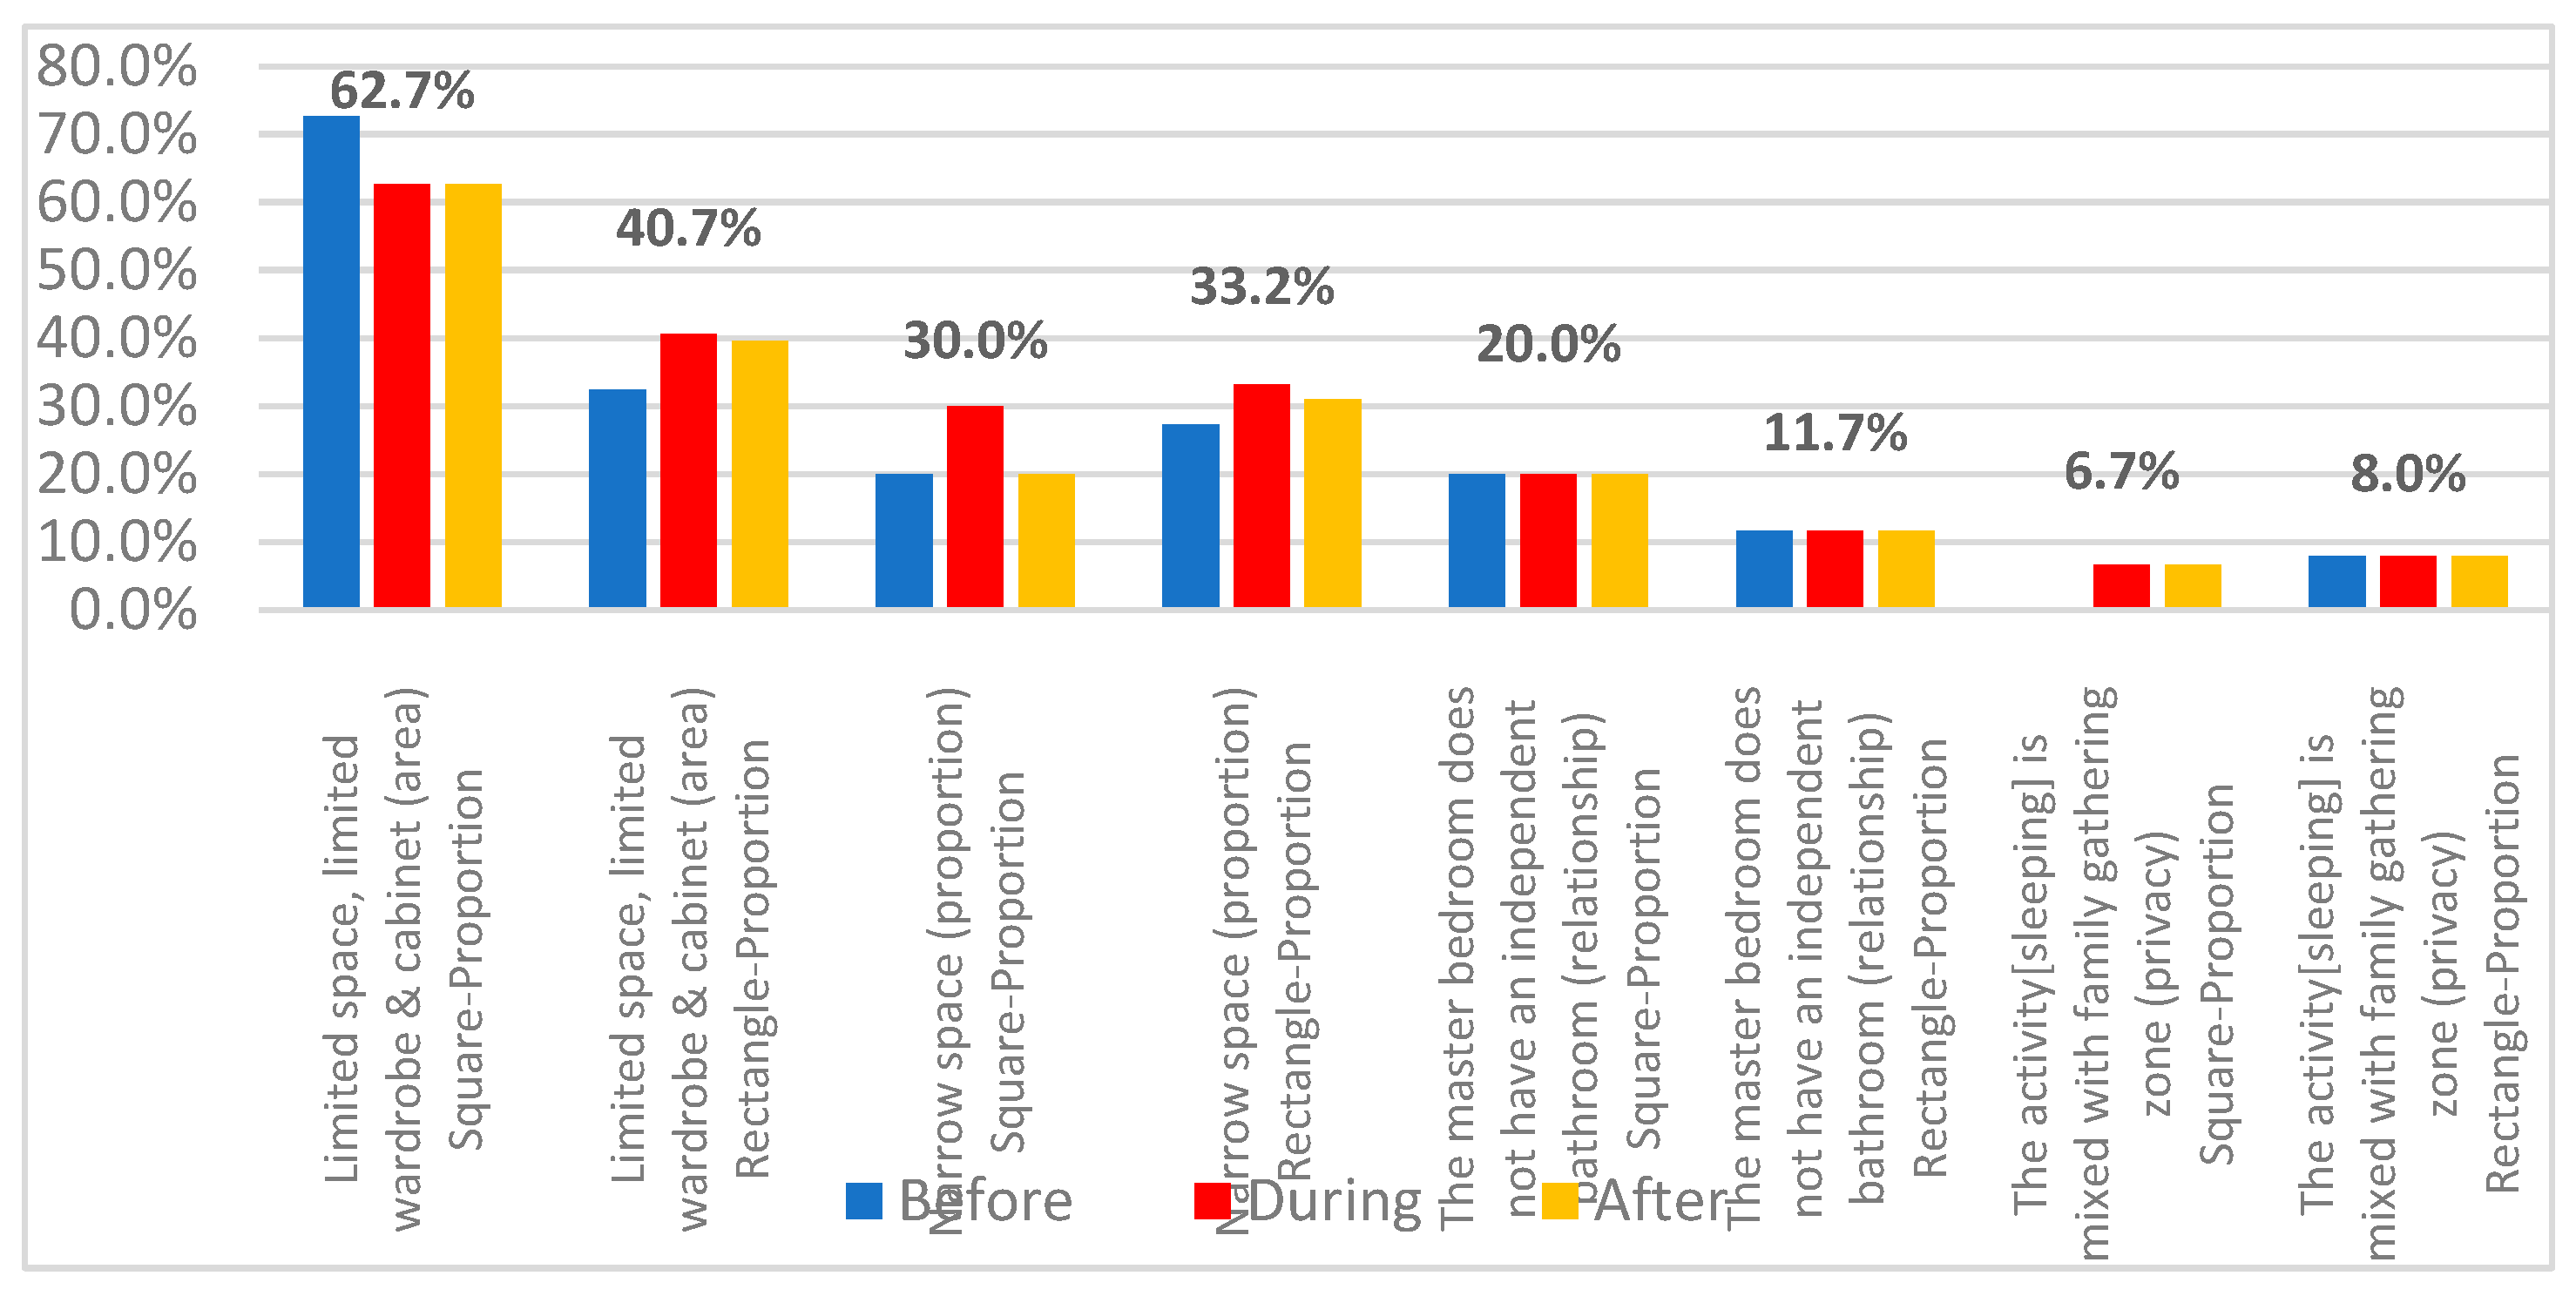
Figure 45.
Dissatisfaction differences in master bedrooms due to spatial organization .
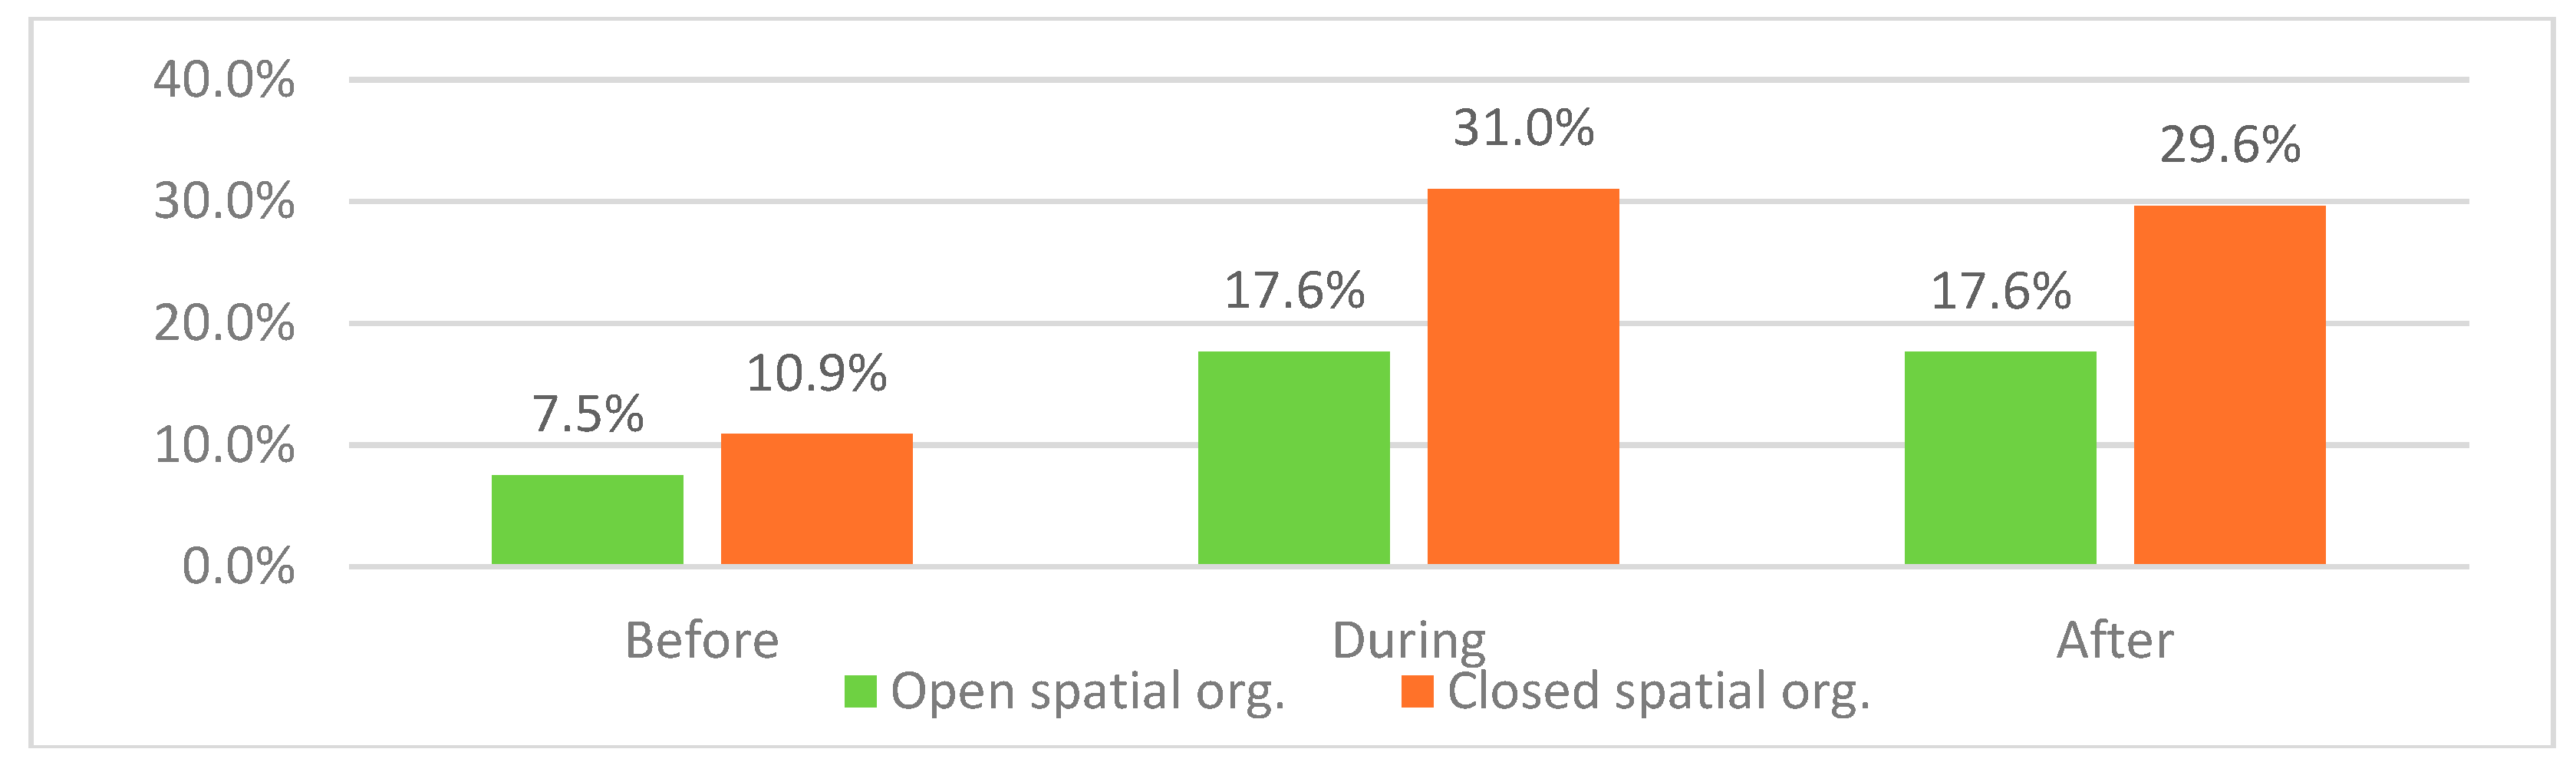
Figure 46.
Variations in apartments with two categories and two different organizations .
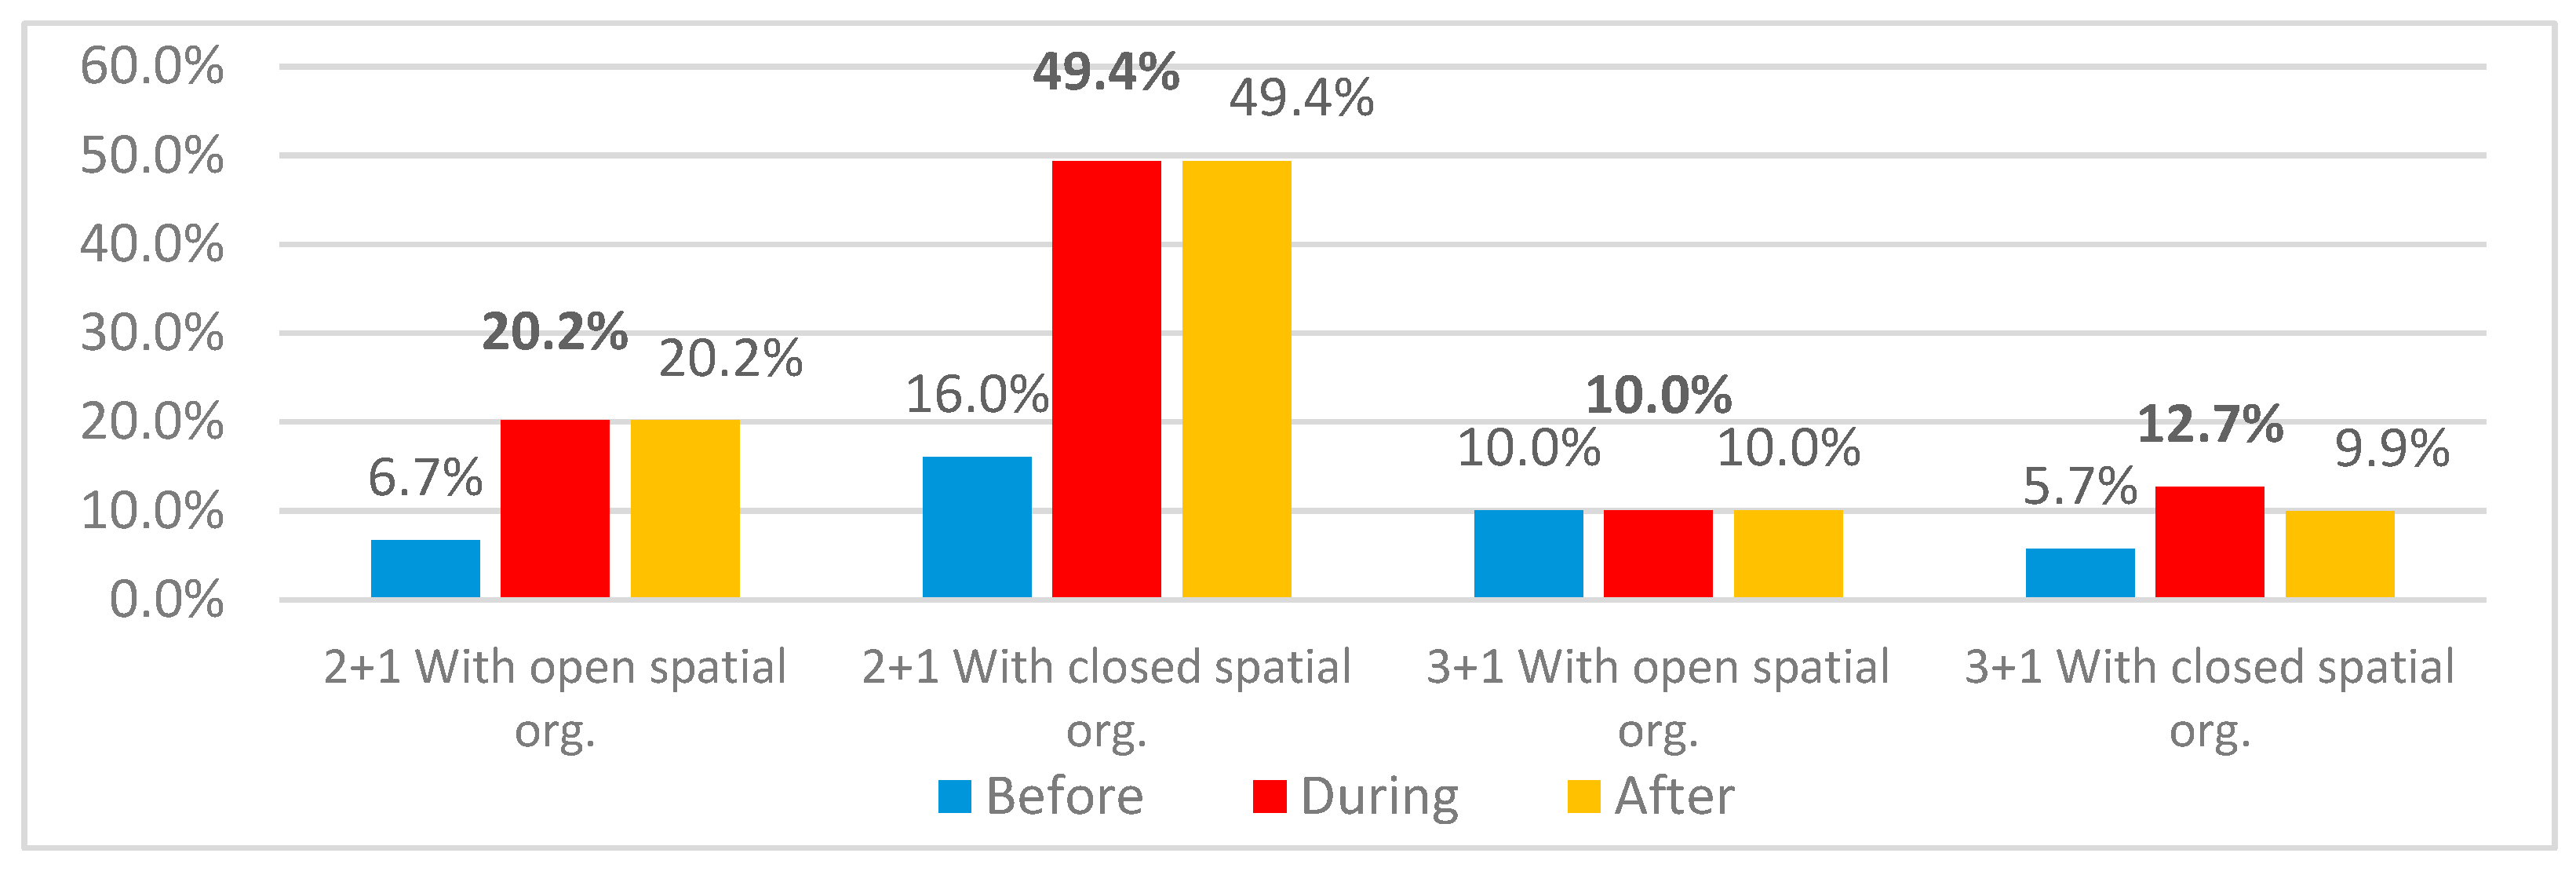
Figure 47.
Dissatisfaction differences for children’s bedrooms for all categories.
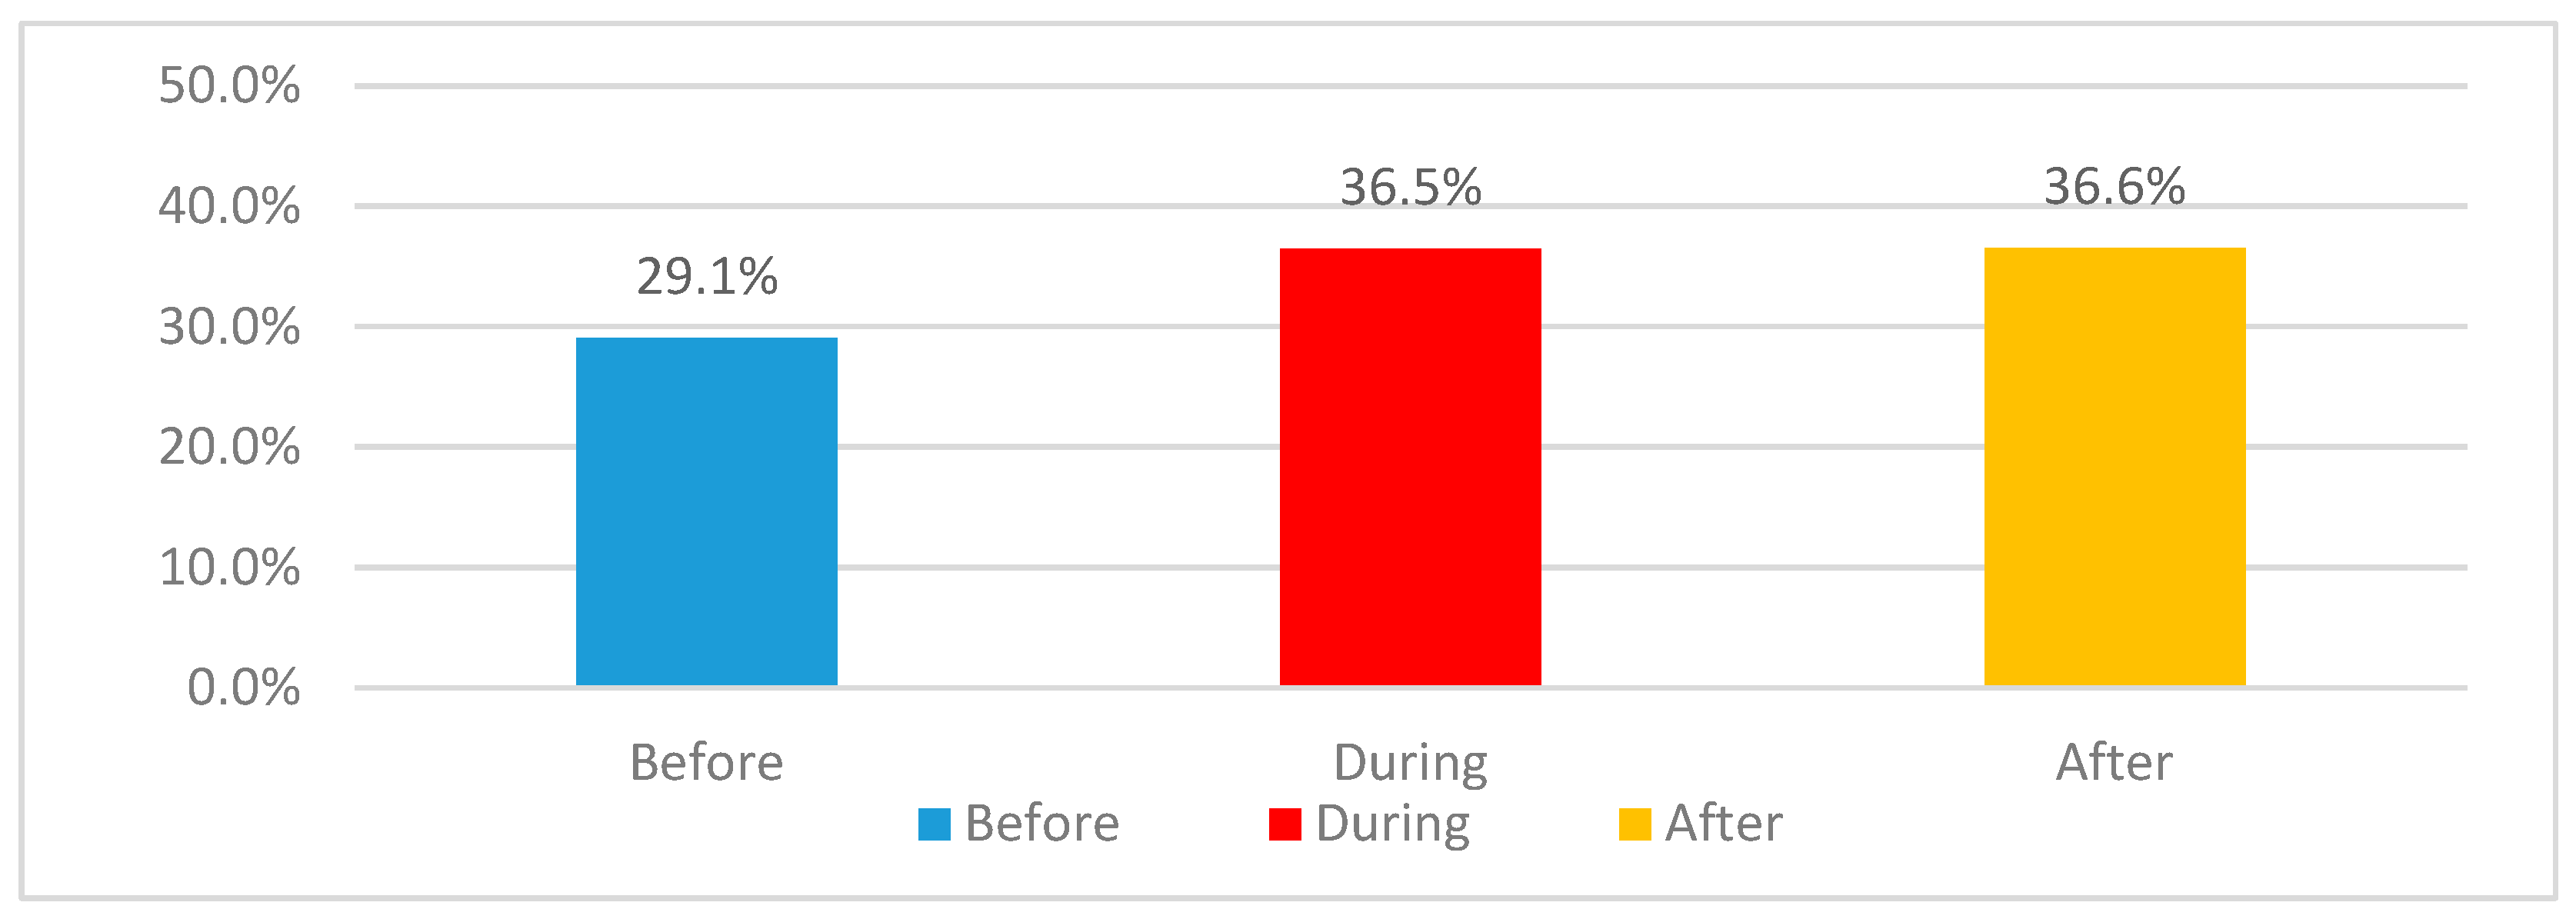
Figure 48.
Dissatisfaction differences for children’s bedrooms 2+1 and 3+1 category.
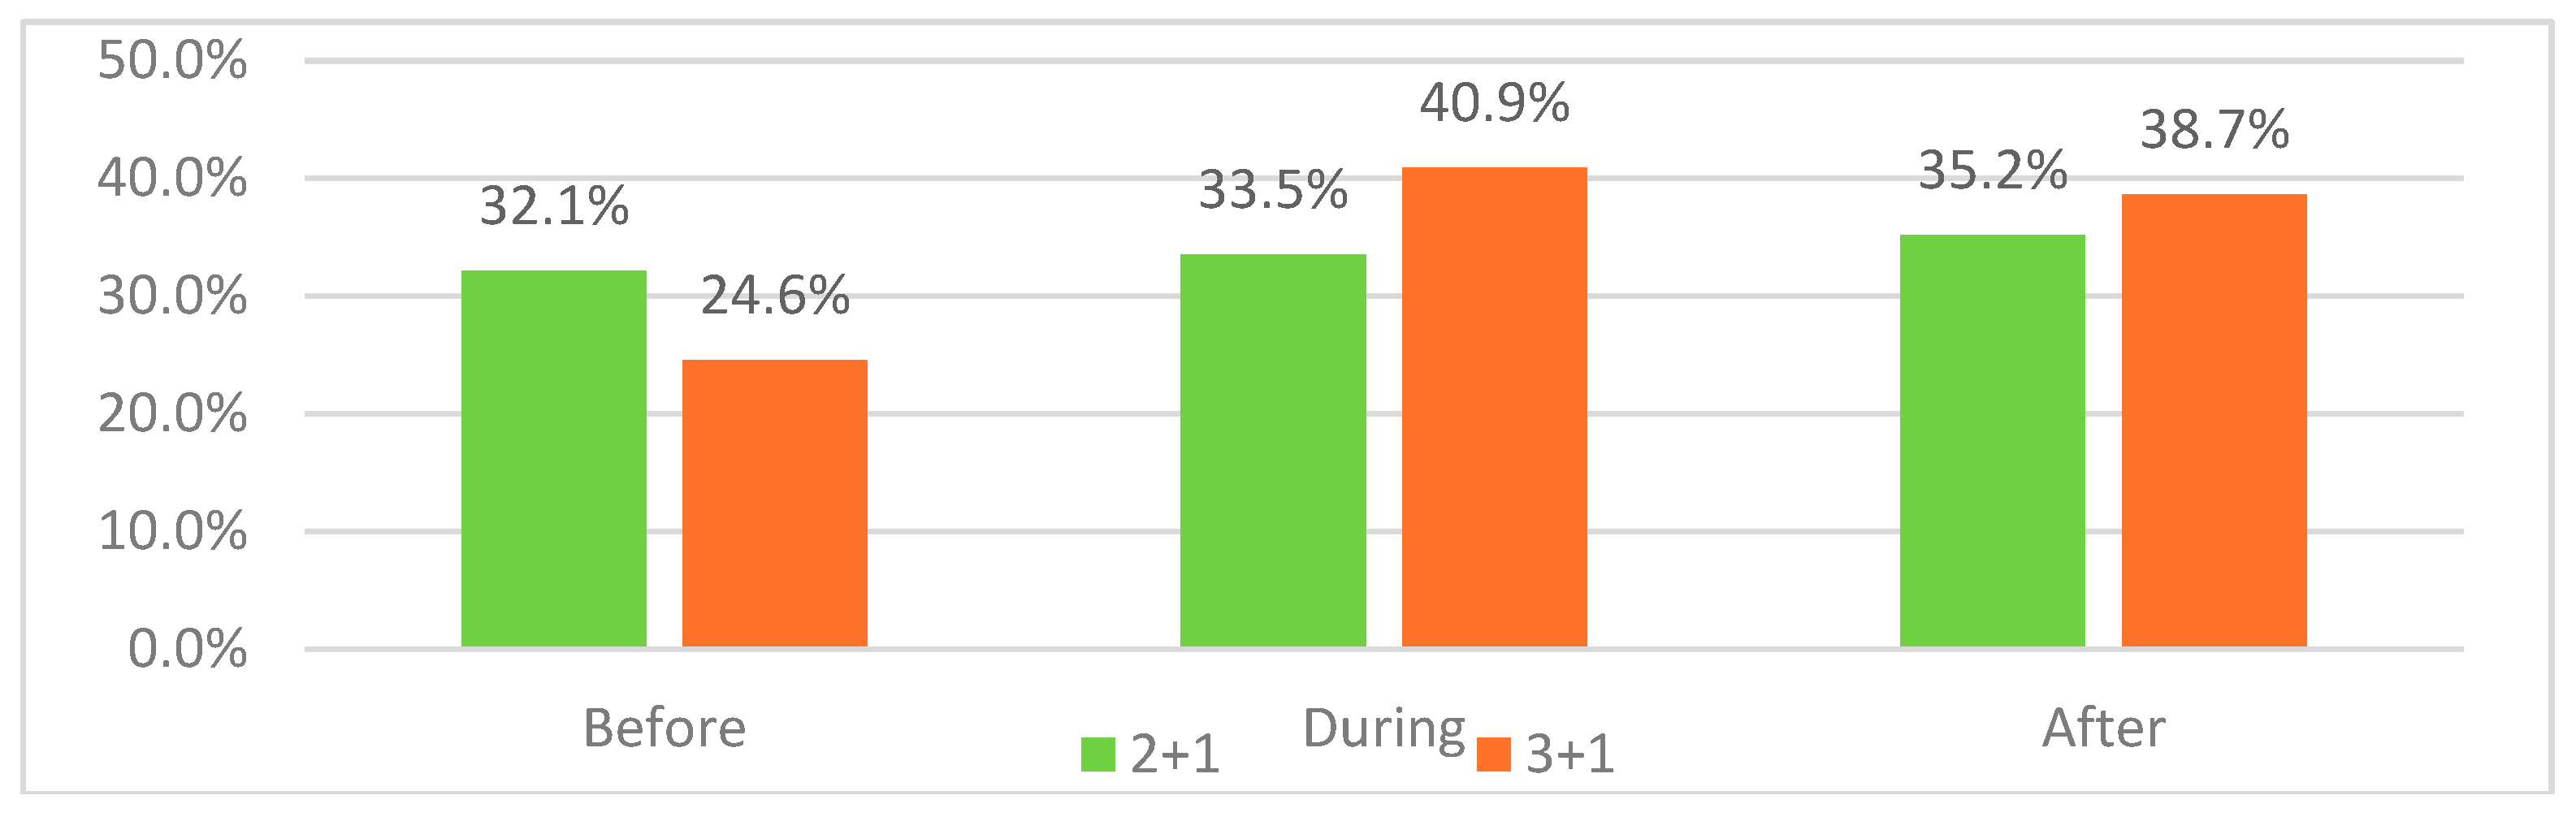
Figure 49.
main reasons for dissatisfaction differences for children’s bedrooms for 2+1 category.
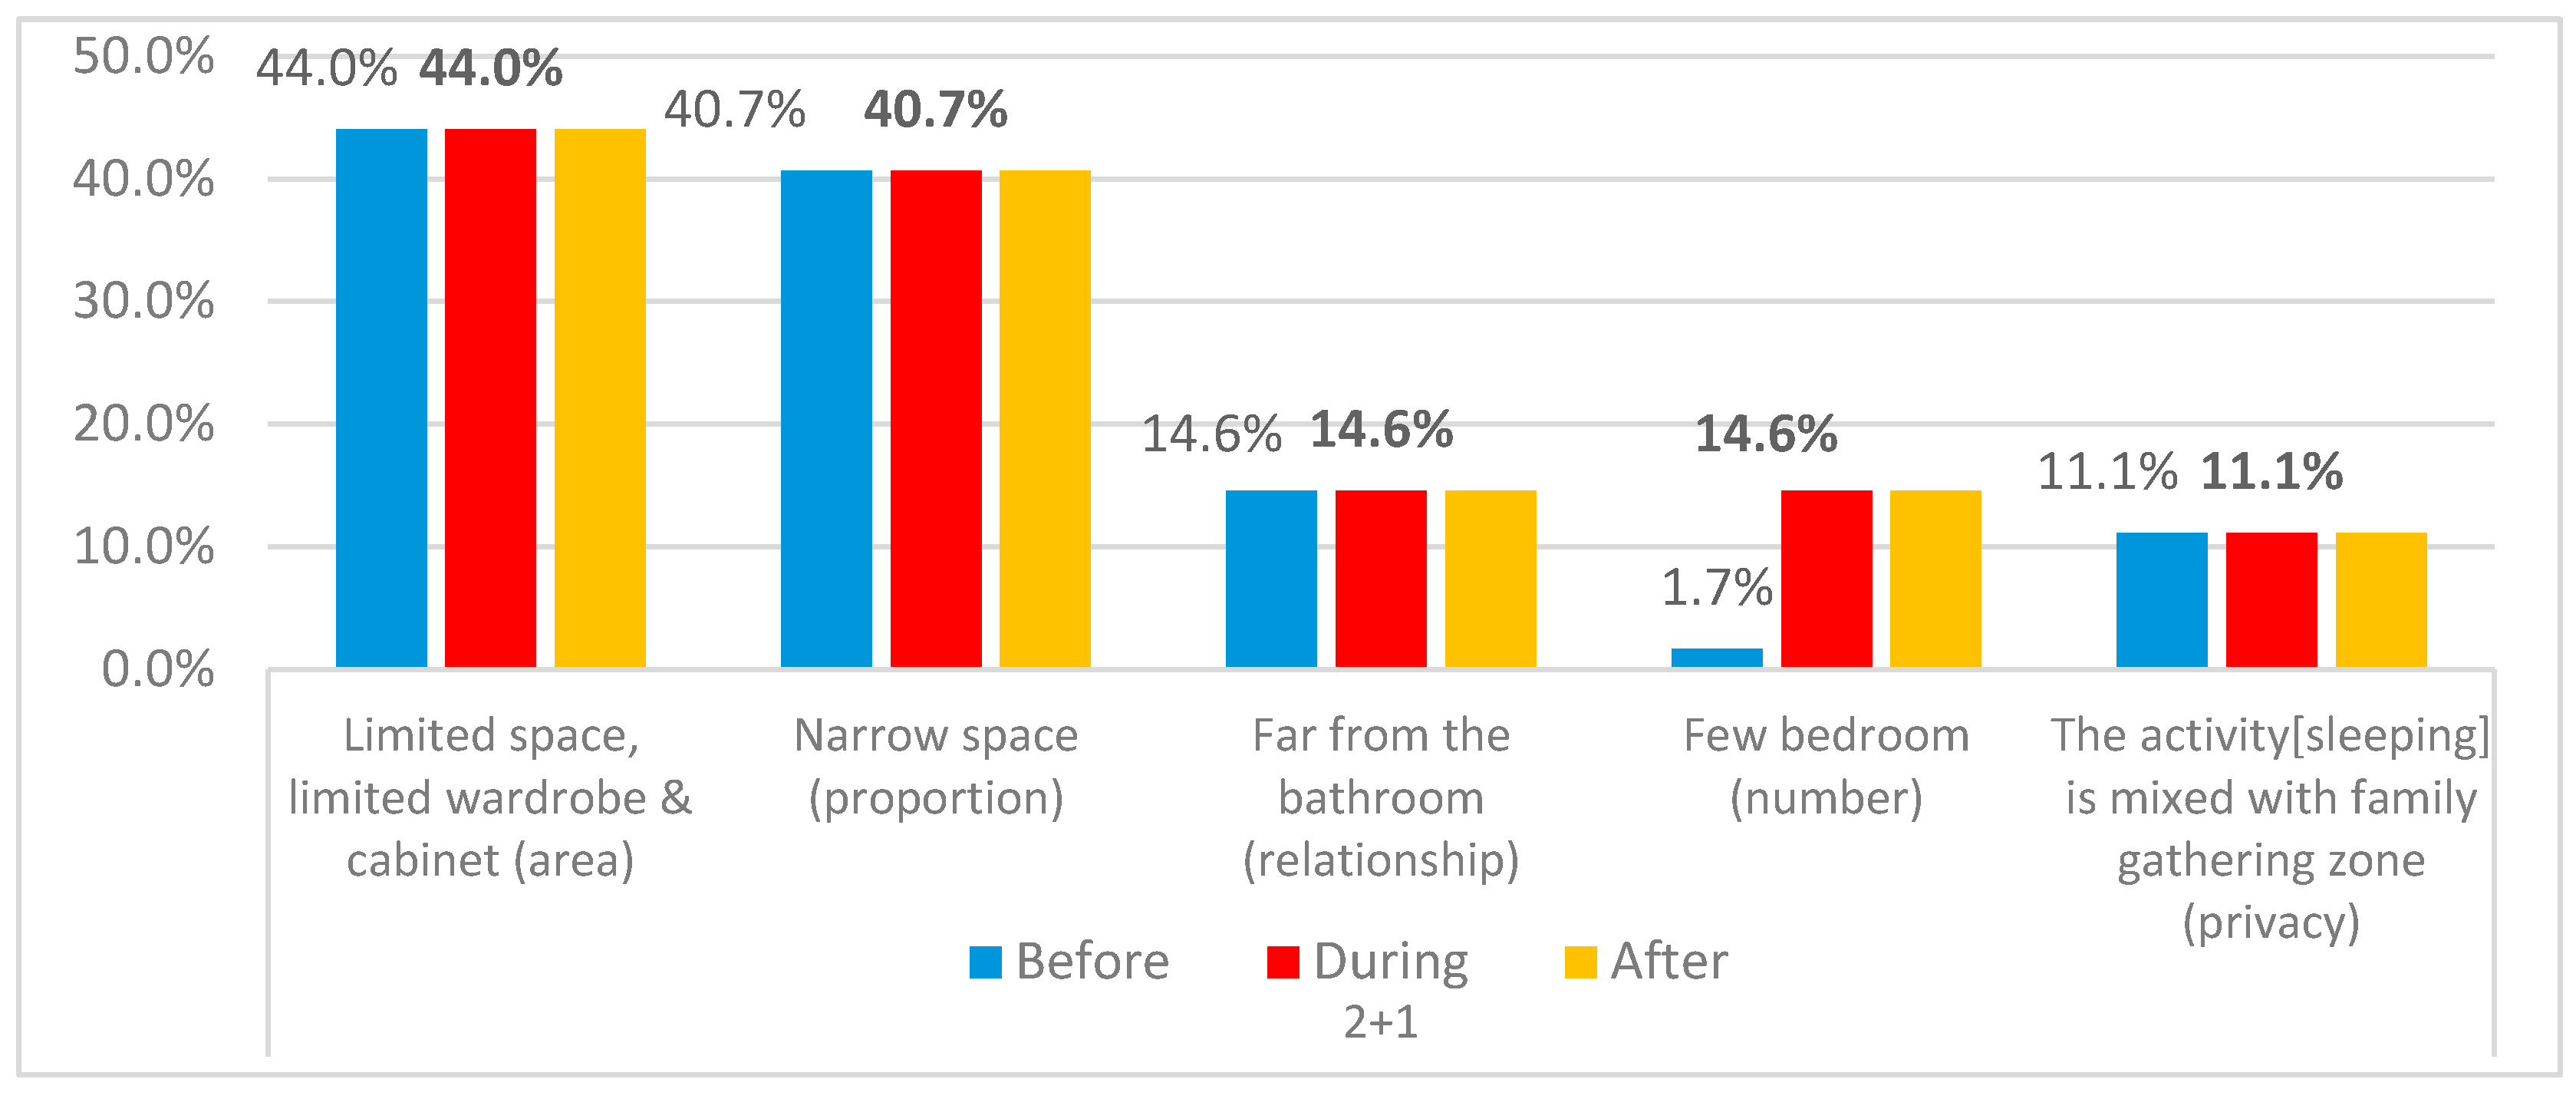
Figure 51.
Dissatisfaction differences for children’s bedrooms due to space proportion variations.
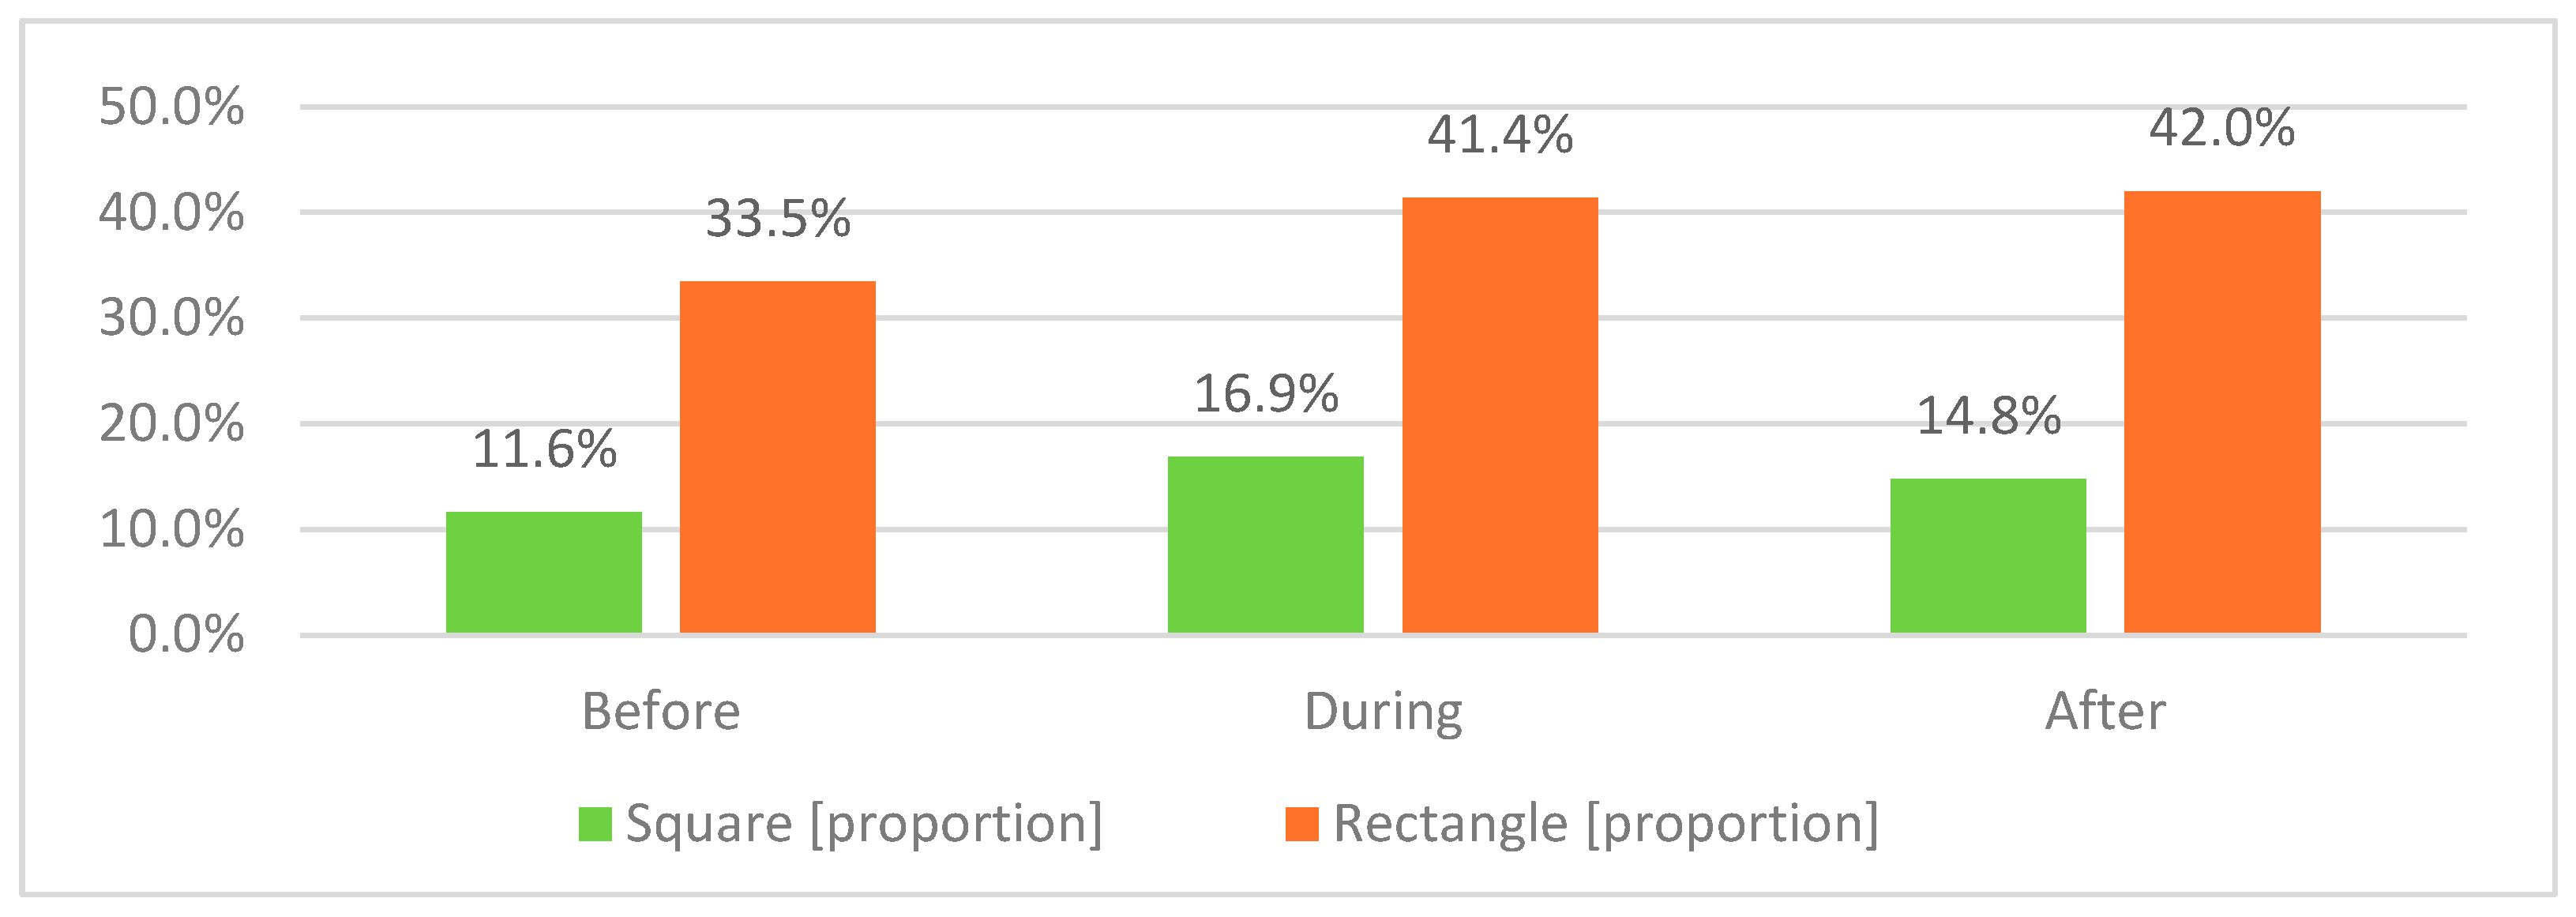
Figure 52.
Dissatisfaction differences for children’s bedrooms due to balcony availability.
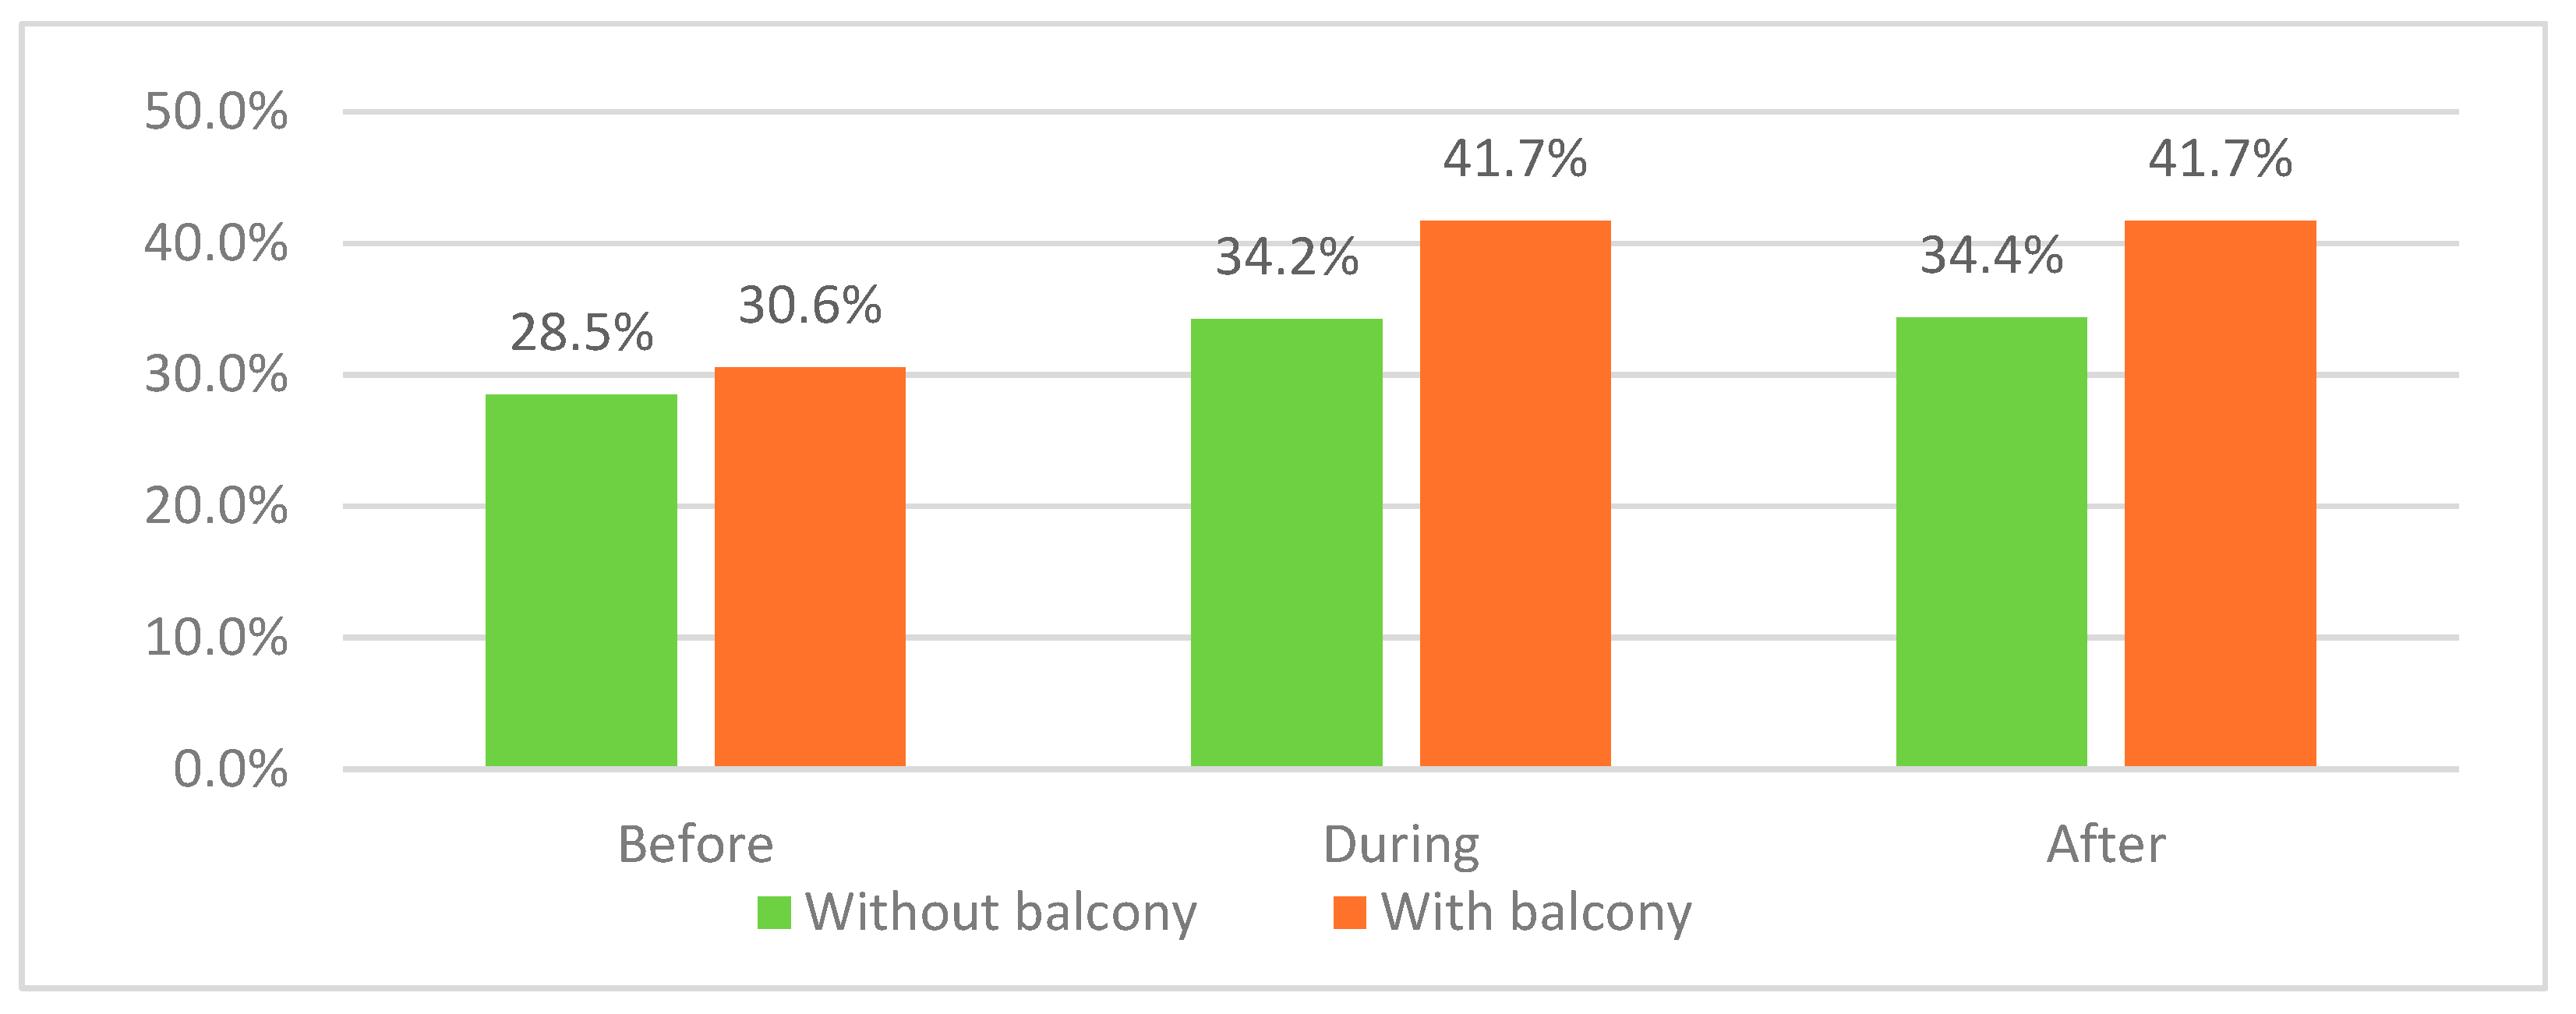
Figure 53.
Dissatisfaction variations for children’s bedrooms due to spatial organization.
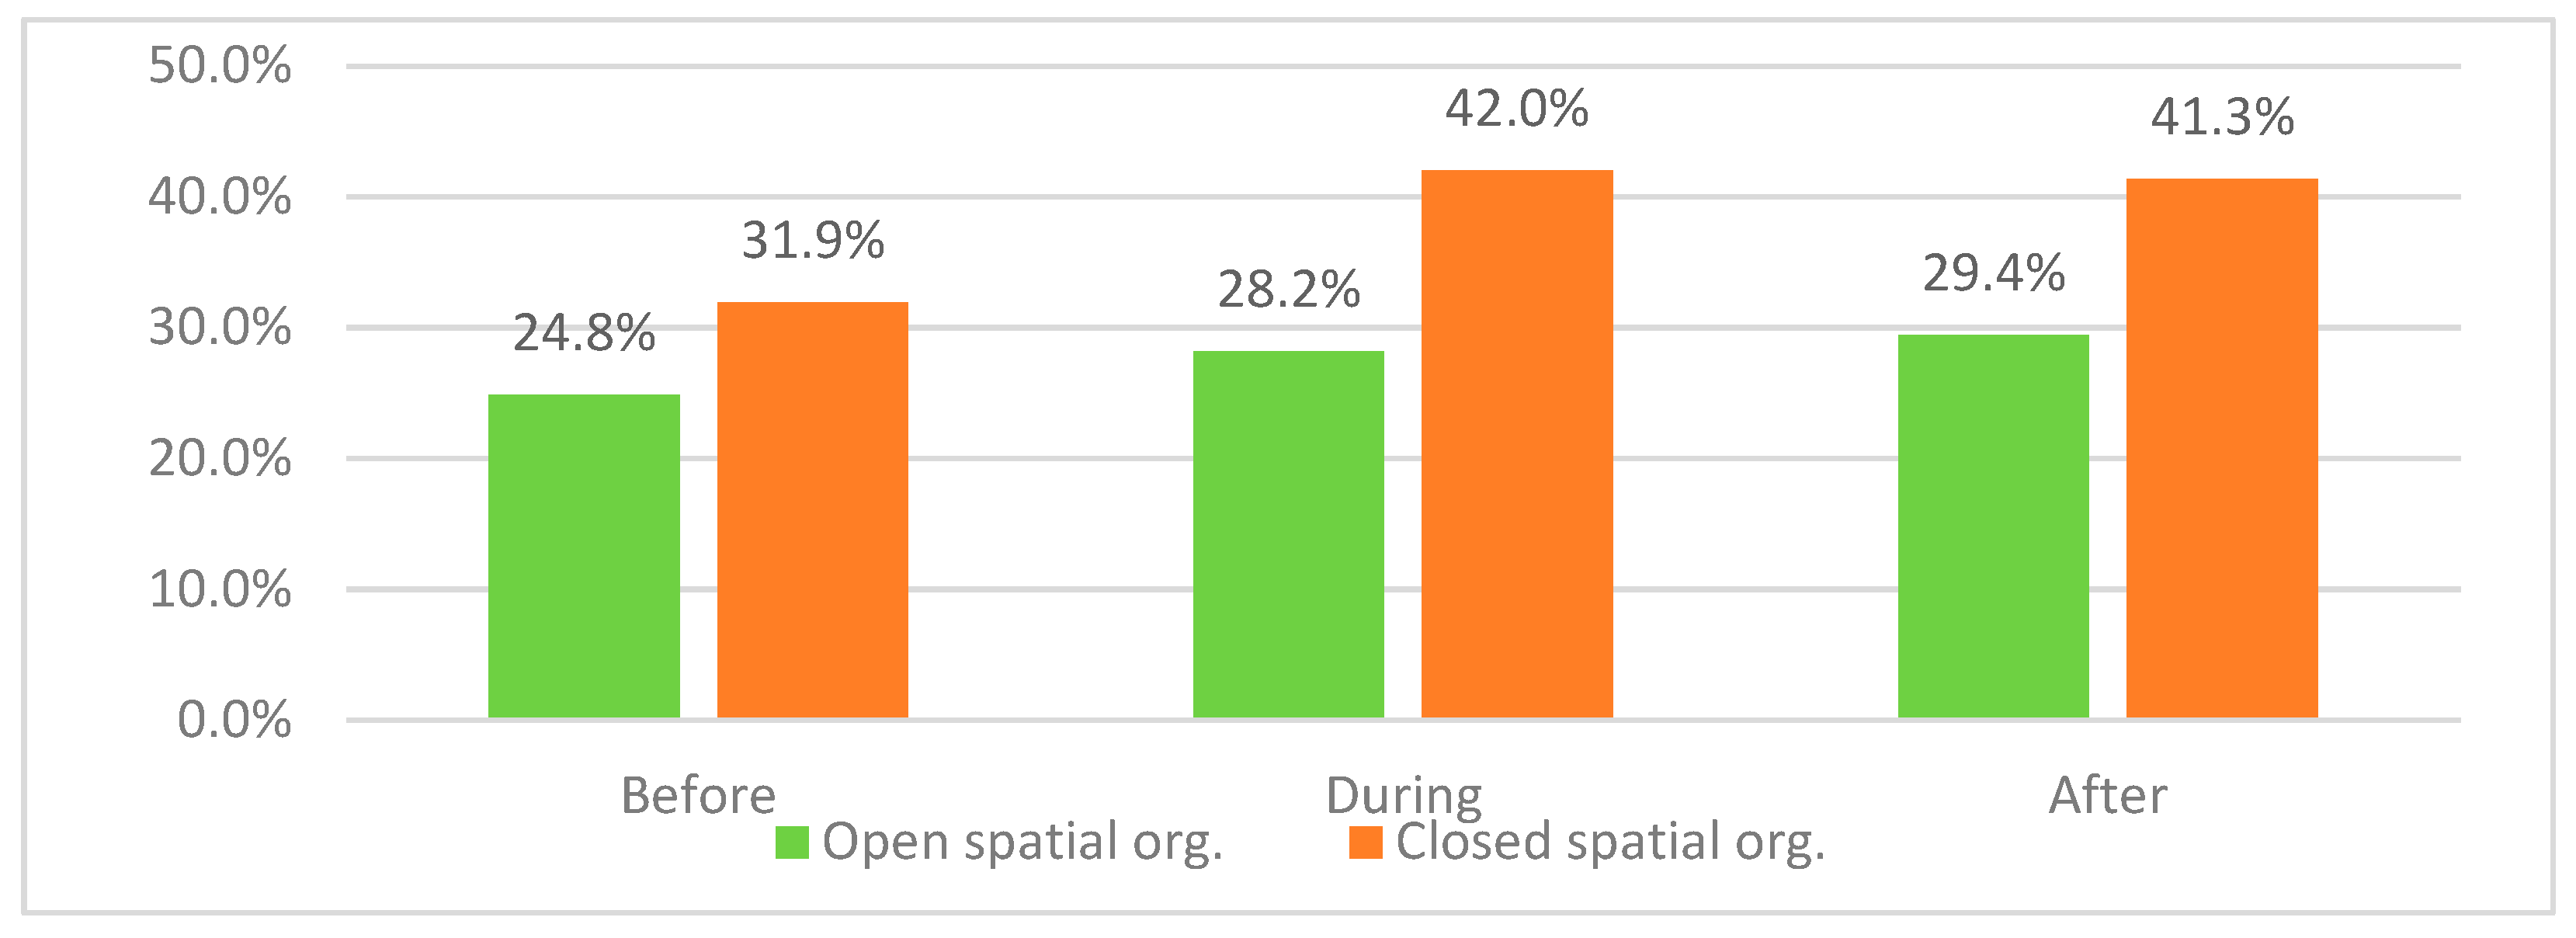
Figure 54.
Dissatisfaction variations for children’s bedrooms due to spatial organization and apartment category.
Figure 54.
Dissatisfaction variations for children’s bedrooms due to spatial organization and apartment category.
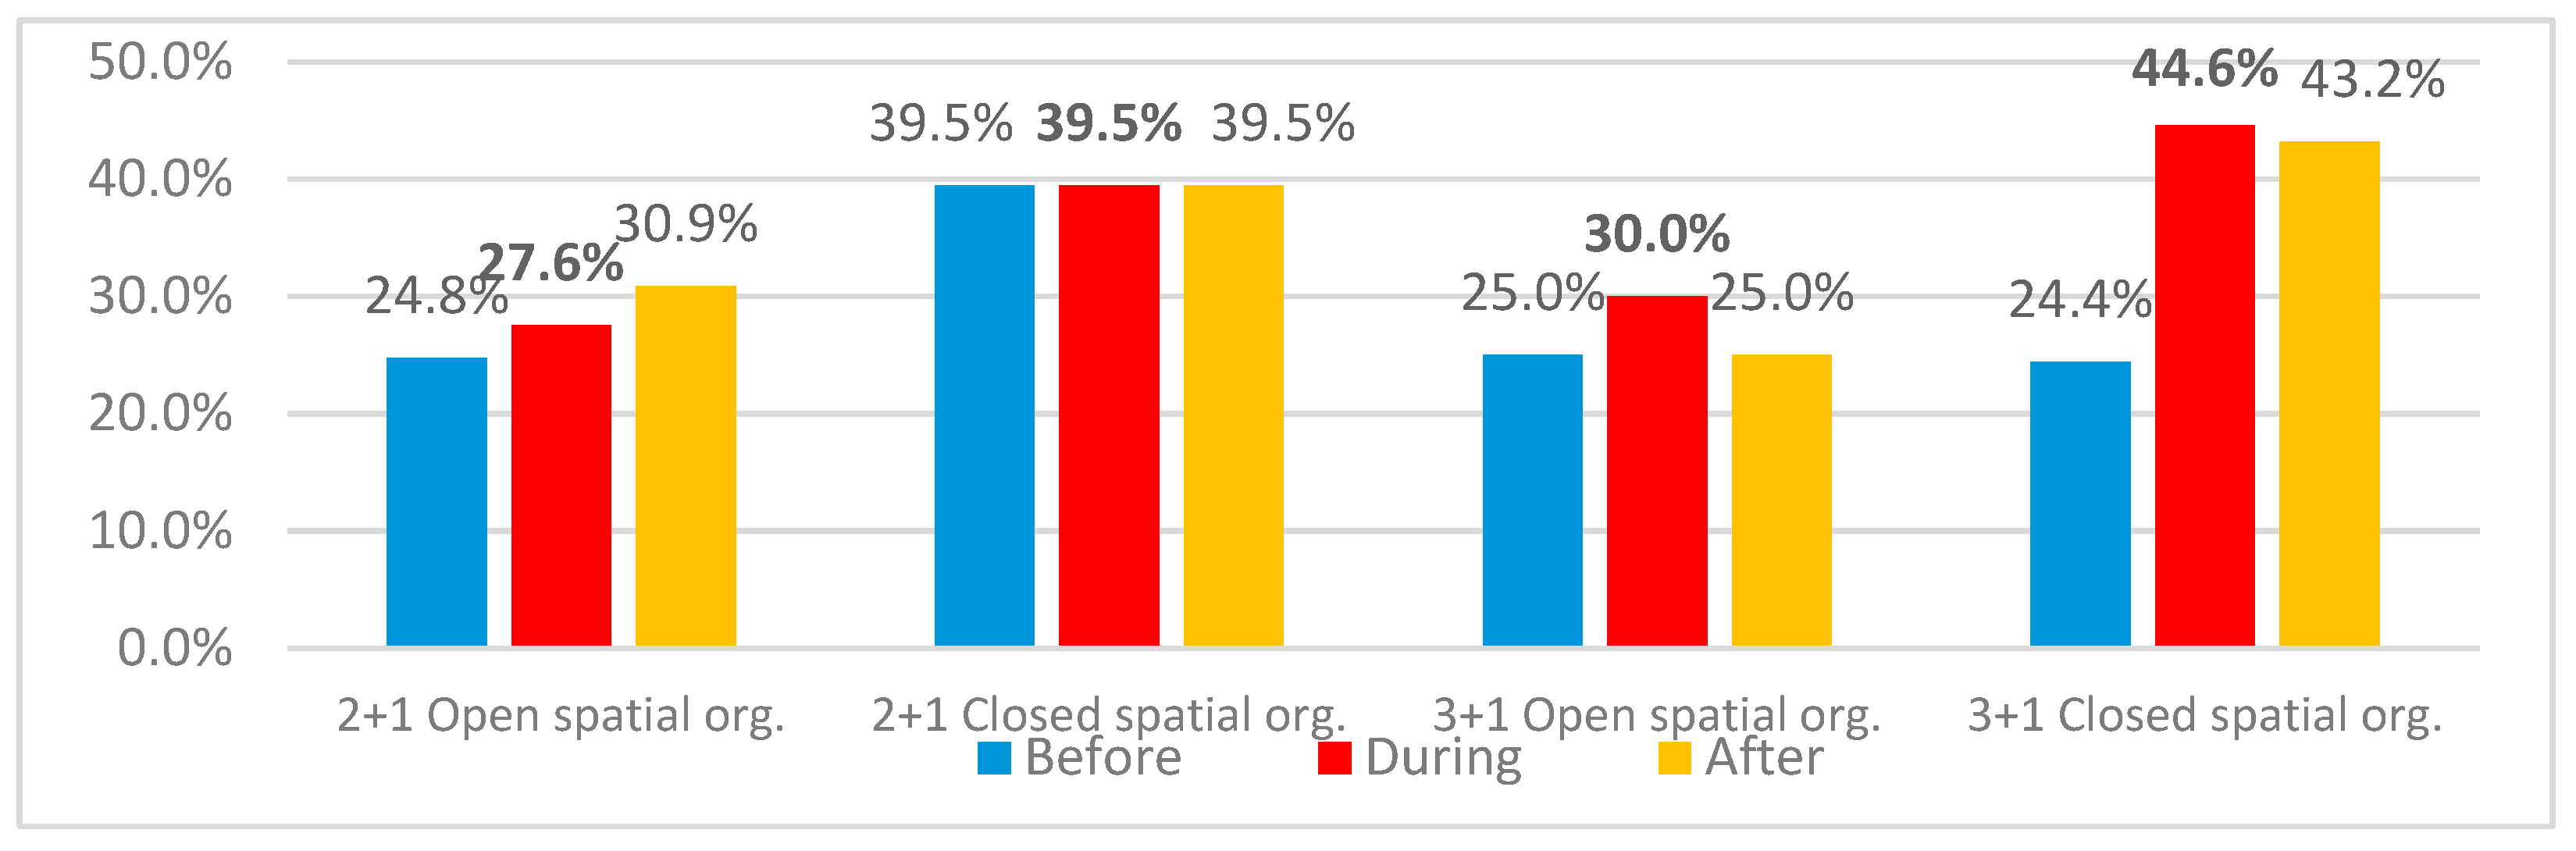
Figure 55.
Dissatisfaction variations for kitchen through three stages of study.
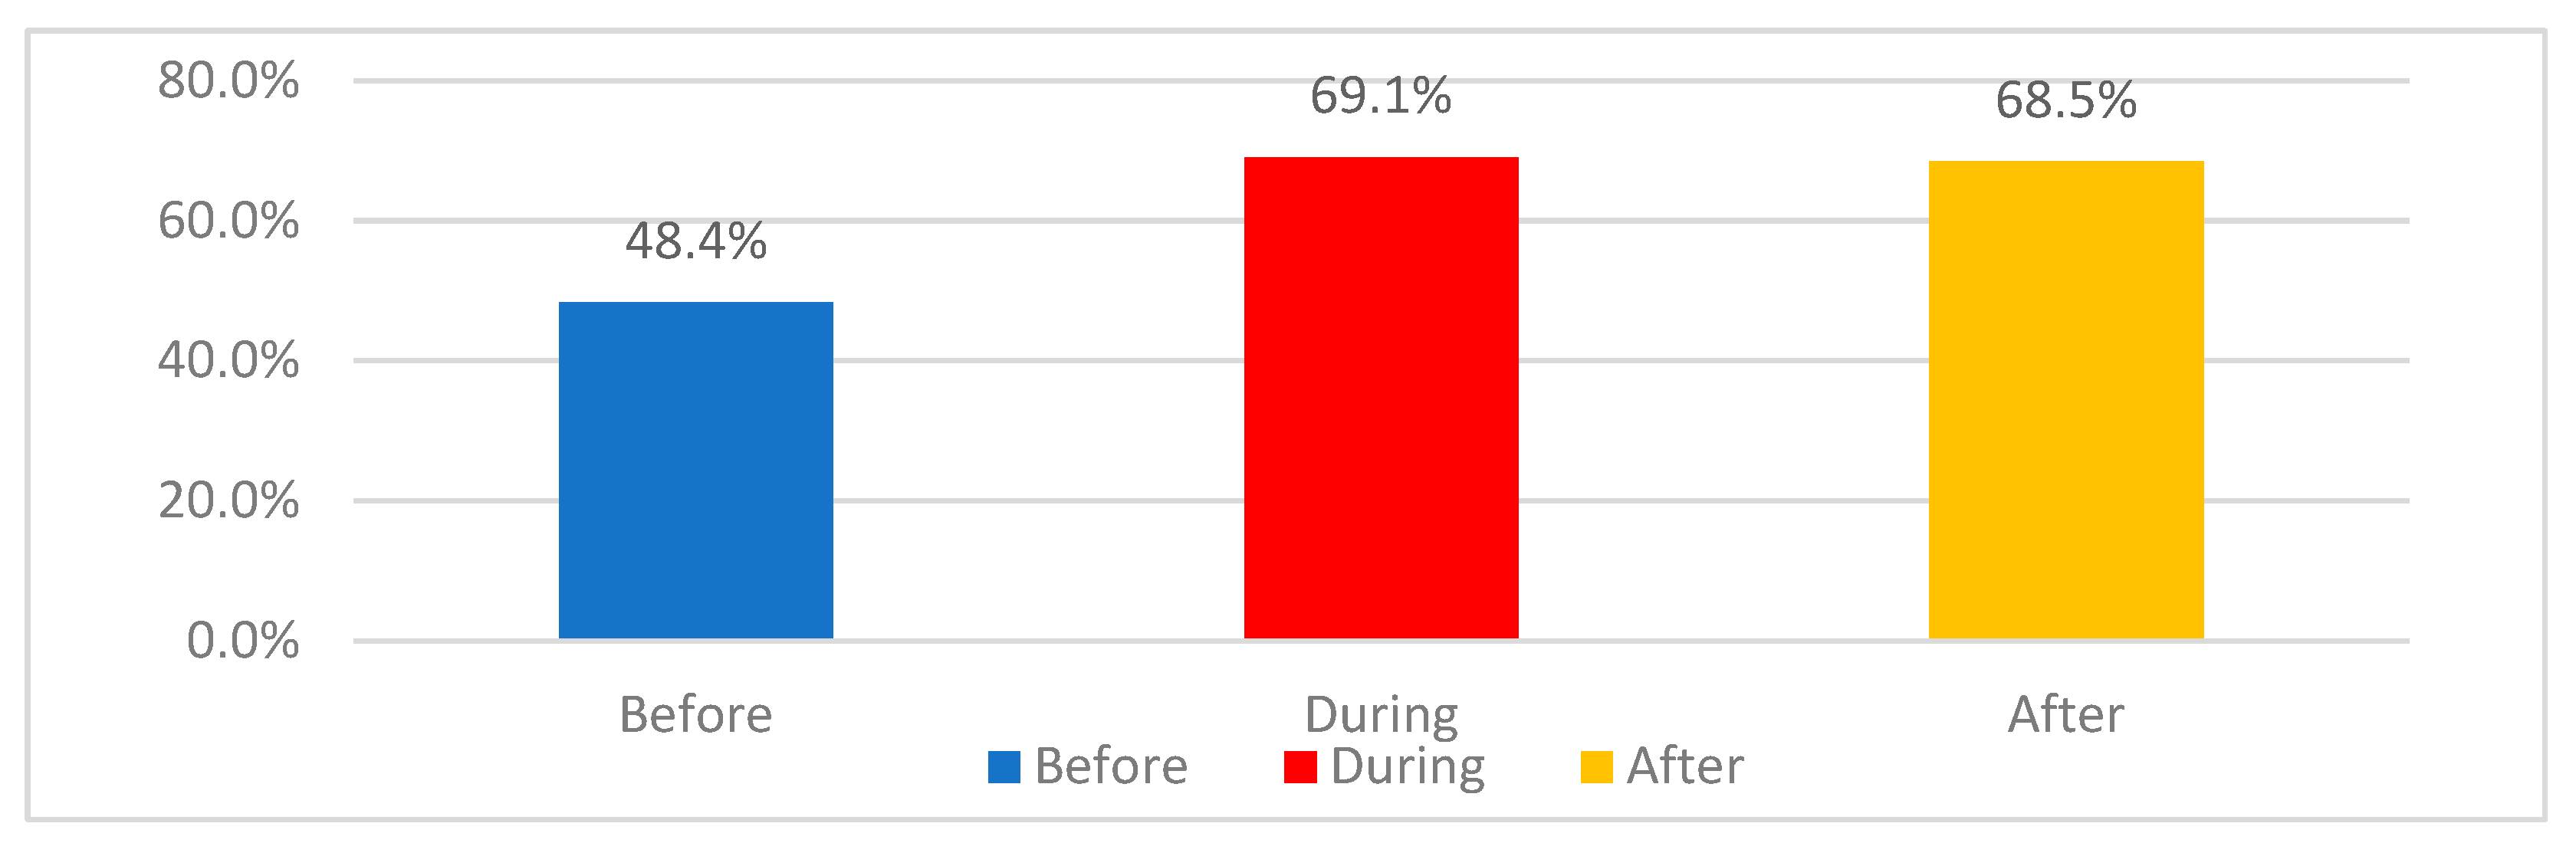
Figure 56.
main reasons for dissatisfaction differences for kitchen in all apartments .
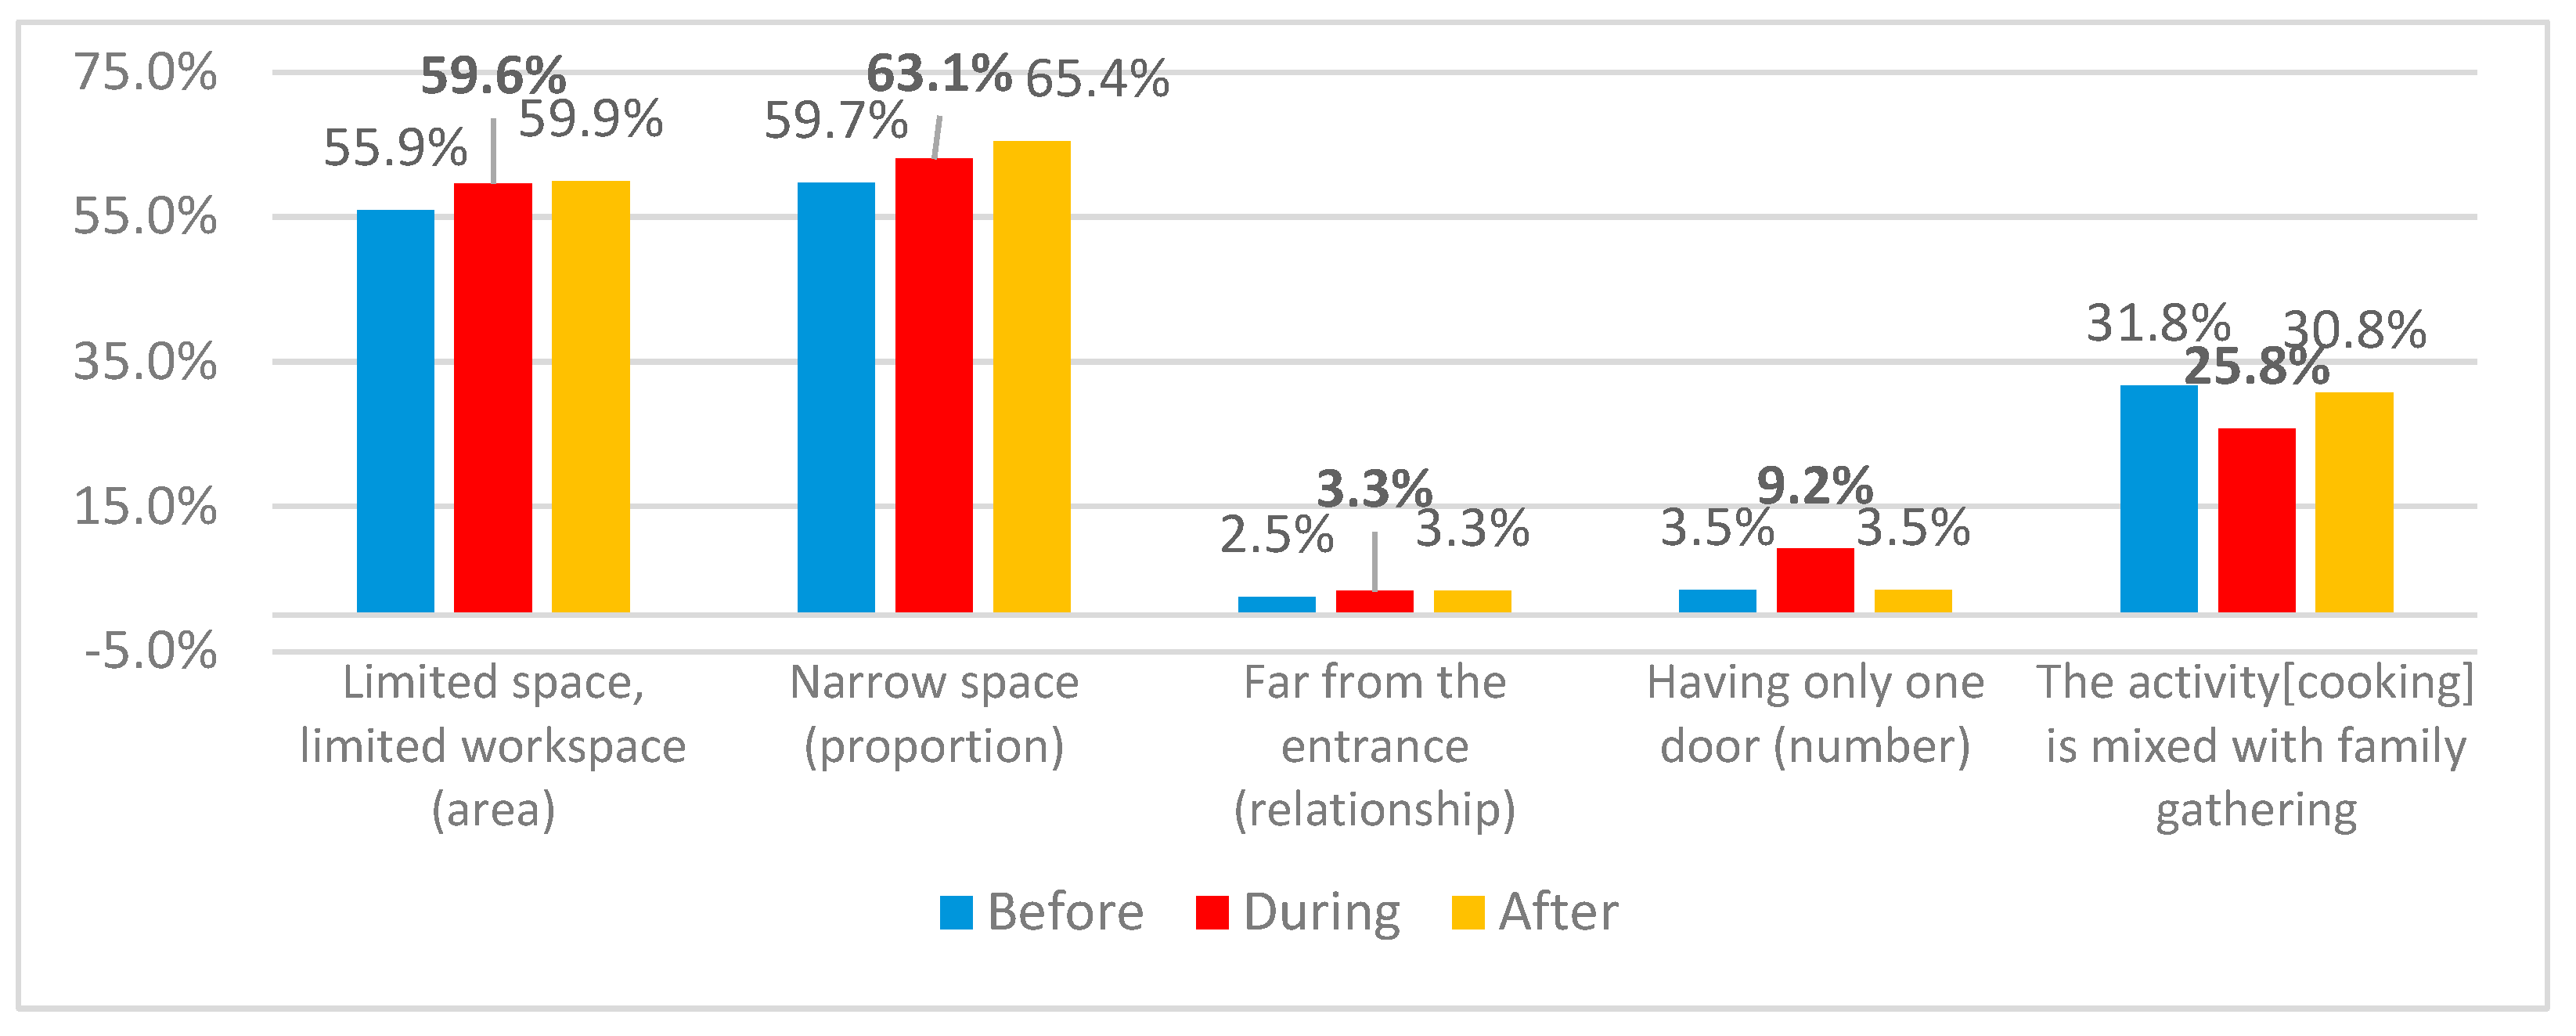
Figure 57.
Dissatisfaction differences for kitchens in 2+1 and 3+1 category.
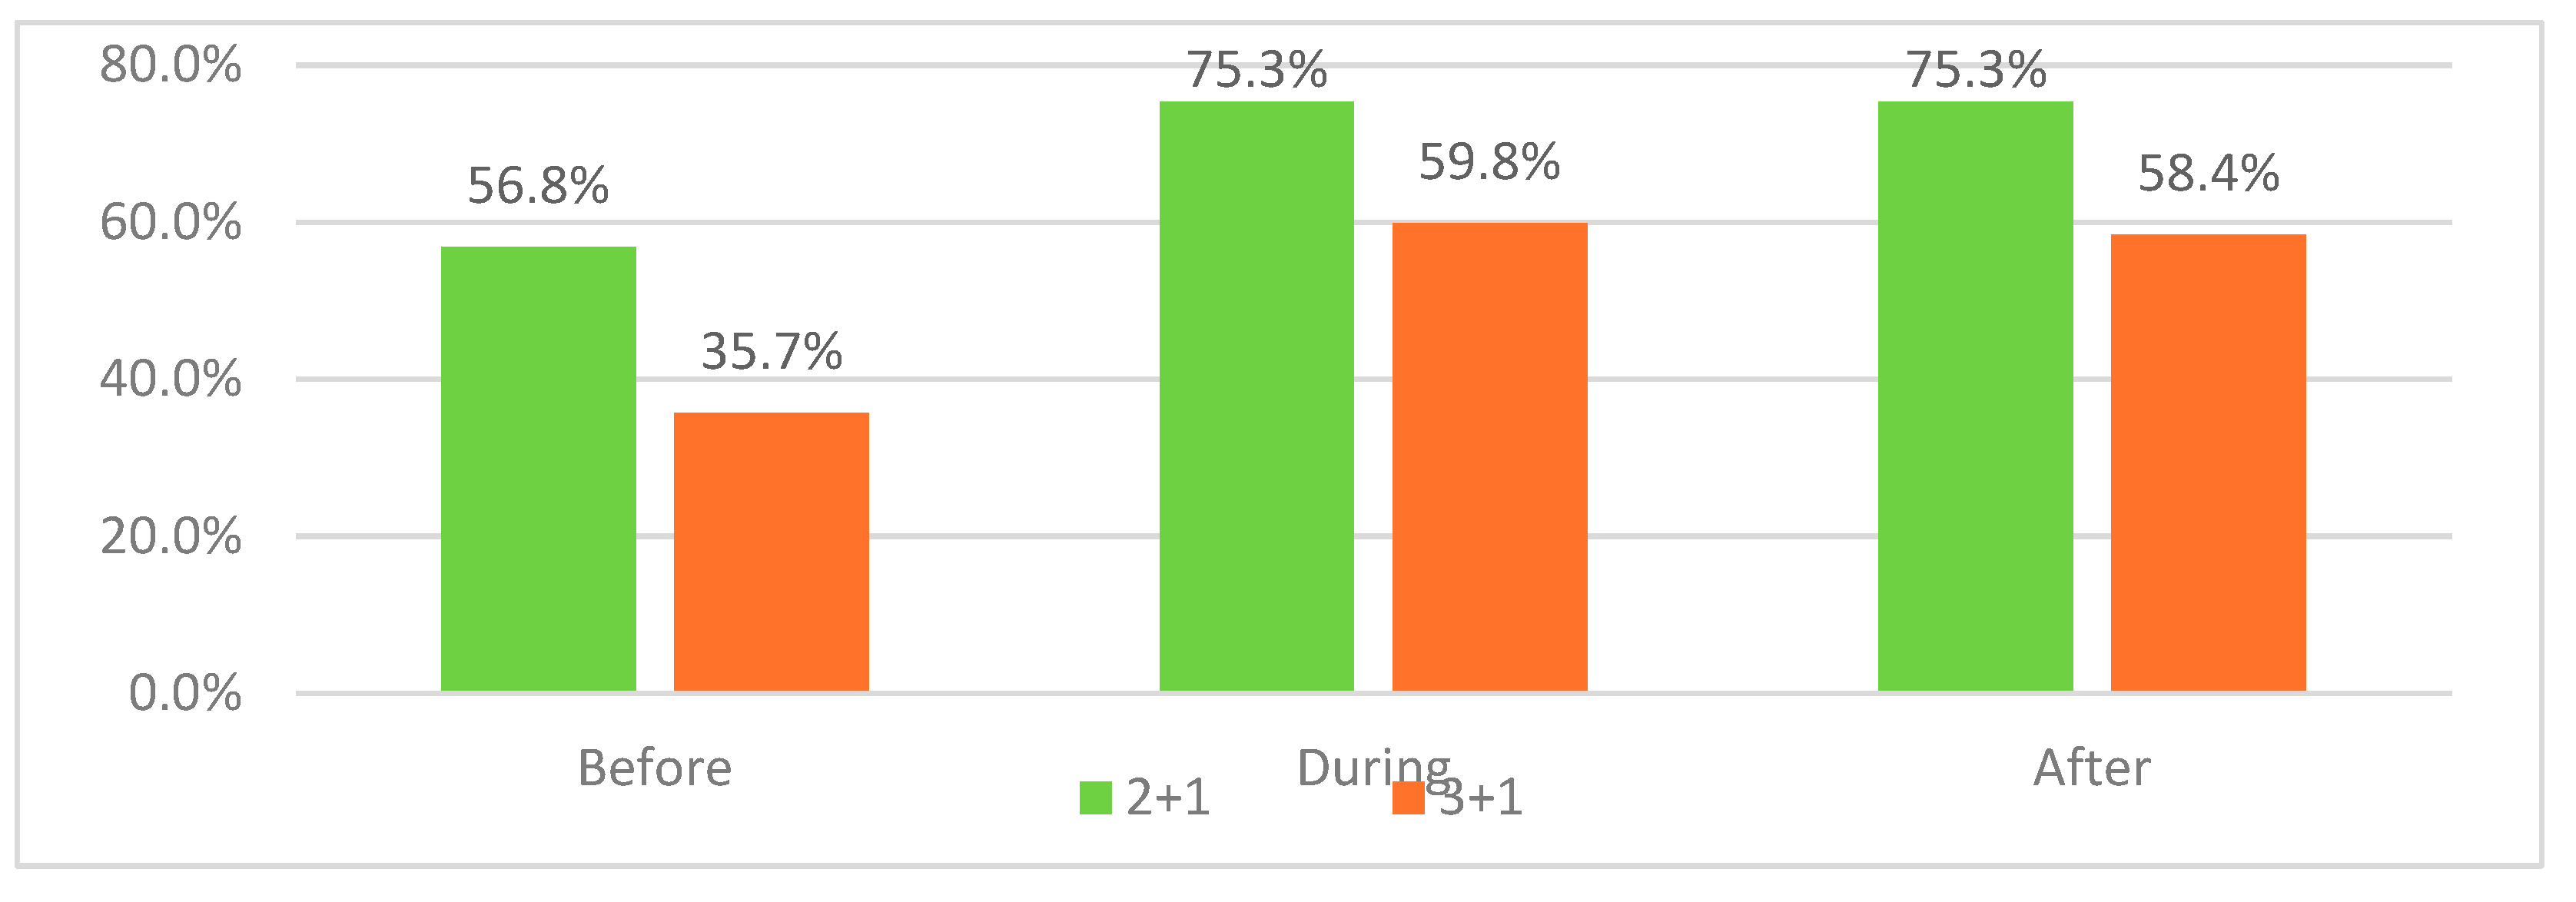
Figure 58.
Main reasons for dissatisfaction differences for kitchens for 2+1 category.
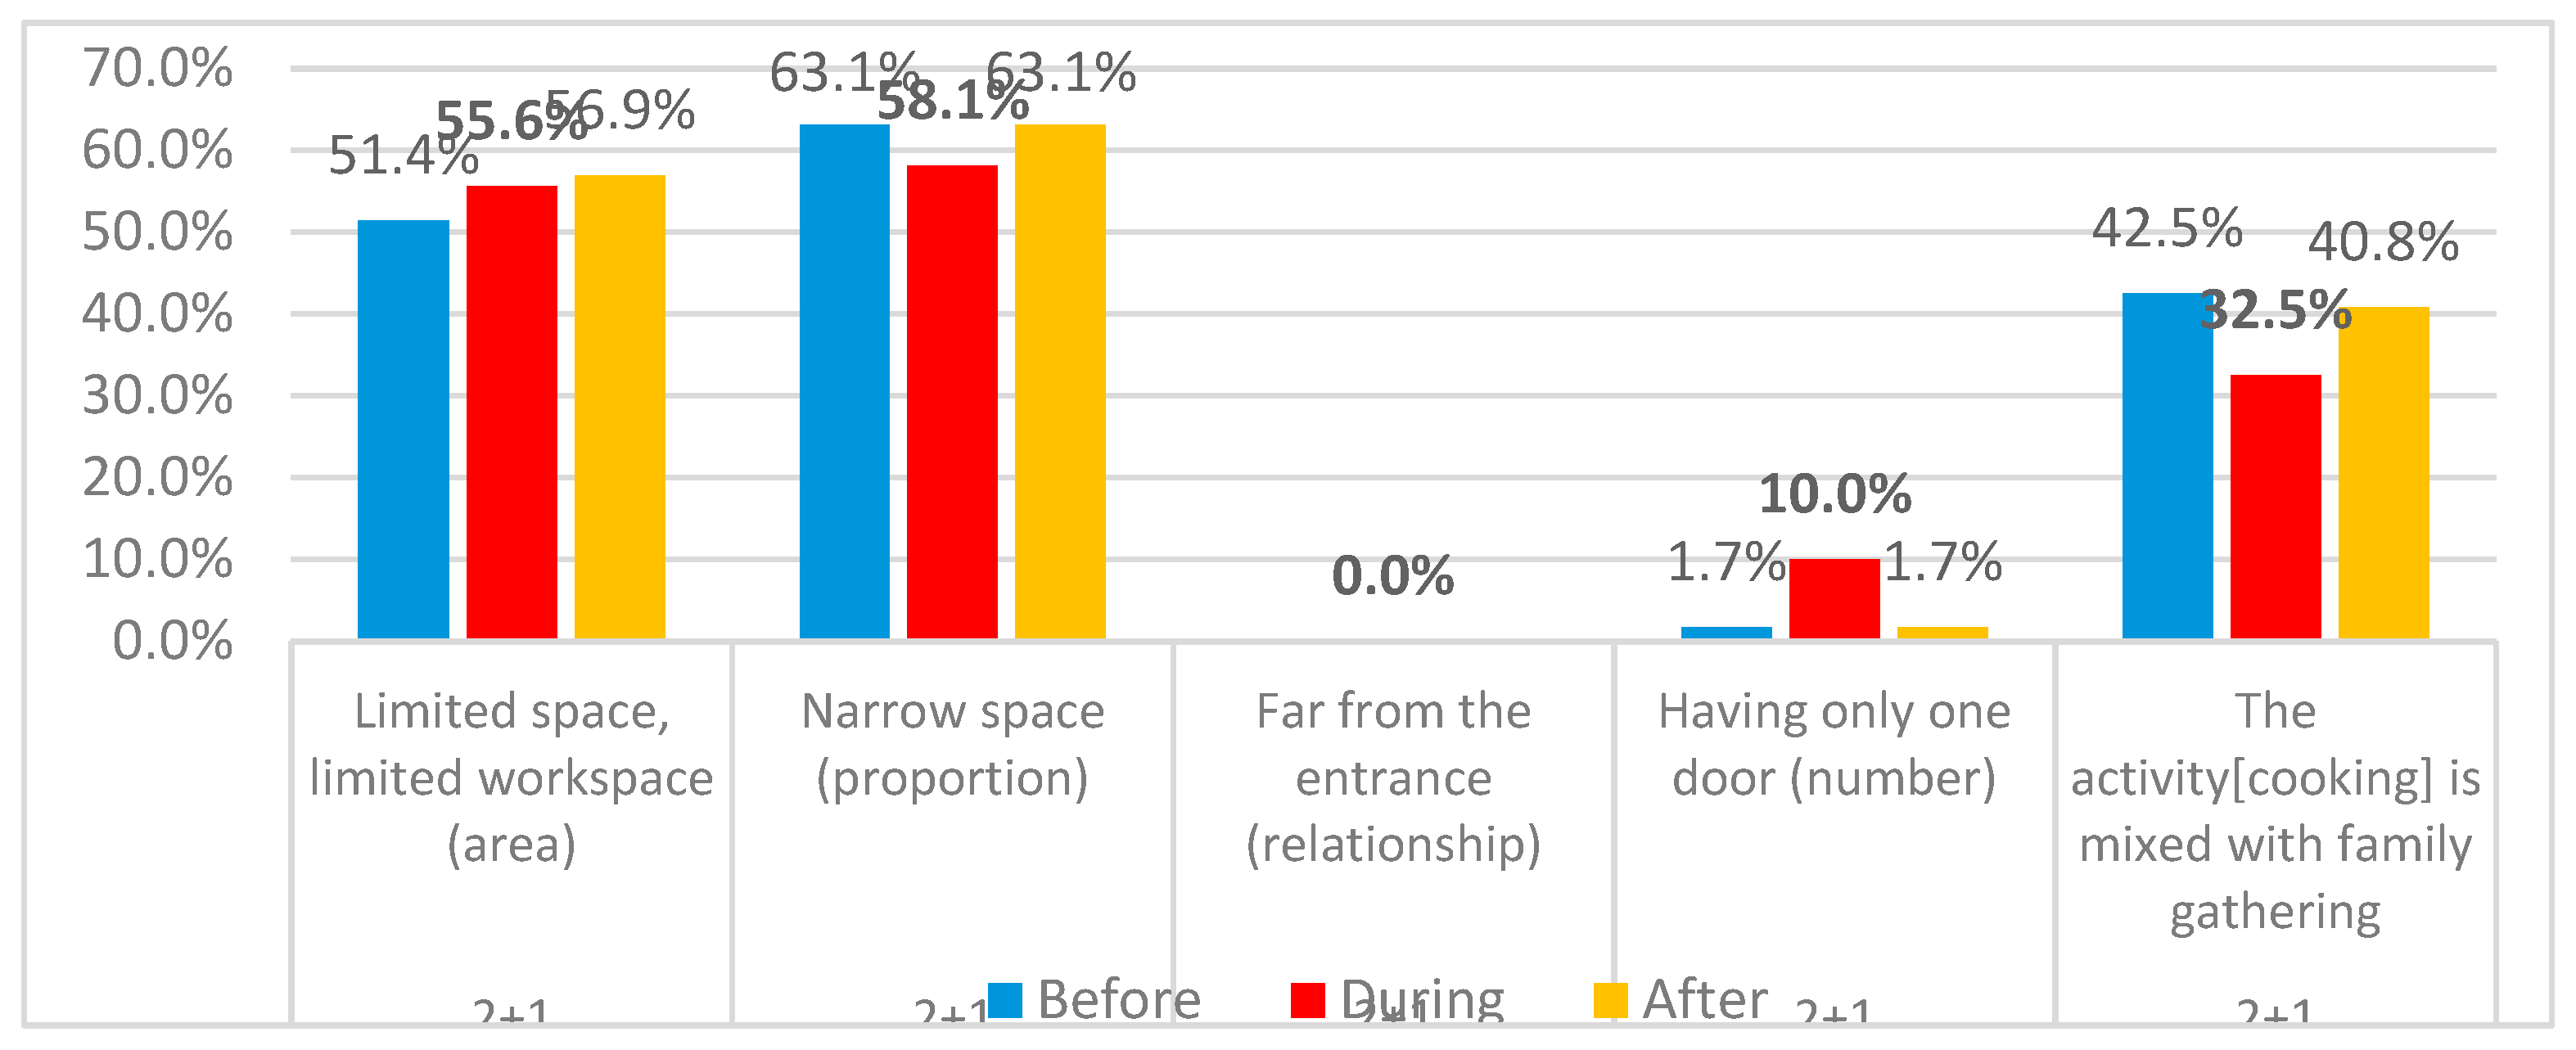
Figure 59.
Main reasons for dissatisfaction differences for kitchens for 3+1 category.
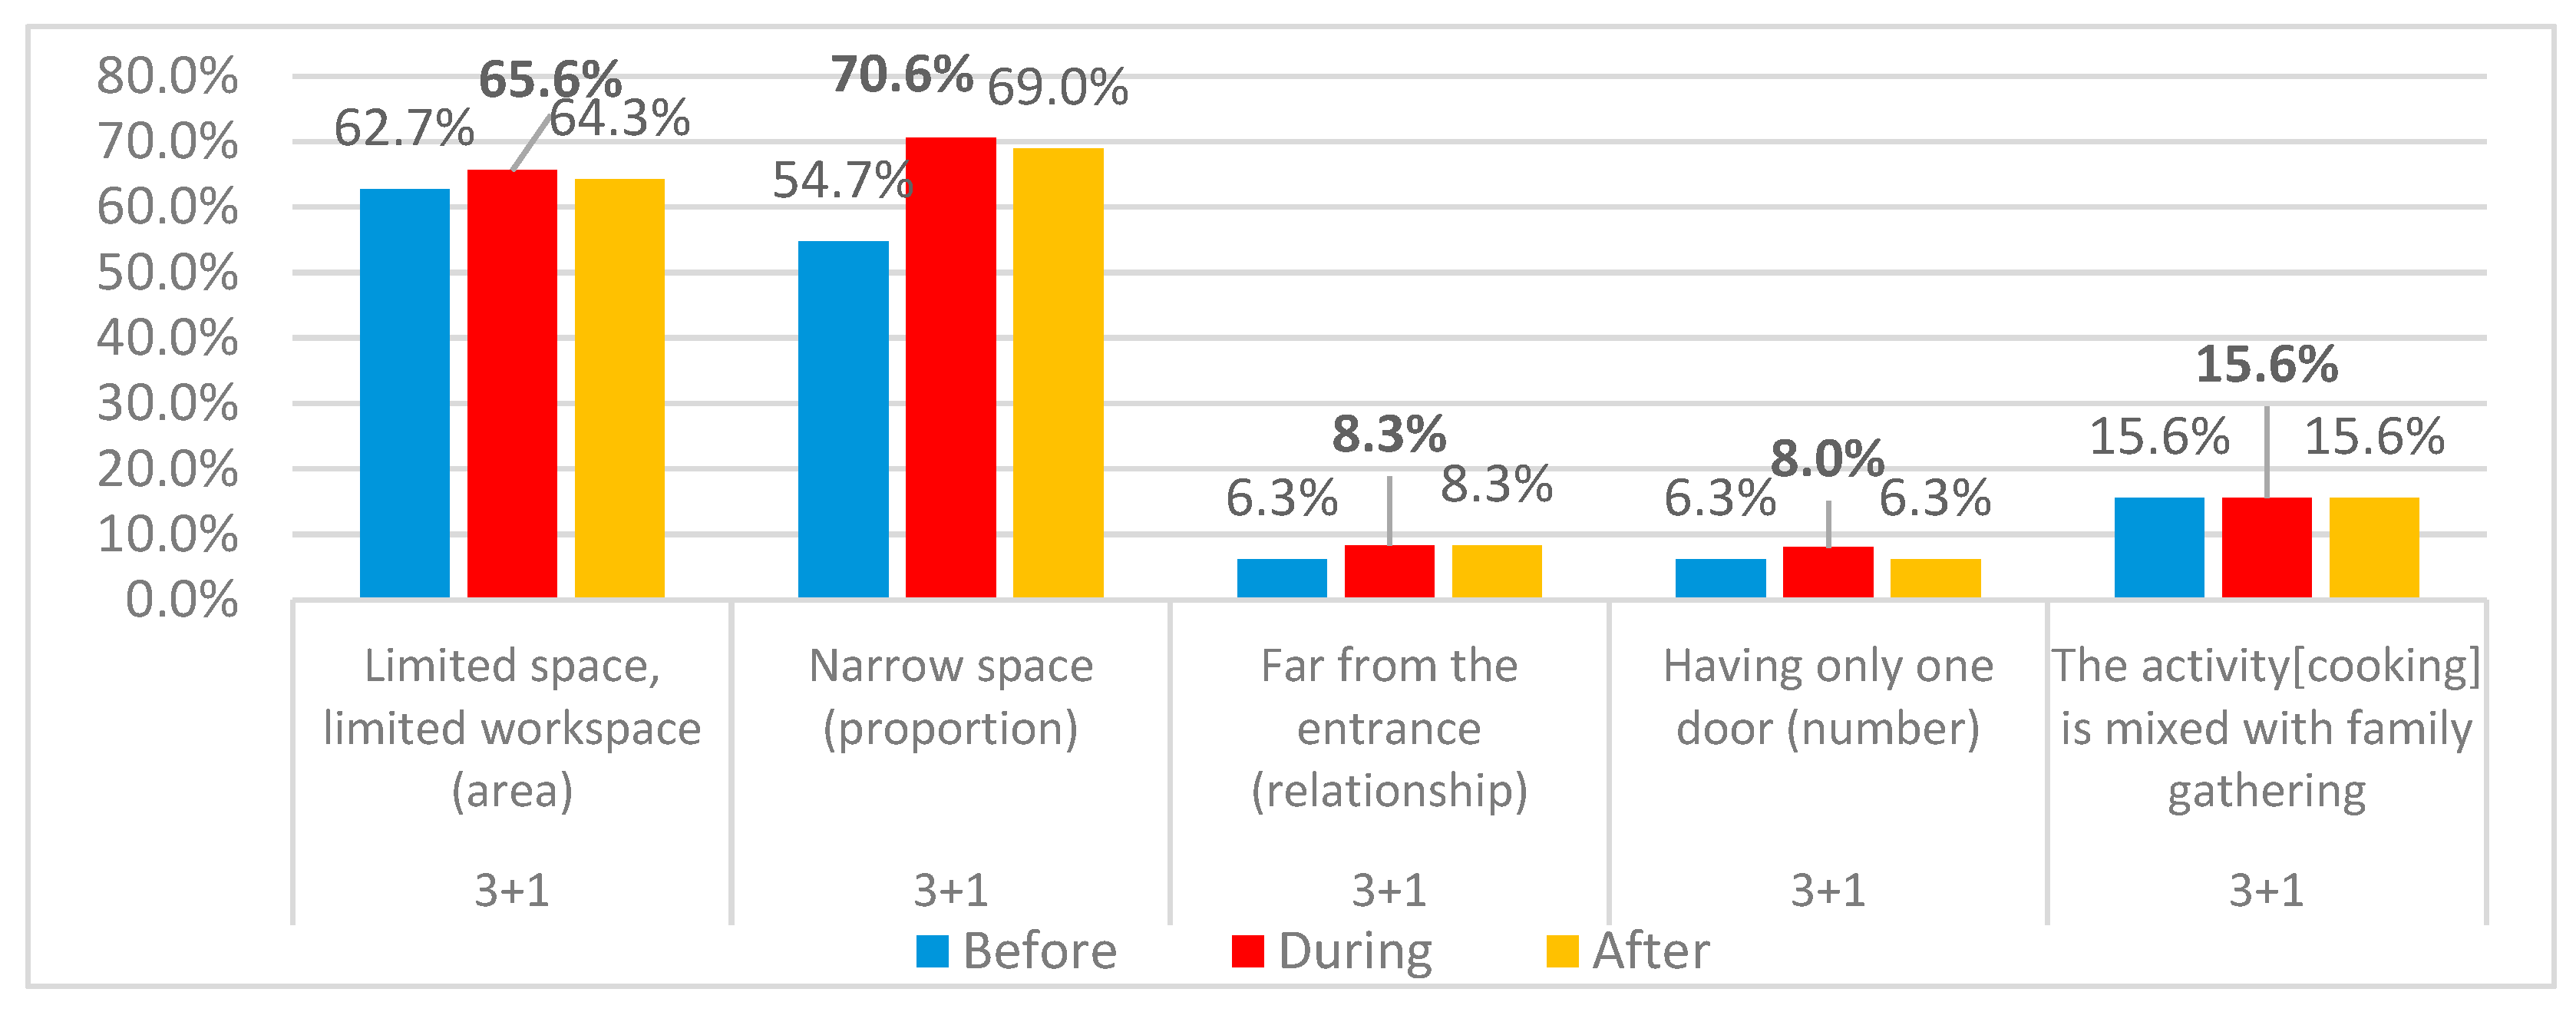
Figure 60.
Dissatisfaction variations for kitchens due to spatial organization.
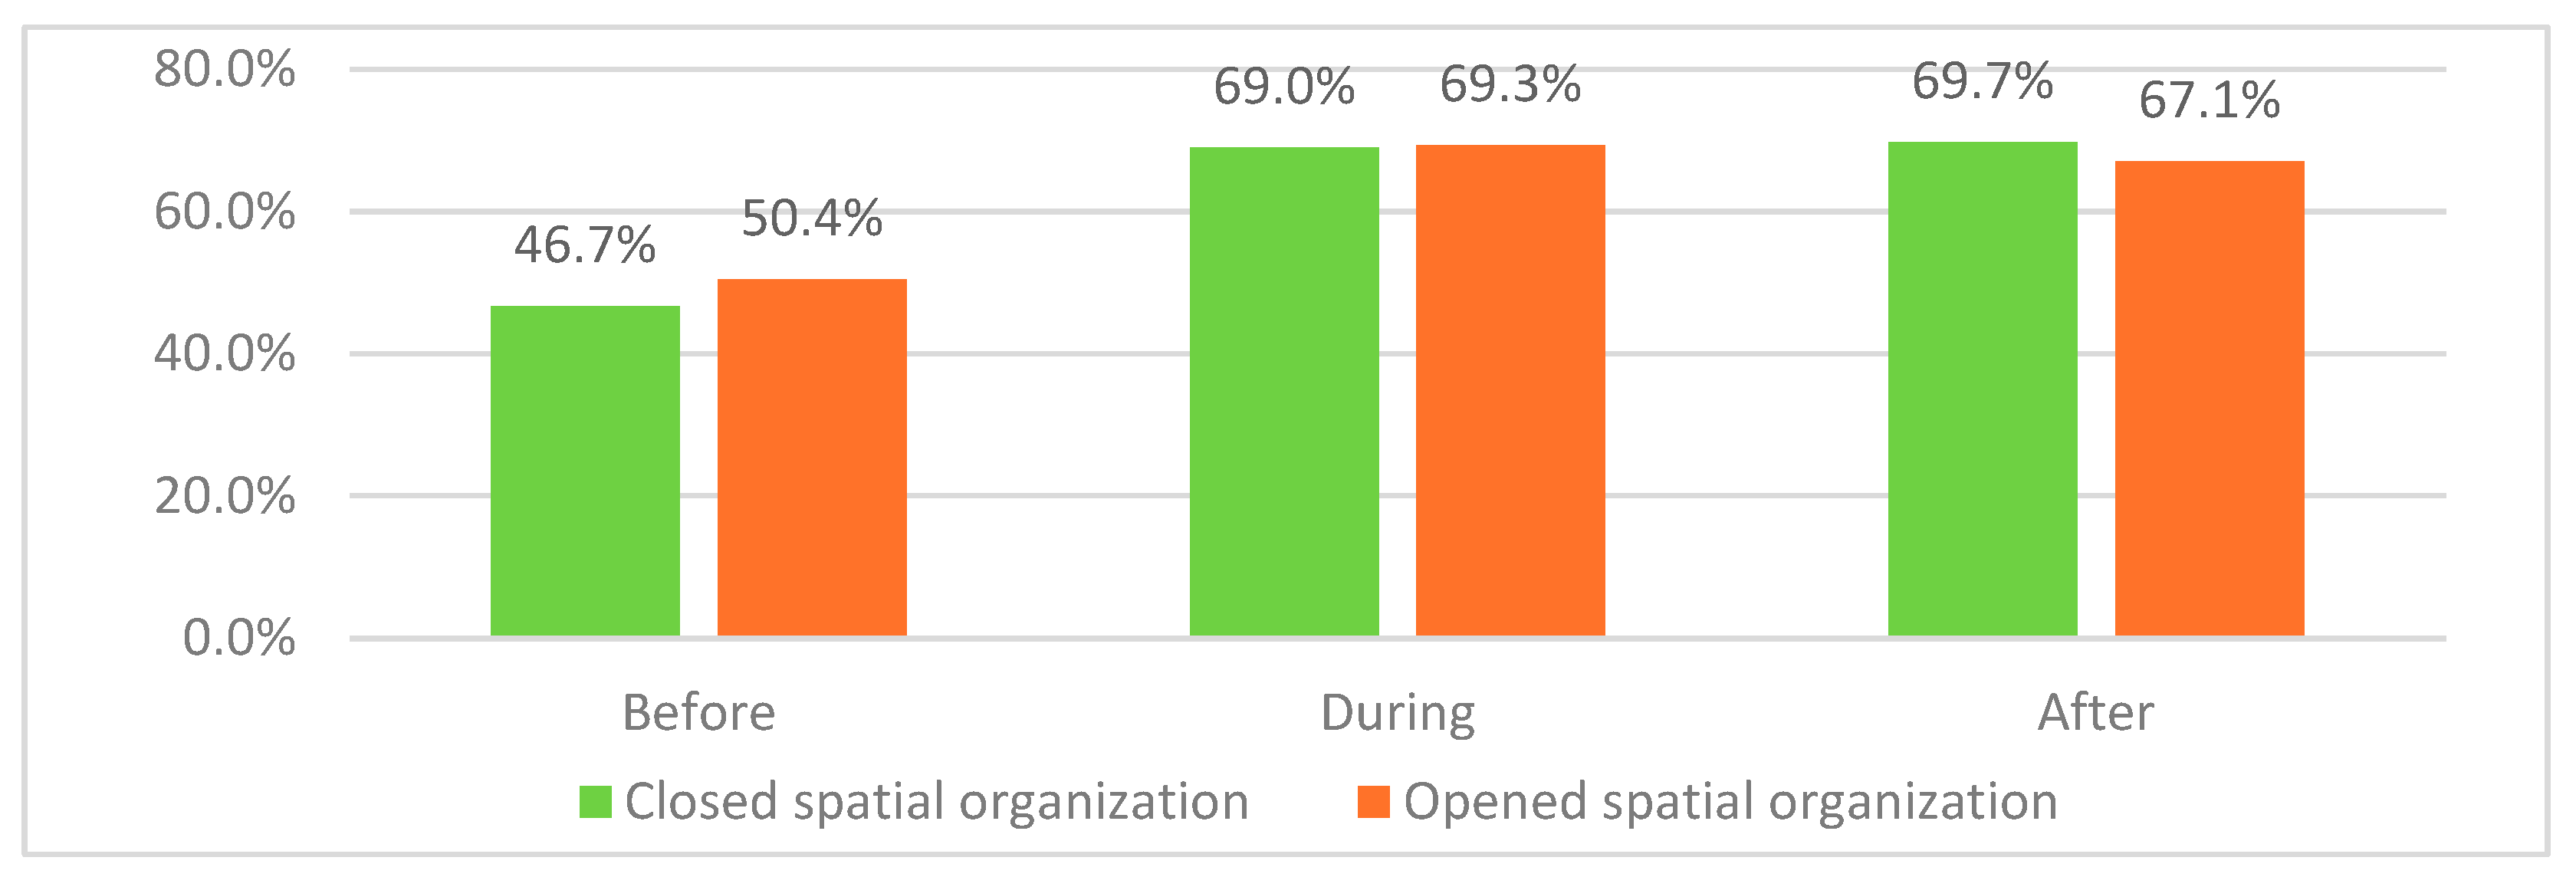
Figure 61.
Reasons of Dissatisfaction for kitchens for closed spatial organization .
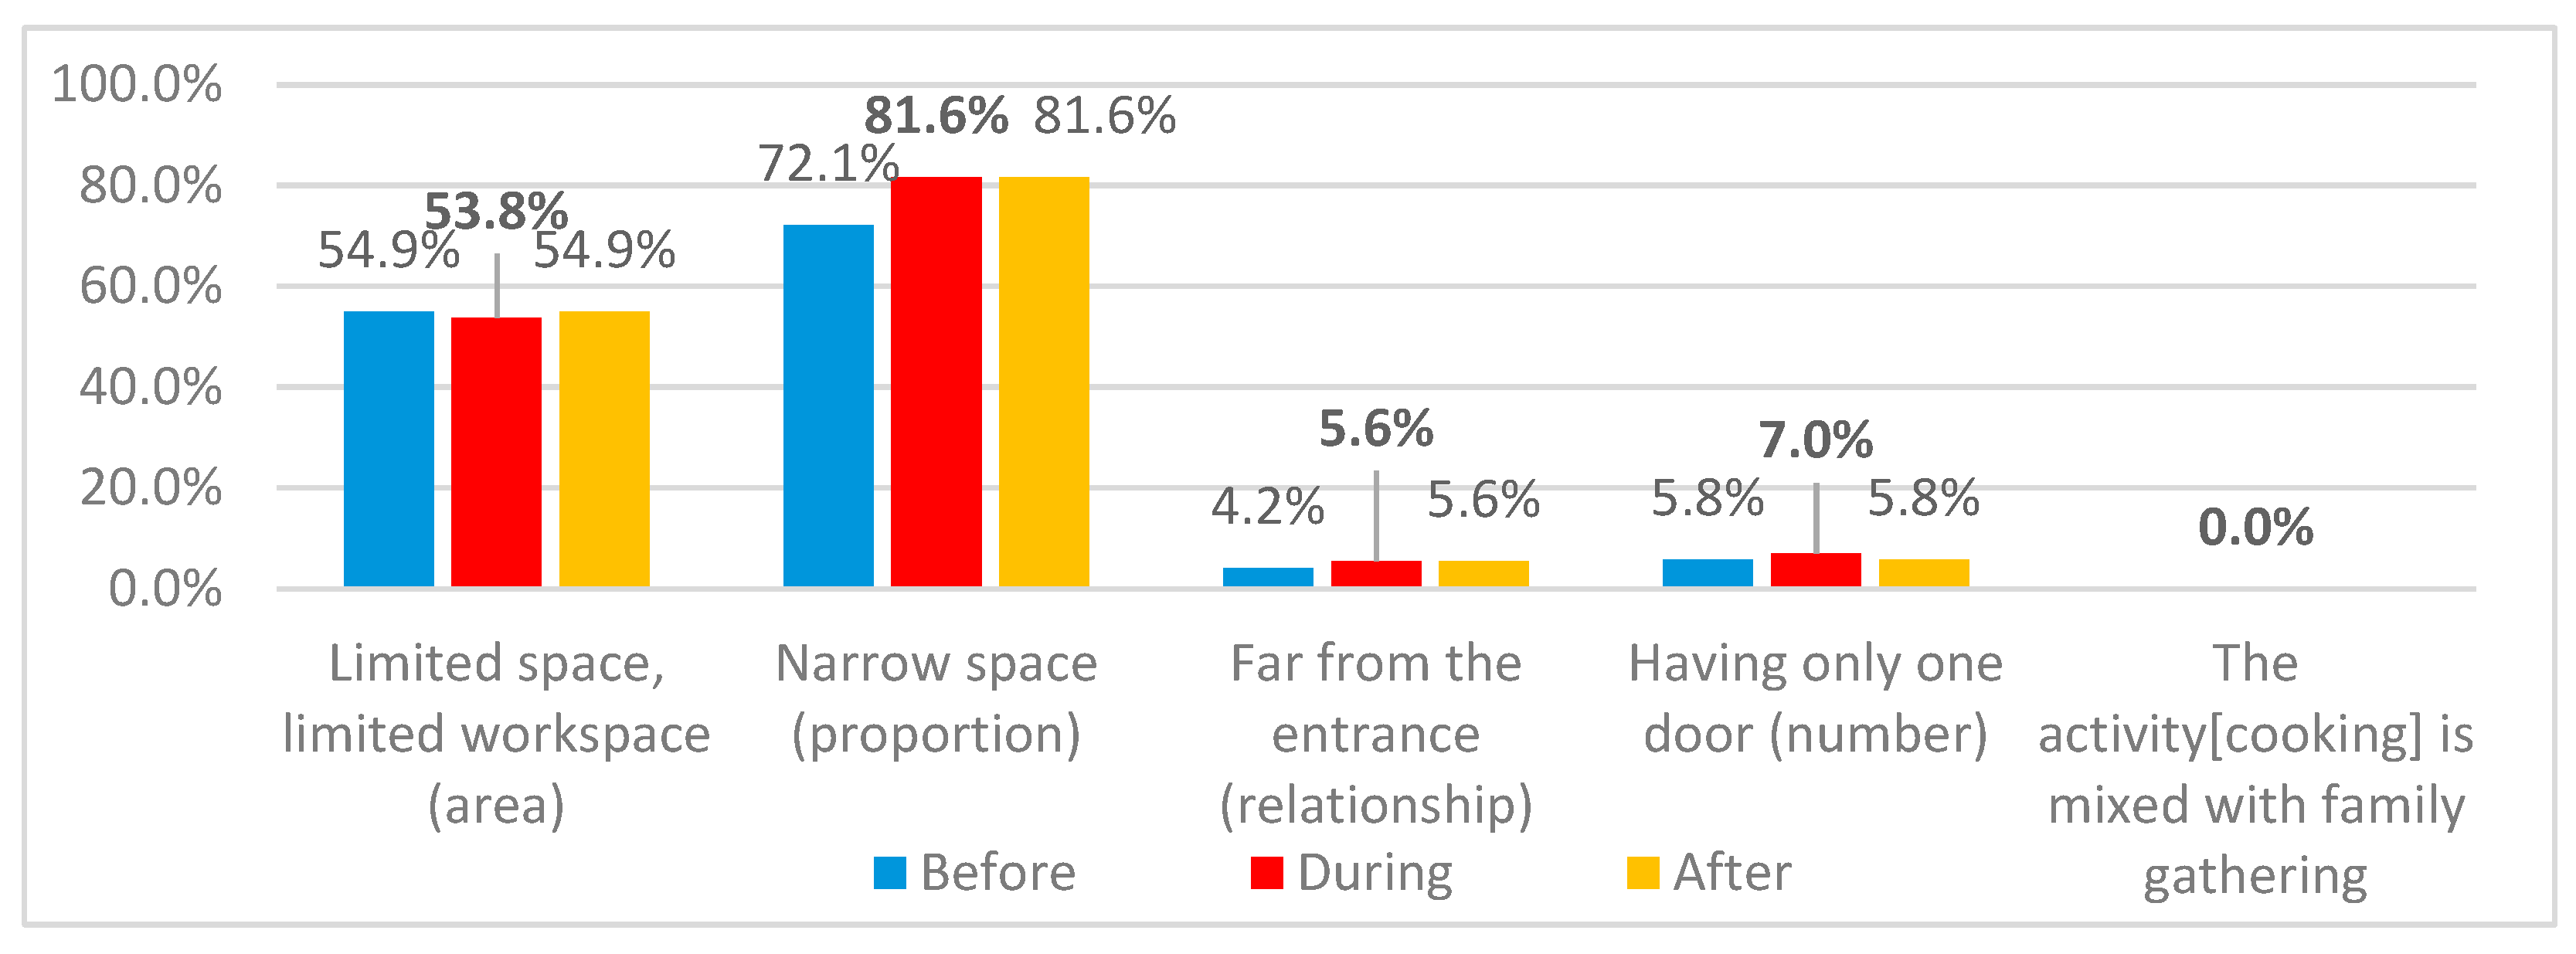
Figure 62.
Reasons of Dissatisfaction for kitchens for opened spatial organization .
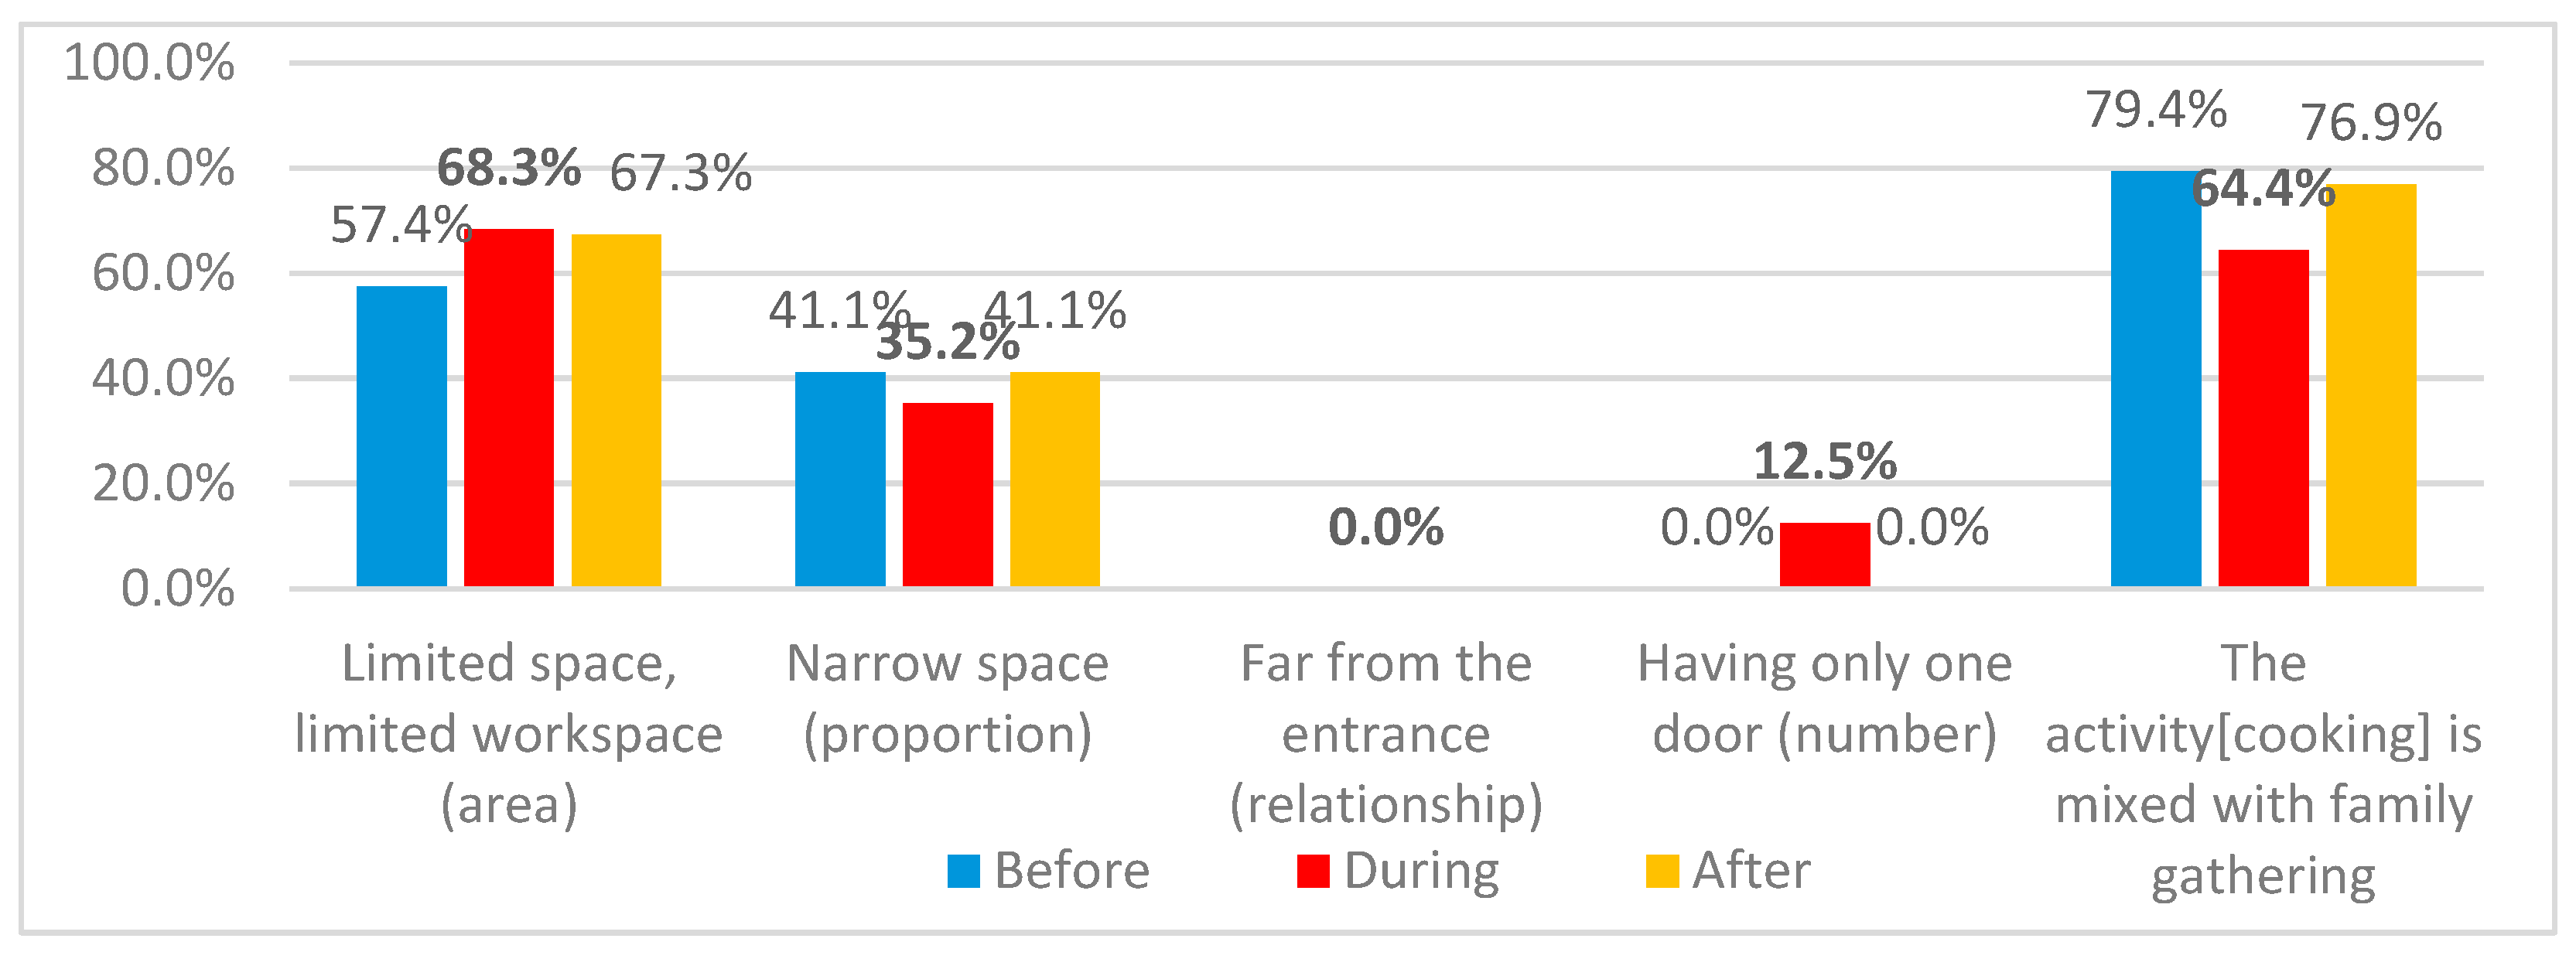
Figure 63.
Dissatisfaction variations for kitchens due to availability of family dining .
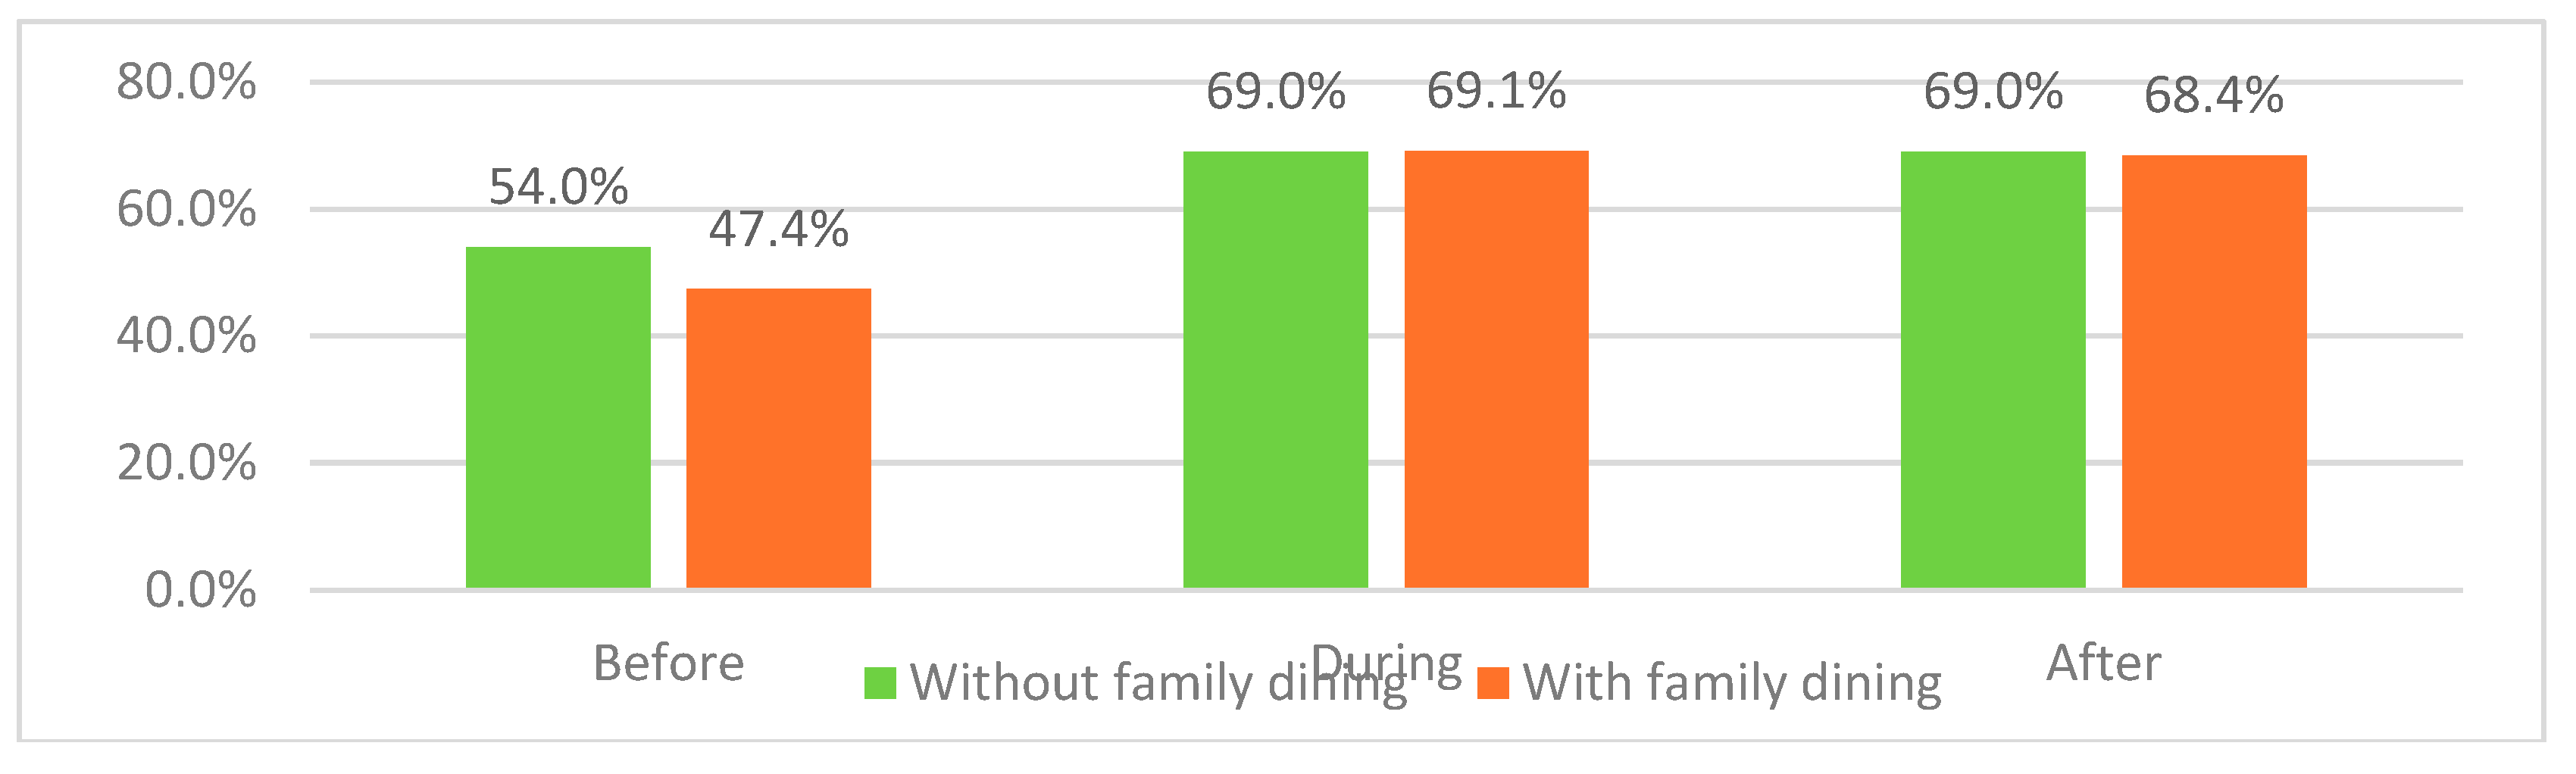
Figure 64.
Main reasons for dissatisfaction differences for kitchens without balcony.
Figure 65.
Main reasons for dissatisfaction differences for kitchens with balcony.
Figure 66.
Dissatisfaction variations for kitchens due to availability and absence of balcony with closed spatial organization .
Figure 66.
Dissatisfaction variations for kitchens due to availability and absence of balcony with closed spatial organization .
Figure 67.
Dissatisfaction variations for kitchens due to availability and absence of balcony with closed spatial organization .
Figure 67.
Dissatisfaction variations for kitchens due to availability and absence of balcony with closed spatial organization .
Figure 68.
Dissatisfaction variations for family bathroom through stages of study.
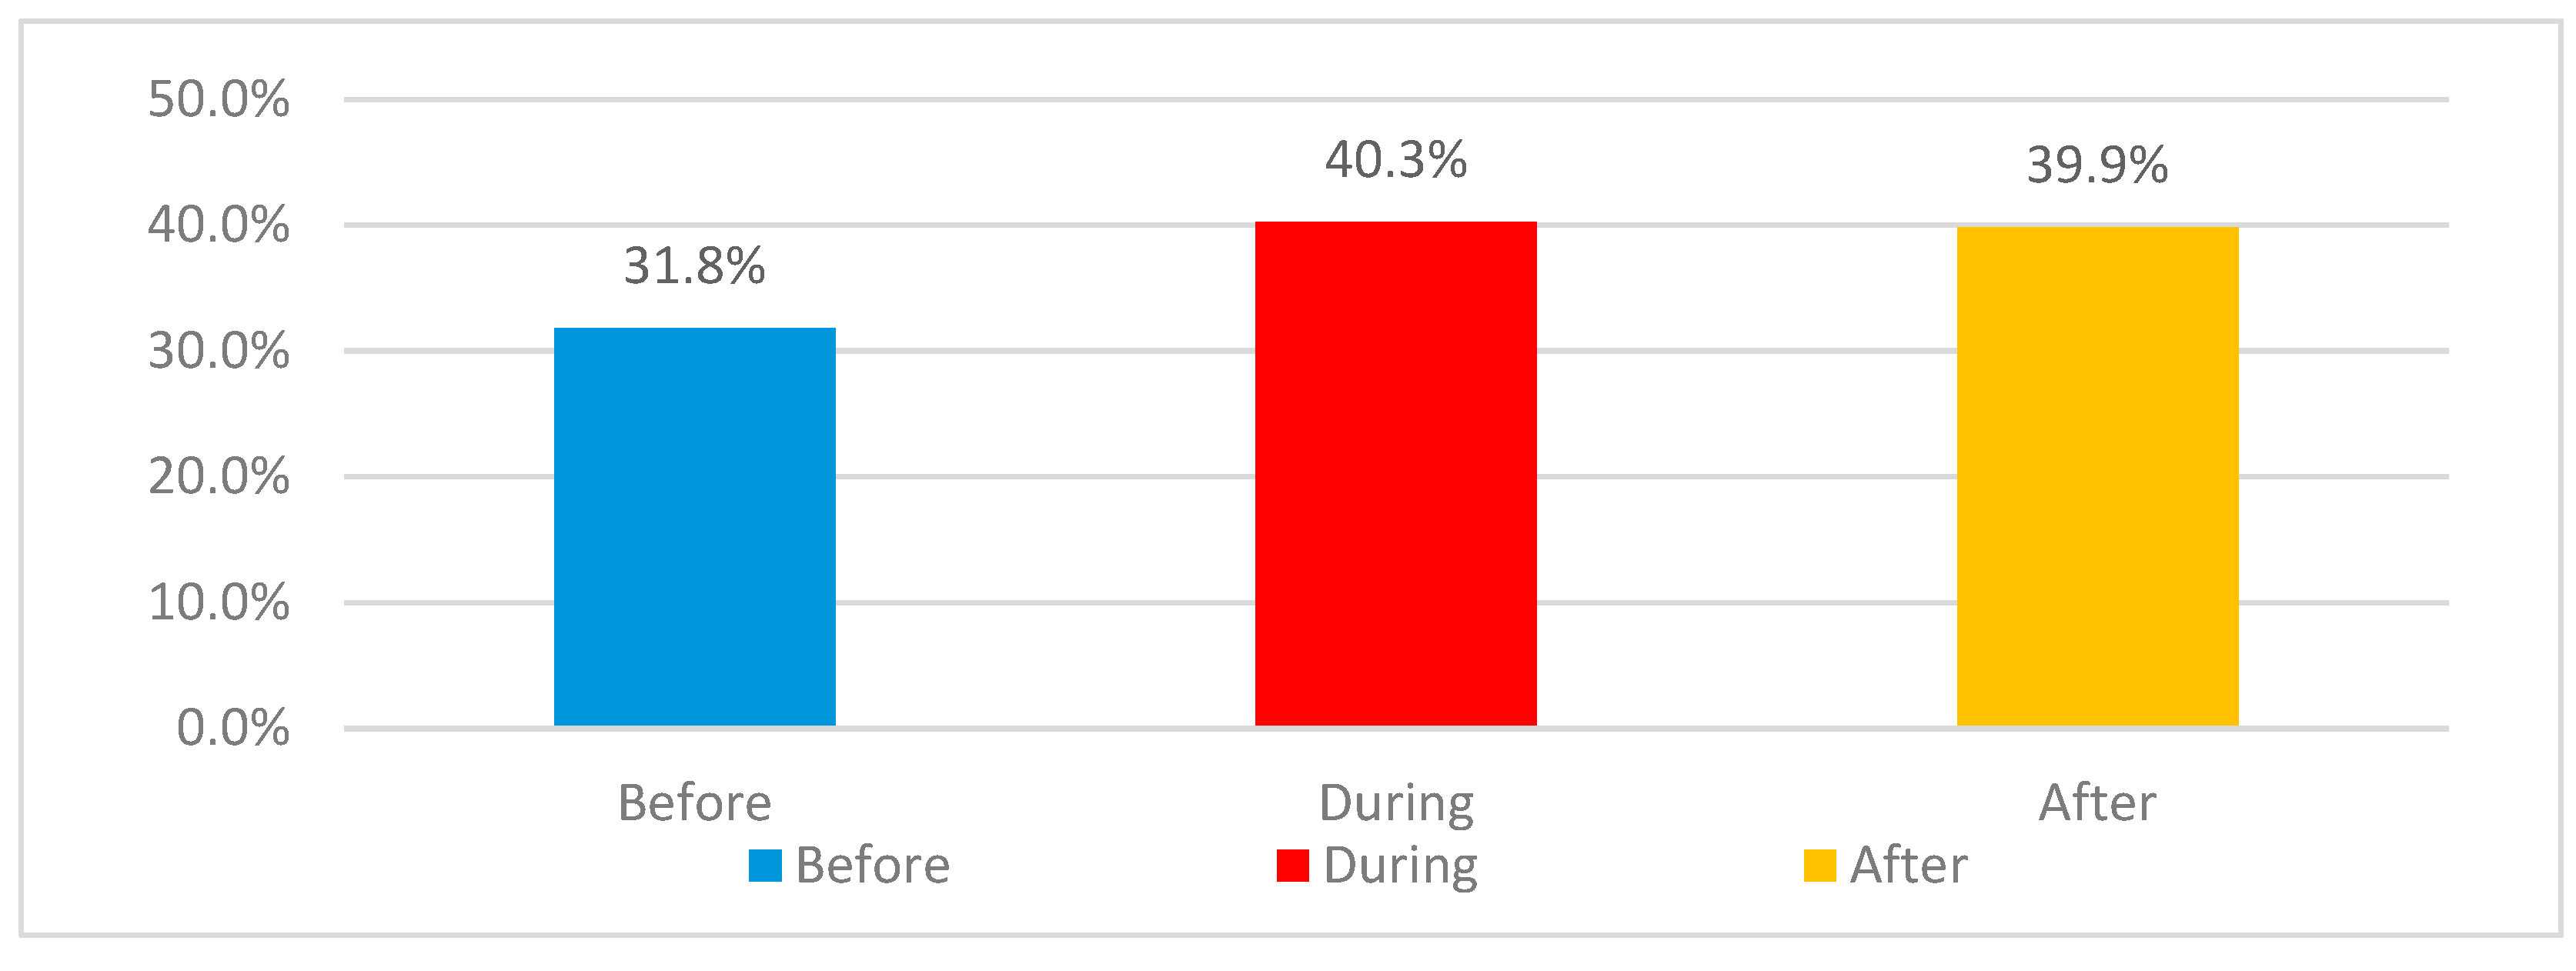
Figure 69.
Main reasons for dissatisfaction differences for family bathrooms .
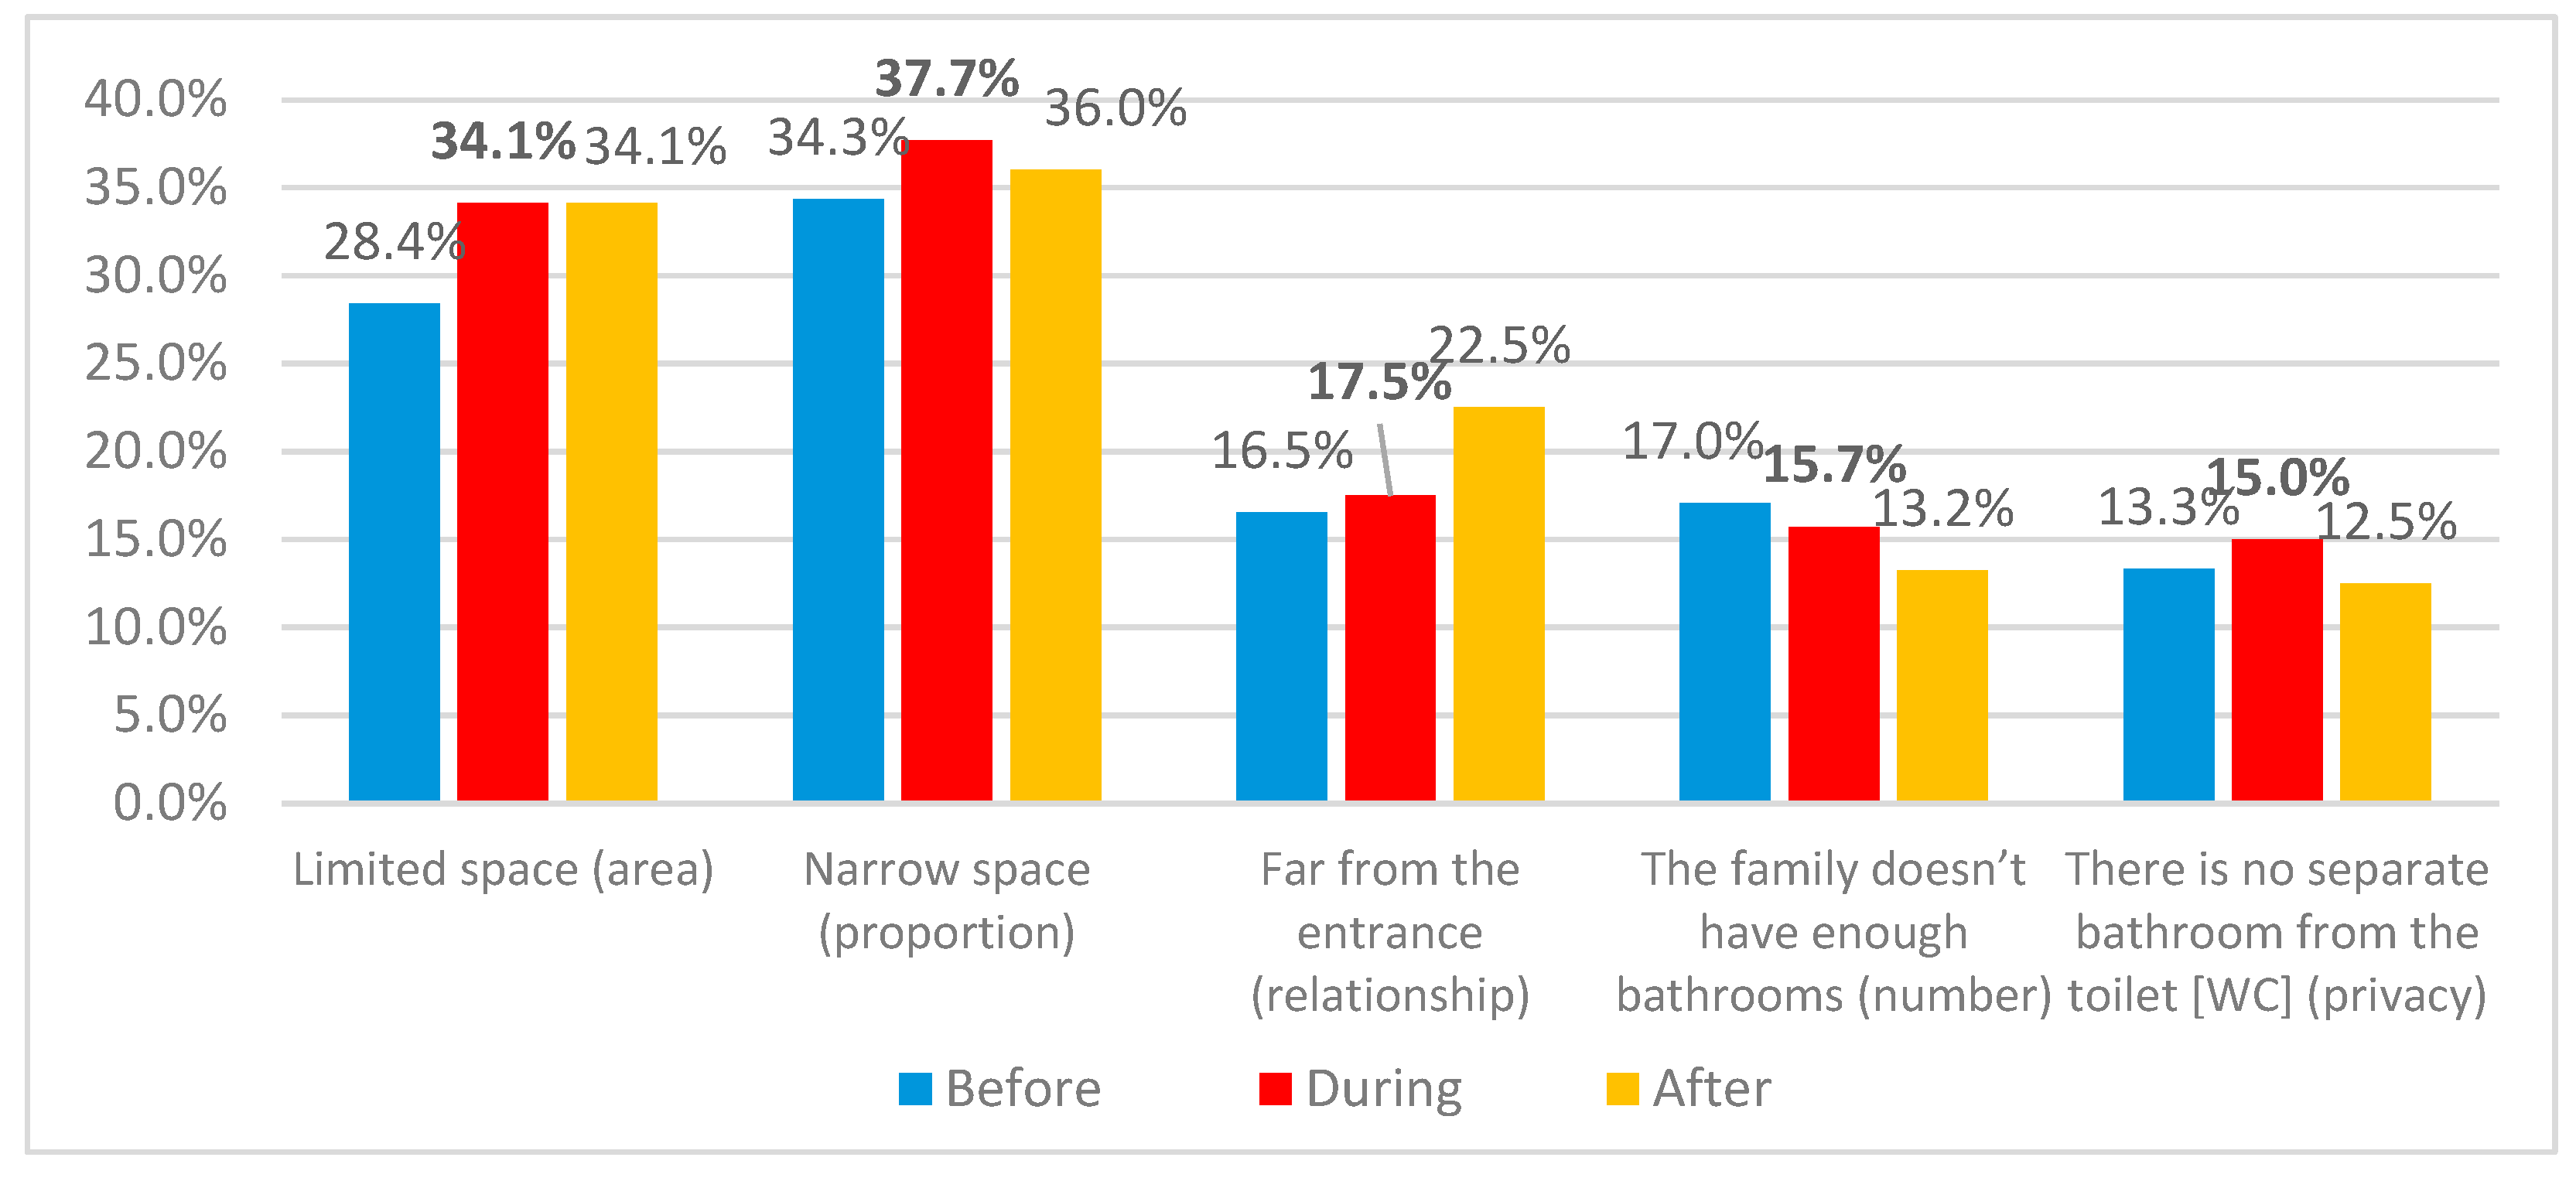
Figure 70.
Variations in dissatisfaction by the existence of master bathroom in addition to basic family bathroom.
Figure 70.
Variations in dissatisfaction by the existence of master bathroom in addition to basic family bathroom.
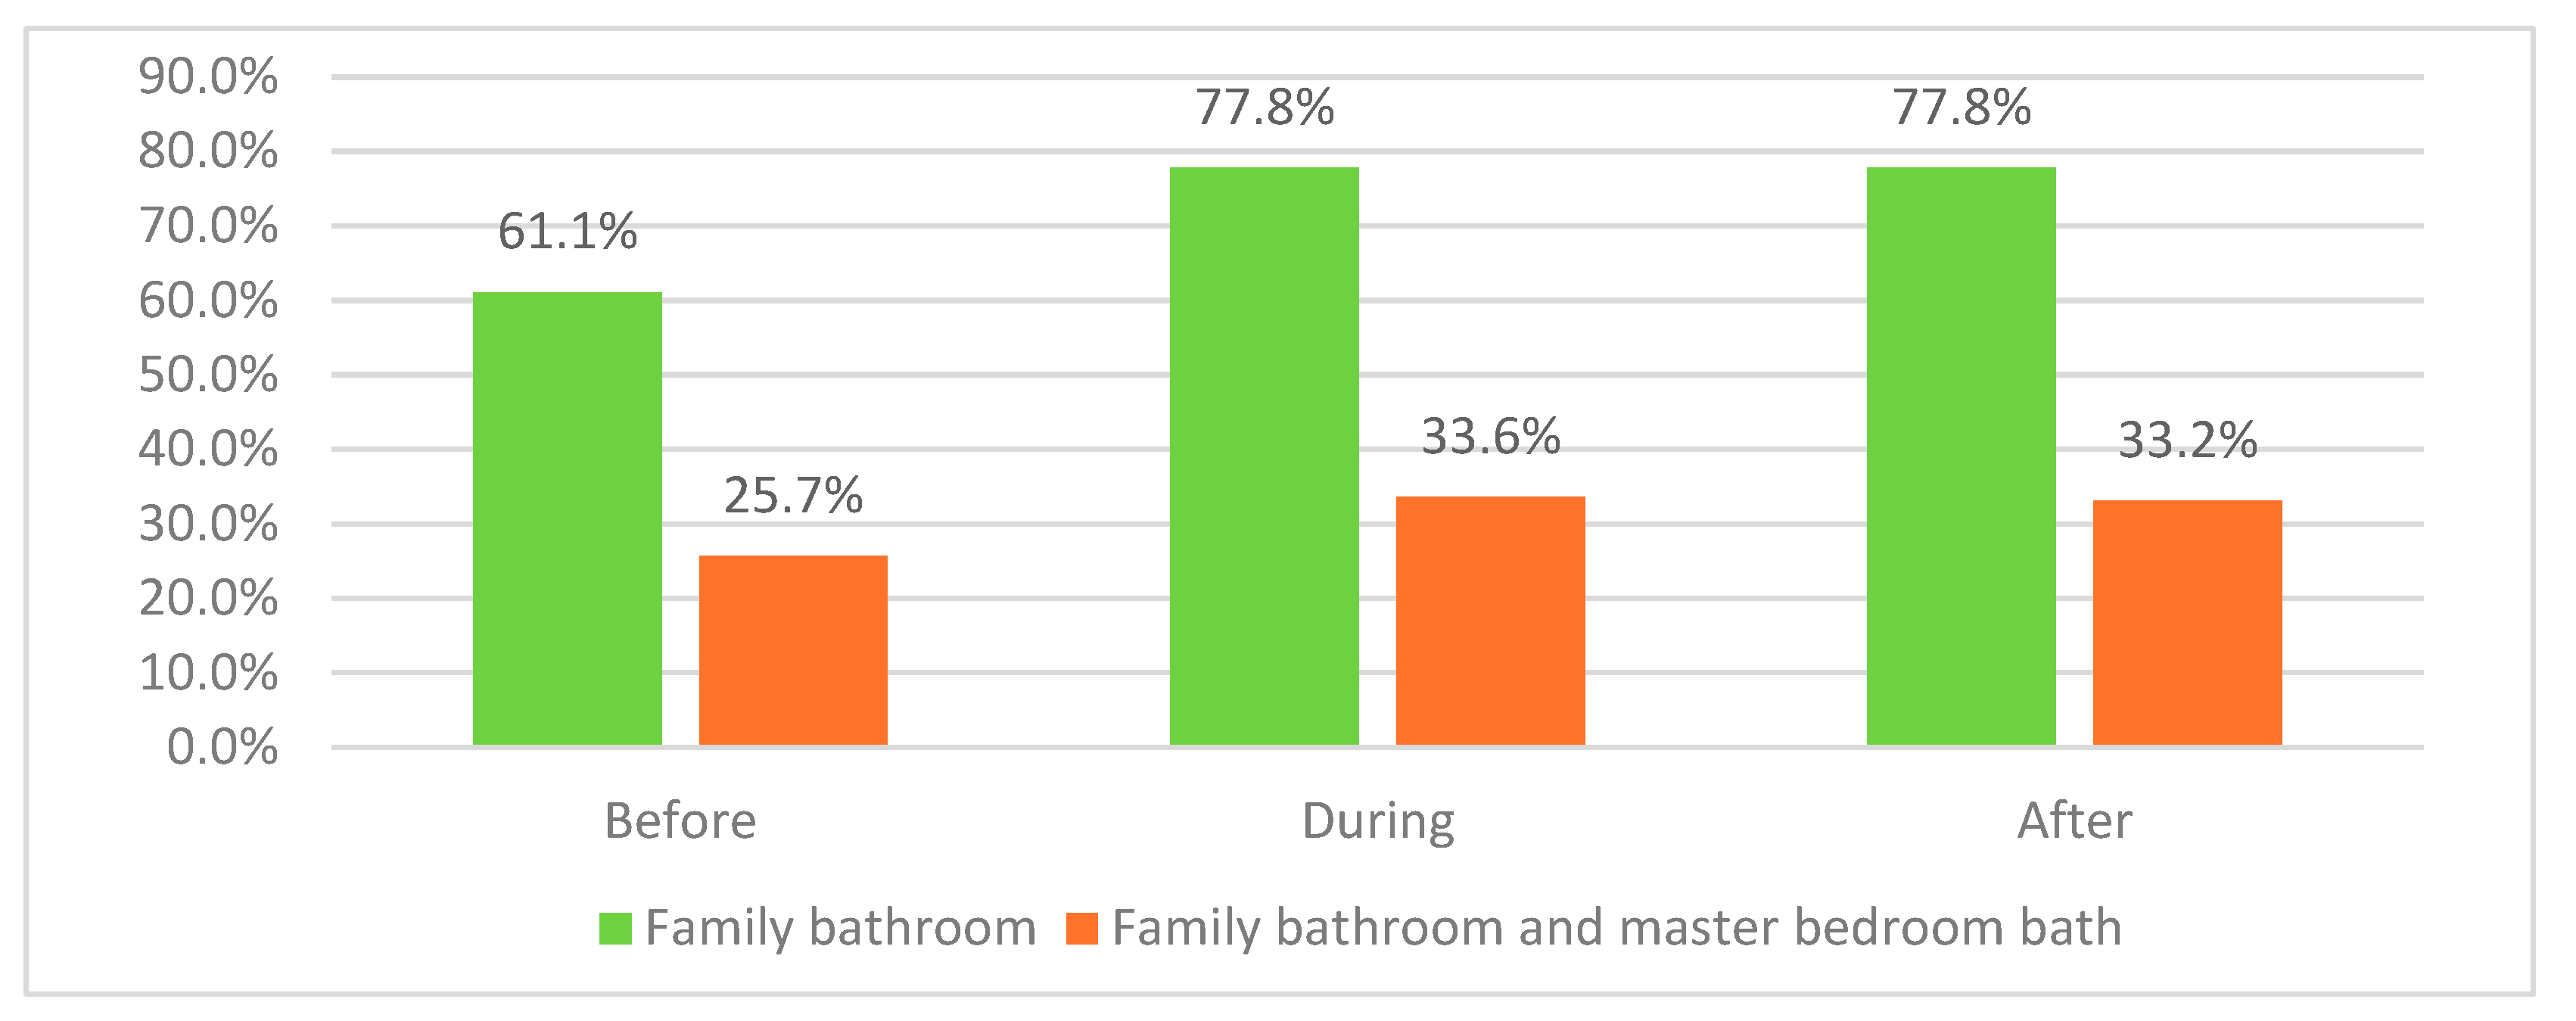
Figure 71.
Reasons of dissatisfaction for cases only having basic family bathroom.
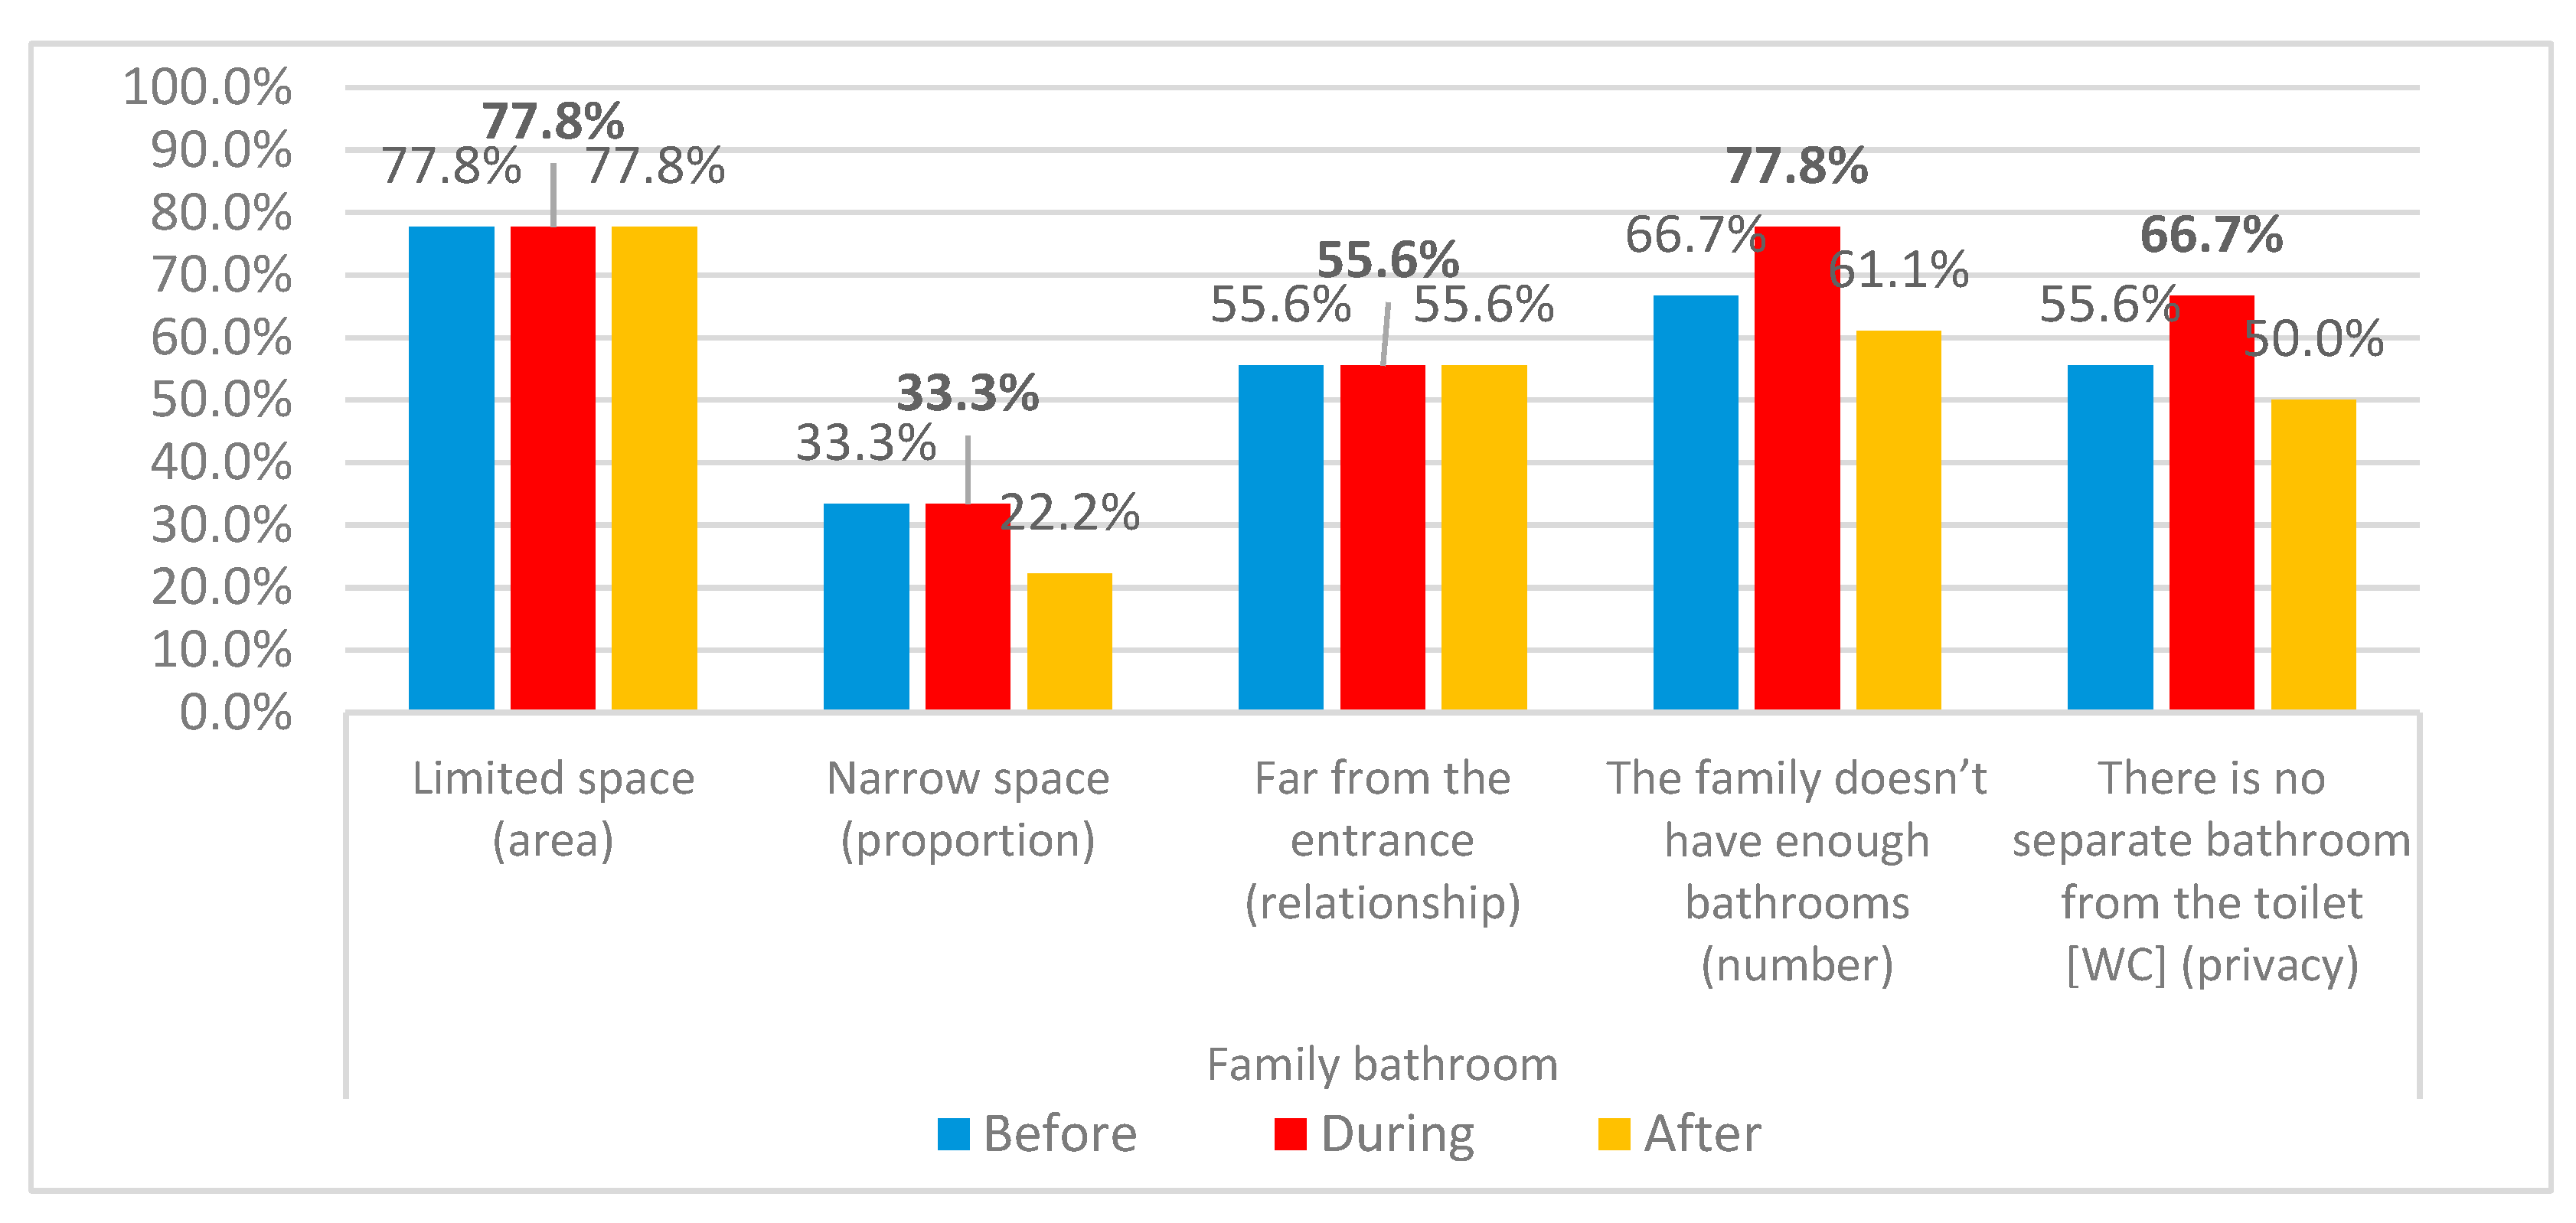
Figure 72.
Reasons of dissatisfaction by the existence of master bathroom added to family bathroom.
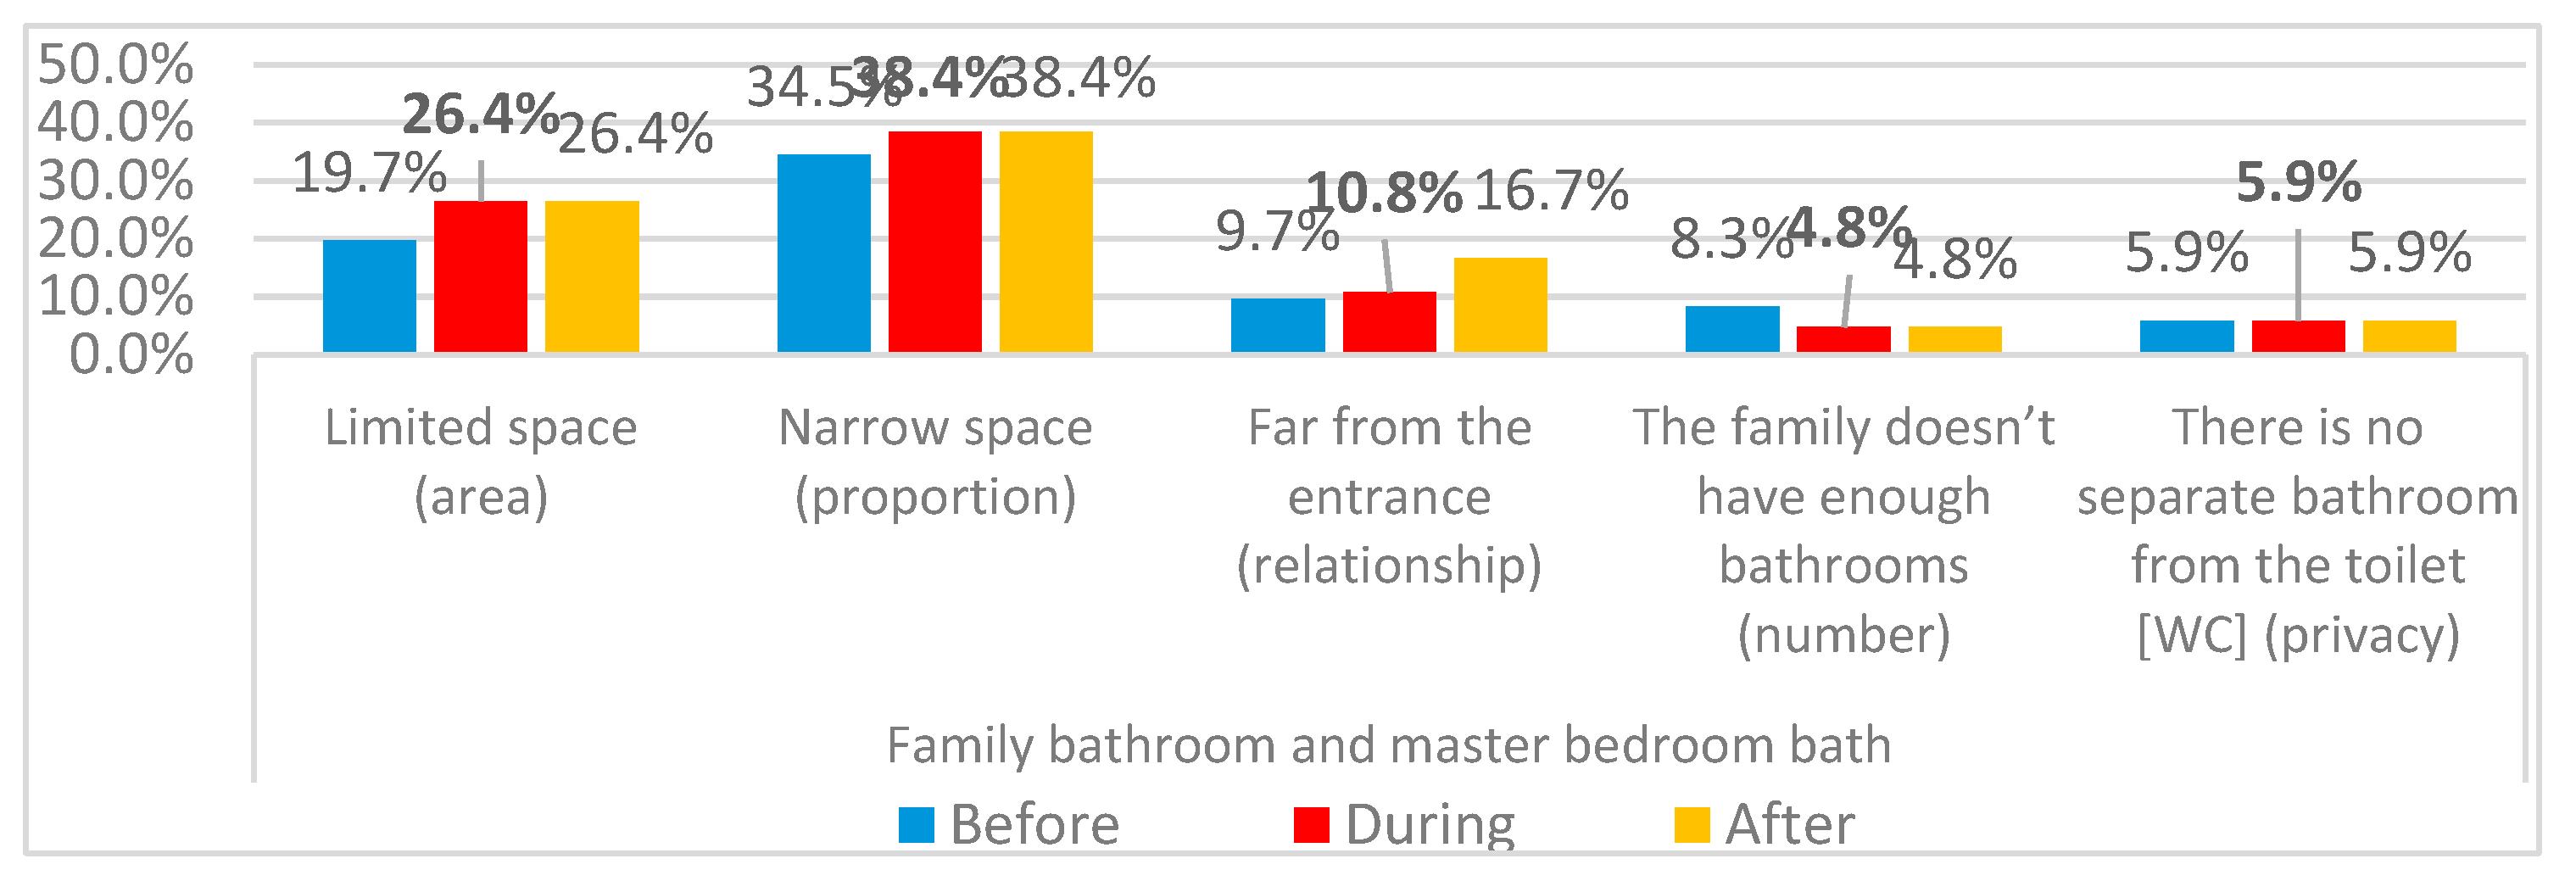
Figure 73.
Variations in dissatisfaction by the existence of master bathroom in addition to basic family bathroom in between categories of 2+1 and 3+1.
Figure 73.
Variations in dissatisfaction by the existence of master bathroom in addition to basic family bathroom in between categories of 2+1 and 3+1.
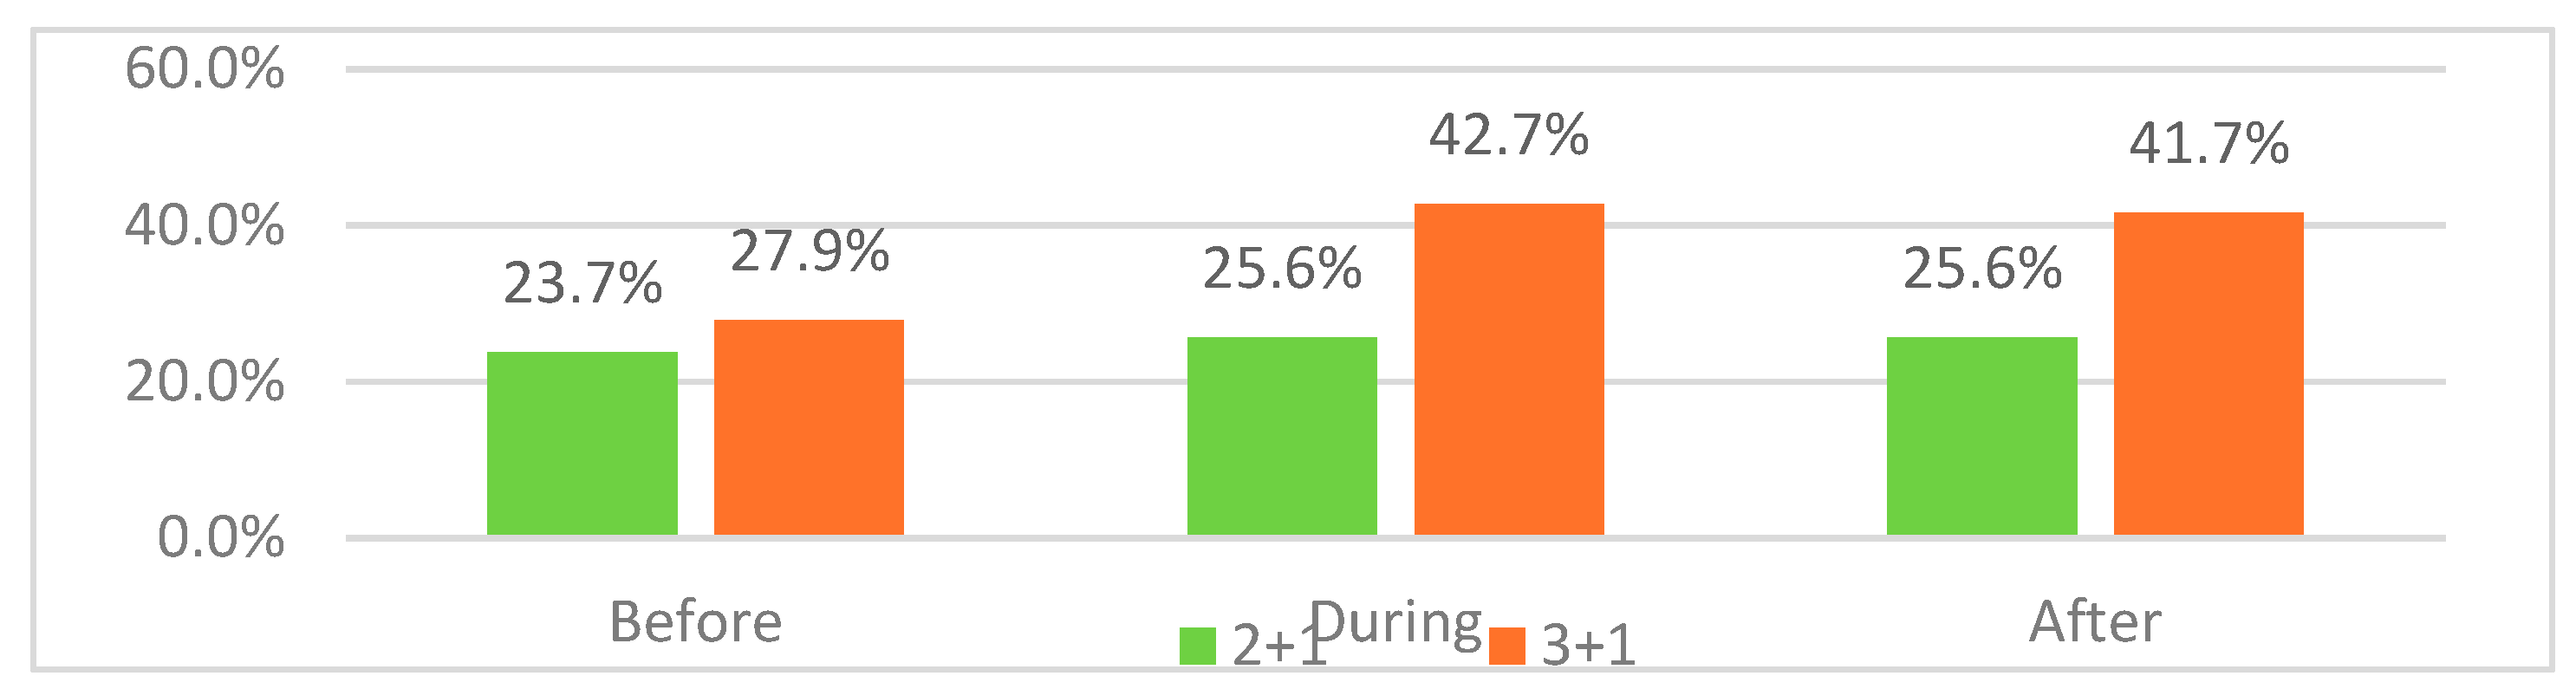
Figure 74.
Reasons of changes in dissatisfaction by the existence of master bathroom in addition to basic family bathroom for category of 2+1.
Figure 74.
Reasons of changes in dissatisfaction by the existence of master bathroom in addition to basic family bathroom for category of 2+1.
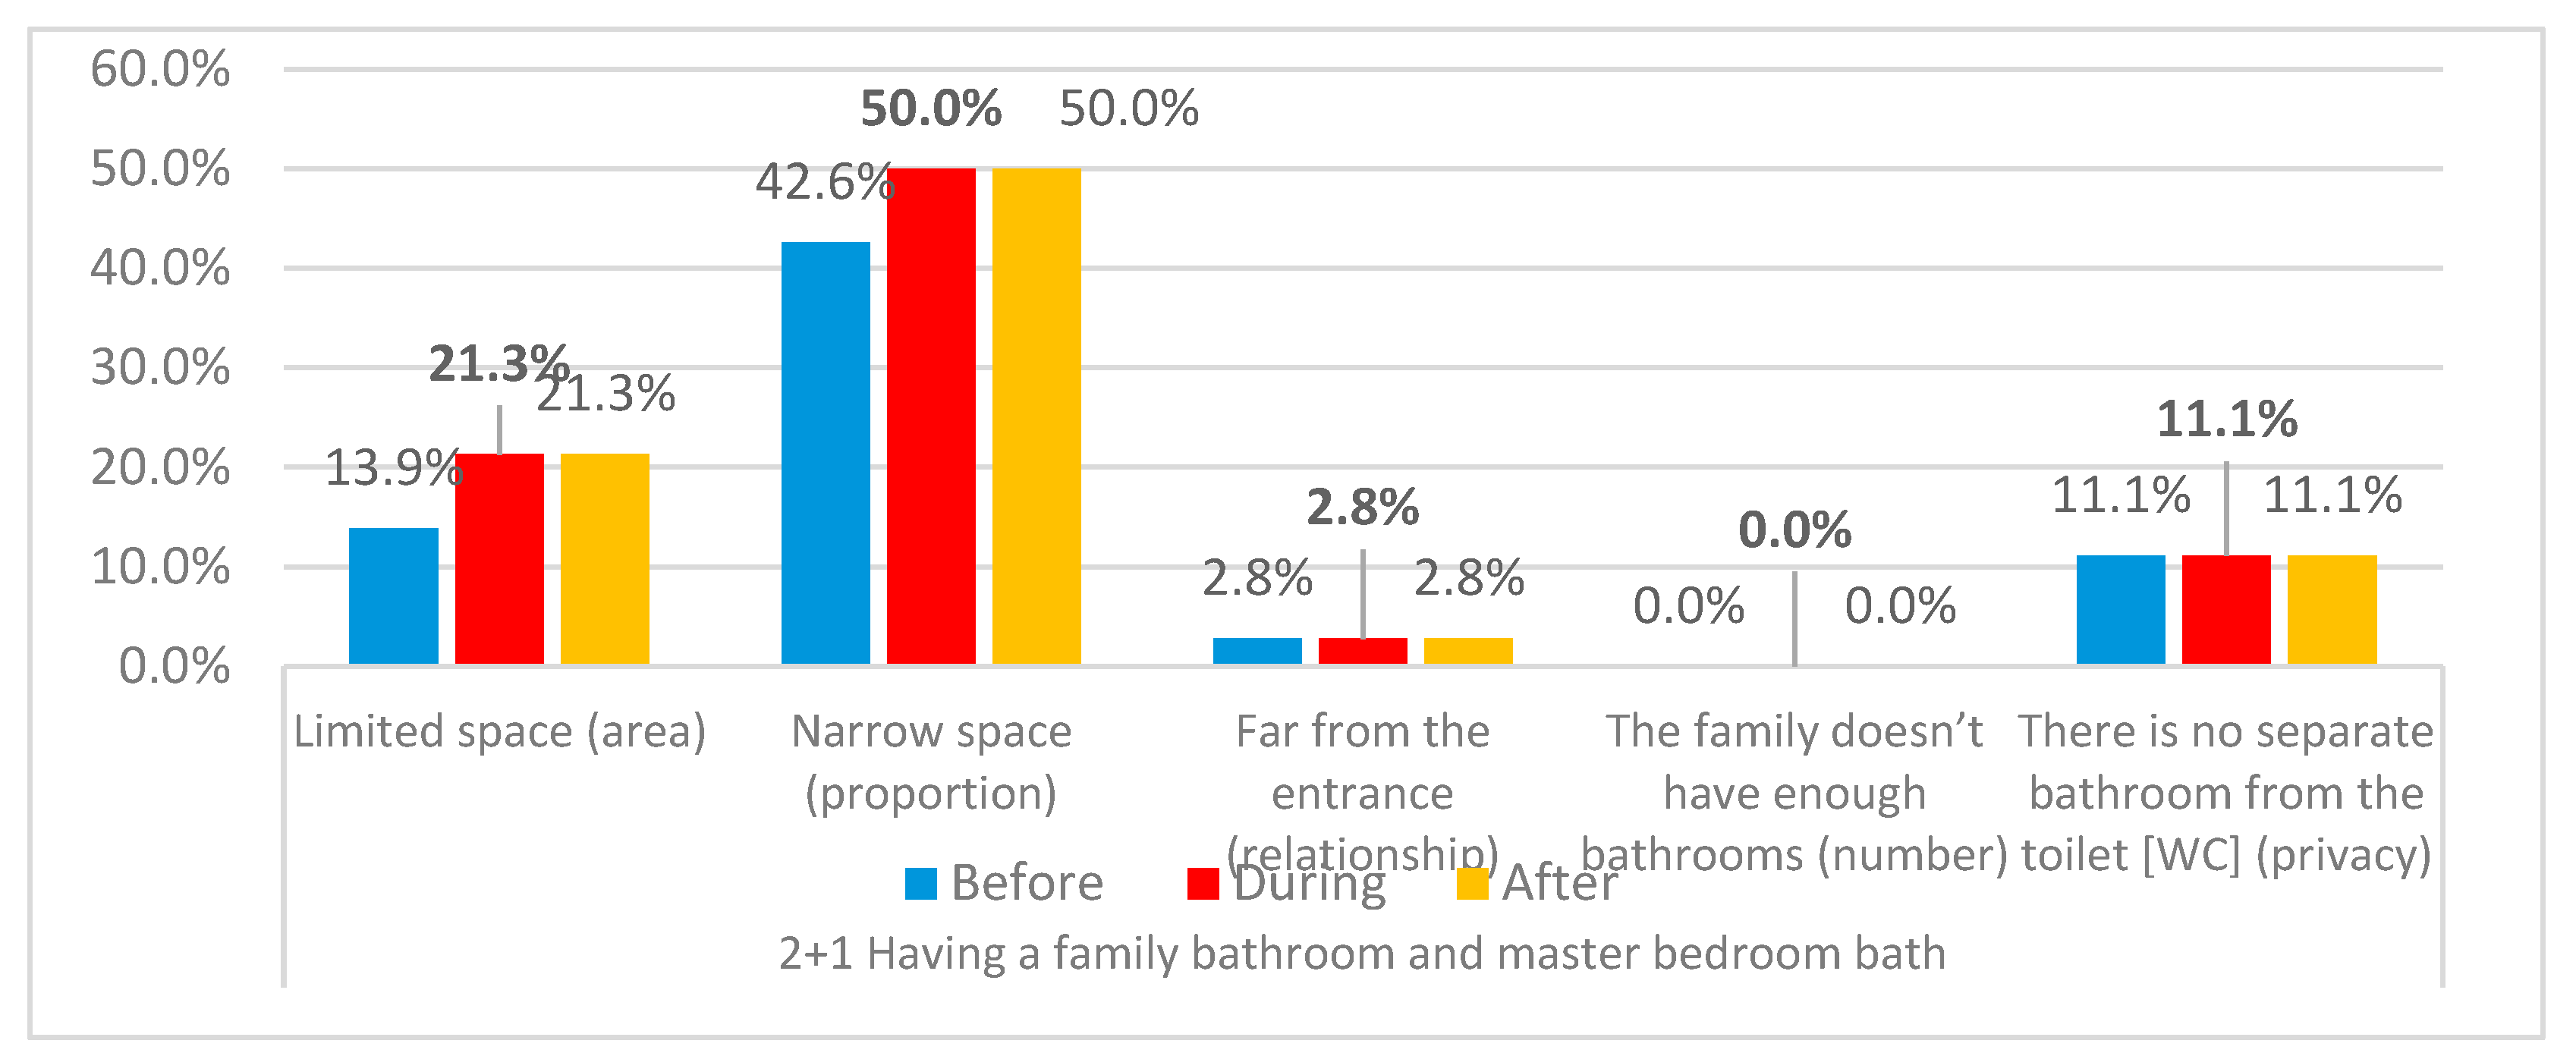
Figure 75.
Reasons of changes in dissatisfaction by the existence of master bathroom in addition to basic family bathroom for category of 3+1.
Figure 75.
Reasons of changes in dissatisfaction by the existence of master bathroom in addition to basic family bathroom for category of 3+1.
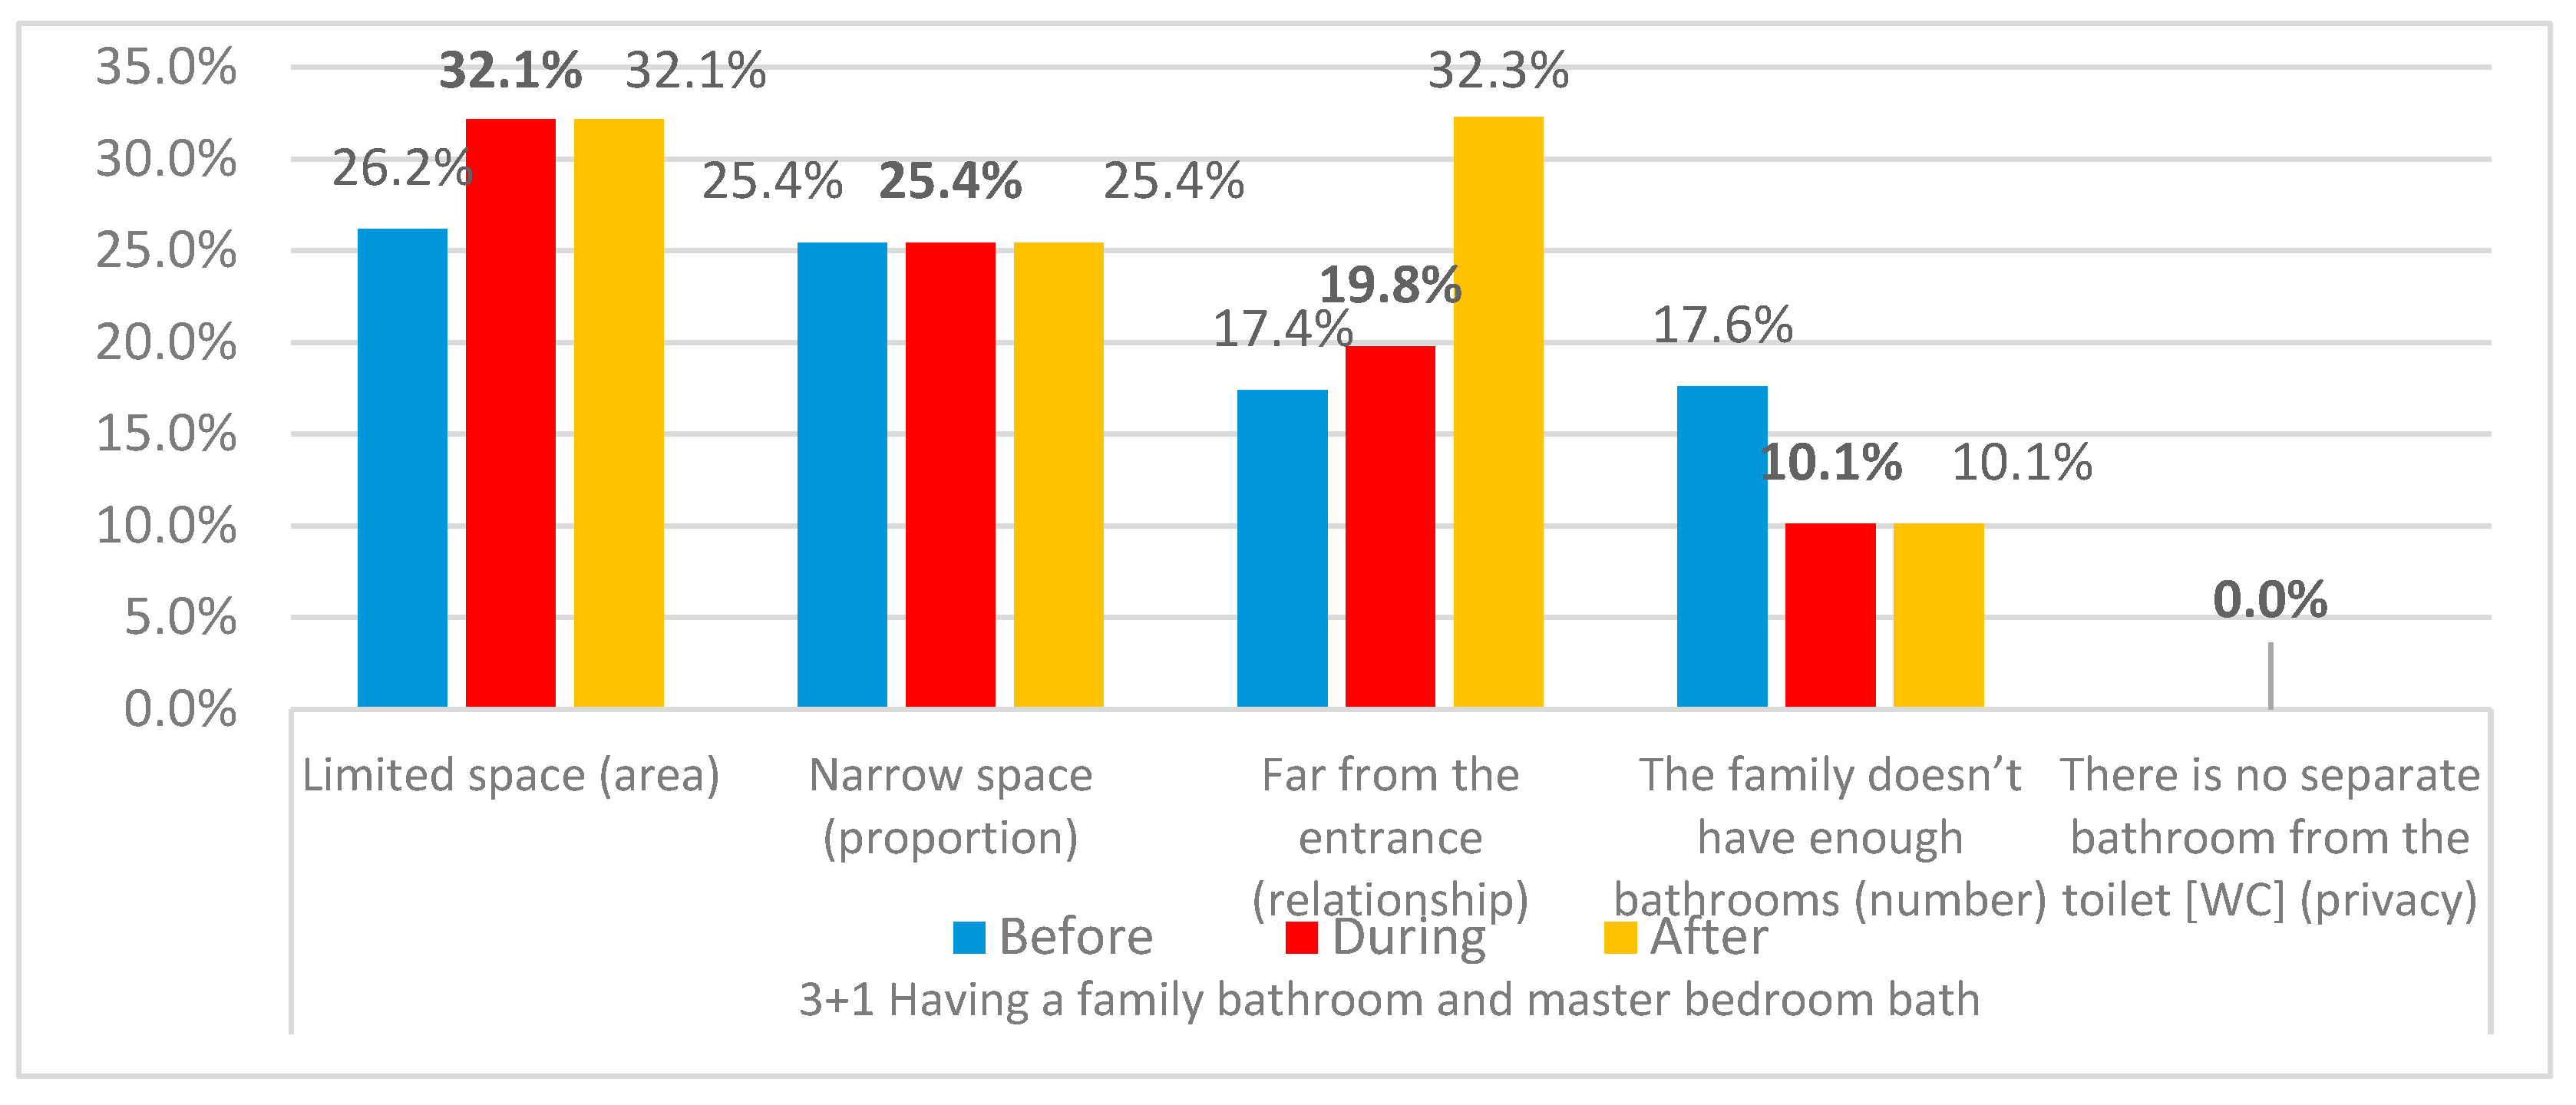
Figure 76.
Dissatisfaction variations for toilets through three stages of pandemic.
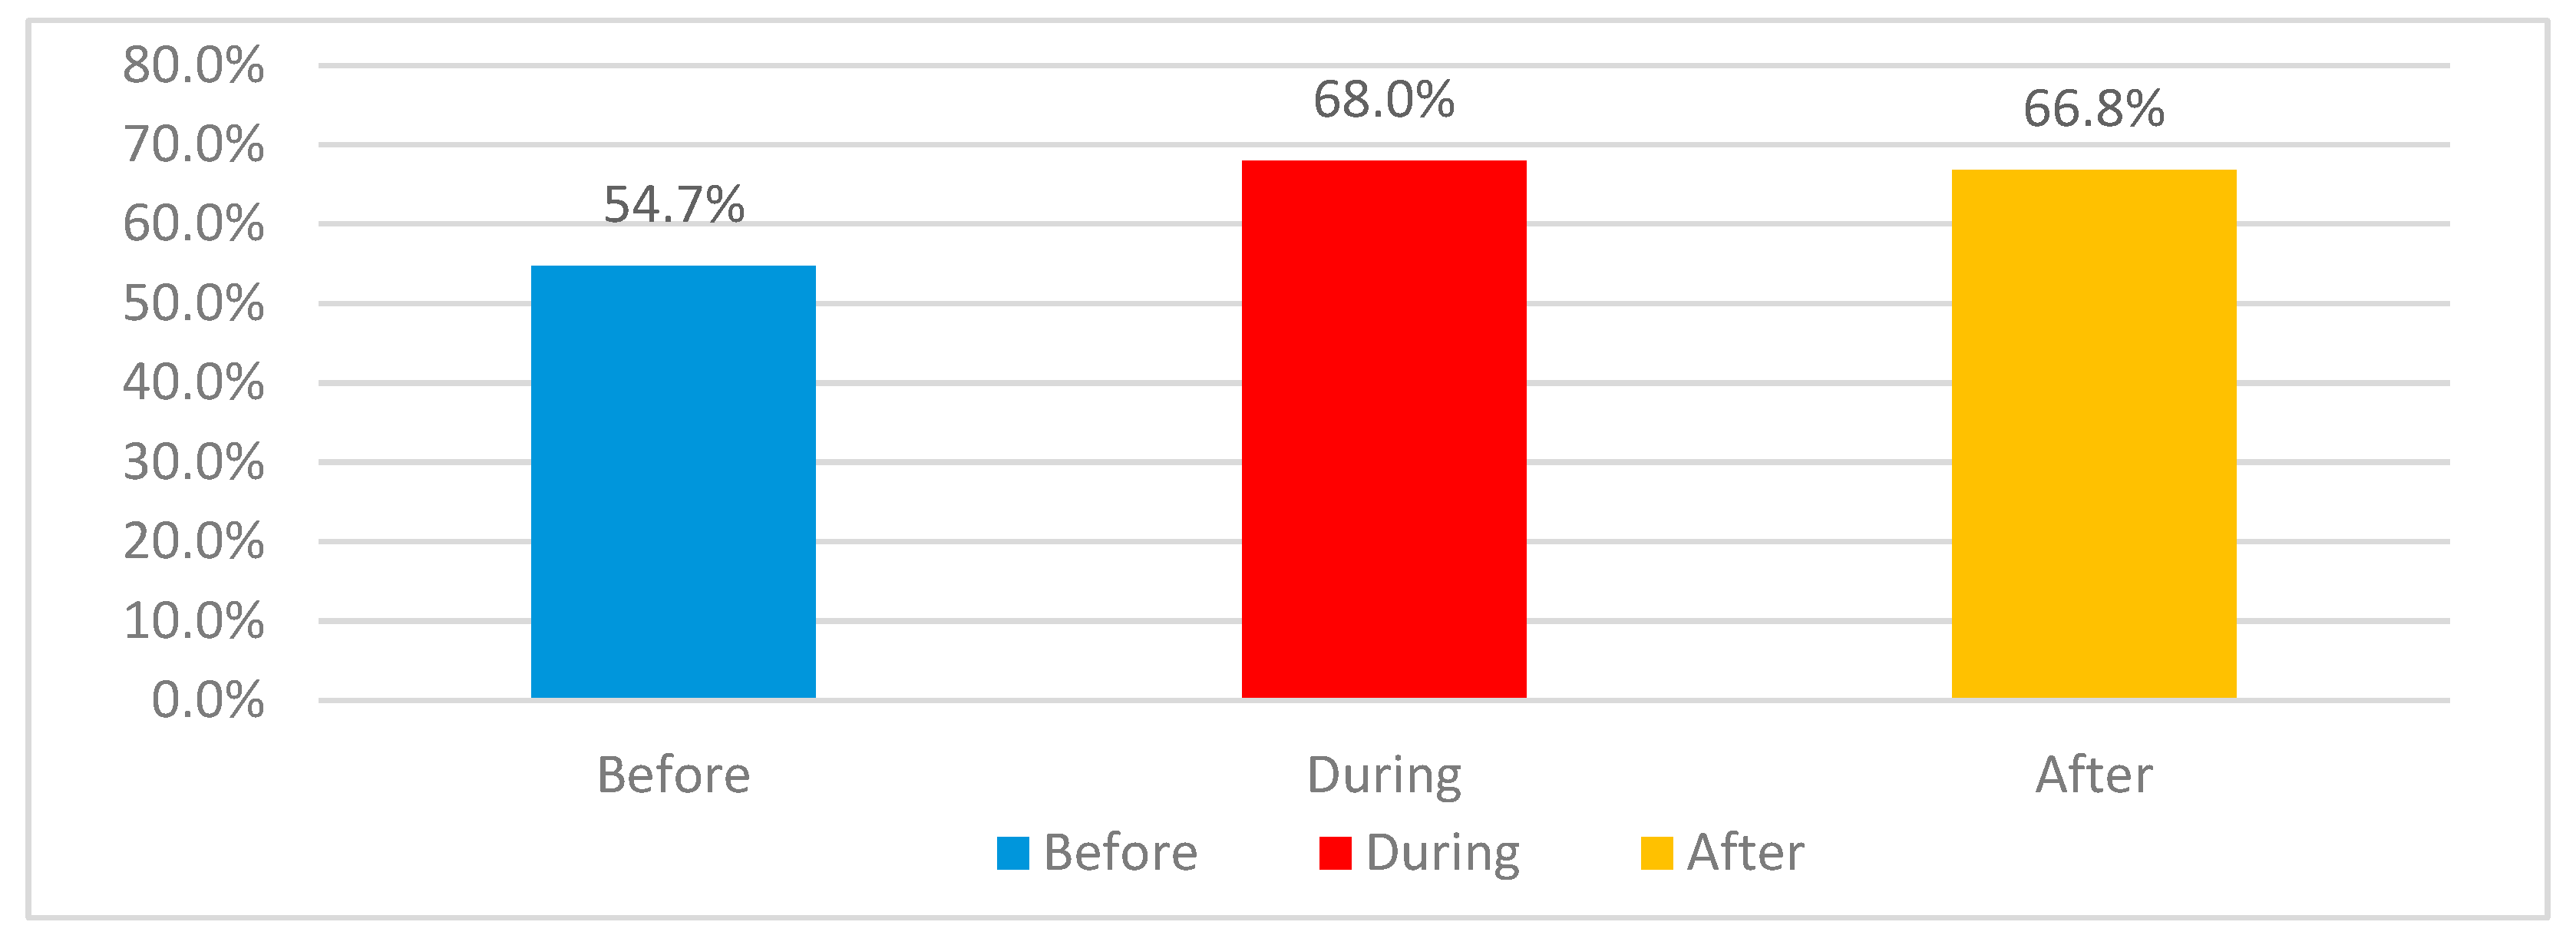
Figure 77.
Differences in dissatisfaction percentages for 2+1 and 3+1 categories.

Figure 78.
Differences in dissatisfaction percentages for apartments without separate toilets and those who had separate units. .
Figure 78.
Differences in dissatisfaction percentages for apartments without separate toilets and those who had separate units. .
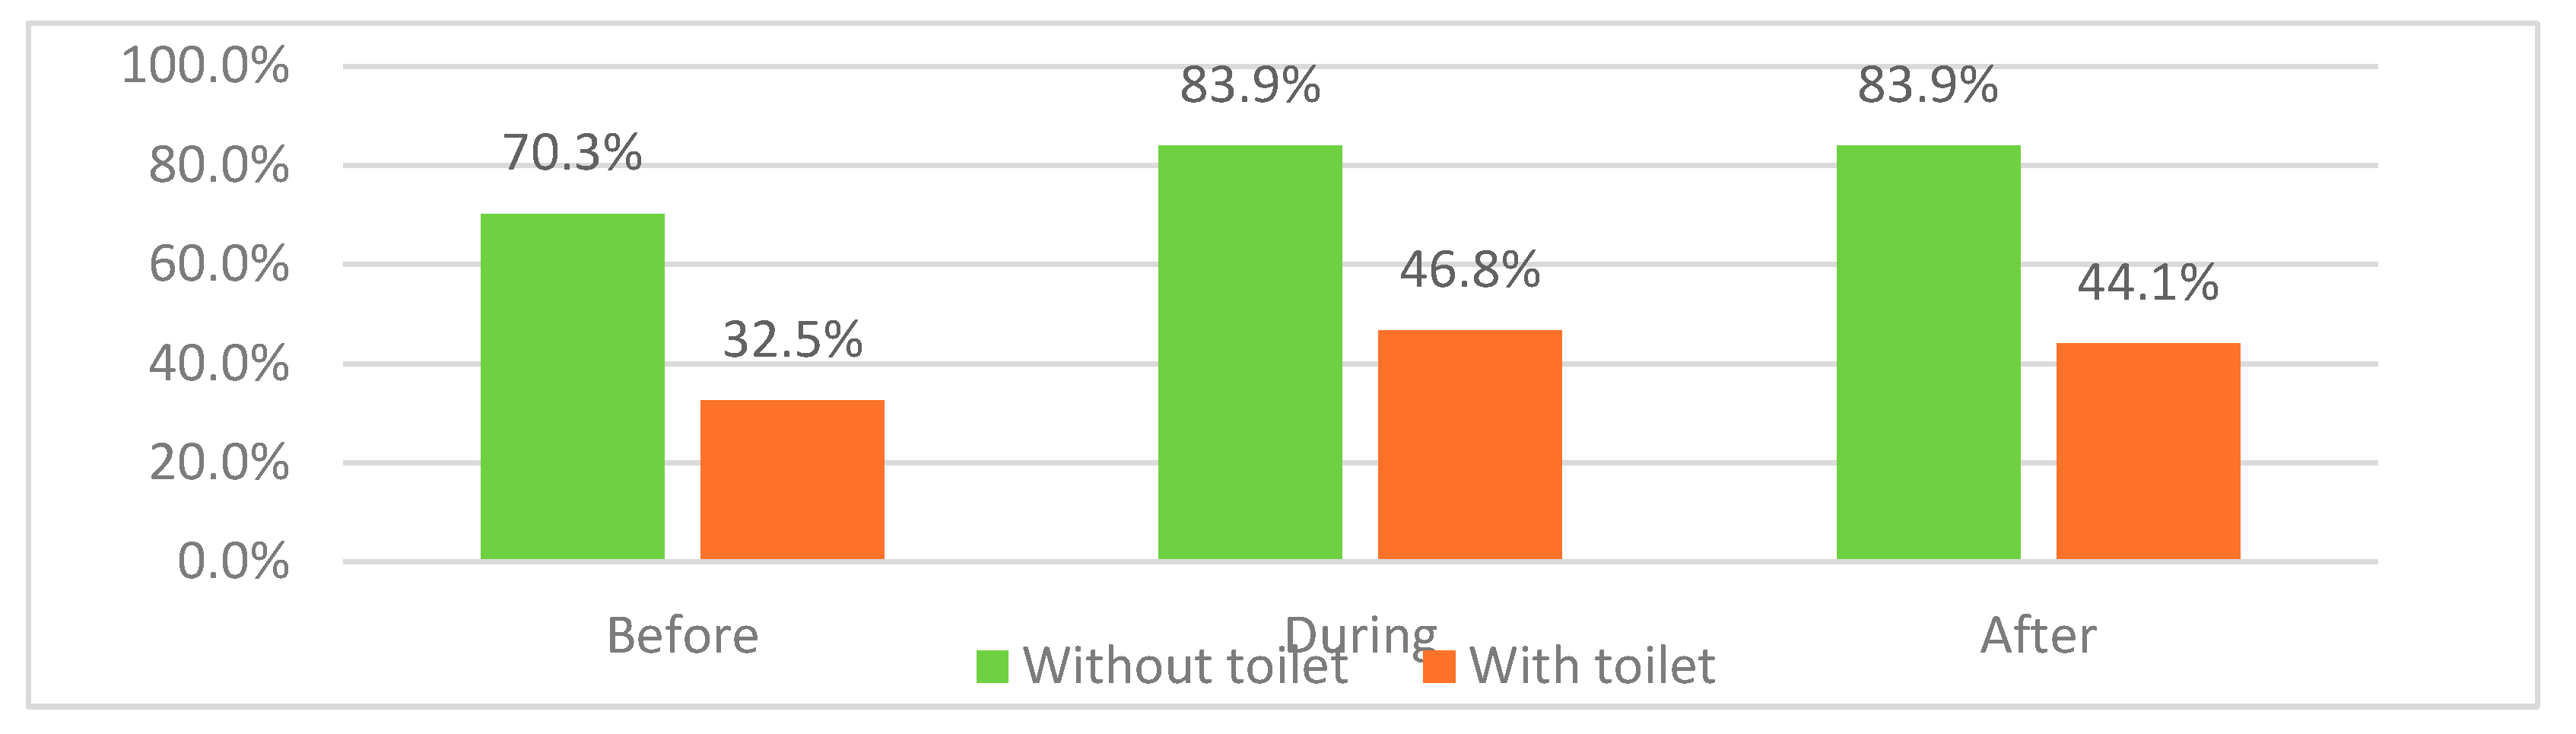
Figure 79.
Absence of separate toilet in formation of apartments indicating high dissatisfaction percentages of category 2+1 compared to 3+1 category. .
Figure 79.
Absence of separate toilet in formation of apartments indicating high dissatisfaction percentages of category 2+1 compared to 3+1 category. .
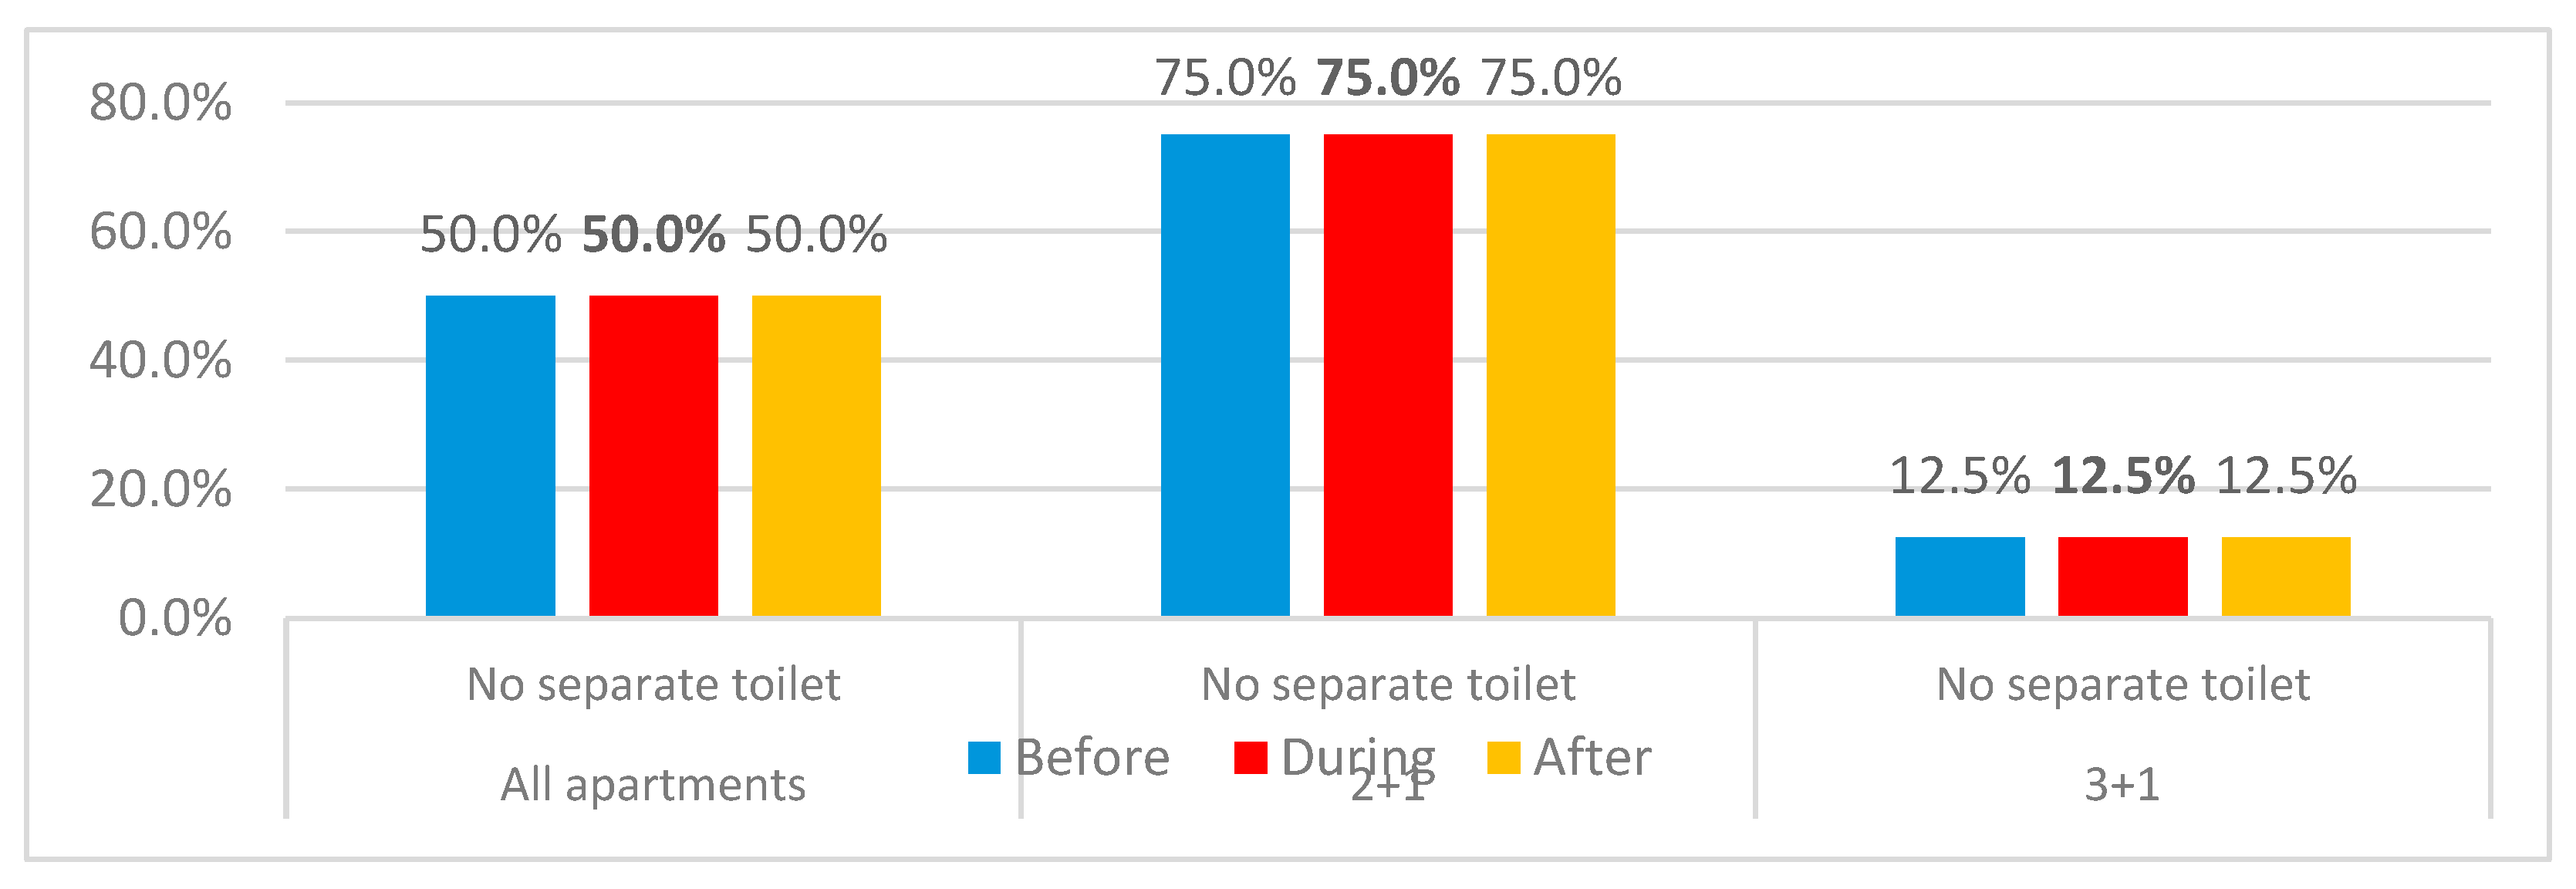
Figure 80.
Reasons for different dissatisfaction percentages for apartments with separate toilets.
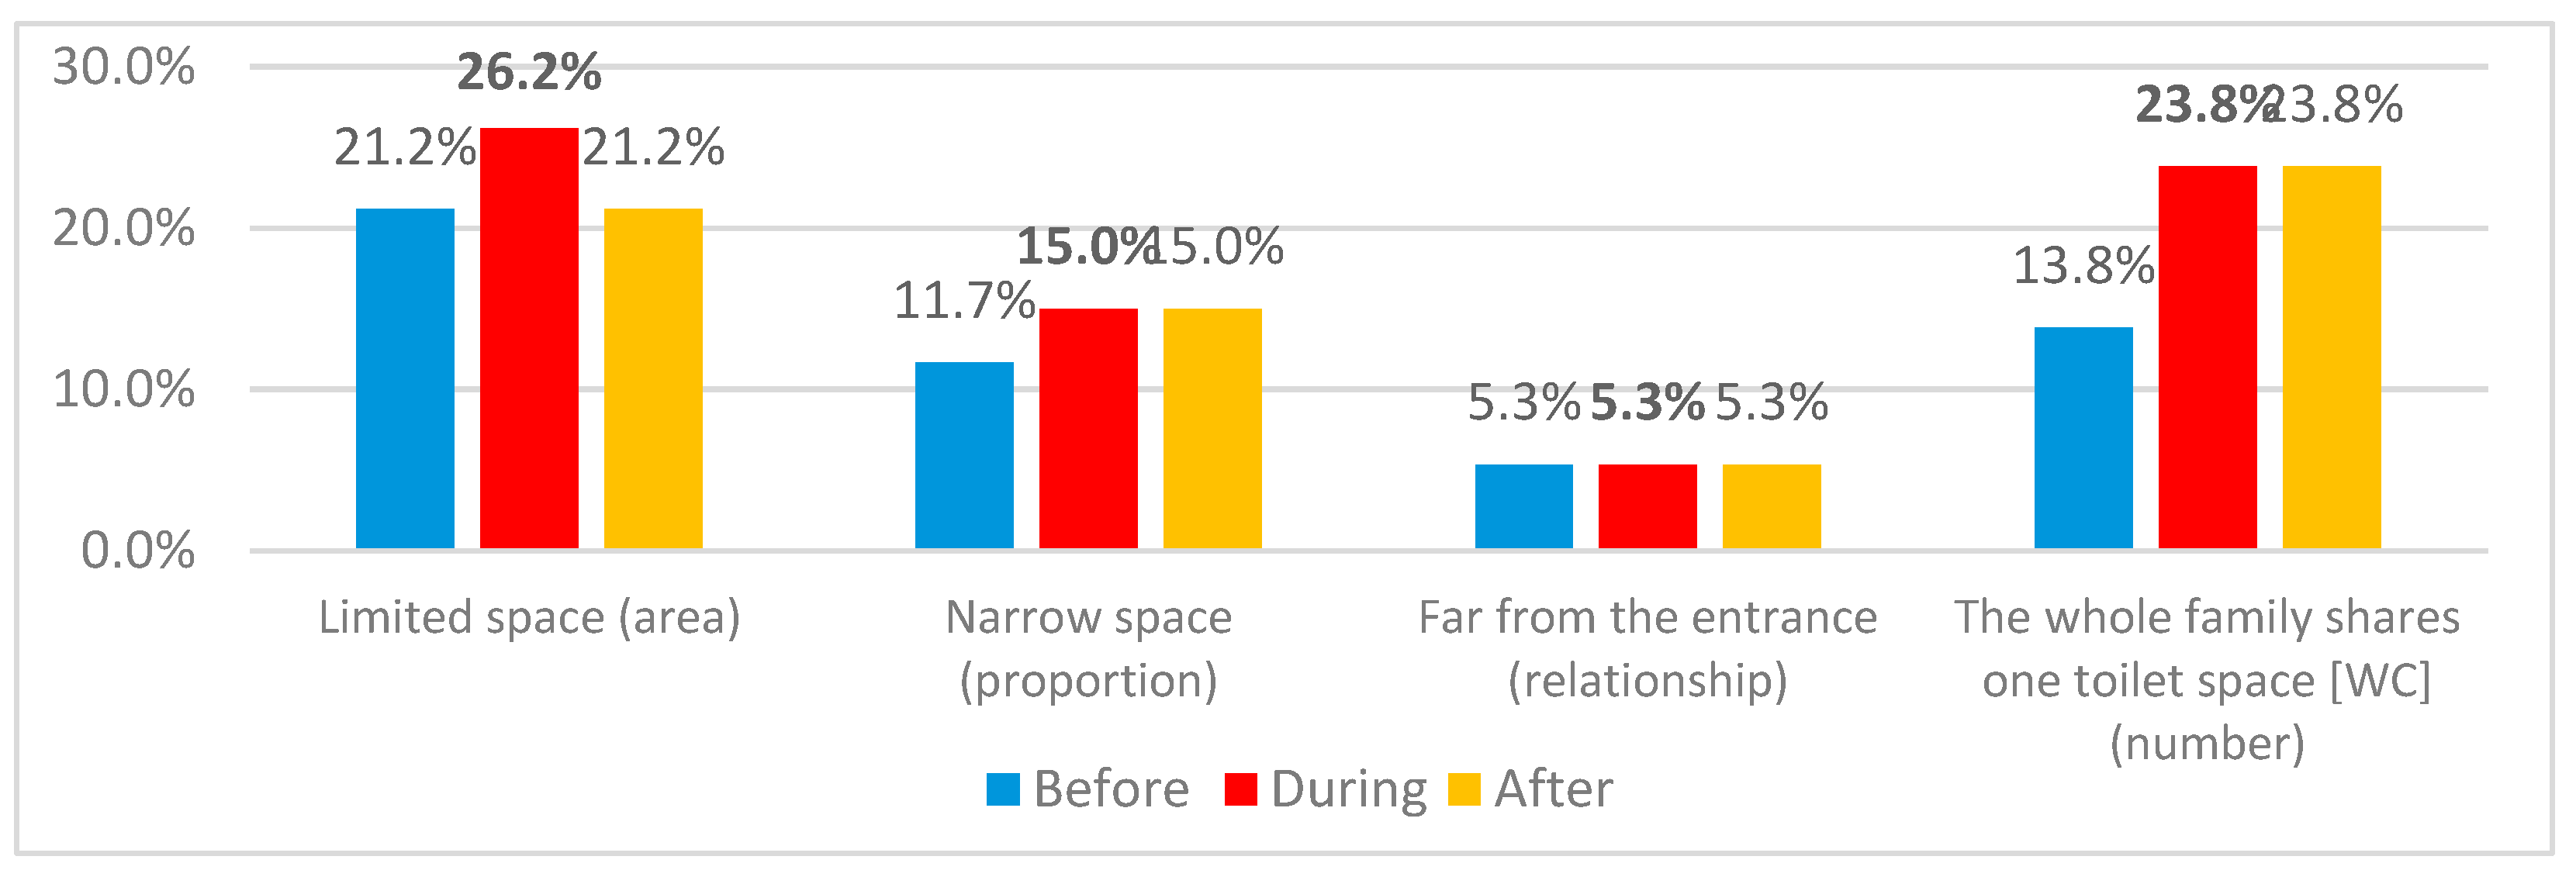
Figure 81.
Differences of dissatisfaction percentages in apartments with family toilet space and those with guest toilet spaces.
Figure 81.
Differences of dissatisfaction percentages in apartments with family toilet space and those with guest toilet spaces.
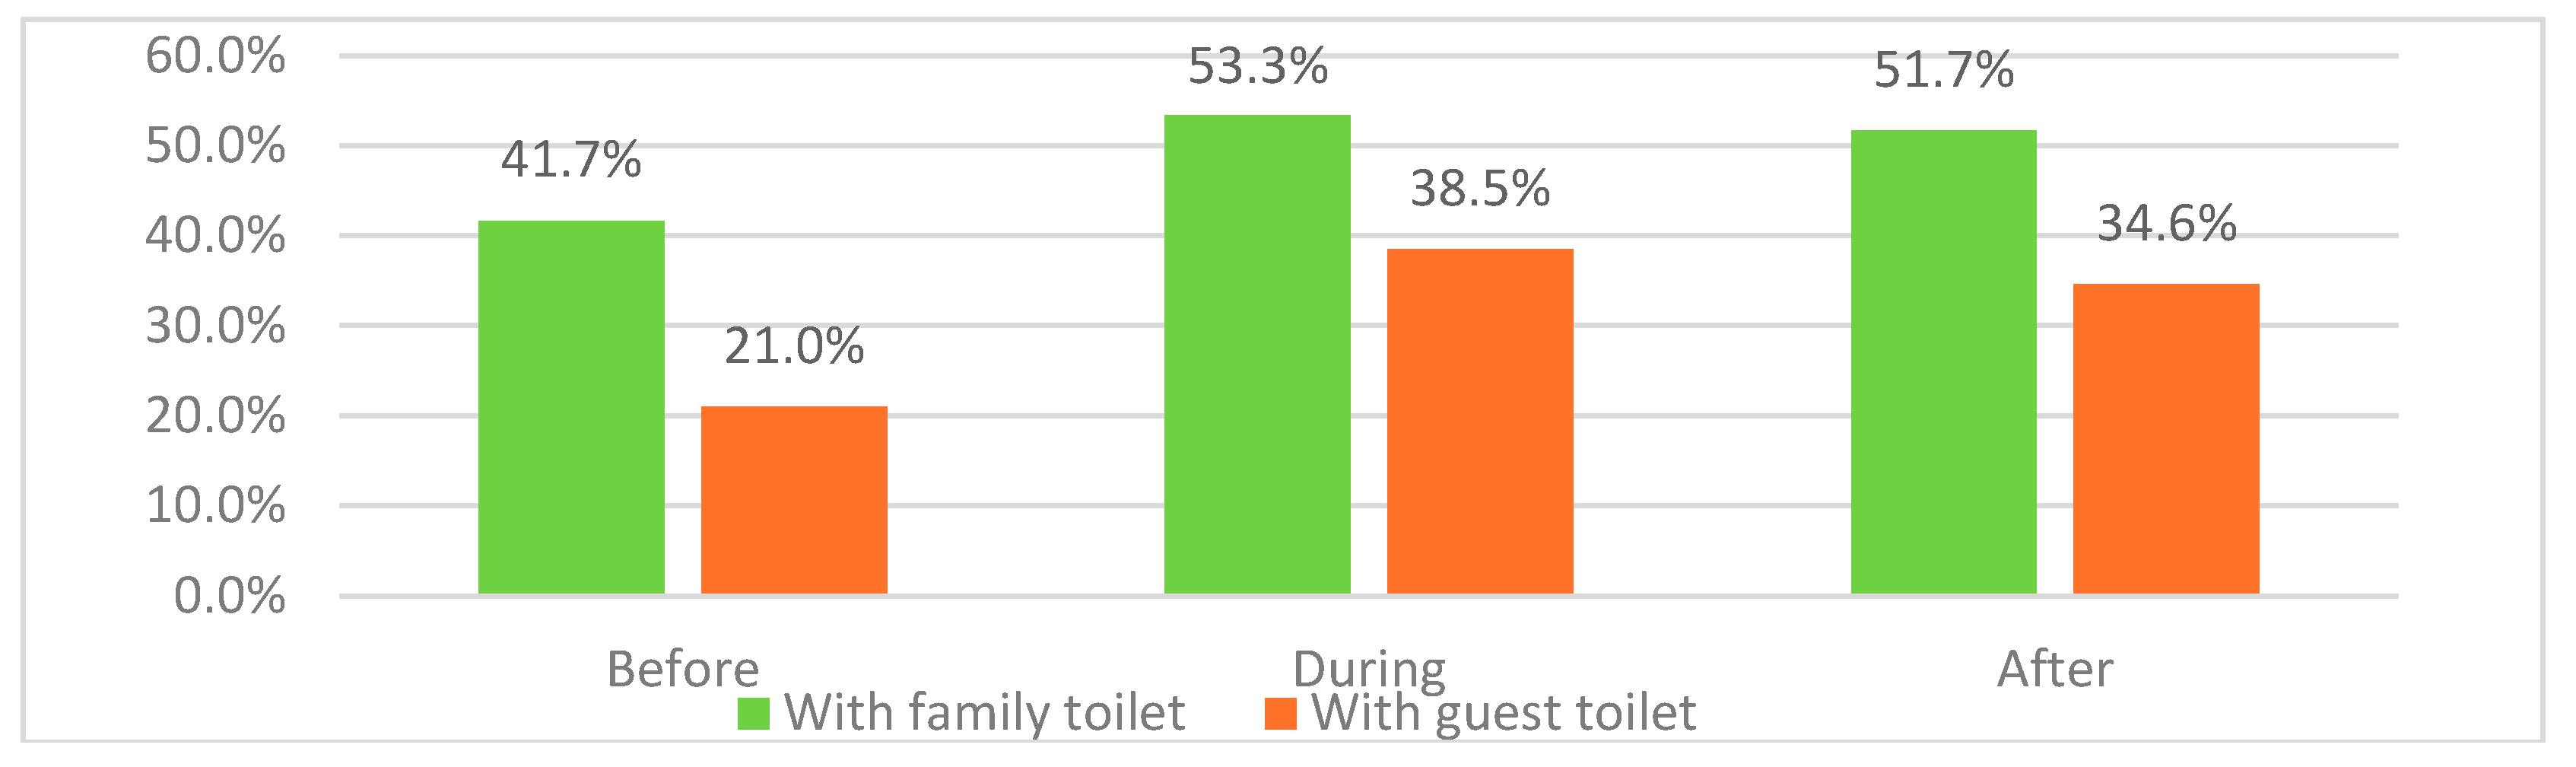
Figure 82.
Differences in percentages for reasons for dissatisfaction in apartments with family toilet space and those with guest toilet spaces.
Figure 82.
Differences in percentages for reasons for dissatisfaction in apartments with family toilet space and those with guest toilet spaces.
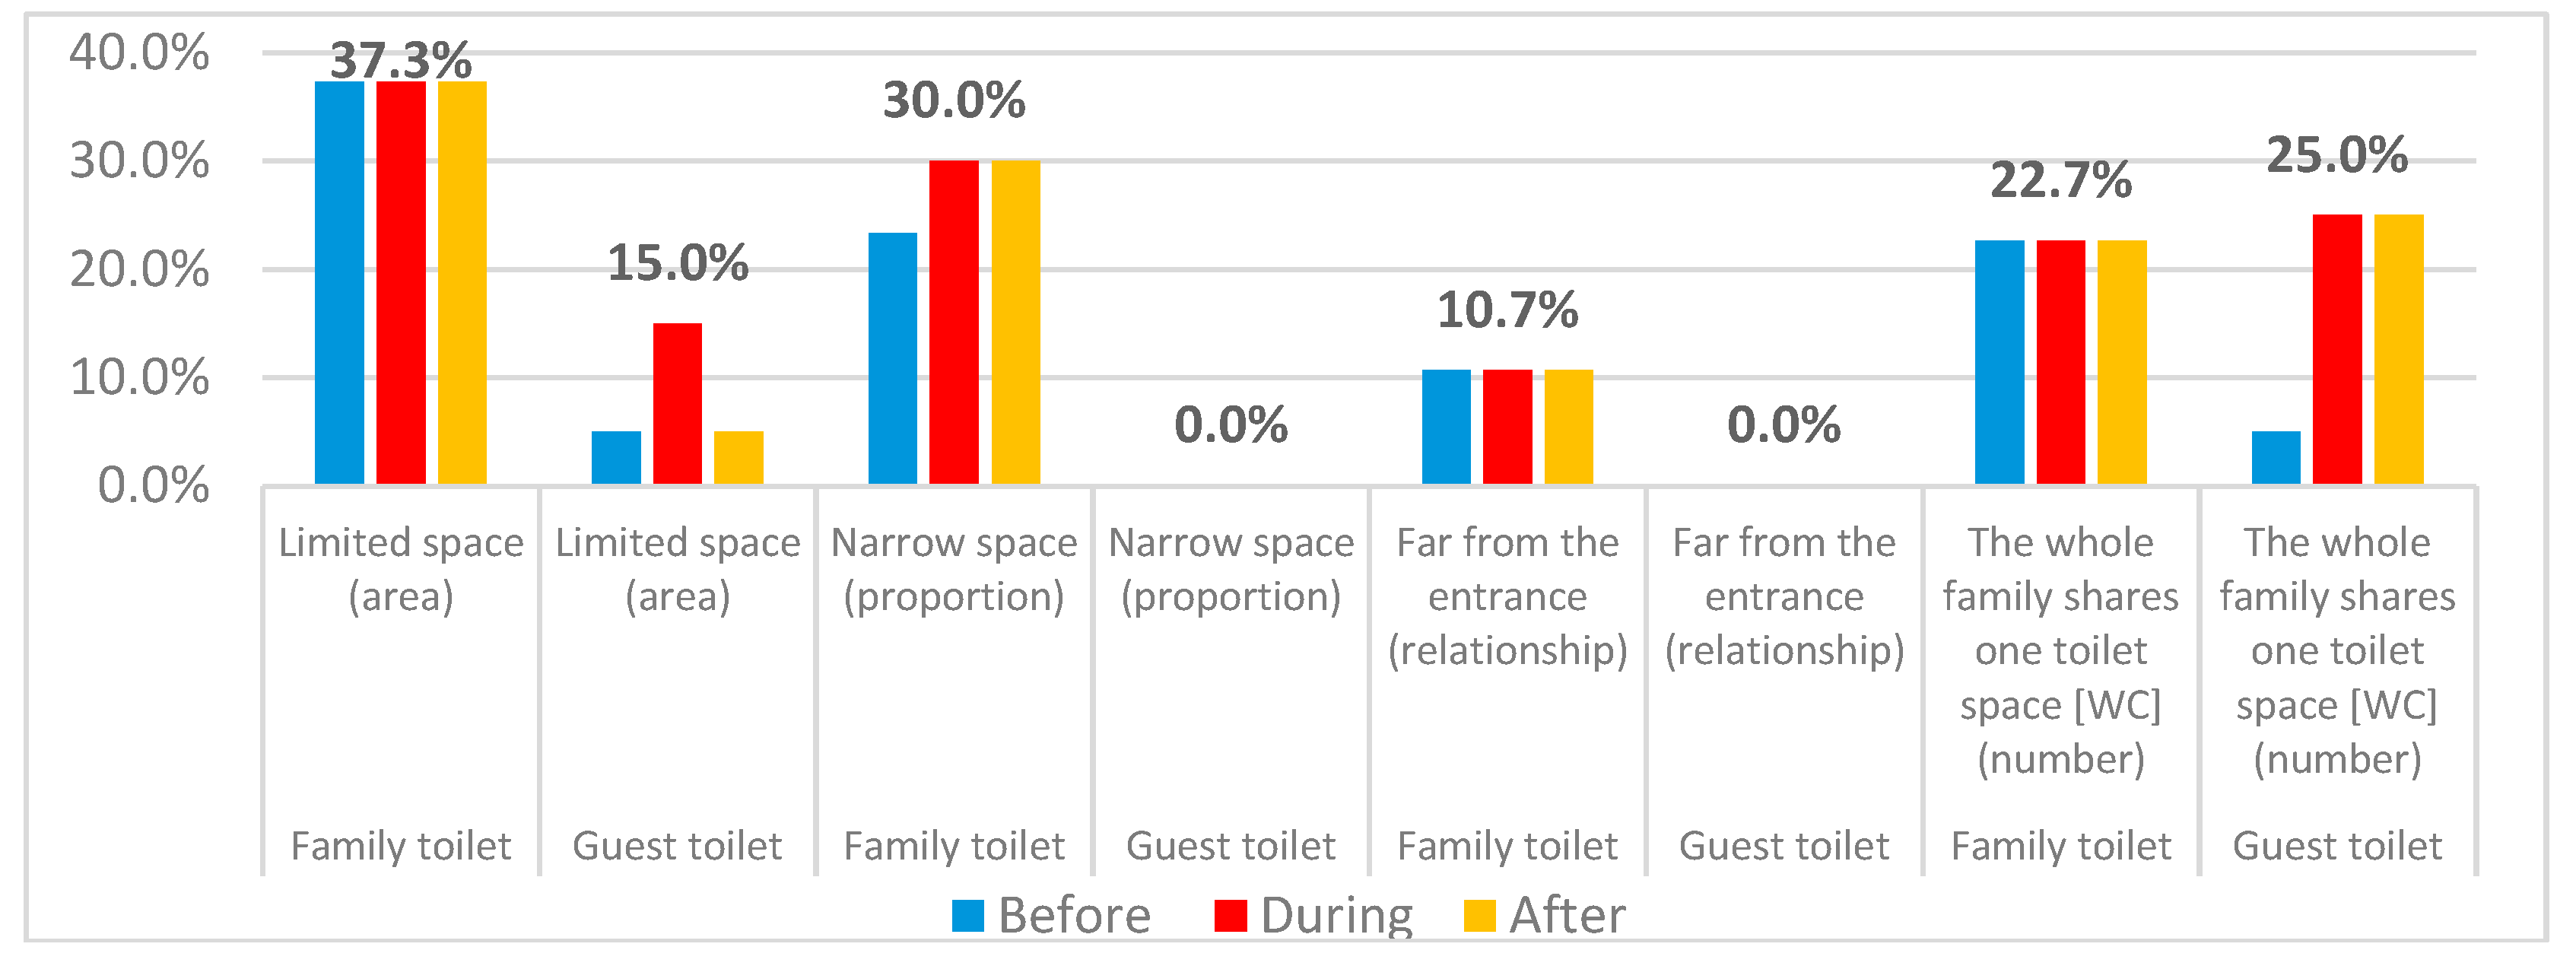
Figure 83.
Dissatisfaction variations for laundry through three stages of pandemic.
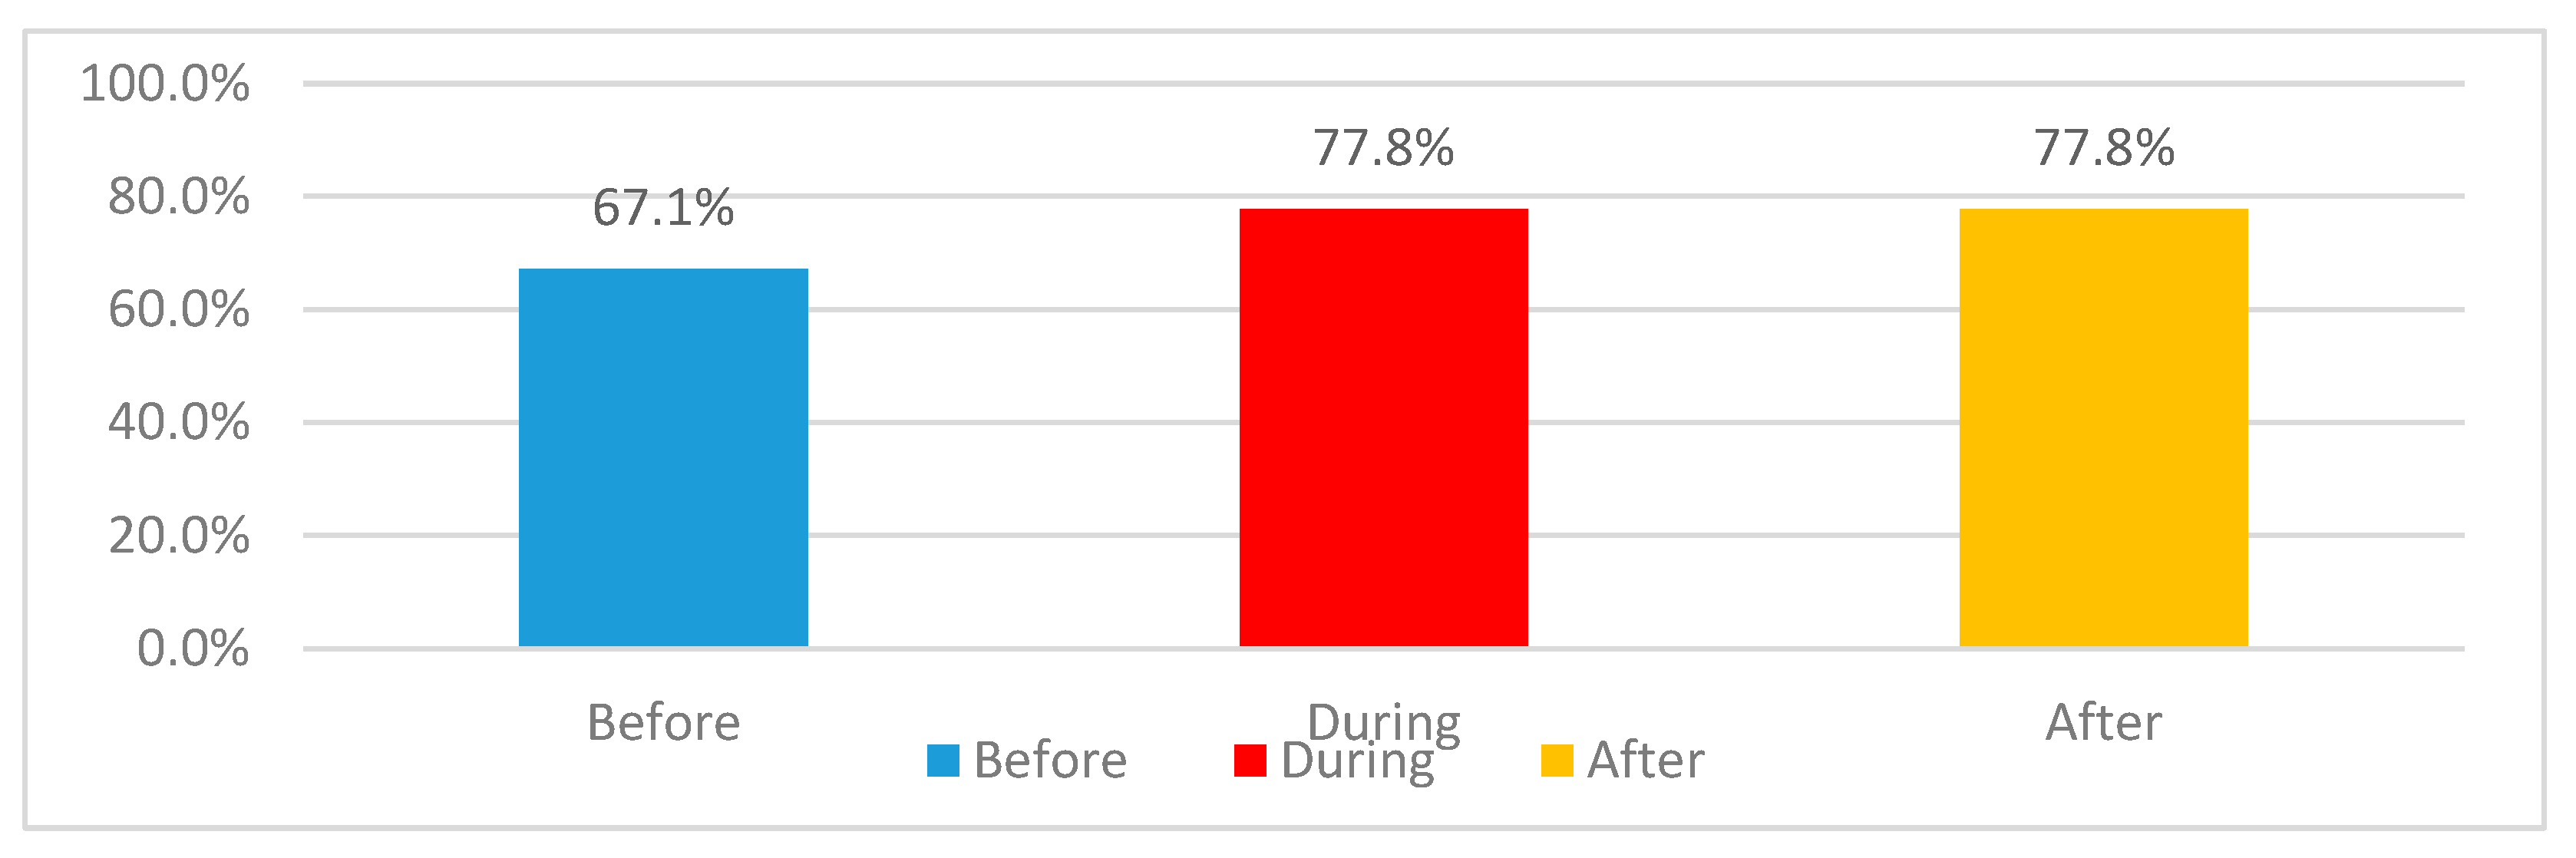
Figure 84.
Dissatisfaction variations due to availability or absence of laundry space.
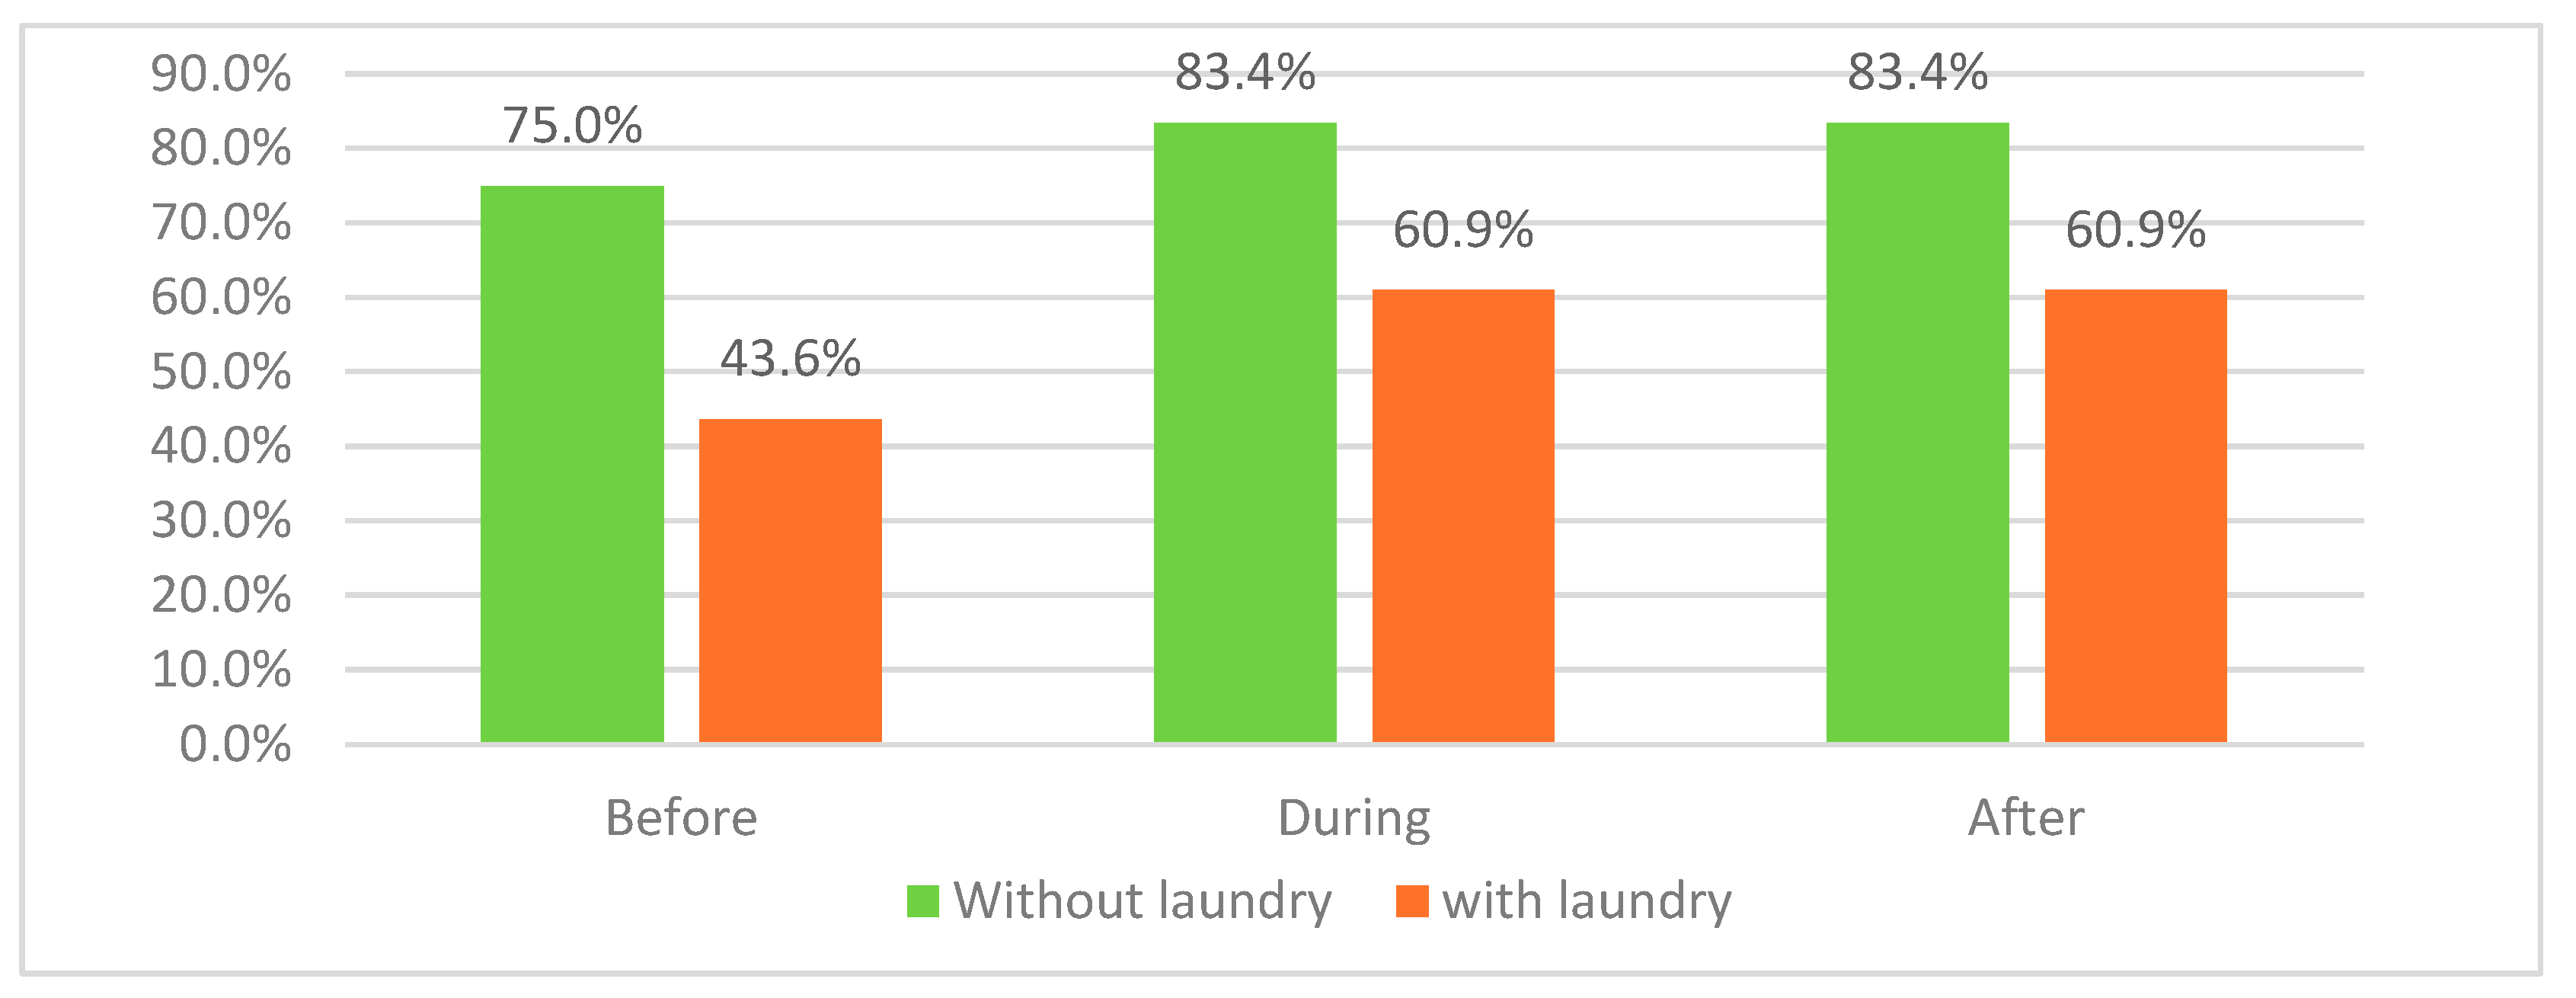
Figure 85.
Reasons for variations due to availability or absence of laundry space.
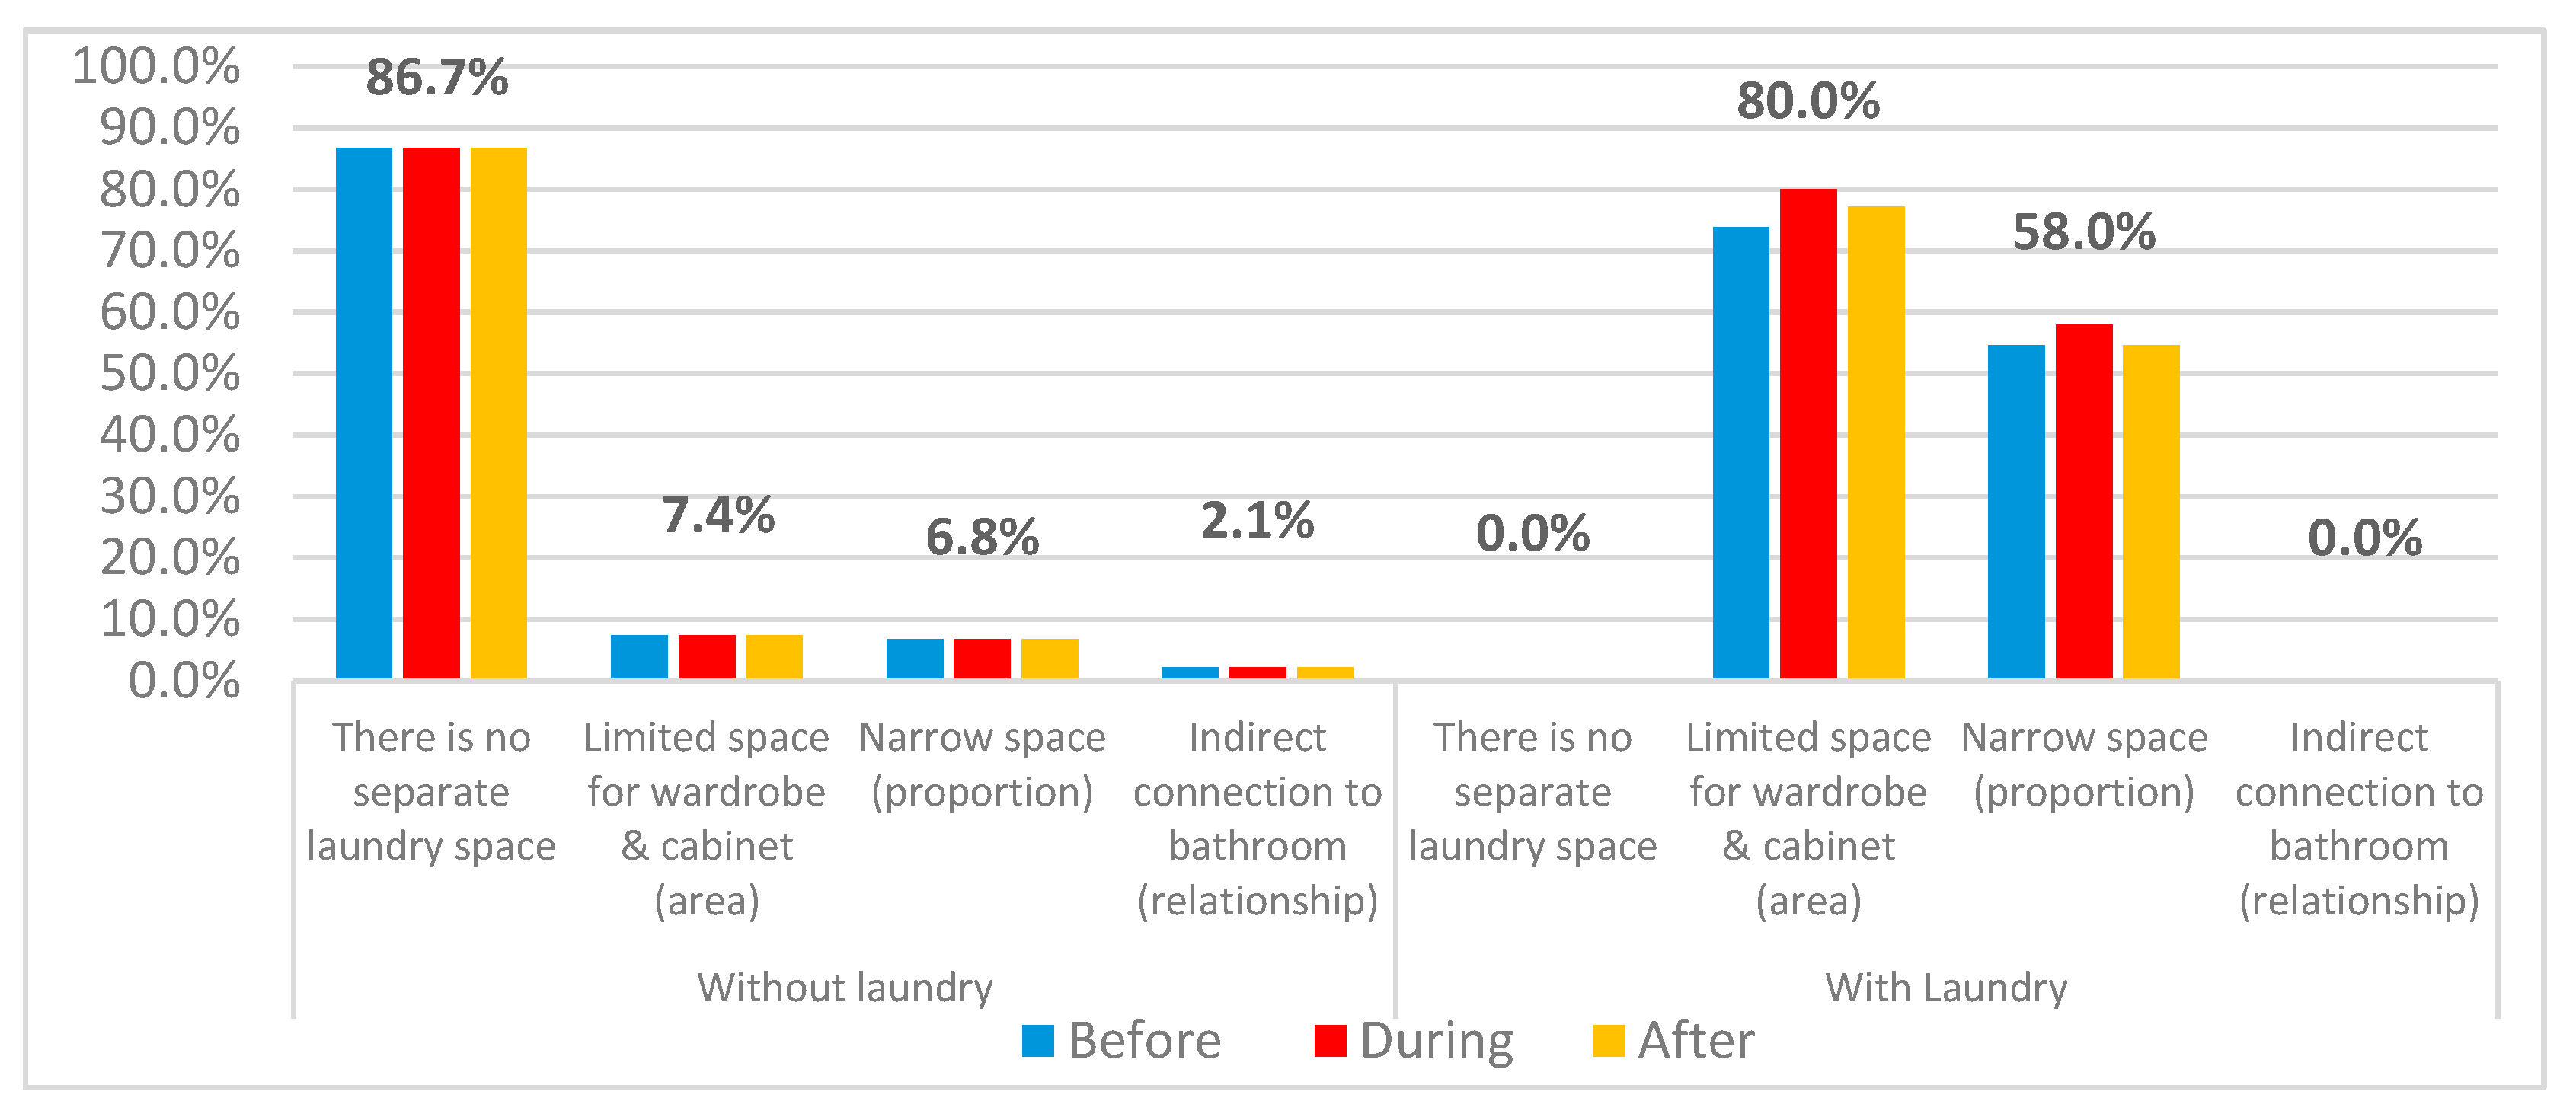
Figure 86.
Apartments without specific laundry space dissatisfaction percentages of both categories.
Figure 86.
Apartments without specific laundry space dissatisfaction percentages of both categories.
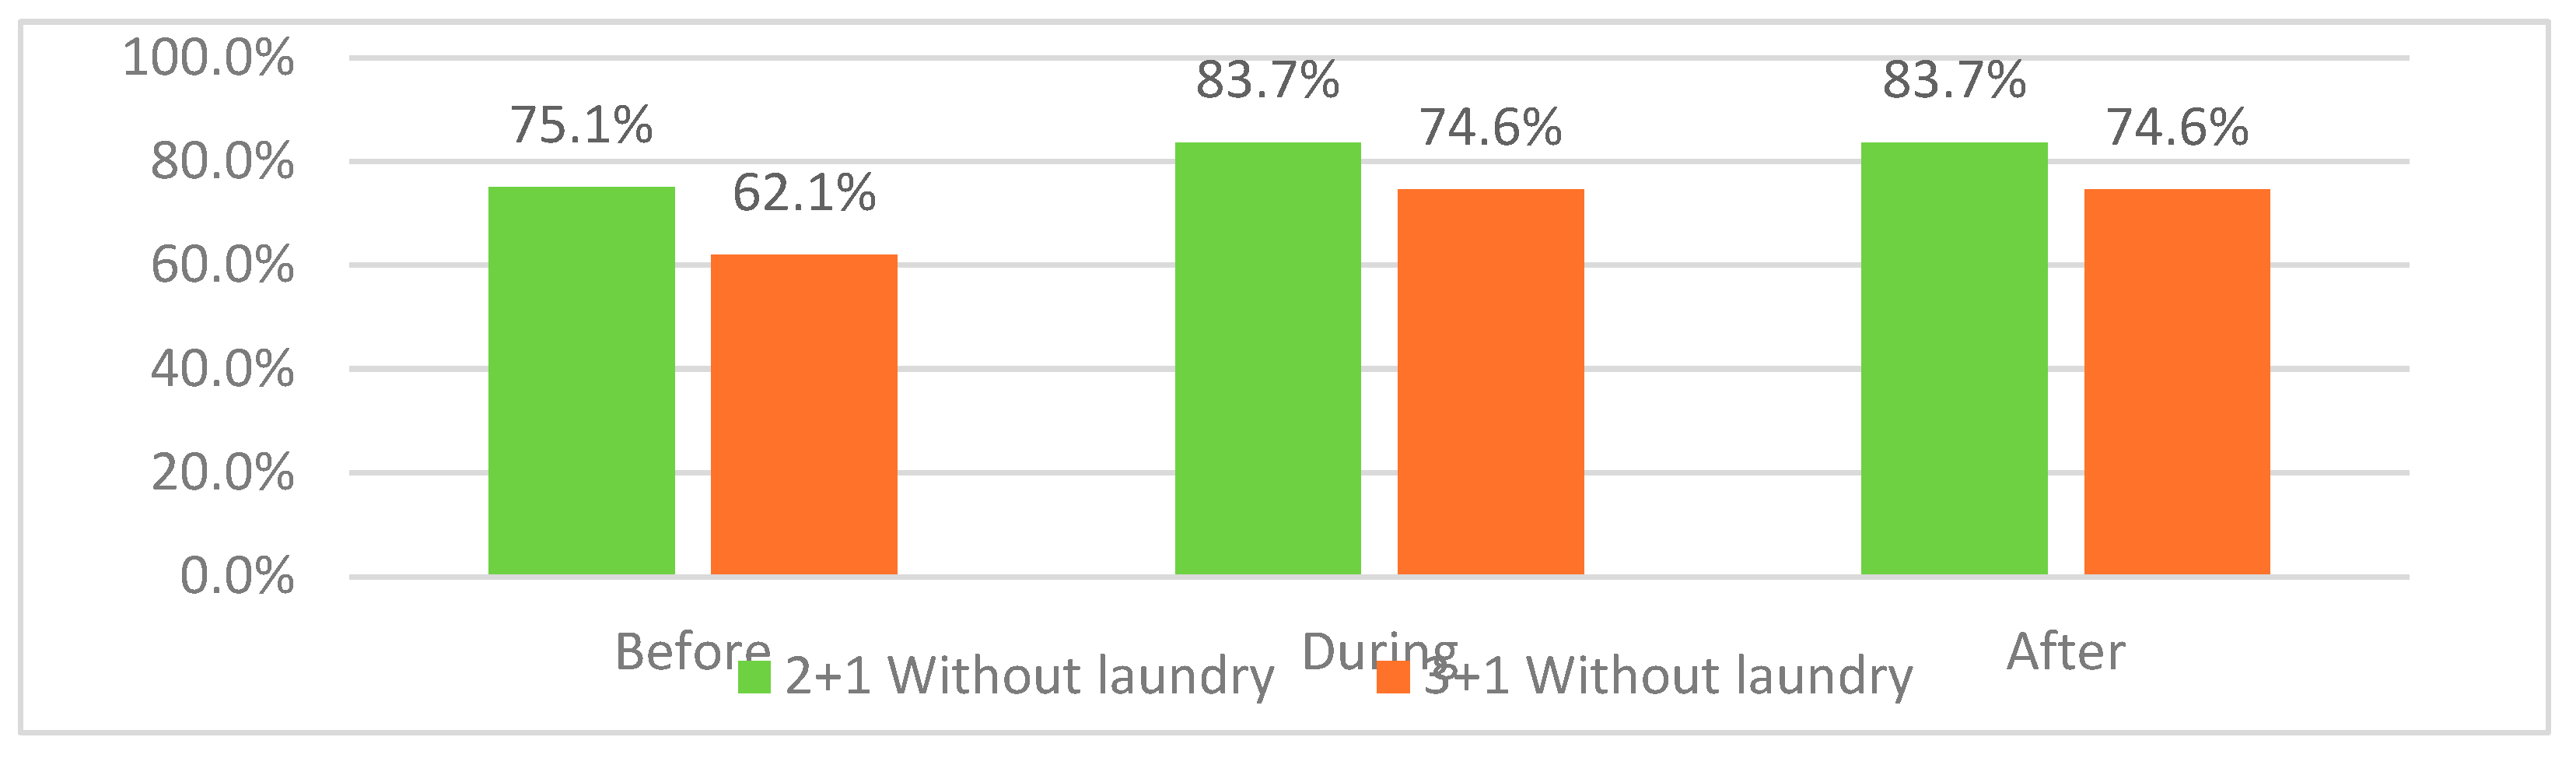
Figure 87.
Reasons for dissatisfactions variations of both categories with absence of specific laundry.
Figure 87.
Reasons for dissatisfactions variations of both categories with absence of specific laundry.
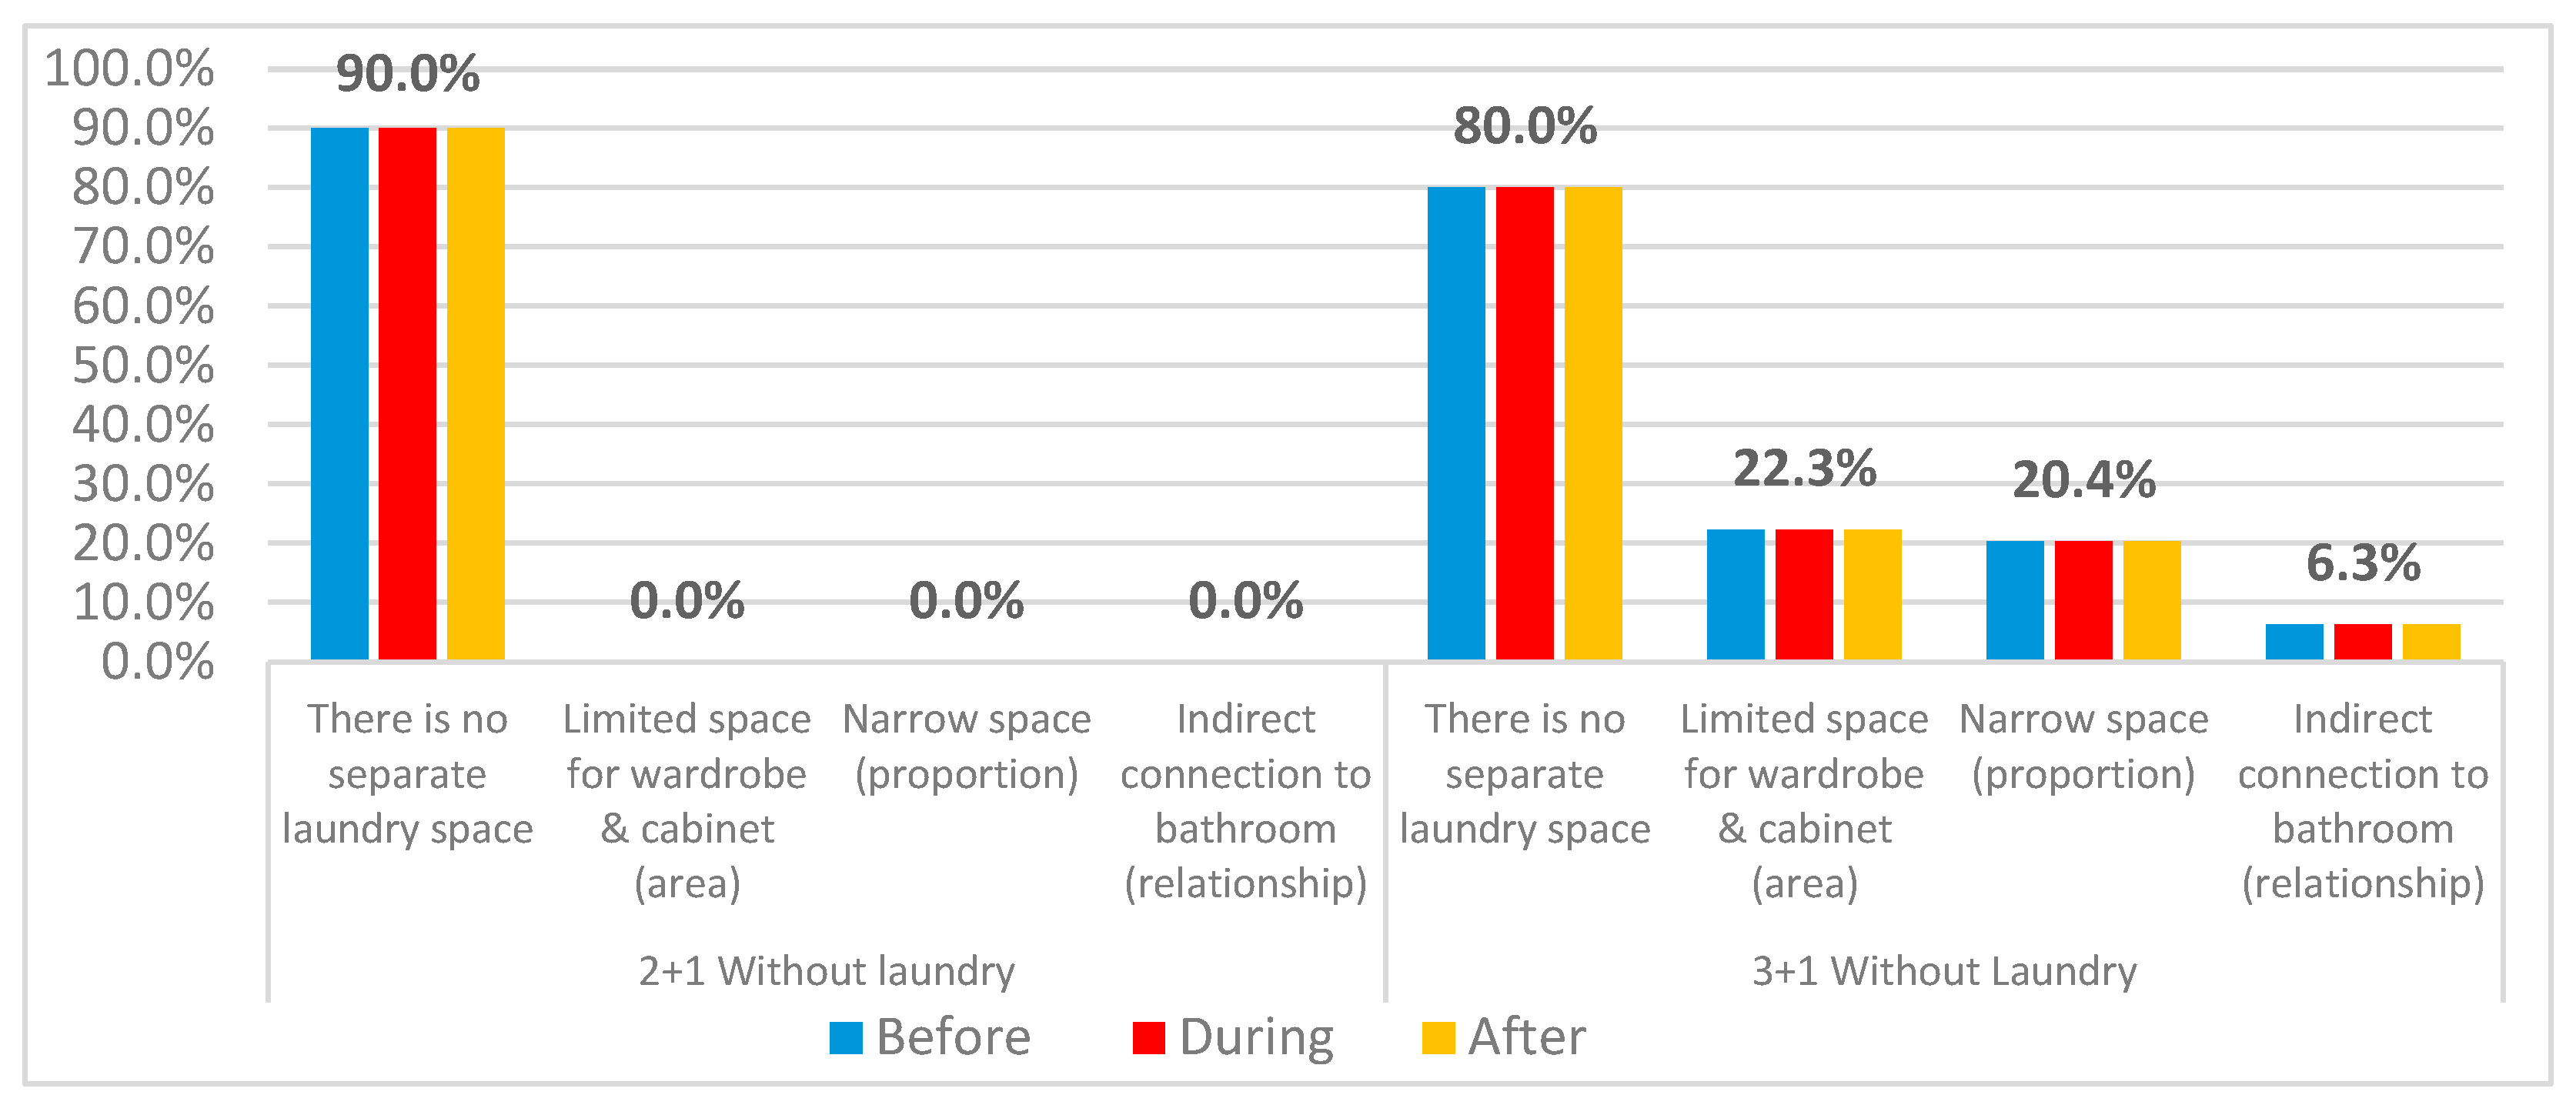
Figure 88.
Apartments containing specific laundry space’s dissatisfaction percentages of both categories 2+1 and 3+1.
Figure 88.
Apartments containing specific laundry space’s dissatisfaction percentages of both categories 2+1 and 3+1.
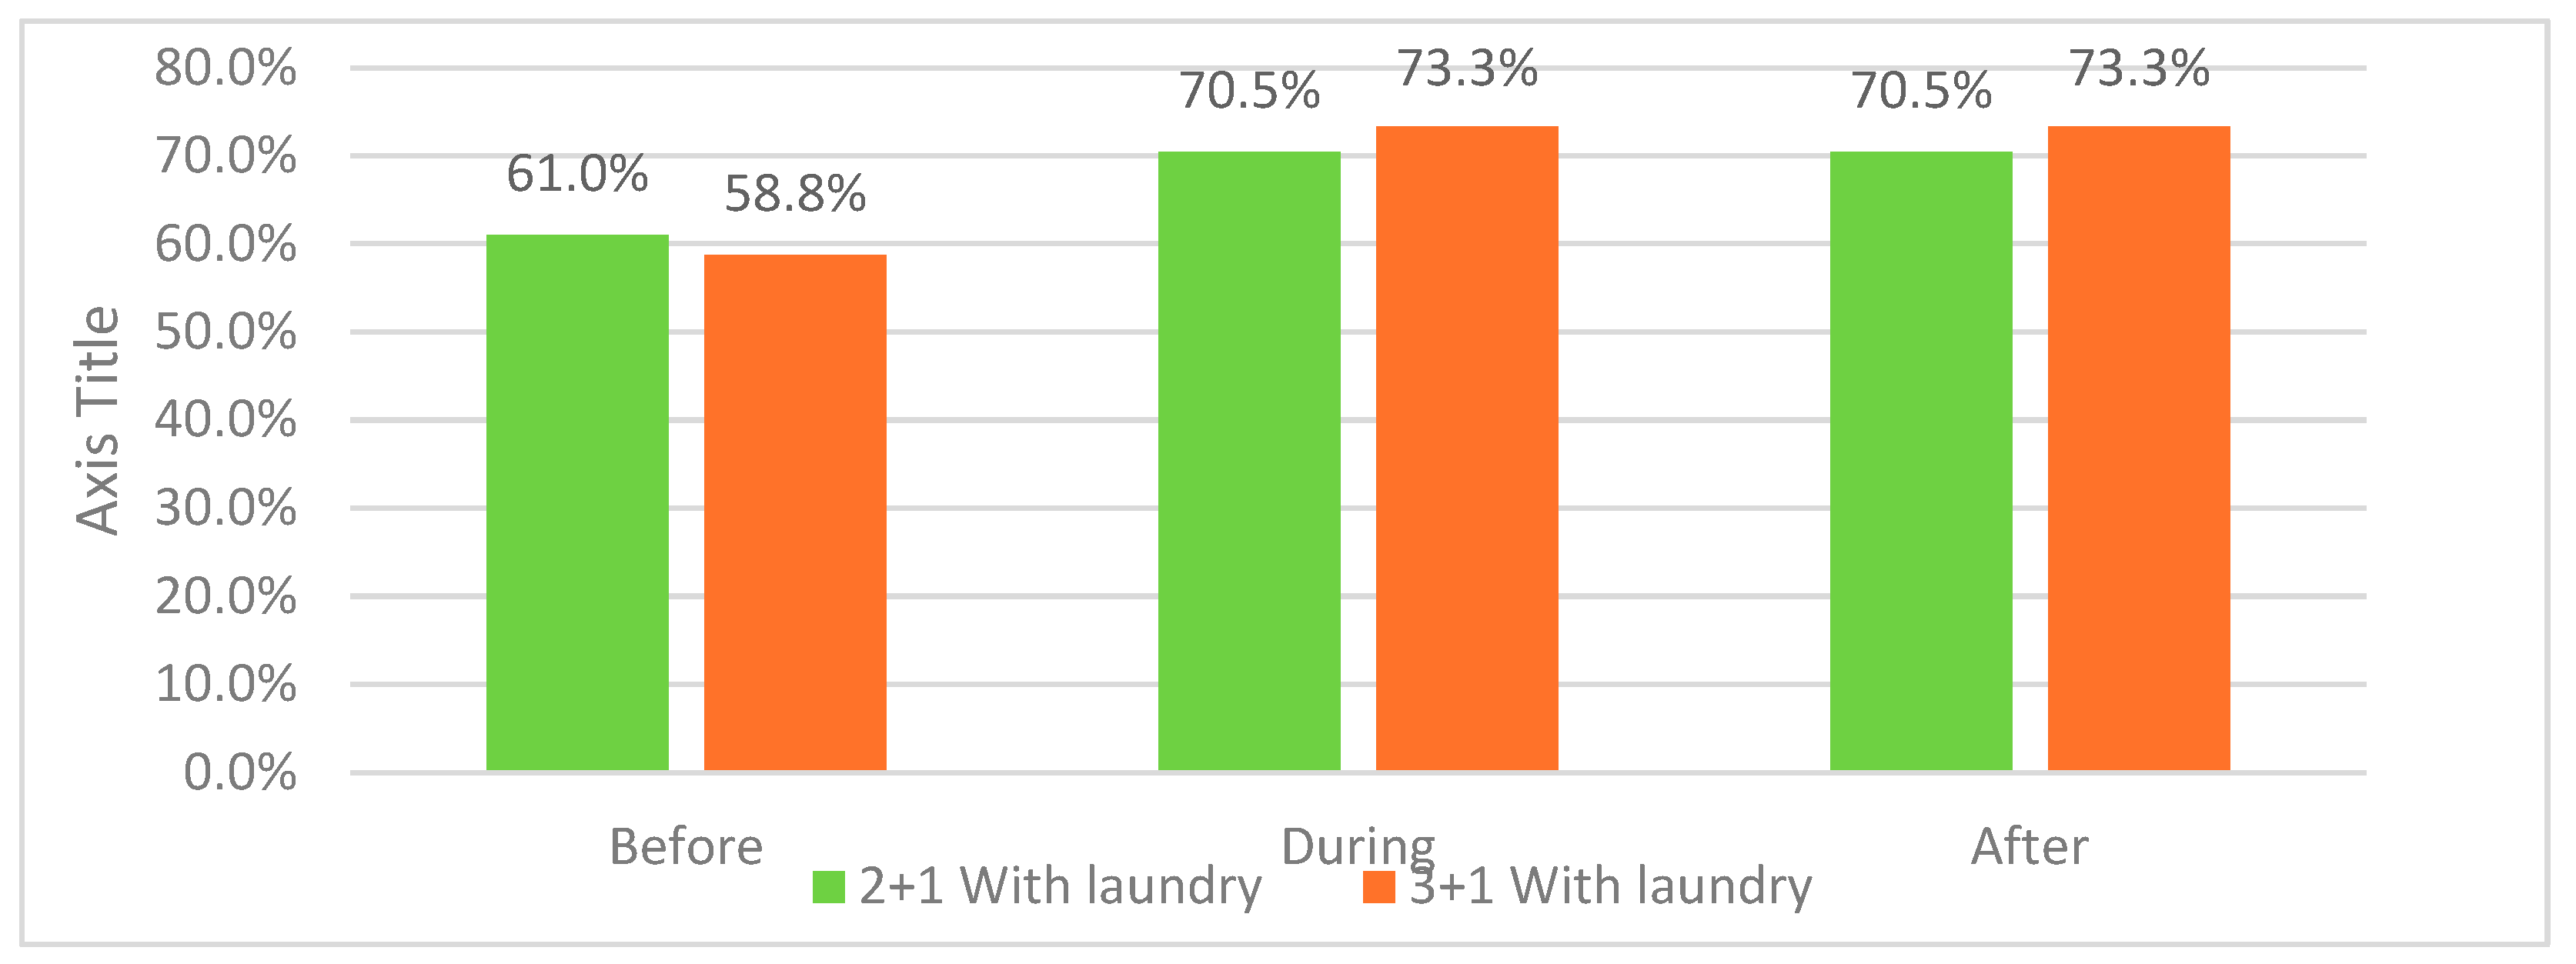
Figure 89.
Reasons for dissatisfaction variations regarding both apartments’ categories 2+1 and 3+1 with the availability of specific laundry space.
Figure 89.
Reasons for dissatisfaction variations regarding both apartments’ categories 2+1 and 3+1 with the availability of specific laundry space.
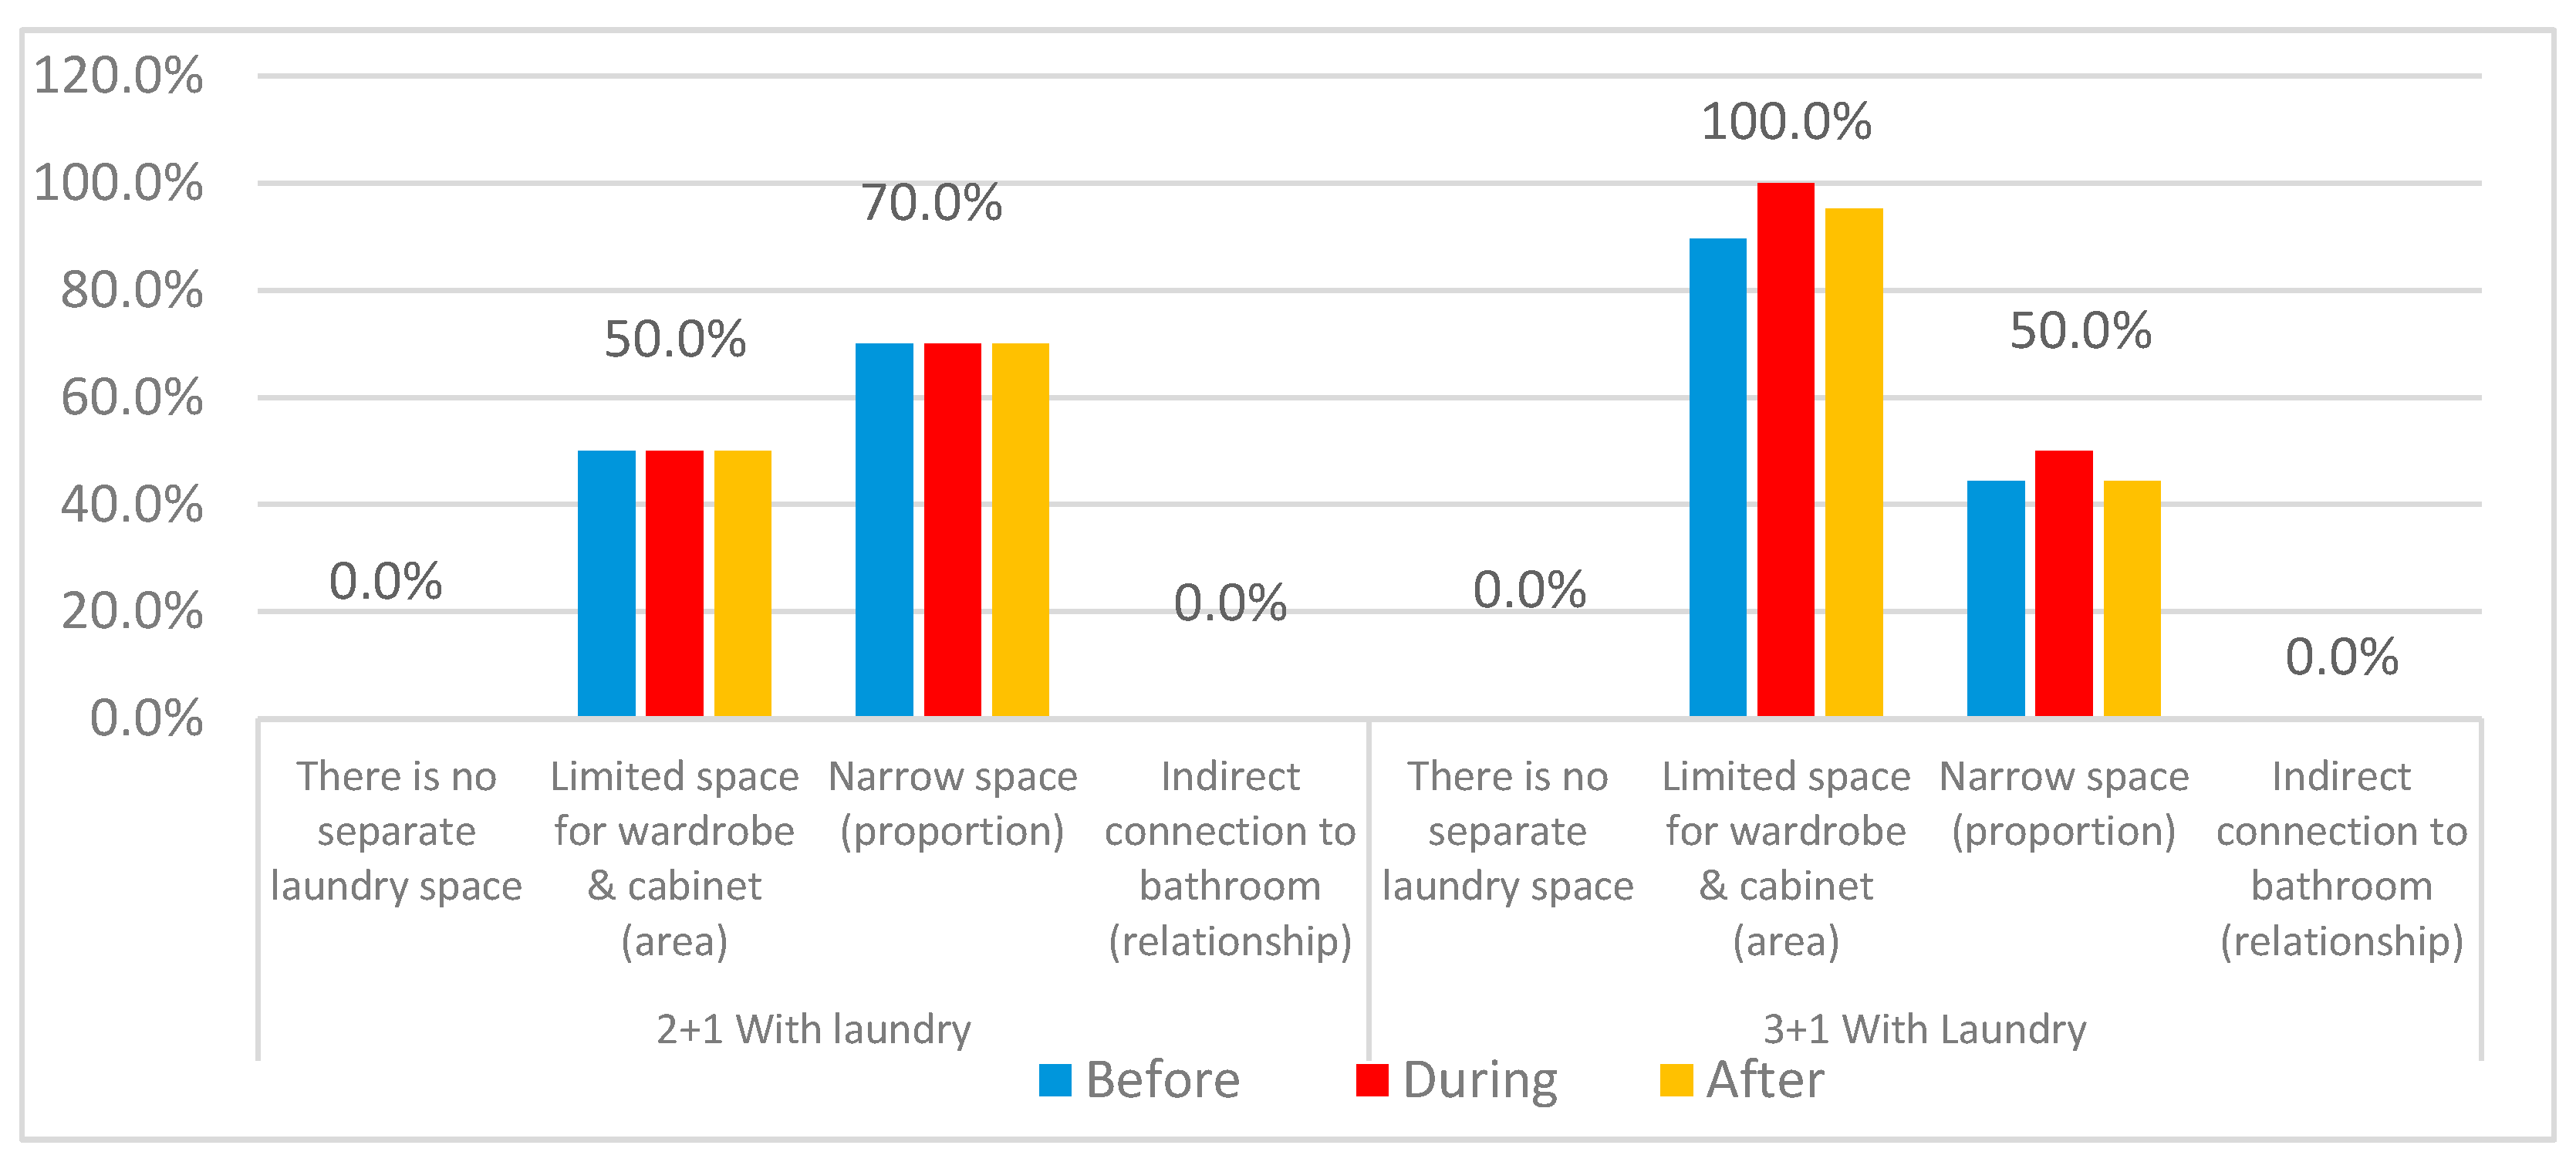
Figure 90.
Dissatisfaction variations for storage through three stages of pandemic.
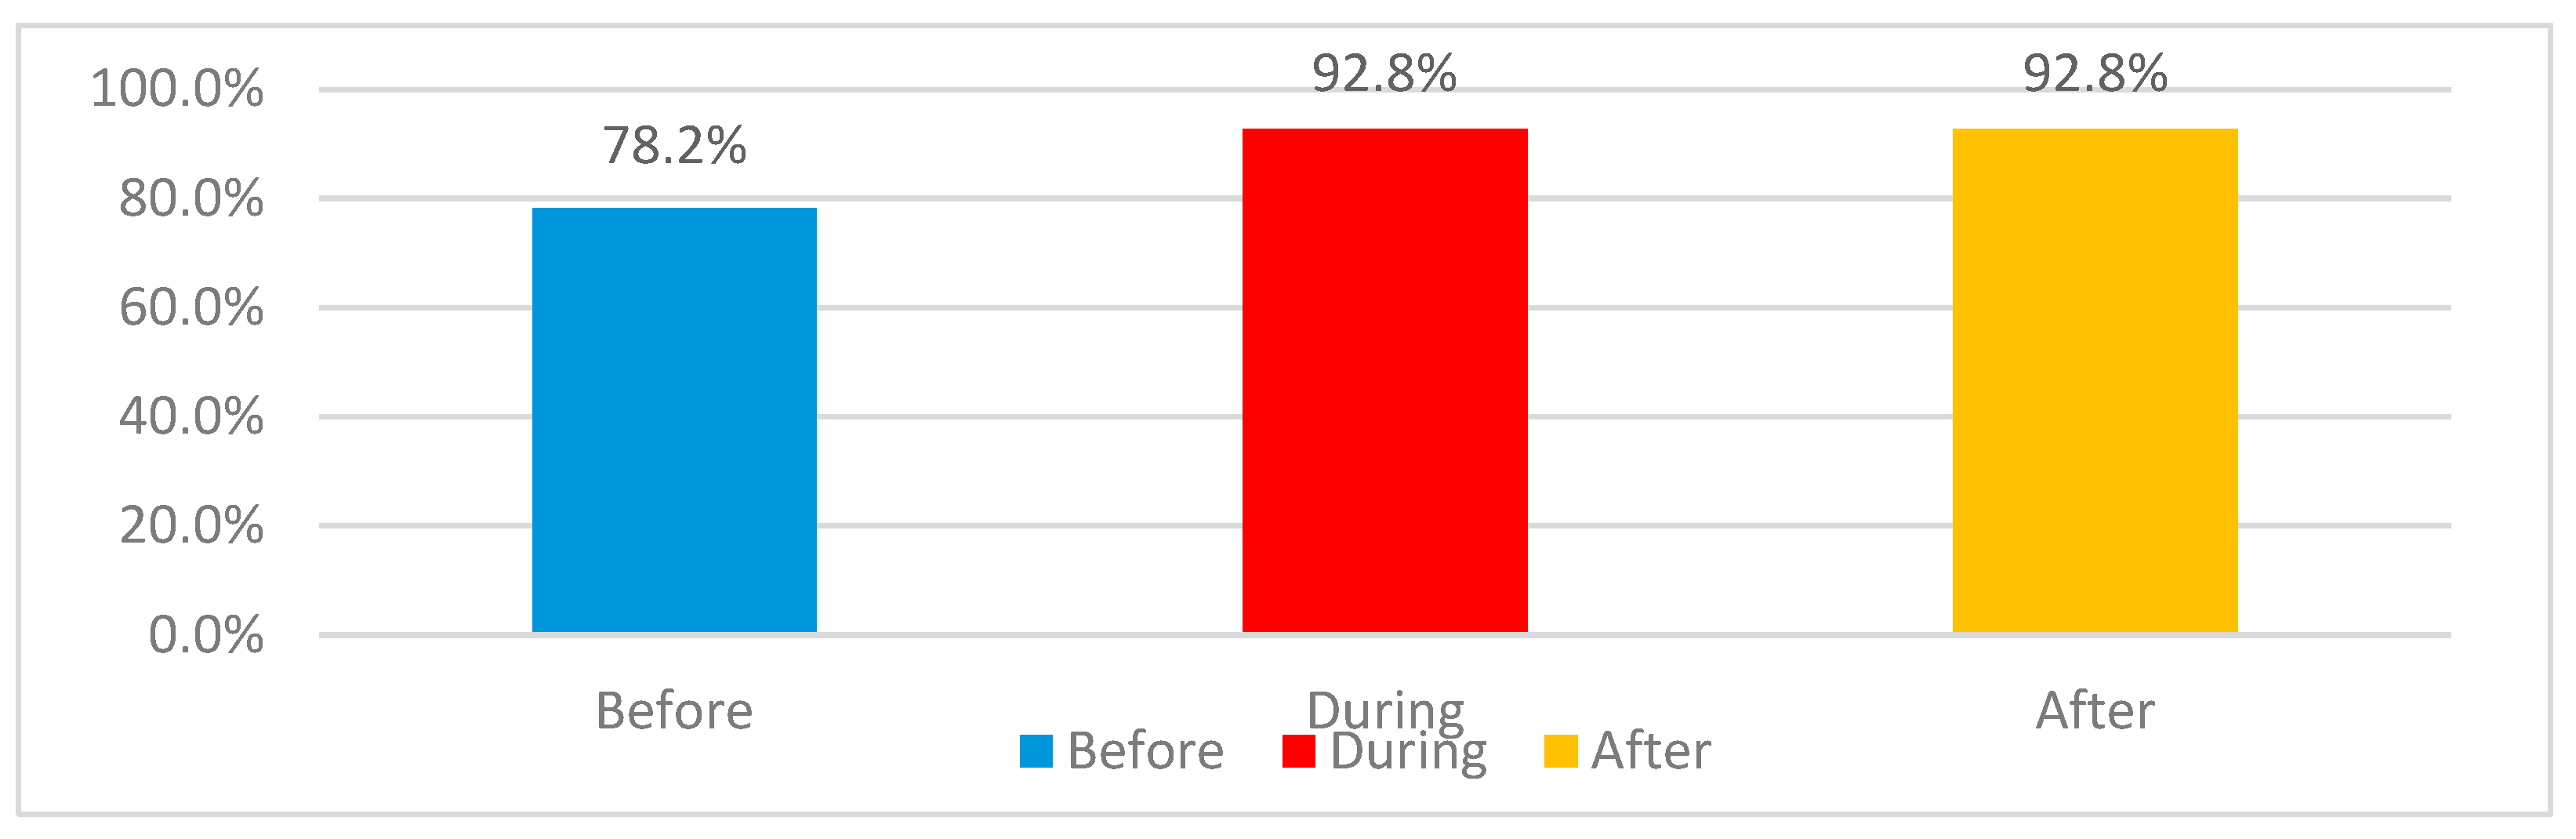
Figure 91.
Reasons for dissatisfaction variations regarding storage activity .
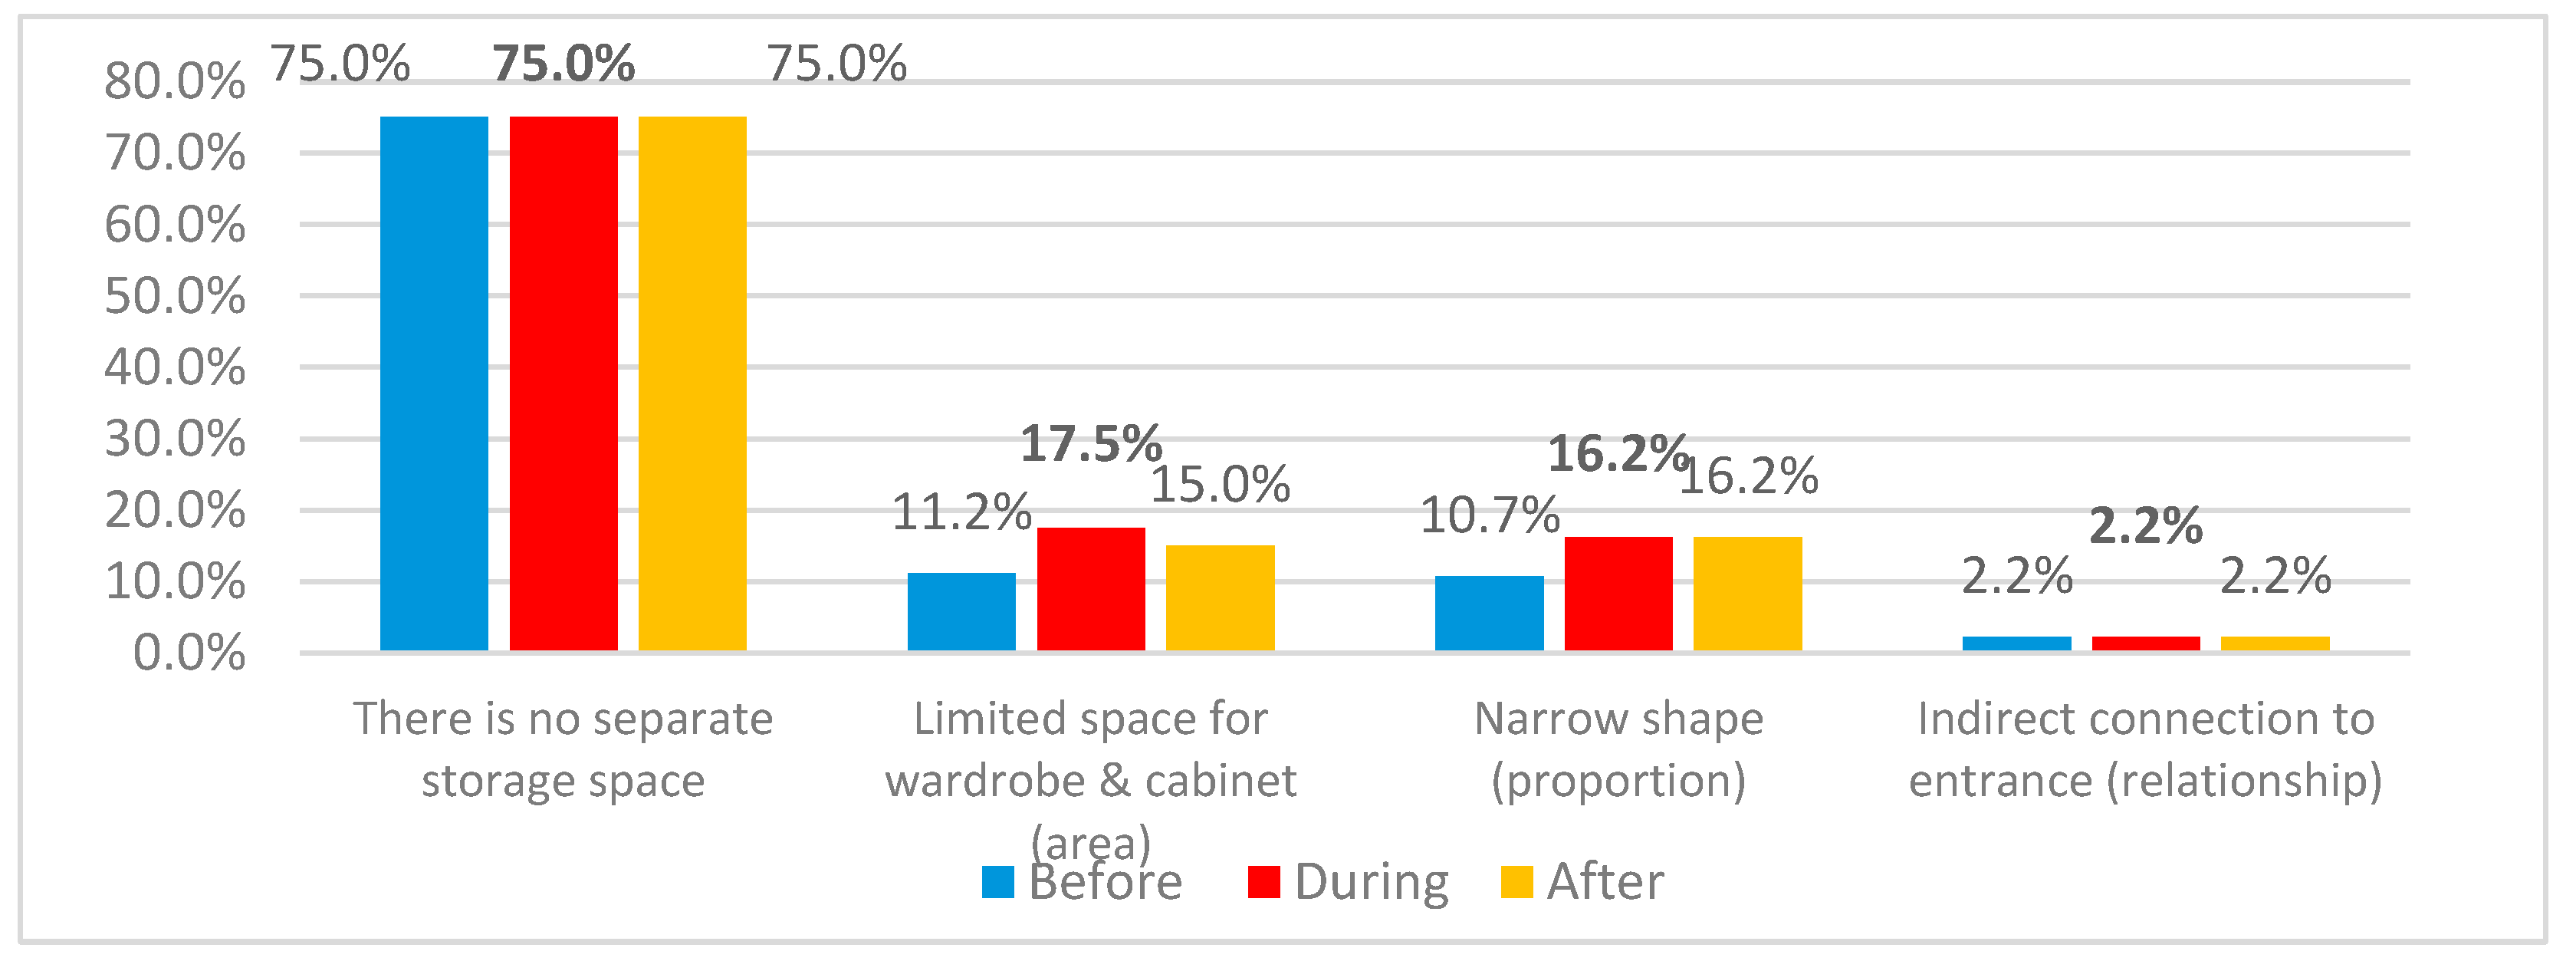
Figure 92.
Dissatisfaction variations due to availability or absence of storage space.
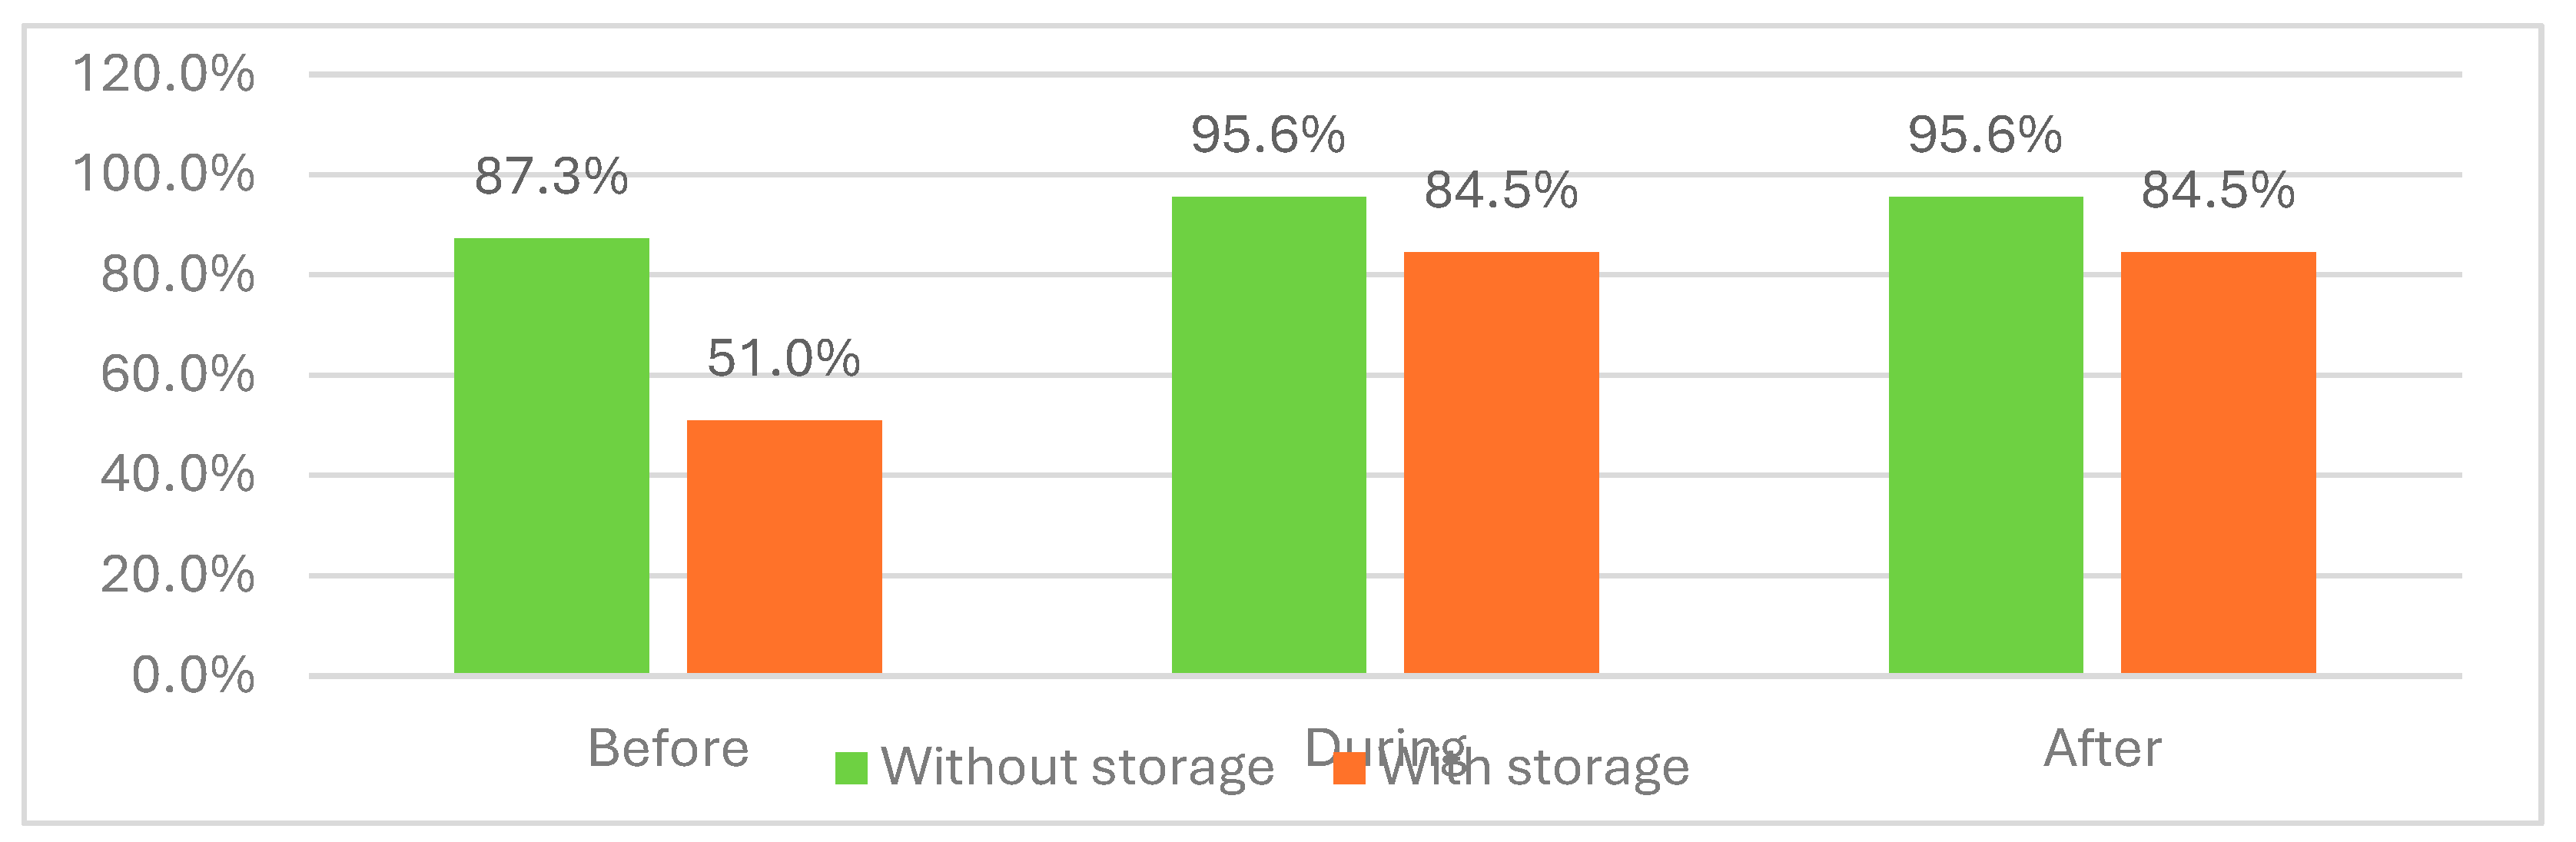
Figure 93.
Dissatisfaction percentages of both categories 2+1 and 3+1 of apartments without specific storage space.
Figure 93.
Dissatisfaction percentages of both categories 2+1 and 3+1 of apartments without specific storage space.
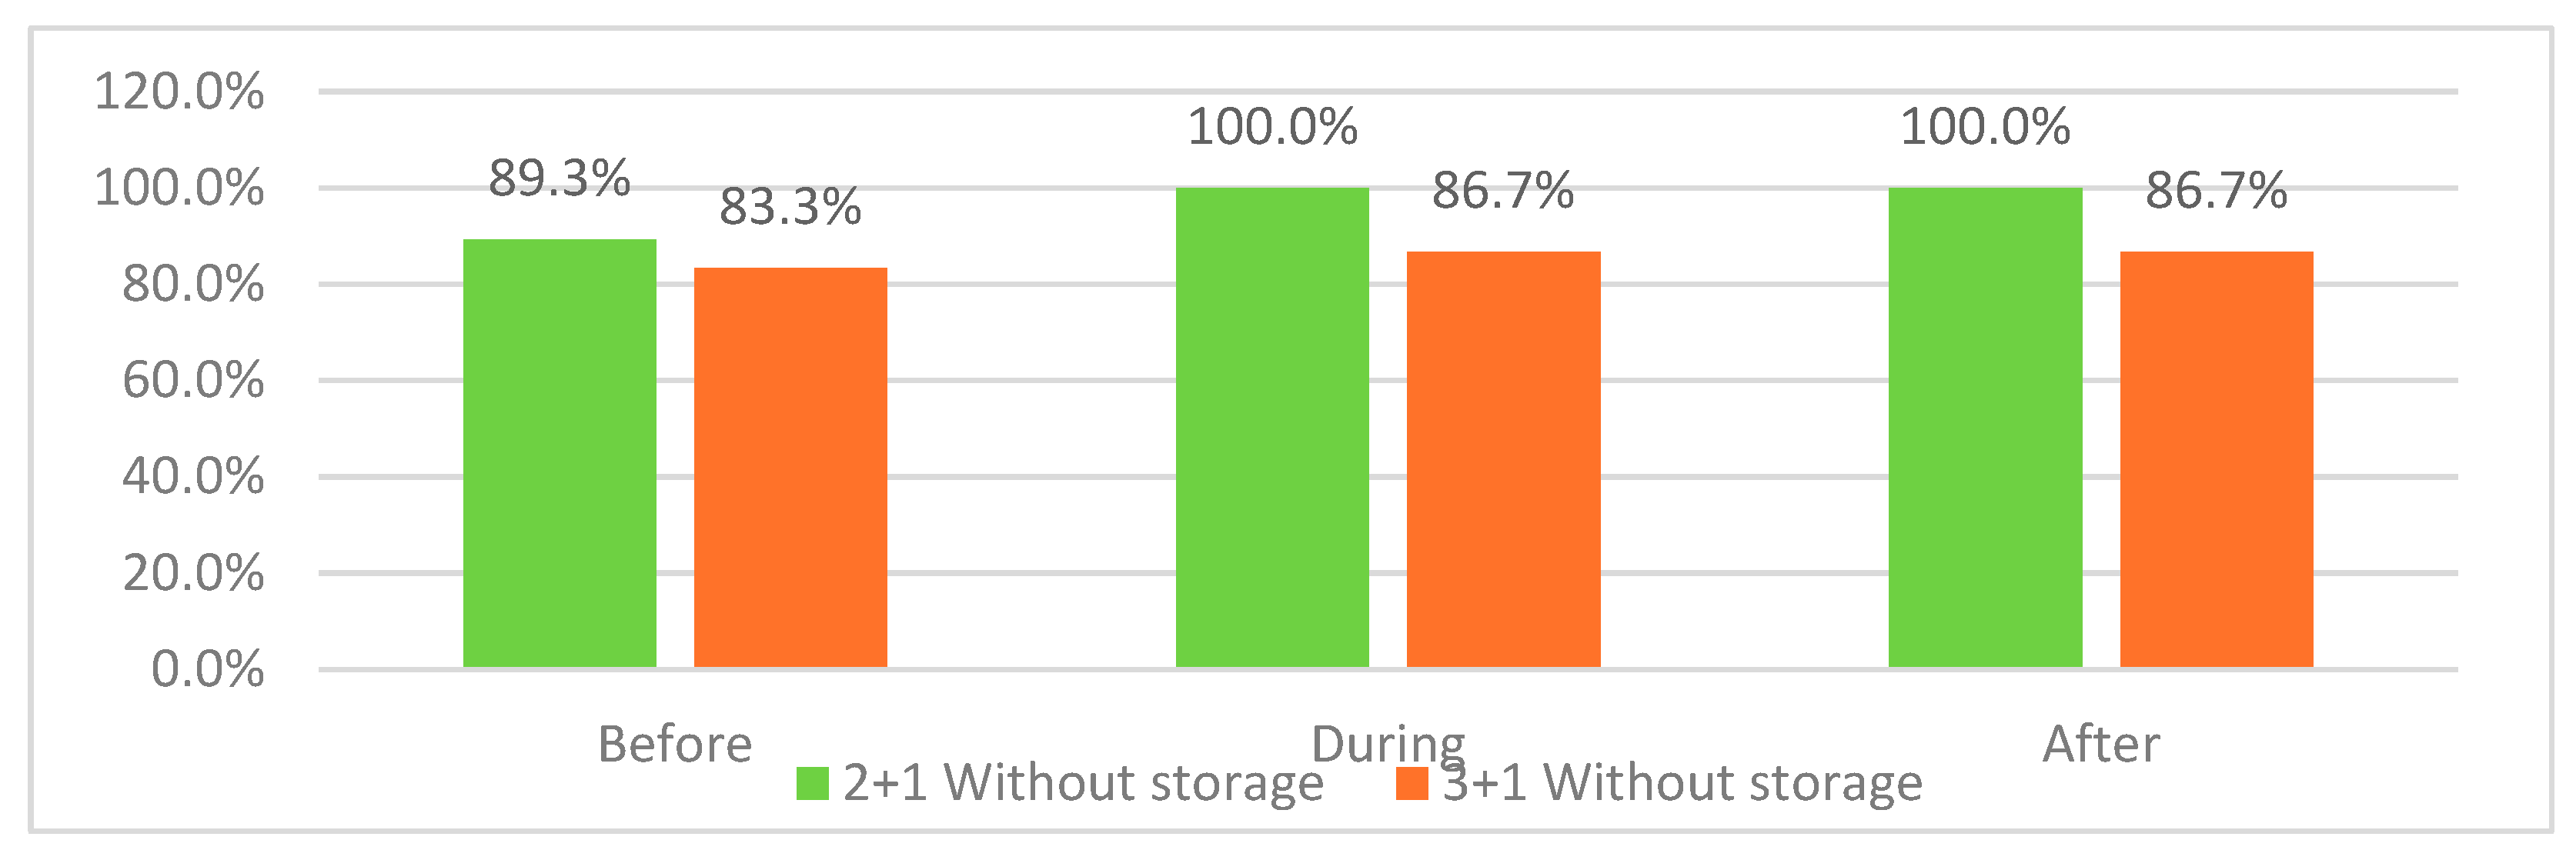
Figure 94.
Dissatisfaction percentages of both categories of apartments having specific storage space.
Figure 94.
Dissatisfaction percentages of both categories of apartments having specific storage space.
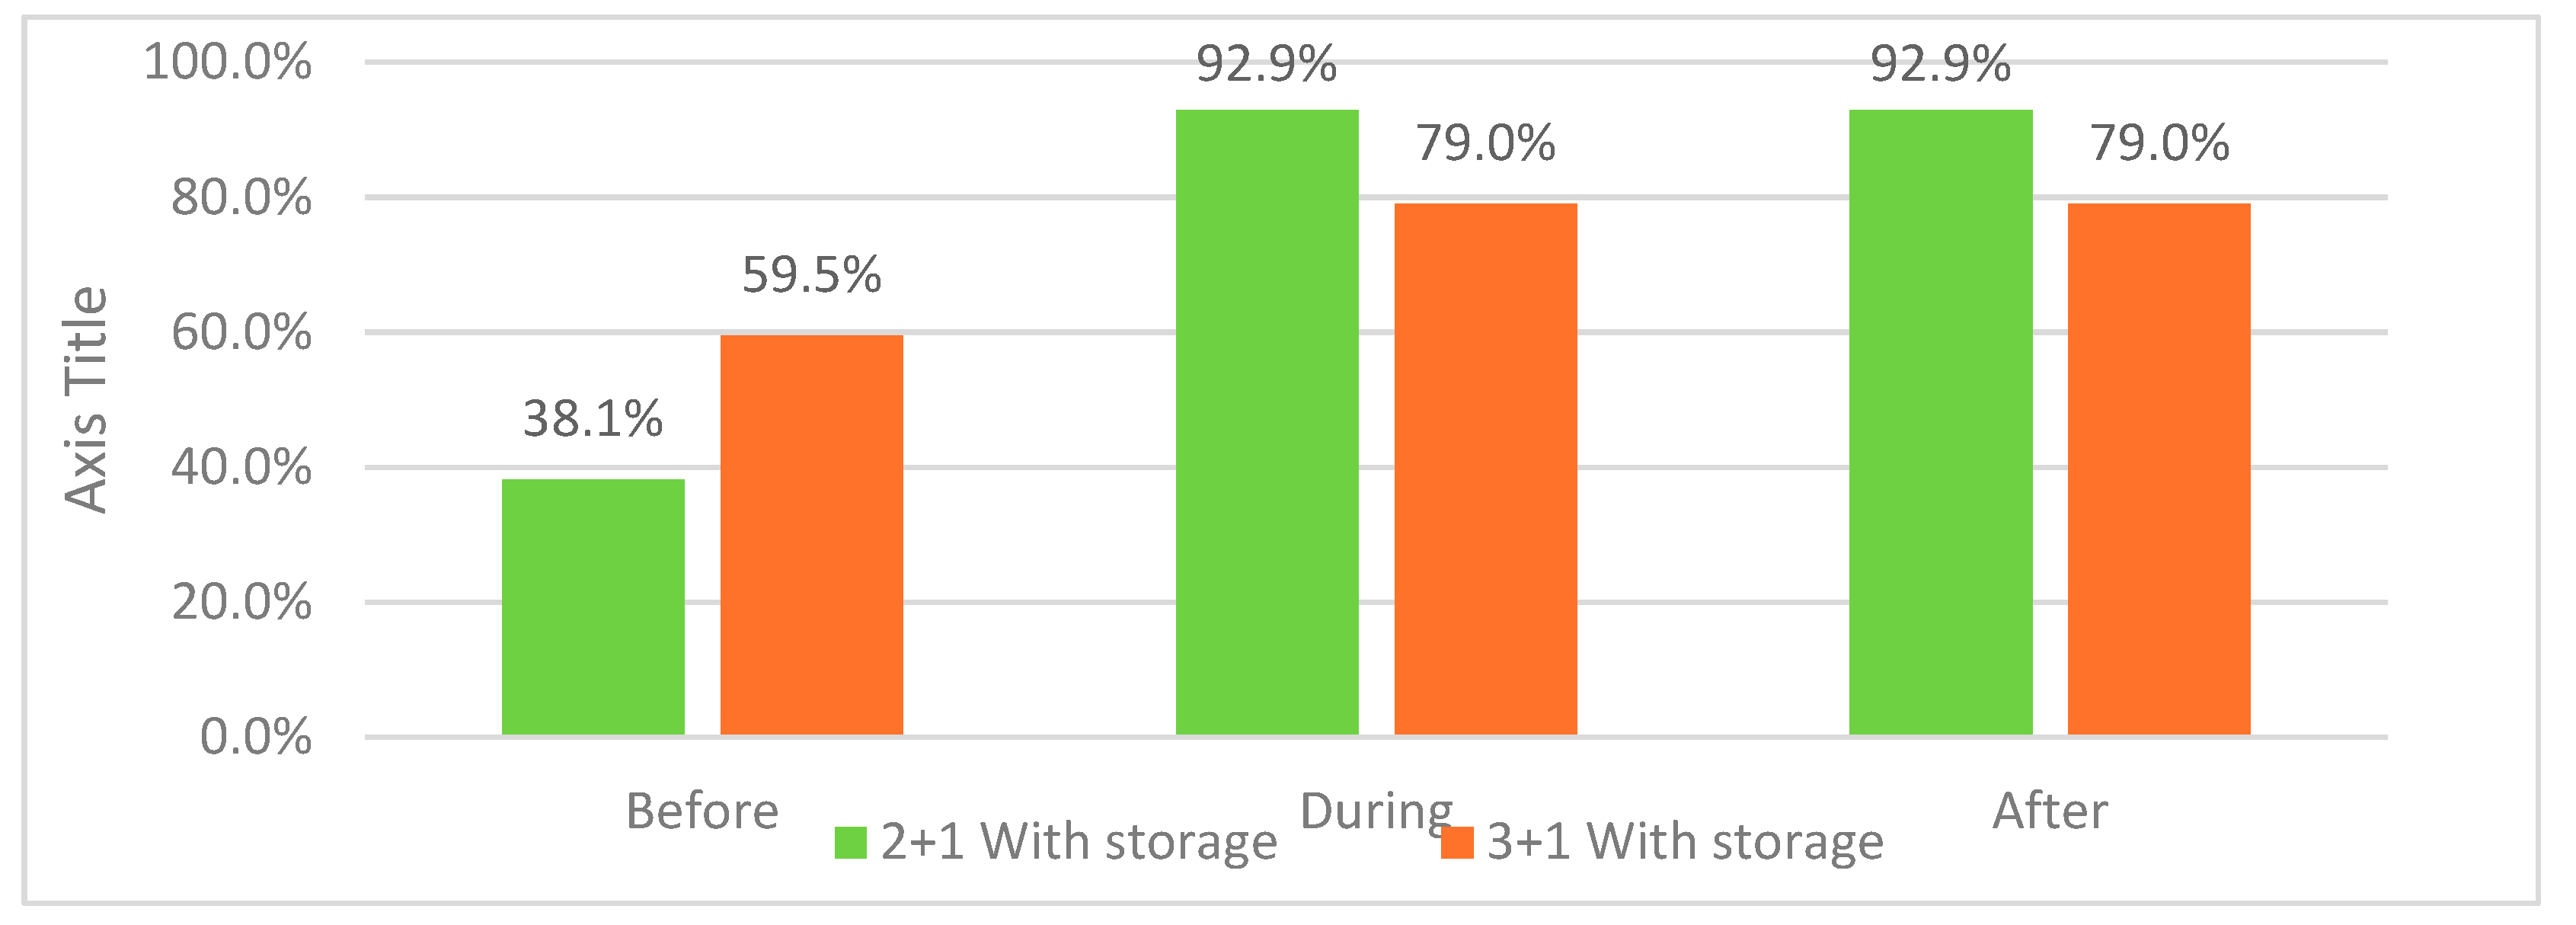
Figure 95.
Reasons for dissatisfactions variations regarding both apartments’ categories 2+1 and 3+1 with the absence of specific storage space.
Figure 95.
Reasons for dissatisfactions variations regarding both apartments’ categories 2+1 and 3+1 with the absence of specific storage space.
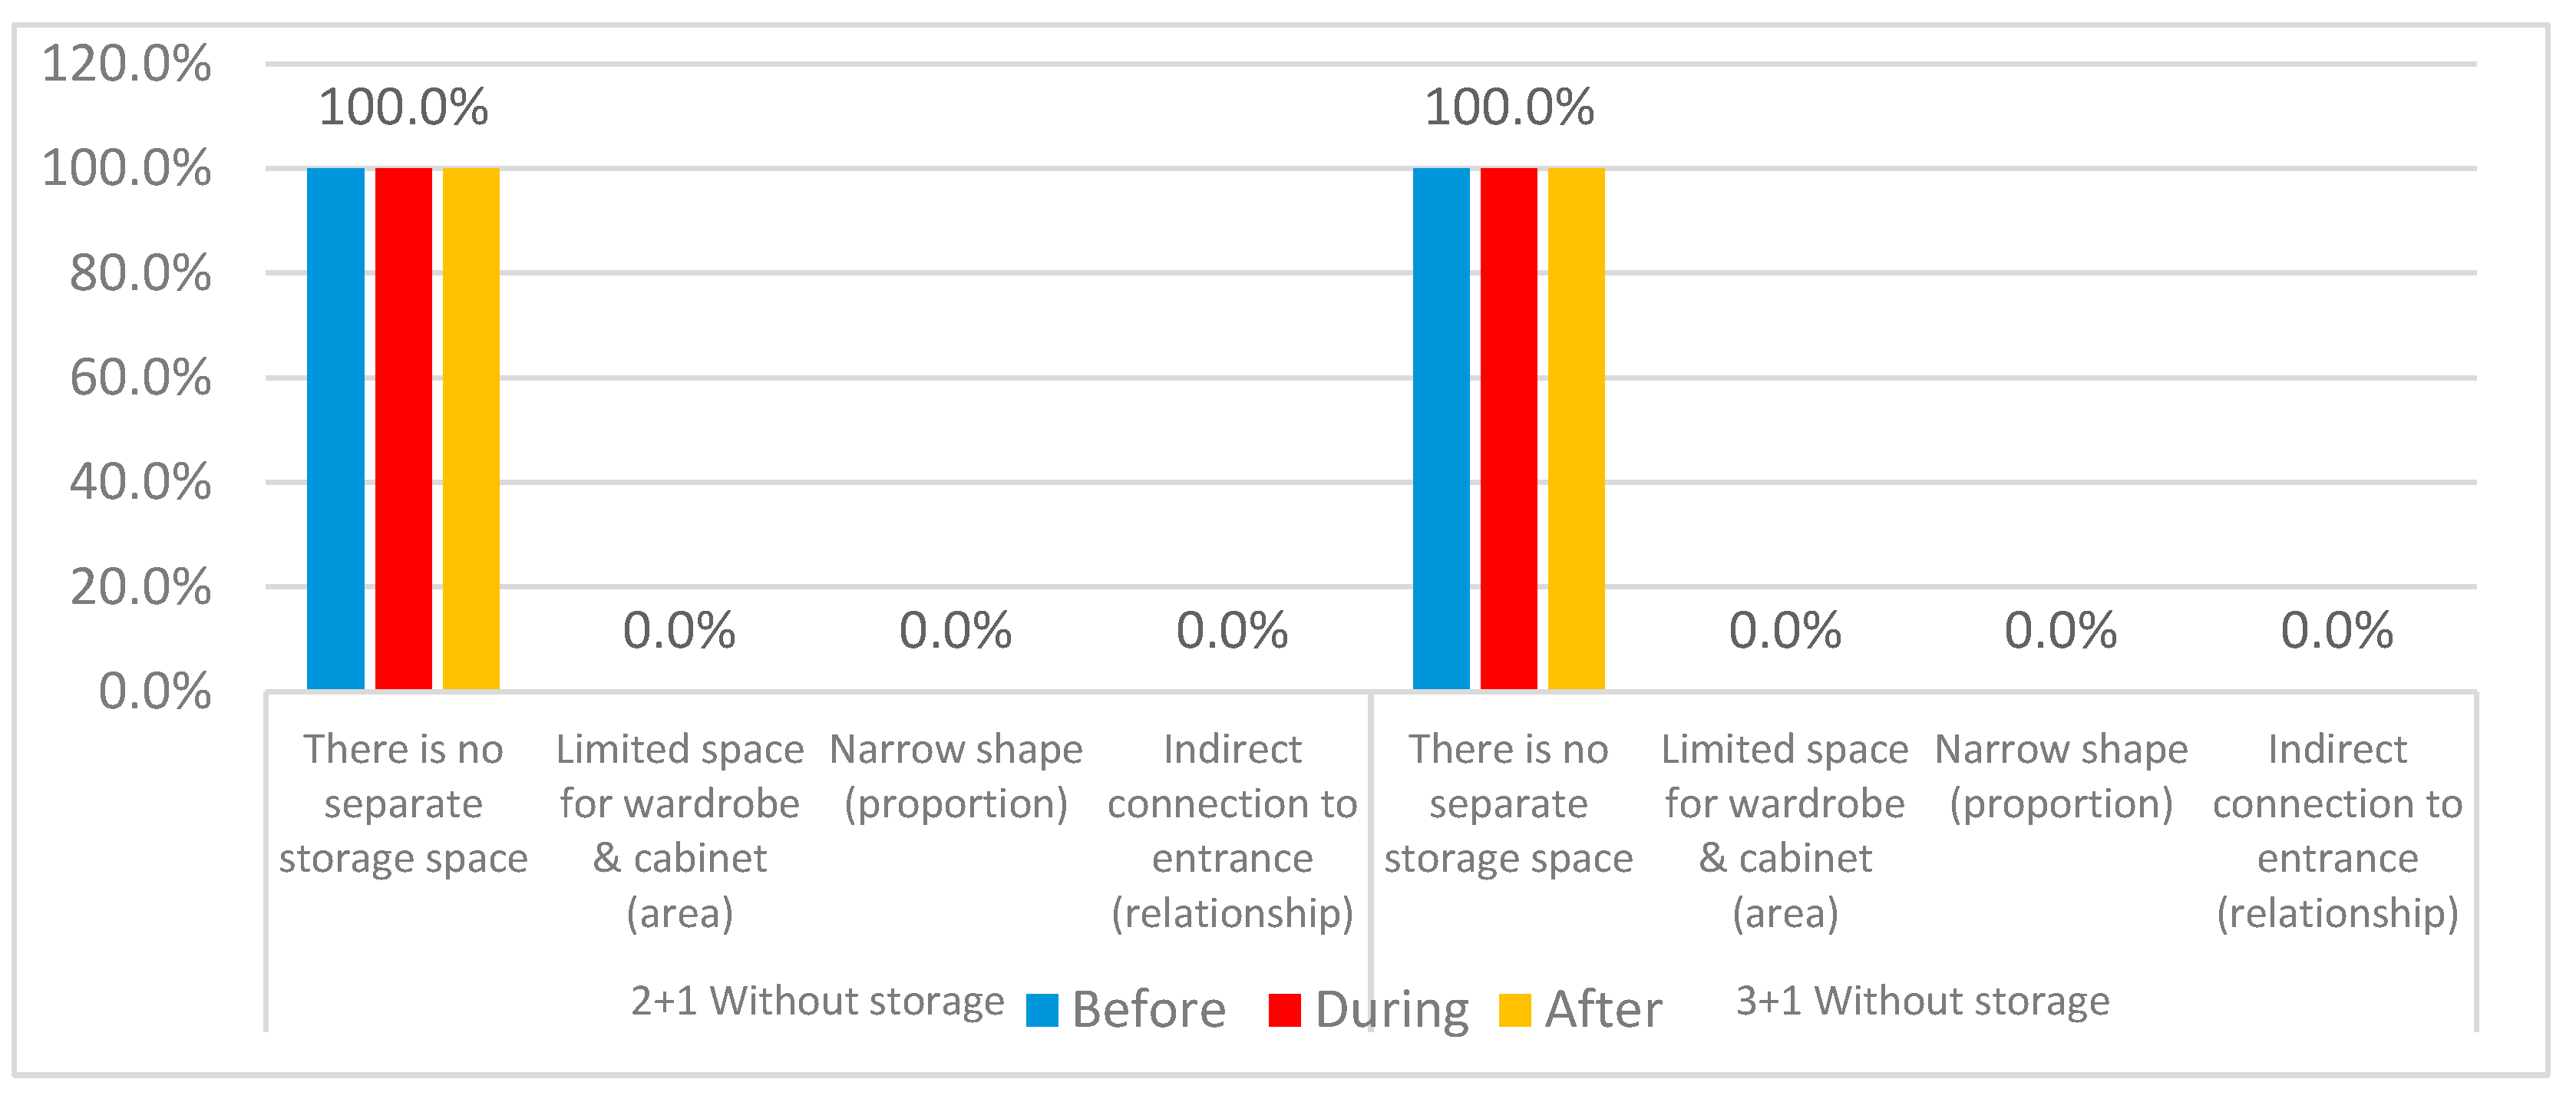
Figure 96.
Reasons for dissatisfaction variations regarding both apartments’ categories 2+1 and 3+1 with the availability of specific storage space.
Figure 96.
Reasons for dissatisfaction variations regarding both apartments’ categories 2+1 and 3+1 with the availability of specific storage space.
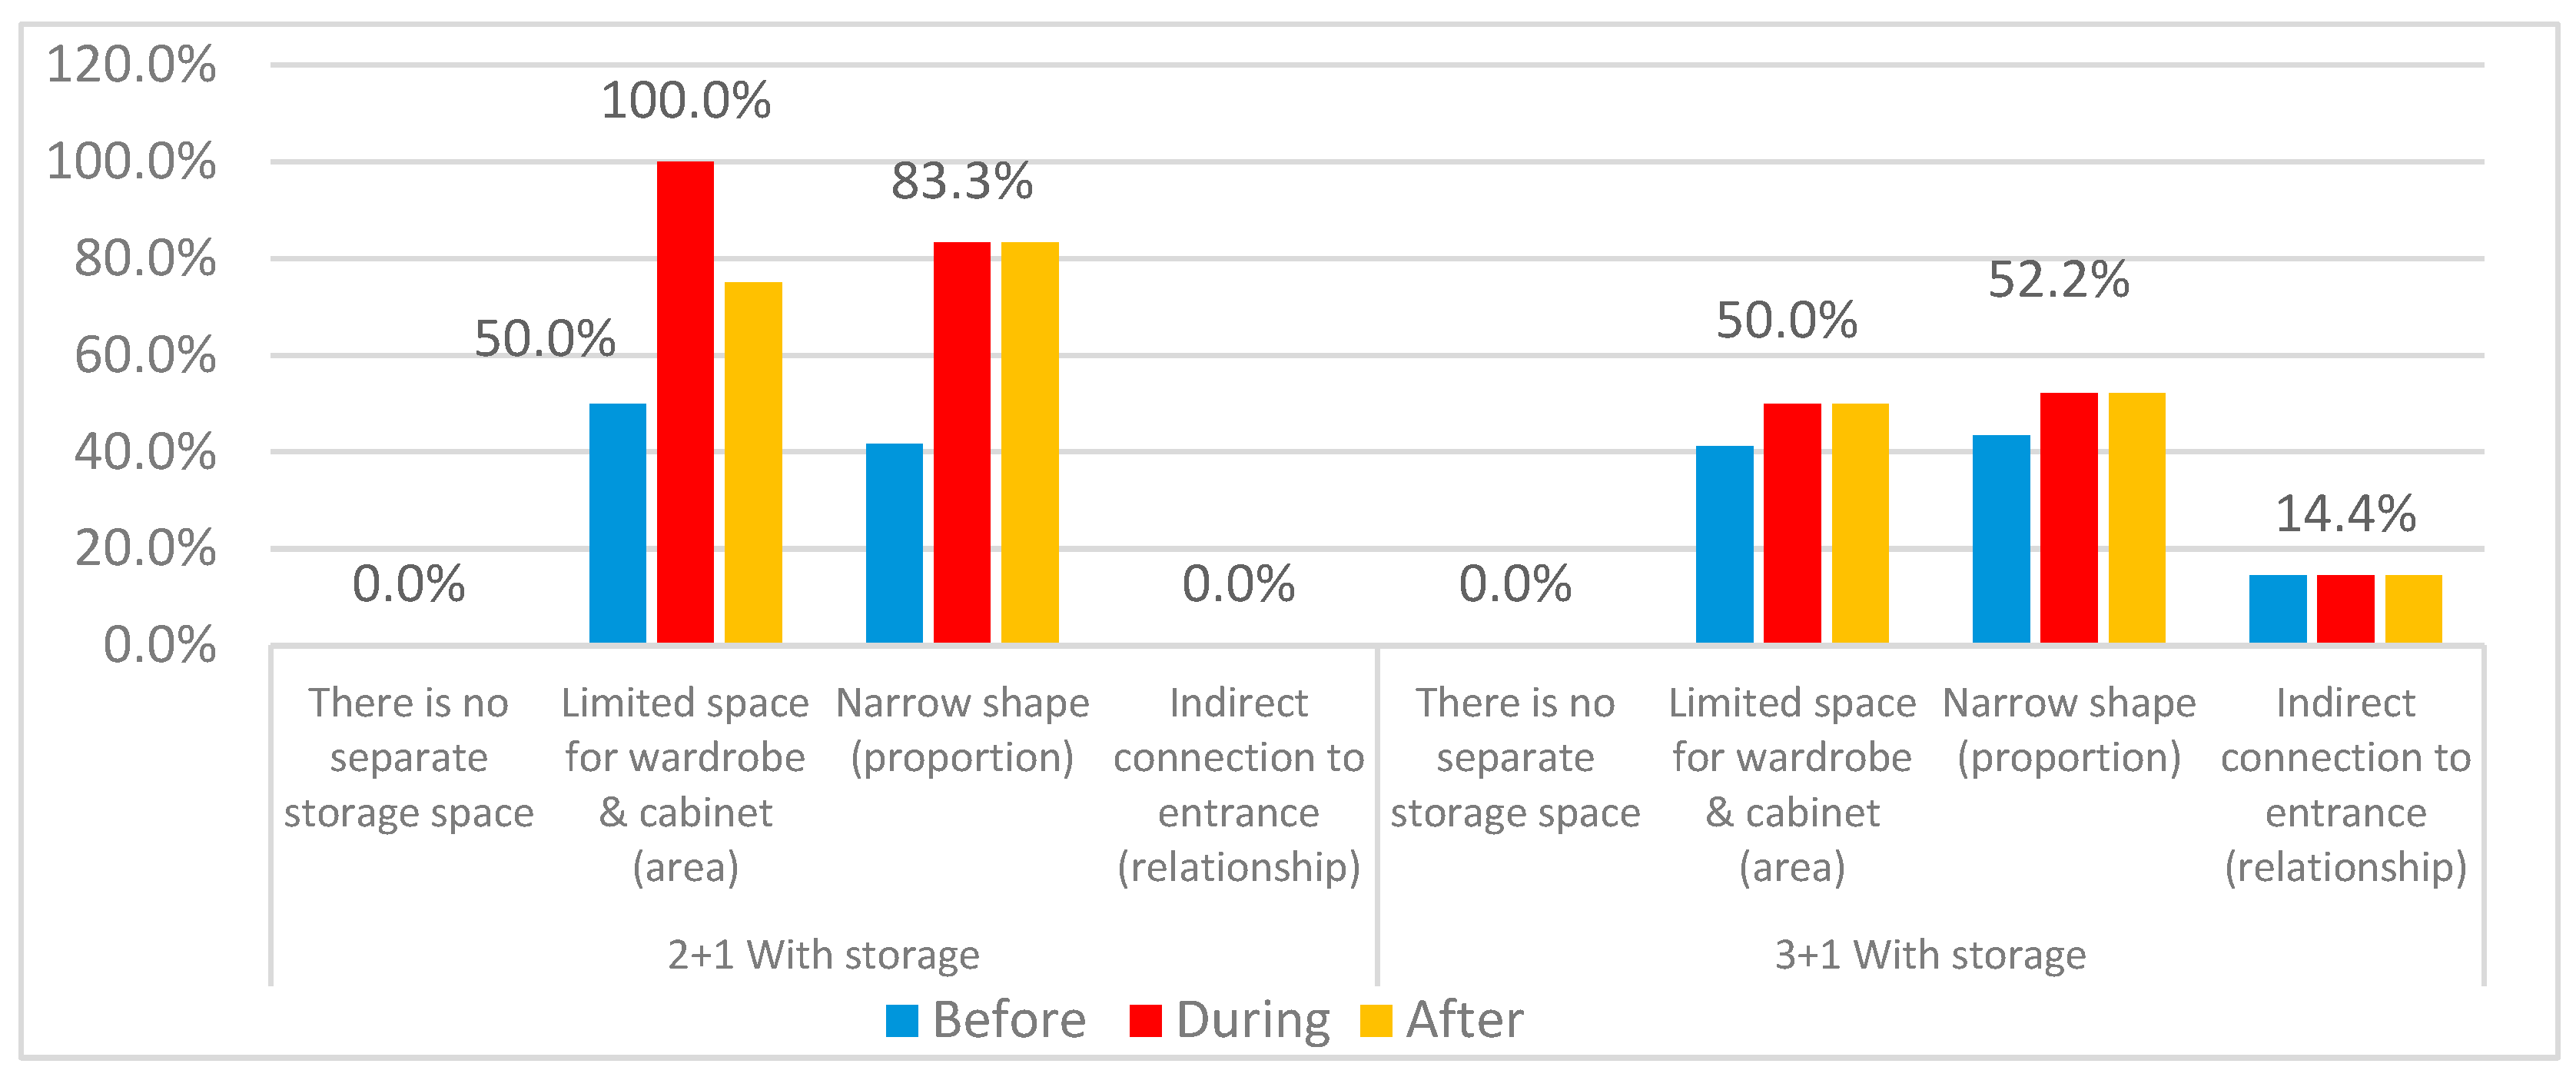
Figure 97.
Dissatisfaction variations for balconies through three stages of pandemic.
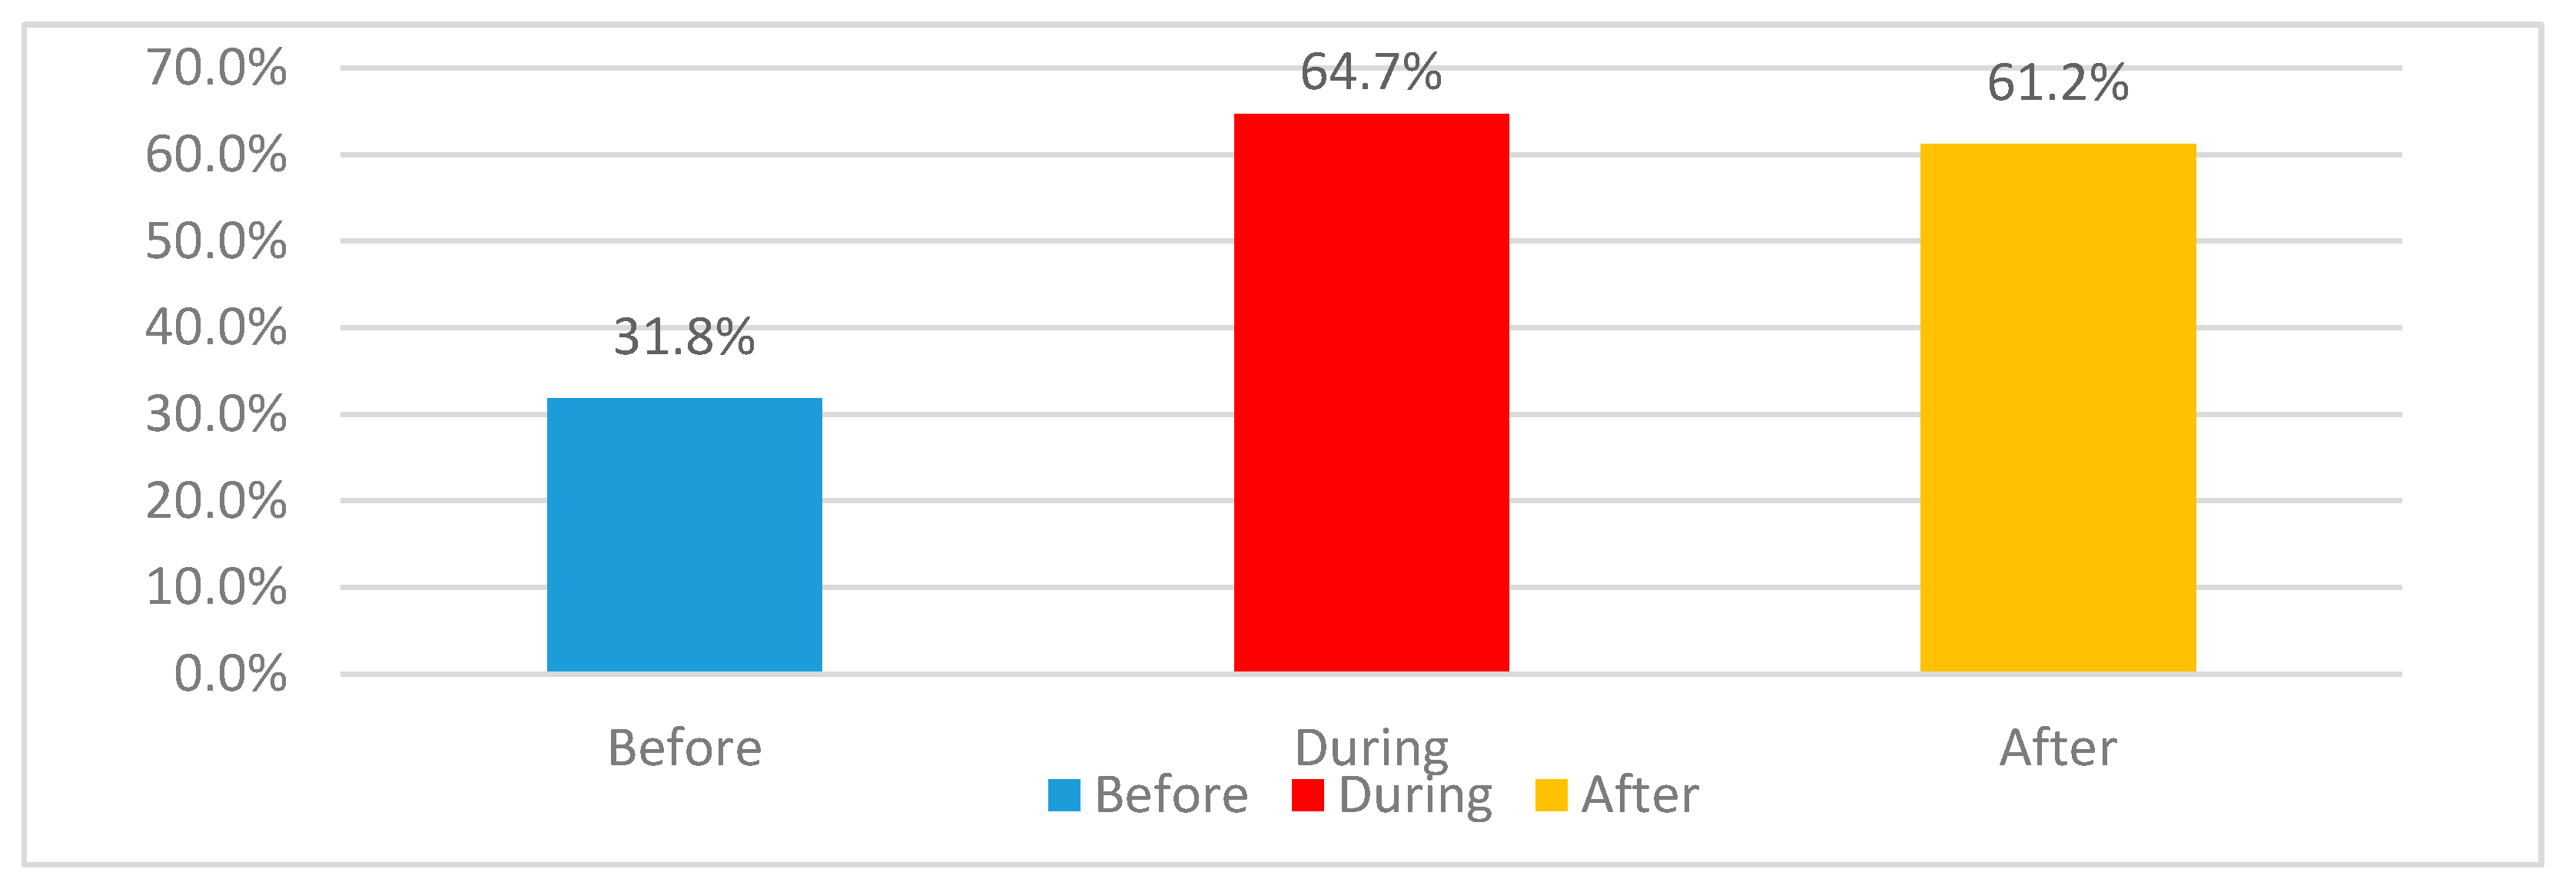
Figure 98.
Dissatisfaction percentages of both types of apartments for availability or absence of balconies through three stages of study concern.
Figure 98.
Dissatisfaction percentages of both types of apartments for availability or absence of balconies through three stages of study concern.
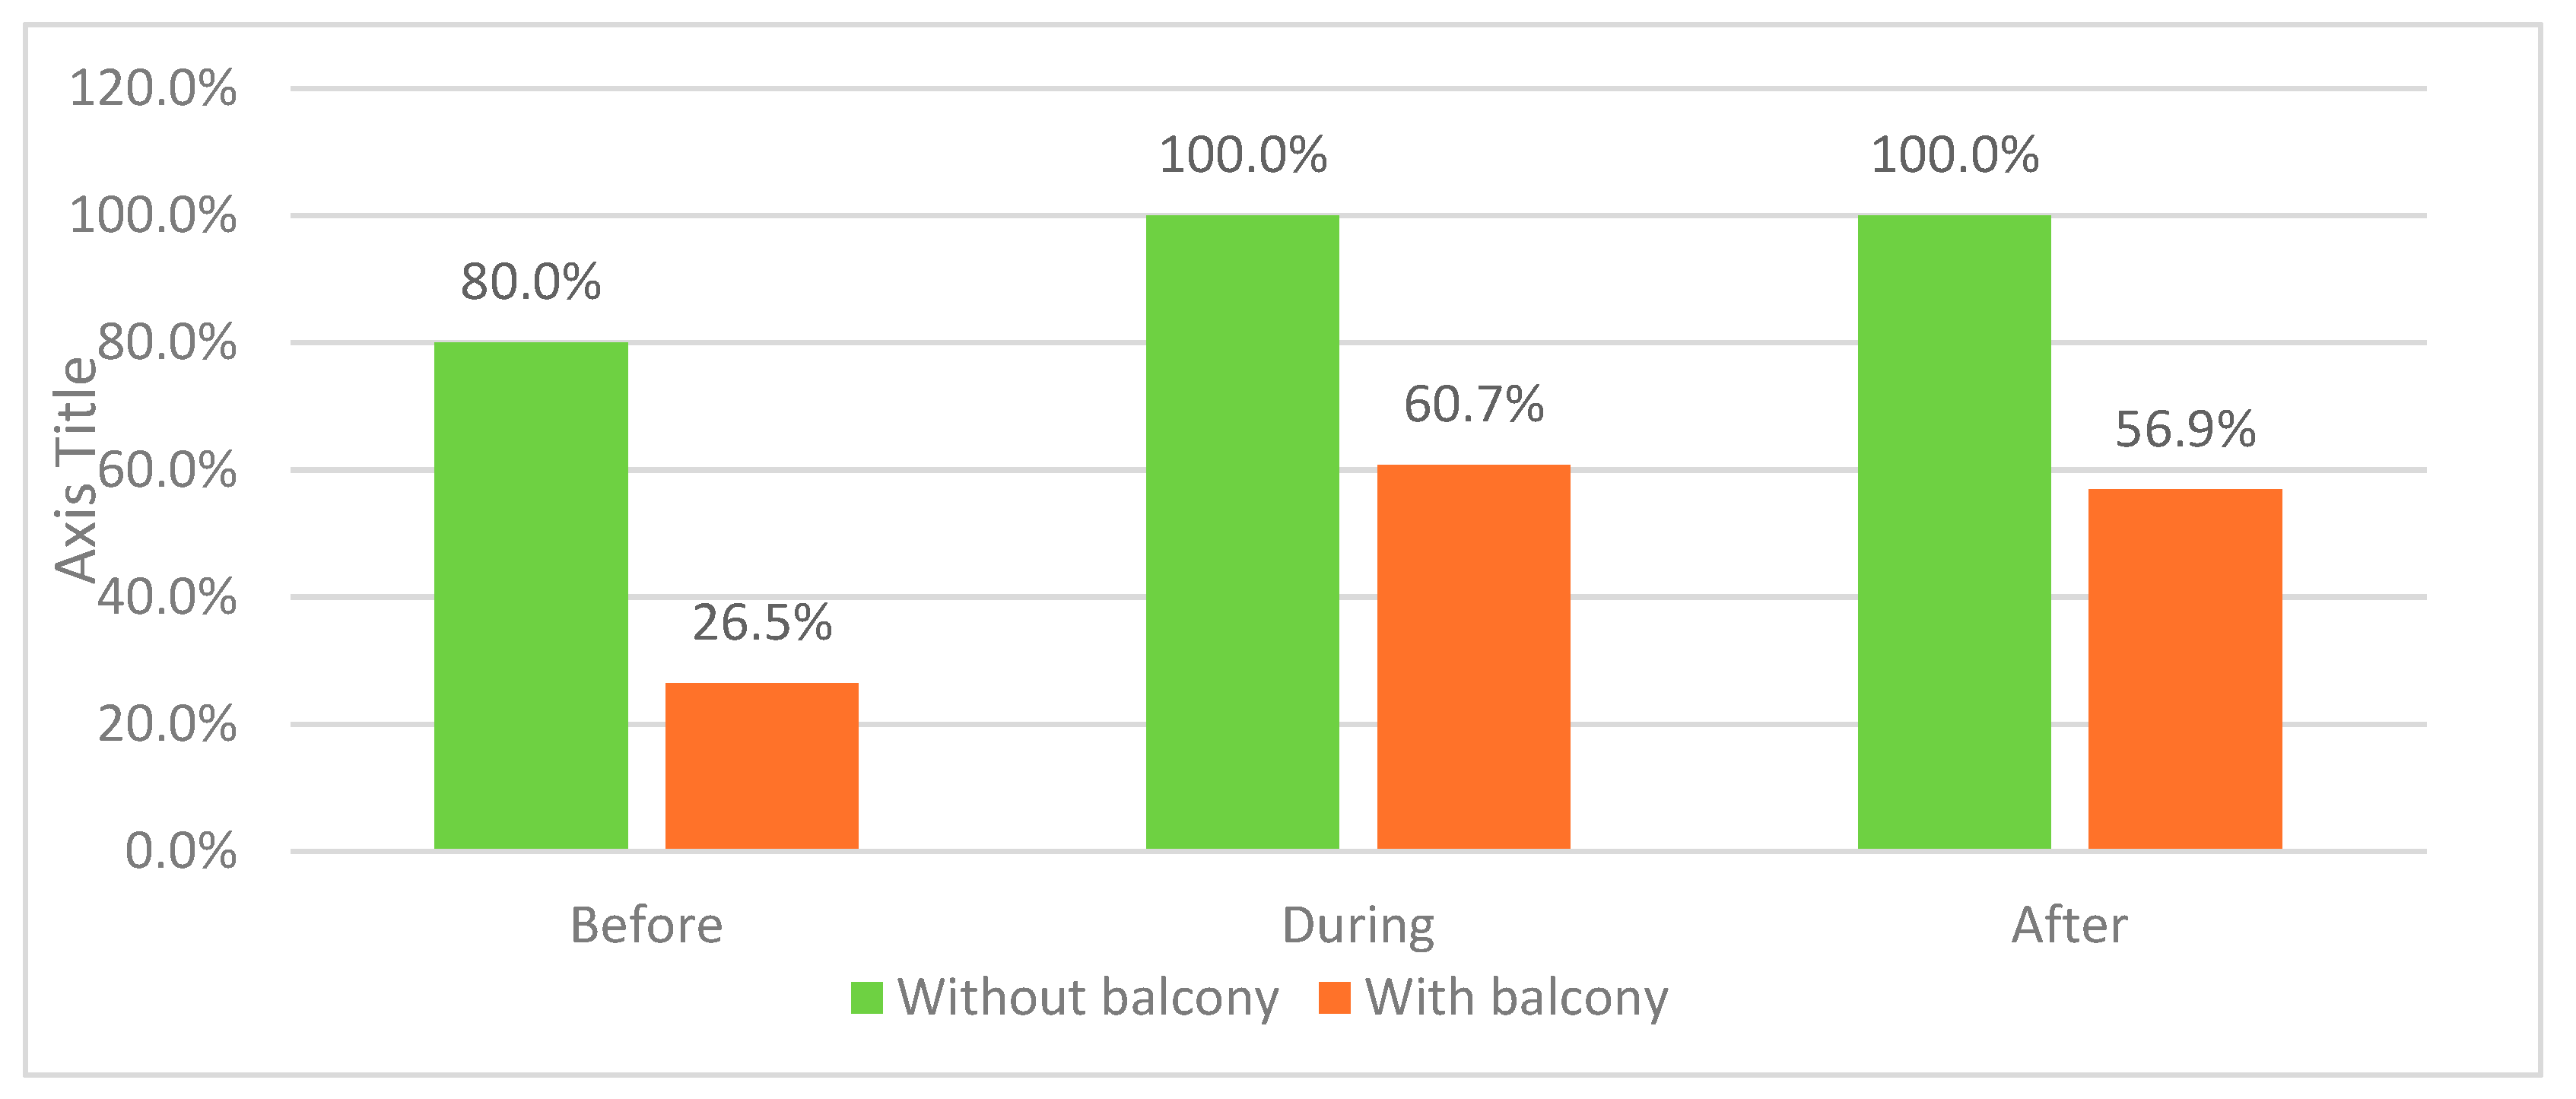
Figure 99.
Reasons for dissatisfaction variations for all apartments with the availability of balconies.
Figure 99.
Reasons for dissatisfaction variations for all apartments with the availability of balconies.
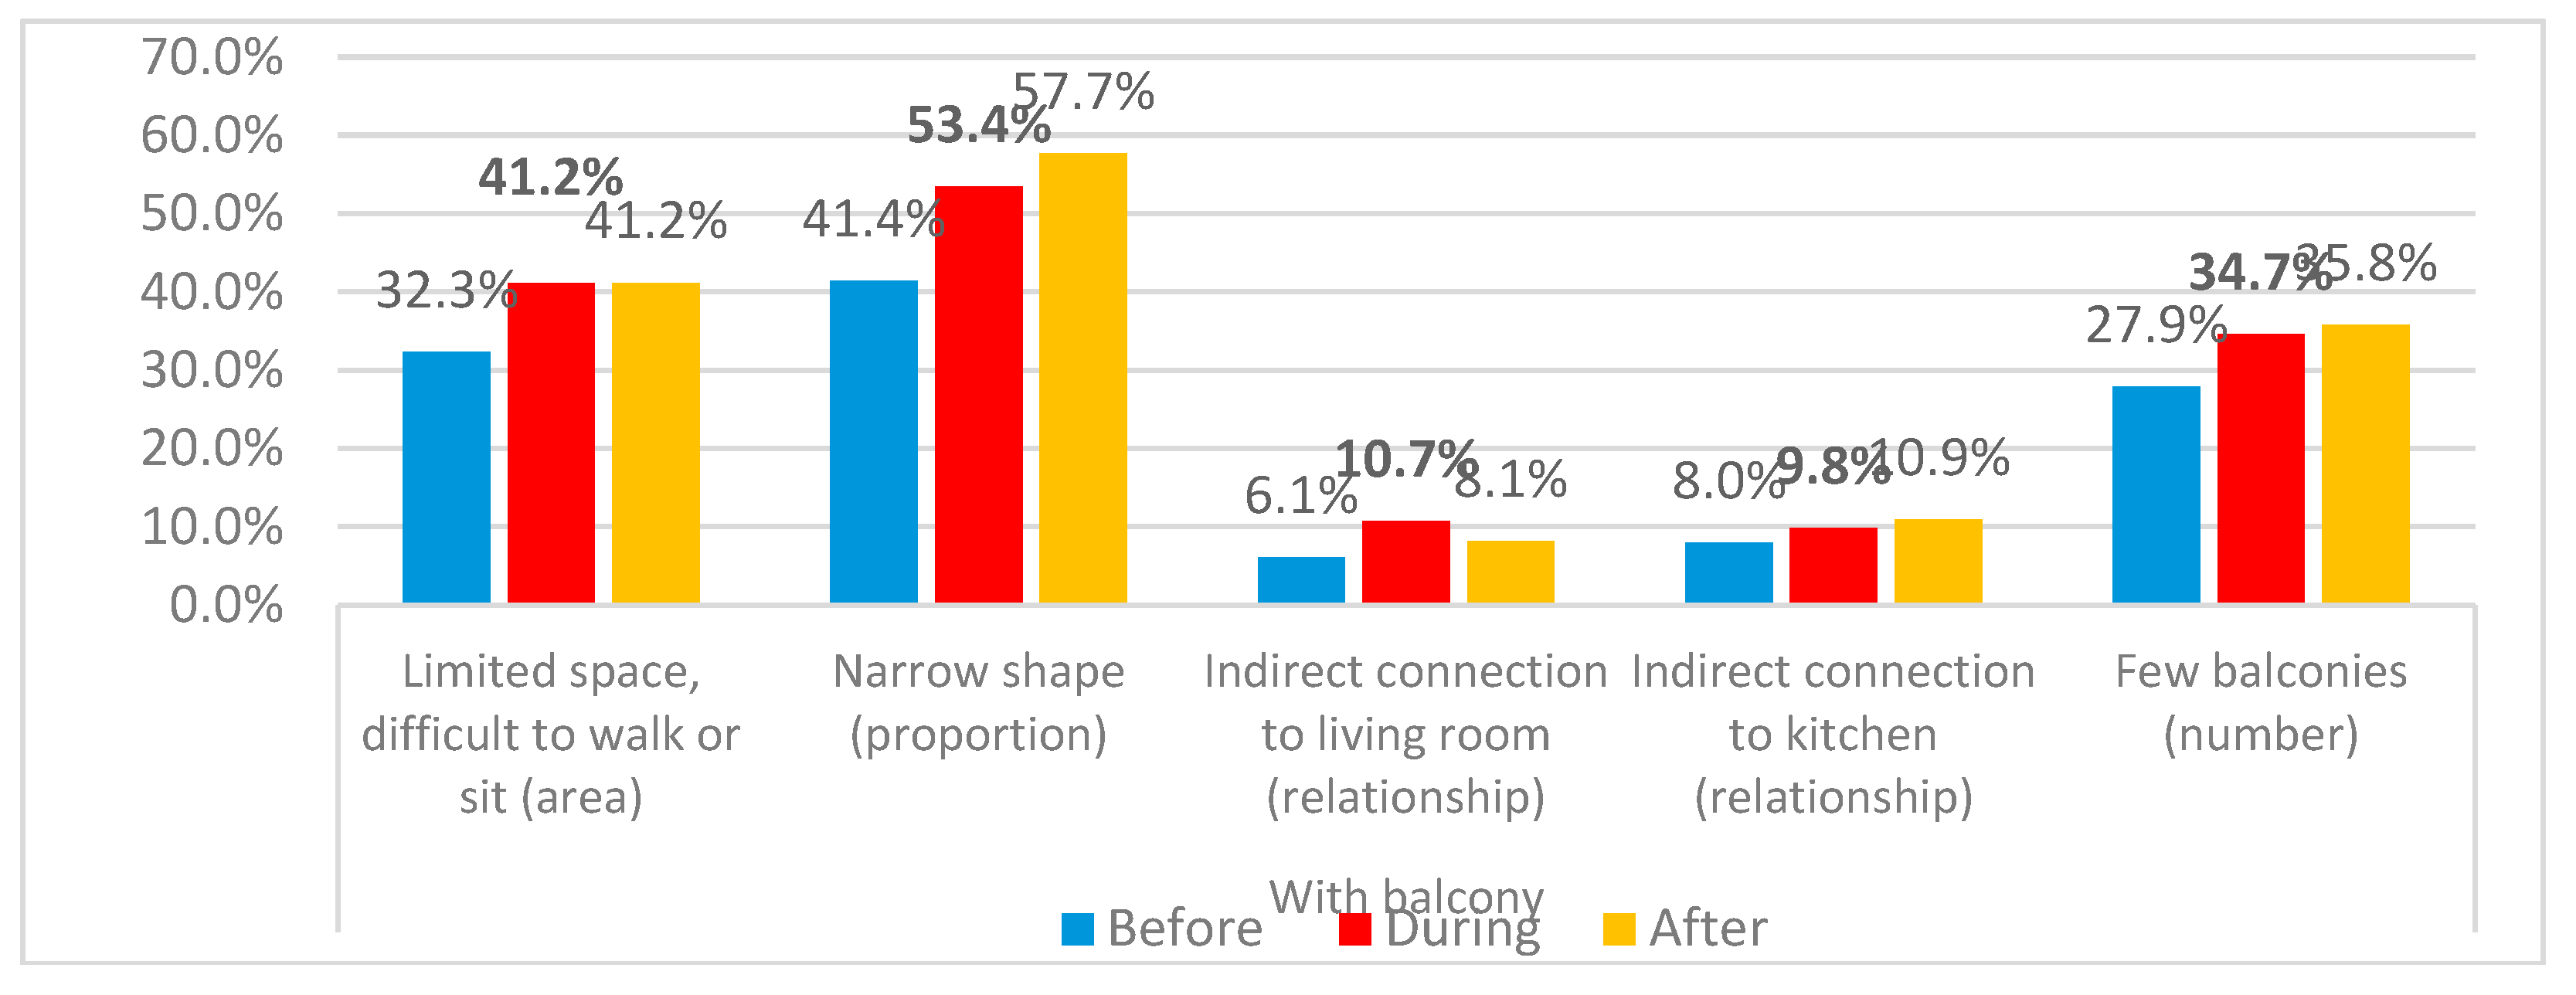
Figure 100.
Reasons for dissatisfaction variations regarding both apartments’ categories 2+1 and 3+1 with the availability of balconies.
Figure 100.
Reasons for dissatisfaction variations regarding both apartments’ categories 2+1 and 3+1 with the availability of balconies.
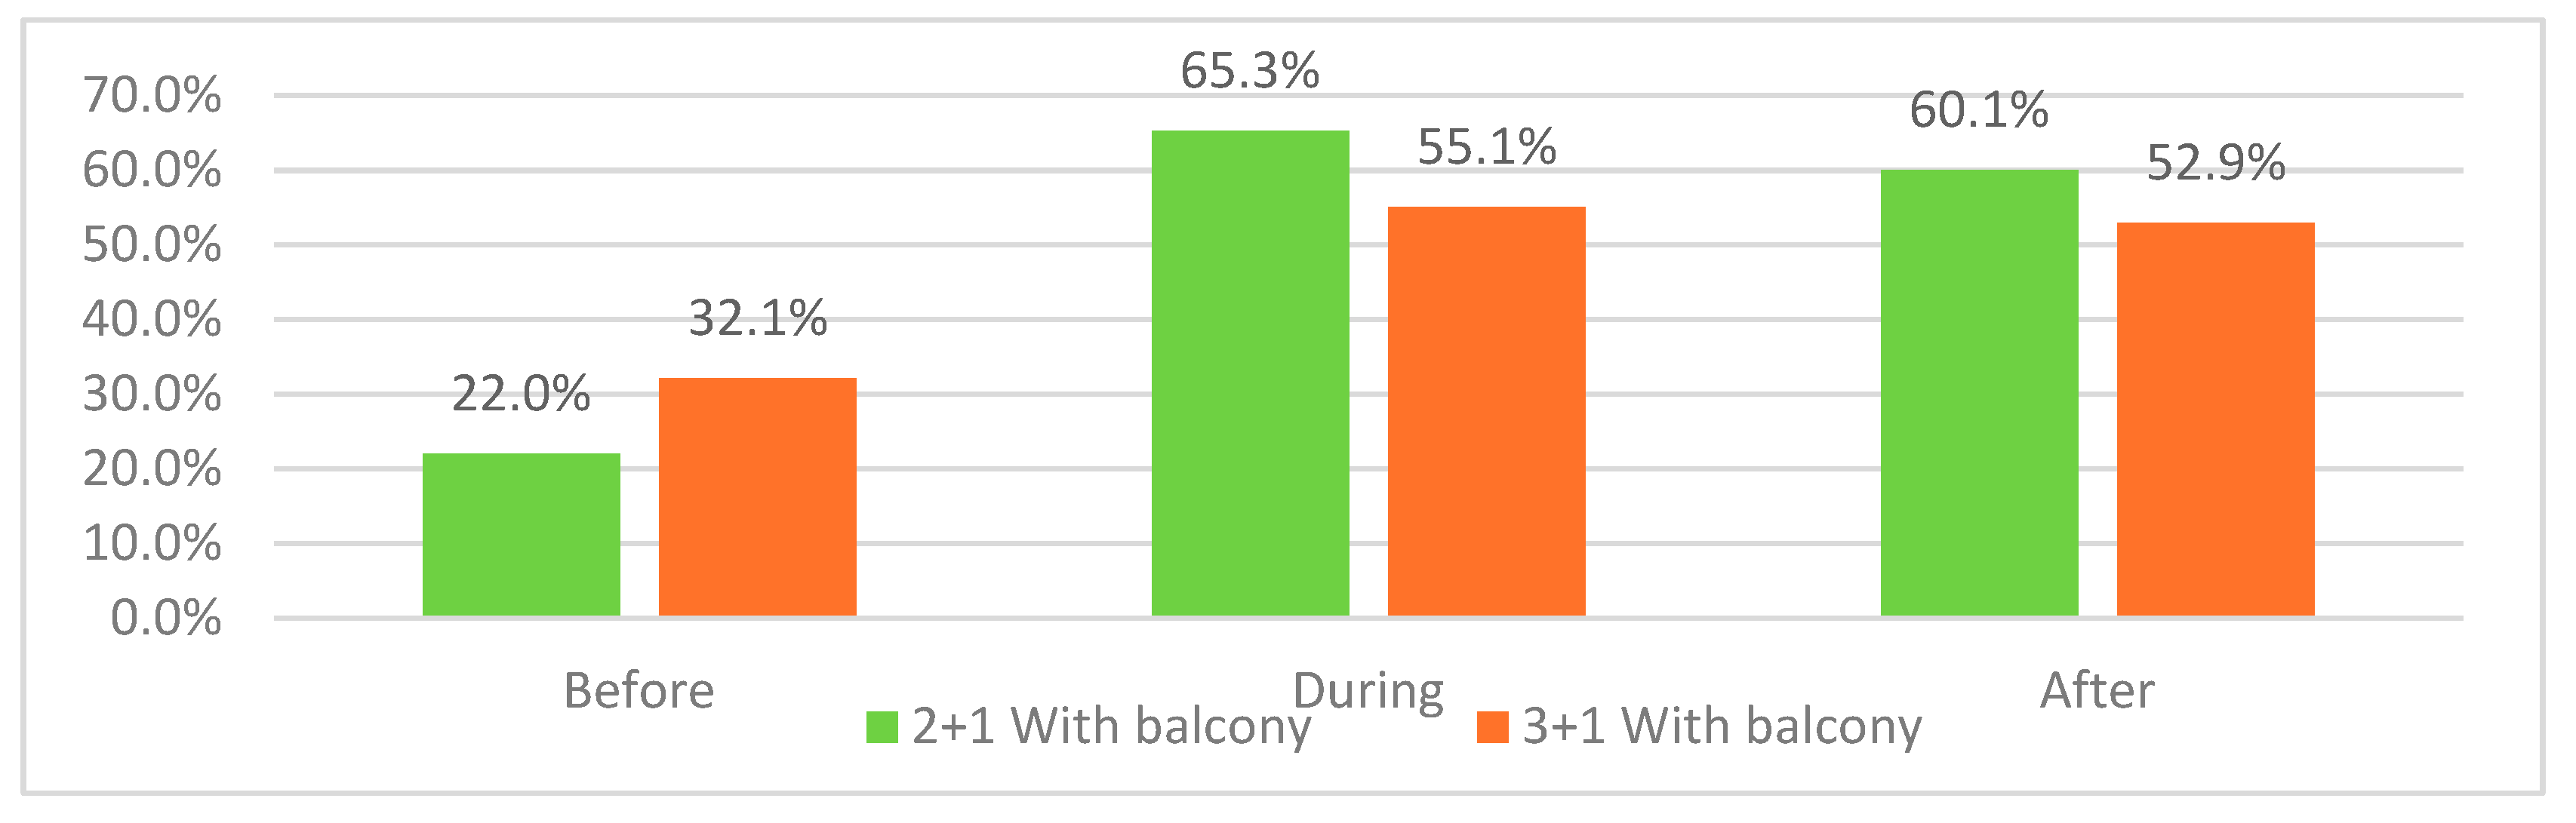
Figure 101.
Reasons for dissatisfaction variations regarding all apartments with the availability of balconies of category 2+1.
Figure 101.
Reasons for dissatisfaction variations regarding all apartments with the availability of balconies of category 2+1.
Figure 102.
Reasons for dissatisfaction variations regarding all apartments with the availability of balconies of category 3+1.
Figure 102.
Reasons for dissatisfaction variations regarding all apartments with the availability of balconies of category 3+1.
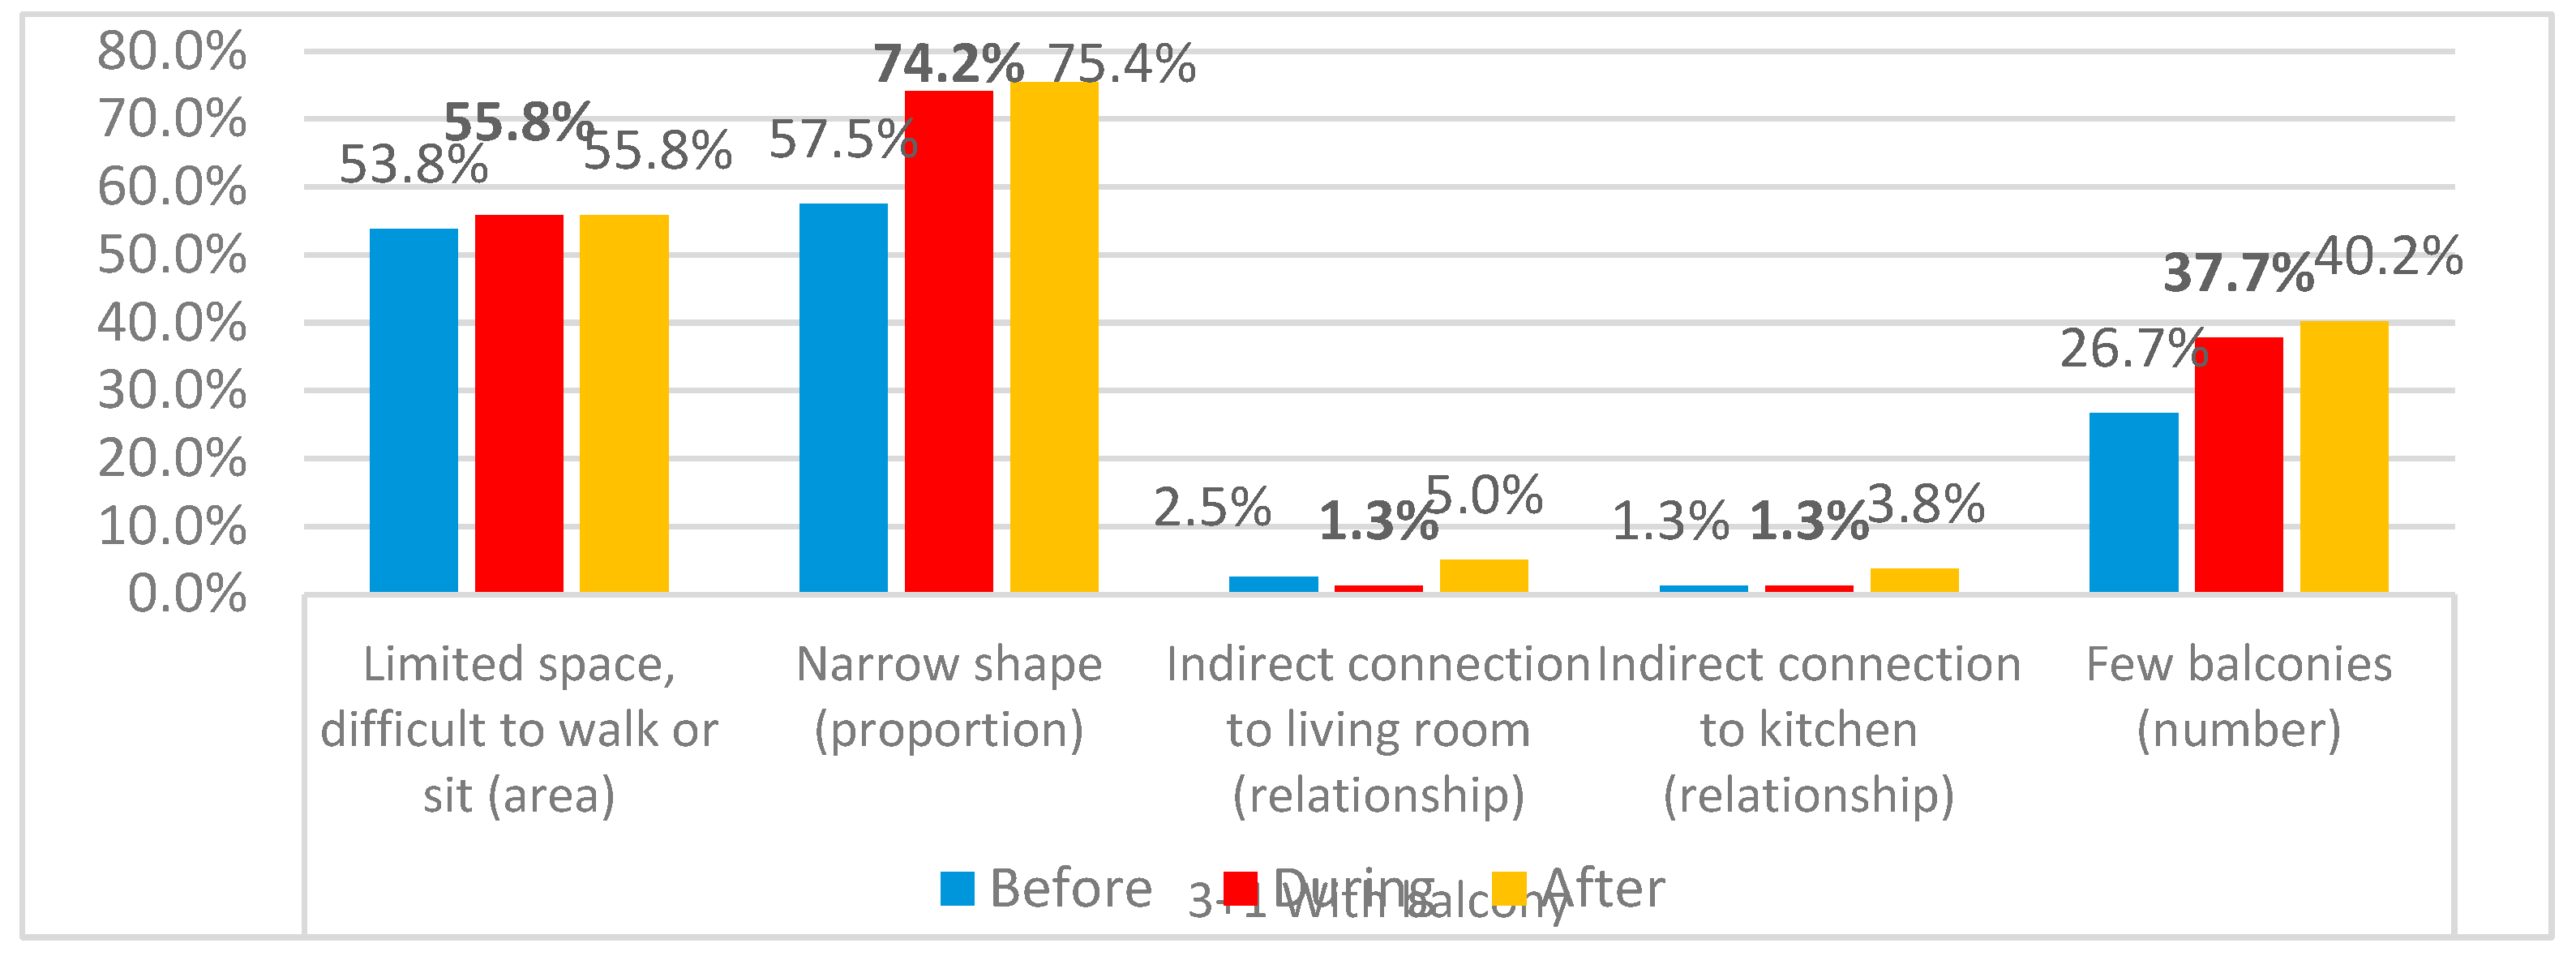
Figure 103.
Dissatisfaction variations regarding all apartments with different numbers of balconies zero cases were excluded .
Figure 103.
Dissatisfaction variations regarding all apartments with different numbers of balconies zero cases were excluded .
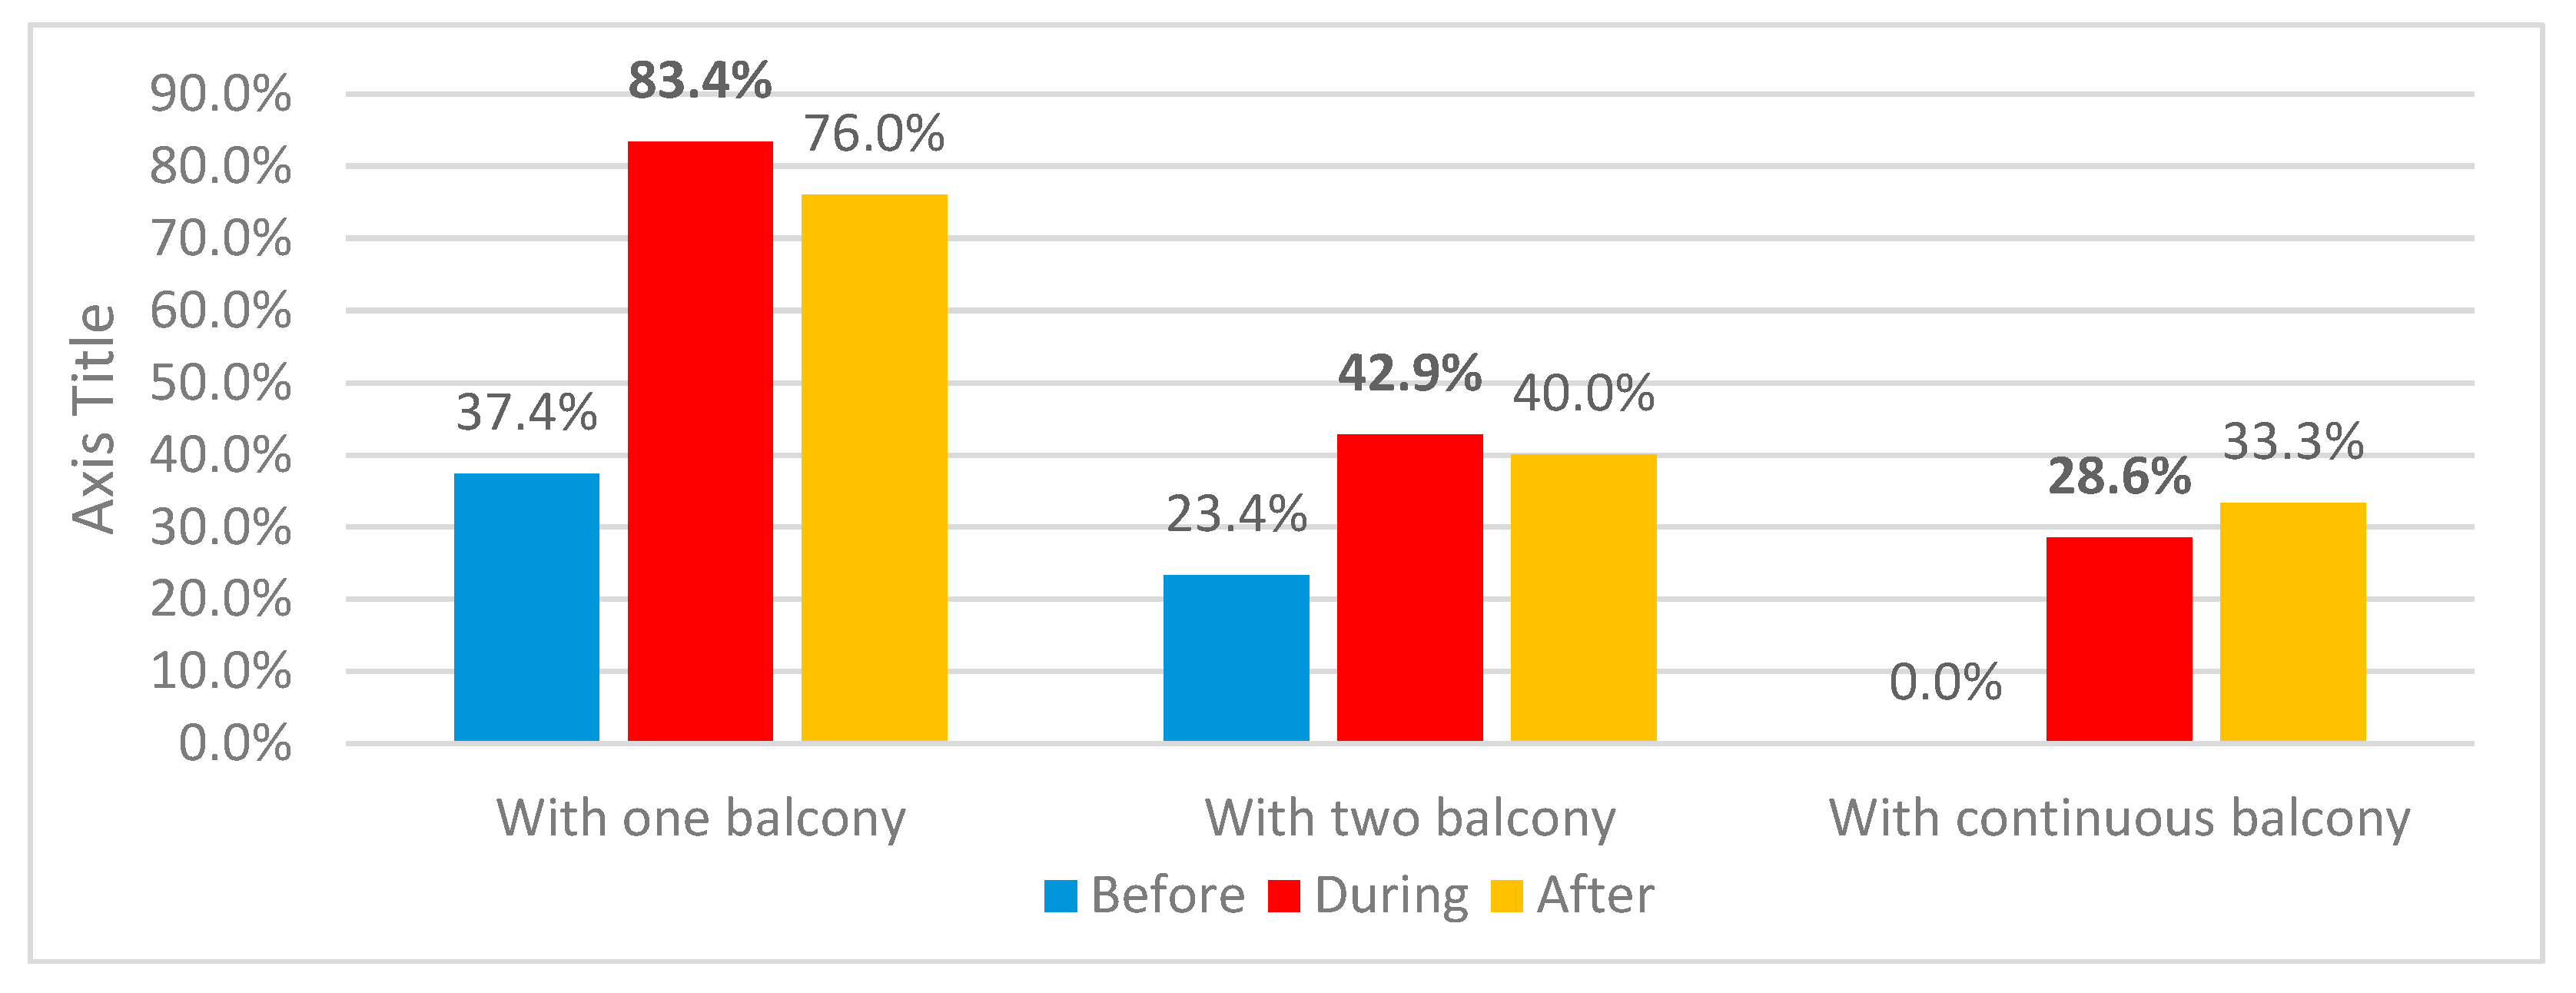
Figure 104.
Dissatisfaction variations regarding different balconies types related to internal spaces.
Figure 104.
Dissatisfaction variations regarding different balconies types related to internal spaces.
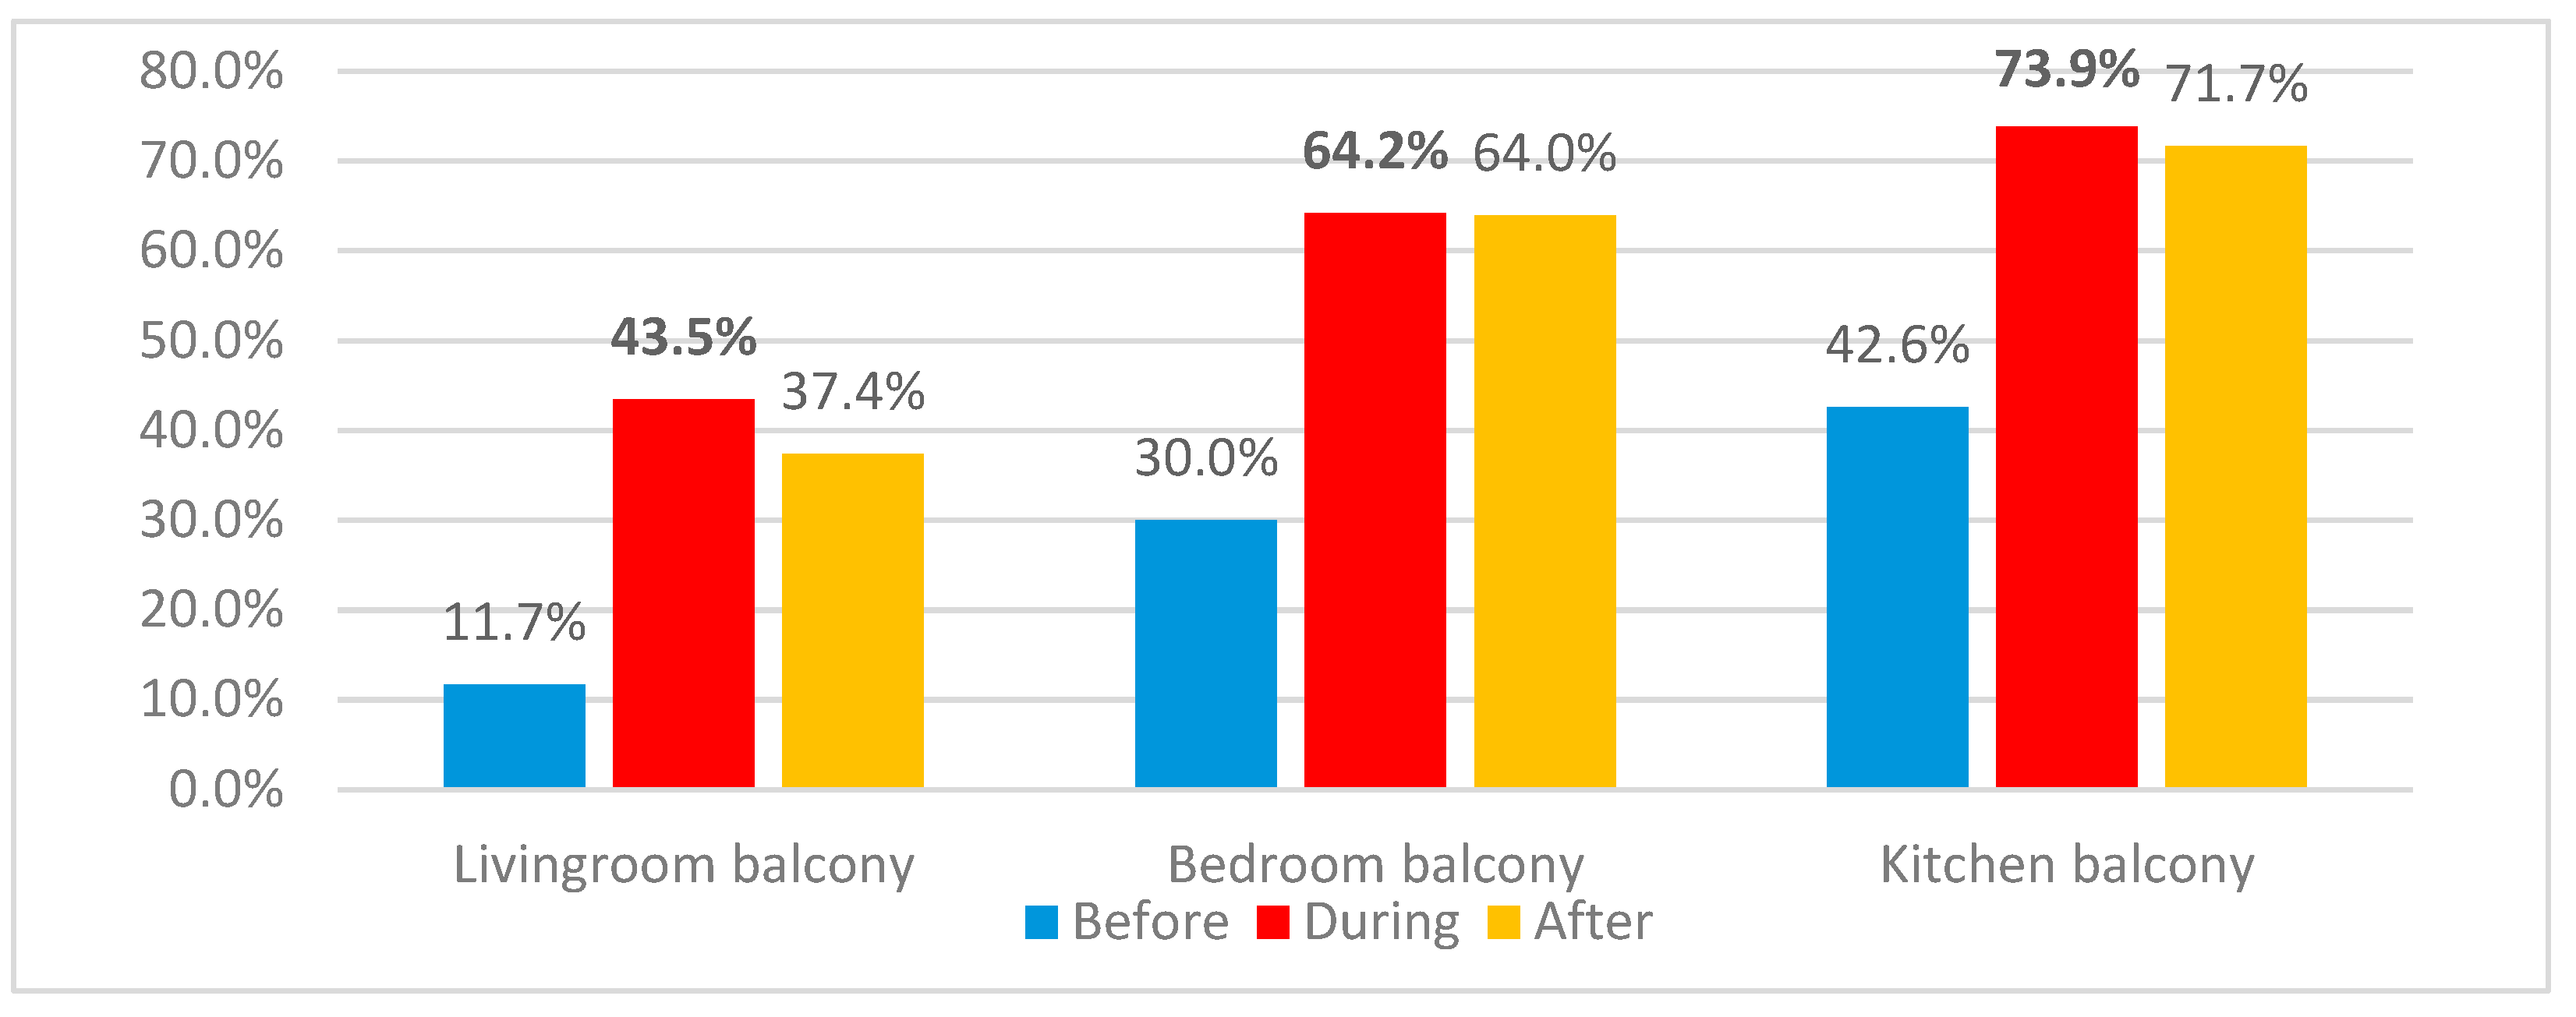
Figure 105.
Reasons for dissatisfaction variations regarding living room balconies.
Figure 106.
Reasons for dissatisfaction variations regarding bedroom room balconies.
Figure 109.
Reasons for dissatisfaction variations for apartments’ corridors through the three stages of pandemic.
Figure 109.
Reasons for dissatisfaction variations for apartments’ corridors through the three stages of pandemic.
Figure 110.
Dissatisfaction variations for corridors between categories 2+1 and 3+1 .
Figure 111.
Reasons for dissatisfaction variations for apartments’ corridors through the three stages of pandemic for categories 2+1 and 3+1.
Figure 111.
Reasons for dissatisfaction variations for apartments’ corridors through the three stages of pandemic for categories 2+1 and 3+1.
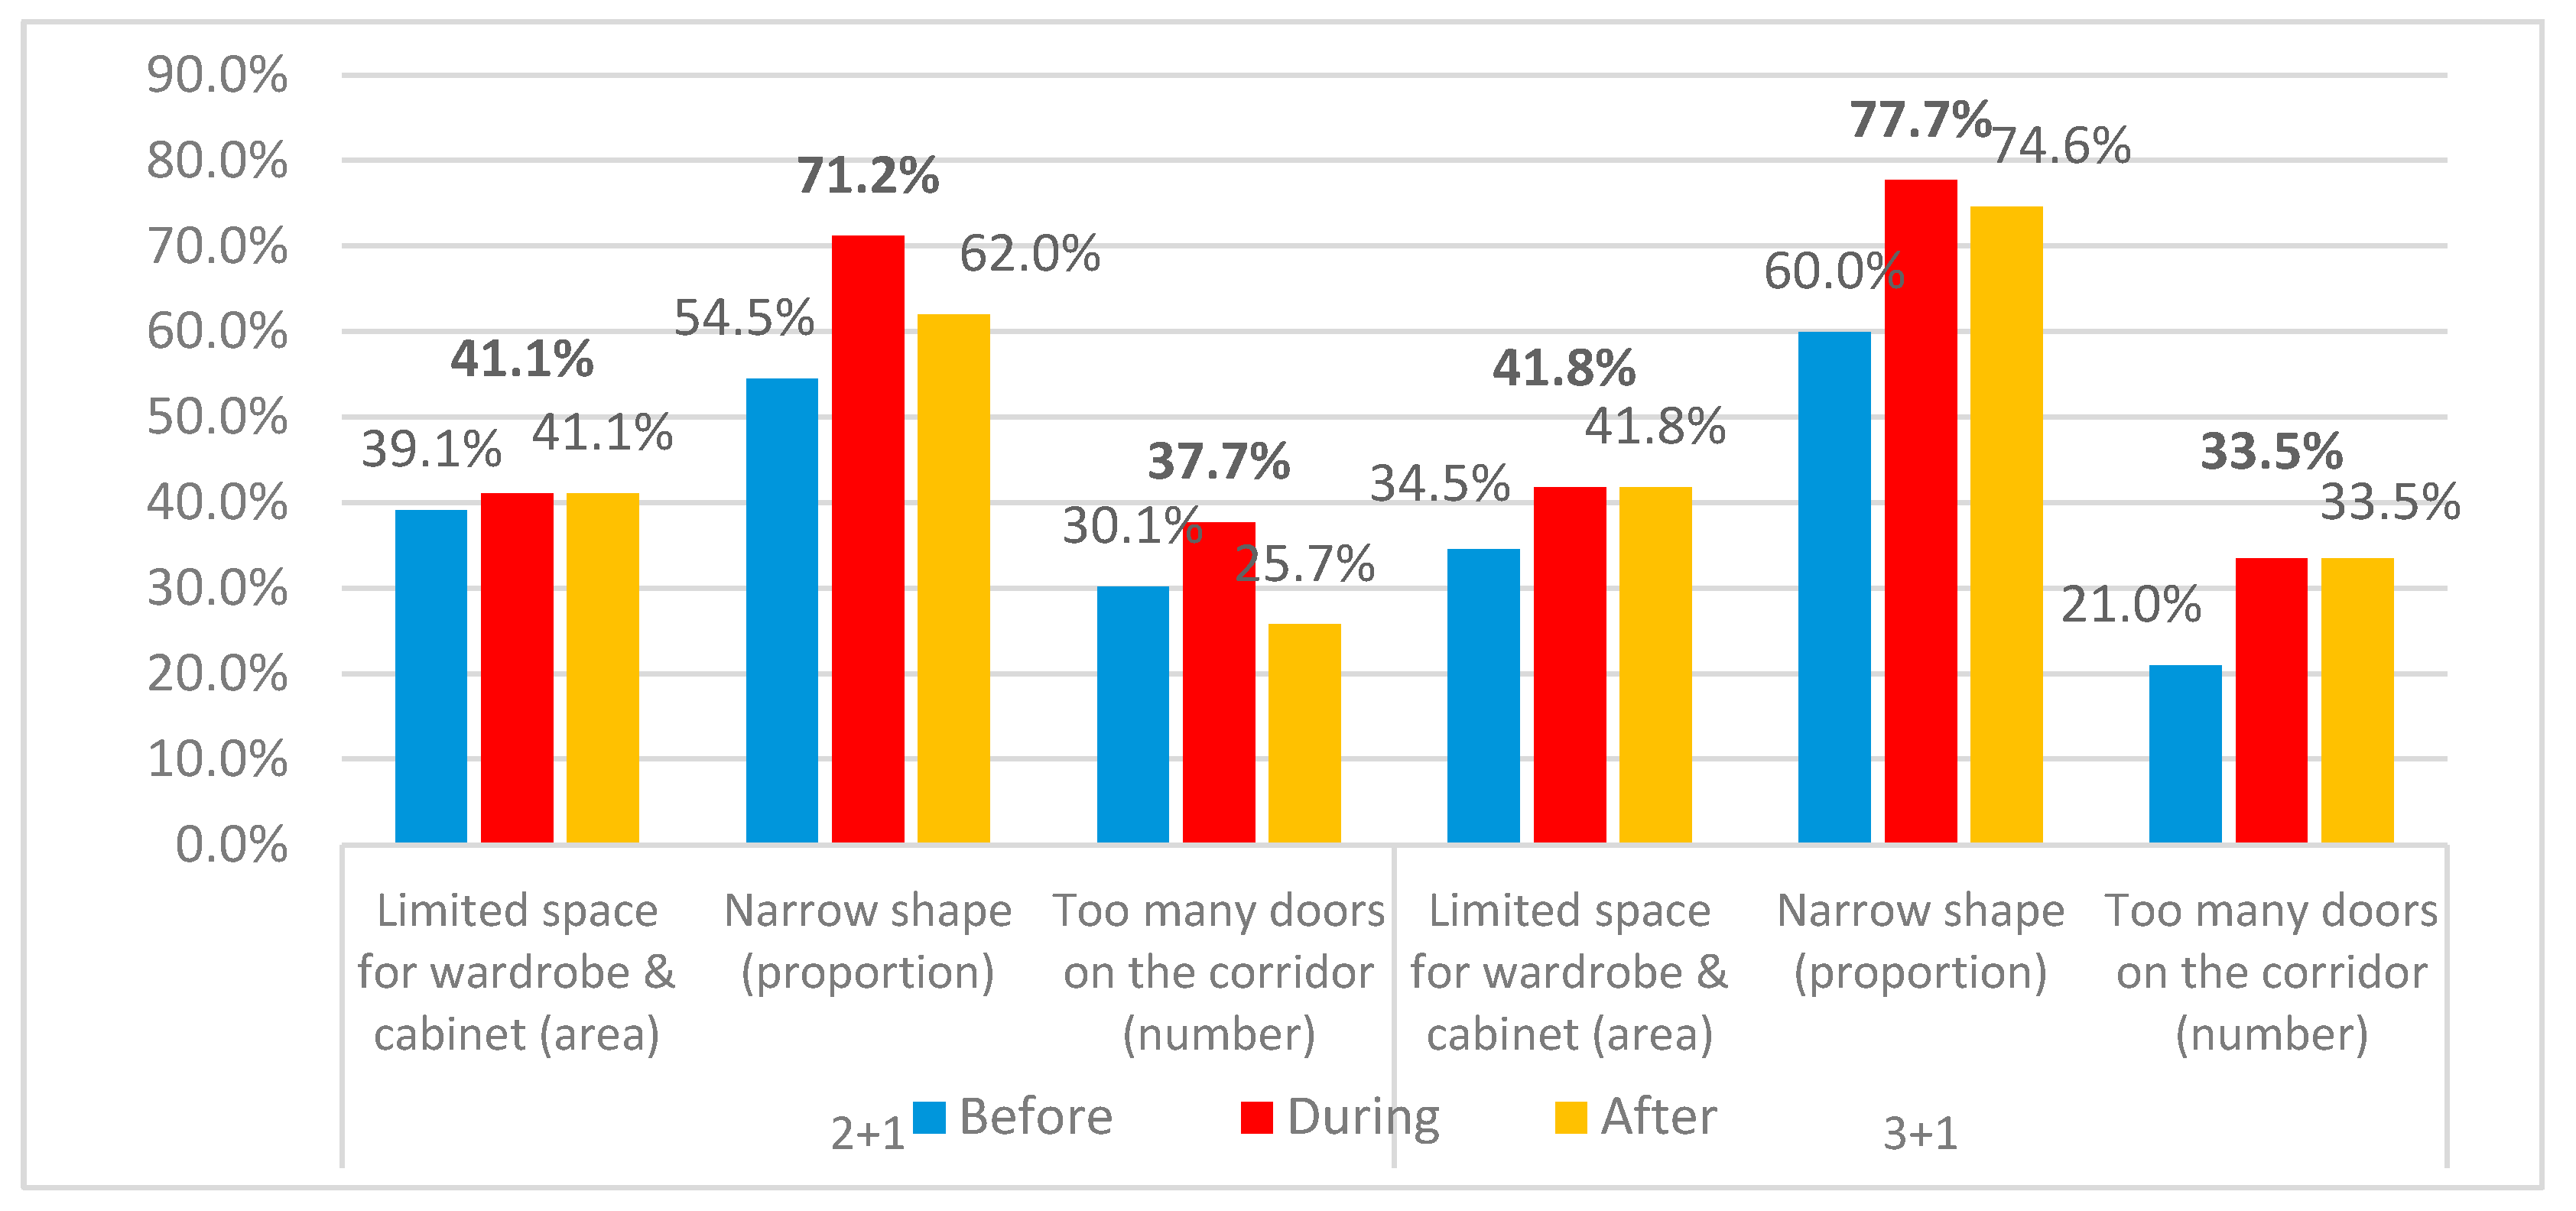
Figure 112.
Dissatisfaction variations for corridors between closed and opened spatial organizations.
Figure 112.
Dissatisfaction variations for corridors between closed and opened spatial organizations.
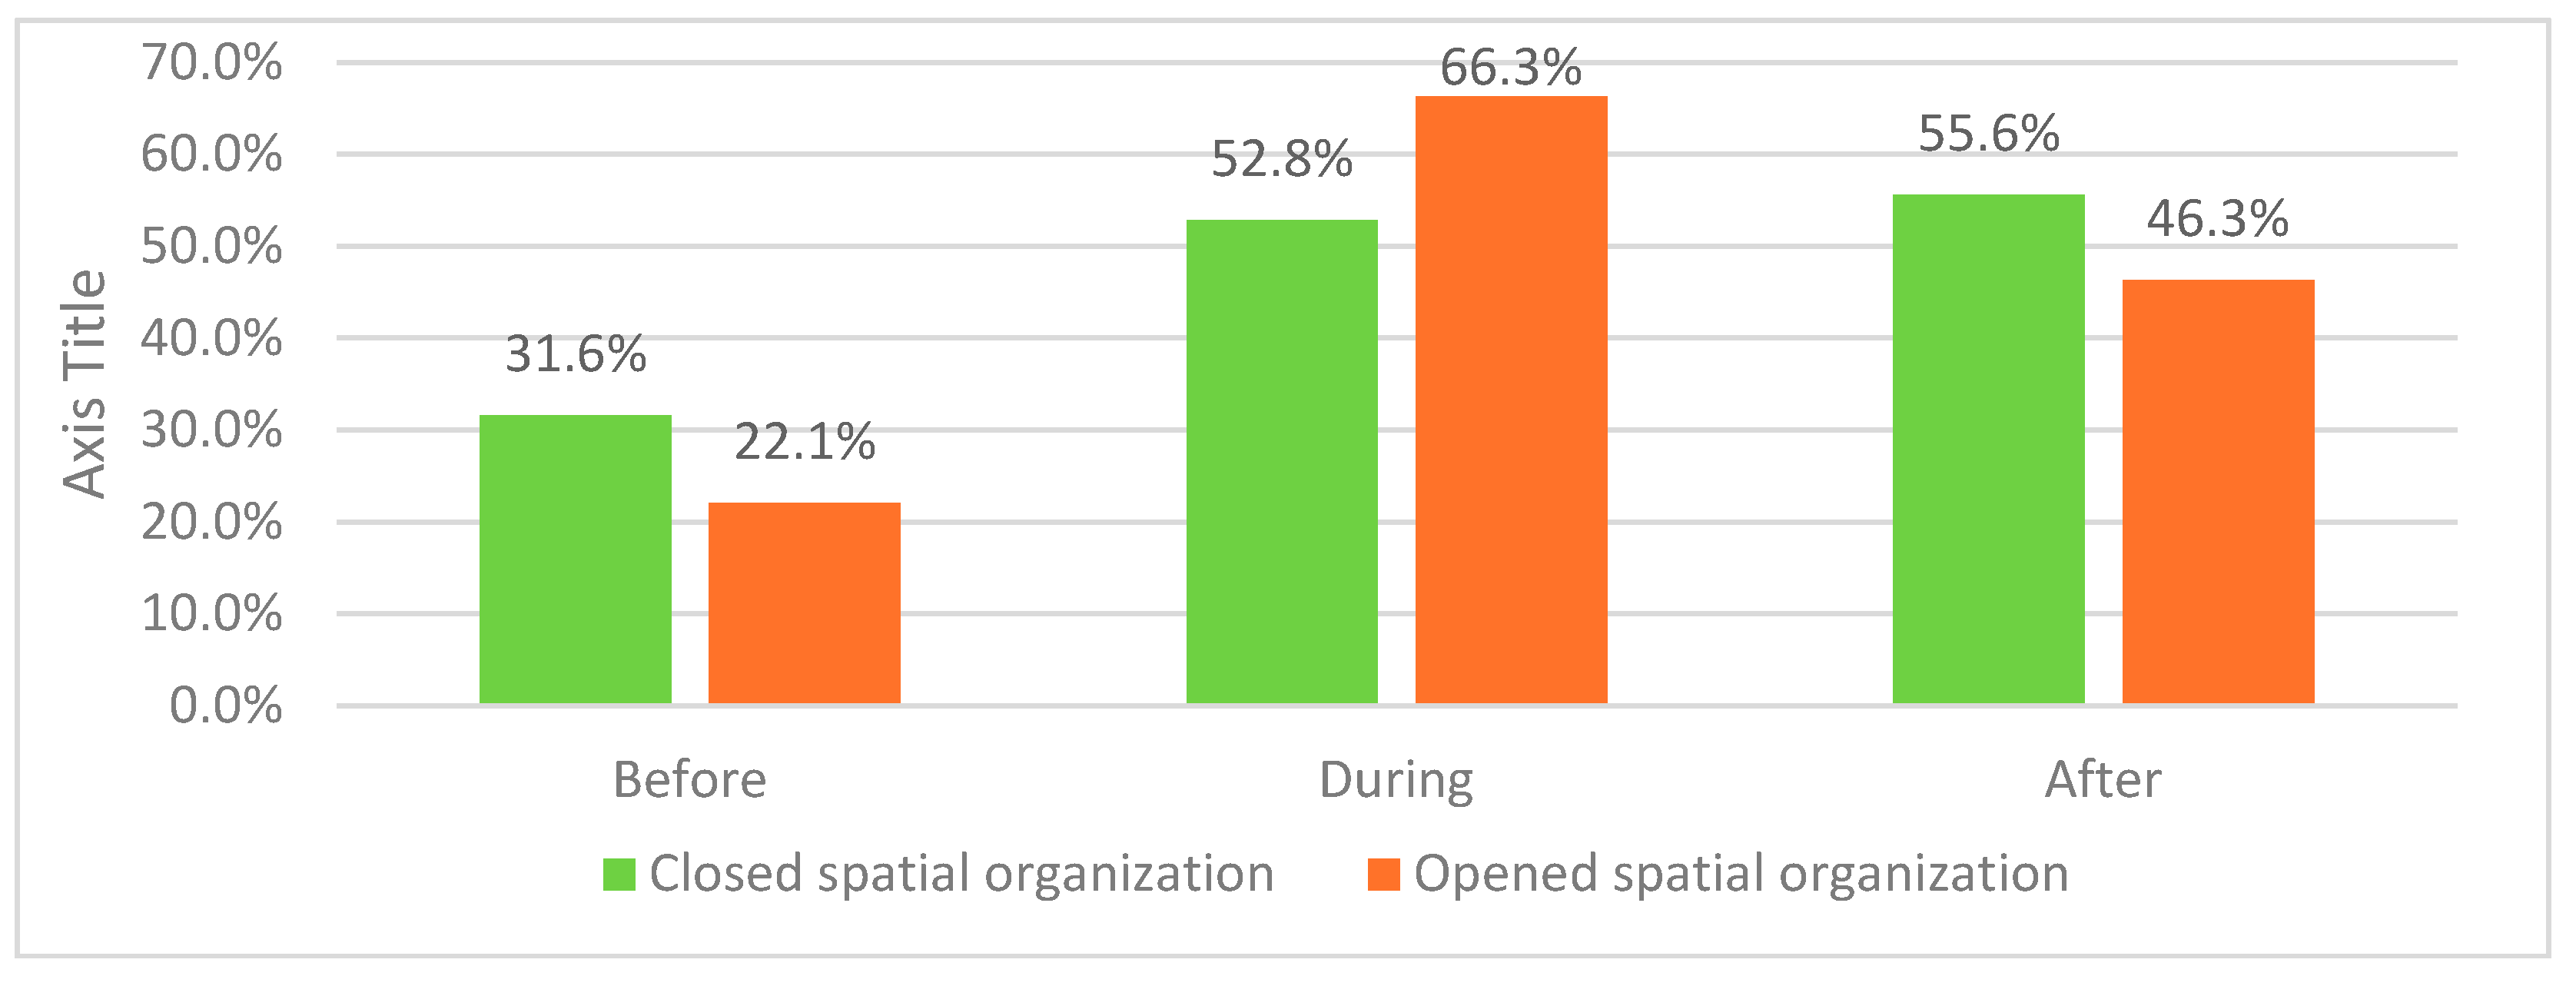
Figure 113.
Reasons for dissatisfaction variations about apartments’ corridors through the three stages of pandemic for closed and opened spatial organizations .
Figure 113.
Reasons for dissatisfaction variations about apartments’ corridors through the three stages of pandemic for closed and opened spatial organizations .
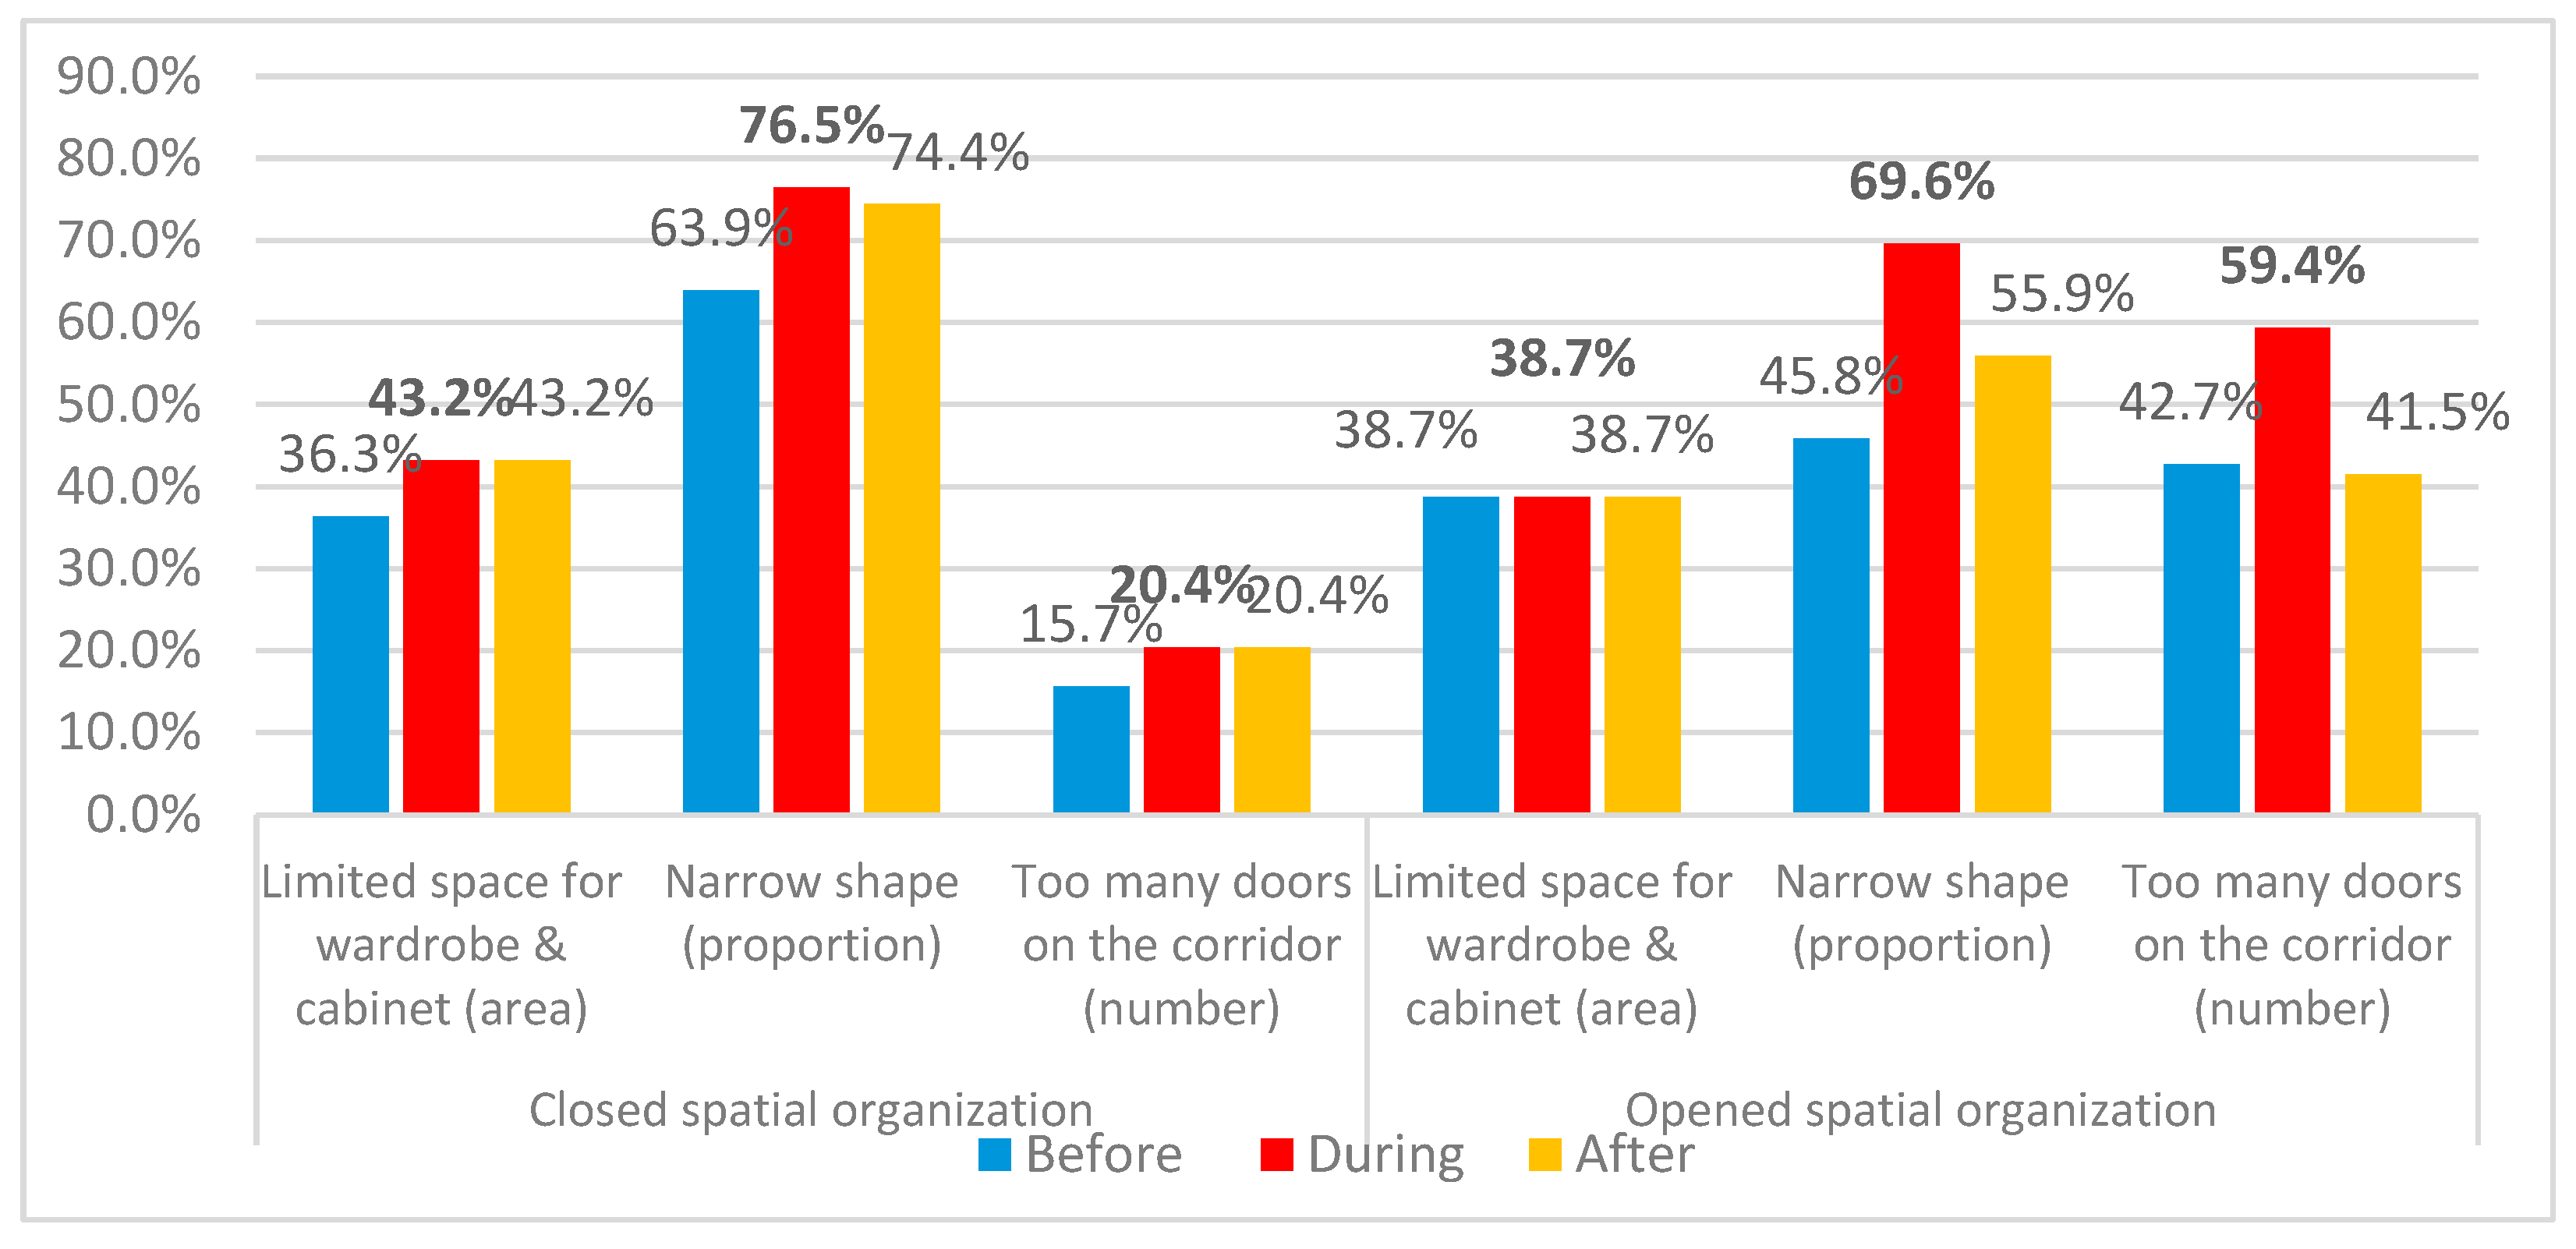
Figure 114.
Dissatisfaction variations for apartments’ layout due to pandemic.
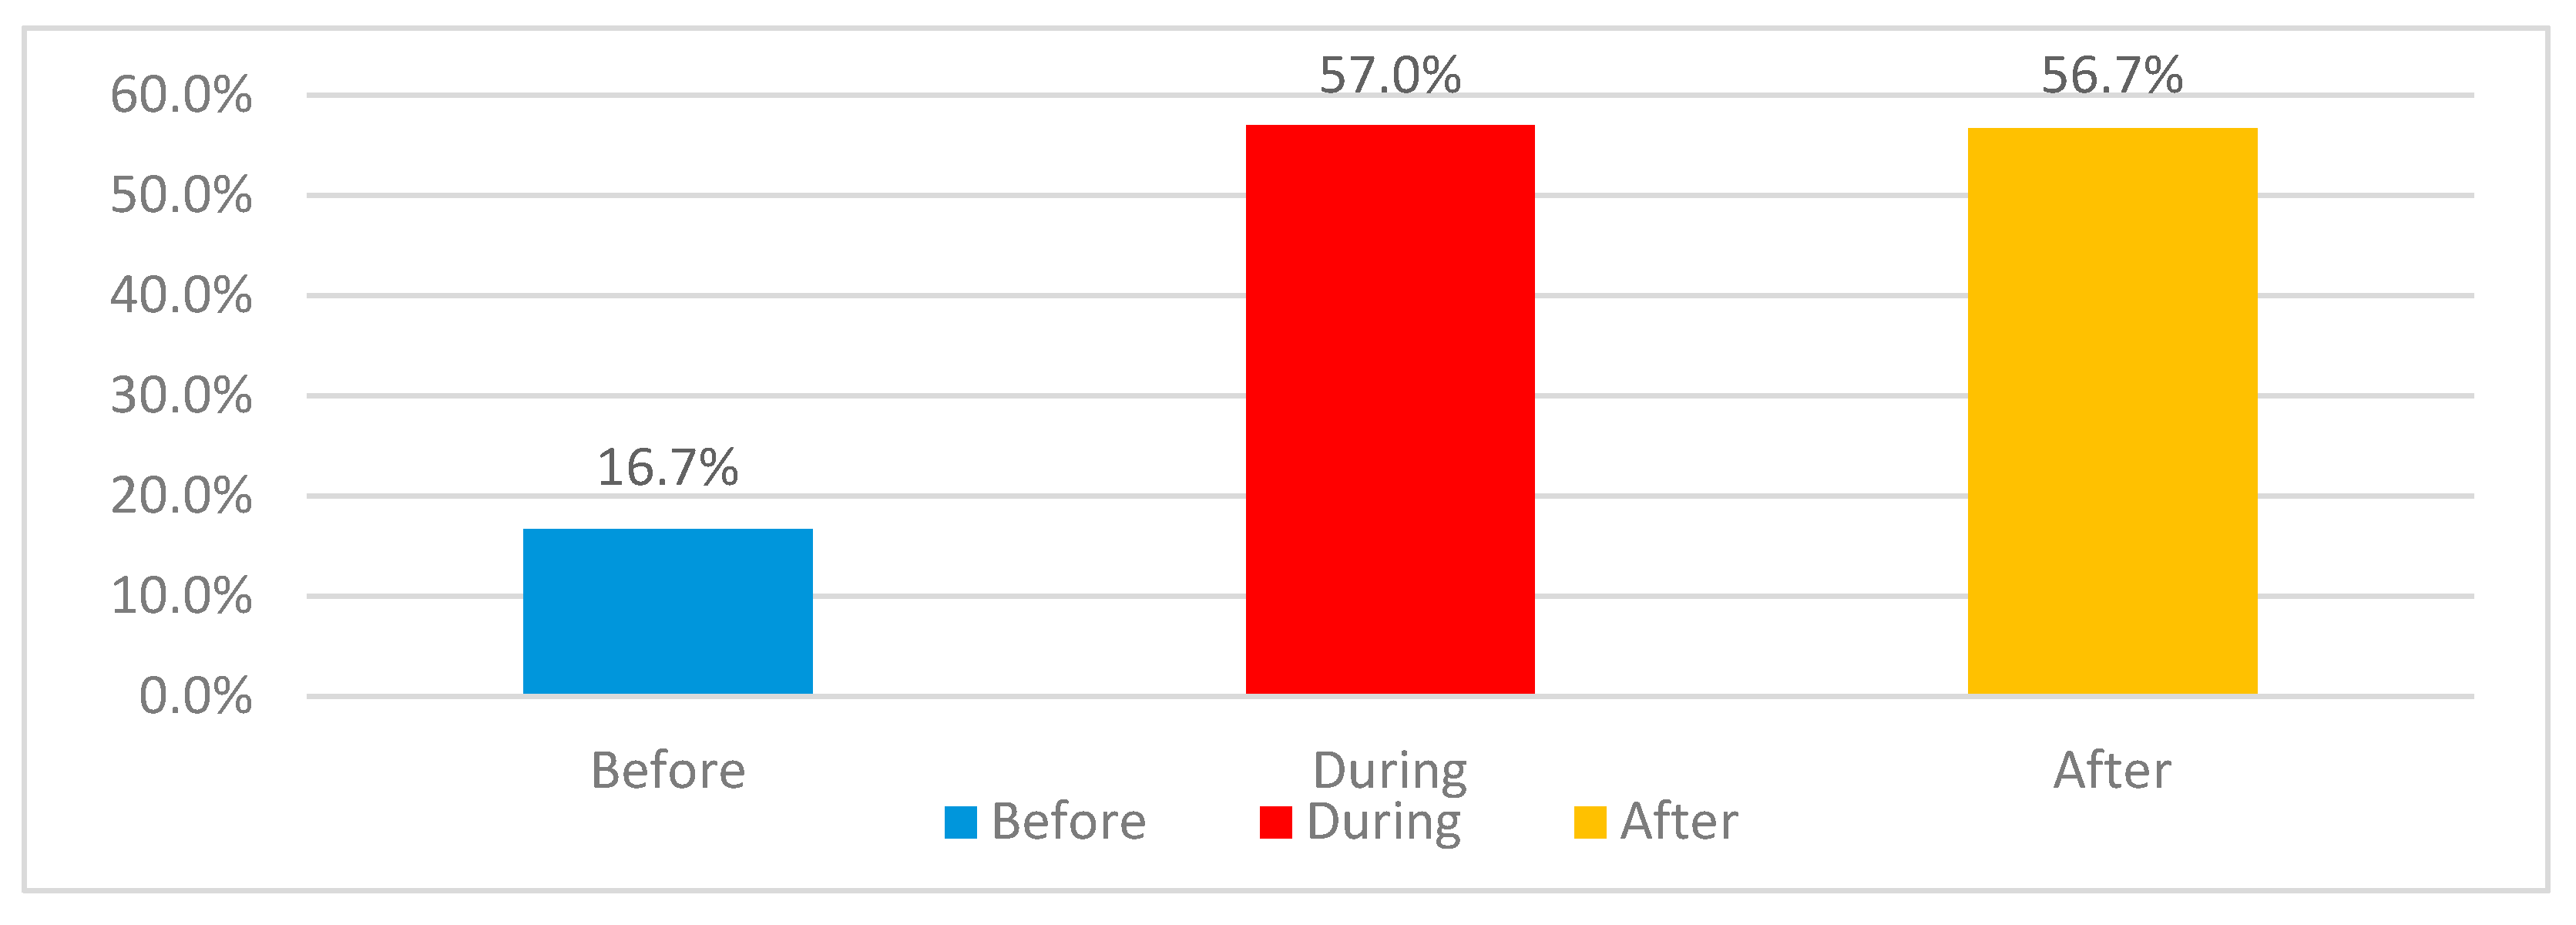
Figure 115.
Dissatisfaction variations for apartments’ layouts s through the three stages of pandemic for categories 2+1 and 3+1 and subcategories 2+2 and 3+2.
Figure 115.
Dissatisfaction variations for apartments’ layouts s through the three stages of pandemic for categories 2+1 and 3+1 and subcategories 2+2 and 3+2.
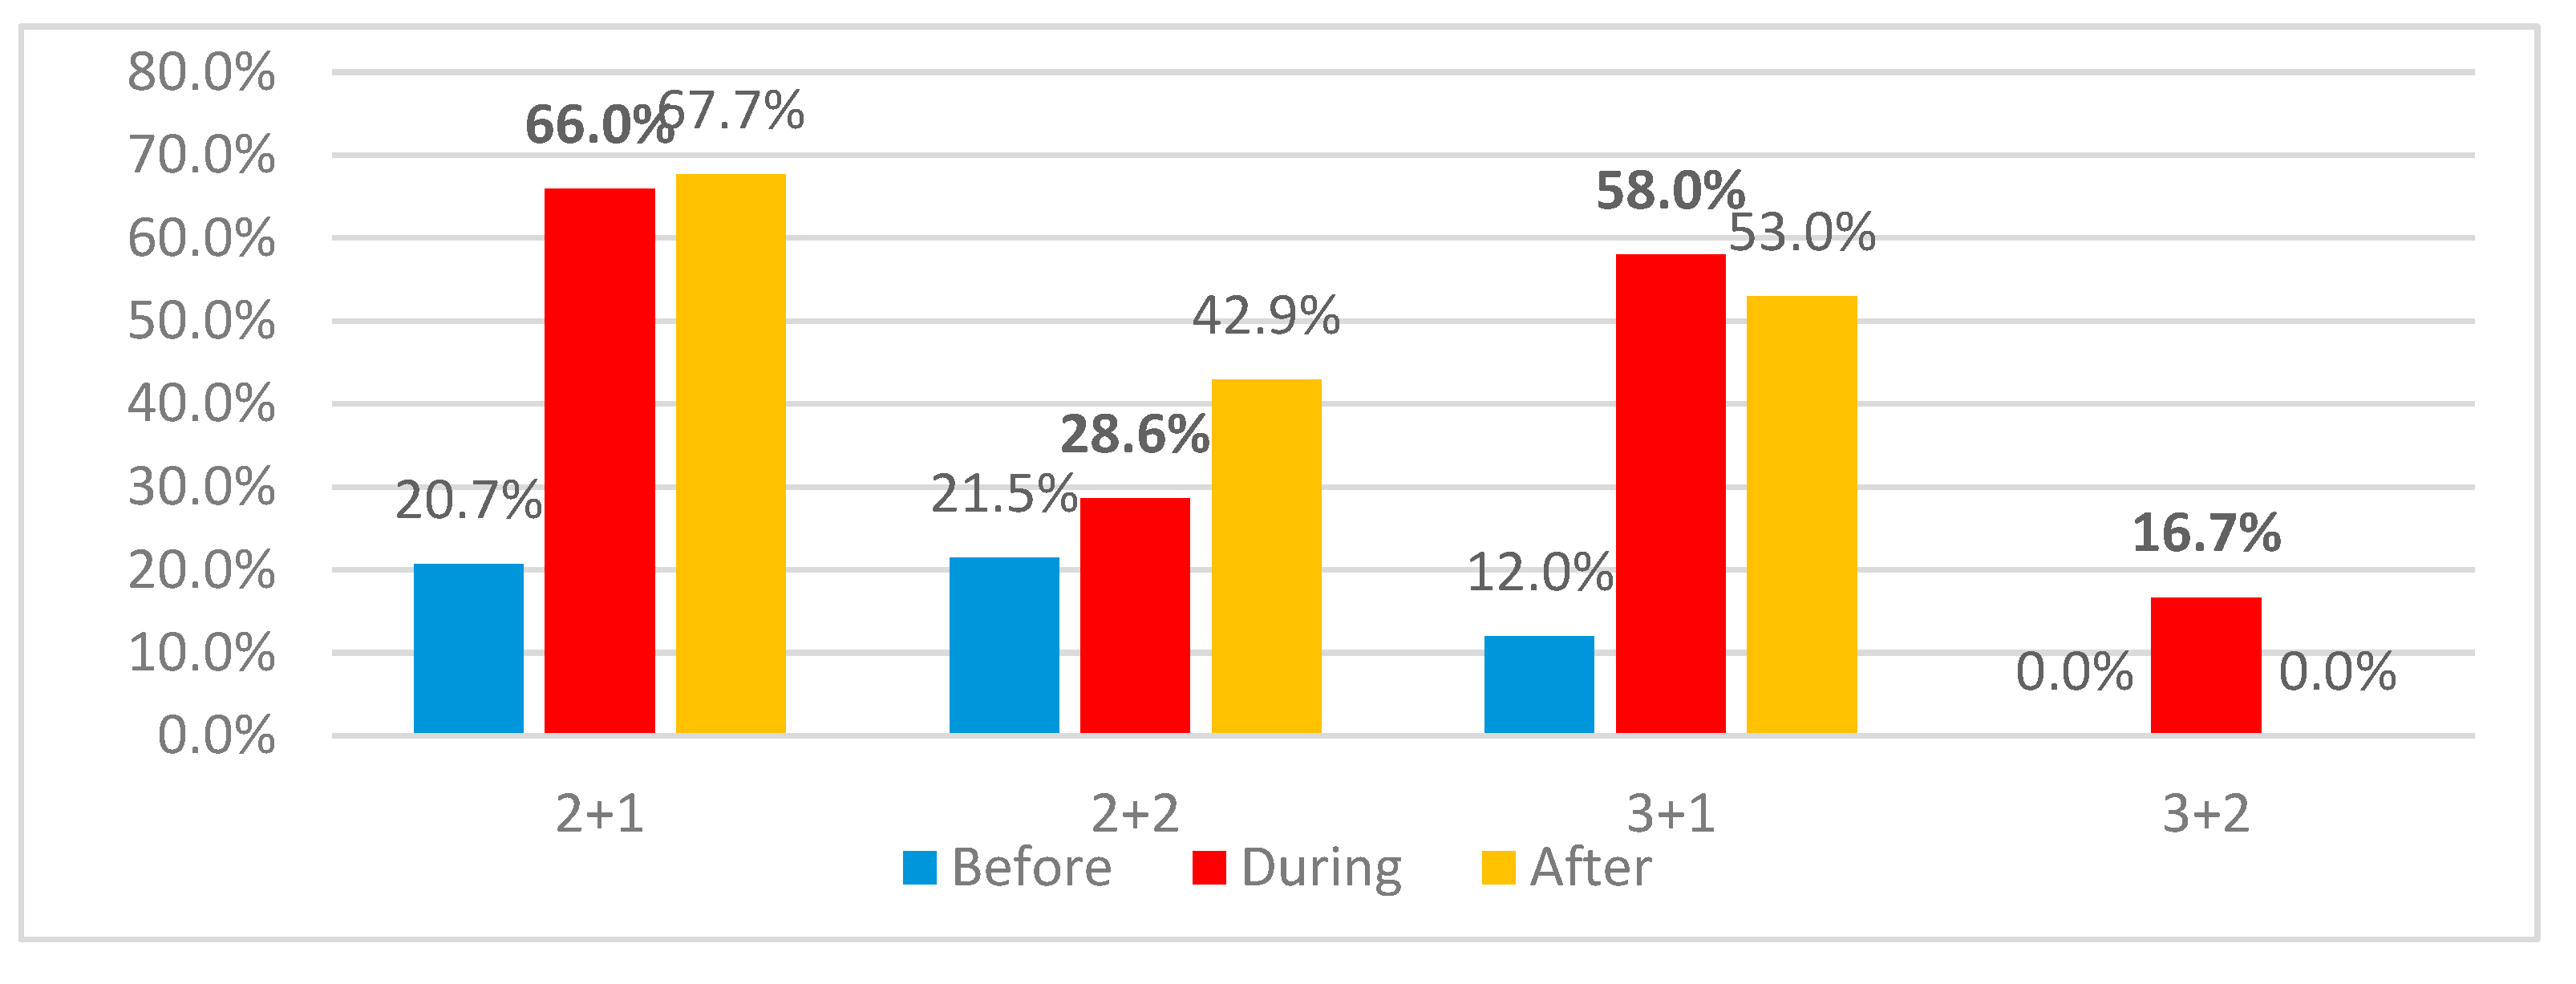
Figure 116.
Dissatisfaction variations for corridors between closed and opened spatial organizations.
Figure 116.
Dissatisfaction variations for corridors between closed and opened spatial organizations.
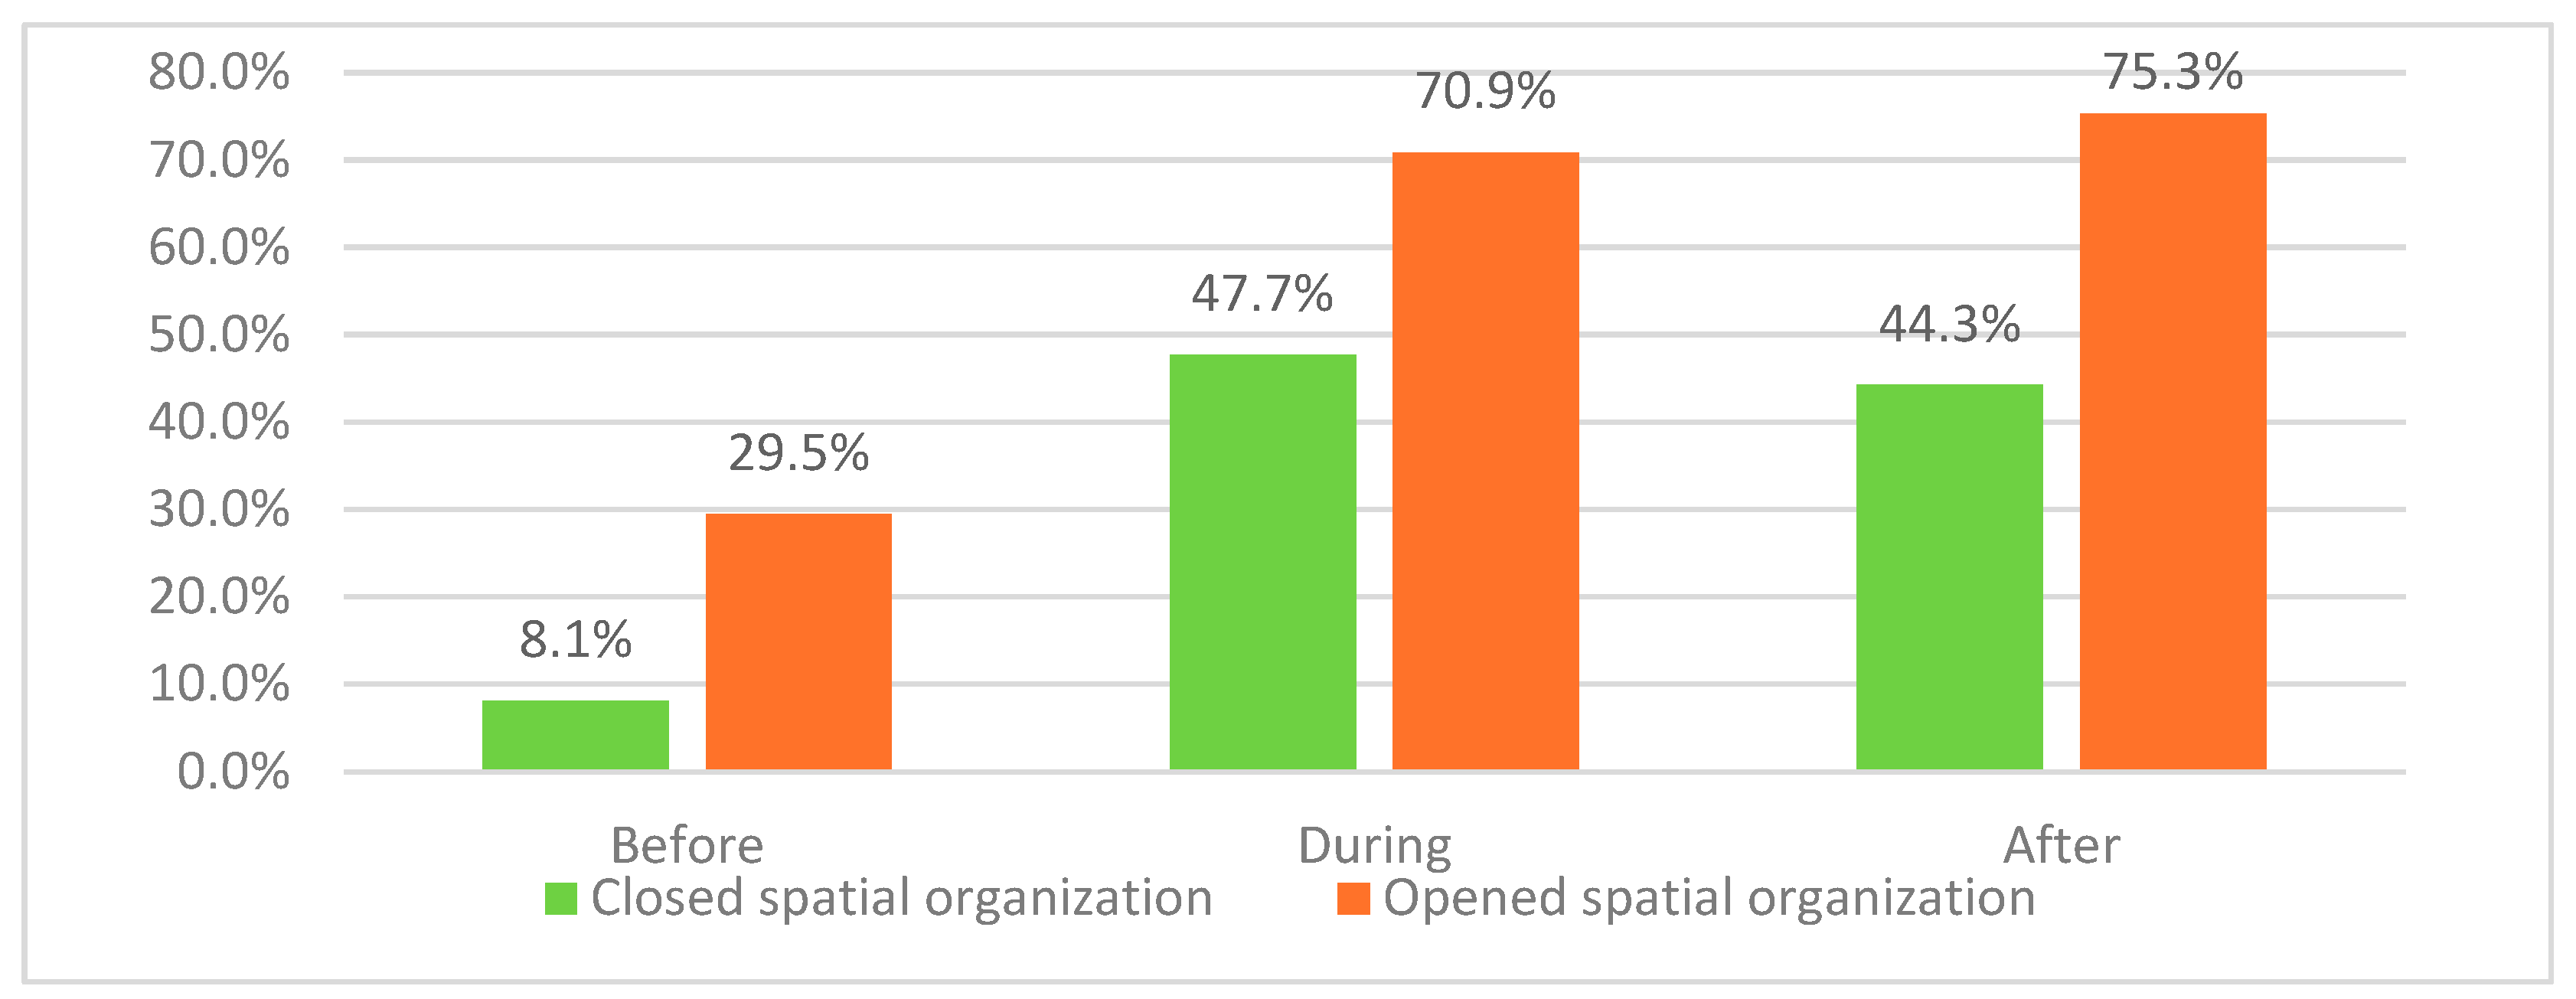
Figure 117.
Reasons for dissatisfaction variations about apartments’ layout of closed organization.
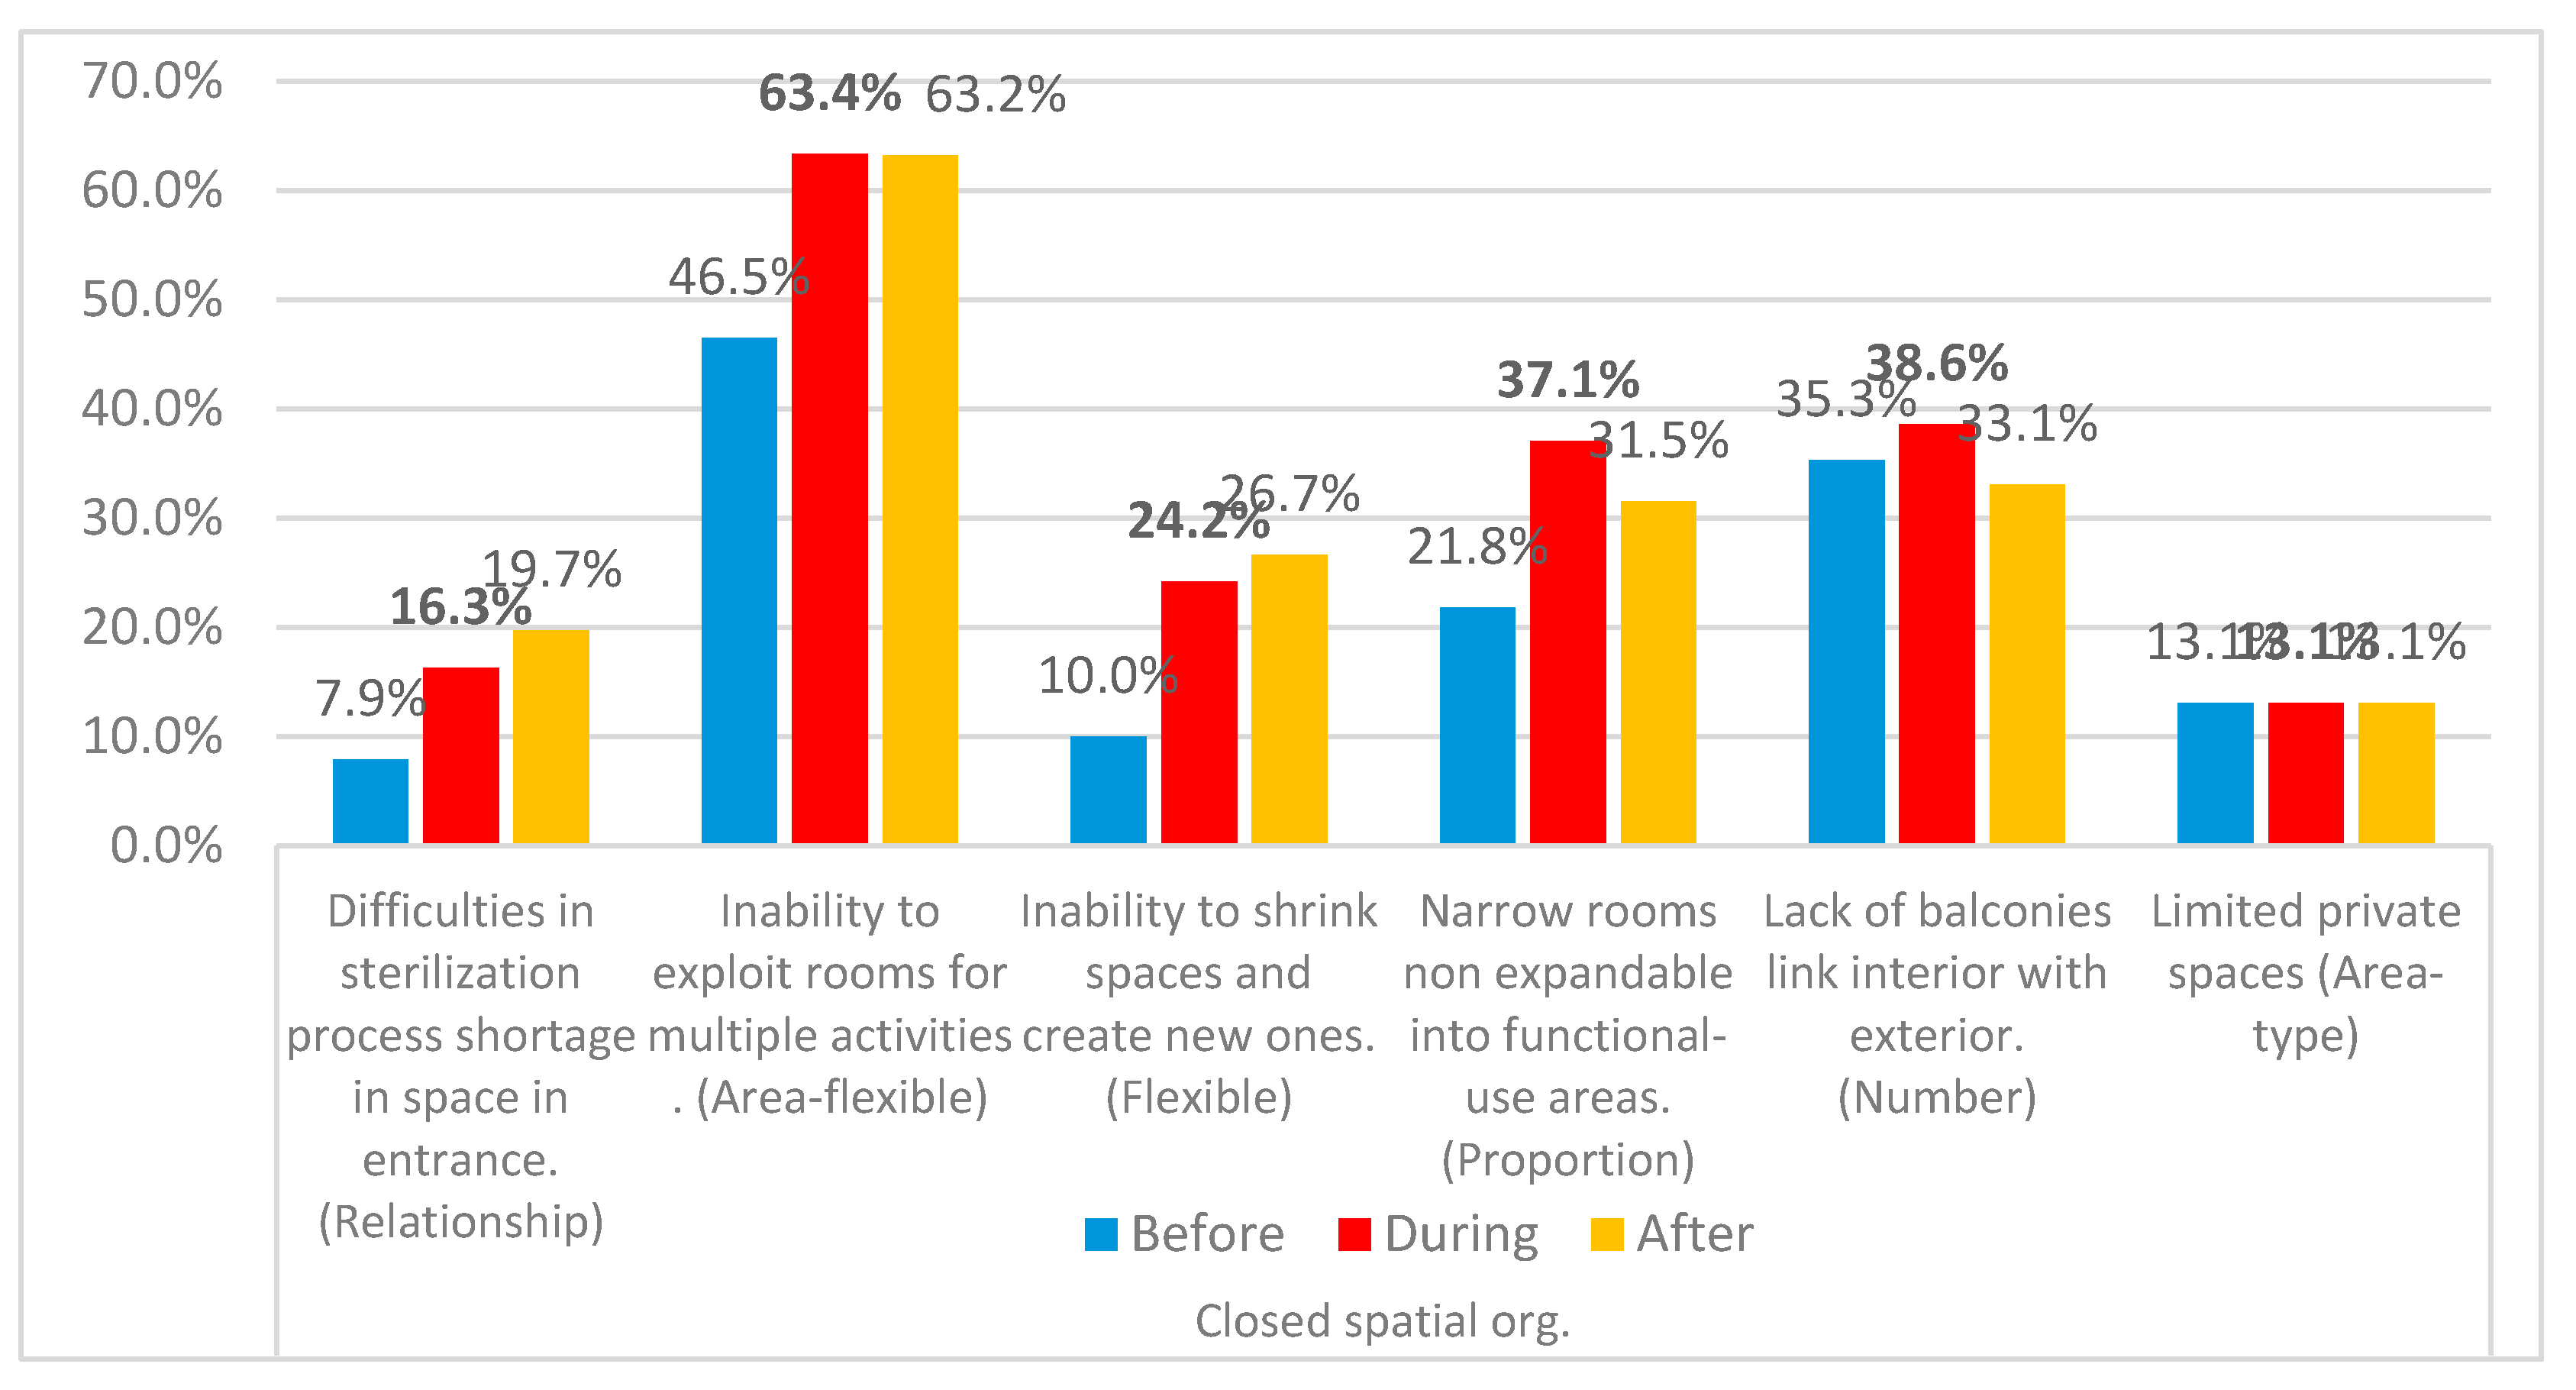
Figure 118.
Reasons for dissatisfaction variations about apartments’ layout of opened spatial organization .
Figure 118.
Reasons for dissatisfaction variations about apartments’ layout of opened spatial organization .
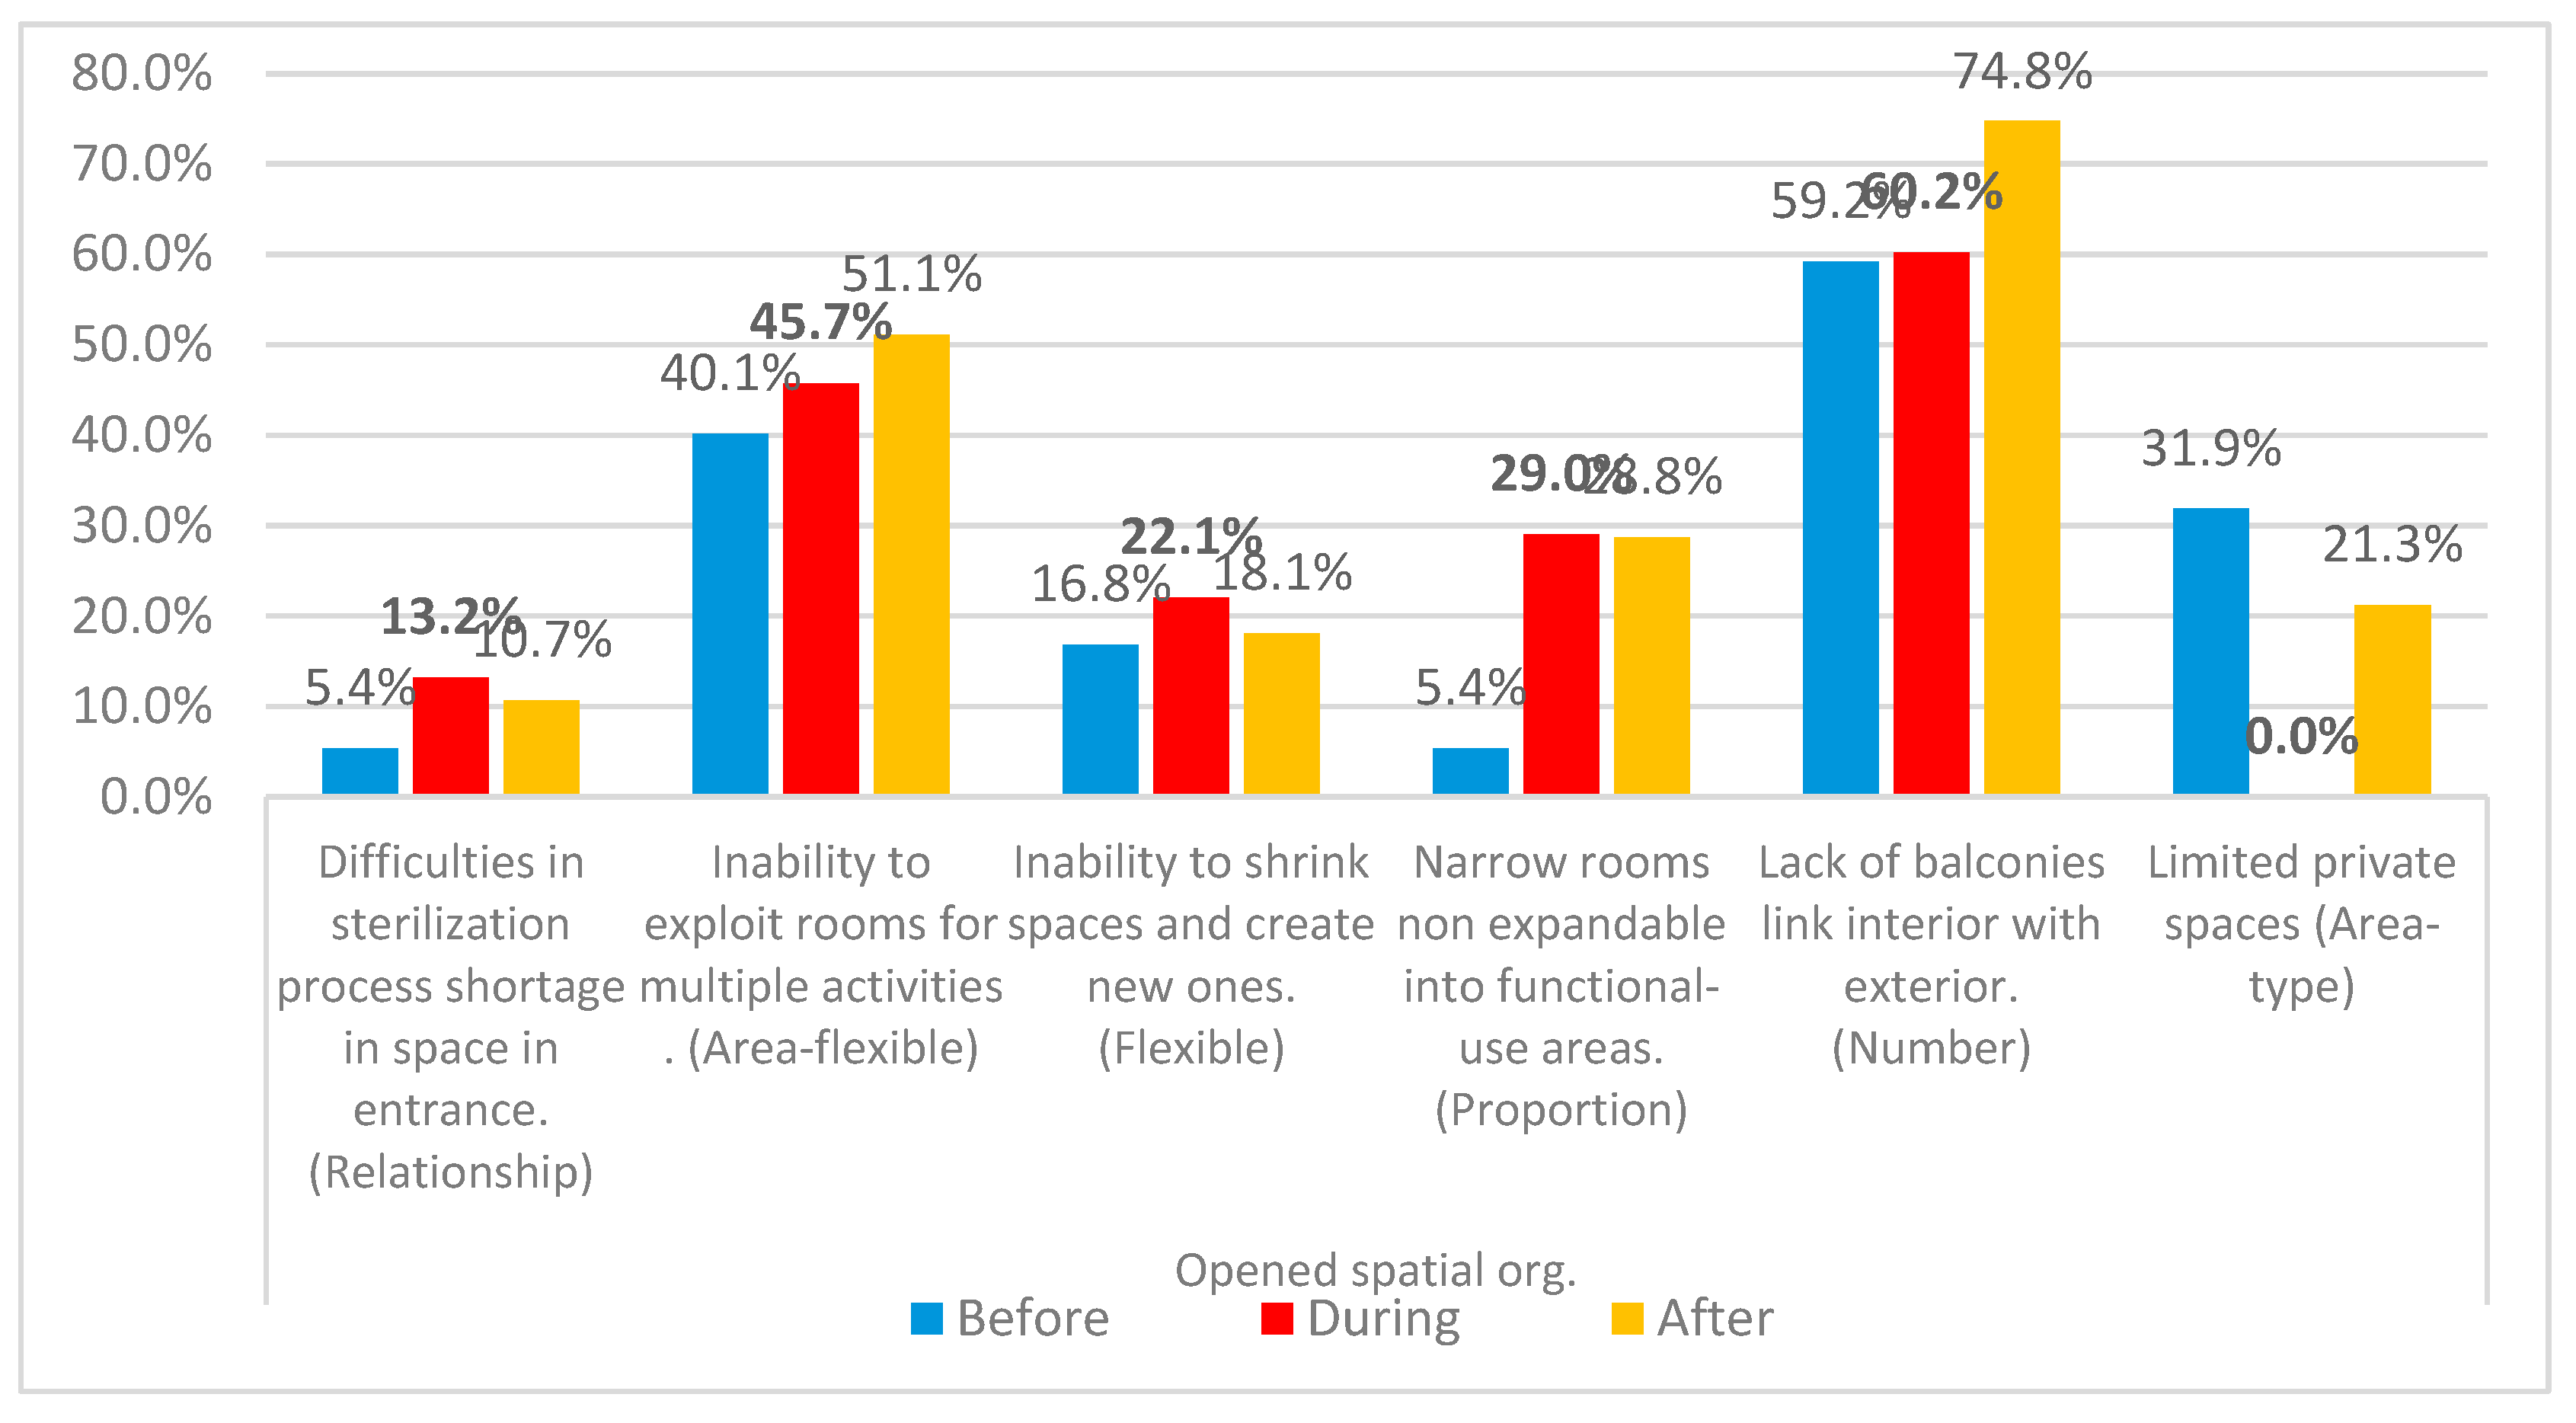
Table 1.
Main criteria used for selection of investment projects for current study.
| No | Projects | Residents’ main requirements | Apartments requirements | Acceptance for participation | |||||
| Criteria | Occupied | Family | Ownership | Stages | Size | Higher | Investor authorization | Family authorization | |
| 1 | Zanyary | √ | √ | √ | √ | √ | √ | √ | √ |
| 2 | Eskan Tower | √ | √ | √ | √ | √ | √ | √ | √ |
| 3 | Quatro | √ | √ | √ | √ | √ | √ | √ | √ |
| 4 | Park View | √ | √ | √ | √ | √ | √ | √ | √ |
| 5 | Empire | √ | √ | √ | √ | √ | √ | √ | √ |
| 6 | MRF5 | √ | √ | √ | √ | √ | √ | √ | √ |
| 7 | Roya | √ | √ | √ | √ | √ | √ | √ | √ |
| 8 | Cihan | √ | √ | √ | √ | √ | √ | √ | √ |
| 9 | FM Plaza | √ | √ | √ | √ | √ | √ | √ | √ |
| 10 | Plus Life | √ | √ | √ | √ | √ | √ | √ | √ |
Table 2A.
Respondents Demographic characteristics part A.
| Table -2 Respondents’ Demographic Characteristics -part A | ||||
| Criteria | Category | Frequency | % | |
| Gender | Male | 72 | 50.7% | |
| Female | 70 | 49.3% | ||
| Total | 142 | 100% | ||
| Age of Head | 20-29 | 29 | 20.4% | |
| 30-39 | 70 | 49.3% | ||
| 40-49 | 24 | 16.9% | ||
| 50-59 | 11 | 7.7% | ||
| 60-69 | 8 | 5.6% | ||
| >69 | 0 | 0.0% | ||
| Total | 142 | 100% | ||
Table 2B.
Respondents Demographic characteristics part B.
| Table -2 Respondents’ Demographic Characteristics -part B | ||||
| Criteria | Category | Frequency | % | |
| Education of Head | H.S. | 11 | 7.7% | |
| B.Sc. | 105 | 73.9% | ||
| M.Sc. | 19 | 13.4% | ||
| Ph.D. | 7 | 4.9% | ||
| Others | 0 | 0.0% | ||
| Total | 142 | 100% | ||
| Job of Head | Engineer | 31 | 21.8% | |
| Doctor | 27 | 19.0% | ||
| Architect | 12 | 8.5% | ||
| Employee | 45 | 31.7% | ||
| Housekeeper | 6 | 4.2% | ||
| Retired | 2 | 1.4% | ||
| Private sector | 19 | 13.4% | ||
| Total | 142 | 100% | ||
Table 3.
Respondents families’ Demographic characteristics.
| Table -3 Respondents ‘Family Demographic Characteristics | |||
| Criteria | Category | Frequency | % |
| No. of residents | One person | 4 | 2.8% |
| Two persons | 20 | 14.1% | |
| Three persons | 48 | 33.8% | |
| Four persons | 45 | 31.7% | |
| Five persons | 15 | 10.6% | |
| Six persons | 6 | 4.2% | |
| Seven persons | 4 | 2.8% | |
| Total | 142 | 100% | |
| Marital Status | Single | 8 | 5.6% |
| Married | 21 | 14.8% | |
| Married with children | 108 | 76.1% | |
| Married with parents | 5 | 3.5% | |
| Total | 142 | 100% | |
Table 17.
average dissatisfaction percentages for all apartments’ spaces and items considered in current research.
Table 17.
average dissatisfaction percentages for all apartments’ spaces and items considered in current research.
| No. |
Dissatisfaction Stages |
Trend | B< [D ≤A] | [B < A] & [D > A] | [B > D,A] & [D < A] | [B=A] Or [ B<A] |
| Change | Definition | Firm change | Real change | Slight change | Stable or Negative | |
| Change Typology | Type 1 | Type 2 | Type 3 | Type 4 | ||
| 1 | En.Q1.Beforepandemic | 34.0% | ||||
| En.Q1.Duringpandemic | 65.2% | |||||
| En.Q1.Afterpandemic | 57.9% | |||||
| 2 | Re.Q1.Beforepandemic | 52.7% | ||||
| Re.Q1.Duringpandemic | 32.7% | |||||
| Re.Q1.Afterpandemic | 37.3% | |||||
| 3 | Li.Q1.Beforepandemic | 21.1% | ||||
| Li.Q1.Duringpandemic | 45.5% | |||||
| Li.Q1.Afterpandemic | 47.5% | |||||
| 4 | Fd.Q1.Beforepandemic | 33.6% | ||||
| Fd.Q1.Duringpandemic | 50.3% | |||||
| Fd.Q1.Afterpandemic | 59.4% | |||||
| 5 | Ma.Q1.Beforepandemic | 9.5% | ||||
| Ma.Q1.Duringpandemic | 25.7% | |||||
| Ma.Q1.Afterpandemic | 24.8% | |||||
| 6 | Ch.Q1.Beforepandemic | 29.1% | ||||
| Ch.Q1.Duringpandemic | 36.5% | |||||
| Ch.Q1.Afterpandemic | 36.6% | |||||
| 7 | Ki.Q1.Beforepandemic | 48.4% | ||||
| Ki.Q1.Duringpandemic | 69.1% | |||||
| Ki.Q1.Afterpandemic | 68.5% | |||||
| 8 | Ba.Q1.Beforepandemic | 31.8% | ||||
| Ba.Q1.Duringpandemic | 40.3% | |||||
| Ba.Q1.Afterpandemic | 39.9% | |||||
| 9 | To.Q1.Beforepandemic | 54.7% | ||||
| To.Q1.Duringpandemic | 68.0% | |||||
| To.Q1.Afterpandemic | 66.8% | |||||
| 10 | La.Q1.Beforepandemic | 67.1% | ||||
| La.Q1.Duringpandemic | 77.8% | |||||
| La.Q1.Afterpandemic | 77.8% | |||||
| 11 | St.Q1.Beforepandemic | 78.2% | ||||
| St.Q1.Duringpandemic | 92.8% | |||||
| St.Q1.Afterpandemic | 92.8% | |||||
| 12 | Ap.Co.Q1.Beforepandemic | 27.8% | ||||
| Ap.Co.Q1.Duringpandemic | 58.2% | |||||
| Ap.Co.Q1.Afterpandemic | 51.9% | |||||
| 13 | Bal.Q1.Beforepandemic | 31.8% | ||||
| Bal.Q1.Duringpandemic | 64.7% | |||||
| Bal.Q1.Afterpandemic | 61.2% | |||||
| 14 | Ap.La.Q1.Beforepandemic | 16.7% | ||||
| Ap.La.Q1.Duringpandemic | 57.0% | |||||
| Ap.La.Q1.Afterpandemic | 56.7% |
Disclaimer/Publisher’s Note: The statements, opinions and data contained in all publications are solely those of the individual author(s) and contributor(s) and not of MDPI and/or the editor(s). MDPI and/or the editor(s) disclaim responsibility for any injury to people or property resulting from any ideas, methods, instructions or products referred to in the content. |
© 2024 by the authors. Licensee MDPI, Basel, Switzerland. This article is an open access article distributed under the terms and conditions of the Creative Commons Attribution (CC BY) license (http://creativecommons.org/licenses/by/4.0/).
Copyright: This open access article is published under a Creative Commons CC BY 4.0 license, which permit the free download, distribution, and reuse, provided that the author and preprint are cited in any reuse.


