
Submitted:
03 July 2024
Posted:
04 July 2024
You are already at the latest version
Abstract
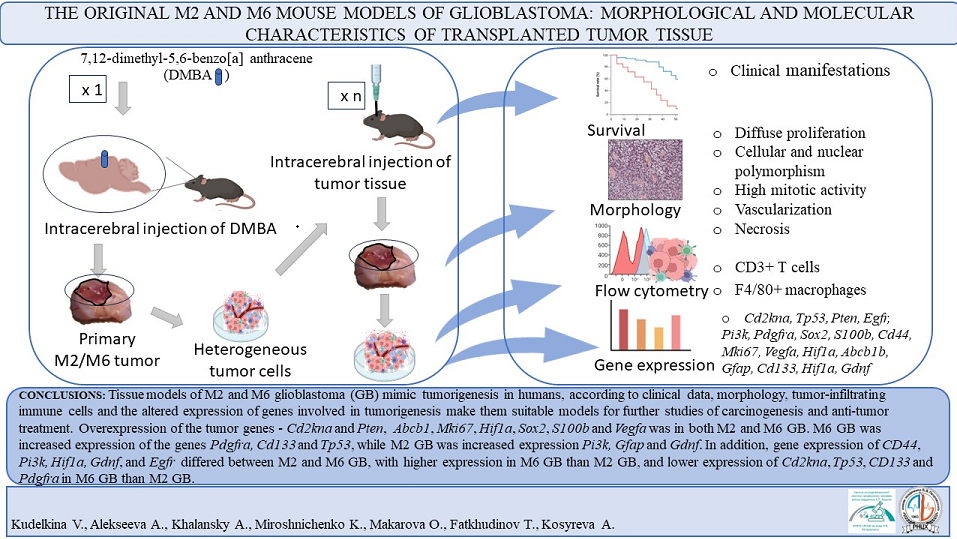
Important tumor biomarkers, therapeutic targets, and mechanisms of tumorigenesis were discovered in animal models. Mouse models of malignant gliomas were represented by transplantable, chemically-induced, and genetically-engineered cells. The aim of the study was to investigate the morphological, molecular, and immunological characteristics of two original glioblastoma (GB) strains, M2 and M6. These are new, chemically-induced, trans-plantable tissue models of malignant diffuse mouse glioma. Tissues from M2 GB and M6 GB were transplanted into immunocompetent C57BL/6 mice. The clinical manifestations of M2 GB and M6 GB growth in mice include motility disorders, cachexia, and priapism. Morphologically, M2 GB and M6 GB are characterized by diffuse proliferation, cellular and nuclear polymorphism, high mitotic activity, and pathological forms of mitosis due to the aggressive nature of these tumors. Flow cytometry showed that CD3+ T lymphocytes (~32%) and F4/80+ macrophages (~28-50%) highly infiltrated both tumors. M2 GB had higher levels of F4/80+ macrophages than M6 GB. Cdkn2a, S100b, Mki67, Pten, Vegfa, Hif1a, Sox2, Abcb1, and Gfap genes were overexpressed in both tumors. Cd133, Tp53, and Pdgfra expression was increased in M2 GB. High expression of Pi3k and Gdnf was observed in M6 GB. Expression of Cd44, Pi3k, Hif1a, Gdnf and Egfr was higher in the M6 GB tissues com-pared to M2 GB, while Cdkn2a, Tp53, Cd133 and Pdgfra were higher in the M2 GB tissue compared to M6 GB. The transplantable M2 GB and M6 GB tissue models have intratumor immune responses, clinical and morphological features similar to human GB, as well as gene expression patterns that are important for further studies on tumorigenesis. These models can be used to develop diagnostic and therapeutic procedures and study carcino-genesis.
Keywords:
glioblastoma mouse model
; morphology
; gene expression
; intratumor immune response
1. Introduction
Glioblastoma (GB) is the most aggressive tumor in the central nervous system. Currently, there is no effective treatment, and tumors often recur [1]. Understanding the mechanisms of tumor initiation, progression, and evolution is critical for developing therapeutic approaches. Preclinical models such as GB are essential for this research. The mouse model is one of the most utilized in biomedical preclinical research [2]. Allogeneic, xenograft, and genetically engineered mouse tumor models are common, each with its own advantages and limitations. Genetically engineered models are expensive and time-consuming to create, and gene expression may be suppressed in later generations of animals [3]. Xenografts do not reflect early stochastic carcinogenesis, and the molecular biological characteristics of the host organism and tumor differ. Xenografts model does not allow for the assessment of the immune system's impact on carcinogenesis, therapy including immunotherapy [4]. Allogeneic models do not replicate human tumors with all the characteristic molecular abnormalities [5]. The ideal GB model would share the same biological characteristics as human tumors, including clinical data, morphology, systemic and tumor tissue immune response, and molecular profile. The response of the GB model to treatments should be the same as in humans, and the tumor should be chemoresistant and radioresistant. Although no models accurately replicate human GB, each has unique characteristics that must be considered when designing experiments [6]. Some models are difficult and expensive to obtain and cannot be used in a large series of experiments. The failure to successfully transfer the results of effective preclinical treatments to the clinic underscores the importance of the correct choice of experimental models and the interpretation of the obtained data [2,7,8,9]. In our study, we characterized transplantable tissue models of M2 GB and M6 GB. According to our study, transplantable tumor tissue models have advantages over widely used cellular models: they have a heterogeneous cellular composition and gene expression more similar to human tumors [10,11].
2. Materials and Methods
This study was performed using 54 male C57BL/6 mice (20-22 g) obtained from 'Stolbovaya' (Russia). Animals were housed in cages with a 12-hour (h) light/dark cycle, access to food and water ad libitum throughout the study. All surgical procedures were in an aseptic environment. Animals exhibiting the first clinical signs of tumor growth (decreased activity, paralysis, weight loss, weakness and lethargy) were euthanized [12]. All experimental procedures involving animals were conducted in accordance with the Declaration of Helsinki guidelines and were approved by the Bioethics Commission (Protocol No. 29(5) dated November 8, 2021) of the Avtsyn Research Institute of Human Morphology of FSBSI 'Petrovsky National Research Centre of Surgery', Russia.
Tissues samples M2 GB and M6 GB are cataloged and managed by the 'Collection of Experimental Tumors of the Nervous System' (https://ckp-rf.ru/catalog/usu/498710/ public access 07.05.2024). Tumors were induced in the mouse brain (Mus. musculus) by multiple intracerebral transplantation of primary tumor tissue. Primary tumor tissues, designated M2 GB and M6 GB, were obtained by implanting the solid carcinogen 7,12-dimethylbenz[a]anthracene (DMBA) at a dose of 1 mg into the right hemisphere of the brain of different mice. After 8–10 consecutive transplantations of M2 GB and M6 GB, tissue morphology was methodically analyzed and the average latent period preceding the manifestation of clinical symptoms was documented. Once consistent morphological features and latencies were observed without noticeable variation between groups, the models were considered stable for further study.
Prior to the main study, tumor tissues were revitalized. Ampoules containing strains M2 and M6 GB, retrieved from cryostorage, were submerged in a container with warm water at 39°C for rapid thawing. The samples were then centrifuged for 5-7 minutes at 1,000-2,000 rpm (equivalent to 250 g). After centrifugation, the supernatant was discarded, and the pellet was resuspended. Using a syringe equipped with a wide-bore needle, 7-10 μl of the cell suspension, 7-10 μl of the cell suspension, containing approximately 4 x 10^5 cells, was injected intracranially into each animal (n=14). Tissue samples from mature tumors were transplanted into experimental animals as described below.
M2 GB (n=6) and M6 GB (n=6) tissue (mechanically crushed tissue ~7-10 μl, ~4×10∧5 cells) were implanted into the mouse brain under intraperitoneal anesthesia with Zoletil 100 (Virbac, France) 0.25 mg/animal and Xylanit (Nita-Pharm LLC, Russia) 0.5 mg/animal. The viability of cells within tumor tissue samples (n=12), ~7 -10 μl, was quantified post-mechanical dissociation via pipetting. A trypan blue exclusion assay (Servicebio, China) was employed to assess cell viability, utilizing a Goryaev chamber (MiniMed, Russia) and conducted under a light microscope by Carl Zeiss, Germany.
Tumor transplantation was performed as previously described, except that the tumor was transplanted into the brain 2 mm to the right of the sagittal suture (Sutura sagittalis) and 2 mm caudal to the coronal suture (Sutura coronalis), to a depth of 2 mm in the striatum region [13]. Implantation coordinates into the right striatum were AP: +1 mm; ML: +2.0 mm lateral to bregma; and DV: -2.0 mm relative to the skull surface (RWD, China). The injection rate was 7~10 μl /10 seconds for both experimental models. Samples of each GB strain were collected from at least 6 male mice.
Morphological studies on the brains of animals afflicted with glioblastoma (GB) were conducted during the terminal stages of tumor growth, specifically for M2 GB at 17-19 days and M6 GB at 24-26 days post-implantation. These time frames correspond to the onset of the first clinical symptoms in rats. For euthanasia, animals were given an overdosed (10 mg/kg) of Zoletil 100 (Virbac, France). Intact brain (n=6) and brain with GB (n=12) were fixed in 10% buffered formalin (BioVitrum, Russia), and tissue sections of 7 μm were prepared on a Microm HM 340 microtome (Thermo Scientific, Germany) and stained with hematoxylin and eosin (BioVitrum, Russia). The completed histological sections were meticulously analyzed under a light microscope to identify cellular structures and assess pathological changes (Carl Zeiss, Germany).
Gene expression was analyzed via real-time polymerase chain reaction (PCR). Total RNA was isolated from 6 samples of M2 GB, 6 samples of M6 GB and from 6 intact brain, each weighing 30 mg, which were preserved in RNA-later solution. The isolation was performed using the RNeasy Plus Mini Kit (Qiagen, USA). The mRNA content and its quality were assessed using a NanoPhotometer N50 spectrophotometer (Implen, Germany). The mRNA content was more than 300 ng/μl. Synthesis of cDNA from a total RNA template was carried out using a ready-made reagent kit MMLV RT kit (Evrogen, Russia). PCR was carried out with the resulting cDNAs using the qPCRmix-HS SYBR reagent kit containing the fluorescent intercalating dye SYBR Green I (Evrogen, Russia). The design of primers for PCR was carried out using the Primer-BLAST online resource, following generally accepted requirements. Selected primers (Table 1) were synthesized by Evrogen. To analyze gene expression, we used the threshold cycle (Ct) method and calculation of relative gene expression by method [14] taking into account recommendations [15]. The Gapdh gene was used as a control. Comparisons of mRNA expression were made between the M2 GB and M6 GB tumor samples and intact brain tissues. The mRNA expression levels in the tumor samples were quantified and contrasted with those in the normal brain tissue to assess the relative upregulation or downregulation of specific genes.

Table 1.
Sequence of primers used to determine the expression level of the corresponding gene.
| Gene | Forward primer | Reverse primer |
|---|---|---|
| Cd44 | AGAAGGGACAACTGCTTCGG | TTGGAGCTGCAGTAGGCTG |
| Cdkn2a | TGGTCACTGTGAGGATTCAGC | TGCCCATCATCATCACCTGG |
| Pi3k | CCGCTCAGGGAGAGGAGTA | CCACTCTCAGCTTCACCTCC |
| S100b | GATGTCCGAGCTGGAGAAGG | CCTGCTCCTTGATTTCCTCCA |
| Tp53 | TTCTCCGAAGACTGGATGACTG | CTGCTCCTTGATTTCCTCCA |
| Mki67 | CCTGCCTGTTTGGAAGGAGT | AAGGAGCGGTCAATGATGGTT |
| Pten | GGACCAGAGACAAAAAGGGAGT | CCTTTAGCTGGCAGACCACA |
| Vegfa | TCCACCATGCCAAGTGGTC | AGATGTCCACCAGGGTCTCA |
| Hif1a | GATGTCCGAGCTGGAGAAGG | CTGTCTAGACCACCGGCATC |
| Cd133 | GGAGCAGTACACCAACACCA | GTCTGTTTGATGGCTGTCGC |
| Sox2 | AGGAAAGGGTTCTTGCTGGG | GGTCTTGCCAGTACTTGCTCT |
| Pdgfra | GTGCTAGCGCGGAACCT | CATAGCTCCTGAGACCCGC |
| Gdnf | GACCGGATCCGAGGTGC | GAGGGAGTGGTCTTCAGCG |
| Mgmt | GACCGGATCCGAGGTGC | GAGGGAGTGGTCTTCAGCG |
| Abcb1 | CTCTTGAAGCCGTAAGAGGCT | AACTCCATCACCACCTCACG |
| Gfap | GGCTGCGTATAGACAGGAGG | CCAGGCTGGTTTCTCGGAT |
The relative numbers of lymphocytes and macrophages in the tumor tissue homogenate were assessed using the flow cytometer Cytomics FC 500 device (Beckman Coulter, USA). For each type of tumor strain, the number of samples was at least 5. The number of cells in the sample was 1x10∧6. Tumor samples were lysed using OptiLyse C (eBioscience, USA) and incubated with CD3-FITC (eBioscience, USA) and anti-mouse F4/80-PE (Miltenyi Biotec, Germany) antibody for at least 30 minutes at room temperature. For the control of autofluorescence, assessment was conducted using a sample devoid of antibodies.
Statistical data processing was performed using STATISTICA 10.0 (StatSoft, Inc. USA). Experimental data were characterized by median (Me) and interquartile range (25%;75%). Statistical differences were analyzed with Dunn's Kruskal-Wallis multiple comparisons test.
3. Results and Discussion
After injecting 7-10 μl of crushed tissue (~ 4 x 10∧5 cells) into the brain, the tumor formation rate was 95-100 %. The mean asymptomatic period for animals with intracranial M2 GB was 17-35 days (mean 20 days) and for M6 GB – 23-34 days (mean 27 days). Animal lifespans were 1-2 days longer than the latency period.
The clinical manifestations of M2 GB and M6 GB growth at the final stage included decreased activity, paralysis, weight loss, and priapism, indicating a terminal state and imminent death. These symptoms are associated with metabolic changes – cachexia, coagulopathy, ischemic brain damage – priapism, and motor deficits, which can also be in patients with brain tumors [16,17,18,19]. Similar symptoms are observed in models of brain tumor [20,21,22].
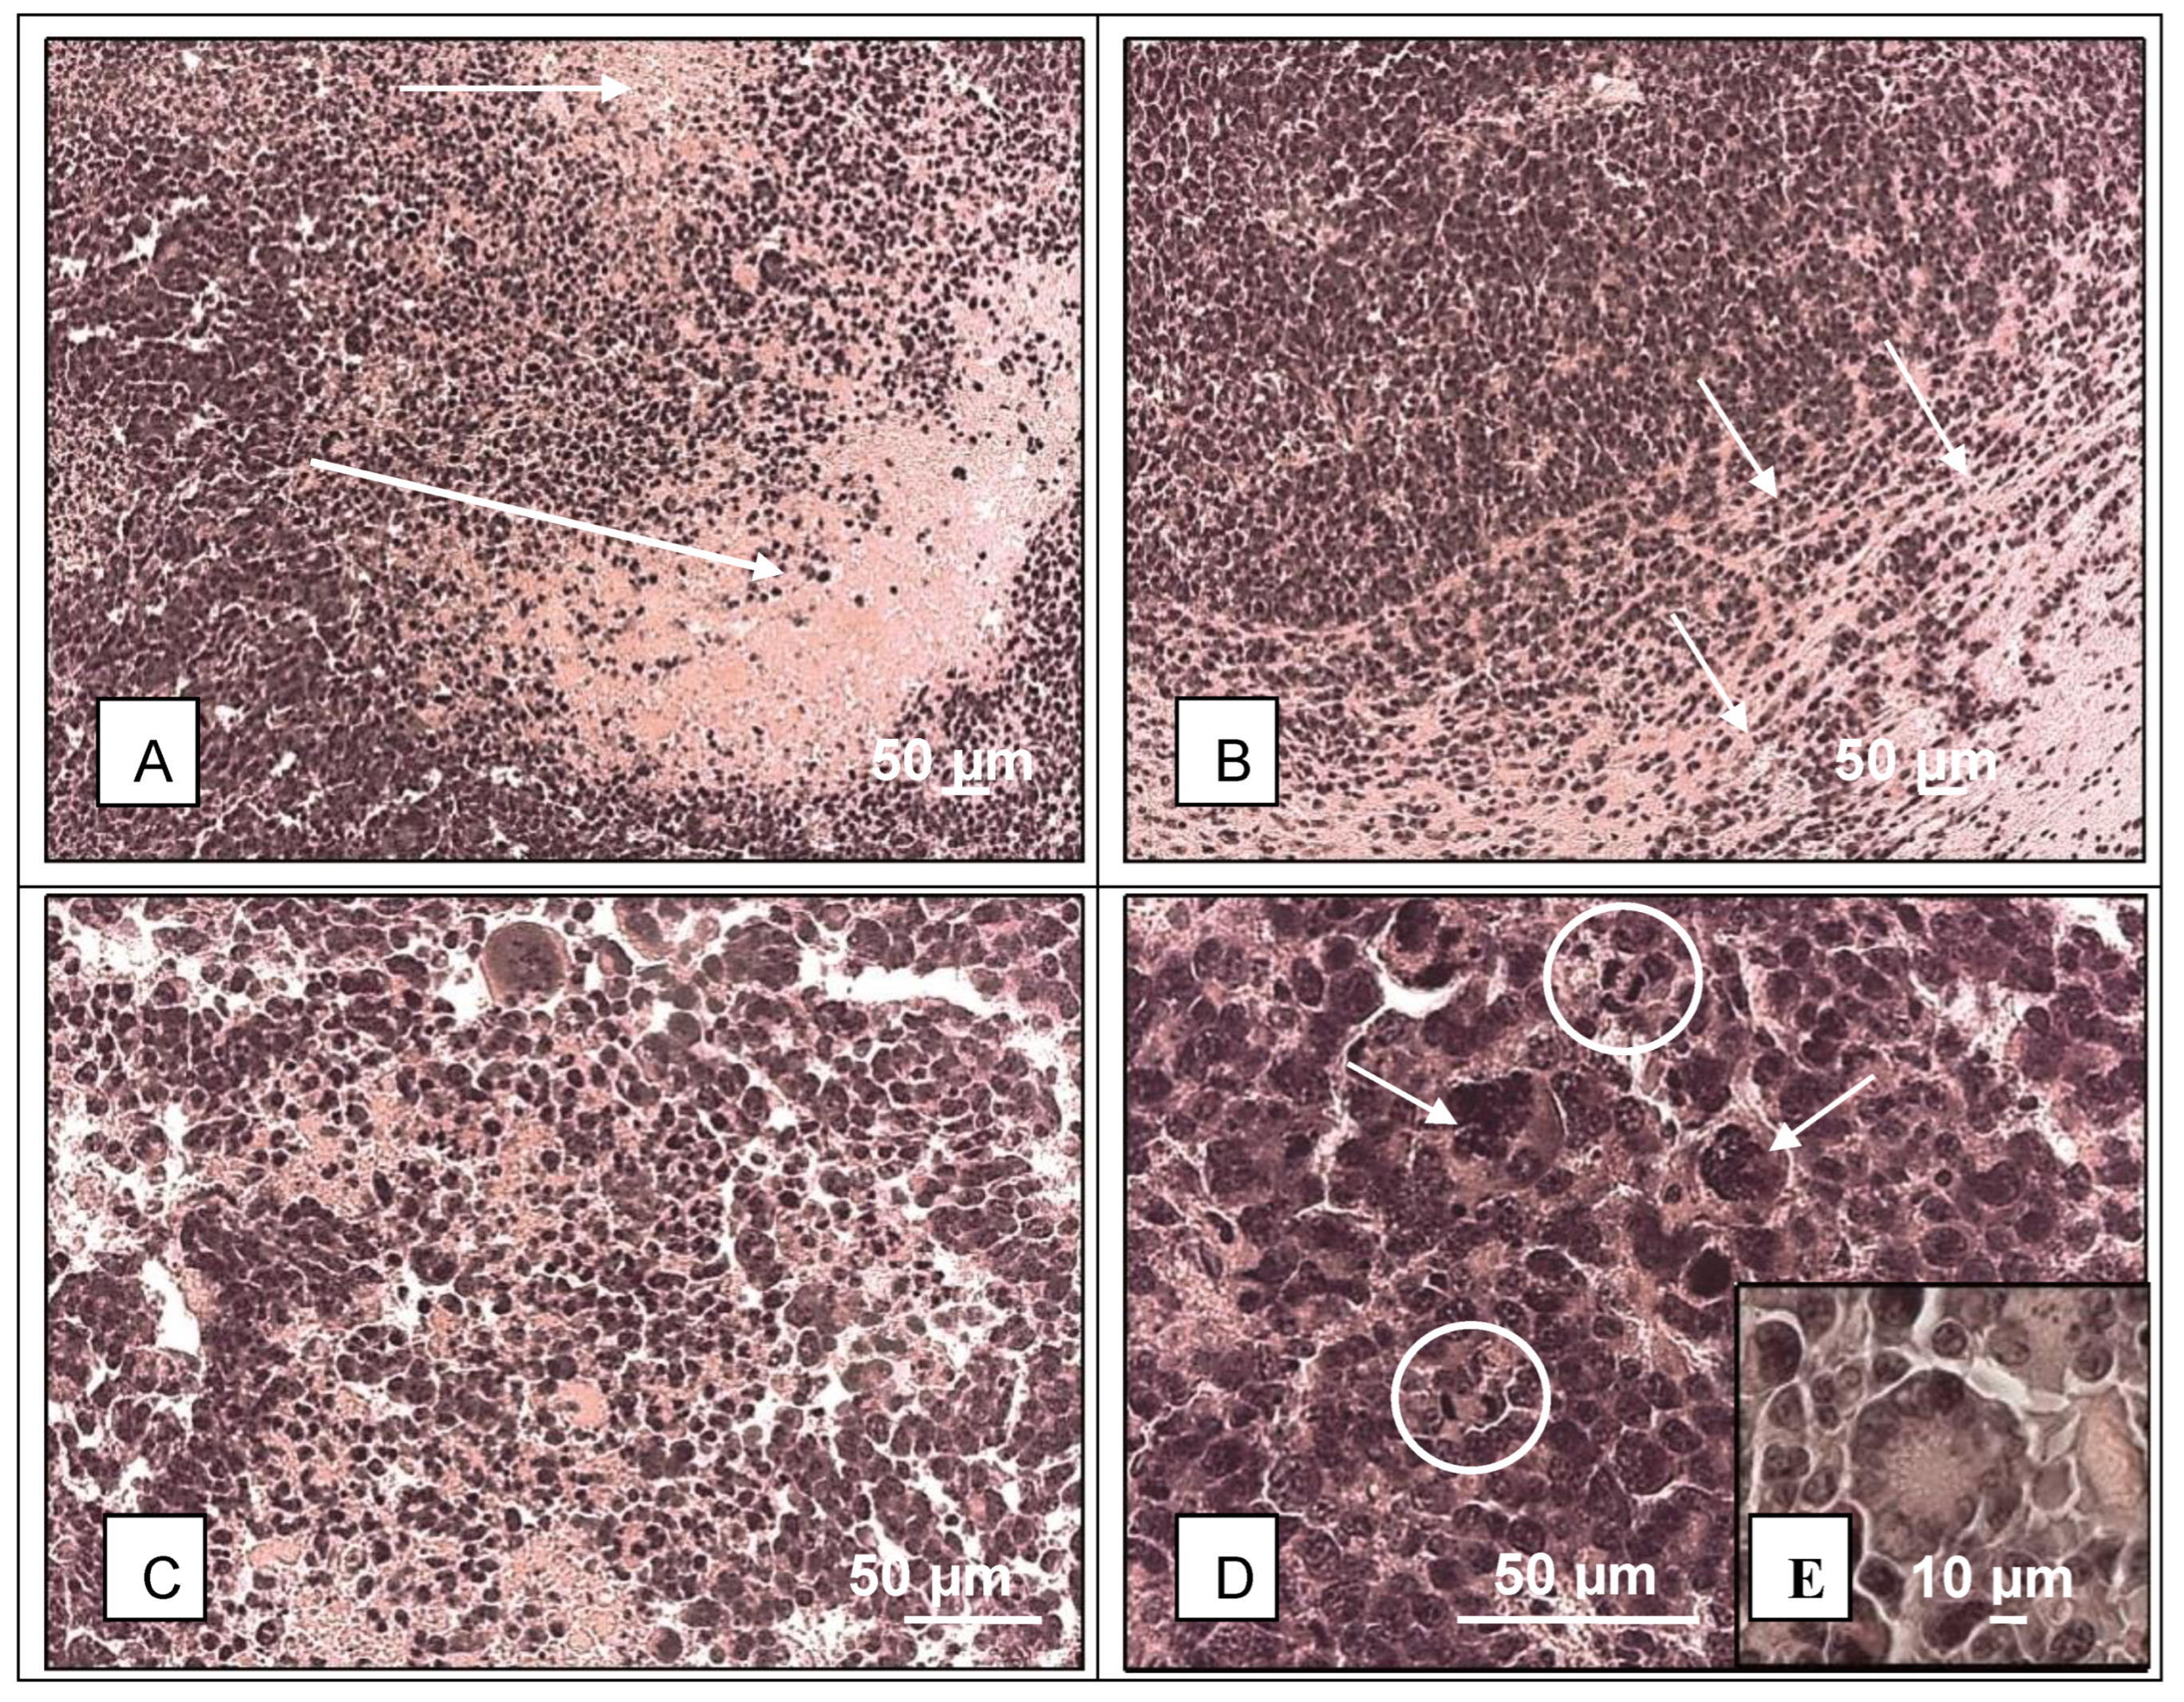
In histological sections stained with hematoxylin and eosin, M2 GB (n=6) was large and extended into the cortex and subcortex of the brain. M2 GB were characterized by high cellularity and mitotic activity (Figure 1D). Cells were polymorphic, atypical, and had large nuclei, with a significant number of multinuclear giant cells (Figure 1C, D). About 2% of mitosis, including pathological ones, and about 2% of dying cells with fragmented nuclei in the form of apoptotic bodies were found in the tumor. This corresponded to two or more mitoses per 100 tumor cells. Many neuropathologists use a cutoff of two or more mitoses in the entire specimen or one mitosis in a small biopsy [23], which is consistent with our data of M2 GB tissue with high mitotic activity and a high tumor grade. At the border of the tumor and the brain, an accumulation of astroglia and peritumoral edema were observed. Necrosis and hemorrhage were detected in the tumor (Figure 1A). Perivascular and perineural infiltrative growth was observed at the border between tumor and brain tissue (Figure 1B). Rosette-like clusters of tumor cells (Figure 1E), and the presence of these structures is a diagnostic sign of several tumors, including medulloblastoma and neuroblastoma.
Figure 1.
Histology of M2 glioblastoma. A – extensive necrosis and hemorrhage (arrow); B – infiltrative growth into brain tissue; C – dying tumor cells and mitotic cells, hemorrhage; D – hyperpigmented, polymorphic, multinucleate (arrows), mitotic cells (circles) in the tumor; E – some tumor cells form rosettes. Hematoxylin and eosin.
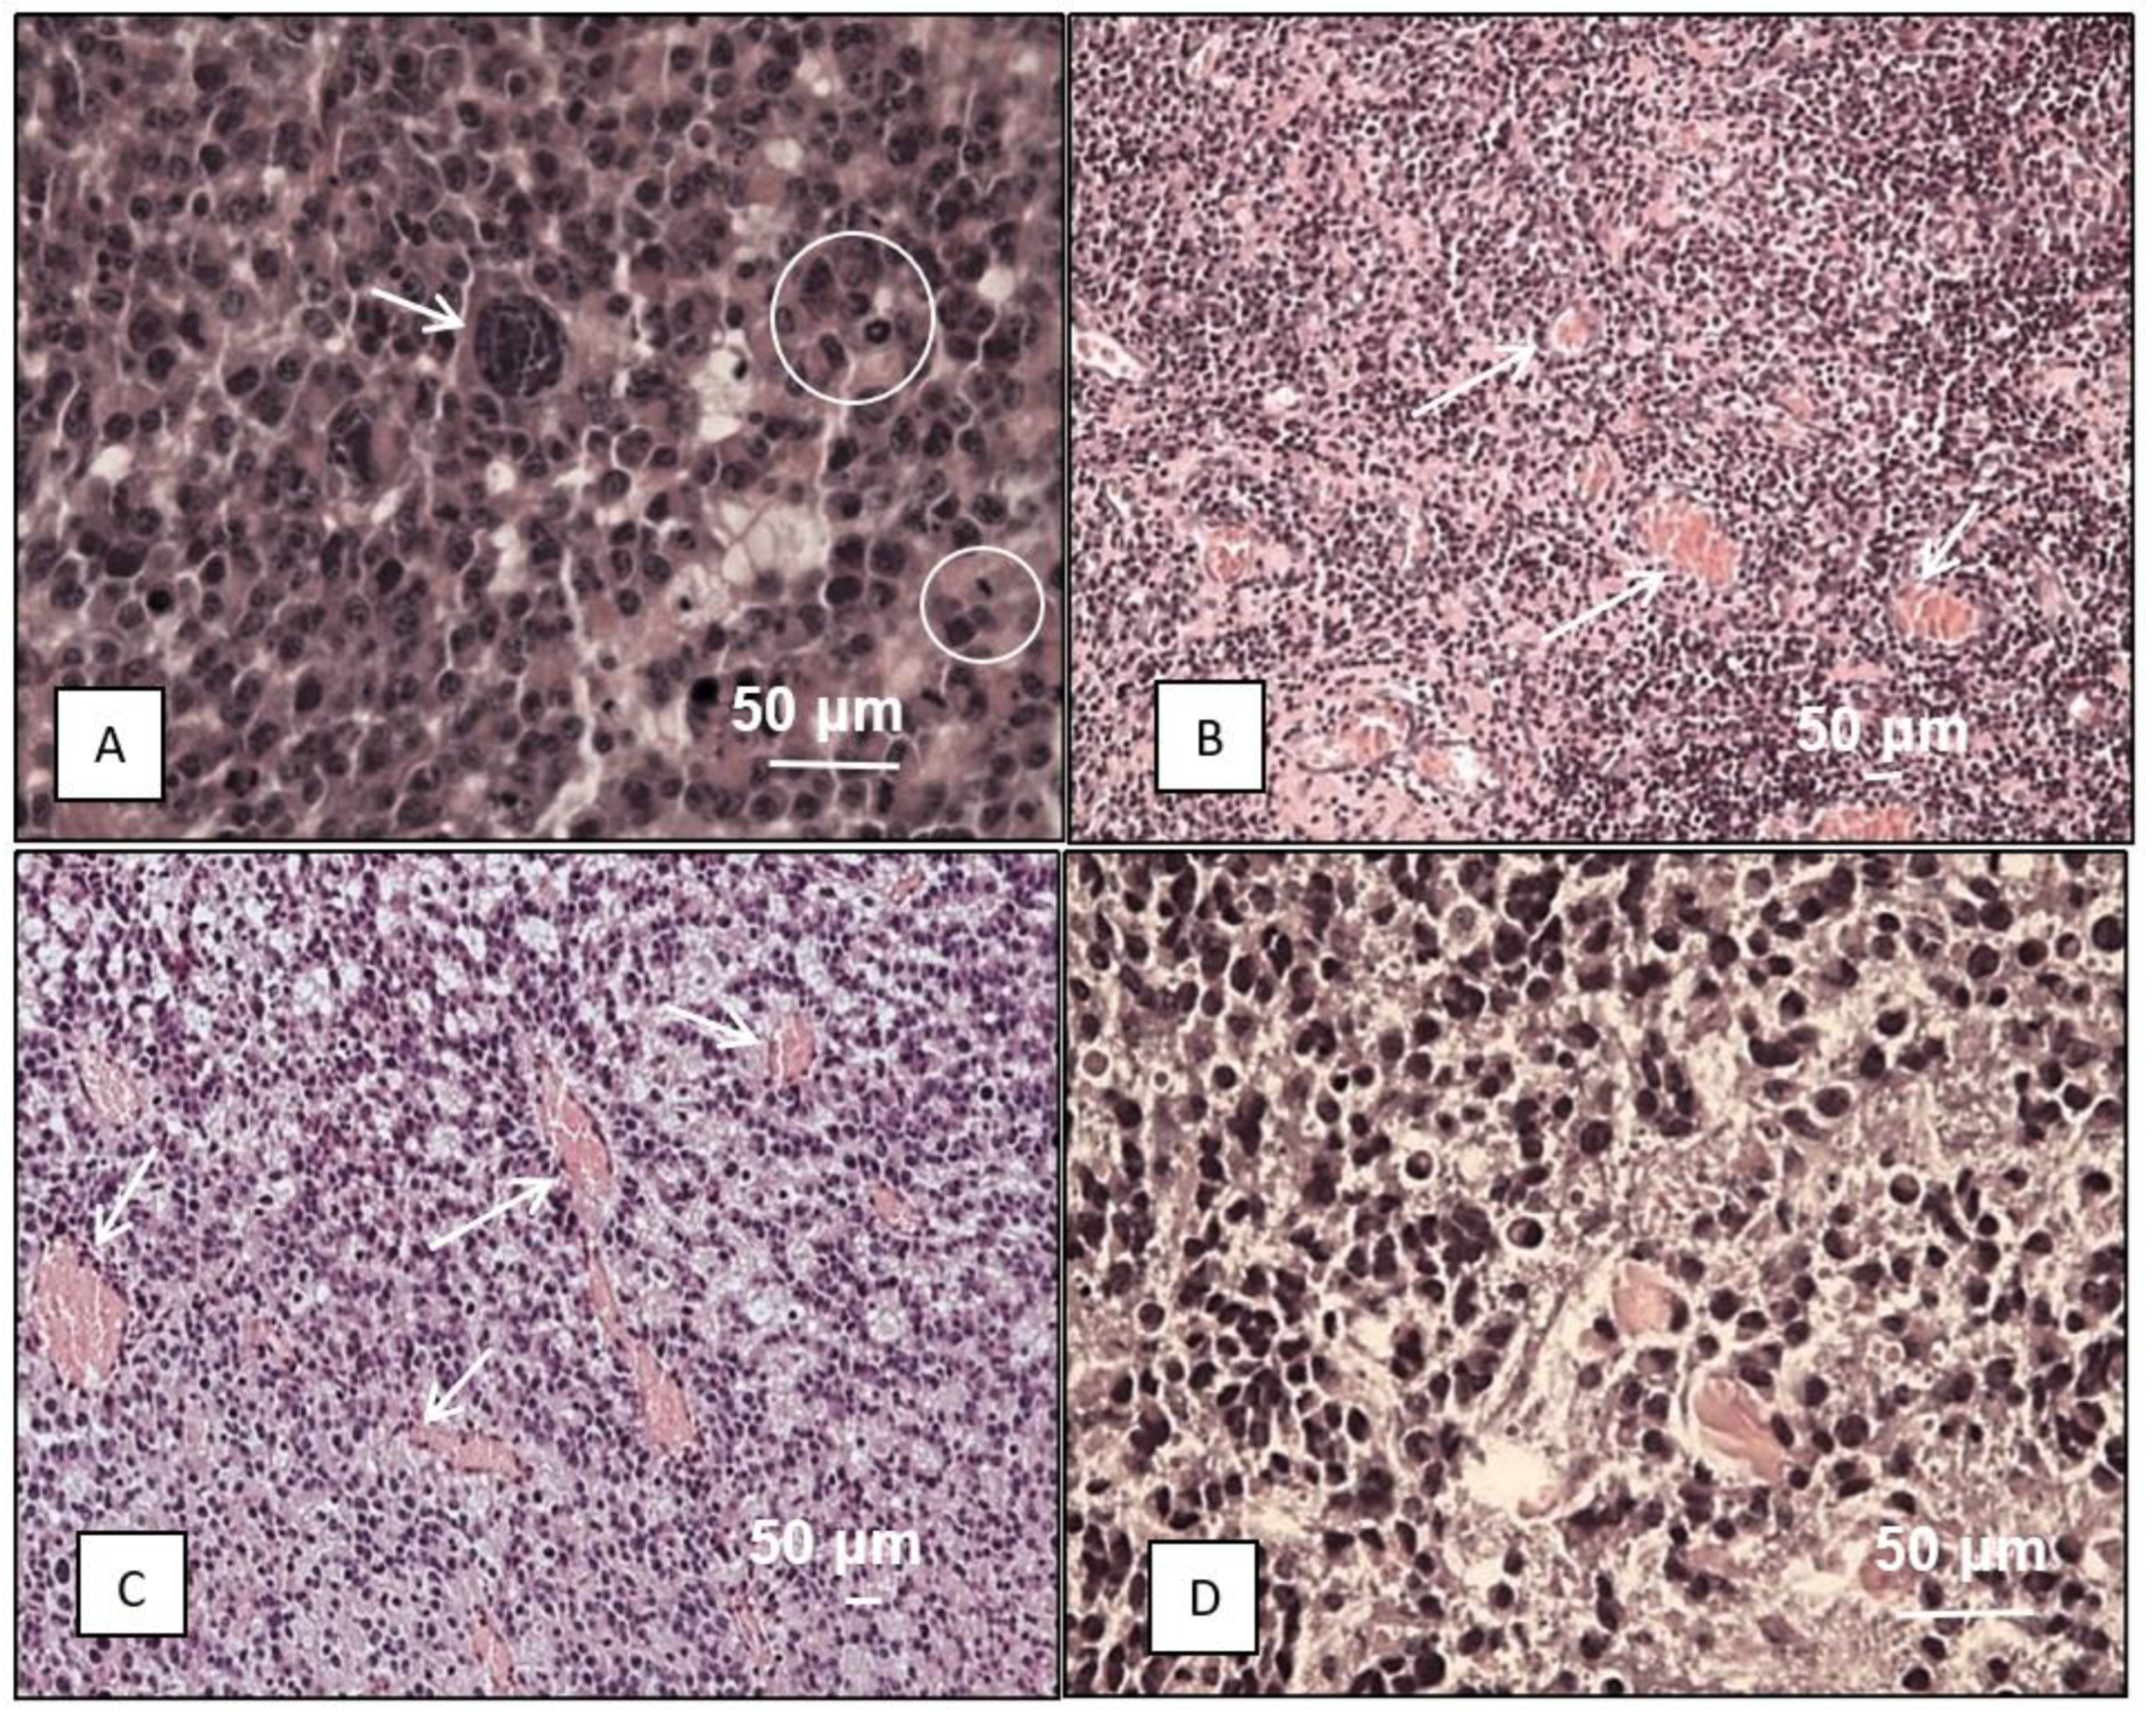
In M6 GB (n=6), tumor cells are polymorphic, with narrow edges of cytoplasm, predominantly giant cells with multiple nuclei (Figure 2A, D). Mitoses in tumor cells, including pathological forms of mitoses, account for about 3% of cells (Figure 2A). Tumor cells dying in the form of apoptotic bodies account for about 3%. This corresponded to 3 or more mitoses per 100 tumor cells. These findings are consistent with those of neurologists who recognize tumors as highly malignant when there are two or more mitoses in the entire specimen or one mitosis in a small biopsy [23]. Within the tumor, numerous vessels with deformed lumens, microvascular proliferation, and hemorrhages were observed (Figure 2B, C, D). Several areas of necrosis were detected. Tumor growth was infiltrative, perineural, and perivascular.
Figure 2.
Histology of M6 glioblastoma. A – polymorphic cells and nuclei, giant multinucleated cell (arrow), numerous mitoses (circle); А-D – hypercellularity; B, C – numerous vessels in the tumor (arrows); D – hyperpigmented, polymorphic cells and nuclei in the tumor. Hematoxylin and eosin.
Figure 2.
Histology of M6 glioblastoma. A – polymorphic cells and nuclei, giant multinucleated cell (arrow), numerous mitoses (circle); А-D – hypercellularity; B, C – numerous vessels in the tumor (arrows); D – hyperpigmented, polymorphic cells and nuclei in the tumor. Hematoxylin and eosin.
GB is an immunosuppressive tumor, and the persistence of locally and systemically impaired immune responses limits the potential for immunotherapy. Immature bone marrow-derived cells and macrophages may limit T cell infiltration and activation in gliomas [24]. M2 GB and M6 GB tissues were infiltrated with CD3+ T lymphocytes and F4/80+ macrophages. The relative numbers of T lymphocytes and macrophages in M6 GB (n=5) were 32.01% (8.9-33.6) and 28.4% (14.8-28.4), respectively. In M2 GB samples (n=5), macrophages were statistically significantly (p=0.04) higher – 50.3% (49.4-51.2) than in M6 GB – 28.4% (14.8-28.4). F4/80+ accounts for up to one-third of human GB with protumor and antitumor phenotypes. Glioma cells and infiltrating immune cells escape immune surveillance by secreting suppressive cytokines – IL 6, IL 10, TGF-β, prostaglandin E-2, etc., and their expression is dependent on growth factors secreted by tumor cells [25]. Perhaps the difference in the number of T lymphocytes and macrophages in the M2 GB and M6 GB models is determined by the higher secretion of anti-inflammatory cytokines by the M2 GB cells. Greater immunosuppression is exerted by tumor-infiltrating stroma cells, including macrophages/microglia, than by the tumor cells themselves. Immunosuppression forms a clonal composition of tumor cells and regulates gene expression within the tumor [26]. An increased content of T lymphocytes in the tumor indicates its inflammatory status, and a high number of F4/80+ indicates an immunosuppressive background in the tumor [27]. This condition is typical of HIV-infected patients. HIV-mediated immunosuppression is associated with an increased incidence of gliomas and the progression of low-grade glioma to GB [28], suggesting a significant contribution of the immunosuppressive microenvironment to glioma progression. Patients with GB and mice with GB have CD4 T-lymphocyte counts in the blood consistent with AIDS, and lymphoid organs with T-cell deficiency. Instead, the missing naïve T cells are found in large numbers in the bone marrow. This phenomenon is typical not only for headaches, but also for other types of tumors, but only when they grow intracranial [29]. Compared to the M2 GB and M6 GB tissue models, populations of macrophages in cell tumor model - mouse glioma GL261 are low (mean 5.6%) [30]. According to other data, the GL261 glioma mouse cell model is highly infiltrated with immune cells, although there are fewer of them in human GB [31]. Maire et al. found that the highest expression of immune response-related genes in a GB animal model was observed during the initial phase of tumor growth. TAM, CD3+, and CD8+ T cell infiltration initially increased and decreased after mice became symptomatic. This illustrates the concept of immune editing and immune escape [32].
The presence of CD3+ T cells in glioblastoma (GB) samples signifies an immune response to the tumor, which is pivotal for the development of immunotherapy. Notably, higher pretreatment intratumoral CD3 T cell levels have been positively correlated with patient survival. While the majority of human GBs exhibit low CD3 infiltration, aligning with the characteristic 'cold' tumor profile, approximately 25% of GBs in humans demonstrate intermediate to high CD3 infiltration, similar to the M6 GB model. This model can be used to develop immunotherapy for such patients [33]. Following radiation therapy, neoantigens are released, and the number of CD3+ cells increases significantly. It has been suggested that, during relapse, GB cells limit T cell responses due to a lack of antigens. According to some data, the number of intratumoral CD3 cells before treatment is positively associated with patient survival [33], but according to others, it is not associated [34]. Compared to primary human GB, where immunosuppressive cells are 'cold tumors', tumor recurrence, intracranial metastasis of melanoma, lung, and kidney tumors are 'hot tumors', more enriched in T cells and tumor cells have no immunosuppression. Increased Treg content in GB correlates with decreased cytotoxicity of T cells [35,36]. In response to therapy, the volume of GL261 tumor decreased, and the number of T cells and macrophages increased [37]. In both mouse GB and human GB, the pool of macrophages consists of microglial cells with a pro-inflammatory profile and peripheral monocytes with genes linked to wound healing [38]. Most tumor-associated macrophages (TAM) are CD68 and F4/80 positive, but more F4/80 than CD68 are found on the periphery of the tumor and in areas where it grows. F4/80+/CD68 cells are rarely found in the core of the tumor [38]. F4/80+ cells are the dominant population in neurospheres derived from M7 and O61 mouse tumors [39].
Transplanted tumor tissue is more tumorigenic and shows more aggressive growth and faster macrophage polarization to the M2 anti-inflammatory phenotype compared to cell lines and chemically induced primary tumors. The majority of immunosuppressive cytokines, enzymes, checkpoint ligands, cell surface molecules, and signaling pathways are overexpressed in glioma stroma cells and macrophages/microglia but not in tumor cells [32]. The fact that M6 GB and M2 GB are highly infiltrated with tumor-associated lymphocytes and macrophages begs the question: What is the expression of the genes directly examined in the tumor cells of M2 GB and M6 GB, and which belong to the surrounding immune cells? We plan to study this in our next experiments.
Compared to the intact mouse brain, the mRNA expression of Cdkn2a, Mki67, Hif1a, Sox2, Pdgfra, Abcb1, Cd133, Tp53, S100b, Pten and Vegfa was increased in M2 GB tissue, with no differences in the other investigated genes (Table 2). Compared to the intact brain, the expression of Cdkn2a, S100b, Mki67, Vegfa, Hif1a, Sox2, Abcb1, Pi3k, Gfap, Gdnf, and Pten was statistically significantly higher in M6 GB tissue, with no differences in the other investigated genes. In addition, differences in expression levels of many genes were detected between M2 GB and M6 GB: thus, expression of Cd44, Pi3k, Hif1a, Gdnf and Egfr was higher in M6 GB than in M2 GB, and Cdkn2a, Tp53, Cd133, and Pdgfra were higher in M2 GB than M6. Mgmt expression did not differ between tumor and intact brain tissue (Table 2).
In human GB tissues, literature indicates a differential expression pattern of several key genes. The expression levels of CD44, S100B, PI3K, VEGFA, HIF1A, PDGFRA, GDNF, MGMT, EGFR and GFAP are reported to be increased [40,41,42,43,48,51,52,53,55,56]. Conversely, the expression of CDKN2A, PTEN, and SOX2 is observed to be decreased [44,47,49].
Table 2.
mRNA expression levels in intact mouse brain and tissue strains of mouse M2 GB and M6 GB. Data are shown in Me (25%-75%), Kruskal-Walli’s test. (*– brain and M2 GB; ** – brain and M6 GB; *** – M2 GB and M6 GB. GB – glioblastoma; ↑ or ↓ – upregulation or downregulation of gene expression correlates with low survival; - no prognostic significance).
| Gene | Function | Brain tissue (n=6) | М2 GB tissue (n=6) |
М6 GB tissue (n=6) |
Statistical significance: |
Human GB, References |
|---|---|---|---|---|---|---|
| Cd44 | Cell adhesion, neurotrophic factor | 9 (4; 32) |
7 (6; 11) |
39 (36; 55) |
0.002*** | ↑[40] |
| S100b | 126 (49; 897) |
9155 (6851; 1429) |
1742 (1204; 3406) |
0.000*; 0.041** | ↑[41] | |
| Pi3k | Angiogenesis, differentiation, transcription | 45 (35; 70) |
105 (87; 155) |
301 (229; 900) |
0.000**; 0.007*** | ↑[42] |
| Vegfa | 51 (36; 423) |
2109 (1242; 4244) |
8269 (8; 11877) |
0.033*; 0.015** | ↑[43] | |
| Cdkn2a | Cell cycle, apoptosis, transcription, lipid metabolism, neurogenesis | 19 (3; 38) |
68721 (43328; 84452) |
10496 (9155; 15291) |
0.000*; 0.047**; 0.010*** | ↓[44] |
| Tp53 | 1141 (770; 1458) |
93397 (5336; 22744) |
40 (25; 201) |
0.004*; 0.000*** | - [45] | |
| Mki67 | 9 (2; 16) |
4410 (1972; 7018) |
747 (539; 1285) |
0.000*; 0.032** | - [46] | |
| Pten | 424 (272; 1011) |
5301 (2633; 6966) |
6736 (4548; 16931) |
0.000*; 0.000** | ↓[47] | |
| Hif1a | Transcription | 245 (133; 375) |
2269 (1402; 2725) |
5876 (4951; 7018 |
0.006*; 0.000**; 0.046*** | ↑[48] |
| Sox2 | 1029 (358; 2219) |
5876 (3967; 7018) |
12060 (10322; 17055) |
0.009*; 0.000** | ↓[49] | |
| Cd133 | Differentiation, proliferation, apoptosis | 82 (35; 88) |
168 (137; 218) |
36 (25; 42) |
0.020*; 0.000*** | - [50] |
| Pdgfra | Growth factor, chemotaxis | 71 (30; 296) |
505 (276; 773) |
43 (29; 68) |
0.009*; 0.000*** | ↑[51] |
| Gdnf | Growth factor | 3 (2; 5) |
16 (9; 26) |
1065 (586; 1376) |
0.000**; 0.001*** | ↑[52] |
| Mgmt | DNA damage/repair | 23 (2; 96) |
30 (9; 73) |
31 (16; 47) |
> 0.05 | ↑[53] |
| Abcb1 | Cellular transport | 33 (27; 53) |
302 (245; 426) |
596 (523; 968) |
0.002*; 0.000** | - [54] |
| Gfap | Glioma-associated | 281 (35; 1554) |
2702 (1051; 5301) |
6736 (4548; 12104) |
0.05*; 0.000** | ↑[55] |
| Egfr | Proliferation | 14 (5; 26) |
1 (0.4; 1) |
27 (5; 110) |
0.011*** | ↑ [56] |
Mutations in Hras, Pten, Pi3k, Mdm2, Tp63, Esr, Pgr, and Her2, loss of Cdkn2a, Igf, Akt, and phosphorylation of MYC were found in DMBA-induced breast, blood, and skin tumor models [57,58,59]. These tumors are also characterized by activation of EGFR and Ki-67, wild-type p53, low levels of CDKN1A and PTEN mRNA and protein, as well as decreased expression and activity of the IDH1/2 enzyme, one of the main markers of gliomas. Decreased IDH1 expression correlates with tumor progression and DMBA-induced oxidative stress may contribute to IDH1 inactivation [60]. It is possible that M2 and M6 GB induced by DMBA may be IDH1/2 mutant, which requires verification.
Human GB is characterized by IDH wild type, activation of EGFR occurs in almost 57% of GB cases, but mutations in the TERT promoter are rare. Activation of EGFR is rarely observed in giant cell GB and gliosarcoma. We have shown that M2 GB consists of a significant number of giant cells and an unchangeable expression of EGFR. Compared to GB, IDH-mutant astrocytomas are often wild-type EGFR and PTEN, as well as the presence of MGMT promoter methylation, TP53, ATRX and TERT promoter mutations [61,62]. Discrepancies between the methylation status of the MGMT promoter and the response to treatment in some patients may be due to a mismatch between MGMT methylation and expression levels in GB [63].
Cells of aggressive tumors, especially poorly differentiated ones [64,65], activate exocytosis with P-glycoprotein (P-gp) [66], which is expressed on the plasma membrane of endothelial cells in the blood-brain barrier. Overexpression of ABCB1 is correlated with low survival in patients with GB [67,68], and other data trace the correlation to longer survival in patients with high expression of ABCB1, but its prognostic significance hasn’t been identified [69]. Interestingly, in pancreatic and renal tumors, high expression of ABCB1 is a favorable prognostic factor. In M2 GB and M6 GB, the Abcb1 was overexpressed. It is possible that the increased expression of P-gp is caused in response to prolonged exposure of the carcinogen DMBA to cells in order to eliminate it [70]. P-gp expression is regulated by a number of signaling pathways, including PI3K/Akt. According to our data, Pi3k is overexpressed in M2 GB. Alterations in this gene have been detected in 17% of human GB [71]. Dysregulation of PI3K transforms tumors into more aggressive or recurrent disease, and this has been confirmed at the morphological level: malignant morphology and rapid growth in M2 GB are relatively higher than in M6 GB, which is a PI3K wild-type.
Expression levels of the Tp53 gene, encoding p53, a tumor suppressor and transcription factor that regulates P-gp expression and cell cycle, were elevated in M2 GB compared to intact brains, and conversely decreased in M6 GB. Low expression of the tumor suppressor gene Tp53 and increased expression of the Pi3k oncogene in M6 GB may be associated with a pronounced increase in the expression of Hif1a, Vegfa, Gdnf and Egfr. Loss of p53 promotes tumorigenesis in several CNS tumors, including GB (25-37%). In the giant cell type of GB, inactivating mutations in TP53 are more common, while Tp53 was overexpressed in M2 GB with giant cell morphology. Inactivating mutations in TP53 are also found in over 50% of IDH mutant astrocytoma and large cell medulloblastoma. Human H3K27M mutant diffuse midline gliomas are characterized by a high incidence of wild-type IDH, TP53 and ATRX mutations, and PDGFRA amplification compared to GB, while TERT promoter mutations and EGFR amplification are rare [61].
Mutations in the TP53 gene associated with loss p53 are associated with the development of various types of tumors [72]. Thus, missense mutations in TP53 are characteristic of gliomas with IDH mutations, resulting in the synthesis of proteins with altered structure and function, although the mutations may not affect the protein [61]. The gene for tumor suppressor, cell cycle regulator, p53 activator, and transcription factor – Cdkn2a is overexpressed in M2 GB and M6 GB. However, in contrast to our results, GB and grade 4 human astrocytoma are characterized by the presence of homozygous deletions of CDKN2A, which correlates with high proliferative activity of tumor cells and poor prognosis [73]. It has been reported that when non-tumor mouse cells are exposed to carcinogens, the levels of the tumor suppressor p53 increase [74]. Prion aggregation decreases p53 expression and may be associated with tumorigenesis [78]. It is speculated that the mutant p53 protein also has prion-like properties, folding into large aggregates, oligomers, and amyloid-like fibers that aggregate with the wild-type protein and lose their tumor suppressor function [76]. Lower levels of p53 promote stem cell formation and proliferation, whereas higher levels and activity of p53 promote stem cell differentiation [77]. Additionally, M6 GB may be a more differentiated tumor than M2 GB. Furthermore, the interaction of p53 with mitochondrial PPIF (Peptidylprolyl Isomerase F) has been shown to cause cell death through a necrosis [78], supporting our morphological studies in which necrosis was more pronounced and extensive in M2 GB than in M6 GB.
M2 GB and M6 GB have increased expression of the Sox2 gene, a stem cell transcription factor and marker of undifferentiated cells. Its overexpression is characteristic of various types of poorly differentiated tumors, including GB [79]. SOX2 has been shown to activate cell migration and chemotherapy resistance [80]. However, knockdown of SOX2 also leads to tumor invasion and treatment resistance. Sox2 is highly expressed in the neuroepithelium of the developing CNS and has been shown to function in neural stem cells. SOX2 is a well-studied pluripotency factor that is essential for stem cell self-renewal, reprogramming, and homeostasis [81]. GB and low-grade gliomas, like neural stem cells, have a cluster of SOX2 enhancers accessible and have a unique pattern of chromatin, which explains the high levels of tumor cell proliferation [82].
The tumor suppressor gene Pten is overexpressed in the M2 GB and M6 GB models. More than half of human GB cases [71] and 100% of cases of Cowden syndrome with pediatric brain tumors [61] are characterized by deficiency of PTEN. Overexpression of PTEN reduces the survival of human glioma cells, activates apoptosis, and impairs mitochondrial function [83]. Other data has shown that PTEN overexpression correlates with increased motility and an altered tumor cell phenotype related to stems [84], and is associated with increased motility in M2 GB and M6 GB, as confirmed by increased expression of Cd44 and Sox2 in M6 GB. Other studies have reported that overexpression of PTEN may enhance the effect of chemotherapy [85]. Despite the fact that the main mechanisms determining carcinogenesis are related to the suppression of tumor suppressor gene expression and activation of oncogenes, several studies have shown that overexpression of tumor suppressors can cause various types of tumors, including colorectal, breast, lymphoma, ovarian, and head and neck cancers, to progress and correlates with reduced survival [86,87], and these genes can be considered oncogenes. Overexpression of tumor suppressors in tumor cells is believed to be aimed at inhibiting their growth, causing the cells to return to a more differentiated state and tend to self-destruct [70]. PTEN suppresses the PI3K/AKT/mTOR signaling cascade that promotes tumor cell growth, however, in M2 GB and M6 GB we observe Pi3k activation in response to Pten overexpression. In melanoma, PTEN is often mutated with protein loss and correlates with decreased tumor T cell infiltration, resistance to targeted therapies, and immunotherapy, so PI3K inhibition may be effective [88]. In our study, however, M2 GB and M6 GB Pten was overexpressed, and tumor infiltration by T cells was pronounced.
Expression levels of the Mki67 gene, which encodes a nuclear protein associated with cell proliferation, were elevated in M2 GB and M6 GB, which correlated with the marked mitotic activity of the tumor cells. Methylation of the MGMT promoter inhibits the expression of genes encoding DNA repair enzymes, which is prognostically important in the treatment of GB with alkylating agents [61]. In M2 GB and M6 GB models, Mgmt expression was unaltered, suggesting a poor response to the alkylating cytotoxic agents. Thus, these GB models can be used to study the issue of resistance to alkylating agents and to develop effective antitumor therapies.
Vegfa and Hif1 are overexpressed in the M2 GB and M6 GB models, which is common in many tumor types. VEGFA is a growth factor, angiogenesis-promoting and angiogenesis-suppressing factor, involved in physiological and pathological angiogenesis, endothelial cell proliferation, and a vascular permeability and inflammation inducers [89]. Hif1 is used to predict tumor response to therapy. Receptors for many growth factors are usually constitutively active in tumors and are active even if the factor itself is basic and at low levels. Increased expression or activation of growth factor membrane receptors or their tyrosine kinase cascades in tumors is erroneously considered a stimulator of tumor growth. Although erroneously thought of as a factor, in reality, cells, thus 'attempt' to restore impaired regulation, leading to differentiation or death of dysregulated tumor cells [70].
GDNF is a neurotrophic factor of dopaminergic neurons, and its gene is overexpressed in M6 GB. The GDNF gene encodes a TGF-β ligand involved in the activation of the transcription factor SMAD, a cell cycle regulator [90]. Cd133, a marker of proliferating tumor stem cells in various solid tumors, was overexpressed in M2 GB. Literature indicates that the high number of CD133+ cells in a tumor correlates with resistance to chemotherapy and radiation therapy and poor survival [91]. Differentiated cells may also express CD133+ and CD133 negative cells may initiate tumor development [92].
Pdgfra was overexpressed in M2 GB. PDGFRA phosphorylates PIK3R1, resulting in cytosolic Ca2+ mobilization, activation of protein kinase C, AKT1, HRAS/MAPK/ERK, and STAT signaling pathways [93].
Protein S100b is a neurotrophic factor and one of the most abundant soluble proteins in the brain [94], its gene was overexpressed in M2 GB and M6 GB. S100b promotes astrocytosis and axon growth, binds weakly to Ca2+ but strongly to Zn2+. It is a potent regulator of many physiological and pathological processes. High serum S100b levels in glioma patients are a prognostic marker, and the S100 family regulates glioma stem cells and mediates epithelial-to-mesenchymal transition in GB [95].
All the genes we studied encode different protein isoforms. Alternative splicing of genes and the use of alternative promoters lead to an increase in transcript variants and isoforms [96,97]. Gene activity is affected by epigenetic changes, and post-translational modifications – phosphorylation, acetylation, methylation, hydroxymethylation, etc. [98]. Even with relatively high mRNA expression in tumor cells, post-transcriptional repression does not alter the protein at all [99]. Thus, future studies should reveal the composition of the proteins encoded by the genes we studied.
Thus, the carcinogen DMBA causes changes in brain tissue, initiates tumorigenesis through the formation of DNA adducts, alters the expression of genes related to angiogenesis, proliferation, invasion, development and differentiation, transcription factors and tumorigenesis, apoptosis, DNA replication, cytoskeleton, metabolism and cell-cell interactions [100], contributing to genomic instability and tumor progression. Subsequently, transplantation of tumor-associated macrophages and other microenvironments factors and cells into DMBA-induced tumor tissue may alter the genetic landscape of the tumor and contribute to malignant progression. According to gene expression profiles examined in M2 GB and M6 GB, tumor suppressor genes Pten, Cdkn2a, and in M2 GB Tp53 were over-activated. The changes in gene expression and the resultant tumor development suggest that the cells' compensatory response exposed to the carcinogen DMBA was unsuccessful. This compensatory response is intended to restore DNA integrity, inhibit the adverse effects of the carcinogen, inhibit cell proliferation, remove the carcinogen, and cause the abnormal tumor cells to die. The initial stages of chemical DMBA-induced tumorigenesis are characterized by nonproliferative changes, particularly the phenomenon of capsule formation [101], which is associated with the body's protective response to isolate itself from carcinogens. Tumor cells are cells of the body with impaired self-regulation that have the same remnants of genomic regulation as healthy cells. Most of the genes altered in tumors may be an adaptive response to carcinogenesis and an attempt to repair defects in DNA replication. Rather than striving for survival and replication, tumor cells use all of their retained capacity for DNA repair and self-induced death [70].
The use of intracerebral tissue models, such as M2 GB and M6 GB in immunocompetent mice, will allow us to obtain new data on carcinogenesis, diagnosis, and therapy of tumors. These models, along with the GB 101.8 rat tissue model from our collection, are pivotal in developing diagnostic tools [102,103,104], therapeutic strategies [105], and understanding the intricacies of carcinogenesis [106].
In our subsequent studies, we recommend examining the dynamics of tumor growth, conducting MRI studies, investigating the biology at the early stages of tumor development, assessing the impact of brain injury during tumor transplantation, studying gender and age characteristics, as well as observing changes in cellular composition during different periods of development. Separate expression of tumor cells and their microenvironmental cells. Compare the biology of our GB tissue models with standard GB cell models.
4. Conclusions
Experimental tissue models of M2 GB and M6 GB mimic tumorigenesis in humans, according to clinical data on this disease – cachexy, metabolic disturbances, tumor-associated coagulopathy; morphology: invasive aggressive growth, nuclear and cellular polymorphism, high mitotic activity, marked vascularization and necrosis. The marked infiltration of tumors by immune cells, which account for 50% of tumor tissue, and the altered expression of genes involved in tumorigenesis make them suitable models for further studies of carcinogenesis and anti-tumor therapy. Overexpression of the tumor suppressor genes – Cdkn2a and Pten, cellular transport – Abcb1, proliferation – Mki67, transcription factors – Hif1a, Sox2, neurotrophic factor – S100b, angiogenesis – Vegfa was found in both M2 GB and M6 GB. M6 GB showed increased expression of the gene of growth factor – Pdgfra, the differentiation factor – Cd133, and the tumor suppressor – Tp53, while M2 GB showed increased expression of the angiogenesis and differentiation factors – Pi3k, the glioma-association protein – Gfap, and the growth factor – Gdnf. In addition, mRNA expression of Cd44 – cell adhesion, Pi3k, Hif1a, Gdnf, and Egfr – proliferation differed between M2 GB and M6 GB, with higher expression in M6 GB than M2 GB, and lower expression of Cdkn2a, Tp53, Cd133 – differentiation, proliferation, apoptosis, and receptor of growth factor – Pdgfra in M6 GB than M2 GB.
Author Contributions
Conceptualization, V.K. and A.Kh.; methodology, A.A. and O.V.; formal analysis V.K.; investigation O.V., E.M. and A.K..; resources T.F..; writing – original draft preparation V.K.; writing – review and editing, A.K. and V.K. All authors have read and agreed to the published version of the manuscript.
Funding
This work was supported by the Ministry of Science and Higher Education of the Russian Federation within the framework of Agreement No. 075-15-2021-1356 (7 October 2021; internal No. of the Agreement – 15.SIN.21.0011; identifier RF0951.61321X0012) and internal No. of the Agreement 123030700107-4, cellular and molecular mechanisms of tumor progression.
Acknowledgments
The research was conducted using the scientific infrastructure 'Collection of Experimental Tumors of the Nervous System and Neural Tumor Cell Lines', supervised by Dr. A.M. Kosyreva.
Conflicts of Interest
The authors declare no conflict of interest.
References
- Wu: W.; Klockow, J.L.; Zhang, M.; Lafortune, F.; Chang, E.; Jin, L.; Wu, Y.; Daldrup-Link, H.E. Glioblastoma multiforme (GBM): An overview of current therapies and mechanisms of resistance. Pharmacological research 2021, 171, 105780. [CrossRef]
- McInnes, E.F. Background lesions in laboratory animals. A Color Atlas. Book. Elsevier Ltd., USA. 2011. [CrossRef]
- Lampreht Tratar, U.; Horvat, S.; Cemazar, M. Transgenic Mouse Models in Cancer Research. Frontiers in oncology 2018, 8, 268. [CrossRef]
- Ireson, C.R.; Alavijeh, M.S.; Palmer, A.M.; Fowler, E.R.; Jones, H.J. The role of mouse tumour models in the discovery and development of anticancer drugs. British journal of cancer 2019, 121, 2, 101–108. [CrossRef]
- Sahu, U.; Barth, R.F.; Otani, Y.; McCormack, R.; Kaur, B. Rat and Mouse Brain Tumor Models for Experimental Neuro-Oncology Research. Journal of neuropathology and experimental neurology 2022, 81(5), 312–329. [CrossRef]
- Haddad, A.F.; Young, J.S.; Amara, D.; Berger, M.S.; Raleigh, D.R.; Aghi, M.K.; Butowski, N.A. Mouse models of glioblastoma for the evaluation of novel therapeutic strategies. Neuro-oncology advances 2021, 3, 1, vdab100. [CrossRef]
- Lowenstein, P.R.; Castro, M.G. Uncertainty in the translation of preclinical experiments to clinical trials. Why do most phase III clinical trials fail? Current gene therapy 2009, 9, 5, 368–374. [CrossRef]
- Fogel, D.B. Factors associated with clinical trials that fail and opportunities for improving the likelihood of success: A review. Contemporary clinical trials communications 2018, 11, 156–164. [CrossRef]
- Mirzayans, R.; Murray, D. What Are the Reasons for Continuing Failures in Cancer Therapy? Are Misleading/Inappropriate Preclinical Assays to Be Blamed? Might Some Modern Therapies Cause More Harm than Benefit? International journal of molecular sciences 2022, 23, 21, 13217. [CrossRef]
- Arutyunyan, I.V.; Soboleva, A.G.; Kovtunov, E.A.; Kosyreva, A.M.; Kudelkina, V.V.; Alekseeva, A.I.; Elchaninov, A.V.; Jumaniyazova, E.D.; Goldshtein, D.V.; Bolshakova, G.B.; Fatkhudinov, T.K. Gene Expression Profile of 3D Spheroids in Comparison with 2D Cell Cultures and Tissue Strains of Diffuse High-Grade Gliomas. Bulletin of experimental biology and medicine 2023, 175, 4, 576–584. [CrossRef]
- Neuroscience for medicine and psychology: abstracts of reports XIX international interdisciplinary congress. Sudak, Russia, 2023, 34-35. [CrossRef]
- Paster, E.V.; Villines, K.A.; Hickman, D.L. Endpoints for mouse abdominal tumor models: refinement of current criteria. Comparative medicine 2009, 59, 3, 234–241.
- Fedoseeva, V.V.; Khalansky, A.S.; Mkhitarov, V.A.; Tsvetkov, I.S.; Malinovskaya, Y.A.; et al. Anti-tumor activity of doxorubicin-loaded poly(lactide-co-glycolide) nanoparticles in the experimental glioblastoma. Klini. i Eksperimental. Morfolog 2017, 2, 22, 65–71. http://www.stm-journal.ru/en/numbers/2018/4/1485/pdf.
- Pfaffl, M.W. A new mathematical model for relative quantification in real-time RT-PCR. Nucleic acids research 2001, 29(9), e45. [CrossRef]
- Vandesompele, J.; De Preter, K.; Pattyn, F.; Poppe, B.; Van Roy, N.; De Paepe, A.; Speleman, F. Accurate normalization of real-time quantitative RT-PCR data by geometric averaging of multiple internal control genes. Genome biology 2002, 3(7). [CrossRef]
- Goldman, O.; Adler, L.N.; Hajaj, E.; Croese, T.; Darzi, N.; Galai, S.; Tishler, H.; Ariav, Y.; Lavie, D.; Fellus-Alyagor, L.; Oren, R.; Kuznetsov, Y.; David, E.; Jaschek, R.; Stossel, C.; Singer, O.; Malitsky, S.; Barak, R.; Seger, R.; Erez, N.; Erez, A. Early Infiltration of Innate Immune Cells to the Liver Depletes HNF4α and Promotes Extrahepatic Carcinogenesis. Cancer discovery 2023, 13, 7, 1616–1635. [CrossRef]
- Law, M.L. Cancer cachexia: Pathophysiology and association with cancer-related pain. Frontiers in pain research (Lausanne, Switzerland) 2022, 3, 971295. [CrossRef]
- Olson, B.; Diba, P.; Korzun, T.; Marks, D.L. Neural Mechanisms of Cancer Cachexia. Cancers 2021, 13, 16, 3990. [CrossRef]
- Zhong, W.; Jina, H.; Rathore, P.; Wong, E.L.; Mancuso, P.; Lalak, N.; Hayden, L.; Haghighi, K. A Case Report of Priapism with unusual presentation and clinical course. Urology case reports 2017, 12, 70–72. [CrossRef]
- Shelton, L.M.; Mukherjee, P.; Huysentruyt, L.C.; Urits, I.; Rosenberg, J.A.; Seyfried, T.N. A novel pre-clinical in vivo mouse model for malignant brain tumor growth and invasion. Journal of neuro-oncology 2010, 99(2), 165–176. [CrossRef]
- Cui, P.; Shao, W.; Huang, C.; Wu, C.J.; Jiang, B.; Lin, D. Metabolic derangements of skeletal muscle from a murine model of glioma cachexia. Skeletal muscle 2019, 9(1), 3. [CrossRef]
- Monteiro, R.Q.; Lima, L.G.; Gonçalves, N.P.; DE Souza, M.R.; Leal, A.C.; Demasi, M.A.; Sogayar, M.C.; Carneiro-Lobo, T.C. Hypoxia regulates the expression of tissue factor pathway signaling elements in a rat glioma model. Oncology letters 2016, 12(1), 315–322. [CrossRef]
- Onizuka, H.; Masui, K.; Komori, T. Diffuse gliomas to date and beyond 2016 WHO Classification of Tumours of the Central Nervous System. International journal of clinical oncology 2020, 25(6), 997–1003. [CrossRef]
- Himes, B.T.; Geiger, P. A.; Ayasoufi, K.; Bhargav, A.G.; Brown, D.A.; Parney, I.F. Immunosuppression in Glioblastoma: Current Understanding and Therapeutic Implications. Frontiers in oncology 2021, 11, 770561. [CrossRef]
- Alghamri, M.S.; McClellan, B.L.; Hartlage, C.S.; Haase, S.; Faisal, S.M.; Thalla, R.; Dabaja, A.; Banerjee, K.; Carney, S.V.; Mujeeb, A.A.; Olin, M.R.; Moon, J.J.; Schwendeman, A.; Lowenstein, P.; Castro, M.G. Targeting Neuroinflammation in Brain Cancer: Uncovering Mechanisms, Pharmacological Targets, and Neuropharmaceutical Developments. Frontiers in pharmacology 2021, 12, 680021. [CrossRef]
- Andersen, J.K.; Miletic, H.; Hossain, J.A. Tumor-Associated Macrophages in Gliomas-Basic Insights and Treatment Opportunities. Cancers 2022, 14, 5, 1319. [CrossRef]
- Georgieva, P.B.; Mathivet, T.; Alt, S.; Giese, W.; Riva, M.; Balcer, M.; Gerhardt, H. Long-lived tumor-associated macrophages in glioma. Neuro-oncology advances 2020, 2(1), vdaa127. [CrossRef]
- Rodrigues, L.F.; Camacho, A.H.D.S.; Spohr, T.C.L.S.E. Secondary glioblastoma metastasis outside the central nervous system in a young HIV-infected patient. Therapeutic advances in medical oncology 2020, 12, 1758835920923432. [CrossRef]
- Chongsathidkiet, P.; Jackson, C.; Koyama, S.; Loebel, F.; Cui, X.; Farber, S.H.; Woroniecka, K.; Elsamadicy, A.A.; Dechant, C.A.; Kemeny, H.R.; Sanchez-Perez, L.; Cheema, T.A.; Souders, N.C.; Herndon, J.E.; Coumans, J.V.; Everitt, J.I.; Nahed, B.V.; Sampson, J.H.; Gunn, M.D.; Martuza, R.L.; Fecci, P.E. Sequestration of T cells in bone marrow in the setting of glioblastoma and other intracranial tumors. Nature medicine 2018, 24(9), 1459–1468. [CrossRef]
- Sanchez, V.E.; Lynes, J.P.; Walbridge, S.; Wang, X.; Edwards, N.A.; Nwankwo, A.K.; Sur, H.P.; Dominah, G.A.; Obungu, A.; Adamstein, N.; Dagur, P.K.; Maric, D.; Munasinghe, J.; Heiss, J.D.; Nduom, E.K. GL261 luciferase-expressing cells elicit an anti-tumor immune response: an evaluation of murine glioma models. Scientific reports 2020, 10(1), 11003, . [CrossRef]
- Akkari, L.; Bowman, R.L.; Tessier, J.; Klemm, F.; Handgraaf, S.M.; de Groot, M.; Quail, D.F.; Tillard, L.; Gadiot, J.; Huse, J.T.; Brandsma, D.; Westerga, J.; Watts, C.; Joyce, J.A. Dynamic changes in glioma macrophage populations after radiotherapy reveal CSF-1R inhibition as a strategy to overcome resistance. Science translational medicine 2020, 12(552), eaaw7843. [CrossRef]
- Maire, C.L.; Mohme, M.; Bockmayr, M.; Fita, K.D.; Riecken, K.; Börnigen, D.; Alawi, M.; Failla, A.; Kolbe, K.; Zapf, S.; Holz, M.; Neumann, K.; Dührsen, L.; Lange, T.; Fehse, B.; Westphal, M.; Lamszus, K. Glioma escape signature and clonal development under immune pressure. The Journal of clinical investigation 2020, 130(10), 5257–5271. [CrossRef]
- Brown, C.E.; Hibbard, J.C.; Alizadeh, D.; Blanchard, M.S.; Natri, H.M.; Wang, D.; Ostberg, J.R.; Aguilar, B.; Wagner, J.R.; Paul, J.A.; Starr, R., Wong, R.A.; Chen, W.; Shulkin, N.; Aftabizadeh, M.; Filippov, A.; Chaudhry, A.; Ressler, J.A.; Kilpatrick, J.; Myers-McNamara, P.; Badie, B. Locoregional delivery of IL-13Rα2-targeting CAR-T cells in recurrent high-grade glioma: a phase 1 trial. Nature medicine 2024, 30(4), 1001–1012. [CrossRef]
- Sobhani, N.; Bouchè, V.; Aldegheri, G.; Rocca, A.; D'Angelo, A.; Giudici, F.; Bottin, C.; Donofrio, C.A.; Pinamonti, M.; Ferrari, B.; Panni, S.; Cominetti, M.; Aliaga, J.; Ungari, M.; Fioravanti, A.; Zanconati, F.; Generali, D. Analysis of PD-L1 and CD3 Expression in Glioblastoma Patients and Correlation with Outcome: A Single Center Report. Biomedicines 2023, 11(2), 311. [CrossRef]
- van Hooren, L.; Handgraaf, S.M.; Kloosterman, D.J.; Karimi, E.; van Mil, L.W.H.G.; Gassama, A.A.; Solsona, B.G.; de Groot, M.H.P.; Brandsma, D.; Quail, D.F.; Walsh, L.A.; Borst, G.R.; Akkari, L. CD103+ regulatory T cells underlie resistance to radio-immunotherapy and impair CD8+T cell activation in glioblastoma. Nature cancer 2023, 4(5), 665–681. [CrossRef]
- Musca, B.; Russo, M.G.; Tushe, A.; Magri, S.; Battaggia, G.; Pinton, L.; Bonaudo, C.; Della Puppa, A.; Mandruzzato, S. The immune cell landscape of glioblastoma patients highlights a myeloid-enriched and immune suppressed microenvironment compared to metastatic brain tumors. Frontiers in immunology 2023, 14, 1236824. [CrossRef]
- Enríquez Pérez, J.; Kopecky, J.; Visse, E.; Darabi, A.; Siesjö, P. Convection-enhanced delivery of temozolomide and whole cell tumor immunizations in GL261 and KR158 experimental mouse gliomas. BMC cancer 2020, 20(1), 7. [CrossRef]
- Wang, S.C.; Hong, J.H.; Hsueh, C.; Chiang, C.S. Tumor-secreted SDF-1 promotes glioma invasiveness and TAM tropism toward hypoxia in a murine astrocytoma model. Laboratory investigation; a journal of technical methods and pathology 2012, 92(1), 151–162. [CrossRef]
- Kamran, N.; Kadiyala, P.; Saxena, M.; Candolfi, M.; Li, Y.; Moreno-Ayala, M.A.; Raja, N.; Shah, D.; Lowenstein, P.R.; Castro, M.G. Immunosuppressive Myeloid Cells' Blockade in the Glioma Microenvironment Enhances the Efficacy of Immune-Stimulatory Gene Therapy. Molecular therapy: the journal of the American Society of Gene Therapy 2017, 25(1), 232–248. [CrossRef]
- Inoue, A.; Ohnishi, T.; Nishikawa, M.; Watanabe, H.; Kusakabe, K.; Taniwaki, M.; Yano, H.; Ohtsuka, Y.; Matsumoto, S.; Suehiro, S.; et al. Identification of CD44 as a Reliable Biomarker for Glioblastoma Invasion: Based on Magnetic Resonance Imaging and Spectroscopic Analysis of 5-Aminolevulinic Acid Fluorescence. Biomedicines 2023, 11, 2369. [CrossRef]
- Wang, L.J.; Lv, P.; Lou, Y. Alarm Signal S100-Related Signature Is Correlated with Tumor Microenvironment and Predicts Prognosis in Glioma. Disease markers 2022, 4968555. [CrossRef]
- Yuan, Q.; Zuo, F.X.; Cai, H.Q.; Qian, H.P.; Wan, J.H. Identifying Differential Expression Genes and Prognostic Signature Based on Subventricular Zone Involved Glioblastoma. Frontiers in genetics 2022, 13, 912227. [CrossRef]
- Luo, X.; Xu, S.; Zhong, Y.; Tu, T.; Xu, Y.; Li, X.; Wang, B.; Yang, F. High gene expression levels of VEGFA and CXCL8 in the peritumoral brain zone are associated with the recurrence of glioblastoma: A bioinformatics analysis. Oncology letters 2019, 18(6), 6171–6179. [CrossRef]
- Liu, W.; Lv, G.; Li, Y.; Li, L.; Wang, B. Downregulation of CDKN2A and suppression of cyclin D1 gene expressions in malignant gliomas. Journal of experimental & clinical cancer research: CR 2011, 30(1), 76. [CrossRef]
- Shiraishi, S.; Tada, K.; Nakamura, H.; Makino, K.; Kochi, M.; Saya, H.; Kuratsu, J.; Ushio, Y. Influence of p53 mutations on prognosis of patients with glioblastoma. Cancer 2002, 95(2), 249–257. [CrossRef]
- Dahlrot, R.H.; Bangsø, J.A.; Petersen, J.K.; Rosager, A.M.; Sørensen, M.D.; Reifenberger, G.; Hansen, S.; Kristensen, B.W. Prognostic role of Ki-67 in glioblastomas excluding contribution from non-neoplastic cells. Scientific reports 2021, 11(1), 17918. [CrossRef]
- Hashemi, M.; Etemad, S.; Rezaei, S.; Ziaolhagh, S.; Rajabi, R.; Rahmanian, P.; Abdi, S.; Koohpar, Z.K.; Rafiei, R.; Raei, B.; Ahmadi, F.; Salimimoghadam, S.; Aref, A.R.; Zandieh, M.A.; Entezari, M.; Taheriazam, A.; Hushmandi, K. Progress in targeting PTEN/PI3K/Akt axis in glioblastoma therapy: Revisiting molecular interactions. Biomedicine & pharmacotherapy = Biomedecine & pharmacotherapie 2023, 158, 114204. [CrossRef]
- Sfifou, F.; Hakkou, E.M.; Bouaiti, E.A.; Slaoui, M.; Errihani, H.; Al Bouzidi, A.; Abouqal, R.; El Ouahabi, A.; Cherradi, N. Correlation of immunohistochemical expression of HIF-1alpha and IDH1 with clinicopathological and therapeutic data of moroccan glioblastoma and survival analysis. Annals of medicine and surgery 2021, 69, 102731. [CrossRef]
- Yu, W.; Ren, X.; Hu; C.; Tan, Y.; Shui, Y.; Chen, Z.; Zhang, L.; Peng, J.; Wei, Q. Glioma SOX2 expression decreased after adjuvant therapy. BMC cancer 2019, 19(1), 1087. [CrossRef]
- Abdoli Shadbad, M.; Nejadi Orang, F.; Baradaran, B. CD133 significance in glioblastoma development: in silico and in vitro study. European journal of medical research 2024, 29(1), 154. [CrossRef]
- Farsi, Z.; Allahyari Fard, N. The identification of key genes and pathways in glioblastoma by bioinformatics analysis. Molecular & cellular oncology 2023, 10(1), 2246657. [CrossRef]
- Yu, Z.; Li, H.; Wang, M.; Luo, W.; Xue, Y. GDNF regulates lipid metabolism and glioma growth through RET/ERK/HIF-1/SREBP-1. International journal of oncology 2022, 61(3), 109. [CrossRef]
- Szylberg, M.; Sokal, P.; Śledzińska, P.; Bebyn, M.; Krajewski, S.; Szylberg, Ł.; Szylberg, A.; Szylberg, T.; Krystkiewicz, K.; Birski, M.; Harat, M.; Włodarski, R.; Furtak, J. MGMT Promoter Methylation as a Prognostic Factor in Primary Glioblastoma: A Single-Institution Observational Study. Biomedicines 2022, 10(8), 2030. [CrossRef]
- Roy, L.O.; Lemelin, M.; Blanchette, M.; Poirier, M.B.; Aldakhil, S.; Fortin, D. Expression of ABCB1, ABCC1 and 3 and ABCG2 in glioblastoma and their relevance in relation to clinical survival surrogates. Journal of neuro-oncology 2022, 160(3), 601–609. [CrossRef]
- Ahmadipour, Y.; Gembruch, O.; Pierscianek, D.; Sure, U.; Jabbarli, R. Does the expression of glial fibrillary acid protein (GFAP) stain in glioblastoma tissue have a prognostic impact on survival? Neuro-Chirurgie 2020, 66(3), 150–154. [CrossRef]
- Dhawan, A.; Manem, V.S.K.; Yeaney, G.; Lathia, J.D.; Ahluwalia, M.S. EGFR Pathway Expression Persists in Recurrent Glioblastoma Independent of Amplification Status. Cancers 2023, 15(3), 670. [CrossRef]
- Nasti, T.H.; Cochran, J.B.; Tsuruta, Y.; Yusuf, N.; McKay, K.M.; Athar, M.; Timares, L.; Elmets, C.A. A murine model for the development of melanocytic nevi and their progression to melanoma. Molecular carcinogenesis 2016, 55, 5, 646–658. [CrossRef]
- Todorova, V.K.; Kaufmann, Y.; Luo, S.; Klimberg, V.S. Modulation of p53 and c-myc in DMBA-induced mammary tumors by oral glutamine. Nutrition and cancer 2006, 54, 2, 263–273. [CrossRef]
- Fidianingsih, I.; Aryandono, T.; Widyarini, S.; Herwiyanti, S. Profile of Histopathological Type and Molecular Subtypes of Mammary Cancer of DMBA-induced Rat and its Relevancy to Human Breast Cancer. Open Access Macedonian Journal of Medical Sciences 2022, 10, A, 71–78. [CrossRef]
- Robbins, D.; Wittwer, J.A.; Codarin, S.; Circu, M.L.; Aw, T.Y.; Huang, T.T.; Van Remmen, H.; Richardson, A.; Wang, D.B.; Witt, S.N.; Klein, R. L.; Zhao, Y. Isocitrate dehydrogenase 1 is downregulated during early skin tumorigenesis which can be inhibited by overexpression of manganese superoxide dismutase. Cancer science 2012, 103, 8, 1429–1433. [CrossRef]
- Mallick, S. Evidence based practice in Neuro-oncology ISBN 978-981-16-2658-6 ISBN 978-981-16-2659-3. Springer Nature 2021, Singapore. Pte Ltd. [CrossRef]
- Marker, D.F.; Agnihotri, S.; Amankulor, N.; Murdoch, G.H.; Pearce, T.M. The dominant TP53 hotspot mutation in IDH -mutant astrocytoma, R273C, has distinctive pathologic features and sex-specific prognostic implications. Neuro-oncology advances 2021, 4, 1, vdab182. [CrossRef]
- Butler, M.; Pongor, L.; Su, Y.T.; Xi, L.; Raffeld, M.; Quezado, M.; Trepel, J.; Aldape, K.; Pommier, Y.; Wu, J. MGMT Status as a Clinical Biomarker in Glioblastoma. Trends in cancer 2020, 6(5), 380–391. [CrossRef]
- Ohtsuki, S.; Kamoi, M.; Watanabe, Y.; Suzuki, H.; Hori, S.; Terasaki, T. Correlation of induction of ATP binding cassette transporter A5 (ABCA5) and ABCB1 mRNAs with differentiation state of human colon tumor. Biological & pharmaceutical bulletin 2007, 30, 6, 1144–1146. [CrossRef]
- Oda, Y.; Saito, T.; Tateishi, N.; Ohishi, Y.; Tamiya, S.; Yamamoto, H.; Yokoyama, R.; Uchiumi, T.; Iwamoto, Y.; Kuwano, M.; Tsuneyoshi, M. ATP-binding cassette superfamily transporter gene expression in human soft tissue sarcomas. International journal of cancer 2005, 114(6), 854–862. [CrossRef]
- Ahmed, S.; Khan, H.; Aschner, M.; Mirzae, H.; Küpeli Akkol, E.; Capasso, R. Anticancer Potential of Furanocoumarins: Mechanistic and Therapeutic Aspects. International journal of molecular sciences 2020, 21, 16, 5622. [CrossRef]
- Robey, R.W.; Massey, P.R.; Amiri-Kordestani, L.; Bates, S.E. ABC transporters: unvalidated therapeutic targets in cancer and the CNS. Anti-cancer agents in medicinal chemistry 2010, 10(8), 625–633. [CrossRef]
- Amiri-Kordestani, L.; Basseville, A.; Kurdziel, K.; Fojo, A. T.; Bates, S.E. Targeting MDR in breast and lung cancer: discriminating its potential importance from the failure of drug resistance reversal studies. Drug resistance updates: reviews and commentaries in antimicrobial and anticancer chemotherapy 2012, 15, 1-2, 50–61. [CrossRef]
- Uhlén, M.; Fagerberg, L.; Hallström, B.M.; Lindskog, C.; Oksvold, P.; Mardinoglu, A.; Sivertsson, Å.; Kampf, C.; Sjöstedt, E.; Asplund, A.; Olsson, I.; Edlund, K.; Lundberg, E.; Navani, S.; Szigyarto, C.A.; Odeberg, J.; Djureinovic, D.; Takanen, J.O.; Hober, S.; Alm, T.; Pontén, F. Proteomics. Tissue-based map of the human proteome. Science (New York, N.Y.) 2015, 347, 6220, 1260419. [CrossRef]
- Suba, Z. Rosetta Stone for Cancer Cure: Comparison of the Anticancer Capacity of Endogenous Estrogens, Synthetic Estrogens and Antiestrogens. Oncology reviews 2023, 17, 10708. [CrossRef]
- Padovan, M.; Maccari, M.; Bosio, A.; De Toni, C.; Vizzaccaro, S.; Cestonaro, I.; Corrà, M.; Caccese, M.; Cerretti, G.; Zagonel, V.; Lombardi, G. Actionable molecular alterations in newly diagnosed and recurrent IDH1/2 wild-type glioblastoma patients and therapeutic implications: a large mono-institutional experience using extensive next-generation sequencing analysis. European journal of cancer (Oxford, England: 1990) 2023, 191, 112959. [CrossRef]
- Huszno, J.; Grzybowska, E. TP53 mutations and SNPs as prognostic and predictive factors in patients with breast cancer. Oncology letters 2018, 16, 1, 34–40. [CrossRef]
- Robertson, L.B.; Armstrong, G.N.; Olver, B.D.; Lloyd, A.L.; Shete, S.; Lau, C.; Claus, E.B.; Barnholtz-Sloan, J.; Lai, R.; Il'yasova, D.; Schildkraut, J.; Bernstein, J.L.; Olson, S.H.; Jenkins, R.B.; Yang, P.; Rynearson, A.L.; Wrensch, M.; McCoy, L.; Wienkce, J.K.; McCarthy, B.; Houlston, R.S. Survey of familial glioma and role of germline p16INK4A/p14ARF and p53 mutation. Familial cancer 2010, 9, 3, 413–421. [CrossRef]
- Maltzman, W.; Czyzyk, L. UV irradiation stimulates levels of p53 cellular tumor antigen in nontransformed mouse cells. Molecular and cellular biology 1984, 4, 9, 1689–1694. [CrossRef]
- Park, S.K.; Park, S.; Pentek, C.; Liebman, S.W. Tumor suppressor protein p53 expressed in yeast can remain diffuse, form a prion, or form unstable liquid-like droplets. iScience 2020, 24, 1, 102000. [CrossRef]
- Navalkar, A.; Ghosh, S.; Pandey, S.; Paul, A.; Datta, D.; Maji, S.K. Prion-like p53 Amyloids in Cancer. Biochemistry 2020, 59, 2, 146–155. [CrossRef]
- Levine, A.J.; Puzio-Kuter, A.M.; Chan, C.S.; Hainaut, P. The Role of the p53 Protein in Stem-Cell Biology and Epigenetic Regulation. Cold Spring Harbor perspectives in medicine 2016, 6(9), a026153. [CrossRef]
- Hill, K.A.; Sommer, S.S. p53 as a mutagen test in breast cancer. Environmental and molecular mutagenesis 2002, 39, 2-3, 216–227. [CrossRef]
- Mirzaei, S.; Paskeh, M.D.A.; Entezari, M.; Mirmazloomi, S.R.; Hassanpoor, A.; Aboutalebi, M.; Rezaei, S.; Hejazi, E.S.; Kakavand, A.; Heidari, H.; Salimimoghadam, S.; Taheriazam, A.; Hashemi, M.; Samarghandian, S. SOX2 function in cancers: Association with growth, invasion, stemness and therapy response. Biomedicine & pharmacotherapy = Biomedecine & pharmacotherapie 2022, 156, 113860. [CrossRef]
- Zhu, Y.; Huang, S.; Chen, S.; Chen, J.; Wang, Z.; Wang, Y.; Zheng, H. SOX2 promotes chemoresistance, cancer stem cells properties, and epithelial-mesenchymal transition by β-catenin and Beclin1/autophagy signaling in colorectal cancer. Cell death & disease 2021, 12, 5, 449. [CrossRef]
- Zhang, S.; Xiong, X.; Sun, Y. Functional characterization of SOX2 as an anticancer target. Signal transduction and targeted therapy 2020, 5, 135. [CrossRef]
- Abatti, L.E.; Lado-Fernández, P.; Huynh, L.; Collado, M.; Hoffman, M. M.; Mitchell, J.A. Epigenetic reprogramming of a distal developmental enhancer cluster drives SOX2 overexpression in breast and lung adenocarcinoma. Nucleic acids research 2023, 51, 19, 10109–10131. [CrossRef]
- Bao, L.; Li, X.; Lin, Z. PTEN overexpression promotes glioblastoma death through triggering mitochondrial division and inactivating the Akt pathway. Journal of receptor and signal transduction research 2019, 39, 3, 215–225. [CrossRef]
- Yokoi, A.; Minami, M.; Hashimura, M.; Oguri, Y.; Matsumoto, T.; Hasegawa, Y.; Nakagawa, M.; Ishibashi, Y.; Ito, T.; Ohhigata, K.; Harada, Y.; Fukagawa, N.; Saegusa, M. PTEN overexpression and nuclear β-catenin stabilization promote morular differentiation through induction of epithelial-mesenchymal transition and cancer stem cell-like properties in endometrial carcinoma. Cell communication and signaling: CCS 2022, 20, 1, 181. [CrossRef]
- Li, B.; Zhang, J.; Su, Y.; Hou, Y.; Wang, Z.; Zhao, L.; Sun, S.; Fu, H. Overexpression of PTEN may increase the effect of pemetrexed on A549 cells via inhibition of the PI3K/AKT/mTOR pathway and carbohydrate metabolism. Molecular medicine reports 2019, 20, 4, 3793–3801. [CrossRef]
- Romagosa, C.; Simonetti, S.; López-Vicente, L.; Mazo, A.; Leonart, M.E.; Castellvi, J.; Ramon y Cajal, S. p16(Ink4a) overexpression in cancer: a tumor suppressor gene associated with senescence and high-grade tumors. Oncogene 2011, 30, 18, 2087–2097. [CrossRef]
- Yehia, L.; Keel, E.; Eng, C. The Clinical Spectrum of PTEN Mutations. Annual review of medicine 2020, 71, 103–116. [CrossRef]
- Cabrita, R.; Mitra, S.; Sanna, A.; Ekedahl, H.; Lövgren, K.; Olsson, H.; Ingvar, C.; Isaksson, K.; Lauss, M.; Carneiro, A.; Jönsson, G. The Role of PTEN Loss in Immune Escape, Melanoma Prognosis and Therapy Response. Cancers 2020, 12, 3, 742. [CrossRef]
- Pentheroudakis, G.; Mavroeidis, L.; Papadopoulou, K.; Koliou, G.A.; Bamia, C.; Chatzopoulos, K.; Samantas, E.; Mauri, D.; Efstratiou, I.; Pectasides, D.; Makatsoris, T.; Bafaloukos, D.; Papakostas, P.; Papatsibas, G.; Bombolaki, I.; Chrisafi, S.; Kourea, H.P.; Petraki, K.; Kafiri, G.; Fountzilas, G.; Kotoula, V. Angiogenic and Antiangiogenic VEGFA Splice Variants in Colorectal Cancer: Prospective Retrospective Cohort Study in Patients Treated With Irinotecan-Based Chemotherapy and Bevacizumab. Clinical colorectal cancer 2019, 18, 4, e370–e384. [CrossRef]
- GDNF glial cell derived neurotrophic factor https://www.ncbi.nlm.nih.gov/gene/2668 (available 26.05.24).
- Vora, P.; Venugopal, C.; Salim, S.K.; Tatari, N.; Bakhshinyan, D.; Singh, M.; Seyfrid, M.; Upreti, D.; Rentas, S.; Wong, N.; Williams, R.; Qazi, M.A.; Chokshi, C.; Ding, A.; Subapanditha, M.; Savage, N.; Mahendram, S.; Ford, E.; Adile, A.A.; McKenna, D.; Singh, S. The Rational Development of CD133-Targeting Immunotherapies for Glioblastoma. Cell stem cell 2020, 26, 6, 832–844.e6. [CrossRef]
- Irollo, E.; Pirozzi, G. CD133: to be or not to be, is this the real question?.American journal of translational research 2013, 5, 6, 563–581.
- Razmara, M.; Heldin, CH.; Lennartsson, J. Platelet-derived growth factor-induced Akt phosphorylation requires mTOR/Rictor and phospholipase C-γ1, whereas S6 phosphorylation depends on mTOR/Raptor and phospholipase D. Cell Commun Signal 2013, 11, 3. [CrossRef]
- Ostendorp, T.; Diez, J.; Heizmann, C.W.; Fritz, G. The crystal structures of human S100B in the zinc- and calcium-loaded state at three pH values reveal zinc ligand swapping. Biochimica et biophysica acta 2011, 1813, 5, 1083–1091. [CrossRef]
- Wang, H.; Mao, X.; Ye, L.; Cheng, H.; Dai, X. The Role of the S100 Protein Family in Glioma. Journal of Cancer 2022, 13, 10, 3022–3030. [CrossRef]
- Yin, Y.; Stephen, C.W.; Luciani, M.G.; Fåhraeus, R. p53 Stability and activity is regulated by Mdm2-mediated induction of alternative p53 translation products. Nature cell biology 2002, 4, 6, 462–467. [CrossRef]
- Marcel, V.; Perrier, S.; Aoubala, M.; Ageorges, S.; Groves, M.J.; Diot, A.; Fernandes, K.; Tauro, S.; Bourdon, J.C. Δ160p53 is a novel N-terminal p53 isoform encoded by Δ133p53 transcript. FEBS letters 2010, 584, 21, 4463–4468. [CrossRef]
- Pienkowski, T., Kowalczyk, T., Cysewski, D., Kretowski, A., Ciborowski, M. Glioma and post-translational modifications: A complex relationship. Biochimica et biophysica acta. Reviews on cancer 2023, 1878(6), 189009. [CrossRef]
- Perl, K.; Ushakov, K.; Pozniak, Y.; Yizhar-Barnea, O.; Bhonker, Y.; Shivatzki, S.; Geiger, T.; Avraham, K.B.; Shamir, R. Reduced changes in protein compared to mRNA levels across non-proliferating tissues. BMC genomics 2017, 18, 1, 305. [CrossRef]
- Plante I. Dimethylbenz(a)anthracene-induced mammary tumorigenesis in mice. Methods in cell biology 2021, 163, 21–44. [CrossRef]
- Avtsyn A.P. Staroe i novoe v uchenii o predglome [Old and new concepts in the teaching on preglioma]. Arkhiv patologii 1972, 34(11), 3–11.
- Kucheryavenko, A.S.; Chernomyrdin, N.V.; Gavdush, A.A.; Alekseeva, A.I.; Nikitin, P.V.; Dolganova, I.N.; Karalkin, P.A.; Khalansky, A.S.; Spektor, I.E.; Skorobogatiy, M.; Tuchin, V.V.; Zaytsev, K.I. tissue heterogeneity. Biomedical optics express 2021, 12(8), 5272–5289. [CrossRef]
- Dolganova, I.N.; Aleksandrova, P.V.; Nikitin, P.V.; Alekseeva, A.I.; Chernomyrdin, N.V.; Musina, G.R.; Beshplav, S.T.; Reshetov, I.V.; Potapov, A.A.; Kurlov, V.N.; Tuchin, V.V.; Zaytsev, K.I. Capability of physically reasonable OCT-based differentiation between intact brain tissues, human brain gliomas of different WHO. grades, and glioma model 101.8 from rats. Biomedical optics express 2020, 11(11), 6780–6798. [CrossRef]
- Kiseleva, E.B.; Yashin, K.S.; Moiseev, A.A.; Timofeeva, L.B.; Kudelkina, V.V.; Alekseeva, A.I.; Meshkova, S.V.; Polozova, A.V.; Gelikonov, G.V.; Zagaynova, E.V.; Gladkova, N.D. Optical coefficients as tools for increasing the optical coherence tomography contrast for normal brain visualization and glioblastoma detection. Neurophotonics 2019, 6(3), 035003. [CrossRef]
- Maksimenko, O.; Malinovskaya, J.; Shipulo, E.; Osipova, N.; Razzhivina, V.; Arantseva, D.; Yarovaya, O.; Mostovaya, U.; Khalansky, A.; Fedoseeva, V.; Alekseeva, A.; Vanchugova, L.; Gorshkova, M.; Kovalenko, E.; Balabanyan, V.; Melnikov, P.; Baklaushev, V.; Chekhonin, V.; Kreuter, J.; Gelperina, S. International journal of pharmaceutics 2019, 572, 118733. [CrossRef]
- Dzhalilova, D.S.; Zolotova, N.A.; Mkhitarov, V.A.; Kosyreva, A.M.; Tsvetkov, I.S.; Khalansky, A.S.; Alekseeva, A.I.; Fatkhudinov, T.H.; Makarova, O.V. Morphological and molecular-biological features of glioblastoma progression in tolerant and susceptible to hypoxia Wistar rats. Scientific reports 2023, 13(1), 12694. [CrossRef]
Disclaimer/Publisher’s Note: The statements, opinions and data contained in all publications are solely those of the individual author(s) and contributor(s) and not of MDPI and/or the editor(s). MDPI and/or the editor(s) disclaim responsibility for any injury to people or property resulting from any ideas, methods, instructions or products referred to in the content. |
© 2024 by the authors. Licensee MDPI, Basel, Switzerland. This article is an open access article distributed under the terms and conditions of the Creative Commons Attribution (CC BY) license (http://creativecommons.org/licenses/by/4.0/).
Copyright: This open access article is published under a Creative Commons CC BY 4.0 license, which permit the free download, distribution, and reuse, provided that the author and preprint are cited in any reuse.


