1. Introduction
The major function of the fixed offshore platforms in the Gulf of Mexico is the extraction of hydrocarbons, producing about 1.718 million barrels of oil daily [
1]. These production volumes place Mexico as one of the most important oil-producing countries in the world; crude oil exports reach 831 thousands of barrels per day [
2], with a value of 1,715 million dollars [
3].
The country of Mexico was facing a drop in its oil production, it was in 2019 that it stopped it; Pemex’s General Strategy for Exploration and Production of Oil and Gas set as strategic objective 3.1 to accelerate the development of new recently discovered fields, expecting a production of liquids by new fields of 554 thousand barrels per day, to this goal is added point 2.3 of accelerating the recovery of mature and new wells, having as main goal for the year 2027 to reach a total hydrocarbon production of 2,319 million barrels per day [
4], due to the above arises the need to install new drilling platforms, both in existing and future fields. In terms of civil engineering, the design and construction of structures on which exploitation and production work can be carried out has been one of the great problems to be solved, under the premise of economy and security.
The analysis, design and construction of offshore platforms is a very demanding and specialized task for a civil engineer, these structures, being in the sea, face difficult loads such as hurricanes (16 mts waves), earthquakes, drilling equipment loads (5,000 ton), hydrostatic collapse of the elements because of hydrostatic pressure and fatigue in tubular joints produced by the waves over the years, making it a difficult problem to solve; In view of the need of Mexico and the world to continue installing such structures at sea, currently in the literature there are books such as Ageing and Life Extension of Offshore Structures [
5]. In previous discussions introducing new physical concepts such as the analysis and design of offshore platforms, we aimed to outline the key characteristics of the equations used to mathematically formulate these ideas, referencing works [
6,
7,
8,
9,
10,
11,
12,
13,
14,
15,
16,
17,
18,
19,
20] only briefly.
These analyzes are based on what is mentioned in section 9.3.2.2 of the Pemex technical specification [
21], where the analyzes prepared in this document are indicated.
The structural integrity of offshore jacket structures has been extensively studied, with numerous papers highlighting that the concept is more complex than initially assumed. Key challenges identified include the nonlinearity effects in structural integrity monitoring methods for offshore jacket-type structures, specifically those based on principal component analysis. To address this, a stochastic autoregressive moving average with exogenous input (ARMAX) model was employed [
9]. Additionally, the stress concentration factors (SCFs) induced by out-of-plane bending loads in ring-stiffened tubular KT-joints of jacket structures have been examined, leading to the development of a new set of SCF parametric formulas for the fatigue design of ring-stiffened KT-joints under such loads [
22,
23]. In ship structural integrity, new stiffened plates were introduced with the aim of enhancing the strength-to-weight ratio [
24]. For indirect damage detection in jacket-type offshore platforms, using the rate of signal energy via wavelet packet transform has proven effective in accurately predicting damage location [
25]. Furthermore, a proposed time-domain fatigue analysis method, when compared to spectral fatigue assessment, has demonstrated that analyzing only a limited number of sea states is necessary to achieve an accurate solution for an offshore jacket structure [
26]. Lastly, the Damage Submatrices Method, which focuses on stiffness degradation, has been applied to detect damage in offshore jacket platforms with limited modal information, successfully identifying damaged elements [
27].
Another reported approach involves assessing the structural integrity of ageing offshore jacket structures for life extension, offering recommendations for simulating structural degradation, loading history, and fatigue strength for corroded components [
12]. Some researchers suggest conducting parametric studies on the structural behavior of tubular K-joints under axial loading at fire-induced elevated temperatures through nonlinear regression analyses to determine the ultimate strength of K-joints under balanced axial loads at such temperatures [
28].
In addition to previous research efforts, a comprehensive wave analysis framework has been meticulously proposed to facilitate the probabilistic assessment of structural integrity specifically pertaining to offshore platforms, thereby enhancing our understanding of the dynamic interactions between waves and structural components. This sophisticated framework adeptly incorporates various uncertainties that arise in the context of nonlinear dynamic time-domain modeling of the structure, which is an essential consideration for accurate representation and prediction of structural behavior under complex loading conditions [
15]. Furthermore, a large-scale experimental investigation focused on wave slam phenomena has been rigorously conducted with the objective of developing a global slamming force model tailored for offshore wind jacket structures, utilizing a wealth of empirical data collected under a diverse array of wave conditions to ensure robustness and applicability of the model in practical scenarios [
24].
Additionally, repair systems for grouted connections in offshore structures have been proposed, with studies focusing on their development and experimental verification [
30].
Furthermore, researchers have emphasized the importance of renewable energy sources and the necessity of well-designed offshore structures to mitigate environmental damage. This includes the application of various offshore platforms in oil and gas exploration, wind energy generation, and other industries [
31].
Data collected through a questionnaire from experts in the field identified three crucial factors influencing the inspection of fixed offshore platforms: environmental conditions, structural design, and anomalies/defects. The significance of each factor varies according to the respondents’ perspectives [
32].
Getting the results allowed us to know at all times the structural behavior of the platform during the different load cases to compare it with the current regulations, observing that the established parameters and factors were always met, in order to determine that the platform complies with the structural integrity, i.e., it does not represent a risk to people and equipment, therefore it is reliable to operate during its useful life.
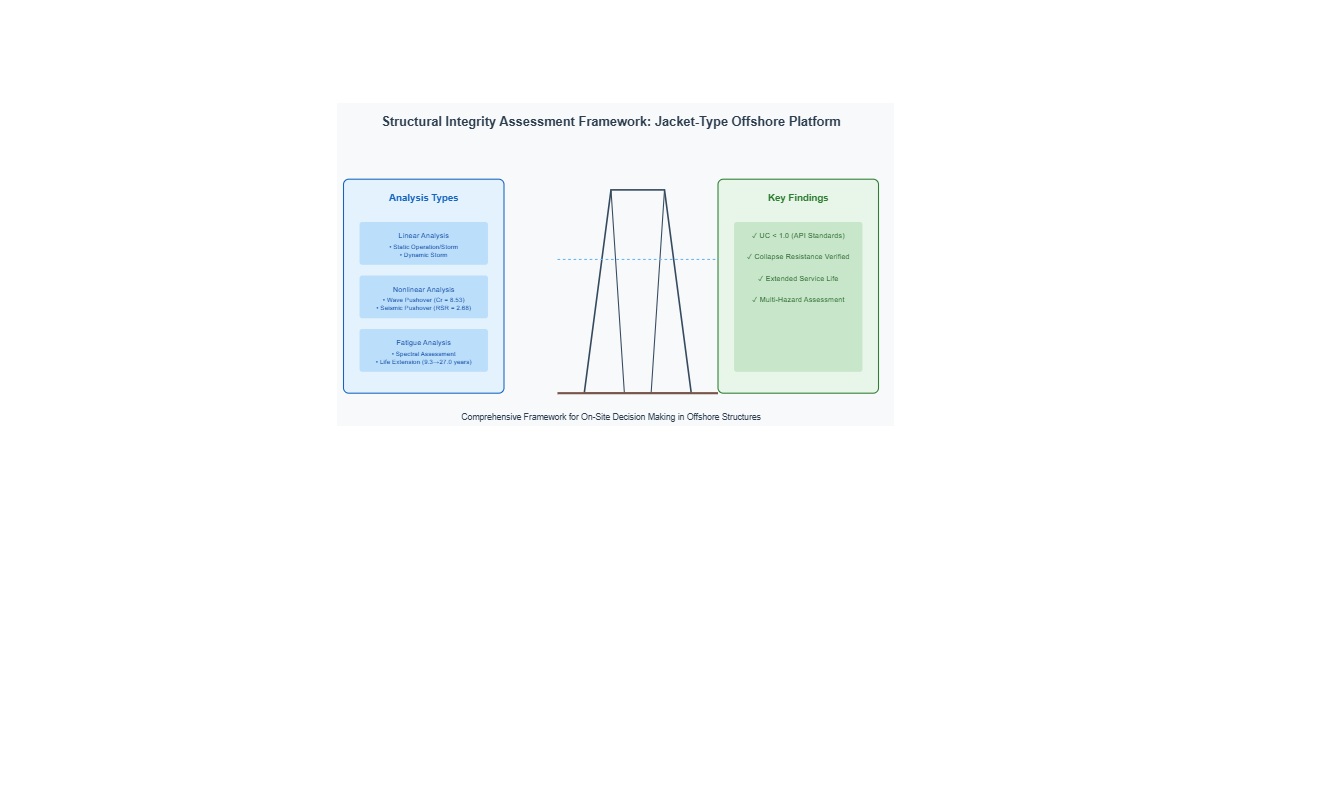
Nevertheless, upon conducting a thorough and systematic review of the existing literature, it becomes apparent that there exists a notable and significant gap in the current body of research: specifically, no studies have been undertaken that explicitly focus on the application of six distinct types of analyses, which include three linear analyses, two nonlinear analyses, and spectral fatigue analyses, for the purpose of evaluating the structural integrity of jacket-type offshore platforms through comprehensive on-site analysis.
In addition to studies focused on improving the prediction of structural response in offshore platform engineering, research has been conducted to obtain meteorological data related to wave conditions by comparing satellite-derived information with data from specific locations in the Arabian Gulf [
33]. These findings highlight the critical importance of incorporating accurate data into analysis and design methods.
A recent study incorporates site-specific meteorological and oceanographic parameters into the analysis process, including wave data simulated via WAVEWATCH III (version 4.18), with uncertain parameters accounted for in the input data. Long-term load distribution parameters are localized to determine the platform’s Probability of Failure (PoF) due to extreme wave loading. Additionally, the structural damage rate is evaluated based on the most recent underwater inspection conducted in the oilfield under study [
34].
The literature review reveals a gap: no studies have specifically addressed the application of six types of analyses three linear, two nonlinear, and spectral fatigue to evaluate the structural integrity of jacket-type offshore platforms through on-site analysis.
In Mexico, there are currently no works that show as an example how the structural behavior changes during different load stresses before storm events such as hurricanes, earthquakes and fatigue, using a drilling platform with a 50-meter water depth. Therefore, the main contribution is to propose a method for performing the six on-site analyzes (static operation and storm analysis, dynamic storm analysis, strength level seismic analysis, ductility level seismic analysis, ultimate wave resistance analysis and spectral fatigue analysis) aimed at determining the structural integrity of jacket-type fixed offshore drilling platforms installed in Mexican waters.
2. Material and Methods
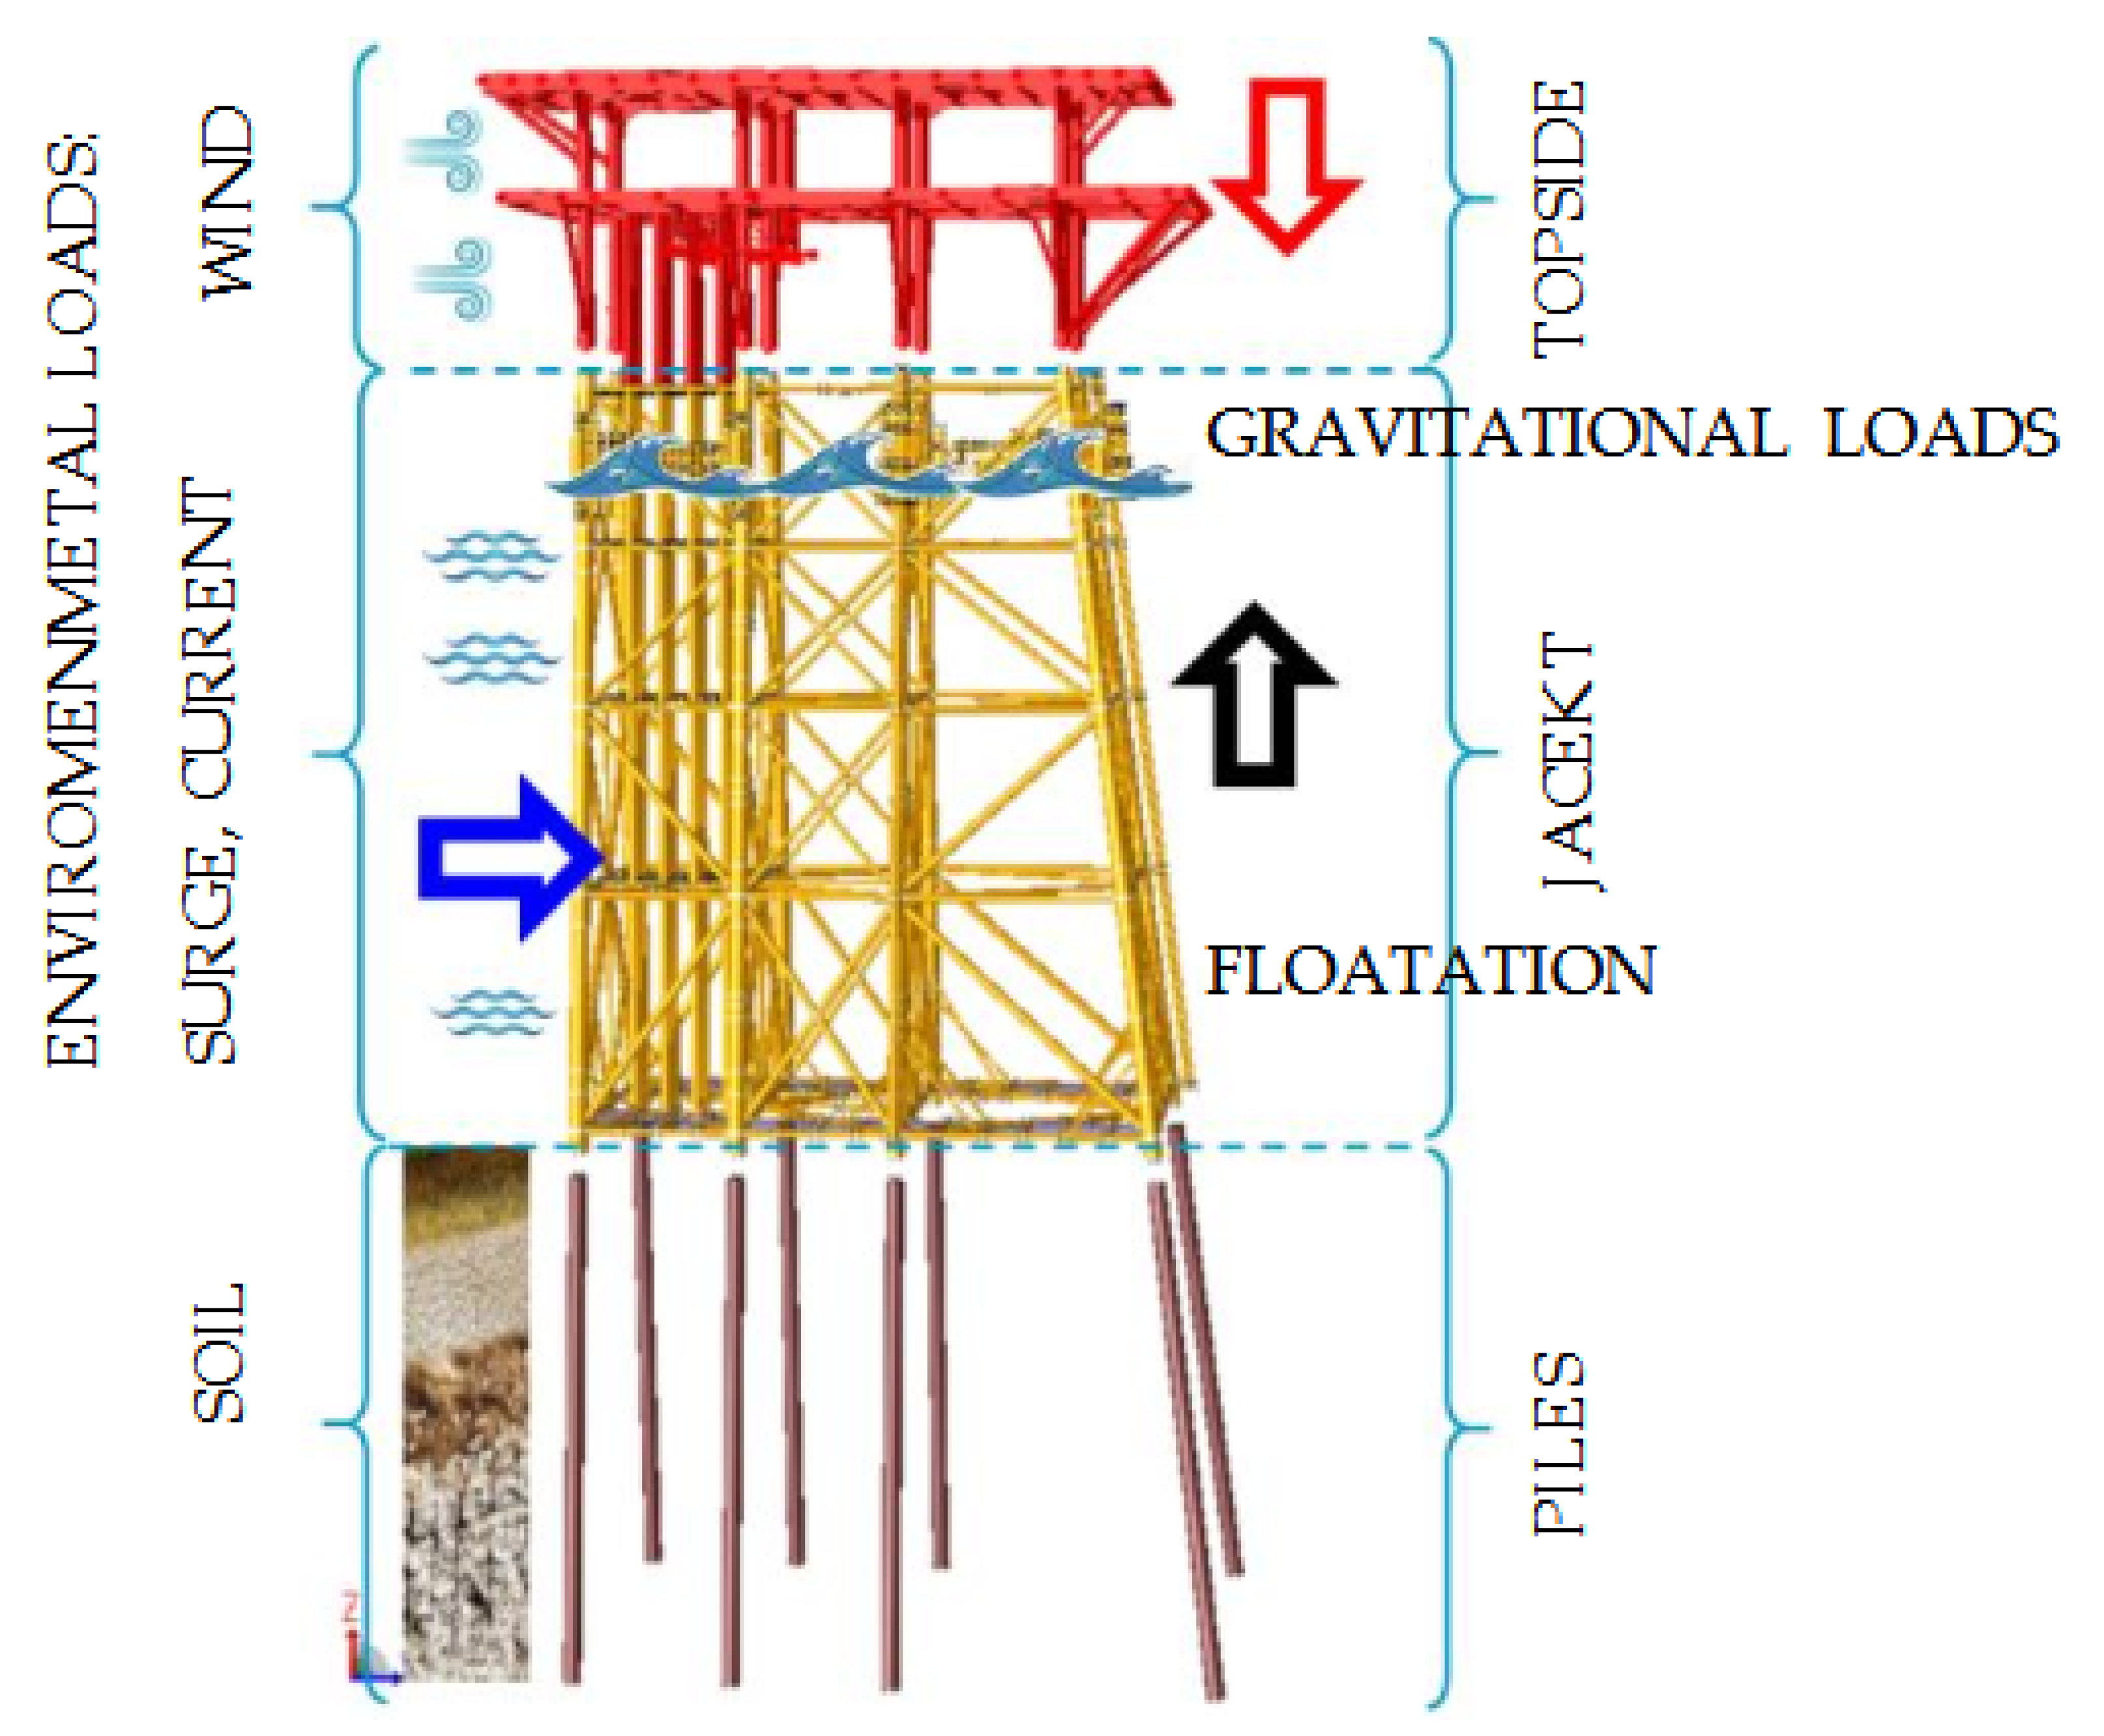
For the development of this work, previous research on the type of jacket type fixed offshore platforms and the current regulations applicable to the Gulf of Mexico has been carried out. In order to particularize the case study, a drilling platform has been considered, which will have a 50,400 m tie-back, with capacity to accommodate 12 conductors, which will be drilled with fixed equipment and will have two productions and drilling decks. The structural parts that make up the fixed offshore platforms are piles, jacket and topside. The main loads are gravity and environmental, according to
Figure 1 and
Table 1
The environmental loads depend on the meteorological and oceanographic conditions of each region, the most representative are waves, currents and wind, the characteristics of the loads are based on the guidelines proposed by the API RP 2A-WSD 22 ed [
35] and will be complemented with the environmental parameters established in the Pemex technical specification “P.2.0130.01- 2015” [
21], the loads generated are static forces acting on the structure and are applied in eight directions at every 45.0°, below are the environmental parameters for the Operation and Storm condition and Ultimate Surge Resistance, as illustrated in
Table 2.
The background of the values in
Table 2 includes the selection of the corresponding stream function, which is generally assumed according to the stream function defined by Equation 1
where N is the order of the stream function and k is the wave number.
For regular stream function theory, the input is simply the wave height, period and water depth as with other wave theories. For irregular stream function theory, the free surface profile for one cycle of the wave becomes a constraint as well.
Particular solutions involve solving equation (1) for the cases of linear theory, applicable to scenarios such as steady-state wave analysis, fatigue analysis, regular and uniform wave conditions, floating and fixed structures where inertial effects dominate; second-order Stokes theory, recommended for analyzing tendons in TLP (Tension Leg Platform) structures; stream function theory or fifth-order Stokes theory, applicable for storm wave conditions. Additional aspects of particular solutions and applicability are discussed in [
35,
36,
37,
38]. In order to choose the appropriate order of the stream function theory in a particular application, one should consult the data on Figure 5.3 of API RP 2A WSD 22ed. [
35]
Additional parameters, such as drag coefficients, blockage factors, marine growth and shape coefficients, were also considered in
Table 3.
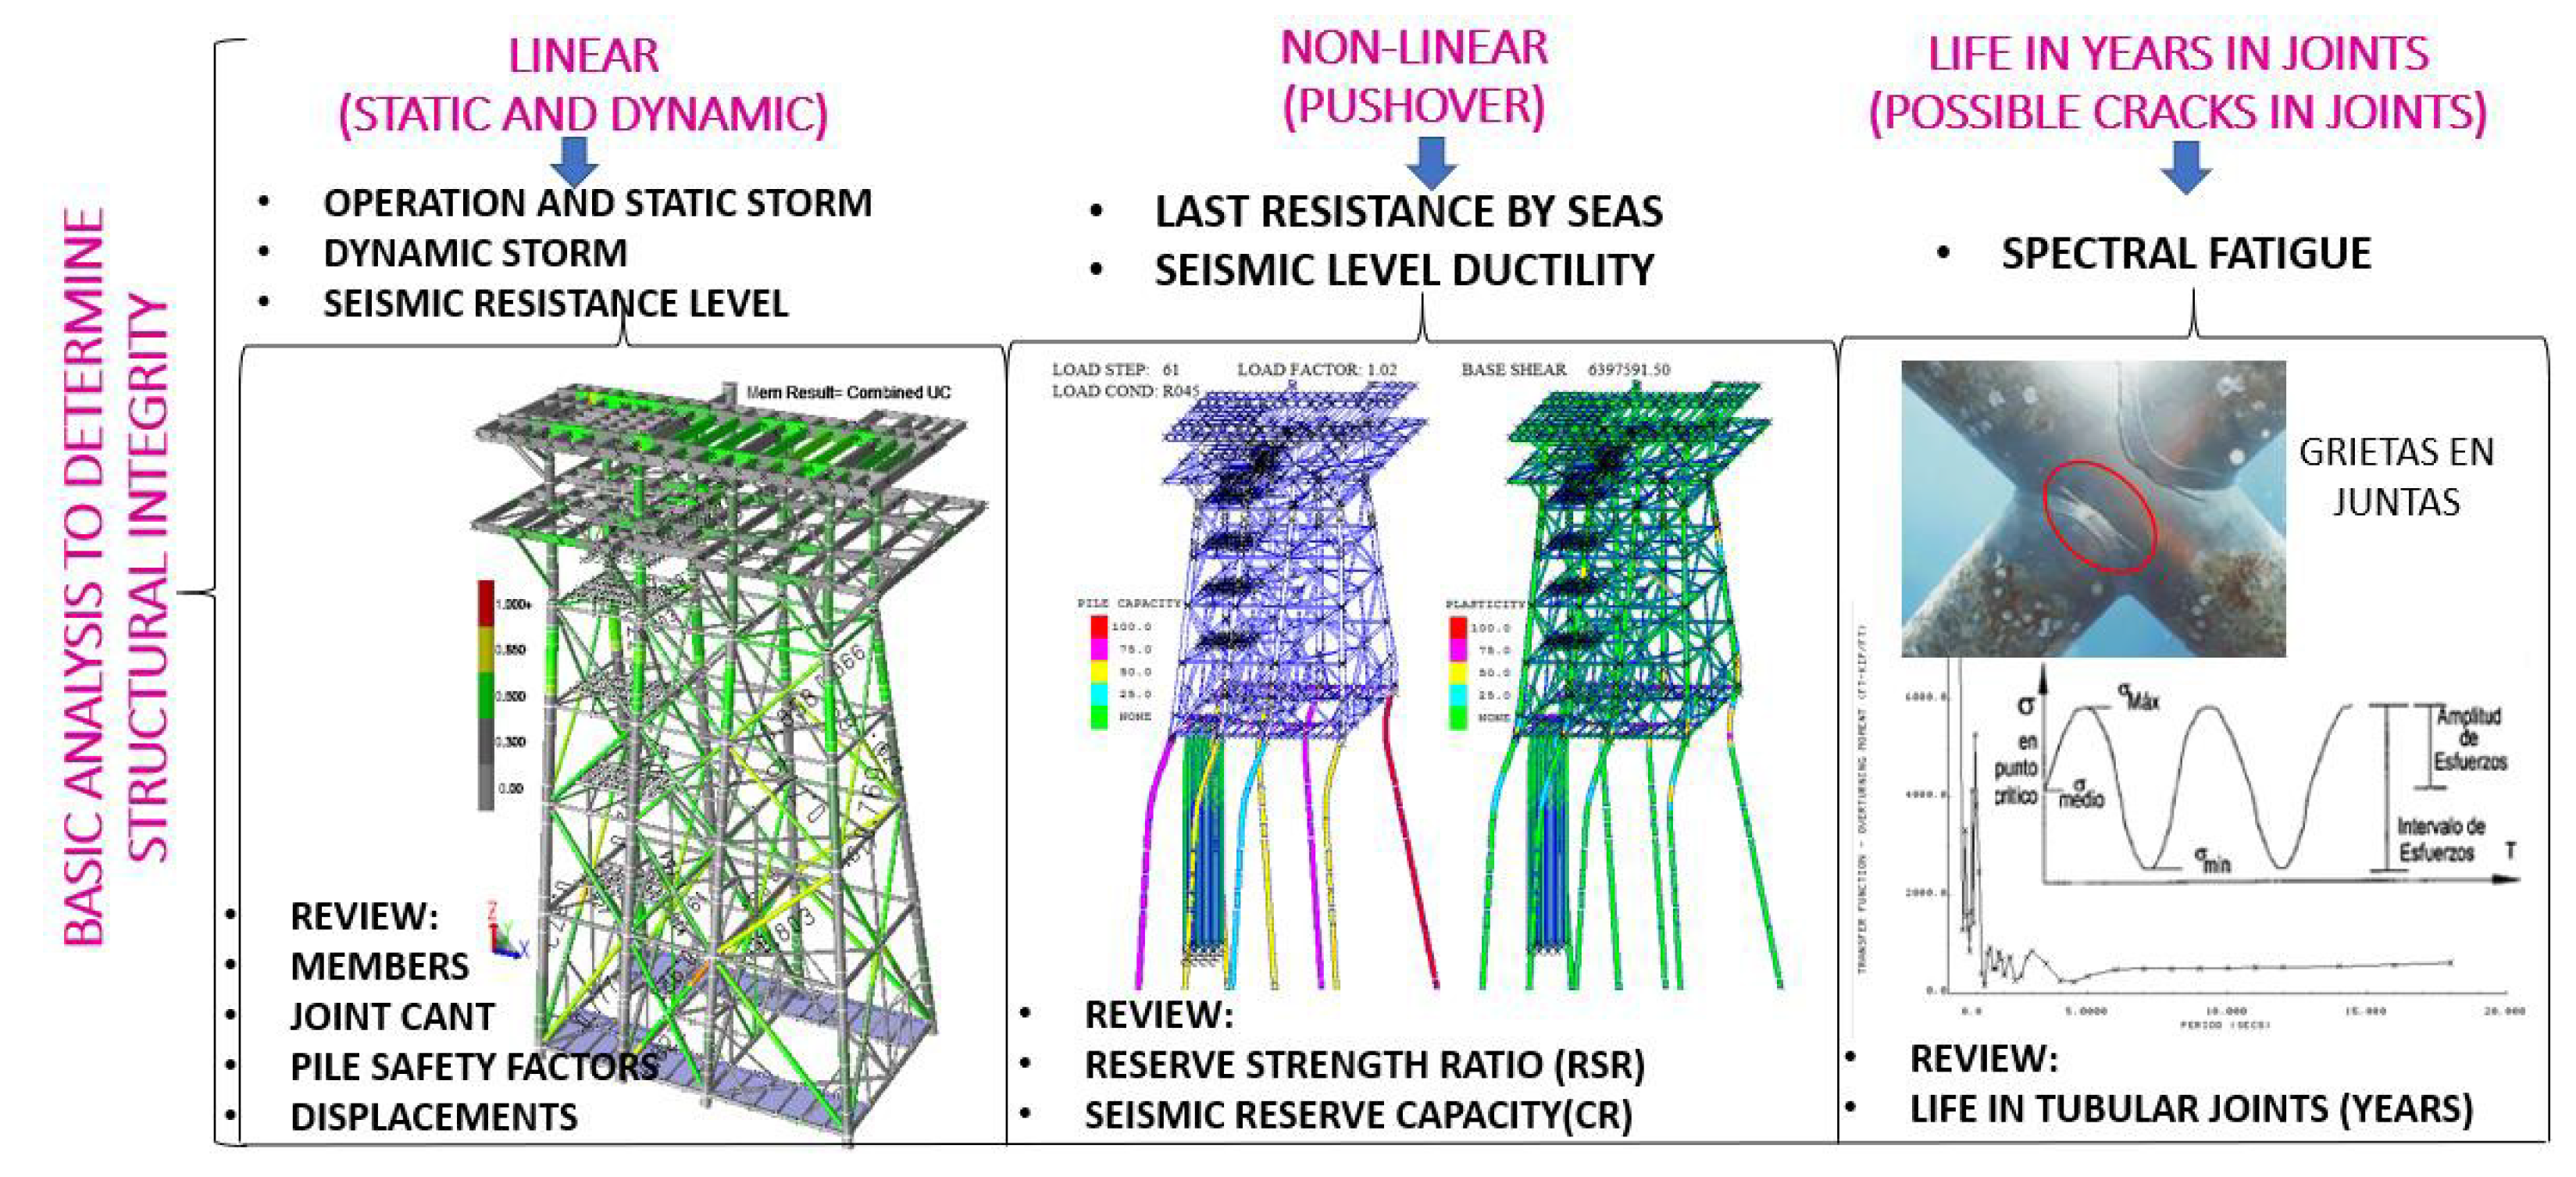
In order to determine the structural integrity, it is necessary to develop the six on-site analyzes, which can be categorized into 3 groups; 1st group Linear (operation and static storm, Dynamic storm, Earthquake Resistance Level), 2nd group Non-linear (Ultimate Surge Resistance, Earthquake Ductility Level) and 3rd group Spectral Fatigue, in agreement with
Figure 2.
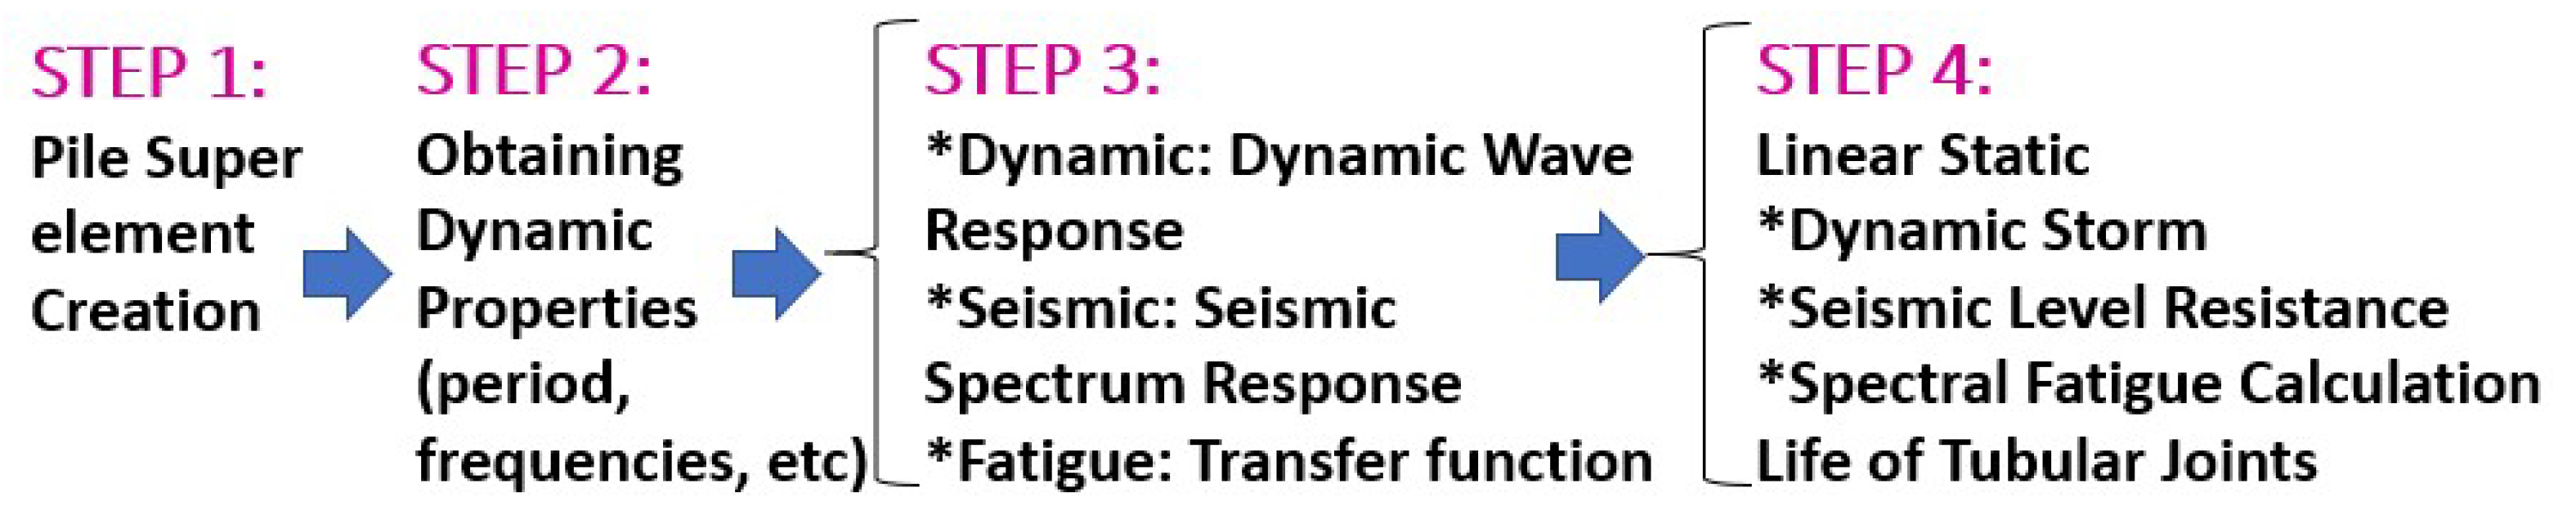
The operation and static storm analysis is performed in a single step, the dynamic storm, seismic resistance level and spectral fatigue analyzes follow a process of steps to get the results which are shown and described below, for the ultimate wave resistance and seismic ductility level analyzes are performed with the method known as pushover, are given in
Figure 3 below and
Table 4.
3. Linear Analysis
Step “3.1” Linearization of the Foundation, (applies to dynamic storm, seismic resistance and fatigue): Since the analyzes are of the dynamic order performed in Sac’s software, it is necessary that the soil-pile interaction be modeled linearly, even though in reality the soil-pile behavior is not; therefore, it is necessary to linearize the foundation. This is done by creating fictitious “super- elements” at the head of each pile, whose function is to describe the equivalent non-linear behavior of each pile head by a linear stiffness matrix. These matrices are got with the help of Sac’s software.
Step “3.2” getting the Dynamic Properties (applies to dynamic storm, seismic resistance and fatigue): To calculate the dynamic properties of the structure, it is necessary to run a dynamic analysis in the Dynpac module of Sac’s software; this module uses a set of master nodes with degrees of freedom (assigned by the user) to generate dynamic characteristics, including Eigen values (periods) and Eigen vectors (modal shapes), which are extracted using the standard Hogar-Givens extraction technique. However, the stiffness and mass matrix are reduced to master nodes using the standard matrix condensation and Guyan reduction methods respectively, assuming that stiffness and mass are distributed similarly. All degrees of freedom that are non-inertial (no mass value) must be slave nodes. Master nodes have been established in the structural model, represented through 222,000 which are at the intercepts of the alphabetic axes with the number of axes at each bracing level, which describe the configuration of the system with the masses concentrated at those points, it is worth mentioning that all stiffness and mass properties associated to the Slave nodes are included in the Eigen extraction procedure.
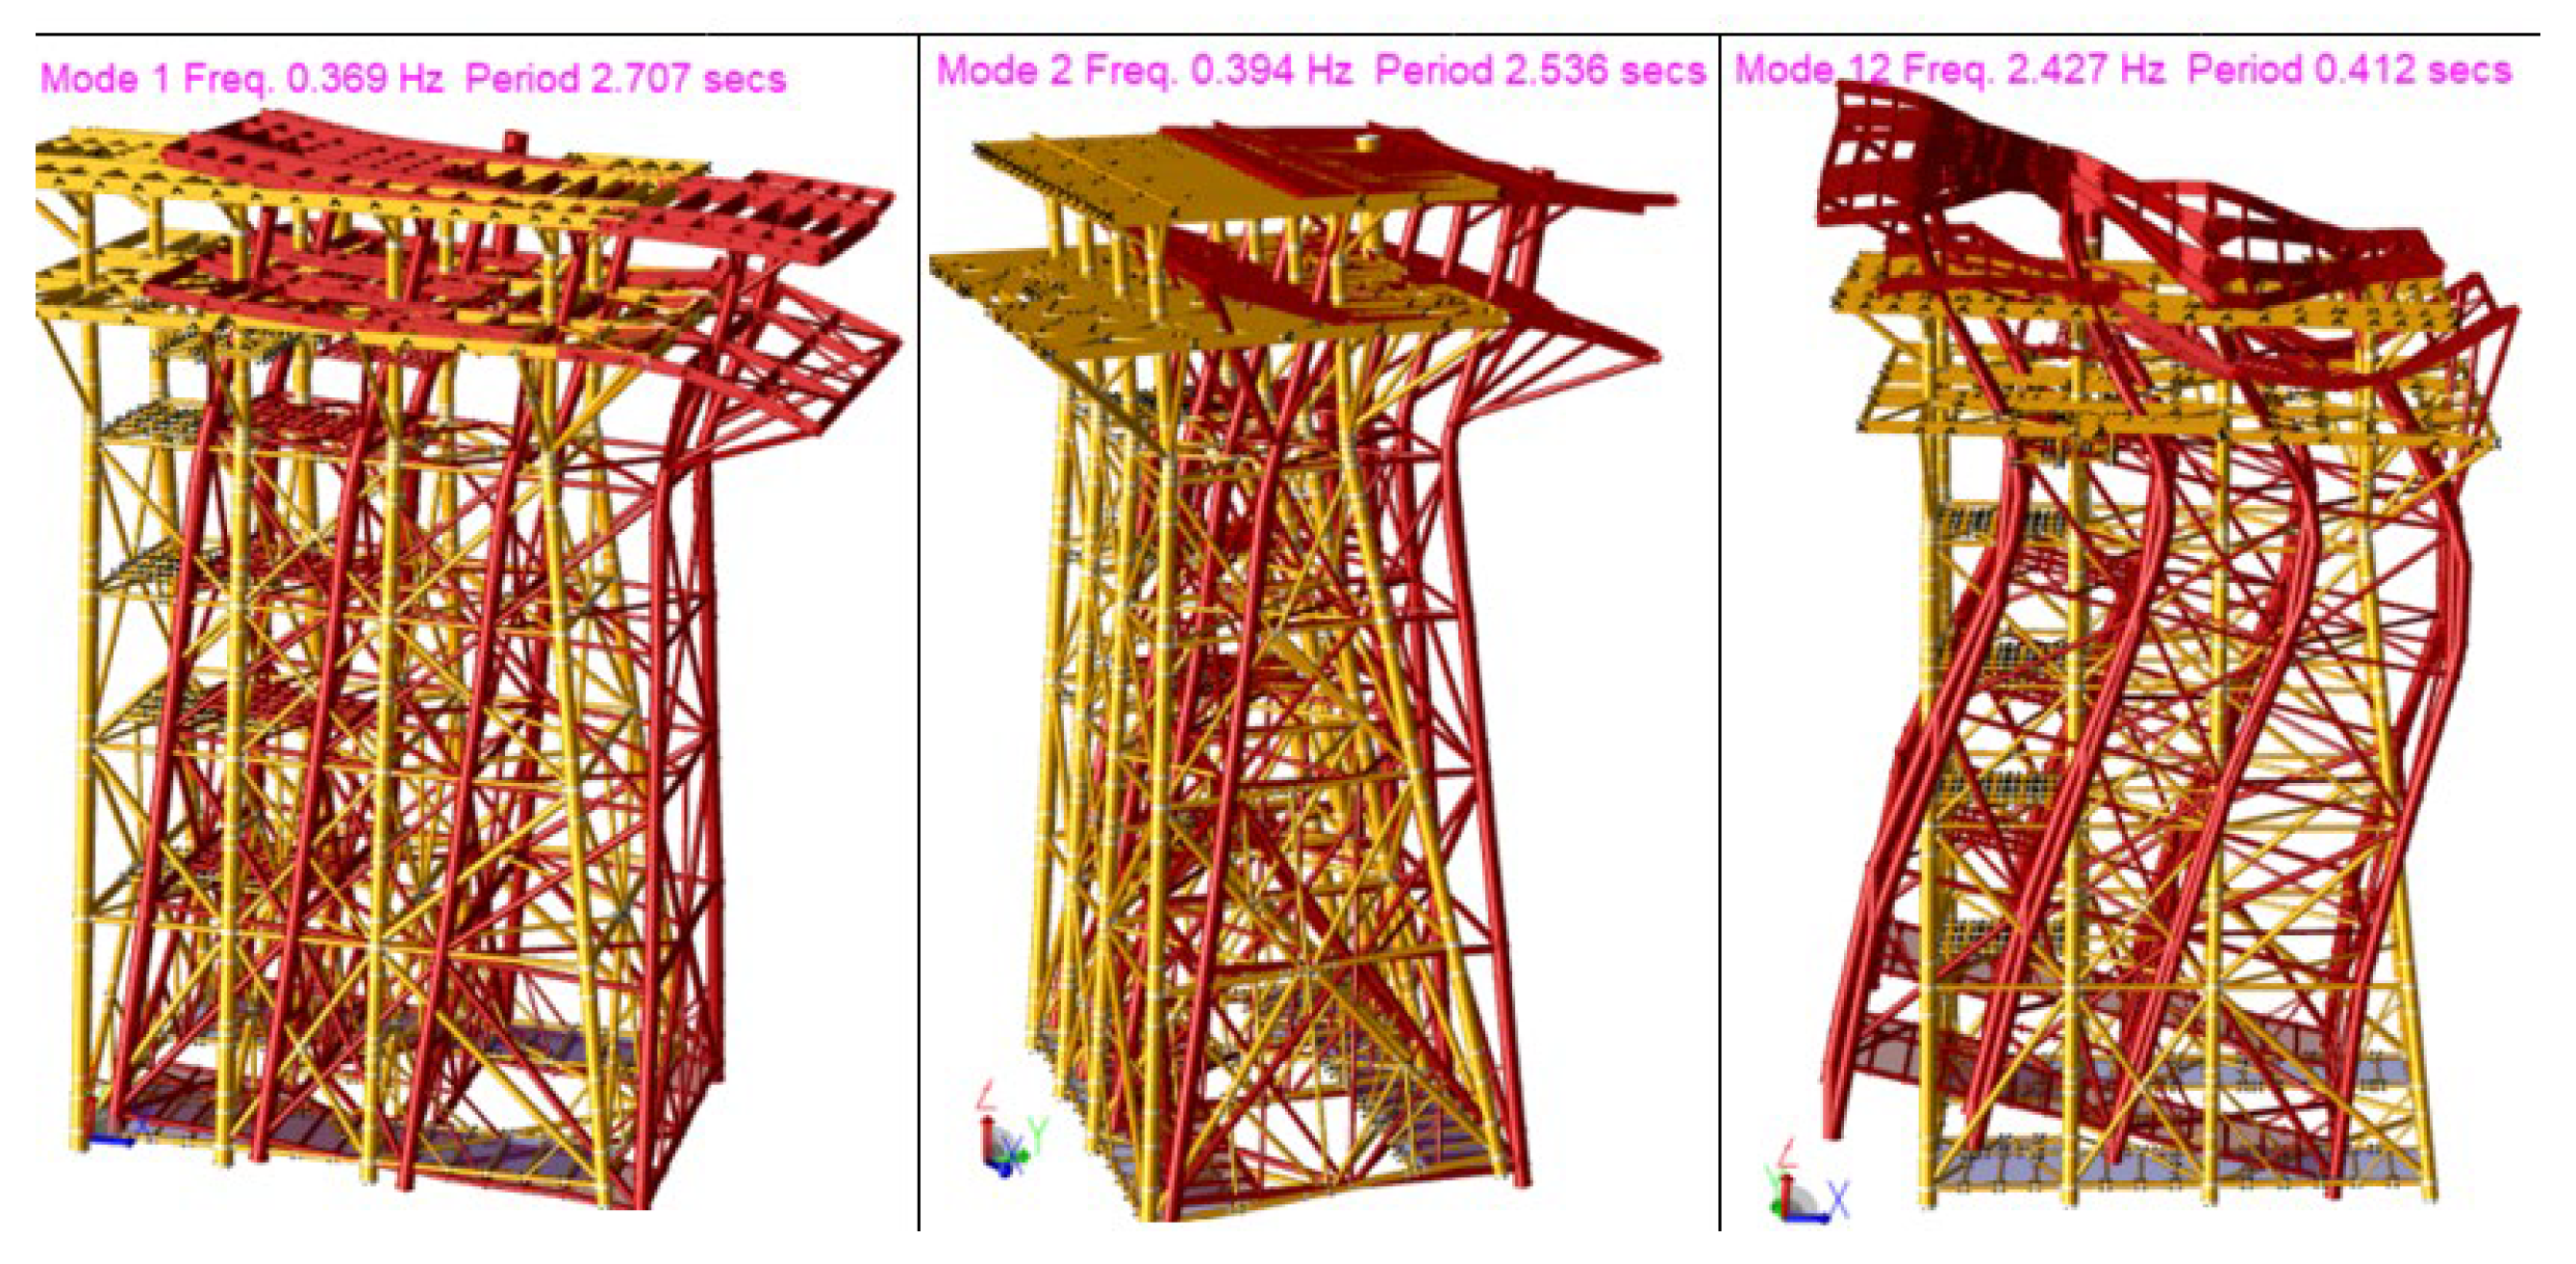
The structural analysis considers 30 modes, reaching cumulative factors at X=1.0, Y=0.998, & Z= 0.925, which are considered adequate, because in the z direction more than 90% is reached; in the first mode a period is obtained at X= 2.70 seconds, in mode 2 there is a period at Y= 2.53 seconds, and for the vertical axis the period is Z= 0.41 seconds in mode 12.,
Table 5 shows the periods for all 30 modes;
Figure 4 shows the periods for modes 1, 2 and 12.
Step “3.3.1” Dynamic Storm Analysis, Wave Response: To get the dynamic response to the forces because of the velocity and acceleration of the water particles resulting from wave and current action, it is necessary to generate equivalent static loads that represent the forces on the structure because of fluid motion, including the relative motion between the platform, fluid and inertia. Although, these static loads are composed of hydrodynamic loads and inertia loads: The inertia loads are determined from the modal accelerations, while the hydrodynamic loads represent the acting forces of the fluid because of the movement of the fluid and the platform. It is worth mentioning that the equivalent loads are determined using the “equivalent static load” method through the “Wave Response” module of Sac’s program, which produces a file with equivalent static loads for each of the wave and current incidences corresponding to the storm conditions used in the On-Site Analysis, which will be added to the gravity and wind loads for the elaboration of the final static analysis.
Step “3.3.2” Resistance Level, Spectral Modal Seismic Analysis: The dynamic response module of SACS calculates the dynamic responses of a structure subjected to dynamic excitation due to base motion as in an earthquake, generating the equivalent static seismic forces, for this case in 20 different directions every 18º. Therefore, it is possible to determine in which of them the greatest effects of the earthquake on the structure occur.
The Response Spectrum method was used, the design spectrum used is shown in the table below and was applied in both horizontal directions and the complete quadratic combination method (complete quadratic combination CQC) was used, to combine the modal responses and the square root of the sum of the squares SRSS; the spectrum will be applied simultaneously and complete for two horizontal orthogonal directions and at 50% for the vertical direction, the Pemex technical specification “P.2 .0130.01-2015” [
21] establishes that the Resistance Level Analysis shall be done with the loads got from the acceleration spectrum as described in
Table 6.
Damping factors can have a profound effect on the analysis results. A 5% structural critical damping was considered, as established in section 5.3.6.3.2 of API RP-2A-WSD [
35]; The program has the ability to consider both structural damping.
In
Table 7, the results of the loads are shown considering a 5% damping (recommended by the Pemex specification [
21] and a 2% damping, it is observed that the vertical load for the 2% damping is 1,314.98 ton < 1,509.55 of the 5% damping, therefore, the structural analysis was carried out with the most unfavorable, using the results of the 5% damping.
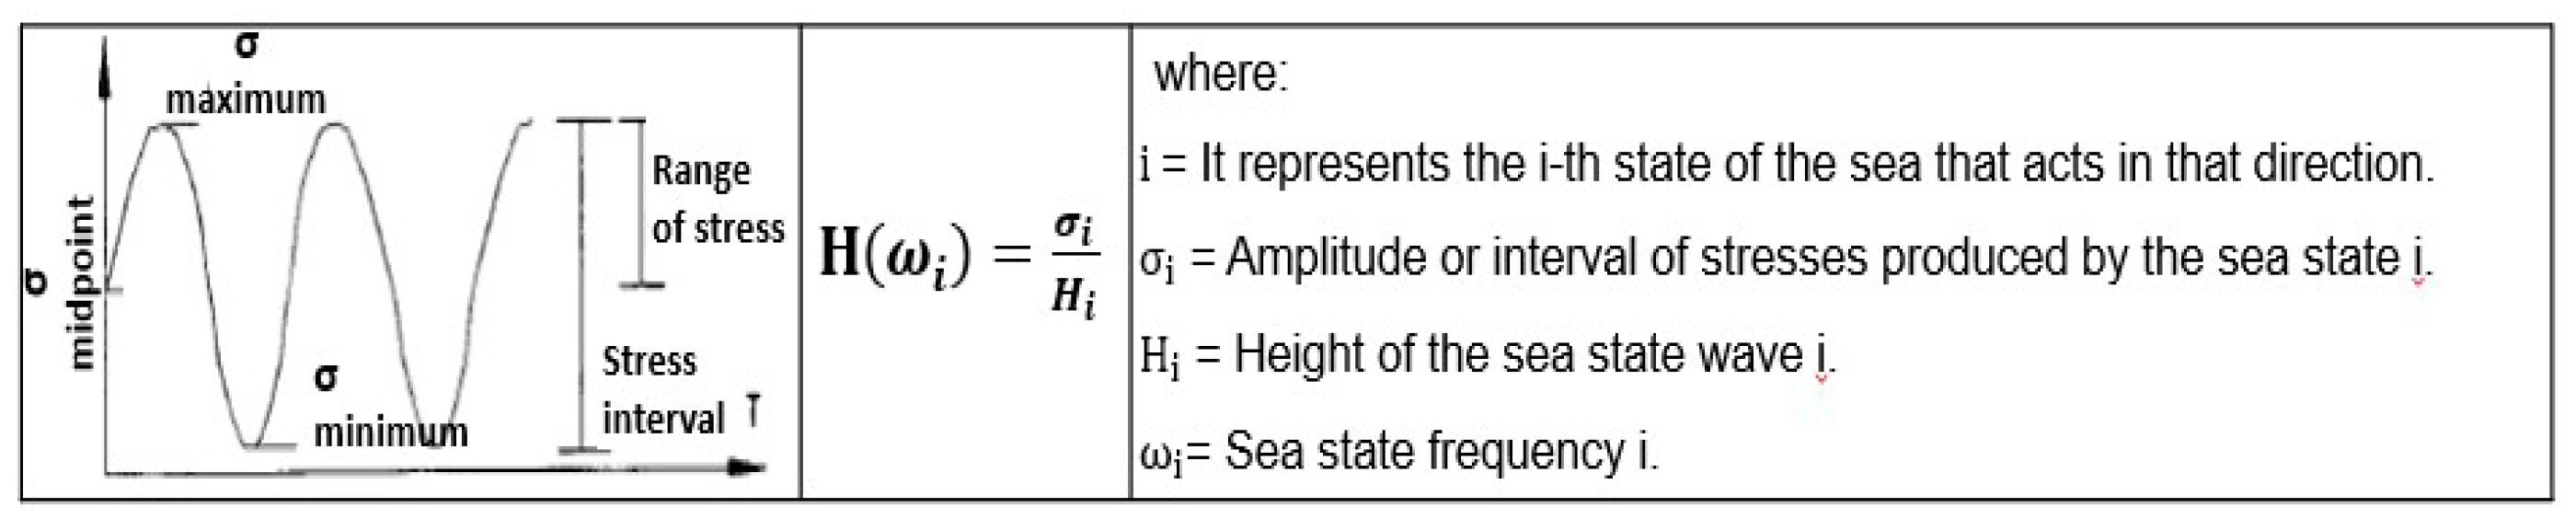
Step “3.3.3” Spectral Fatigue Analysis, Transfer Functions: A transfer function defines the relationship between the stress range cycles and the wave height as a function of frequency (usually for a wave direction). The difference between the maximum and minimum stress, called the stress range, is determined for each cycle. For this case study, it was determined at every 22.5° of wave incidence, i.e., 18 directions are given in the following
Figure 5.
The values of the transfer function are got by dividing the stress interval or amplitude by the wave height that produces it and represents the relationship between a sea state defined by a wave and its period, as well as the amplitude of stresses produced at the critical point.
For example, cyclic wind loading, its defined by a mechanical transfer function for each mode. The mechanical transfer function for any mode, H(f), defines the ratio of the range of cyclic stress as a function of the wind frequency and the mode natural frequency by equation (2).
where K
i is the generalized stiffness, f
n is the natural frequency and c is the percent damping.
The transfer functions are calculated at every 22.5° and correspond to the total vectors of the oceanographic information in table C.9 (Areas as: May, Yum, Coastal) of the Pemex specification [
21]; it is necessary to generate the response of the structure to the wave loads for each direction. Then, 16 independent functions are needed, one in each direction, for which, the orientation of the structure regarding the North and regarding the X, Y coordinate axes of the model are considered. 40 waves are used, starting with 6 waves with 12.5 sec and period decrements of 1.0 sec, and then 4 waves starting at 6.5 sec, and separated at 0.5 sec. Next, to cover the region close to the natural frequencies of the structure, 4, 7, 7, 6 and 6 waves are applied, with decrements of 0.2, 0.15, 0.05, 0.1 and 0.2 seconds, and starting at 4.5, 3.7, 2.75, 2.35 and 1.7 seconds, respectively.
4. No-Linear Analysis (Pushover)
This analysis was performed by applying an incremental load until the platform collapse mechanism was produced, using the nonlinear method of load increment (pushover). This method was generated with the “collapse” module of the SACS program, which considers the nonlinearity in the structure and foundation, the product of the analysis is determined the Resistance Reserve Factor (RSR) which relates the lateral basal shear with which the structure collapses (ultimate design wave resistance) and the reference shear product of the design wave, the RSR must be calculated for 8 different directions of incidence of the wave; i.e. at every 45° in all cases the RSR got must be greater than the minimum specified in standard 2.2, The procedure used in each of the eight analyzes is presented below.
4.1. Ultimate Wave Resistance Analysis
The Reference Basal Shear is got from the analysis in Operation and Static Storm site, for the eight directions of incidence in Storm conditions considered in the analysis.
Gradual application of Gravity Loads (Self Weight, Dead Loads and Live Loads) on the platform. It is applied, for example, in 10 steps with a 10% increment.
Gradual application of the meteorological loads for the Ultimate Strength Analysis.
Increments of 2% in the magnitude of such loads have been defined; so that to reach 80%, 40 steps are needed. Followed by refining the area of interest by applying 140 steps with a load increase of 0.5%, starting from 80% up to 150% (where collapse is reached), The percentage of 100% corresponds to the magnitude of the loads defined in table A.1.1 of the Pemex standards for Ultimate Strength.
Identification of the platform collapse mechanism in each direction.
Getting the basal shear and RSR for the meteorological conditions that generate platform collapse.
4.2. The Seismic Analysis by Ductility
The ductility analysis should be performed by an ultimate strength analysis using an incremental load (pushover) method. Cr is defined as the ratio between the ultimate lateral load resisting the platform before collapse (obtained in this analysis) and the reference lateral load (calculated in the seismic analysis by resistance), it has been performed for each of the 20 directions of occurrence, the analysis has been executed as follows.
The gravity load is applied in 10% increments until 100% of the gravity load is reached.
The seismic load is applied in 5% increments until 100% of the seismic load is reached, Seismic loading continues to be applied in 5% increments until the collapse mechanism of the structure is reached.
5. Results and Discussion
5.1. Operational and Static Storm Analysis
This analysis is required to ensure that the design of the platform complies with all the applicable regulations in force, in terms of loads and stress, both in the substructure and superstructure, as well as in the piles.
The results are presented in unity checks that are: Unity check is the inverse of the factor of safety, which is the ratio of the maximum design load to the allowable load. Another term for this is utilization ratio. A unity check below one means the component passes with the specified design factor, See details in section 6.2 of the API RP 2A WSD 22 ed [
35]
The present analysis has been carried out with the SACS (Structural Analysis Computer System) program by which the mechanical elements in the structural elements, the stress ratios of elements (Unity Check), as well as the review of the piles (including the non-linear soil-pile interaction), the analysis by hydrostatic collapse, and the analysis of joints “by penetration” and “by resistance” have been obtained, the above based on the API-RP-2A -WSD 22ed. [
35], AISC and IMCA. The results of the operation and static storm analysis are shown below. However, the summary of static storm and operation analysis results is given in
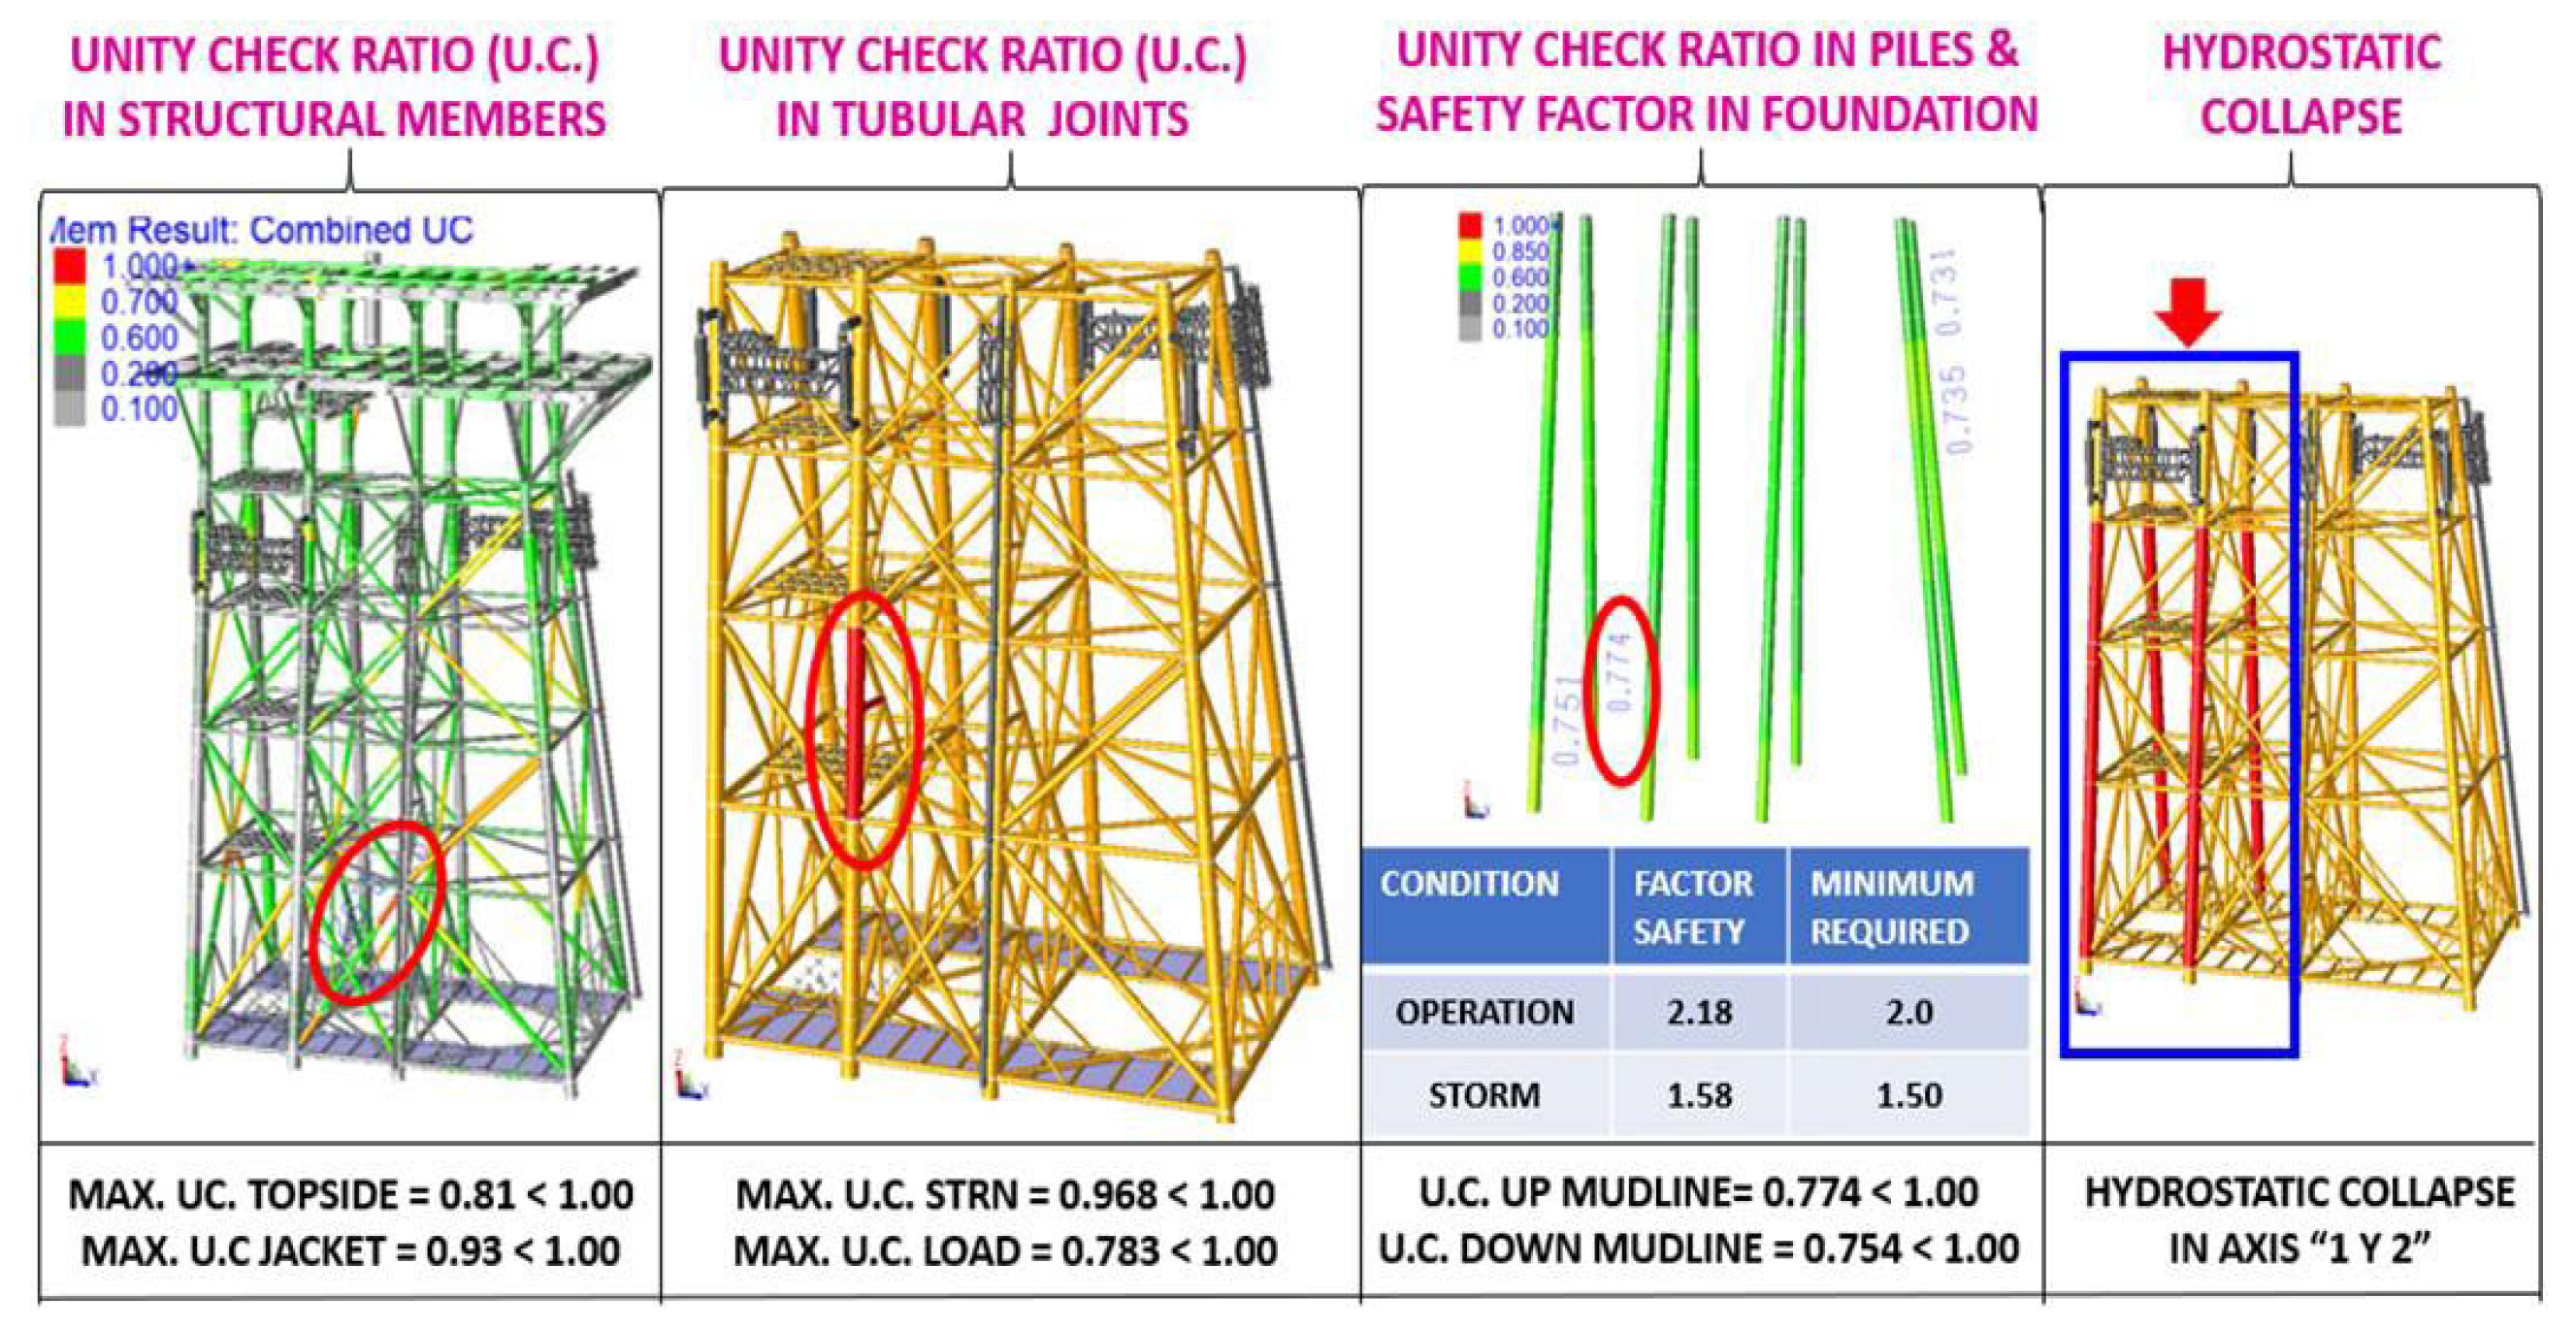
Figure 6.
UC stress interaction relationships: The maximum UC was presented in the substructure (jacket) with a value of 0.93, and in the superstructure (topside) with a value of 0.81, both cases less than 1.0, the UC are less than unity, thus complying with current regulations.
Tubular Joint Penetration: Tubular joints were checked for penetration (Load) and resistance (STRN), getting values of 0.968 and 0.783 respectively, in both cases, the UC. In both cases, the UC are less than the unit, so they comply with current standards.
Stress Interaction Relationships U.C. in Piles and Load Safety Factors in the foundation: The piles were reviewed, for the piles above the seabed (mudline) the U.C. max was 0.774 and for the piles below the seabed the U.C. max was 0.754, both cases less than unity. 754, both cases less than unity, as regards the safety factors for axial load on the piles the values are higher than the minimum required by the standard had factors for operation of 2.18 >2.00 (min required) and for storm of 1.58 > 1.50 (min required), which shows that the foundation complies with the parameters established in the standards in force.
Hydrostatic collapse: there are over stresses in the columns of axis 1 and 2, for which the following solutions can be recommended:
Rings of 1.00” (25.4 mm) thick by 12” (305 mm), for the separation of the rings you
can use as a guide the separation proposed by the program in the redesign that the Sac’s program performs, the above for the cases of structures already built but not installed, i.e.: Relocations and service changes, this type of solution is complicated in structures already installed because of the cost of underwater welding.
With offshore platforms that are in the design phase, the proposed solution is to redesign the elements, i.e. to increase the thickness of the pipe or to install anchor bolts.
For structures already installed on site, the solution may be to cement the elements, as this solution increases the properties of the element.
It is worth mentioning that this document shows the results of a structural proposal and intends to show the solutions, the structural civil engineer together with his working group will determine which is the best technical and economical solution for the project, in this case study hydrostatic collapse rings will be used as a solution.
5.2. Dynamic Storm Analysis
Due to the fact that the height of the structure, and its stiffness and mass characteristics, it can be considered as an “inverted pendulum”, i.e., most of its mass is kept at the top, hence its dynamic behavior shows tendencies to “pitch” when subjected to wave loads. When the waves hit the structure, it deforms in the same direction as the waves.
The present analysis aims to know the behavior of the platform in storm conditions, considering its dynamic properties and the movement of the water particles, which can cause relative displacements between the platform and the fluid. These movements can have a negative effect on the behavior of the platform, which is not possible to know through static analysis. On the other hand, according to API recommendations [
35], structures with natural period of vibration of three (3) seconds or more, shall be analyzed through a dynamic wave analysis, considering extreme sea states, gravity loads and attached mass.
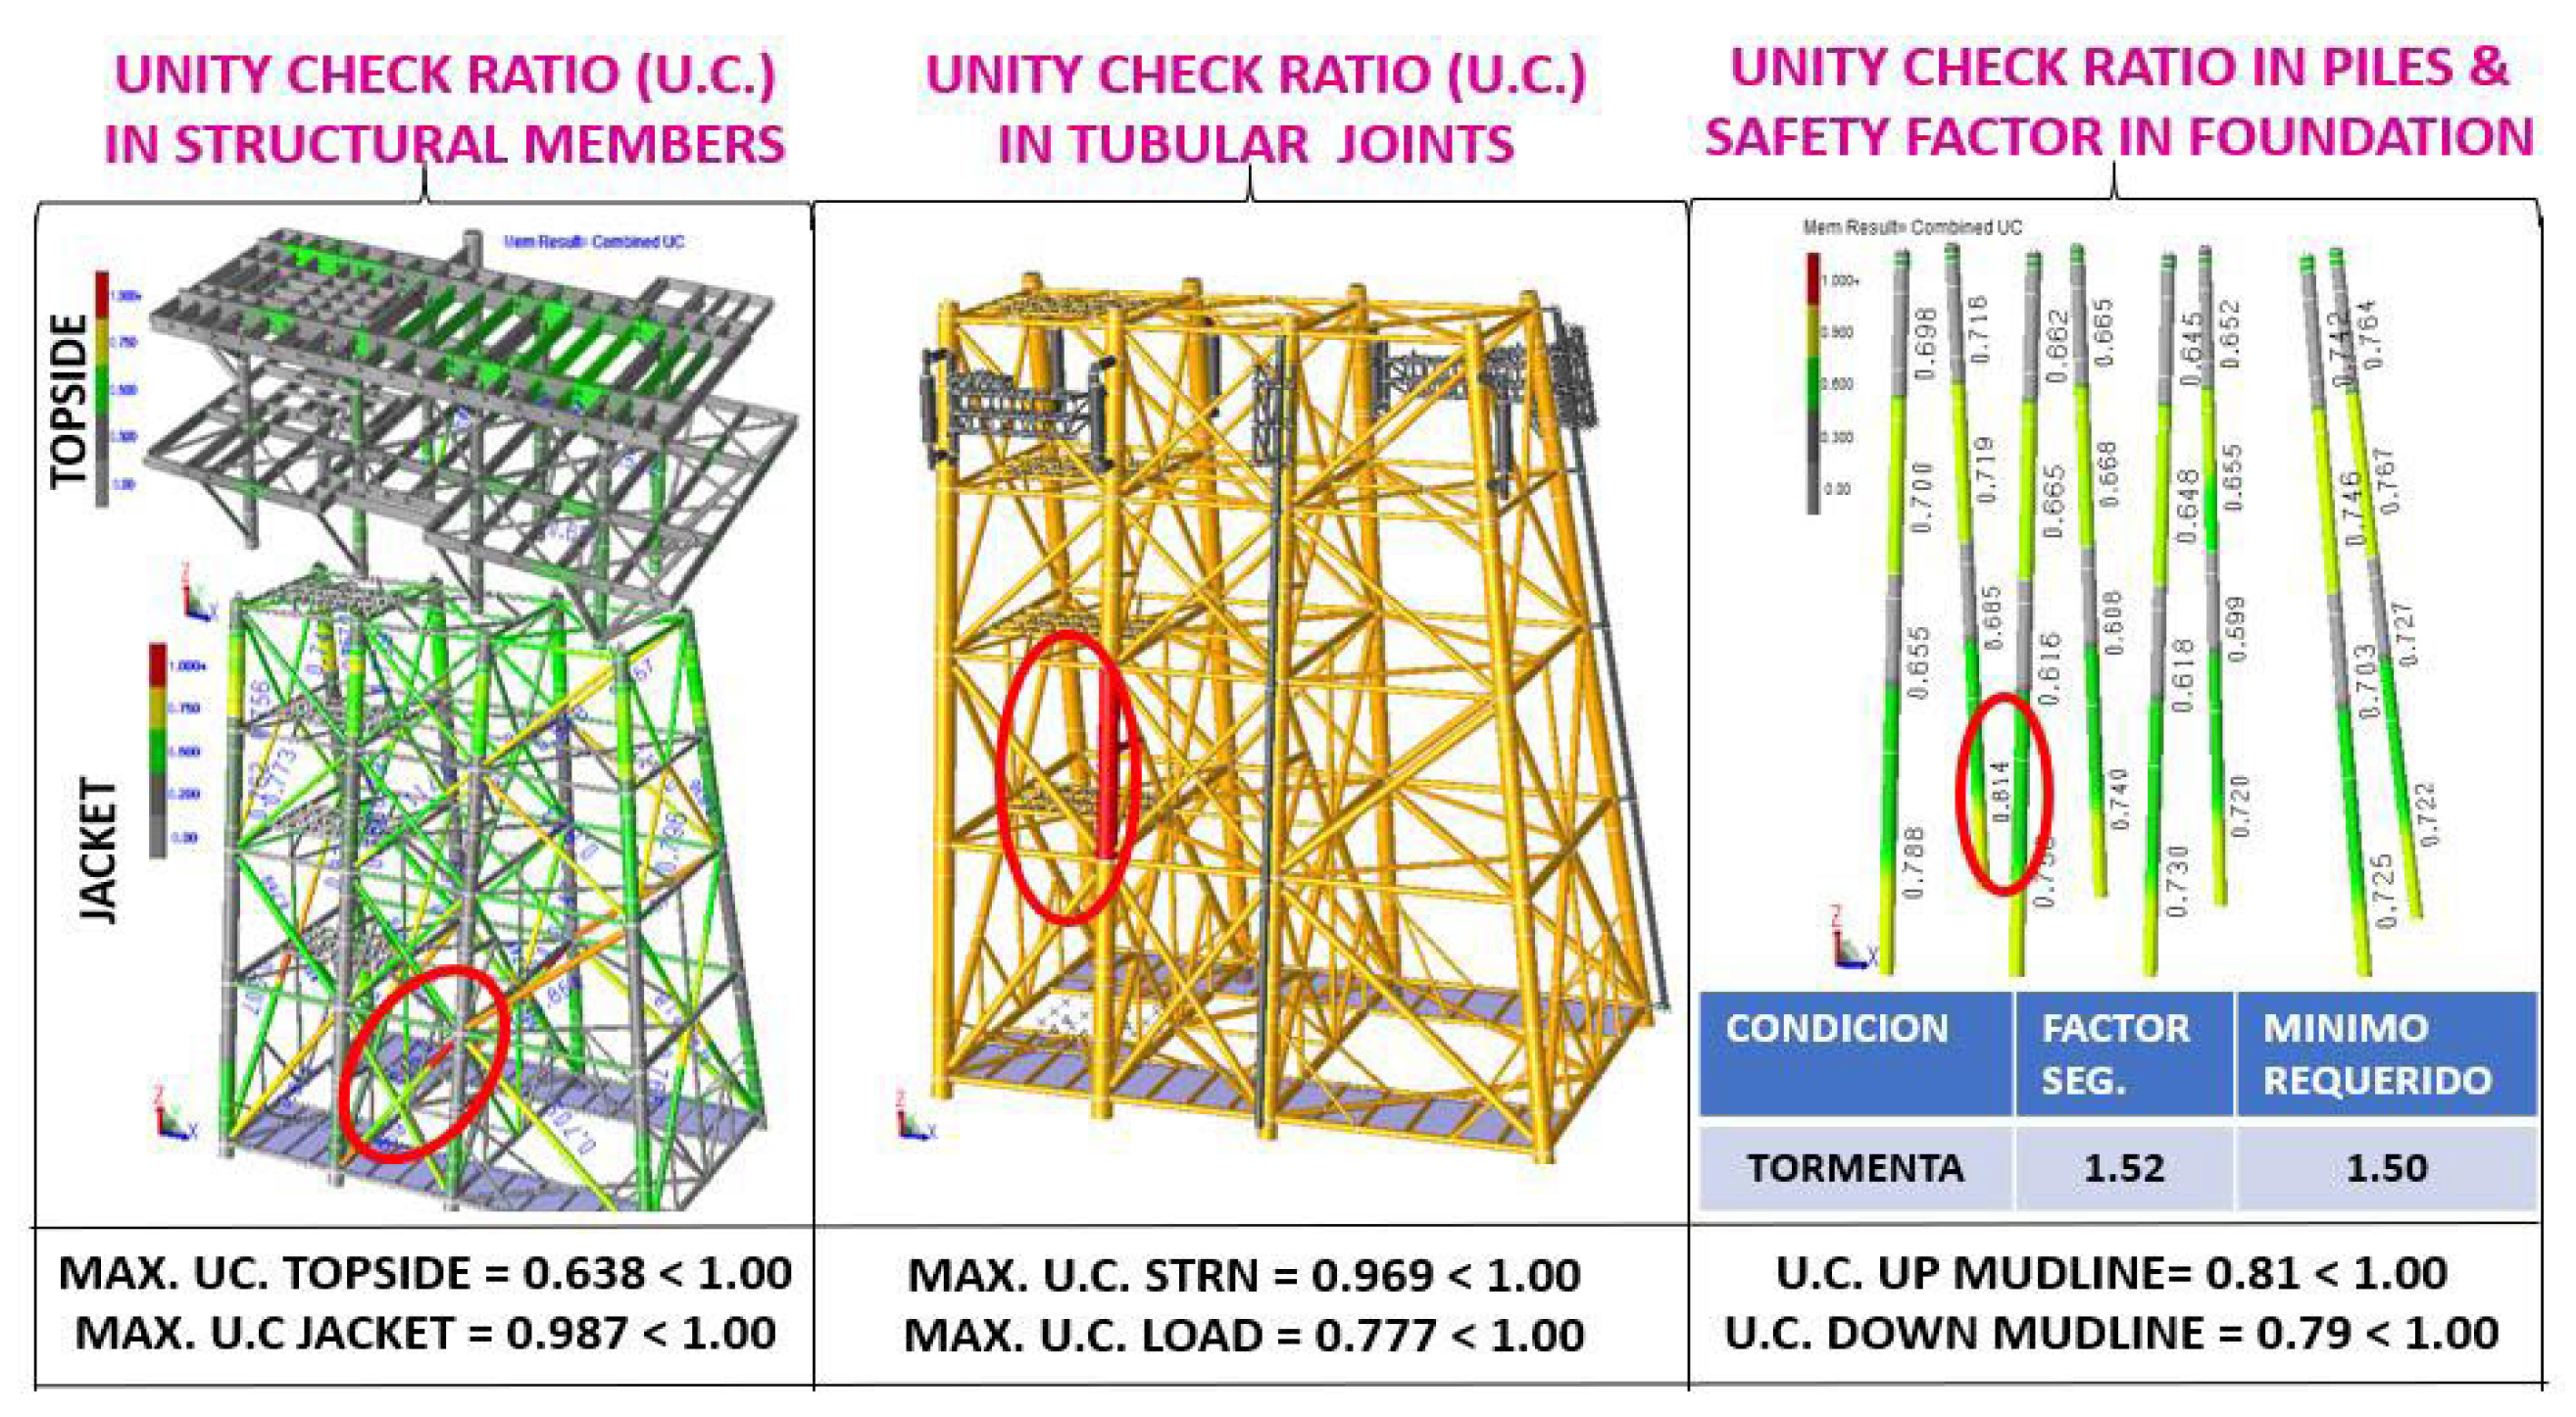
U.C. stress interaction ratios: The maximum U.C. occurred in the substructure (jacket) with a value of 0.987, and in the superstructure with a value of 0.638, both cases less than 1.0, the U.C. are less than unity, thus complying with current regulations.
Tubular Joint Penetration: Tubular joints were checked for penetration (Load) and resistance (STRN), getting values of 0.777 and 0.969 respectively, in both cases, the UC. They are less than the unit, so they comply with the current standards.
Stress Interaction Relationships U.C. in Piles and Load Safety Factors in the foundation: The piles were reviewed, for the piles above the seabed (mudline) the U.C. max was 0.81 and for the piles below the seabed a U.C. max of 0.79, both cases less than unity. 79, both cases less than the unit, regarding the safety factors for axial load on the piles, a value for storm of 1.52 > 1.50 (min required) was obtained, which shows that the foundation complies with the parameters established in the current standards, described in
Figure 7.
The strength level analysis is required to ensure that the platform has adequate strength and stiffness levels to avoid significant structural damage in the presence of an earthquake. The proposed seismic design acceleration spectra correspond to the envelope of the expected value (average) of the maximum accelerations of the structure in the zone of interest and not to the envelope of the maximum of the maximum accelerations. This condition requires that the structure be reviewed by an ultimate strength analysis to ensure adequate safety factors (reliability indices). The seismic design acceleration spectra at the strength level correspond to 20 years.
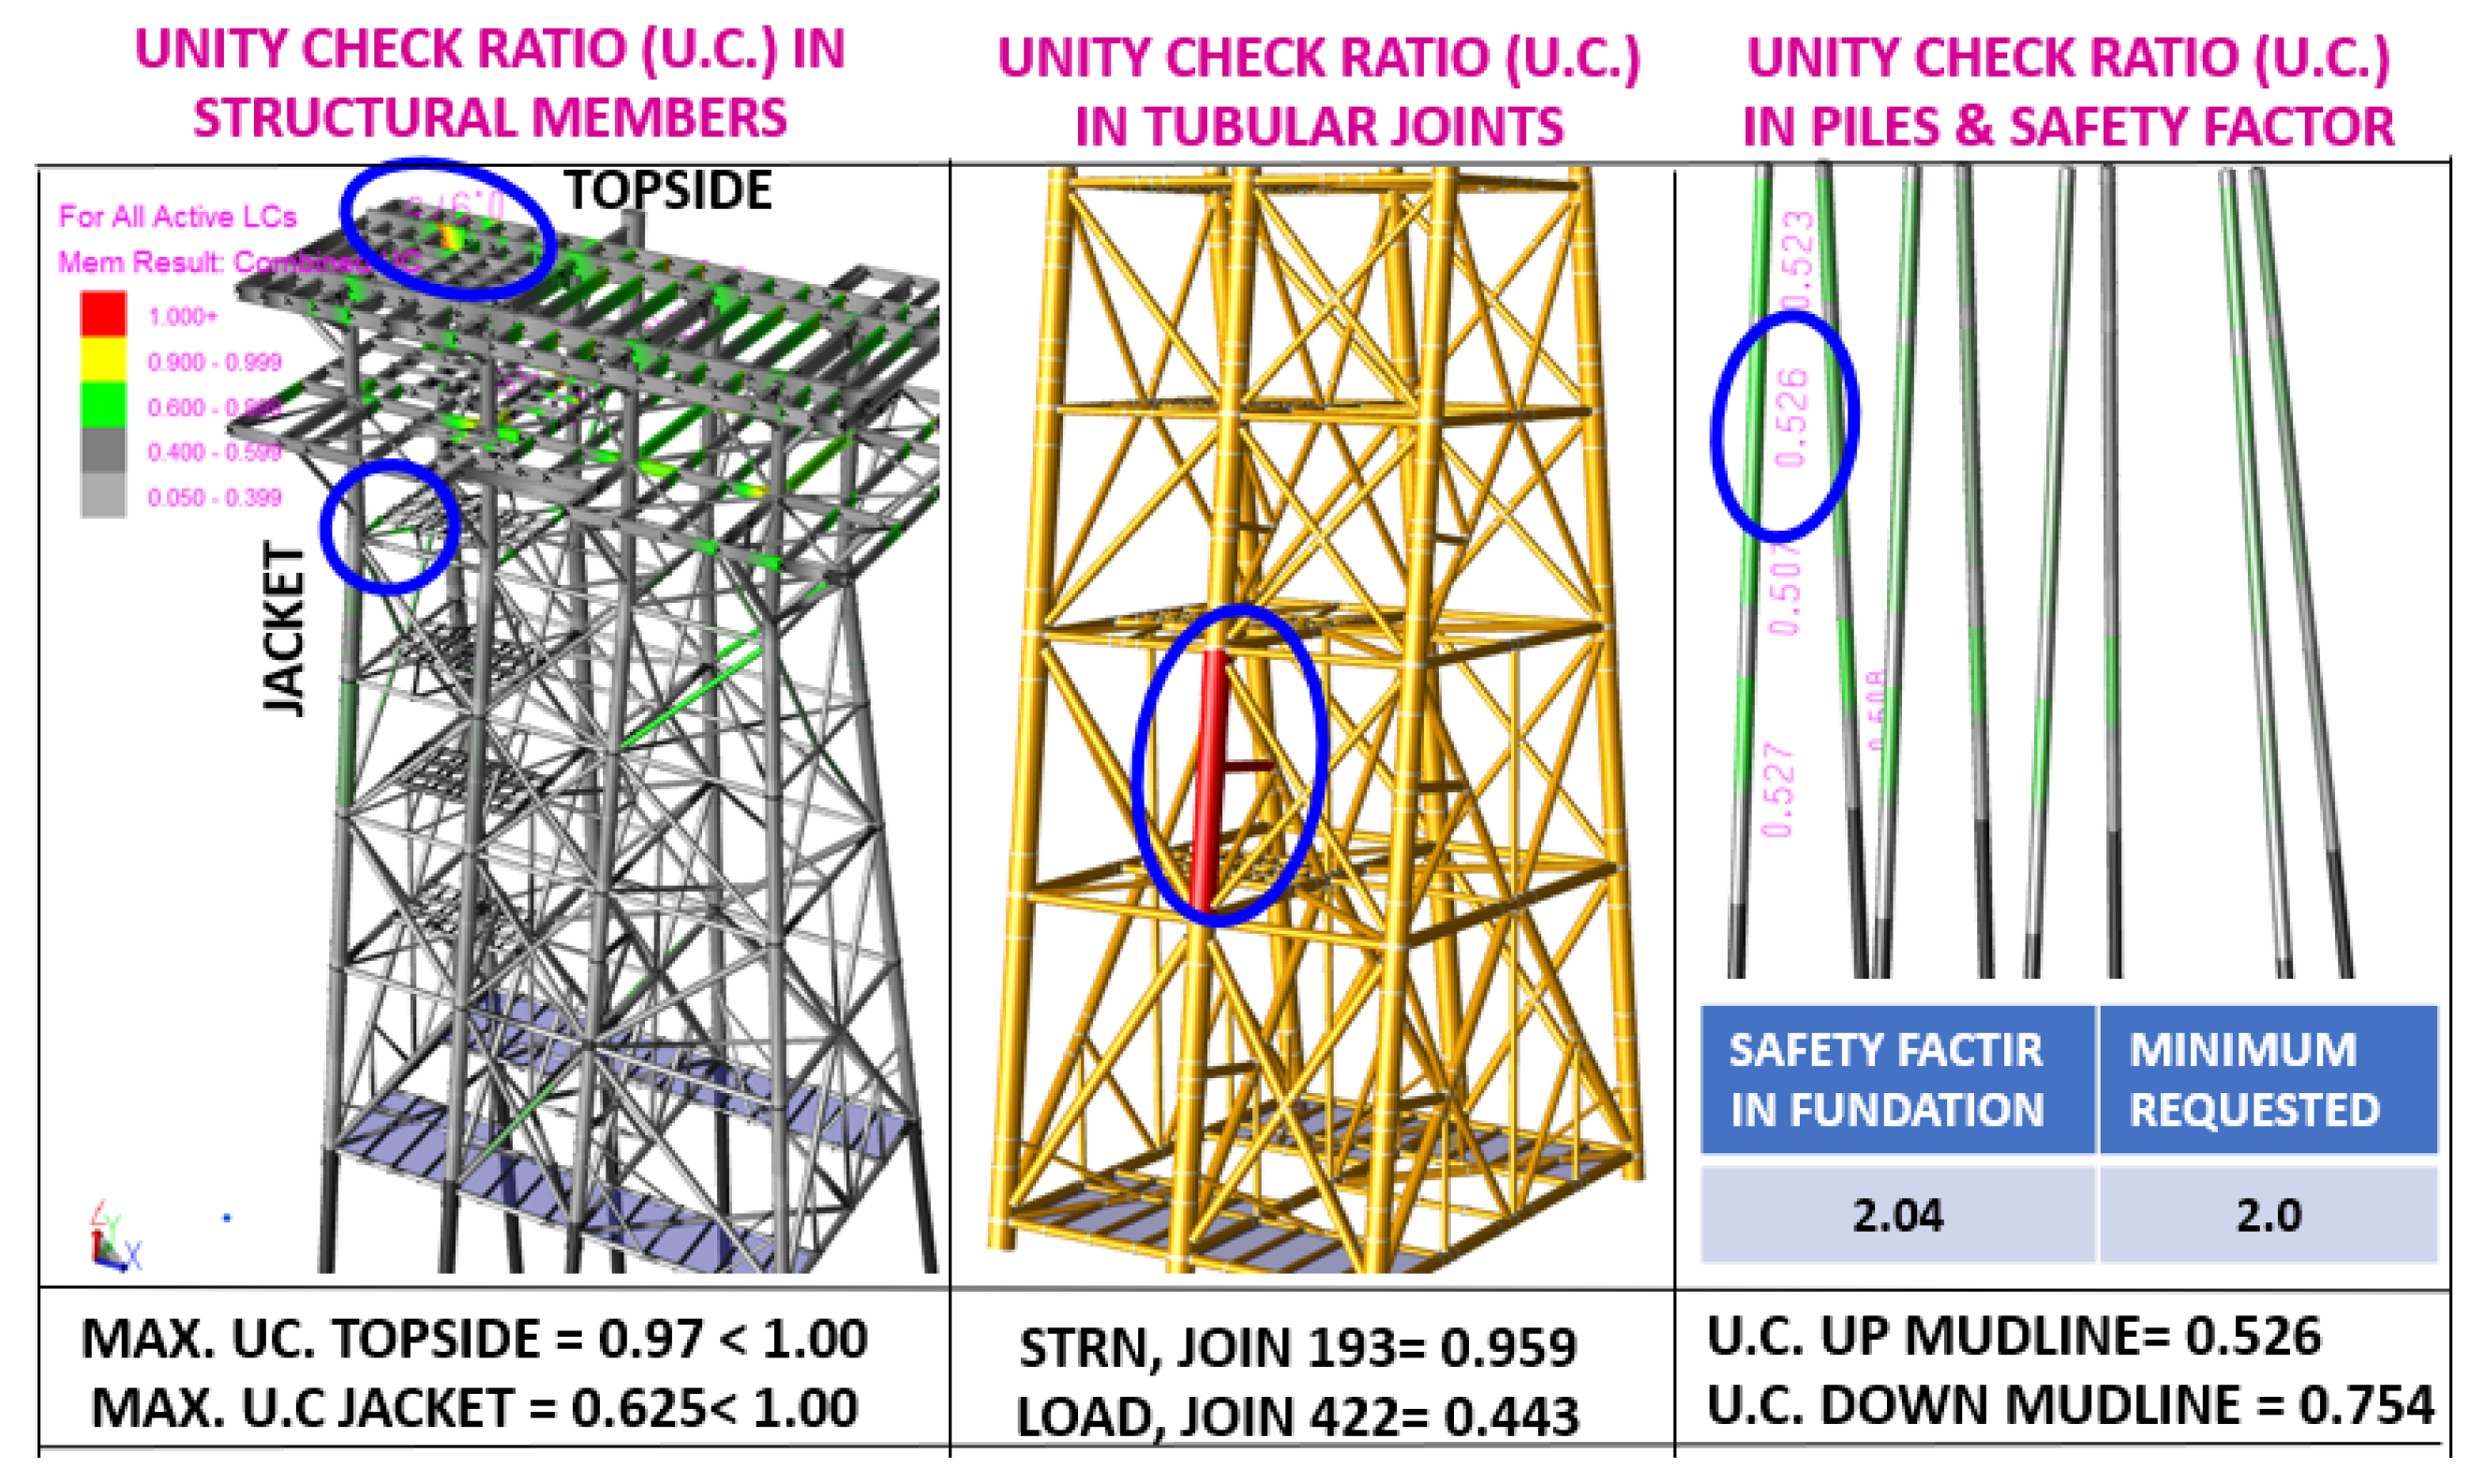
5.3. Seismic Resistance Analysis
Seismic Resistance Analysis has been carried out with the SACS (Structural Analysis Computer System) program through its modules PSI, DYNPAC, DYNAMIC RESPONSE, SACS IV and JOINT CAN with which the fundamental period of the structure, the mechanical elements in the structural members, the nodal displacements, the stress ratios in elements (Unity Check), as well as the revision of the piles and the analysis of joints under shear stresses by penetration (Punching Shear) have been obtained.
U.C. stress interaction relationships: The maximum U.C. was presented in the jacket with a value of 0.625, and in the topside (deck) with a value of 0.97, both cases less than 1.0, the U.C. are less than unity, thus complying with current regulations.
Tubular Joint Penetration: Tubular joints were checked for penetration (Load) and resistance (STRN), getting values of 0.443 and 0.959 respectively, in both cases, the UC. In both cases, the UC are less than the unit, so they comply with current standards.
U.C. in Piles and Load Safety Factors in the foundation: The piles were reviewed, for the piles located above the seabed (mudline) the U.C. max was 0.526and for the piles below the seabed a 0.754, both cases less than the unit, with respect to the safety factor for axial load in the piles, the value was 2.04 > 2.00 (min required), which shows that the foundation complies with the parameters established in the current standards are shown by
Figure 8.
5.4. The Seismic Analysis by Ductility
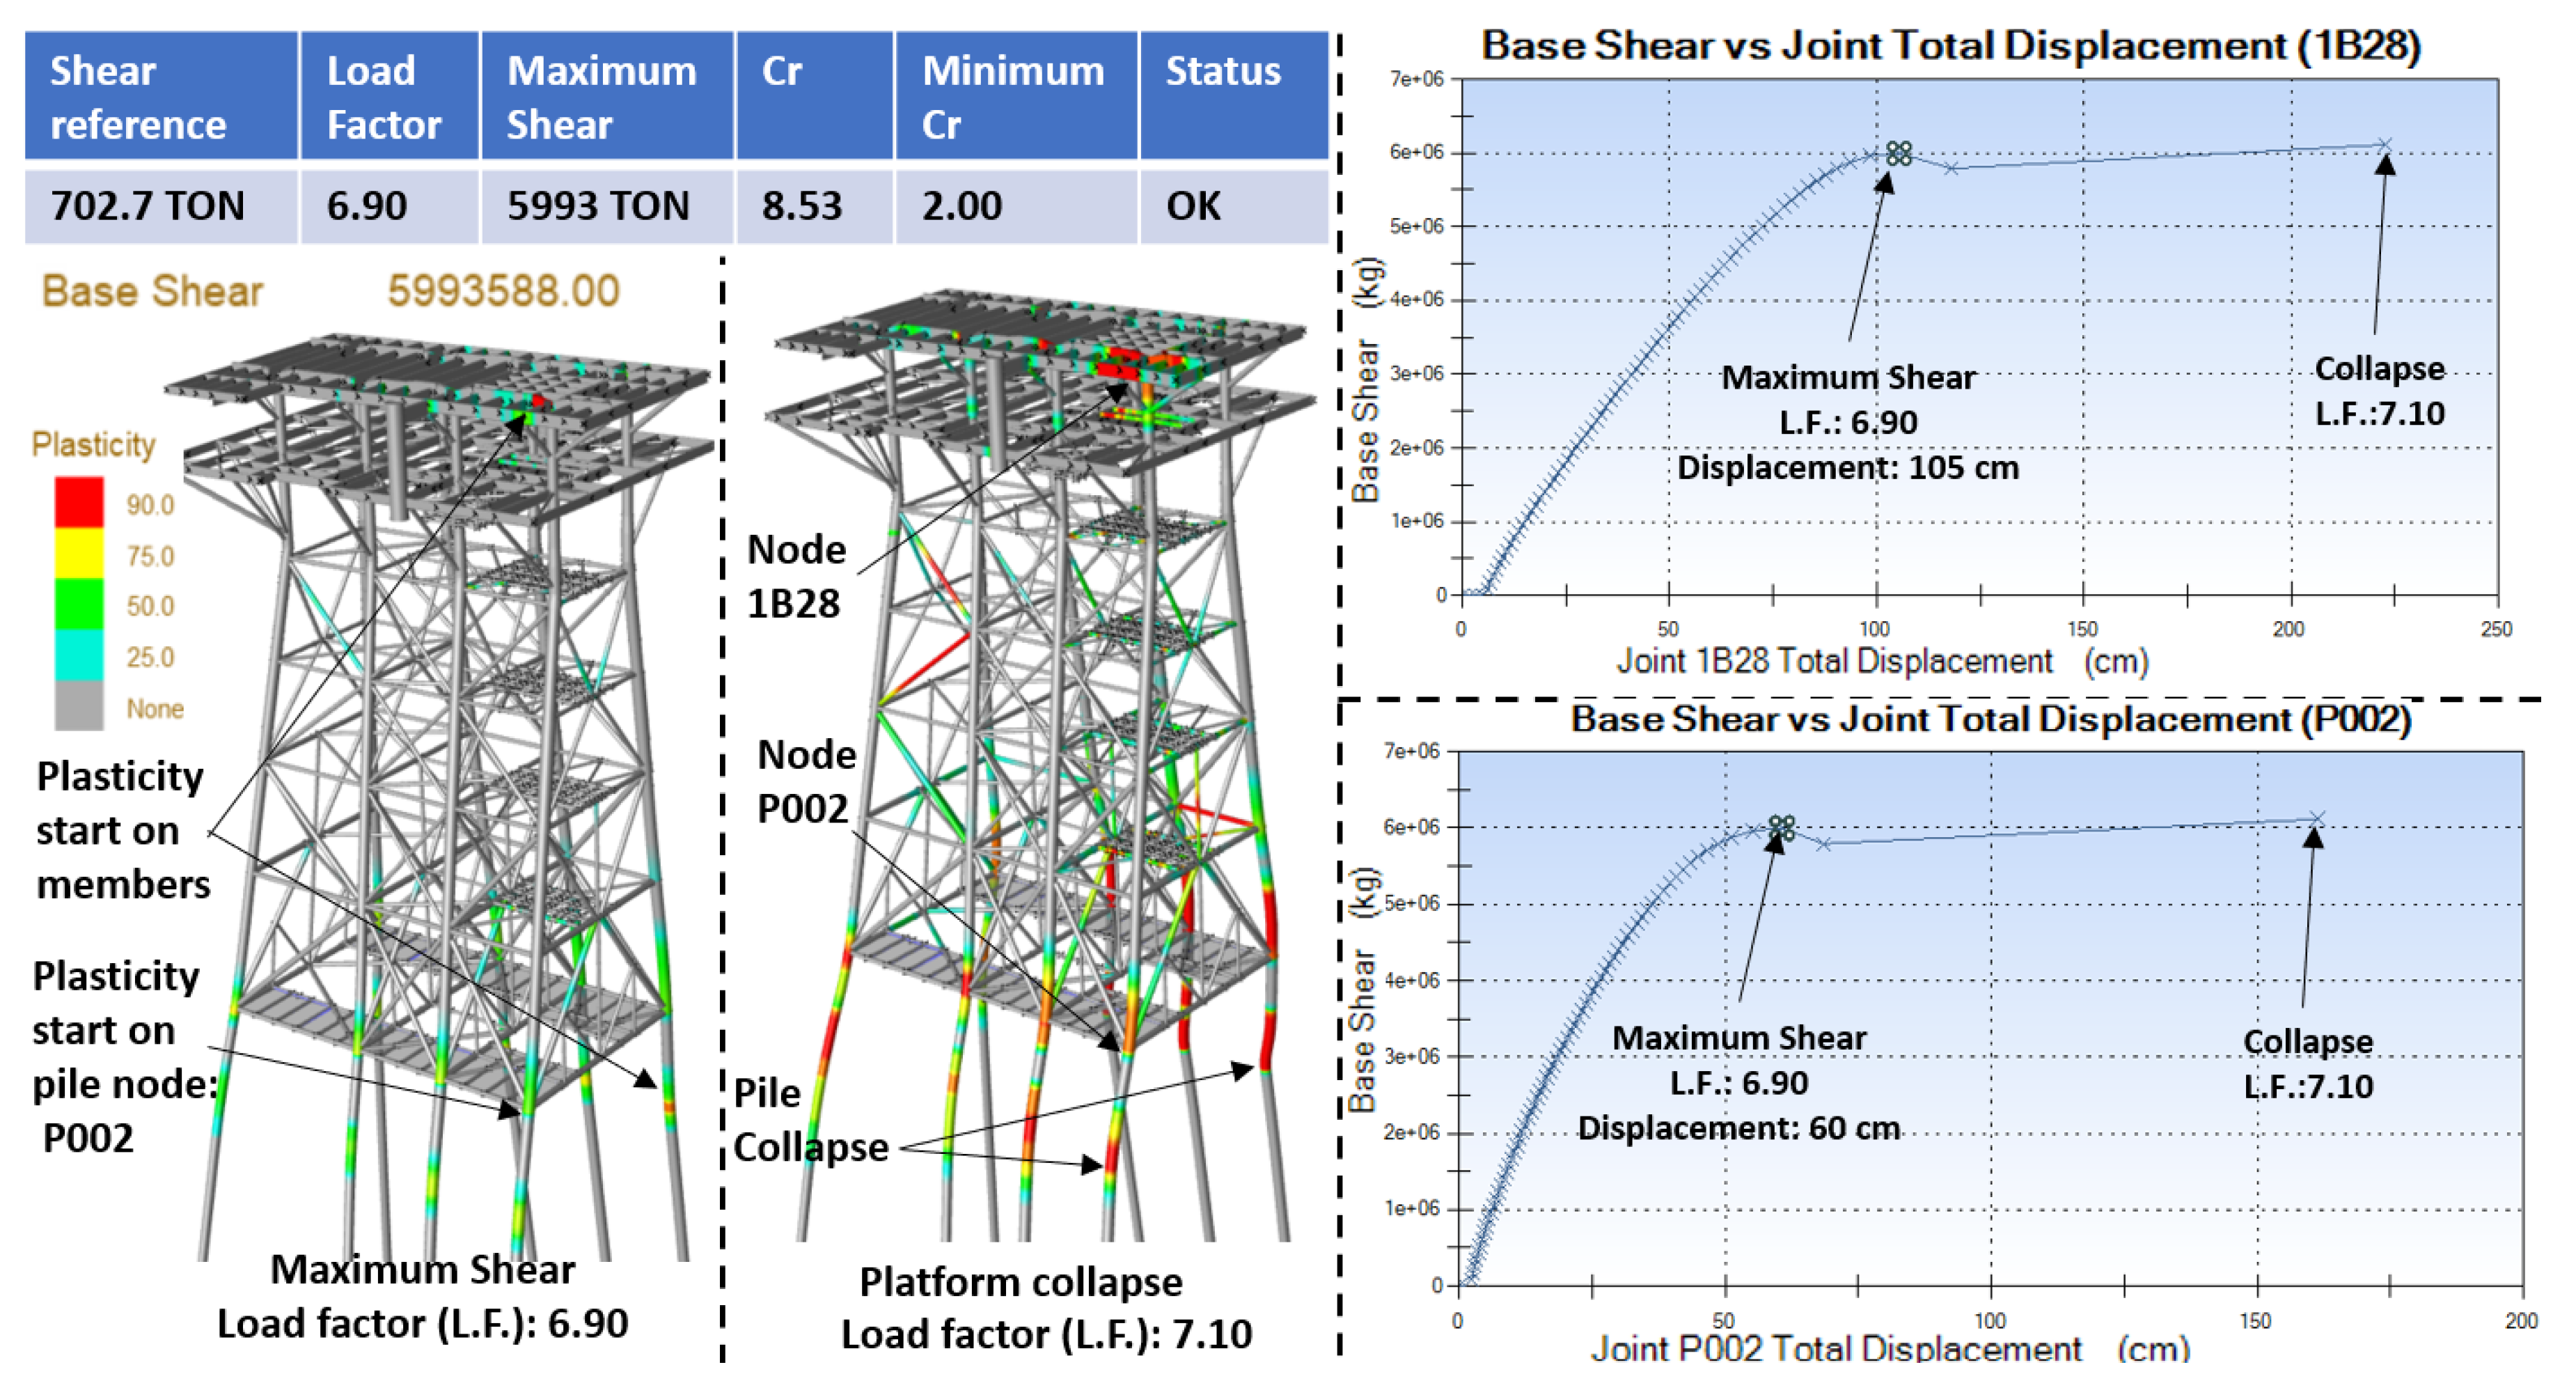
The seismic analysis by ductility is required to guarantee that the platform and its foundations can resist the equivalent of an earthquake of exceptional intensity, the aim is to determine the seismic reserve capacity factor, (Cr), by an incremental analysis of gravity and seismic loads (pushover), which must comply with the current regulations (Table 11.3-1 of ISO 19902: 2007). For knowing the collapse mechanism that will occur in the structure after having applied the incremental pushover analysis in the gravity and seismic loading conditions.
The seismic reserve capacity factor, Cr. This factor represents the capacity of a structure to sustain ground motions due to an earthquake beyond the reference level. It is defined as the ratio of spectral acceleration that causes structural collapse or catastrophic failure of the system to the spectral acceleration. For fixed steel offshore structures, the representative value of Cr can be estimated from the general design characteristics of a structure according to Table 11.3-1 of ISO 19902: 2007 “Petroleum and natural gas industries Fixed steel offshore structures.” the analysis has been performed for each of the 20 incident directions.
The maximum shear (load) is reached by applying a load of 6.90 to the earthquake. This value is divided by the reference shear obtained in the earthquake resistance analysis (see equation 3), with the most unfavorable direction being 270°, the other directions obtaining higher factors.
It is observed in
Figure 9 that by applying a load factor of 6.90 the earthquake reaches the maximum shear (5,993 tons), this is because in this step some elements in the topside near node 1B28 and the pile with node P002 begin to present plasticization, this causes the collapse mechanism to start; applying a load factor of 7.10 the platform collapses due to the plasticization of elements, on the other hand, the behavior of the foundation and piles is as follows, the maximum load capacity of the piles is for node P008 (axis B4) = 65.6% in tension and for compression at node P001 (axis A1) = 72.8%, both cases less than 100% of their load capacity
The nodes P002 (at the base of the piles) and 1B28 (in the beam-column connection of the second level) were graphed, in which the behavior in terms of force-deformation is shown. The graphs have a stable behavior up to the load factor of 6.90, reaching a displacement of 60 cm for node P002 and 105 cm in node 1B28, followed by the displacement increasing very drastically until reaching structural collapse by applying a load factor of 7.10.
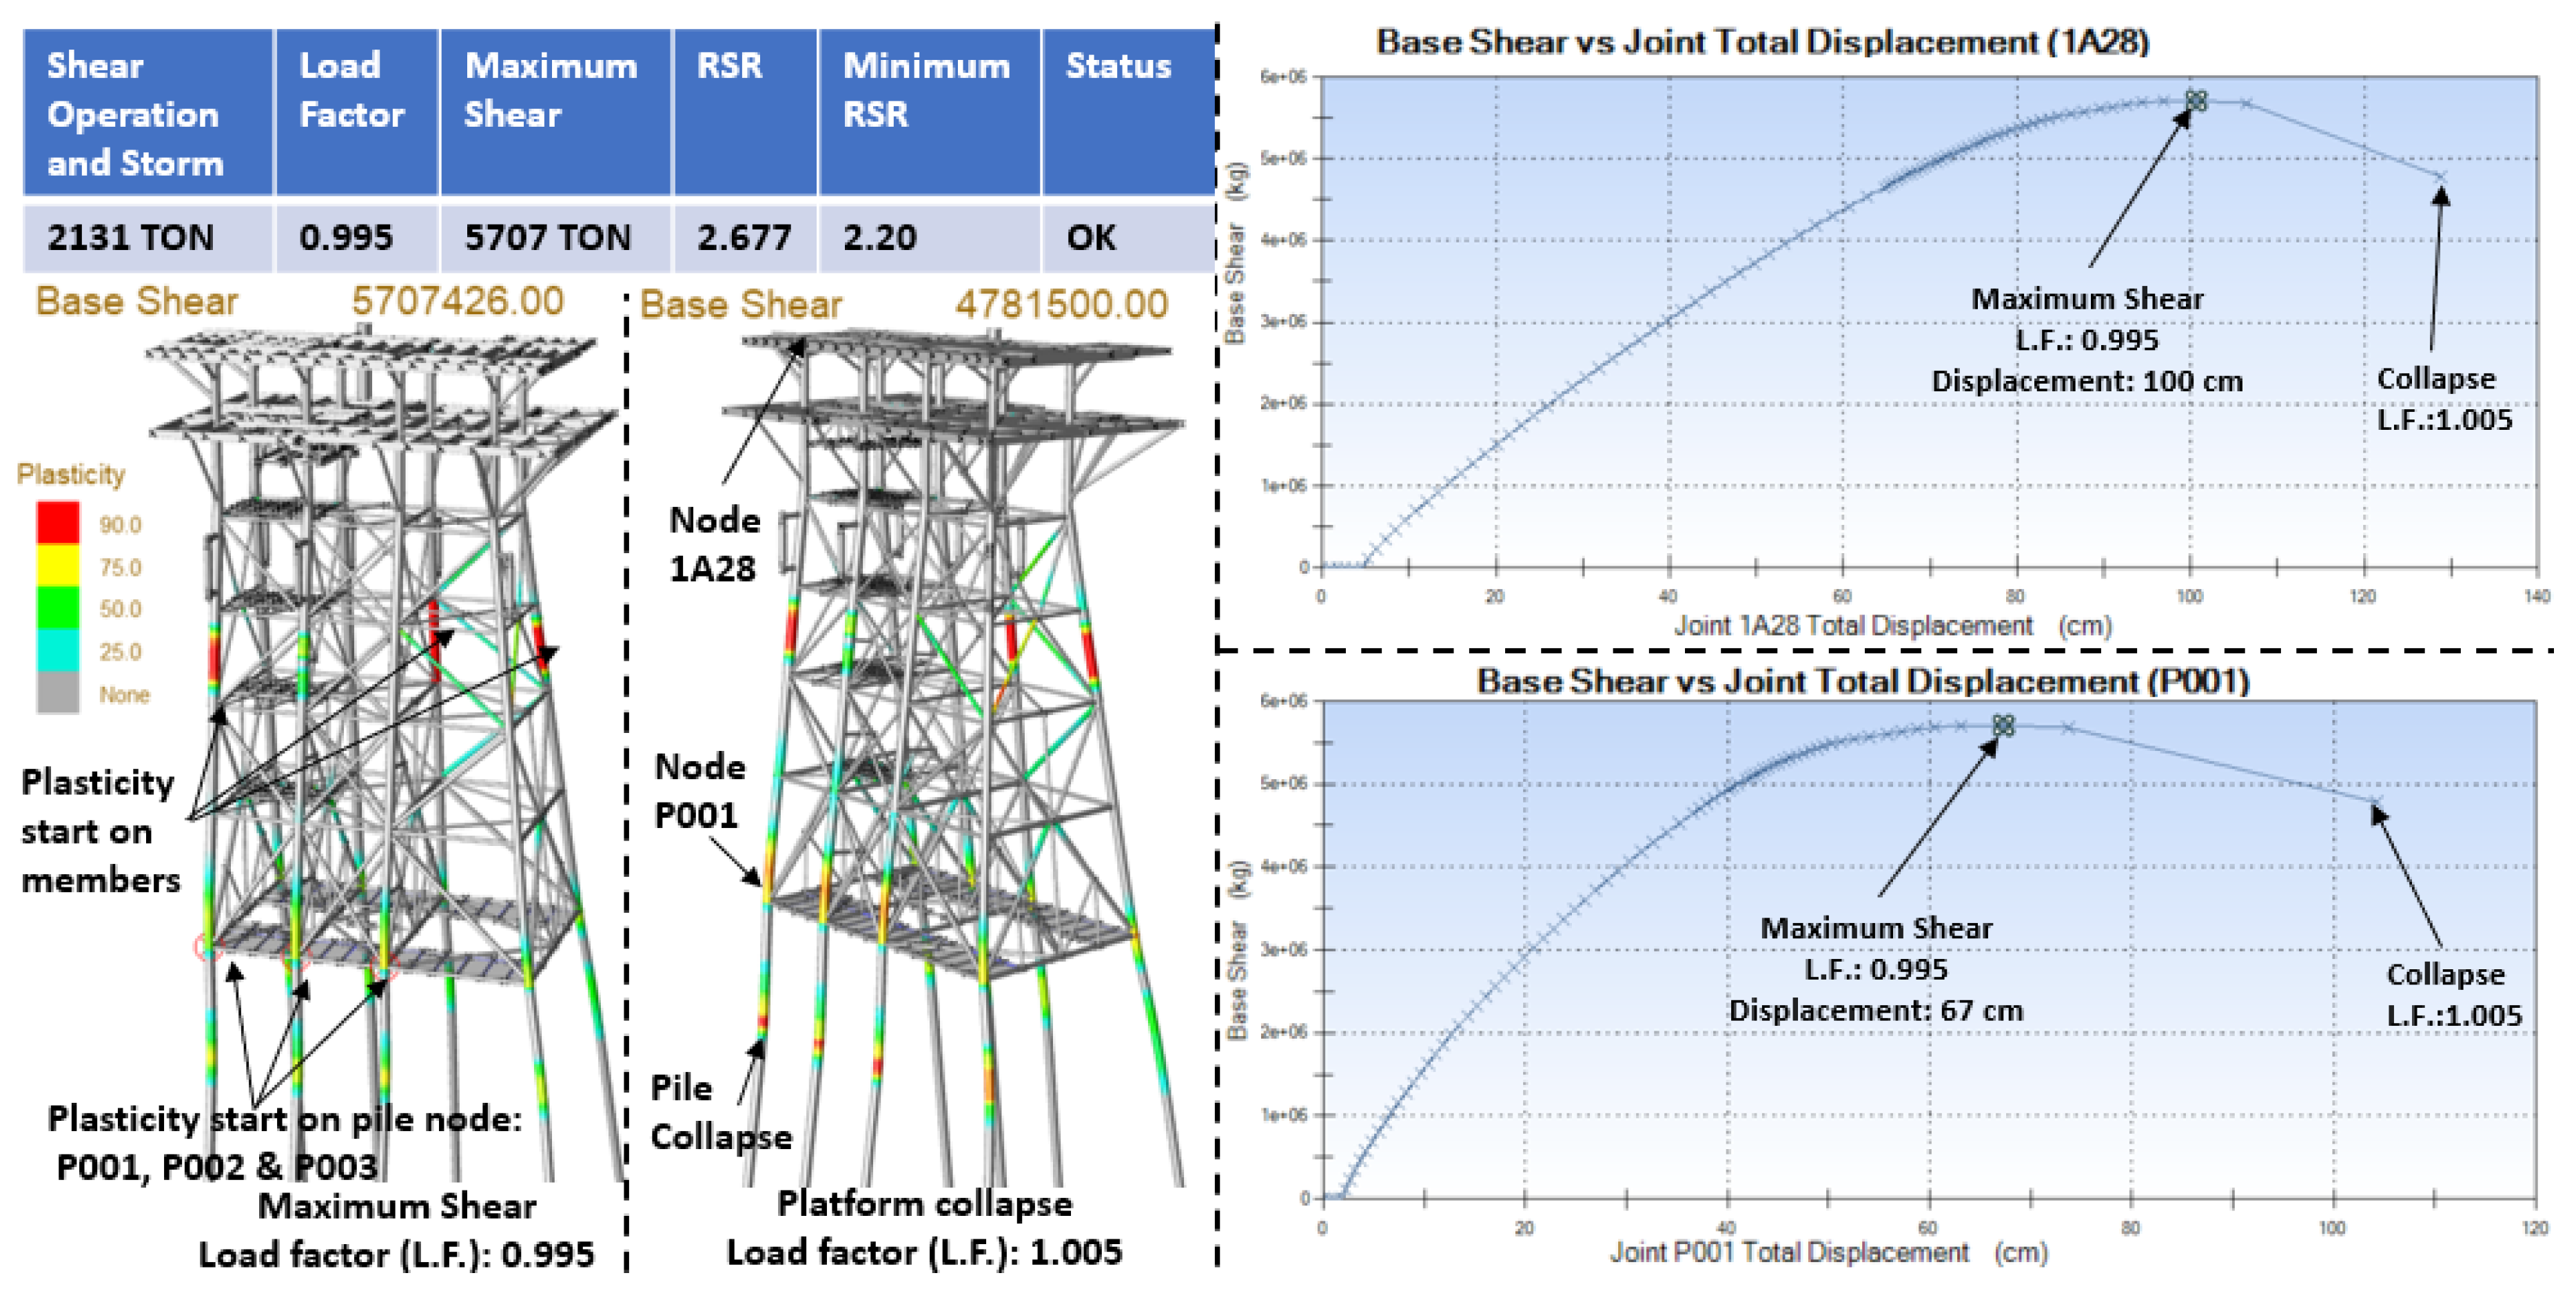
5.5. Ultimate Wave Resistance Analysis
The ultimate wave resistance was performed by applying an incremental load until the collapse mechanism of the platform was produced, using the nonlinear method of load increment (pushover), which was generated with the “COLLAPSE” module of the SACS (Structural Analysis Computer System) program, which considers the nonlinearity in the structure and foundation, because of the analysis, the Resistance Reserve Factor (RSR) is determined, which relates the lateral basal shear with which the structure collapses (ultimate design resistance wave) and the reference shear resulting from the design wave.
To calculate the RSR, the maximum shear before the collapse of the platform is obtained by dividing it by the shear from the operation and storm analysis. Below is an example of the calculation of the RSR for the 225° direction (see equation 4).
Table 8 shows the results of all the RSR’s, for all directions the collapse mechanism is due to plasticization of elements, for all directions the piles have load capacity since none reaches 100%,
Figure 10 and
Figure 11 show the platform with the maximum shear, followed by an image with the collapse of the platform, in the lateral graphs the load vs. the displacements are observed, the nodes graphed are at the base of the platform and at the column and beam connection of the second level of the platform.
It is observed in
Figure 10 that by applying a load factor of 1.020 the reaches the maximum shear (5,534 tons), this is because in this step some elements in the jacket and the pile with node P001 begin to present plasticization, this causes the collapse mechanism to start; applying a load factor of 1.035 the platform collapses due to the plasticization of elements, on the other hand, the behavior of the foundation and piles is as follows, the maximum load capacity of the pile is for node P007 = 63.1% in tension, less than 100% of their load capacity
The nodes P001 (at the base of the piles) and 1A28 (in the beam-column connection of the second level) were graphed, in which the behavior in terms of force-deformation is shown. The graphs have a stable behavior up to the load factor of 1.020, reaching a displacement of 77 cm for node P001 and 115 cm in node 1A28, followed by the displacement increasing very drastically until reaching structural collapse by applying a load factor of 1.035.
It is observed in
Figure 11 that by applying a load factor of 0.995 the reaches the maximum shear (5,707 tons), this is because in this step some elements in the jacket and the piles with nodes P001, P002 and P003, begin to present plasticization, this causes the collapse mechanism to start; applying a load factor of 1.005 the platform collapses due to the plasticization of elements, on the other hand, the behavior of the foundation and piles is as follows, the maximum load capacity of the pile is for node P008 = 84.6% in tension, less than 100% of their load capacity
The nodes P001 (at the base of the piles) and 1A28 (in the beam-column connection of the second level) were graphed, in which the behavior in terms of force-deformation is shown. The graphs have a stable behavior up to the load factor of 0.995, reaching a displacement of 67 cm for node P001 and 100 cm in node 1A28, followed by the displacement increasing very drastically until reaching structural collapse by applying a load factor of 1.035.
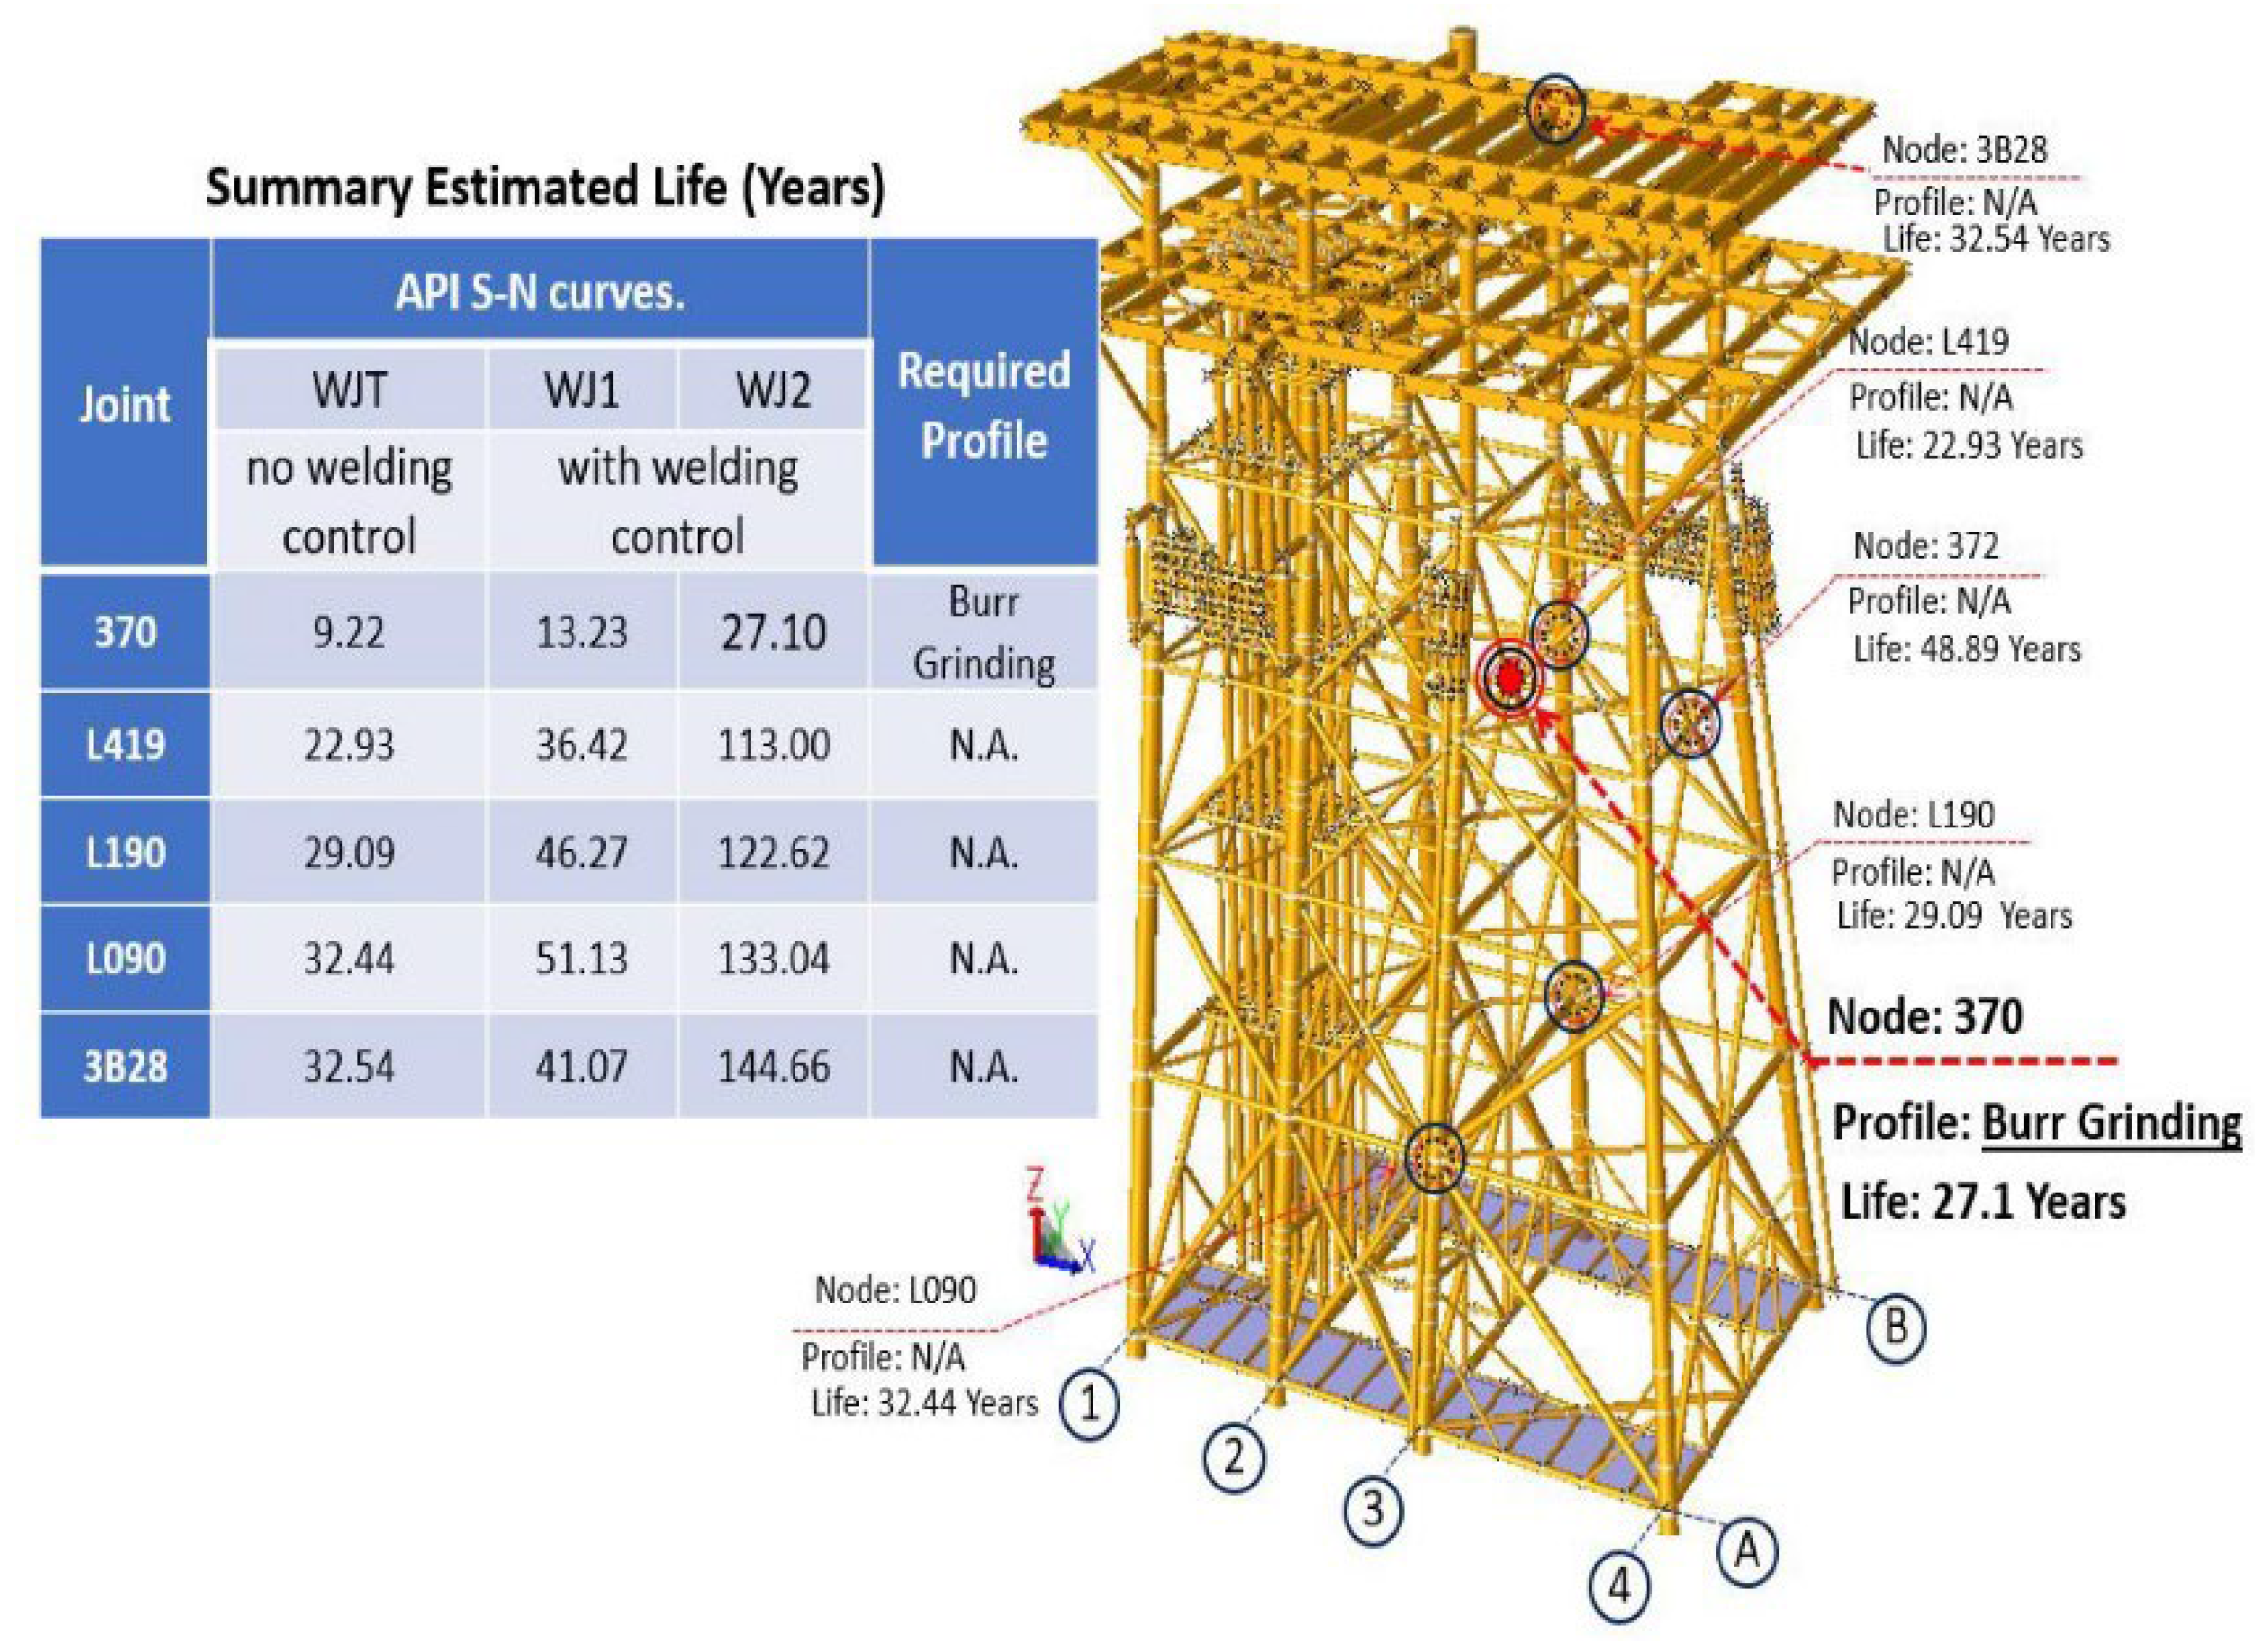
5.6. Fatigue Spectral
The purpose of the fatigue spectral analysis is to evaluate the stresses because of repeated or cyclic loads acting on the connections of the tubular elements that make up the structure, caused by the action of the gravity and environmental loads acting during its useful life, and to determine the design fatigue life of each joint and member, which should not be less than the expected useful life of the structure multiplied by a safety factor.
The theory based on the accumulation of fatigue damage (D) of Palmgren-miner, states that the amount of fatigue damage is got from the ratio between the number of cycles (lowest number that produces failure) of a stress range acting on a structure, n(s), and the number of cycles to the corresponding failure of the same, N(s). When the sum of the damage associated with each stress range is equal to or greater than unity, fatigue failure occurs.
The fatigue spectral method makes use of the wave incidence probability to determine the stress intervals and the number of cycles associated with these intervals, which act on the welds of the tubular joints of the structure. When the number of cycles of the stress intervals acting on the material is determined, it is possible to determine the damage they will produce by comparing them with the allowable cycles according to the data indicated in the S-N curves (Stress Interval vs. Number of Cycles).
Fatigue is calculated from the S-N curves of API RP 2A-WSD, 22nd Ed. [43] From which 4 specific curves are obtained, which are named WJ for tubular connections with steels with yield strength lower than 72 ksi, the first one is considered suitable for conventional tubular joints without strict weld control (WJT), the other three are applied for concave profiled welds whose values vary according to the technique used (WJ1, WJ2 and WJ3).
The results of the spectral fatigue analysis are shown below, as illustrated
Figure 12.
A summary of the analyzes is shown below, where the differences in the results can be observed, i.e., its structural behavior through the different scenarios that the platform will face during its useful life as illustrated into
Table 9.
6. Conclusions
From the research conducted, the following conclusions are derived:
In this paper, it can be seen how the stress interaction relationships in UC elements of the jacket, piles and safety factors in the foundation, are more unfavorable for the dynamic storm analysis, which considers the periods and percentages of mass participation, compared to the static operation and storm, which does not consider it; We can see that the joints have an almost identical behavior in the revision by resistance (revision without considering the acting load), where a greater change is appreciated is in the revision by penetration which considers the difference of loads acting on the element, finally we see how the hydrostatic collapse is presented in the three scenarios, this is because the collapse depends on the depth at which the submerged element is located, to solve this problem of collapse 1” rings are proposed to prevent the pipes from collapsing.
In the nonlinear analysis, it is observed that there is a large safety factor in the earthquake, compared to the ultimate wave resistance, proving that the greatest load that governs the design of offshore platforms in the Campeche Sound is the wave, i.e. the earthquake is not the most critical condition to design this type of structures.
In the predictive fatigue analysis, we observed that applying the first S-N curve (this analysis does not consider a control of the most unfavorable scenario weld) as all the joints comply with the minimum useful life, except joint 370, for this joint two additional analyzes were performed by changing the S-N curves (as marked by the API [43]) getting that joint 370 will comply with the minimum design life by applying a profiling control called “Burr Grinding”.
Based on the above, we can qualify the results as satisfactory and recommend that it is necessary to perform the 6 basic analyzes to always know the structural behavior of the platform during its useful life to determine its structural integrity.
Finally, this investigation proposed the necessity to install offshore platforms in new fields of exploitation.
Author Contributions
The first author led the development of the model, including its approach, analysis, design, and interpretation of the results. The first co-author provided significant input to the mathematical framework, while the second co-author carried out a thorough review. Ultimately, all authors collaborated in formulating the conclusions derived from the research findings.
Funding
No internal or external funding was allocated to this research project. Nevertheless, its realization was made possible by the postgraduate scholarship awarded to the first author and the financial incentives granted to the first and second co-authors for their membership in the National System of Researchers under Autonomous University of Carmen (UNACAR).
Institutional Review Board Statement
Not applicable.
Informed Consent Statement
Not applicable.
Data Availability Statement
Not applicable.
Acknowledgments
The authors, Rodrigo Daniel Alvarez-Bello Martínez, Juan Antonio Álvarez-Arellano, Youness El-Hamzaoui, express their gratitude for the support provided by the Consejo Nacional de Humanidades, Ciencias y Tecnologías (CONAHCYT), the Programa para el Desarrollo Profesional Docente (PRODEP) and the Grupo Disciplinar Ingeniería estructural aplicada e ingeniería de la construcción y sus procesos sustentables through Universidad Autónoma del Carmen (UNACAR).
Conflicts of Interest
The authors declare no conflict of interest.
References
- Petróleos Mexicanos. (s.f.). Estadísticas petroleras.
- Petróleos Mexicanos. (s.f.). Volumen de las exportaciones de petróleo crudo.
- Petróleos Mexicanos. (s.f.). Valor de las exportaciones de petróleo crudo.
- Petróleos Mexicanos (2023). Plan de negocios 2023-2027. 2023–2027.
- Ersdal, G.; Sharp, J.V.; Stacey, Alexander. Ageing and Life Extension of Offshore Structures: The Challenge of Managing Structural Integrity, 1st Ed., Wiley, US, 2019.
- Viero, P.F.; Roitman, N. Application of some damage identification methods in offshore platforms. Mar. Struct. 1999, 12, 107–126. [Google Scholar] [CrossRef]
- Onoufriou, T. Reliability based inspection planning of offshore structures. Mar. Struct. 1999, 12, 521–539. [Google Scholar] [CrossRef]
- Lotsberg, I.; Sigurdsson, G.; Fjeldstad, A.; Moan, T. Probabilistic methods for planning of inspection for fatigue cracks in offshore structures. Mar. Struct. 2016, 46, 167–192. [Google Scholar] [CrossRef]
- Mojtahedi, A.; Lotfollahi Yaghin, M.A.; Ettefagh, M.M.; Hassanzadeh, Y.; Fujikubo, M. Detection of nonlinearity effects in structural integrity monitoring methods for offshore jacket-type structures based on principal component analysis. Mar. Struct. 2013, 33, 100–119. [Google Scholar] [CrossRef]
- Mousavi, M.; Gardoni, P. A simplified method for reliability- and integrity-based design of engineering systems and its application to offshore mooring systems. Mar. Struct. 2014, 36, 88–104. [Google Scholar] [CrossRef]
- Lotsberg, I.; Olufsen, O.; Solland, G.; Dalane, J.I.; Haver, S. Risk assessment of loss of structural integrity of a floating production platform due to gross errors. Mar. Struct. 2004, 17, 551–573. [Google Scholar] [CrossRef]
- Aeran, A.; Siriwardane, S.C.; Mikkelsen, O.; et al. A framework to assess structural integrity of ageing offshore jacket structures for life extension. Mar. Struct. 2017, 56, 37–259. [Google Scholar] [CrossRef]
- Ramasamy, R.; Ibrahim, Z.; Chai, H.K. Screening method for platform conductor integrity assessment for life extension prioritisation. Mar. Struct. 2018, 58, 136–153. [Google Scholar] [CrossRef]
- Vaz, M.A.; Cyrino, C.R.; Hernández, I.D. Experimental and numerical analyses of the ultimate compressive strength of perforated offshore tubular members. Mar. Struct. 2018, 58, 1–17. [Google Scholar] [CrossRef]
- Zeinoddini, M.; Yaghubi Namin, Y.; Nikoo, H.M.; Estekanchi, H.; Kimiaei, M. An EWA framework for the probabilistic-based structural integrity assessment of offshore platforms. Mar. Struct. 2018, 59, 60–79. [Google Scholar] [CrossRef]
- Guédé, F. Risk-based structural integrity management for offshore jacket platforms. Mar. Struct. 2019, 58, 444–446. [Google Scholar] [CrossRef]
- Tabeshpour, R.; Fatemi, M. Optimum arrangement of braces in jacket platform based on strength and ductility. Mar. Struct. 2020, 71, 102734. [Google Scholar] [CrossRef]
- Adamkowski, A.; Lewandowski, M.; Lewandowski, S. Fatigue life analysis of hydropower pipelines using the analytical model of stress concentration in welded joints with angular distortions and considering the influence of water hammer damping. Thin-Walled Structures 2021, 159, 107350. [Google Scholar] [CrossRef]
- Gao, S.; Guo, L.; Zhang, S.; et al. Performance degradation of circular thin-walled CFST stub columns in high-latitude offshore region. Thin-Walled Structures 2020, 154, 106906. [Google Scholar] [CrossRef]
- Liu, L.; Yang, D.Y.; Frangopol, D.M. Ship service life extension considering ship condition and remaining design life. Marine Structures 2021, 78, 102940. [Google Scholar] [CrossRef]
- Diseño y evaluación de plataformas marinas fijas en el golfo de México, especificación técnica interna para proyecto de obras, “P.2.0130.01:2015” segunda edición, Agosto de 2015.
- Ahmadi, H.; Zavvar, E. Stress concentration factors induced by out-of-plane bending loads in ring-stiffened tubular KT-joints of jacket structures. Thin-Walled Structures 2015, 91, 82–95. [Google Scholar] [CrossRef]
- Ahmadi, H.; Mohammadi, A.H.; Yeganeh, A. Probability density functions of SCFs in internally ring-stiffened tubular KT-joints of offshore structures subjected to axial loading. Thin-Walled Structures 2015, 94, 485–499. [Google Scholar] [CrossRef]
- Leheta, H.W.; Farouk Badran, S.; Shawki Elhanafi, A. Ship structural integrity using new stiffened plates. Thin-Walled Structures 2015, 94, 545–561. [Google Scholar] [CrossRef]
- Asgarian, B.; Aghaeidoost, V.; Rahman Shokrgozar, H. Damage detection of jacket type offshore platforms using rate of signal energy using wavelet packet transform. Marine Structures 2016, 45, 1–21. [Google Scholar] [CrossRef]
- Mohammad, S.F.; Galgoula, N.S.; Starossek, U.; Videiro, P.M. An efficient time domain fatigue analysis and its comparison to spectral fatigue assessment for an offshore jacket structure. Marine Structures 2016, 49, 97–115. [Google Scholar] [CrossRef]
- Pérez, R.; Rodríguez, R.; Vázquez-Hernández, A.O. Damage detection in offshore jacket platforms with limited modal information using the Damage Submatrices Method. Marine Structures 2017, 55, 78–103. [Google Scholar] [CrossRef]
- Dodaran, N.A.; Ahmadi, H.; Lotfollahi-Yaghin, M. Parametric study on structural behavior of tubular K-joints under axial loading at fire-induced elevated temperatures. Thin-Walled Structures 2018, 130, 467–486. [Google Scholar] [CrossRef]
- Tu, Y.; Cheng, Z.; Muskulus, M. A global slamming force model for offshore wind jacket structures. Marine Structures 2018, 60, 201–217. [Google Scholar] [CrossRef]
- Hüsken, G.; Shamsuddoha, M.; Pirskawetz, S.; Hofmann, D.; Baeßler, M.; Kühne, H.-C. Potential of a repair system for grouted connections in offshore structures: Development and experimental verification. Marine Structures 2021, 77, 102934. [Google Scholar] [CrossRef]
- Amiri, N.; Shaterabadi, M.; Reza Kashyzadeh, K.; Chizari, M.A. Comprehensive Review on Design, Monitoring, and Failure in Fixed Offshore Platforms. J. Mar. Sci. Eng. 2021, 9, 1349. [Google Scholar] [CrossRef]
- Sidiq, R.B.; Utomo, C.; Silvianita. Determining Factors of Fixed Offshore Platform Inspections in Indonesia. Appl. Sci. 2023, 13, 737. [Google Scholar] [CrossRef]
- Kazeminezhad, M.H.; Ghavanini, F.A. Operational wave forecasting for extreme conditions in the Arabian Sea – A comparison with buoy and satellite data. Ocean Eng 2023, 275. [Google Scholar] [CrossRef]
- Alizadeh, A.; Daghigh, M.; Bali, M.; Golpour, H.; Kazeminezhad, M.H. A framework for implementing structural integrity management of an ageing fixed offshore platform using wave modeling for risk-based underwater inspection provision. Ocean Eng 2024, 309. [Google Scholar] [CrossRef]
- API (2014). American Petroleum Institute, Recommended Practice for Planning, Designing and Constructing Fixed Offshore Platforms –Working Stress Design, API RP 2A-WSD, Twenty-second edition, November 2014.
- Fenton, J.D. A high-order cnoidal wave theory. Journal of Fluid Mechanics 1979, 94, 129–161. [Google Scholar] [CrossRef]
- Atkins Engineering Services (1990). Fluid Loading on Fixed Offshore Structures, OTH 90 322. 1990.
- Chakrabarti, S.K. Handbook of offshore engineering, Vol. 1. 1st Edition; Elsevier Science, US, 2005.
Figure 1.
Components and loads of a Jacket Type Marine Platform.
Figure 1.
Components and loads of a Jacket Type Marine Platform.
Figure 2.
Basic Analysis to Determine Structural Integrity.
Figure 2.
Basic Analysis to Determine Structural Integrity.
Figure 3.
Sequence of execution of analyzes in sacs software.
Figure 3.
Sequence of execution of analyzes in sacs software.
Figure 4.
Period and frequencies, platform.
Figure 4.
Period and frequencies, platform.
Figure 5.
Graph of obtaining range of stress.
Figure 5.
Graph of obtaining range of stress.
Figure 6.
Summary of static storm and operation analysis results.
Figure 6.
Summary of static storm and operation analysis results.
Figure 7.
Dynamic storm analysis results summary.
Figure 7.
Dynamic storm analysis results summary.
Figure 8.
Summary of resistance level seismic analysis results.
Figure 8.
Summary of resistance level seismic analysis results.
Figure 9.
Summary of ductility level seismic analysis results (270°).
Figure 9.
Summary of ductility level seismic analysis results (270°).
Figure 10.
Results of the ultimate wave resistance analysis, direction 180°.
Figure 10.
Results of the ultimate wave resistance analysis, direction 180°.
Figure 11.
Results of the ultimate wave resistance analysis, direction 225°.
Figure 11.
Results of the ultimate wave resistance analysis, direction 225°.
Figure 12.
Summary estimated life (Years) using API S-N curves.
Figure 12.
Summary estimated life (Years) using API S-N curves.
Table 1.
Loads of a Jacket Type Marine Platform.
Table 1.
Loads of a Jacket Type Marine Platform.
| Load case |
LOAD CASE DESCRIPTION |
Weight
“Ton” |
| 1 |
Selfweight structure (Does not include flotation or marine growth) |
3,574.90 |
| 2 |
Dead load on jacket |
263.96 |
| 3 |
Dead load on topside (deck) |
405.92 |
| 4 |
Live load on topside (deck) |
1,065.13 |
| 5 |
Dead load of equiment empty on topside (deck) |
464.69 |
| 6 |
Live load of equipment on topside (deck) |
274.57 |
| 7 |
Piping, electrical & instrumentation load on topside |
36.30 |
| 8 |
Dead load of equipment drilling |
2,069.69 |
| 9 |
Dead load of drilling tower “Position 1” |
944.00 |
| 10 |
Dead load of drilling tower “Position 2” |
944.00 |
| 11 |
Dead load of drilling tower “Position 3” |
944.00 |
| 12 |
Live load of equipment drilling |
1,687.53 |
| 13 |
Load increase per operation of drilling tower “Position 1” |
796.00 |
| 14 |
Load increase per operation of drilling tower “Position 2” |
796.00 |
| 15 |
Load increase per operation of drilling tower “Position 3” |
796.00 |
| 16-23 |
Wave, current and wind @45° operation |
|
| 24-31 |
Wave, current and wind @45° Extreme storm |
|
| R001-R008 |
Wave, current and wind @45° Ultimate resistance to waves |
|
| S000-S342 |
Seismic Environmental Loads |
|
Table 2.
Environmental parameters.
Table 2.
Environmental parameters.
| Description |
OPERATION |
EXTREME |
PUSHOVER |
| parameter |
Reference |
parameter |
Reference |
parameter |
factor |
total |
| Maximum wave height (m): |
7.60 |
*Figure 20 |
16.20 |
*Figure 13 |
16.20 |
1.38 |
22.36 |
| Wave period (s): |
8.20 |
*Table 17 |
12.18 |
*Sec. A.1.1 |
12.18 |
1.12 |
13.64 |
| Astronomical tide (m): |
0.76 |
*Table 17 |
0.76 |
*Sec. A.1.1 |
0.76 |
1.00 |
0.76 |
| Tide storm (m): |
0.30 |
*Table 17 |
0.62 |
*Figure 15 |
0.62 |
1.51 |
0.94 |
| Water depth (m): |
50.40 |
|
50.40 |
|
50.40 |
|
50.40 |
| Water depth including tides (m) |
51.46 |
|
51.78 |
|
51.78 |
|
52.10 |
| wave theory |
steam funtion 3 |
steam funtion 5 |
steam funtion 7 |
| Current speeds (cm/s): |
|
|
|
| At 0% depth: |
30.00 |
*Figure 17 |
125.00 |
*Figure 16 |
125.00 |
2.04 |
255.00 |
| At 50% depth: |
25.00 |
112.00 |
112.00 |
2.04 |
228.48 |
| At 95% depth: |
18.00 |
100.00 |
100.00 |
2.04 |
204.00 |
| Maximum wind speed at 10 m SNMM (m/s), 1 hr average: |
14.00 |
*Figure 17 |
31.00 |
*Figure 14 |
31.00 |
1.40 |
43.40 |
| *Values taken from the Specification of Pemex “P.2.0130.01:2015” [21] |
Table 3.
Coefficient parameters.
Table 3.
Coefficient parameters.
| Coefficients |
|---|
| Wave kinematics coefficient: |
1.00 |
*Sec. 8.3.2.2 |
| Drag coefficient (Cd): |
1.05 |
| Coefficient of inertia (cm.): |
1.20 |
| Marine growth |
| Elevation Interval Regarding NMM (m) |
Hard Marine Growth Thickness (cm) |
| (+) 1.00 A (-) 20.00 |
7.50 |
*Table 3 |
| (-) 20.00 A (-) 50.00 |
5.50 |
| (-) 50.00 A (-) 80.00 |
3.50 |
| Blocking Factor for Currents |
| # columns |
Direction |
Factor |
|
| 8 |
Longitudinal |
0.80 |
**Table 5.2 |
| Diagonal |
0.85 |
| Crossover |
0.80 |
| Wind Shape coefficients |
| Area |
Shape coefficients |
| Beams |
1.50 |
**Tabla 5.4 |
| Module surfaces |
1.50 |
| Cylindrical Sections |
0.50 |
| Total Platform Area |
1.00 |
| *Values taken from the Specification of Pemex “P.2.0130.01:2015” [21] |
| **Values taken from the “API RP 2A WSD 22ed” [35] |
Table 4.
Types of Analysis.
Table 4.
Types of Analysis.
| Item |
Description |
Linear analysis |
NO-Linear analysis |
predictive |
5.1
Operational and Static Storm |
5.2
Dynamic Storm |
5.3
Seismic
Resistance |
5.4
Ultimate
Wave |
5.5
seismic
ductility |
5.6
Fatigue
spectral |
| 3.0 |
Analysis static |
X |
|
|
|
|
|
| 3.1. |
Pile supper element |
|
X |
X |
|
|
X |
| 3.2. |
Obtaining
dynamic |
|
X |
X |
|
|
X |
| 3.3.1 |
Dynamic wave |
|
X |
|
|
|
|
| 3.3.2 |
Seismic spectrum response |
|
|
X |
|
|
|
| 3.3.3 |
Transfer function |
|
|
|
|
|
X |
| 4.0 |
Analysis
pushover |
|
|
|
X |
X |
|
| 5.0 |
Results |
X |
X |
X |
X |
X |
X |
Table 5.
Period and frequencies, platform.
Table 5.
Period and frequencies, platform.
| MODE |
FREQUENCIES AND GENERALIZED MASS |
MASS PARTICIPATION FACTOR REPORT
BASED ON EXPANDED DEGREES OF FREEDOM |
| FREQ. (CPS) |
GEN. MASS |
EIGENVALUE |
PERIOD (SECS) |
MASS PARTICIPATION FACTORS |
CUMULATIVE FACTORS |
| X |
Y |
Z |
X |
Y |
Z |
| 1 |
0.369399 |
8.42E+03 |
1.86E-01 |
2.7070989 |
0.838561 |
0.000373 |
0.000517 |
0.838561 |
0.000373 |
0.000517 |
| 2 |
0.394287 |
7.65E+03 |
1.63E-01 |
2.5362264 |
0.000461 |
0.794025 |
0.000020 |
0.839022 |
0.794398 |
0.000537 |
| 3 |
0.477673 |
5.17E+03 |
1.11E-01 |
2.0934819 |
0.001617 |
0.000832 |
0.000003 |
0.840639 |
0.795229 |
0.000540 |
| 4 |
0.932655 |
1.89E+04 |
2.91E-02 |
1.0722076 |
0.018467 |
0.000261 |
0.000051 |
0.859105 |
0.795490 |
0.000590 |
| 5 |
1.054308 |
5.66E+03 |
2.28E-02 |
0.9484895 |
0.000139 |
0.180755 |
0.000258 |
0.859244 |
0.976245 |
0.000848 |
| 6 |
1.157719 |
6.14E+03 |
1.89E-02 |
0.8637675 |
0.121645 |
0.000030 |
0.001271 |
0.980889 |
0.976275 |
0.002120 |
| 7 |
1.302983 |
3.18E+03 |
1.49E-02 |
0.7674697 |
0.000290 |
0.003258 |
0.000013 |
0.981180 |
0.979533 |
0.002133 |
| 8 |
1.459729 |
6.29E+03 |
1.19E-02 |
0.6850586 |
0.000239 |
0.000215 |
0.000378 |
0.981418 |
0.979748 |
0.002510 |
| 9 |
1.661087 |
3.03E+03 |
9.18E-03 |
0.6020153 |
0.000000 |
0.000005 |
0.000049 |
0.981418 |
0.979753 |
0.002559 |
| 10 |
2.382828 |
2.03E+03 |
4.46E-03 |
0.4196695 |
0.000823 |
0.002457 |
0.086971 |
0.982242 |
0.982210 |
0.089530 |
| 11 |
2.409303 |
4.49E+03 |
4.36E-03 |
0.4150579 |
0.000007 |
0.012004 |
0.001183 |
0.982248 |
0.994215 |
0.090713 |
| 12 |
2.426896 |
6.38E+03 |
4.30E-03 |
0.4120489 |
0.006888 |
0.000233 |
0.522803 |
0.989136 |
0.994447 |
0.613516 |
| 13 |
2.5682 |
4.83E+03 |
3.84E-03 |
0.3893777 |
0.004847 |
0.000046 |
0.304267 |
0.993983 |
0.994493 |
0.917783 |
| 14 |
3.317563 |
3.26E+03 |
2.30E-03 |
0.3014261 |
0.000161 |
-0.000009 |
0.001590 |
0.994144 |
0.994485 |
0.919373 |
| 15 |
3.491456 |
3.47E+03 |
2.08E-03 |
0.2864135 |
0.000886 |
0.000038 |
0.005239 |
0.995030 |
0.994523 |
0.924611 |
| 16 |
3.745607 |
3.87E+03 |
1.81E-03 |
0.2669794 |
0.000009 |
0.000396 |
0.000428 |
0.995039 |
0.994918 |
0.925039 |
| 17 |
4.019744 |
3.31E+02 |
1.57E-03 |
0.2487721 |
0.000018 |
0.003282 |
0.000214 |
0.995057 |
0.998200 |
0.925253 |
| 18 |
4.062873 |
2.34E+02 |
1.53E-03 |
0.2461312 |
0.004864 |
0.000017 |
0.000016 |
0.999921 |
0.998217 |
0.925270 |
| 19 |
4.089537 |
1.87E+02 |
1.51E-03 |
0.2445264 |
0.000009 |
0.000000 |
0.000001 |
0.999930 |
0.998217 |
0.925270 |
| 20 |
4.105793 |
1.82E+02 |
1.50E-03 |
0.2435583 |
0.000007 |
0.000000 |
0.000010 |
0.999937 |
0.998217 |
0.925280 |
| 21 |
4.109676 |
2.45E+02 |
1.50E-03 |
0.2433282 |
0.000003 |
0.000000 |
0.000001 |
0.999940 |
0.998218 |
0.925282 |
| 22 |
4.121228 |
1.99E+02 |
1.49E-03 |
0.2426461 |
0.000022 |
0.000000 |
0.000000 |
0.999962 |
0.998218 |
0.925282 |
| 23 |
4.1339 |
1.41E+02 |
1.48E-03 |
0.2419023 |
0.000000 |
0.000038 |
0.000016 |
0.999962 |
0.998256 |
0.925298 |
| 24 |
4.138429 |
1.63E+02 |
1.48E-03 |
0.2416376 |
0.000000 |
0.000000 |
0.000000 |
0.999962 |
0.998256 |
0.925298 |
| 25 |
4.14046 |
1.50E+02 |
1.48E-03 |
0.2415191 |
0.000000 |
0.000000 |
0.000000 |
0.999962 |
0.998256 |
0.925298 |
| 26 |
4.142018 |
1.67E+02 |
1.48E-03 |
0.2414282 |
0.000000 |
0.000010 |
0.000004 |
0.999962 |
0.998266 |
0.925302 |
| 27 |
4.143043 |
2.05E+02 |
1.48E-03 |
0.2413685 |
0.000033 |
0.000001 |
0.000000 |
0.999995 |
0.998267 |
0.925302 |
| 28 |
4.1474 |
1.56E+02 |
1.47E-03 |
0.2411149 |
0.000000 |
0.000000 |
0.000000 |
0.999995 |
0.998267 |
0.925302 |
| 29 |
4.148291 |
7.97E+01 |
1.47E-03 |
0.2410631 |
0.000000 |
0.000013 |
0.000007 |
0.999995 |
0.998280 |
0.925310 |
| 30 |
4.150421 |
1.61E+02 |
1.47E-03 |
0.2409394 |
0.000005 |
0.000000 |
0.000000 |
1.000000 |
0.998280 |
0.925310 |
Table 6.
Numerical data of the acceleration spectrum.
Table 6.
Numerical data of the acceleration spectrum.
| CAMPECHE BAY |
|---|
| Period (second “s” ) |
Acceleration “α” (g’s) |
| 0.010 – 0.050 |
0.100 |
| 0.125 – 0.504 |
0.250 |
| 10 |
0.013 |
| Numerical data of the acceleration spectrum for a return period of 200 years and a critical damping coefficient of 5% |
| * Values taken from the Specification of Pemex “P.2.0130.01:2015” |
Table 7.
Shear and moment versus direction, damping 2% vs damping 5%.
Table 7.
Shear and moment versus direction, damping 2% vs damping 5%.
| ANGLE DEG |
DAMPING 2% |
DAMPING 5% |
| Base shear |
Overturning
moment |
Vertical load |
Base shear |
Overturning
moment |
Vertical load |
| TON |
TON -M |
TON |
TON |
TON -M |
TON |
| 0 |
679.44 |
22125.67 |
1314.98 |
687.62 |
22511.32 |
1509.55 |
| 18 |
684.58 |
23456.37 |
1314.98 |
696.19 |
24285.96 |
1509.55 |
| 36 |
691.14 |
25278.76 |
1314.98 |
704.34 |
26822.54 |
1509.55 |
| 54 |
696.29 |
27093.88 |
1314.98 |
708.53 |
29189.43 |
1509.55 |
| 72 |
698.00 |
28528.01 |
1314.98 |
706.65 |
30995.49 |
1509.55 |
| 90 |
698.52 |
28694.71 |
1314.98 |
702.72 |
31175.57 |
1509.55 |
| 108 |
700.27 |
28380.62 |
1314.98 |
708.20 |
30864.82 |
1509.55 |
| 126 |
697.40 |
26880.03 |
1314.98 |
709.17 |
29026.76 |
1509.55 |
| 144 |
691.04 |
24578.74 |
1314.98 |
704.21 |
26117.74 |
1509.55 |
| 162 |
684.76 |
22247.35 |
1314.98 |
696.73 |
23031.73 |
1509.55 |
| 180 |
679.44 |
22125.67 |
1314.98 |
687.62 |
22511.32 |
1509.55 |
| 198 |
684.58 |
23456.37 |
1314.98 |
696.19 |
24285.96 |
1509.55 |
| 216 |
691.14 |
25278.75 |
1314.98 |
704.34 |
26822.54 |
1509.55 |
| 234 |
696.29 |
27093.87 |
1314.98 |
708.53 |
29189.42 |
1509.55 |
| 252 |
698.00 |
28528.01 |
1314.98 |
706.65 |
30995.49 |
1509.55 |
| 270 |
698.52 |
28694.71 |
1314.98 |
702.72 |
31,175.57 |
1509.55 |
| 288 |
700.27 |
28380.62 |
1314.98 |
708.20 |
30864.82 |
1509.55 |
| 306 |
697.40 |
26880.03 |
1314.98 |
709.17 |
29026.76 |
1509.55 |
| 324 |
691.04 |
24578.75 |
1314.98 |
704.21 |
26117.74 |
1509.55 |
| 342 |
684.76 |
22247.35 |
1314.98 |
696.73 |
23031.73 |
1509.55 |
| maximum |
700.27 |
28,694.71 |
1,314.98 |
709.17 |
31,175.57 |
1,509.55 |
Table 8.
Resistance Reserve Factor (RSR).
Table 8.
Resistance Reserve Factor (RSR).
| Resistance Reserve Factor (RSR) |
Collapse mechanism |
| Direction |
Load Factor |
Maximum shear
(Ton) |
Shear (Ton) |
RSR |
RSR minimum |
Status |
Collapse by |
Pile capacity |
| Plasticization of elements |
Pile
collapse |
% |
Pile |
Type |
| 0° |
1.020 |
5517.15 |
2022.39 |
2.728 |
2.20 |
OK |
YES |
NO |
81.7% |
P008 |
Compression |
| 45 |
1.005 |
5809.17 |
2130.64 |
2.726 |
2.20 |
OK |
YES |
NO |
92.3% |
P008 |
Compression |
| 90 |
1.090 |
6596.93 |
2350.79 |
2.806 |
2.20 |
OK |
YES |
NO |
71.8% |
P008 |
Compression |
| 135 |
1.005 |
5665.08 |
2080.09 |
2.723 |
2.20 |
OK |
YES |
NO |
81.9% |
P007 |
Tension |
| 180 |
1.020 |
5534.18 |
2038.55 |
2.715 |
2.20 |
OK |
YES |
NO |
63.1% |
P007 |
Tension |
| 225 |
0.995 |
5707.43 |
2131.81 |
2.677 |
2.20 |
OK |
YES |
NO |
84.6% |
P008 |
Tension |
| 270 |
1.085 |
6573.62 |
2347.36 |
2.800 |
2.20 |
OK |
YES |
NO |
71.2% |
P005 |
Compression |
| 315 |
1.035 |
5907.95 |
2062.58 |
2.864 |
2.20 |
OK |
YES |
NO |
90.5% |
P007 |
Compression |
Table 9.
Summary results of the structural analysis.
Table 9.
Summary results of the structural analysis.
| Revision |
Operation and Static Storm |
Dynamic storm |
Seismic
Resistance |
Seismic Ductility |
Ultimate Wave
resistance |
Spectral Fatigue |
Status |
| Unity Check Ratio (U.C.) in structural members |
TOPSIDE:
UC= 0.81 <1.00 |
TOPSIDE:
UC=0.64<1.0 |
TOPSIDE:
UC=0.97<1.0 |
--- |
--- |
--- |
OK |
JACKET:
UC= 0.93 <1.00 |
JACKET:
UC=0.99 <1.0 |
JACKET:
UC=0.62 <1.0 |
--- |
--- |
--- |
OK |
PILES:
UP= 0.77 <1.0
Down= 0.75 <1.0 |
PILES:
UP= 0.81 <1.0
Down= 0.79 <1.0 |
PILES:
UP= 0.58 <1.0
Down= 0.75 <1.0 |
--- |
--- |
--- |
OK |
| Unity Check Ratio (U.C.) in tubular members |
UC LOAD= 0.78 <1.0
UC STR= 0.97 <1.0 |
UC LOAD= 0.78 <1.0
UC STRN= 0.97 <1.0 |
UC LOAD= 0.44 <1.0
UC STRN= 0.96 <1.0 |
--- |
--- |
--- |
OK |
| Safety Factor |
Operation= 2.18 >2.00
Storm= 1.58> 1.50 |
Storm=
1.52 > 1.50 |
Seismic =
2.04 > 2.00 |
--- |
--- |
--- |
OK |
| Hydrostatic Collapse |
YES
(strengthen) |
YES
(strengthen) |
YES
(strengthen) |
--- |
--- |
--- |
Reinforce with Rings |
RSR
Cr (Seismic) |
--- |
--- |
--- |
“Cr”:
8.53 > 2.0 |
“RSR”=
2.68 > 2.20 |
--- |
OK |
Minimum life in years
Nodo 370 |
--- |
--- |
--- |
--- |
--- |
WJ0=9.2
WJ1=13
WJ2= 27 (years) |
Apply
Burr Grinding
in Nodo 370 |
|
Disclaimer/Publisher’s Note: The statements, opinions and data contained in all publications are solely those of the individual author(s) and contributor(s) and not of MDPI and/or the editor(s). MDPI and/or the editor(s) disclaim responsibility for any injury to people or property resulting from any ideas, methods, instructions or products referred to in the content. |
© 2025 by the authors. Licensee MDPI, Basel, Switzerland. This article is an open access article distributed under the terms and conditions of the Creative Commons Attribution (CC BY) license (http://creativecommons.org/licenses/by/4.0/).