
Submitted:
31 October 2025
Posted:
03 November 2025
You are already at the latest version
Abstract
Reinforced concrete (RC) buildings with masonry-induced soft-storey irregularities exhibit extreme seismic vulnerability, a critical risk often underestimated by conventional code-based design. Standard equivalent static methods typically fail to capture the intense concentration of seismic demand at the flexible ground level, leading to unconservative designs that do not meet performance objectives. This research proposes a corrective linear-static methodology to address this deficiency. A new Equivalent Lateral Force profile (ELF1) was developed, derived from modal analyses of 235 representative soft-storey archetypes. This profile was integrated with a more realistic response modification coefficient (Rᵢ₁ = 5.04), which was determined to be 37% lower than the normative R-factor (R=8) prescribed by code. Nonlinear static (pushover) analyses confirmed that the conventional design resulted in "irreparable" damage (mean GDI = 0.82). In contrast, redesigning the structure using the proposed ELF1 and Rᵢ₁ methodology successfully mitigated damage concentration, upgrading the structural performance to a "repairable" state (mean GDI = 0.52). Finally, Incremental Dynamic Analysis validated the approach; the redesigned structure satisfied FEMA P695 collapse prevention criteria, achieving an Adjusted Collapse Margin Ratio (ACMR) of 2.10. This study confirms the proposed ELF1 method is a robust and practical design alternative that accurately accounts for soft-storey mechanisms within a simplified linear framework.
Keywords:
resilient infrastructure
; urban resilience
; disaster risk reduction
; seismic vulnerability
; sustainable structural design
1. Introduction
This research aims to develop a linear-static calculation model for reinforced concrete buildings with soft stories. The objective is for this model to accurately approximate the seismic response that is predicted by more complex non-linear analyses, all while maintaining the required design performance. Such structures often show pronounced stiffness discontinuities that amplify seismic demand on the first level. The practical application of nonlinear analysis in routine design is fundamentally constrained by its significant demands. It requires specialised expertise and robust material data for constitutive modelling, resources rarely available in typical design projects. If the lateral force profile in a linear–static model reflects these stiffness variations, it could approximate nonlinear response effectively. Supported by established seismic design principles favouring simplicity and safety, the proposed model achieves a balanced force distribution and ensuring reliable yet economical structural performance.
The urgency of this contribution is underscored by the destructive impact of recent earthquakes. In February 2023, Türkiye experienced two catastrophic events (Mw 7.8 and 7.5) that caused more than 50,000 deaths and widespread structural collapse across 11 provinces . Similarly, the 2017 Mexico earthquake (Mw 7.1) and the 2016 Pedernales earthquake in Ecuador (Mw 7.8) revealed the high vulnerability of urban building stocks, leading to thousands of casualties and severe economic disruption . These tragedies highlight the need for efficient yet robust seismic design strategies that safeguard human lives while promoting resilient urban development.
Beyond the magnitude of seismic forces themselves, the degree of damage sustained by buildings is strongly influenced by intrinsic structural characteristics. Among these, the presence of irregularities plays a decisive role in amplifying vulnerability, often determining whether a structure experiences repairable damage or catastrophic collapse. These irregularities are defined as discontinuities or abrupt changes in the geometric configuration, stiffness, mass, or strength of a building, and they significantly influence the structure’s response to lateral loads . Past earthquake observations reveal that many collapsed structures had irregular mass distribution along their height, which amplified inertia forces and P-Δ effects, contributing to failure . In analytical studies, vertical irregularities have been shown to notably degrade seismic performance compared to more uniform structures . For example, in a recent pushover analysis comparing different irregularity types, buildings with only a mass irregularity fared better than those with a stiffness irregularity, such as a soft storey, which suffered significantly larger drifts and higher vulnerability . This suggests that while extra mass can intensify seismic demands, a sudden loss of stiffness at one level represents an even more critical weakness.
Seismic standards such as the ASCE 7-22 , Eurocode 8 , and Ecuador’s NEC-15 include provisions to mitigate the soft storey irregularity. ASCE 7-22 defines a soft storey irregularity as a story with lateral stiffness less than 70% of that of the story immediately above, or less than 80% of the average stiffness of the three stories above when applicable. An extreme soft storey irregularity exists when the lateral stiffness falls below 60% of the story above or below 70% of the average stiffness of the three stories above , and it requires advanced analysis and prohibits such extreme cases in high seismic design categories NEC-15 likewise adopts the ~70% stiffness threshold and penalises soft-storey buildings with an extra design shear (~11.11 % increase) via configuration coefficients, while cautioning that added strength alone may not ensure adequate performance. Collectively, these codes aim to reduce drift concentration in soft stories and improve collapse resistance. An study highlighted that ASCE 7-22’s stiffness-based criterion has been shown to capture soft-storey risks consistent with observed damage .
Although seismic design codes include provisions for strength, detailing, and geometric configuration, their implementation in practice remains frequently limited. This is because design standards typically rely on a simplified set of idealised structural systems, whereas real-world construction involves a much broader range of configurations, materials, and hybrid solutions that fall outside these normative assumptions. This is particularly true in developing contexts, where architectural demands frequently dictate building layouts, leading to irregular geometries such as soft stories [26]. Although these irregularities are formally recognised by the codes, the prescribed mitigation strategies—ranging from the incorporation of shear walls or steel bracings to the use of energy dissipation devices—require specialised design expertise, advanced analysis, and increased construction costs [4]. Similarly, strengthening through oversized structural members with penalisation and amplification factors [21] further raises technical and economic demands. Consequently, despite the availability of code-based guidelines, their practical application becomes limited in regions with resource constraints, informal construction practices, or limited professional oversight. This gap highlights the need for simplified approaches that account for architectural realities while offering more accessible and economically viable alternatives for enhancing seismic resilience in buildings with soft-storey irregularities.
2. Materials and Methods
The research employs a systematic methodological framework structured into five sequential stages (Figure 1): Archetype Definition and Structural Modelling, Seismic Response Assessment, Performance Quantification, Alternative Design Formulation, and Validation against Collapse Safety Requirements. This process facilitates a rigorous transition from a conventional bare frame model to the non-linear characterisation and reliability assessment of soft-storey frames with masonry infills (SMF + IM).
2.1. Archetype Definition and Structural Modelling
2.1.1. Archetype Building and Conventional Design
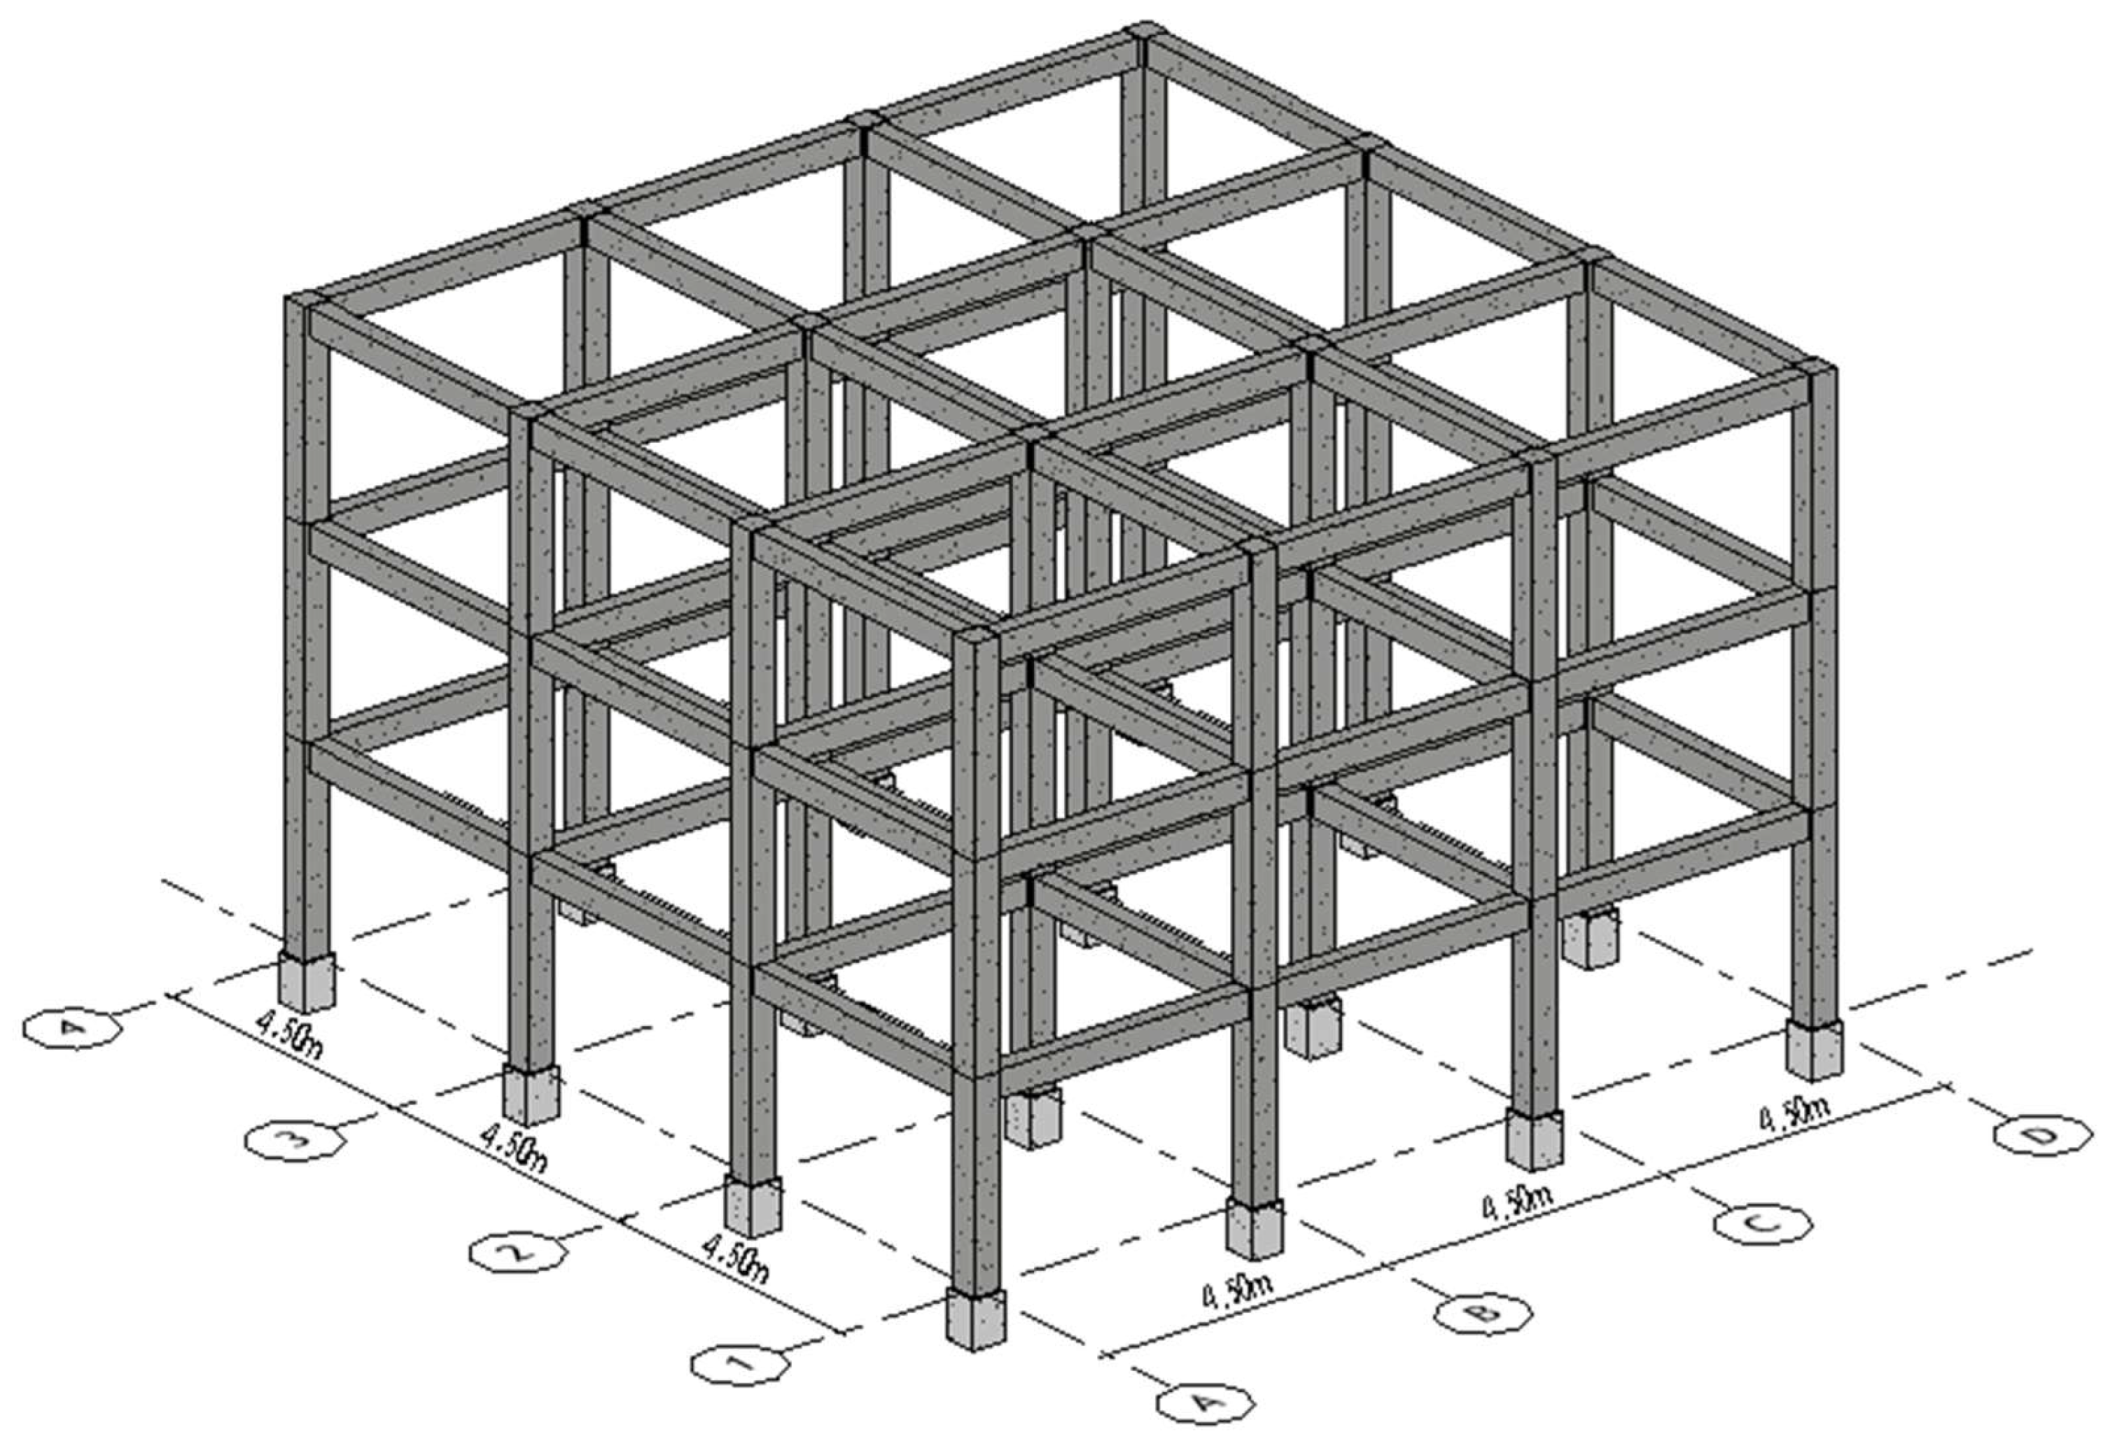
The study centres on a representative three-storey reinforced concrete special moment-resisting frame (SMF) with soft-storey irregularity at the ground level, reflecting common construction practice and seismic hazard in Quito [6,9]. The initial bare frame was designed via linear–elastic analysis strictly in accordance with the Ecuadorian Construction Code (NEC-15) and ACI 318-19 [1] to establish the normative reference. Design parameters, including material properties, and geometric configurations are tabulated (Table 1, Table 2 and Table 3) to ensure replicability.
Figure 2.
Archetype building.
2.1.2. Masonry Infill Modelling and Configuration Selection
Masonry infill panels were incorporated only in the upper floors to induce the soft-storey condition at the ground level. Three infill states were considered—full (100%), partial (60%), and absent (0%)—distributed across six wall locations, yielding an initial population of 729 configurations. To capture the variability and relative frequency of masonry arrangements observed in practice, a finite-population sampling with 95% confidence and 5% margin of error determined a sample size of 252. A systematic sampling scheme with step size k≈3 was then applied, resulting in a final subset of 243 representative models, referred to as SMF+IM (Special Moment Frame + Infill Masonry), which preserves the probabilistic distribution of the original configuration space.
The non-linear interaction between the RC frame and the infills was represented using the bi-puntal macro-model proposed by Crisafulli (1997) [10]. Mechanical properties— including compressive and shear strength—were calibrated against experimental data summarised in Table 4, and adjusted for openings following Smyrou (2006) [24].
2.2. Seismic Response Assessment: Modal and Static Analysis
2.2.1. Model Filtering and Soft-Storey Characterisation
The SMF+IM models were subjected to a filtering procedure to ensure the exclusive presence of the soft-storey mechanism, identified by the concentration of inter-storey drift at the ground floor. Spectral modal analysis was subsequently undertaken to characterise the dominant vibration periods and the governing deformation profile (eigenvectors) of the irregular systems.
2.2.2. Formulation of the Equivalent Lateral Force Profile (ELFi1)
The fundamental modal shape (Φi) was utilised to derive the Equivalent Lateral Force (ELF) profile normalised per storey. This profile was adjusted iteratively to account for the stiffness redistribution introduced by the masonry infills. The resulting ELF1 load pattern (Equations 1-3) is commensurate with the dominant soft-storey modal response, providing a robust lateral load distribution for subsequent static analysis.
where Wi is the seismic weight of storey i, and V is the total base shear. Statistical treatment of the results (mean and standard deviation) captured the variability introduced by the different infill arrangements, thereby defining representative ranges of application.
where F is the total lateral force at the storey under consideration, is the portion resisted by masonry panels, is the lateral stiffness of the bare frame, and is the lateral stiffness of the same storey including masonry infill.
2.2.3. Non-Linear Static (Adaptive Pushover) Assessment
Adaptive pushover analyses were performed on representative configurations of the SMF+IM models using the derived ELFi1 loading profile. The analysis followed the Capacity Spectrum Method (ATC-40) to establish the performance point, systematically evaluating the structural capacity against seismic demand and capturing the non-linear response of the soft-storey.
2.3. Performance and Ductility Quantification
2.3.1. Local and Global Damage Criteria
The performance and ductility of the structural system were quantified by applying both local and global damage criteria. For Reinforced Concrete elements, performance was evaluated using strain-based thresholds to characterise states from initial yielding to ultimate collapse, in line with established international practice (Table 5). Damage to Masonry Infills was assessed based on equivalent strut axial deformations, benchmarked against experimental drift thresholds that detail performance from elastic behaviour to collapse prevention (Table 6). For a comprehensive synthetic measure, local performance was aggregated into a Global Damage Index (GDI) which was calibrated against established performance limit states: Serviceable, Repairable, Irreparable, and Collapse (Table 7).
2.3.2. Adjusted Response Modification Coefficient (RI1)
The seismic response modification coefficient (R) was determined from the capacity curves. The adjusted coefficient (RI1) was calculated as a product of the ductility factor (Rµ), overstrength ratio (Ω), and redundancy factor (RR) (Equation 4). This coefficient explicitly reflects the reduced ductility capacity identified in the non-linear analyses, serving as a critical indicator for the design alternatives.
2.4. Alternative Design and Comparative Assessment
2.4.1. Alternative Design Methodology
The strengthened design alternative aimed to mitigate the soft-storey mechanism by recalibrating the design demand. This was achieved by integrating the ELFi1 load profile with the adjusted response modification coefficient RI1 to formulate a more realistic seismic design basis.
2.4.2. Structural Redesign of the Ground Storey
The ground-storey elements were redesigned iteratively to enhance their stiffness and ductility (e.g., through modified column section dimensions and reinforcement ratios). The modifications were guided by moment–curvature analyses to ensure the modified sections maintained adequate capacity without major architectural changes.
2.4.3. Comparative Performance Evaluation
The redesigned configuration was subjected to the same ELFi1 pushover analysis framework. A comparative assessment was then conducted, contrasting the global response parameters, local deformation demands, and seismic performance indicators of the original and redesigned archetypes.
2.5. Validation: Nonlinear Dynamic Time-History Analysis
2.5.1. Nonlinear Dynamic Analysis and Collapse Intensity
The validation was executed through Nonlinear Dynamic Time-History Analyses on a reduced, representative set of nine structural models, selected in compliance with FEMA P695 (2009) [13]. Each model was subjected to a suite of twenty-two bidirectional far-field ground motions (Table S1), which were incrementally scaled until the global collapse intensity was established. Collapse was defined as the state where more than 50% of the ground motions exceeded the structural resistance.
2.5.2. Safety Level Against Collapse
The structural reliability was quantified using the Adjusted Collapse Margin Ratio (ACMR), which is the ratio between the median collapse intensity and the design-level seismic intensity. The ELFi1 and ELF NEC approach was validated if the minimum required safety margin, specified as ACMR≥90% (FEMA P695), was achieved.
3. Results
3.1. Archetype Definition and Model Development
3.1.1. Linear–Elastic Reference Response (SMF Model)
The linear–elastic analysis of the bare reinforced concrete frame demonstrates a regular and code-compliant structural behaviour, adopted as the reference model (Table 8). The base shear distribution under NEC-15 loading reached 71.27 tonf at the ground floor, with values of 28.48 tonf at the third floor, 28.53 tonf at the second, and 14.26 tonf at the first. Lateral displacements were 0.0235 m at the third floor, 0.0173 m at the second, and 0.0075 m at the first, corresponding to drift ratios of 1.25%, 1.96%, and 1.50%, respectively. All of these values remain below the 2% drift limit established by NEC-SE-DS (2015) [8], confirming performance in accordance with normative requirements.
3.1.2. Infill Configuration Sampling (SMF+IM Models)
The 729 possible infill permutations were generated through a combinatorial analysis, accounting for the binary presence (full or empty) or partial configuration (openings) in the six available bays of the upper storeys. This variability reflects common constructive practices in Ecuador. As the computational cost of analysing all 729 models was prohibitive, a representative sample size was determined using statistical sampling theory. For a 95% confidence level and a 5% margin of error, the required sample size was calculated as 252. This set was subsequently refined to 243 representative models through systematic sampling. Characterisation
3.1.3. Final Model Validation and Soft-Storey
The initial 243-model sample was refined to a final set of 235 models by filtering statistical outliers that exhibited atypical modal responses inconsistent with the target soft-storey mechanism. For instance, Model 75 (featuring an entirely empty second storey) induced modal distortions that skewed the dataset, disproportionately increasing the variance (Figure 3a). The exclusion of these 8 outlier models reduced the variance and standard deviation by nearly half (Table 9). This filtering process enhanced the statistical robustness of the mean as a central estimator and consolidated a coherent dataset representative of the intended structural behaviour.
The normative verification indicated that the stiffness ratio between the first and second levels (K₁/K₂ = 0.34) is far below the 70% threshold established by NEC-15, and even when adjusted by the dispersion range (0.328–0.350), the condition of soft storey remains, in agreement with the ASCE-7 classification of irregularity type I (Table 10). Consequently, the final set of 235 models is validated as an appropriate and representative basis for subsequent dynamic analyses and for the formulation of equivalent lateral load profiles (Figure 3b).
3.2. Seismic Response Assessment
3.2.1. Sensitivity of Modal Response to Infill Patterns
The inclusion of masonry significantly alters the distribution of normalised lateral forces and the dynamic behaviour of the structure, as the additional stiffness provided by the infill walls redistributes the seismic demand, concentrating it at the ground floor and reducing the relative participation of the upper storeys (Figure 4). In the reference model (SMF), the Fi/V coefficients were 0.20 at the first storey and 0.40 at the upper levels, reflecting a regular pattern; however, with the incorporation of masonry, the coefficient at the first level progressively increased to 0.37 in configurations with high wall density, whilst at the third level it decreased to minimum values of 0.23 in low-density cases. The average scenario showed an intermediate profile with coefficients of 0.31, 0.41, and 0.29, confirming the concentration of demand at the ground floor. This effect is supported by Figure 4, which demonstrates the sensitivity of the ELF profile to wall density. Similarly, the fundamental vibration periods shifted from 0.49 s in the bare frame to a range between 0.28 s and 0.45 s in models with masonry, implying a reduction of 8% to 41% and reflecting the substantial increase in stiffness.
3.2.2. Formulation of the Equivalent Lateral Force Profile (ELFi1)
A critical finding is that while the conceptual framework of the Equivalent Lateral Force method is applicable, the normative force distribution is insufficient for frames with significant stiffness irregularities. The conventional ELF profile must be adjusted to account for the stiffness of redistribution introduced by the masonry. This adjustment, derived from the relative stiffness of the system with and without masonry (Equations 1-3), is essential for accurately capturing the concentration of forces at the flexible storey (Table 11 and Figure 5). The inclusion of masonry amplifies the seismic demand in the first storey from 20% in the bare frame to values exceeding unity (1.08–1.23), thereby concentrating the demand in the soft-storey level. Conversely, the second storey develops negative coefficients (–0.15 to –0.30), which reveal a counter-phase effect. The third storey, in turn, contributes only marginally, with coefficients between 0.03 and 0.07.
3.3. Performance Quantification of the Original System
3.3.1. Adjusted Response Modification Coefficient (Rᵢ₁)
The analysis of the 235 numerical models yielded an average response modification coefficient of Rᵢ₁ = 5.04, notably lower than the R = 8 value prescribed by the NEC-SE-DS (2015) for special moment frames. This deviation, representing an overestimation of approximately 37%, evidences that the soft-storey irregularity substantially reduces the system’s capacity to dissipate seismic energy. The decomposition of the global reduction factor into its constituent components—ductility (Rμ), overstrength (RΩ), and redundancy (RRED)—illustrated in Figure 6, reveals that ductility dominates the overall behaviour and is the most severely affected parameter.
3.3.2. Capacity Curves and Performance Points
For the computationally intensive nonlinear static (PushOver) analysis, a representative subset of 60 models was selected from the full sample of 235. This subset was established through stratified sampling to ensure it encapsulated the primary statistical distribution of the full set, spanning the minimum, mean, and maximum stiffness ranges identified in the modal analysis. The 'control group' refers to these 60 models with their original NEC-15 design. This control group exhibited an average spectral displacement of 0.120 m at the performance point, associated with a roof deformation of 0.135 m, indicating a high concentration of inelastic demand in the soft-storey columns (Figure 7).
3.3.3. Local Damage Analysis: Columns
The analysis of the ground-storey critical columns showed that, in the 60 models belonging to the control group, all interior columns, except those located at the corners, reached an irreparable damage state, exceeding the 66% damage index threshold. This outcome confirms that the concentration of inter-storey drift at the first level produces a highly localized inelastic demand on the vertical elements of the interior frame. To examine the local deterioration in detail, a representative interior column located along Axis B was selected, as it exhibited the maximum plastic curvature, the highest cumulative rotation, and structural symmetry with respect to the building’s central axis. This selection criterion ensured that the observed behaviour was characteristic of the global inelastic response and provided a consistent basis for comparison between models.
In contrast, the redesigned models (Figure 8) exhibited damage indices associated with moment, rotation, and strain-energy dissipation within the range of 0.33–0.66, corresponding to a repairable damage state according to the adopted classification. These results demonstrate a systematic reduction of local deterioration and a more uniform distribution of inelastic demand along the first-storey columns, resulting in a more controlled structural response.
3.3.4. Local Damage Analysis: Masonry Infills
The analysis of the equivalent struts in the internal (PA-32, PA-33) and external (PA-22, PA-23) frames revealed distinct damage patterns in the control configurations (Figure 9, Table 14). In the control models designed under the NEC, the third storey remained practically undamaged, whereas in the second storey, approximately 44% of the panels exhibited slight to moderate deterioration due to their proximity to the flexible zone. This spatial distribution of damage (Figure 9) confirms that the concentration of inelastic incursions occurs predominantly in the level immediately above the soft storey.
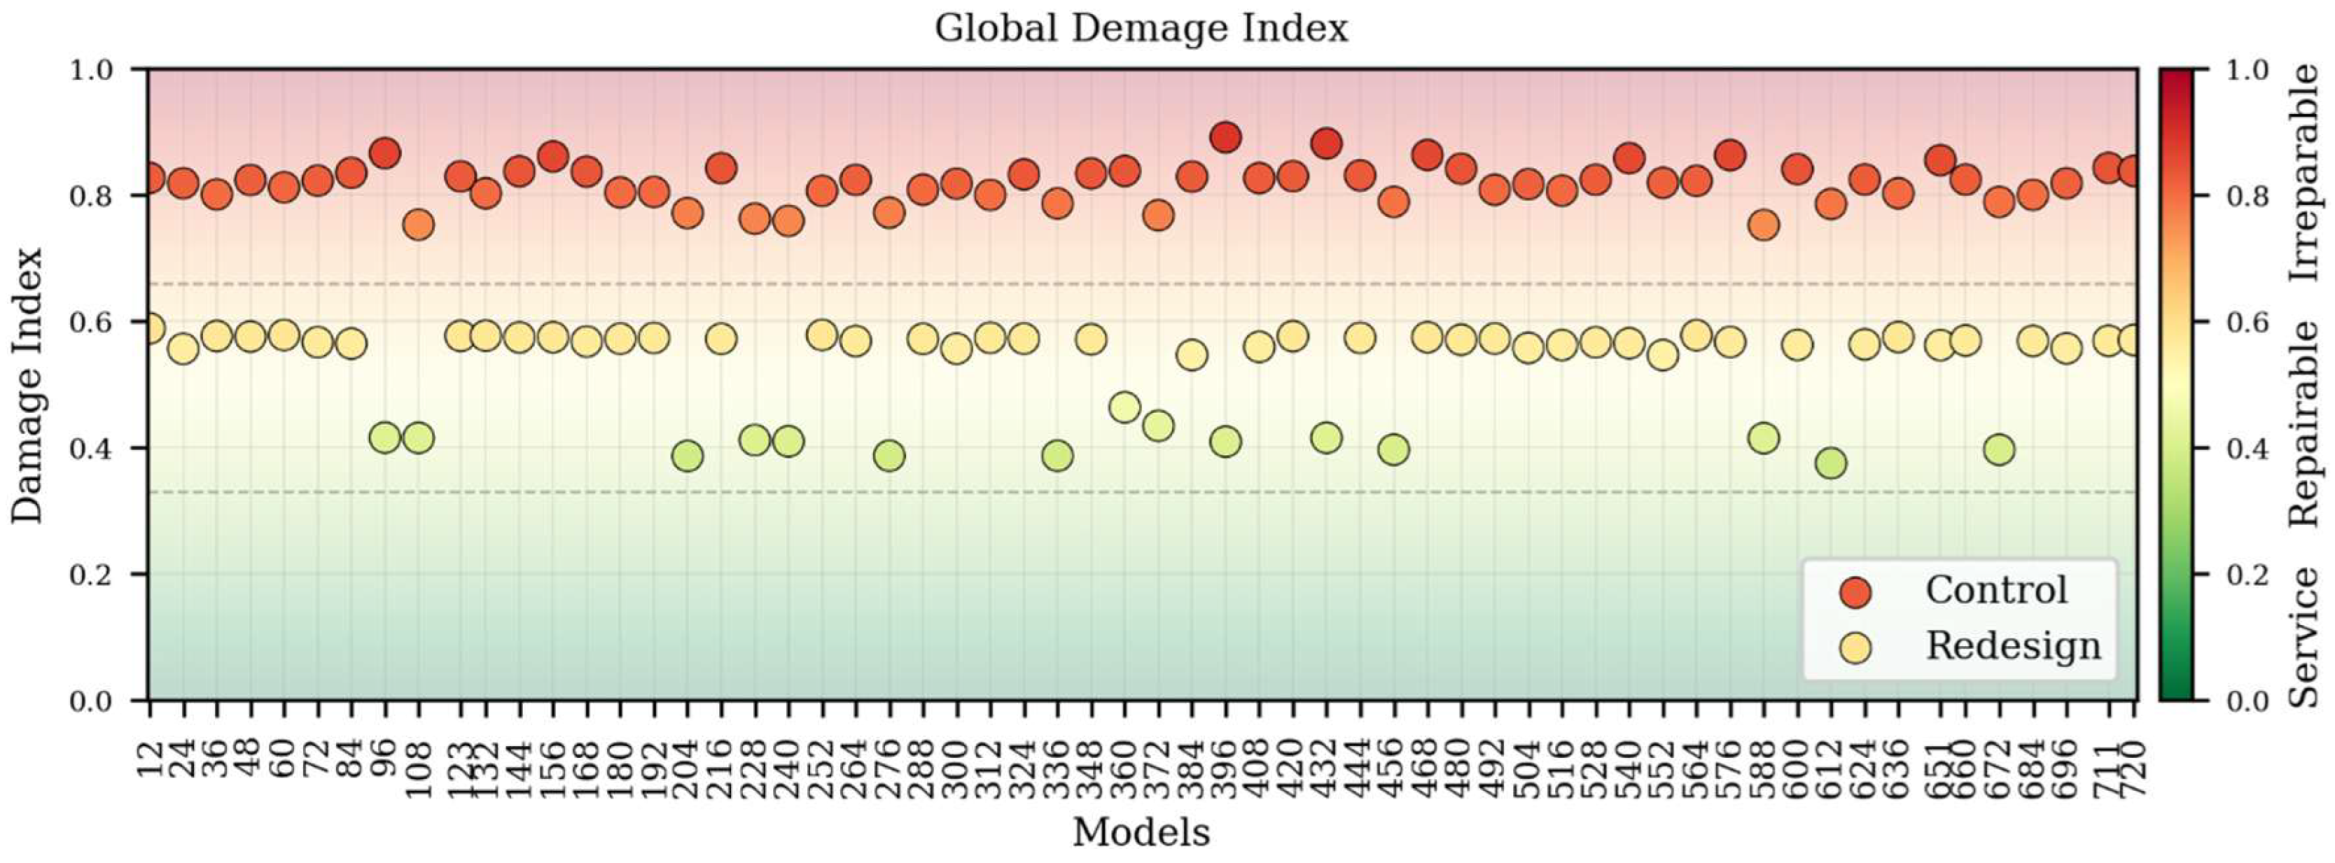
3.3.5. Global Damage Index (GDI)
The analysis of the global damage index (Figure 12) for the control group revealed a mean index value of 0.82, with a range between 0.75 and 0.90. This indicates that all models experienced irreparable damage when subjected to the design earthquake defined by the NEC. This outcome confirms that the soft-storey typology fails to maintain acceptable structural performance under such seismic demands.
Figure 10.
Global Damage Index.
3.4. Alternative Design and Comparative Assessment
3.4.1. Comparison of Lateral Load Distributions (ELFi1 vs. NEC)
The adoption of the adjusted equivalent lateral force profile (ELFi1) revealed marked differences compared to the NEC-15 distribution, even when considering the penalty for vertical irregularity (ELF NEC*). The redesigned models exhibited an increase in base shear, reaching 114.03 tonf, against 71.27 tonf for NEC and 79.19 tonf for NEC*, representing increments of 60% and 44%, respectively (Table 12). The redistribution concentrated predominantly at the first storey, where the lateral demand increased to 127.72 tonf (1.12 Fi/V), equivalent to 12% more than the total base shear (Table 12). This behaviour, also illustrated in the proposed distribution (Figure 11), confirms that ELFIi1 reflects the soft-storey mechanism more accurately than the normative distributions.
3.4.2. Parametric Analysis for Ground-Storey Redesign
The moment–curvature analysis conducted for the ground-storey columns provided a detailed evaluation of how different strengthening strategies influenced both resistance and ductility (Figure 12). Increasing the concrete section (Figure 12a) resulted in a 35% strength gain but a 40% reduction in ductility. This behaviour is attributed to the enlarged compression zone, which shifts the failure mechanism towards a more brittle, Compression -Controlled State. As the neutral axis deepens, the tensile steel achieves a lower strain at the point of concrete crushing, thereby limiting the element's post-yield deformation capacity and the corresponding rotational ductility of the member. When the longitudinal reinforcement ratio was increased while maintaining the same geometry (Figure 8b), both strength and ductility improved—by about 30% and 25%, respectively. Conversely, raising the axial load (Figure 12c) produced only a moderate gain in resistance (20%) coupled with a loss of ductility (30%). The combined alternative (Figure 12d) achieved the highest strength increase (45%) but exhibited the most severe loss of ductility (50%).
3.4.3. Comparative Analysis of Internal Forces
The comparison between the conventional model (ELF NEC-15) and the adjusted configuration (ELFi1) revealed significant redistributions of internal actions in the ground-storey columns (Figure 13 and 14). The adjusted load pattern systematically increased flexural demands across all columns. In the external frame, the bending moment rose between +30.6 % and +36.6 %, while in the internal frame the increase ranged from +31.0 % to +41.7 %, reaching the maximum at Axis A. Correspondingly, the peak moment rose from 10.54 tonf·m to 14.06 tonf·m, representing an average increase of approximately 35 %.
Shear forces exhibited even stronger amplification. The external frame showed increments between +51.2 % and +73.9 %, whereas the internal frame reached +53.8 % to +98.7 %, with the largest rise again at Axis A. In contrast, axial forces displayed minor variations, generally within ±5 %, with overall deviations in the range of −9.3 % to +19.8 %. These numerical trends demonstrate that the adjusted ELFi1 profile produces marked amplification of flexural and shear actions at the first storey, while axial gravity effects remain nearly unchanged.
Figure 14.
Percentage Differences – NEC-15 Model vs. Alternative Design: (a) External Frame, (b) Internal Frame.
Figure 14.
Percentage Differences – NEC-15 Model vs. Alternative Design: (a) External Frame, (b) Internal Frame.

3.4.4. Comparative Performance of Redesigned System
The redesigned group—integrating the ELFi1 profile and strengthened columns—showed significant performance improvements. The mean spectral displacement at the performance point was reduced to 0.101 m (a 16% reduction from the control group's 0.120 m). Locally, the redesigned models (Figure 10) exhibited damage indices predominantly within the 0.33–0.66 range, corresponding to a reparable state. In the masonry (Figure 11), axial deformations increased, affecting between 57% and 58% of the panels, indicating the reinforcement effectively transferred demand to the upper storeys as intended. Globally (Figure 12), the redesigned group exhibited a mean GDI of 0.52 (ranging from 0.38 to 0.60). Approximately 87% of these models remained within the repairable-damage range, and none exceeded the irreparable threshold.
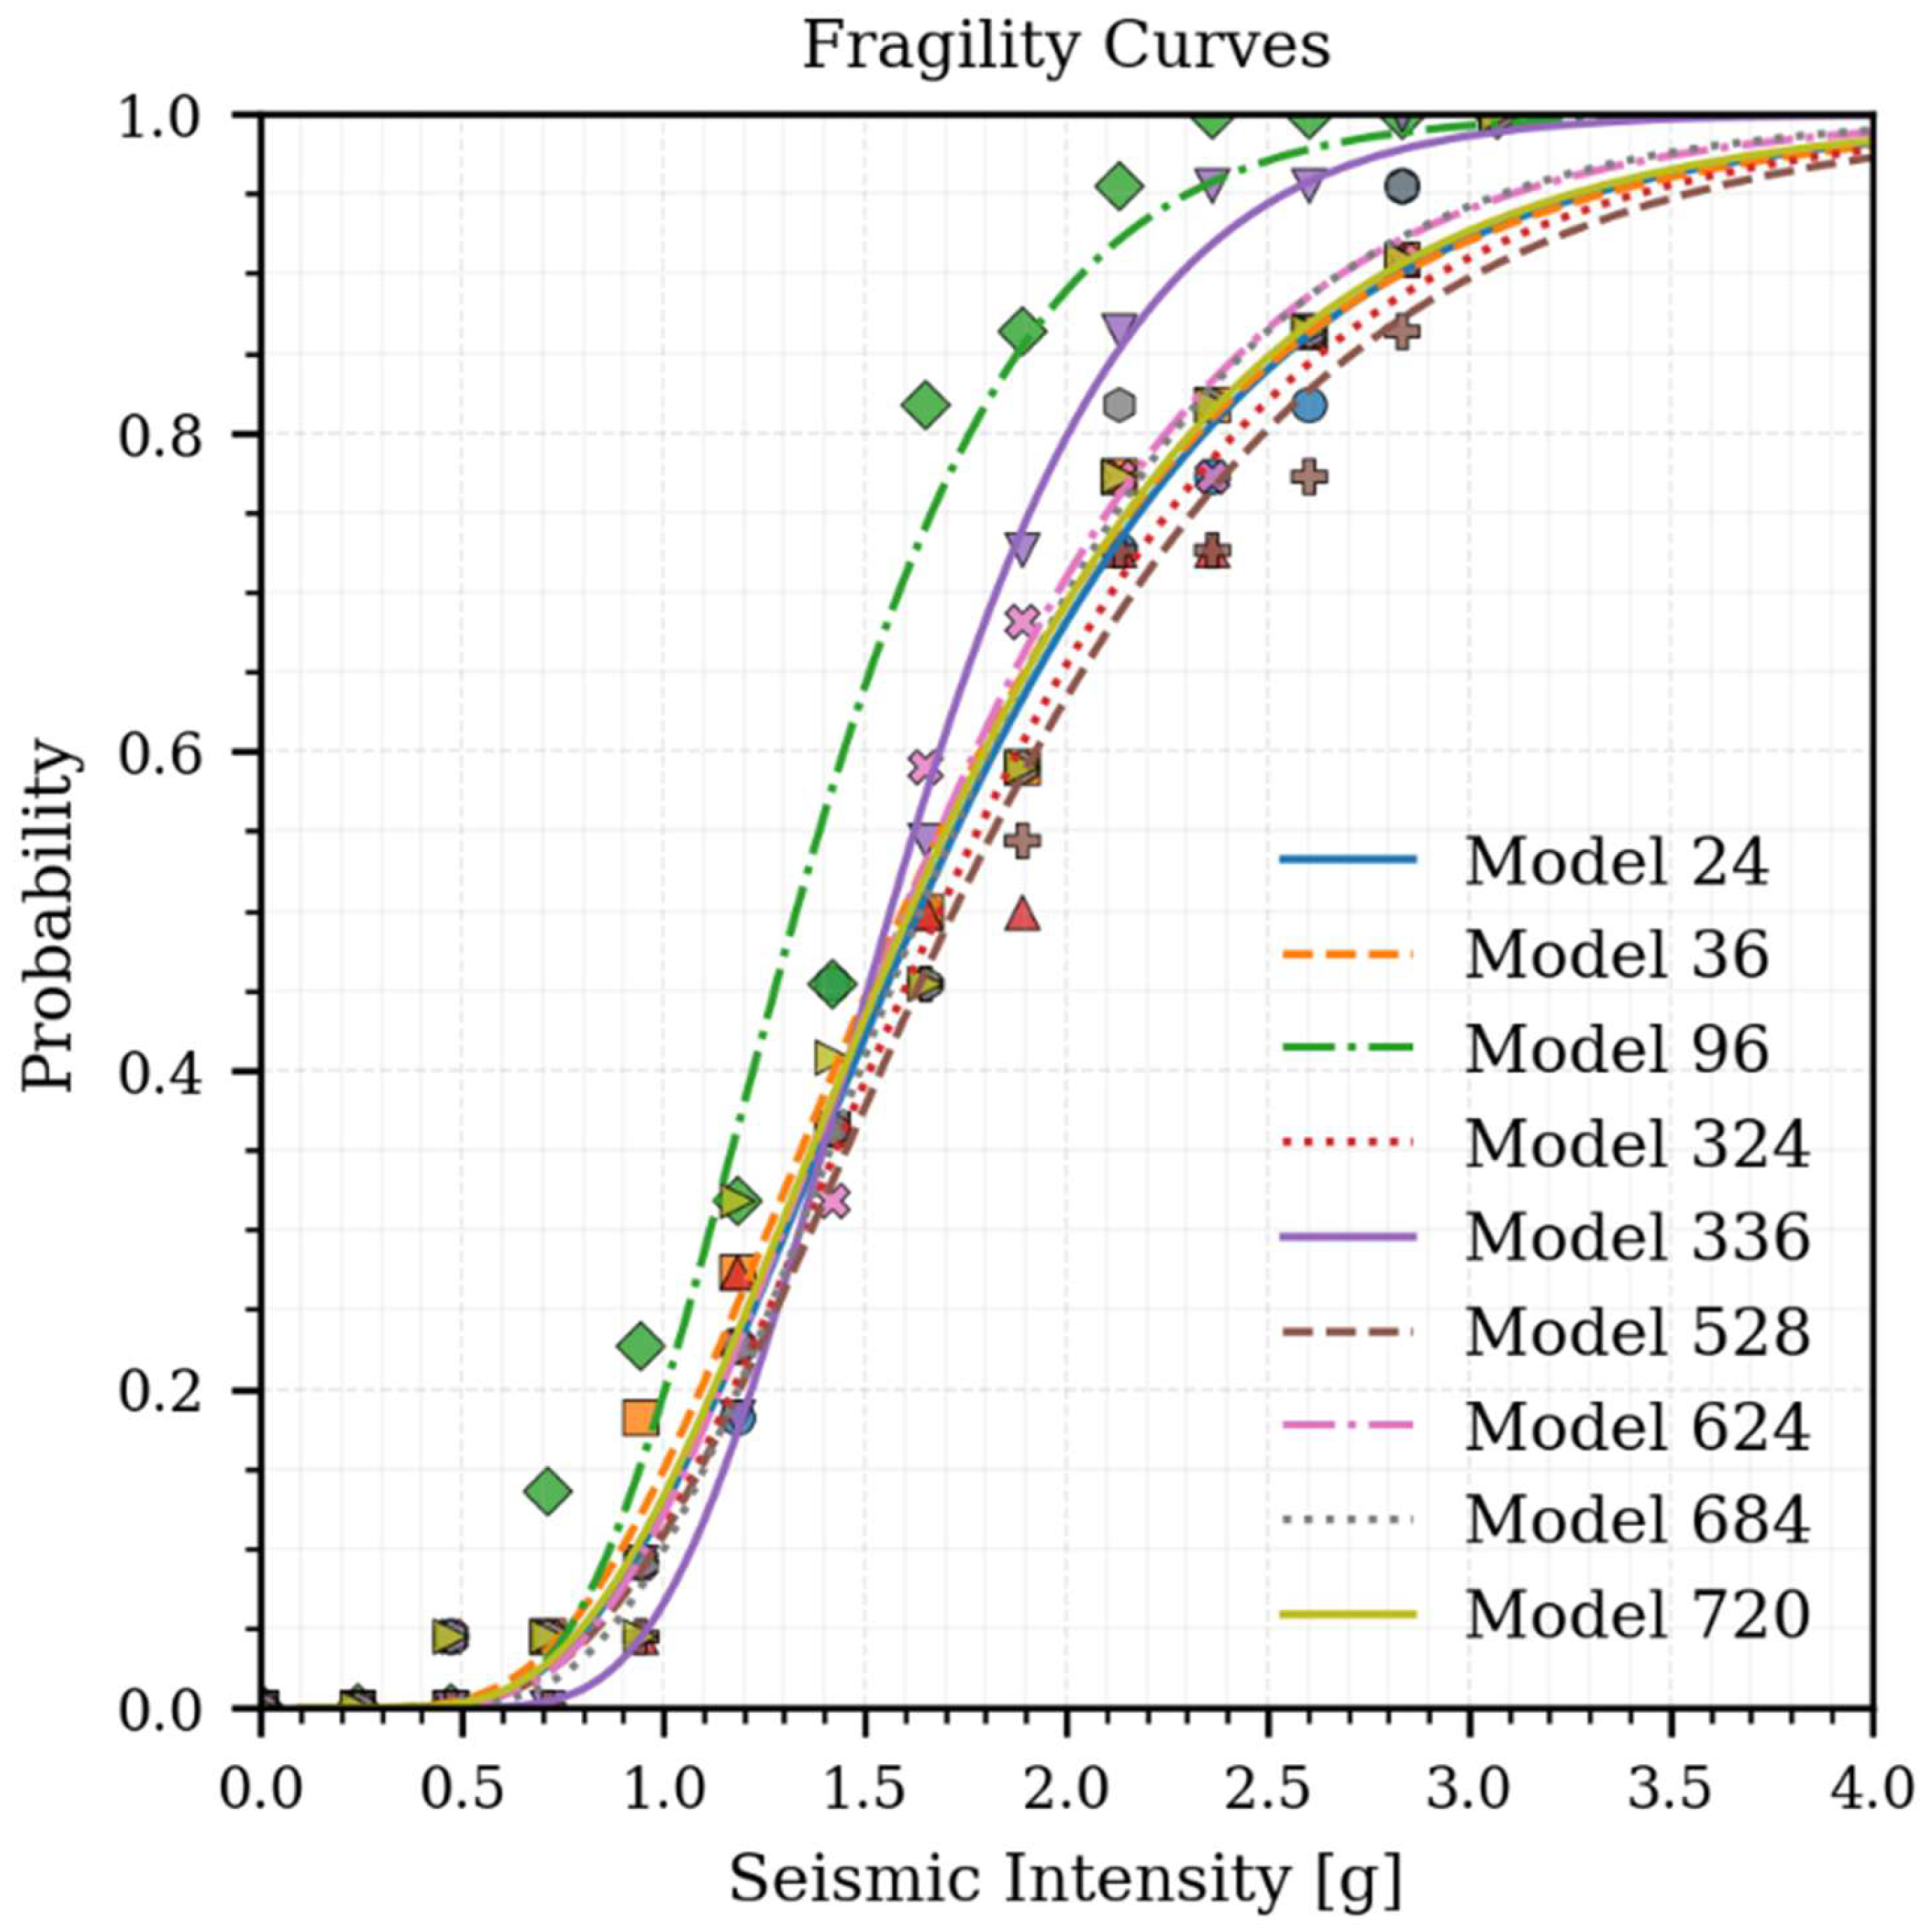
3.5. Validation via Nonlinear Dynamic Analysis
The capacity curves from the nonlinear static analyses revealed two distinct behaviours, justifying the selection of nine representative models for the dynamic analysis in accordance with FEMA P695 (2009). The incremental dynamic analysis (IDA) performed with 22 ground-motion records yielded a mean collapse intensity of SCT = 0.94 g, with a dispersion coefficient β₁ = 0.34 and ε₀ = −0.10. The cumulative collapse curve (Figure 12) indicated that the average collapse intensity occurred at SCT = 0.94 g, with individual results ranging between 0.82 g and 1.05 g.
The computed Adjusted Collapse Margin Ratio (ACMR = 2.10) exceeded the minimum threshold prescribed by the procedure (ACMRmin = 1.74), confirming the statistical reliability and a safety margin greater than 90% against global collapse. This validation supports the adoption of the ELFi1 lateral-force profile and the coefficient Rᵢ₁ = 5.04 as reliable design parameters. The results confirm that while the normative R = 8 factor does not accurately represent this typology, the proposed design approach (ELFi1 and Rᵢ₁) ensures consistency with FEMA P695 safety criteria.
Figure 15.
Collapse Intensity of Redesigned Models.
4. Discussion
The findings from this investigation highlight a critical deficiency in conventional seismic design practices for structures with significant vertical irregularities. Our results confirm that for soft-storey buildings, standard response modification coefficients (R-factors) are often unconservative. This aligns with the work of Guevara-Perez (2012) [15], who previously identified the failure of these coefficients to represent the amplified seismic demand concentrated at the flexible ground level. This inadequacy, therefore, underscores the risk of premature failure mechanisms not anticipated by prescriptive code-based approaches.
The successful reduction in the global damage index, achieved through targeted reinforcement of ground-storey columns, validates our proposed strengthening strategy. This empirical evidence supports the conclusions of Lee et al. (2016) [19], demonstrating that such localized retrofitting can substantially enhance global structural performance and mitigate collapse potential. Furthermore, the consistency between the observed behavior and our nonlinear analysis provides a strong justification for developing more refined analytical tools. This supports the pursuit of methods like the linear-static equivalent dissipation approach [7], is a crucial step in bridging advanced analysis with routine design applications.
Ultimately, these results reinforce the foundational principle of balancing strength and ductility. While our reinforcement strategy increased strength, its primary contribution to collapse prevention was the enhancement of ductile behavior, allowing for controlled energy. This work, therefore, argues for a shift towards performance-based assessment and retrofitting that prioritizes both component-level ductility and global system integrity.
The results of this investigation confirm that the proposed lateral force distribution offers a more realistic and necessary alternative to conventional code-based formulations for structures with soft-storey irregularities induced by infill masonry. Our analysis demonstrates that the profile accurately reproduces the concentration of inter-storey drifts and internal forces at the first level. This contrasts sharply with standard equivalent static methods, which tend to underestimate these crucial demands. The underestimation arises because simplified code procedures often neglect the significant stiffness irregularities caused by the presence of masonry infills on upper floors, potentially leading to unsafe designs, a concern echoed in recent research on irregular structures .
The profile addresses this gap by incorporating the influence of infill walls, derived from nonlinear static analysis. Recent studies emphasize that irregular infill distribution significantly impacts structural behaviour, potentially inducing severe torsional effects or soft-storey mechanisms not captured by linear methods . While advanced nonlinear dynamic analysis provides the most accuracy, its complexity can be prohibitive for routine design. Our proposed profile, grounded in nonlinear behaviour yet applicable within a linear static framework, provides a practical and more reliable tool for preliminary design and assessment, improving upon purely elastic approaches. By capturing the ground floor's high flexibility and force concentration, the profile offers a necessary refinement for analysing and designing buildings with masonry-induced soft storeys.
The proposed ELF₁ lateral force profile provides a more realistic, representative, and analytically pragmatic tool for the seismic design of structures with masonry-induced soft-storey irregularity than conventional code-based approaches. A seismic design methodology can only be considered safe and effective if it accurately accounts for the actual physical mechanisms of the structure, such as the critical frame-masonry interaction that dictates force redistribution.
The proposed profile meets this standard. Its foundation rests on key findings from nonlinear analysis: modal analysis confirms the principal deformation mechanism is a displacement concentration at the ground floor, a behaviour ca used by the heterogeneous stiffness from upper-storey masonry. Conventional code-based formulations significantly underestimate the seismic demands on this critical soft storey [26]. In contrast, the ELF₁ profile accurately captures this behaviour by transferring a larger, more realistic portion of the seismic demand to the first storey.
The analytical soundness of this approach is further validated by two points. First, the reduced value of the effective response modification coefficient (Rᵢ₁) observed in the models confirms that current normative coefficients are inadequate for this structural typology. Second, capacity curve analysis validates that the proposed linear-static ELF₁ approach, much like other modified distribution methods , successfully reproduces the global deformation trends and internal force concentrations predicted by more complex nonlinear analyses.
Therefore, the ELF₁ profile is a highly representative tool for preliminary design. While its validation is currently numerical, it offers a significant practical advantage by providing a robust analytical solution, avoiding the need for the costly physical retrofits common in other methodologies [14,17].
The modal analysis of the archetype structure identified the governing dynamic characteristics that define the seismic response. The first modal shape confirmed the dominance of a soft-storey mechanism, exhibiting a significant concentration of displacements at the ground floor. This finding is critical, as it contrasts directly with the bare-frame model, which demonstrated inherently regular structural behaviour. This confirms that the critical irregularity is not intrinsic to the frame but arises from the heterogeneous stiffness distribution induced by the inclusion of infill masonry on the upper storeys.
This stiffness heterogeneity directly influences the effective redistribution of forces throughout the structure. The concentration of deformation at the flexible base, coupled with a reduction of forces in the stiffer upper levels, is justified by the rigidity imparted by the infill masonry, which conditions the global structural behaviour. This modal behaviour, which incorporates the frame-masonry interaction, is a critical factor often simplified in previous shear distribution models and elastic-based approaches [25]. Consequently, this dynamic characterisation forms the fundamental basis for defining a more representative equivalent lateral force profile (ELF₁). This profile, derived from the observed modal properties, provides the foundation for a simplified analytical model that acknowledges the direct relationship between mode shapes, infill-induced stiffness, and seismic vulnerability.
The findings of this investigation must be considered within the context of its specific limitations, which also define the directions for future validation. The validation of the profile was conducted on a specific three-storey structural archetype and relied exclusively on nonlinear numerical simulations, thereby lacking direct experimental validation. Furthermore, the analysis did not consider the potential influence of key variables, such as variability in masonry strength, geometric irregularities, or three-dimensional (3D) structural effects.
Consequently, the methodology's generalizability requires confirmation. Future research must evaluate the profile in models of varying heights and structural typologies and conduct comparisons against dynamic time-history analyses to verify robustness against different seismic records. It is also essential to provide empirical validation of the numerical results, ideally through experimental shake-table tests. Finally, the profile should be integrated into probabilistic frameworks to assess its impact on fragility and loss estimations, thereby confirming its utility in performance-based design. Addressing these analytical boundaries will validate the broader applicability of the proposed seismic design adjustments.
5. Conclusion
Standard equivalent static methods are dangerously inadequate for masonry-induced soft-storey buildings, fundamentally underestimating seismic demand. This study proposed a corrective linear-static methodology, integrating a new lateral force profile (ELFi1) with a realistic response modification coefficient (Rᵢ₁ = 5.04). Nonlinear static analyses confirmed this approach successfully mitigates damage concentration, critically upgrading the archetype's performance from an "irreparable" to a "repairable" state.
Most importantly, incremental dynamic analysis validated the redesigned structure, which achieved an Adjusted Collapse Margin Ratio (ACMR = 2.10) and thus satisfied FEMA P695's collapse prevention criteria. The ELFi1 method is therefore presented as a robust and practical design alternative that accurately accounts for soft-storey mechanisms within a simplified linear framework. Experimental validation and application to taller structures are key priorities for future research.
Supplementary Materials
The following supporting information can be downloaded at the website of this paper posted on Preprints.org. Table S1: Earthquakes and Recording Stations for Far-Field – FEMA P695;
Author Contributions
Conceptualization, Carlos Avila; Formal analysis, Marco Altamirano, Daniel Rios, Carlos Avila, and Juan Tlapanco; Investigation, Marco Altamirano, Daniel Rios and David Rivera; Methodology, Carlos Avila and Juan Tlapanco; Software, Marco Altamirano, Daniel Rios and Daniel Ilbay; Supervision, Carlos Avila; Validation, Daniel Ilbay and Juan Tlapanco; Writing – original draft, Marco Altamirano, Daniel Rios, and Daniel Ilbay; Writing – review & editing, Carlos Avila and David Rivera.
Funding
“This research received no external funding”
Data Availability Statement
The raw data supporting the conclusions of this article will be made available by the authors on request.
Conflicts of Interest
“The authors declare no conflicts of interest.”.
Acknowledgements
During the preparation of this manuscript, the author(s) used Gemini 2.5 Pro for the purposes of assistance with copyediting, grammar checks, and minor phrasing improvements to enhance the clarity and readability of the manuscript. The authors have reviewed and edited the output and take full responsibility for the content of this publication.
Abbreviations
The following abbreviations are used in this manuscript:
| RC | Reinforced concrete |
| ELF1 | Equivalent Lateral Force profile |
| GDI | Global Damage Index |
| ACMR | Adjusted Collapse Margin Ratio |
| ASCE | American Society of Civil Engineers |
| NEC-15 | Norma ecuatoriana de la construcción (Ecuadorian Construction Code) |
| SMF | Special Moment Frame |
| IM | Infill Masonry |
| ACI | American Concrete Institute |
| ATC-40 | Spectrum Method |
| DI | Damage Index |
| RR | Redundancy Factor |
| IDA | Incremental Dynamic Analysis |
| FEMA P695 | Federal Emergency Management Agency P695 |
References
- ACI Committee 318. 2019. Building Requirements for Structural Concrete and Commentary. American Concrete Institute, Farmington Hills.
- Izzettin Alhalil and M. Fethi Gullu. 2023. Investigating Infill Wall Configurations on 3-D Structural Systems with a Generalized Modeling Approach. Arabian Journal for Science and Engineering 48, 10: 13523–13551.
- American Society of Civil Engineers. 2022. Minimum Design Loads and Associated Criteria for Buildings and Other Structures, ASCE/SEI 7-22. Reston.
- R Apostolska, Golubka Necevska-Cvetanovska, Julijana Bojadzieva, and Elena Gjorgjievska. 2016. Seismic Performance Assessment of Soft-Story RC Frame Buildings.
- Jiulin Bai, Huiming Chen, Junfeng Jia, Bohao Sun, and Shuangshuang Jin. 2020. New lateral load distribution pattern for seismic design of deteriorating shear buildings considering soil-structure interaction. Soil Dynamics and Earthquake Engineering 139: 106344.
- Alvaro Bohorquez, Esteban Viteri, Edgar Rivera, and Carlos Avila. 2024. Environmental Impact of Earthquake-Resistant Design: A Sustainable Approach to Structural Response in High Seismic Risk Regions. Buildings 14, 12.
- Nouredine Bourahla. 2014. Equivalent Static Analysis of Structures Subjected to Seismic Actions. In Encyclopedia of Earthquake Engineering. Springer Berlin Heidelberg, 1–13.
- CAMICON and MIDUVI. 2014. Norma ecuatoriana de la construcción - NEC: NEC-SE-MP - Mamposteria estructural. Quito.
- Estefani Coral, Carlos Ávila, Elvia Gallegos, Andrés Salazar, Liliana Barros, and Edgar Rivera. 2025. Cellular concrete: A viable low-carbon alternative for developing countries in seismic regions? Structural Concrete.
- Francisco Javier Crisafulli. 1997. Seismic behaviour of reinforced concrete structures with masonry infills. Retrieved October 29, 2025 from http://hdl.handle.net/10092/1221.
- Yunus Demirtaş, Özgür Avşar, Ali Bozer, and Ahmet Anıl Dindar. 2025. Investigation of code based criteria for soft-story irregularity. Structures 80.
- Federal Emergency Management Agency. 2009. Quantification of Building Seismic Performance Factors (FEMA P695). Redwood.
- P. D. Gkournelos, T. C. Triantafillou, and D. A. Bournas. 2021. Seismic upgrading of existing reinforced concrete buildings: A state-of-the-art review. Engineering Structures 240: 112273.
- L Teresa Guevara-Perez. 2012. “Soft Story” and “Weak Story” in Earthquake Resistant Design: A Multidisciplinary Approach. The 18th World Conference on Earthquake Engineering.
- Ercan Işık, Fatih Avcil, Rabia İzol, et al. 2024. Field Reconnaissance and Earthquake Vulnerability of the RC Buildings in Adıyaman during 2023 Türkiye Earthquakes. Applied Sciences (Switzerland) 14, 7.
- M.A Ismaeil. 2013. Seismic Retrofitting of a RC Building by Adding Steel Plate Shear Walls. IOSR Journal of Mechanical and Civil Engineering 7, 2: 49–62.
- Armin Karami, Shahrokh Shahbazi, and Mahdi Kioumarsi. 2020. A Study on the Effects of Vertical Mass Irregularity on Seismic Behavior of BRBFs and CBFs. Applied Sciences 2020, Vol. 10, Page 8314 10, 23: 8314.
- Kang Seok Lee, Bang Yeon Lee, and Soo Yeon Seo. 2016. A seismic strengthening technique for reinforced concrete columns using sprayed FRP. Polymers 8, 4.
- Vyshnavi Pesaralanka, S. P. Challagulla, Felipe Vicencio, et al. 2023. Influence of a Soft Story on the Seismic Response of Non-Structural Components. Sustainability 2023, Vol. 15, Page 2860 15, 4: 2860.
- D. C.Haran Pragalath, Saleema Panda, and Mustafa Salsal. 2022. Multiplication Factors for Design of Open Ground Story RC Building – A Probabilistic Approach. World Congress on Civil, Structural, and Environmental Engineering, Avestia Publishing.
- Kshithij G Raj, · S Roopanjali, and · P Akshatha. 2025. Impact of irregularities on seismic fragility of reinforced concrete structures. Discover Civil Engineering 2025 2:1 2, 1: 1–24.
- Davi Santos, José Melo, and Humberto Varum. 2024. Code Requirements for the Seismic Design of Irregular Elevation RC Structures. Buildings 2024, Vol. 14, Page 1351 14, 5: 1351.
- Ellen M. Smith and Walter D. Mooney. 2021. A seismic intensity survey of the 16 April 2016 Mw7.8 Pedernales, Ecuador, Earthquake: A comparison with strong-motion data and teleseismic backprojection. Seismological Research Letters 92, 2156–2171.
- Eleni Smyrou, Stelios Antoniou, Rui Pinho, Carlos Blandon-Uribes, and Helen Crowley. 2006. Implementation and Verification of a Masonry Panel Model for Nonlinear Pseudo-Dynamic Analysis of Infilled RC Frames. First European Conference on Earthquake Engineering and Seismology, ECEES, 3–8.
- S Suresh Kannan. 2023. Seismic Analysis of Soft Storey Building in Earthquake Zones. IOP Conference Series: Earth and Environmental Science 1130, 1: 012023.
- Hakan Ulutaş. 2024. Investigation of the Causes of Soft-Storey and Weak-Storey Formations in Low- and Mid-Rise RC Buildings in Türkiye. Buildings 2024, Vol. 14, Page 1308 14, 5: 1308.
Figure 1.
Workflow of the proposed methodology, from archetype definition and infill masonry modelling to modal, static, and dynamic analyses, culminating in validation against collapse safety requirements.
Figure 1.
Workflow of the proposed methodology, from archetype definition and infill masonry modelling to modal, static, and dynamic analyses, culminating in validation against collapse safety requirements.
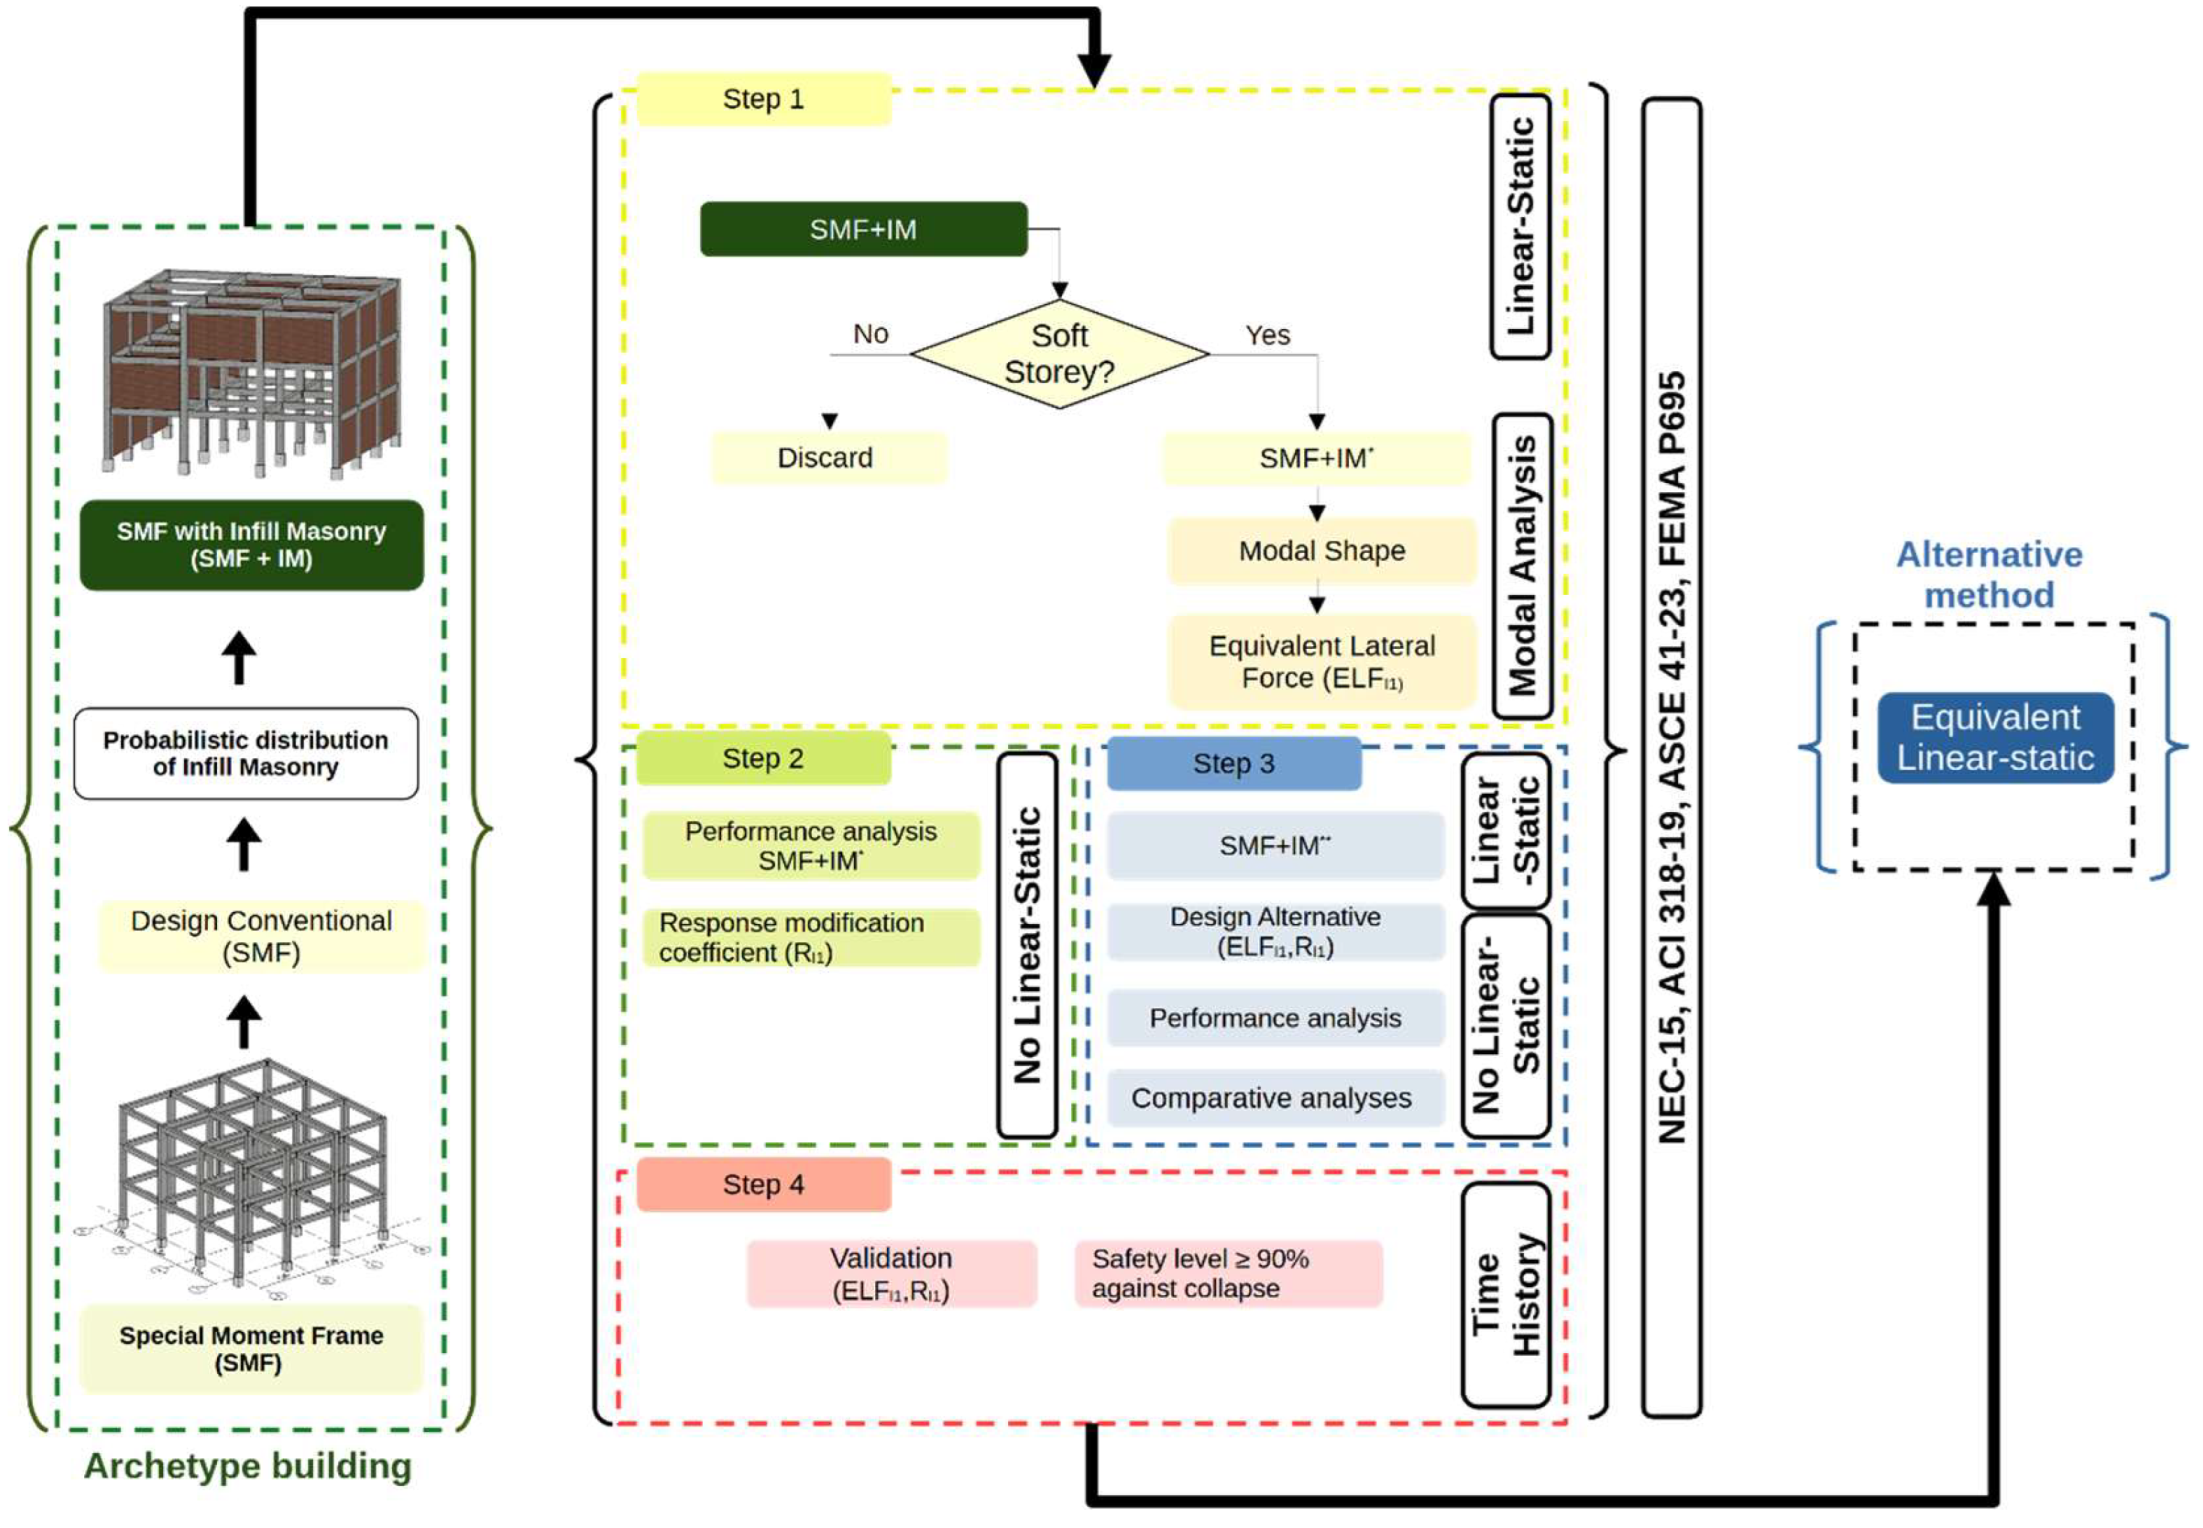
Figure 3.
(a) Initial and (b) Reduced Sample Counts.
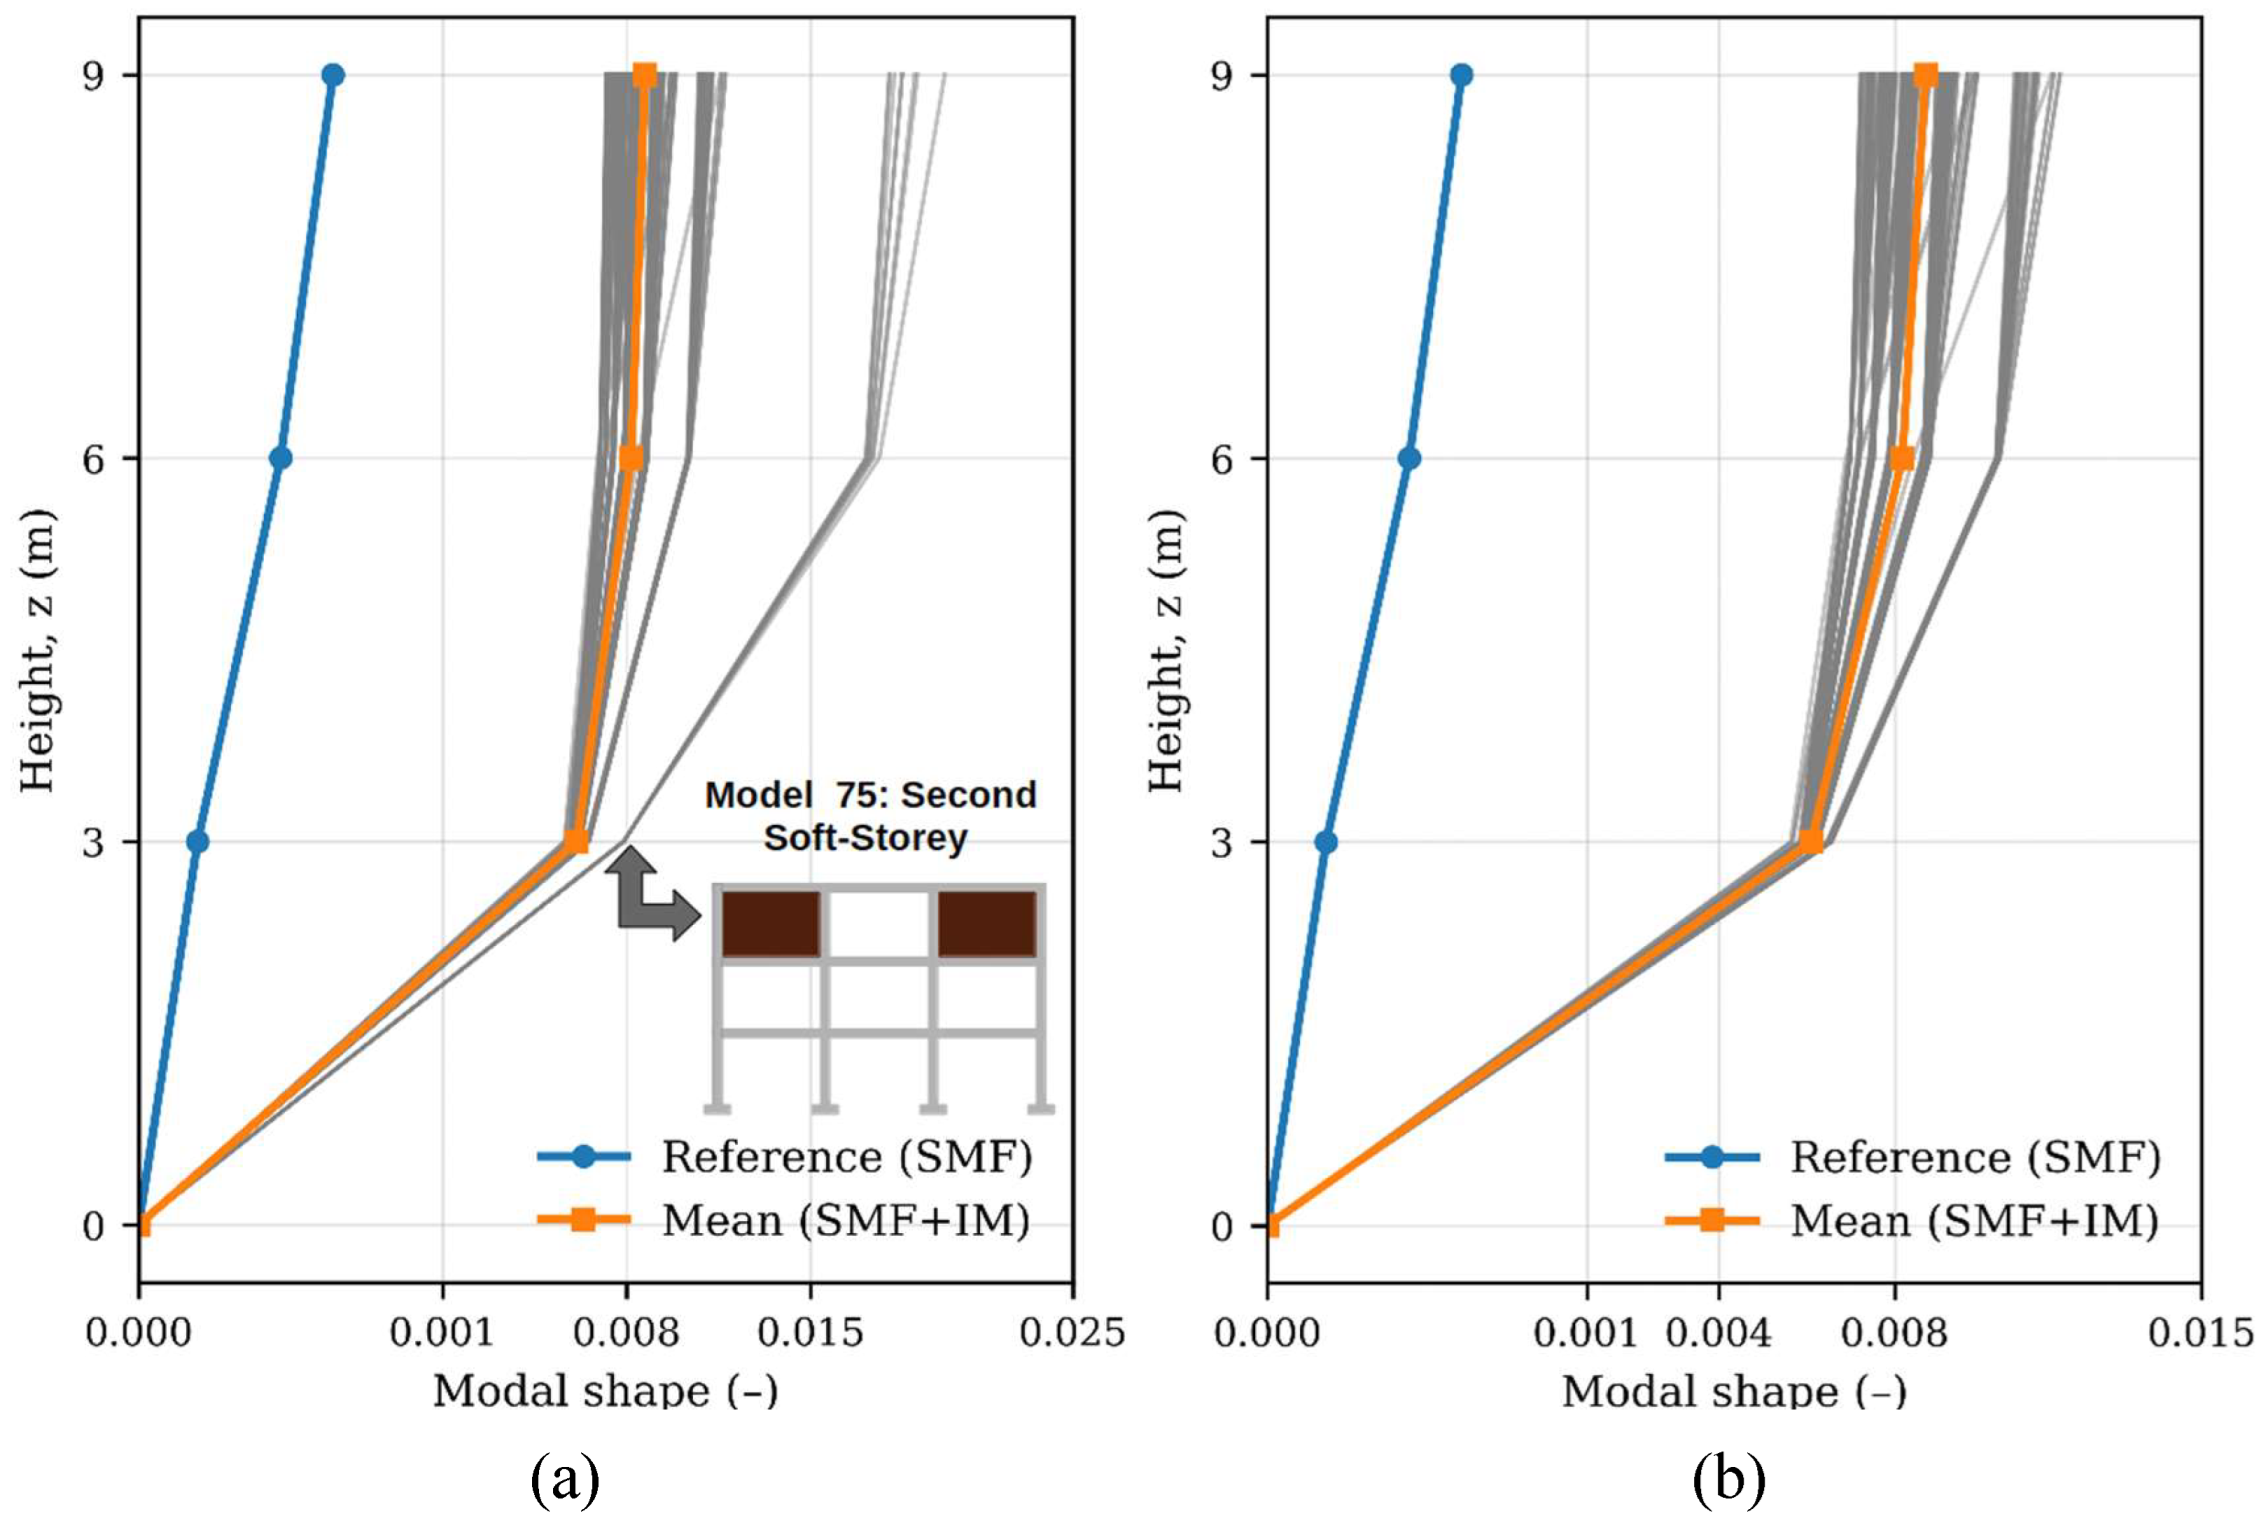
Figure 4.
Equivalent Lateral Force Profile.
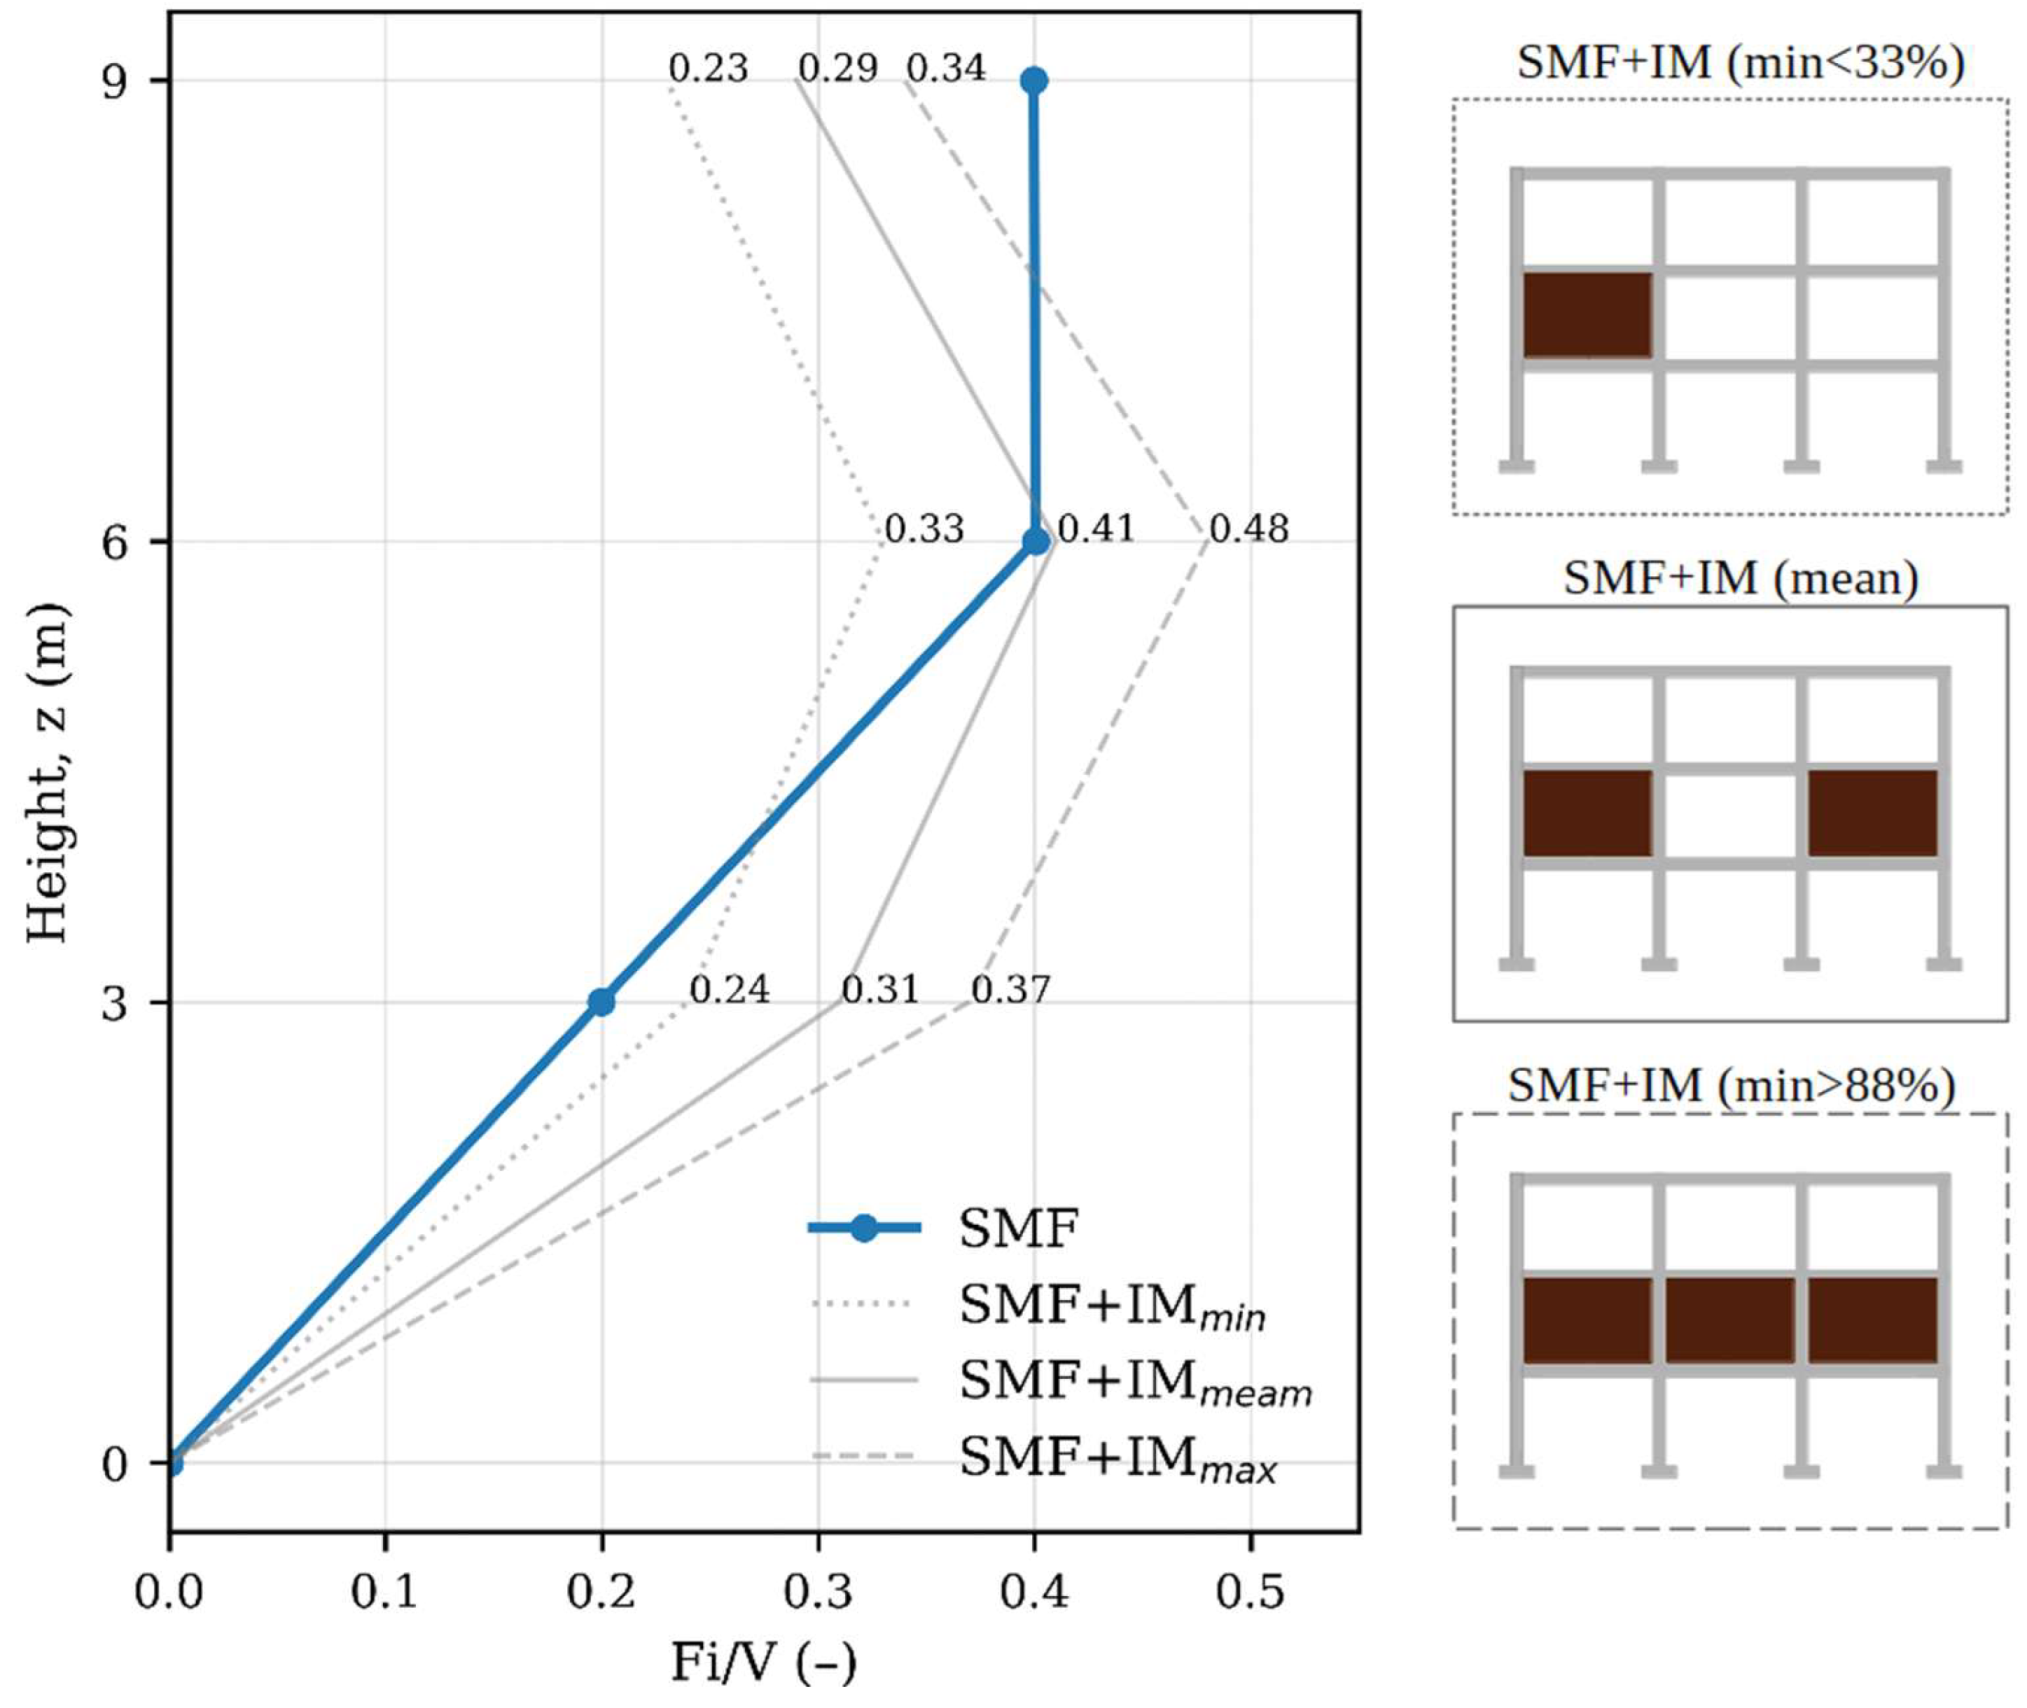
Figure 5.
Equivalent lateral force distribution derived from modal analysis.
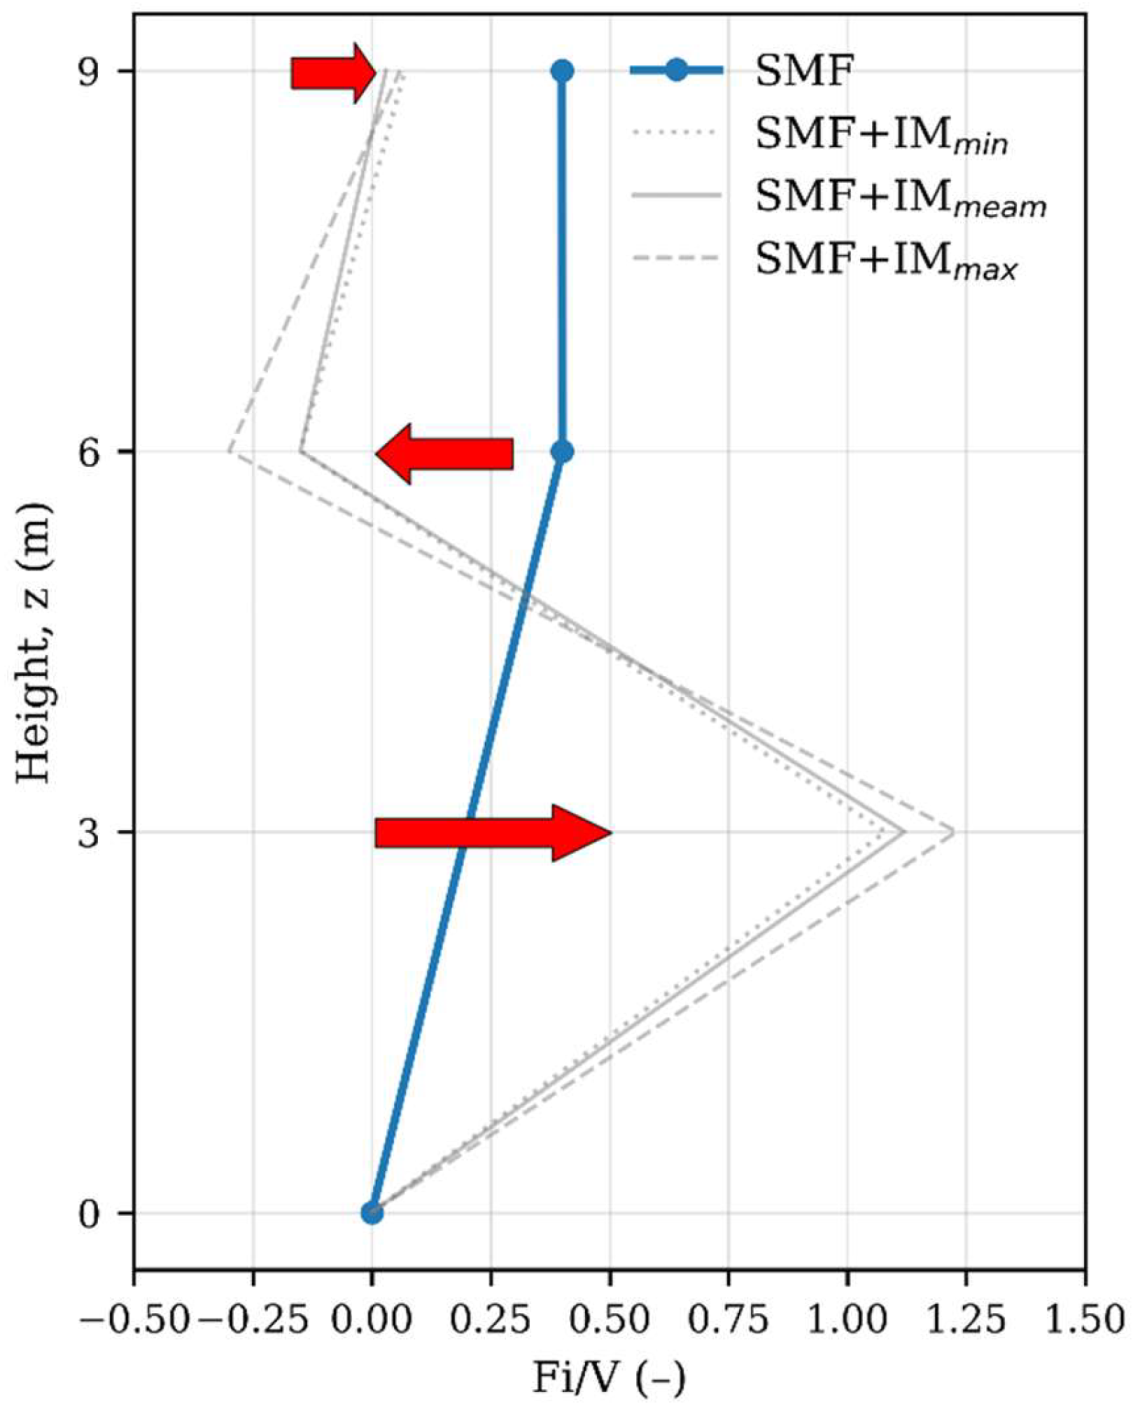
Figure 6.
Seismic Response Reduction Factor.

Figure 7.
Seismic Performance Point.
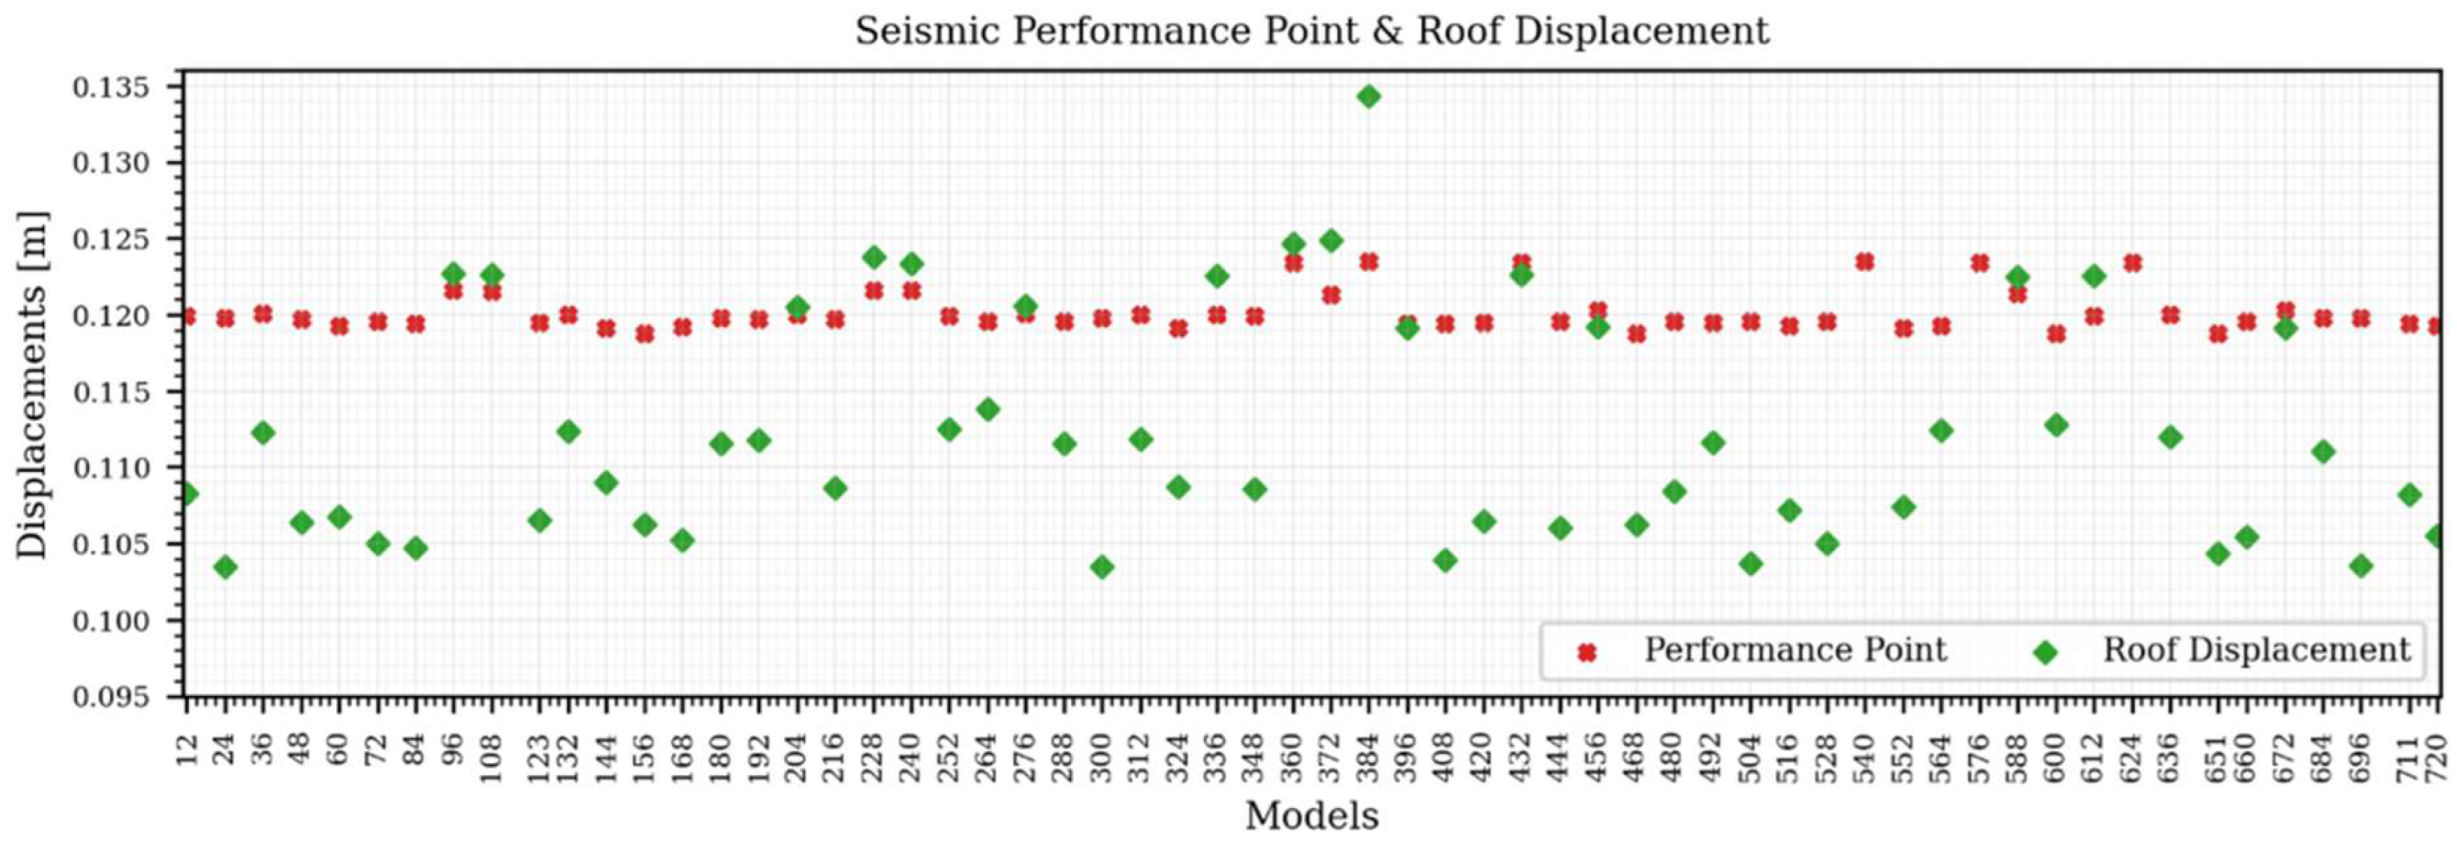
Figure 8.
Local Damage Index.
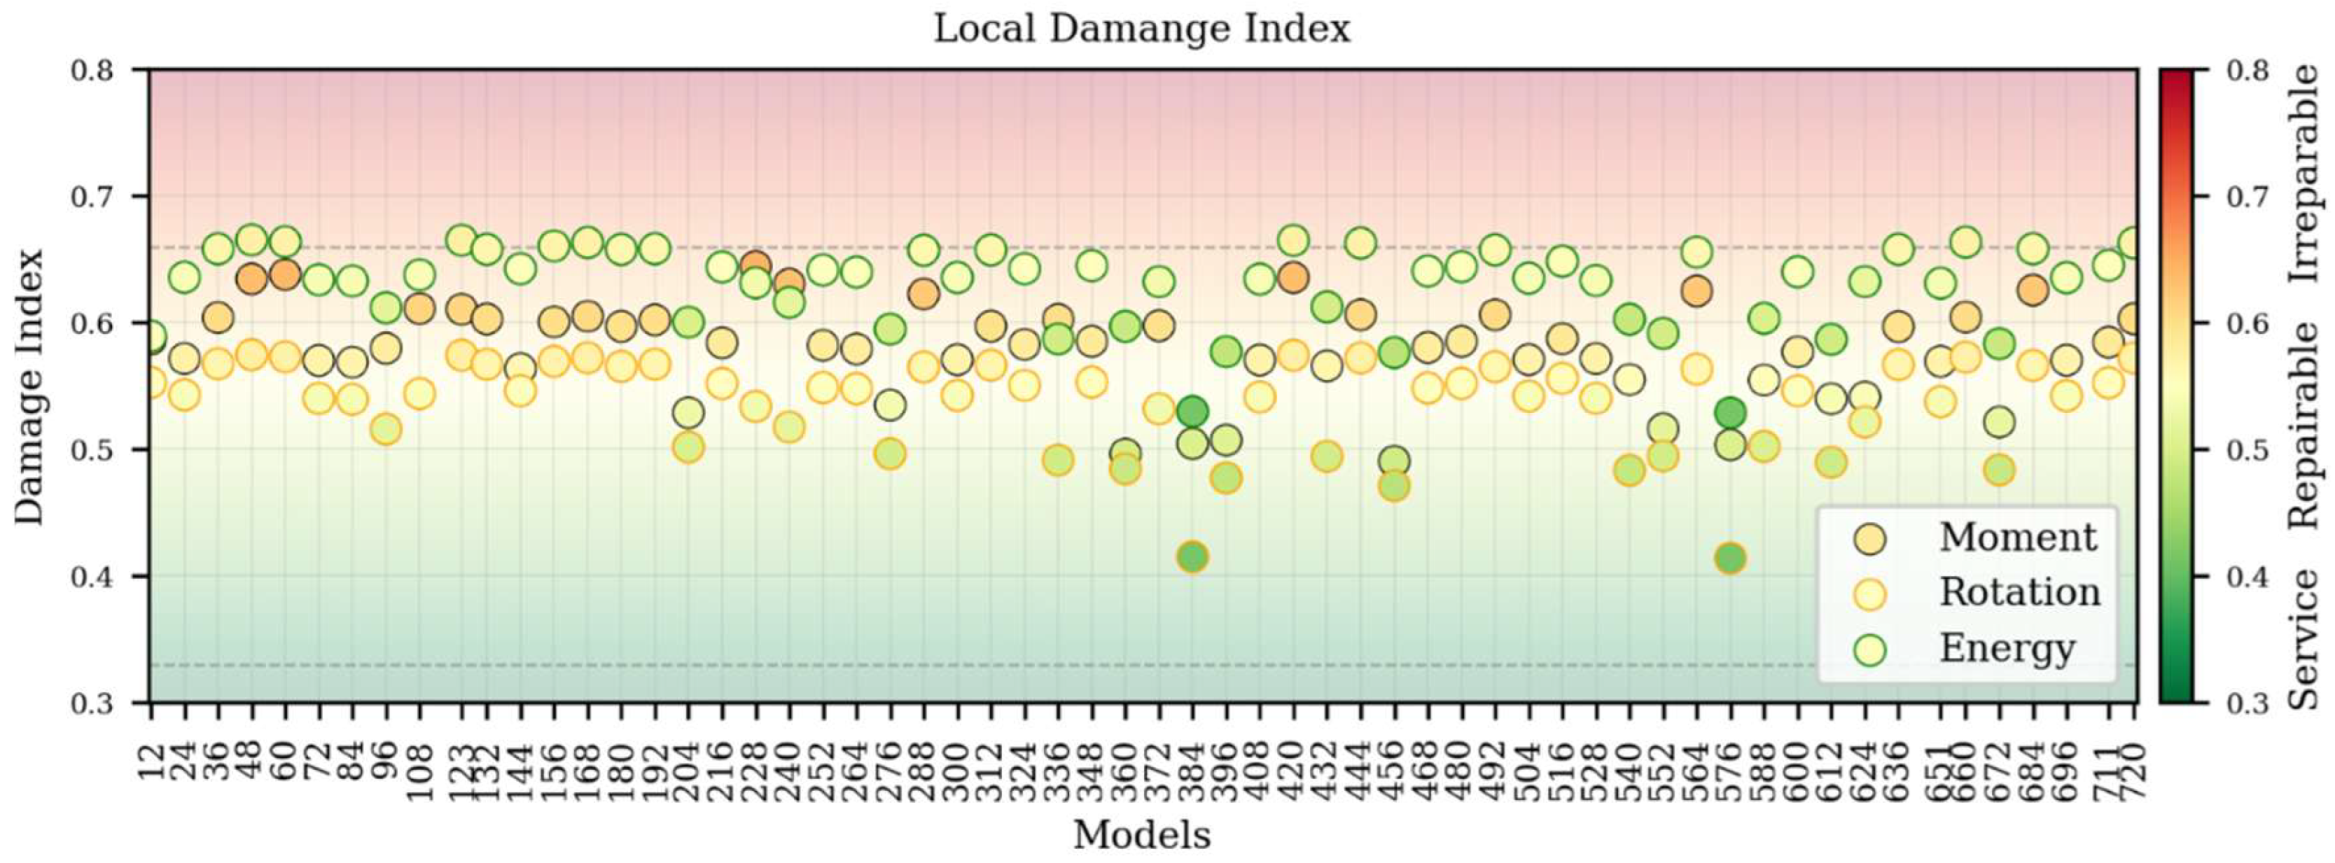
Figure 9.
Masonry Damage (a) Control and (b) Redesign.
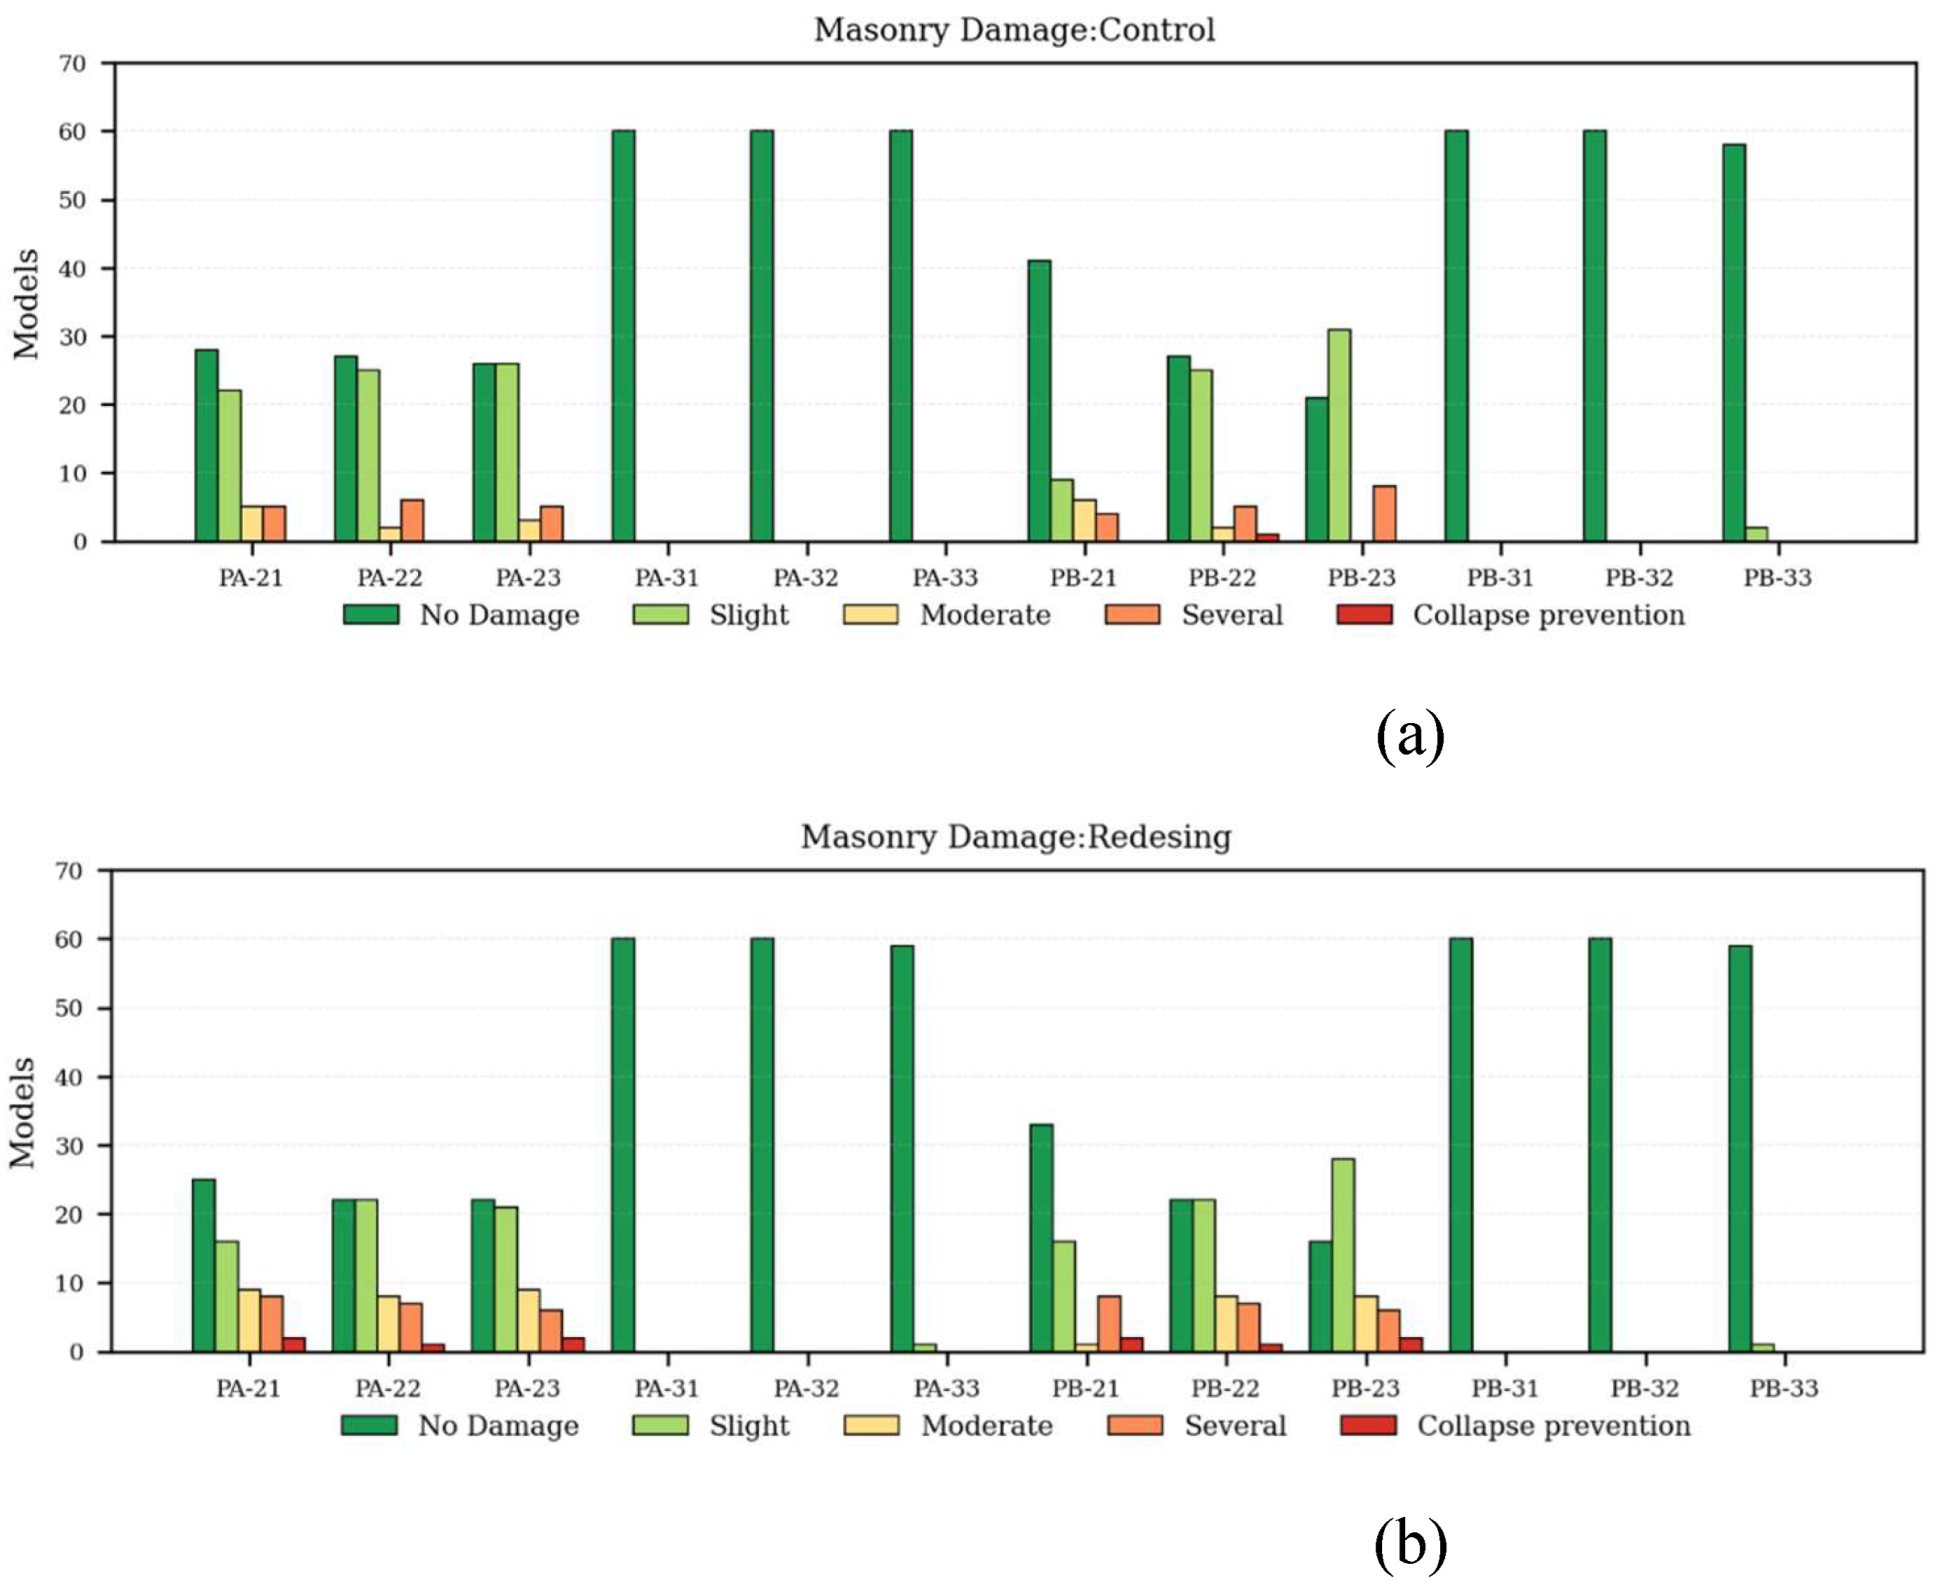
Figure 11.
Proposed Equivalent Lateral Force Distribution.
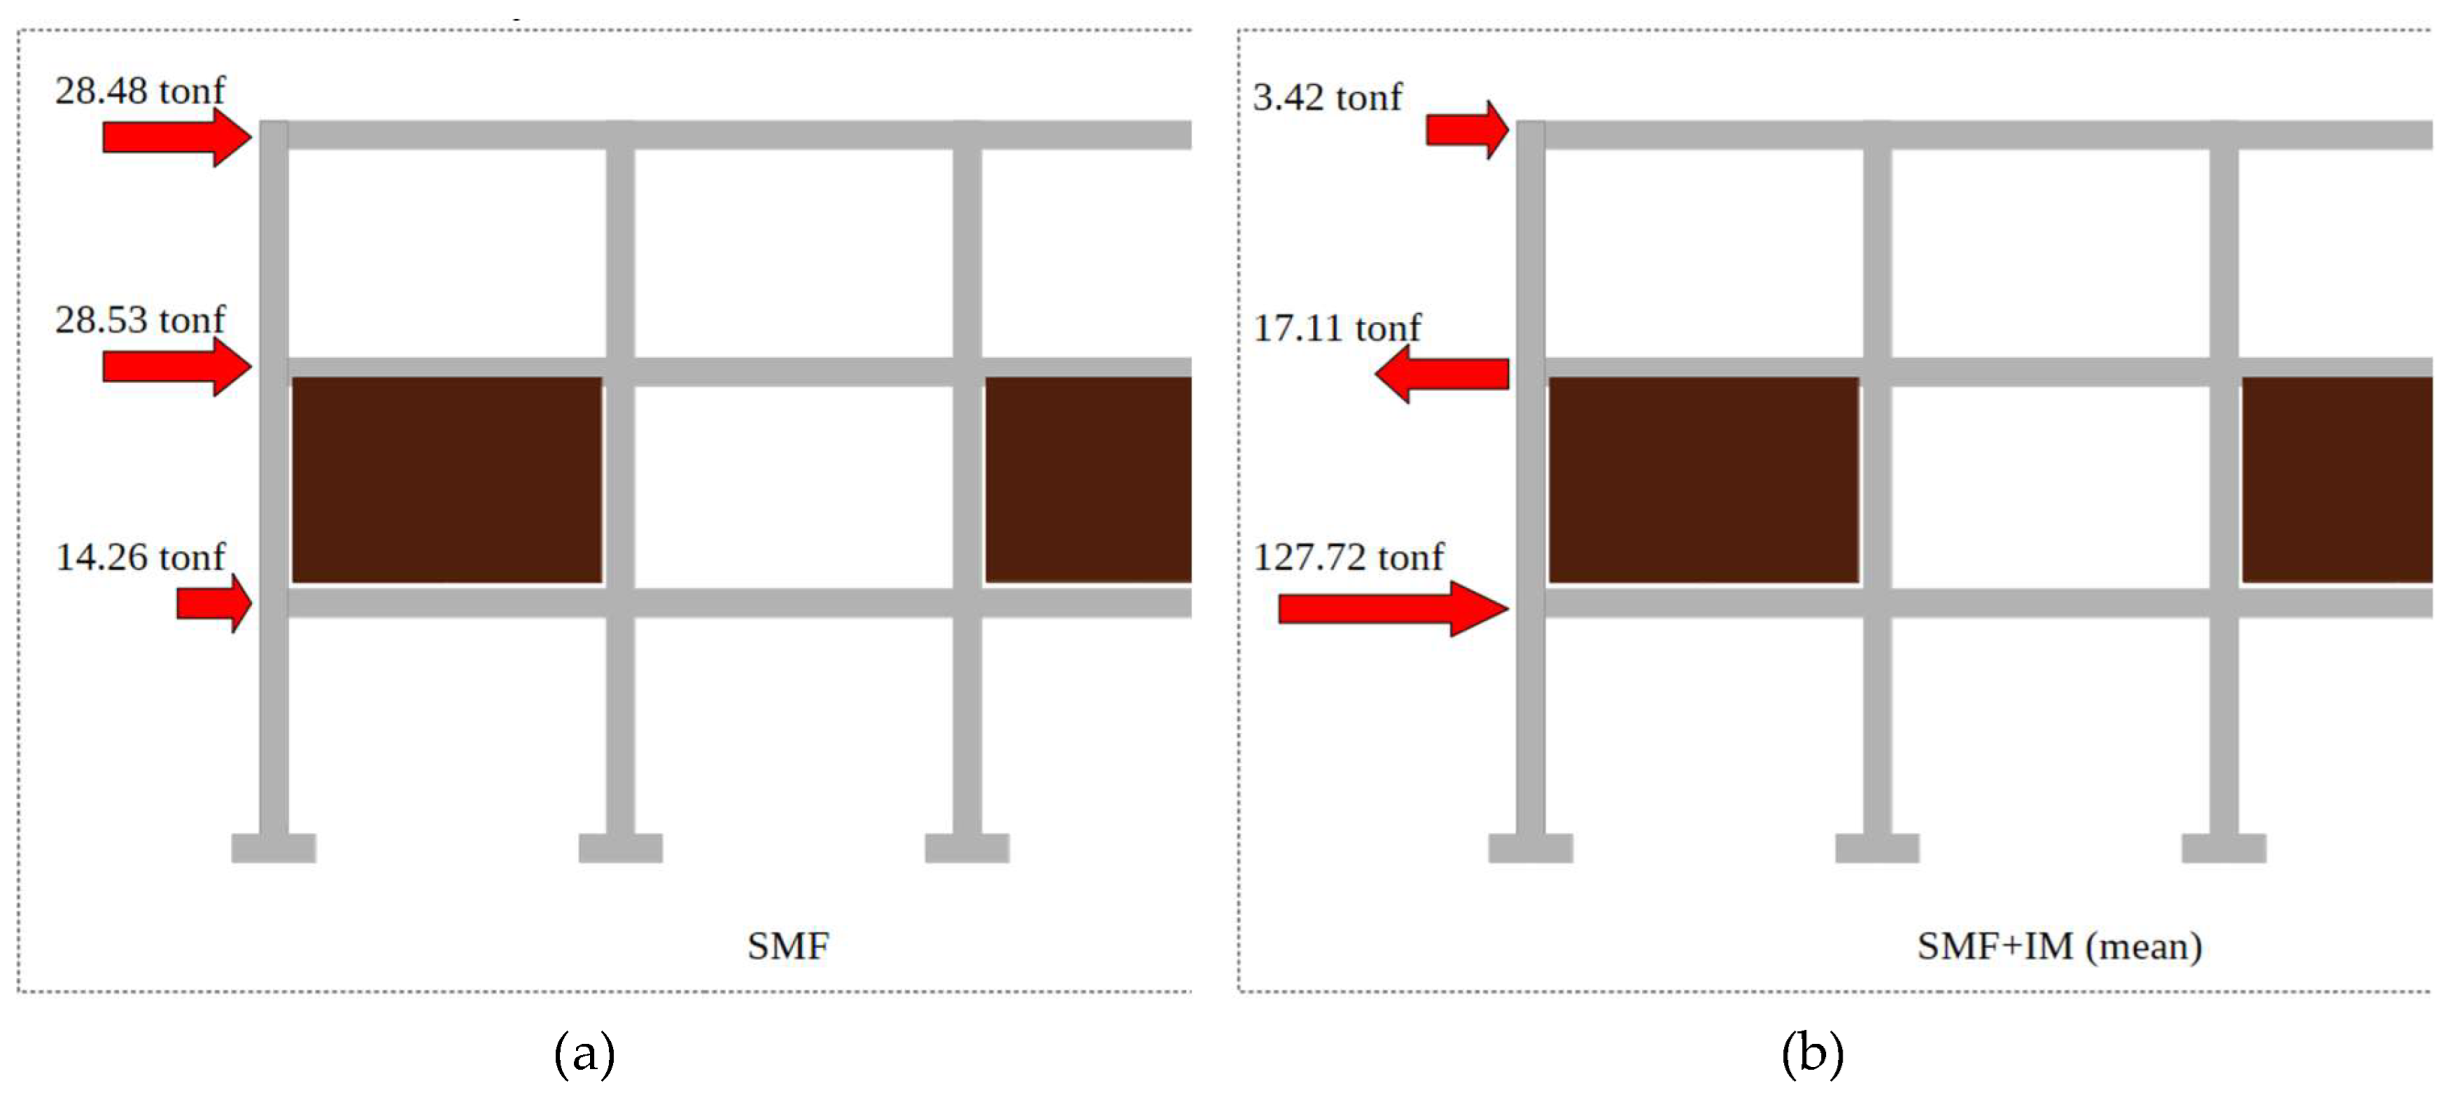
Figure 12.
Ground-Floor Column Redesign Alternatives (a) Effect of cross-sectional dimensions, (b) Effect of reinforcing steel ratio, (c) Effect of axial load level and (d) Combined effect of cross-sectional dimensions and reinforcing steel ratio.
Figure 12.
Ground-Floor Column Redesign Alternatives (a) Effect of cross-sectional dimensions, (b) Effect of reinforcing steel ratio, (c) Effect of axial load level and (d) Combined effect of cross-sectional dimensions and reinforcing steel ratio.
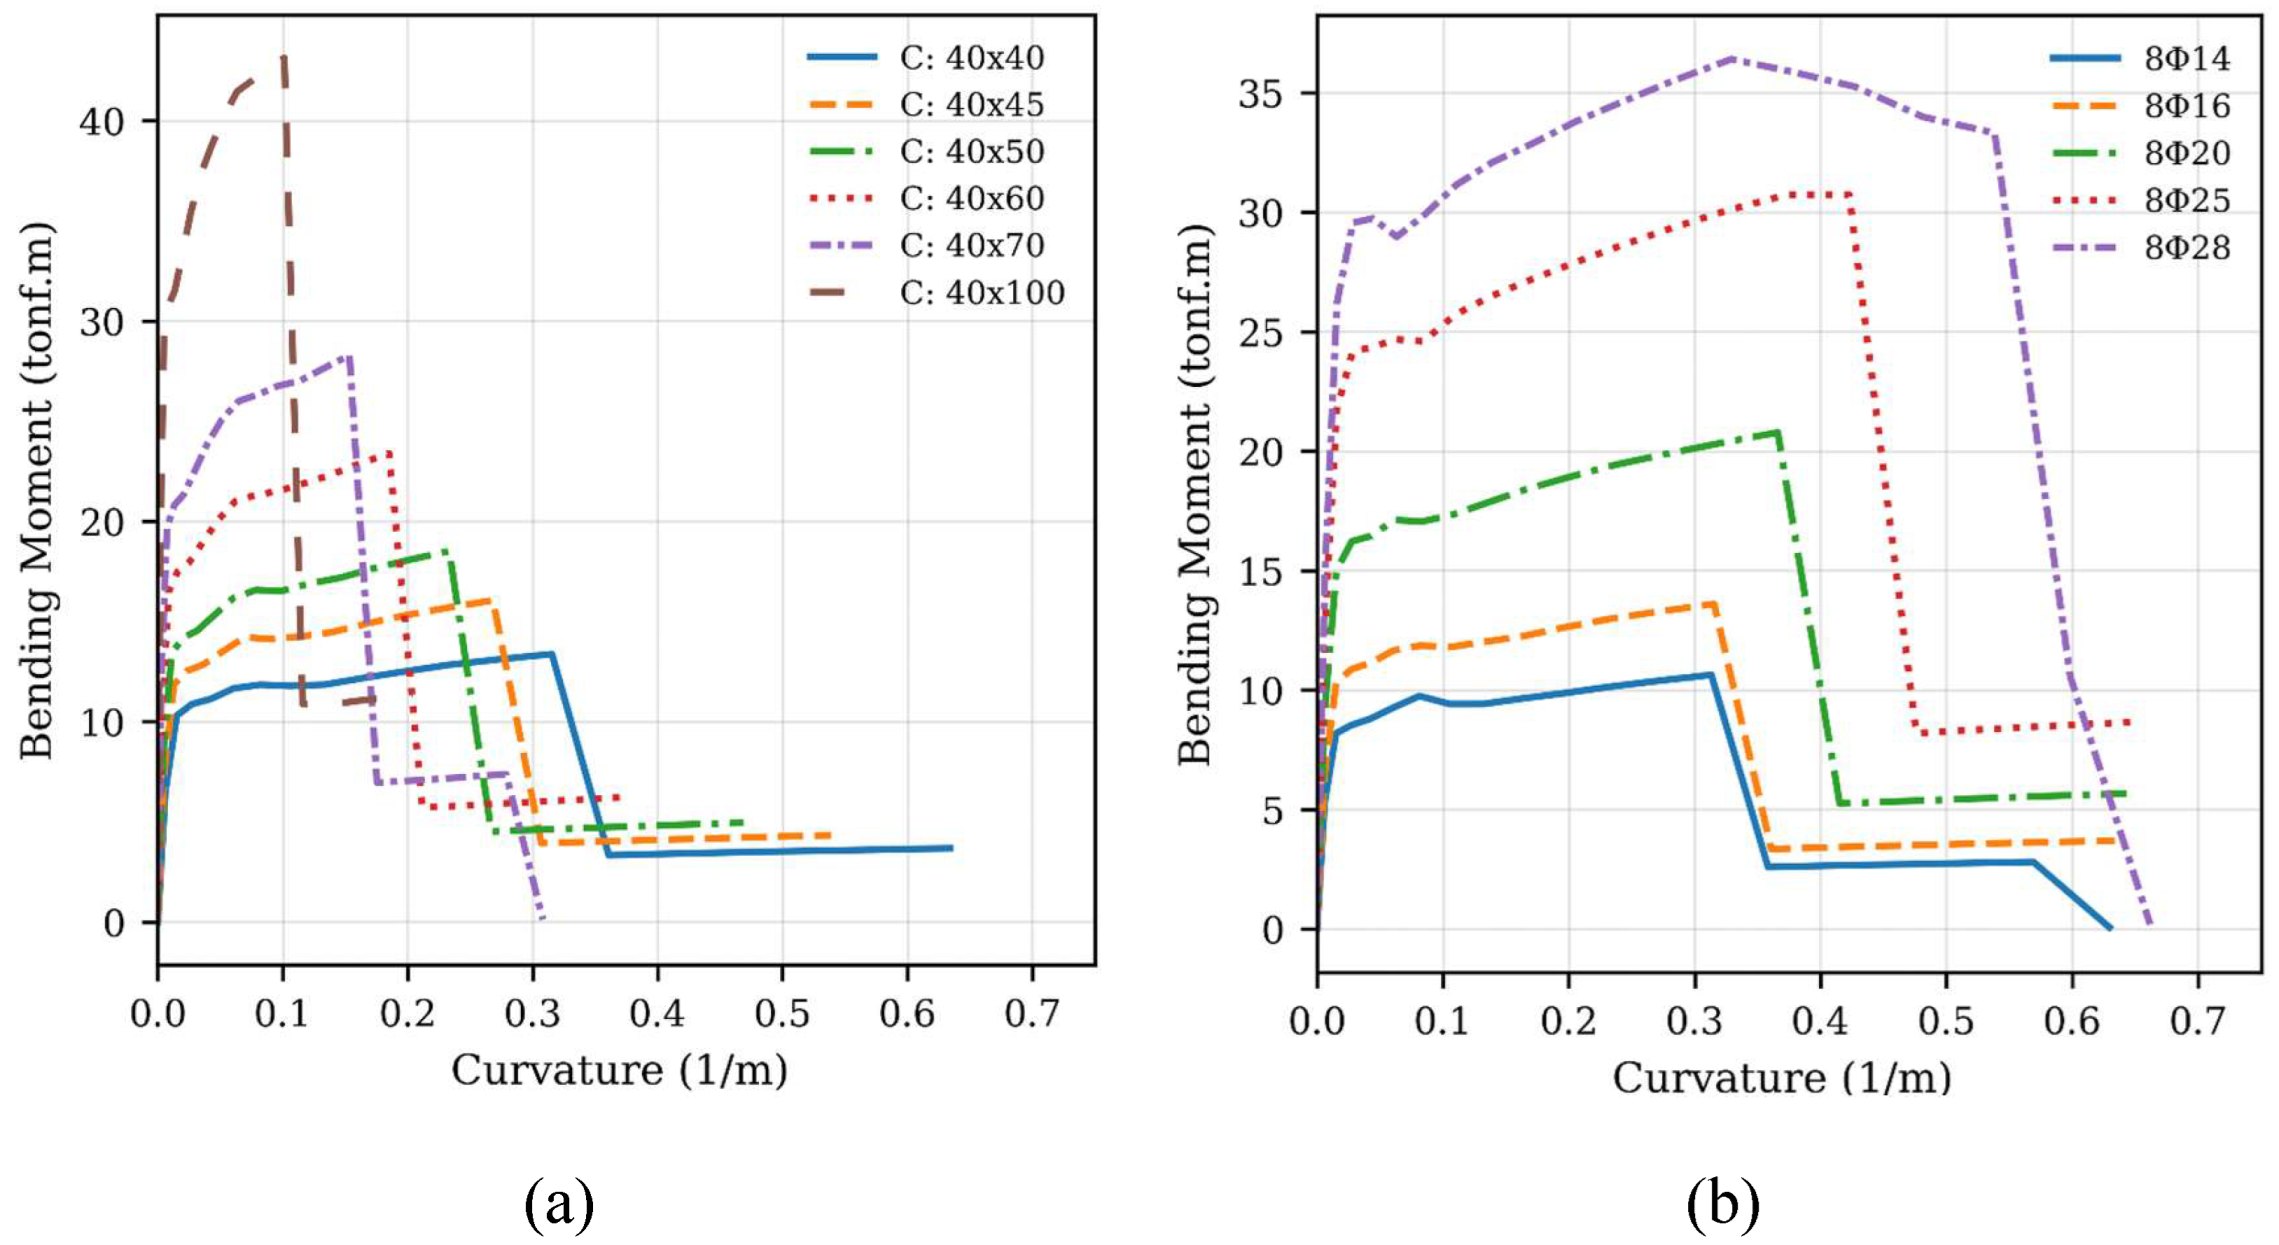
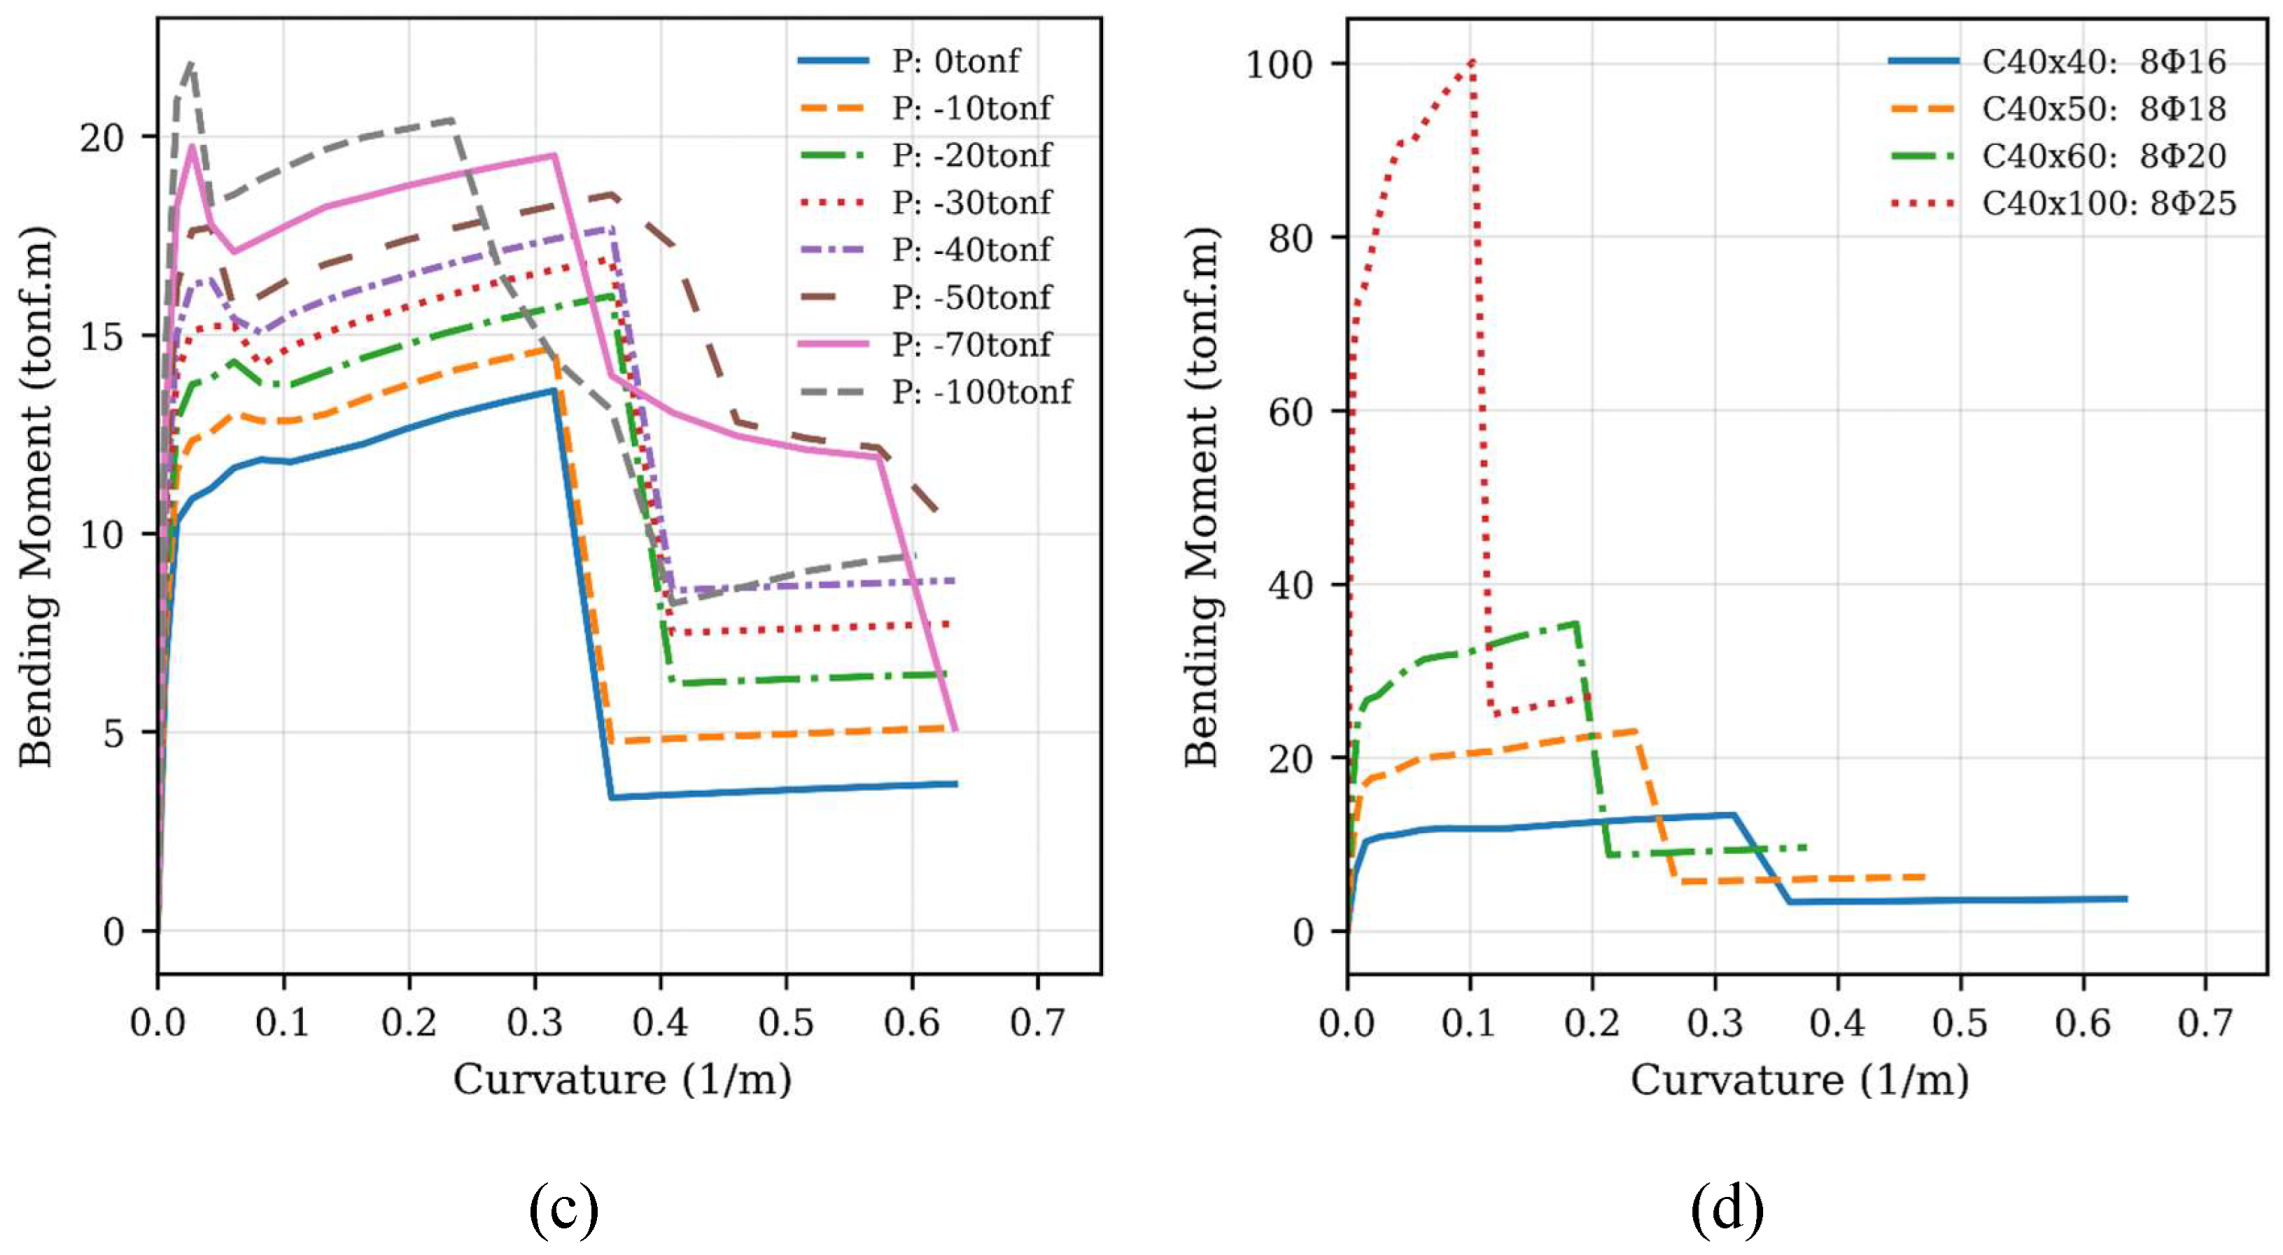
Figure 13.
Action Differences: (a) NEC-15 Model vs. (b) Design Proposal.
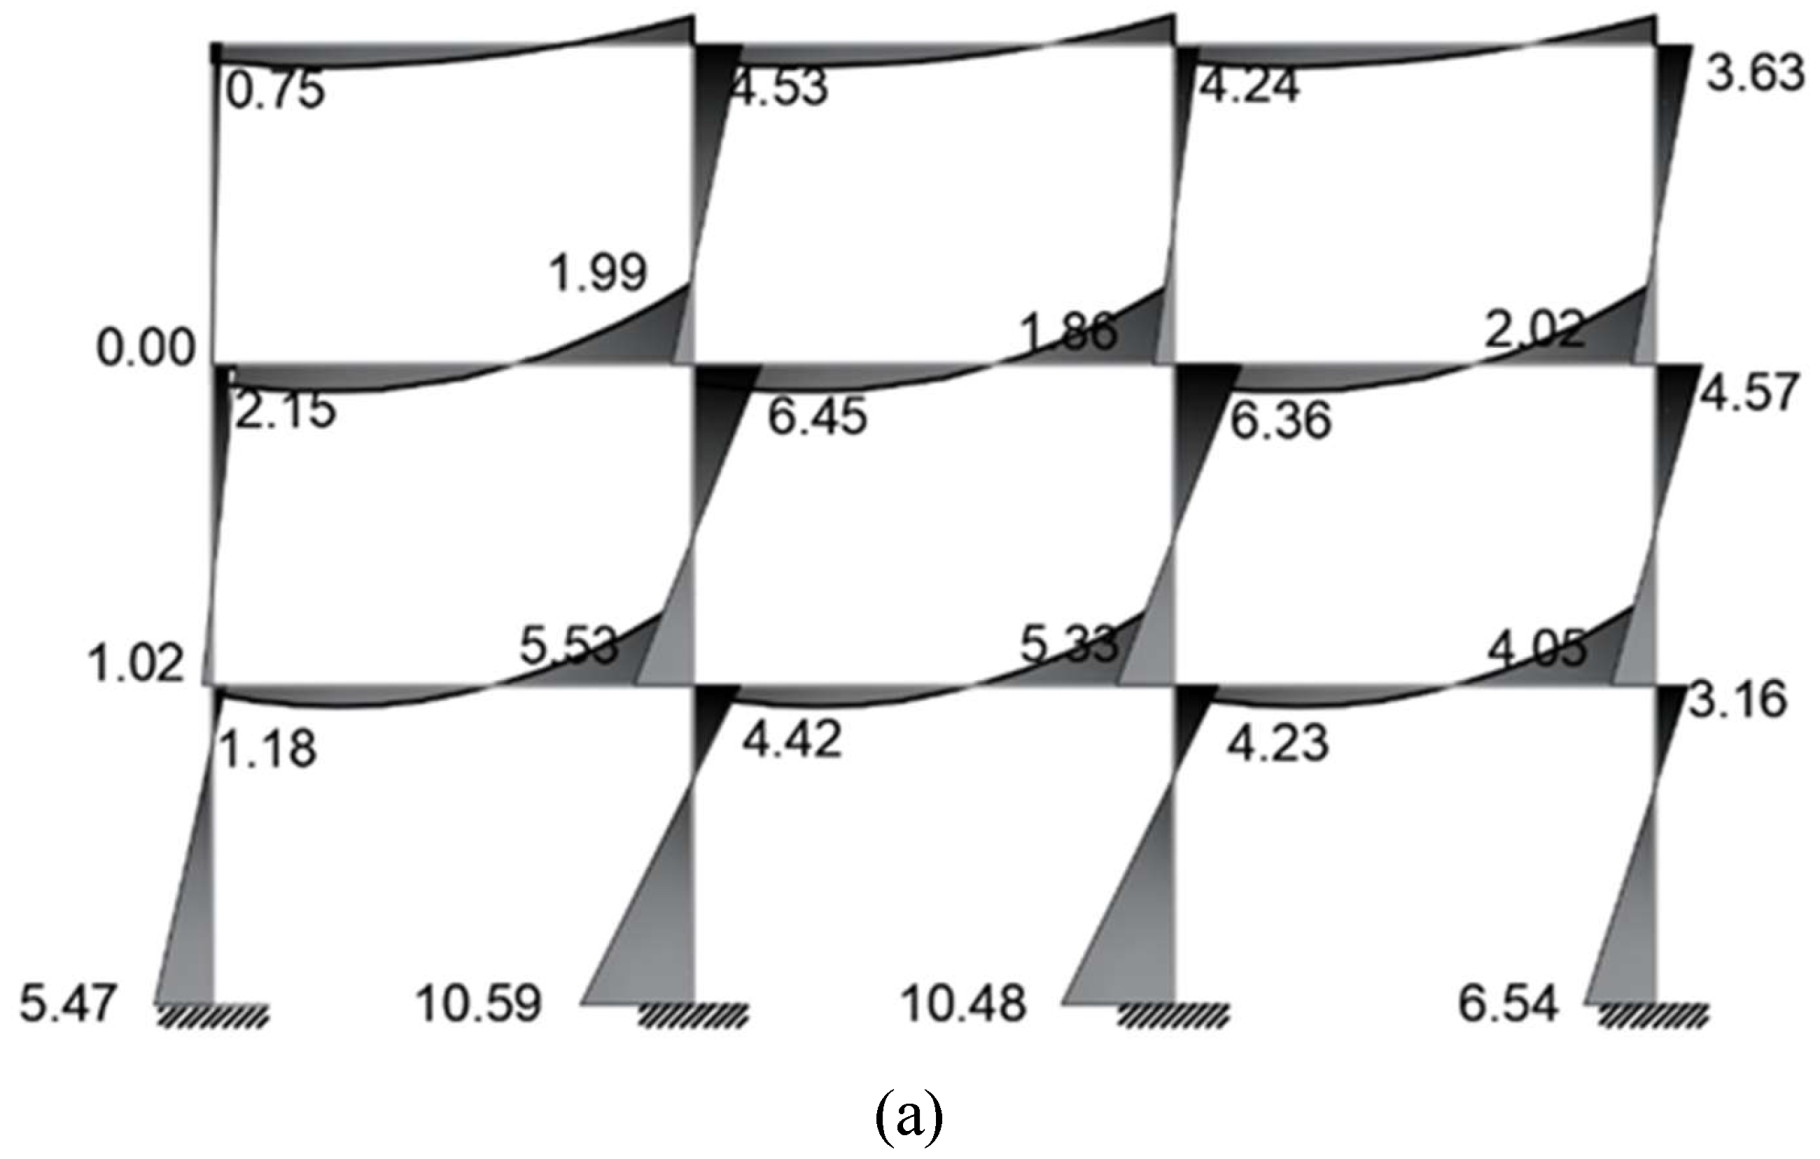
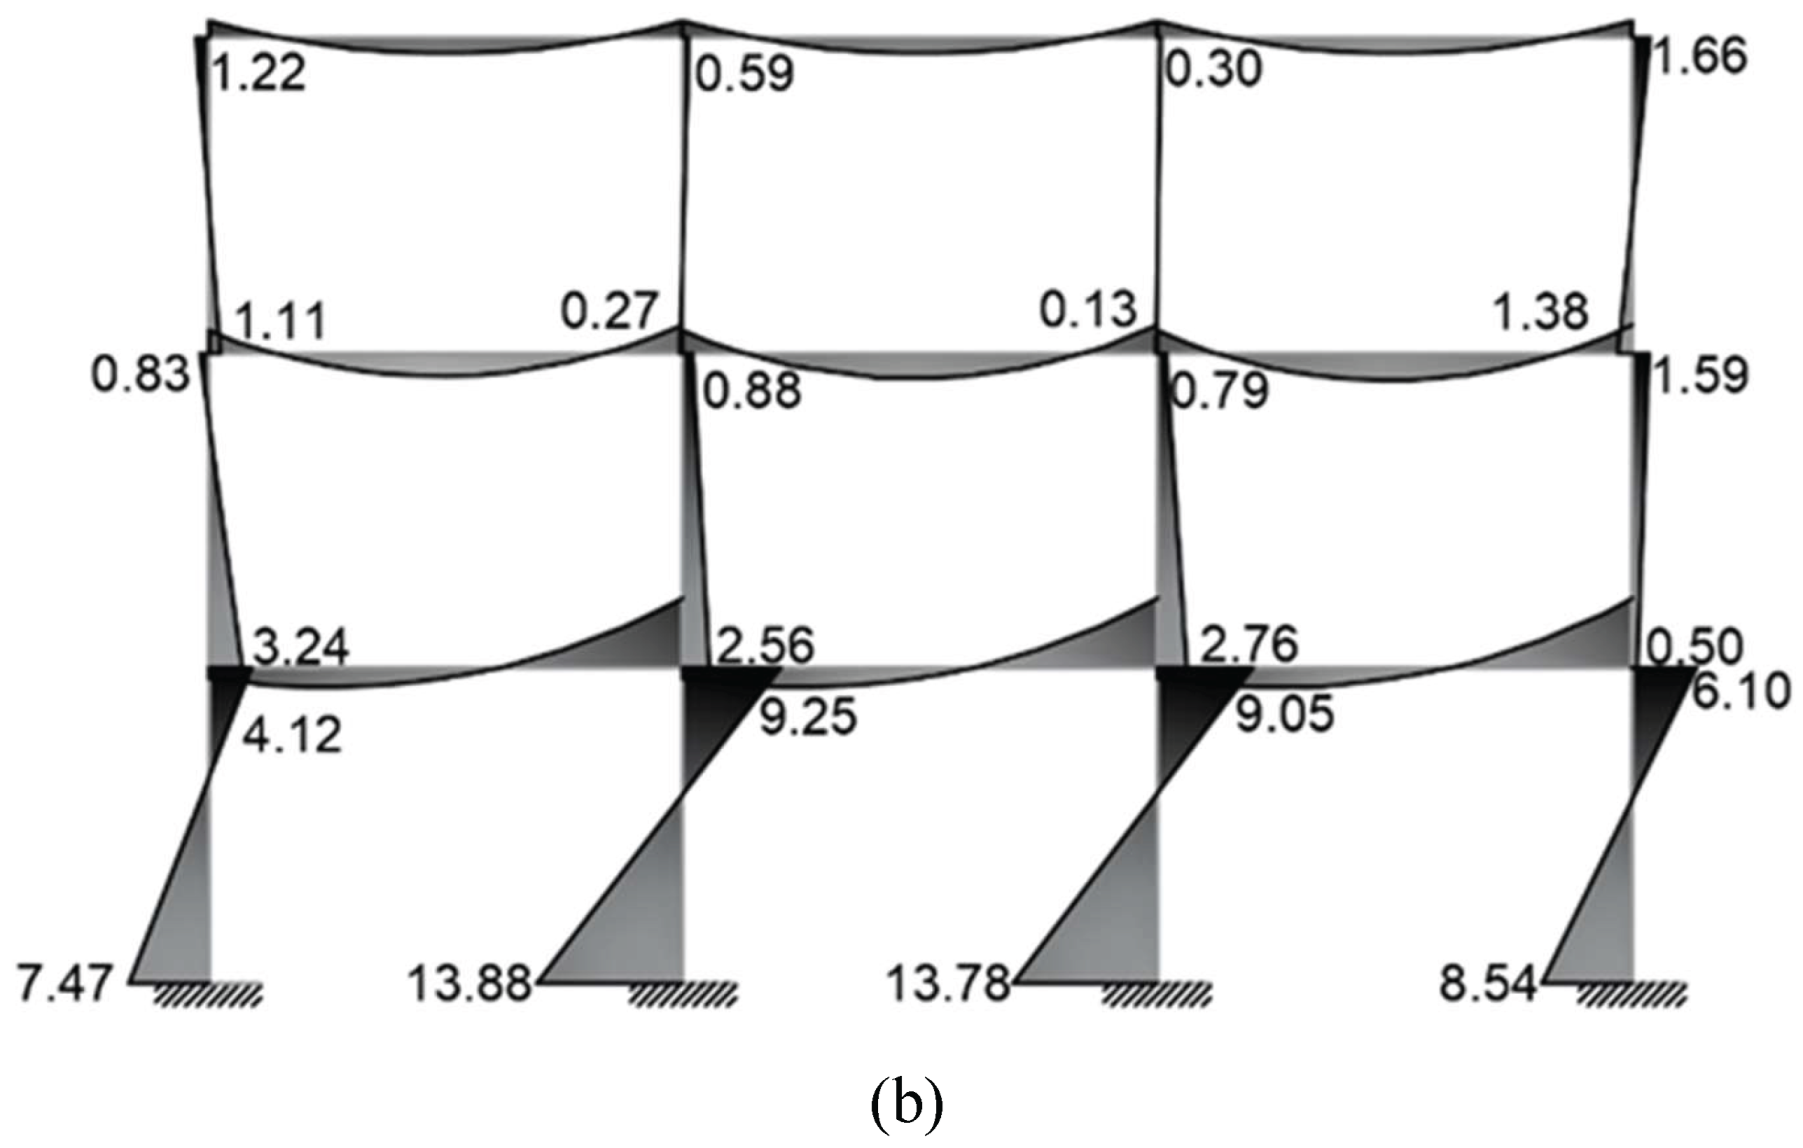

Table 1.
Lateral and gravitational loads.
| Parameter | Unit | Value |
|---|---|---|
| City | - | Quito |
| Soil Type | - | D |
| Use | - | Residential |
| Seismic zone | ° | V |
| Response modification factor (R) | - | 8 |
| Seismic coefficient | % | 0.1488 |
| Dead load (typical floor) | Kgf/m2 | 700 |
| Dead load (terrace) | Kgf/m2 | 430 |
| Live load (typical floor) | Kgf/m2 | 200 |
| Live load (terrace) | Kgf/m2 | 100 |
Table 2.
Material Properties.
| Parameter | Unit | Value |
|---|---|---|
| Compressive strength f’c | Kgf/cm2 | 210 |
| Modulus of elasticity Ec | Kgf/cm2 | |
| Yield strength fy | Kgf/cm2 | 4200 |
Table 3.
Building geometry.
| Parameter | Unit | Value |
|---|---|---|
| Number of stories | u | 3 |
| Number of bays | u | 3 |
| Storey height | m | 3 |
| Floor area | m2 | 182.25 |
Table 4.
Infill masonry properties adopted in the study case.
| Parameter | Unit | Value |
|---|---|---|
| Wall thickness (tw) | mm | 150.00 |
| Modulus of elasticity (Emθ) | kgf/cm2 | 16,005.46 |
| Equivalent strut width (bw) | mm | 1,694.54 |
| Shear strength (fws) | kgf/cm2 | 0.067 |
| Compressive strength (f’w) | kgf/cm2 | 0.204 |
| Masonry strength (fmθ) | kgf/cm2 | 10.42 |
| Strain at max stress (ε’m) | mm/mm | 0.0020 |
| Ultimate strain (ε’u) | mm/mm | 0.0150 |
| Initial shear strength (τ₀) | kgf/cm2 | 0.462 |
| Friction coefficient (μ*) | - | 0.23 |
| Maximum shear stress (τmax) | kgf/cm2 | 1.151 |
Table 5.
Strain Limits to Evaluate Performance.
| Performance level | Strain limit | Observation |
|---|---|---|
| Yielding of reinforcing steel | 0.002 | Onset of yielding |
| Service compression of concrete | 0.004 | Onset of cover spalling |
| Service tension of reinforcing steel | 0.015 (1) | (1) Elements subjected to axial loads |
| 0.010 (2) | (2) Elements subjected to non-axial loads | |
| Damage control in confined concrete compression | 0.025 | Fracture of transverse confinement reinforcement |
| Damage control in reinforcing steel tension | 0.060 | Slip between reinforcing steel and concrete at the critical section |
| Ultimate strain limit of reinforcing steel | 0.100 | Fracture of reinforcing steel, therefore the section is no longer capable of carrying gravitational load |
Table 6.
Drift Results.
| Drift Distortion | Damage Level | Type of Response | Damage Description |
| ≤ 0.10 | No damage | Elastic | Slight cracks at the corners |
| ≤ 0.28 | Slight | Inelastic, with stiffness degradation, maximum strength reached | Growth of initial cracks and appearance of localised compression cracks in both directions |
| ≤ 0.40 | Moderate | Inelastic, post-peak with strength and stiffness degradation | Cracks of appreciable length |
| ≤ 1.00 | Severe | Inelastic, post-peak with marked strength degradation | Extended cracking and crushing, portions of surface spalling |
| ≥ 1.00 | Collapse prevention | Inelastic, post-peak with marked strength degradation until total loss | Partial detachment of masonry units |
Table 7.
Relationship Between the Damage Index and the Performance Limit State.
| Damage Index (D.I.) | Performance Limit State |
|---|---|
| D.I. ≤ 0.33 | Serviceable |
| 0.33 ≤ D.I. ≤ 0.66 | Repairable |
| 0.66 ≤ D.I. ≤ 1.00 | Irreparable |
| D.I. ≥ 1.00 | Collapse |
Table 8.
Shear Base, Displacement and Stoyer-Drift SMF .
| Floor level |
Inertial Force tonf | Displacement m |
Storey-Drift % |
|---|---|---|---|
| 3 | 28.48 | 0.0235 | 1.25 |
| 2 | 28.53 | 0.0173 | 1.96 |
| 1 | 14.26 | 0.0075 | 1.50 |
| Ground floor | 71.27 | - | - |
Table 9.
Assessment of Displacement Estimators.
| Estimator | Initial Sample | Final Sample | ||
| Nv. +3.00 | Nv. +3.00 | Nv. +6.00 | Nv. +9.00 | |
| N° | 243 | 235 | 235 | 235 |
| Mean | 0.006165 | 0.006106 | 0.008177 | 0.008706 |
| Mode | 0.005873 | 0.005873 | 0.006991 | 0.007232 |
| Median | 0.006073 | 0.006068 | 0.007925 | 0.00834 |
| Variance | 1.38E-07 | 3.78E-08 | 9.33E-07 | 1.23E-06 |
| Deviation | 0.000372 | 0.000194 | 0.000966 | 0.001109 |
| % Standard Deviation | 6.0 | 3.2 | 11.8 | 12.7 |
| Kurtosis | 12.87 | 0.44 | 0.49 | 0.43 |
| Skewness | 3.32 | 0.88 | 1.14 | 1.09 |
Table 10.
Ground-floor soft-storey verification.
| Storey floor | Inertial Forces (Tonf) |
Shear Forces (Tonf) |
Mean Displacement (m) |
(m) |
(tonf/m) |
|
|---|---|---|---|---|---|---|
| 3 | 28.48 | 28.48 | 0.00533 | 0.00046 | 61913.043 | - |
| 2 | 28.53 | 57.01 | 0.00487 | 0.00104 | 54817.308 | 0.89 |
| 1 | 14.23 | 71.24 | 0.00383 | 0.00383 | 18600.522 | 0.34 |
Table 11.
Equivalent lateral force coefficients per storey.
| Floor Level |
SMF | SMF+IMmin | SMF+IMFmean | SMF+IMmax |
|---|---|---|---|---|
| 3 | 0.399 | 0.07 | 0.03 | 0.06 |
| 2 | 0.400 | -0.15 | -0.15 | -0.30 |
| 1 | 0.200 | 1.08 | 1.12 | 1.23 |
| Base | - | - | - | - |
Table 12.
Comparison of equivalent lateral force distributions.
| Floor | ELF NEC | ELF NEC* | ELFi1 | |||
|---|---|---|---|---|---|---|
| Level | Fi/V | Fi | Fi/V | Fi | Fi/V | Fi |
| 3 | 0.399 | 28.44 | 0.40 | 31.60 | 0.03 | 3.42 |
| 2 | 0.400 | 28.53 | 0.40 | 31.70 | -0.15 | -17.10 |
| 1 | 0.200 | 14.26 | 0.20 | 15.84 | 1.12 | 127.72 |
| Base shear | 71.27 | 79.19 | 114.03 | |||
| Diference % | 160.0% | 144.0% | - | |||
Disclaimer/Publisher’s Note: The statements, opinions and data contained in all publications are solely those of the individual author(s) and contributor(s) and not of MDPI and/or the editor(s). MDPI and/or the editor(s) disclaim responsibility for any injury to people or property resulting from any ideas, methods, instructions or products referred to in the content. |
© 2025 by the authors. Licensee MDPI, Basel, Switzerland. This article is an open access article distributed under the terms and conditions of the Creative Commons Attribution (CC BY) license (http://creativecommons.org/licenses/by/4.0/).
Copyright: This open access article is published under a Creative Commons CC BY 4.0 license, which permit the free download, distribution, and reuse, provided that the author and preprint are cited in any reuse.


