Submitted:
25 June 2024
Posted:
26 June 2024
You are already at the latest version
Abstract
Most of the mid-high permeability sandstone oilfields in China have entered the ultra-high water cut stage, accompanied with the highly-dispersed residual oil, and the control effect of mi-cro-heterogeneity on the residual oil is increasingly prominent. Understanding the microscopic characteristics of pore structural and its evolution during the long-term waterflooding is critical for enhancing the accuracy and efficiency of oil field exploitation. While the previous insights paid more attention to the geometrical and morphological features of pore structure and ignores the relation of pore structure with the fluid flow capacity. In this study, we propose a microscopic pore structure classification method considering pore size and local permeable capacity, which realizes the physical classification and quantitative evaluation of pore structure characteristics for different permeability rocks. The micro-pore structure is classified into 6 types based on the key evaluation parameters of pore diameter and flow flux area. By taking six mid-high permea-bility sandstone core samples from Daqing oilfield in China, a series of long-term waterflooding experiments are carried out and the interior pore structure was captured using high precision CT scanning technique. The results reveals that high-permeability reservoirs exhibit concentrated pores diameters and finer throats, whereas mid-permeability reservoirs exhibit smaller pores and throats in greater quantity. With the increase of water injection volumes, the permeable ca-pacity and connectivity of the high-connectivity pore space in ultra-high- and high-permeability reservoirs are enhanced, and in mid-permeability reservoirs, the micro-heterogeneity intensifies the increase in low-connectivity small pores. These findings provide new insights for the micro-scopic heterogeneity and a solid theoretical basis for investigating the occurrence of microscopic residual oil and optimising enhanced oil recovery strategies at the late stage of ultra-high water cut.
Keywords:
Pore classification
; local permeable capacity
; pore size
; mid-high permeability sandstone
; pore structure variation
; long-term waterflooding
1. Introduction
Most of the mid-high permeability sandstone oilfields in China have entered the ultra-high water cut stage and confronted challenges such as elevated water cuts, di-minished oil extraction rates, and the difficulty in exploiting the residual oil. In this context, advanced development strategies for residual oil recovery and recovery rate enhancement have become major concerns [1,2,3]. In the ultra-high water cut stage, the residual oil is spatially distributed with high dispersion and local concentration, which is determined by the interplay between oil and water displacement within the reservoir [4,5]. Storage and permeable capabilities of reservoirs are intrinsically controlled by their micro-porous structure [6,7,8,9,10], in which the pore structure not only serves as the basic storage space of fluids, but also provides the important flow paths for oil recovery. The structural heterogeneity directly influences the distribution, fluid migration, and the residual oil volume at the micro level, and the accurate characterization of pore structure is essential for engineering applications such as strategically selecting macro-scale oil recovery techniques and precisely tapping the residual oil, as well as the subsurface water contaminant treatment.
The mid-high permeability sandstones always contain pore structure at microscopic scale, while the complexity and irregularity of the pore geometry make it difficult to characterize the microscopic characteristics. The characterization of pore structure in rocks refers to the geometry shape, pore size and distribution, and their interconnections as well as the spatial distribution of all these properties in rocks. Various techniques and methods have been developed to describe the pore structure in rock, primarily containing the imaging analysis and the experimental analysis. The former approach can make a qualitative and quantitative assessment of pore dimensions and shapes using techniques such as cast thin sections, scanning electron microscopy (SEM), computed tomography (CT) scanning, focused ion beam (FIB) SEM, and synchrotron radiation, which visually represent the micro-heterogeneity of pore structure in rocks [11,12,13,14,15,16,17,18]. The latter methodology is to derive various parameters that indicate pore structure using high-pressure mercury intrusion, constant-rate mercury intrusion, nuclear magnetic resonance (NMR), gas adsorption, and small-angle scattering [19,20,21,22,23,24,25,26]. To understanding the effect of pore structure on residual oil recovery in reservoir rocks, it is necessary to investigate the pore structure characteristics from the perspective of fluid flow capacity. Therefore, we used the high-resolution microscopic CT to characterize the micro-heterogeneity of pore structure during the long-term waterflooding.
Significant research efforts focus on the microscopic morphologies and sizes in sandstone reservoir rocks, although the porosity and permeability measurements have provided important insights into the microscopic pore structure of sandstones. The microscopic pore structure of sandstone in image analysis has been characterized by complex pore geometry, average pore radius, pore connectivity, heterogeneity coefficient, and the anisotropy. Ren et al. [27] demonstrated the distribution characteristics of core pores and throats and their contributions on permeability in dense sandstone reservoirs with different permeabilities in the Ordos Basin, by using casting flakes and capillary seepage models in core displacement experiments. They also highlighted that submicron pores and throats in reservoirs play a dominant role in seepage, but they did not discuss the impact of different pore structures within the same core on seepage. Guo et al. [28] clarified the main pore structures of different dense reservoirs, and analyzed the influence of the major throat-interval controlling factors on fluid mobility in reservoirs having different permeability levels using the conventional core analysis method, NMR, and a gas-water high-speed centrifugation method. However, they did not investigate the effect of different pore spaces on fluid mobility in detail. Pei et al. [29] summarized the differences between micro-pore structures by comparing and analyzing the core experimental results of the cast sheet, scanning electron microscope, and mercury piezoelectric curve, nevertheless, they did not elucidate the variations in permeation capability across different pore structure types. These studies confirmed that the pore structure should be quantitatively evaluated considering the emplacement and recovery of residual oil in mid-high permeability sandstones. However, there is still a gap between the microscopic characterization of pore structure and macroscopic fluid flow. Additionally, understanding the evolution of microscopic pore structure during the long-term waterflooding is also a challenging task when the relation between the microscopic pore structure and fluid flow remains ambiguous.
The goal of this paper is to investigate the pore structure characteristics and its evolution during the long-term waterflooding of mid-high permeability sandstones. To quantitatively characterize the pore structure, a new classification of microscopic pore structure is proposed based on the pore size and local permeable capacity. By taking a series long-term waterflooding experiments of 6 natural cores using the high-resolution CT imaging, the pore structure characteristics are described and classified based on digital rock analyses. Furthermore, the gradual differences with long-term water flooding in the micro-porous structure of several reservoir types are also revealed. These findings offer the fundamental insights for investigating the micro-occurrence of residual oil in the advanced ultra-high water cut and for optimizing enhanced oil recovery methodologies.
2. Materials and Methods
2.1. Sample Selection
Mid-high permeability sandstone reservoirs are classified as ultra-high-permeability reservoirs characterized by air permeability of 2000 mD or greater, high-permeability reservoirs with air permeability ranging from 500 mD to 2000mD, and mid-permeability reservoirs with air permeability ranging from 50 mD to 500 mD, according to the Evaluation Methods for Oil and Gas Reservoirs (SY/T 6285-2011), which is the oil and gas industry standard of the People's Republic of China. Taking the permeability, porosity, and median particle size of reservoirs in Songliao Basin into account, two representative core samples from each category—ultra-high-, high- and mid-permeability—were selected. The physical property parameters of the sandstone samples used in this study are presented in Table 1.
2.2. Representative Elementary Volume (REV) for Reservoirs with Different Permeabilities
This research was conducted by fusing micro-CT scanning with water-flooding oil displacement experiments, which enabled the non-destructive analysis of the core samples at various displacement process stages. By performing micro-CT scans at multiple stages of displacement, the micro-porous structure and its dynamic evolutionary traits across reservoirs with different permeability were discussed using the imaging analysis based on the digital rocks reconstructed from the micro-CT scanning images.
However, it is worth noting that two key contradictions must be weighed before core samples scanned. Firstly, there is an inverse correlation between the sample size and the scanned resolution. Specifically, an increase in sample size leads to a proportional decrease in resolution, which may hide the fine nuances of structure within the core. Conversely, pursuing high resolution reduces the sample size that can be scanned, which may cause inadequate REV coverage of the overall core characteristics, thereby reducing representativeness. Secondly, the cost of scanning is directly proportional to the increase in resolution; that is, with a higher resolution, the increase in scanning cost leads to a decline in economic benefit. Moreover, taking into account that the sweeping contribution of small pore channels is poor in practical waterflooding displacement process, the resolution level satisfies the requirements of practical engineering applications when reaches a certain resolution threshold and further enhancements do not confer substantial benefit from the effect of seepage through tiny pores.
Hence, a critical task in the accurate portrayal of micro-porous structural characteristics using digital rock models is to determine the minimum REV and the scanning resolution threshold for reservoir rocks with different permeabilities. Using permeability as the benchmark for determining the representative unit size, this study employed the size expansion method illustrated in Figure 1 and Lattice Boltzmann numerical simulation [30,31,32] to capture CT scanning structures of varying sizes from the core maximum position towards the core centre gradually. The specific parameters of the simulations are configured in Table 2. Through the above method, the changes in the pore structure across different dimension size and their consequential effects on permeability can be better understood and quantified.
Based on the simulation results for the velocity field of pore structure, the changes of permeability in the various samples with different dimension sizes and scanning resolutions can be calculated by the Darcy’s equation, as shown by the scatter data in Figure 2, the following conclusions were drawn by comparatively analysing the changes with the measured values obtained from permeability measurement, as shown by the solid red line in Figure 2:
- As the dimension size increases and scanning resolution size decreases, the calculated permeability stabilizes, and the difference between the calculated and measured values decreases. This proves that a digital rock model constructed at a reasonable size can effectively determine fluid flow characteristics within the interior pore structure of the rock core.
- Considering the economy and the allowable margin of error in engineering practice, maintaining the calculated permeability error within 10%, as indicated by the red dashed line (Figure 2), is deemed to fulfil the optimal alignment requirement for the REV and the critical resolution.
- For different reservoir rocks ranging from ultra-high permeability to middle permeability, the required minimum REV decreases along with a decrease in the pore characteristic size, with a corresponding increase in the required scanning resolution size. Specifically, for ultra-high permeability reservoirs, the minimum REV should not fall below 1200 μm, and the upper limit of resolution size should be less than 8 μm/voxel. In the case of high permeability reservoirs, the minimum REV should be no less than 800 μm, and the upper limit of resolution size is suggested to be lower than 4 μm/voxel. For mid-permeability reservoirs, the minimum REV should be not less than 600 μm, and the accurate capture of pore structure requires high scanning resolution, with the maximum resolution size not exceeding 2 μm/voxel.
2.3. Long-term waterflooding experiments
Following the determination of the minimum REV and optimal scanning resolution size for sandstone rocks with different permeabilities, this study proceeded to perform long-term waterflooding experiments. Specifically, the spatial distribution information within the sandstone sample during the water-oil displacement experiment were identified using high-resolution micro-CT scanning technique at different displacement stages. Meanwhile, the scanning data information were segmented to isolate and extract the oil, water, and solid rock phases using the specialised image analysis software such as Avizo and ImageJ. This process achieved the dynamic quantification of the micro-porous structural variations in the digital rock models at different displacement stages. The sample sizes and design for the displacement stages are shown in Table 3.
2.4. Construction of Pore Network Model
To further investigate the connectivity of the micro-porous structures and the characteristics of fluid flow within the structure, a pore network model was established using the maximum sphere method, as shown in Figure 3. This method, which was developed based on the foundational theory proposed by Fatt [31] and substantially advanced over the past 20 years, has evolved as a pivotal means for effectively constructing pore network models.
In this study, the pore-throat segmentation method based on local hydraulic resistance equivalence [34] was applied to extract localised features, pore body and pore throat, based on the CT scan images for sandstone samples with different permeabilities. By balancing the local hydraulic resistance equivalence between the real void space and the simplified pore-throat geometry, this method transforms the porous structure into a network of pores and connecting throats and generates pore network models for ultra-high-, high-, and mid-permeability sandstone samples, as presented in Figure 4. The extraction of the characteristic parameters for pore structure, which are presented in Figure 5, indicates that ultra-high permeability reservoirs have a broad range of pore sizes (varying from 10 μm to 130 μm in diameter, with diameters concentrated around approximately 50 μm), with high pore-to-throat connectivity (a ratio of total throats to total pores as high as 3.81). As the permeability decreases, high permeability sandstones exhibit a more focused distribution of pore sizes (ranging from 10 μm to 80 μm in diameter, with diameters concentrated around 32 μm) and increasingly refined throats (a throat-to-pore ratio close to 2.76). In addition, middle permeability reservoirs are characterised by a greater number of smaller pores and throats (with the pore sizes clustered around 18 μm). With a further reduction in the ratio of total throats to total pores to approximately 2.71, the decreased throat dimensions generally contribute to lower permeability.
3. Three-Dimensional Characterization of Microscopic Pore Structure
3.1. Pore Structure Classification Method
The physical properties of pore structure, particularly the permeable capacity, plays a significant role in the sandstone rock permeability at local and global scales and affects the flow paths of the contained fluids, such as oil and water. Traditional pore classification and evaluation methods [35–37] depend on parameters such as the average throat radius, sorting coefficient, and homogeneity coefficient. These parameters, which emphasise the geometric morphology and distribution patterns for pores, provide only a reflection of the pore structural characteristics without a thorough consideration of the porous structure impact on the fluid flow. It is intended to more accurately describe the connectivity characteristics of the pore space and its contribution to rock permeability. In this study, we introduce a new characteristic parameter, the flow flux area, to quantify the local permeable capacity. Simultaneously, the pore diameter is used to represent the global permeability of the pore structure. The threshold of the aforementioned two crucial characteristic parameters can be more easily determined, as illustrated in Figure 6, by analysing pore characteristics from the pore network representation for the digital rock samples.
- 4.
- Pore diameter R. This parameter is used to represent the distribution and morphological characteristics of the granular pores within the sandstone, as the pore diameter directly influences the resistance experienced by fluids during interior fluid flow in pore structure. By comprehensively analysing the distributional features for throat diameters across sandstone rocks with different permeabilities, pore structure was classified into three categories—large, mid, and small pores—by employing a pore diameter-versus-pore volume percentage curve. The boundaries were set to pore diameters corresponding to 33.3% and 66.6% volume percentages of the total pore volume with reference to the contribution of pore volume.
- 5.
- Flow flux area S. As a new characterisation parameter for pore structure, the flow flux area quantifies the connectivity of pores by counting the areas of all throats associated with each pore. This treatment can be derived from the product of the coordination number (or the number of throats linked to a single pore) and the average throat area. The flow flux area is a more direct representation of the low permeable capacity, which is vital for comprehending and evaluating the connectivity within the sandstone rocks and the effect of pore and throat dimensions on variations in local permeability. Given the negative skew distribution observed in the relationship between the flow flux area and the corresponding pore volume percentage, the median value of the flow flux area from this curve (313 μm²) was selected as the boundary for classifying the pores into high and low connectivity.
Based on the boundary division of the two key parameters abovementioned, this study established a set of micro-pore structure classification criteria for mid-high permeability rocks. The pores were subdivided into high-connectivity large pores, low-connectivity large pores, high-connectivity mid pores, low-connectivity mid pores, high-connectivity small pores, and low-connectivity small pores, as shown in Table 4. Thus, the pore structure of sandstone rocks with different permeabilities can be classified effectively.
3.2. Evaluation on Classified Reservoir Pore Structure
According to the aforementioned pore structure classification approach, this study categorised and comparatively analysed the pore structures over ultra-high-permeability, high-permeability, and mid-permeability reservoirs and defined the different distributions of pore structures between reservoirs of varying permeabilities, as shown in Figure 7. From the perspective of pore volume proportion, ultra-high- and high-permeability reservoir rocks are dominated by high-connectivity mid-to-large pores, which indicate their satisfactory storage and permeation capabilities. Furthermore, mid-permeability reservoir rocks are predominantly composed of small pores, indicating that the connectivity is significantly dependent on the effective connectivity within these small pores. Regarding the proportions of pore numbers, low-connectivity small pores have a remarkable prevalence in all reservoir types. These low-connectivity small pores, however, have different influence on connectivity in reservoir rocks with different permeabilities. In ultra-high-permeability rock, over 50% of low-connectivity small pores account for only 2% of the volume, and they exert a negligible effect on the oil-water flow dynamics. Low-connectivity tiny pores, which account for 64% of all pores in mid-permeability reservoir rock, have an effect on fluid movement because they make up 10% of the volume. After the non-connected pores were excluded, the pores within various oil-bearing strata demonstrated favourable connectivity, although there was a marked different distribution between large and small pores. In ultra-high-permeability reservoirs with optimal permeability, high-connectivity large pores are dominant, accounting for 50%. In contrast, in mid-permeability reservoirs that have weak permeability, the volume proportion of mid- and high-connectivity large pores drops sharply to less than 1%, with a limited proportion of pore numbers. Apparently, a transformation occurs within the pore structure of mid-permeability reservoirs in which high-connectivity small pores dominate, which decreases the overall seepage capacity.
4. Pore Structure Variation Characteristics
4.1. Evolutionary Patterns of Classified Reservoir Pore Structures
By precisely calculating and analysing the pore size distributions based on the digital rock models at various displacement stages, this study uncovered the evolution of pore structures in diverse sandstone samples under the influence of long-term water flooding. After the core samples underwent different displacement stages, the pore size of different permeability cores exhibited a similar distribution trend of pore diameters, with a broad range from 0 μm to 200 μm. However, when the water displacement of oil reached 500 PV, the pore size distribution in the range of 130 μm to 160 μm was moderately enhanced, as shown in Figure 8. As the displacement process advanced, the mean and median pore diameters of all sandstone rocks increased in synchronisation. Notably, the variation amplitude in the pore diameter is greater in ultra-high- and high-permeability reservoirs, with a small variation in pore diameters for mid-permeability rock, as shown in Figure 9. A robust linear correlation was observed between the porosity at different displacement stages and the displacement PV value. As indicated by the study, there is an overall upwards trend in the porosity of rock samples from the ultra-high- and high-permeability sandstone, which suggests an increased connectivity and better permeable capacity of the pore structure during long-term water flooding. Conversely, the variation in porosity remained stable in mid-permeability rock, as shown in Figure 10.
4.2. Variation Characteristics for Different Pore Types
We extracted and analysed the volume and number proportions of different digital rock models with different permeabilities at four critical displacement stages, including initial oil saturation, 0.5 PV, 3.0 PV and 500.0 PV, to reveal the dynamic changes in various pore types.
According to our findings, the micro-heterogeneity within all sandstone rocks intensifies as the displacement process advances. Specifically, a pronounced expansion trend was observed in large- and mid-pores within the rock under long-term water flooding. In ultra-high-permeability and high-permeability rocks, especially, changing pore size is observed in the pore systems above 25 μm, with significant expansion observed in these pores. This expansion directly causes a substantial increase in the permeable capacity of high-connectivity pore spaces and an expansion in the spatial extent of connected pathways, as well as the expanded dominant pores and the intensified preferential flow pathways.
In mid-permeability rock, however, changes in pore size are mainly confined to pore systems between 20 μm and 40 μm, whereas the overall connectivity of pores improves, as shown in Figure 11. During this process, the increasing low-connectivity small pores and their extensive distribution indicate that the connectivity characteristics become complex within the pore space of mid-permeability rock, and there is enhanced interconnectivity among small pores. However, the advantage over large pores in mid-permeability rock does not increase as significantly as in ultra-high- and high-permeability rocks. To a certain degree, the evolution of the pore structure in mid-permeability reservoirs is observed to be unique. These discoveries offer a scientific foundation for the study on the occurrence of micro-residual oil and an optimised strategy for enhancing oil recovery, and they enhance our understanding on the evolved pore structure in various reservoir types during water replacement.
5. Conclusions
- (1)
- Different pore structures among different reservoir types are identified in mid-high permeability reservoirs. Ultra-high-permeability reservoirs in Daqing oilfields are significantly varied in pore diameter and distribution, featuring extensive pore diameters and high pore-throat connectivity. As permeability decreases, high-permeability rock demonstrates narrower pore diameter ranges with finer throats, whereas mid-permeability rock exhibits numerous smaller pores and throats and the low penetrating quality due to the reduced throat size.
- (2)
- An evaluation method for pore structure classification is established based on local and global permeable capacity. This study creatively introduces the flow flux area to indicate throat flow capacity. By proposing a classification approach of the complex porous system in rocks, the micro-pore structure is categorised into high-connectivity large pores, low-connectivity large pores, high-connectivity mid pores, low-connectivity mid pores, high-connectivity small pores, and low-connectivity small pores, which further reflects the differences of conveyance strength at pore scale.
- (3)
- Micro-pore structure differences between sandstone rocks with different permeabilities are presented. Ultra-high- and high-permeability rocks are dominated by mid- and high-connectivity large pores and show robust storage and permeation capabilities, whereas mid-permeability rock is composed of small pores, which indicates that the pore connectivity rely on the effective interconnectivity of these small pores and their permeable capacity declines as the pore type changes.
- (4)
- The long-term water flooding variation in pore structure is defined for classified sandstone rocks. As water injection increases, the permeable capacity and connectivity of high-connectivity pore spaces are strengthened in ultra-high- and high-permeability rocks. In contrast, despite the overall improvement in connectivity, the mid-permeability rock witnesses an increase in low-connectivity small pores and an expansion in their distribution, which accelerates micro-heterogeneity.
The findings of this study support future research on the micro-residual oil occurrence mechanism at ultra-high water cut late stage and research on optimal strategies for enhancing oil recovery.
Author Contributions
Conceptualization, J. Wu; methodology, Y. Zhu; data curation, Y. He, Q. Wang, and Y. Bao; formal analysis, S. Shao; investigation, R. Li; funding acquisition, J. Guo; writing—original draft preparation, J. Wu and Y. Zhu; writing—review and editing, J. Guo. All authors have read and agreed to the published version of the manuscript.
Funding
This research was partially funded by the Scientific Research and Technology Development Program of PetroChina(2023ZZ22YJ02).
Data Availability Statement
The pore network extraction in this work is based on the open-source software local resistance equivalence pore-throat segmentation (LoRePorTS). The library is available at Mendeley Data via https://data.mendeley.com/datasets/mwsxdb2tpm/3.
Conflicts of Interest
The authors declare no conflicts of interest.
References
- Hou, L.H.; Li, H.W.; Li, Q. Characteristics of oil and gas discoveries in recent 20 years and future exploration in the world. Pet. Explor. Dev. 2018, 23, 44–53. [Google Scholar]
- Zhang, H.; Shan, G.J.; Du, Q.L.; Wang, C.X. Technical challenges and solutions of water flooding development in late stage of ultra-high water cut in placanticline oilfield in Daqing. Petroleum Geology & Oilfield Development in Daqing 2022, 41, 60–66. [Google Scholar]
- Yuan, Q.F.; Pang, Y.M.; Du, Q.L.; Fang, Y.J.; Zhao, Y.F.; Lu, H.M. Development laws of the sandstone oilfields at extra-high watercut stage. Petroleum Geology & Oilfield Development in Daqing 2017, 36, 49–55. [Google Scholar]
- Liu, K.; Wang, R.; Shi, W.Z.; Martín, J.D.; Qi, R.; Zhang, W.; Qin, S.; Travé, A. Full scale of pore-throat size distribution and its control on petrophysical properties of the Shanxi Formation tight sandstone reservoir in the North Ordos Basin, China. Lithosphere 2023, v20222358721. [Google Scholar] [CrossRef]
- Li, Q.; You, X.L.; Li, J.S.; Zhou, Y.; Lu, H.; Wu, S.H.; Yue, D.L.; Zhang, H.M. Pore structure and factors controlling shale reservoir quality: Acase study of Chang 7 Formation in the Southern Ordos Basin, China. Enerigies 2024, 17, 1140. [Google Scholar] [CrossRef]
- Keith, W. S.; Robert, M. C. The evolution of pore-scale fluid-saturation in low-permeability sandstone reservoirs. AAPG Bulletin 2015, 99, 1957–1990. [Google Scholar]
- Coskun, S.B.; Wardlaw, N.C. Image analysis for estimating ultimate oil recovery efficiency by waterflooding for two sandstone reservoirs. J. Petrol. Sci. Eng. 1996, 15, 237–250. [Google Scholar] [CrossRef]
- Zhou, Y.; Wu, S.T.; Li, Z.P.; Zhu, R.K.; Xie, S.Y.; Zhai, X.F.; Lei, L. Investigation of microscopic pore structure and permeability prediction in sand-conglomerate reservoirs. J. Earth Sci. 2021, 32, 818–827. [Google Scholar] [CrossRef]
- Xiao, L.; Bi, L.; Yi, T.; Lei, Y.T.; Wei, Q.L. Pore structure characteristics and influencing factors of tight reservoirs controlled by different provenance systems: A case study of the Chang 7 Members in Heshui and Xin’anbian of the Ordos Basin. Energies 2023, 16, 3410. [Google Scholar] [CrossRef]
- Mu, C.H.; Hua, H.J.; Wang, X.K. Characterization of pore structure and reservoir properties of tight sandstone with CTS, SEM, and HPMI: A case study of the tight oil reservoir in fuyu oil layers of Sanzhao Sag, Songliao basin, NE China. Front. Energy Res. 2023, 10, 1053919. [Google Scholar] [CrossRef]
- Dai, Z.; Luo, D.L.; Xie, M.Y. A new method for particle size analysis of cuttings images based on improved watershed algorithm. China Offshore Oil Gas 2019, 31, 103–107. [Google Scholar]
- Jiang, Z.L.; Pan, Y.J.; Fu, C.Q.; Li, W.W.; Wang, Y.C.; Long, W.J. Three-dimensional pore structure characterization of cement paste by X-ray computed tomography (XCT) and focused ion beam/scanning electron microscopy (FIB/SEM). Constr. Build. Mater. 2023, 383, 131379. [Google Scholar] [CrossRef]
- Bijoyendra, B.; Sushanta, K.; Douglas, V. Understanding the micro structure of Berea Sandstone by the simultaneous use of micro-computed tomography (micro-CT) and focused ion beam-scanning electron microscopy (FIB-SEM). Micron 2011, 42, 412–418. [Google Scholar]
- Gu, N.L.; Hu, W.S.; Gao, L.Y.; Liu, G.W. Three-dimensional spatial microscopic characteristics and developmental influencing factors of tight gas layers in Hangjinqi Prospect Area, Ordos Basin, China. Energies 2024, 17, 399. [Google Scholar] [CrossRef]
- Sakdinawat, A.; Attwood, D. Nanoscale X-ray Imaging. Nat. Photonics 2010, 267, 840–848. [Google Scholar] [CrossRef]
- Ju, Y.; Gong, W.; Xie, H.; Chang, C.; Xie, L.; Liu, P. Three-dimensional characterisation of multi-scale structures of the Silurian Longmaxi shale using focused ion beam-scanning electron microscopy and reconstruction technology. J. Nat Gas Sci. Eng. 2017, 46, 26–37. [Google Scholar] [CrossRef]
- Dmitriy, A.M.; Shadfar, D.; Ali, K.; Masoud, R.; Yousef, K.; Ma, T.S. Multiscale and diverse spatial heterogeneity analysis of void structures in reef carbonate reservoirs. Geoenergy Sci. Eng. 2024, 233, 212569. [Google Scholar]
- Ali, A.A.; Namam, M.S.; Dmirriy, A.M. Paleoenvironmental evaluation using an integrated microfacies evidence and triangle model diagram: A case study from Khurmala Formation, Northeastern Iraq. J. Mar. Sci. Eng. 2023, 11, 2162. [Google Scholar] [CrossRef]
- Ju, Y.; Xi, C.; Zheng, J.; Gong, W.; Wu, J.; Wang, S.; Mao, L. Study on three-dimensional immiscible water–Oil two-phase displacement and trapping in deformed pore structures subjected to varying geostress via in situ computed tomography scanning and additively printed models, Int. J. Eng. Sci. 2022, 171, 103615. [Google Scholar] [CrossRef]
- Zhang, J.J.; Sun, J.Y.; Cao, Y.F.; Zhong, X.; Li, S.X. Research of micro-pore structure and seepage characteristics of Portugal Reservoir in Lamadian Oilfield. Mineral Exploration 2023, 14, 1402–1411. [Google Scholar]
- Wang, J.J.; Wu, S.H.; Xiao, S.M.; Guo, S.H.; Lv, Z.Q.; Jiao, H.Y.; Guo, Z.H.; Liu, Z.W.; Wu, H.; Xiao, Q. Distribution characteristics of micropore throat size of turbidite sandstone reservoir in middle sub-member of 3rd member, Shahejie Formation in Dongying Depression. Journal of China University of Petroleum 2021, 45, 12–21. [Google Scholar]
- Lin, J.; Yang, Y.; Yin, J.C.; Liu, Y.; Li, X.W. Study on pore structure evolution characteristics of weakly cemented sandstone under freeze–thaw based on NMR. Water 2023, 15, 281. [Google Scholar] [CrossRef]
- Chen, D.Y.; Zhu, Y.S.; Wang, W.; Zhang, L.L.; Tang, J.Y.; Ren, J.L.; Wang, Y.Z. Pore structure of tight sandstones with differing permeability: The He 8 Member of the Middle Permian Lower Shihezi Formation, Gaoqiao area, Ordos Basin. Energy Sci. Eng. 2024, 12, 117–135. [Google Scholar] [CrossRef]
- Zhang, Q.P.; Qi, H.P.; Huo, Y.; Li, Y.; Li, T.; Zhang, D.D.; Lin, K.; Yang, C.; Tong, J.; Zhao, H.; Suo, B.S.; Xue, Y.L.; Yi, C.P. Study of pore-throat structure characteristics and fluid mobility of Chang 7 tight sandstone reservoir in Jiyuan area, Ordos Basin. Open Geosciences 2023, 15, 20220534. [Google Scholar] [CrossRef]
- Chen, C.B.; Fu, L.; Chen, X.J.; Zhang, T.; Xie, Y.H.; Wang, H.B.; Zhu, Y.S. Quantitative Evaluation Method for Micro Heterogeneity of Tight Sandstone: A case study of Chang-6 reservoir of Yanchang Formation in Huaqing area, Ordos Basin. Acta Sedimentol. Sin. 2021, 39, 1086–1099. [Google Scholar]
- Gong, W.; Liu, Y.; Xi, C.; Ju, Y.; Wang, M. Dynamic characterization of residual oil during long-term waterflooding experiments in heterogeneous porous structures. Fuel, 2024, 356, 129567. [Google Scholar] [CrossRef]
- Ren, X.X.; Li, A.F.; Wang, Y.Z.; Wu, S.T.; Wang, G.J. Pore structure of tight sand reservoir and its influence on percolation-taking the Chang 8 reservoir in Maling oilfield in Ordos basin as an example. Oil & Gas Geology 2015, 36, 774–779. [Google Scholar]
- Guo, H.K.; Liu, Q.; Li, H.B.; Meng, Z.Q.; Bai, Y.W. Characteristics of pore structure of Jurassic tight reservoir in Sichuan basin. Journal of Shenzhen University (Science and Engineering) 2013, 30, 306–312. [Google Scholar] [CrossRef]
- Pei, Z.S.; Zhou, Z.G.; Chang, W.; Zhang, Y. Type division and reservoir characteristics of micro-pore structure in S area of Daqing placantieline. Petroleum Geology and Engineering 2022, 36, 82–87. [Google Scholar]
- Lin, W.; Li, X.Z.; Yang, Z.M.; Xiong, S.C.; Luo, Y.T.; Zhao, X.L. Modeling of 3D rock porous media by combining X-Ray CT and Markov chain Monte Carlo. Journal of Energy Resources Technology - Transactions of the ASME 2020, 142, 013001. [Google Scholar] [CrossRef]
- Yun, L. Reconstruction and analysis of tight sandstone digital rock combined with X-ray CT scanning and multiple-point geostatistics algorithm. Mathematical Problems in Engineering 2020, v20209476060. [Google Scholar]
- Song, R.; Wang, Y.; Liu, J.J.; Cui, M.M.; Lei, Y. Comparative analysis on pore-scale permeability prediction on micro-CT images of rock using numerical and empirical approaches. Energy Science and Engineering 2019, 7, 2842–2854. [Google Scholar] [CrossRef]
- Fatt, I. The network model of porous media. SPE 1956, 207, 144–159. [Google Scholar] [CrossRef]
- Liu, Y.; Gong, W.; Zhao, Y.; Jin, X.; Wang, M. A Pore-Throat Segmentation Method Based on Local Hydraulic Resistance Equivalence for Pore-Network Modeling. Water Resour. Res. 2022, 58, e2022WR033142. [Google Scholar] [CrossRef]
- Meng, J.; Zhang, L.Y.; Li, R.; Zhao, A.F.; Zhu, B.W.; Huang, P.; Shen, S.B. Microscopic pore structure characteristics of tight sandstone reservoirs and its classification evaluation. Special Oil & Gas Reservoirs 2023, 30, 71–78. [Google Scholar]
- Pang, Y.D.; Liu, Y.L.; Zhang, L.; Xi, N.N.; Yuan, L.J.; Chen, C.B. Micro-pore structure and fluid mobility of tight sandstone reservoirs of Chang 8 menber in Huachi area in Ordos basin. Petroleum Geology & Oilfield Development in Daqing 2023, 42, 1–10. [Google Scholar]
- Ran, X.Q.; Wu, S.H.; Fu, J.; Wei, X.S.; Chu, M.J. Research on the pore structure classification of low permeability reservoir of the Yanchang formation in Longdong area, Ordos basin. Earth Science Frontiers 2013, 20, 77–85. [Google Scholar]
Figure 1.
Changes in microscopic parameters of digital cores extracted from the same rock sample at different sizes.
Figure 1.
Changes in microscopic parameters of digital cores extracted from the same rock sample at different sizes.
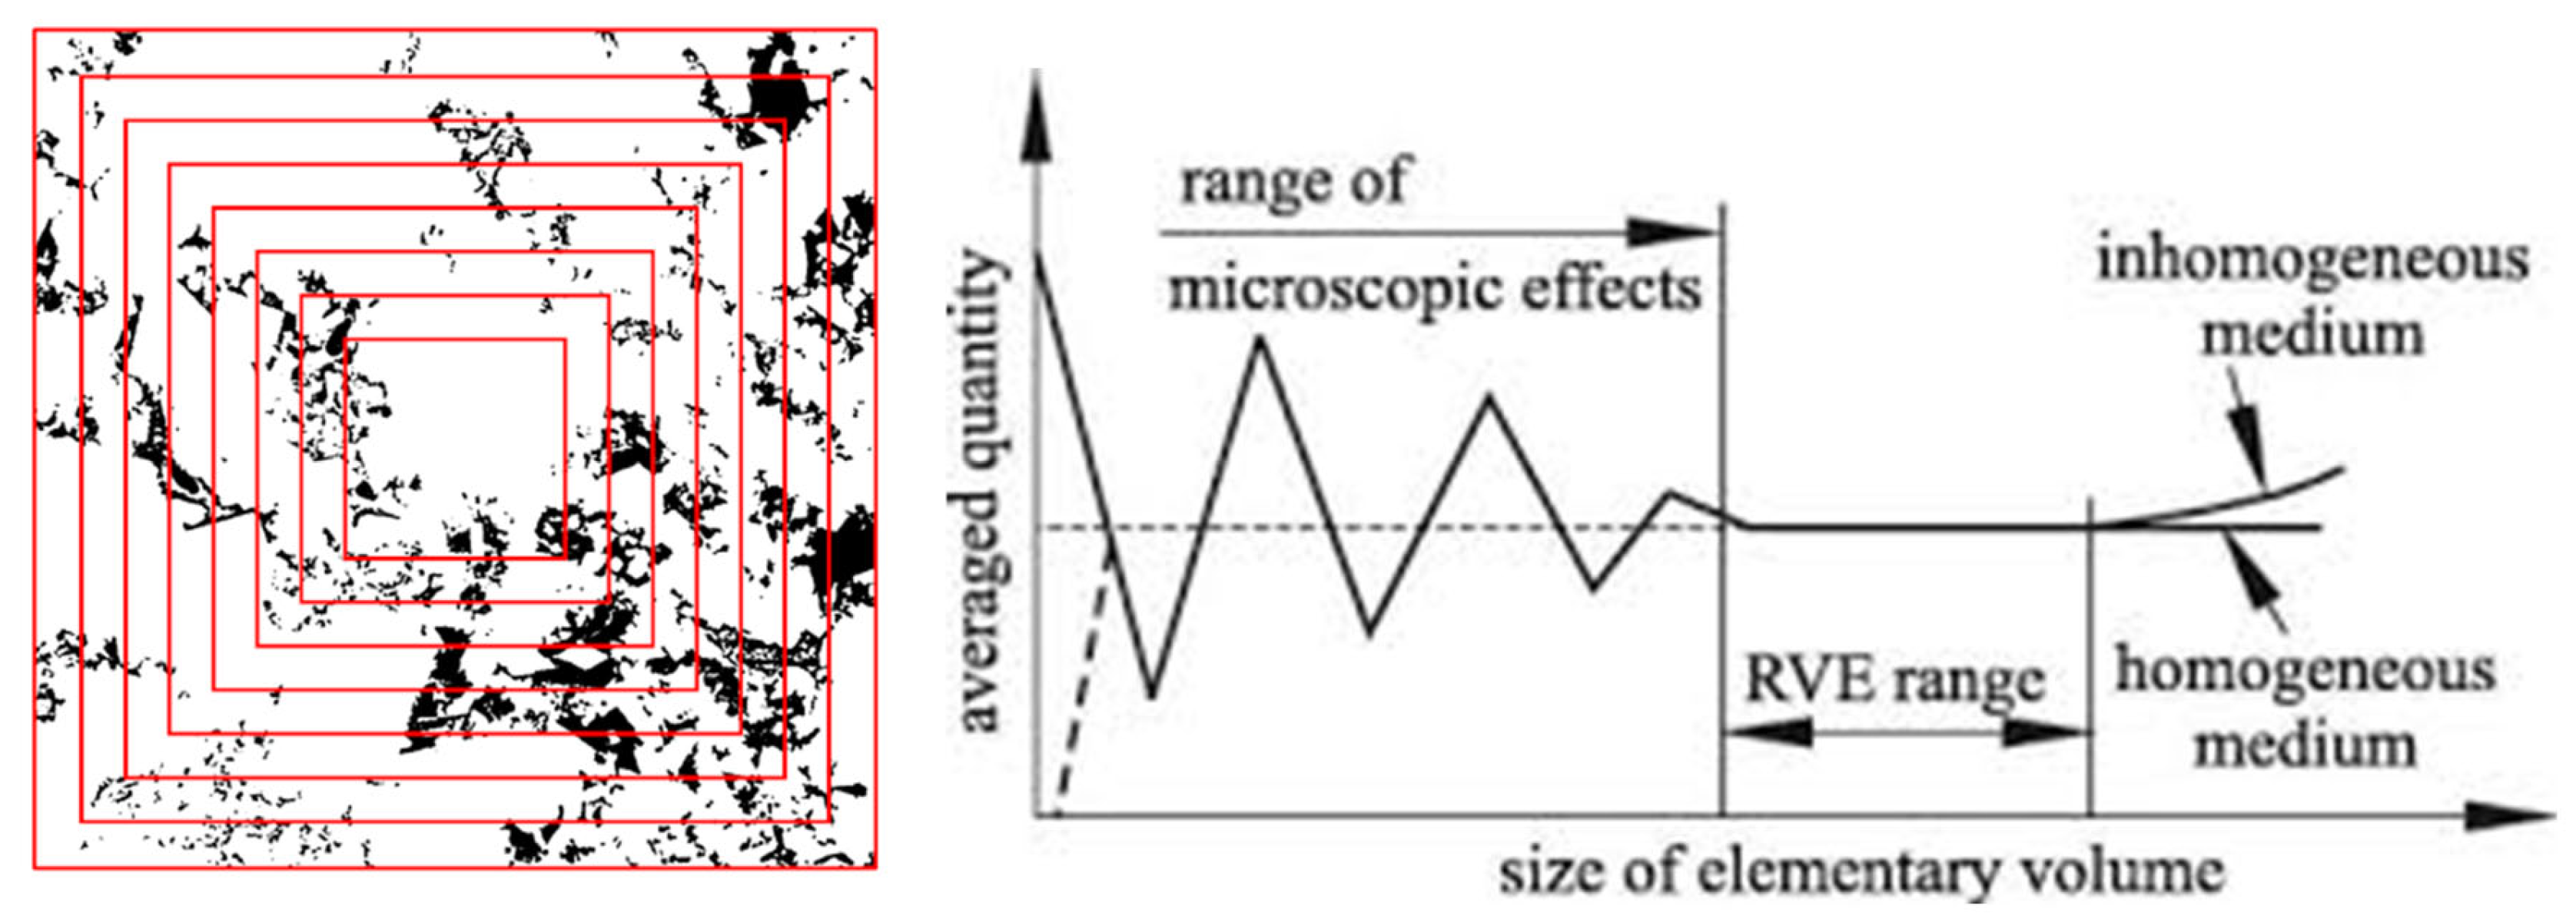
Figure 2.
Simulated results of rock samples at different resolution sizes and domain sizes for the sandstone samples with varied permeabilities: (a)ultra-high permeability sample; (b) high-permeability sample; and (c) mid-permeability sample. The red line labelled as reference represents the experimental measurements.

Figure 3.
Pore network model principle.
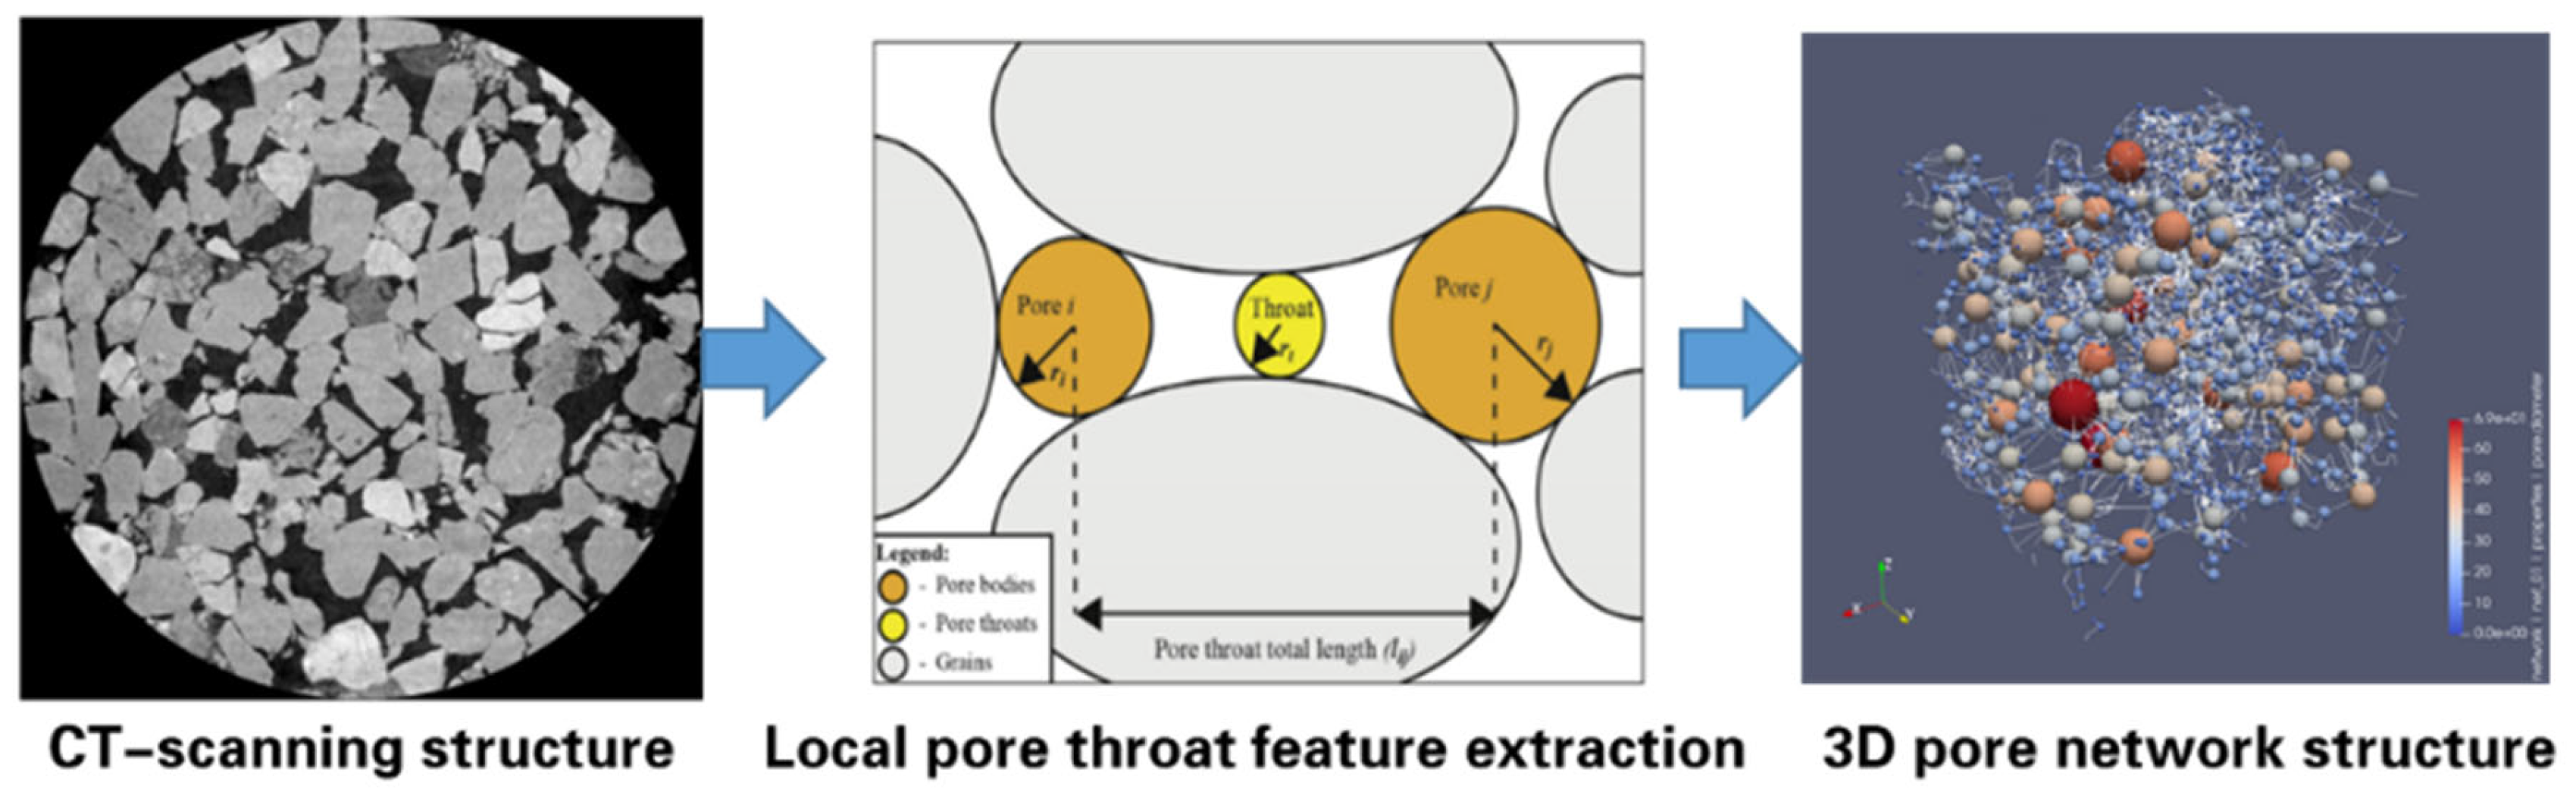
Figure 4.
Extraction of core-pore network model and pore-throat distribution in middle permeability reservoirs.
Figure 4.
Extraction of core-pore network model and pore-throat distribution in middle permeability reservoirs.
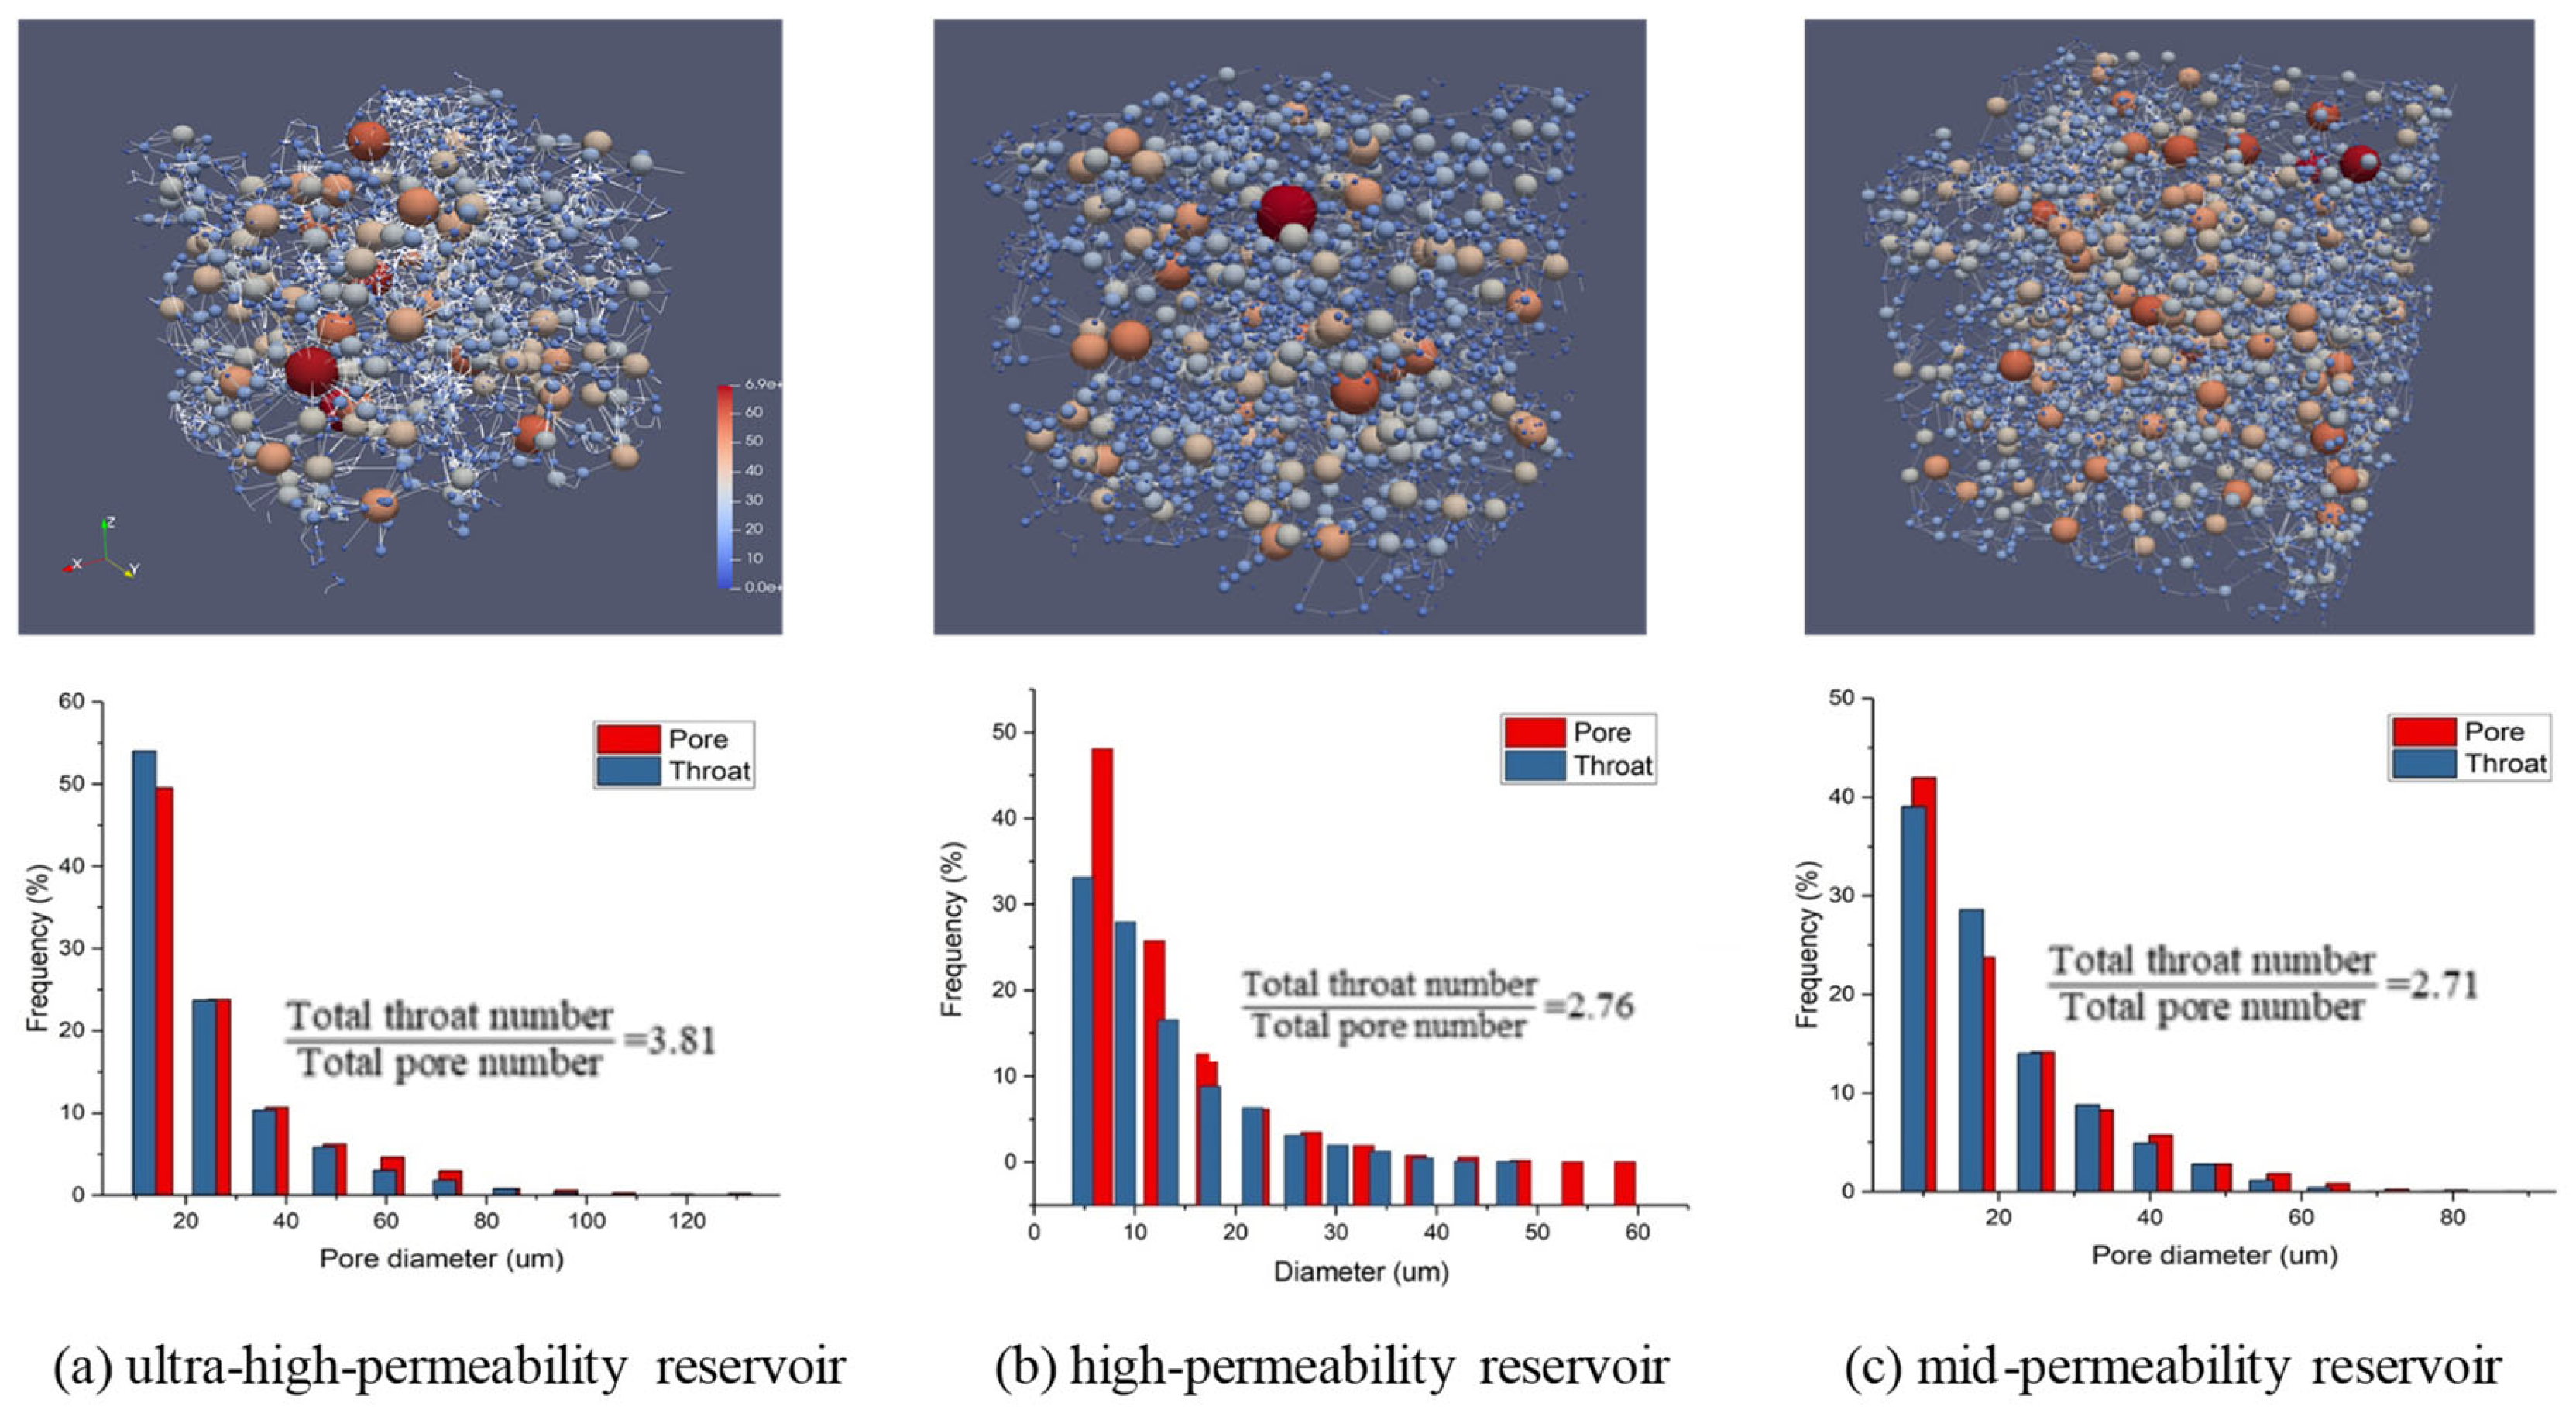
Figure 5.
Pore structure characteristic for different oil reservoirs.
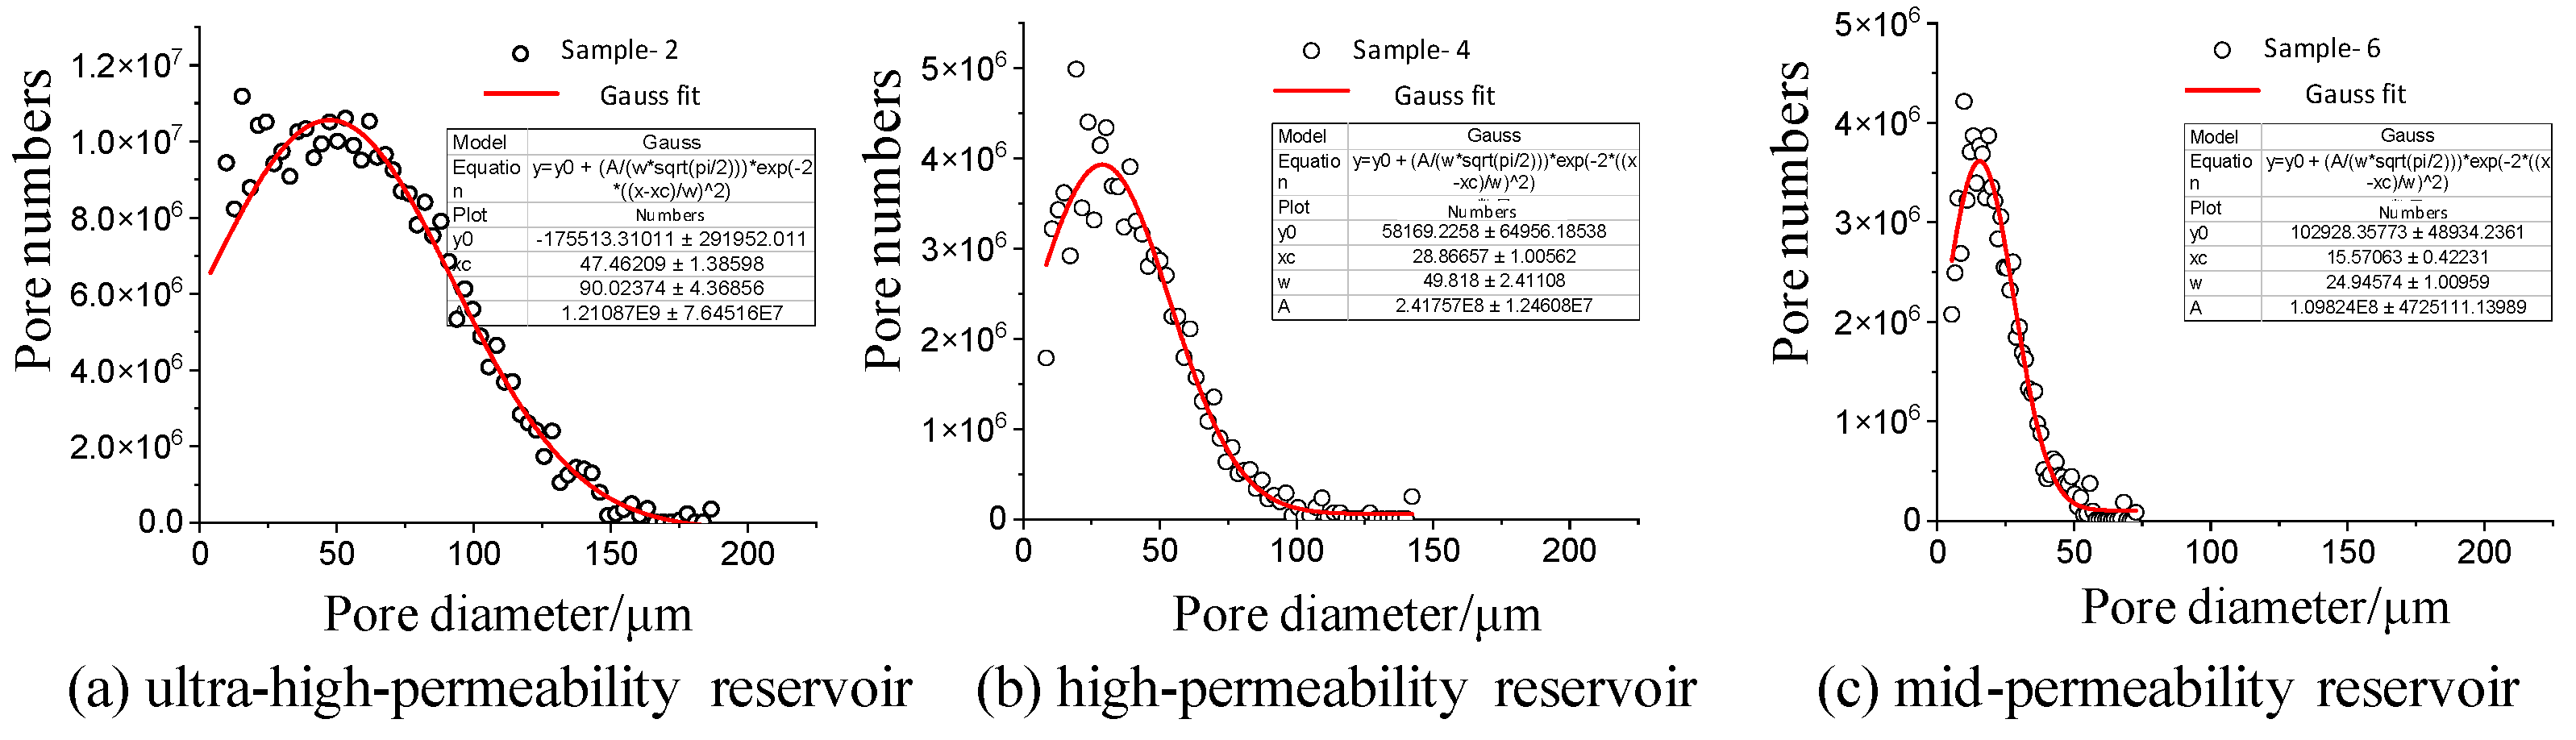
Figure 6.
Thresholds of pore structure classification parameters.
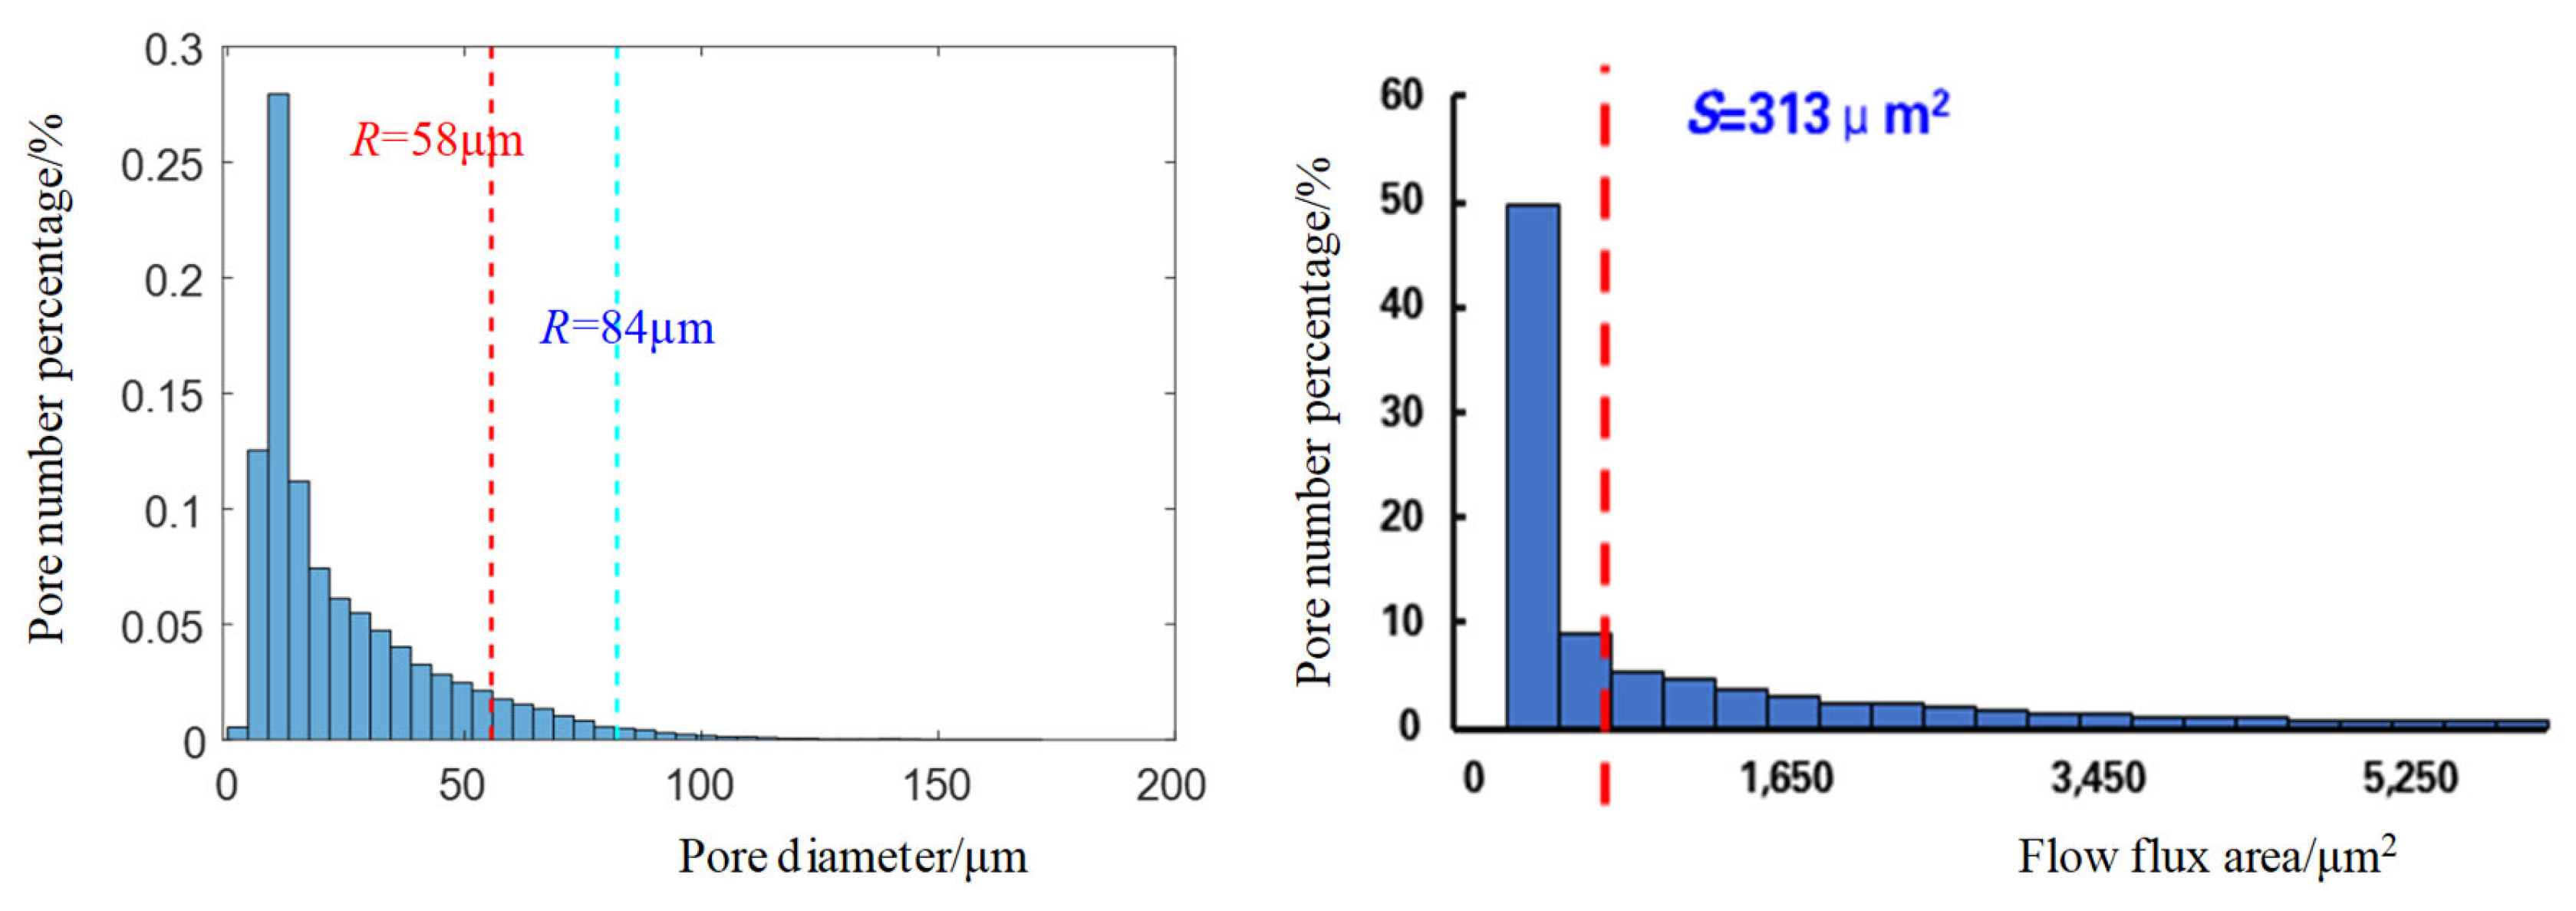
Figure 7.
Proportion of different pores in varied permeability reservoirs.
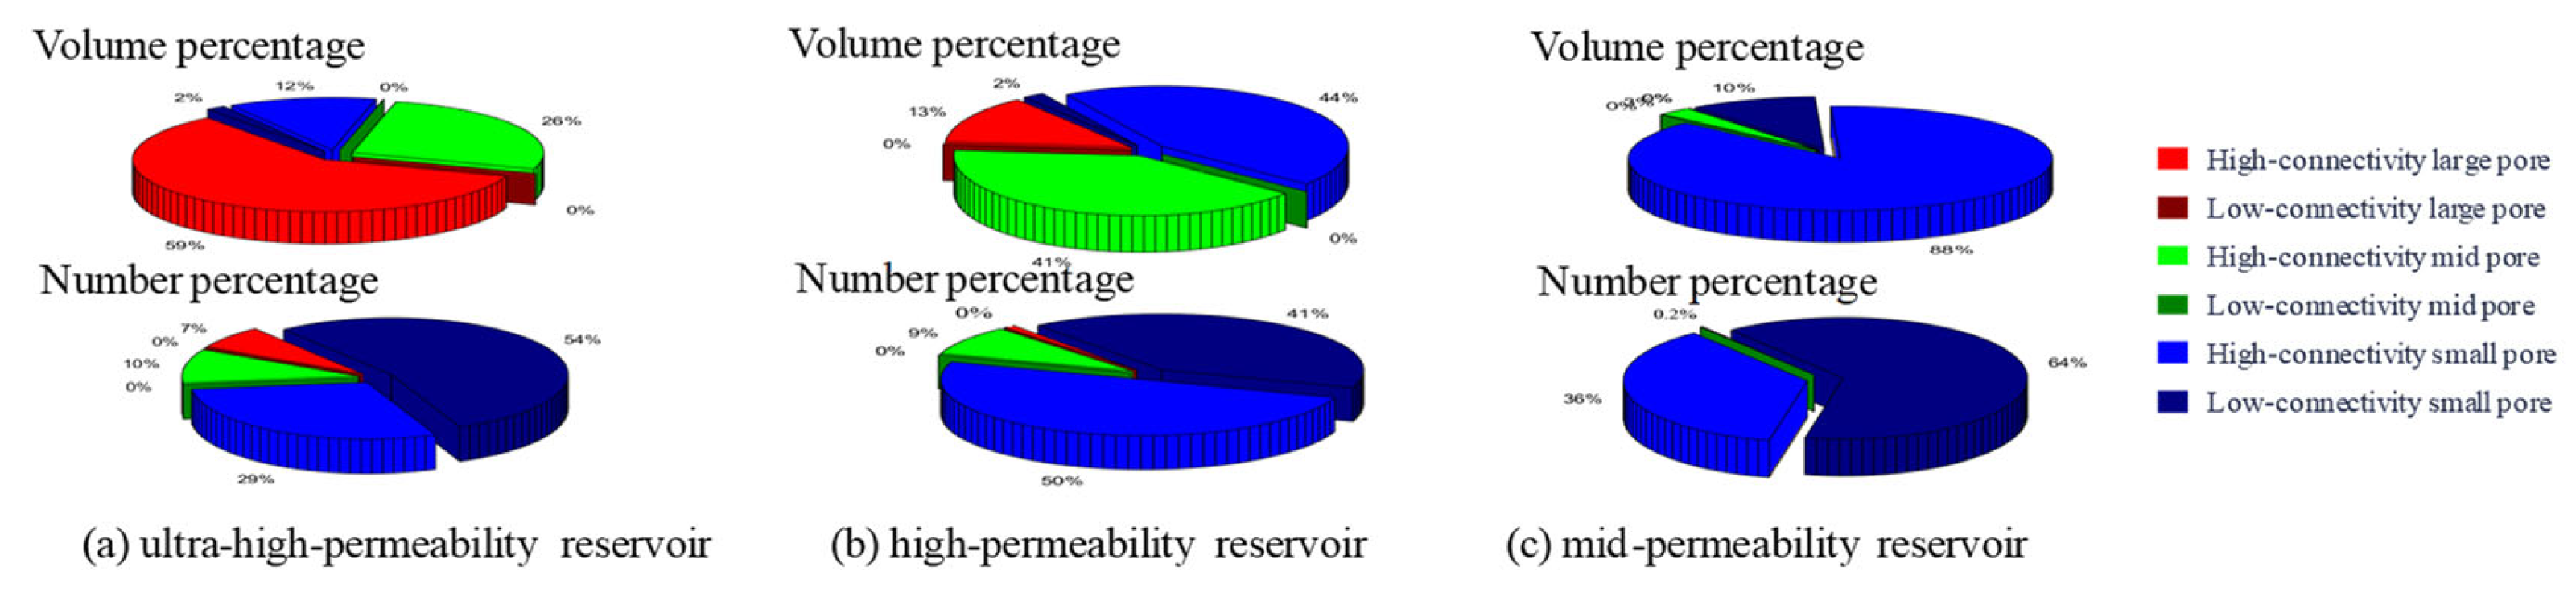
Figure 8.
Distribution curves for different displacement nodes (taking Sample 1 as an example).
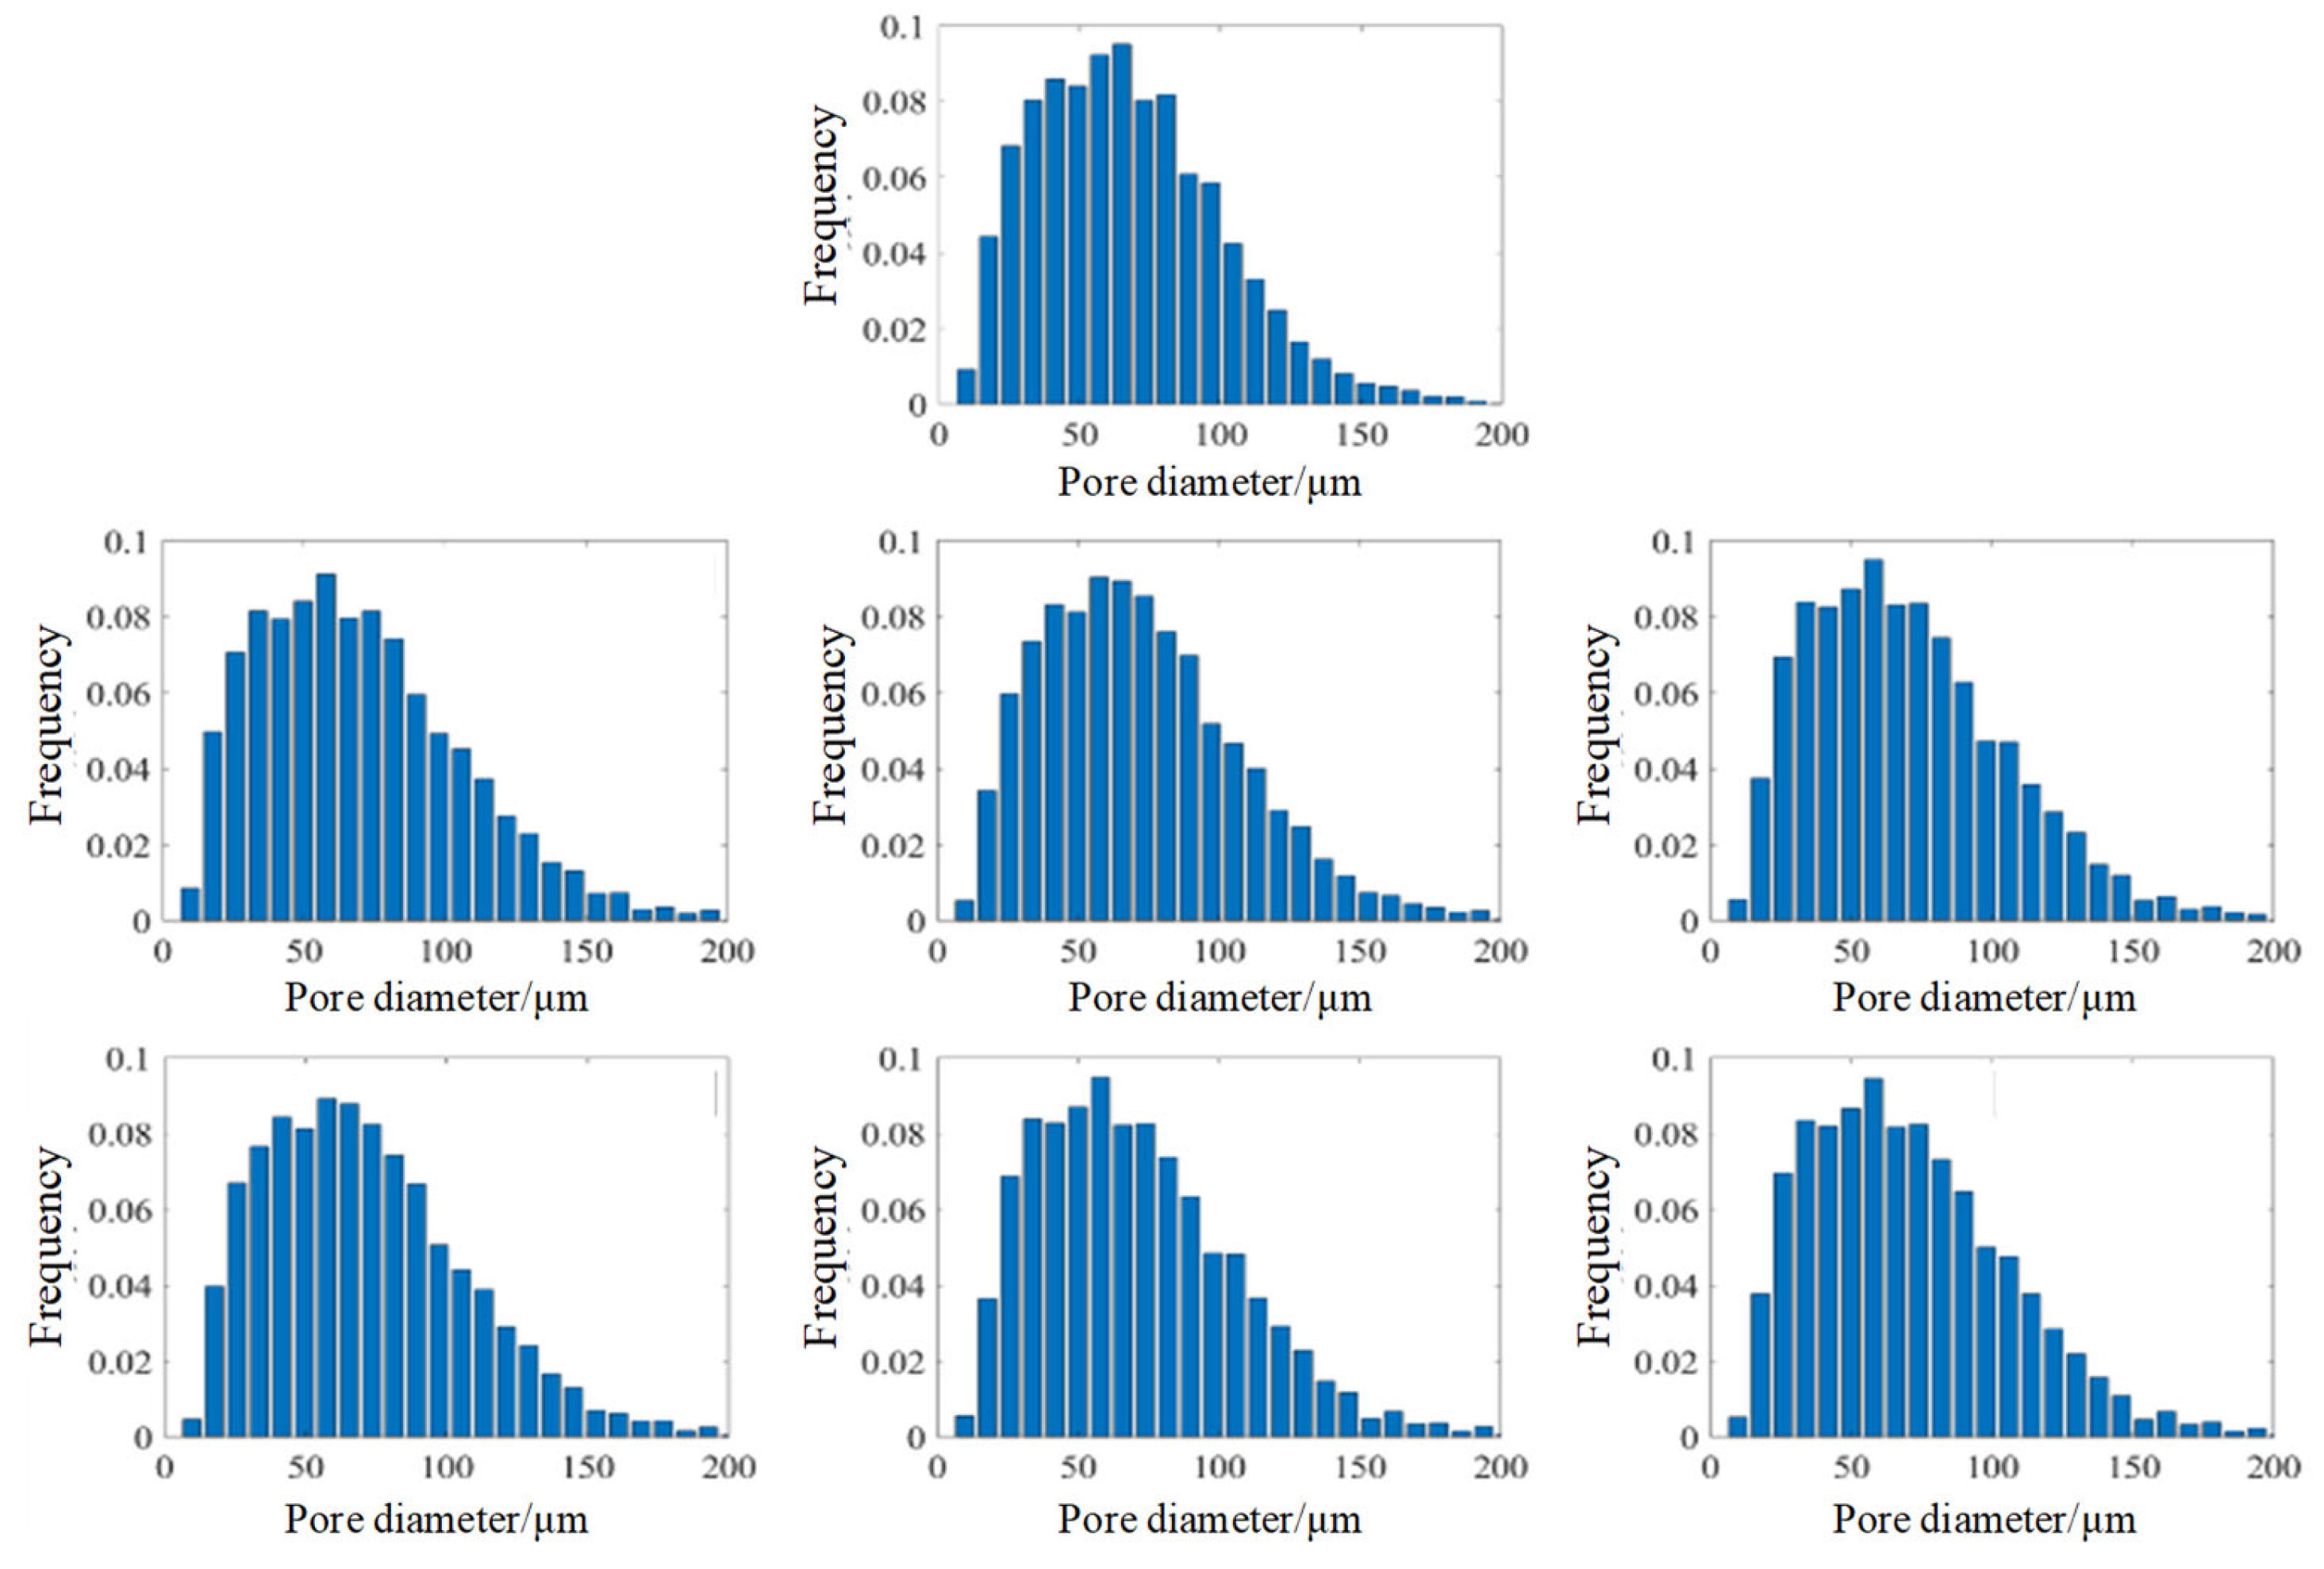
Figure 9.
Varied characteristic values for digital distribution of core-pore size at different displacement stages.
Figure 9.
Varied characteristic values for digital distribution of core-pore size at different displacement stages.
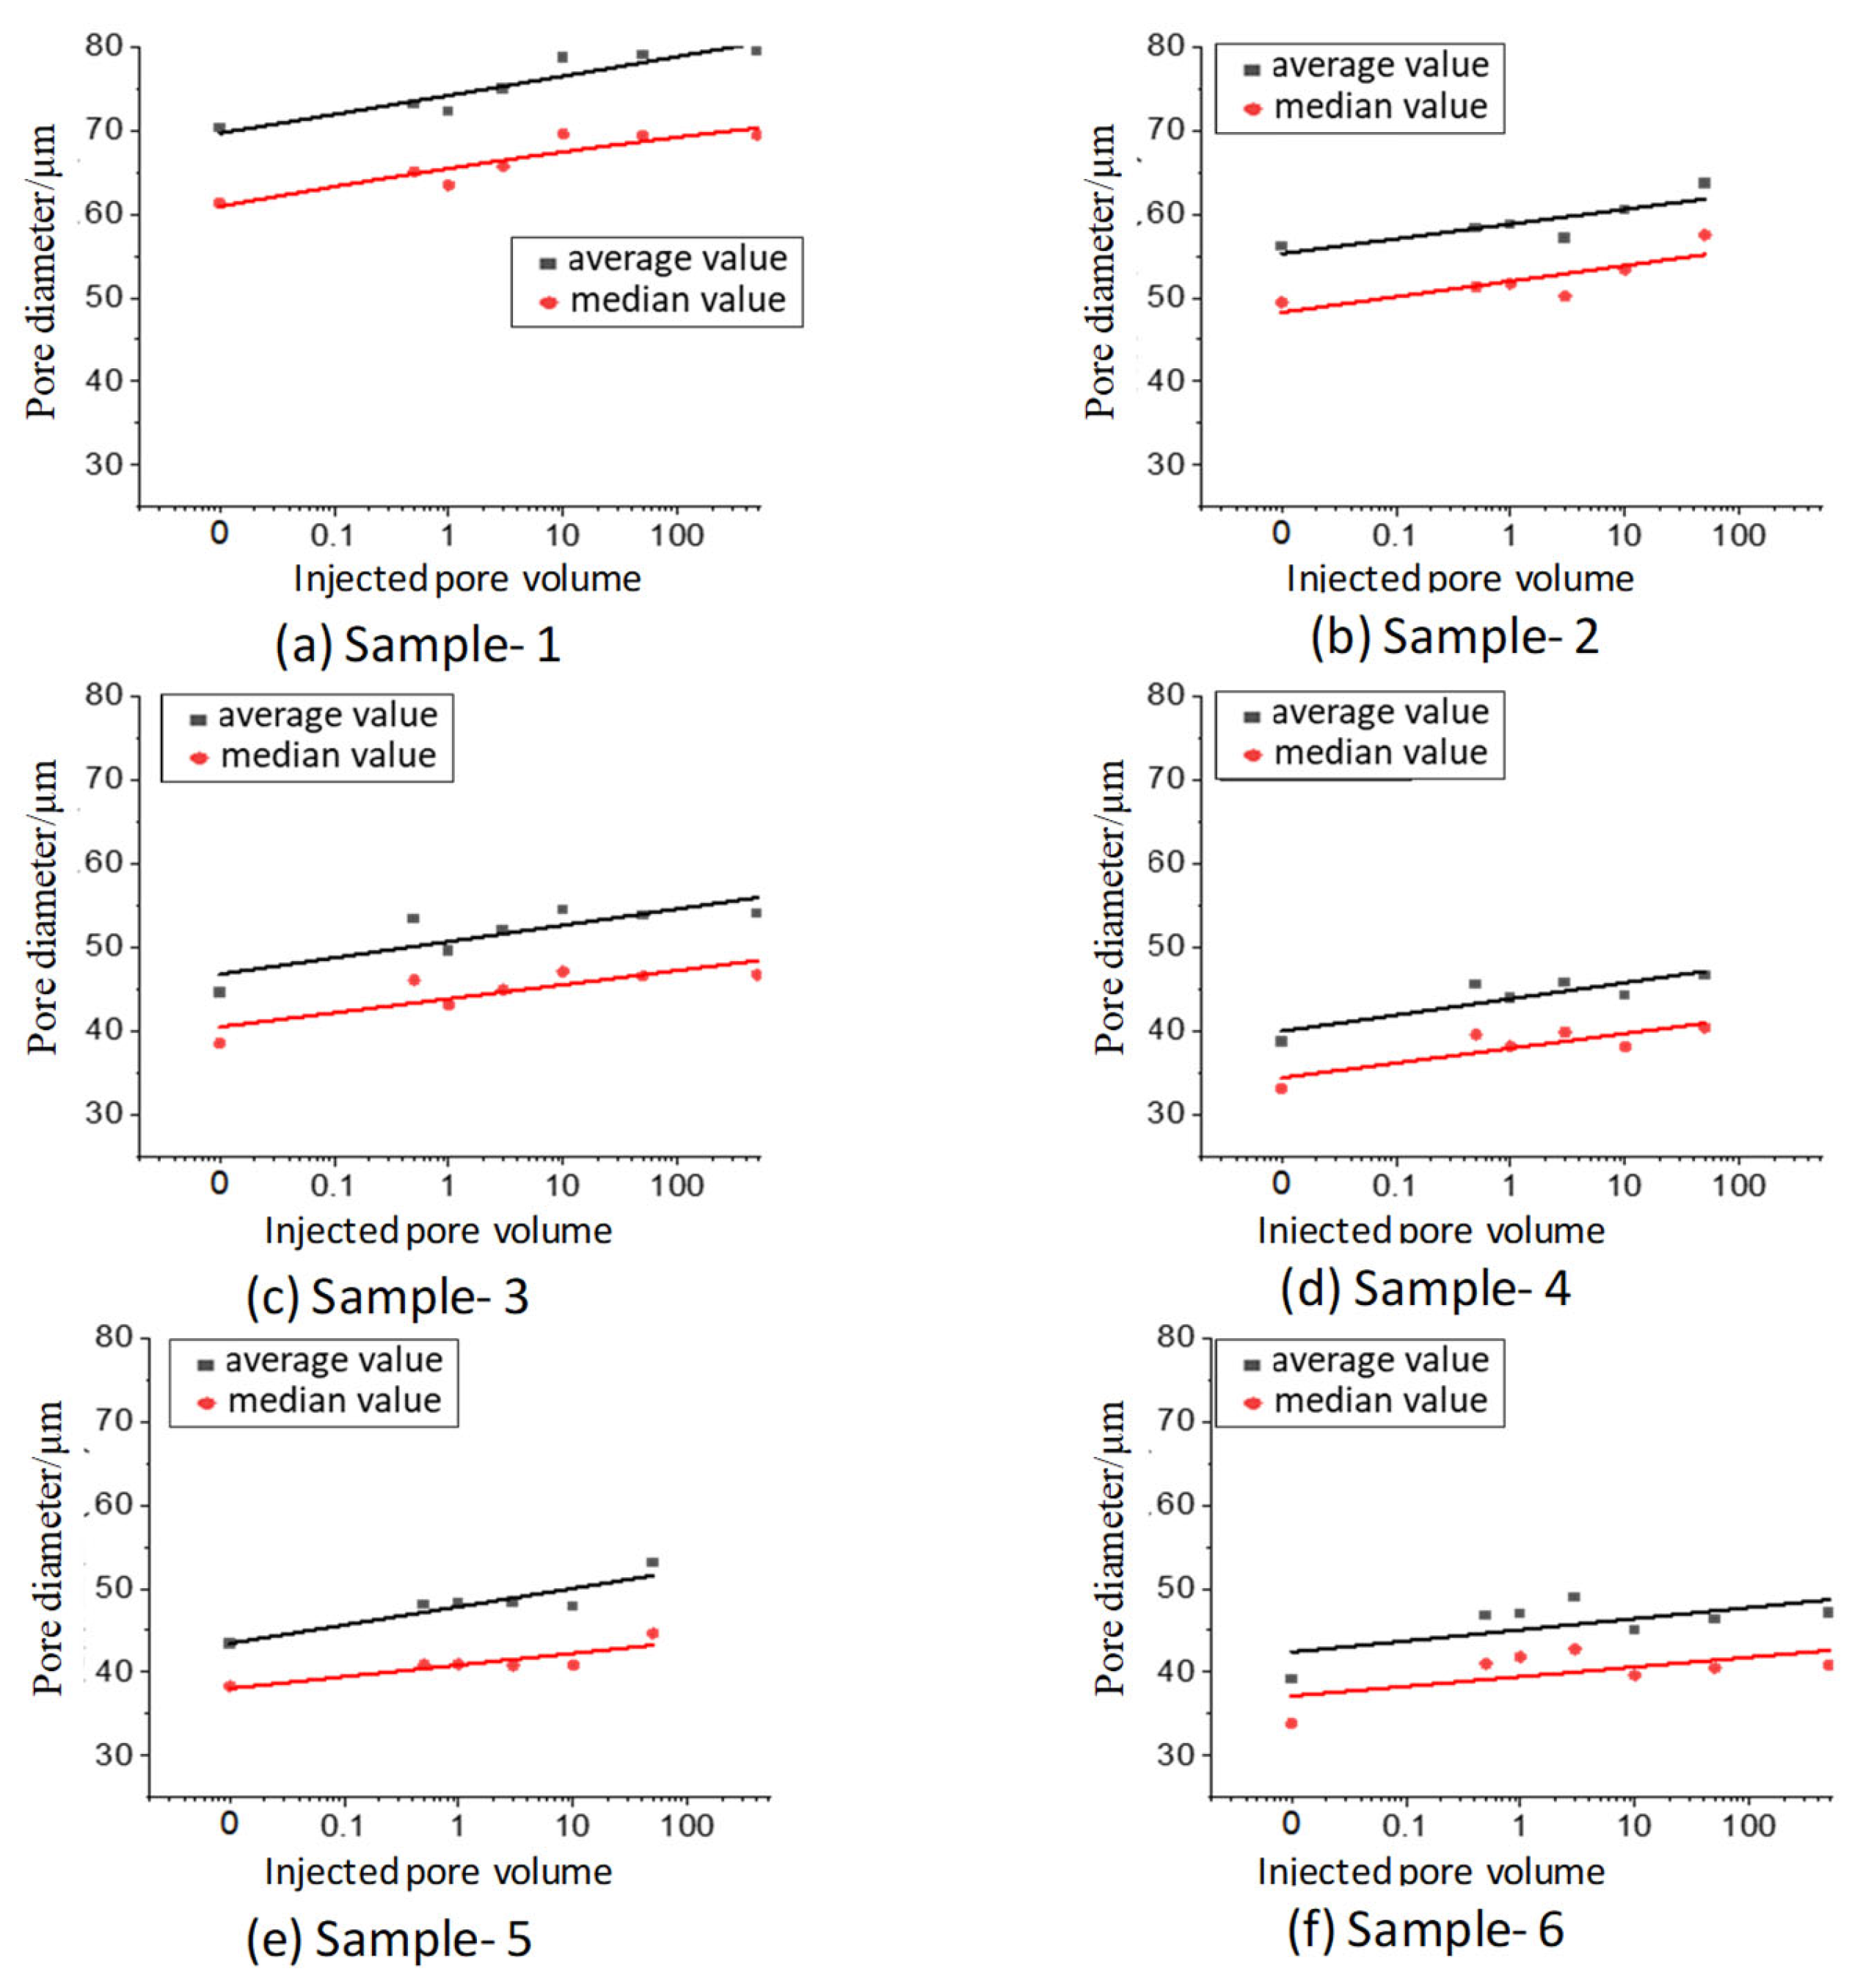
Figure 10.
Porosity Variations in reservoir cores under long-term water flooding.
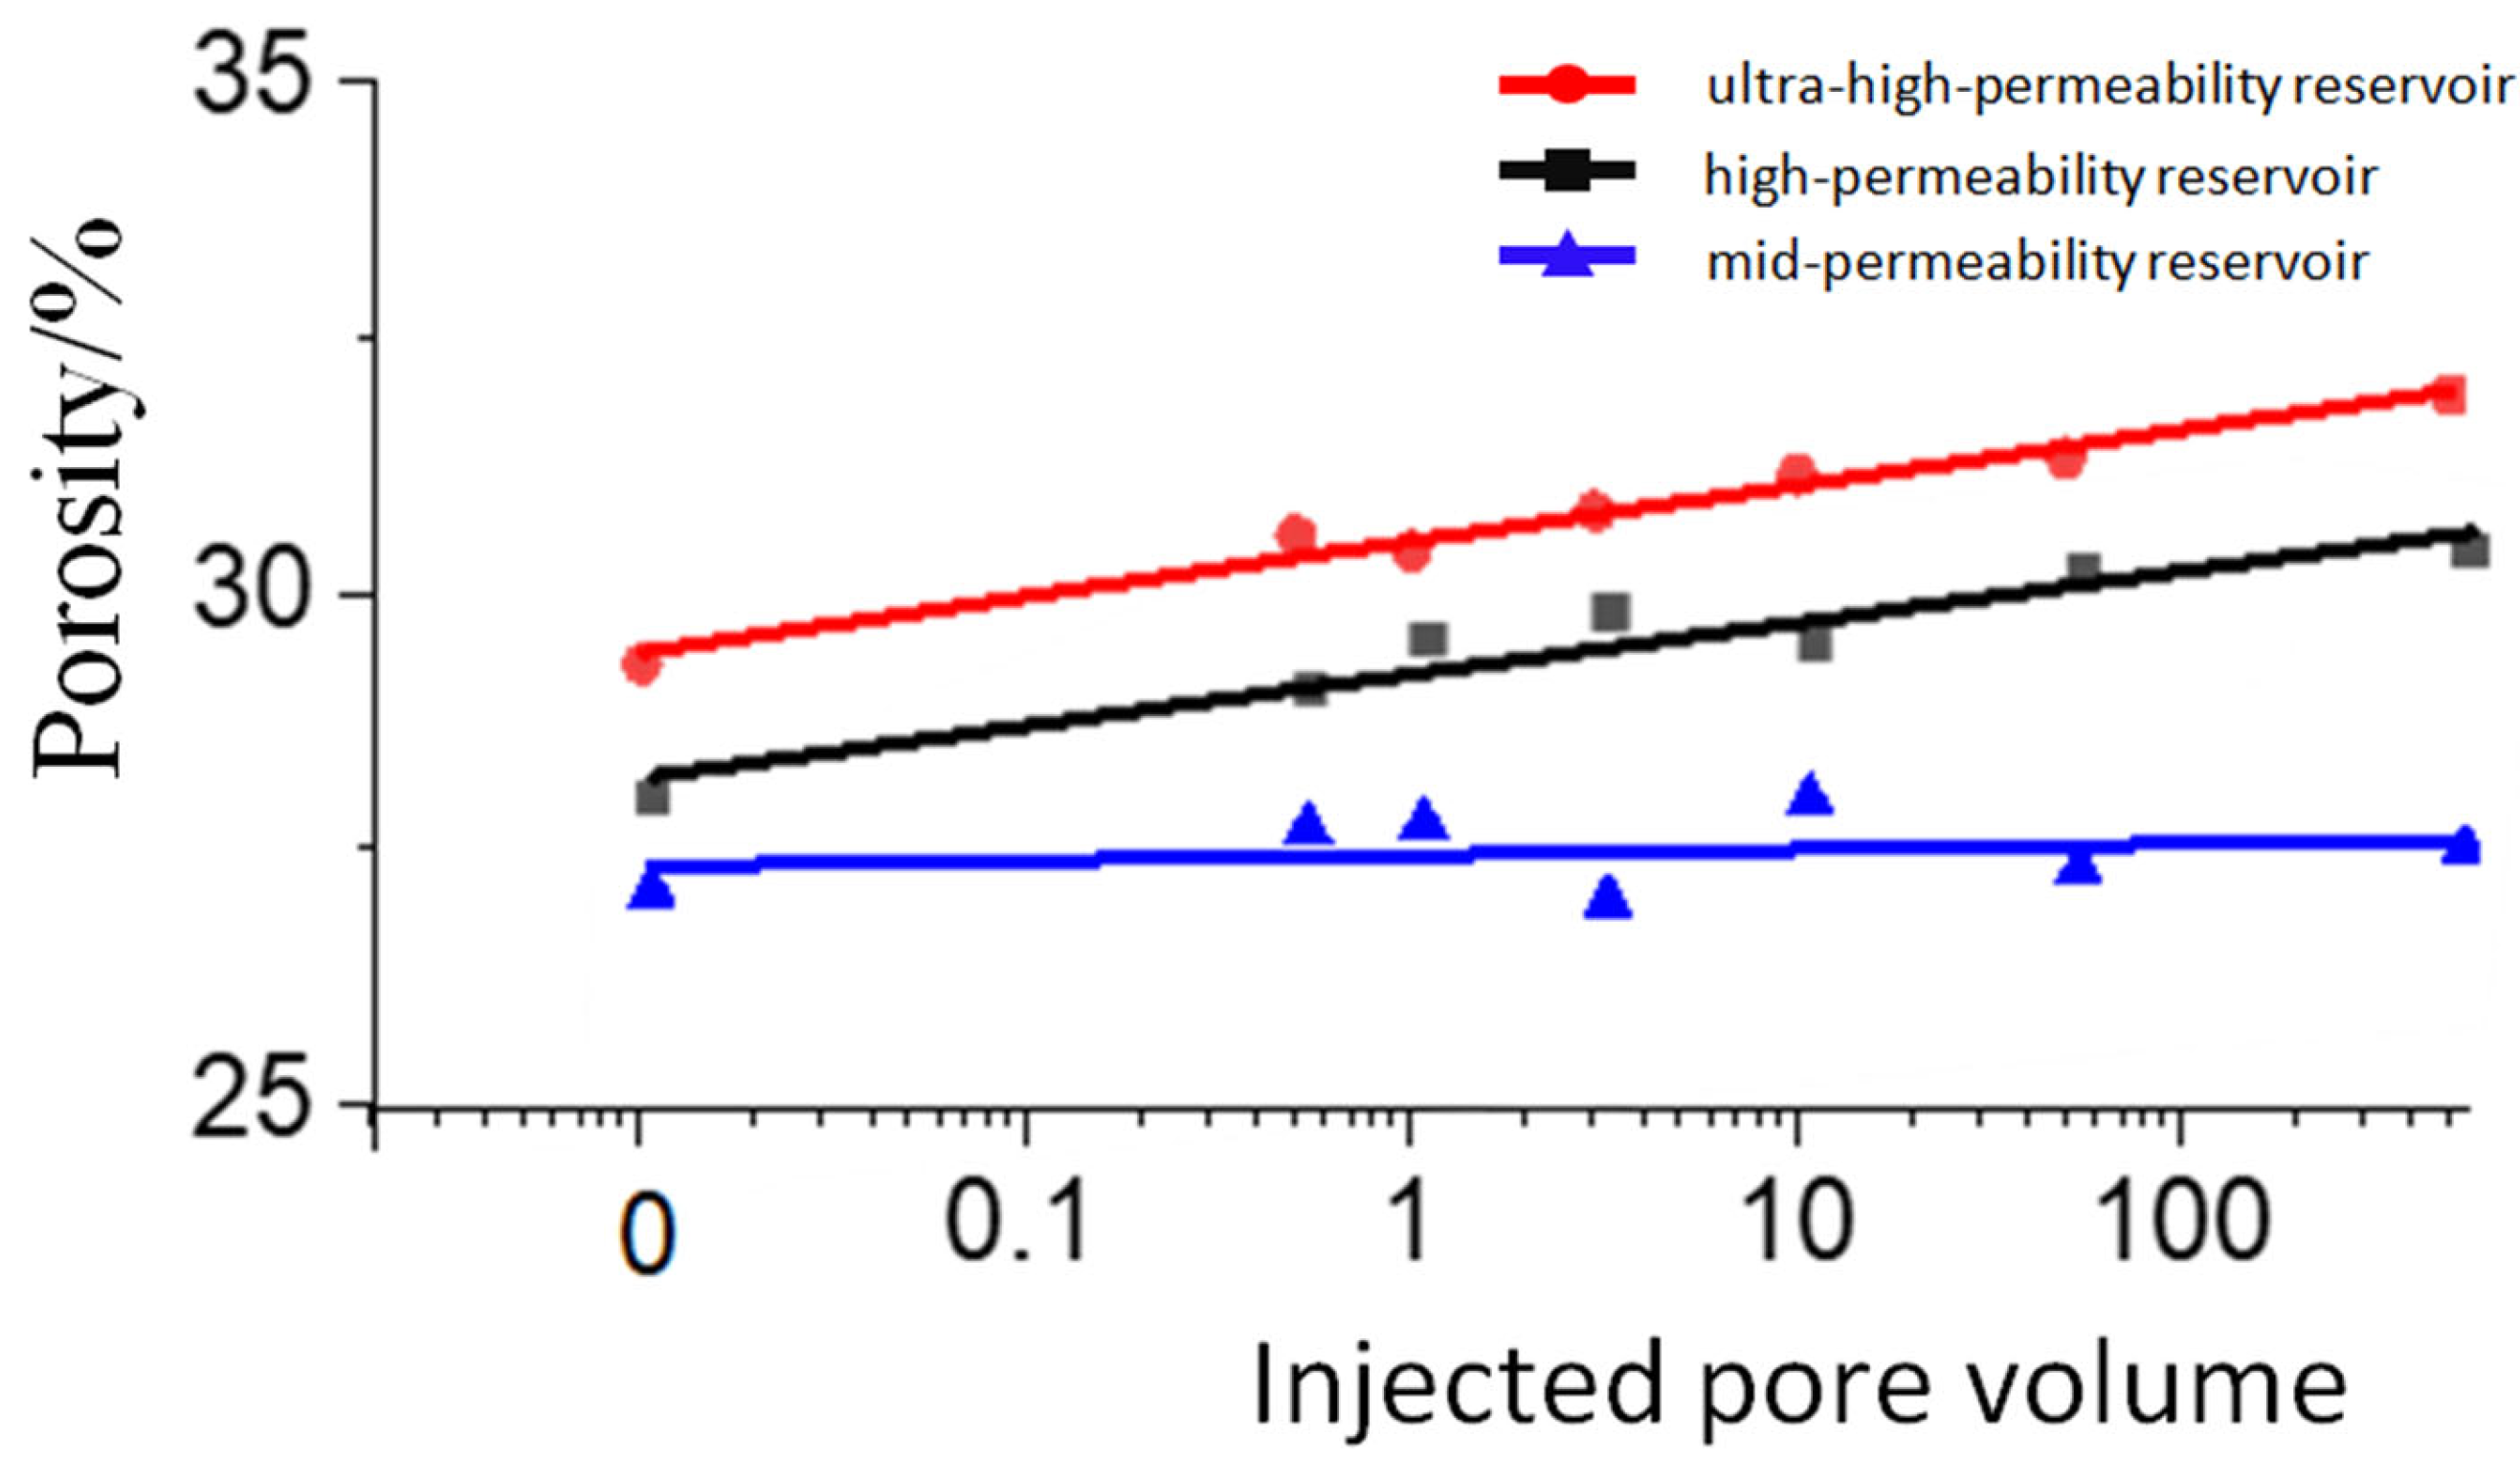
Figure 11.
Changes in pore size distribution and proportions of classified pores in different reservoirs under long-term water flooding.
Figure 11.
Changes in pore size distribution and proportions of classified pores in different reservoirs under long-term water flooding.
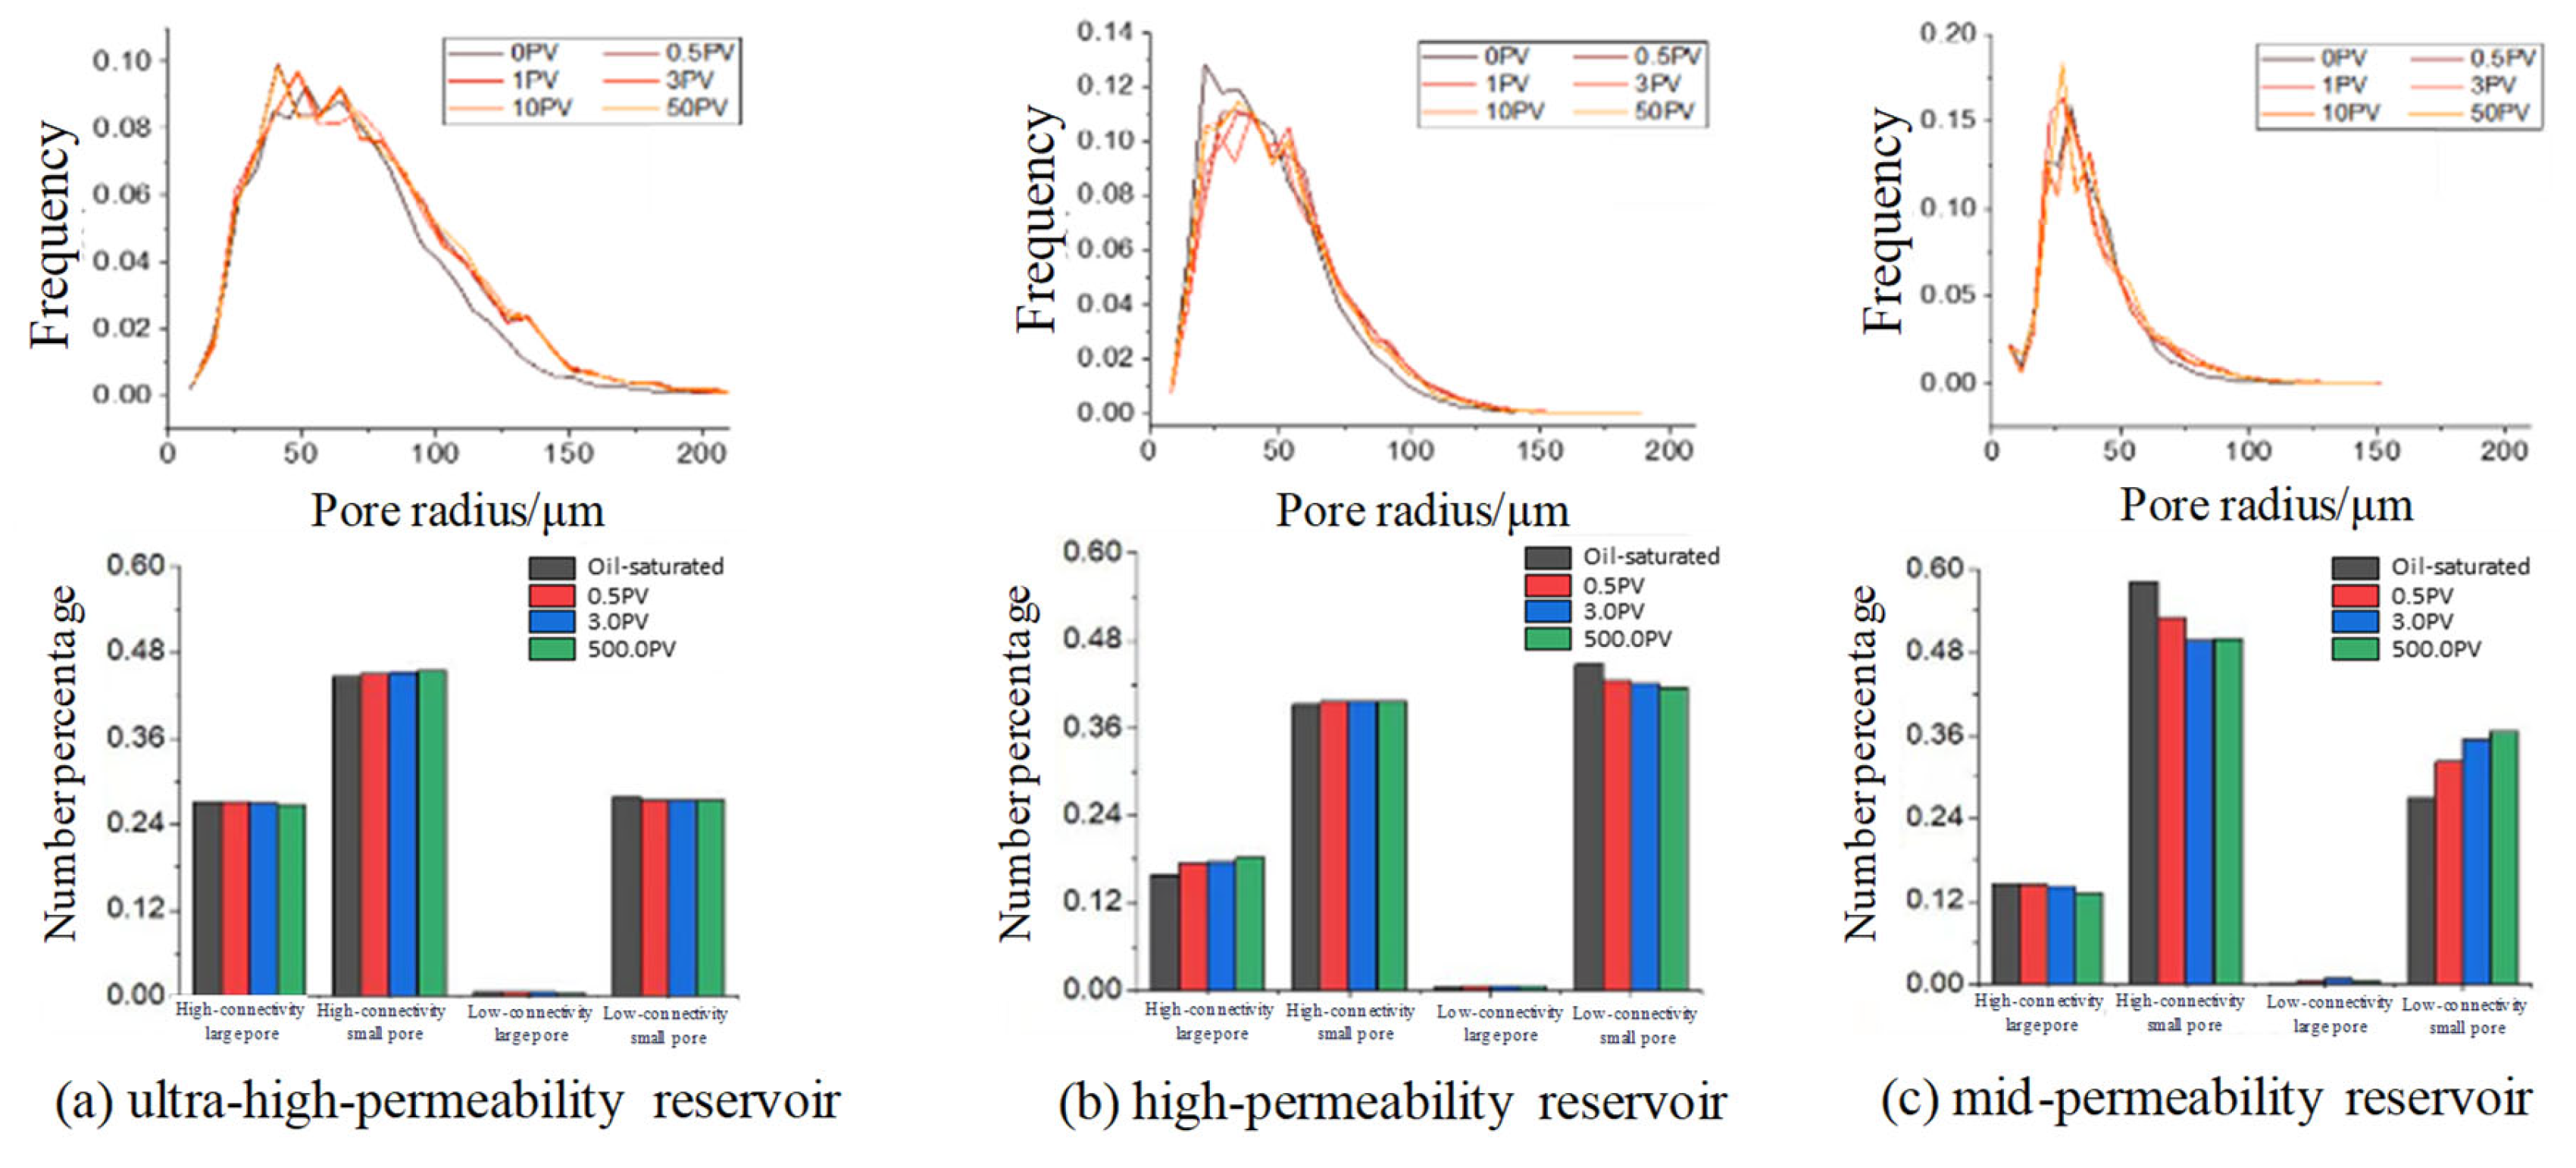

Table 1.
Physical properties of rock samples.
| Sample Number | Reservoir Type | Lithologic feature | Porosity (%) |
Air Permeability (10−3 μm2) |
Length (cm) | Diameter (cm) |
|---|---|---|---|---|---|---|
| 1 | Ultra-high-permeability reservoir | Fine sandstone | 30.96 | 3956 | 3.53 | 2.47 |
| 2 | Ultra-high-permeability reservoir | Fine sandstone | 30.26 | 2568 | 3.83 | 2.47 |
| 3 | High-permeability reservoir | Siltstone | 29.32 | 1890 | 4.94 | 2.49 |
| 4 | High-permeability reservoir | Siltstone | 28.84 | 1398 | 4.73 | 2.48 |
| 5 | Mid-permeability reservoir | Siltstone | 27.79 | 381 | 4.03 | 2.47 |
| 6 | Mid-permeability reservoir | Siltstone | 27.33 | 238 | 3.91 | 2.48 |
Table 2.
Selection of rock samples at different sizes and simulated parameter settings.
| Reservoir Type | Sample Number | Resolution size (μm/voxel) |
Dimension Size (μm) | Boundary Condition | Reynolds Number |
|---|---|---|---|---|---|
| Ultra-high –permeability & high-permeability reservoirs | 2, 4 | 2, 4, 8 | 800, 1200, 1600, 2000 | Pressure Boundary | ~0.01 |
| Mid-permeability reservoir | 5 | 1, 2, 4 | 440, 520, 580, 640 |
Table 3.
Design of displacement-collaborative computed tomography (CT) scan experiment.
| Sample Size | Diameter 4 mm, Length 8 mm, Scanning resolution 2 μm | |||||||
| Displacement Nodes | Dry sample | Oil-bearing | 0.5PV | 1.0PV | 3.0 PV | 10.0PV | 50.0PV | 500.0PV |
| Displacement Speed | / | / | 1 m/d | 1 m/d | 1 m/d | 3 m/d | 10 m/d | 10 m/d |
Table 4.
Classification criteria for reservoir micro-pore structure.
| Pore Structure Type |
Criteria for classification | ||
|---|---|---|---|
| Pore Diameter/μm | Flux area/μm2 | ||
| Large-pore | High connectivity | >84 | >313 |
| Low connectivity | >84 | ≤313 | |
| Mid-pore | High connectivity | (58,84] | >313 |
| Low connectivity | (58,84] | ≤313 | |
| Small pore | High connectivity | ≤58 | >313 |
| Low connectivity | ≤58 | ≤313 | |
Disclaimer/Publisher’s Note: The statements, opinions and data contained in all publications are solely those of the individual author(s) and contributor(s) and not of MDPI and/or the editor(s). MDPI and/or the editor(s) disclaim responsibility for any injury to people or property resulting from any ideas, methods, instructions or products referred to in the content. |
© 2024 by the authors. Licensee MDPI, Basel, Switzerland. This article is an open access article distributed under the terms and conditions of the Creative Commons Attribution (CC BY) license (http://creativecommons.org/licenses/by/4.0/).
Copyright: This open access article is published under a Creative Commons CC BY 4.0 license, which permit the free download, distribution, and reuse, provided that the author and preprint are cited in any reuse.


