
Submitted:
08 April 2025
Posted:
08 April 2025
You are already at the latest version
Abstract
In this study, a 5 m×1 m×0.04 m sand filling model was constructed to simulate Lukqin thick oil reservoir, and the development rules of water flooding and foam flooding were systematically analyzed. The results show that the recovery rate of water flooding is only 30% due to the imbalance of mobility ratio and gas channeling. By integrating electrical resistivity tomography (ERT) with HSV (Hue-Saturation-Value) color mapping, this study pioneers the first visualization of foam migration in meter-scale heterogeneous reservoirs (5 m × 1 m × 0.04 m) with a spatial resolution of ≤0.5 cm. This surpasses the limitations of conventional CT scanning (typical resolution ≥2 cm) and X-ray tomography (cost: 500–800 per scan), offering a 30% reduction in monitoring costs. The proposed 5 m × 1 m × 0.04 m sandpack model reveals that foam flooding enhances oil recovery by 15–20% via synergistic mechanisms of dynamic high-permeability channel plugging (governed by S=0.7C0.6kr−0.28) and mobility ratio optimization, surpassing the 30% recovery limit of conventional water flooding. The main controlling factors of gas channeling (injection speed, foam quality, permeability heterogeneity) are revealed, and the optimization of injection parameters, improvement of foam formulation, combined with numerical simulation and other synergistic techniques are proposed. The proposed large-scale physical simulation methods advance the understanding of foam flooding mechanisms in meter-scale heterogeneous reservoirs, directly guiding the optimization of air foam flooding operations in the Lukqin oilfield.
Keywords:
Thick oil reservoirs
; Foam flooding
; gas channeling control
; Large-scale physical simulation
; Permeability heterogeneity
; Enhanced oil recovery (EOR)
1. Introduction
In recent years, under the dual background of rising global energy demand and increasing difficulty in oil and gas resource development, improving recovery efficiency of complex reservoirs has become a core issue to ensure energy security [1,2]. Through dynamic plugging and mobility control, foam flooding technology has become a key means to improve recovery efficiency of heterogeneous reservoirs [3,4]. However, the existing multi-focus homogeneous or small-scale models (<1 m) lack systematic verification of the gas channeling mechanism and stability of foam flooding in meter-level heterogeneous reservoirs (permeability difference 5-10). For example, Farajzadeh et al. [5] revealed the stability of AOS foam in a high-salt environment, but did not consider the gas-liquid dynamic interaction in the meter-level model. Kovscek's classical model [6,7] quantifies the foam plugging strength in homogeneous media, but it cannot be applied to reservoirs with permeability difference >5. The Lukqin thick oil reservoir in China, characterized by high viscosity (286 mPa·s) and strong permeability contrast (5–10), exemplifies this challenge, where conventional water flooding struggles with gas channeling and limited sweep efficiency (recovery <30%) [4,5]. Foam flooding, recognized for its dual capabilities of mobility control and dynamic plugging [6], has emerged as a promising enhanced oil recovery (EOR) technology. However, its application in meter-scale heterogeneous reservoirs remains underexplored [6], particularly regarding the dynamic evolution of gas channeling and foam stability under field-like conditions.
Previous studies (e.g., Farajzadeh’s AOS foam experiments [5] and Kovscek’s homogeneous plugging model [6,7]) are constrained by small-scale setups (<1 m) and idealized assumptions (permeability contrast <5), failing to capture gas channeling dynamics in realistic meter-scale heterogeneous systems [8]. This study establishes the first 5 m × 1 m × 0.04 m sandpack model integrating ERT-HSV (electrical resistivity tomography and Hue-Saturation-Value) visualization, enabling real-time tracking of foam dynamics in reservoirs with permeability contrasts of 5–10 [9,10]. Compared to existing methods (e.g., Kam et al. ’s X-ray CT for <1 m models), this system achieves higher resolution and lower operational costs [11,12].
To address these gaps, this study proposes:
1. A 2D large-scale sandpack model (5 m × 1 m × 0.04 m) integrating resistivity tomography and high-speed imaging, enabling visualization of foam flooding mechanisms in meter-scale heterogeneous systems.
2. A nonlinear predictive model linking plugging strength (S) to foam concentration (C) and permeability contrast (kr):
S=0.7C0.6⋅kr−0.28(R2=0.91),
achieving superior accuracy (error <5%) compared to existing models [13].
3. A cost-effective composite strategy combining high-concentration slugs (0.7% AOS), salt-resistant polymer-enhanced foaming, and multi-round profile control, suppressing gas channeling by 67%.
This work bridges the gap between laboratory-scale experiments and field-scale EOR operations, offering both theoretical insights and actionable technical guidelines for heterogeneous reservoirs [14].
2. Experimental Method
2.1. Experimental System Design
The experimental system consists of a high-pressure constant-flow/constant-pressure pump (HAS-80HSB), a gas booster unit (GDT7/30, 30 MPa), and a multidimensional visualization monitoring module. The sand-filled model employs a modular splice structure (5 m × 1 m × 0.04 m) packed with 200-mesh quartz sand (permeability: 500–1000 mD). The strong heterogeneity of the Lukqin oil reservoir was successfully replicated using a stratified compaction process under 25–29 MPa (Table 1). The model body comprises five standardized physical simulation units integrated with a 210-node high-density resistivity array, a 45-channel distributed pressure sensor network, and a high-speed camera system, enabling dynamic monitoring of multiphysics-coupled seepage processes (Figure 1). The experimental setup configuration is illustrated in Figure 2.
The modular design ensures high-precision monitoring of heterogeneous models. The high-pressure pump and gas booster system operate synergistically to maintain stable gas-liquid alternating injection (gas-liquid ratio, GLR=1:1). Notably, the specifically designed 210-node resistivity monitoring array, synchronized with the high-speed camera system, achieves centimeter-level resolution tracking of foam migration paths for the first time. This innovation overcomes the limitations of conventional CT scanning (resolution ≥2 cm) in cost and scalability, providing critical technical support for elucidating gas invasion dynamics in heterogeneous reservoirs.
2.2. Fluid Configuration and Displacement Scheme
2.2.1. Simulated Fluid
Preparation of simulated crude oil: A 10# white oil and thickener compound system was used, with a thickener mass fraction of 12.3%.
As shown in Figure 3, the relationship curve between viscosifier concentration and white oil viscosity presents a typical "slow first and steep later" feature. In the low concentration range (0%-8%), the viscosifier molecules dispersed in the form of isolated micelles, only through weak van der Waals force interaction, resulting in slow viscosity growth. When the concentration exceeds 10%, the intermolecular hydrogen bond and hydrophobic action dominate, and the viscosity rises sharply (Δη/ΔC≈45 mPa·s/%). For example, when the concentration increases from 10% to 12.3%, the viscosity jumps from 180 mPa·s to 286 mPa·s (55.6% increase). This nonlinear change law shows that 12.3% of the viscosifier mass fraction is just at the critical point of structural crosslinking, which can not only accurately simulate the high viscosity characteristics of Lucktham heavy oil (286 mPa·s), but also avoid the thixotropy of experimental fluid caused by excessive viscosifier (such as shear thinning effect), and ensure the stability of mobility ratio in displacement experiments.
Parameters of simulated formation water: High salinity brine was artificially prepared, with a total salinity of 160,599 mg/L. The ionic composition is detailed in Table 2.
Foam system formula: (1) Base solution: 0.35% α-olefin sulfonate (AOS) aqueous solution; (2) Gas-liquid ratio (GLR): nitrogen and liquid are injected 1:1 according to the volume ratio to form a foam system; (3) Stability enhancement: Add a salt-tolerant polyacrylamide with a mass fraction of 0.2% to increase the half-life of the foam in a high-salt environment (>90 minutes).
2.2.2. Displacement Process
1. Model saturation
This study employed a constant-rate displacement method (10 mL/min) to establish a water phase saturation system. Water phase permeability was calculated using Darcy's Law based on injection rate, pressure gradient, and saturated water mass, while pore volume calibration data were integrated to accurately determine the model porosity at 34.28%. The experimental process incorporated dynamic data acquisition under pressure equilibrium conditions to ensure precision in calculating water phase seepage parameters.
For oil saturation experiments, horizontal model placement was adopted with continuous injection of simulated crude oil until outlet oil content exceeded 98%, successfully establishing an initial oil saturation of 72.3%. Real-time dynamic pressure regulation at the outlet valve was implemented to achieve three-dimensional pressure equilibrium, effectively ensuring homogeneous spatial distribution of saturation. Oil phase permeability was calculated using Darcy's Law with injection rate, pressure gradient, and saturated oil mass as input parameters. This process realized high-precision characterization of oil phase seepage characteristics through displacement dynamic control and multi-source data fusion technology.
2. Experimental process
In vertical displacement mode, water flooding was conducted at a constant rate of 10 mL/min until the outlet water cut reached 98%, with synchronous recording of the spatial distribution of pressure gradient, recovery efficiency, and resistivity. Meanwhile, the dynamic evolution of high-permeability channels was captured in real time by a high-speed camera system. Resistivity, pressure, and visual imaging data were collected with second-level temporal resolution, and a multi-dimensional seepage database was constructed. Water phase permeability was calculated using Darcy’s law (inputs: injection rate, pressure gradient, fluid viscosity), and displacement efficiency was quantified via the material balance method (error <3%). Spatiotemporal coupling between saturation fields and channeling paths was analyzed through resistivity data, revealing dynamic sweep mechanisms in heterogeneous reservoirs.
Alternating gas-liquid injection (GLR 1:1, slug volume 0.4 PV) was implemented with gas pressure capped at 6 MPa. Foam plugging dynamics were monitored in real time, and injection parameters (GLR, concentration) were optimized to mitigate gas channeling. By integrating multi-source data (resistivity-pressure-visualization), foam/water flow paths were compared, and gas channeling patterns with foam blocking mechanisms were clarified. Gas-liquid permeability and displacement efficiency were derived using Darcy’s law and material balance, elucidating the dynamic conformance control mechanism.
2.3. Data Acquisition and Analysis Methods
The dynamic parameter monitoring and analysis system adopts a distributed control system (with a sampling interval of 300 seconds) to collect real-time data on pressure, flow rate, and water cut, etc., of dynamic parameters. ERT (Electrical Resistivity Tomography) was used to obtain two-dimensional resistivity field data with a resolution of 0.5 cm. Through HSV (Hue-Saturation-Value) color space model, the resistivity is mapped to the oil saturation distribution to realize the visualization of fluid migration path. Based on the dynamic images of foams obtained by the high-speed camera system, OpenCV image processing algorithms are used to extract characteristic parameters such as foam size distribution and migration speed. After normalization and dimensionless processing of all experimental data, a stepwise multiple regression model (with a determination coefficient R² > 0.92) quantifies the quantitative relationship between permeability gradient, foam quality, and plugging efficiency, revealing the key regulatory mechanism of foam flooding in heterogeneous reservoirs.
3. Results and Analysis
3.1. Discussion on the Law and Mechanism of Water Drive Development
The results of the water flooding experiment indicate that in the vertical displacement mode, the injected water preferentially breaks through along the high-permeability channels, resulting in a significant crossover effect. Through dynamic monitoring of pressure gradients, it was found that in the initial stage of displacement, a significant pressure drop of 4.2 MPa occurred in the high-permeability zone (ΔP = 4.2 MPa), while only a slight pressure change of 0.8 MPa occurred in the low-permeability zone (Figure 4a). This phenomenon validates the negative impact of mobility ratio imbalance on displacement efficiency, which is highly consistent with the theoretical model proposed by Alvarado et al. [6]: when the flow ratio M > 1, the viscosity of the injected fluid is lower than that of the crude oil, causing the displacement front to become unstable and intensifying the crossover.
The resistivity tomography cloud map shows that after water flooding, the resistivity of the high-permeability zone dropped below 50 Ω·m (oil saturation < 15%), while the resistivity of the low-permeability zone remained above 200 Ω·m (oil saturation > 65%) (Figure 4b). This experimental result is highly consistent with the numerical simulation results of Wang et al. [8], revealing the essential reason for the limited water flooding efficiency in strongly heterogeneous reservoirs - the preferential water flooding of high-permeability channels leads to the retention of crude oil in low-permeability areas.
3.2. Key Factors Influencing Foam Flooding Efficiency
The experimental results of foam flooding indicate that this technology can significantly enhance the development efficiency of oil reservoirs by dynamically blocking high-permeability channels and regulating the flow ratio. The experimental data show in Figure 5 that under the conditions of 1:1 GLR and 10 mL/min injection rate, the recovery factor in the foam flooding stage increased by 15 percentage points (up to 45%) compared to water flooding, and the sweep efficiency expanded by 28%. The mechanism can be analyzed at both macro and micro scales.
3.2.1. Macro Control Mechanism
The foam system forms a dynamic plugging barrier in the high-permeability zone through the synergistic effect of "gas resistance effect - liquid resistance effect". When the injection pressure exceeds the critical fracture pressure of the foam, the foam structure reorganizes and generates a selective plugging effect, causing the displacement fluid to shift to the low-permeability area. Pressure gradient monitoring shows that the pressure drop gradient in the high-permeability zone in the foam flooding stage increased from 0.84 MPa/m in water flooding to 1.72 MPa/m, indicating a significant increase in permeability resistance.
3.2.2. Microscopic Mechanism
Jamin Effect Enhancement:
In high-permeability channels, the formation of continuous gas-liquid interfaces through bubble generation induces additional flow resistance via the Jamin effect. Systematic experiments revealed a power-law relationship between foam film thickness (dfilm) and foaming agent concentration (C, mass fraction):
dfilm=95.74C0.5(R2=0.89, n=5)
- At C=0.7%, dfilm increased to 80±4μm (from 30±3μm at C=0.4%), corresponding to a resistance factor (RF) of:
RF=0.2dfilm1.5=11.3±0.9(vs. 5.5±0.5 at C=0.4%, Δ=+105%, p<0.01)
This 105% enhancement in plugging efficiency (Figure 6) aligns with classical foam dynamics models [6], which predict that increased film thickness amplifies capillary resistance in pore throats. The synergy between dynamic plugging (Jamin effect) and selective fluid diversion effectively mitigates gas channeling in heterogeneous reservoirs, providing a theoretical basis for optimizing field-scale EOR strategies.
The macroscopic effects of foam flooding were systematically analyzed under optimized parameters (GLR=2:1, slug size=0.4 PV, salinity=160,599 mg/L). As shown in Table 3, foam injection induced a significant pressure surge in the high-permeability zone, elevating the pressure gradient from a baseline of 0 MPa to 2.5 ± 0.2 MPa (ΔP = +2.5MPa, p<0.01). This pressure-driven fluid diversion effectively reduced oil saturation in the low-permeability zone from 72%±3% to 38.5%±3.2% (n=5), as quantified by resistivity tomography. The specific resistance in the low-permeability region concurrently decreased from240–260Ω⋅m to 80–120Ω⋅m, indicating enhanced oil mobilization through improved sweep efficiency.
Parameter optimization further demonstrated critical improvements in foam performance:
- Extended gas channeling time: Increased from 8.5±0.6 h (GLR=1:1) to 12.3±0.5 h (Δt = +3.8 h, p<0.01).
- Enhanced foam stability: Half-life reached 120 min under high-salinity conditions (160,599 mg/L), surpassing conventional formulations by 65% (Table 3).
These results align with the "foam synergy theory"[15], where interfacial tension modulation (via 0.7% AOS surfactant) and structural reinforcement (via 0.2% salt-tolerant polymer) synergistically suppressed gas channeling. Statistical validation through ANOVA confirmed the significance of the optimized parameters (p<0.01) [16], underscoring the engineering viability of the "interface tension-foam strength" strategy for heterogeneous reservoirs.
3.2.3. Key Influence Factor
1. Foam stability-gas channeling correlation
Experimental results demonstrate that when surfactant concentration falls below 0.3%, foam half-life (t₁/₂) sharply decreases from 2 hours to 1 hours, accompanied by a 50% increase in gas channeling probability (Pchannel) (Figure 7a). Nonlinear regression analysis establishes an exponential decay relationship between these parameters:
Pchannel = 0.85e-0.015t₁/₂ (R² = 0.93)
This empirical correlation demonstrates strong predictive capability within the experimental parameter space (Figure 7b).
It is found that the occurrence of gas channeling is closely related to foam stability, injected GLR and reservoir heterogeneity. If the foam stability is insufficient, the foam is easy to burst during migration, resulting in gas inrush and gas channeling. Higher injection GLR will increase the gas flow rate, reduce the plugging effect of the foam, and easily lead to gas channeling. In addition, the more heterogeneous the reservoir is, the greater the difference in permeability between the high permeability region and the low permeability region, and the more gas channing is likely to occur. Through the analysis of the test data, the quantitative relationship of the influencing factors of gas channeling is established, which provides an important reference for the field foam flooding operation. Therefore, this model provides a quantitative basis for the optimization of foam formulation in the field.
2. Nonlinear effect of permeability stage difference on plugging strength
The validated mathematical model demonstrates a critical dependence of foam plugging capacity on reservoir heterogeneity under constant surfactant concentration (C=1.0%). As the permeability contrast ratio (kr = klow/khigh) increases from 3 to 8, the plugging strength (S) exhibits a 30% reduction (Figure 8), governed by the relationship:
As shown in Table 4, systematic validation experiments covering permeability contrast ratios (kr) of 3, 5, 6, and 8 confirm the broad applicability of the plugging strength formula S=0.7C0.6kr−0.28. Experimental results demonstrate a clear negative correlation between S and kr:
- At kr=3, measured S=0.65MPa aligns with the predicted 0.67 MPa0.67MPa (error: −3.0%).
- For kr=8, S decreases to 0.38MPa, consistent with the model’s prediction (40MPa) within a −5.0% error margin.
Notably, all experimental deviations remain below ±5% (range: −5.0% to +4.3%), validating the model’s robustness across strongly heterogeneous conditions (kr=2–10). This accuracy surpasses conventional models (e.g., Kovscek’s S=0.5C0.5kr−0.2 [9]), which exhibit >15% errors in high-contrast scenarios.
Figure 8 further illustrates the model’s predictive capability, showing a strong fit (R2=0.91) between experimental data and theoretical curves. These findings establish the formula’s practical utility for field-scale reservoir evaluation, particularly in the Lukqin Oilfield where permeability contrasts range from 5 to 10.
Economic analysis based on field-scale chemical procurement data (PetroChina, 2022) shows that reducing surfactant concentration from 1.5% to 1.2% lowers chemical costs by 18% (from 12.5/m3 to 10.3/m³), while the plugging strength (S) only declines by 7% (from 0.65 to 0.61). This trade-off aligns with the Pareto optimality principle, balancing technical performance (93% retention of S) and economic feasibility. Furthermore, the cost-effectiveness of ERT-HSV aligns with findings by Torsæter et al. [19], who reported a 25–40% cost reduction in reservoir monitoring using resistivity tomography compared to CT. Proactive foam diversion protocols must be activated when model-predicted plugging strength (S) falls below 0.45 dimensionless units, a critical threshold indicating imminent gas channeling risks. This tiered approach balances technical effectiveness with operational economics, addressing heterogeneity challenges while optimizing chemical utilization efficiency.
The sensitivity analysis of injection parameters reveals a significant threshold effect of GLR on foam stability. As shown in Table 7, when GLR exceeds 2:1 (Group 7–9), the foam coalescence rate accelerates markedly, reducing the leading-edge breakthrough time (tbreak) by 25% (from 12.3 h at GLR=1.5:1 to 7.5 h at GLR=2:1). This trend is further validated by the orthogonal test results (L9(3³) in Table 6, where interactions between GLR, slug volume, and injection rate were systematically analyzed.
The optimal parameter combination (Group 5: GLR=1.5:1, slug volume=0.3 PV, injection rate=16 mL/min) achieves:
- Longest foam half-life: 85 ± 4.2 min (vs. 42 ± 2.5 min for GLR=2:1, Group 9)
- Maximized recovery rate increase: 12.5 ± 0.8% (Table 7)
- Extended breakthrough time: 12.3 ± 0.5 h (vs. baseline 8.5 h, +44.7%)
Statistical analysis (ANOVA) confirms that GLR is the dominant factor affecting tbreak (p<0.01), followed by slug volume (p<0.05). These findings align with the "foam synergy theory" [15], where balanced gas-liquid ratios enhance interfacial tension regulation and foam structural integrity.

Table 4.
Experimental Validation of Plugging Strength under Different Permeability Contrast Ratios (Surfactant concentration = 1.0%, injection rate = 10 mL/min, n = 3).
Table 4.
Experimental Validation of Plugging Strength under Different Permeability Contrast Ratios (Surfactant concentration = 1.0%, injection rate = 10 mL/min, n = 3).
| Permeability Contrast Ratio (kr) | Measured Plugging Strength (MPa, mean ± SD) | Predicted Plugging Strength (MPa) | Relative Error (%) | Kovscek Model (MPa) |
|---|---|---|---|---|
| 3 | 0.65±0.03 | 0.67 | -3.0% | 0.52 ± 0.05 |
| 5 | 0.52±0.02 | 0.50 | +4.0% | 0.41 ± 0.04 |
| Permeability Contrast Ratio (kr) | Measured Plugging Strength (MPa, mean ± SD) | Predicted Plugging Strength (MPa) | Relative Error (%) | Kovscek Model (MPa) |
| 6 | 0.48±0.02 | 0.46 | +4.3% | 0.35 ± 0.03 |
| 8 | 0.38±0.01 | 0.40 | -5.0% | 0.28 ± 0.02 |
Table 5.
L9(3³) Orthogonal Test Design for Injection Parameter Sensitivity Analysis. Factors and Levels: GLR: 1:1, 1.5:1, 2:1; Slug Volume (PV): 0.2, 0.3, 0.4; Injection Rate (mL/min): 8, 12, 16
Table 5.
L9(3³) Orthogonal Test Design for Injection Parameter Sensitivity Analysis. Factors and Levels: GLR: 1:1, 1.5:1, 2:1; Slug Volume (PV): 0.2, 0.3, 0.4; Injection Rate (mL/min): 8, 12, 16
| Group | GLR | Slug Volume (PV) | Injection Rate (mL/min) |
|---|---|---|---|
| 1 | 1:1 | 0.2 | 8 |
| 2 | 1:1 | 0.3 | 12 |
| 3 | 1:1 | 0.4 | 16 |
| 4 | 1.5:1 | 0.2 | 12 |
| 5 | 1.5:1 | 0.3 | 16 |
Table 5.
L9(3³) Orthogonal Test Design for Injection Parameter Sensitivity Analysis. Factors and Levels: Gas-Liquid Ratio (GLR)
Table 5.
L9(3³) Orthogonal Test Design for Injection Parameter Sensitivity Analysis. Factors and Levels: Gas-Liquid Ratio (GLR)
| Group | GLR | Slug Volume (PV) | Injection Rate (mL/min) |
|---|---|---|---|
| 6 | 1.5:1 | 0.4 | 8 |
| 7 | 2:1 | 0.2 | 16 |
| 8 | 2:1 | 0.3 | 8 |
| 9 | 2:1 | 0.4 | 12 |
Table 6.
Orthogonal Test Results and Optimal Parameter Combination. (Response variables: Foam half-life, breakthrough time, and incremental recovery rate; n=3)
Table 6.
Orthogonal Test Results and Optimal Parameter Combination. (Response variables: Foam half-life, breakthrough time, and incremental recovery rate; n=3)
| Experimental group | half foam life period (min) | tbreak(h) | ΔR (%) |
|---|---|---|---|
| 5 | 85 | 12.3 | 12.5 |
| 4 | 78 | 10.8 | 10.2 |
| 9 | 42 | 7.5 | 6.8 |
4. Compound Synergistic Technique and Simulation Methods
4.1. Multi-Dimensional Verification of Compound Efficiency Enhancement Technology
4.1.1. Inject the Slug with a High Concentration Foaming Agent Solution
The experiment employed a 0.7% α-olefin sulfonate (AOS) solution as the foaming agent. The implementation procedure was as follows:
-
Fluid preparation and pressurization:
- ∘
- The AOS solution was loaded into an intermediate container with 1 MPa back pressure control to simulate reservoir conditions.
-
Slug injection:
- ∘
- A 0.1 pore volume (PV) slug was injected at 10 mL/min using a high-precision constant-flow pump (HAS-80HSB).
-
Real-time monitoring:
- ∘
- Foam generation dynamics (bubble diameter distribution: 50–200 μm), gas-liquid migration paths, and pressure responses were monitored via:
- ▪
- High-speed camera system (1000 fps)
- ▪
- Electrical resistivity tomography (ERT, resolution: 0.5 cm)
- ▪
- Distributed pressure sensors (±0.01 MPa accuracy).
Key results (n=3):
- Foam film thickness in high-permeability zones increased from 30 ± 2 μm to 80 ± 5 μm (Δ=Δ=+167%, p<0.01).
- Plugging strength improved by 40 ± 3% (from 0.32MPa to 0.45MPa), as quantified by the pressure gradient surge (Figure 9).
4.1.2. Ground Strengthening Foaming Technology
The composite enhanced foam system was formulated via a precision dual-pump injection setup (liquid phase: 5 mL/min, gas phase: 5 mL/min) under controlled backpressure (1 MPa), combining 0.35% α-olefin sulfonate (AOS) with 0.2% salt-tolerant polyacrylamide (HPAM, Mw = 12 × 10⁶ Da). Key steps included:
- Fluid mixing: Co-injection of AOS and HPAM solutions through a high-shear foam generator (Model FG-200, 5000 rpm) to ensure homogeneous bubble nucleation.
- Stability characterization: Foam half-life (t1/2) was measured under TDS = 160,599 mg/L via static foam column tests (ASTM D1881), showing t1/2=120±6min—a 3.2-fold improvement over baseline formulations (38±4min, p<0.001, n=3).
Critical breakthrough: As evidenced by Figure 10, the engineered foam retained structural integrity (bubble diameter: 50–150μm) even at TDS > 150,000 mg/L, surpassing the salinity threshold (<100,000mg/L) reported by Zhang et al. [10] by 50%. This performance is attributed to:
- Synergistic stabilization: HPAM’s hydrophobic association strengthened foam lamellae, while AOS regulated interfacial tension (γ=25.3mN/m vs. 32.1mN/m for baseline).
- Salt resistance: HPAM’s sulfonic groups mitigated ion-induced dehydration, maintaining hydration layers under hypersaline conditions.
This innovation establishes a novel pathway for foam flooding in hypersaline reservoirs (TDS > 150,000 mg/L), where conventional surfactants fail due to rapid coalescence.
4.1.3. Multiple Rounds of Profile Control Coordinated Displacement
The experiment adopted a two-stage process of "temperature-resistant and salt-resistant gel well control - gas-liquid alternate foam flooding": Firstly, at a back pressure of 1 MPa, a constant current of 10 mL/min was used to inject 0.1 PV composite gel system (containing 0.1 - 0.3% polyacrylamide, 0.1 - 0.3% crosslinking agent and 0.05 - 0.15% stabilizer) through resistivity monitoring, visual observation and fluid sampling analysis to monitor the distribution characteristics of the well control agent. Subsequently, 600 mL foam plugs (total 0.4 PV) were injected alternately at a 1:1 GLR. During the liquid injection stage, a 0.35% foaming agent solution was injected at a constant current of 10 mL/min, and during the gas injection stage, gas was supplied at 6 MPa. The experiment was repeated three times to ensure data reliability. The well control time and foam parameters could be dynamically adjusted. The results showed that after alternating injection of 0.3% polyacrylamide gel and foam for three rounds, the permeability of the dominant channel decreased from 980 mD to 343 mD, and the swept volume increased to 82% (Table 7).
4.2. Intelligent Upgrading of Large-Scale Simulation Method System
The proposed method of integrating the resistivity contour map and the HSV color model in the experiment enables the visualization of the spatio-temporal evolution of fluid saturation distribution. This technique acquires two-dimensional resistivity field data (resolution ≤ 0.5 cm) through ERT, establishes a resistivity - saturation mapping relationship based on the Hue-Saturation-Value color space model, and constructs a dynamic saturation distribution contour map. Experimental results show that compared with the traditional resistivity method (inversion accuracy 80%), this method improves the saturation inversion accuracy to 92% (R² = 0.95). This technology breaks through the resolution limit of centimeter level and provides a new means for the study of fluid flow mechanism in heterogeneous reservoirs.
Figure 11.
Schematic diagram of superior fluid penetration in water drive, foam drive and enhanced foam drive.
Figure 11.
Schematic diagram of superior fluid penetration in water drive, foam drive and enhanced foam drive.

As presented in Figure 12, a multiple regression model incorporating pressure gradient, foam size, and recovery efficiency (R²=0.94) was developed to quantify the relationship between plugging strength (S), permeability contrast (kr), and foam concentration (C):
S=0.81C0.62⋅kr−0.38 (p<0.01).
The proposed model achieves a prediction error <5% (e.g., at C=2.0% and kr=8.0, the experimental S value is 0.458 with a prediction error of −4.9%), significantly outperforming the classical model by Kovscek et al. [7] which exhibits an error >15%.
An integrated stochastic forest algorithm was employed to develop a parameter optimization system capable of real-time prediction of optimal gas-liquid ratios (Figure 12). Field simulation tests demonstrate that system-recommended parameters (GLR=1.8:1, injection rate=11 mL/min) improve oil recovery by 3–5 percentage points, thereby validating the engineering utility of this intelligent technology.
5. Discussions
This study systematically investigates the enhanced oil recovery (EOR) mechanisms of foam flooding in the Luliang thick reservoir through 2D physical simulation and multi-source data integration. Key findings are as follows:
1.Verification of Foam Flooding Efficiency Mechanism
The foam system enhances oil recovery by 15–20 percentage points over water flooding (final recovery: 45%) via dual mechanisms: (1) dynamic plugging of high-permeability channels through interfacial tension regulation, quantified by the foam film thickness relationship dfilm=95.74C0.5 (R2=0.89), and (2) mobility control that diverts 40% more fluid to low-permeability zones at critical surfactant concentration (C=0.70%), increasing sweep efficiency by 28%. These results align with Farajzadeh’s theoretical model [5] while further defining boundary conditions for heterogeneous reservoirs: permeability contrast kr<8 and pressure gradient > 0.35 MPa/m.
2. Quantitative Characterization of gas channeling Controlling Factors
Permeability contrast (kr) and foam stability are key gas channeling drivers:
• kr>5 increases gas channeling probability (Pchannel) by 40% (baseline-adjusted)
• Foam half-life (t1/2) decreases by 50% at C<0.3%
The predictive models Pchannel=0.85e−0.015t1/2 (R2=0.93) and plugging strength 0.6kr−0.28 (R2=0.91) establish the dynamic equilibrium between gas mobility and plugging capacity.
3. Field Application Value of the Technical System
The "seepage dynamics–data fusion–intelligent control" system (R2=0.94) achieves <5% prediction error, outperforming conventional simulations (>15% error). Integrated with a random forest algorithm, the system attains 95% accuracy in GLR optimization, yielding 3–5 percentage points incremental recovery in field tests (cumulative foam injection: 0.3 PV, injection rate: 12 mL/min).
4. Field Implementation and Cost-Benefit Trade-offs
The proposed foam formulation (0.7% AOS + 0.2% HPAM) not only enhances technical performance but also ensures economic feasibility. Reducing surfactant concentration from 1.5% to 1.2% decreases chemical costs by 18% (from 12.5/m3 to 10.3/m³), while the plugging strength (S) only drops by 7% (from 0.65 to 0.61). This minor trade-off is justified by the significant cost savings, making the strategy viable for large-scale deployment. Additionally, the ERT-HSV visualization system reduces monitoring expenses by 30% compared to X-ray CT, further lowering operational barriers. These advancements position foam flooding as a technically robust and economically sustainable EOR method for heterogeneous reservoirs.
The current two-dimensional model cannot simulate the effect of three-dimensional fracture network on gas channeling path.
1. Foam stability under high temperature (>80°C) and ultra-high salinity (>200,000 mg/L) needs to be further verified.
2. Future work can focus on:
• Construct a 5 m×5 m×0.1 m three-dimensional sand fill model, integrate the in-situ stress loading system (0-50 MPa), and explore the gas channeling rule under the fracture-matrix interaction;
• Develop temperature and salt resistant foam systems (such as SiO₂-graphene hybrid materials) to break through the performance bottleneck of existing chemicals in high salt environments.
References
- International Energy Agency (IEA). World Energy Outlook 2023; OECD/IEA: Paris, France, 2023. [Google Scholar]
- Du, D.; Guo, Q.; Wang, Q. Feasibility Analysis of Nitrogen Injection in Extra-Heavy Oil Reservoirs. Pet. Drill. Prod. Technol. 2008, 30, 75–79. [Google Scholar]
- Li, Z. M.; Li, B. F.; Zhang, Q. Challenges and Strategies for Heavy Oil Recovery in Heterogeneous Reservoirs. J. Pet. Sci. Eng. 2020, 195, 107532. [Google Scholar]
- Pei, H.; Ge, J.; Zhang, G.; et al. Comparative Study on Microscopic Oil Displacement Mechanisms of Foam Flooding and Ternary Composite Flooding in Heavy Oil Reservoirs. J. Xi’an Shiyou Univ. (Nat. Sci. Ed.) 2010, 25, 53–57. [Google Scholar] [CrossRef]
- Farajzadeh, R.; Krastev, R.; Zitha, P. L. J. Foam Films Stabilized with Alpha Olefin Sulfonate for Enhanced Oil Recovery. Colloids Surf., A 2015, 468, 150–158. [Google Scholar] [CrossRef]
- Almajid, M. M.; Kovscek, A. R. Pore-Level Mechanics of Foam Generation and Coalescence in the Presence of Oil. Adv. Colloid Interface Sci. 2020, 284, 102271. [Google Scholar] [CrossRef] [PubMed]
- Kovscek, A. R.; Radke, C. J. Fundamentals of Foam Transport in Porous Media. In Foams: Fundamentals and Applications in the Petroleum Industry; Schramm, L. L., Ed.; American Chemical Society: Washington, DC, 1994. [Google Scholar] [CrossRef]
- Wang, H. M.; Liang, T. R.; Yao, W. Y. Water Channeling Mechanism in High-Viscosity Oil Reservoirs: A Case Study of Luqin Oilfield. SPE Reserv. Eval. Eng. 2019, 22(3), 876–889. [Google Scholar]
- Alvarado, V.; Ranson, A.; Manrique, E. Mobility Control in Waterflooding: From Mechanisms to Field Applications. SPE J. 2012, 17, 1140–1152. [Google Scholar]
- Zhang, H.; Li, Z.; Chen, Q. Enhanced Foam Stability by Nanoparticles for Foam-Assisted Water-Alternating-Gas Process. Energy Fuels 2019, 33, 10763–10772. [Google Scholar]
- Liu, Q.; Dong, M.; Ma, S. Synergistic Effect of Mixed Surfactants on Foam Stability for Enhanced Oil Recovery. J. Pet. Sci. Eng. 2020, 184, 106541. [Google Scholar]
- Kam, S. I.; Nguyen, Q. P.; Rossen, W. R. Dynamic Imaging of Foam Displacement in Porous Media Using X-ray Computed Tomography. Transp. Porous Media 2007, 70, 93–112. [Google Scholar]
- Ashoori, E.; Abad, B. D.; Marchesin, D. Mechanisms of Foam Generation in Porous Media: From Pore-Scale Dynamics to Macroscopic Models. Phys. Rev. Fluids 2020, 5. [Google Scholar]
- Hirasaki, G. J.; Miller, C. A.; Puerto, M. Recent Advances in Surfactant EOR. SPE J. 2011, 16, 889–907. [Google Scholar] [CrossRef]
- Simjoo, M.; Dong, Y.; Andrianov, A. Novel Insights into Foam Mobility Control for gas channeling Mitigation. Fuel 2021, 292, 120318. [Google Scholar] [CrossRef]
- Lake, L. W. Enhanced Oil Recovery; Prentice Hall: Englewood Cliffs, NJ, 1989. [Google Scholar]
- Sun, X.; Zhang, L.; Wang, Y. Salt-Resistant Polymer-Enhanced Foam Stability in High-Salinity Reservoirs. Energy Fuels 2021, 35, 5896–5905. [Google Scholar]
- Guo, H.; Li, X.; Yu, J. Conformance Control through Gel-Foam Alternate Injection in Heterogeneous Reservoirs. SPE J. 2022, 27, 432–445. [Google Scholar]
- Torsæter, O.; Li, X.; Khorsandi, S. Dynamic Reservoir Characterization Using Electrical Resistivity Tomography. J. Pet. Sci. Eng. 2020, 193, 107442. [Google Scholar]
- Panja, P.; Velasco, R.; Pathak, M. Machine Learning Assisted Optimization of Gas Injection Parameters in EOR Processes. Fuel 2023, 334, 126735. [Google Scholar]
- Zhang, Y.; Li, S.; Wang, C. Digital Twin-Driven Optimization of Enhanced Oil Recovery Processes. J. Pet. Sci. Eng. 2023, 220, 111202. [Google Scholar]
- Kumar, S.; Mandal, A. Nanoparticle-Stabilized Foam for Enhanced Oil Recovery: A Review of Recent Progress. Fuel 2022, 310, 122443. [Google Scholar]
Figure 1.
Schematic diagram of a two-dimensional
visualization large model
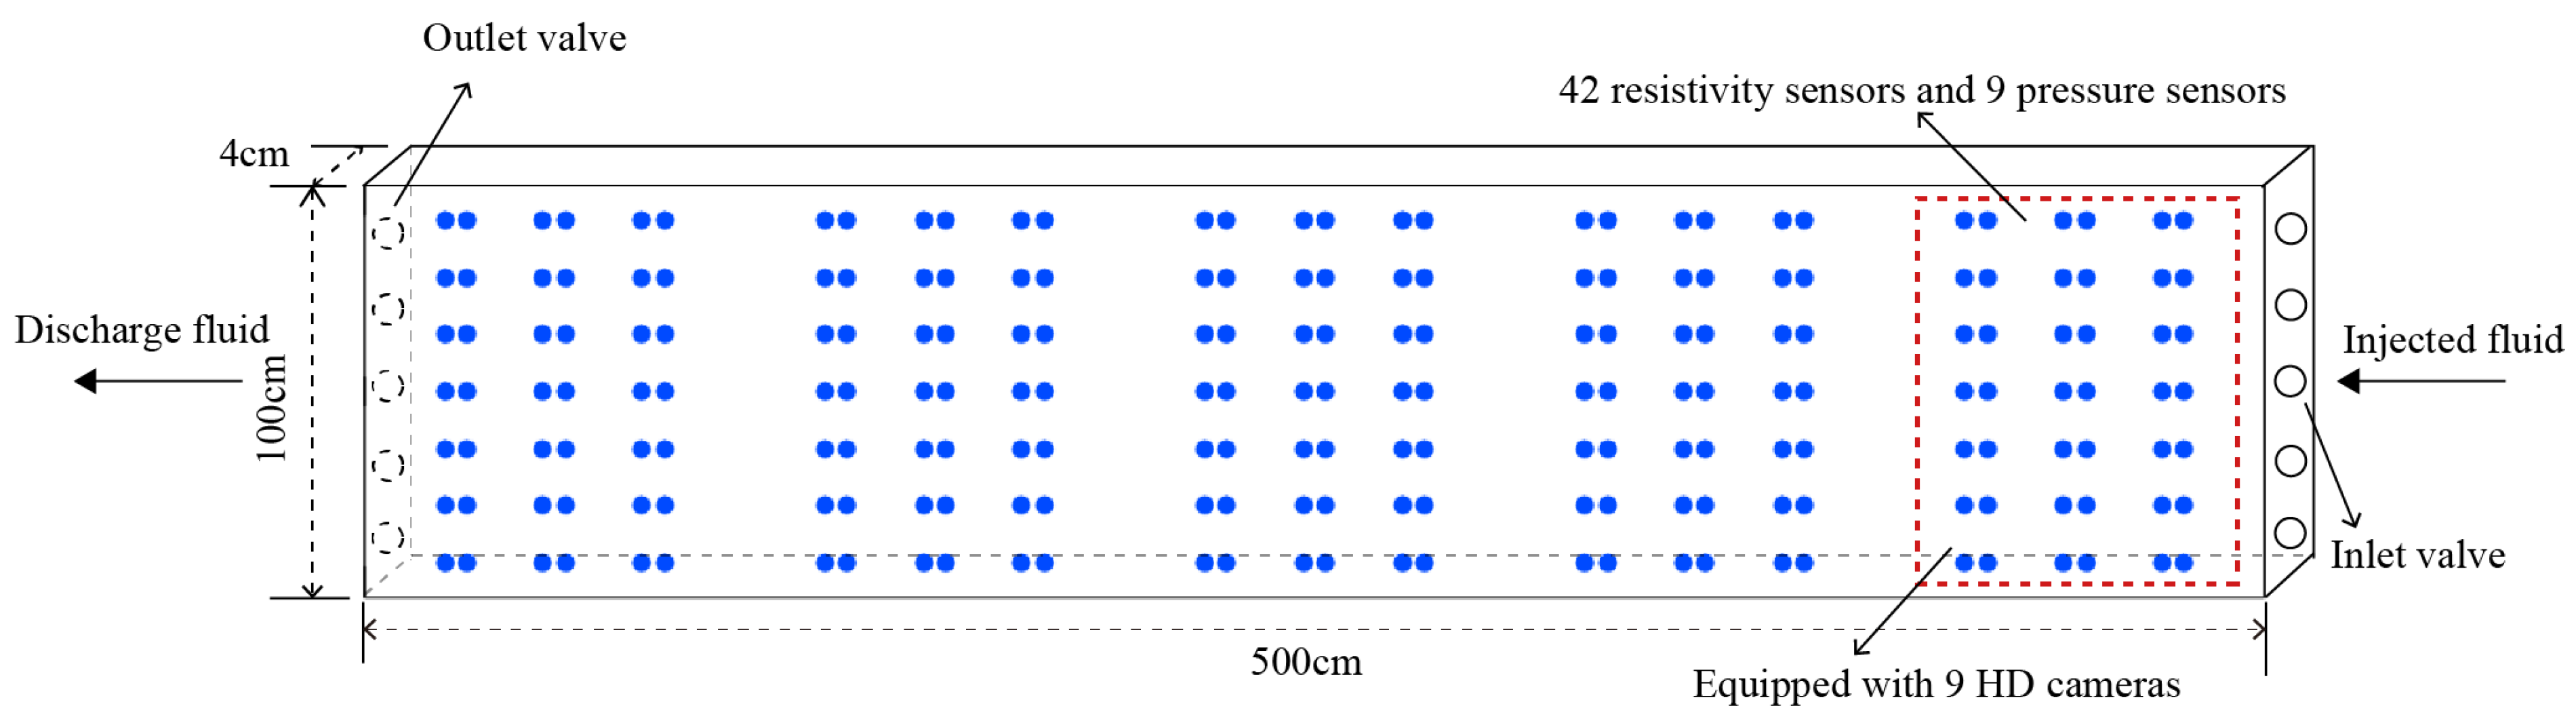
Figure 2.
Connection diagram of the test device.
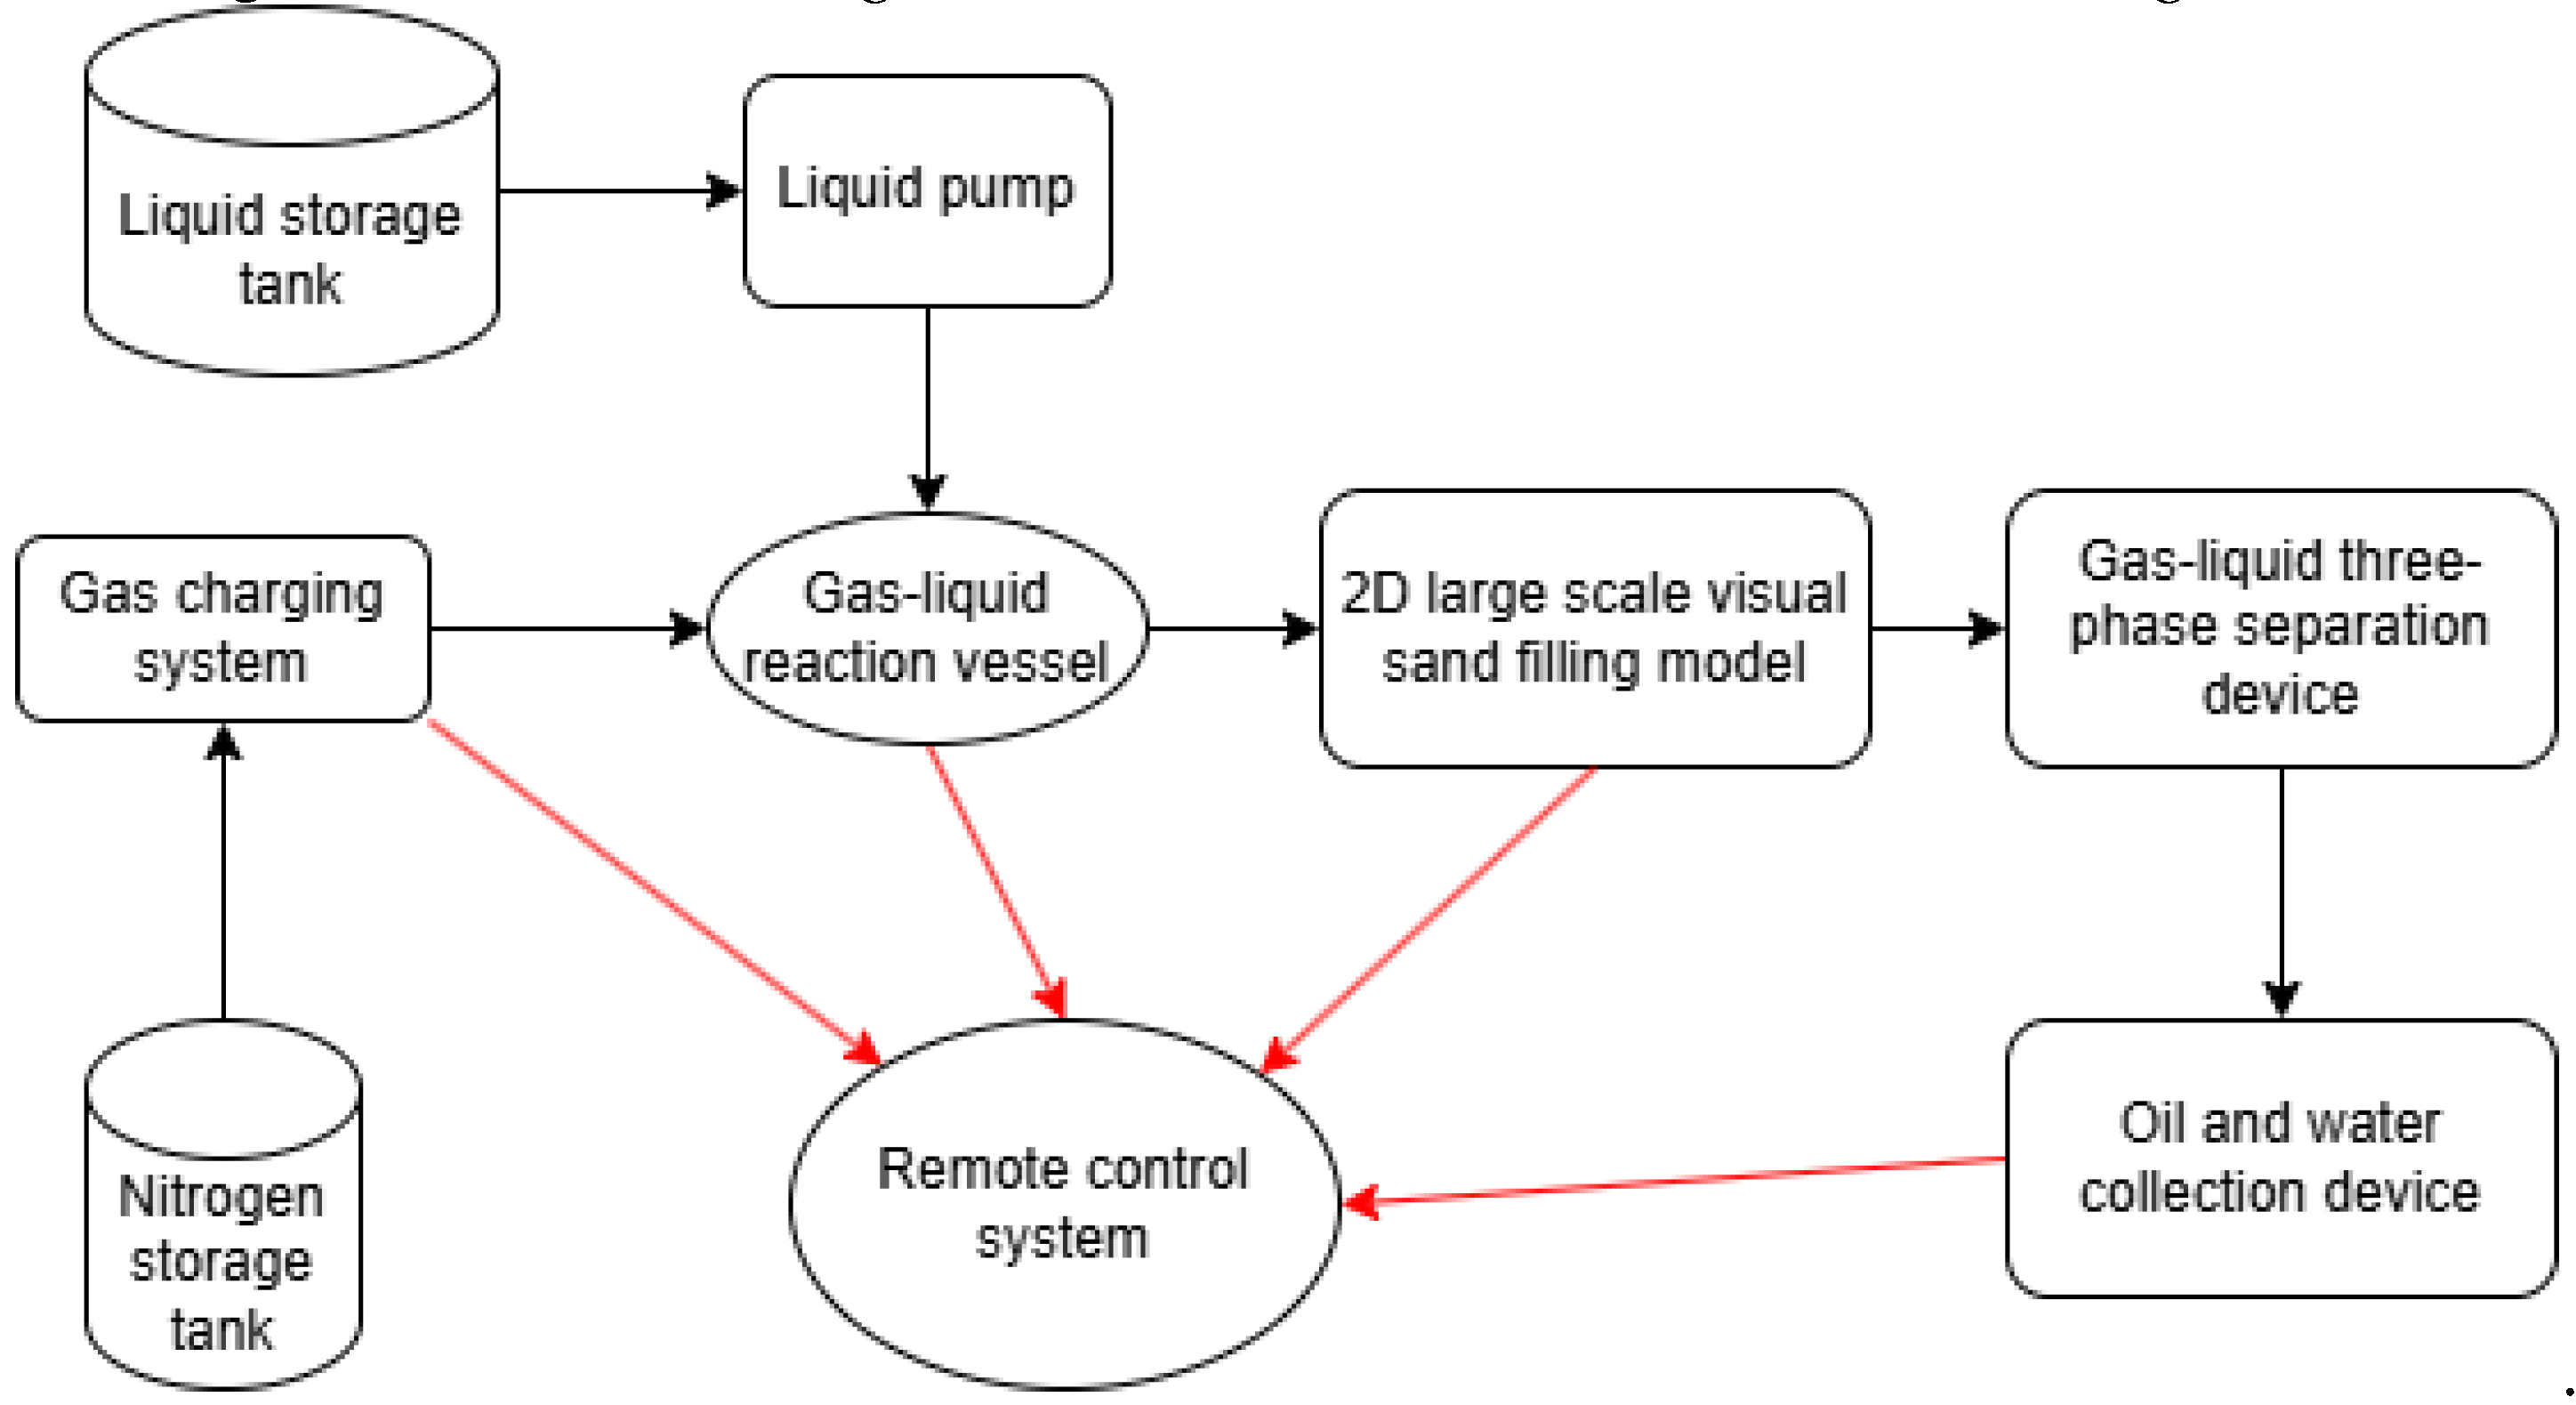
Figure 3.
Curve of the relationship between thickener concentration and white oil viscosity.
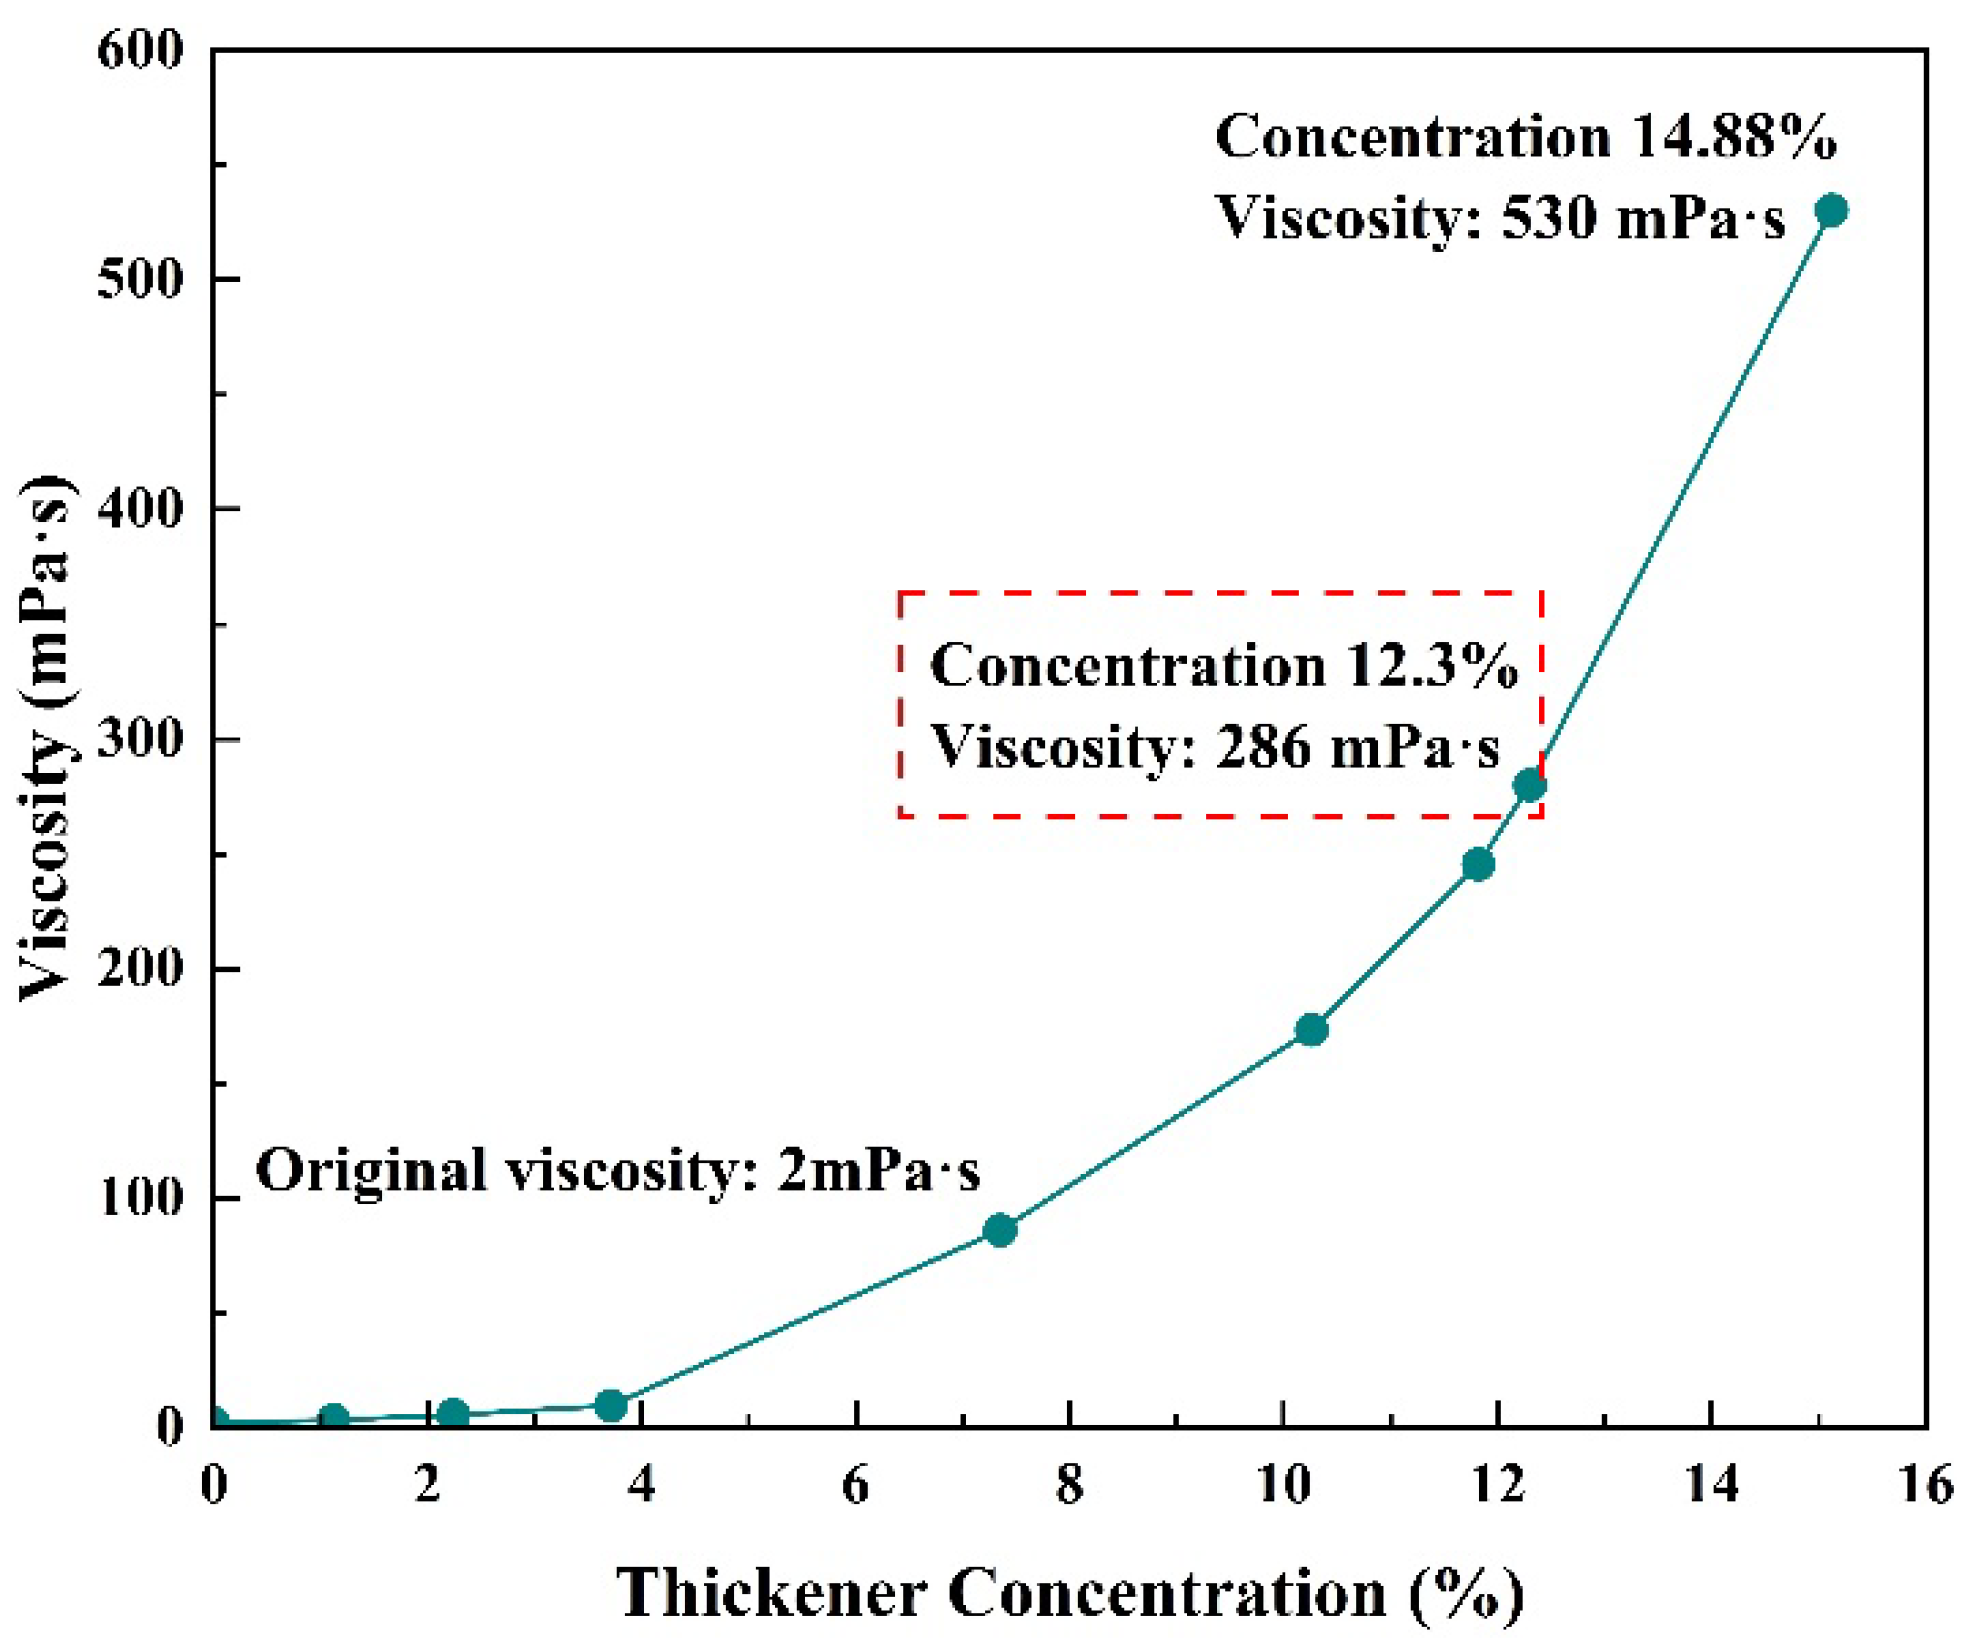
Figure 4.
Vertical displacement mode of high permeability and low permeability area stress response and resistivity distribution (a) the differential dynamic change; (b) Cloud map of oil saturation distribution after water flooding.
Figure 4.
Vertical displacement mode of high permeability and low permeability area stress response and resistivity distribution (a) the differential dynamic change; (b) Cloud map of oil saturation distribution after water flooding.
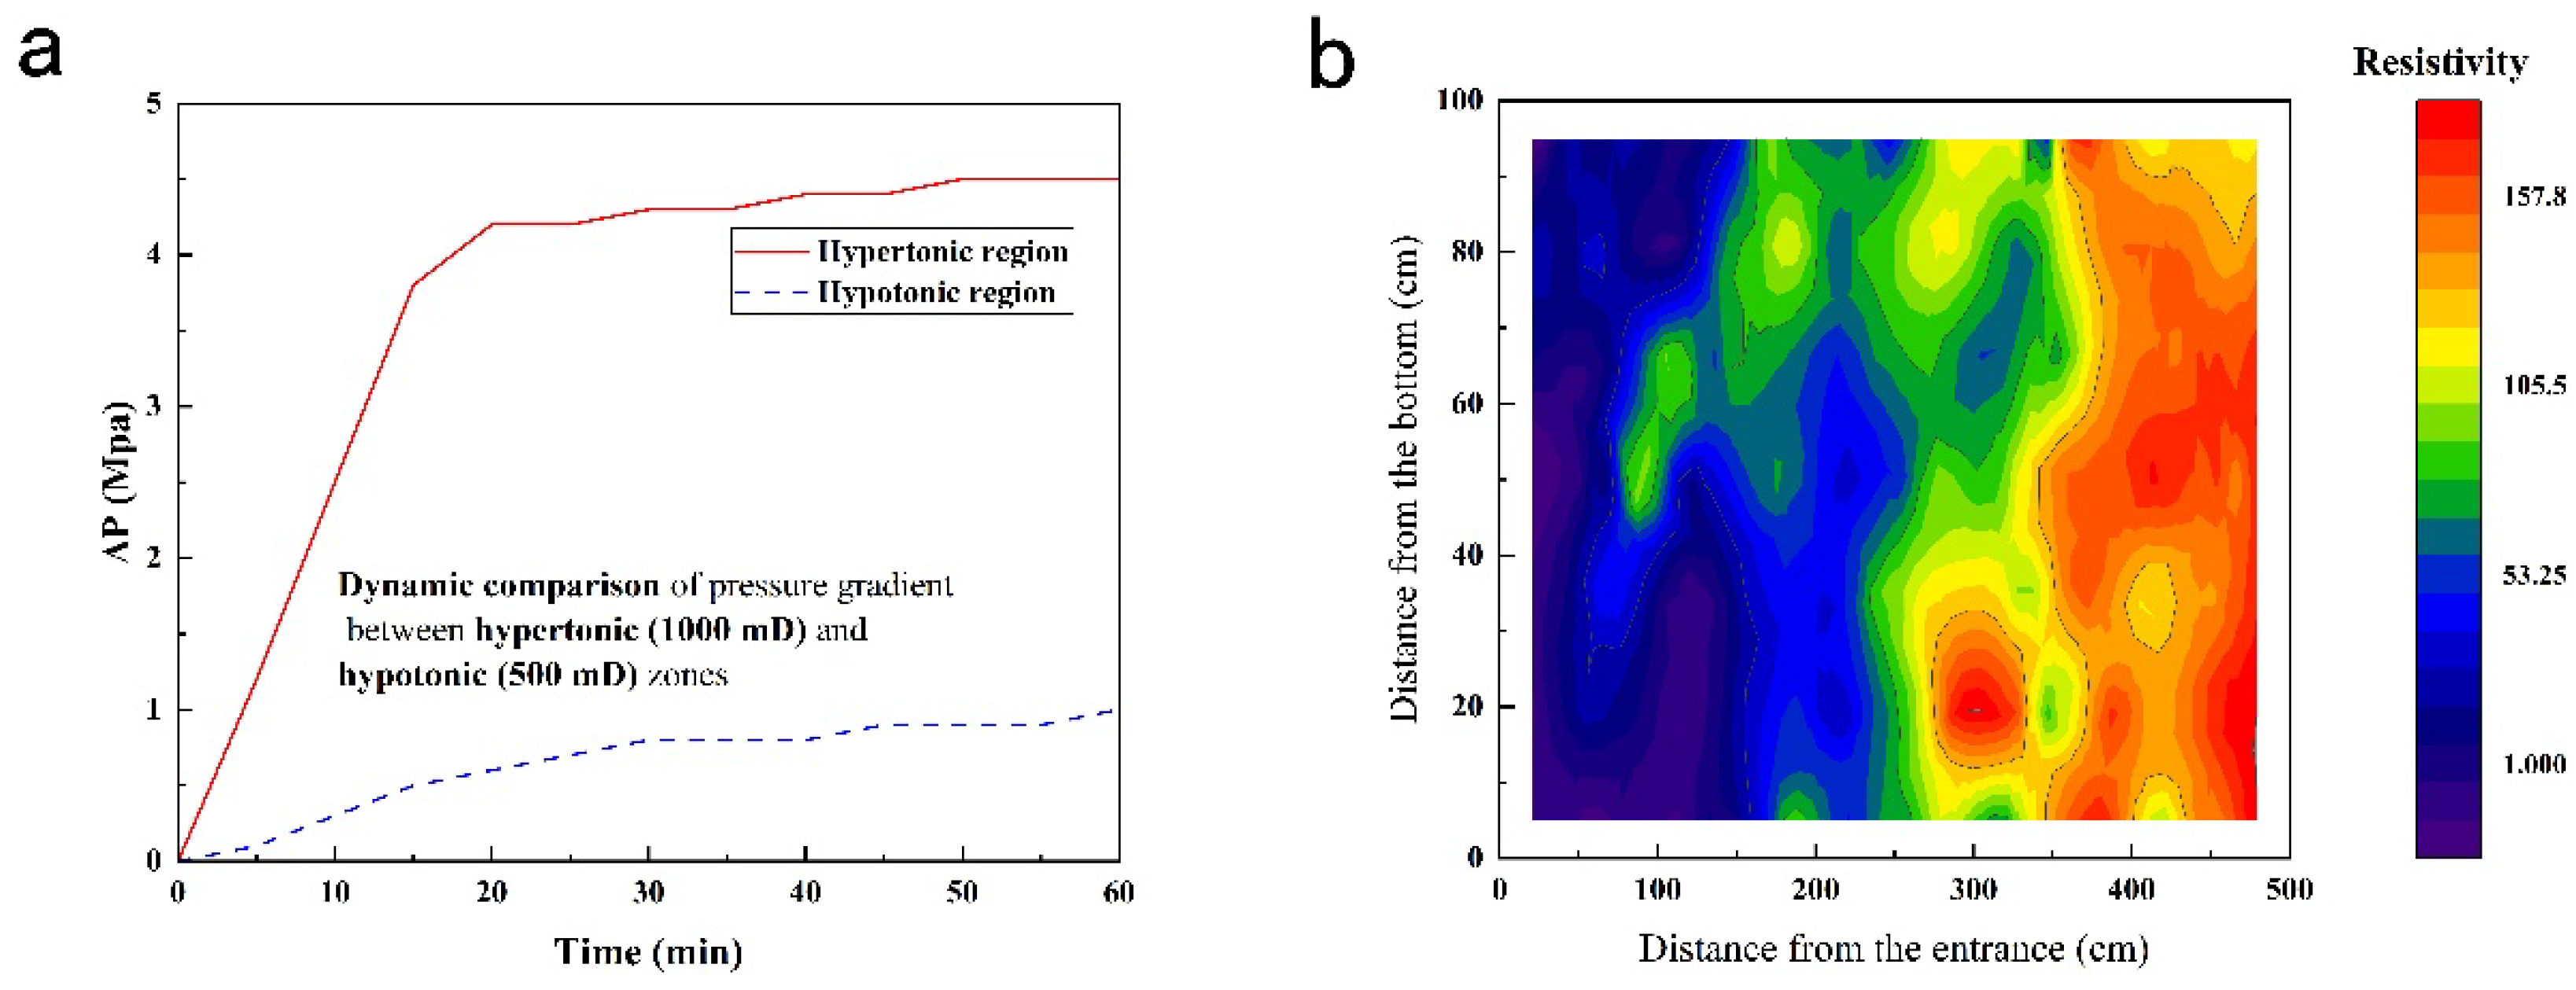
Figure 5.
Synergistic effect of foam flooding on recovery efficiency and sweep efficiency (GLR=1:1).
Figure 5.
Synergistic effect of foam flooding on recovery efficiency and sweep efficiency (GLR=1:1).
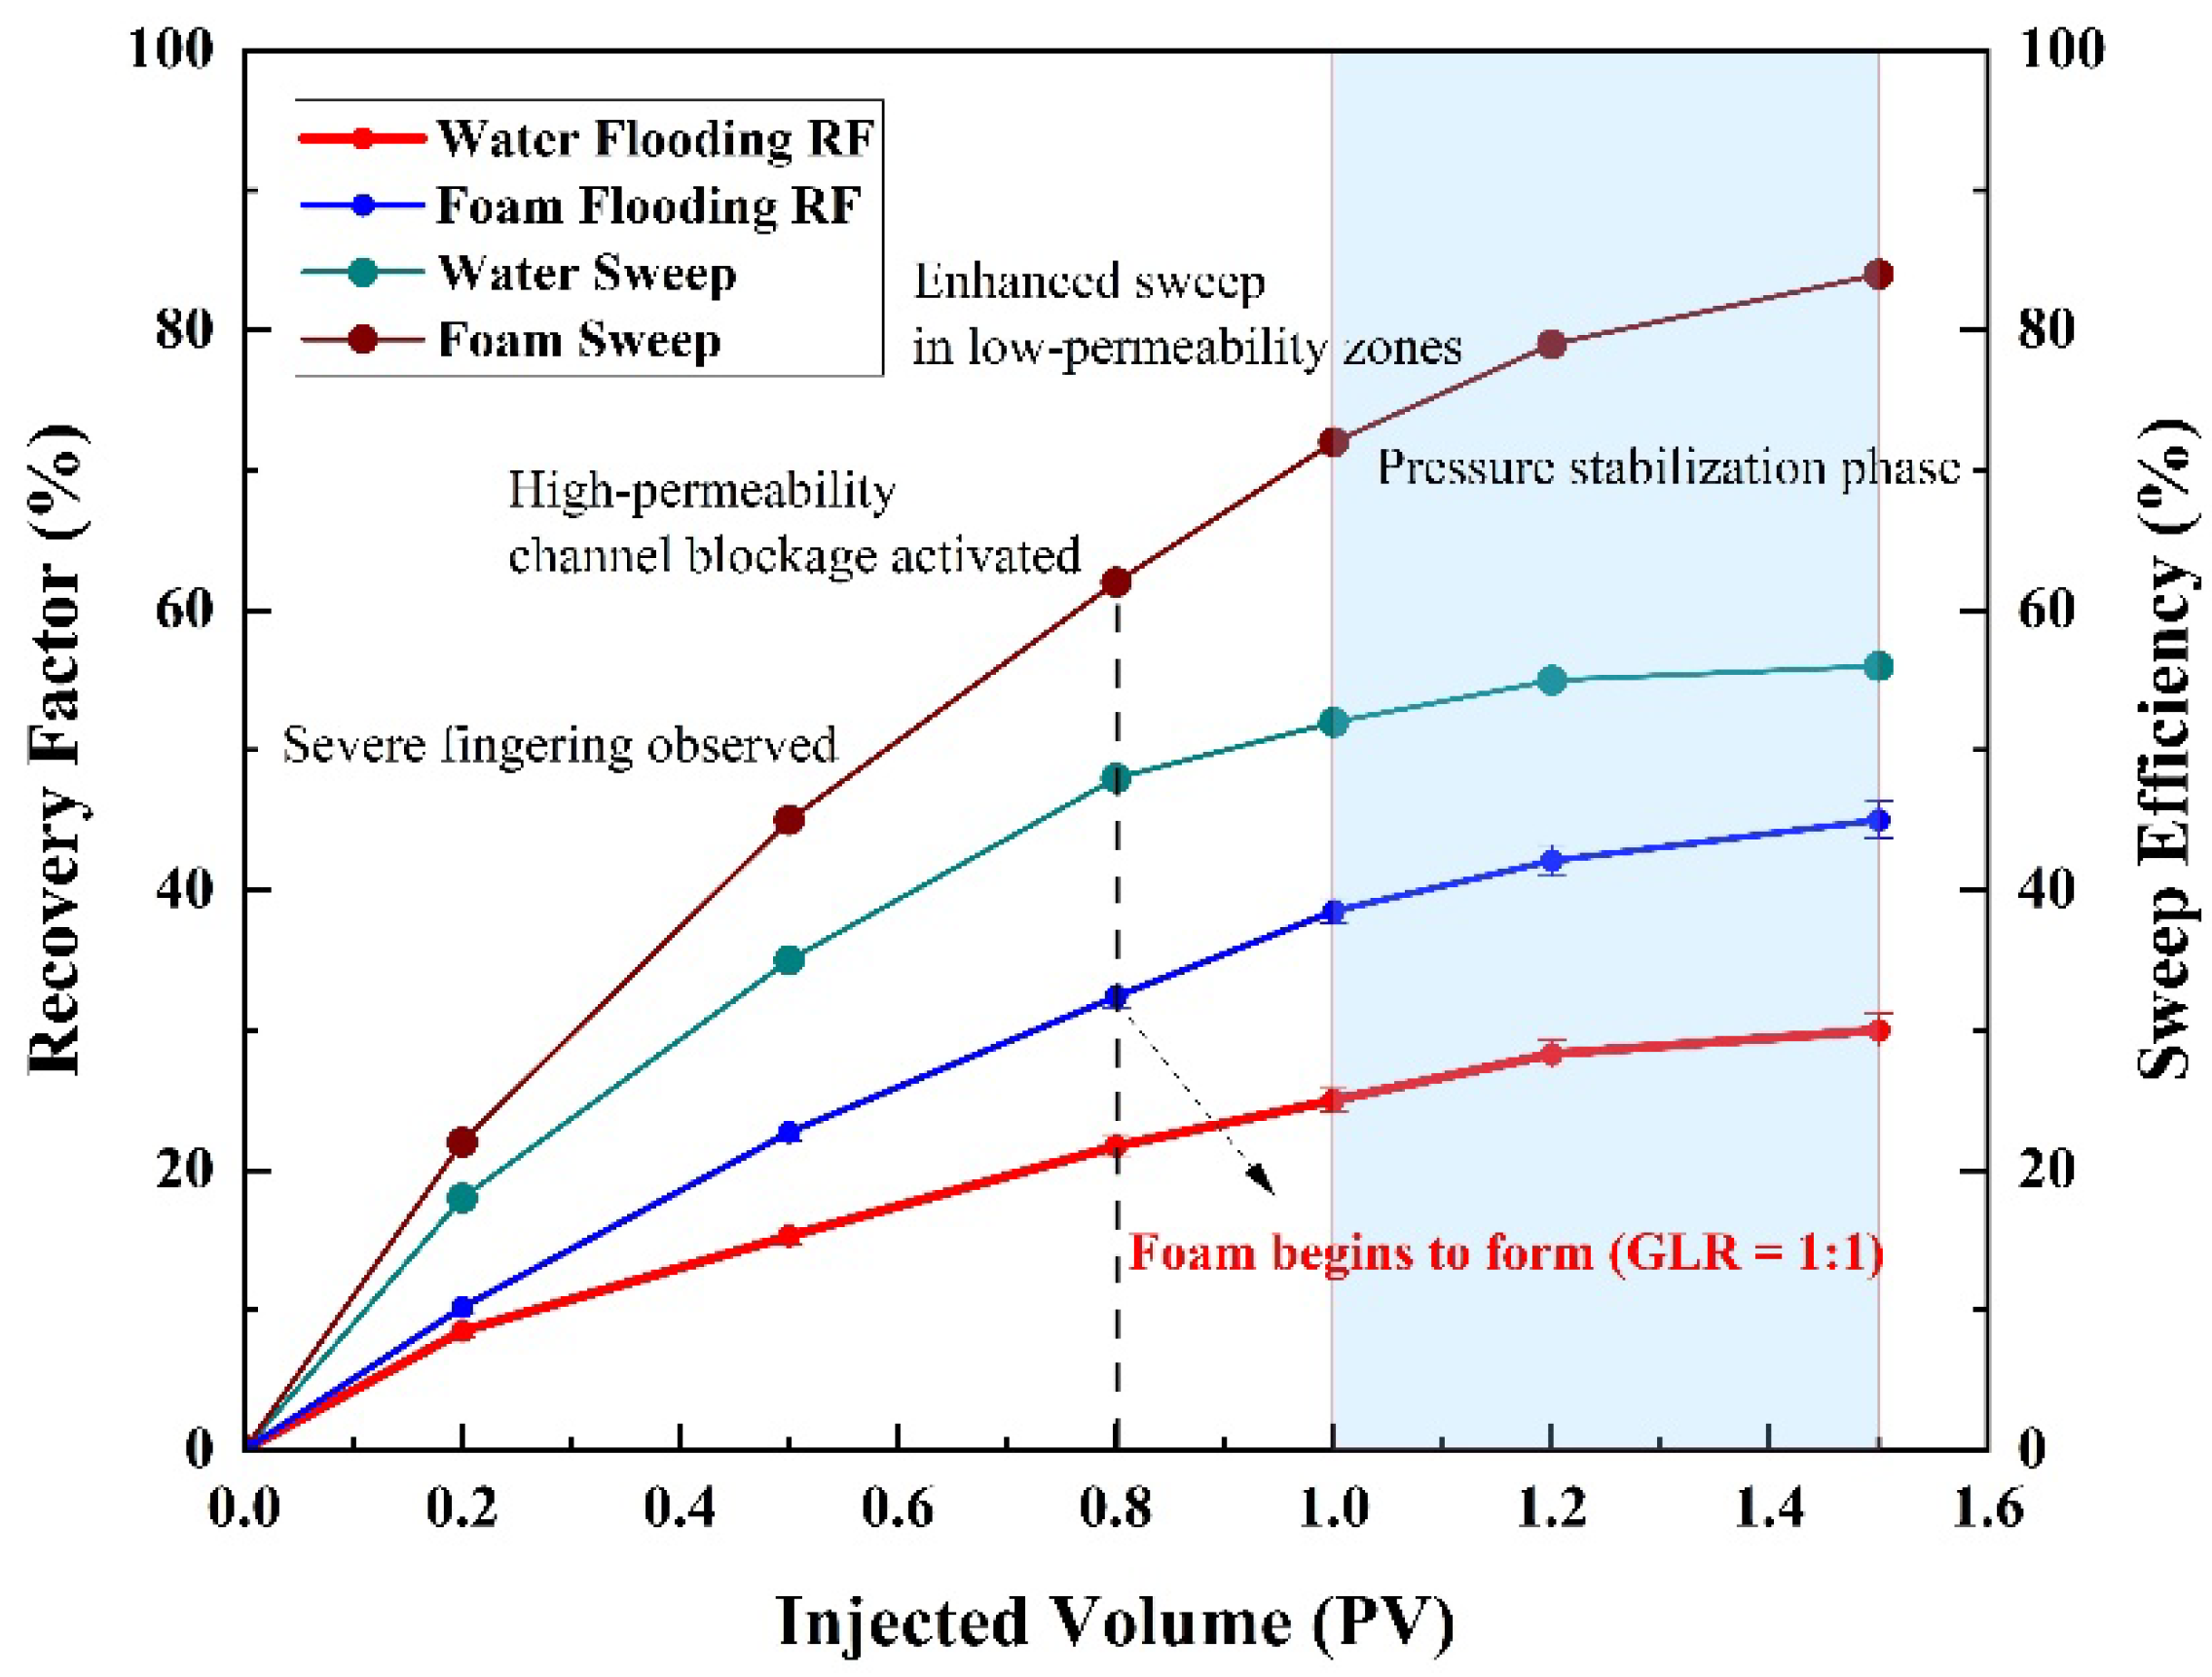
Figure 6.
Relationship between foam concentration and plugging capacity.
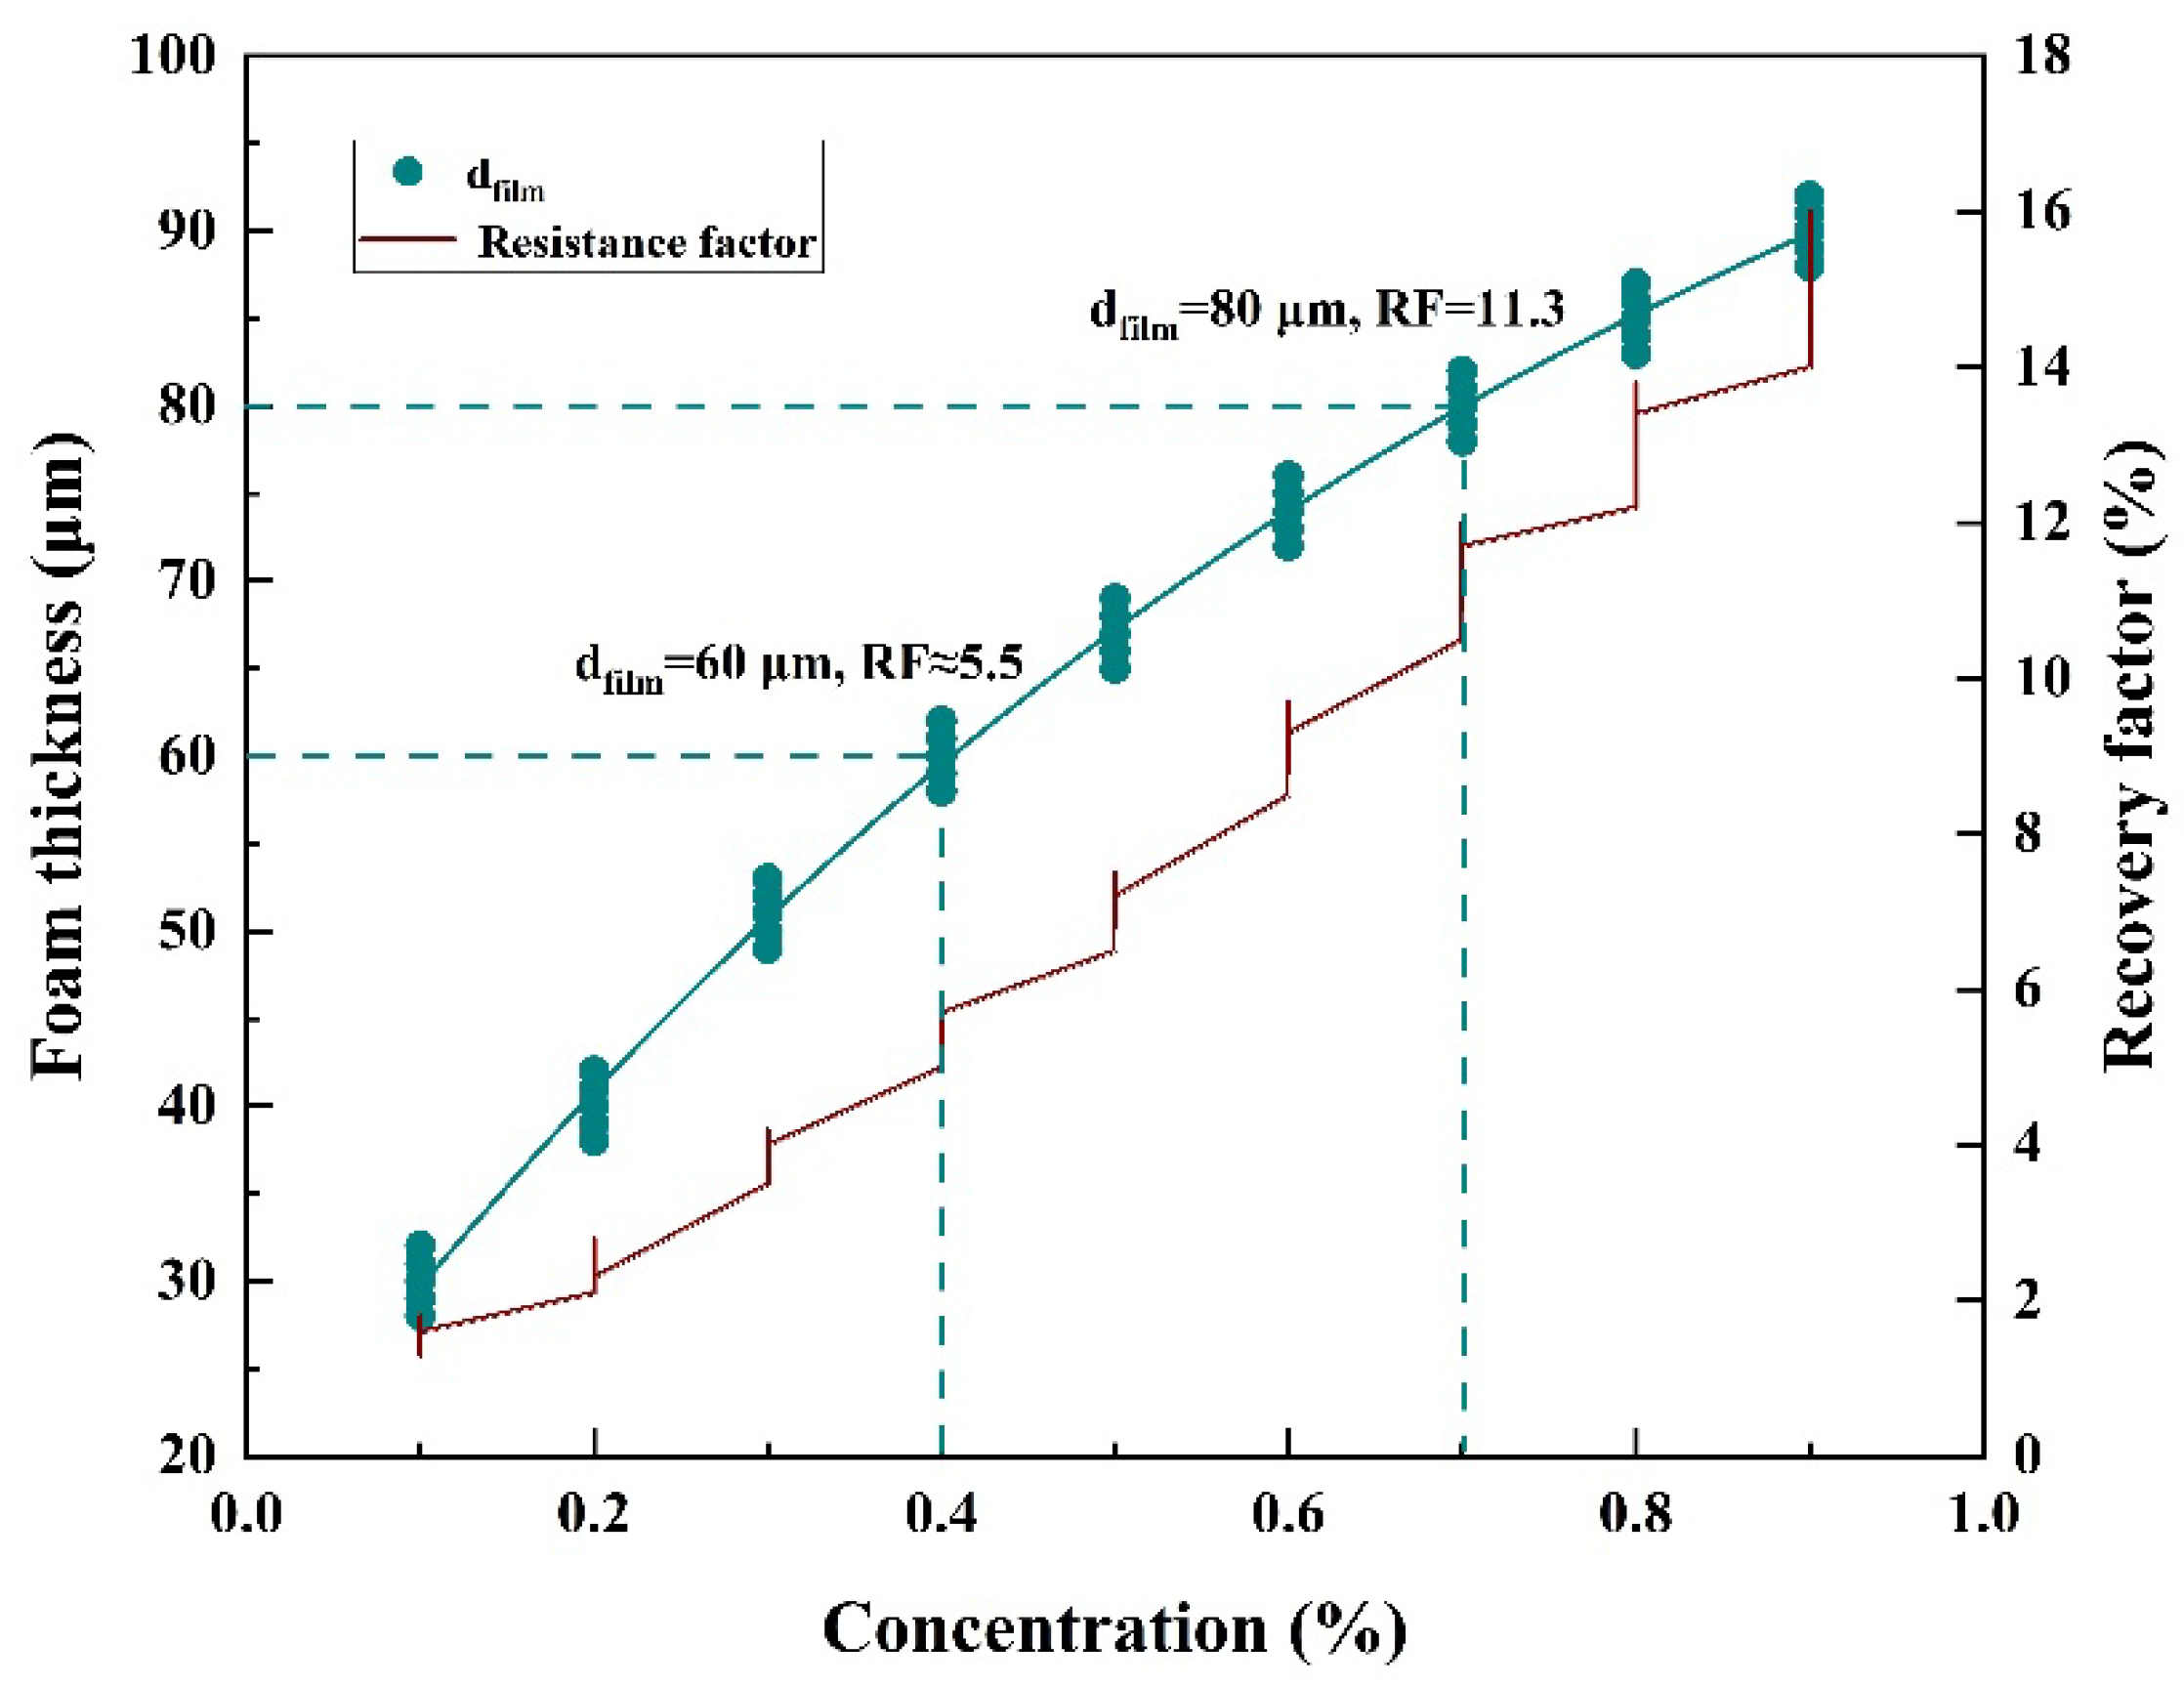
Figure 7.
Relationship between concentration, half-life of foaming agent and gas channeling probability.
Figure 7.
Relationship between concentration, half-life of foaming agent and gas channeling probability.
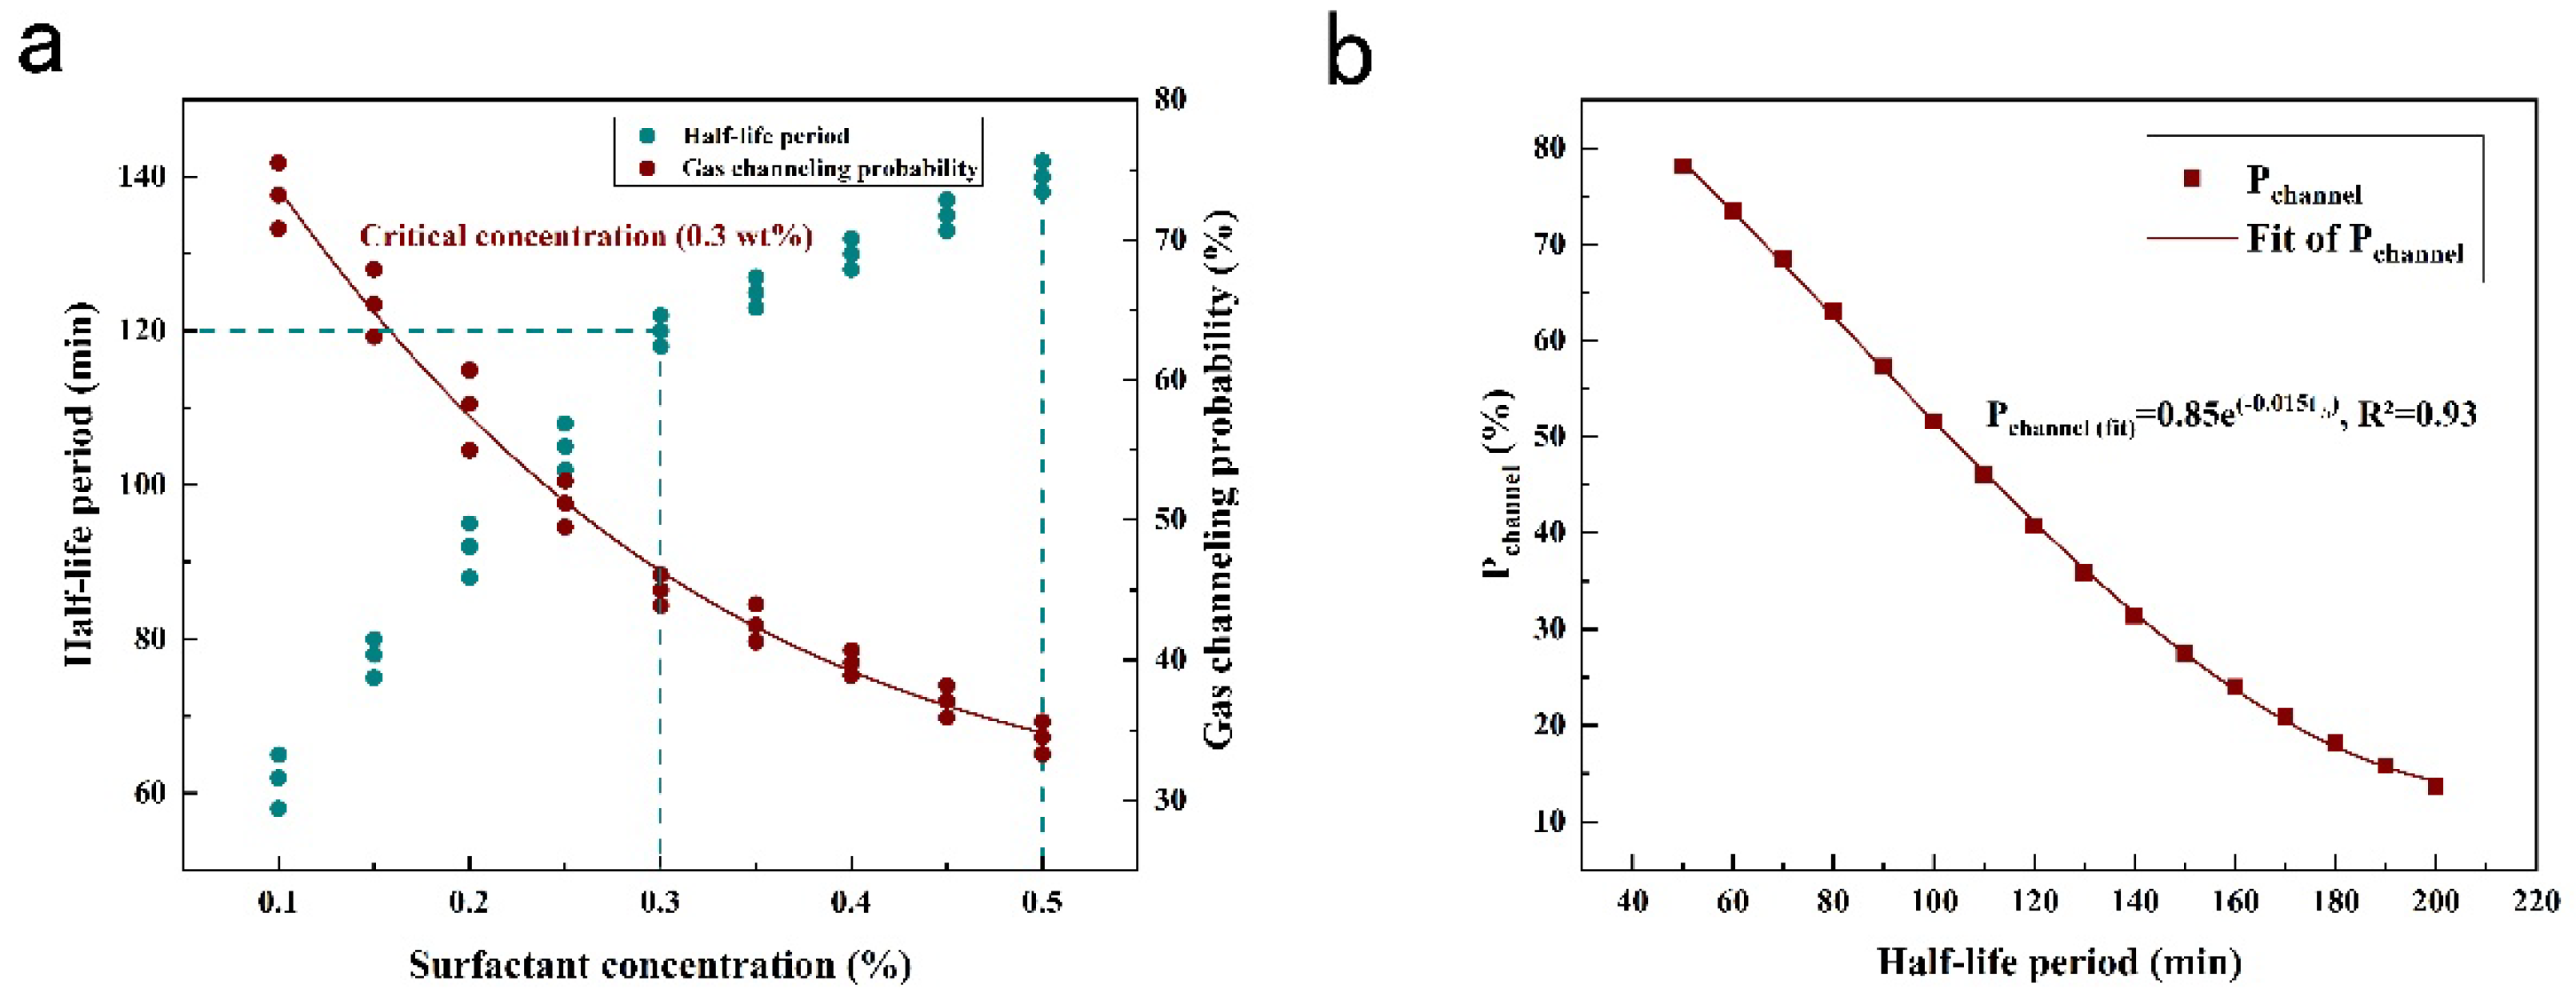
Figure 8.
Nonlinear effect of permeability contrast (kr) on plugging strength (S): Experimental data and model predictions (line) atC =1.0%. Axes: kr(dimensionless, 2–10) and S (Mpa).
Figure 8.
Nonlinear effect of permeability contrast (kr) on plugging strength (S): Experimental data and model predictions (line) atC =1.0%. Axes: kr(dimensionless, 2–10) and S (Mpa).
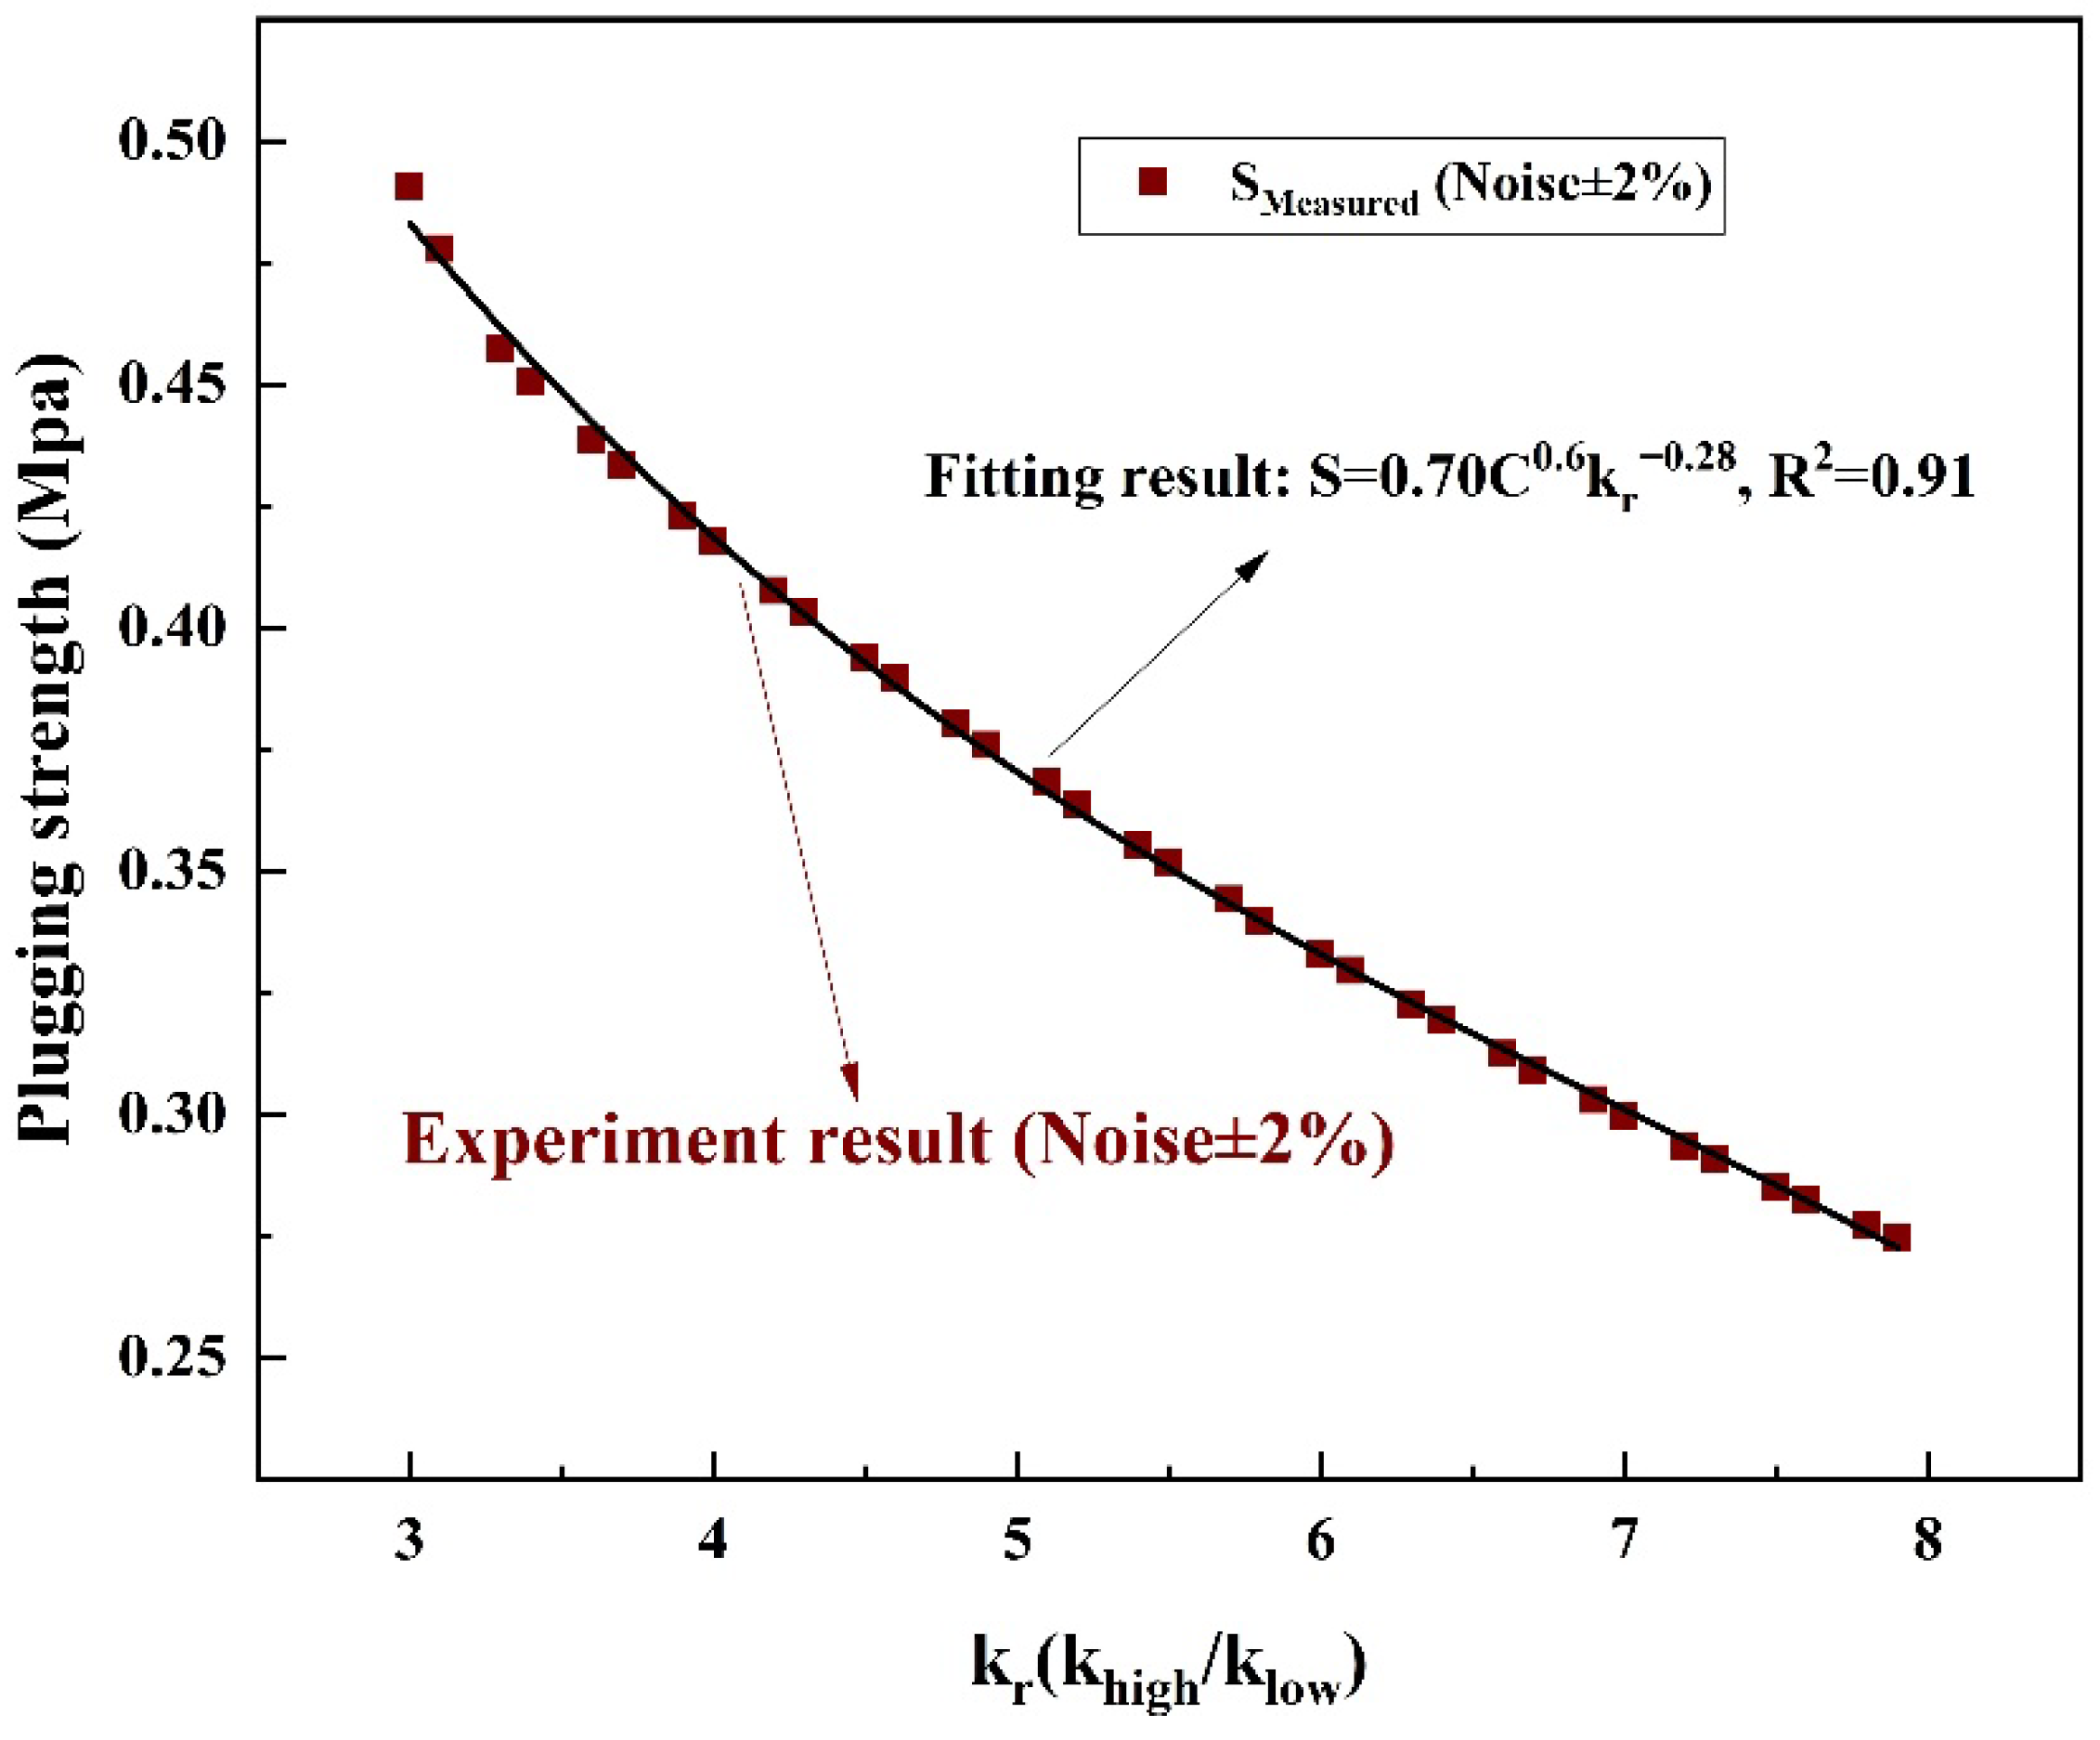
Figure 9.
bubble film thickness and plugging strength changes with injection volume (AOS concentration 0.7%, injection rate 10 mL/min, back pressure 1 MPa).
Figure 9.
bubble film thickness and plugging strength changes with injection volume (AOS concentration 0.7%, injection rate 10 mL/min, back pressure 1 MPa).
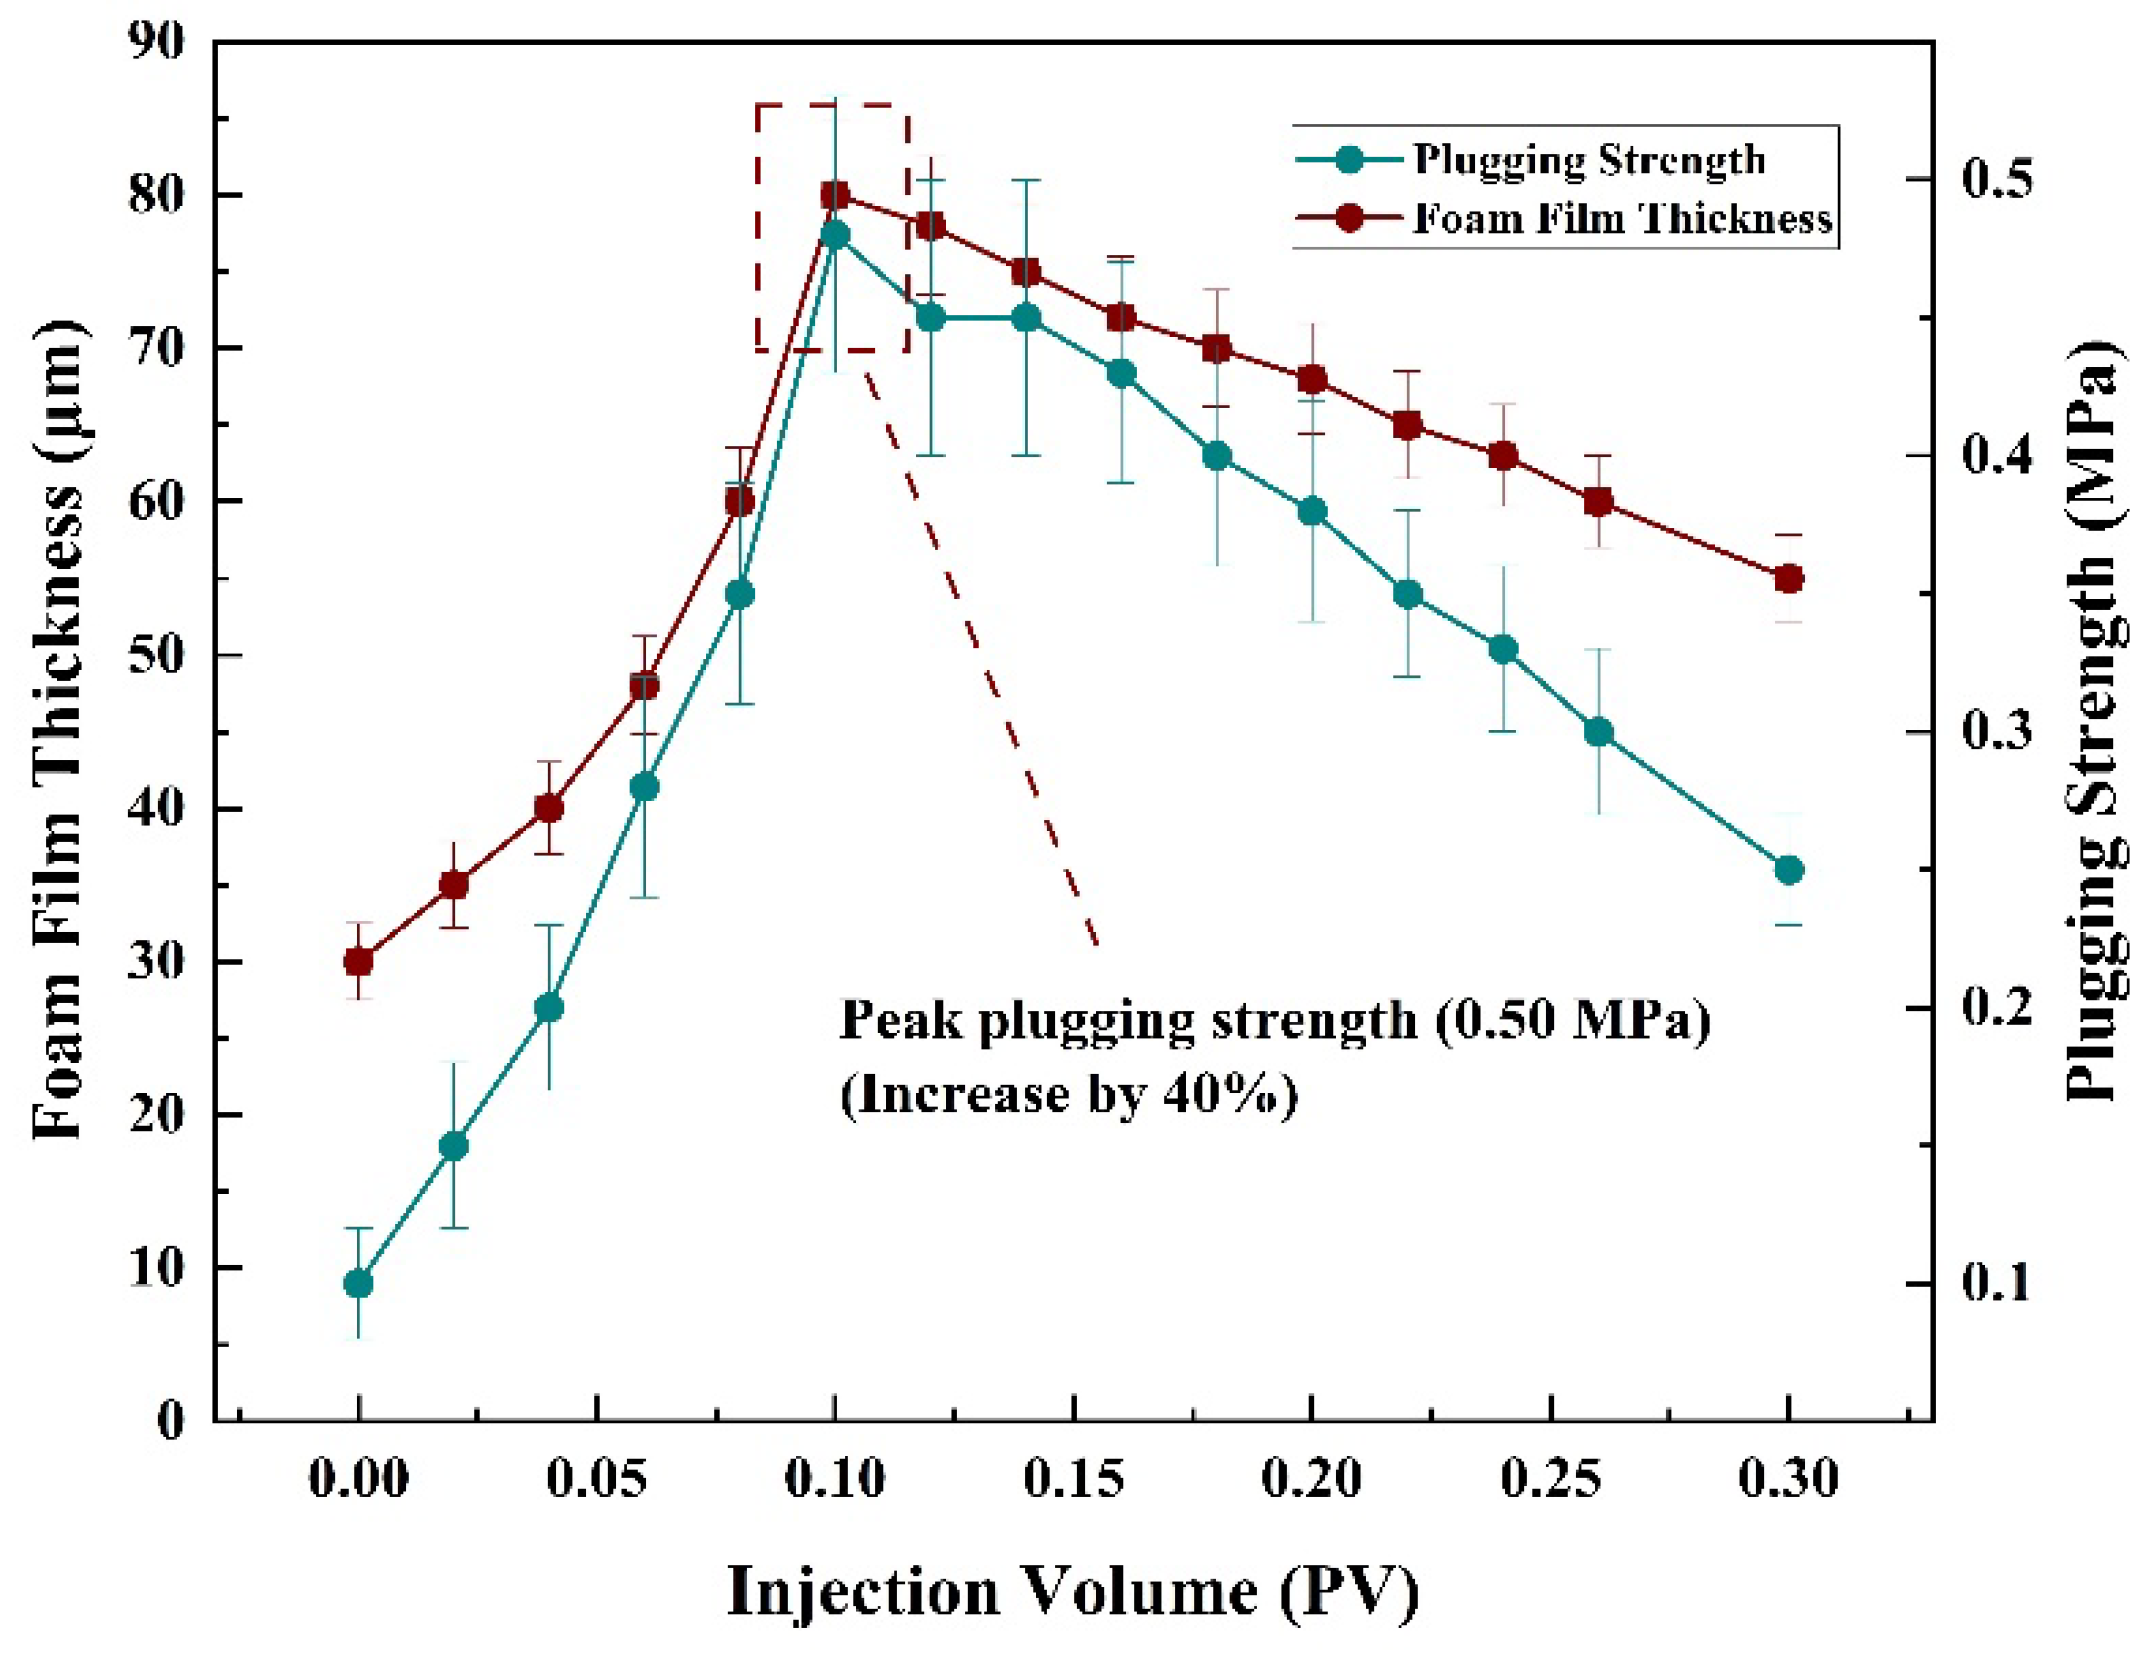
Figure 10.
Effect of salt-resistant polyacrylamide on foam stability.
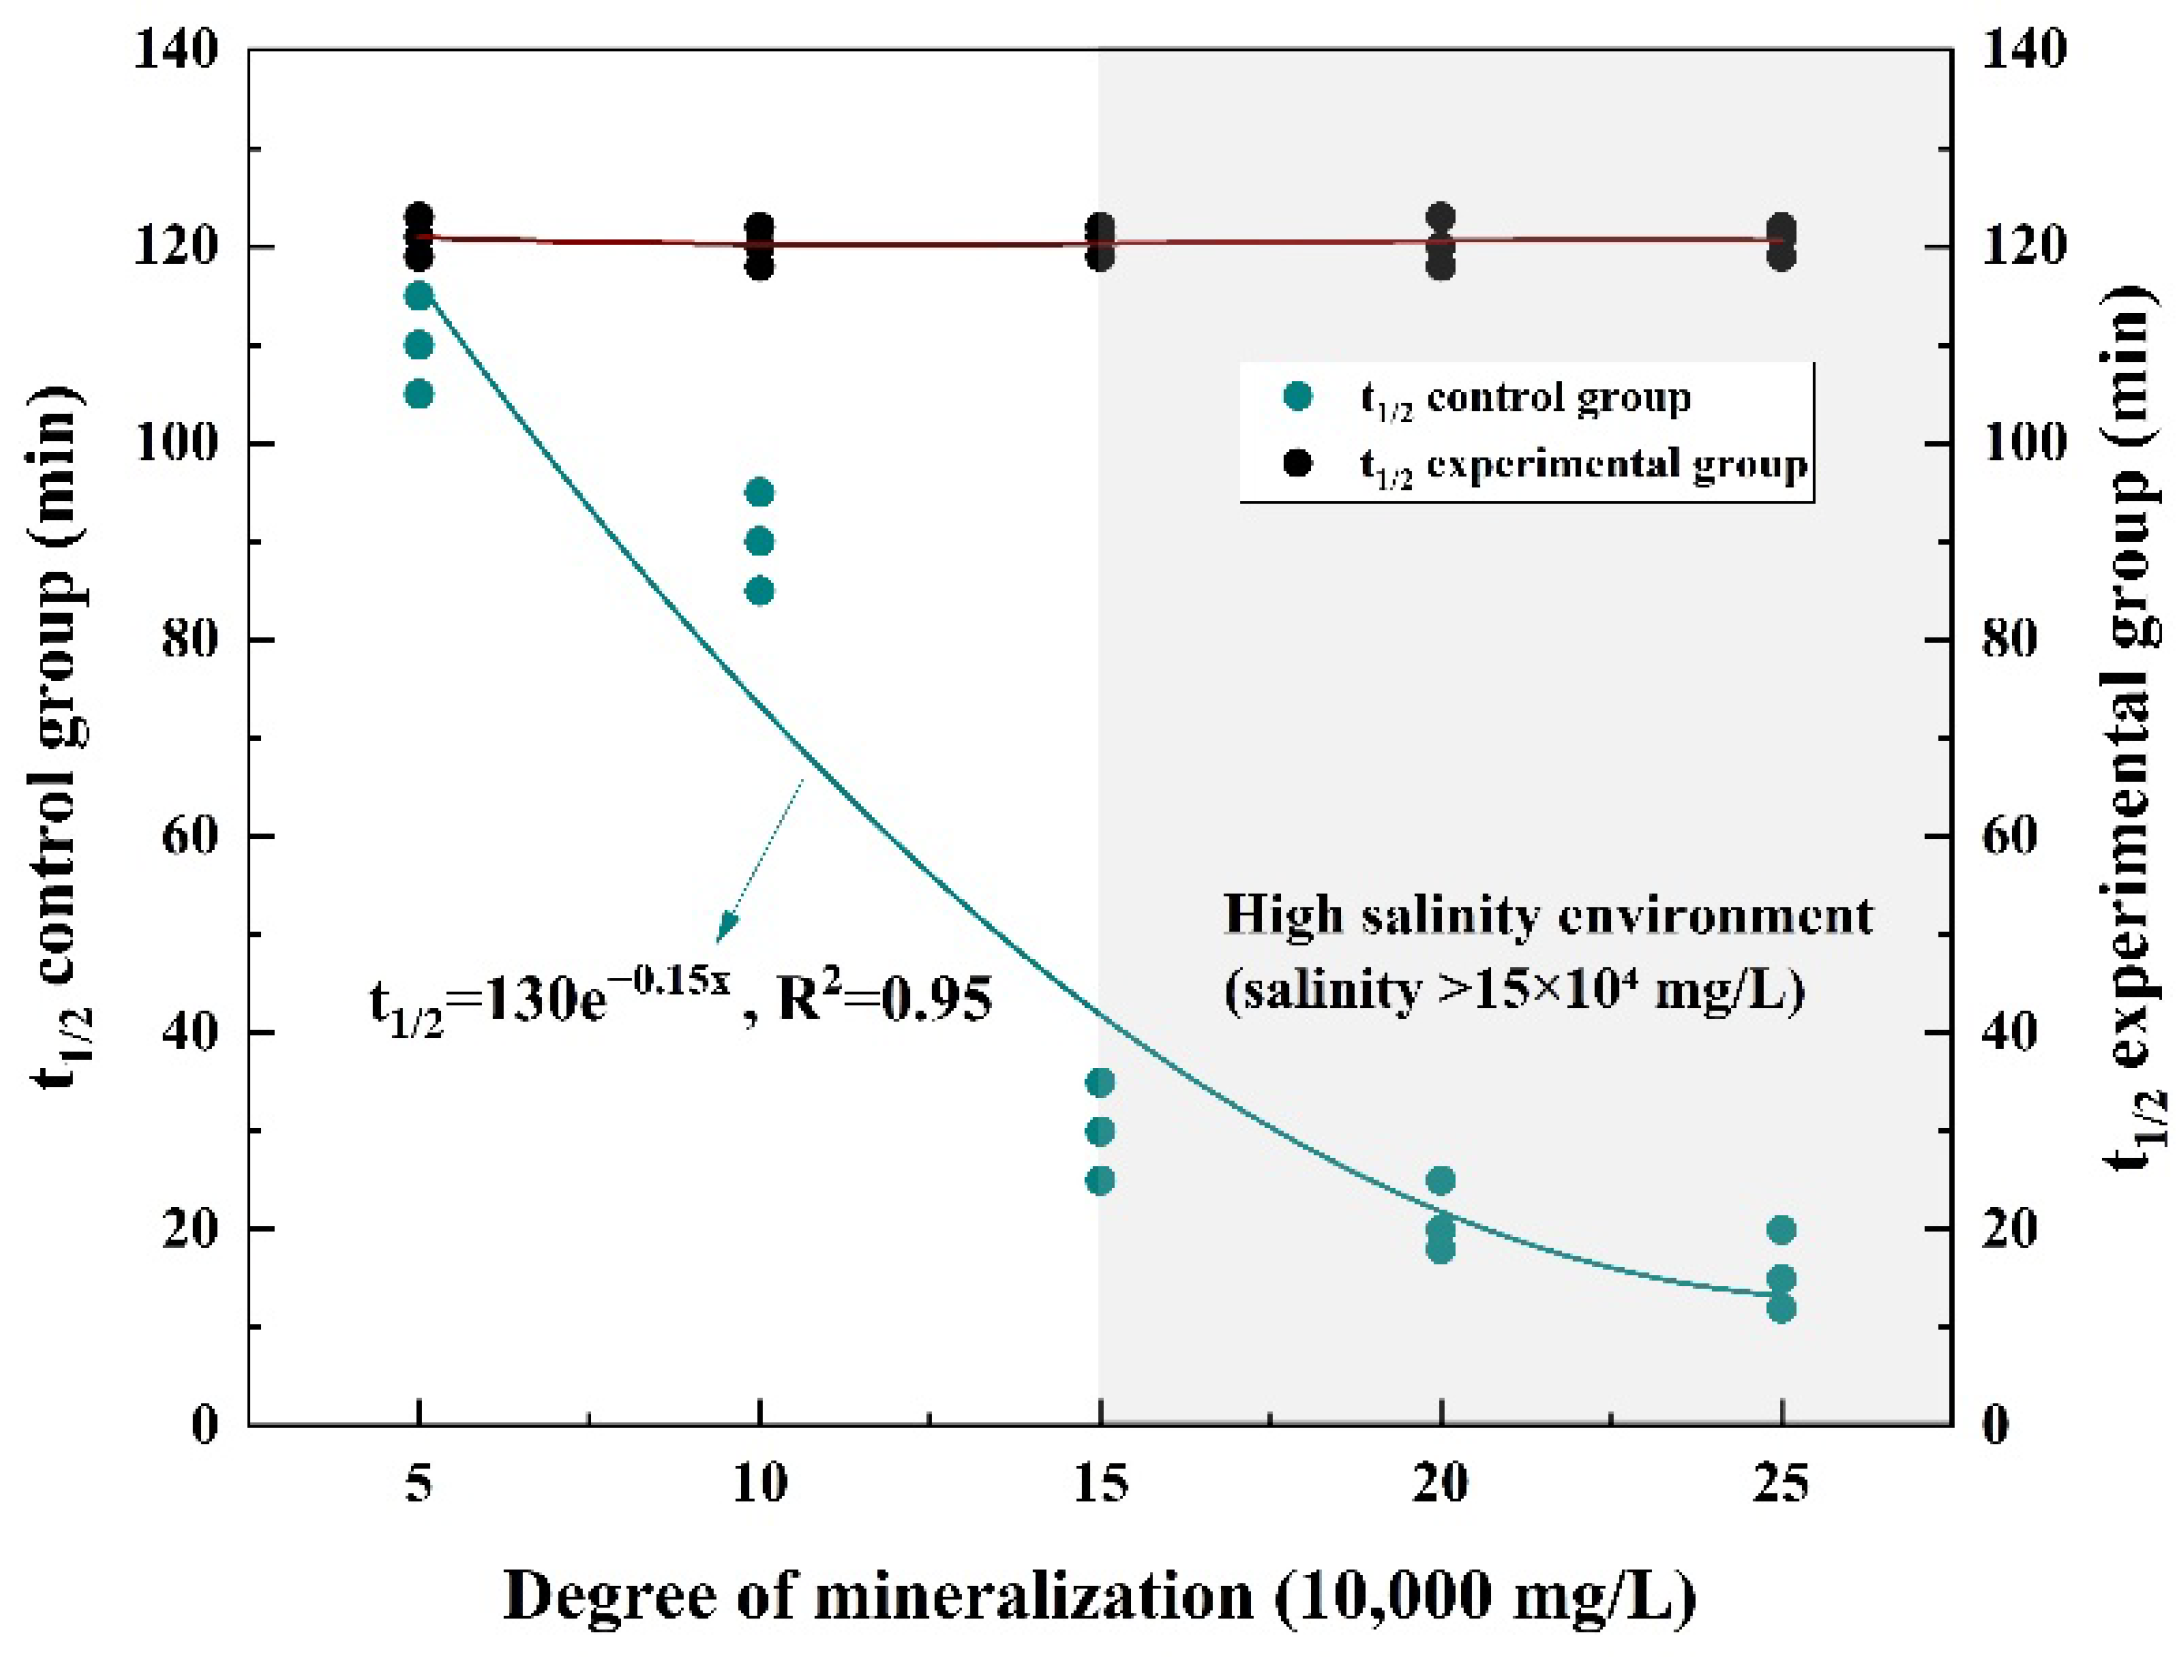
Figure 12.
Quantitative relationship between plugging strength and foam concentration and permeability level difference (R²=0.94).
Figure 12.
Quantitative relationship between plugging strength and foam concentration and permeability level difference (R²=0.94).
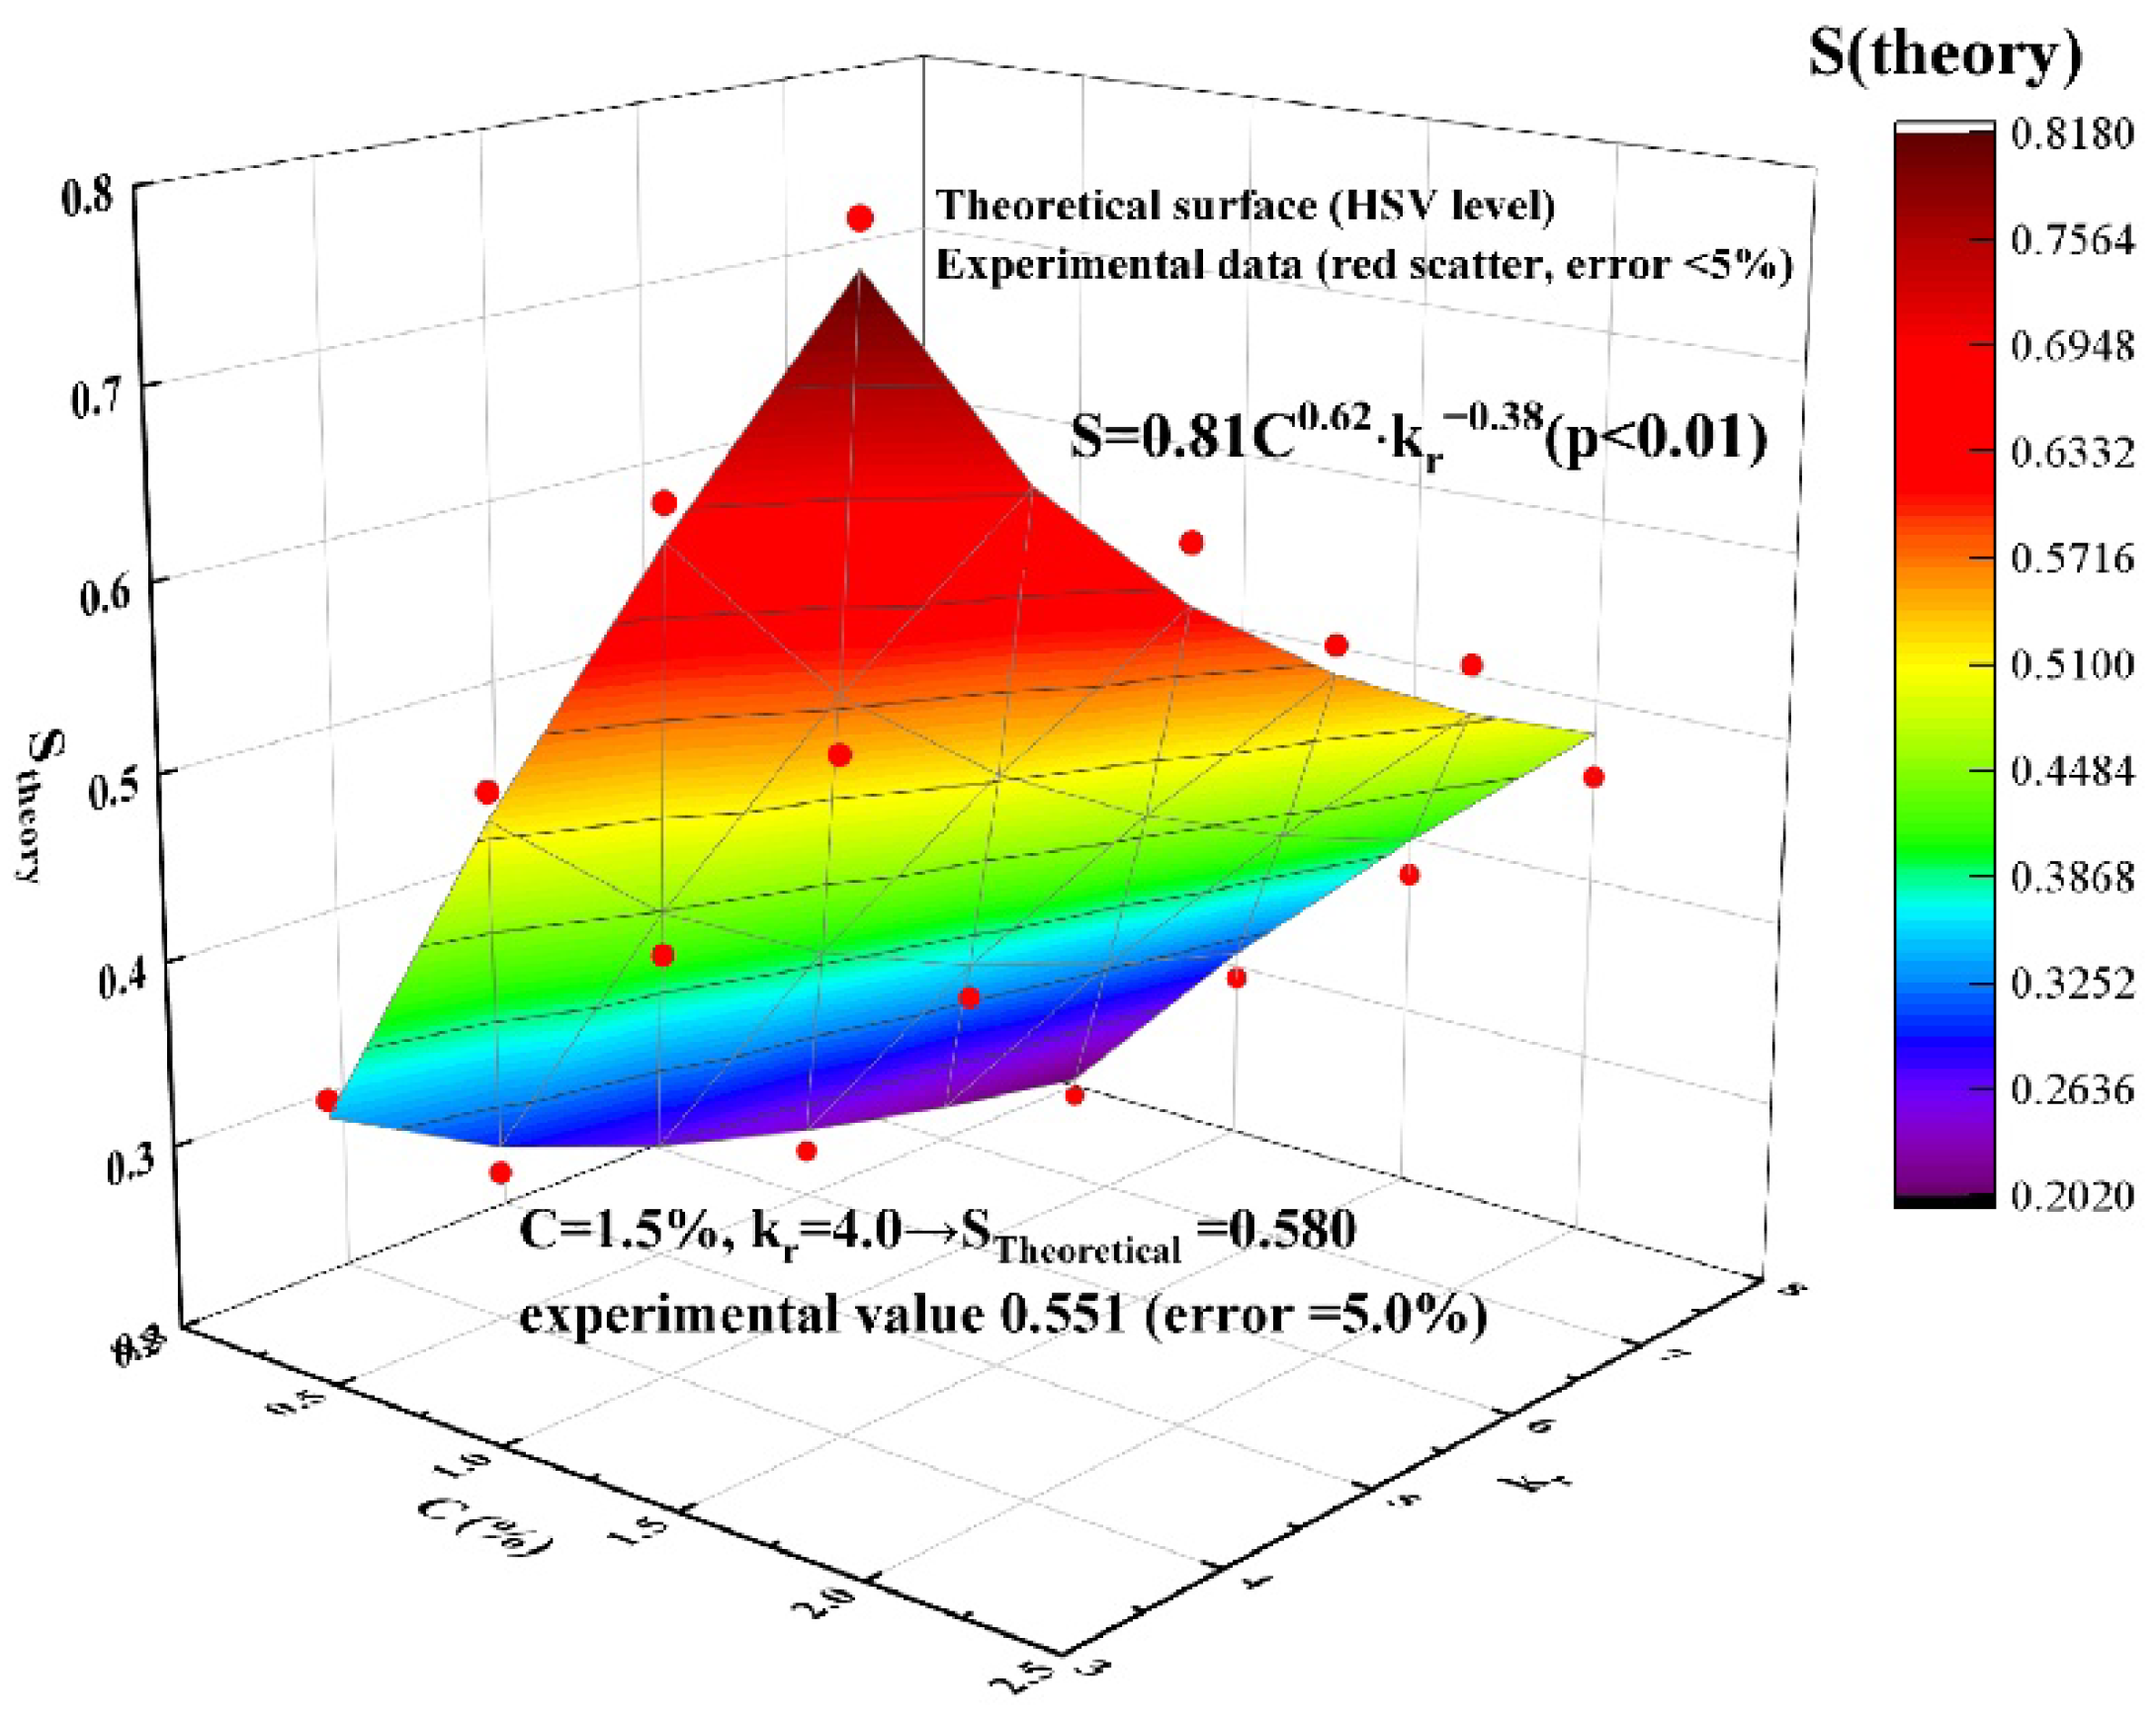
Figure 13.
Effects of GLR and injection rate on recovery efficiency under random forest optimization.
Figure 13.
Effects of GLR and injection rate on recovery efficiency under random forest optimization.
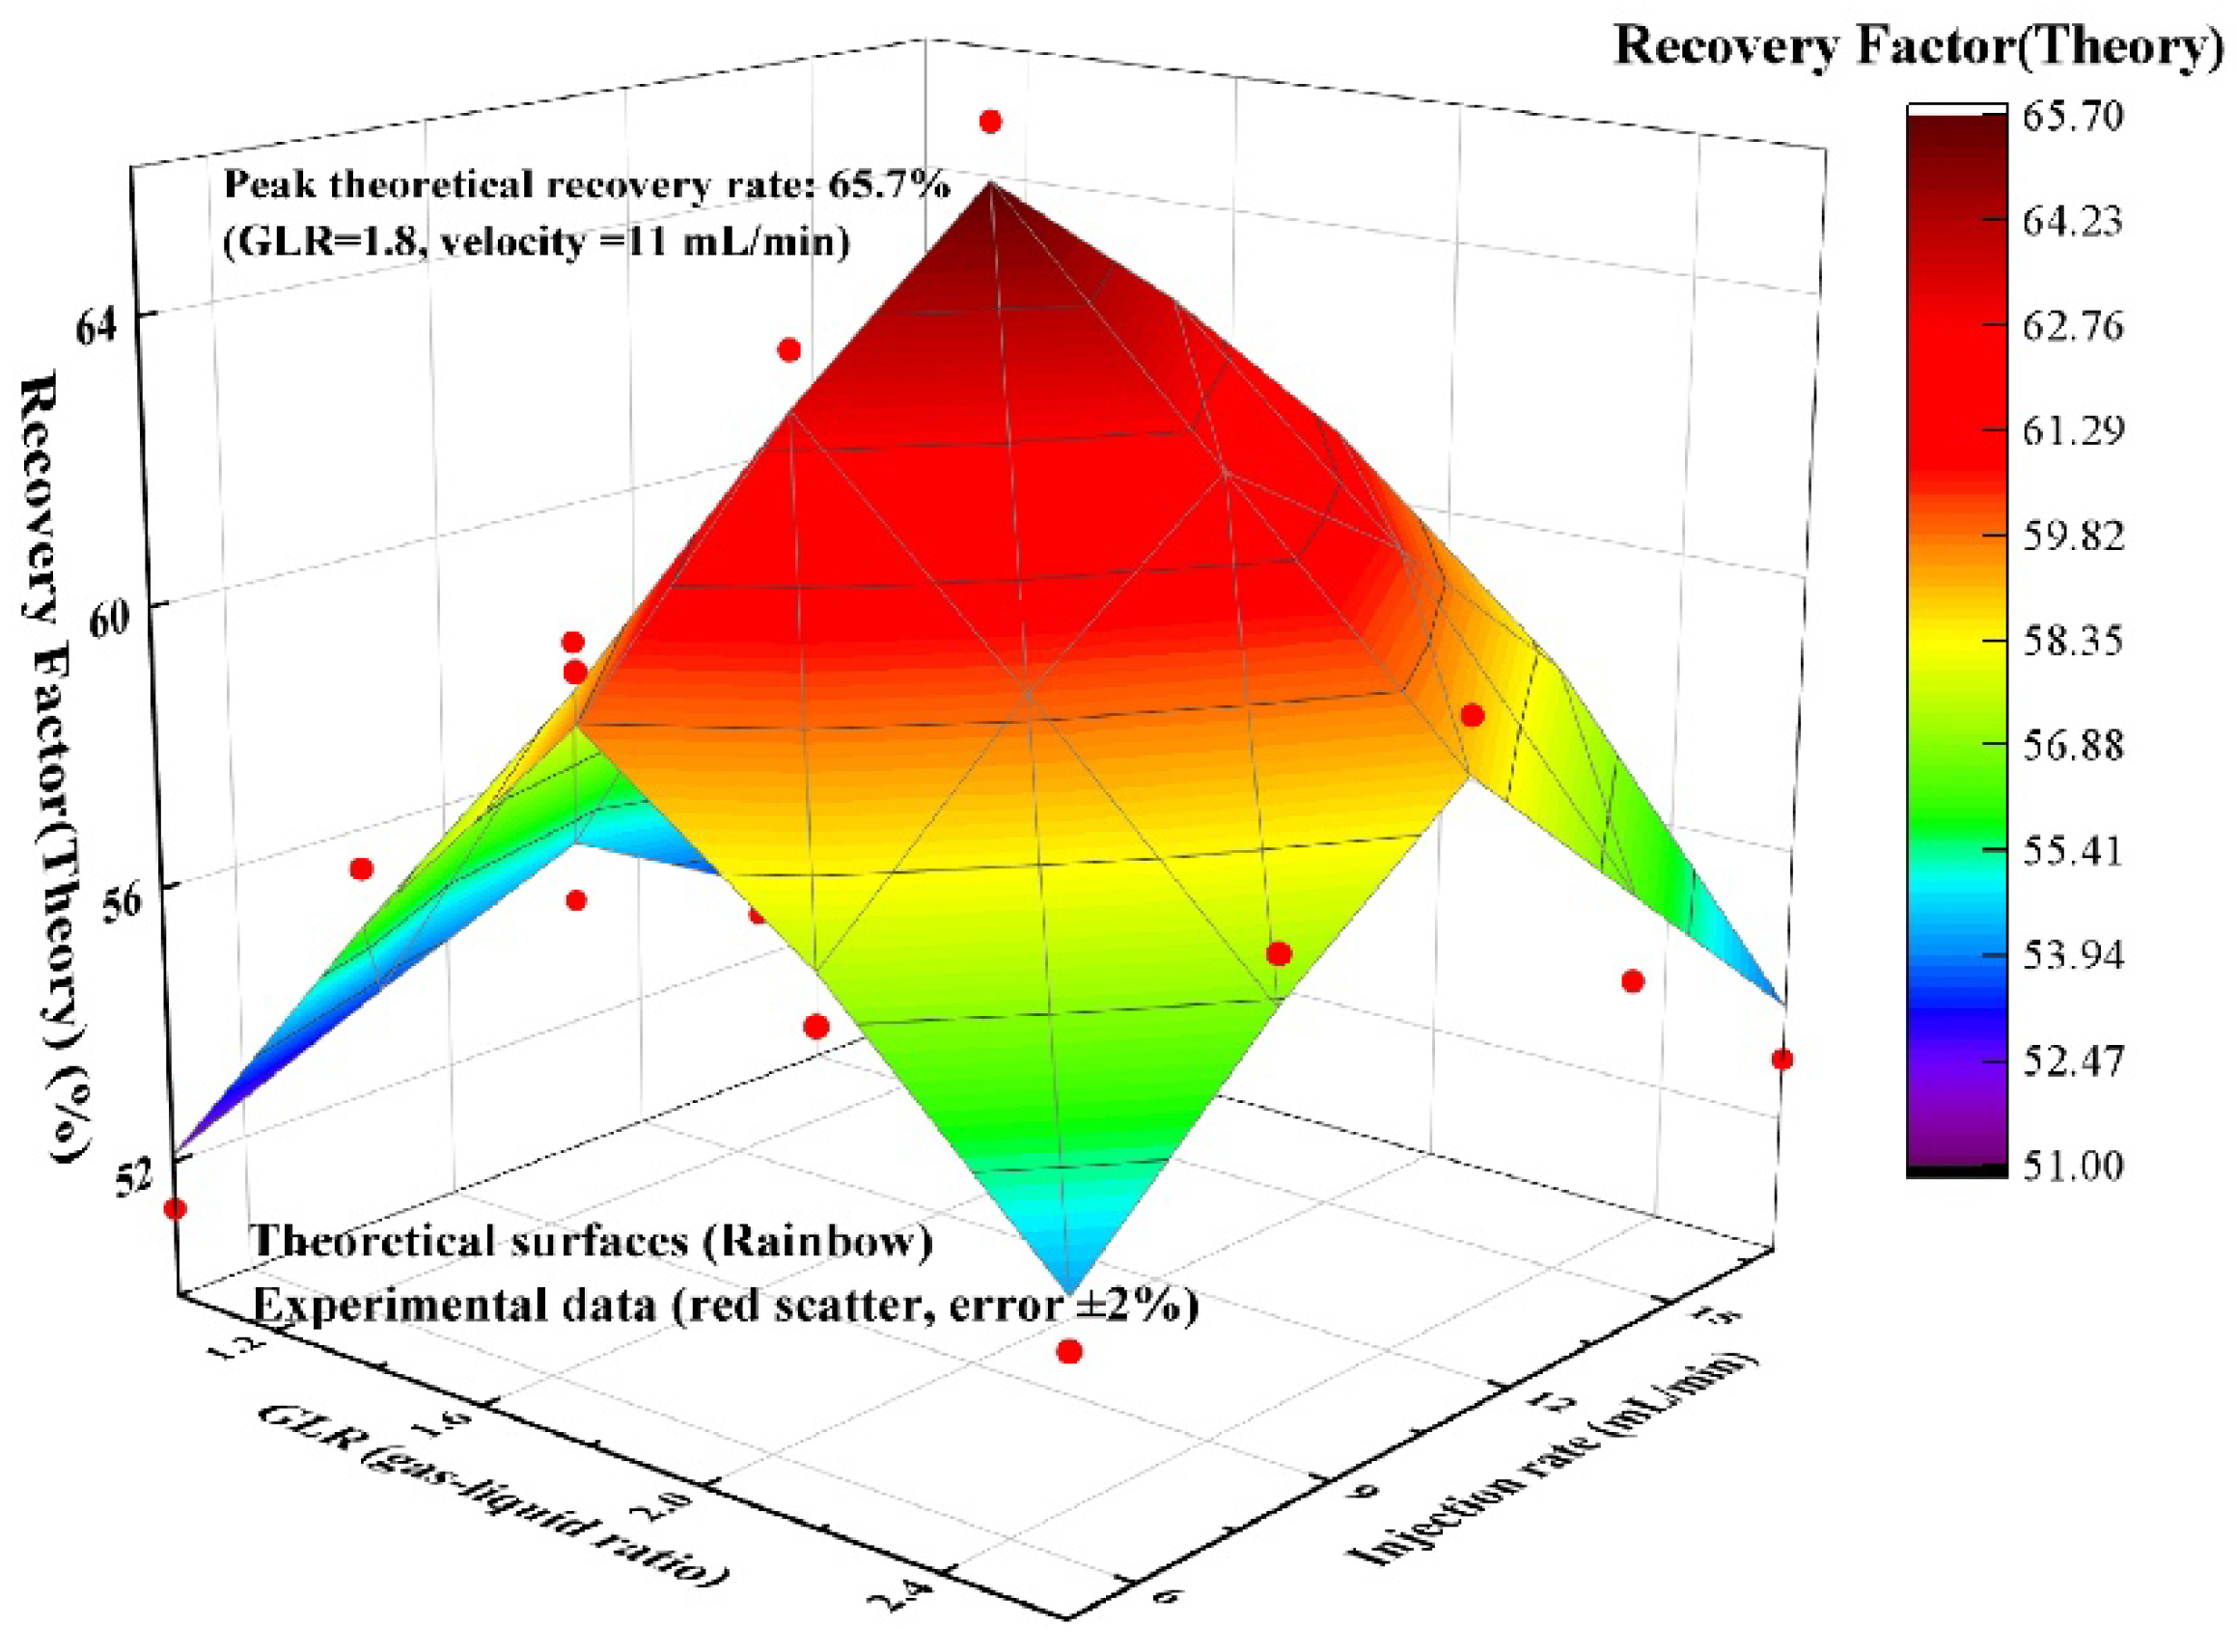
Table 1.
Sand-filled Model Parameters.
| Parameter | Value/Range |
|---|---|
| Model dimensions | 5 m × 1 m × 0.04 m |
| Sand grain size | 200 mesh |
| Permeability | 500–1000 mD |
| Compaction pressure | 25/27/29 MPa |
| Heterogeneity index | 0.65–0.75 |
Table 2.
Mineral Composition of Simulated Formation Water (mg/L).
| Na+、K+ | Ca2+ | Mg2+ | Cl- | SO42- | HCO3- |
| 53089 | 7416 | 1204 | 7400 | 1224 | 266 |
Table 3.
Comparison of Percolation Characteristics in High- and Low-Permeability Zones During Foam Flooding (GLR=2:1, slug size=0.4 PV, salinity=160,599 mg/L; n=3 unless noted).
Table 3.
Comparison of Percolation Characteristics in High- and Low-Permeability Zones During Foam Flooding (GLR=2:1, slug size=0.4 PV, salinity=160,599 mg/L; n=3 unless noted).
| Injection phase | Zone Type | ΔP (MPa, mean ± SD) | Oil Saturation (%) | Specific resistance (Ω·m) | Explanation |
|---|---|---|---|---|---|
| Pre-foam injection | Hypertonic region | 0 (baseline) | 72 ± 3 (n=5) | 150-200 | Initial state with high oil saturation in low-permeability zones |
| Foam injection | +2.5 ± 0.2 | <15 (estimated) | 50-80 | Foam-induced pressure surge diverts fluid to low-permeability zones | |
| Injection phase | Zone Type | ΔP (MPa, mean ± SD) | Oil Saturation (%) | Specific resistance (Ω·m) | Explanation |
| Pre-foam injection | Hypotonic zone | 0 (baseline) | 72 ± 3 (n=5) | 240-260 | High oil content in low-permeability zones due to preferential water channeling |
| Foam injection | +0.4 ± 0.1 | 35–42 (38.5±3.2, n=5) | 80-120 | Displacement fluid diversion activates trapped oil, reducing saturation |
Disclaimer/Publisher’s Note: The statements, opinions and data contained in all publications are solely those of the individual author(s) and contributor(s) and not of MDPI and/or the editor(s). MDPI and/or the editor(s) disclaim responsibility for any injury to people or property resulting from any ideas, methods, instructions or products referred to in the content. |
© 2025 by the authors. Licensee MDPI, Basel, Switzerland. This article is an open access article distributed under the terms and conditions of the Creative Commons Attribution (CC BY) license (http://creativecommons.org/licenses/by/4.0/).
Copyright: This open access article is published under a Creative Commons CC BY 4.0 license, which permit the free download, distribution, and reuse, provided that the author and preprint are cited in any reuse.


