Submitted:
19 June 2024
Posted:
21 June 2024
You are already at the latest version
Abstract
Although it’s been some forty years since we started to teach combined modified Fault Tree / Event Tree acyclic digraphs, as much simpler Bow Tie diagrams, their popularity seems undimmed; as their pictorial and focussed discussion prompts, fulfil a valuable function in the safe design and operation of hazardous plants and installations. An excellent review of the current state of the art and an authoritative treatise on the terminology and issues involved has been produced as an internationally recognised standard for using the approach. But just as this model has augmented and helped formalise previous pictorial tools, (such as “Dominoes” and holey “Cheese” slices), this paper suggests and sets out to show how we can build on even this current cornerstone of practice and augment its versatility; with the ability to obtain, what engineers rely on, some more quantitative insights from these pictures. “Layers Of Protection Analysis” (LOPA), has already demonstrated a way of pulling together more quantitative predictions from the pictures. This paper would go further and by concentrating on the function not the physicality of a barrier, outlines a methodology that can extend, not just the quantification ability of the LOPA extension, but present a much more holistic view of how the Barriers, as functions, need to work together, interact and interdepend; often in nonlinear, unexpected ways, to give system designers and operators a much clearer view of actual performance predictions.
Keywords:
Bow Ties and Barriers
; LOPA
; Risk and FRAM
Introduction
The Bowties and Barriers methodology is a risk management tool used primarily to visualize the risks associated with potentially hazardous activities. It’s a model that helps organizations understand and communicate various aspects of risk control strategies effectively. This visualisation supports making decisions on how to most effectively reduce or eliminate hazards and risk.
The Bowtie method originated in the 1970s, in Imperial Chemical Industries (ICI) (3) in the United Kingdom, (1). It was developed as a part of their attempt to improve their safety management and risk assessment practices, following several high-profile accidents; most notably the Flixborough Disaster in 1975. (2). This catastrophic chemical processing accident highlighted this need for better risk management practices generally. A case has been made for referencing the “Butterfly” cause-consequence diagrams of Nielsen (3), as the origin, but most people accept that the earliest mention of the bowtie methodology appears in the ICI Hazan Course Notes 1979, presented at The University of Queensland, Australia. (4). The methodology gained prominence, as it provided a simple, visual way of describing and analyzing the paths from potential hazards to resulting losses and the measures taken to prevent or mitigate these outcomes. Over the years, it has been refined and adopted by various industries, including aviation, mining, healthcare, and nuclear energy.
The Institute of Chemical Engineering has produced several publications, (5), aimed at bringing all these applications together into a definitive methodology, with recommended descriptions of terms and concepts employed by the most advanced users. This paper now draws very extensively on those publications, quoting verbatim definitions, specifications and classification of barriers and employs the figures they used to illustrate, not further confuse users with personal, or idiosyncratic treatment of these terms to demonstrate an unnecessary independence of thinking (or use of AI?).
The Complementary Methodologies
The Bow Ties and Barriers Method
The “standard” definitions of the terms used in the Bow Tie methodology, are set out blow exactly as defined in the I Chem E publication.
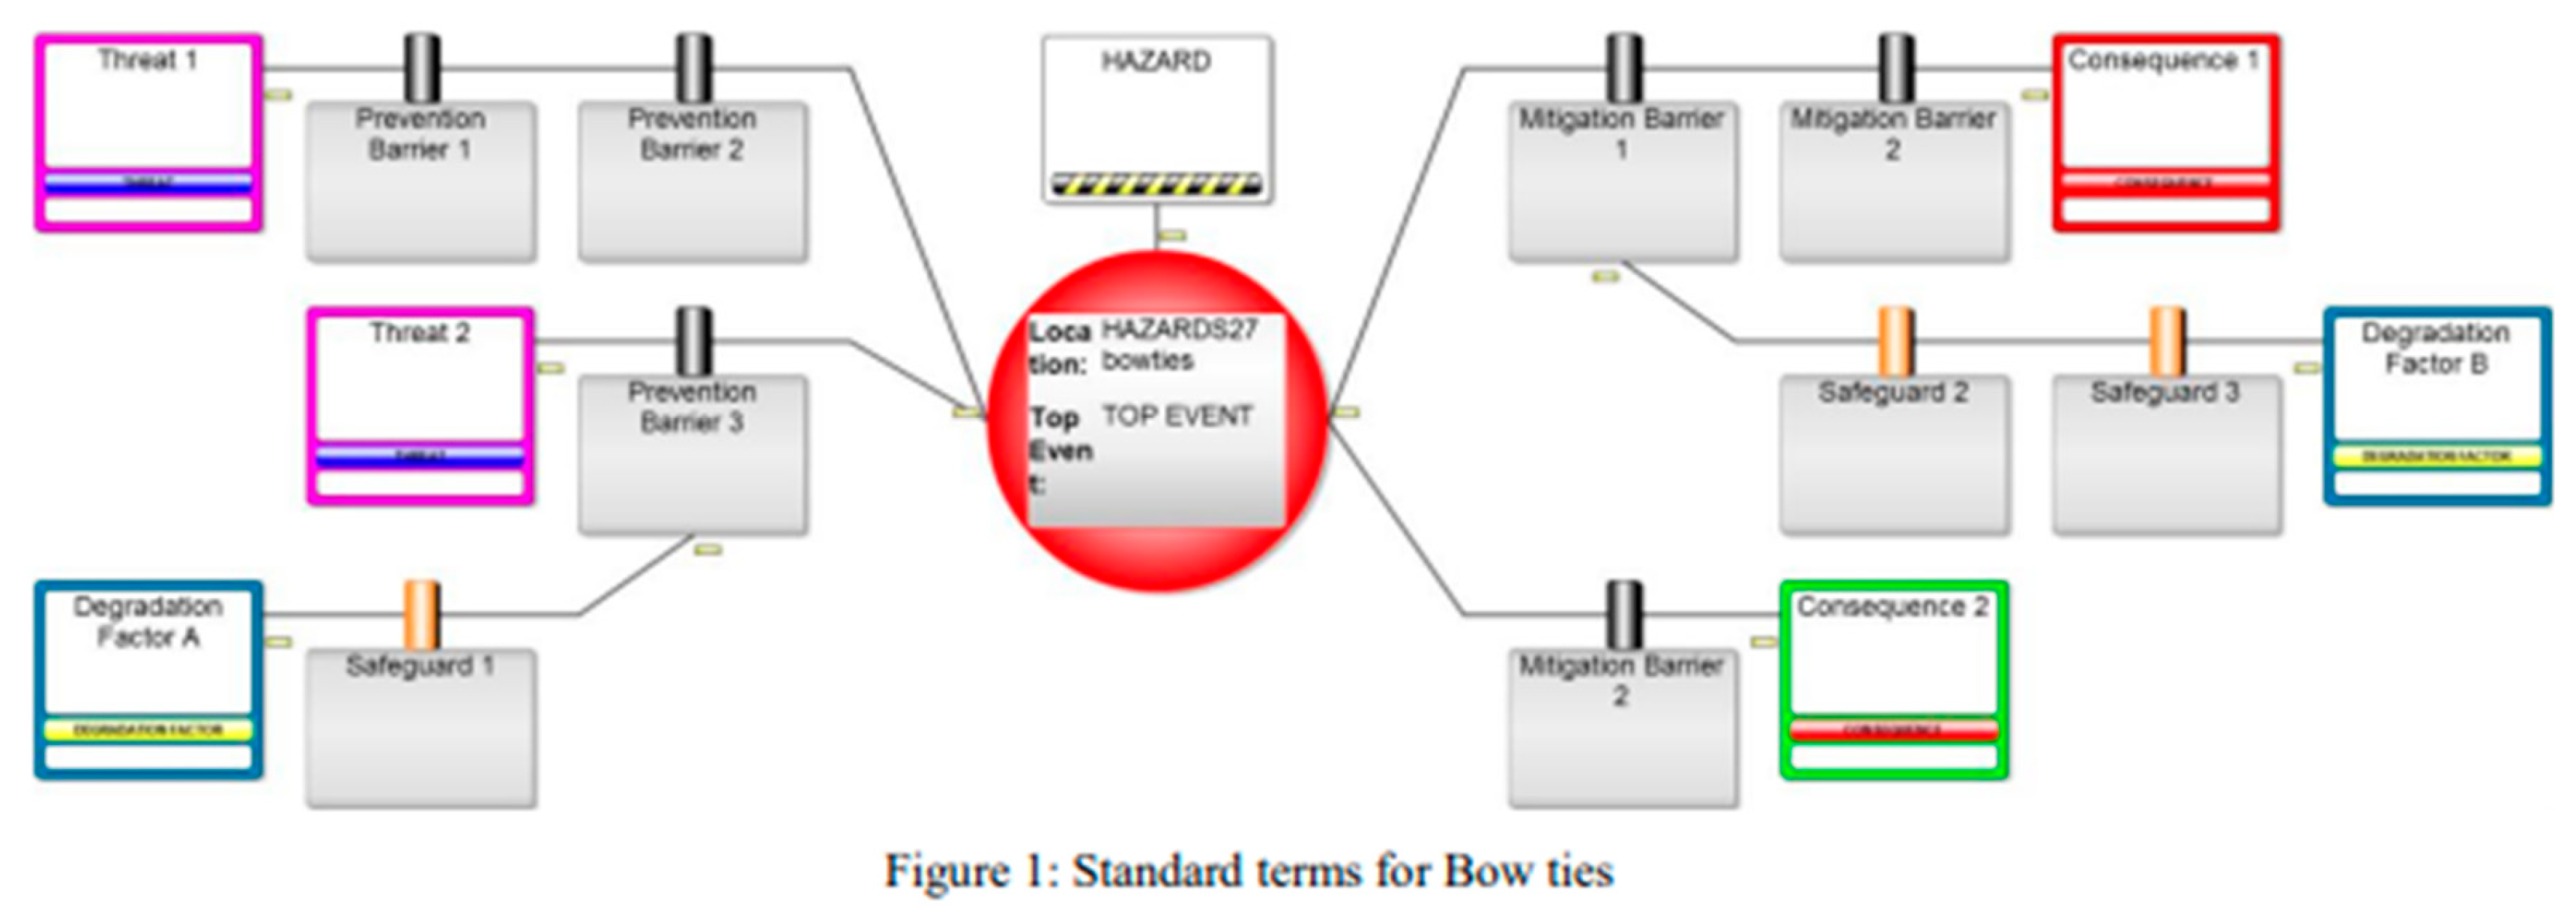
The Bowties method is visually represented by a diagram that looks like a bow tie, a simple way of describing and analyzing the risk management process. Here’s how it works:
- Hazard: At the centre of the bowtie, the hazard, or source of potential harm, is identified.
- Top Event: The diagram splits into two sections from a top event, that which causes the release of the hazard and that which occurs when a hazard is released and leads to consequences.
- Threats: On the left side, all the various threats that could cause the top event are listed.
- Consequences: On the right side, the potential adverse consequences of the top event are detailed.
- Barriers: What makes the bowtie method unique are the barriers placed on both sides of the top event—preventive barriers on the left to stop the hazard from leading to the top event, and mitigative barriers on the right to reduce the consequences of the top event.
Current Uses
The Bowtie method is used extensively for communicating complex risk scenarios in a straightforward and visual manner to all levels of an organization. It helps in identifying and implementing effective control measures and provides a framework for decision-making in safety management systems.
Organizations use bowtie analysis to demonstrate compliance with safety regulations and standards. It also serves as a useful tool during safety audits. The Bowties and Barriers methodology continues to evolve as it adapts to new industries and technologies, making it a dynamic tool in the field of risk management.”
The Functional Resonance Analysis Method (FRAM)
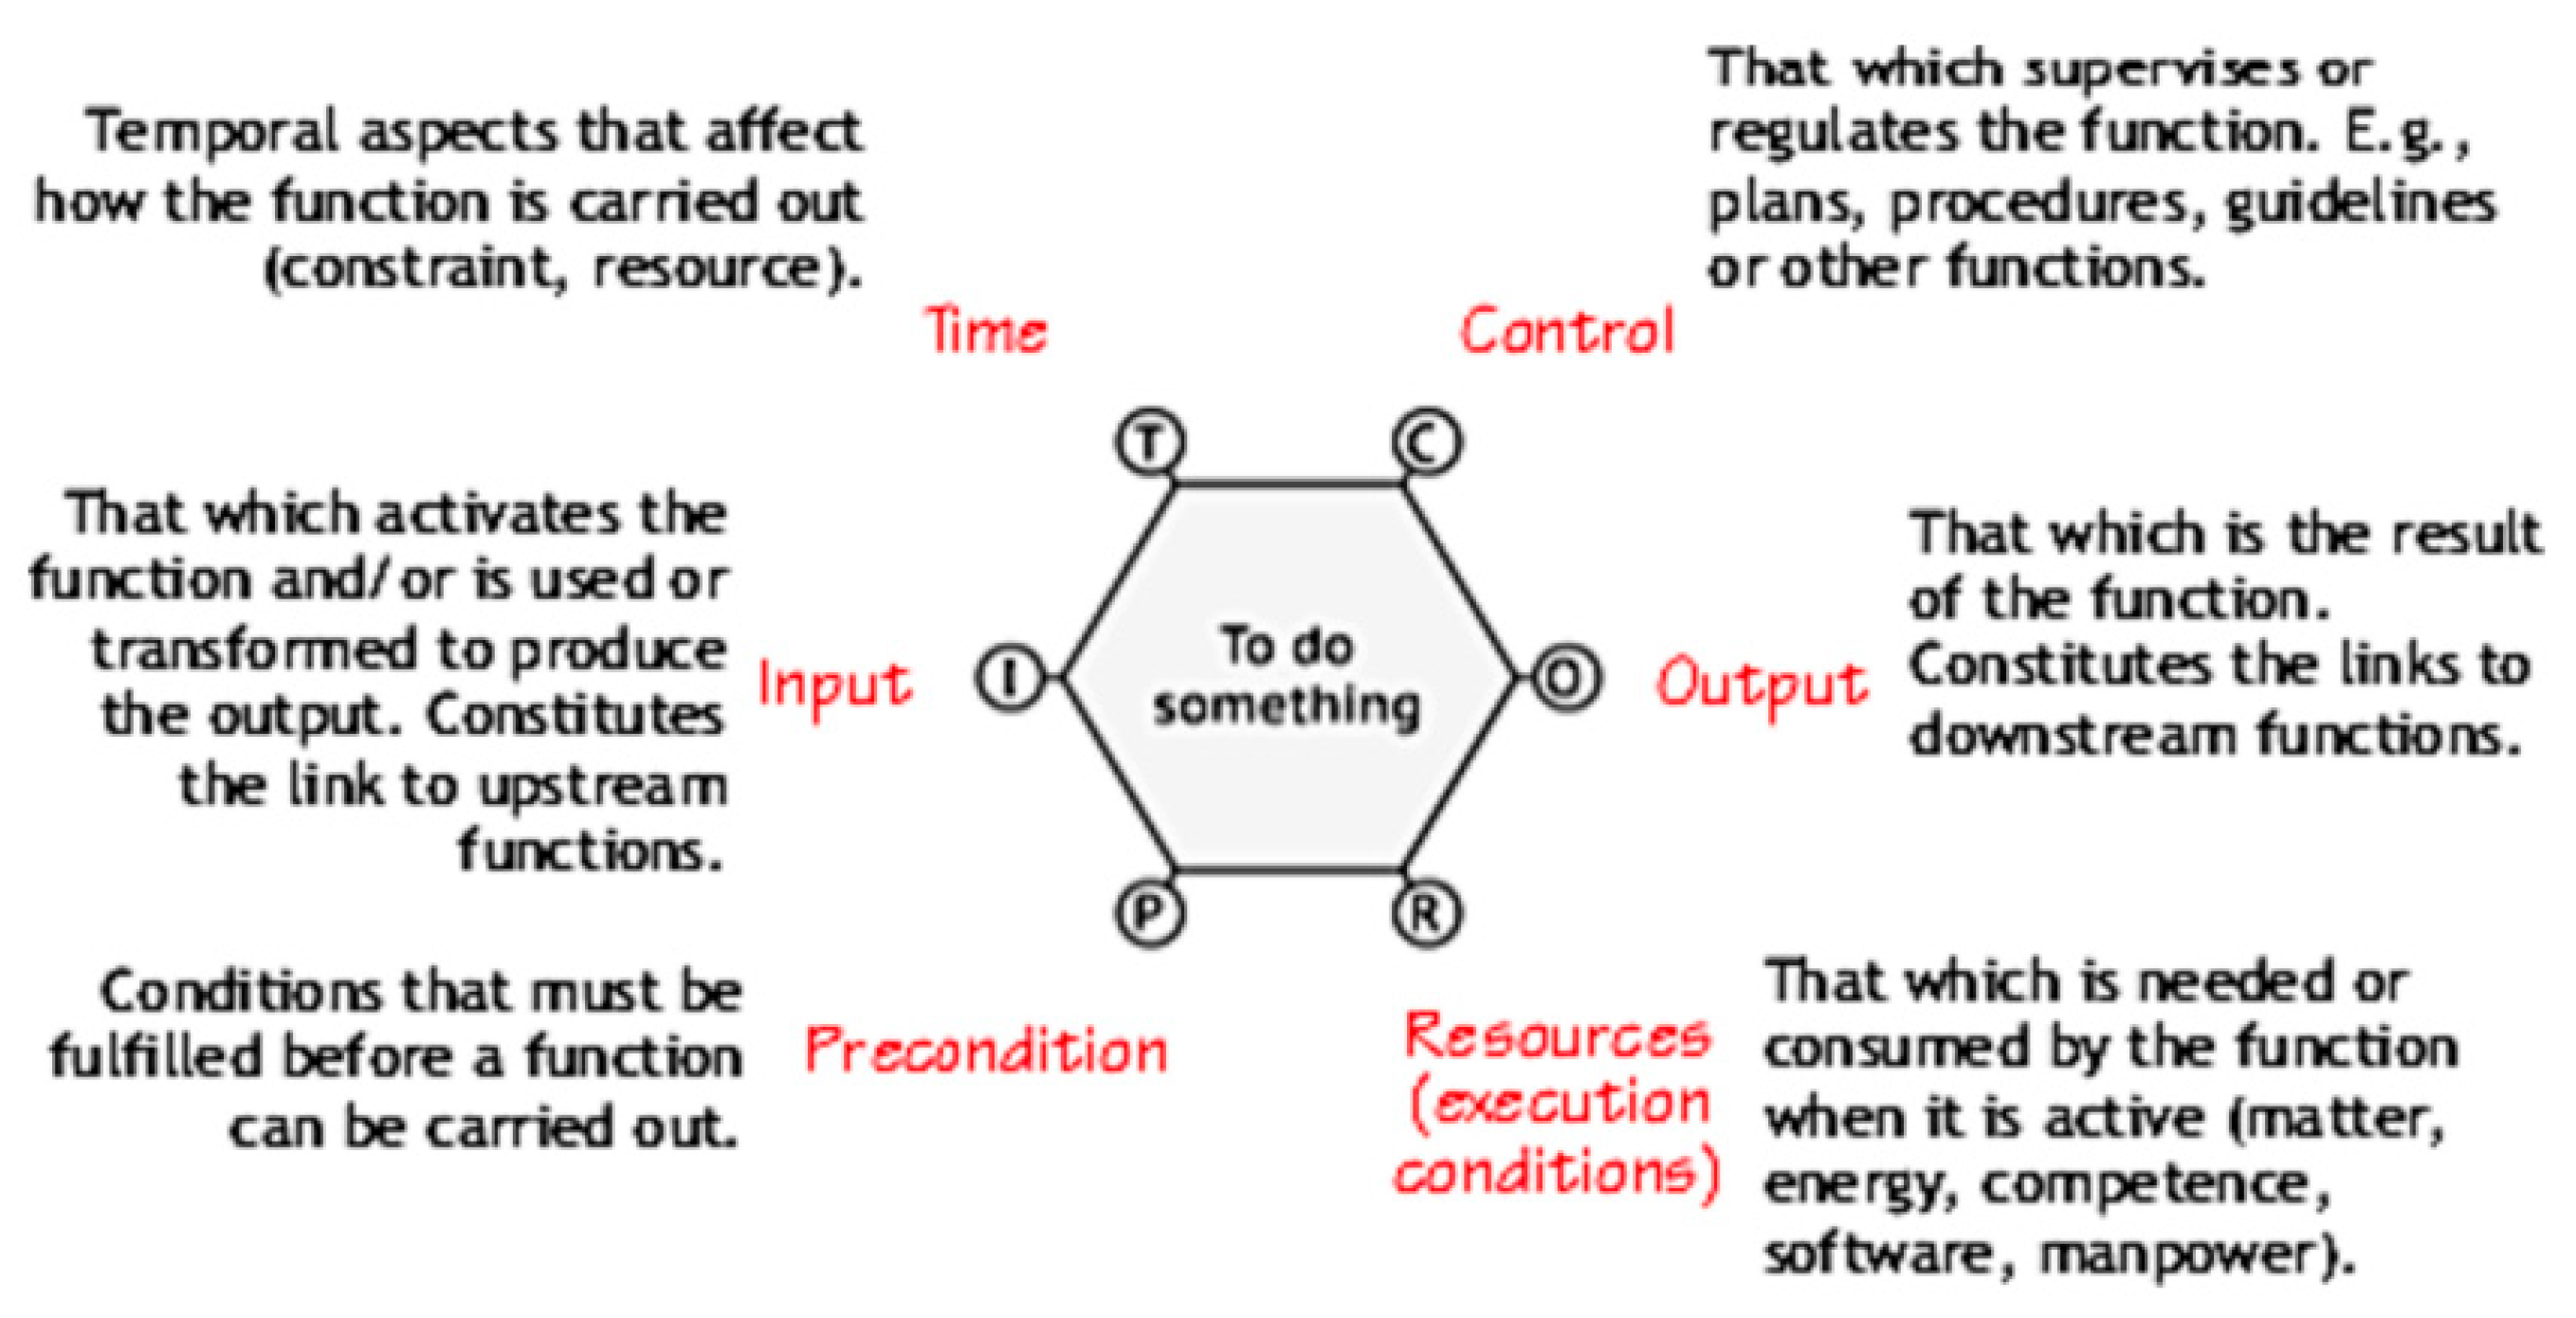
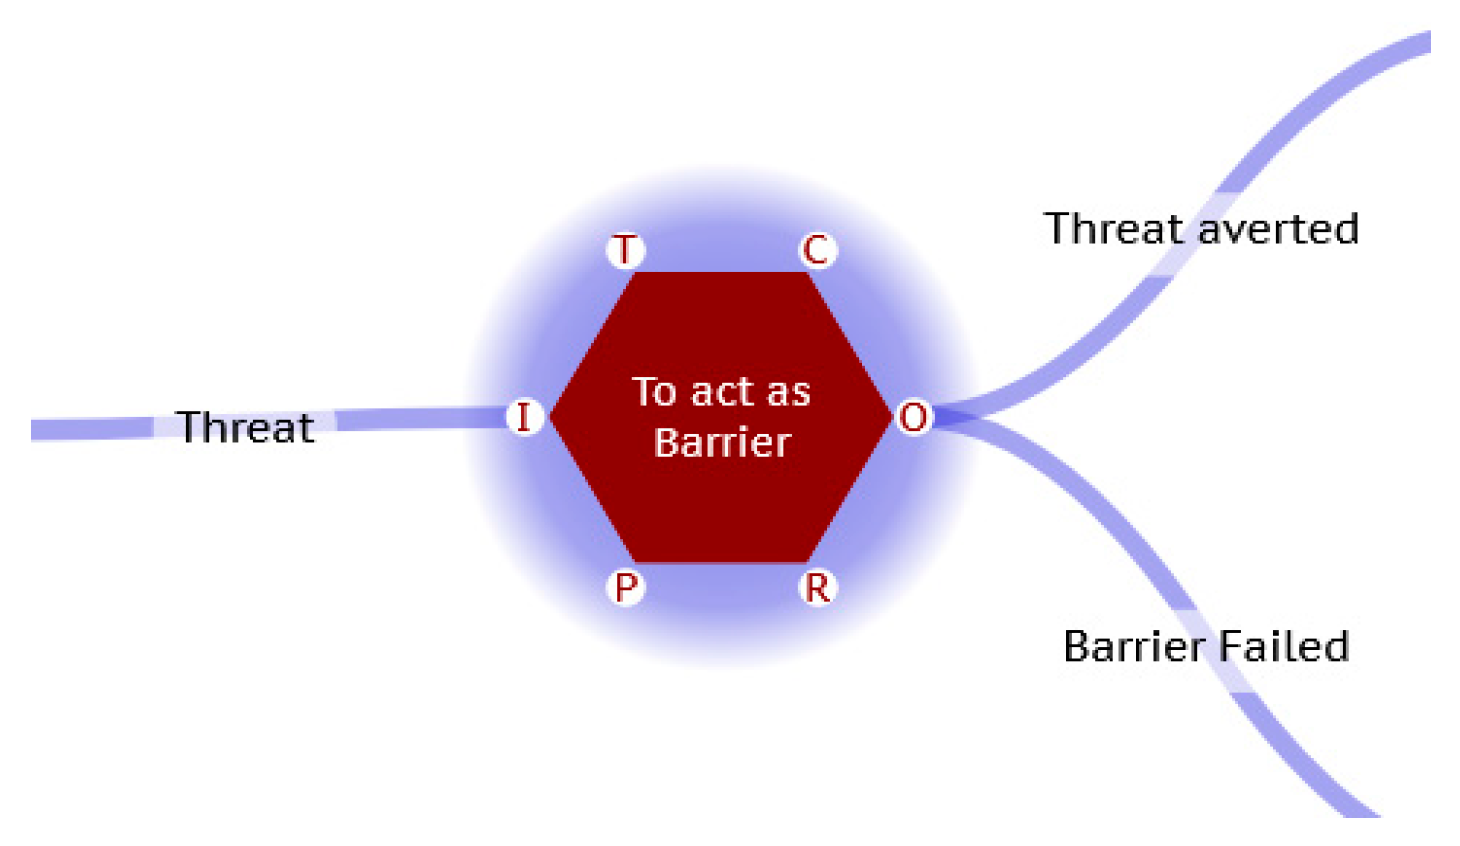
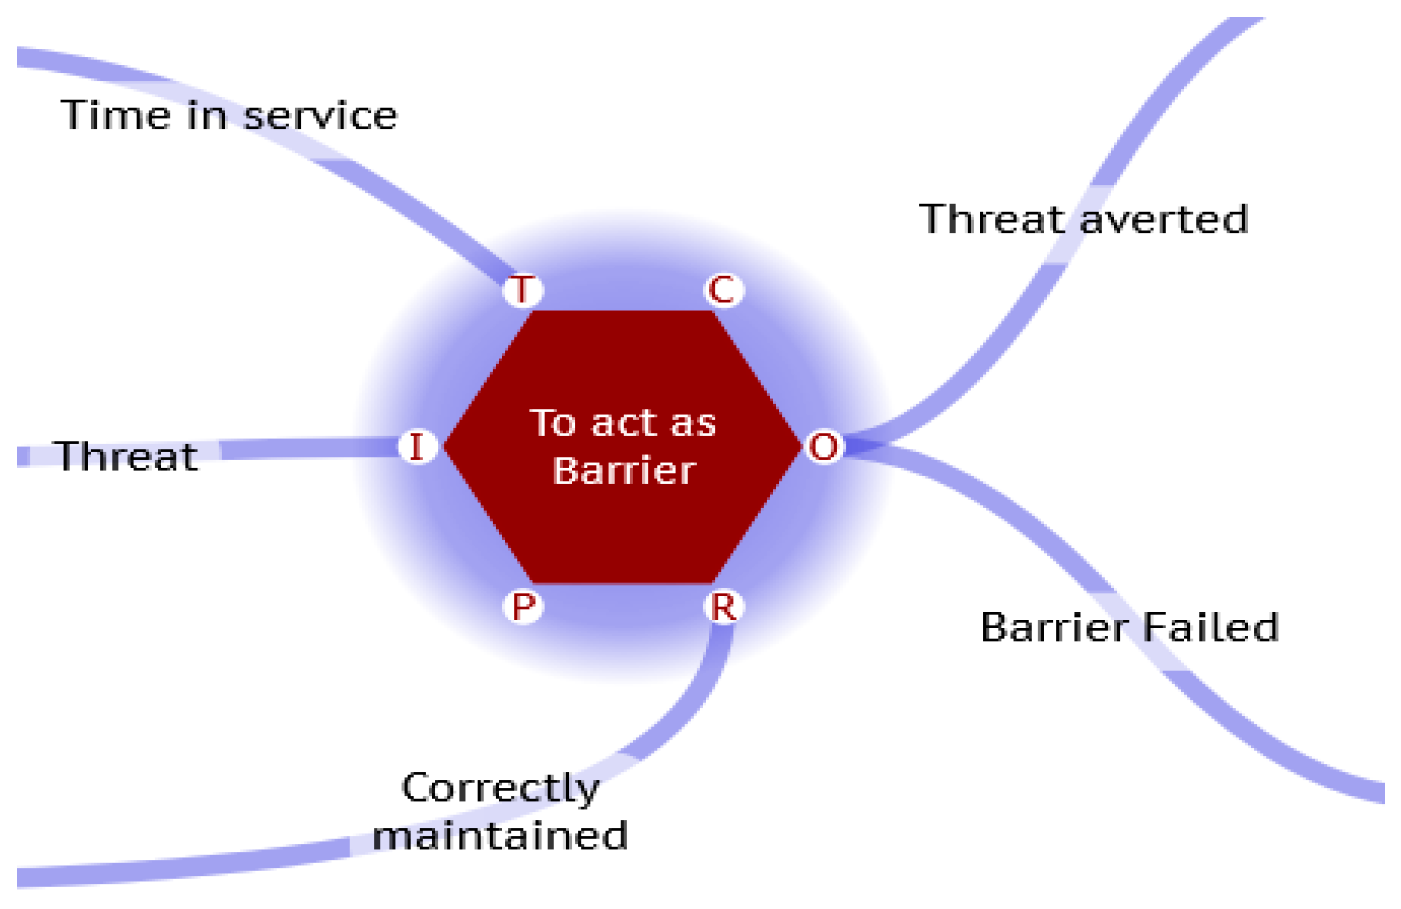
The Functional Resonance Analysis Method (FRAM), (6), is a systems analysis approach used to study complex processes and systems. It focuses on understanding how everyday variability in normal work activities can lead to unexpected outcomes, both positive and negative. Unlike traditional safety assessment tools that often assume a linear cause-and-effect relationship, FRAM acknowledges that in complex systems, outcomes are the result of multiple, interconnected variables interacting in non-linear ways. The method involves identifying and modeling the functions within the system, which are anything that contributes to the system’s operation (like tasks, actions, or processes). Each function is characterized by six aspects:
- Input: What each function requires to start.
- Output: What each function produces.
- Precondition: What must already be in place or true for the function to occur.
- Time: When the function occurs or its duration.
- Resource: What is needed to carry out the function.
- Control: How the function is regulated or constrained.
Figure 2.
– The FRAM “Function”.
By mapping out these functions and their interdependencies, FRAM helps identify potential points of resonance, where the variability in one function can amplify or dampen the effects in another, leading to emergent outcomes. This model assists engineers and managers in visualizing potential risks in operational systems and designing more resilient and adaptable systems. It offers a way to analyze complex systems and processes by focusing on the variability of everyday performance and how it can lead to system failures or successes. Unlike the Bowtie methodology, which tends to focus on linear cause-and-effect relationships and predefined hazardous events, FRAM examines the complexity and interdependence of functions within a system, acknowledging that outcomes are emergent rather than deterministic.
Integrating FRAM with the Bowtie Methodology
Bowtie barriers are designed and provided to carry out a specific preventative, or mitigating function, and so their interconnections can be modelled as a system of these functions. Thus, each barrier in a Bowtie diagram can be viewed as a separate function in a FRAM system model.
In FRAM, these functions are not static barriers, but rather enable dynamic processes that can vary. For instance, a preventive barrier such as an alarm system can be translated into a FRAM function that involves detecting anomalies, alerting personnel, and initiating a response.
FRAM focuses on how functions can vary and how this variability can affect other functions. Each function’s performance in the FRAM model can depend on multiple factors such as time of day, preceding events, or the physical and mental state of the personnel involved. For example, the effectiveness of the alarm system (a function) might vary depending on maintenance schedules (another function) and operator alertness (another function).
In FRAM, the emphasis is on the interdependencies among functions. This aspect can be used to analyze how barriers are interconnected within a Bowtie diagram. For instance, the failure of one preventive barrier might increase the load on another barrier or change the way a mitigative barrier needs to function.
The integration of Bowtie and FRAM approaches can allow for modeling of emergent outcomes, where the interaction between barriers (functions in FRAM) leads to outcomes that are not predictable from the individual barrier performance alone. This is particularly useful in complex environments where simple cause-and-effect relationships do not adequately describe the reality.
By integrating FRAM modelling into a Bowtie visualisation, organizations can gain a deeper understanding of how variations in the performance of their safety barriers can influence risk scenarios, leading to more robust risk management strategies.
It encourages a more dynamic approach to safety management, where the focus is on managing the functions and their variability, rather than just ensuring compliance with static barrier robustness.
This approach can enhance system resilience by allowing safety systems to adapt to changes and unexpected conditions, as it provides insights into how different functions interact and affect each other.
Implementation Challenges
However, integrating FRAM with the Bowtie methodology can be challenging, due to the conceptual differences between the two approaches. Bowtie is straightforward and deterministic, making it easy to communicate and understand, while FRAM is more complex and requires a deeper analysis of system dynamics and interdependencies.
Dual FRAM Models Needed?
Looking at the safety systems represented by the Bow Tie, they have two distinct purposes. One is to avoid the occurrence of the Top event and the second, the preventative system, is there to mitigate the potential consequences of the top event happening. The Bow tie can thus be modelled as two contiguous joined up FRAM instantiations.
So, The FRAM model could be used to visualise the system of barriers that it is designed to avoid the top event; and further, to continue on to model the development of an incident - the top event having been realised - to model the effects and outcomes of failures of the mitigating barriers, as in an event tree approach.
We show in this paper that the Functional Resonance Analysis Method (FRAM) (7) is indeed, versatile enough to be applied in both the scenarios: before and after a top event, as typically visualized in a Bowtie diagram.
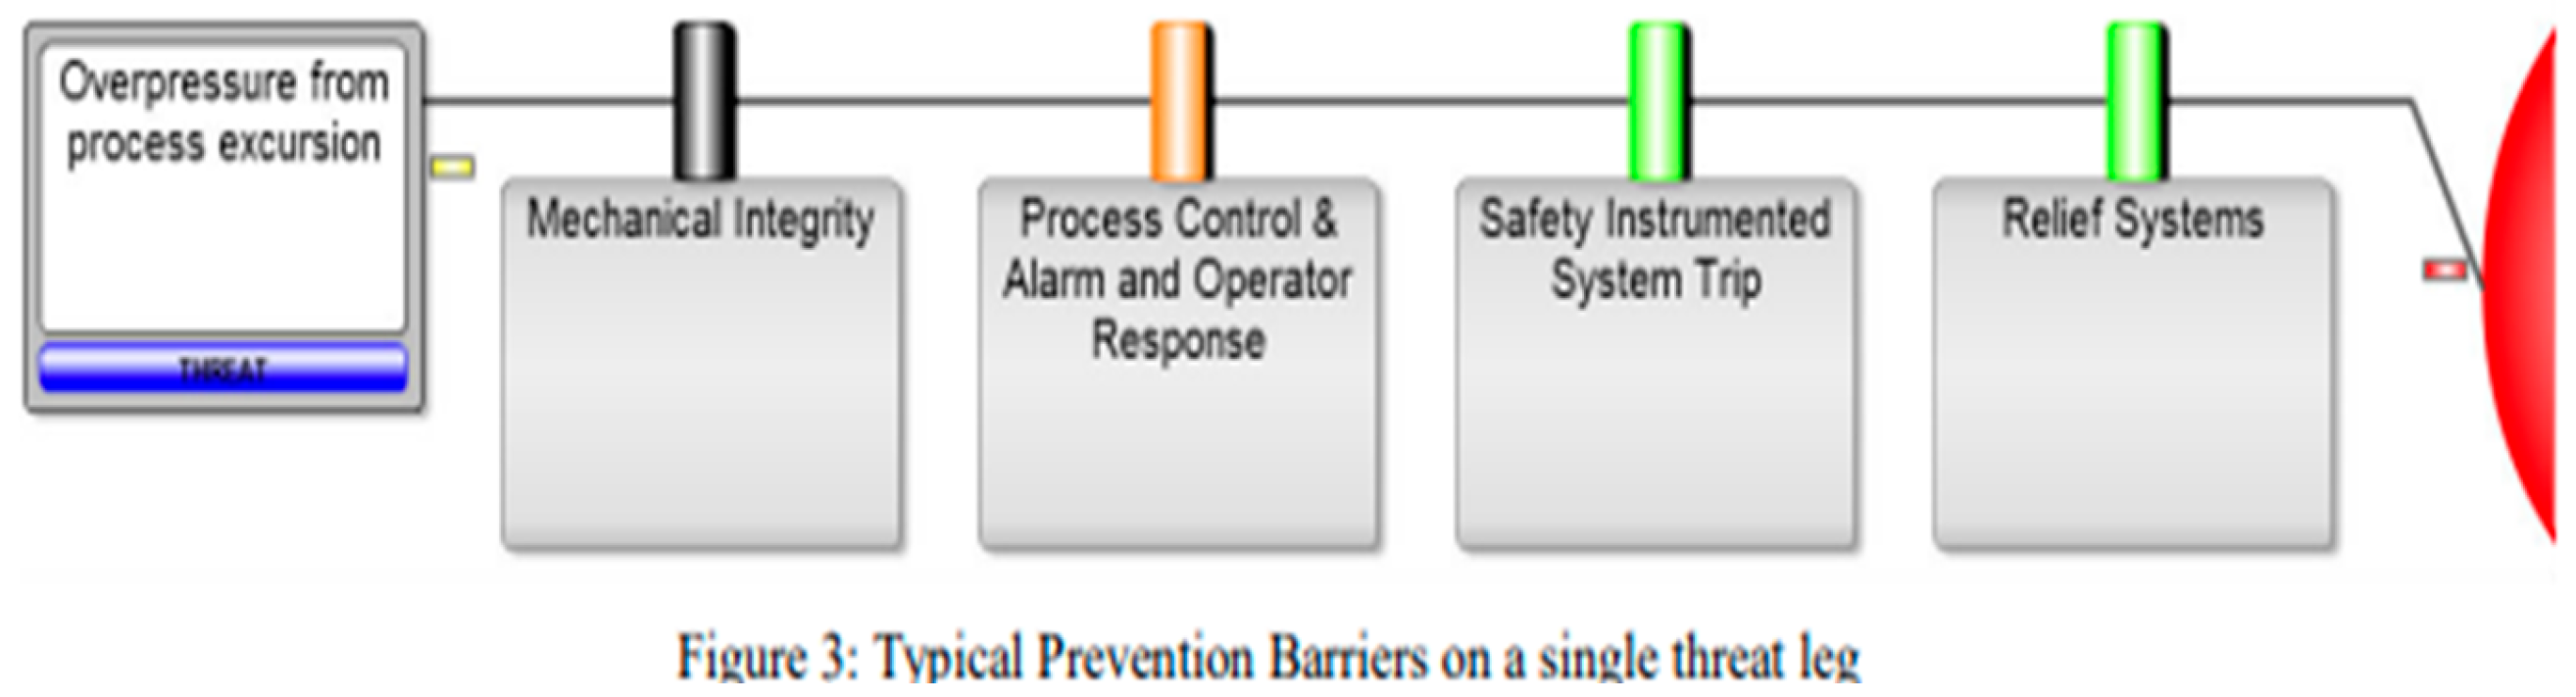
Pre-Event FRAM Model: Visualizing Barrier Systems
In the phase before the top event, FRAM can be used to visualize and analyze the interactions and variability of functions (barriers in Bowtie terms) that are intended to prevent the top event. This involves identifying and modeling each function associated with barriers, including:
- Inputs: What each function requires to operate effectively (e.g., information, physical conditions).
- Outputs: The result or action that comes from the function’s operation.
- Preconditions: Conditions that must be present for a function to perform as intended.
- Resources: Resources needed for the function to operate (e.g., manpower, technology).
- Time: Time-related aspects that affect the function.
This model helps to assess the resilience of preventive measures and to understand how variability in one function might affect others, potentially leading to the top event.
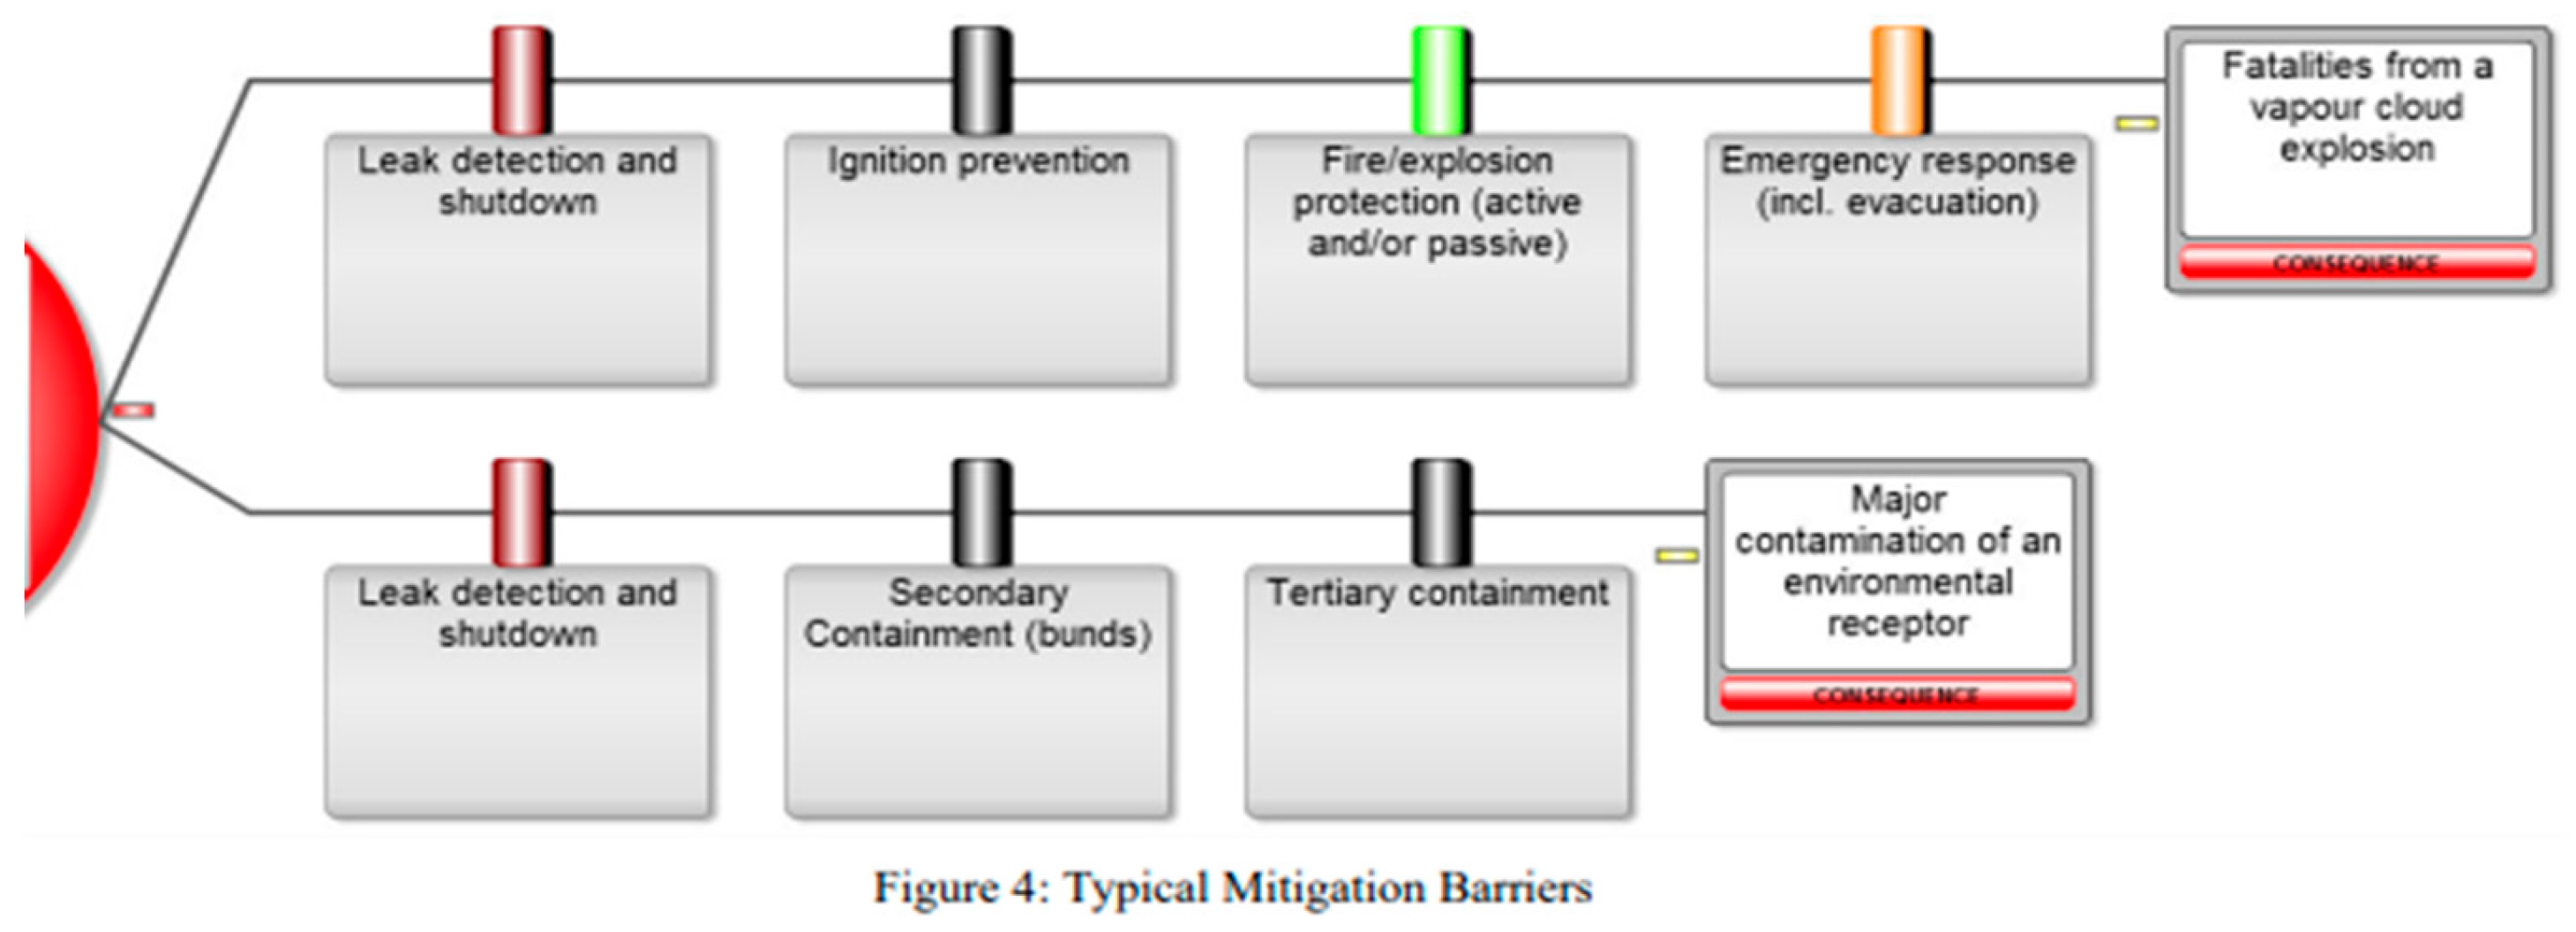
Post-Event FRAM Model: Modeling Incident Development
Once the top event has occurred, the model can be further developed to analyze the sequence of events following the top event, akin to an event tree in traditional risk assessment methods. This model would focus on Mitigative Functions. Here, the focus is on how these functions attempt to control, reduce, or manage the consequences of the top event.
Like the pre-event model, the emphasis would be on how these mitigative functions interact and depend on each other. Variability in one function can significantly influence the effectiveness of others, which might either exacerbate or mitigate the consequences.
This approach allows for the identification of emergent outcomes based on the interaction between functions, providing a more comprehensive view of potential scenarios following a top event.
Using FRAM for both pre- and post-top event scenarios offers a more holistic view of an organization’s risk landscape, capturing both preventive and reactive dimensions of safety management. It recognizes and models the dynamic and complex nature of systems where changes in one part can affect others in unpredictable ways.
Modelling the Barriers
So, to model these Barriers, first we need to define what they are and what are the characteristics of their operation.
Bow Tie Barriers, come in different shapes and sizes, depending on their intent and mode of action. (These definitions are again taken verbatim from the I. Chem E paper (5), for consistency).
“‘Prevention barriers’ on the left-hand side of the bow tie are used to stop the risk event. They sit between the threat and the top event on the bow tie.
‘Mitigation barriers’ on the right-hand side of the bow tie are used to stop, or significantly reduce, the severity of the potential consequences. They sit between the top event and the consequences on the bow tie. Each barrier has to be ‘effective, independent and auditable’. They must have the capacity to completely stop the threat from leading to the top event or, if a mitigation barrier, significantly reducing or eliminating the consequence.
Each barrier must be ‘independent’ of other barriers linked to a particular threat. Grouping together equipment and tasks so that only ‘effective, independent and auditable’ barriers are represented typically limits the number of barriers on the bow tie to between 2 and 5 barriers on each threat or consequence leg. This has a major benefit that the bow ties is more easily understood so that management and operations do not gain a false sense of security that multiple barriers are in place when several of the barriers are not independent (i.e., if one barrier fails then another one will fail at the same time).
Barriers are characterised as passive (e.g., crash barriers, bunds) or active.
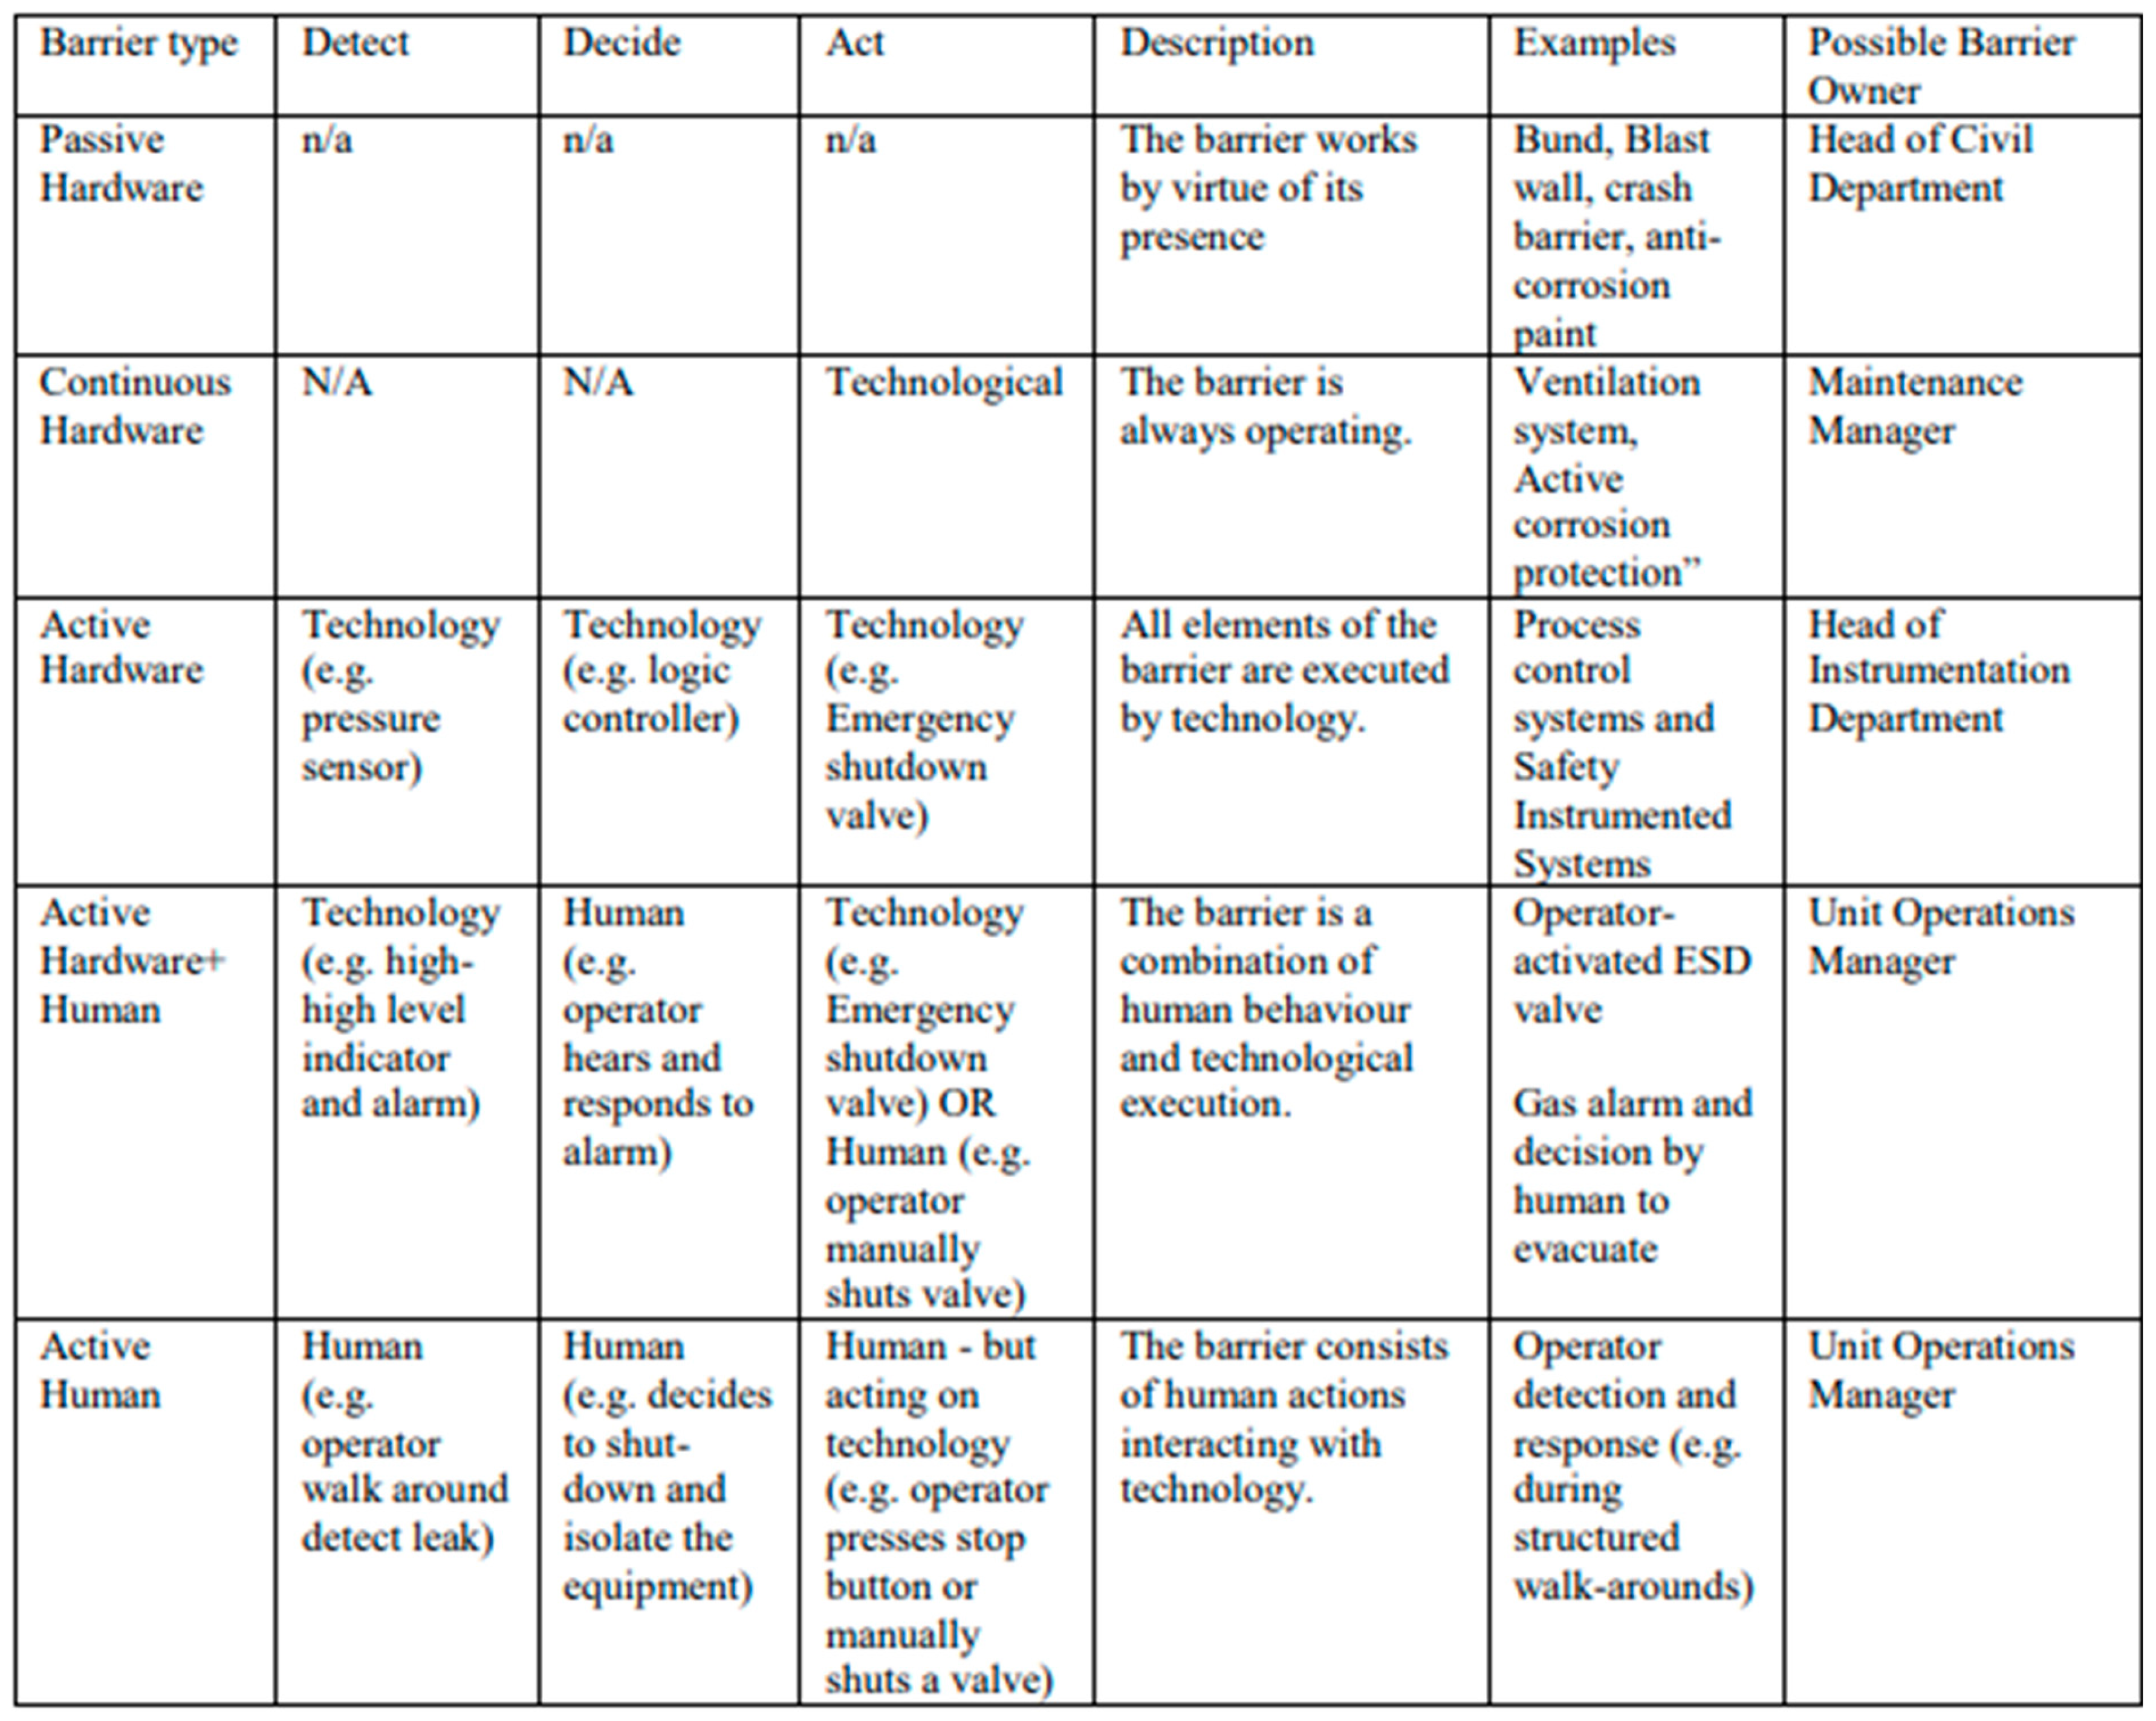
Active barriers are further subdivided into active hardware (with an additional category of continuous hardware for the very particular type of barrier, e.g., ventilation), active hardware + human and active human (Table 1).
Some barriers in bow ties can be compared to Independent Protection Layers (IPLs) in Layer of Protection Analyses (LOPAs) although they may not meet the full criteria specified IEC 61511 (British Standards EN 61511-3, 2004). “
Barrier Types Modelled as FRAM Functions
Passive Bow Tie Barrier
Works or Fails – LOPA can assign a Failure on demand.
FRAM Barrier
Enables activation of alarm, fallback if failure. Can take probability of threat and calculate overall probability of failure / success.
Figure 5.
Passive FRAM Barrier.
But can also include other factors such as maintenance, environment, length of time in service, etc. These probabilities can also be included in an overall calculation of the effectiveness of the barrier (8). This probability can in turn, be transmitted to the next barrier downstream as the revised threat probability.
Figure 6.
Linked FRAM Barrier.
Active Barriers – (From I Chem E)
“Active and human barriers must have separate elements of Detect, Decide and Act,
i.e. Detect what is going wrong, Decide what to do about it, and to Act to stop the threat from progressing further. The detect and decide elements are theoretically also present for passive and continuous barriers but only in the mind of the designer of the project/barrier when she considers that the threat may exist and decides to include the barrier in the design. These three terms are also called “sensor”, “logic solver” and “actuator” by some bow ties users but the committee preferred the simpler terms instead.“
If the Barrier is now a FRAM function, the input aspect is effectively the Detect element. The function’s role is, to Decide what to do about it (e.g. high-level alarm signal is detected, the function is programmed to (decide to) activate an alarm, the output – sound alarm is then the Action resulting).
The FRAM function can essentially program this into a system model, effectively as a line of code.
IF Threat Aspect present, THEN Sound alarm, else Wait.
The I Chem E publication helpfully lays out in a table (Table 1), a selection of these Types of Barriers. But note the advantage of the FRAM model is that we can now add all these ancillary functions, that the table identifies, are necessary to ensure the correct and reliable functioning of these barriers.

Table 1.
Barrier Types and linkage to ‘Detect’, ‘Decide’ and ‘Act’ Component.
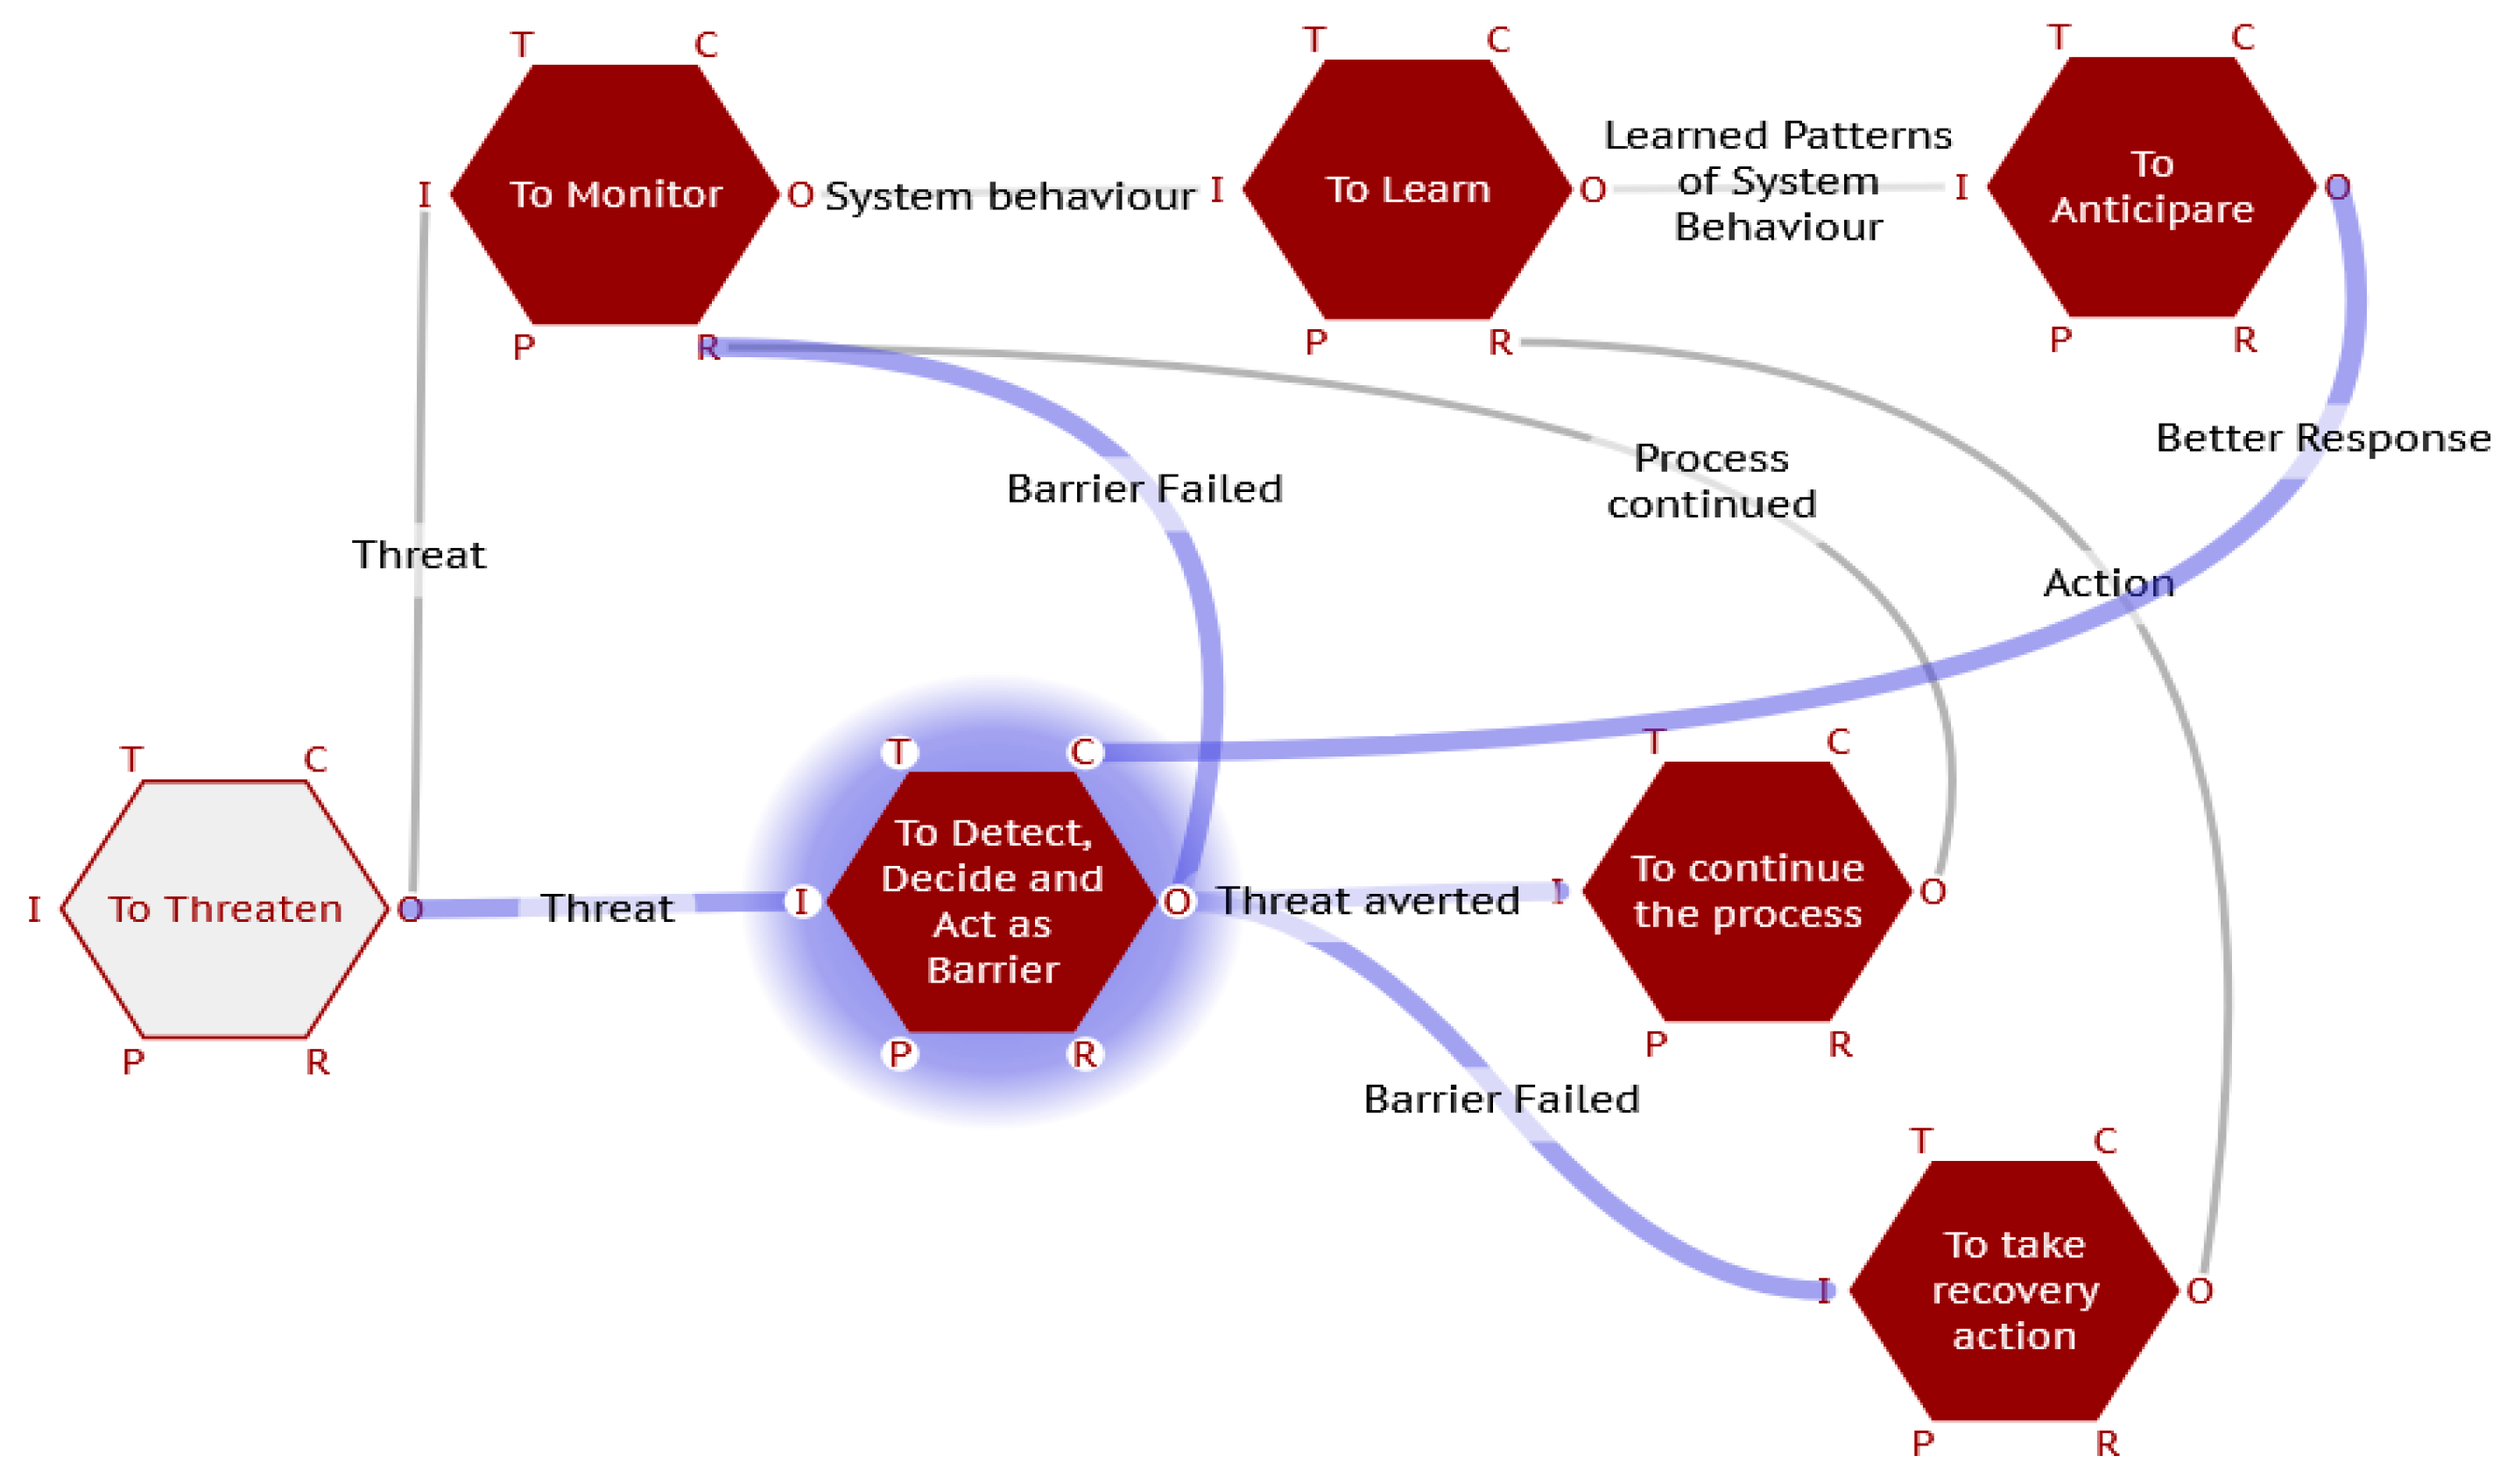
But the FRAM functions can also help to identify additional functions that we could build in (e.g., Hollnagel’s Resilience Functions, (9)), to add resilience as well as reliability to these active Barriers. Figure 7 shows how.
Figure 7.
Active FRAM Barrier with Resilient functions in the Barrier system .
Barrier Meta-Data
Besides the key elements that make up a barrier, it is useful to classify them with further details, or metadata. In the FRAM approach, this metadata can be assigned, calculated, and dynamically developed and monitored as the process instantiations progress.
For Bow tie barriers, we propose to add the main metadata defined in the I. Chem E paper, which are as follows:
“Barrier type: see Table 1
Barrier owner. This will identify the single individual on site, or rather their role, who is responsible to assure that the barrier functions as it should. For example, the barrier owner for active human and active hardware + human barriers will often be the Operations Manager/Superintendent (Table 1)
Barrier Effectiveness/Strength. Whilst every barrier should fulfil the criteria of being effective, independent, and auditable some barriers are better than others. To be effective it has to be “big enough”, “strong enough” and react “fast enough” to stop the threat leading to the top event occurring or in mitigating the consequence. This can be seen as analogous to the size and thickness of the cheese within the ‘Swiss cheese model’.
Barrier Reliability This can be assessed qualitatively (e.g., high, medium, or low; valid, partially valid and invalid; excellent, good, acceptable, poor and unacceptable/absent) or quantitatively (e.g., in terms of probability of failure on demand similar to a LOPA). (10)
Barrier Adequacy: whilst the goal is for all barriers to be fully effective, specific barriers might be included due to their importance even if not meeting a desired effectiveness target, particularly on the mitigation side of the bow tie (e.g. effective, partially effective, not effective or using a percentage estimate). For example, an ammonia water curtain might only address 50% of wind directions and reduce ammonia impacts by only 70%.
Barrier Criticality. In principle all barriers are important, but some are more important than others. Factors determining criticality can include if the barrier is working to prevent a particularly prevalent threat or a critical consequence or if a barrier is used across multiple threat or consequence legs. Pressure relief valves might be determined to be critical as the last line of defence and in many jurisdictions having a functioning pressure relief valve is a legal requirement.
Barrier condition. This is important during operation, to give an indication of the status of the barrier against the design intent and whether the barrier has degraded over time. This can be seen as analogous to the size of holes in the cheese within the ‘Swiss cheese model’; have they increased in size during operation? A three-level system lends to the use of ‘traffic lighting’, for example:
- -
- Green: in place, available and operating as per design
- -
- Amber: in place and available but operating below its intended functionality
- -
- Red: not available or significantly degraded.
Some companies have found it has been useful to also add two other categories: white where the barrier has not yet been assessed or no operational performance is available and black to designate either a barrier is not installed versus a standard design or where a barrier has been removed or not available on a long-term basis (deactivated).
Degradation Factors There will always be things that can cause a barrier to not work as intended. Degradation factors enable the team to further investigate why a barrier won’t work as intended.). As with all elements, the CCPS/EI bow tie book (5) recommends that the degradation factors be clearly described and specific - not just “the barrier fails”. We need know how and why the barrier might fail. Will an “alarm and operator response” barrier fail because the alarm is broken and there is no system in place to detect this has happened or because the training and competence of operators is deficient, so they do not respond, or respond incorrectly to the alarm.
Safeguards Safeguards lie along degradation pathways into that barrier where they help defeat the degradation factor. Safeguards are not titled “barriers” to provide differentiation of terminology. Some safeguards can fulfil the requirements of a barrier but other may not because they may neither have the detect, decide, and act elements nor the effective, independent, and auditable requirements of a barrier. Safeguard can also be used to incorporate softer issues such as human and organisational factors.
Incorporating These Characteristics as Metadata
A FRAM Function represents an activity or process that changes something in the system, and this change can have an effect on any other Function in the system with which it interacts. The metadata facility sets out to allow us to see the effect of these changes and to follow the consequences of these events. Consider a Function has a property that can be modified after its interaction with another Function. Call this property/parameter a “value” and identify it with a “key”. The FMV allows us to specify these key–value pairs as metadata (Figure 10).
Figure 10.
Metadata key–value pair.
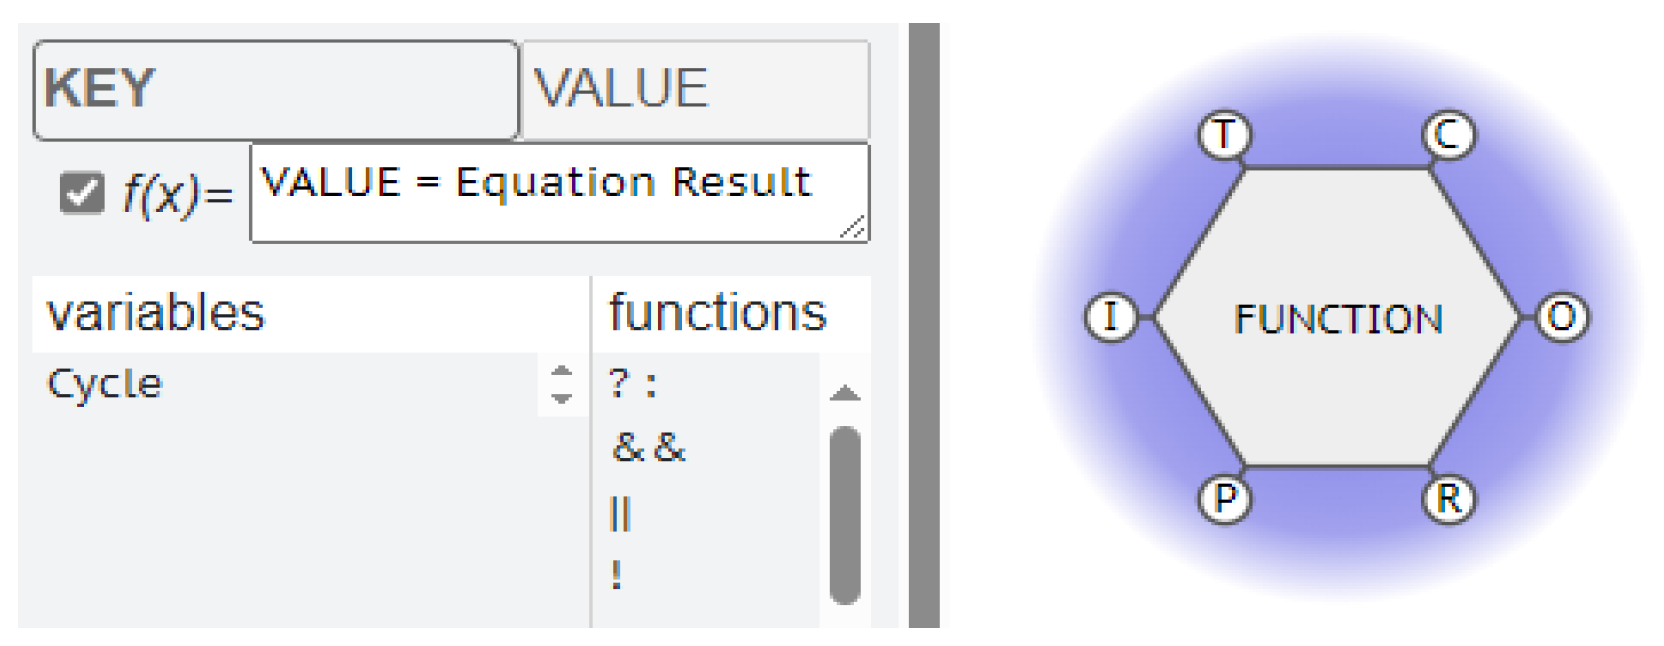
In this way, the metadata can be defined for different types of data, including the following:
- -
- Fixed constants that represent properties of a specific Function, like a name, description, or other properties.
- -
- Variable properties of a specific Function that can be modified using equations based on other metadata available from upstream Functions.
- -
- Global constants that are set by the starting Function and passed on through the couplings.
- -
- Global variables that are passed on through the couplings but can be modified by Functions using equations as they pass through.
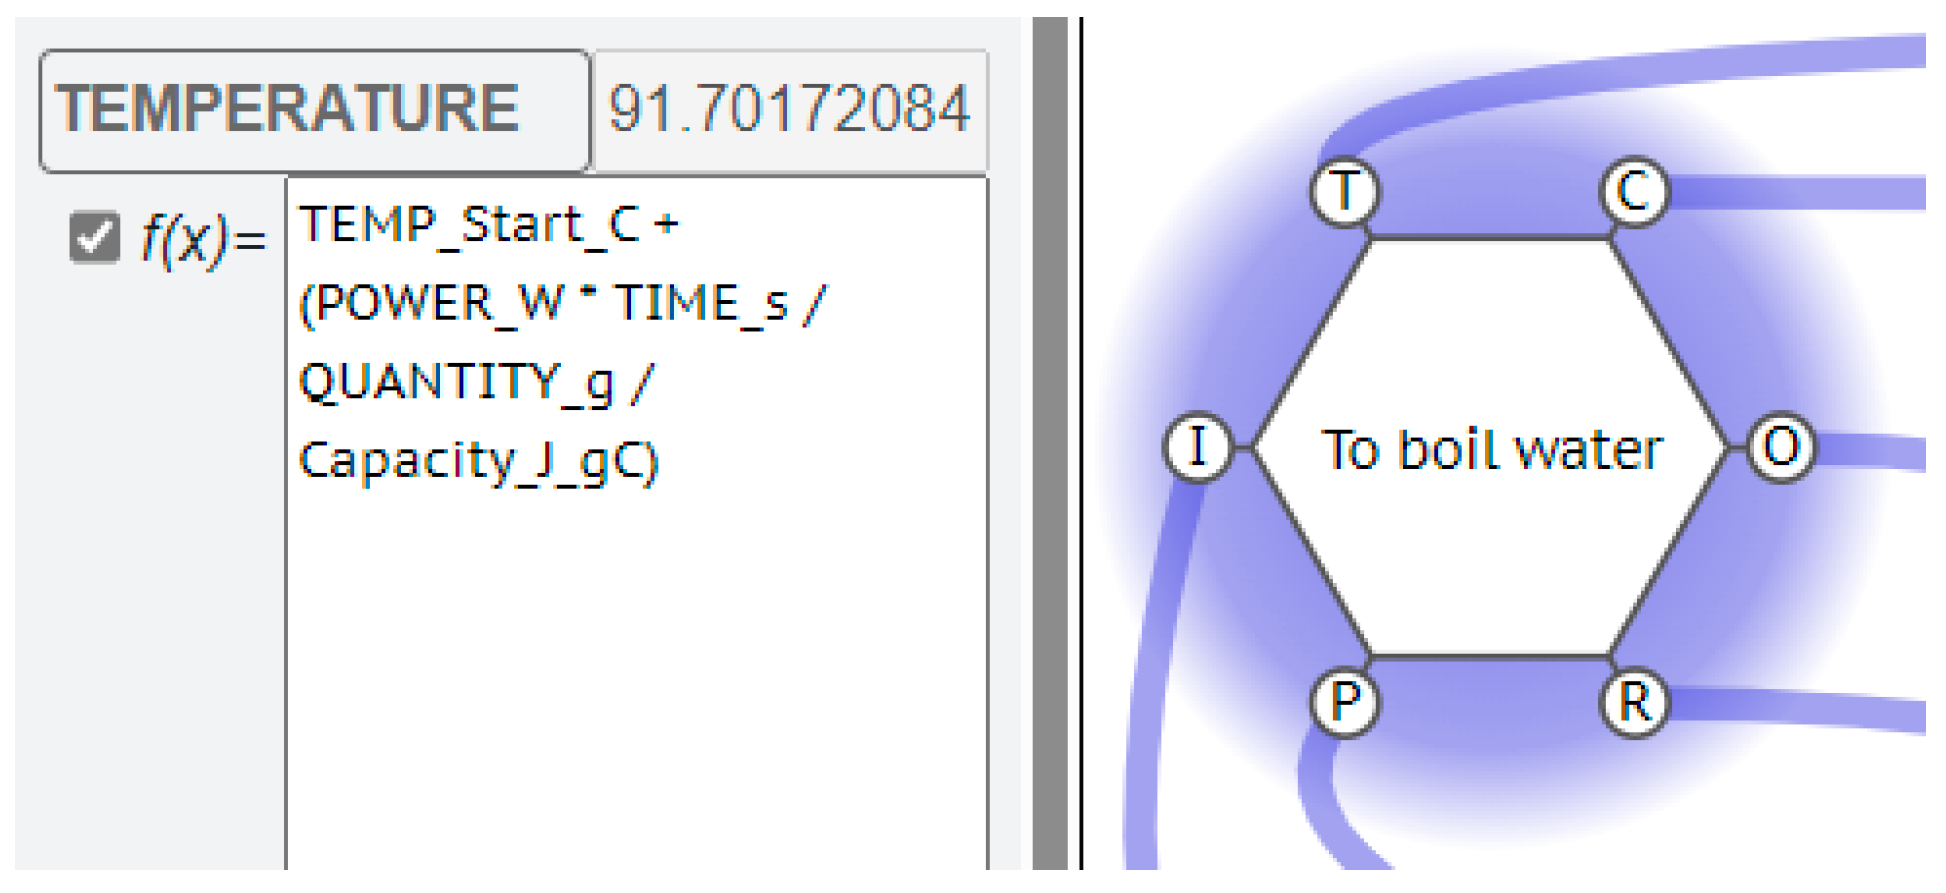
Consider the Function “to boil water”, using an electric kettle. One of the parameters of critical interest would be the TEMPERATURE of the water being boiled. There would then need to be a KEY label for this Temperature, which would have a VALUE calculated from an EQUATION relating the power supply wattage, the quantity of water in the kettle and the time allowed for the kettle to boil.
These extra parameters, POWER, QUANTITY and TIME, can be VALUES for these new KEYS, transmitted by the interaction with upstream, or background Functions. So, the FMV does not just check that these upstream aspects are present, it can also read and process the information from the interaction as a measurable (calculable) effect on the Function’s OUPUT.
The Temperature of the water produced by that Function could thus have a calculated VALUE as a mathematical function of the VALUE of the strength of the power supplied, the VALUE of the quantity of water, and the VALUE of the time that the kettle is allowed to take. The equation is shown in Figure 3 and the FRAM model min Figure 11.
Figure 11.
TEMPERATURE equation on Function “To boil water”.
Further, the TEMPERATURE of this water could have a direct effect on the QUALITY of the tea produced; if this “boiled water”, OUTPUT is an ASPECT for a Function “To pour on to tea leaves”. So, we can have a KEY–VALUE pair for the quality of the tea produced by this Function. This can then be calculated from the TEMPERATURE of the water received and perhaps a TIME VALUE from an upstream Function “To control the time it is allowed to stew”.
In a conventional FRAM analysis, the possible effects of cooler water or shorter times could be flagged as a variability to be noted. With the metadata we can now follow/predict the development and the quantitative effect of the ripples produced by this variability, right throughout the instantiation, and track any “emergence” of unexpected effects, or “resonances”.
Because the metadata is defined by the user, the FMV does not direct any particular method of analysis, but rather, by maintaining an open configuration, allows for the possible use of many different forms of interpretation and analysis. This is in keeping with the purpose of the FRAM, which is a method to build a model of how things happen, not to interpret what happens in the terms of a pre-existing model. By combining FRAM with the FMV and Metadata, it should be possible to model any complex system and define a meaningful analysis.
So, for our Bow Tie we can set Key Value pairs and calculation equations to quantitatively keep track of the critical barrier metadata as the process unfolds. So, addressing the I. Chem E’s focus on the barrier properties in turn.
Barrier Effectiveness/Strength. One of the more sophisticated options available from the methodology, is to continuously cycle the model, each time choosing random values of the initial parameters to build up a Monte Carlo visualisation of the effects of their variability as a challenge to the barrier strength / effectiveness. So, since our starting function is to pump a liquid, the normal HAZOP variations in parameters such as Flow, Pressure, Temperature, Timing can be examined systematically (– Too much, too little, too early, too late, etc.) and the hazardous excursions flagged as markers on the visualisation (11)
Barrier Reliability: A recent paper details how if we set initial estimates of the reliability, etc. of the functions operating, the model can calculate using the metadata, how these probabilities combine to give overall and individual chances of successful operation or failure of critical components and the entire system.
Barrier Adequacy: This can be investigated by using the variability in challenge to test the limits of successful operation of individual barriers and the total system.
Barrier Criticality. Again, varying the metadata systematically can identify the criticality of functioning of individual functions in affecting the overall performance of the system.
Degradation Factors One of the key uses of metadata is to track availability and consumption of resources. All components have designed lifetimes which can be affected by how and how much they are used or exposed. (fatigue, corrosion, etc.). The metadata can keep track of the utilisation and maintenance, inspection, audit logs, etc.
Safeguards
Just as in the Bow Tie, we can add backup and safeguarding functions to the models to incorporate these. Indeed, it is often an outcome of the approach that functions can be modified, augmented, or even eliminated dependent on performance and behaviours demonstrated.
And more This metadata can now be further utilised to give quantitative performance predictions. The obvious one is to use the barrier effectiveness data to produce the LOPA (Layers of Protection Analysis numbers for the whole system as well as individual components or different linear sequences of event progression.
Consequences. This is a crucial part of the standard safety approach, what can go wrong and how much? As in the Tea making example, that metadata facility can be used, not just to predict weak tea will be the consequence of cold water, but on what scale of acceptability will the strength of the tea be depending on the water temperature and time of exposure of the leaves.
Risk. We now through the metadata facility have the means to calculate and follow the development of bit =h the probabilities and consequences of functions activating or not. This, (Likelihood times Consequences) is the classic engineers’ definition of Risk. So, we can now calculate and predict as precisely as the starting data allow, the risks involved in operating the nonlinear complex systems.
Even for non-Specialists. Boards and managers these days, seem to prefer semiquantitative, possibly more subjective estimates of risk for their Matrices and Registers. These easier to assimilate, integer estimates usually on logarithmic scales of 1- 5 these days, for Likelihood and Consequences and the product used as a measure of the Risk. (12) (Figure 12) These can also be used as input metadata to the models to give equally scaled integers estimates of significance of operational risks. (using the same sharp end model). This is probably still the best way of presenting the predictions to management, as the FRAM models are meant for the analysts and professionals who actually work the systems and can appreciate the power of visualising Work as Done versus Work as fondly Imagined.
Figure 12.
– Probability / Impact Graph (PIG) or Risk Matrix.
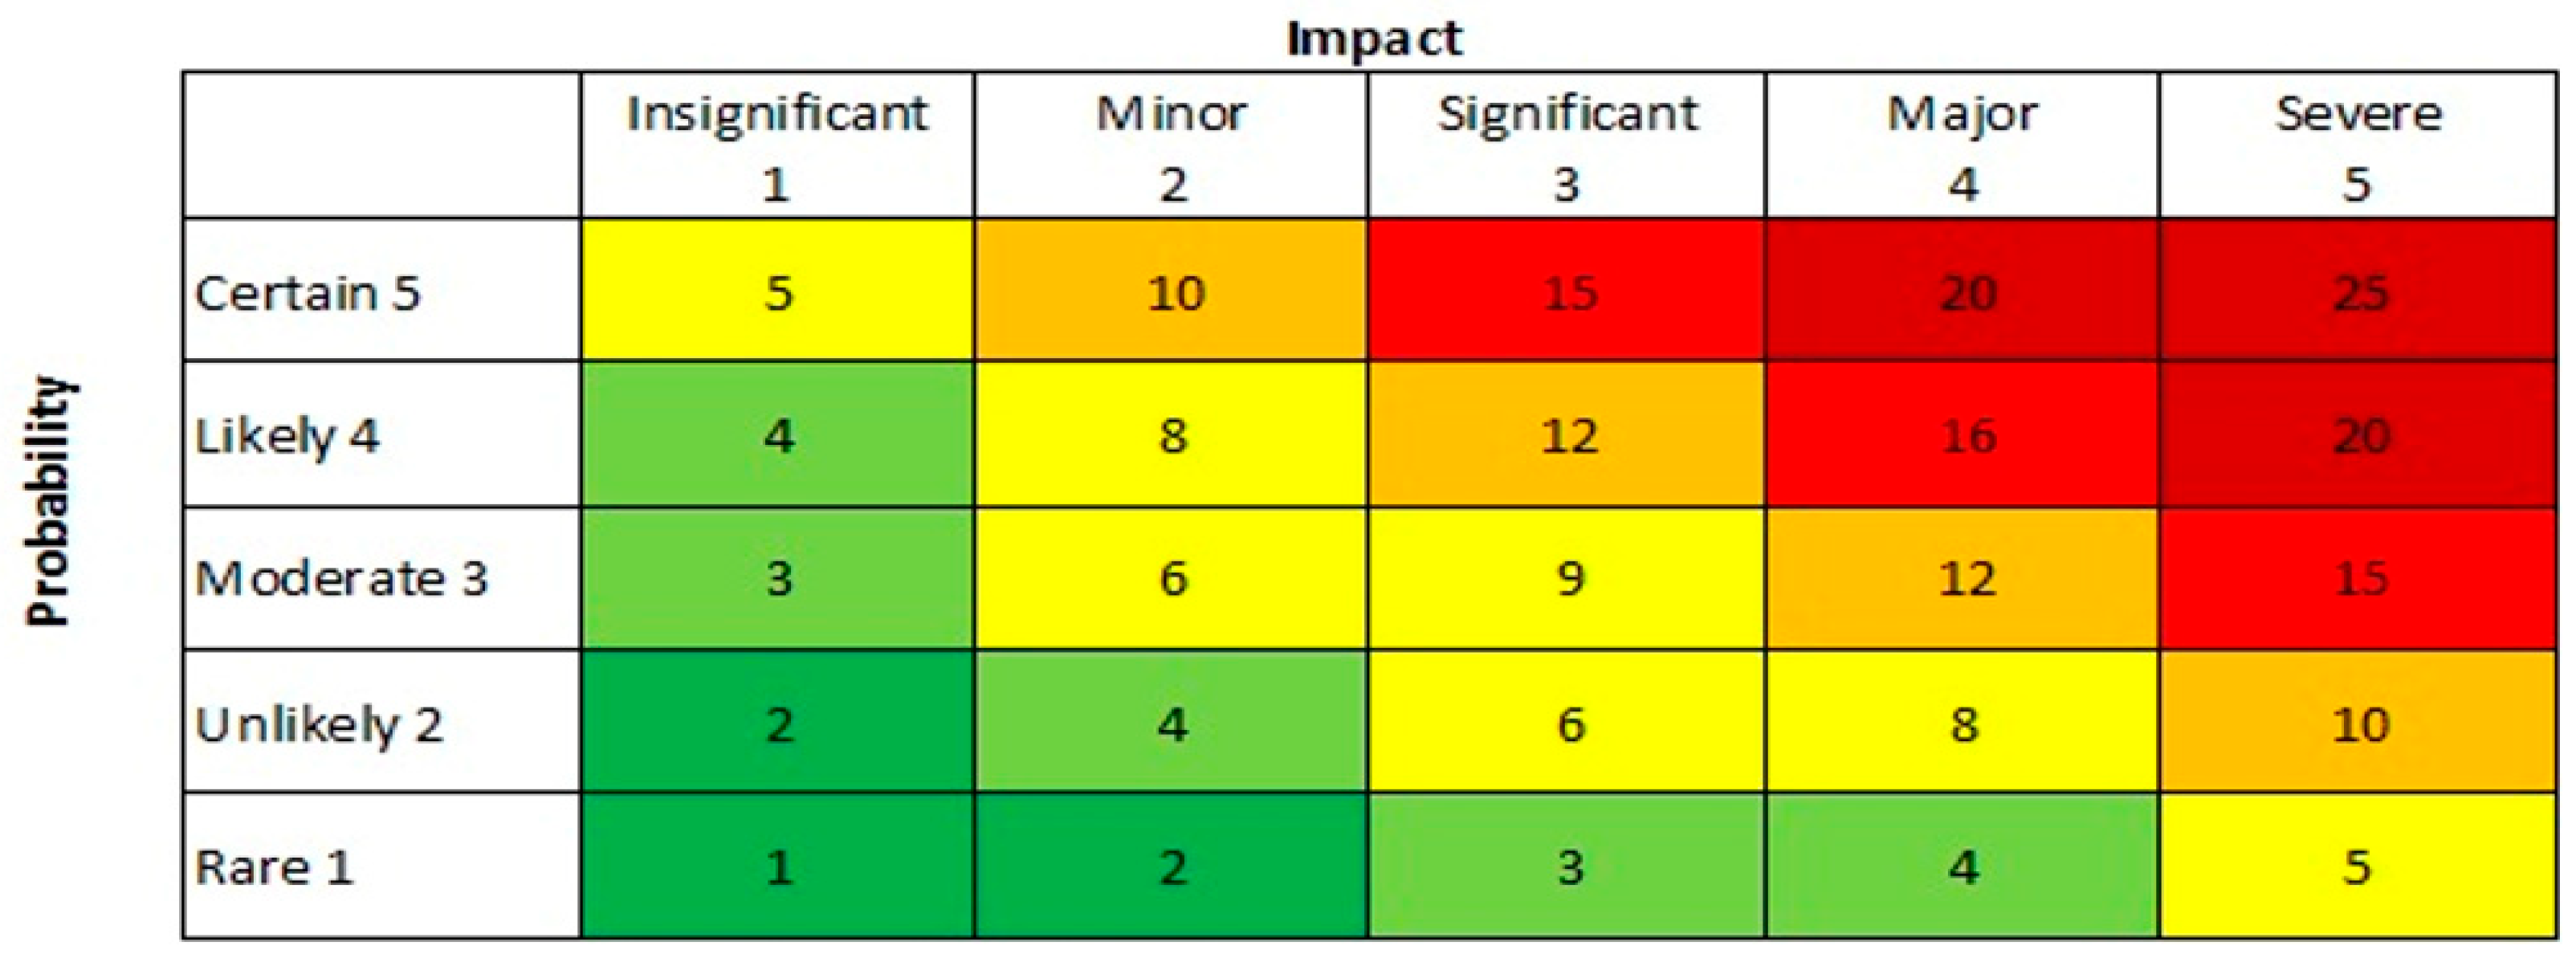
And for specialists There are even standard colours assigned to criteria for acceptable and unacceptable risk numbers. These Red, Green, and Amber indicators can be automatically displayed as coloured bands ion the functions, which can change dynamically as the barrier properties change.
They can even be interfaced to real process instrumentation to provide live digital twins for more intelligent monitoring and anticipatory interventions.
Implementation
But now we can do so much more than just ensure the barriers have been identified and shown as a sequence of isolated components – valuable though that is as a first step. We can now run the system as a dynamic model to check that all the components and connections really behave as linearly designed. We can fully utilise the Metadata.
The easiest way to fully understand the terms and construction of a bow tie is through studying an example.
Bow Tie Example – Gasoline Storage (Buncefield)
Conventional Bow Tie Barriers
Again, quoting the guidance directly “The book contains an in-depth overview of an example, namely the storage of gasoline in an atmospheric storage tank. This was chosen because it is well known and because of all of the well documented work done on this subject following on from the Buncefield incident, starting with the PSLG report (13), continuing with the short (36 page) but detailed incident investigation report (14) and many guidance documents published under the auspices of the Chemical and Downstream Oil Industry Forum (CDOIF), in particular the “Other Products in Scope” guidance (15).
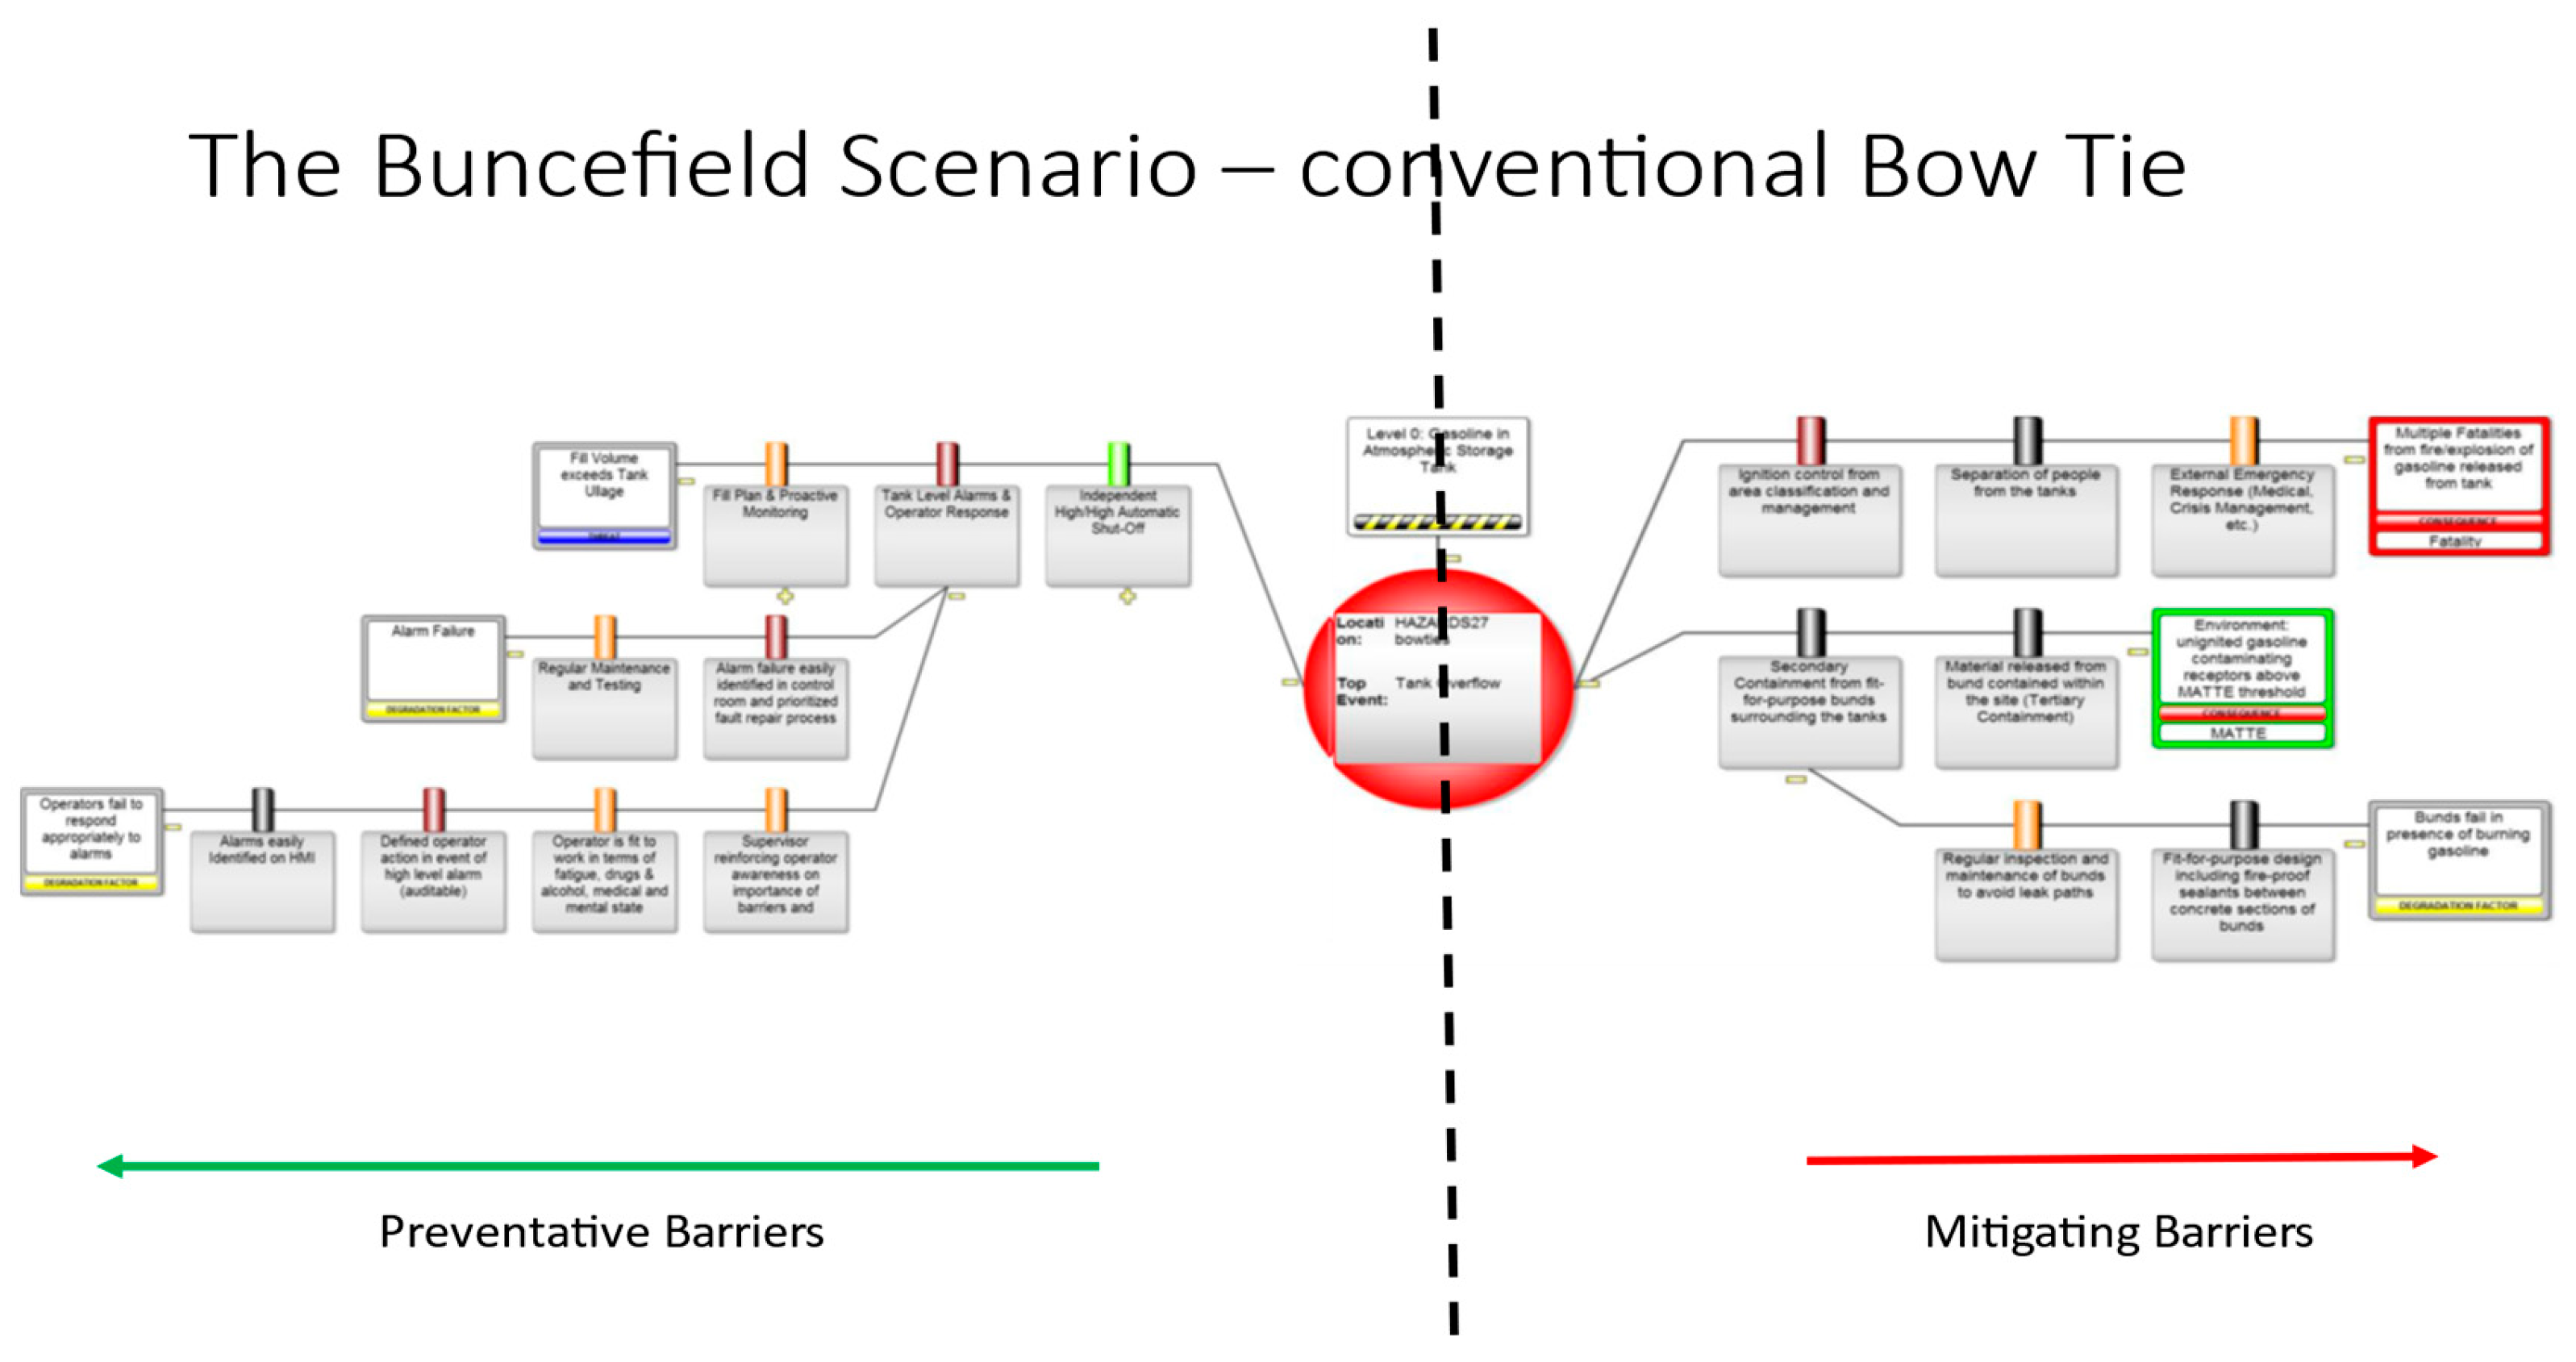
The simplest view of the bow tie is shown in Figure 8. Note how the hazard, top event, consequence, and threat have all been defined. The intention with each is to comply with the guidance described above to be specific and sufficient. The threat is sufficient, if there are no preventative barriers present, to lead to the top event.
In this tank overfill example the three barriers are those identified in the industry guidance (16). The degradation factors that would prevent an “alarm and operator response” functioning correctly could be failures of the “detect” element (alarm failure) or failures of the “decide and act” elements (operators fail to respond appropriately to alarms). The safeguards for the alarm failure cover preventative and breakdown maintenance. The safeguards for the operator failing to respond appropriately cover the four possibilities for this failure from the operator not:
- -
- seeing the alarm
- -
- knowing how to respond
- -
- being physically fit enough to respond or
- -
- being mentally fit enough to respond
After the top event has occurred and the tank is overflowing then the two main consequences depend on whether the gas cloud ignites or not. There were no fatalities in Buncefield due to the simple fact that no operators were in the area and no-one occupying the Maylands Industrial Estate at 06h01 on 11th December 2005, it being a Sunday morning. Buncefield was a useful reminder that passive barriers can fail. Buncefield led to environmental damage with bund failure from loss of the sealant between the concrete sections of the bunds, and between penetrating pipes and the bund walls due to the sealant melting in the presence of the burning gasoline allowing it to flow outside the bunds. Drains and soak-aways allowed the liquids to flow off-site (failure of tertiary containment) and to harm the local environmental receptors including a drinking water aquifer.
Another possible mitigation barrier is a leak detection and shutdown system. It has not been included in this example because it was not present in Buncefield and has rarely been implemented in gasoline tank farms in the UK. Guidance on such systems is available in another CDOIF report (17).
Figure 8.
– Conventional BOW TIE Diagram of the Barriers designed to cope with Tank Overfill scenarios.
Figure 8.
– Conventional BOW TIE Diagram of the Barriers designed to cope with Tank Overfill scenarios.
Functional Barriers
If we now take the Barriers identified in the conventional Bow Tie above (Figure 8.) and use the description of their purpose and mode of operation to define our set of Functions needed to model an instantiation of a FRAM process model, we get the model shown in Figure 8 below it matches the Bow Tie structure of prevention and mitigation. But now we can see the interactions and interdependencies needed to make the actual system work successfully.
Figure 9.
The equivalent FRAM model built from the BOW Tie barriers as functions.
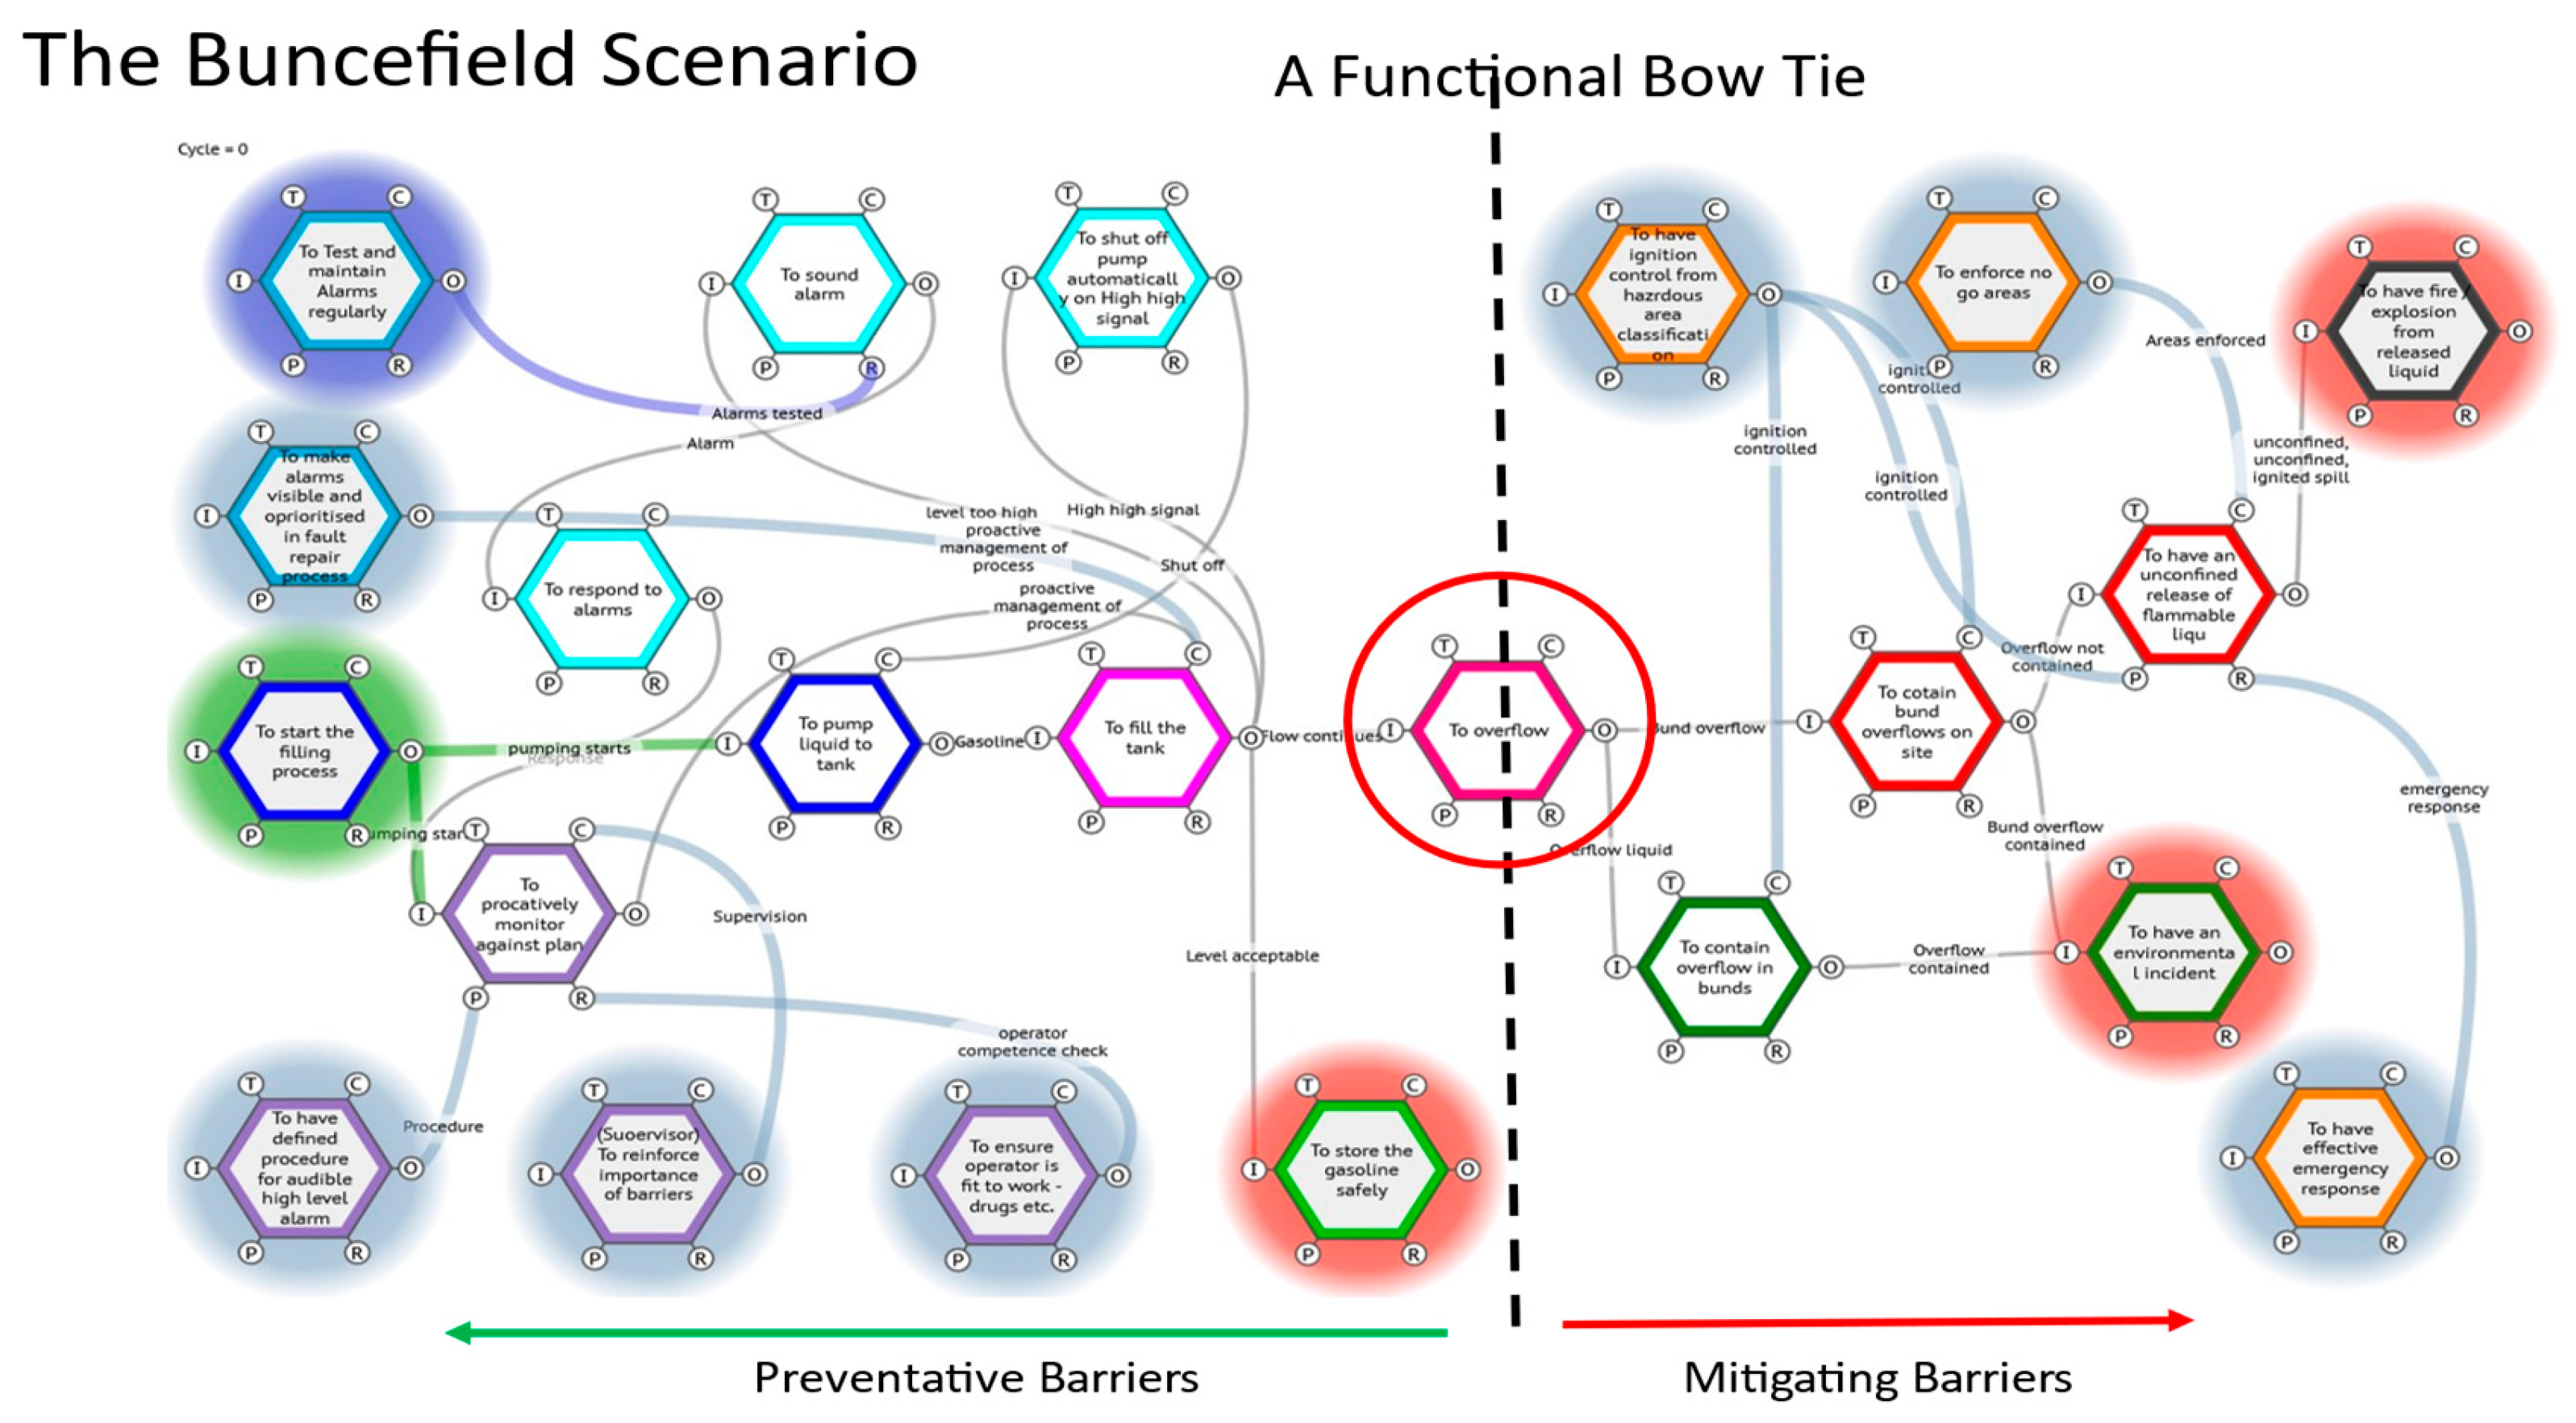
But seeing the interaction of the functions allows the perception of potential issues with the process as designed. The control of the tank filling, crucial to preventing overfilling is crucially dependent on level. This is designed to be monitored continuously by the operator, aided by incrementally serious alarms or warnings of which the High-high is the last and least used fall back. If for some reason the operator is ignoring the lower-level alarms and the High-High, fails to sound, there is no means of detecting the overflow in time to prevent an incident. Unless of course that last alarm is wired to automatically cut off the pumping.
Similarly, on the mitigation side, all the functions are passive, designed to cope with “design” not worst case, failure scenarios (e.g., design and capacity of bunds, tank spacing, etc.). The I. Chem. E text highlights the omission of an obvious active barrier, a leak detection and (again) coupled with automatic pumping shut down. Presumably there is a sensitivity in using leak detection is an issue as there are inevitably plenty of adventitious leaks in these systems.)
Has It Been Demonstrated?
As with the conventional Bow tie it is probably best demonstrated using a very well known, well investigated application. In this case the Deepwater Horizon Incident in the Gulf of Mexico in which a number of the barriers failed to prevent a tragedy is a relevant example (18). The CSB inquiry actually used a conventional Bow Tie approach in its report. (shown below Figure 12) The CSB report sets out the barriers that were designed to control “kicks”, unwanted but not uncommon incidents during drilling operations. Normally these kicks are controlled by an operator in the doghouse utilising the balancing column of drilling mud in the riser, sufficient to keep the hydrocarbons in the reservoir.
Figure 13.
– The BOP Bow tie from the CSB report – (18).
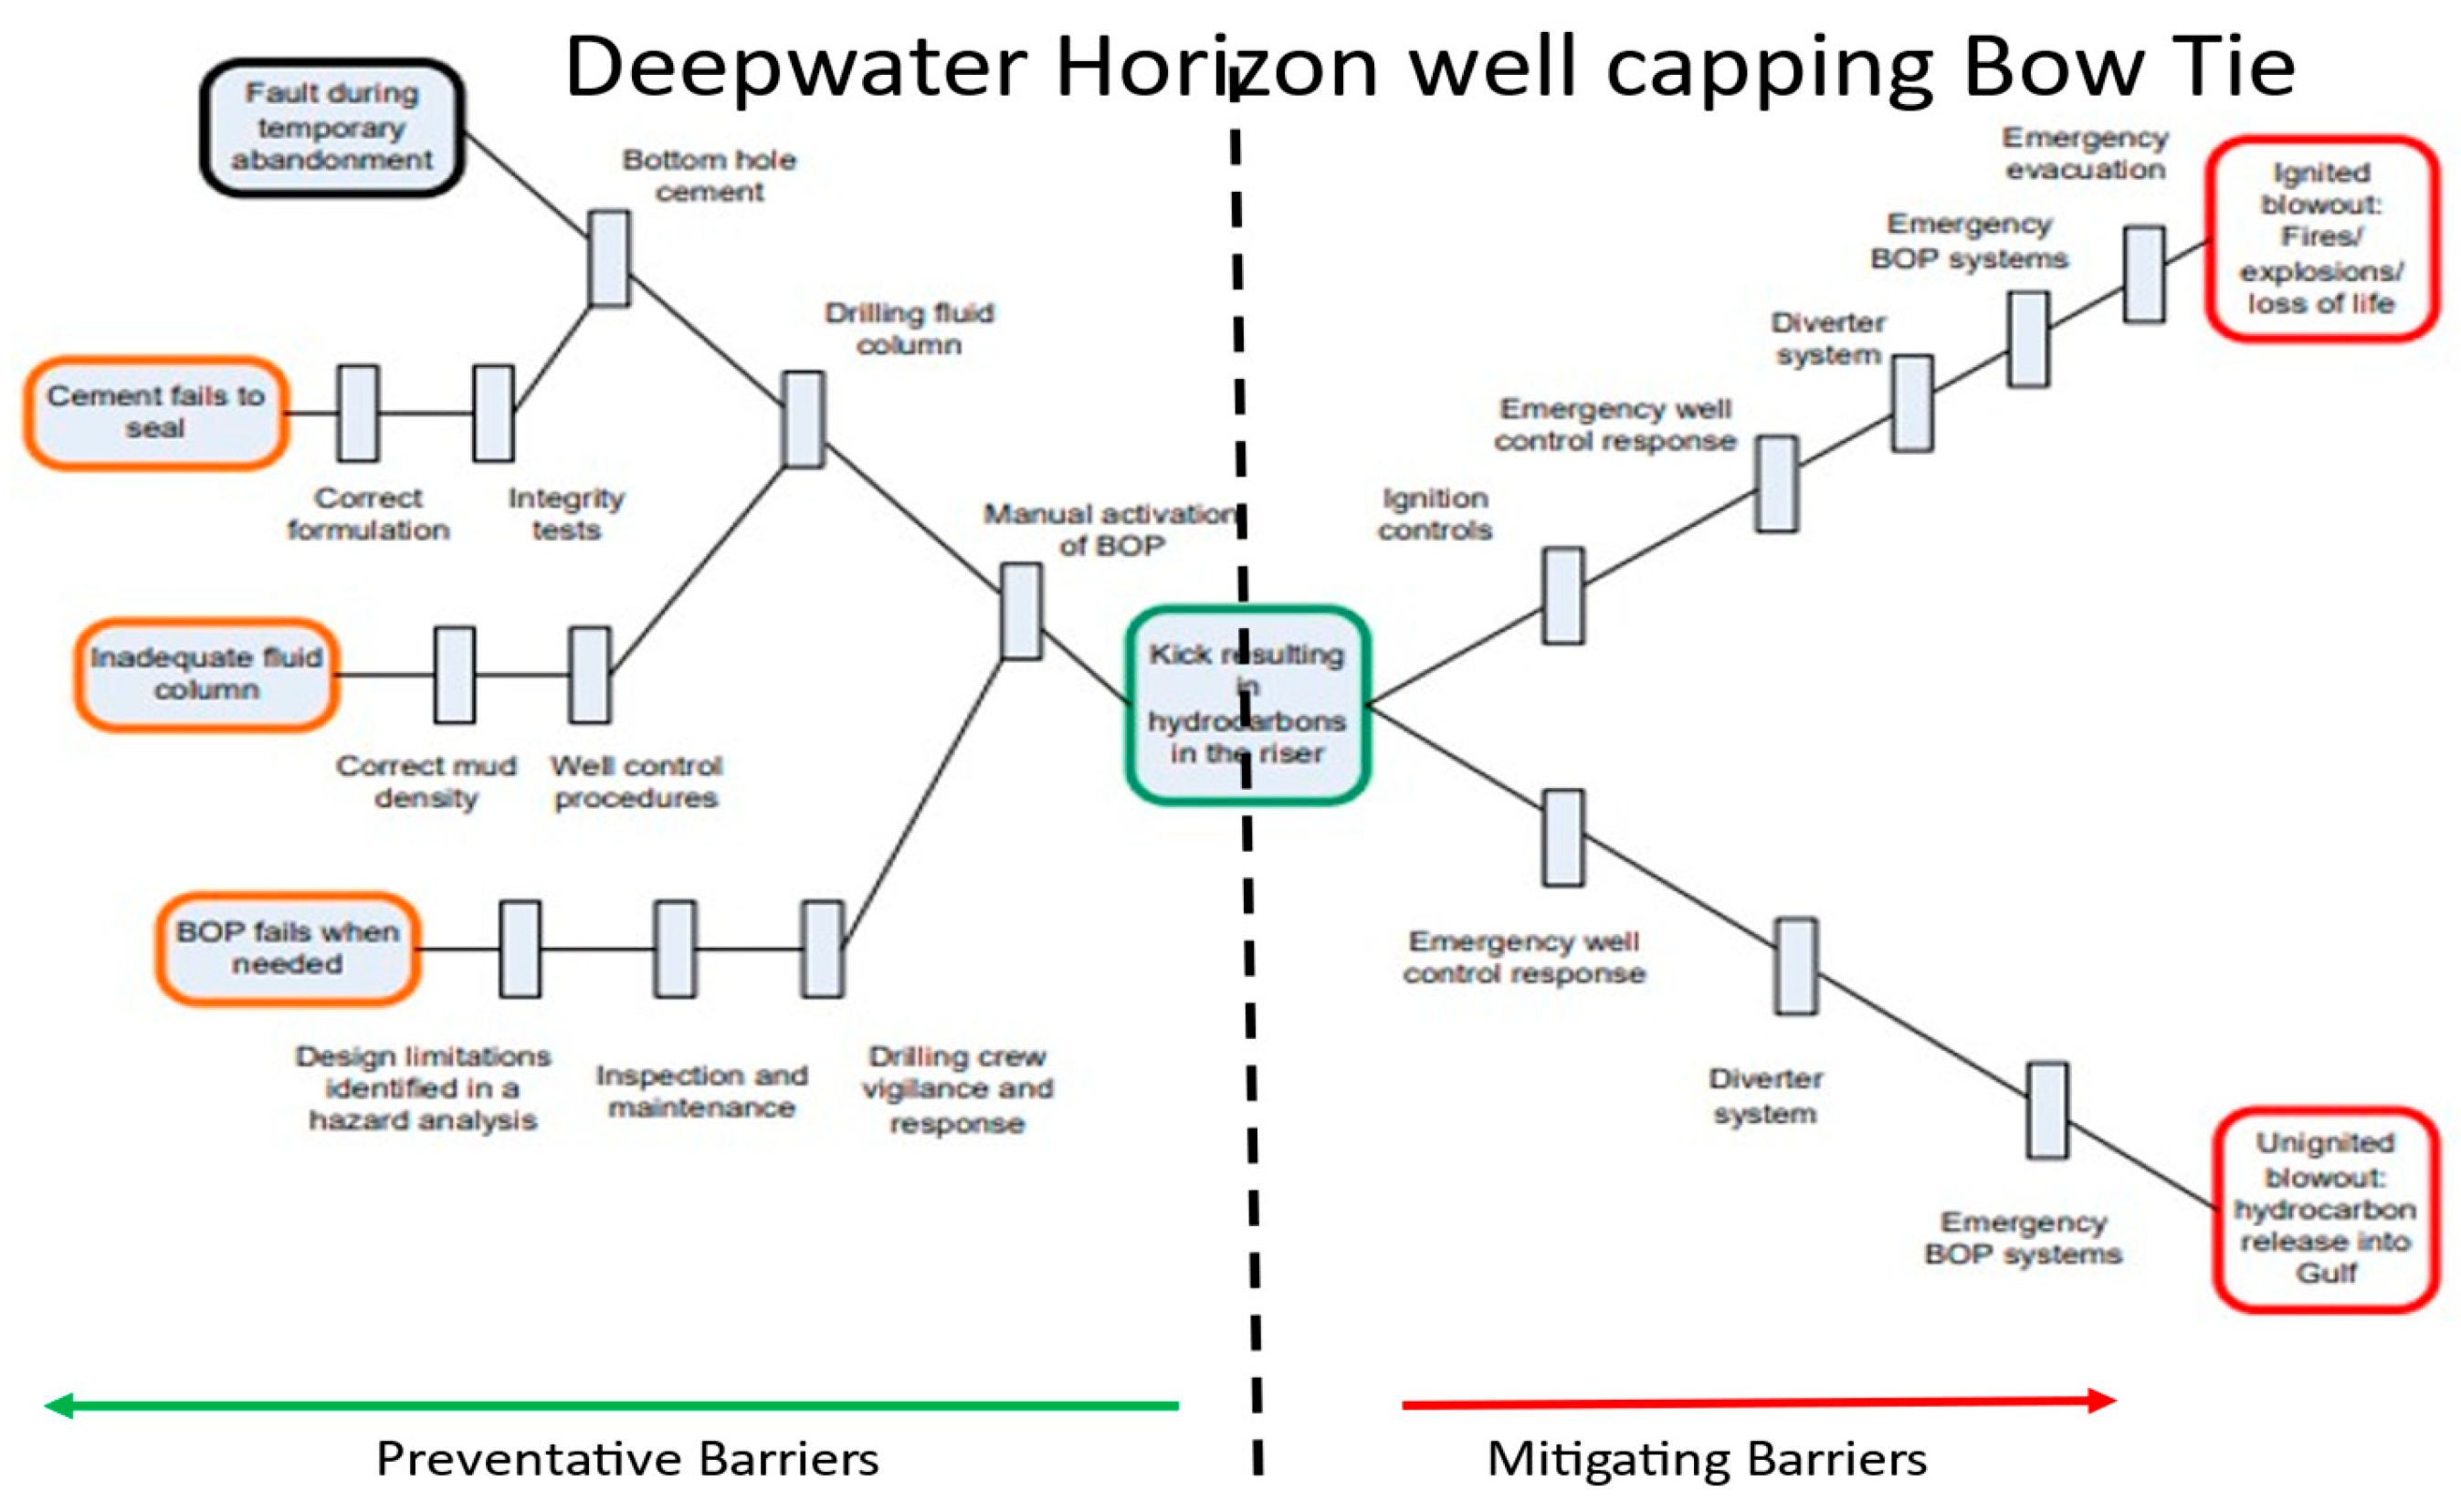
Figure 14.
– The CSB Barriers as interacting, interdependent FRAM functions.
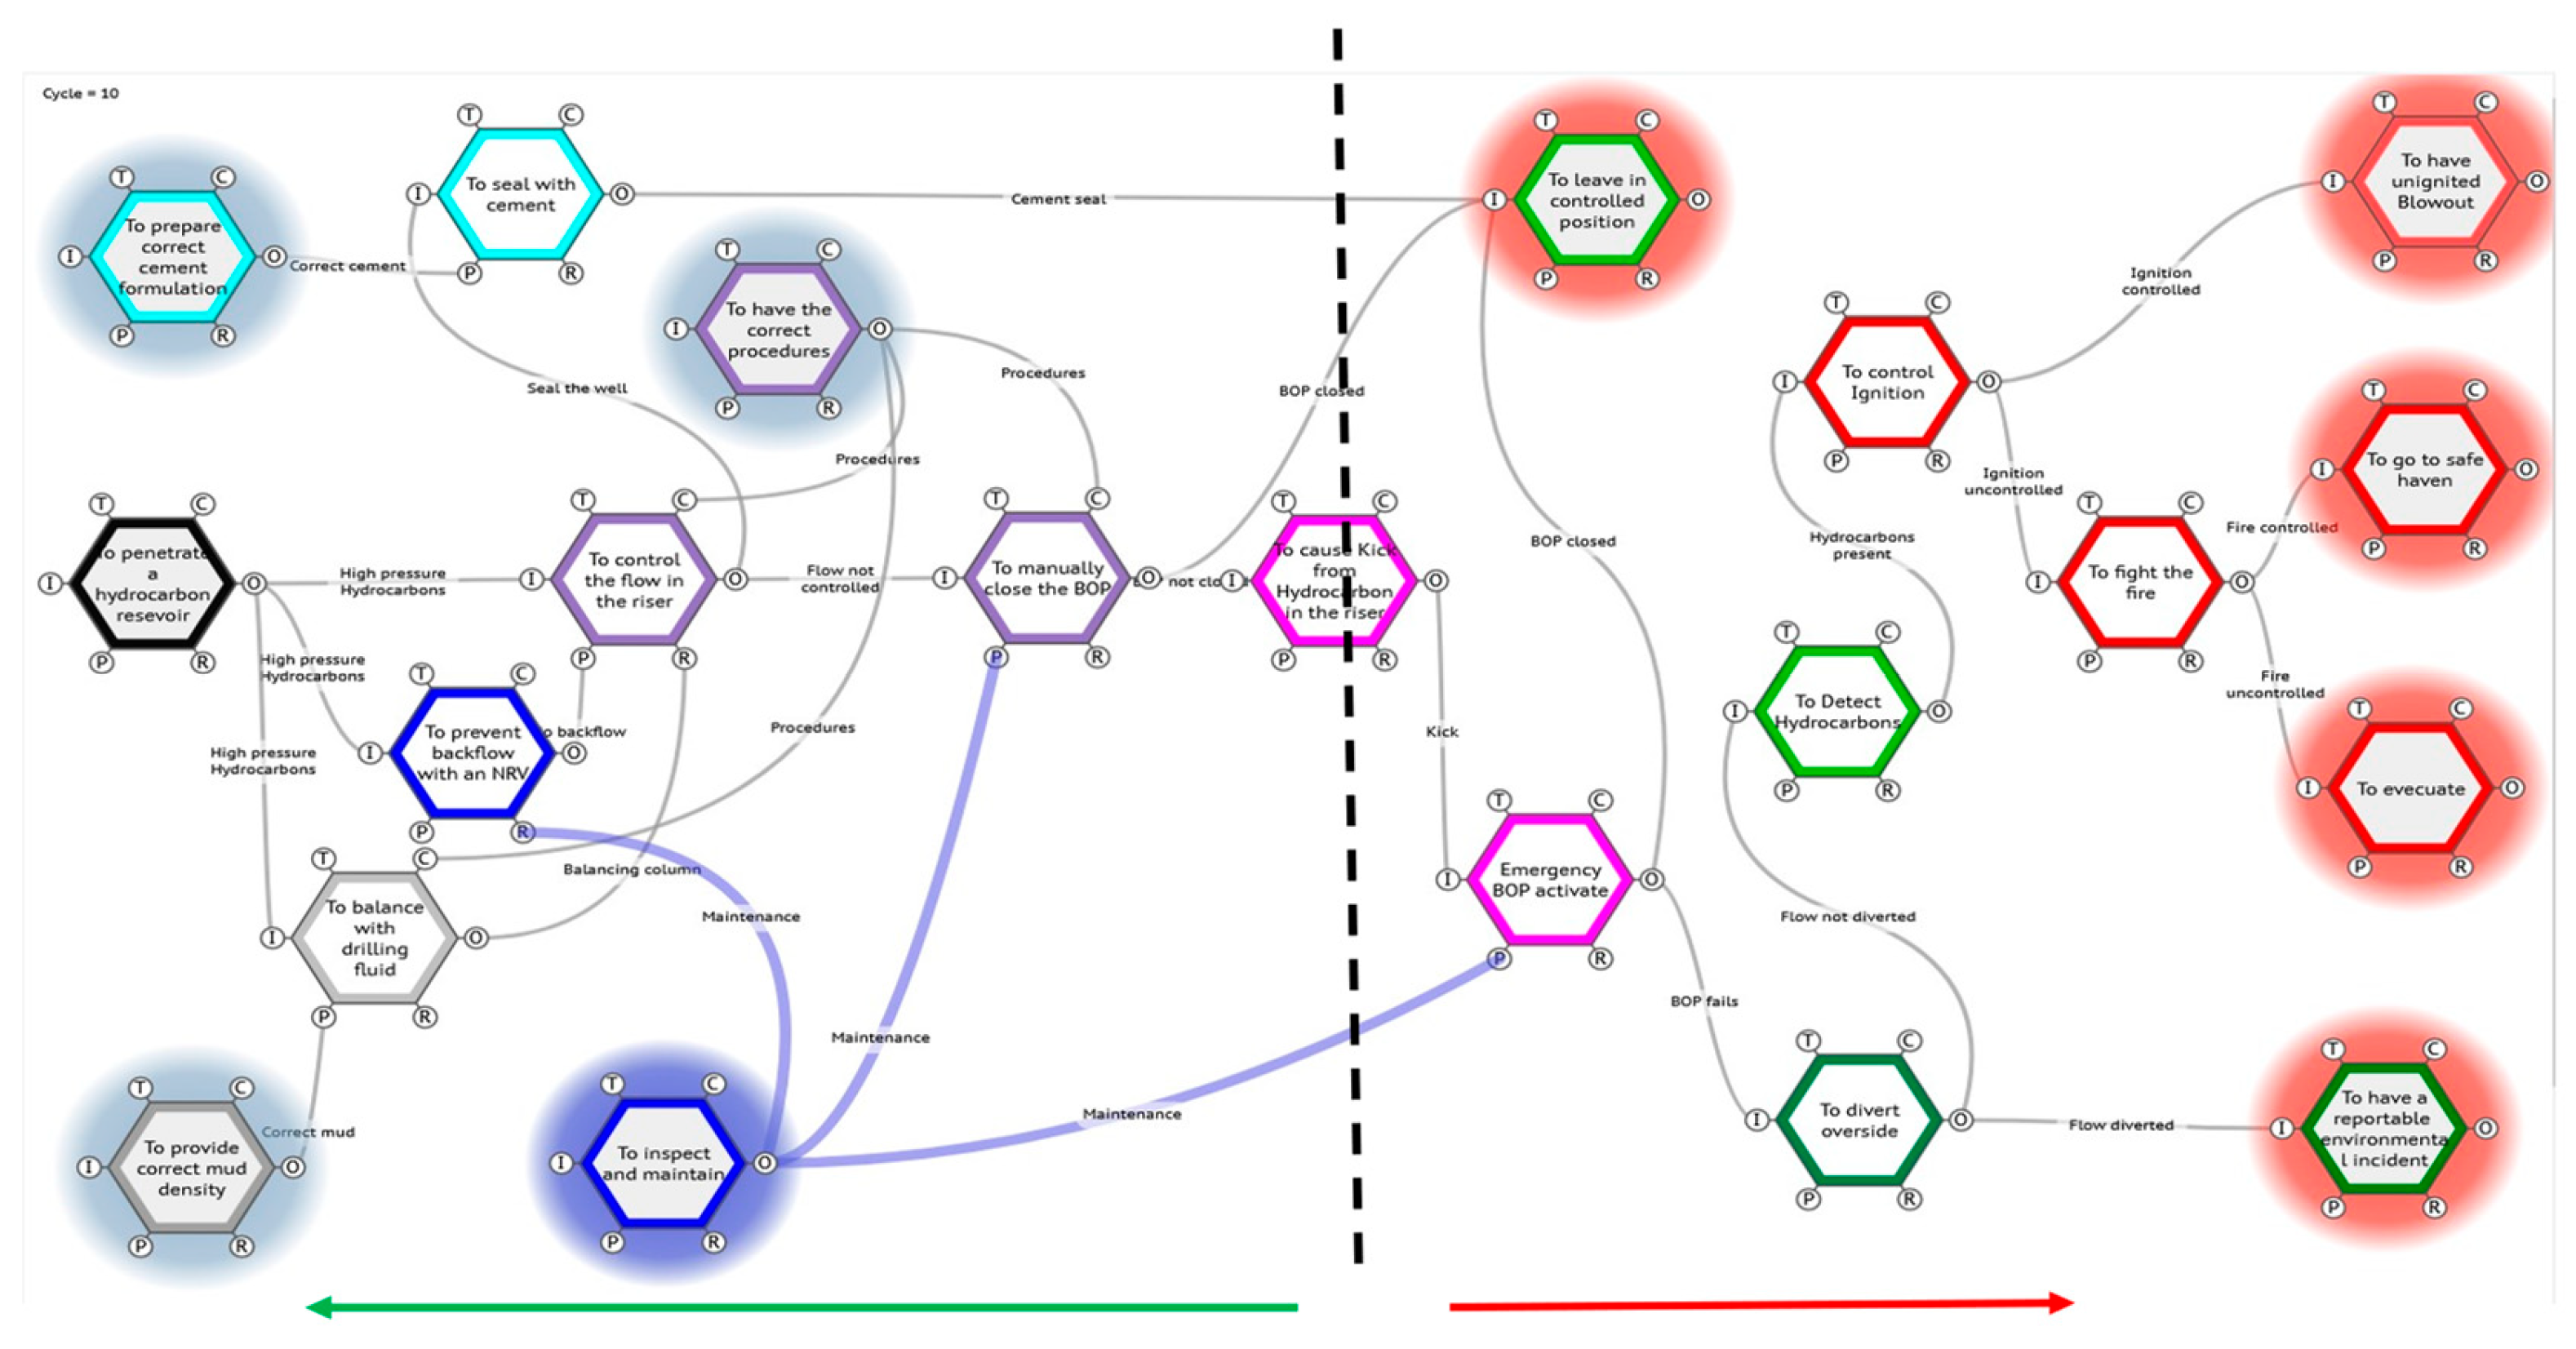
The driller relies very heavily on the support teams to provide the correct equipment and resources, like cement, drilling muds, monitoring, and analysing flow and pressure data and to maintain critical equipment such as pipe, valves, and most importantly the safety net Blow out Preventer.
But it is not clear how much control the driller has over these background functions, his controls can only manipulate the resources as supplied. The functional Bow tie (Figure 13.), shows clearly the intricate communication and checks and balances that need to happen. Indeed, it inspires admiration of the team’s adaptability and experience, (and risk appetite?), that this operation goes right most of the time.
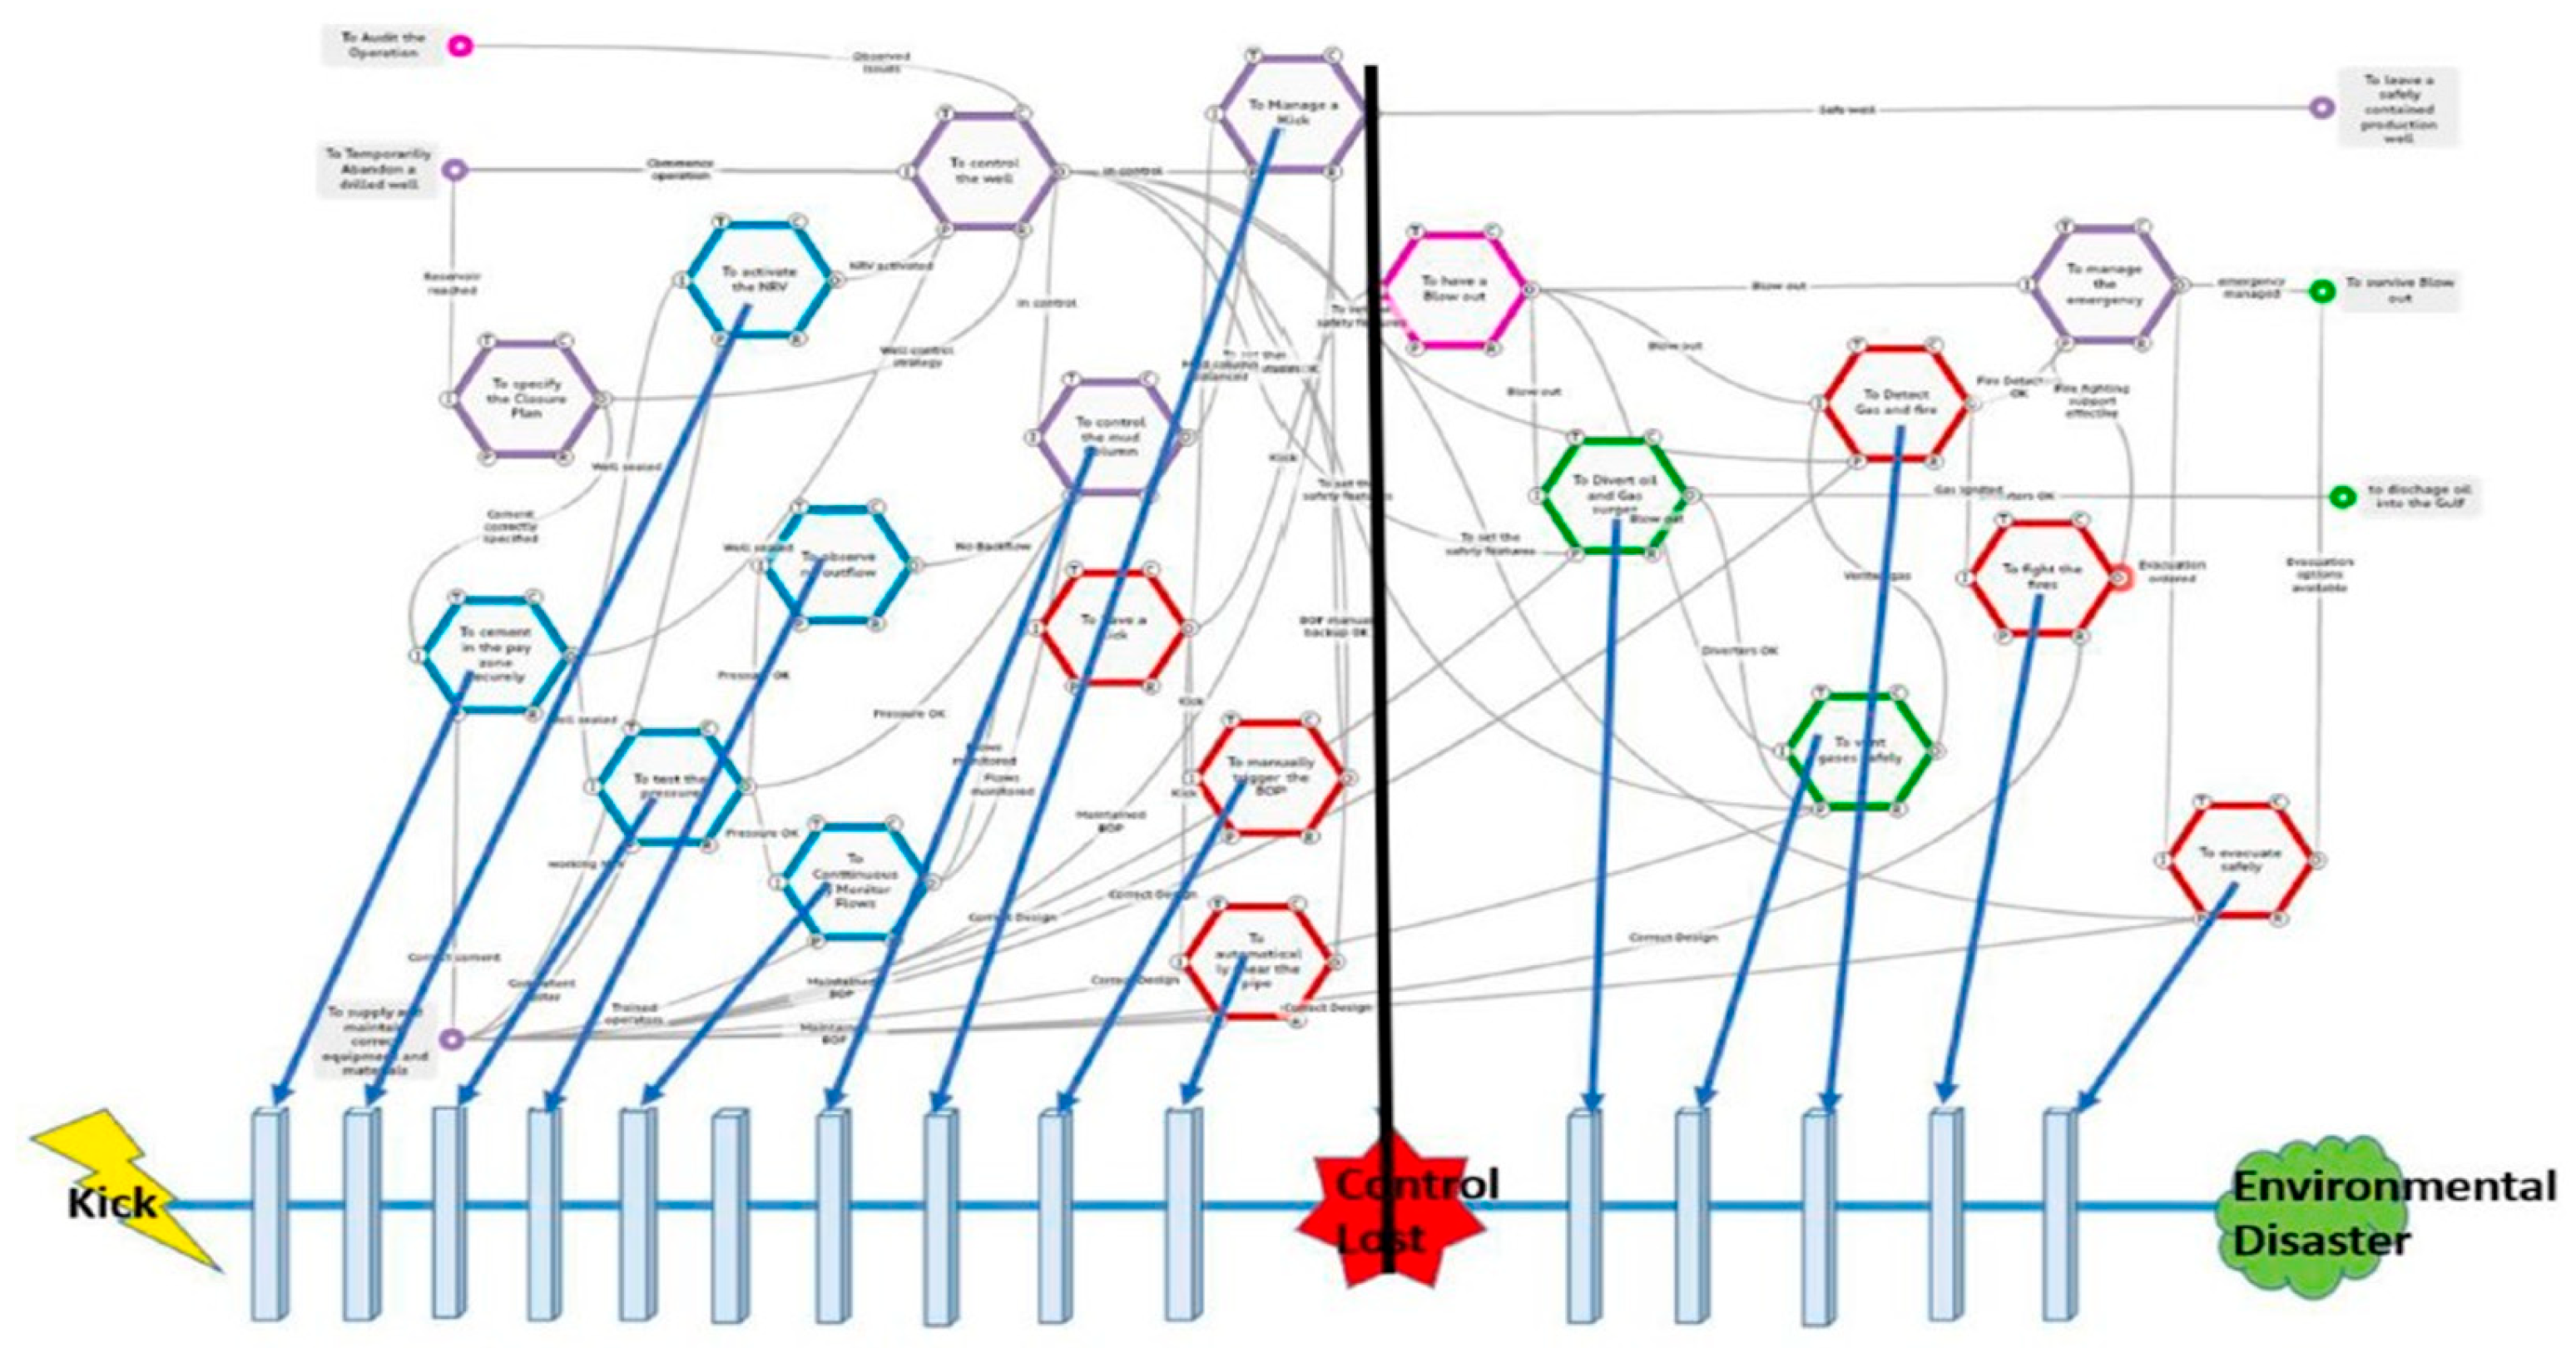
An analysis based on teasing out the functions involved and why they failed revealed much more deep-seated issues (19), (see Figure 14 below). But perhaps more tellingly for this paper illustrated that although the domino model is very much a primitive precursor, the functional model is a legitimate evolution in the sophistication of analysis by building upon sound and historically significant foundations.
Figure 15.
– The BP report simplified their visualisation to a more primitive “Heinrich barriers as dominoes” model.
Figure 15.
– The BP report simplified their visualisation to a more primitive “Heinrich barriers as dominoes” model.
Conclusions
The origins of the Bow Tie methodology have been the subject of a separate paper (20), but there is no doubt as to its popularity. It is employed as a safety management tool by a wide variety of organisations. The reasons for its popularity over other risk assessment approaches seem to include:
- i)
- Its simplicity of use,
- ii)
- Its value as a focus for collegiate HAZOP style troubleshooting,
- iii)
- Its clear identification and clarification of the type and sequence of barriers; and what they are meant to achieve,
- iv)
- A possibility to assess the combined effect of multiple barriers, (LOPA),
- v)
- A tracing of event causes to specific barrier failures,
- vi)
- the identification and analysis of degradation factors to understand how barriers can fail and the safeguards that need to be in place to prevent such failure and
- vii)
- the visualisation of barrier and safeguard condition in the operating phase.
This paper has set out to demonstrate how a functional approach to barrier performance, opens up a new possibility of extending the Bow Ties approach, to look at more complex, systems. Enabling the nonlinear mapping of the sometimes-unexpected interactions and interdependencies, between possibly safety critical functions, often assumed independently isolated for simplicity.
The Functional Resonance Analysis Method can provide this extra dimension needed for visualising and modelling complex safety management systems. But the value of using it as a Bow Tie extension, is that the Bow Tie approach has simplified the initial set of functions (barriers), and also provides the essential metadata need to specify expectations of their performance.
Using this metadata, the models can then predict behaviours, reliabilities, consequence possibilities and quantitative (and semi quantitative) Risk numbers for design choices, optimisation, and cost benefit analyses.
The paper concludes that the combination can provide a much need tool for exploring today’s more complex systems and environments in which we have to design, build, and operate hazardous installations.
References
- Manton, M. et al, (2017), Standardisation of Bow Tie Methodology and Terminology via a CCPS/EI Book, I. Chem. E., SYMPOSIUM SERIES NO 162, Hazards 27.
- Health and Safety Executive, HSE (1975), ‘The Flixborough Disaster : Report of the Court of Inquiry’, HMSO, ISBN 0113610750L.
- Nielsen, D.S., 1971. The Cause/Consequence Diagram Method as a Basis for Quantitative Accident Analysis. Tech. Rep., Danish Atomic Energy Commission, Roskilde, Denmark.
- Reference to ICI Plc Hazan Course Notes 1979 www.bowtiepro.com/bowtie_history.asp.
- CCPS/EI, (2018), Bow Ties in Risk Management: A Concept Book for Process Safety, ISBN 978-1-119-49039-5.
- Hollnagel, E. (2012), The Functional Resonance Analysis Method.
- Hollnagel Barriers?
- Slater et al. (2024) FRAMily 2024.
- Hollnagel Resilience potentials.
- LOPA Centre for Chemical Process Safety (CCPS). (2007). Guidelines for Risk Based Process Safety. John Wiley & Sons.
- Hill, R. The FMV.
- Risk Matrices.
- PSLG. (2009). Safety and environmental standards for fuel storage sites. Process Safety Leadership Group, Health and Safety Executive.
- HSE. (2011). Buncefield: Why did it happen? Retrieved from http://www.hse.gov.uk/comah/buncefield/buncefield-report.pdf.
- CDOIF. (2012). Other Products in Scope. Chemicals and Downstream Industry Forum incl. Health and Safety Executive. Retrieved 2016, from http://www.hse.gov.uk/aboutus/meetings/committees/cif/resources.htm: http://www.hse.gov.uk/aboutus/meetings/committees/cif/pslg-other-products.pdf.
- PSLG. (2009). Safety and environmental standards for fuel storage sites. Process Safety Leadership Group, Health and Safety Executive.
- CDOIF. (2013). Guidance - Leak Detection. Chemicals and Downstream Industry Forum - HSE. Retrieved from http://www.hse.gov.uk/aboutus/meetings/committees/cif/leak-detection-guide.pdf.
- CSB (2011) .Final report of the President’s National Commission on the BP Deepwater Horizon Oil Spill and Offshore Drilling : oversight hearing before the Committee on Natural Resources, U.S. House of Representatives, One Hundred Twelfth Congress, first session, Wednesday, January 26, https://www.loc.gov/item/2011388947/.
- Slater, D. (2023), Was the Deepwater Horizon a Normal Accident, Safety Science. [CrossRef]
- Ale, BJM. And Slater, DH.,(2024), The Origins of the BOW TIE Risk Methodology (in preparation).
Disclaimer/Publisher’s Note: The statements, opinions and data contained in all publications are solely those of the individual author(s) and contributor(s) and not of MDPI and/or the editor(s). MDPI and/or the editor(s) disclaim responsibility for any injury to people or property resulting from any ideas, methods, instructions or products referred to in the content. |
© 2024 by the authors. Licensee MDPI, Basel, Switzerland. This article is an open access article distributed under the terms and conditions of the Creative Commons Attribution (CC BY) license (http://creativecommons.org/licenses/by/4.0/).
Copyright: This open access article is published under a Creative Commons CC BY 4.0 license, which permit the free download, distribution, and reuse, provided that the author and preprint are cited in any reuse.


