
Submitted:
11 June 2024
Posted:
12 June 2024
You are already at the latest version
Abstract
Biological nitrogen fixation (BNF) by symbiotic bacteria plays a vital role in sustainable agriculture. However, current quantification methods are often expensive and impractical. This study explores the potential of Raman spectroscopy, a non-invasive technique, for rapid assessment of BNF activity in soybeans. Raman spectra were obtained from soybean plants grown with and without rhizobia bacteria to identify spectral signatures associated with BNF. δN15 isotope ratio mass spectrometry (IRMS) was used to determine actual BNF percentages. Partial least squares regression (PLSR) was employed to develop a model for BNF quantification based on Raman spectra. The model explained 80% of the variation in BNF activity. To enhance the model's specificity for BNF detection regardless of nitrogen availability, a subsequent elastic net (Enet) regularization strategy was implemented. This approach provided insights into key wavenumbers and biochemicals associated with BNF in soybeans.
Keywords:
Pattern recognition
; chemometrics
; precision agriculture
; non-destructive
; rhizobia
; symbiosis
1. Introduction
Biological nitrogen fixation (BNF) is an essential process for sustainable agriculture as it can provide a cost-effective alternative to synthetic nitrogen fertilizers [1,2]. Several methods have been developed for measuring BNF, including the acetylene reduction assay, the natural abundance method, and the δN15 isotope dilution method. The natural abundance method which is the most accurate method for BNF measurement, is a destructive and time-consuming procedure [2].
Isotope ratio mass spectrometry (IRMS) [3] is considered the gold standard and the most direct measure of N2 fixation by incorporating 15N2 [2], but it is not practical for high-throughput screening or in-field applications.
Nitrogen balance calculations can be utilized to estimate N2 fixation by analyzing long-term changes in total soil nitrogen and crop nitrogen uptake. However, the nitrogen balance can only provide an estimate of potential fixation over a long time and does not directly measure nitrogen fixation.
Indeed, none of these methods offer a fast, reliable, cost-effective, and non-destructive method to measure BNF, and this remains a challenge.
In recent years, Raman spectroscopy (RS) has emerged in agriculture and plant biology [4]. RS is based on the inelastic scattering of photons by molecular vibrations, which produces a characteristic spectrum of the sample.
Conventional Raman (CR) spectroscopy has several advantages over other analytical methods, including non-destructiveness, no need to do sample preparation, and the ability to analyze multiple metabolites simultaneously [2,5,6].
The process of amino acid synthesis occurs in the root system of legumes and the exported substances are mostly used in the aerial part of the plant for photosynthesis. RS has been used to analyze various plant metabolites, including amino acids [7], sugars [8,9], and nucleic acids [10]. RS has been used for the analysis of secondary metabolites in medicinal plants, detection of plant stress responses, and analysis of plant growth regulators [11].
Symbiosis between plant and bacteria in the root system of legumes yields nitrogen fixation. Such plant-microbe interactions have also been analyzed using RS of cultured bacteria extracted from the rhizosphere [12]. The nitrogen fixation rate can also be measured by using a closed chamber on the plant and continuously analyzing its gas exchange with a Raman gas analyzer [13].
Macro measurements of Raman spectra of plant organs can be challenging because different plant parts can have varying chemical compositions. For example, leaves, stems, and roots can differ significantly in their chemical content, and even different parts of the same organ (e.g., distance from the petiole) can exhibit different chemical profiles. Therefore, it may be necessary to take measurements from specific regions or to use chemometric techniques to account for and analyze these variations. In addition to the composition of the compounds, the orientation of the molecules in the cellular structure of the tissue also affects the polarized Raman spectra of the tissue [14].
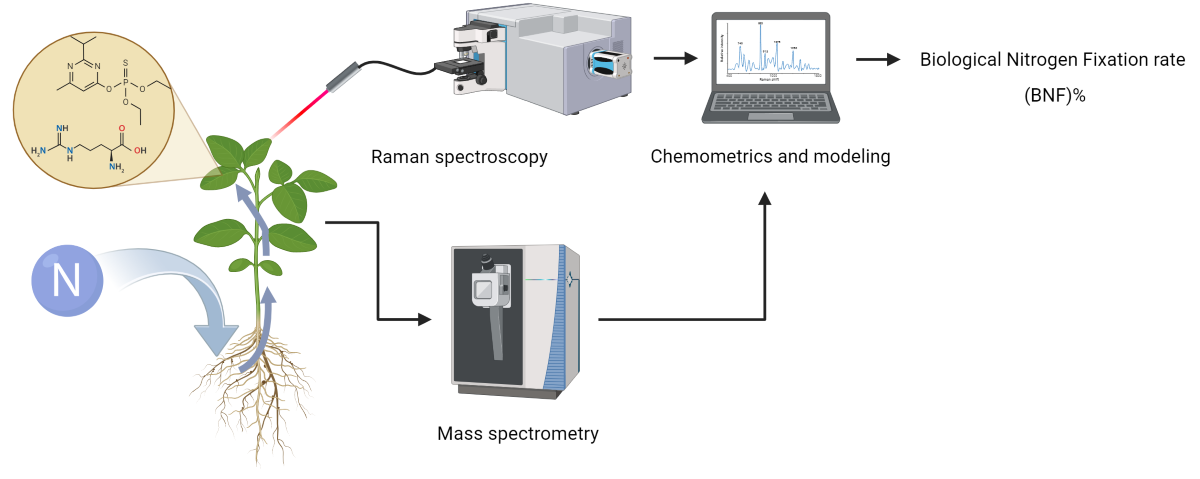
The objective of this study was to explore the potential of RS as a non-invasive, high-throughput method for measuring biological nitrogen fixation (BNF). Given that BNF is a plant activity that can lead to the production of specific metabolites or change the energy consumption of the plant, it can either directly affect the Raman spectra of plant tissue or alter the composition of other chemical compounds in the tissue, ultimately leading to changes in the Raman spectra. We hypothesized that these spectral variations could be linked to BNF activity, allowing for its quantification. In particular, we aimed to determine if different levels of nitrogen fixation in soybean plants could be traced through changes in the Raman spectra of their leaves.
2. Materials and Methods
The effect of nitrogen concentration on the suppression of nitrogen fixation is well known [15,16,17,18]. Therefore, in this study, nitrogen concentration was used as an agent to provide different levels of nitrogen fixation. To achieve different nitrogen fixation rates, we took advantage of the fact that nitrogen fixation is suppressed when there is adequate nitrogen in the rooting medium.
The exchange of nitrogen for carbohydrates between plants and bacteria is halted when sufficient nitrogen is available in the soil, which means that legumes no longer provide their carbohydrates to host rhizobia in return for fixed nitrogen, which comes at an energy cost to the plant [19]. Using this phenomenon, we prepared growth media with varying nitrogen concentrations to provide various levels of nitrogen fixation. Specifically, we grew soybean plants in vermiculite using four different nitrogen concentrations (2 mM, 6 mM, 10 mM, and 14 mM solutions of ammonium nitrate) under controlled conditions in a growth chamber, with five replications for each treatment.
Non-genetically modified soybeans (Glycine max L. cv. Sonya) were grown in a semi-sterile and closed system with precise amounts of N added for six weeks. For this, 4-liter pails (n=56) were filled with vermiculite (grade 2; compressed). Each box was filled with 2.2 L McKnights solution [20,21] and autoclaved (30 min, wet cycle, 121° C) to eliminate any background rhizobia present. The lids of the boxes were drilled to make a 1.5 cm hole in the center for the plant stem to emerge, before autoclaving. Soybean seeds were surface sterilized (70% ethanol, 30 s; 1% NaOCl, 2 min; 4X rinses, sterilized deionized water, 30 s) and pre-germinated for 6 days (22° C; dark) in a 5 cm deep bed of vermiculite and water (3:1; autoclaved) in trays. The healthy seedlings were then transplanted into the boxes under sterile conditions, carefully placed through the holes on the lids, at one seedling per box. The seedlings were allowed to establish for 2 days in a clean growth room with 600 µmol/m2/s of light for 16 h day at 24°C and 8 h night at 19°C.
The Rhizobia-inoculated plants were inoculated with a pipette at the base of the seedling with 1×10⁷ colony forming units (cfu) of Bradyrhizobium japonicum (Strain ICMP3163, Landcare research) twice, on day 1 (day of inoculation; 8 days from germination) and again on day 8 to give the seedlings the maximum chance of nodule formation. Nitrogen (N) was added as 5% atom 15N ammonium nitrate (Sigma Aldrich) at concentrations of 2, 6, 10 and 14 mM of N. To account for increasing N requirements of the plant while growing, N was not added all at once, but was split into four doses of 10%, 20%, 30%, and 40% added on days 1, 8, 15, and 22, respectively. Plants were watered with sterilized deionized water as and when needed.
While different inorganic nitrogen concentrations have an impact on the BNF rate, it is important to note that the target values for model construction (the ground truth) were the BNF rates that had been determined by measuring the isotope ratio mass spectrometry (IRMS) test.
2.1. Experimental Design
Designing treatments with different levels of nitrogen fixation presents a challenge, as we needed to use an agent to provide different fixation levels, which in turn would change the spectral features of the plant. Consequently, it becomes difficult to discern whether the observed variations in the plant spectra are primarily attributed to changes in nitrogen fixation or the introduced manipulation agent (ammonium nitrate). Because we used nitrogen level as the manipulating agent, the question remains whether any detected pattern corresponds to BNF variation or merely represents the changes in nitrogen concentration.
To discriminate between BNF-caused traits on the spectra from those due to nitrogen variation, two sets of treatments were prepared: fixing versus non-fixing sets (Figure 1).
Soybean samples in the non-fixing set were grown under completely sterile conditions to ensure that no bacteria for nitrogen fixation existed in the growing medium, while the other set was inoculated with Bradyrhizobium japonicum bacteria.
The procedure began with constructing a model based on the Raman data from the fixing set, which was capable of taking Raman spectra of the leaves as input and delivering nitrogen fixation rates as output. To achieve this, the input data was needed to cover the full range of nitrogen fixation variations. In addition, it is important to note that while we provided the plants with varying nitrogen concentrations, this did not guarantee a uniform distribution of BNF rates across the range. To address this, we conducted δN15 measurements to assess BNF variations in the samples and determine the nitrogen accumulated in the plants at the time of measurement.
The schematic illustration in Figure 1 explains the experimental design, including the division of plants into two groups: those inoculated with nitrogen-fixing bacteria (BNF set) and those grown without bacteria (non-fixing set). The figure also depicts the expected observations of the two groups under varying nitrogen treatments. This design serves as a key control experiment to validate the specificity of the models in BNF measurement. We compared the Raman spectral patterns of both groups to assess if the model is capturing general nitrogen responses or changes specific to nitrogen fixation.
If the spectral patterns in both sets followed the same trends with varying nitrogen levels, it would indicate the model might be capturing general nitrogen responses rather than changes specific to nitrogen fixation. This would suggest the method is unsuitable for BNF quantification.
Our δN15 isotope ratio mass spectrometry (IRMS) experiments confirmed that at six weeks after germination, soybean plants in the BNF set achieved a mature symbiotic state with the bacteria fully supplying their nitrogen needs.
Hence, it is reasonable to anticipate that six weeks after inoculation, there should be no discernible differences in N-related traits within the spectra of fixing plants, while the N-related distinctions may persist in the non-fixing set. Nevertheless, it is worth exploring the possibility of residual effects from prior nitrogen deficiency in the spectra of fixing plants.
To develop a robust method that specifically measures BNF (irrespective of the variations in nitrogen levels), the method should be evaluated with non-fixing samples to ensure that the model does not simply detect nitrogen variation.
2.2. Raman Spectra Acquisition
Raman spectra were acquired from the first fully developed leaves of soybean plants using a spectrophotometer (Horiba iHR320, Japan). To balance the reduction of plant tissue fluorescence and the collection of strong Raman signals, a 785 nm laser source with 350 mW power was employed for excitation.
To ensure that all sampling spots were precisely positioned within the focal point of the laser beam, a fixture was utilized to securely hold the leaves in place and prevent de-formation and local undulation of the leaf surface. Raman spectra were collected from the samples within the range of 400 cm-1 to 1800 cm-1. Each spectrum was acquired with an acquisition time of 20 s and three accumulations. To enhance the signal-to-noise (S/N) ratio, three measurements were taken from nearly the same spot on the leaves. However, due to the potential for severe dehydration or burning of the leaf texture with the employed laser intensity and acquisition time, the data acquisition spot was slightly shifted by approximately ±2 mm in each iteration relative to the initial spot.
2.3. Data Processing and Analysis
Data preprocessing steps were carried out on the collected spectra, which included the removal of cosmic rays and smoothing of Raman spectra to eliminate random noise. Different combinations of polynomial orders and kernel sizes were tested using Savitzky-Golay filters. Ultimately, a filter with a polynomial order of 13 and a frame length of 51 exhibited the best performance in terms of effectively eliminating random noise while preserving the essential Raman peaks. Consequently, this specific filter configuration was selected for the subsequent processes.
Despite using a 780 nm laser, the Raman spectra of the soybean samples still exhibited significant fluorescence intensity. To address this, a baseline detection procedure [22] was employed, with a modification that used an iterative moving average approach instead of polynomial kernels. The modification was justified based on a comparison between the results obtained from the two types of kernels, i.e., moving average versus polynomials.
After conducting a preliminary evaluation of the baseline-subtracted spectra, a kernel size of 50 wavenumbers with 50 iterations of the application showed the optimum performance in extracting the pure Raman peaks from the fluorescence-induced baseline. The application was programmed using MATLAB.
To remove variations in intensity caused by factors such as sample thickness, laser power fluctuations, and detector sensitivity, the average magnitude of the filtered spectra of the 15 measurements (5 replications, 3 measurement points) were normalized at carotenoid β peak [23] at 1525 cm-1.
Detection of BNF-related patterns was performed by developing partial least square regression (PLSR) models on the Raman data collected from the leaves of the “Fixing set” plants. The quality of the model fit was assessed using two parameters: the coefficient of determination (R²) and root mean square error (RMSE) of both the calibration and cross-validation sets obtained through LOOCV (leave-one-out cross-validation).
2.4. Model Regularization
The target BNF estimation by the model for the non-fixing samples was expected to be zero. To refine the BNF information from the Raman spectra of the N-related variations due to nitrogen concentrations applied to the root medium, model regularization was needed. As illustrated in the final stage of Figure 1, this regularization procedure was carried out using elastic net (ENet) reqularisation.
This procedure involves adjusting the influential vectors of the model to achieve a target null value for the non-fixing set. While this adjustment may reduce the model's performance on the fixing set, it results in a more specific BNF determination model. We determined the trade-off point between maximizing BNF sensitivity and minimizing N sensitivity by applying elastic net regularization of the model.
Although the concept of regularization is applied here, there is a difference between the common concept of regularization with what applied in this study. Here, instead of adjusting the model to reduce variance on the validation set, we regularize the model to yield the lowest values for the non-fixing set to minimize the model sensitivity to nitrogen concentration. The refined performance indices would indicate the extent of information in the Raman spectra that could be representative of BNF.
Elastic net (EN) regularization is a combination of the two methods of regularization, namely, L1 (lasso regularization) and L2 (Tikhonov or ridge regularization). In any of these three approaches (L1, L2 and EN) regularization terms or penalties are introduced to the ordinary least squares cost functions to minimize the variance of the models.
The regularization strength is typically controlled by the hyperparameter λ which determines the amount of shrinkage applied to the coefficients. The model coefficients, β and β0 are calculated by minimizing the cost function J(β) [24] as follows:
where
Pα(β): Elastic net’s penalty term
In this study, we aimed to reduce the sensitivity of the model to factors mostly indicative of nitrogen concentration, so that yield the lowest possible value for this plant set. The result of this regularization process will determine the optimum λ that yields the lowest BNF for the non-fixing plants. To incorporate an equal proportion of L1 and L2 penalties in the cost function, α=0.5 was considered.
It is worth noting that while this regularization process may diminish the model’s performance for the fixing set, it will tailor the model specifically to the BNF measurement.
3. Results and Discussion
The general patterns of the Raman spectra from both “Fixing” and “Non-fixing” soybean leaves were quite similar, with the most evident variations occurring at the Raman peaks 747, 1160, 1189, 1272, and 1525 cm-1. The averages and standard deviations of the collected spectra are shown in Figure 2.
Following the first step depicted in Figure 1, the PLSR models developed on the Raman data of the "Fixing set" showed that BNF estimation from the leaves’ spectra is possible (Figure 3a).
3.1. Model Optimization
We assessed the impact of various combinations of normalization and standardization techniques, including area normalization, standard normal variate (SNV), and multiplicative scatter correction (MSC), on the performance of the model. This evaluation demonstrated not an improvement but rather reductions in the performance of the mod-el. Therefore, it was concluded that the intensity of the Raman data is as crucial as the relative intensity of the Raman shifts. Hence, standardizing or normalizing the Raman data would deprive the model of this important information.
It can be seen in Figure 3 that the constructed model exhibited significant variance, representing notable disparities between model accuracies in calibration and cross validation data, which was a sign of overfitting. Overfitting occurs when the model memorizes the variations in the training data rather than learning the overall patterns of the variations. Consequently, this can reduce the model’s robustness when applied to conditions different from those in the experiment. This issue could be mitigated by eliminating the features of low importance in the model.
Incorporating the entire Raman spectrum into the modeling process has the drawback of potentially causing over-fitting as there are numerous features involved in the model, increasing the chance of memorization.
The divergence between the variances explained by the model during the training and cross-validation is another sign of potential overfitting (Figure 3b), suggesting that there are some features that could be omitted from the model. Although this omission might lead to a performance reduction in the calibration set, it could improve the validation results and enhance the model’s generalizability. Particularly considering the already high explained variances on the training set (100% with 7 factors), there would be a good potential for the model to reduce the variance of the validation (Figure 3b).
As the first step towards variable reduction in the model, the involvement of the peaks instead of the entire spectrum was tried. One of the advantages of RS compared with NIR spectroscopy and hyperspectral imaging is that the Raman peaks are associated with specific molecule bonds and can be indicative of specific molecules or compounds. Therefore, it is more explicable to provide a model with the peaks rather than the entire spectrum. Consequently, the performance of the models was assessed when instead of using the whole spectrum (comprising 1097 wavenumbers), the distinctive Raman peaks (Table 1) were used for BNF estimation modeling. In this case, there would be a few countable wavenumbers as input features rather than whole spectral features.
For this aim, the variables importance in projection (VIP) scores were utilized to identify the most influential features in the model. Variables with a VIP score lower than 1 [25] were selected as less important and eliminated from the PLSR model. Figure 4a depicts the performance of the model when specific Raman peaks were employed in the BNF model.
The explained variances of the model indicated that the model improved generalizability compared with the one constructed using the entire spectrum (Figure 4b). It is also important to note that the model achieved its highest performance when only the first three PLS factors were utilized, and they were able to account for 80% of the variations in the Raman peaks.
Under sterile conditions used for growing the non-fixing set, nitrogen fixation in the samples was effectively not occurring. This was confirmed through root system inspection, which revealed the absence of nodules on the roots, indicating the inability of the non-fixing sample set to perform nitrogen fixation.
These results validate the initial condition depicted in Figure 1, affirming that specific features in the Raman spectra of leaves can indeed represent nitrogen fixation rates. Yet, as a subsequent confirmatory measure, it was crucial to assess the model’s performance by utilizing spectra from the non-fixing sets, where the plants were subjected to different levels of nitrogen treatment.
3.2. Regularization Results
The model was verified to assess the extent of exclusivity in BNF estimation, irrespective of the nitrogen levels provided to the plant. When fed with Raman spectra from leaves of non-fixing plants, the model yielded an average value of 13.7% for these plants.
Although the experimental design aimed to eliminate the impact of nitrogen variations on the model, Figure 5 reveals some, albeit minor, correlations between BNF variations and nitrogen concentration. This suggests that certain features in the Raman spectra of the leaves still contain information about nitrogen variations in the plant.
Regularization at this step was tried to further refine the BNF related Raman peaks and determine potential chemical compounds associated with the peaks.
The variation of the model coefficients at various lambda values is depicted in Figure 6. Increasing the penalties on the model reduces sensitivity and, in some cases, eliminates certain features, depending on the chosen threshold.
The aim of regularization in this study was to decrease the sensitivity of the model to features (wavenumbers) associated with nitrogen concentration rather than nitrogen fixation. The optimal combination of coefficients was determined based on the minimum output of the elastic net (ENet) model at various lambda values. Figure 7 illustrates the optimal point at lambda=20, where the minimum BNF output of 12.6 is attained for the non-fixing set.
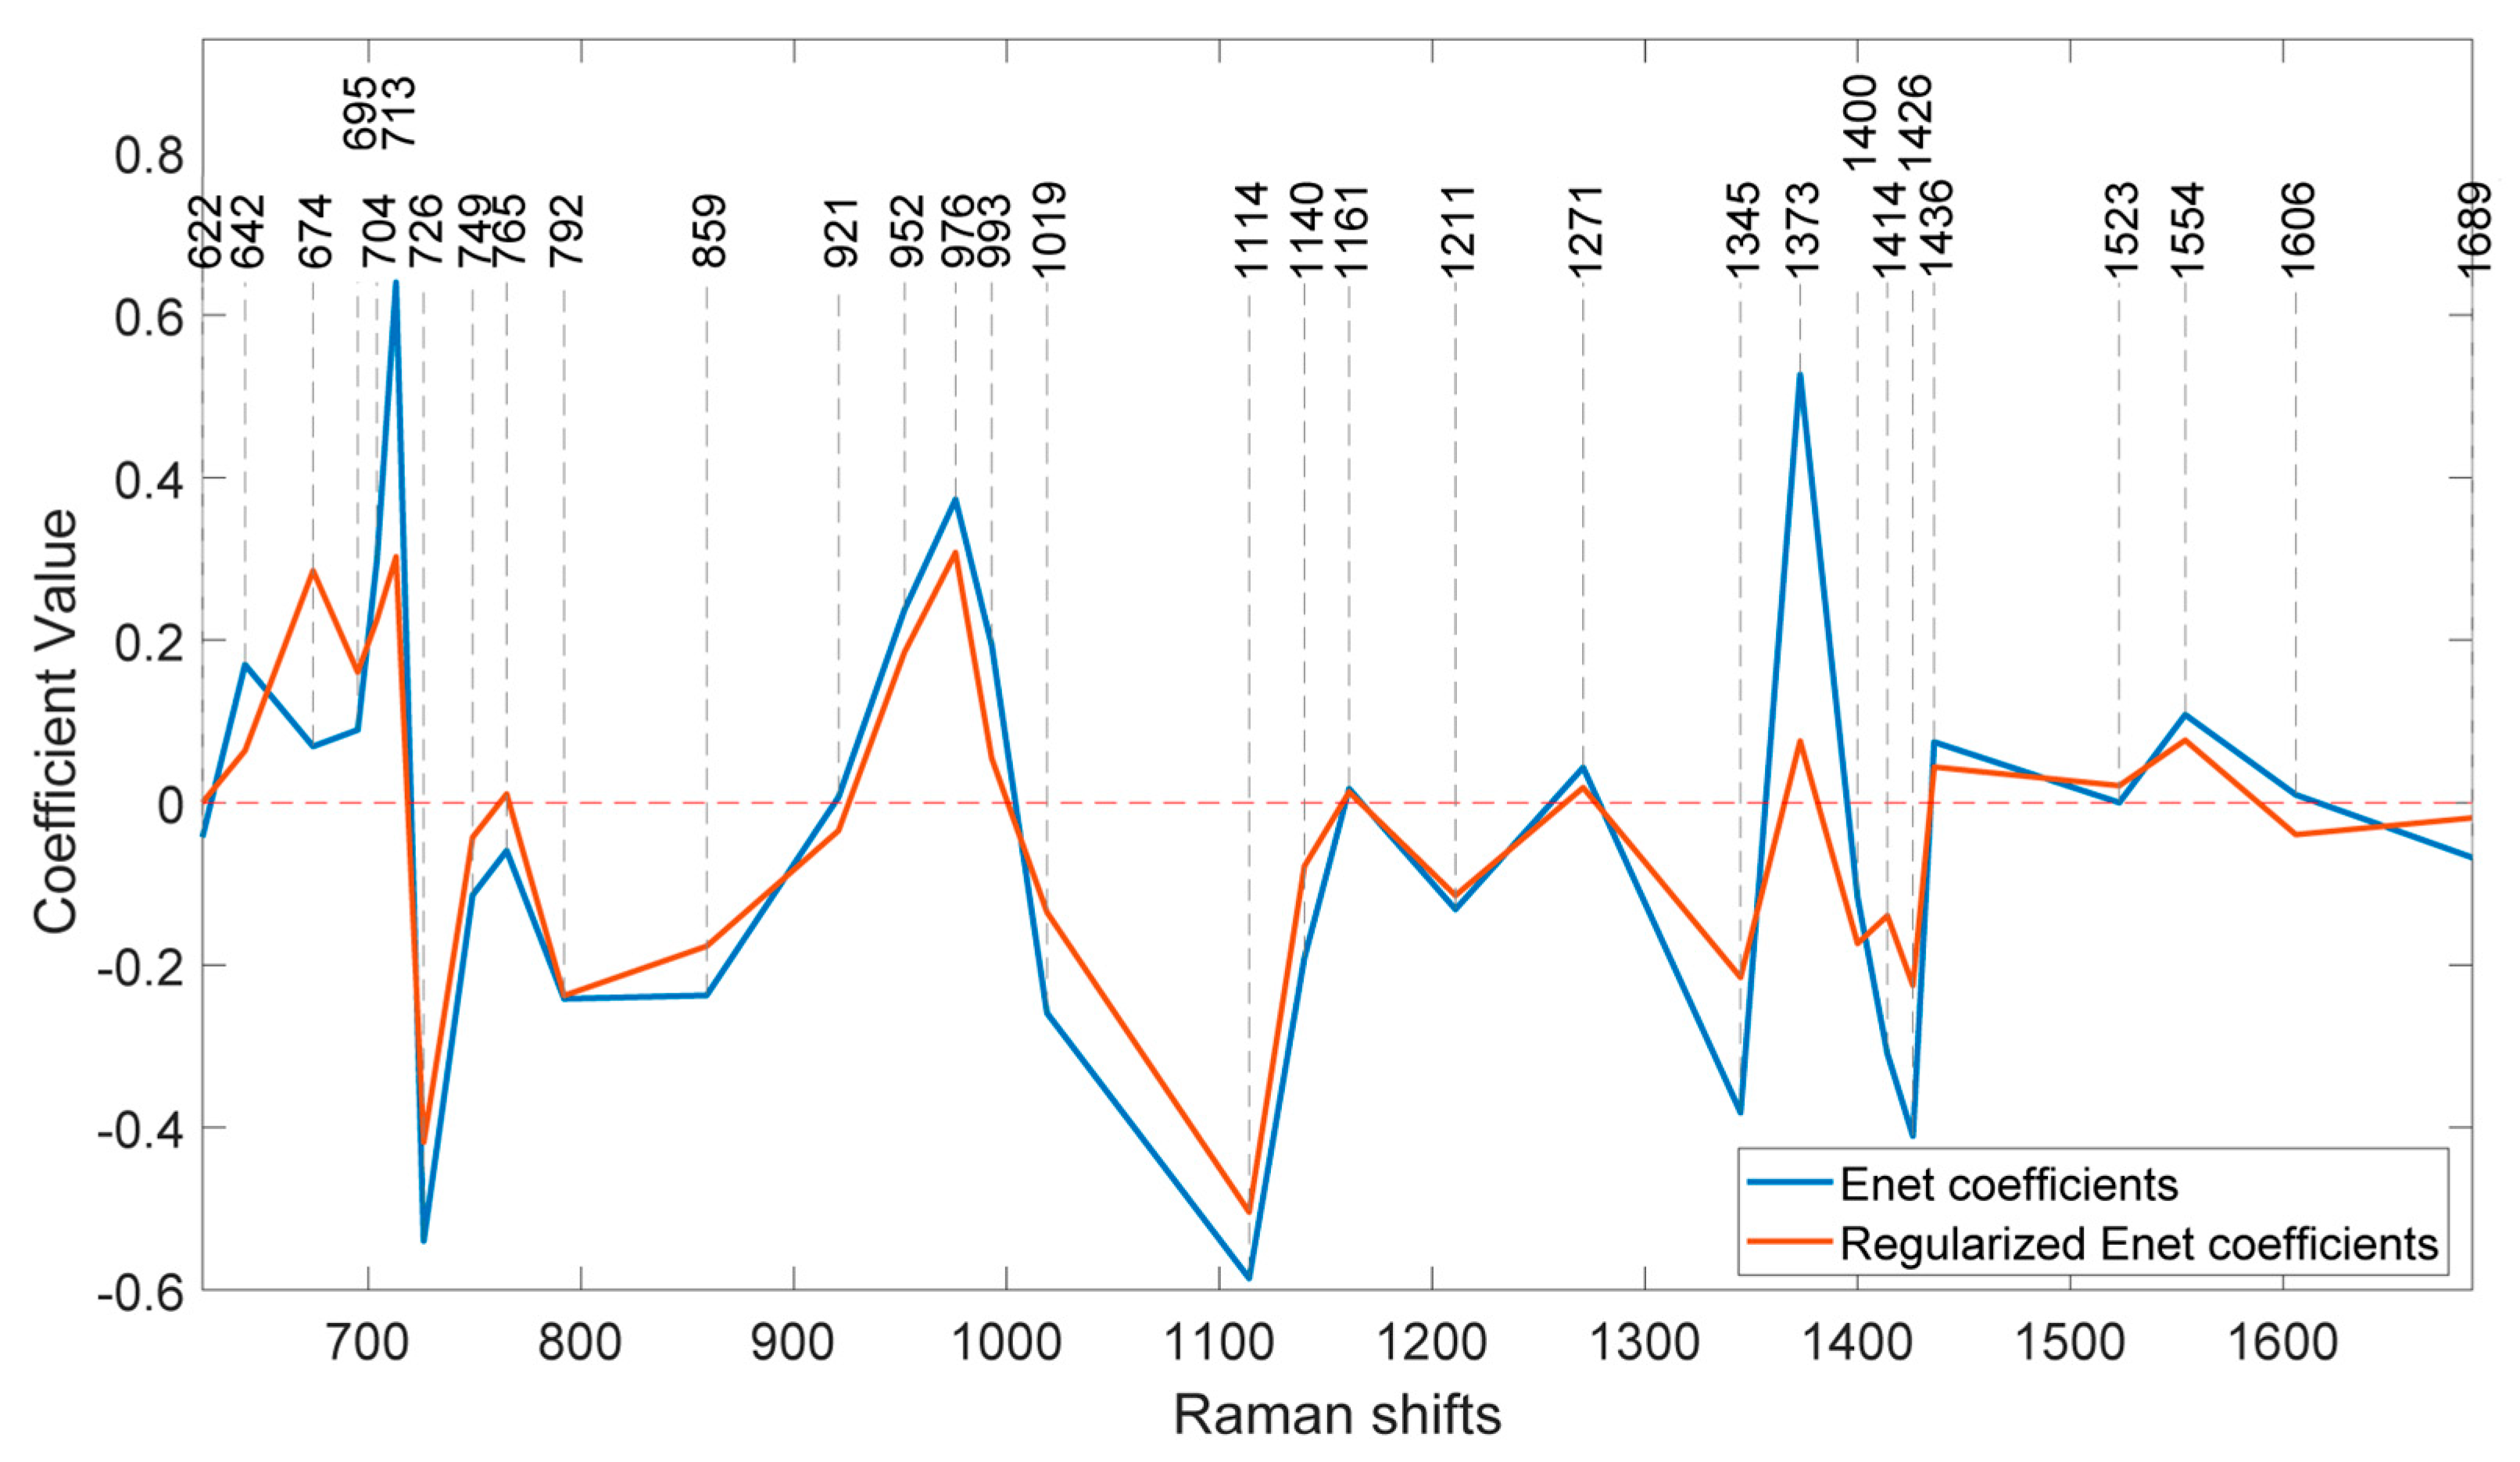
At this stage, the coefficients of the features in the model at the optimum lambda can be determined. Figure 8 illustrates the coefficients of the model without regularization (lambda=0) and at the optimal regularization (lambda=20) which corresponds to a BNF% of 12.6 % for the non-fixing set.
It is evident that the effects of regularization were not uniform across all features. Wavenumbers with significantly reduced values after regularization can be attributed to nitrogen concentration, indicating a lesser contribution to biological nitrogen fixation (BNF).
Additionally, the direction of change in the coefficients is also different across the peaks. For instance, at 674 cm-1, the regularized BNF model shows a higher value than the non-regularized model, while the coefficient at 713 cm-1 has decreased.
There are also some coefficients that vanished as a result of the second lasso (L1) penalty. To segregate the most BNF related peaks, a set of wavenumbers with coefficients larger than 0.1 having more than 10% reduction in the regularized model would select 15 out of the 31 features as represented in Table 1.
It is intriguing that the two distinct bands at 1160 cm-1 and 1525 cm-1, assigned to carotenoids (Figure 1), do not play important roles in biological nitrogen fixation (BNF), despite being strong indicators of plant greenness and nitrogen uptake. Carotenoids exhibit two robust Raman bands due to stretching vibrations of the polyene chain [26]. Given that changes in nitrogen concentration directly affect the chlorophyll content of leaves, these peaks were expected to hold a prominent position in nitrogen estimation models.
The table also shows that the peaks indicative of BNF are not the largest or most distinctive peaks in the leaf spectrum; rather, the BNF information is contained in relatively lower intensity Raman peaks.
One interesting observation is that, although the coefficients of the regularized model have decreased at most peaks, there is an increase observed at the peak corresponding to 674 cm-1. This peak is associated with C–C–O rocking and deformation in glycerol [27]. This finding is particularly intriguing considering the abundant presence of glycerol in soybeans [28] and shows that the effect of nitrogen fixation can be traced in concentration of glycerol.

Table 1.
Assignments of vibrational bands to the influential Raman peaks in BNF specific model developed for soybean plants.
Table 1.
Assignments of vibrational bands to the influential Raman peaks in BNF specific model developed for soybean plants.
| Band (cm-1) | Vibrational mode | Assignment |
|---|---|---|
| 674 | ν(C–C–O) + δ(C–C–O) | Carbohydrates [29] Glycerol [27] |
| 695 | δ(C-C-H) twisting | Cellulose Avicel (II) [30] |
| 704 | ring deformation | Cytosine [31] |
| 713 | C–S–C asymmetric stretch; H2O rocking | Isoleucine, methionine [32] |
| 726 | ring breath | Adenine [33] |
| 859 | τ (C –N) | Arginine, Serine [32] |
| 952 | δ (CCH), δ(COH) | Pectin [34] |
| 976 | CH2 rocking | Glycerol [27] |
| 1019 | C–O–H deformation | Alcoholic hydroxyl [32] |
| 1114 | νs(C-O-C) | Glycosidic ring breathing [35], Cellulose [36] |
| 1211 | δ(> C = C - C-) β-ring | β-Carotene [37-39] |
| 1345 | ν(C–O); δ(C–O–H) | Carbohydrates [29] |
| 1400 | ν; δ(C–OH)COOH; δs(CH3) | Pectin [34], β-carotene [37], Cellulose [36] |
| 1414 | δ(C-H) | Deoxyadenosine triphosphate [27] |
| 1426 | νs(COO-); CH2 deformation | Aspartic acid, glutamic acid, methionine [27],[32] |
Soybeans are considered as a complete protein source, containing all nine essential amino acids. The peak at 713 cm-1 can be attributed to protein elements and amino acids such as isoleucine and methionine [32]. Isoleucine is essential for nitrogen metabolism, and changes in the source of nitrogen uptake may influence its production. The quantity of isoleucine in plant leaves varies depending on factors such as plant species, growth conditions, and leaf part. While plant leaves are generally not rich sources of isoleucine compared to animal products, soybeans stand out for good isoleucine content [40].
The peak at 726 cm-1 can also be assigned to adenine [33], a fundamental building block of DNA and RNA. Peak positions can shift depending on factors like the pH of the environment. This peak is often attributed to in-plane ring breathing vibrations within the adenine molecule.
Serine and arginine are other important amino acids for legumes, playing crucial roles in their growth and development, and they exhibit a prominent peak at 859 cm-1 [32]. A recent study [41] suggests that arginine serves as a precursor molecule in nitrogen fixation process, providing the necessary building blocks for the bacteria. This research proposes a metabolic cycle where plant-provided arginine and succinate fuel the nitrogen-fixing bacteria within the nodules.
The peak at 1426 cm-1, the last nitrogen-related peak, may result from overlapping peaks of various amino acids such as aspartic acid, tryptophan, valine, and methionine [32]. Nitrogen, in its structural molecule, contributes to the vibration at 1426 cm-1, where the bond is attributed to the carboxyl group connected to the amino group NH2. The accumulation of intensity from the peaks of these amino acids at this wavenumber can compensate for the low concentration of each individual amino acid in soybean plants. Although the combination of wavenumbers selected by our approach demonstrated effective performance in discerning biological nitrogen fixation (BNF), it is not inherently exclusive. The substantial collinearity among the spectral features suggests that alternative Raman wavenumbers could convey similar levels of information. Consequently, insights derived from these data might be transferable through different combinations of Raman shifts. As a result, models with diverse specifications and input variables may achieve comparable performance.
4. Conclusions
This study confirmed that biological nitrogen fixation (BNF) in legumes is a plant activity that induces changes in the Raman spectra of leaves. The Raman spectra of legumes revealed valuable information about BNF activity, allowing for the estimation of nitrogen fixation levels.
Nitrogen abundance was used as the control parameter for regulating nitrogen fixation. Given nitrogen's role in influencing the extent of nitrogen fixation, it was imperative to refine the BNF estimation model to account for the effects induced by nitrogen.
The experimental grouping of fixing and non-fixing plants proved to be effective for training and regulating a model exclusively tailored to determine the BNF ratio in soybean plants.
The results from partial least squares regression (PLSR) for fixing plants supported our hypothesis. Nitrogen fixation, potentially accompanied by metabolic changes, induced unique spectral signatures in the leaves. These signatures correlated well with the plants' nitrogen fixation rates. Notably, applying the model to non-fixing plants with varying nitrogen levels produced minimal BNF values. This demonstrates that the model selectively identifies features indicative of BNF, rather than simply reflecting overall plant nitrogen content.
Various metabolites are generated as a result of plant activity, raising the expectation that information related to BNF can also be encoded in different chemicals and Raman bands. This suggests that the Raman bands proposed for BNF detection in this study may not be entirely unique. However, the novelty of the results presented here is related to the incorporation of the structural characteristics of BNF-related molecules with multiple Raman peaks into a unified model derived from RS data.
Our findings confirm the presence of specific patterns in the Raman data that serve as fingerprints of the biological nitrogen fixation (BNF) process, enabling their utilization for quantifying nitrogen fixation. As various factors influence biological nitrogen fixation in legumes, it is crucial to explore the impact of other parameters on the performance of the BNF measurement model to ensure its applicability in diverse field conditions.
Author Contributions
Conceptualization, A.W. and A.J. and V.H.V; methodology, A.J. and K.S. and A.W. and V.H.V. and R.H. and S.S.; software, A.J.; validation, A.J. and K.S.; formal analysis, A.J.; investigation, A.J. and K.S.; resources, A.W. and V.H.V.; data curation, A.J. and K.S.; writing—original draft preparation, A.J.; writing—review and editing, A.J. and K.S. and A.W. and V.H.V. and R.H. and S.S.; All authors have read and agreed to the published version of the manuscript.
Funding
This research was funded by New Zealand Ministry of Business, Innovation & Employment, to AgResearch, grant number C10X1804.
Institutional Review Board Statement
Not applicable
Informed Consent Statement
Not applicable
Data Availability Statement
The original data presented in the study are openly available in FigShare at 10.6084/m9.figshare.25909780
Conflicts of Interest
The authors declare no conflicts of interest
References
- Hardarson, G.; Danso, S. Methods for measuring biological nitrogen fixation in grain legumes. Plant and soil 1993, 152, 19–23. [Google Scholar] [CrossRef]
- Unkovich, M.; Baldock, J. Measurement of asymbiotic N2 fixation in Australian agriculture. Soil Biology and Biochemistry 2008, 40, 2915–2921. [Google Scholar] [CrossRef]
- Alonso, J.; Gonzalez, P. Isotope dilution mass spectrometry; Royal Society of Chemistry: 2019.
- Saletnik, A.; Saletnik, B.; Puchalski, C. Overview of popular techniques of Raman spectroscopy and their potential in the study of plant tissues. Molecules 2021, 26, 1537. [Google Scholar] [CrossRef]
- Zavafer, A.; Ball, M.C. Good vibrations: Raman spectroscopy enables insights into plant biochemical composition. Functional Plant Biology 2022. [Google Scholar] [CrossRef]
- Sharma, S.; Bharti, A.; Singh, R.; Uttam, K. Non-destructive, label free evaluation of the biochemical profile associated with the growth and ripening process of jamun fruit by confocal micro Raman spectroscopy. Analytical Letters 2022, 55, 812–827. [Google Scholar] [CrossRef]
- Schulz, H.; Baranska, M. Identification and quantification of valuable plant substances by IR and Raman spectroscopy. Vibrational Spectroscopy 2007, 43, 13–25. [Google Scholar] [CrossRef]
- De Moliner, F.; Knox, K.; Gordon, D.; Lee, M.; Tipping, W.J.; Geddis, A.; Reinders, A.; Ward, J.M.; Oparka, K.; Vendrell, M. A Palette of Minimally Tagged Sucrose Analogues for Real-Time Raman Imaging of Intracellular Plant Metabolism. Angewandte Chemie 2021, 133, 7715–7720. [Google Scholar] [CrossRef]
- Gersony, J.T.; McClelland, A.; Holbrook, N.M. Raman spectroscopy reveals high phloem sugar content in leaves of canopy red oak trees. The New Phytologist 2021, 232, 418–424. [Google Scholar] [CrossRef]
- Dina, N.E.; Muntean, C.M.; Bratu, I.; Tican, A.; Halmagyi, A.; Purcaru, M.A.; Coste, A. Structure and surface dynamics of genomic DNA as probed with surface-enhanced Raman spectroscopy: Trace level sensing of nucleic acids extracted from plants. Spectrochimica Acta Part A: Molecular and Biomolecular Spectroscopy 2022, 279, 121477. [Google Scholar] [CrossRef]
- Li, M. Developing Raman sorting and imaging techniques to characterise and differentiate unculturable microbial single cells. University of Sheffield, 2012.
- Polisetti, S.; Baig, N.; Bible, A.; Morrell-Falvey, J.; Doktycz, M.; Bohn, P.W. Using Raman spectroscopy and SERS for in situ studies of rhizosphere bacteria. Proceedings of Biosensing and Nanomedicine VIII 2015. SPIE; pp. 34–38.
- Jochum, T.; Fastnacht, A.; Trumbore, S.E.; Popp, J.r.; Frosch, T. Direct Raman spectroscopic measurements of biological nitrogen fixation under natural conditions: an analytical approach for studying nitrogenase activity. Analytical chemistry 2017, 89, 1117–1122. [Google Scholar] [CrossRef]
- Agarwal, U.; Atalla, R. In-situ Raman microprobe studies of plant cell walls: Macromolecular organization and compositional variability in the secondary wall of Picea mariana (Mill.) BSP. Planta 1986, 169, 325–332. [Google Scholar] [CrossRef]
- Saito, S. Field evaluation of the symbiotic fixation abilities among Rhizobium phaseoli strains [Rhizobium; Symbiotic fixation of nitrogen]. Pesquisa Agropecuaria Brasileira 1982. [Google Scholar]
- Farid, M. Symbiotic nitrogen fixation in common bean. University of Guelph, 2015.
- Akter, Z.; Pageni, B.; Lupwayi, N.Z.; Balasubramanian, P. Biological nitrogen fixation by irrigated dry bean (Phaseolus vulgaris L.) genotypes. Canadian Journal of Plant Science 2018, 98, 1159–1167. [Google Scholar] [CrossRef]
- Reinprecht, Y.; Schram, L.; Marsolais, F.; Smith, T.H.; Hill, B.; Pauls, K.P. Effects of nitrogen application on nitrogen fixation in common bean production. Frontiers in plant science 2020, 11, 1172. [Google Scholar] [CrossRef]
- Friel, C.A.; Friesen, M.L. Legumes modulate allocation to rhizobial nitrogen fixation in response to factorial light and nitrogen manipulation. Frontiers in Plant Science 2019, 10, 481099. [Google Scholar] [CrossRef]
- McKnight, T. Efficiency of isolates of Rhizobium in the cowpea (Vigna unguiculata) group, with proposed additions to this group. 1949.
- Unkovich, M.; Herridge, D.; Peoples, M.; Cadisch, G.; Boddey, B.; Giller, K.; Alves, B.; Chalk, P. Measuring plant-associated nitrogen fixation in agricultural systems; Australian Centre for International Agricultural Research (ACIAR): 2008.
- Lieber, C.A.; Mahadevan-Jansen, A. Automated method for subtraction of fluorescence from biological Raman spectra. Applied spectroscopy 2003, 57, 1363–1367. [Google Scholar] [CrossRef]
- Sanchez, L.; Ermolenkov, A.; Biswas, S.; Septiningsih, E.M.; Kurouski, D. Raman spectroscopy enables non-invasive and confirmatory diagnostics of salinity stresses, nitrogen, phosphorus, and potassium deficiencies in rice. Frontiers in plant science 2020, 11, 1620. [Google Scholar] [CrossRef]
- Zou, H.; Hastie, T. Regularization and variable selection via the elastic net. Journal of the Royal Statistical Society Series B: Statistical Methodology 2005, 67, 301–320. [Google Scholar] [CrossRef]
- Cocchi, M.; Biancolillo, A.; Marini, F. Chemometric methods for classification and feature selection. In Comprehensive analytical chemistry, Elsevier: 2018; Vol. 82, pp. 265–299.
- Qin, J.; Chao, K.; Kim, M.S. Nondestructive evaluation of internal maturity of tomatoes using spatially offset Raman spectroscopy. Postharvest biology and technology 2012, 71, 21–31. [Google Scholar] [CrossRef]
- Pezzotti, G. Raman spectroscopy in cell biology and microbiology. Journal of Raman Spectroscopy 2021, 52, 2348–2443. [Google Scholar] [CrossRef]
- Brentin, R.P. Soy-based chemicals and materials: growing the value chain. In Soy-Based Chemicals and Materials, ACS Publications: 2014; pp. 1–23.
- Almeida, M.R.; Alves, R.S.; Nascimbem, L.B.; Stephani, R.; Poppi, R.J.; De Oliveira, L.F.C. Determination of amylose content in starch using Raman spectroscopy and multivariate calibration analysis. Analytical and bioanalytical chemistry 2010, 397, 2693–2701. [Google Scholar] [CrossRef]
- Agarwal, U.P. 1064 nm FT-Raman spectroscopy for investigations of plant cell walls and other biomass materials. Frontiers in plant science 2014, 5, 103972. [Google Scholar] [CrossRef]
- Madzharova, F.; Heiner, Z.; Gühlke, M.; Kneipp, J. Surface-enhanced hyper-Raman spectra of adenine, guanine, cytosine, thymine, and uracil. The Journal of Physical Chemistry C 2016, 120, 15415–15423. [Google Scholar] [CrossRef]
- Zhu, G.; Zhu, X.; Fan, Q.; Wan, X. Raman spectra of amino acids and their aqueous solutions. Spectrochimica Acta Part A: Molecular and Biomolecular Spectroscopy 2011, 78, 1187–1195. [Google Scholar] [CrossRef]
- Kundu, J.; Neumann, O.; Janesko, B.; Zhang, D.; Lal, S.; Barhoumi, A.; Scuseria, G.; Halas, N. Adenine− and adenosine monophosphate (AMP)− gold binding interactions studied by surface-enhanced Raman and infrared spectroscopies. The Journal of Physical Chemistry C 2009, 113, 14390–14397. [Google Scholar] [CrossRef]
- Synytsya, A.; Čopı́ková, J.; Matějka, P.; Machovič, V. Fourier transform Raman and infrared spectroscopy of pectins. Carbohydrate polymers 2003, 54, 97–106. [Google Scholar] [CrossRef]
- Schenzel, K.; Fischer, S. NIR FT Raman spectroscopy–a rapid analytical tool for detecting the transformation of cellulose polymorphs. Cellulose 2001, 8, 49–57. [Google Scholar] [CrossRef]
- Zhbankov, R.; Firsov, S.; Buslov, D.; Nikonenko, N.; Marchewka, M.; Ratajczak, H. Structural physico-chemistry of cellulose macromolecules. Vibrational spectra and structure of cellulose. Journal of molecular structure 2002, 614, 117–125. [Google Scholar] [CrossRef]
- da Silva, K.J.; Paschoal Jr, W.; Belo, E.A.; Moreira, S.G. Phase transition in all-trans-β-carotene crystal: temperature-dependent Raman spectra. The Journal of Physical Chemistry A 2015, 119, 9778–9784. [Google Scholar] [CrossRef]
- Grudzinski, W.; Janik, E.; Bednarska, J.; Welc, R.; Zubik, M.; Sowinski, K.; Luchowski, R.; Gruszecki, W.I. Light-driven reconfiguration of a Xanthophyll Violaxanthin in the photosynthetic pigment–protein complex LHCII: a resonance raman study. The Journal of Physical Chemistry B 2016, 120, 4373–4382. [Google Scholar] [CrossRef]
- Gruszecki, W.I.; Gospodarek, M.; Grudzinski, W.; Mazur, R.; Gieczewska, K.; Garstka, M. Light-induced change of configuration of the LHCII-bound xanthophyll (tentatively assigned to violaxanthin): a resonance Raman study. The Journal of Physical Chemistry B 2009, 113, 2506–2512. [Google Scholar] [CrossRef]
- Goldflus, F.; Ceccantini, M.; Santos, W. Amino acid content of soybean samples collected in different Brazilian states: Harvest 2003/2004. Brazilian Journal of Poultry Science 2006, 8, 105–111. [Google Scholar] [CrossRef]
- Flores-Tinoco, C.E.; Tschan, F.; Fuhrer, T.; Margot, C.; Sauer, U.; Christen, M.; Christen, B. Co-catabolism of arginine and succinate drives symbiotic nitrogen fixation. Molecular systems biology 2020, 16, e9419. [Google Scholar] [CrossRef]
Figure 1.
Experimental design and procedure for extracting BNF specific pattern from Raman spectra of the aerial parts of soybean plants. The spectra were obtained during the sixth week after inoculation, at a point when the total nitrogen content became consistent across all treatments within the nitrogen-fixing set.
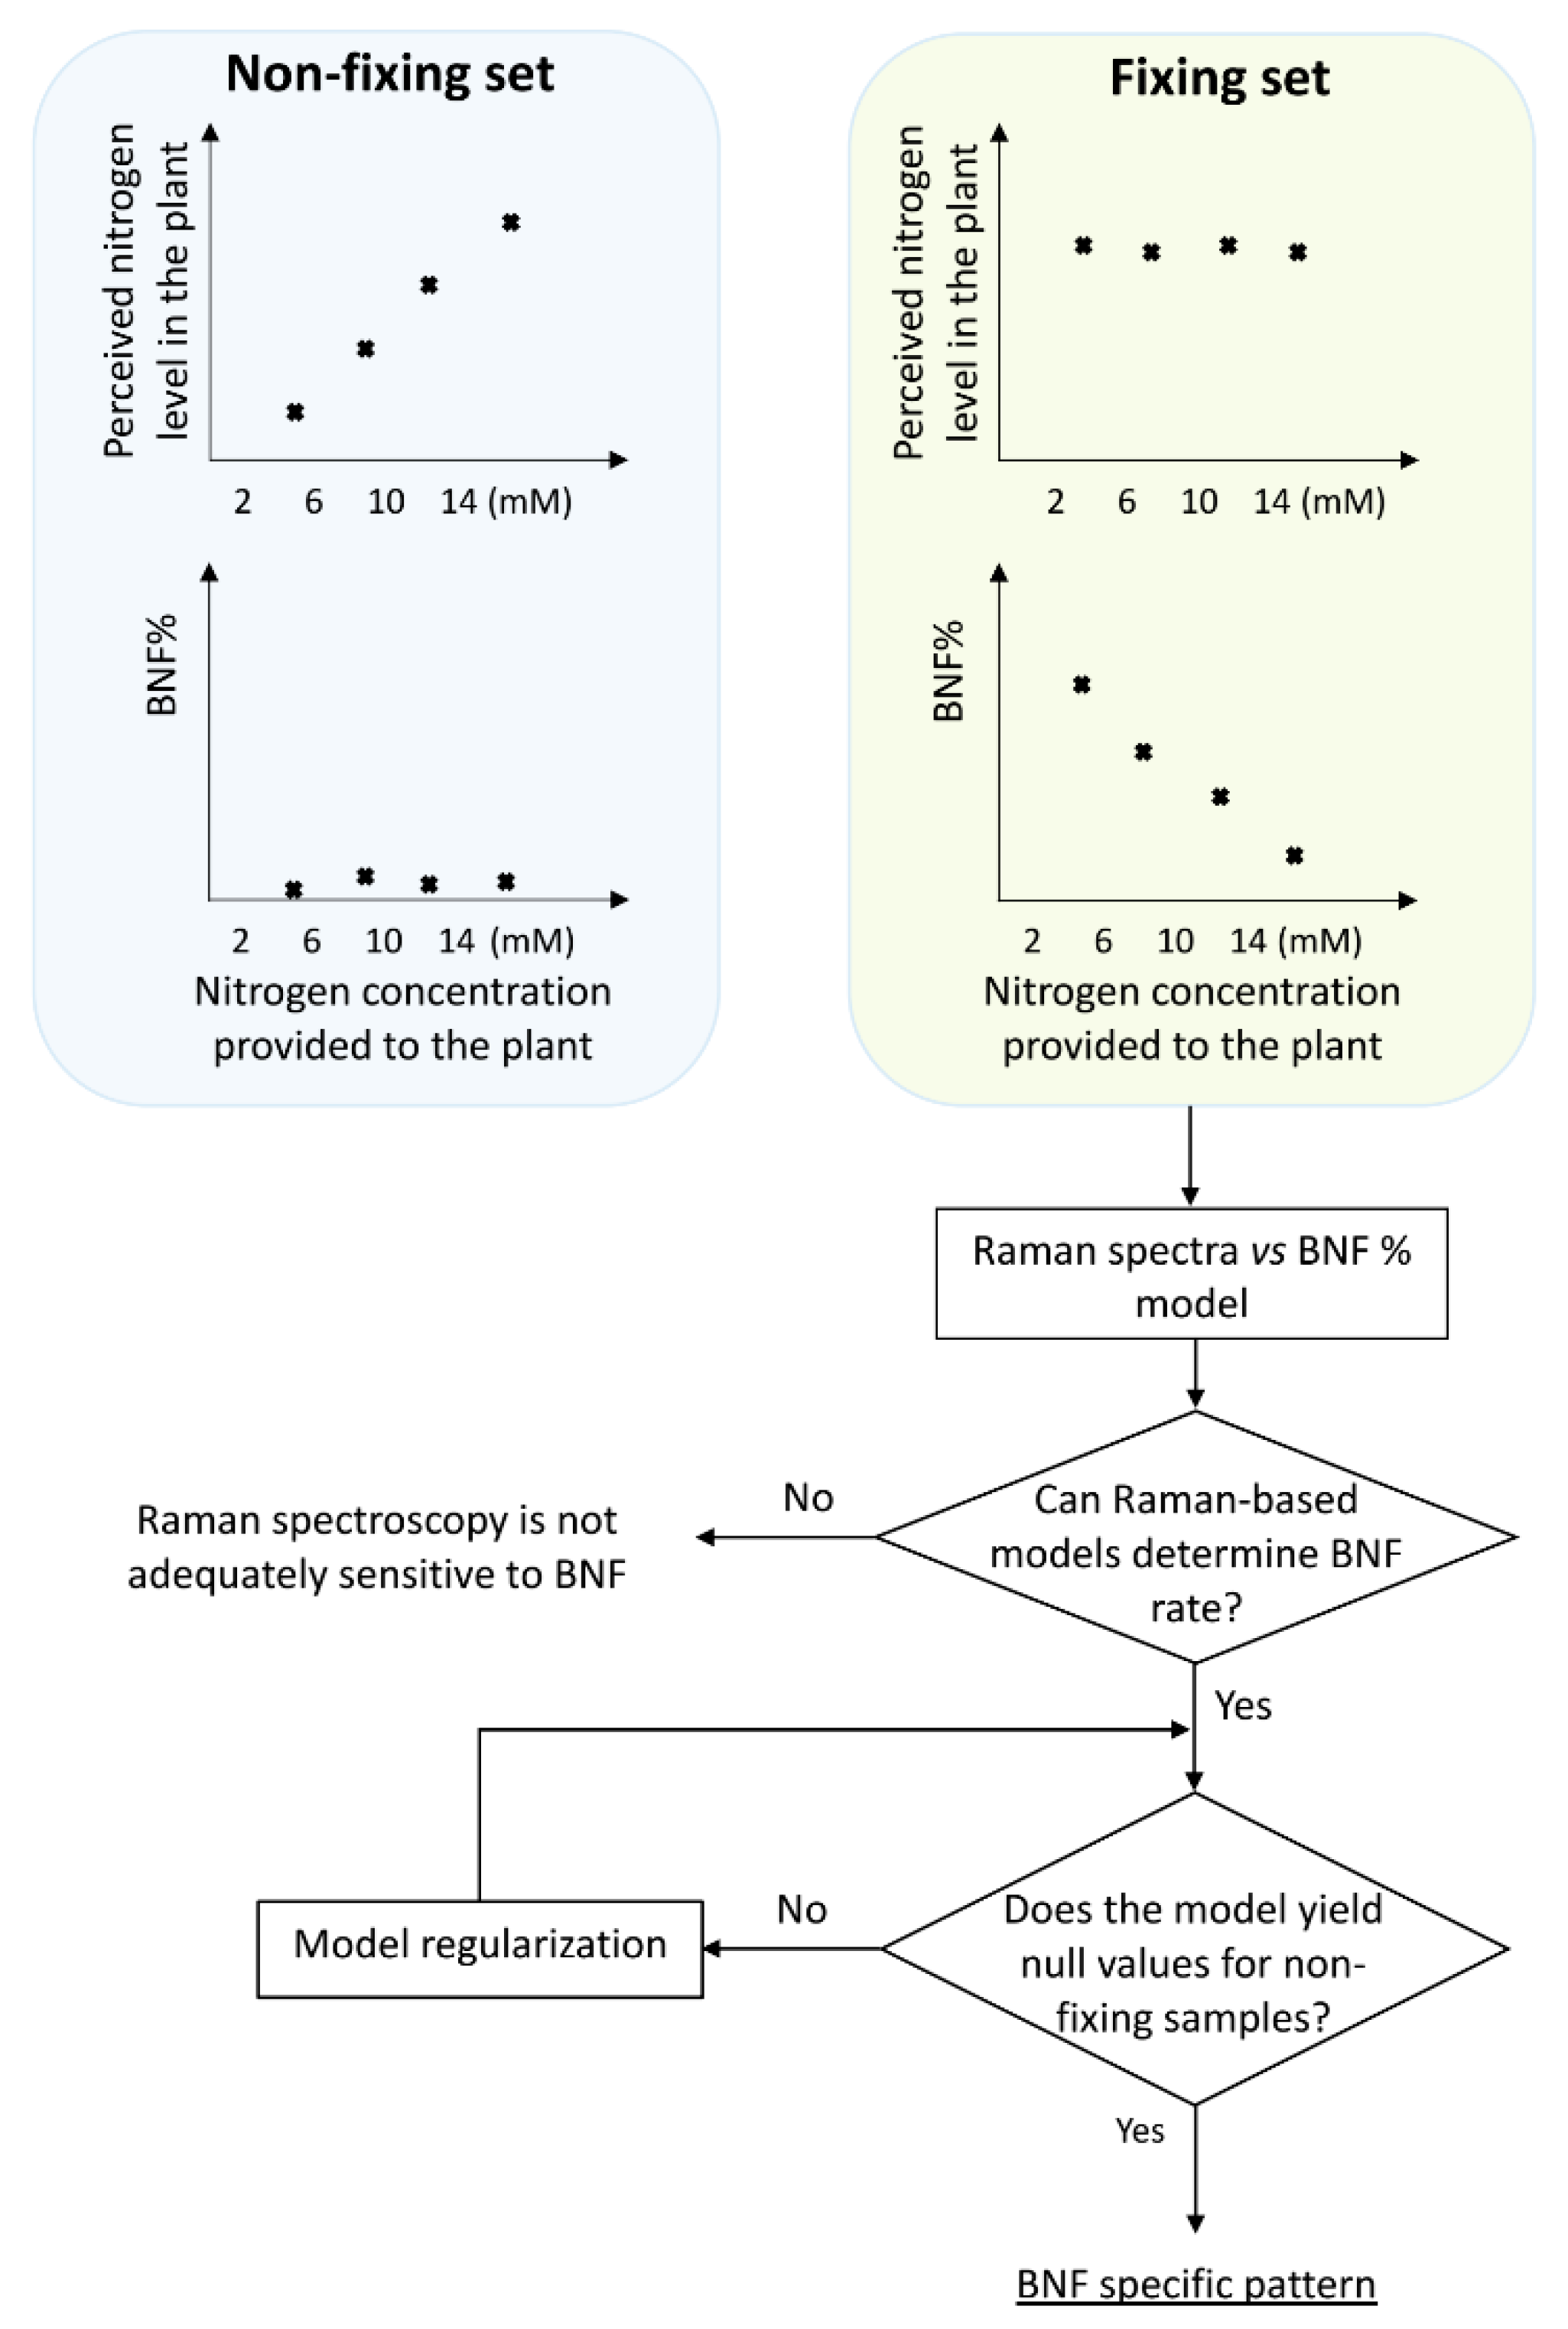
Figure 2.
Average and standard deviation of Raman spectra of soybean leaves under different nitrogen treatments.
Figure 2.
Average and standard deviation of Raman spectra of soybean leaves under different nitrogen treatments.
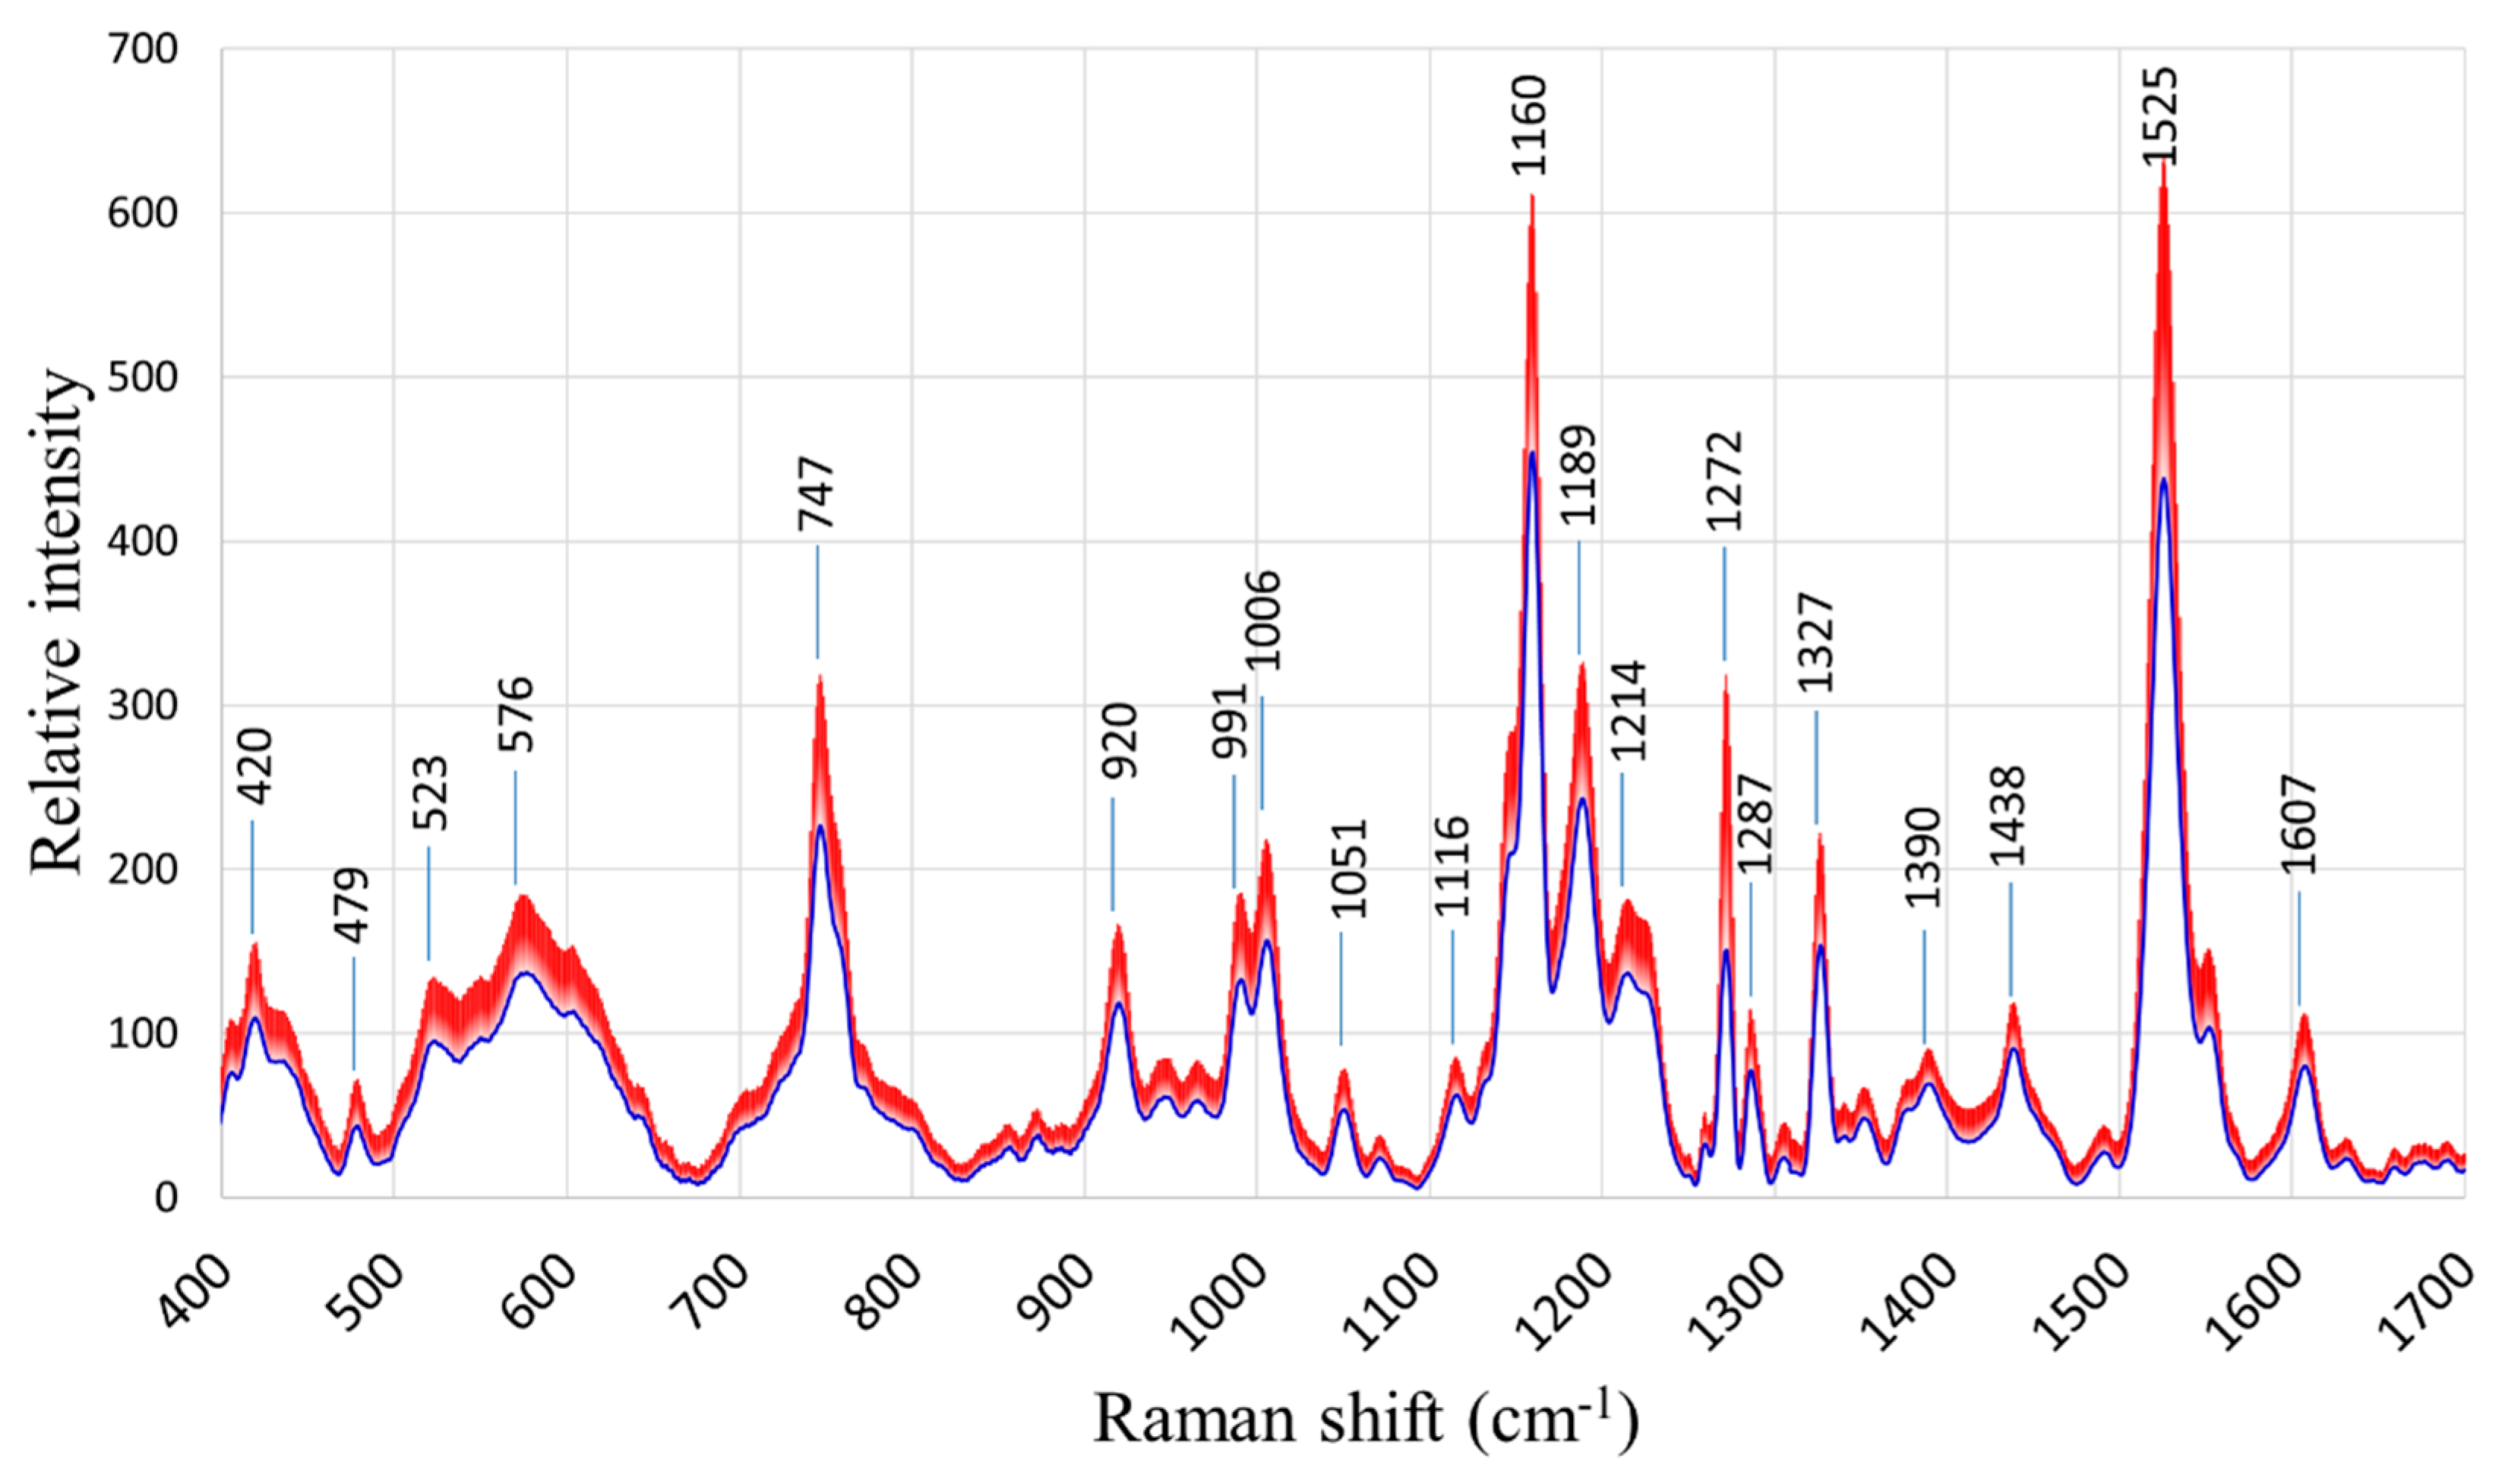
Figure 3.
a) Performance of the BNF estimation model developed using the entire Raman spectrum (600-1770 cm-1) acquired from the leaves of nitrogen-fixing plants for calibration (Cal) and validation (Val) data sets, b) Explained variances by consecutive PLSR factors for estimation of BNF from the full Raman spectra of leaves.
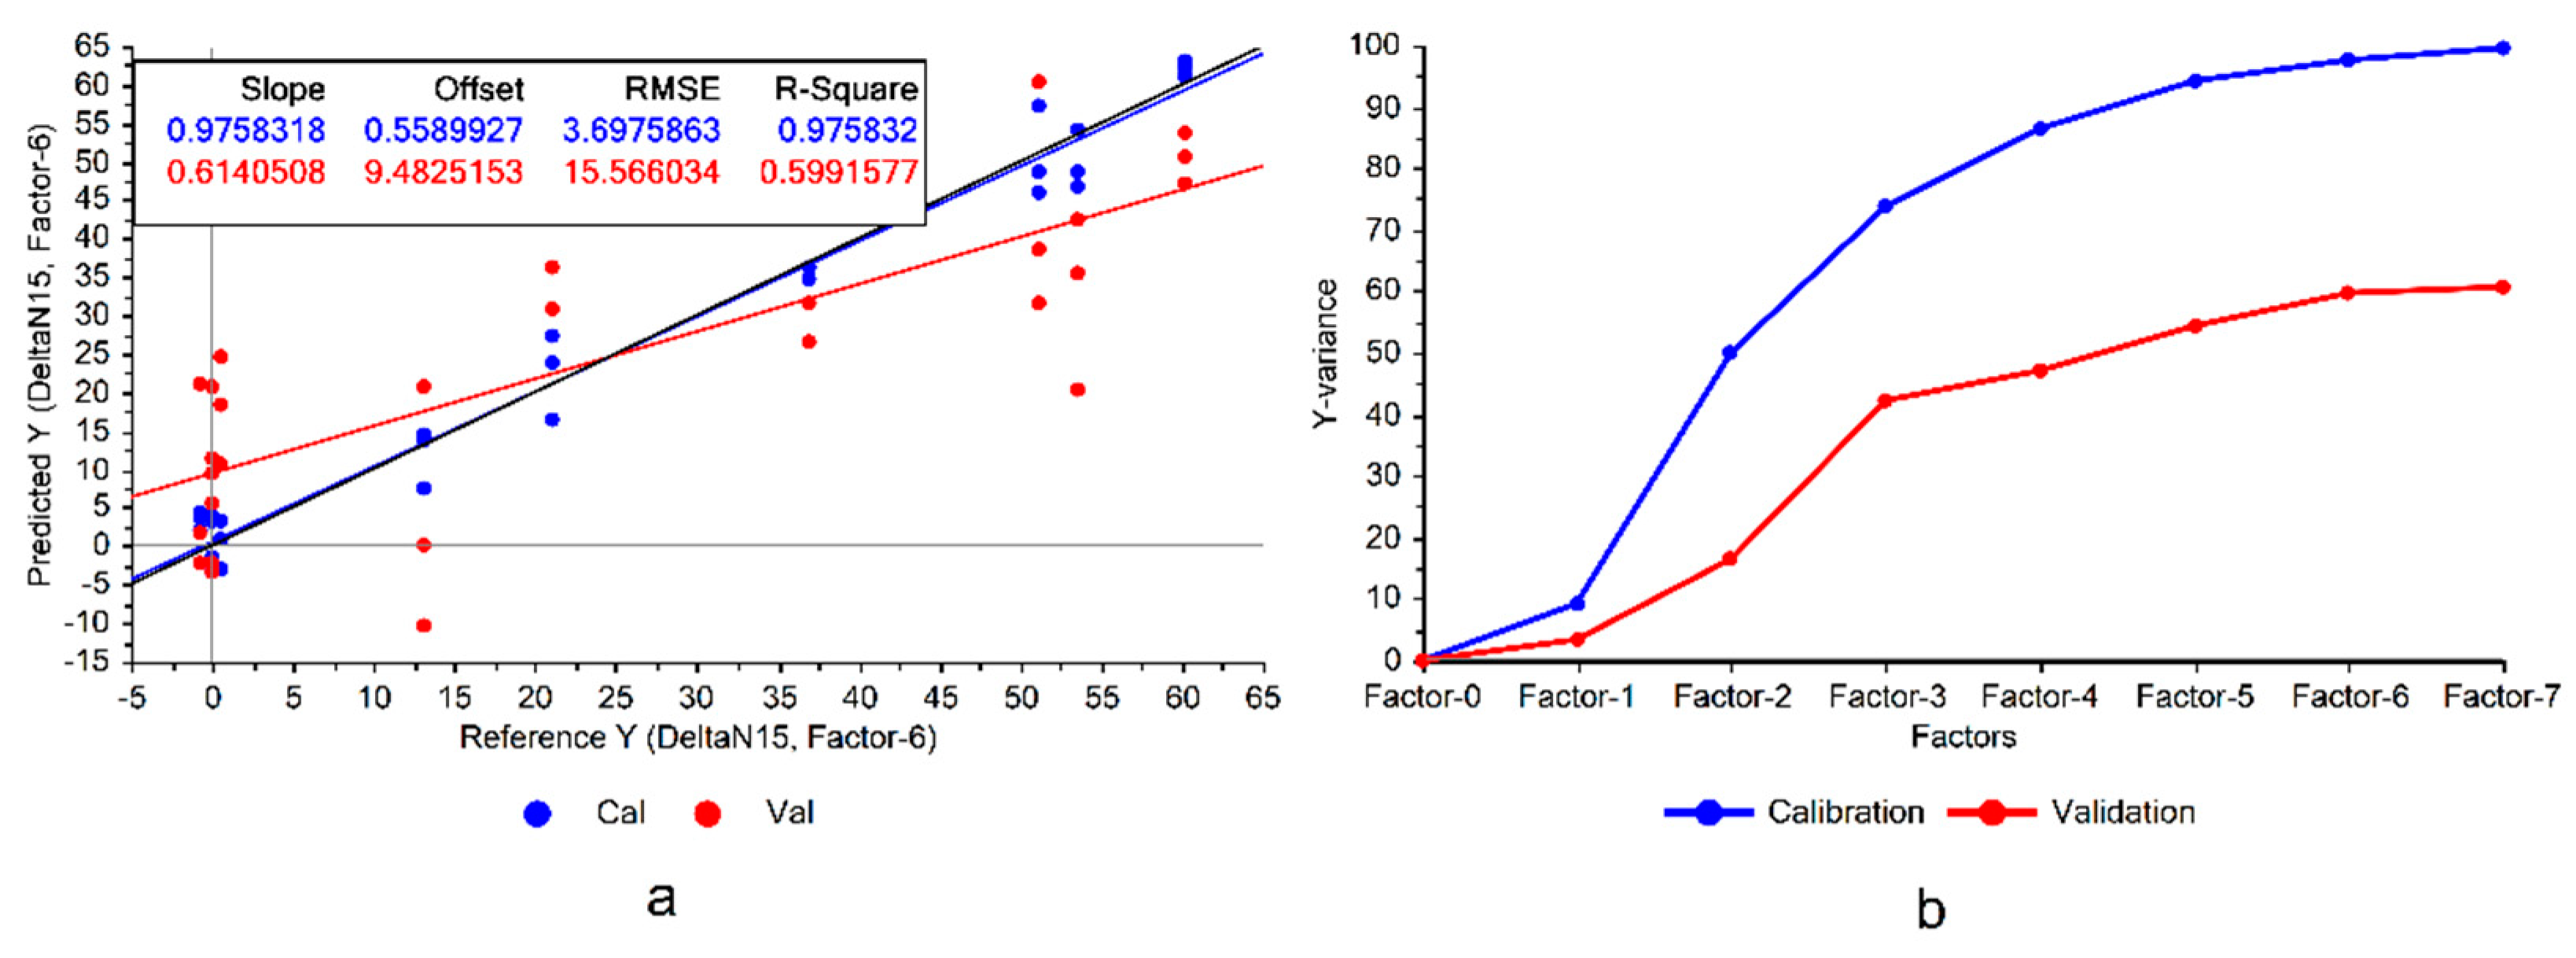
Figure 4.
a) Performance of the BNF estimation model using the Raman peaks of nitrogen-fixing plants, b) Explained variances by PLSR factors for BNF estimation from Raman peaks of the leaves’ spectra.
Figure 4.
a) Performance of the BNF estimation model using the Raman peaks of nitrogen-fixing plants, b) Explained variances by PLSR factors for BNF estimation from Raman peaks of the leaves’ spectra.
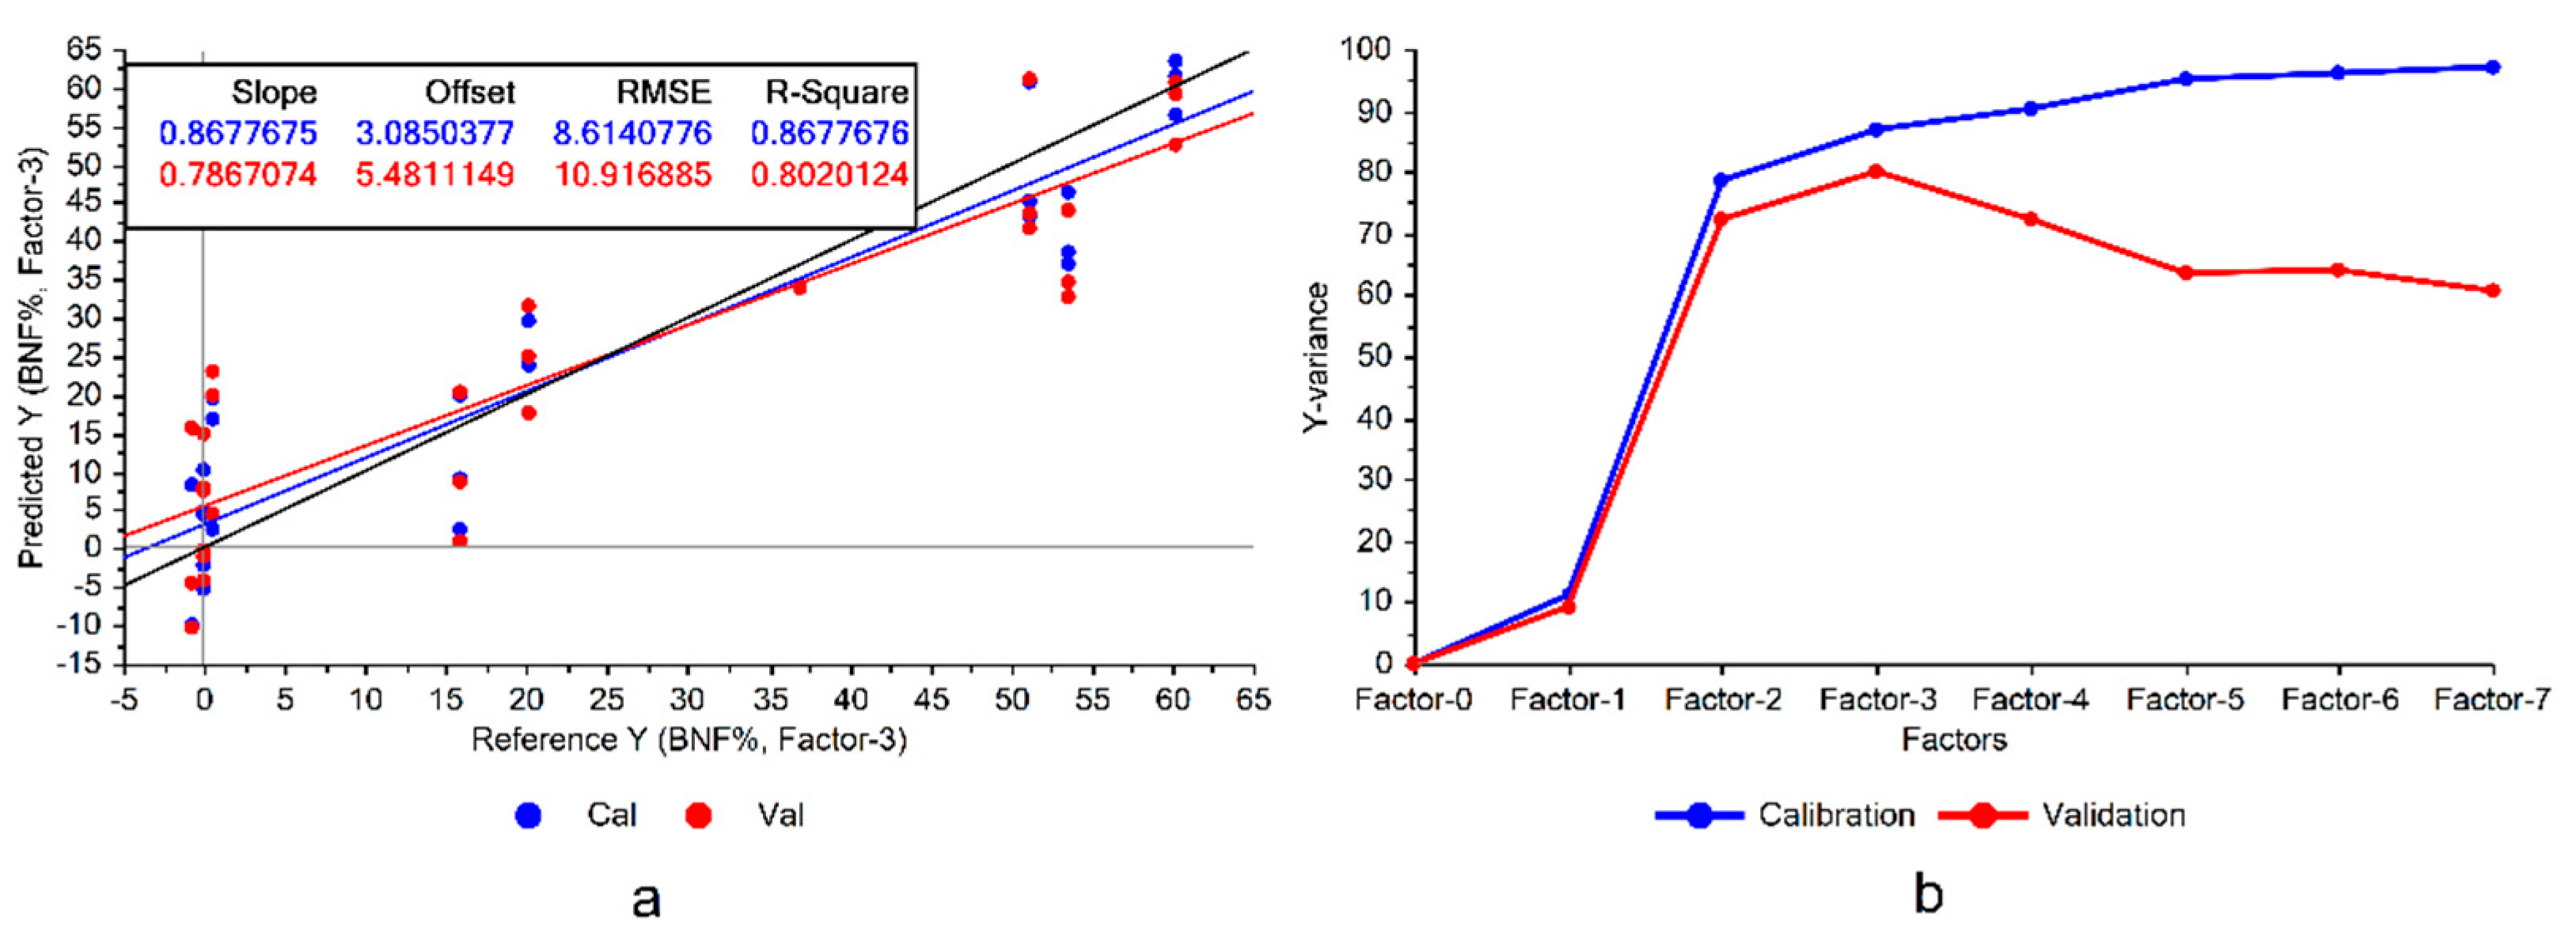
Figure 5.
Output of the BNF model on Raman spectra collected from “non-fixing” soybean plants with various levels of nitrogen fixation.
Figure 5.
Output of the BNF model on Raman spectra collected from “non-fixing” soybean plants with various levels of nitrogen fixation.
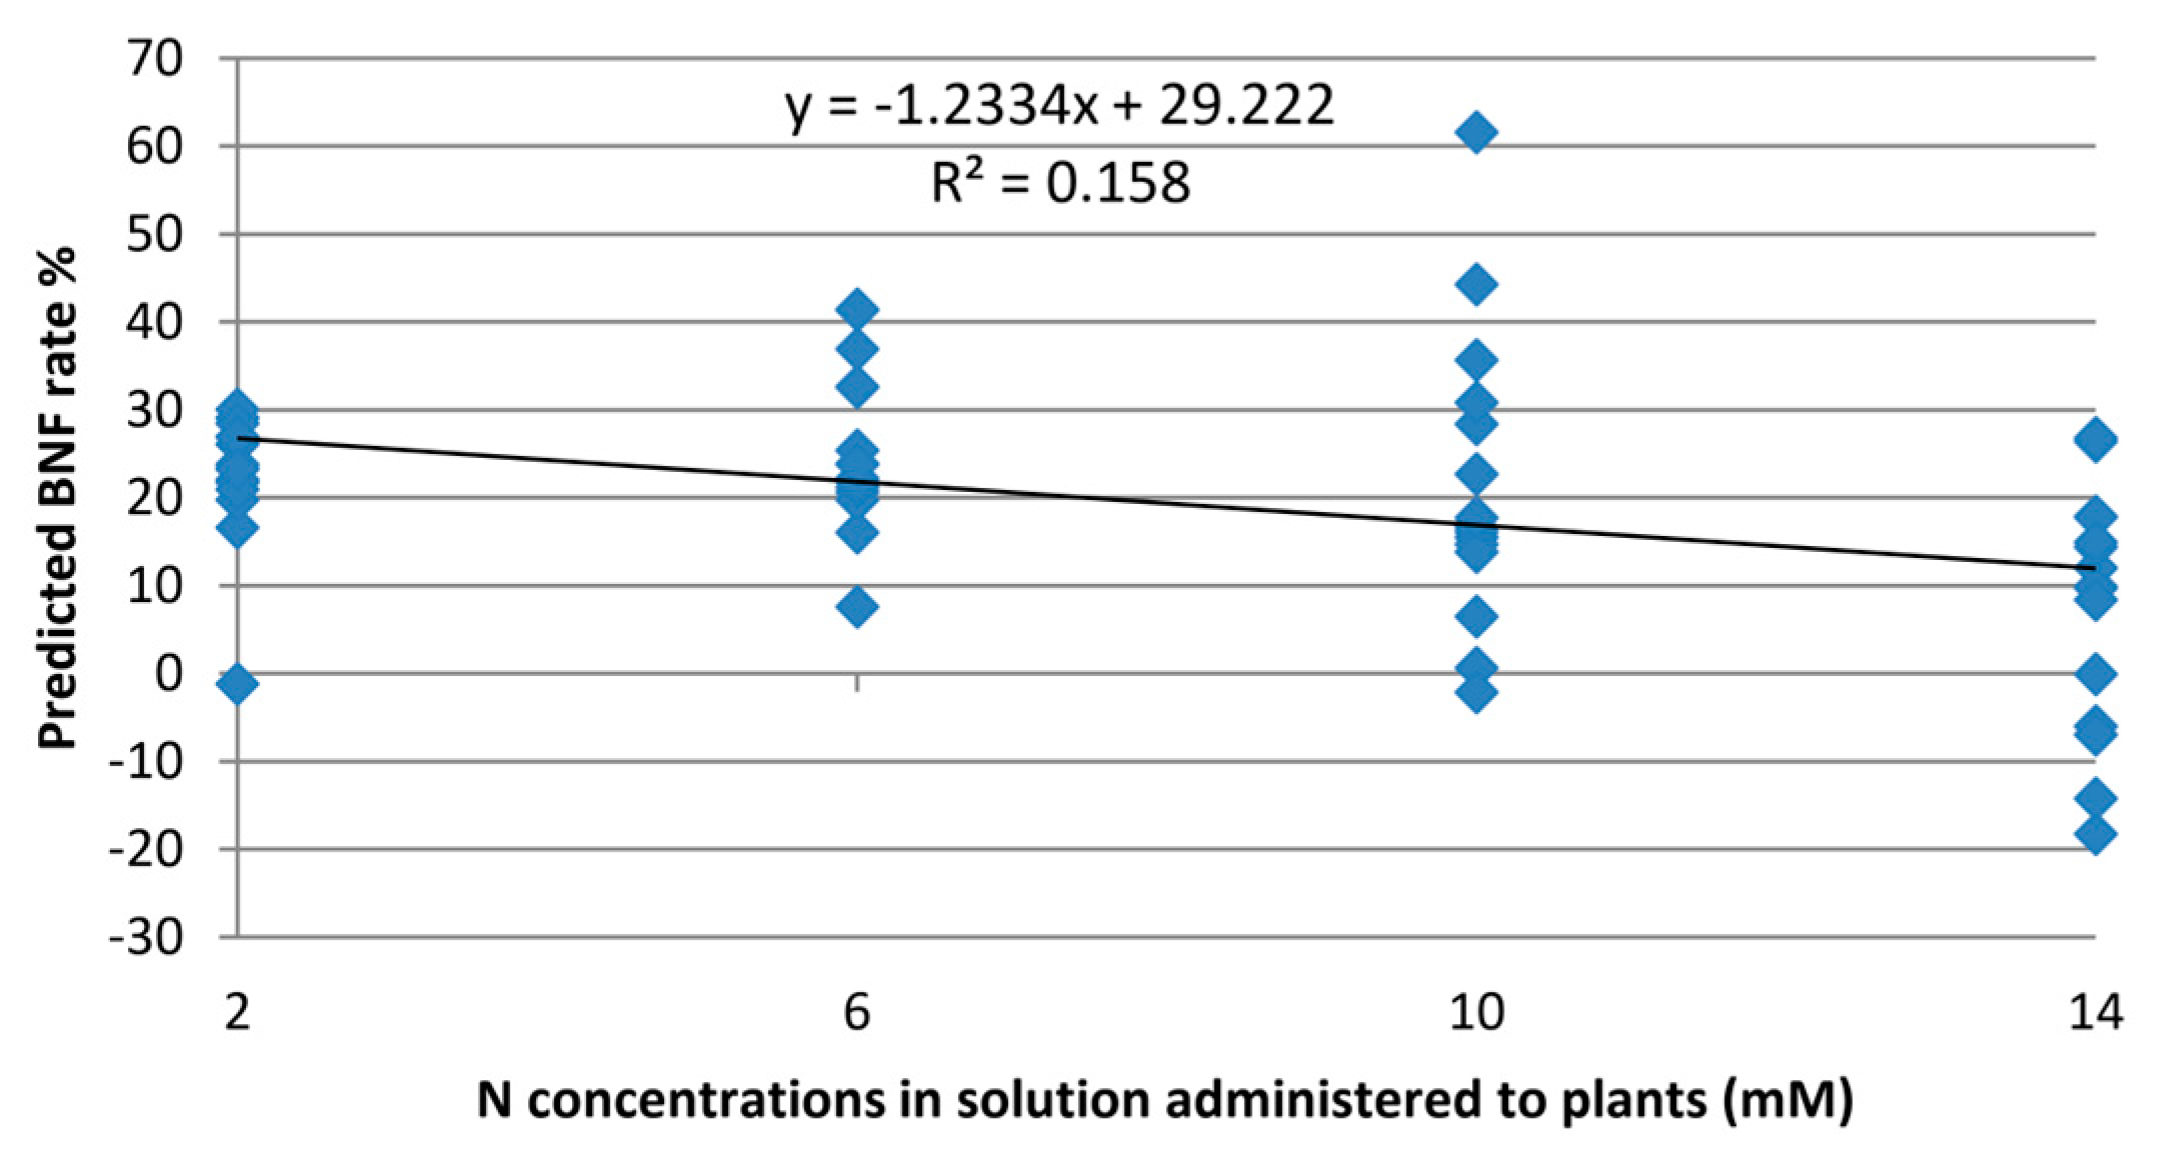
Figure 6.
Variation of the ENet model coefficients at various lambda values.
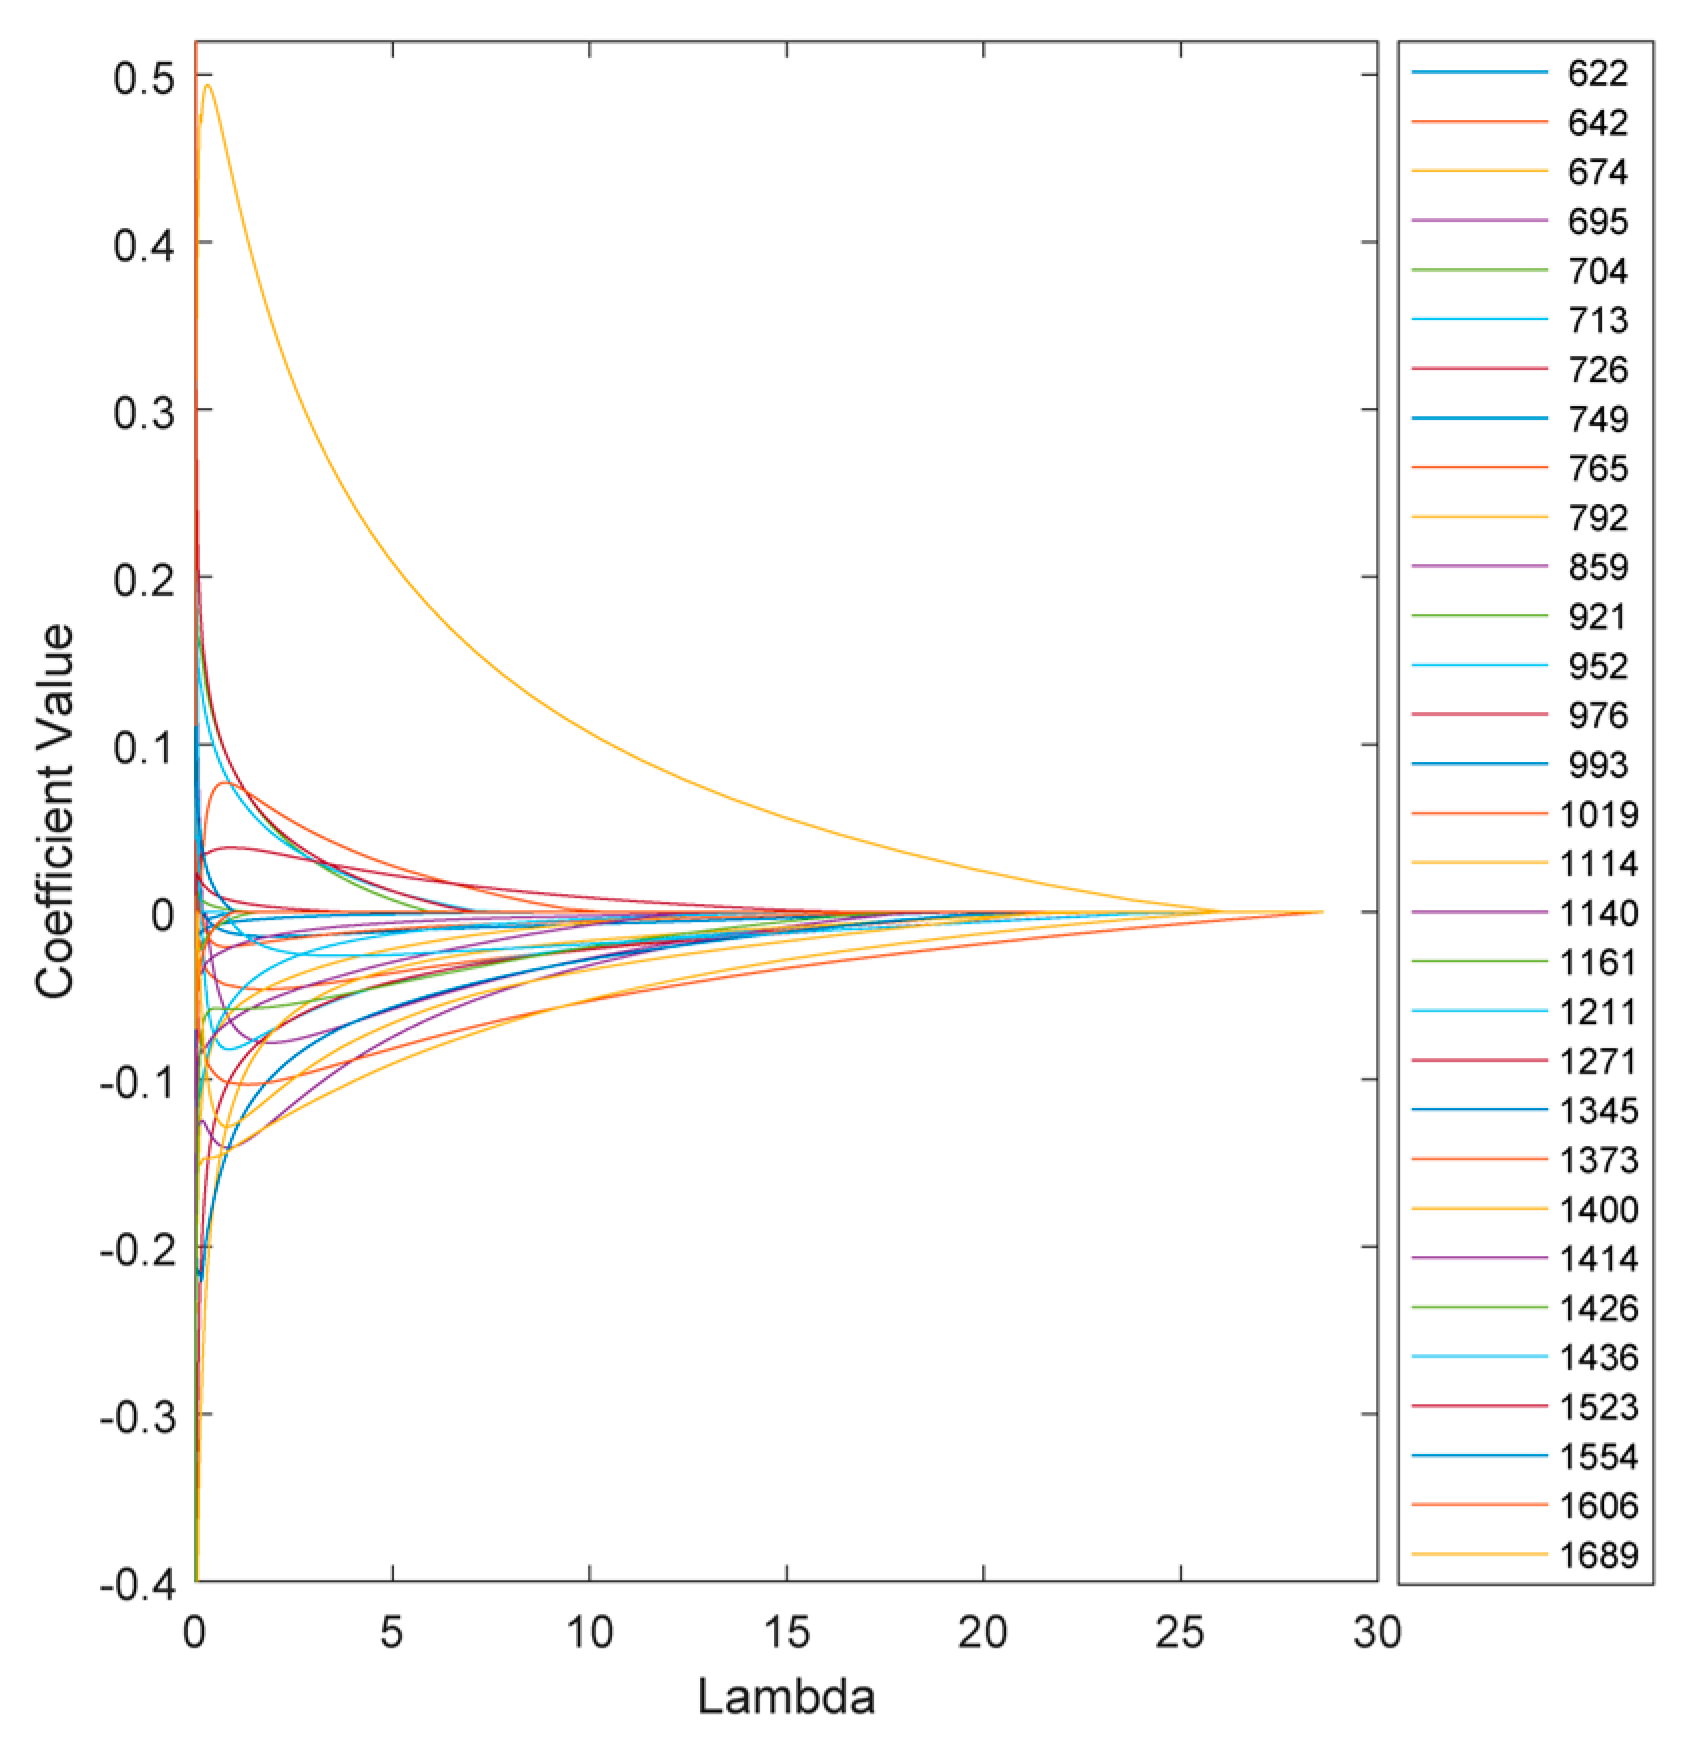
Figure 7.
Output of the ENet model for non-fixing soybean samples at various lambda values.
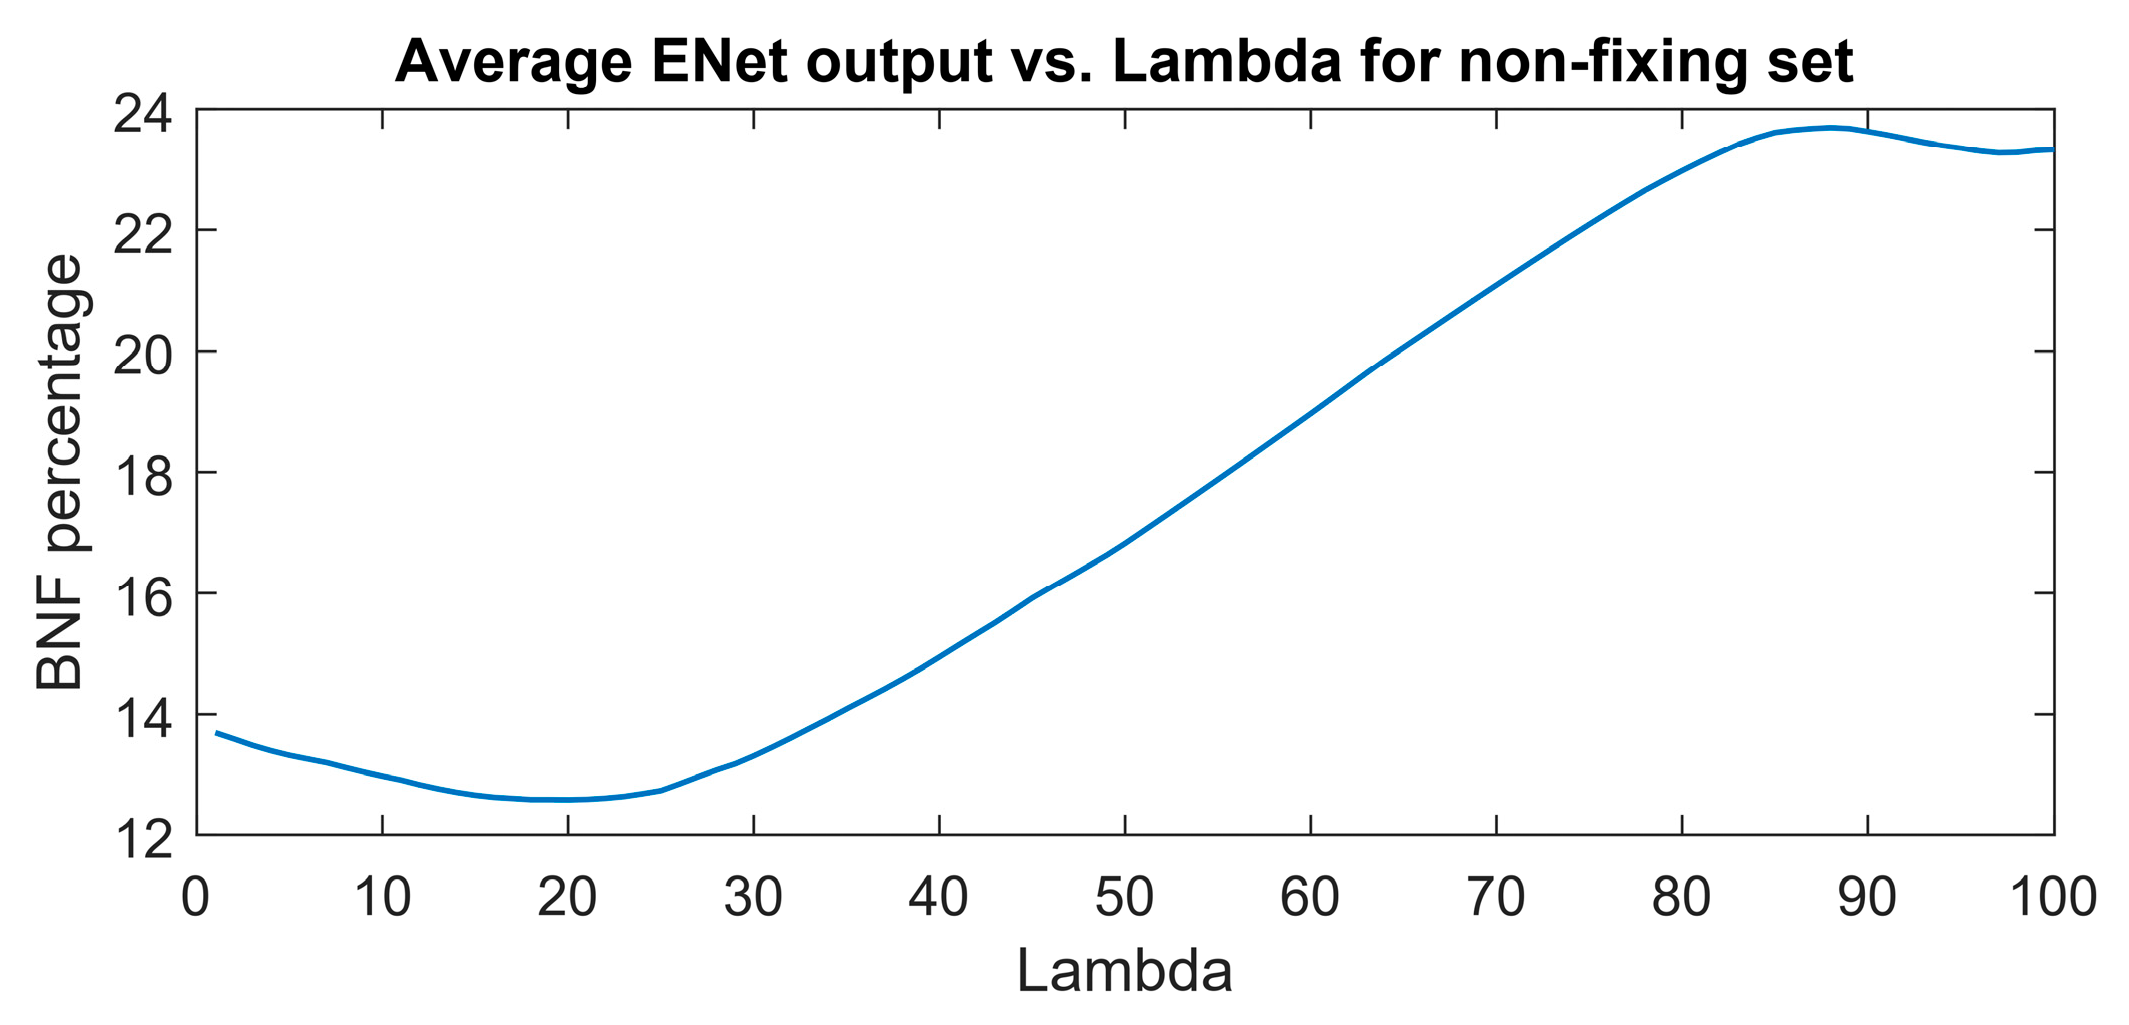
Figure 8.
Coefficients of the ENet and regularized ENet models.
Disclaimer/Publisher’s Note: The statements, opinions and data contained in all publications are solely those of the individual author(s) and contributor(s) and not of MDPI and/or the editor(s). MDPI and/or the editor(s) disclaim responsibility for any injury to people or property resulting from any ideas, methods, instructions or products referred to in the content. |
© 2024 by the authors. Licensee MDPI, Basel, Switzerland. This article is an open access article distributed under the terms and conditions of the Creative Commons Attribution (CC BY) license (http://creativecommons.org/licenses/by/4.0/).
Copyright: This open access article is published under a Creative Commons CC BY 4.0 license, which permit the free download, distribution, and reuse, provided that the author and preprint are cited in any reuse.


