Submitted:
09 June 2024
Posted:
11 June 2024
You are already at the latest version
Abstract
In this research, we utilize density functional theory (DFT) to study and investigate the adsorption process of methanol on three unique two-dimensional nanomaterials, namely BN, Graphene, and AlN. Eight sites for BN, AlN, and six sites for graphene were considered to reach full structural optimization. By conducting comprehensive simulations and analyses, we discovered diverse adsorption configurations and energy levels, which indicate different interaction strengths between methanol and the three 2D nanomaterials. Remarkably, AlN exhibits superior adsorption capabilities when compared to Graphene and BN which can be explained by attributable to the nature of charge transfer between the adsorbate and the adsorbent. For methanol adsorption on AlN, the strongest adsorption energy was (-0.5532 eV), and the amount of charge transferred from methanol to AlN was found to be (+0.075). For BN, the strongest adsorption energy was (-0.1351 eV), and the amount of charge transferred from methanol to BN was (+0.022). The density of states results indicated that the bandgap decreased, with a shift to the right. In contrast, for methanol adsorption on graphene, the strongest adsorption energy was found to be (-0.073 eV), and the amount of charge transferred from methanol to graphene was (+0.004). The density of states results showed no change in the bandgap. Our findings underscore the superiority of AlN’s potential over BN and Graphene for applications requiring efficient methanol adsorption, such as gas separation and storage technologies. This study emphasizes the superiority of AlN over Graphene and BN for tasks that necessitate effective methanol adsorption.
Keywords:
DFT
; Adsorption
; Methanol
; Boron Nitride
; Graphene
; Aluminum Nitride
1. Introduction
Fuel cell technology, which is now applicable to a wide range of technical areas, is becoming commercially viable. This includes stationary power supplies and electro-traction, among other things. The significant advancements in this field are the result of the dedicated efforts of numerous researchers over the past decades [1]. The fuel cell (FC) is a device that has been extensively researched for its potential uses in various fields. It has shown promise as an alternative solution in the automotive industry, distributed power generation, and other industrial applications. The primary function of this device is to convert the chemical energy from a specific fuel into electrical energy [2,3]. One of the fuel cells that is widely used in the meantime is methanol. with progress in various areas, including catalysis, electrolytes, electrode structure, the theoretical understanding of gas diffusion, and fuel cell engineering. This progress also includes direct methanol fuel cells (DMFCs), which have long been viewed as the most challenging fuel cell technology due to issues with methanol crossover and catalytic inefficiency [4]. In parallel, nanomaterials have been extensively utilized in various aspects of human life, such as reinforcing nanocomposites [5,6,7,8,9,10,11,12], and serving as adsorbents to eliminate hazardous substances [13,14,15].
Among the available techniques, adsorption is the most appealing. In this method, two-dimensional materials with vast surface areas and numerous active sites are used as perfect adsorbents for environmental cleanup, similar to porous materials [13,14,15]. Over the past two decades, researchers have been significantly interested in developing an appropriate adsorbent for the adsorbing desulfurization process [16].
Boron nitride (BN) and aluminum nitride (AlN) are wideband gap III–V compounds known for their impressive physical properties and chemical stability. They consist of boron, aluminum, and nitrogen atoms arranged in a hexagonal pattern, similar to a honeycomb. This structure is made up of two-dimensional (2D) layers that are sp2-bonded, much like graphene, which is a flat monolayer of carbon atoms arranged in a 2D honeycomb lattice [17]. Each layer of these hexagonal lattices is held together by strong covalent bonds between B, Al, and N atoms. However, the layers themselves are held together by weak van der Waals (vdW) forces, a characteristic they share with graphite [18]. The intense study of graphene has generally sparked interest in other two-dimensional (2D) hexagonal networks, including h-BN [19,20] This material is particularly interesting as a topological insulator [21]. Recently, the exfoliation of 2D BN nanosheets has been achieved. This is a necessary step to fully realize the potential of h-BN in various applications, from electronics to energy storage [22]. This set of graphene materials exhibits significant potential as adsorbents for methanol. The process by which methanol is adsorbed onto the sides of these graphenes can be assessed using quantum mechanical computations, specifically those based on Density Functional Theory (DFT).
These calculations can provide valuable insights into the interactions between these molecules and the graphene surfaces, contributing to the development of more efficient adsorption processes. A variety of computational methods exist for studying the properties of nanomaterials prior to their experimental use in the lab. Given the high costs associated with experimental procedures, researchers often resort to highly accurate computational methods. From a molecular perspective, calculations based on quantum mechanics tend to align more closely with experimental results compared to other molecular simulations, such as molecular dynamics or Monte Carlo methods [23,24,25,26,27,28]. Density Functional Theory (DFT) as a robust computational tool is capable of handling the periodic boundary conditions required for simulating a graphene sheet. It holds the potential to compute the adsorption characteristics of an arbitrary molecule. Several computational atomistic calculations are used for simulating mechanical properties [29], adsorption [30], and electrical properties [31,32]. These include Classical Monte Carlo (MC), Classical Molecular Dynamics (MD), Semi-Empirical, and Ab-Initio Quantum Mechanics. Among these, the Ab-Initio Quantum Mechanics method is found to be more accurate and is among the most important of these methods [33,34]. This method can be further classified into Density Functional Theory (DFT) and Hartree-Fock (H–F) calculations. It is thought that DFT calculations could provide a good estimation of the interaction mechanism and mechanical behavior. Upon examining the results from these atomistic methods, it is observed that the results from DFT calculations for solid-state systems align best with experimental data [35].
In this research, we investigate the adsorption properties of boron nitride, graphene, and aluminum nitride with methanol, utilizing density functional theory (DFT) simulations. The electronic structure of the molecules was calculated using SIESTA software. This study examined the adsorption of a single methanol molecule under various geometric conditions on these graphenes. The state with the most negative energy value was identified as the most stable possible state. In these most negative states, the amount of charge transferred, the results of state density, and electronic properties were analyzed. The investigation pinpoints the optimized structures and equilibrium bond lengths for both materials and probes the absorption energies for methanol at diverse sites on their surfaces. Aluminum nitride demonstrates a greater propensity for methanol than boron nitride and graphene, with the absorption described as weakly physical in nature. Variations in the electronic states of the materials were unveiled through Local Density of States (DOS) diagrams, signifying a more potent charge transfer from methanol to boron nitride. The research implies that the absorption properties could fluctuate under varying environmental conditions and that additional simulations with sophisticated software could yield more precise forecasts. Moreover, the examination of other nanoparticles might pinpoint materials with optimal absorption capacities for methanol.
2. Computational Method
We calculate the adsorbent energy between methanol atoms with boron nitride, graphene, and aluminum nitride was computed using the first-principle, Density Functional Theory (DFT). The calculations were performed using the Spanish Initiative for Electronic Simulations with Thousands of Atoms (SIESTA) code [36]. The Local Density Approximation (LDA) has a notable limitation due to the overbinding of its extended solids. This often results in underpredicted lattice parameters, while cohesive energies, elastic moduli, and phonon frequencies are typically overpredicted. To address this limitation, we opted to use the Generalized Gradient Approximation (GGA) function to account for electronic exchange and correlation effects, as outlined by Perdew–Burke–Ernzerhof (PBE). The Perdew–Burke–Ernzerhof (PBE) function was utilized in conjunction with the Generalized Gradient Approximation (GGA) for the electronic exchange and correlation effects [37]. Throughout the entire process, a split-valence double-zeta basis set of localized numerical atomic orbitals was employed, incorporating polarization functions (DZP) with a split norm of 0.25 and an energy shift of 50 meV [36,38]. This approach strikes a balance between accuracy and computational resources. An energy cutoff of 120 Ry was chosen for the grid integration to represent the charge density [36].
The fdf file required the following information: system name, number of atoms in the structure, and the number of types of atoms. In the ChemicalSpecialLabel section, a unique counter was assigned to each atom. The LatticeConstant section determined the meshing scale in angstroms, and the LatticeVectors section accounted for the general meshing coordinates. The MeshCutoff section had a value of 120 Ry.
The kgrid-Monkhorst-Pack matrix is related to alternating movements in the xyz direction. To expedite calculations, a ‘#’ sign was placed in front of the propositions. For DM.MixingWeight, a value of 0.08 was considered, and the number of DM.NumberPulay was set to 8. The diagon method was used for solving the equations, and an electric temperature of 25 millielectron volts was used. The DZP mode was used to approximate the super electron layer.
In the Atomic Coordinates and Atomic Species section, the coordinates of all the atoms in the structure were entered based on the type of atoms, the number of atoms, and the numbers assigned to them above in a matrix with six columns. The Atomic coordinates Format section specified the unit of abbreviated numbers as angstroms.
The adsorption energy between the methanol molecule and the adsorbents was computed using the fundamental principles of density functional theory. The local density approximation, despite its limitations due to the excessive connections of its solids, allows for a general prediction of network fronts. Throughout the process, a series of established numerical atomic orbitals with a double axis and split power layer were utilized. This approach ensured compatibility between accuracy and the reduction of computational fluid energy, which was set equal to Ry for the integration of the night to distribute the energy density. It also facilitated the determination of the most stable state of the atom coordinates relative to each other in the system, through a run with the Siesta software. This operation can be time-consuming, potentially requiring several weeks of calculations depending on the number of atoms in the system.
To achieve adsorption at each active center, three runs are necessary: one for the adsorber alone, one for the adsorbate alone, and one for the entire system with both adsorber and adsorbate. The adsorption energy (Eads) is then determined according to the formula by following the equation (eq. 1)
𝐸𝑎𝑑𝑠=𝐸𝑡𝑜𝑡𝑎𝑙−(𝐸𝑚𝑒𝑡ℎ𝑎𝑛𝑜𝑙+𝐸𝑎𝑑𝑠𝑜𝑟𝑏𝑒𝑛𝑡) (1)
Where E(total) represents the total energy of the methanol molecule and adsorbent (system energy), E(methanol) is the energy of the methanol molecule, and E(adsorbent)is the monolayer adsorption energy of AlN, BN, and graphene. After calculating the adsorption energy at different sites, the site with the lowest (more negative) adsorption energy (negative binding energy presents stable adsorption construction) is selected for further calculations such as topical density or DOS or CT load calculations.
3. Results and Discussions
The geometrical structure of monolayer AlN, BN, and graphene was optimized using the Density Functional Theory (DFT) method. The optimized structure of the bare monolayer BN, as shown in Figure 1, has dimensions of 11.319 Å × 10.051 Å. The equilibrium length of the boron and nitrogen atoms is approximately 1.454 Å. As shown in Figure 2, The optimized structure of the bare monolayer graphene has dimensions of 11.329 Å × 10.051 Å. The equilibrium length of the C-C bond is approximately 1.452 Å. Figure 3 shows the structure of aluminum nitride graphene with 14.297 Å × 12.676 Å dimensions. The equilibrium length of aluminum and nitrogen atoms is approximately 1.836 Å. The study examined the adsorption of methanol on the surfaces of AlN, BN, and graphene, considering various adsorption sites. Eight adsorption sites for BN were considered. For methanol on the graphene surface, six adsorption sites were considered. In the case of AlN, the adsorption behavior of methanol was examined at eight different sites, as indicated in Figure 4, Figure 5 and Figure 6. It’s important to note that the initial distance between the methanol atom and the surfaces of AlN, graphene, and BN was set to 2.30 Å for each site under consideration.
Memarian et al. [36] employed molecular mechanics and the DFT method to calculate the mechanical properties of graphene. They used DFT calculations, such as the Generalized Gradient Approximation (GGA) and the Local Density Approximation (LDA), to estimate the optimized bond length between two carbon atoms. They found that the lengths were about 1.426 Å and 1.414 Å, respectively. They also reported that the bond length between two carbon atoms in graphene, obtained from AIREBO potential, was about 1.41 Å, from Tersoff potential was 1.464 Å, and from EDIP-Marks potential was 1.42 Å.
Ghorbanzadeh Ahangari in This study [39] focuses on evaluating the mechanical properties of various monolayer sheets, both carbon-based and non-carbon-based, to identify the most suitable nanofiller for enhancing polypropylene. The materials examined include graphene, SiC-m, BN-m, AlN-m, GaN-m, and silicene. The results suggest that silicene, despite being less stiff, may form a stronger composite with polypropylene due to its superior interaction energy, making it a promising candidate for nanofiller applications. The team calculated the mechanical properties of these monolayer sheets and studied their interaction with propylene. By using Density Functional Theory (DFT) calculations, they optimized the geometry for monolayer sheets of the materials mentioned. The resulting bond lengths were found to be: Graphene: 1.42 Å - SiC-m: 1.81 Å - BN-m: 1.45 Å - AlN-m: 1.83 Å - GaN-m: 1.86 Å - Silicene: 2.27 Å
Our measurements align well with previous theoretical studies as well as previous study measurements [39,40,41,42,43].
Figure 1 shows two main views: an expanded view and a side view. In the expanded view, atoms are represented by spheres. Boron atoms are shown in pink and nitrogen atoms are shown in blue, as indicated by the legend. There are measurements provided for specific distances between atoms. For instance, the distance between adjacent boron and nitrogen atoms is 1.454 Å. A specific section of the expanded view is circled to emphasize a particular arrangement of atoms. In the side view, the tubular structure of the boron nitride nanotube is shown. The alternating pattern of pink (boron) and gray (nitrogen) spheres represents their periodic arrangement in this compound.
Figure 2 shows a complex molecule made up entirely of carbon atoms. Each carbon atom is represented by a gray sphere. The bonds between these carbon atoms are shown as sticks connecting the spheres. There are measurements in angstroms (Å) indicating specific distances between certain groups of atoms within the molecule. A blue circle highlights a particular ring structure within this larger molecule, with distances marked from this ring to other parts of the molecule. On the right side, there’s an isolated view of a ring structure similar to that highlighted in blue in the main molecular structure, with its diameter measured. Section A of the Figure presents a two-dimensional lattice of the molecular structure. The atoms within this structure are symbolized by spheres and are interconnected by lines, which represent bonds. The bond lengths are specifically indicated, with measurements such as 11.329 Å, 10.051 Å, 1.450 Å, and 1.452 Å. A hexagonal section within the structure is encircled and magnified, providing a detailed perspective on the atomic spacing and arrangement. This expanded view offers an in-depth look at the atomic structure, allowing us to understand the intricate details of the molecular configuration. Moving on to Section B, we see a linear array of atoms, suggesting a one-dimensional material or molecule. This section provides a clear view of the linear arrangement of atoms, represented by spheres of different colors. This side view complements the expanded view in Section A, offering a broader perspective on the overall structure of the molecule.
Figure 3 presents two distinct perspectives: a magnified view and a lateral view. In the magnified view, atoms are depicted as spheres, with aluminum atoms represented in pink and nitrogen atoms in gray, as denoted by the legend. Specific interatomic distances are provided, such as the 1.836 Å distance between neighboring aluminum and nitrogen atoms. A particular atomic arrangement is highlighted in a circled section of the magnified view. The lateral view, on the other hand, illustrates the tubular formation of the boron nitride nanotube. The periodic pattern of pink (aluminum) and gray (nitrogen) spheres signifies their alternating arrangement in this compound. It illustrates a complex molecular structure composed of two types of atoms. Each atom is represented by a sphere, with aluminum atoms depicted in pink and nitrogen atoms in gray. The bonds between these atoms are shown as lines connecting the spheres. There are measurements in angstroms (Å) indicating specific distances between certain groups of atoms within the molecule. A blue circle highlights a particular hexagonal structure within this larger molecule, with distances marked from this hexagon to other parts of the molecule. On the right side, there’s an isolated view of a linear arrangement of atoms, similar to the periodic arrangement highlighted in the main molecular structure, with its length measured. The image provided offers a comprehensive view of a complex molecular structure, divided into two main sections, labeled (Top View) and (Side View). Section Top View presents a two-dimensional lattice of a molecular structure. The atoms are symbolized by spheres and are interconnected by lines representing bonds. The bond lengths are specifically indicated, with measurements such as 14.297 Å, 12.676 Å, and 1.836 Å. A hexagonal section within the structure is encircled and magnified, providing a detailed perspective on the atomic spacing and arrangement. Section Side View, on the other hand, shows cases of a linear array of atoms, suggesting a one-dimensional material or molecule. This section provides a clear view of the linear arrangement of atoms, represented by spheres of different colors.
In Figure (4-1) the coordinates of the most stable state are shown for the boron nitride-methanol site 1 system. The closest atom to the boron nitride plane is the hydrogen atom with a distance of 2.442 Å and the absorption energy of this system is equal to 2742/0+(eV). Figure (4-2) the coordinates of the most stable state are shown for the boron nitride-methanol site 2 system. The closest atom to the boron nitride plane is a hydrogen atom with a distance of 2.491 Å and the absorption energy of this system is equal to -0.1198 (eV). Figure (4-3) shows the coordinates of the most stable state for the boron nitride-methanol site 3 system. The closest atom to the boron nitride plane is the hydrogen atom with a distance of 2.481 Å and the absorption energy of this system is equal to +0.0242 (eV). Figure (4-4) shows the coordinates of the most stable state for the boron nitride-methanol site 4 system. The closest atom to the boron nitride plane is the hydrogen atom with a distance of 2.619 Å. The absorption energy of this system is -0.1351 (eV). Also, the value of Mulliken charge is equal to 0.022, which has been transferred from methanol to boron nitride. Figure (4-5) shows the coordinates of the most stable state for the boron nitride-methanol site 5 system. The closest atom to the boron nitride plane is the hydrogen atom with a distance of 2.492 Å and the absorption energy of this system is equal to -0.1093 (eV). Figure (4-6) shows the coordinates of the most stable state for boron nitride-methanol site 6 system. The closest atom to the boron nitride plane is the hydrogen atom with a distance of 2.931 Å and the absorption energy of this system is equal to -0.0922 (eV). Figure (4-7) the coordinates of the most stable state are shown for the boron nitride-methanol site 7 system. The closest atom to the boron nitride plane is a hydrogen atom with a distance of 2.998 Å and the absorption energy of this system is equal to -0.1219 (eV). Figure 4(-8) shows the coordinates of the most stable state for the boron nitride-methanol site 8 system. The closest atom to the boron nitride plane is the hydrogen atom with a distance of 2.621 Å and the absorption energy of this system is equal to -0.1096 (eV).
Table 1 includes the closest atom to the boron nitride plane, the distance of this atom from the boron nitride plane, the absorption energy of the system, and the Mulliken charge (where provided). This should make it easier to compare the properties of the system at different sites, (Mulliken charge is only provided for site 4).
Figure (5-1) shows the coordinates of the most stable state for the graphene-methanol site 1 system. The closest atom to the graphene plane is the hydrogen atom with a distance of 2.661Å and the absorption energy of this system is equal to +0.122 (eV). In Figure( 5-2) the coordinates of the most stable state are shown for the graphene-methanol system site 2. The closest atom to the graphene plane is the hydrogen atom with a distance of 2.452Å and the absorption energy of this system is equal to -0.004 (eV). In Figure (5-3) the coordinates of the most stable state are shown for the graphene-methanol system site 3. The closest atom to the graphene plane is the hydrogen atom with a distance of 2.684Å and the absorption energy of this system is equal to -0.039 (eV). Figure (5-4) shows the coordinates of the most stable state for the graphene-methanol site 4 system. The closest atom to the graphene plane is the hydrogen atom with a distance of 2.638Å. The absorption energy of this system is equal to -0.033(eV) and also the amount of mulliken charge is equal to +0.004, which has been transferred from methanol to graphene. In Figure (5-5) the coordinates of the most stable state are shown for the graphene-methanol system site 5. The closest atom to the graphene plane is the hydrogen atom with a distance of 2.948Å and the absorption energy of this system is equal to -0.073 (eV), In Figure (5-6) the coordinates of the most stable state are shown for the graphene-methanol system site 6. The closest atom to the graphene plane is the hydrogen atom with a distance of 2.607Å and the absorption energy of this system is equal to +0.01 (eV).
Table 2 includes the closest atom to the graphene plane, the distance of this atom from the graphene plane, the absorption energy of the system, and the Mulliken charge (where provided). This should make it easier to compare the properties of the system at different sites, (Mulliken charge is only provided for site 5).
The aluminum nitride-methanol system presents a fascinating case study. This system comprises several sites, each exhibiting unique characteristics. For instance, as depicted in Figure (6-1) For site 1, the closest atom to the aluminum nitride plane is a hydrogen atom at a distance of 2.472 Å, and the absorption energy of this system is +0.4532 eV. For site 2 Figure (6-2), the closest atom is also a hydrogen atom, but at a slightly greater distance of 3.155 Å, and the absorption energy is +0.0272 eV. Site 3 Figure (6-3) shows a similar pattern, with the closest atom being a hydrogen atom at a distance of 2.408 Å, and an absorption energy of +0.3175 eV. In site 4 Figure (6-4), the closest atom to the aluminum nitride plane is a hydrogen atom at a distance of 1.834 Å, and the absorption energy is -0.226 eV. For site 5 Figure (6-5), the closest atom is a hydrogen atom at a distance of 2.462 Å, and the absorption energy is -0.5532 eV. Additionally, a Mulliken charge of +0.075 has been transferred from methanol to aluminum nitride. Site 6 Figure (6-6) shows the closest atom to the aluminum nitride plane as a hydrogen atom at a distance of 2.213 Å, and the absorption energy of this system is -0.2275 eV. For site 7 Figure (6-7), the closest atom is a hydrogen atom at a distance of 2.747 Å, and the absorption energy is -0.0877 eV. Finally, for site 8 Figure (6-8), the closest atom to the aluminum nitride plane is a hydrogen atom at a distance of 2.979 Å, and the absorption energy of this system is -0.1393 eV.
Table 3 includes the closest atom to the aluminum nitride plane, the distance of this atom from the aluminum nitride plane, the absorption energy of the system, and the Mulliken charge (where provided). This should make it easier to compare the properties of the system at different sites. the Mulliken charge is only provided for site 5.
These findings provide a comprehensive understanding of the most stable states for the aluminum nitride-methanol system across different sites, highlighting the variations in absorption energy and the closest atom to the aluminum nitride plane.
In conclusion, these Figures provide a detailed insight into the interactions between boron nitride and methanol across different sites. Each site presents a unique interaction, with varying distances and absorption energies, contributing to our understanding of these complex molecular systems.
Table 4 shows the results of energy calculations for methanol on boron nitride absorber in eight sites as follows. As can be seen from the above table, the best active site to continue calculations is site 4. According to the amount of absorption energy, the absorption of methanol on boron nitride is a physical absorption type with an energy of -0.1351(eV), which is a good value. It presents a detailed analysis of the adsorption energy, system energy, methanol energy, and boron nitride energy at different sites on the surface of boron nitride. The adsorption energy, measured in electron volts (eV), indicates the energy change when a methanol molecule is adsorbed onto the surface. Positive values represent endothermic reactions where energy is absorbed, while negative values represent exothermic reactions where energy is released. The system energy represents the total energy of the boron nitride with the adsorbed methanol molecule. The methanol energy and boron nitride energy columns represent the energy of the isolated methanol molecule and the bare boron nitride surface, respectively. The data suggests that the adsorption process is exothermic at sites 2, 4, 5, 6, 7, and 8, as indicated by the negative adsorption energy values. Conversely, the process is endothermic at sites 1 and 3, where the adsorption energy values are positive.
Table 5: shows the result of energy calculations for methanol on graphene absorber in six sites
Table 5 presents a detailed analysis of the adsorption energy, system energy, methanol energy, and graphene energy at different sites on the surface of graphene. The adsorption energy, measured in electron volts (eV), indicates the energy change when a methanol molecule is adsorbed onto the surface. Positive values represent endothermic reactions where energy is absorbed, while negative values represent exothermic reactions where energy is released. The system energy represents the total energy of the graphene with the adsorbed methanol molecule. The methanol energy and graphene energy columns represent the energy of the isolated methanol molecule and the bare graphene surface, respectively. The data suggests that the adsorption process is exothermic at sites 2, 3, 4, and 5, as indicated by the negative adsorption energy values. Conversely, the process is endothermic at sites 1 and 6, where the adsorption energy values are positive. This information is crucial for understanding the interaction between methanol and graphene, which could have significant implications for its use in various applications. Further experimental studies would be beneficial to validate these computational results and explore their implications in real-world applications. the best active site to continue calculations is the site 5. According to the amount of absorption energy, the absorption of methanol on graphene is a weak physical absorption type with an absorption energy of -0.073(eV).
Table 6: shows the result of energy calculations for methanol on aluminum nitride absorber in six sites
Table 6 presents a detailed analysis of the adsorption energy, system energy, methanol energy, and aluminum nitride energy at different sites on the surface of aluminum nitride. The adsorption energy, measured in electron volts (eV), indicates the energy change when a methanol molecule is adsorbed onto the surface. Positive values represent endothermic reactions where energy is absorbed, while negative values represent exothermic reactions where energy is released. The system energy represents the total energy of the aluminum nitride with the adsorbed methanol molecule. The methanol energy and aluminum nitride energy columns represent the energy of the isolated methanol molecule and the bare aluminum nitride surface, respectively. The data suggests that the adsorption process is exothermic at sites 4, 5, 6, 7, and 8, as indicated by the negative adsorption energy values. Conversely, the process is endothermic at sites 1, 2, and 3, where the adsorption energy values are positive. the best active site to continue calculations is site 5. According to the amount of absorption energy, the absorption energy is -0.5532 eV.
This information is crucial for understanding the interaction between methanol and AlN, graphene, and BN which could have significant implications for its use in various applications.
Our study into the interaction between graphene and methanol, as depicted in Figure 7, unveiled significant modifications in the density of states (DOS). The DOS for pristine graphene, denoted by the red line, showcases distinct peaks at specific energy levels, underscoring its unique electronic properties. However, the incorporation of methanol, represented by the blue line, results in a noticeable shift and modulation in these peaks, suggesting a redistribution of electronic states. This could potentially modify the electronic and chemical properties of graphene. Notably, the Graphene-Methanol system exhibits more pronounced peaks around 10 eV, indicating a higher density of states at this energy level compared to pristine graphene.
Figure 7 provides a comparative analysis of the DOS for Graphene and Graphene-Methanol. The x-axis represents energy levels in electron volts (eV), while the y-axis denotes DOS in states/eV. The graph features two distinct plots: the red line for pure Graphene and the blue line for Graphene-Methanol. The latter exhibits more pronounced peaks and troughs, suggesting a significant alteration in the electronic structure upon the introduction of methanol.
Interestingly, there is no Fermi peak near zero, and the band gap of graphene and graphene-methanol remains unchanged at 3.9 eV. No shift is observed, and there is no electron transfer in this region. Based on the density of the state diagram, the absorption energy, and the Mulliken charge, it can be inferred that the absorption process is of a weak physical type. These findings provide valuable insights into the electronic structure of graphene and its interaction with methanol, paving the way for further research in this area.
The graph in the provided image illustrates the Density of States (DOS) for Graphene and Graphene-Methanol. The DOS for Graphene, represented by the red line, exhibits distinct peaks at specific energy levels, indicative of its unique electronic properties. However, upon interaction with methanol, represented by the purple line, there is a noticeable shift and modulation in these peaks. This suggests that the incorporation of methanol leads to a redistribution of electronic states, potentially offering modified electronic and chemical properties.
The pronounced peaks in the DOS for Graphene-Methanol, particularly around 2 eV and between 10 to 15 eV, suggest a significant redistribution of electronic states. This could be indicative of changes in the electronic structure of Graphene upon the introduction of methanol. The changes in the electronic structure could potentially alter the chemical reactivity and electronic conductivity of Graphene, thereby influencing its performance in various applications.
For instance, in the field of catalysis, the altered electronic structure could potentially enhance the catalytic activity of Graphene. The pronounced peaks in the DOS might correspond to the availability of more electronic states at specific energy levels, which could facilitate electron transfer during catalytic reactions. Similarly, in sensor development, the changes in the DOS could influence the sensitivity and selectivity of Graphene-based sensors.
Moreover, the absence of a Fermi peak near zero and the unchanged band gap of 3.9 eV suggest that the interaction between Graphene and methanol is likely of a weak physical nature, rather than a strong chemical interaction. This could have implications for the stability and recyclability of Graphene in practical applications.
Figure 8 provides a comprehensive illustration of the Density of States (DOS) for Aluminum Nitride (AlN) and its interaction with Methanol (AlN-Methanol). The graph plots energy levels in electron volts (eV) against DOS in states/eV. The DOS for pure AlN, depicted by the red line, presents a distinct pattern of peaks and troughs at specific energy levels, a testament to its unique electronic properties. However, the introduction of methanol, represented by the blue line, noticeably alters this pattern. The peaks and troughs become more pronounced, especially around -5, 0, and 5 eV, suggesting a significant redistribution of electronic states. This implies that methanol's incorporation could potentially modify the electronic and chemical properties of AlN.
The pronounced peaks and troughs in the DOS for AlN-Methanol, particularly around -5, 0, and 5 eV, indicate changes in the electronic structure of AlN upon methanol's introduction. These changes could potentially influence the chemical reactivity and electronic conductivity of AlN, thereby affecting its performance in various applications. For instance, in catalysis, the altered electronic structure could enhance AlN's catalytic activity. The pronounced peaks in the DOS might correspond to the availability of more electronic states at specific energy levels, facilitating electron transfer during catalytic reactions. Similarly, in sensor development, the changes in the DOS could affect the sensitivity and selectivity of AlN-based sensors.
Interestingly, the absence of a Fermi peak near zero and the unchanged band gap of 3.9 eV suggest that the interaction between AlN and methanol is likely of a weak physical nature, rather than a strong chemical interaction. This could have implications for the stability and recyclability of AlN in practical applications.
Figure 9 provides a comprehensive illustration of the Density of States (DOS) for Boron Nitride (BN) and its interaction with Methanol (BN-Methanol). The graph plots energy levels in electron volts (eV) against DOS in states/eV. The DOS for pure BN, depicted by the blue line, presents a distinct pattern of peaks and troughs at specific energy levels, a testament to its unique electronic properties. However, the introduction of methanol, represented by the pink line, noticeably alters this pattern. The peaks and troughs become more pronounced, especially around -5, 0, and 5 eV, suggesting a significant redistribution of electronic states. This implies that methanol’s incorporation could potentially modify the electronic and chemical properties of BN.
It is observed that there are no significant changes in the surface states around the Fermi level of zero. The band gap is seen to reduce from 5.7 eV to 5.3 eV, indicating a shift of 1.4 eV to the right. This shift could be attributed to the electron transfer in the system. Considering the absorption energy and the equilibrium distance of the methanol molecule from boron nitride, along with the local density diagram, it can be inferred that the adsorption process is a physical process. This means that the methanol molecule is physically adsorbed onto the BN surface, without any significant alteration or disruption to the electronic structure of the BN. This observation is crucial as it provides insights into the interaction between methanol and BN, which could have significant implications for its use in various applications.
The pronounced peaks in the DOS for BN-Methanol, particularly around -5, 0, and 5 eV, suggest a significant redistribution of electronic states. This could be indicative of changes in the electronic structure of BN upon the introduction of methanol. The changes in the electronic structure could potentially alter the chemical reactivity and electronic conductivity of BN, thereby influencing its performance in various applications. For instance, in the field of catalysis, the altered electronic structure could potentially enhance the catalytic activity of BN. The pronounced peaks in the DOS might correspond to the availability of more electronic states at specific energy levels, which could facilitate electron transfer during catalytic reactions. Similarly, in sensor development, the changes in the DOS could influence the sensitivity and selectivity of BN-based sensors.
Moreover, the absence of a Fermi peak near zero and the unchanged band gap of 3.9 eV suggest that the interaction between BN and methanol is likely of a weak physical nature, rather than a strong chemical interaction. This could have implications for the stability and recyclability of BN in practical applications.
4. Conclusions
In this study, we demonstrated the superior adsorption capabilities of Aluminum Nitride (AlN) over Graphene and Boron Nitride (BN) for methanol absorption. This superiority is attributed to AlN’s significantly enhanced charge transfer and absorption energies. We considered eight adsorption sites for AlN and BN, and six for Graphene, and examined the adsorption of a single methanol molecule under various geometric conditions on these materials. The state with the most negative energy value was identified as the most stable possible state.
Our Density Functional Theory (DFT) calculations revealed that AlN exhibits the highest adsorbent energy with methanol among the materials studied. The strongest adsorption energy of methanol on AlN was found to be -0.0553 eV at a distance of 2.462 Å, with a charge transfer (Mulliken charge) of +0.075 from methanol to AlN. In contrast, the strongest adsorption energy of methanol on BN was -0.1351 eV at a distance of 2.619 Å, with a charge transfer of +0.022. The density of states results indicated a decrease in the bandgap from 5.7 to 5.3, with a shift of 1.4 eV to the right, suggesting physical adsorption.
On the other hand, the strongest adsorption energy for methanol on Graphene was -0.073 eV, with a charge transfer of +0.004 at a distance of 2.948 Å. The density of states results showed no change in the bandgap, which remained at 3.9, indicating weak physical absorption. Therefore, methanol adsorption on Graphene is physical and weaker than on AlN and BN.
Given the higher absorption energy of methanol on AlN, changes in the local density diagram, and more charge transfer from methanol to AlN, we concluded that methanol absorption on AlN is stronger. The physical adsorption process, as explained through density functional theory, shows that AlN, BN, and Graphene participate in weak physical interactions with methanol, albeit with varying efficiencies.
The unique electronic properties of Boron Nitride, characterized by a reduction in the bandgap upon methanol adsorption and a significant charge transfer to methanol, underscore its potential as an effective material for methanol adsorption applications. These findings provide valuable insights into the adsorption properties of methanol on AlN, BN, and Graphene, which could guide the design and optimization of direct methanol fuel cells. This knowledge opens up new possibilities for the use of Boron Nitride in adsorption and separation technologies.
References
- Vielstich, W. Fuel cells: Modern processes for the electrochemical production of energy. translated by DJG Ives, Willey-Interscience, New York. 1970:76-118.
- Ismail A, Naim R Zubir N. Fuel cell technology review. Polymer Membranes for Fuel Cells. 2009:27-49.
- Barbir, F. PEM fuel cells: theory and practice: Academic press; 2012.
- Wasmus S, Küver A. Methanol oxidation and direct methanol fuel cells: a selective review. Journal of Electroanalytical Chemistry. 1999;461(1-2):14-31. [CrossRef]
- Rostamiyan Y, Mashhadzadeh AH, SalmanKhani A. Optimization of mechanical properties of epoxy-based hybrid nanocomposite: Effect of using nano silica and high-impact polystyrene by mixture design approach. Materials & Design (1980-2015). 2014;56:1068-77. [CrossRef]
- Rostamiyan Y, Fereidoon A, Rezaeiashtiyani M, Mashhadzadeh AH, Salmankhani A. Experimental and optimizing flexural strength of epoxy-based nanocomposite: Effect of using nano silica and nano clay by using response surface design methodology. Materials & Design. 2015;69:96-104. [CrossRef]
- Rostamiyan Y, Fereidoon A, Mashhadzadeh AH, Ashtiyani MR, Salmankhani A. Using response surface methodology for modeling and optimizing tensile and impact strength properties of fiber orientated quaternary hybrid nano composite. Composites Part B: Engineering. 2015;69:304-16. [CrossRef]
- Rostamiyan Y, Fereidoon A, Ghalebahman AG, Mashhadzadeh AH, Salmankhani A. Experimental study and optimization of damping properties of epoxy-based nanocomposite: Effect of using nanosilica and high-impact polystyrene by mixture design approach. Materials & Design (1980-2015). 2015;65:1236-44. [CrossRef]
- Mashhadzadeh AH, Fereidoon A, Ahangari MG. Combining density functional theory-finite element multi-scale method to predict mechanical properties of polypropylene/graphene nanocomposites: Experimental study. Materials Chemistry and Physics. 2017;201:214-23. [CrossRef]
- Mashhadzadeh AH, Fereidoon A, Ahangari MG. Surface modification of carbon nanotubes using 3-aminopropyltriethoxysilane to improve mechanical properties of nanocomposite based polymer matrix: experimental and density functional theory study. Applied Surface Science. 2017;420:167-79. [CrossRef]
- Mashhadzadeh AH, Fereidoon A, Ahangari MG. Atomistic modeling of interfacial interaction between polyvinyl chloride and polypropylene with Boron-Nitride monolayer sheet: a density functional theory study. Superlattices and Microstructures. 2017;111:23-31. [CrossRef]
- Rostamiyan Y, Fereidoon A, Hamed Mashhadzadeh A, Khalili M. Augmenting epoxy toughness by combination of both thermoplastic and nanolayered materials and using artificial intelligence techniques for modeling and optimization. Journal of Polymer Research. 2013;20:1-11. [CrossRef]
- Mashhadzadeh AH, Fathalian M, Ahangari MG, Shahavi M. DFT study of Ni, Cu, Cd and Ag heavy metal atom adsorption onto the surface of the zinc-oxide nanotube and zinc-oxide graphene-like structure. Materials Chemistry and Physics. 2018;220:366-73. [CrossRef]
- Mashhadzadeh AH, Vahedi A, Ardjmand M, Ahangari MG. Investigation of heavy metal atoms adsorption onto graphene and graphdiyne surface: a density functional theory study. Superlattices and Microstructures. 2016;100:1094-102. [CrossRef]
- Mashhadzadeh AH, Ahangari MG, Salmankhani A, Fataliyan M. Density functional theory study of adsorption properties of non-carbon, carbon and functionalized graphene surfaces towards the zinc and lead atoms. Physica E: Low-dimensional Systems and Nanostructures. 2018;104:275-85. [CrossRef]
- Yaşyerli S, Ar I, Doğu G, Doğu T. Removal of hydrogen sulfide by clinoptilolite in a fixed bed adsorber. Chemical Engineering and Processing: Process Intensification. 2002;41(9):785-92. [CrossRef]
- Novoselov KS, Geim AK, Morozov SV, Jiang D-e, Zhang Y, Dubonos SV, et al. Electric field effect in atomically thin carbon films. science. 2004;306(5696):666-9. [CrossRef]
- Song L, Ci L, Lu H, Sorokin PB, Jin C, Ni J, et al. Large scale growth and characterization of atomic hexagonal boron nitride layers. Nano letters. 2010;10(8):3209-15. [CrossRef]
- Novoselov K, Jiang D, Schedin F, Booth T, Khotkevich V, Morozov S, Geim A. Proc. Natl. Acad. Sci. USA. Proc Natl Acad Sci USA. 2005;102(10451).
- Farahani M, Ahmadi TS, Seif A. A DFT study of the nuclear magnetic response of the zigzag AlN–BN and BN–AlN nanotube junctions. Journal of Molecular Structure: THEOCHEM. 2009;913(1-3):126-30. [CrossRef]
- Mishra S, Satpathy S, Jepsen O. Electronic structure and thermoelectric properties of bismuth telluride and bismuth selenide. Journal of Physics: Condensed Matter. 1997;9(2):461. [CrossRef]
- Coleman JN, Lotya M, O’Neill A, Bergin SD, King PJ, Khan U, et al. Two-dimensional nanosheets produced by liquid exfoliation of layered materials. Science. 2011;331(6017):568-71. [CrossRef]
- Mashhadzadeh AH, Ahangari MG, Dadrasi A, Fathalian M. Theoretical studies on the mechanical and electronic properties of 2D and 3D structures of beryllium-oxide graphene and graphene nanobud. Applied Surface Science. 2019;476:36-48. [CrossRef]
- Ahangari MG, Mashhadzadeh AH, Fathalian M, Dadrasi A, Rostamiyan Y, Mallahi A. Effect of various defects on mechanical and electronic properties of zinc-oxide graphene-like structure: A DFT study. Vacuum. 2019;165:26-34. [CrossRef]
- Ahangari MG, Fereidoon A, Mashhadzadeh AH. Interlayer interaction and mechanical properties in multi-layer graphene, Boron-Nitride, Aluminum-Nitride and Gallium-Nitride graphene-like structure: A quantum-mechanical DFT study. Superlattices and Microstructures. 2017;112:30-45. [CrossRef]
- Rostamiyan Y, Mohammadi V, Hamed Mashhadzadeh A. Mechanical, electronic and stability properties of multi-walled beryllium oxide nanotubes and nanopeapods: a density functional theory study. Journal of Molecular Modeling. 2020;26(4):76. [CrossRef]
- Ahangari MG, Mashhadzadeh AH. Density functional theory based molecular dynamics study on hydrogen storage capacity of C24, B12N12, Al12 N12, Be12O12, Mg12O12, and Zn12O12 nanocages. International Journal of Hydrogen Energy. 2020;45(11):6745-56. [CrossRef]
- Ghorbanzadeh Ahangari M, Salmankhani A, Imani AH, Shahab N, Hamed Mashhadzadeh A. Density functional theory study on the mechanical properties and interlayer interactions of multi-layer graphene: carbonic, silicon-carbide and silicene graphene-like structures. Silicon. 2019;11(3):1235-46. [CrossRef]
- Fereidoon A, Mostafaei M, Ganji MD, Memarian F. Atomistic simulations on the influence of diameter, number of walls, interlayer distance and temperature on the mechanical properties of BNNTs. Superlattices and Microstructures. 2015;86:126-33. [CrossRef]
- Turgut C, Pandiyan S, Mether L, Belmahi M, Nordlund K, Philipp P. Influence of alkane chain length on adsorption on an α-alumina surface by MD simulations. Nuclear Instruments and Methods in Physics Research Section B: Beam Interactions with Materials and Atoms. 2015;352:206-9.
- Ahangari MG, Ganji M, Montazar F. Mechanical and electronic properties of carbon nanobuds: First-principles study. Solid State Communications. 2015;203:58-62. [CrossRef]
- Ahangari MG, Fereidoon A, Ganji MD, Sharifi N. Density functional theory based molecular dynamics simulation study on the bulk modulus of multi-shell fullerenes. Physica B: Condensed Matter. 2013;423:1-5. [CrossRef]
- De Almeida E, de Brito Mota F, de Castilho CM, Kakanakova-Georgieva A, Gueorguiev GK. Defects in hexagonal-AlN sheets by first-principles calculations. The European Physical Journal B. 2012;85:1-9.
- Fereidoon A, Ahangari MG, Ganji MD, Jahanshahi M. Density functional theory investigation of the mechanical properties of single-walled carbon nanotubes. Computational materials science. 2012;53(1):377-81. [CrossRef]
- Ahangari MG, Fereidoon A, Jahanshahi M, Ganji M. Electronic and mechanical properties of single-walled carbon nanotubes interacting with epoxy: A DFT study. Physica E: Low-dimensional Systems and Nanostructures. 2013;48:148-56. [CrossRef]
- Memarian F, Fereidoon A, Ganji MD. Graphene Young’s modulus: Molecular mechanics and DFT treatments. Superlattices and Microstructures. 2015;85:348-56. [CrossRef]
- Perdew JP, Burke K, Ernzerhof M. Generalized gradient approximation made simple. Physical review letters. 1996;77(18):3865. [CrossRef]
- Kim BG, Choi HJ. Graphyne: Hexagonal network of carbon with versatile Dirac cones. Physical Review B. 2012;86(11):115435. [CrossRef]
- Ahangari, M.G. Modeling of the interaction between polypropylene and monolayer sheets: a quantum mechanical study. RSC advances. 2015;5(98):80779-85. [CrossRef]
- Osborn TH, Farajian AA, Pupysheva OV, Aga RS, Voon LLY. Ab initio simulations of silicene hydrogenation. Chemical Physics Letters. 2011;511(1-3):101-5. [CrossRef]
- Bekaroglu E, Topsakal M, Cahangirov S, Ciraci S. First-principles study of defects and adatoms in silicon carbide honeycomb structures. Physical Review B. 2010;81(7):075433. [CrossRef]
- Peng Q, Chen X-J, Liu S, De S. Mechanical stabilities and properties of graphene-like aluminum nitride predicted from first-principles calculations. RSC advances. 2013;3(19):7083-92. [CrossRef]
- Le M-Q. Prediction of Young’s modulus of hexagonal monolayer sheets based on molecular mechanics. International Journal of Mechanics and Materials in Design. 2015;11:15-24. [CrossRef]
Figure 1.
Optimized structure and geometrical parameters of bare Boron-Nitride monolayer sheet.
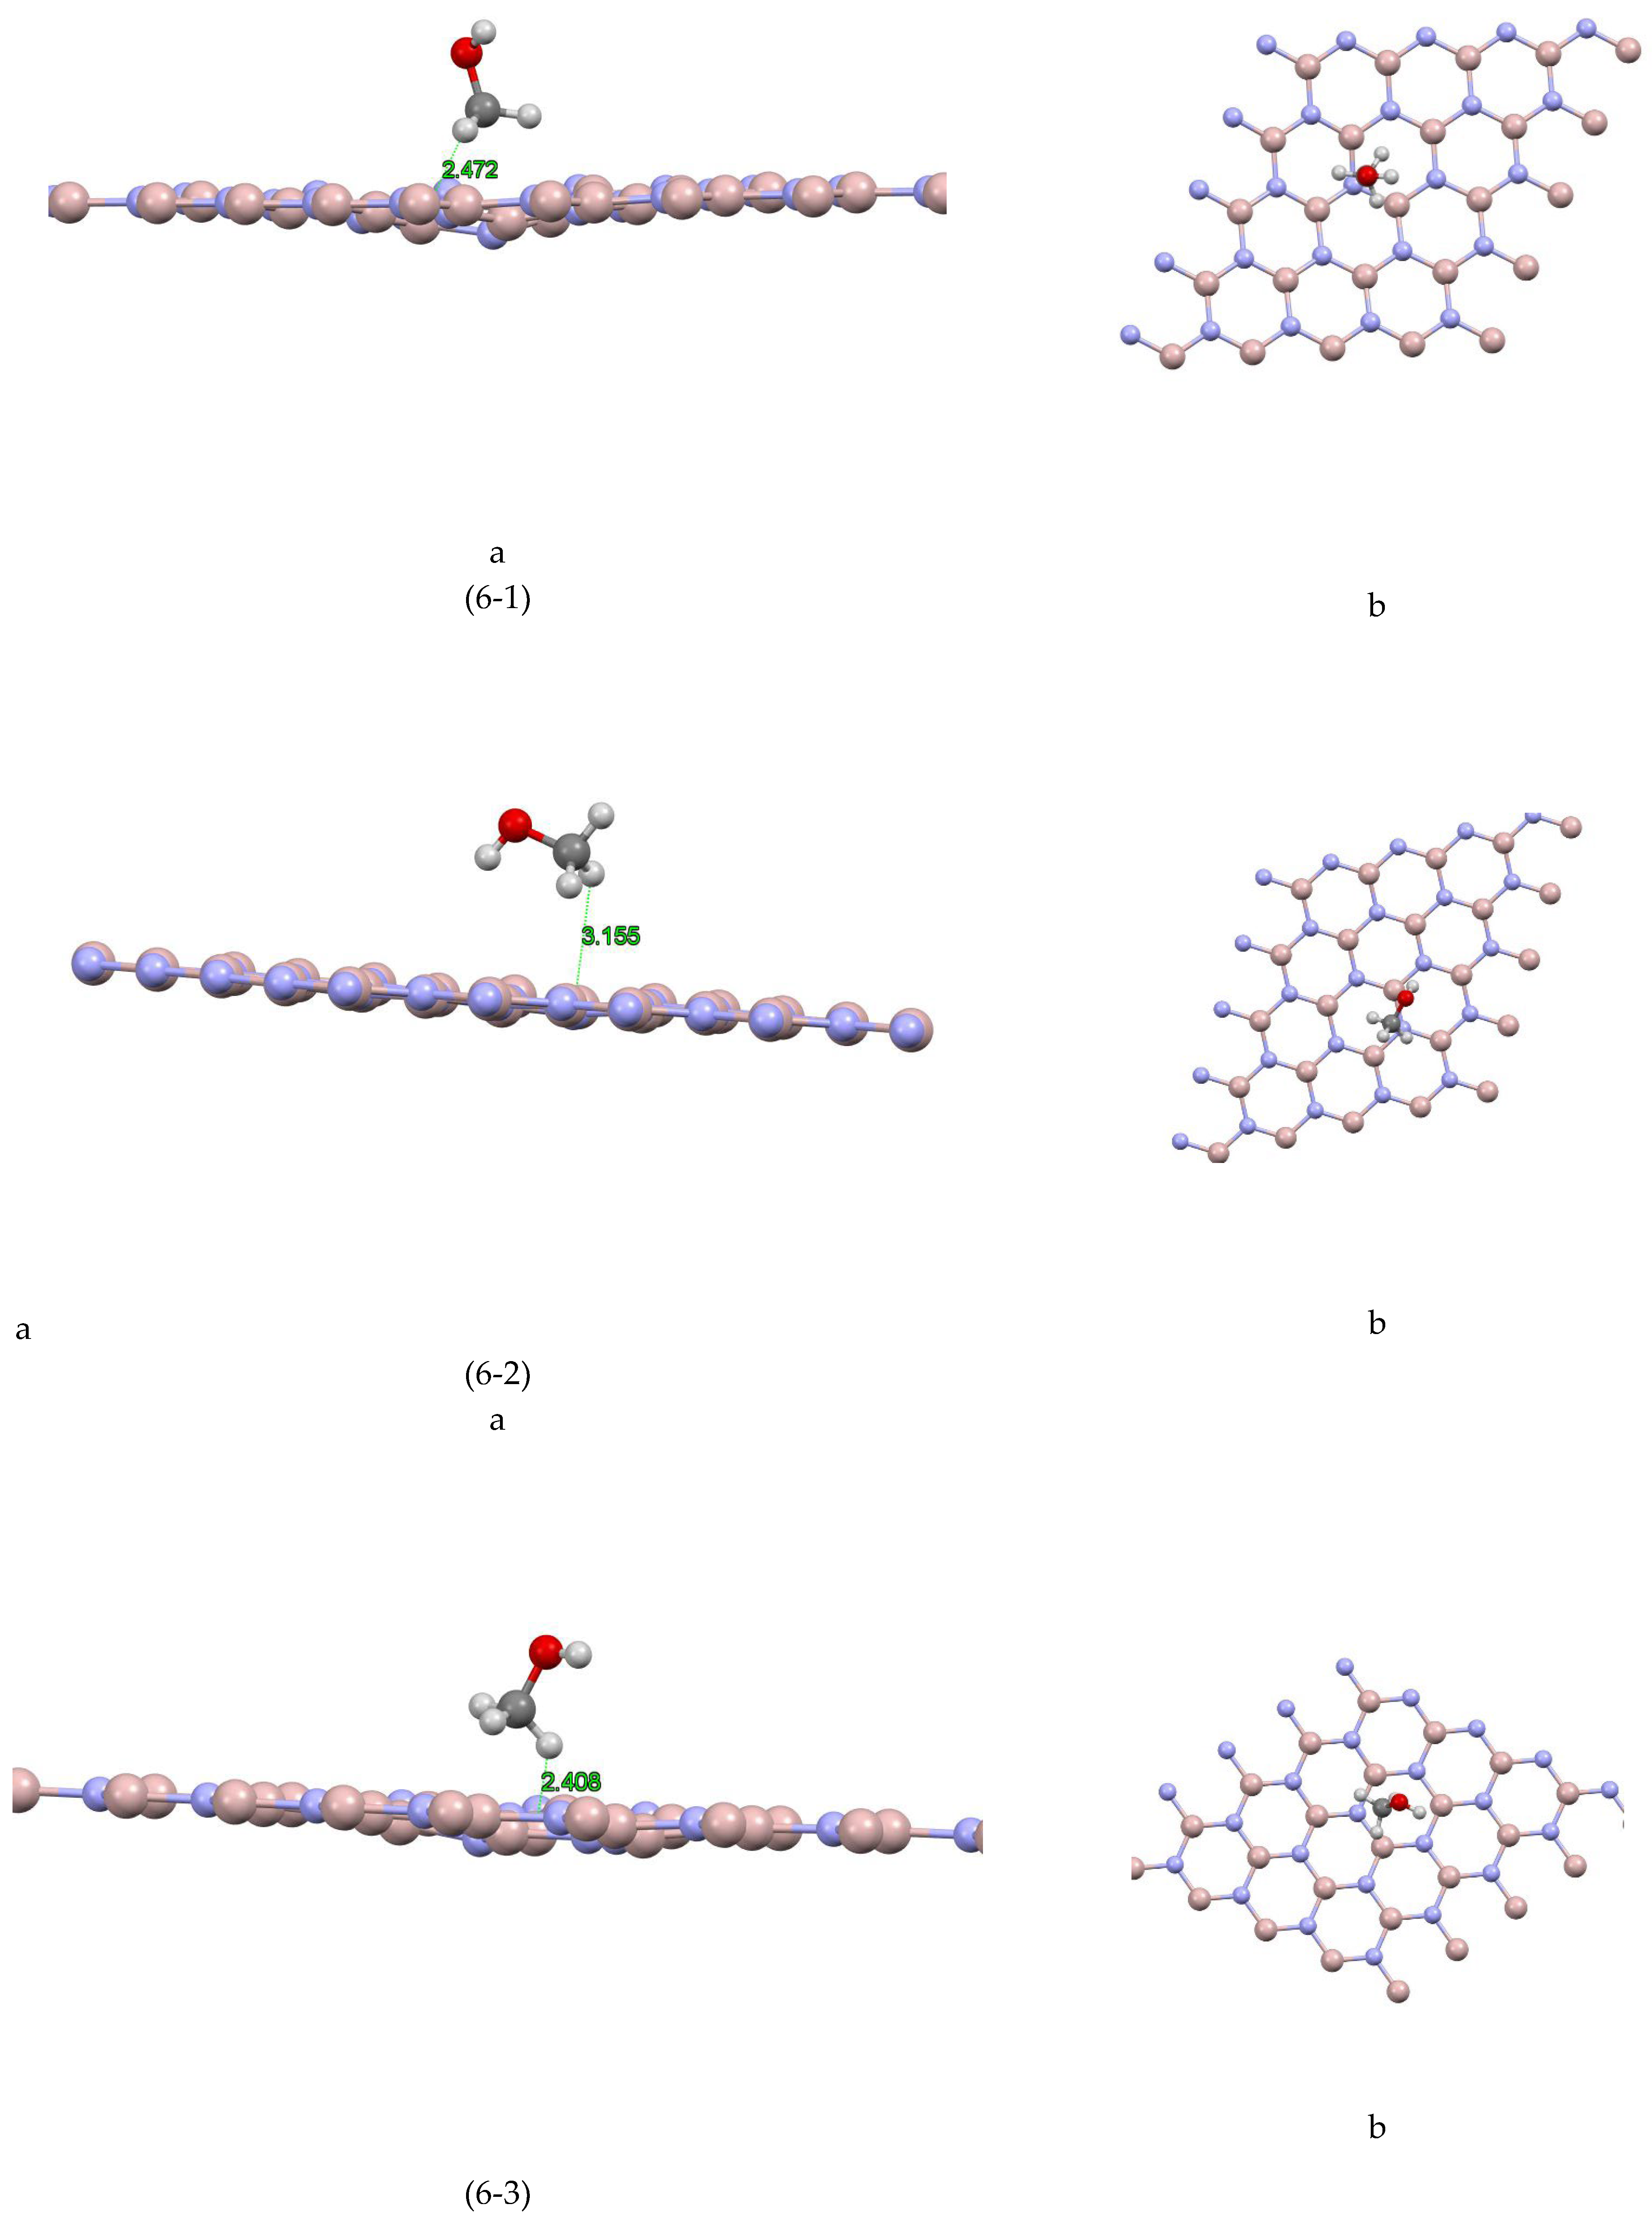
Figure 2.
Optimized structure and geometrical parameters of graphene monolayer sheet.
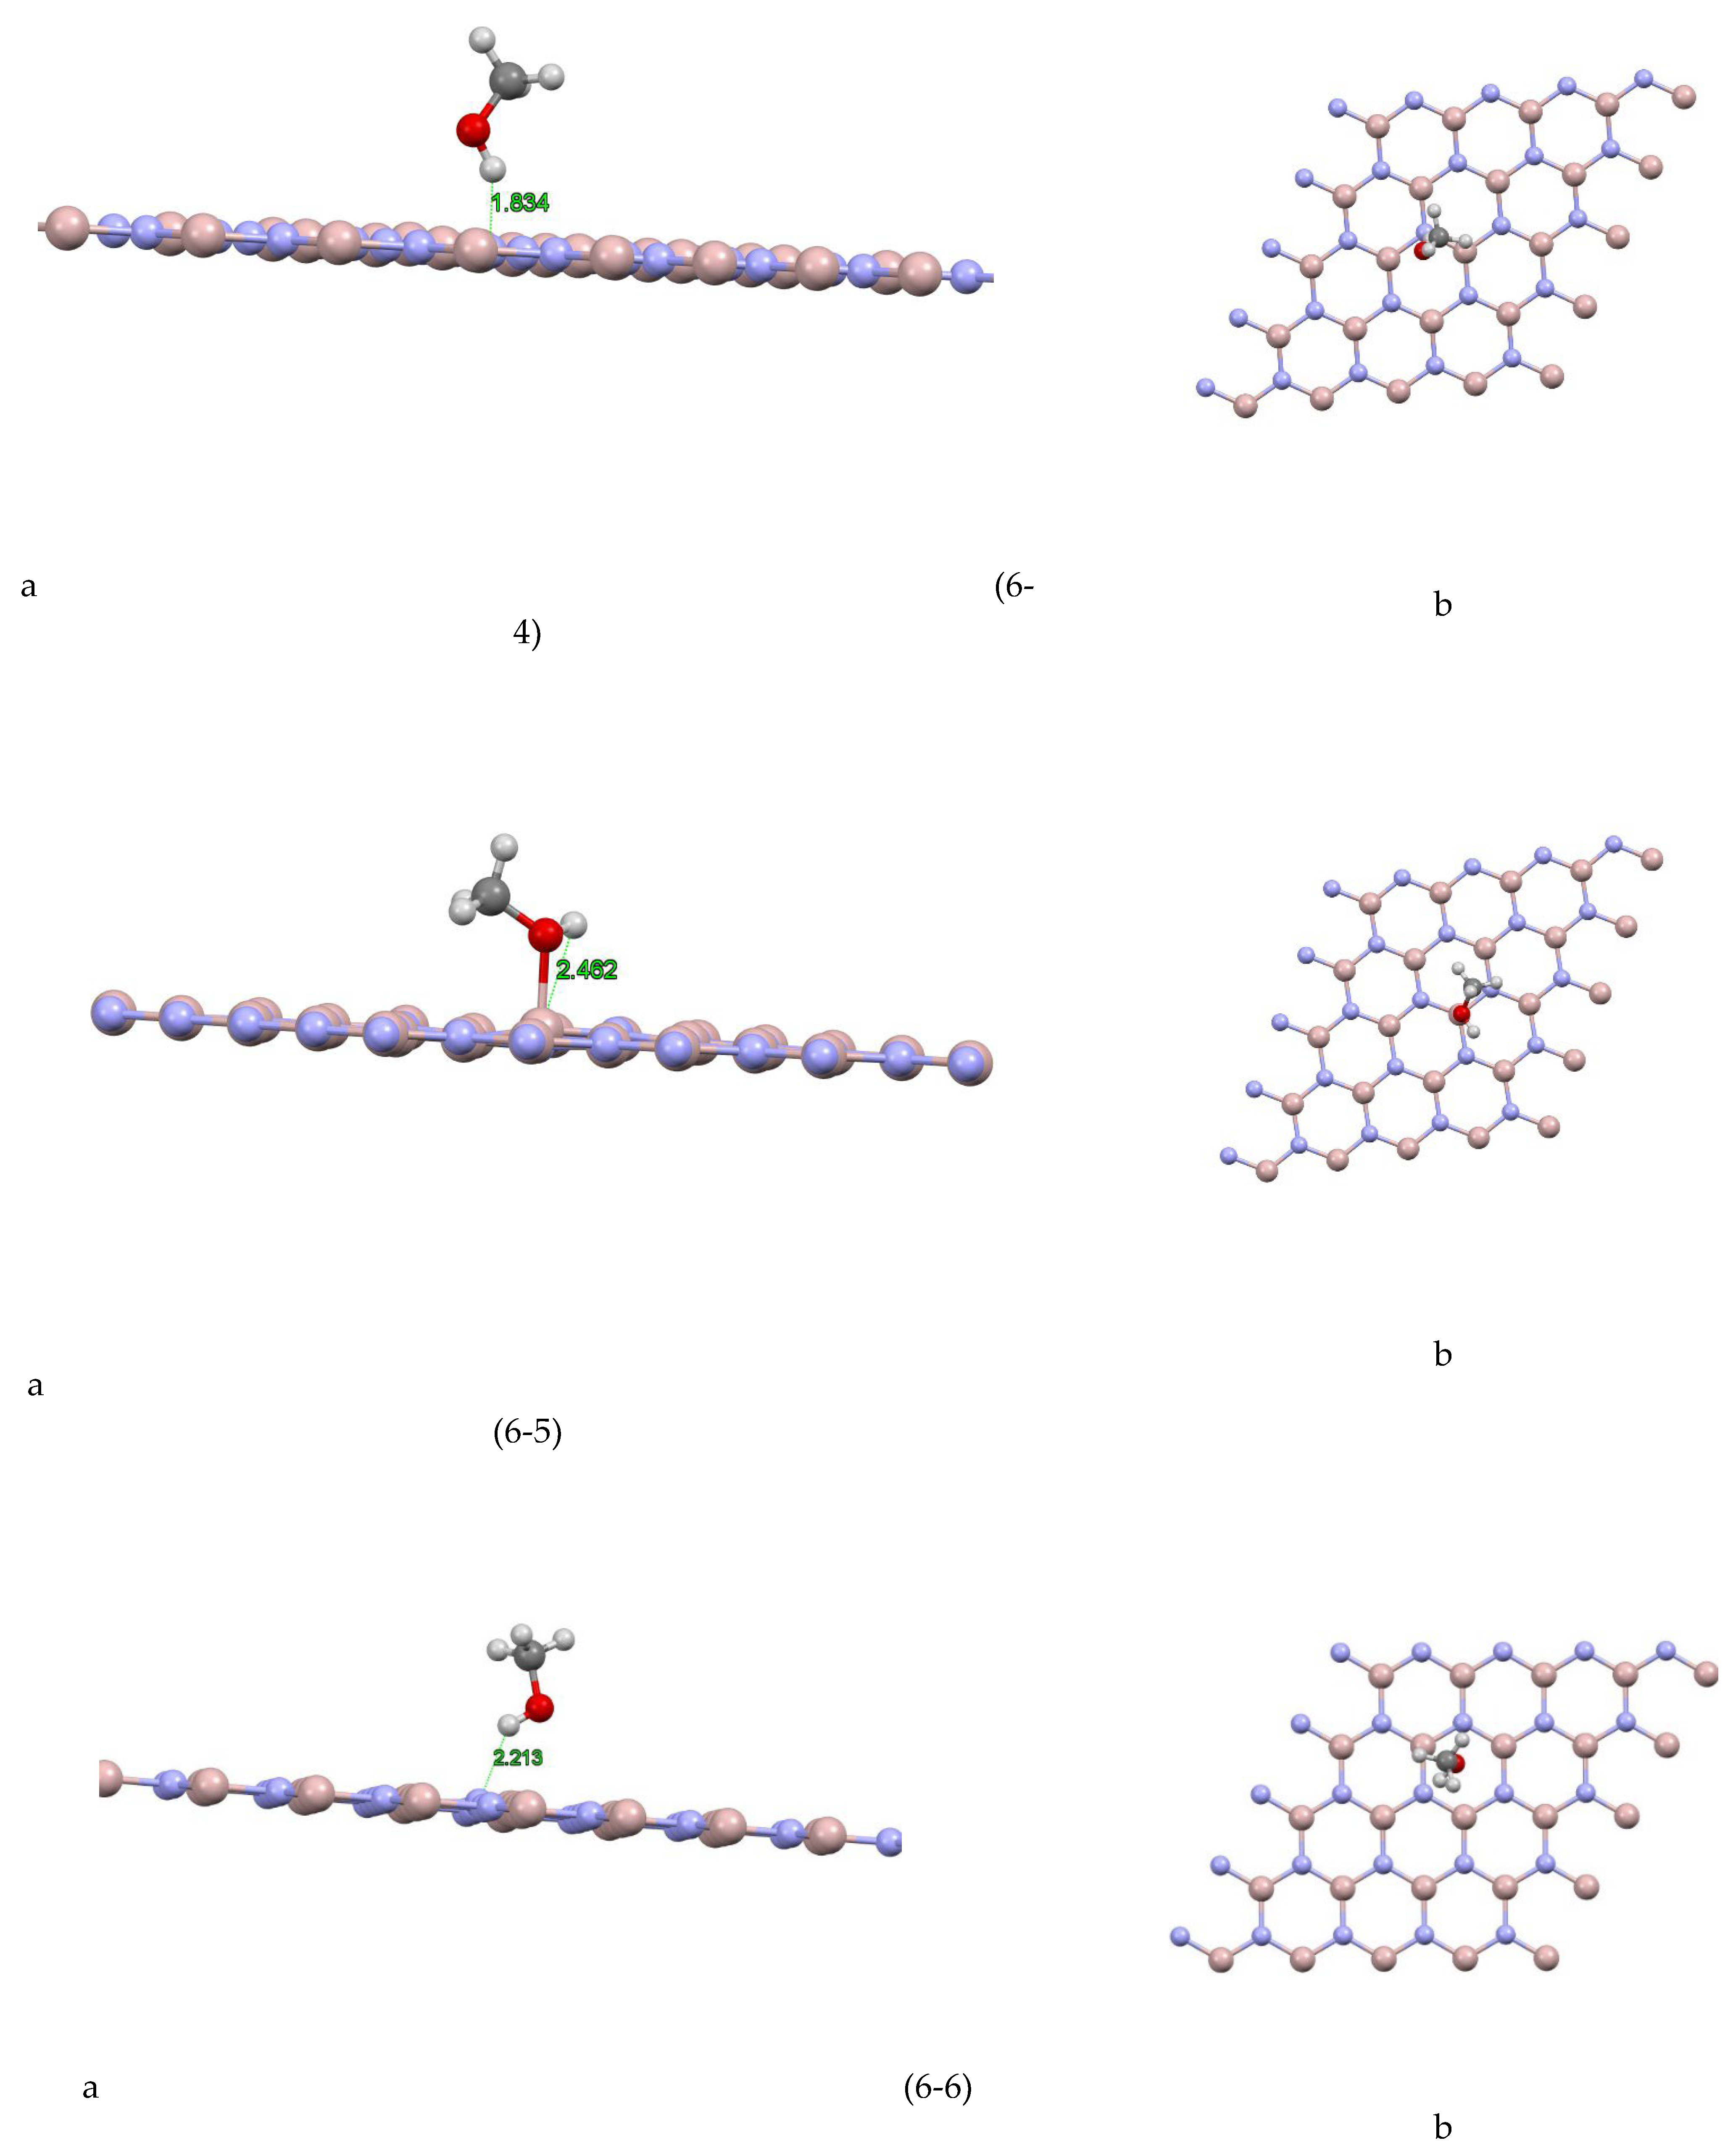
Figure 3.
Optimized structure and geometrical parameters of Aluminum Nitride monolayer sheet.
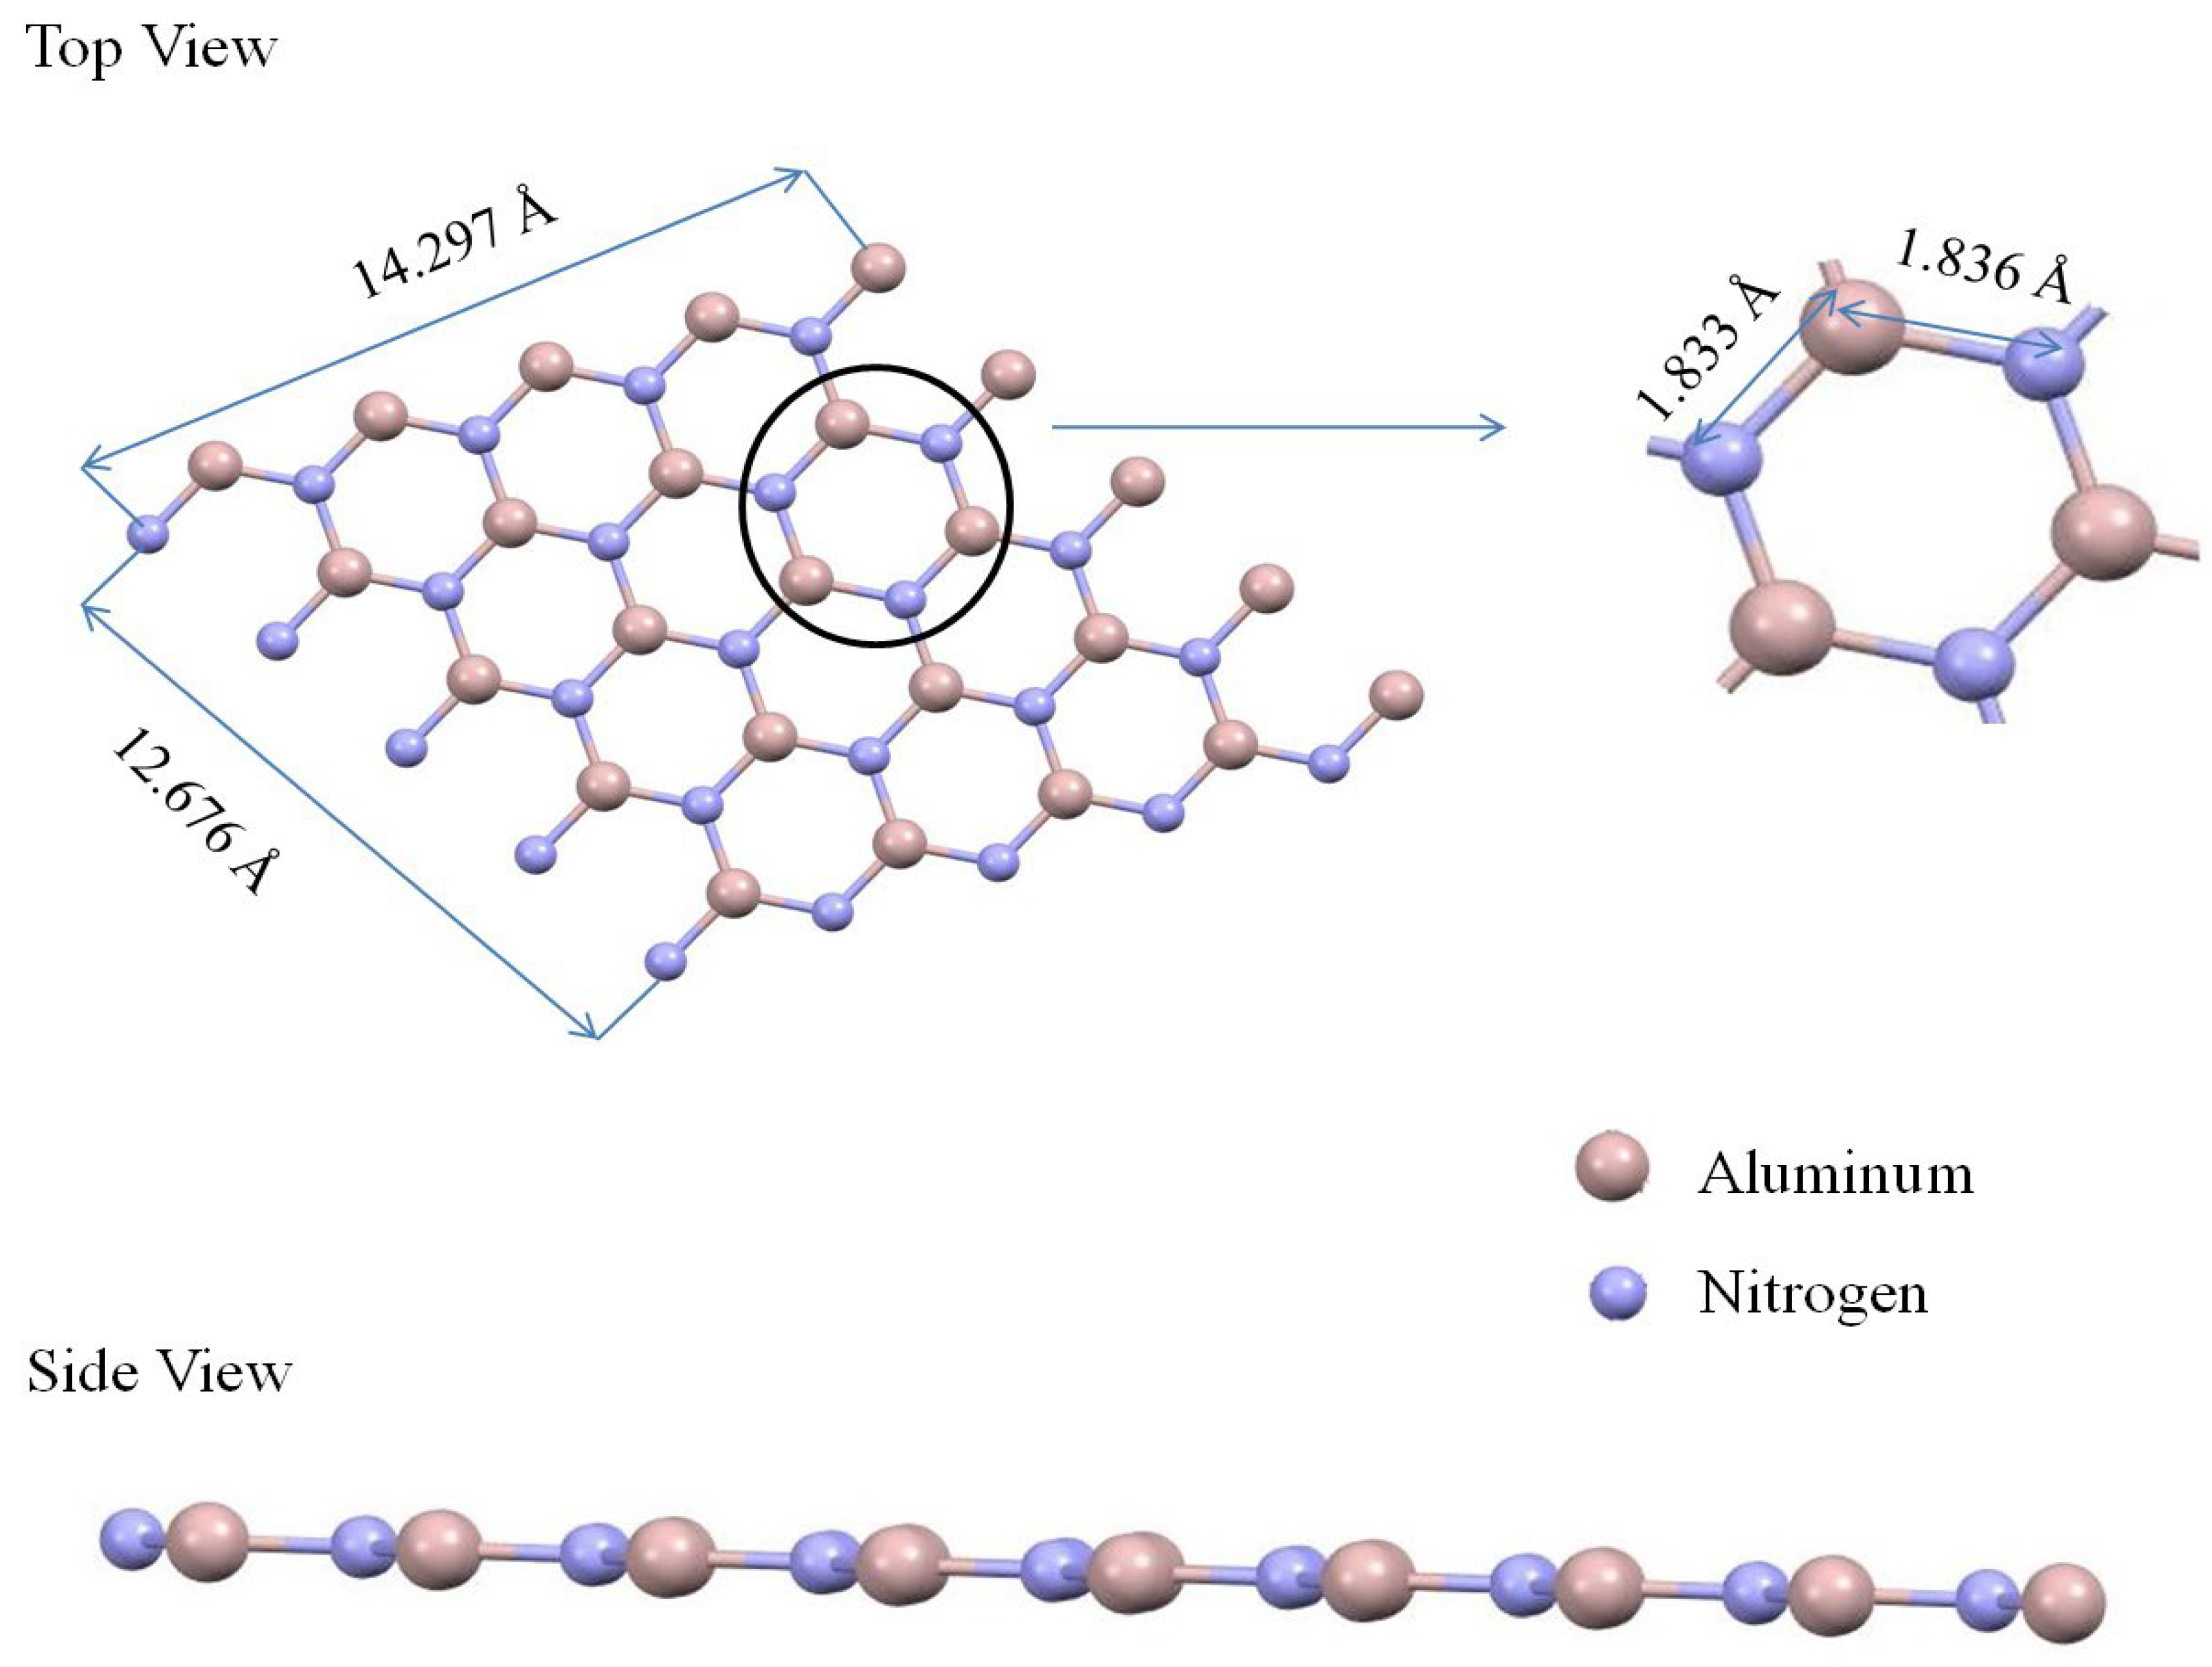
Figure 4.
The optimized structures and geometrical parameters of methanol adsorbed onto the surface of BN-graphene (a) side view and (b) top view (Boron Nitride-Methanol Stabilized System Site 1-8)).
Figure 4.
The optimized structures and geometrical parameters of methanol adsorbed onto the surface of BN-graphene (a) side view and (b) top view (Boron Nitride-Methanol Stabilized System Site 1-8)).
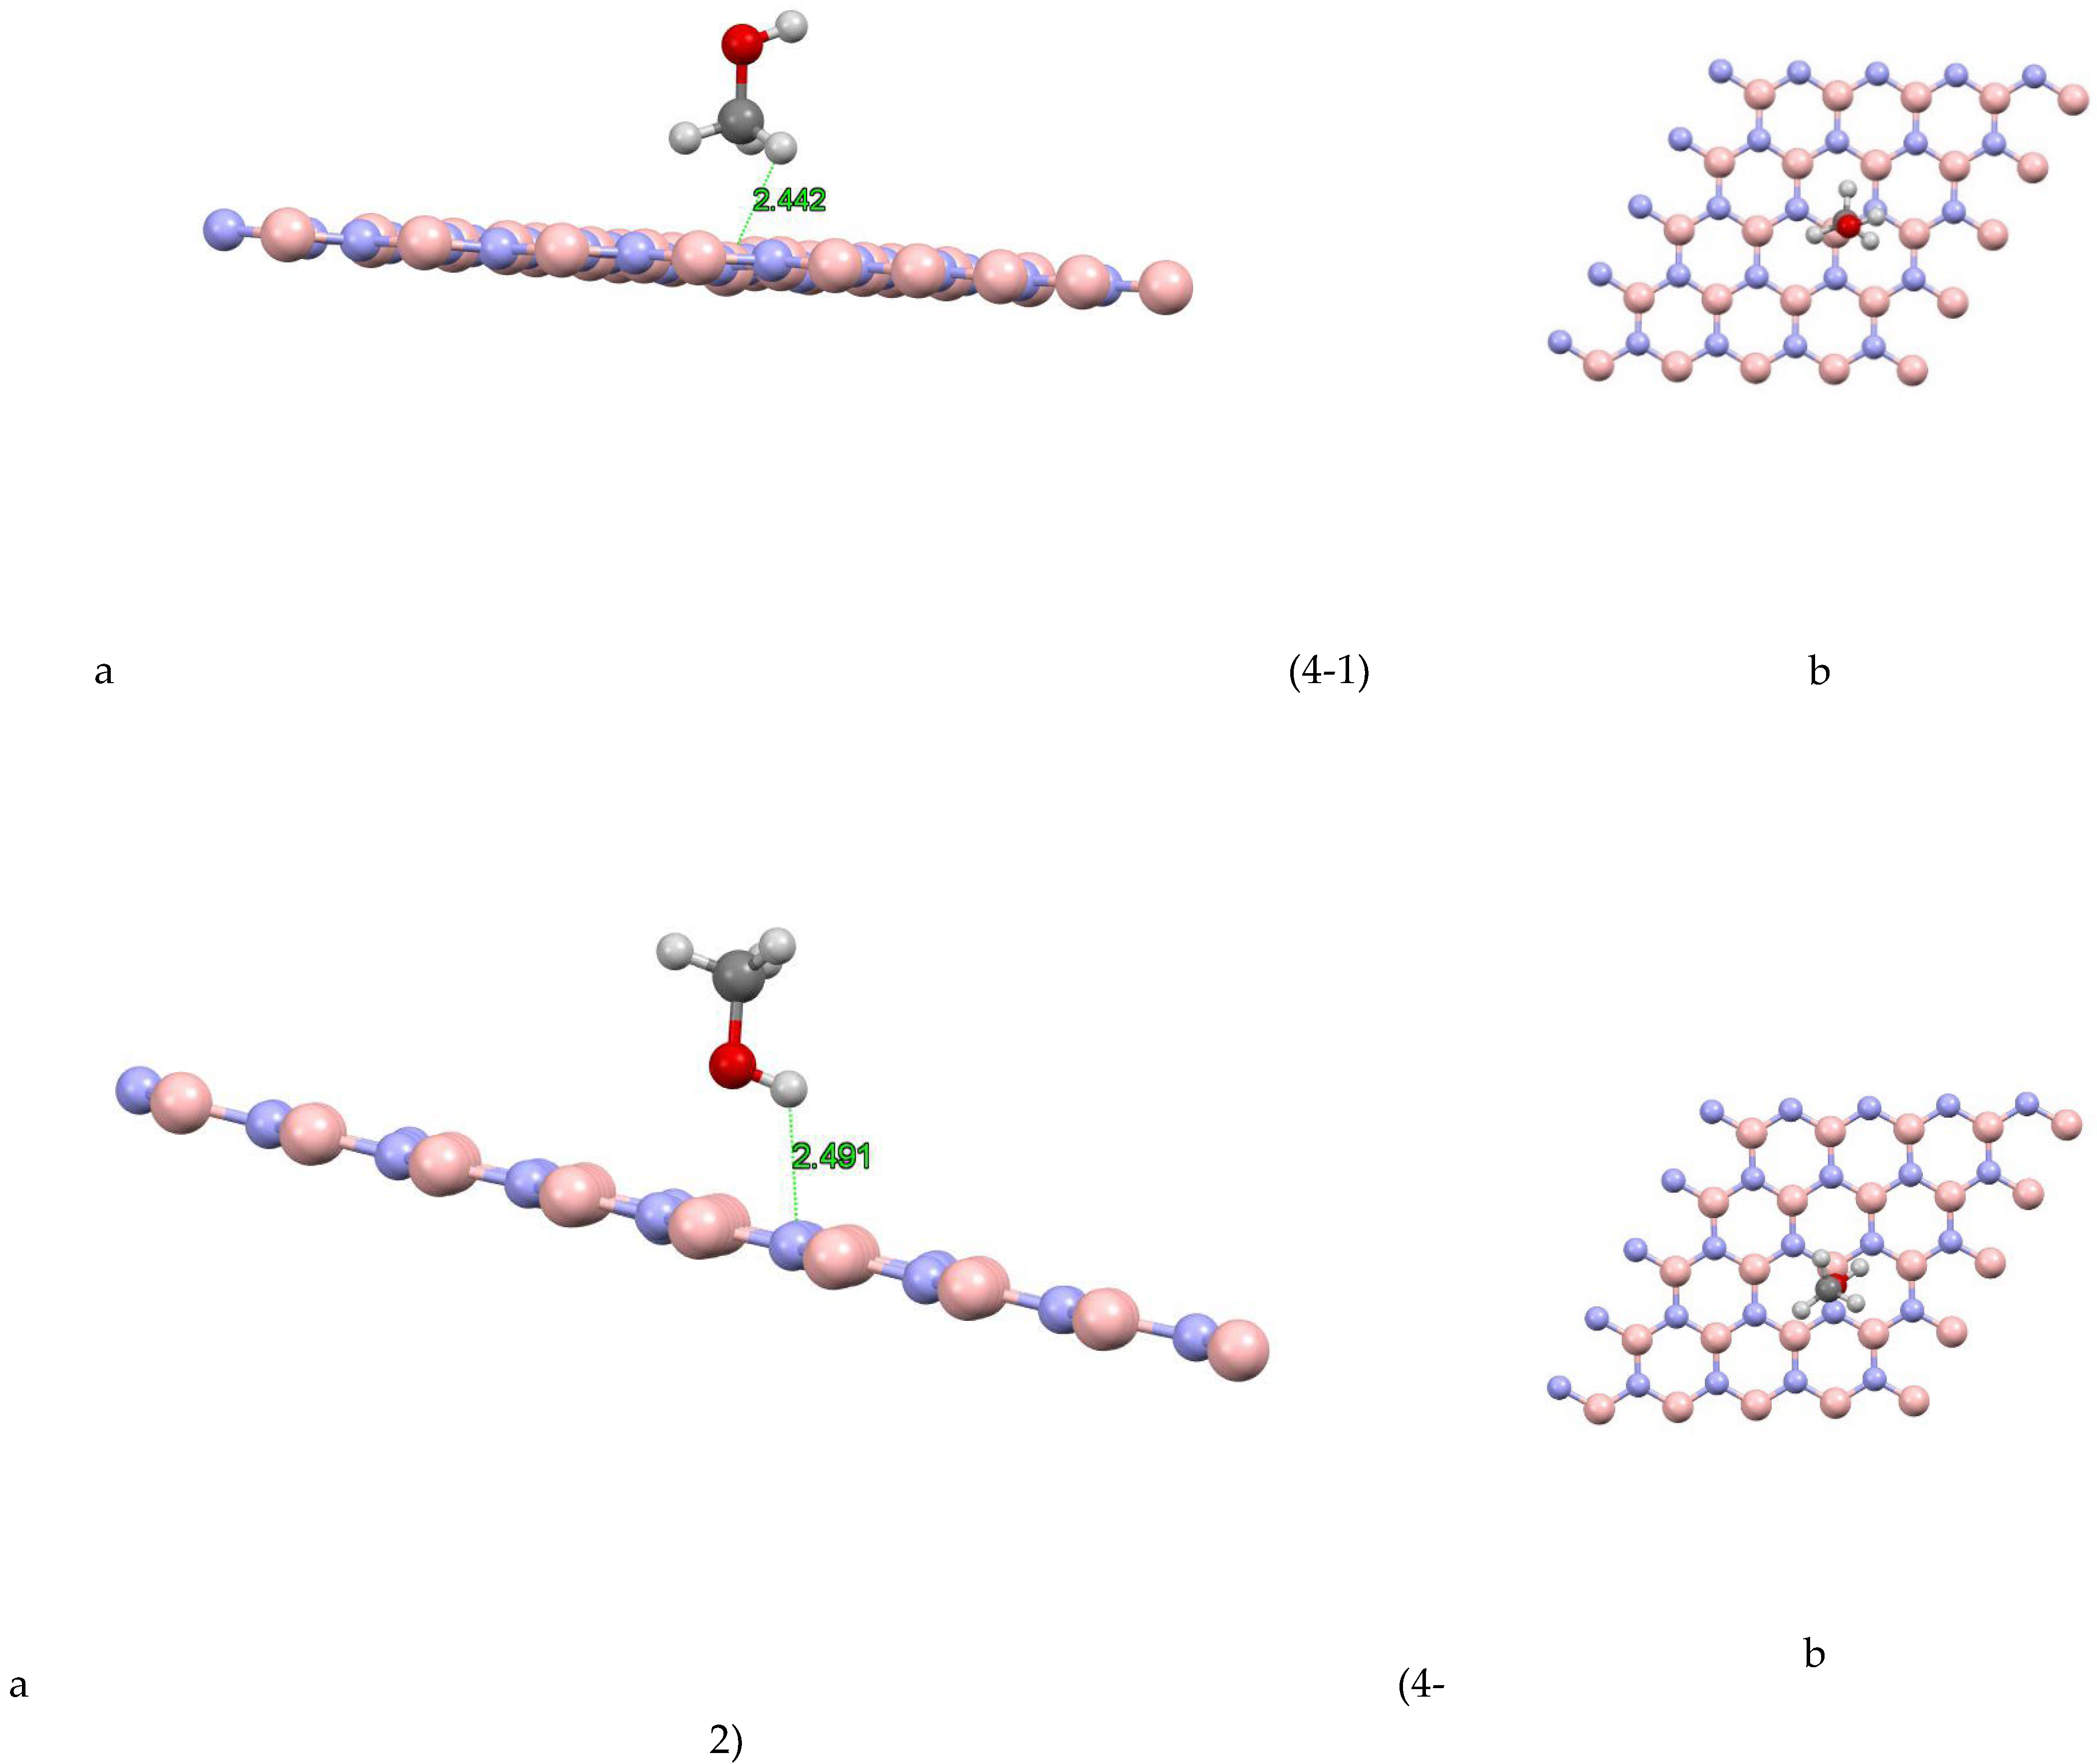
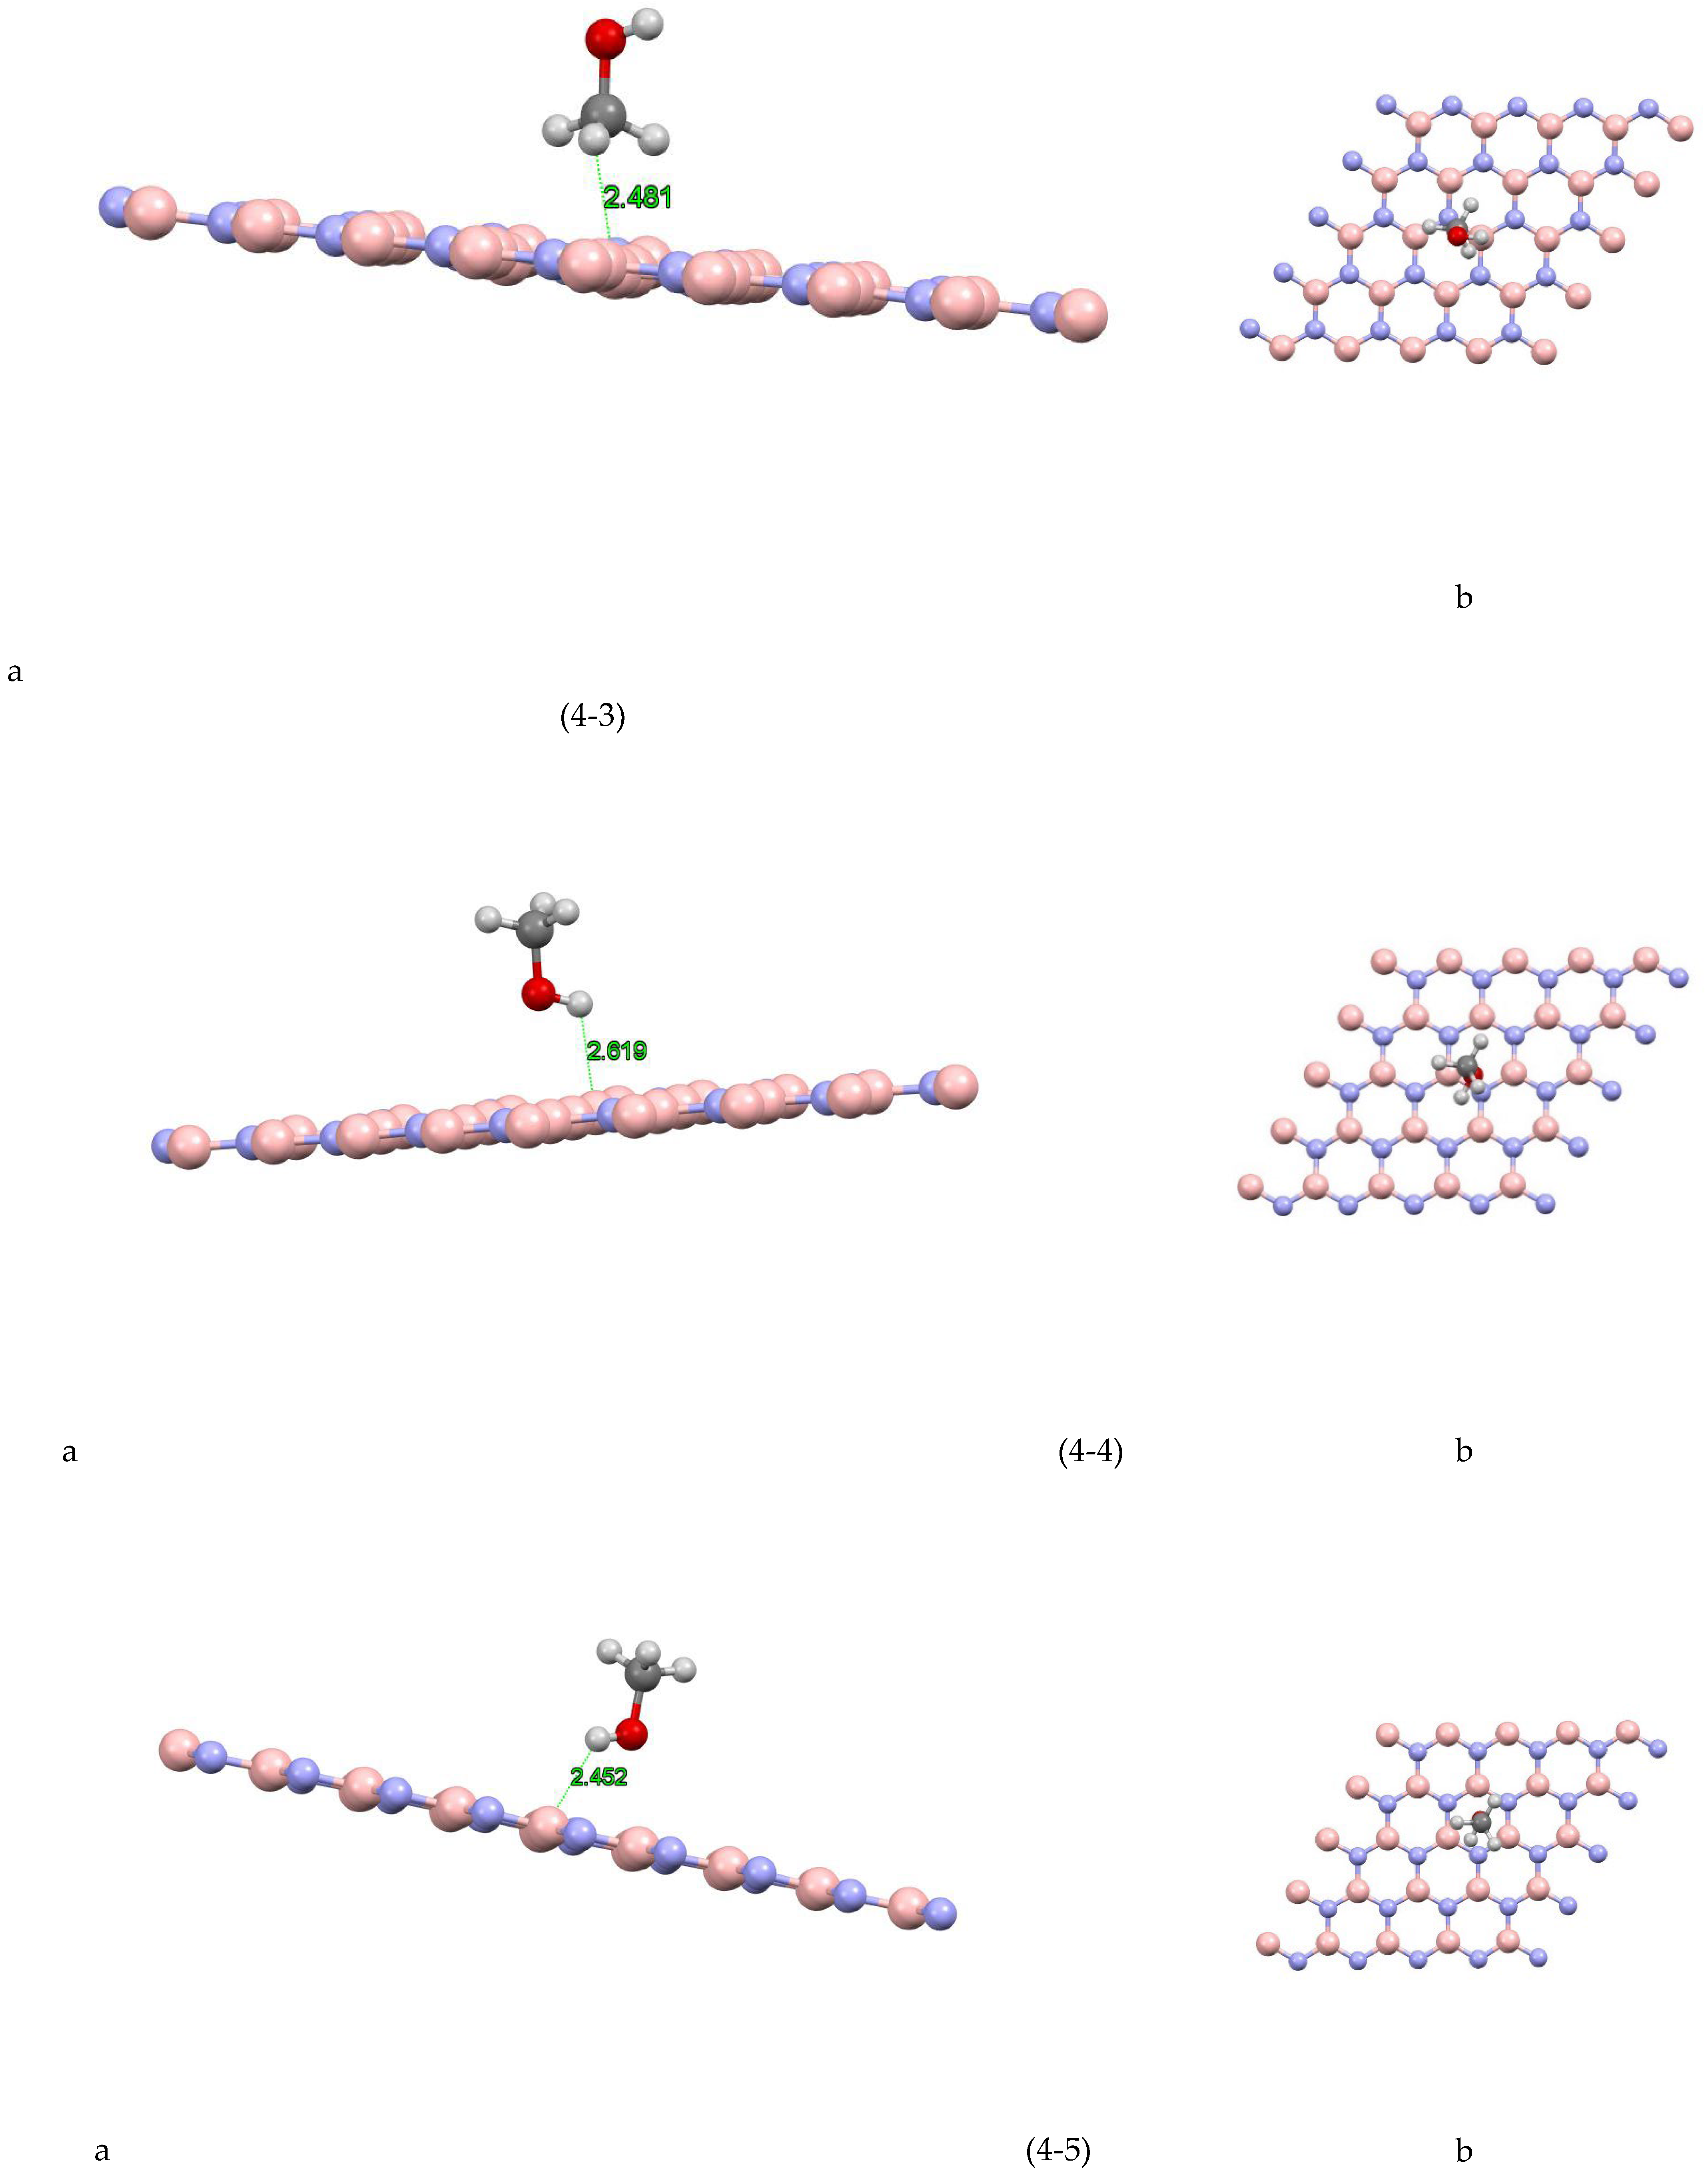
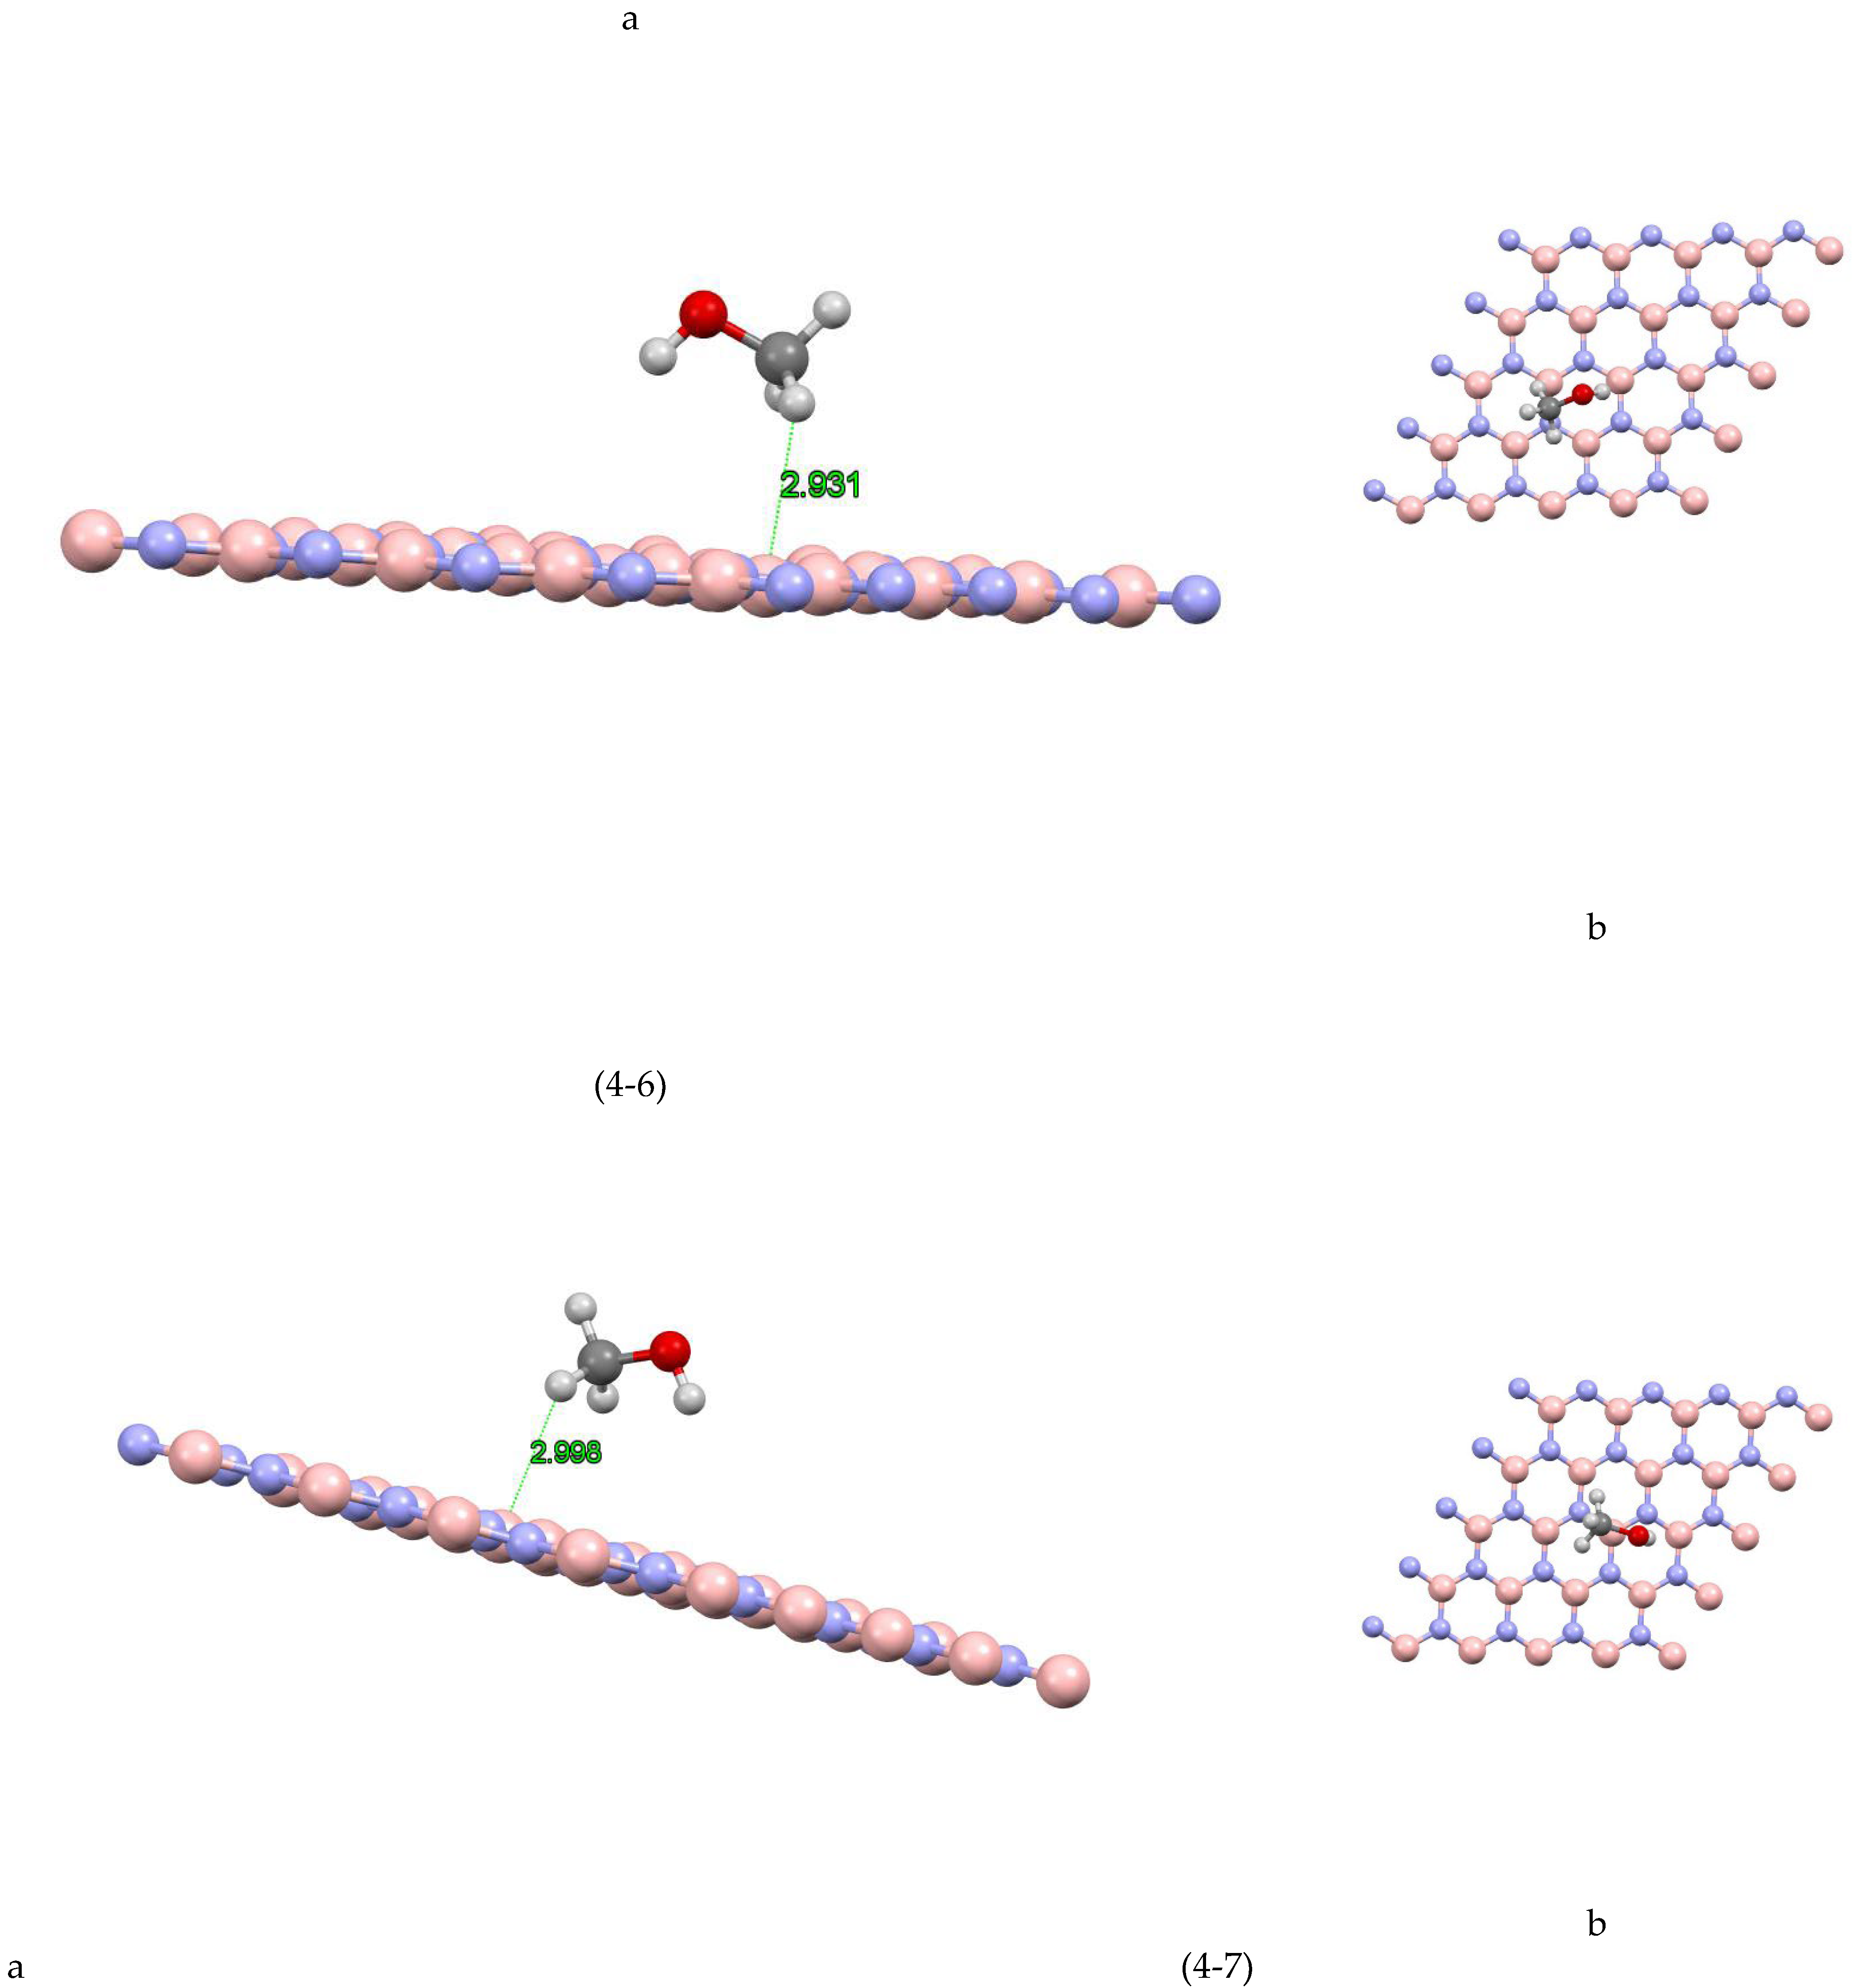
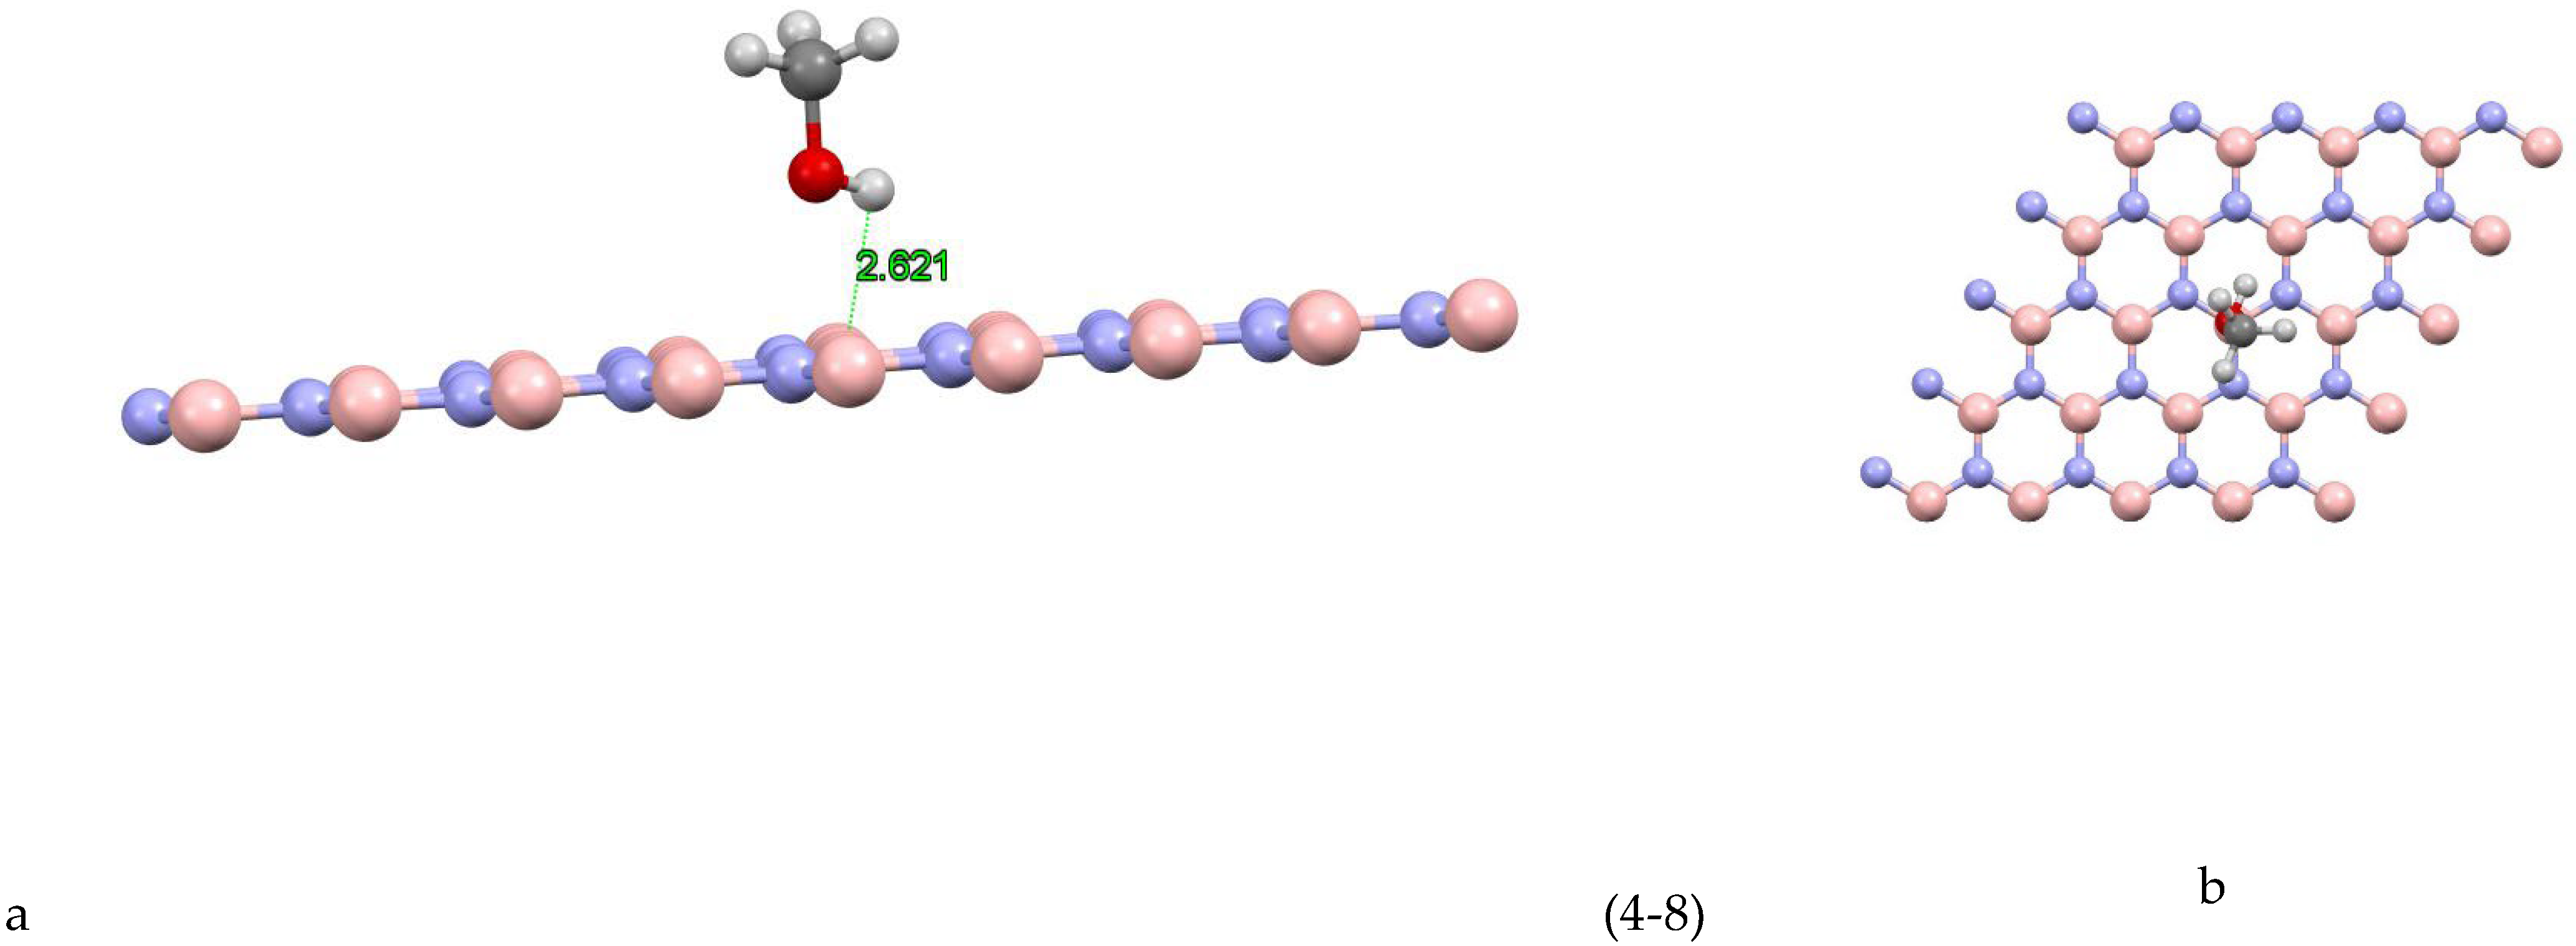
Figure 5.
The optimized structures and geometrical parameters of methanol adsorbed onto the surface of graphene (a) side view and (b) top view (Stabilized graphene-methanol system site (1-6)).
Figure 5.
The optimized structures and geometrical parameters of methanol adsorbed onto the surface of graphene (a) side view and (b) top view (Stabilized graphene-methanol system site (1-6)).
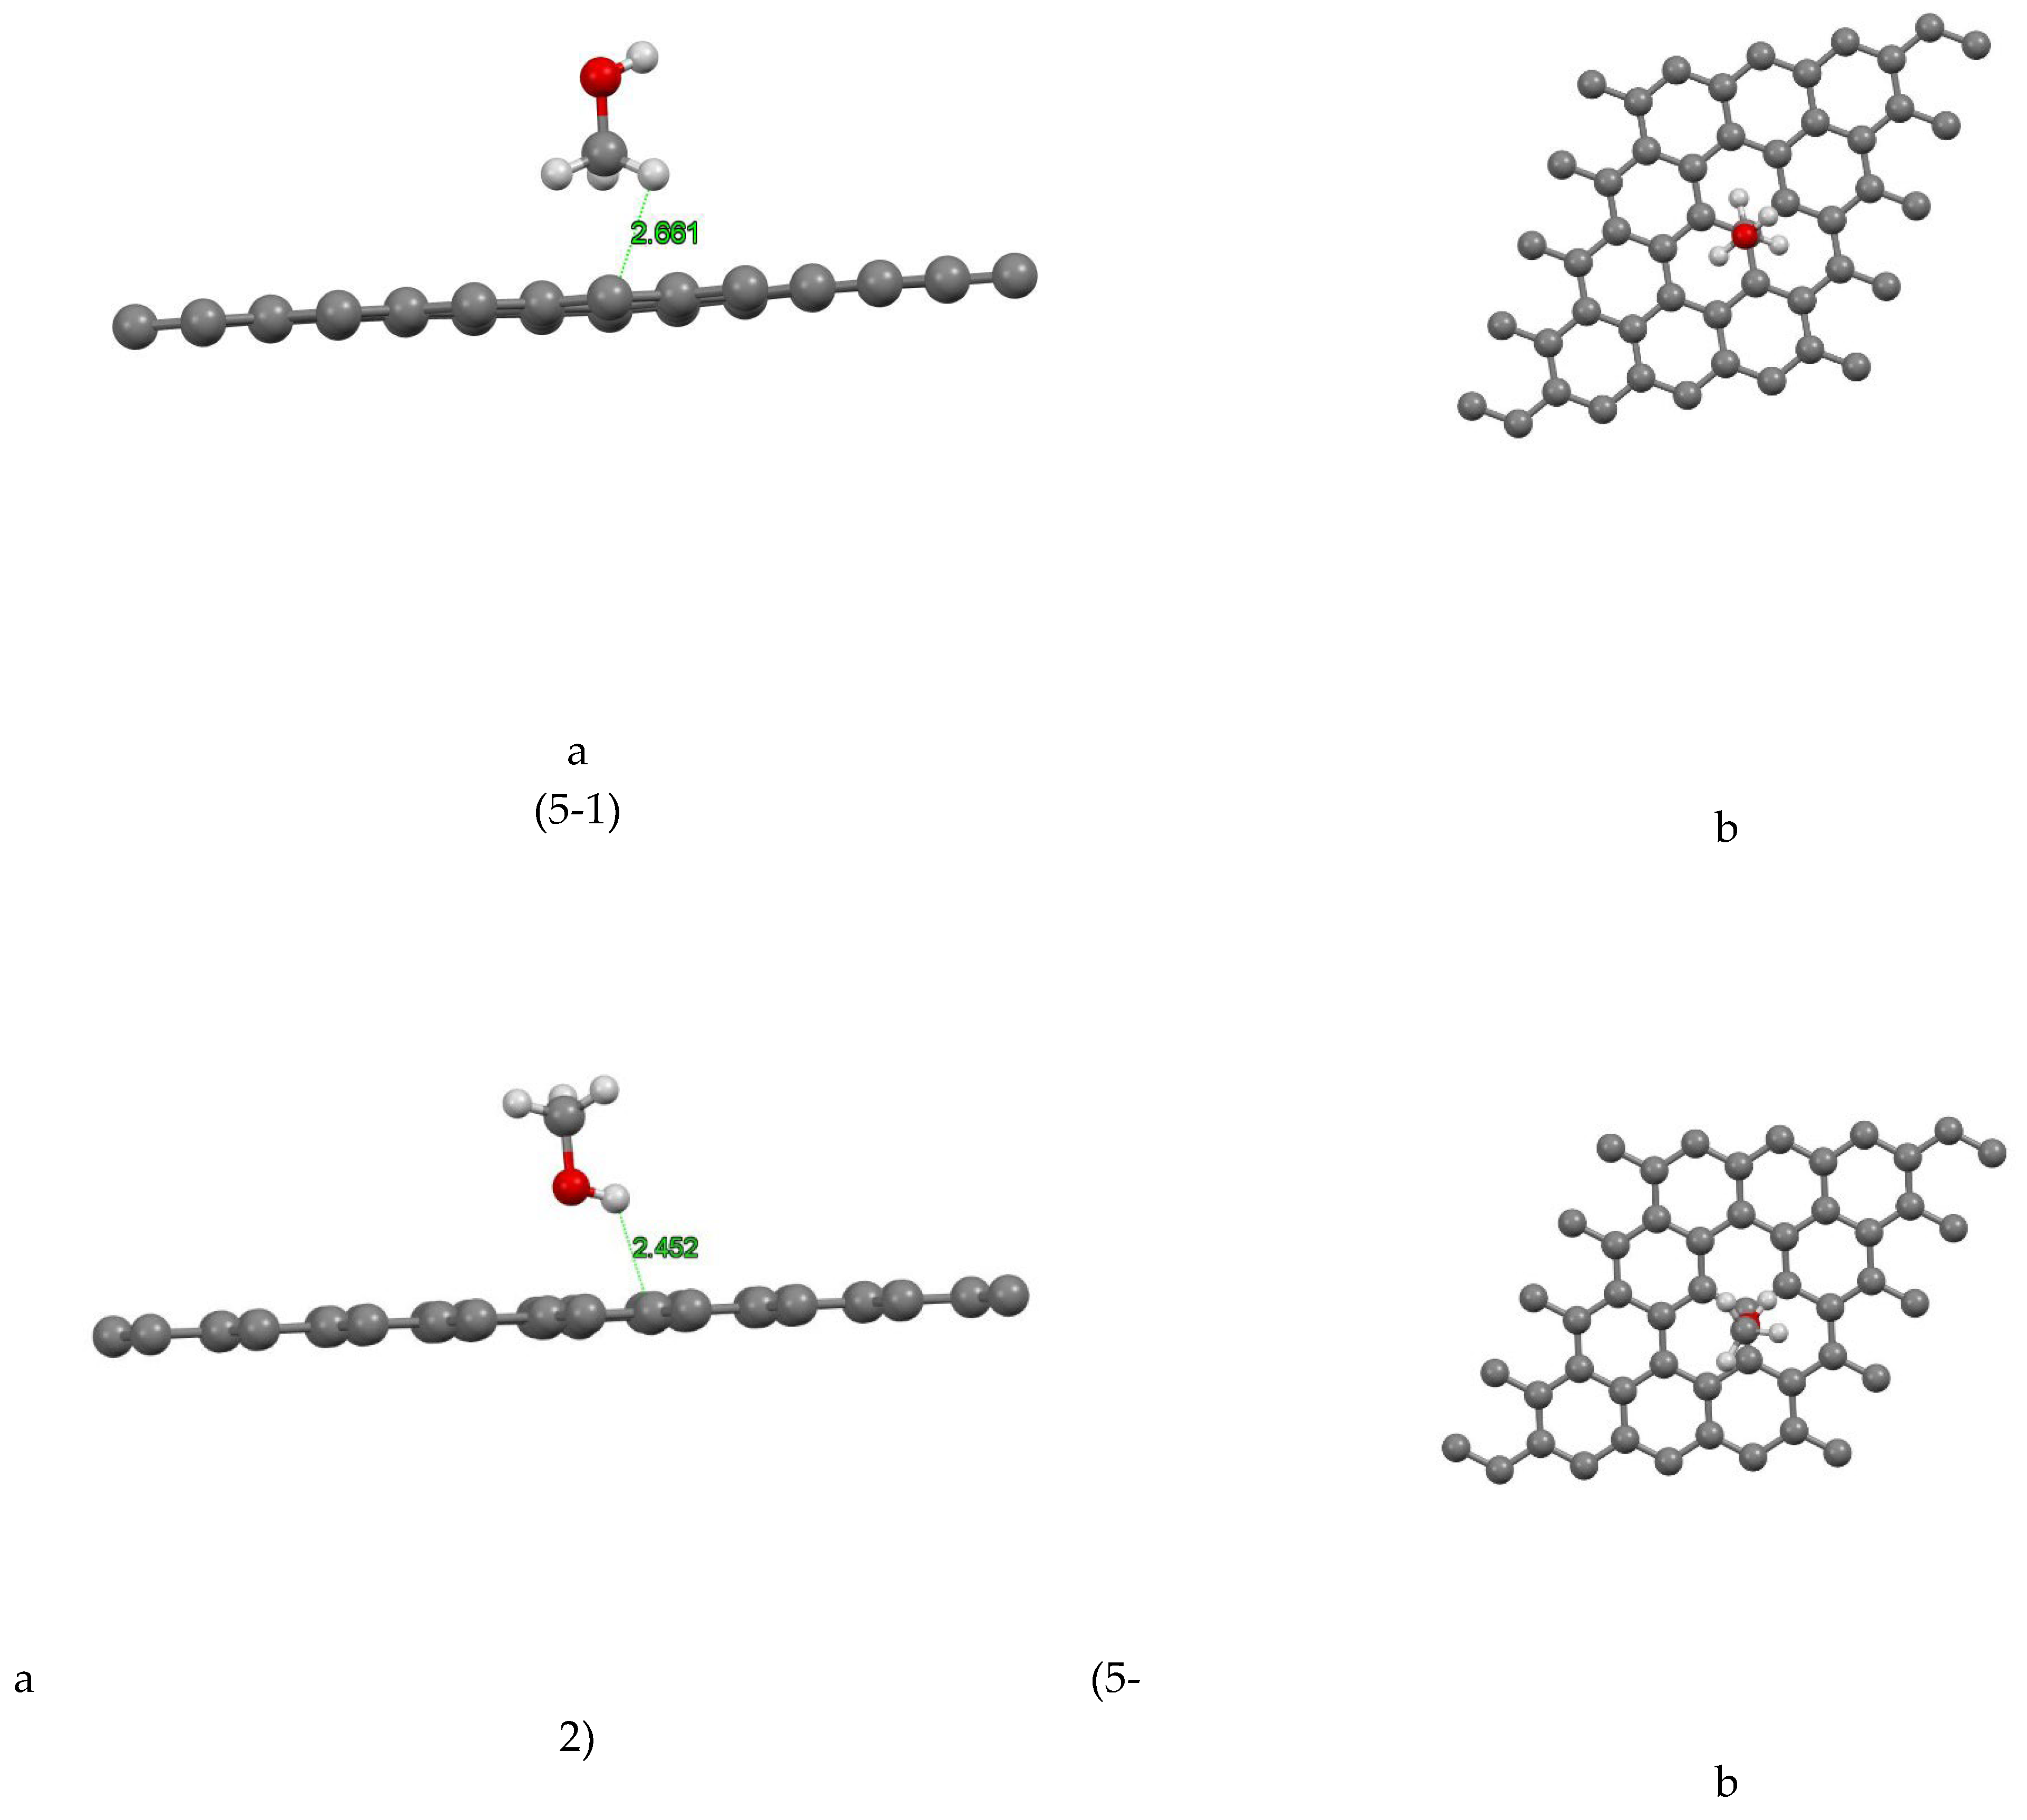
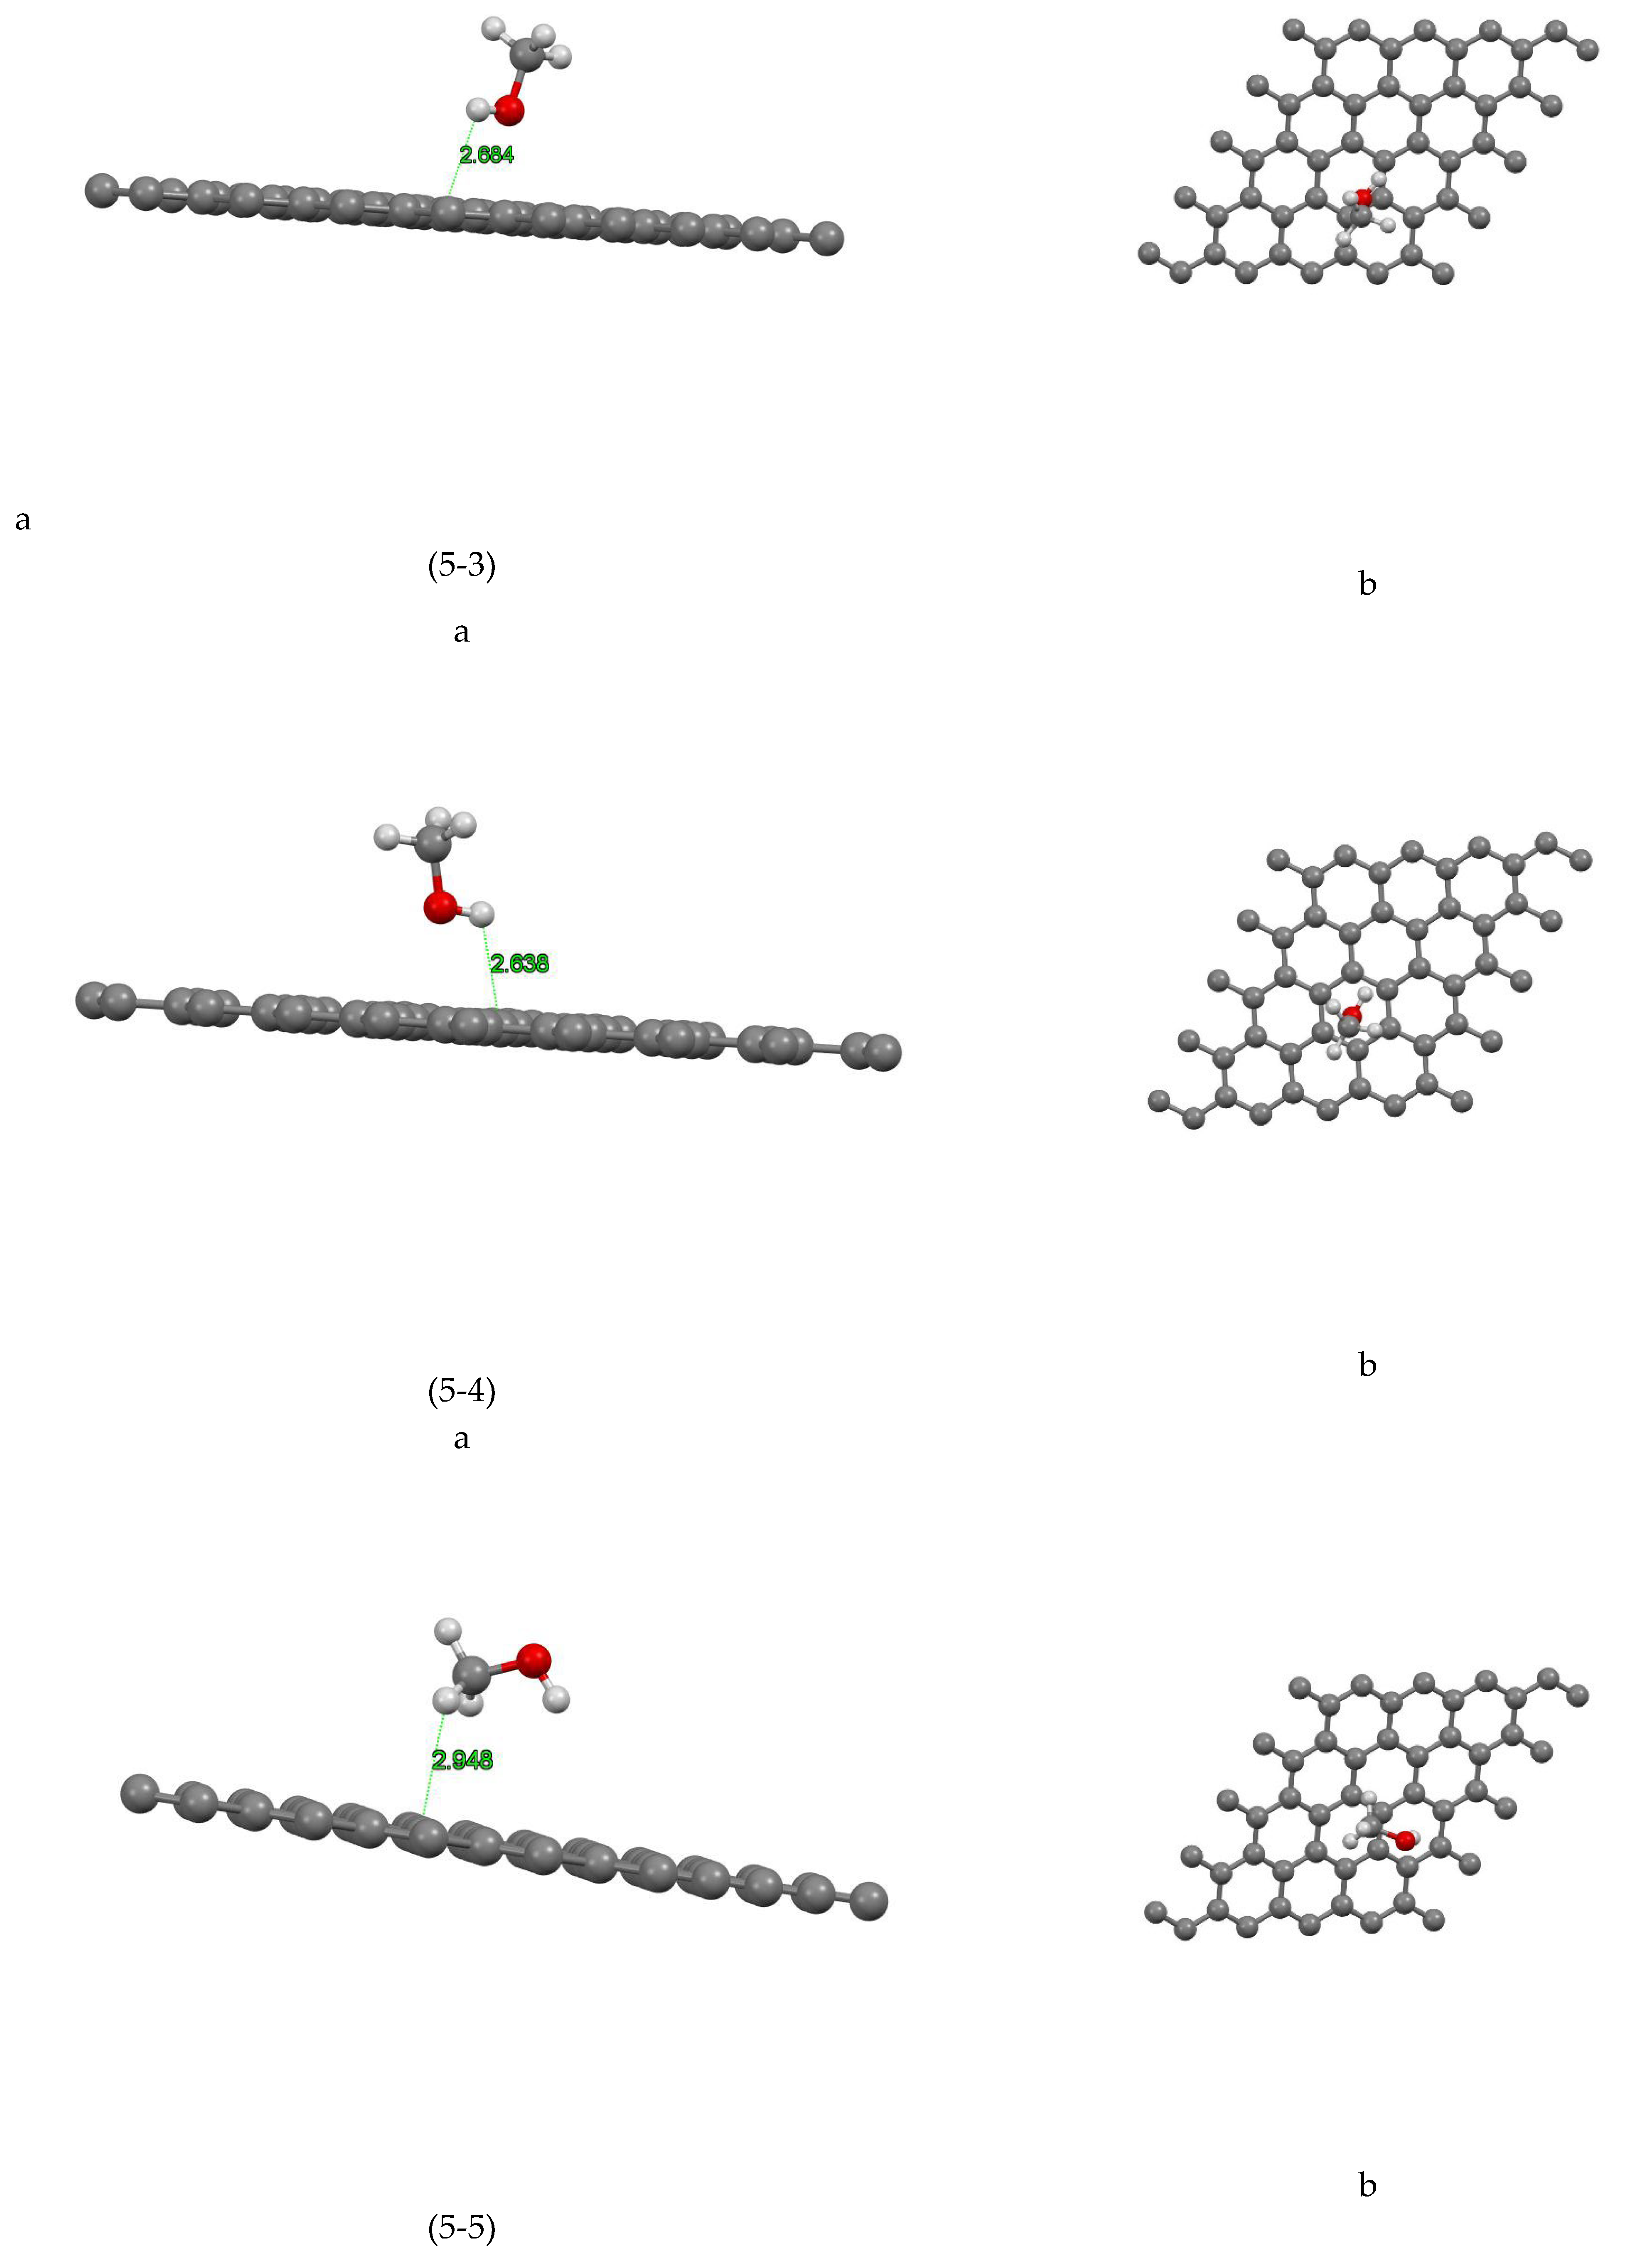
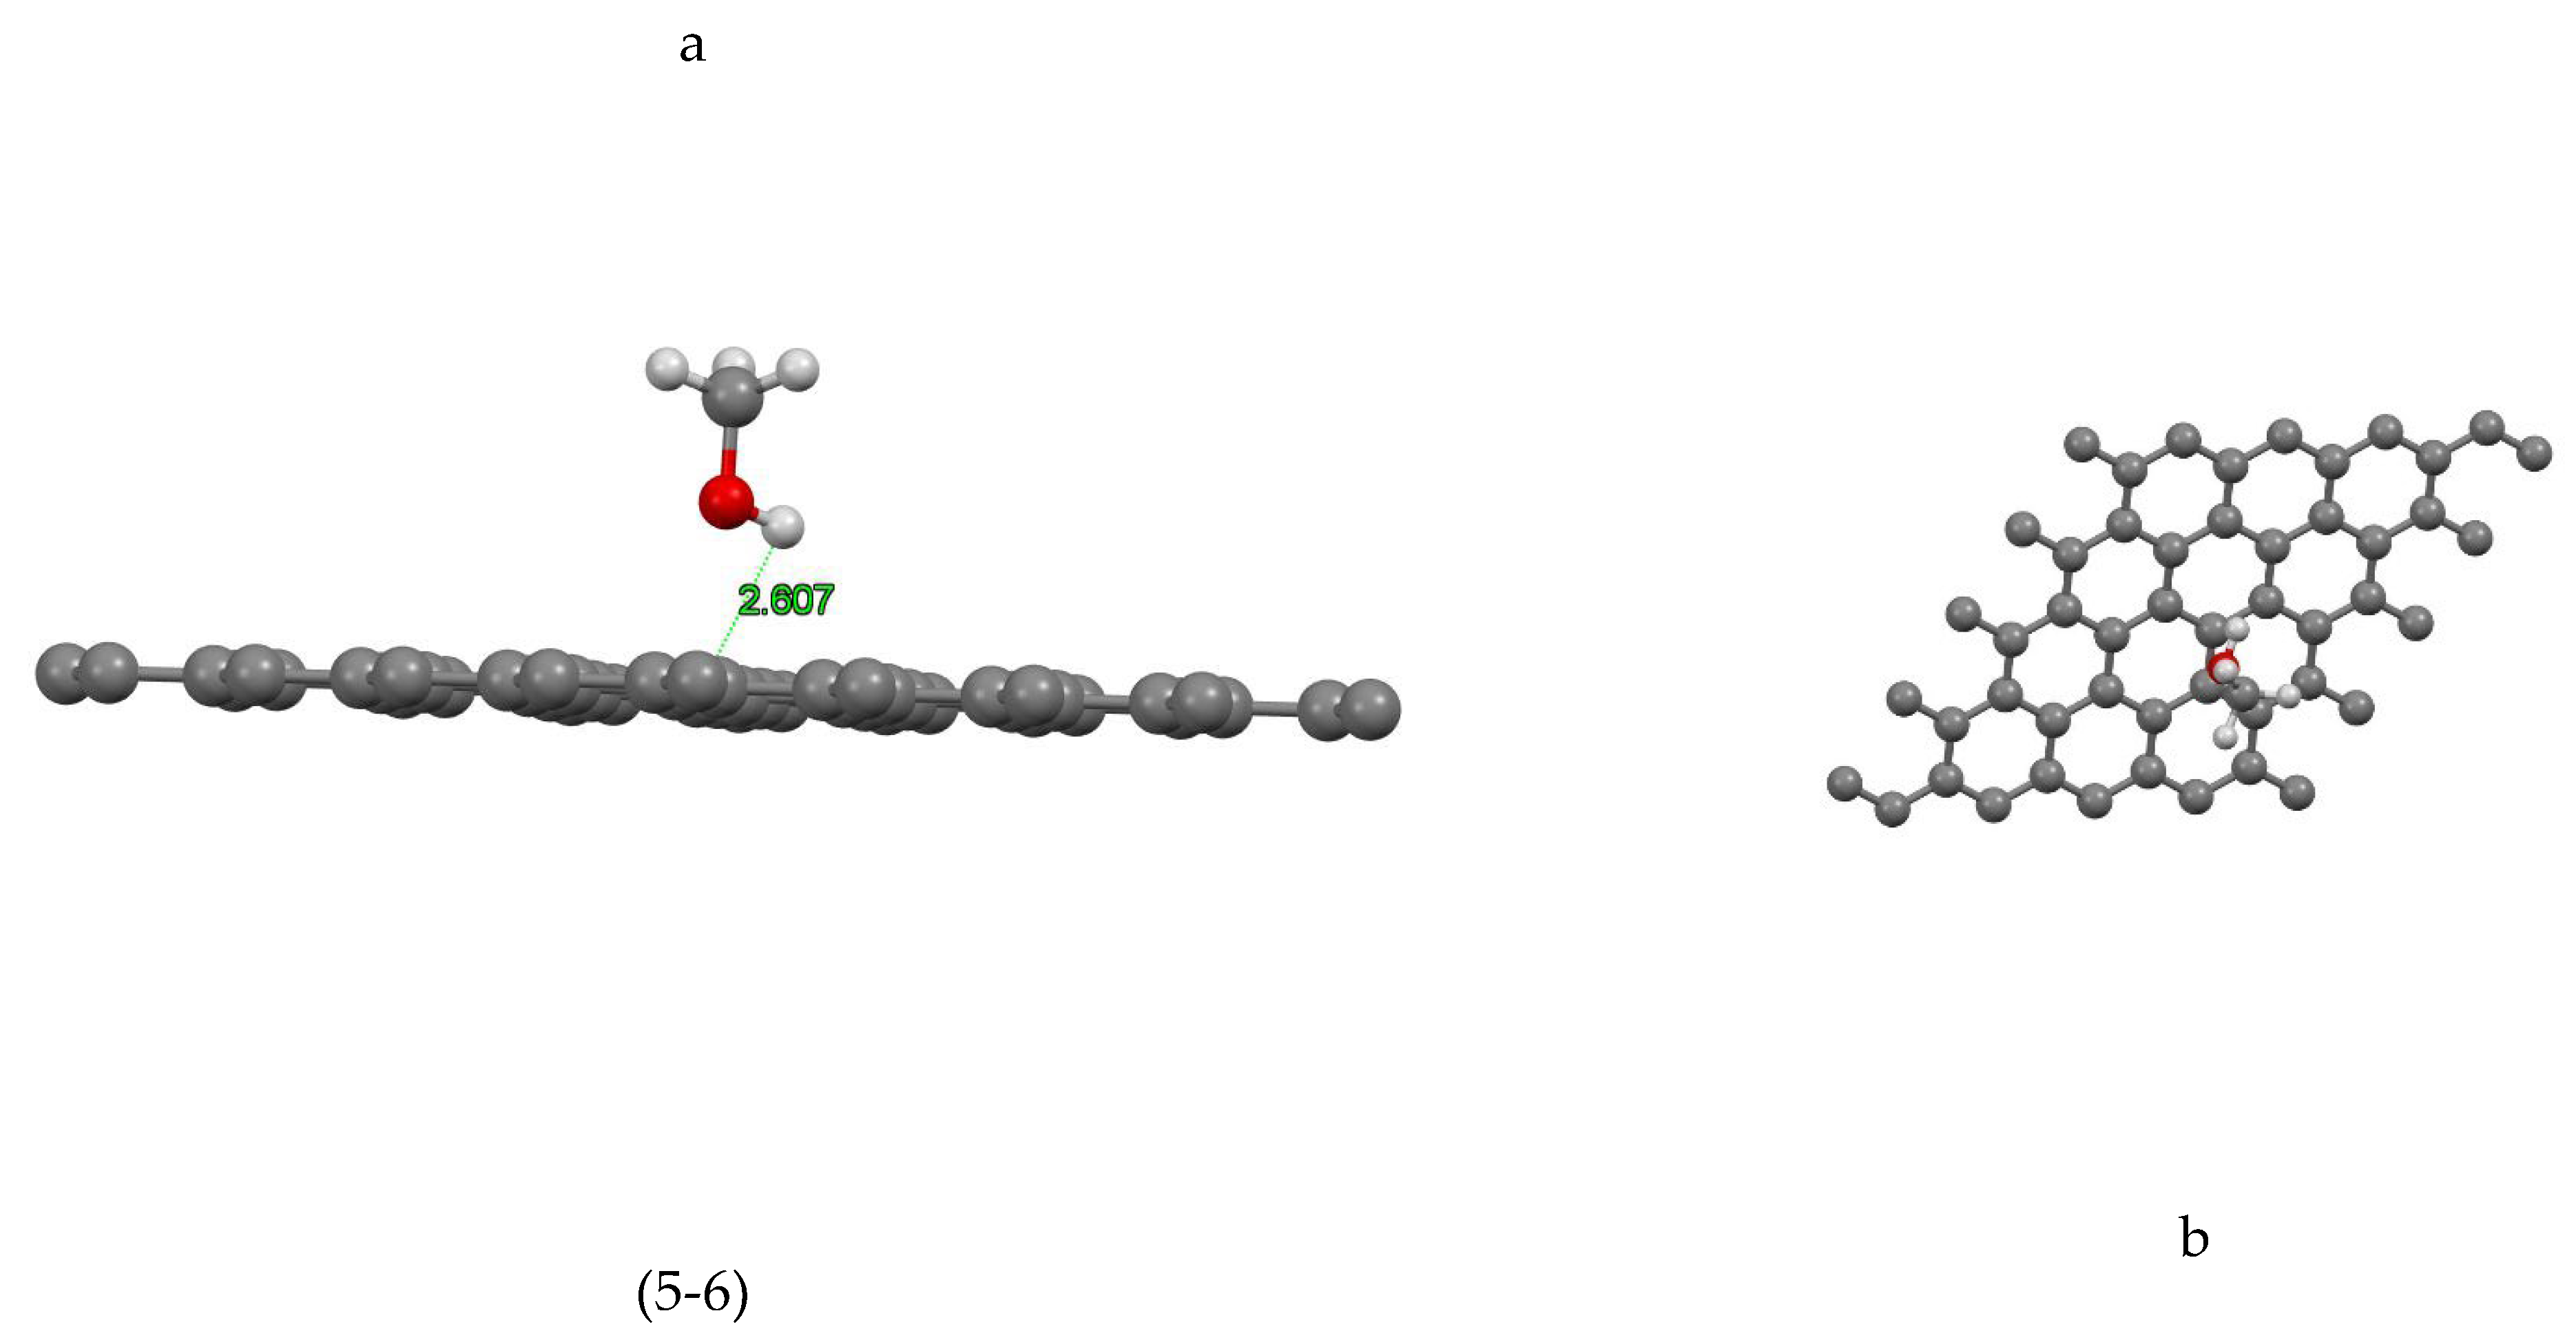
Figure 6.
The optimized structures and geometrical parameters of methanol adsorbed onto the surface of AlN-graphene (a) side view and (b) top view (Stabilized aluminum nitride-methanol system site (1-8)).
Figure 6.
The optimized structures and geometrical parameters of methanol adsorbed onto the surface of AlN-graphene (a) side view and (b) top view (Stabilized aluminum nitride-methanol system site (1-8)).
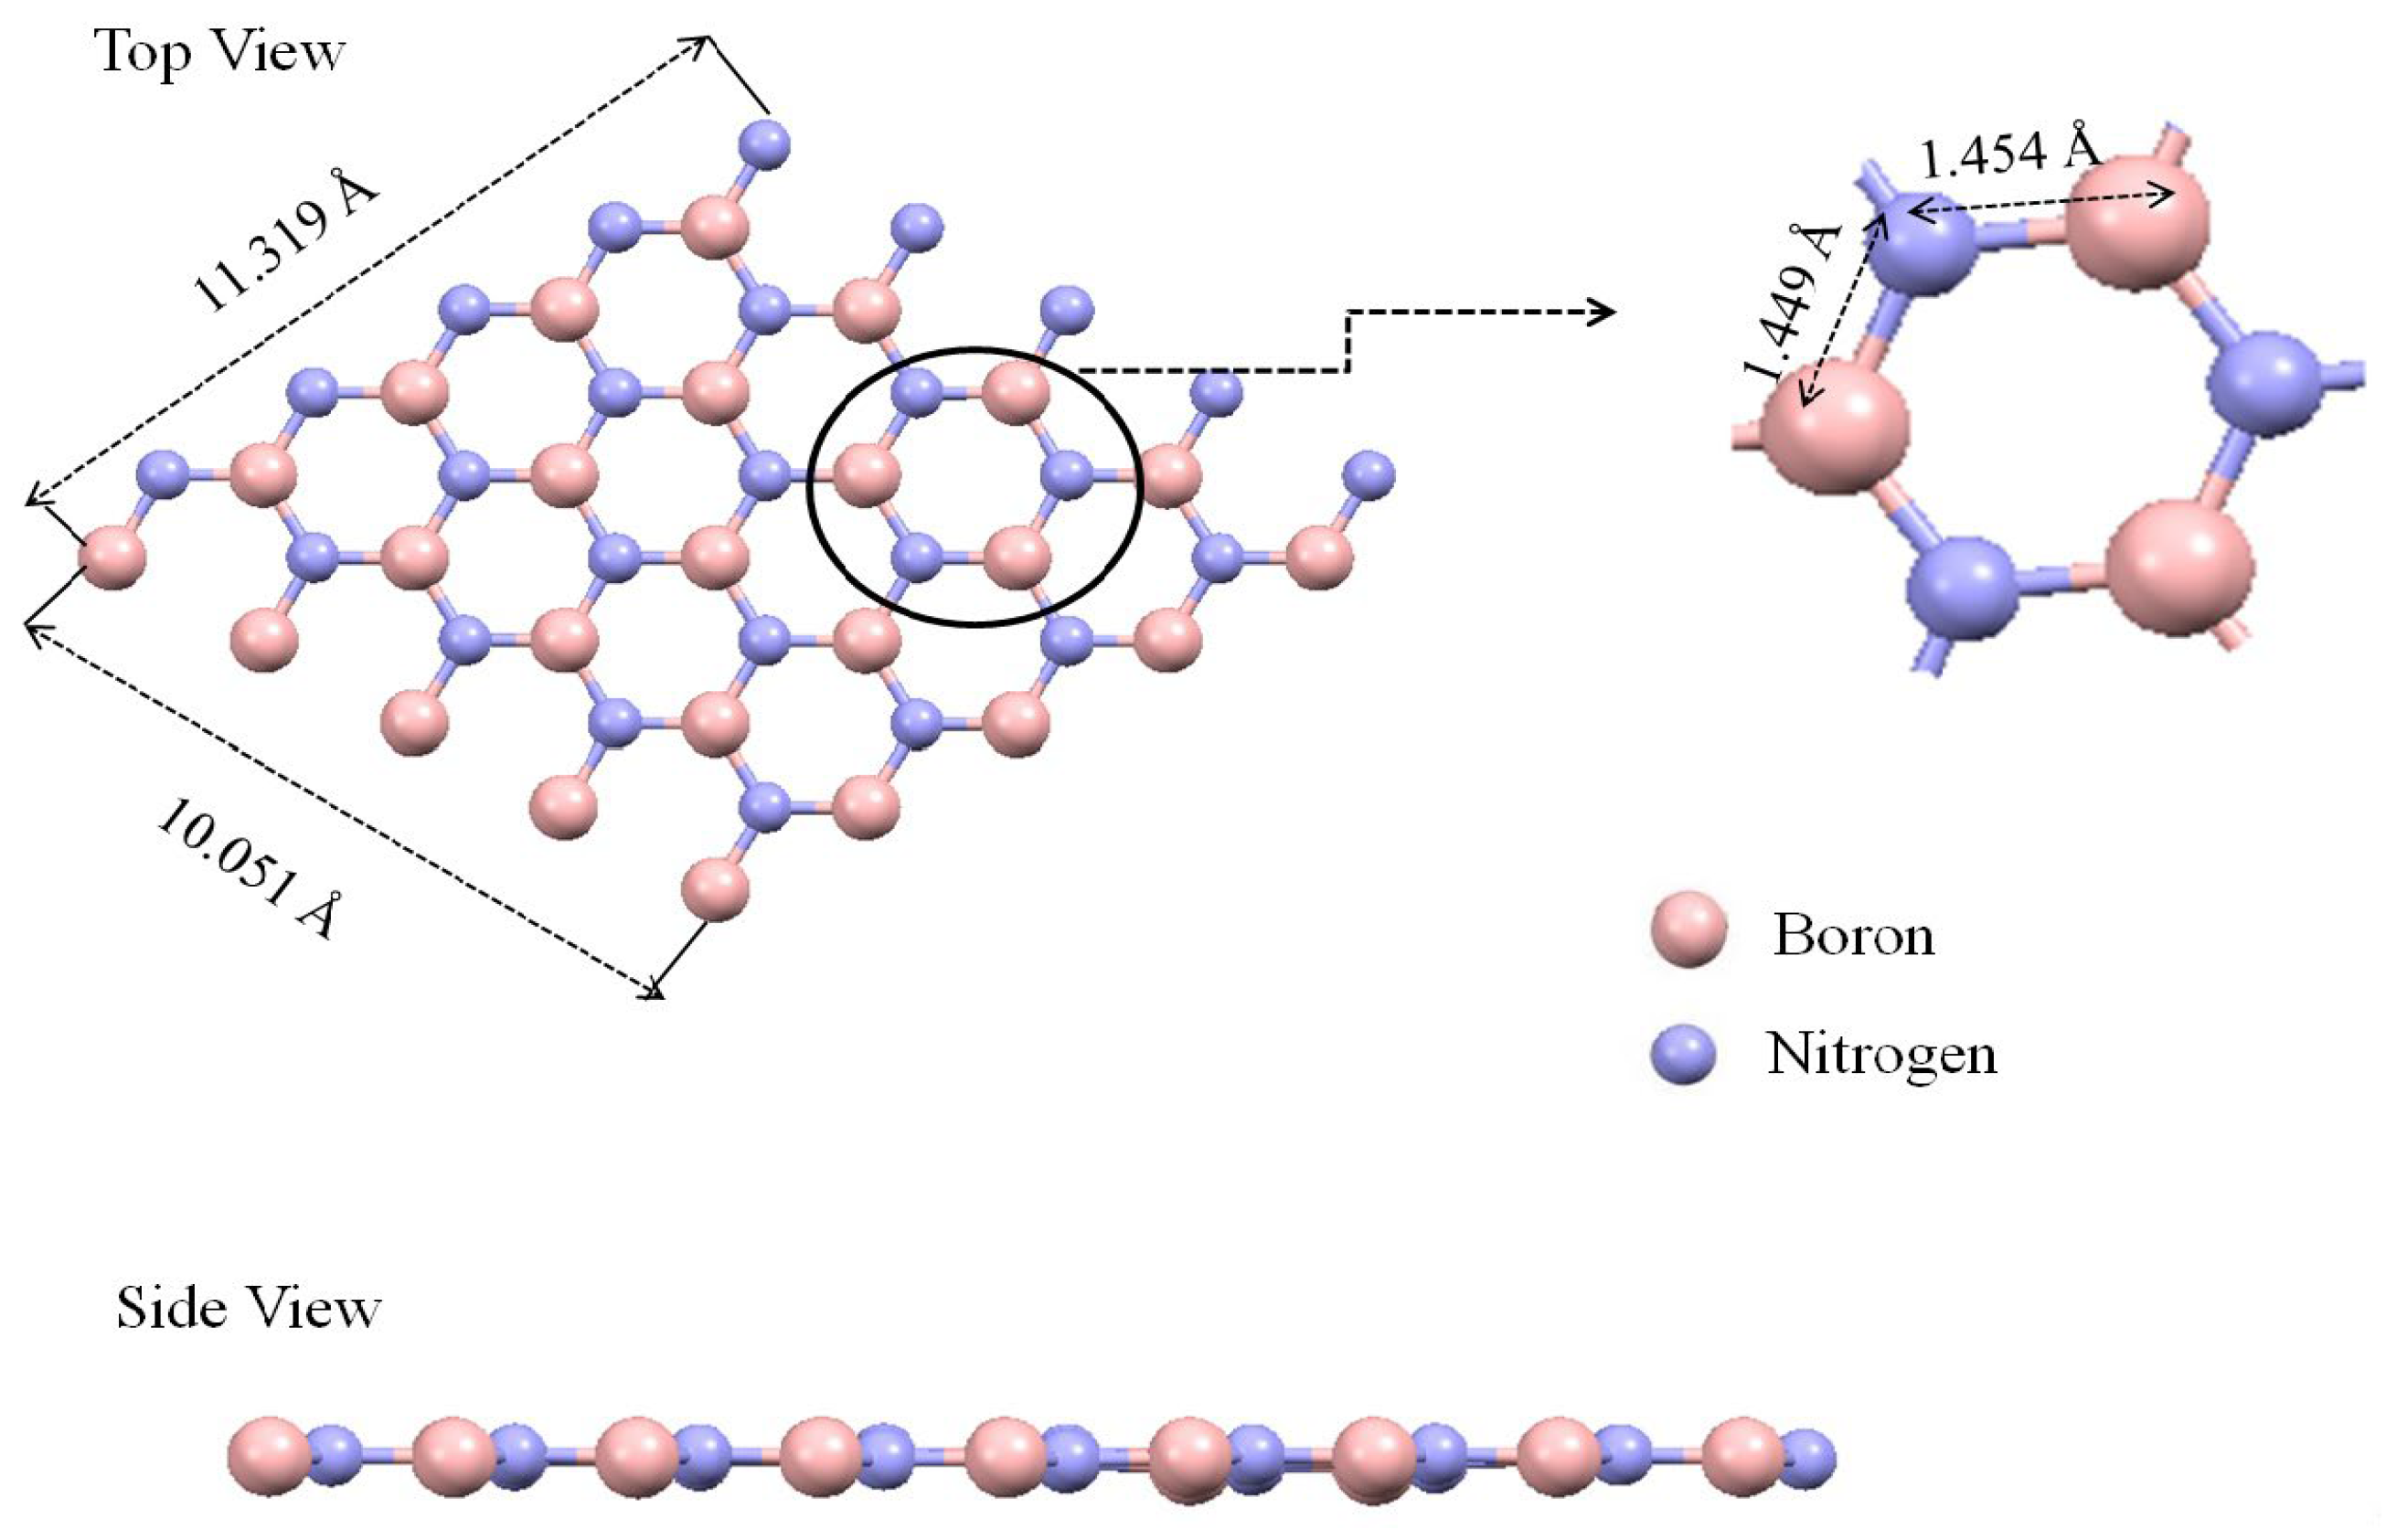
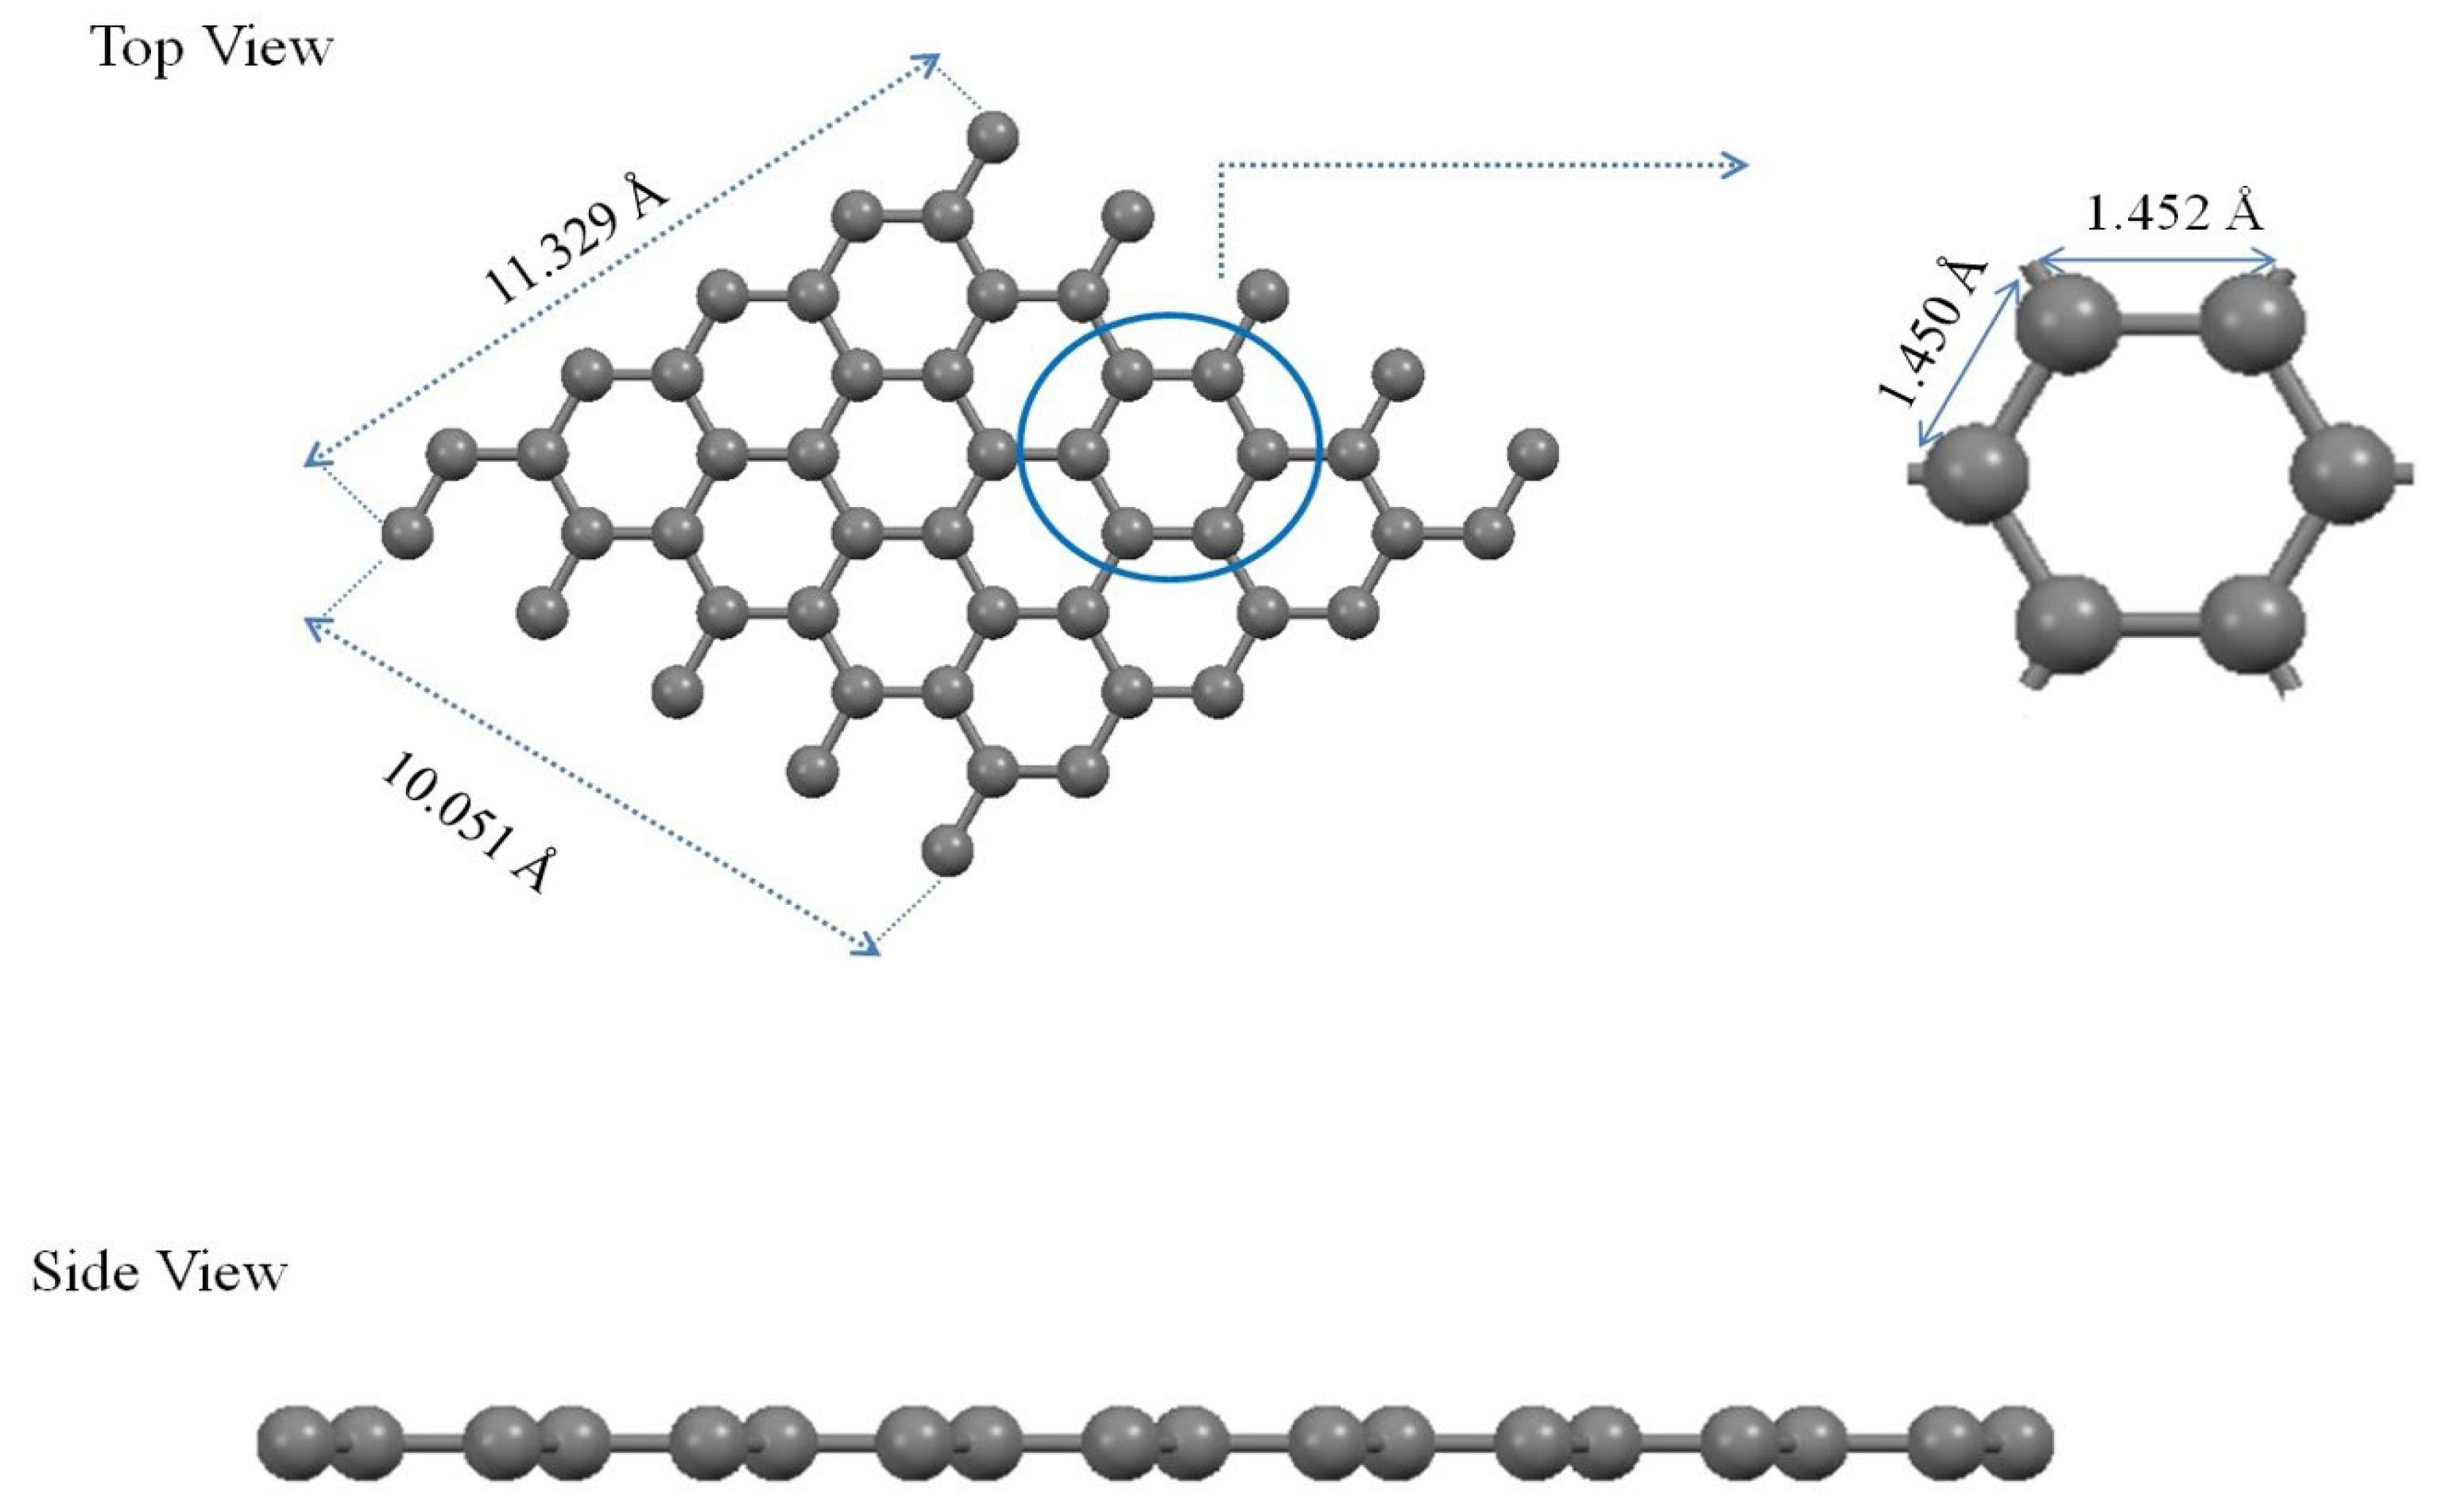
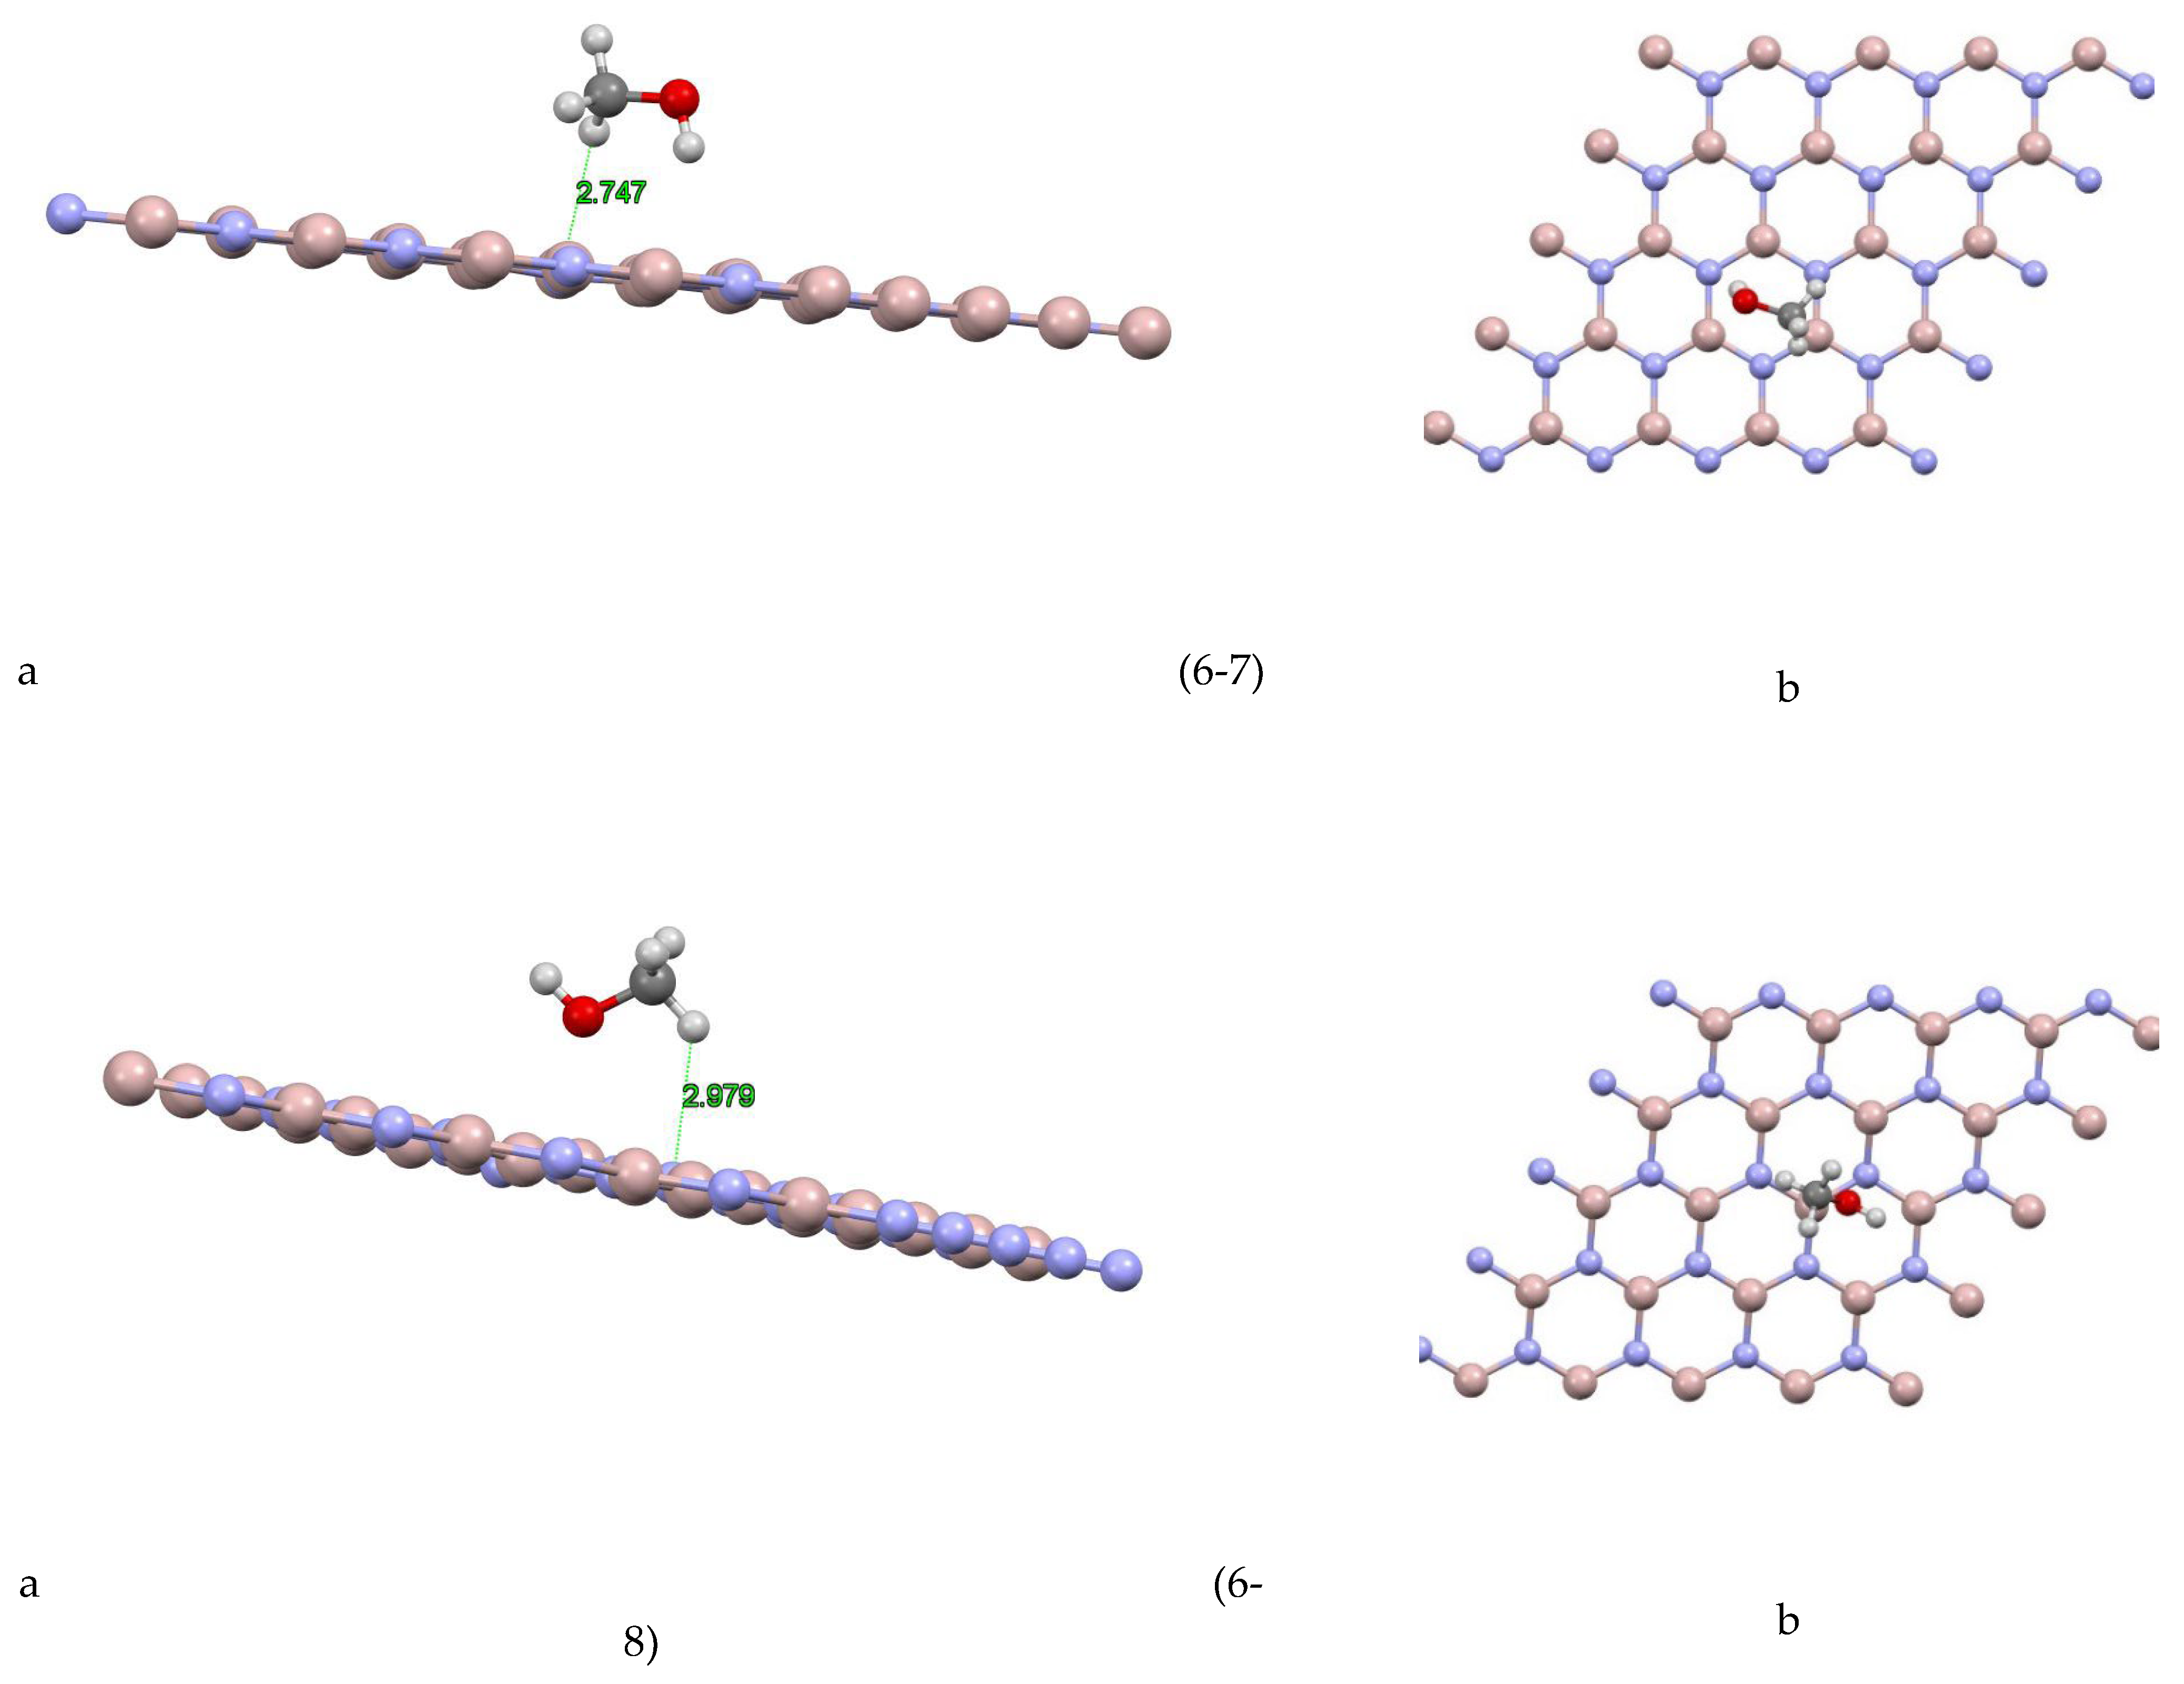
Figure 7.
local density diagram of graphene alone and graphene-methanol site 4.
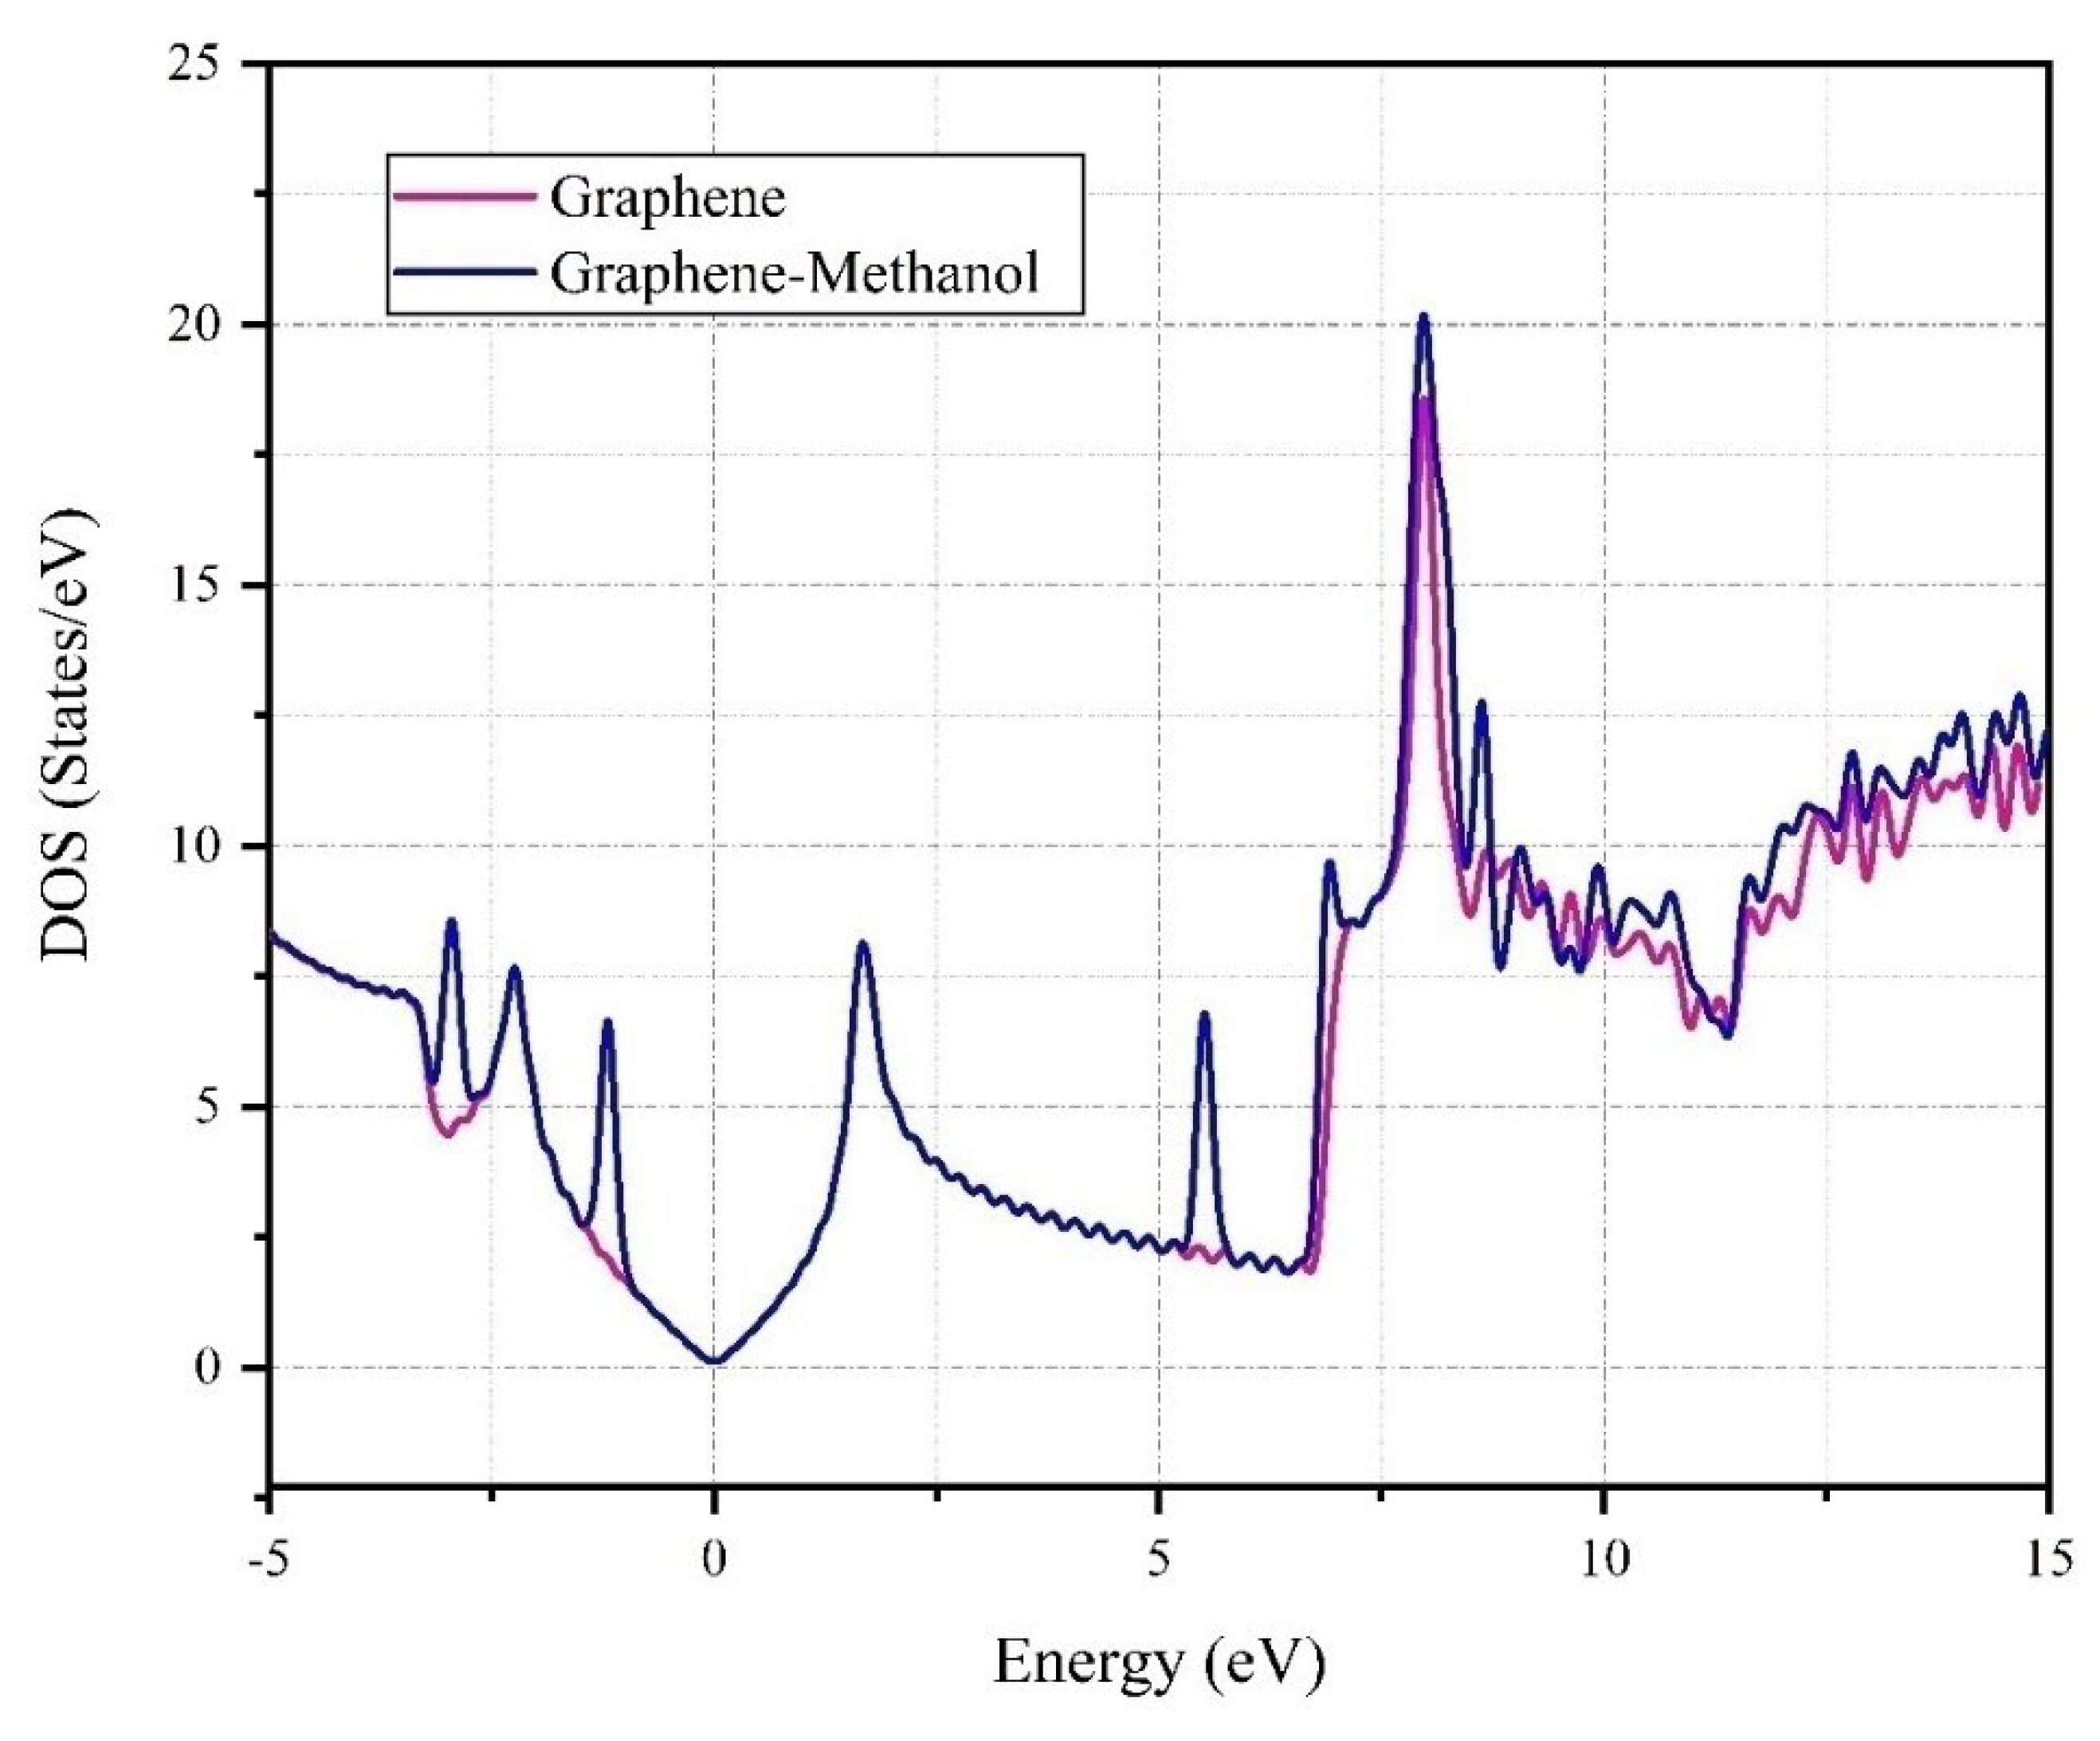
Figure 8.
Local density diagram of Aluminum Nitride alone and Aluminum Nitride-Methanol Site 5.
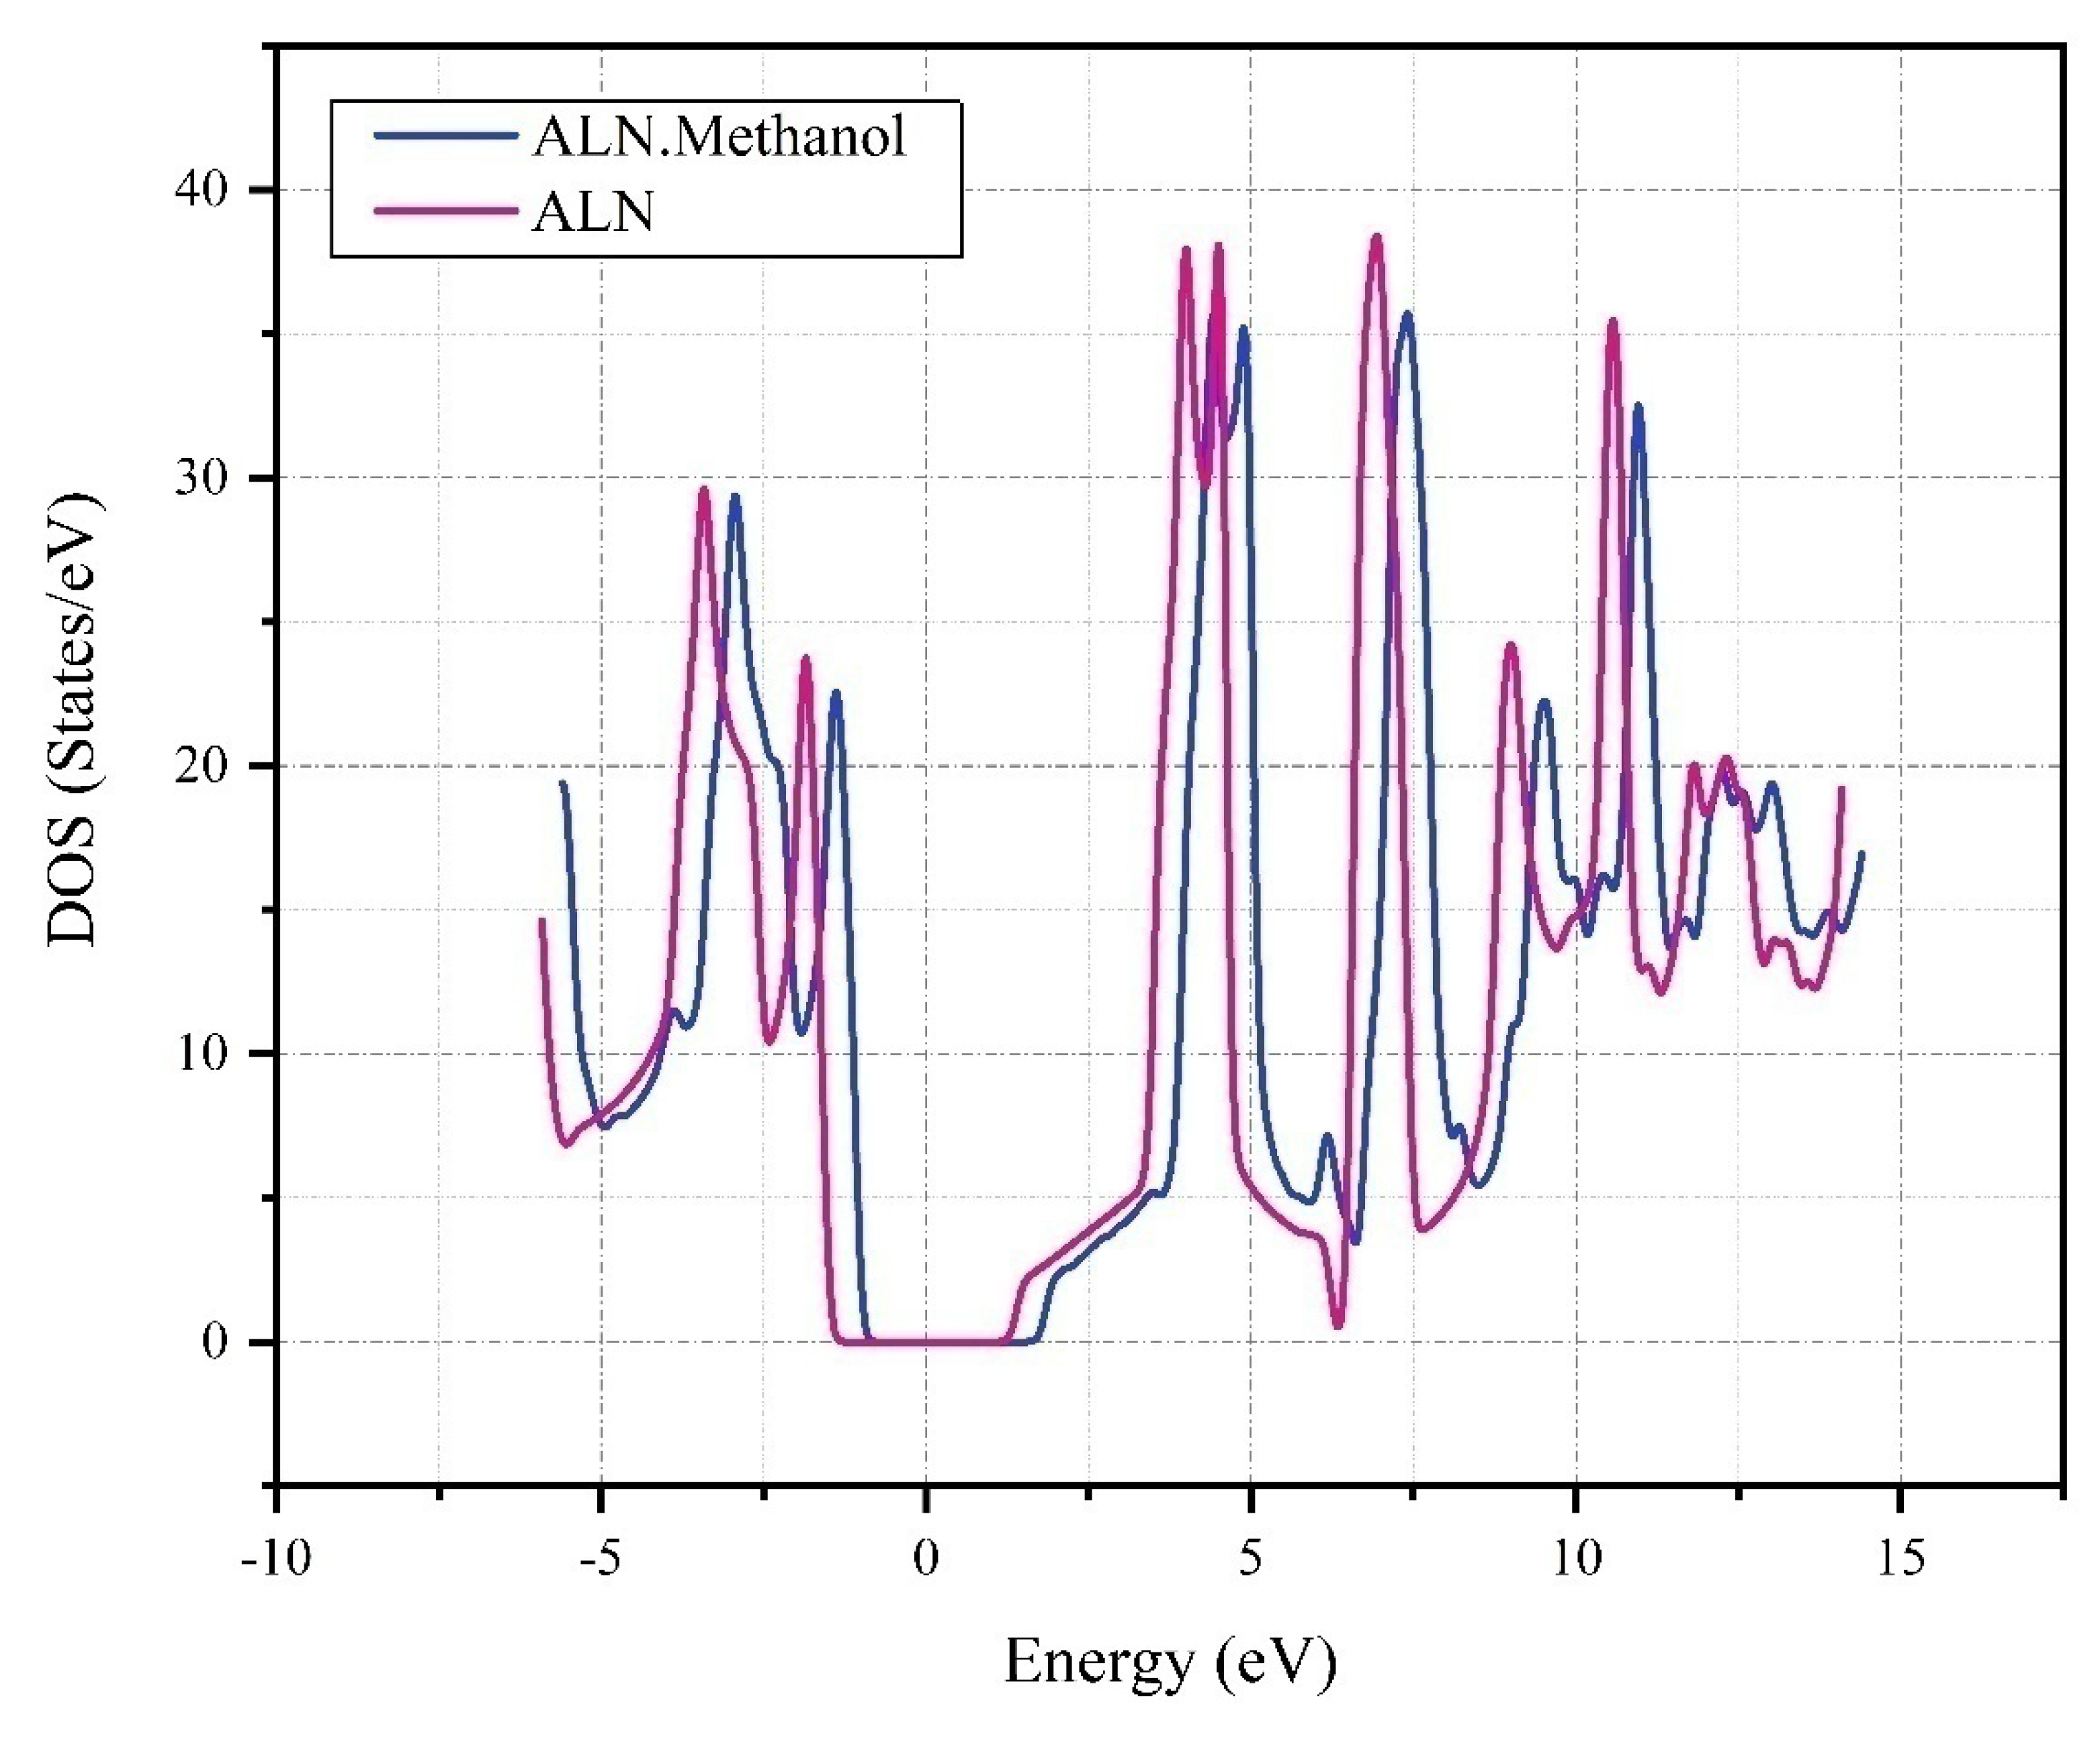
Figure 9.
Local density diagram of Boron Nitride alone and Boron Nitride-Methanol Site 4.
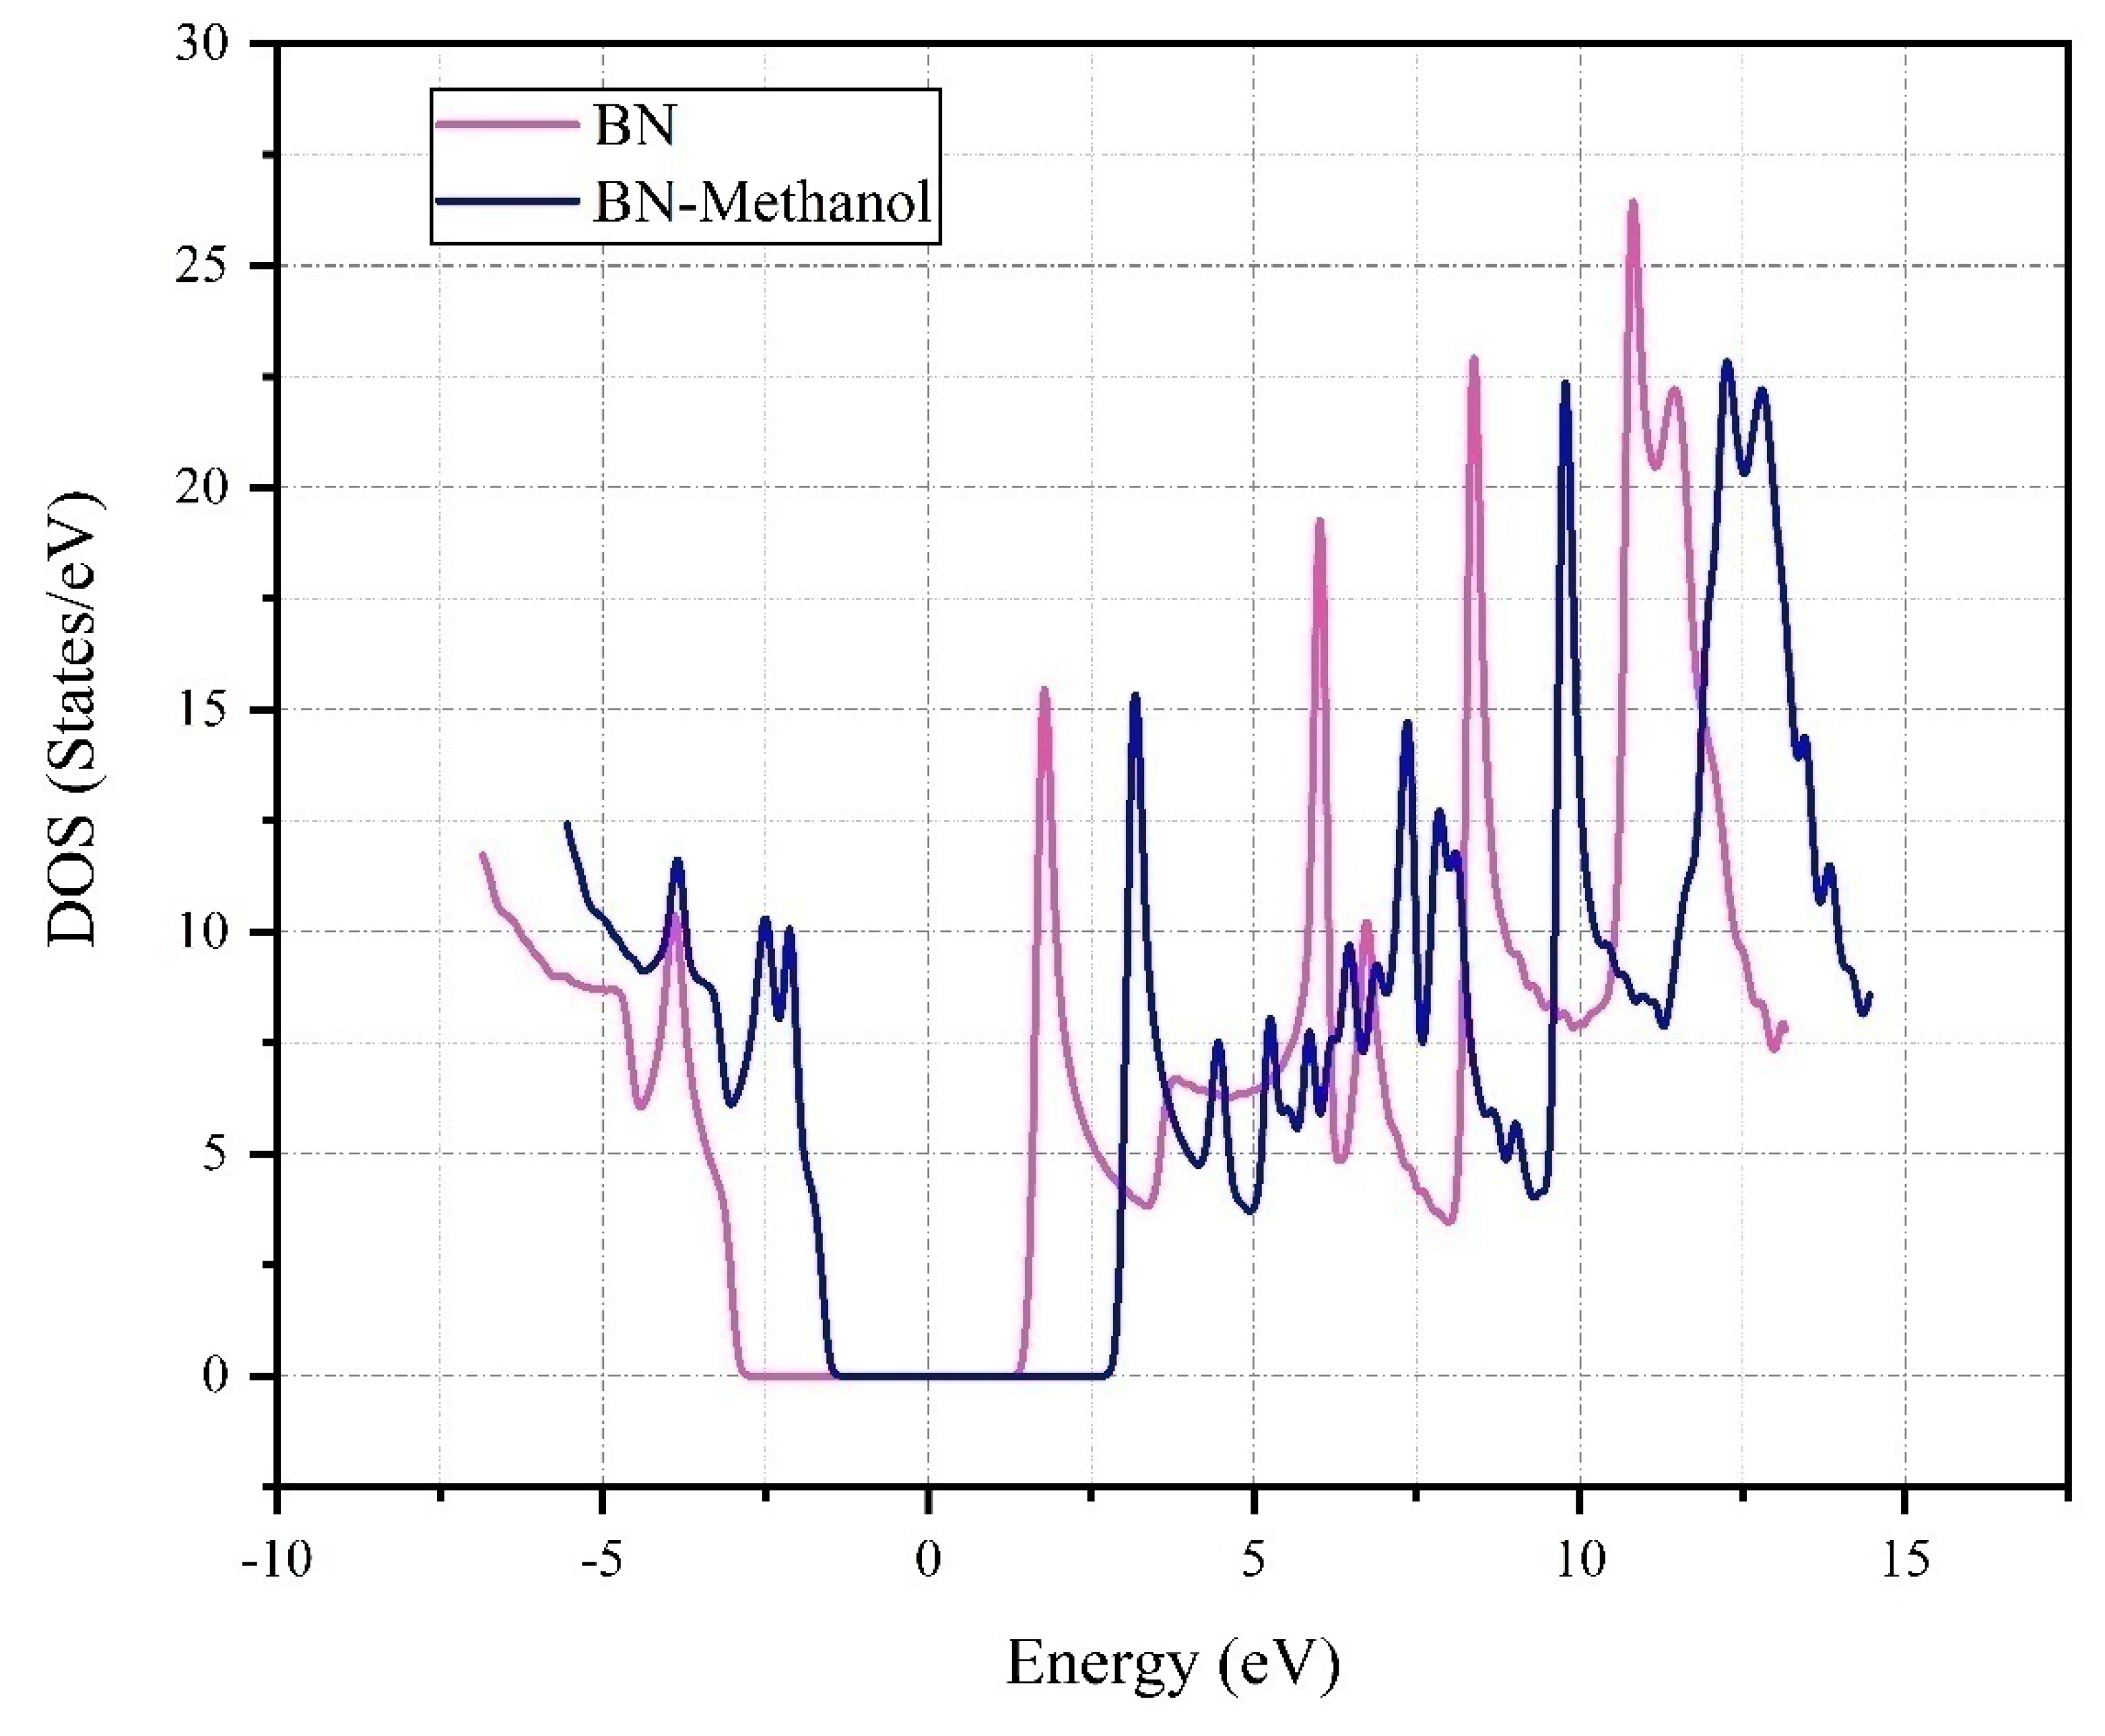

Table 1.
provides a clear and concise summary of the most stable states for the boron nitride-methanol system at different sites.
Table 1.
provides a clear and concise summary of the most stable states for the boron nitride-methanol system at different sites.
| Site | Closest Atom to Boron Nitride Plane | Distance (Å) | Absorption Energy (eV) | Mulliken Charge |
|---|---|---|---|---|
| 1 | Hydrogen | 2.442 | +0.2742 | - |
| 2 | Hydrogen | 2.491 | -0.1198 | - |
| 3 | Hydrogen | 2.481 | +0.0242 | - |
| 4 | Hydrogen | 2.619 | -0.1351 | +0.022 |
| 5 | Hydrogen | 2.452 | -0.1093 | - |
| 6 | Hydrogen | 2.931 | -0.0922 | - |
| 7 | Hydrogen | 2.998 | -0.1219 | - |
| 8 | Hydrogen | 2.621 | -0.1096 | - |
Table 2.
provides a clear and concise summary of the most stable states for the graphene-methanol system at different sites.
Table 2.
provides a clear and concise summary of the most stable states for the graphene-methanol system at different sites.
| Site | Closest Atom to Graphene Plane | Distance (Å) | Absorption Energy (eV) | Mulliken Charge |
|---|---|---|---|---|
| 1 | Hydrogen | 2.661 | +0.122 | - |
| 2 | Hydrogen | 2.452 | -0.004 | - |
| 3 | Hydrogen | 2.684 | -0.039 | - |
| 4 | Hydrogen | 2.638 | -0.033 | - |
| 5 | Hydrogen | 2.948 | -0.073 | +0.004 |
| 6 | Hydrogen | 2.607 | +0.01 | - |
Table 3.
provides a clear and concise summary of the most stable states for the aluminum nitride-methanol system at different sites.
Table 3.
provides a clear and concise summary of the most stable states for the aluminum nitride-methanol system at different sites.
| Site | Closest Atom to Aluminum Nitride Plane | Distance (Å) | Absorption Energy (eV) | Mulliken Charge |
|---|---|---|---|---|
| 1 | Hydrogen | 2.472 | +0.4532 | - |
| 2 | Hydrogen | 3.155 | +0.0272 | - |
| 3 | Hydrogen | 2.408 | +0.3175 | - |
| 4 | Hydrogen | 1.834 | -0.226 | - |
| 5 | Hydrogen | 2.462 | -0.5532 | +0.075 |
| 6 | Hydrogen | 2.213 | -0.2275 | - |
| 7 | Hydrogen | 2.747 | -0.0877 | - |
| 8 | Hydrogen | 2.979 | -0.1393 | - |
Table 4.
the result of energy calculations for methanol on boron nitride (absorber).
| Site name | Boron nitride energy (eV) |
Methanol energy (eV) |
System energy (eV) |
Absorption energy (eV) |
|
| 1 | Site1 | 6677/9670- | 4957/673- | 8892/10343- | 2742/0+ |
| 2 | Site2 | 6677/9670- | 4957/673- | 2832/10344- | 1198/0- |
| 3 | Site3 | 6677/9670- | 4957/673- | 1392/10344- | 0242/0+ |
| 4 | Site4 | 6677/9670- | 4957/673- | 2985/10344- | 1351/0- |
| 5 | Site5 | 6677/9670- | 4957/673- | 2727/10344- | 1093/0- |
| 6 | Site6 | 6677/9670- | 4957/673- | 2556/10344- | 0922/0- |
| 7 | Site7 | 6677/9670- | 4957/673- | 2853/10344- | 1219/0- |
| 8 | Site8 | 6677/9670- | 4957/673- | 2730/10344- | 1096/0- |
Table 5.
the result of the energy calculation for methanol on the Graphene (absorber).
| Site name | Graphene energy (eV) |
Methanol energy (eV) |
System energy (eV) |
Absorption energy (eV) |
|
| 1 | Site1 | 7399/8119- | 4957/673- | 1128/8793- | 122/0+ |
| 2 | Site2 | 7399/8119- | 4957/673- | 2399/8793- | 004/0- |
| 3 | Site3 | 7399/8119- | 4957/673- | 2746/8793- | 039/0- |
| 4 | Site4 | 7399/8119- | 4957/673- | 2686/8793- | 033/0- |
| 5 | Site5 | 7399/8119- | 4957/673- | 3092/8793- | 073/0- |
| 6 | Site6 | 7399/8119- | 4957/673- | 2256/8793- | 0/0+1 |
Table 6.
the result of the energy calculation for methanol on AlN (absorber).
| Absorption energy (eV) |
System energy (eV) |
Methanol energy (eV) |
Aluminum nitride energy (eV) | Site name | |
| +0.4532 | -9141.9333 | 4957/673- | -8468.8908 | Site 1 | 1 |
| +0.0272 | -9142.3593 | 4957/673- | -8468.8908 | Site 2 | 2 |
| +0.3175 | -9142.0690 | 4957/673- | -8468.8908 | Site 3 | 3 |
| -0.226 | -9142.6125 | 4957/673- | -8468.8908 | Site 4 | 4 |
| -0.5532 | -9142.9397 | 4957/673- | -8468.8908 | Site 5 | 5 |
| -0.2275 | -9142.6140 | 4957/673- | -8468.8908 | Site 6 | 6 |
| -0.0877 | -9142.4742 | 4957/673- | -8468.8908 | Site 7 | 7 |
| -0.1393 | -9142.5258 | 4957/673- | -8468.8908 | Site 8 | 8 |
Disclaimer/Publisher’s Note: The statements, opinions and data contained in all publications are solely those of the individual author(s) and contributor(s) and not of MDPI and/or the editor(s). MDPI and/or the editor(s) disclaim responsibility for any injury to people or property resulting from any ideas, methods, instructions or products referred to in the content. |
© 2024 by the authors. Licensee MDPI, Basel, Switzerland. This article is an open access article distributed under the terms and conditions of the Creative Commons Attribution (CC BY) license (http://creativecommons.org/licenses/by/4.0/).
Copyright: This open access article is published under a Creative Commons CC BY 4.0 license, which permit the free download, distribution, and reuse, provided that the author and preprint are cited in any reuse.


