
Submitted:
30 May 2024
Posted:
30 May 2024
You are already at the latest version
Abstract
CO2 emission activity of xylotrophic fungi response to an increase in temperature in the range of 10-30 °C on the example of pure dikaryotic cultures of Fomes fomentarius s. str., F. inzengae, Fomitopsis betulina, F. pinicola, Phellinus igniarius was analyzed. Emission activity was assessed by the difference in CO2 concentration in 0.5-liter exposure chambers with Petri dishes with mycelium growing on agar at the beginning of exposure and an hour later using a Gasmet DX-4030 FTIR spectrometer (Gasmet Technologies Oy, Finland), error measurements ±50 ppm. Specific (μg CO2/cm2/h) and total (μg CO2/h) emission activity and its relationship with temperature and size (area) of the mycelium were assessed. It has been shown that in the range of 10-30 °C, the specific and total CO2 emission activity of the mycelium is closely and positively related to temperature. Specific emission, which is an indicator of the respiratory activity of the mycelium, does not depend on its size; its only driver is temperature, the relationship with which is linear: an increase in temperature by 10 °C causes an increase in the specific emission activity of the mycelium by 1.7 times. The total CO2 emission activity, which is an indicator of the total amount of CO2 emitted, is directly proportional to the specific emission activity and the size of the mycelium. In the range of 10-30 °C, an increase in temperature causes an almost equal increase in both the specific emission activity of the mycelium (Q10 1.7) and its growth (Q10 1.5) and causes an exponential increase in the total emission of CO2. This must be taken into account when predicting CO2 emissions from woody debris under climate change, as it could potentially contribute to accelerating climate change.
Keywords:
fungi
; Basidiomycota
; respiration
; CO2
; emission
; temperature
; climate
1. Introduction
Climate change, its causes and environmental consequences is one of the most discussed problems in ecology, also in works on the ecology of woody debris and its decomposition [1,2,3,4,5]. This is far from accidental, since woody debris is a globally significant natural reservoir of carbon; in Russian forests alone its reserves amount to about 5.5 Gt. This huge mass of woody debris is at various stages of its biological decomposition – a large-scale and specific to forest ecosystems process, during of which in Russian forest annually about 214 Mt C-CO2 is emitted into the atmosphere. This makes debris the second natural source of carbon dioxide after soil [1,6].
The main role in the decomposition of debris in forests of temperate latitudes is played by xylotrophic fungi − Basidiomycota, Agaricomycetes [7,8,9,10]. This is, perhaps, the only group of organisms in the modern biosphere that has a unique set of interconnected ecological and physiological adaptations to the woody habitat and is capable of decomposing the lignocellulosic complex of wood [11]. They determine the main parameters of CO2 emission activity of woody debris and this makes them one of the globally significant regulators of the gas composition of the atmosphere [12], factors of climate stability and change [5].
One of the key questions arising from climate change relates to future carbon dynamics, which largely depends on the temperature sensitivity of decomposition processes. They play an important role in the global carbon cycle and, through feedbacks, can potentially influence climate change [5,13,14]. All currently available data clearly indicate a close connection between the CO2 emission activity of xylotrophic fungi, wood debris and temperature [3,4,5,15,16,17,18,19,20,21]. In particular, in one of our recent works [22], we showed that an increase in temperature from 20 to 30 °C has a non-additive, possibly synergistic effect on the CO2 emission activity of xylotrophic fungi, causing its exponential growth.
Considering the role of xylotrophic fungi as factors of stability and climate change, this phenomenon undoubtedly requires its most careful study and, above all, this concerns the temperature response of CO2 emission activity of xylotrophic fungi to an increase in temperature. This determined the purpose of this work – analysis of the relationships between the CO2 emission activity of xylotrophic fungi and temperature, testing the hypothesis of an exponential increase in CO2 emission with increasing temperature in the range of 10-30 °C, which is relevant for temperate latitudes.
2. Materials and Methods
The study of the temperature response of CO2 emission activity dikaryotic mycelium of five species xylotrophic fungi growth on wort agar was carried out: Fomes fomentarius (L.) Fr., F. inzengae (Ces. & De Not.) Cooke, Fomitopsis betulina (Bull.) B.K. Cui, M. L. Han & Y.C. Dai, F. pinicola (Sw.) P. Karst., Phellinus igniarius (L.) Quél (Figure 1). Dikaryotic cultures were isolated from basidiocarps of the corresponding species of the fungi using traditional methods [23] and wort (4%) – agar (2%) as a nutrient medium (MA). Use of pure fungi cultures allow to solve of one most difficult problem in the study of xylotrophic fungi − the assessment of mycelium biomass in wood. When mycelium develops on artificial nutrient media, an indicator of its biomass can be such an easily assessed characteristic as the area it occupies in Petri dishes.
The species identification of basidiocarps was determined on anatomical and morphological characteristics [24], and their species names are given according to Index Fungorum [25]. F. fomentarius strains were typed using ITS region sequencing; according to phylogenetic analysis, strains collected on Populus L. belong to F. inzengae, and on Betula L. belong to F. fomentarius sensu stricto – to two cryptic taxa [26,27,28].
The analysis scheme was as follows. Petri dishes (9 cm in diameter, 3 for each strain) were inoculated with a piece of agar (about 5 mm) with the mycelium of the fungus being studied and kept for several days at +25 °C. When the mycelium began to grow around the inoculum, its border was marked by felt-tip pen on the underside of the Petri dishes and dishes were placed in open exposure chambers with a volume of 0.5 l and placed in a thermostat at +10 °C for 2 hours. Then the chambers were sealed, their CO2 content was measured and placed in a thermostat at +10 °C for one hour. At the end of the exposure, CO2 measurements in the chambers again were made, after which they were opened and left with closed Petri dishes inside for a day in a thermostat at +10 °C. After 24 hours, the size of the mycelium in Petri dishes was measured and its border was marked, the chambers were closed, CO2 was measured in them and placed in a thermostat at +10 °C for an hour. At the end of the exposure, the CO2 content in the chambers was measured again. According to the same scheme, growth of mycelium and its emission activity were assessed at +20 °C, +25 °C, +30 °C and +35 °C.
The CO2 content in the chambers was measured using a Gasmet DX-4030 FTIR spectrometer (Gasmet Technologies Oy, Finland) with an accuracy of ±50 ppm. The emission activity of the mycelium was assessed by the difference in CO2 concentration in the chambers at the beginning of the exposure and at it end and was calculated in μg of CO2, taking into account the volume of the exposure chambers and Petri dishes, exposure duration.
Specific CO2 emission was calculated in µg CO2/cm2/h by equation (1):
SEA = ΔСО2 × (V1−V2) / Vm × M / S × 0.27 × 273/T,
The total CO2 emission, or the total amount of carbon dioxide emitted by the mycelium, was calculated in µg CO2/h by equation (2):
where SEA is the specific CO2 emission, TEA is the total CO2 emission, ΔCO2 is the amount of CO2 released by the mycelium during exposure (ppm/h), V1 is the chamber volume (l), V2 is the sample volume (l), Vm is the molar volume (22.4 l/mol), M – molar mass of CO2 (44 g/mol), S – area occupied by mycelium (cm2), T – temperature in Kelvin (K).
TEA = ΔСО2 × (V1−V2) / Vm × M × 0.27 × 273/T,
The temperature coefficient (Q10) of specific CO2 emission, showing the multiplicity of its change with a temperature increase of 10 °C, was calculated by equation (3):
where Q10SEA is the temperature coefficient of specific emission, SEA1 is the specific emission at 10 and 20 °C, and SEA2 at 20 and 30 °C, respectively.
Q10SEA = SEA1/SEA2,
The temperature dependence of mycelium growth was assessed by the increase in the area it occupied on MA during the day (cm2/day) and by the temperature coefficient (Q10) of growth calculated by similar equation (4):
where Q10SM is the temperature coefficient of growth, V1 is the intensity of mycelium growth (cm2/day) at 10 and 20 °C, and V2 is the intensity of mycelium growth at 20 and 30 °C, respectively.
Q10SM = V2/V1,
Statistical data processing was performed using the Statistica 10.0 program (StatSoft Inc., USA). Arithmetic means (m) are given with standard errors (SE). The Pearson correlation coefficient (r) was used to characterize the relationships between variables. Student's t-test was used for pairwise comparisons; one-way analysis of variance (ANOVA) was used for multiple comparisons of means. When describing the results of statistical evaluation, the values of the corresponding criteria and its significance are given.
3. Results
Figure 2 shows the dynamics of CO2 emission activity of five species dikaryotic mycelium at MA in the range of 10-30 °C. It can be seen that the temperature dynamics of total (TEA) and specific (SEA) CO2 emission activity are significantly different: SEA is linear (determination coefficient 0.91-0.98), TEA is exponential (determination coefficient 0.94-0.99).
The Table 1, Table 2 and Table 3 shows that the temperature rise from 10 to 20 °C increase the specific CO2 emission activity mycelium from 1.3 (F. betulina) to 2.1 (F pinicola, collected on Picea), on average 1.8 times. An increase in temperature from 20 to 30 °C enhances SEA by 1.2 (F. fomentarius s. str.) – 1.9 (F. pinicola, collected on Picea), on average 1.6 times. In other words, the temperature coefficient of the specific CO2 emission activity of the mycelium of the studied group of xylotrophic fungi ranges from 1.6 to 1.8. An increase in temperature from 10 to 30 °C (3 times) causes a corresponding increasing in SEA – 2.9 times. At 35 °C, SEA decreases in some of the analyzed fungi, while in F. betulina and F pinicola (collected on Betula) it remains at the same level as at 30 °C.
The specific CO2 emission activity of the mycelium does not show any relationship connection with its size, in our case, with its area. Thus in F. betulina strain at 10 °C SEA of the same level (18˗19 µg CO2/cm2/h) for mycelium with an area of 10 and 13 cm2, and at 20 °C it is equal 24-25 µg CO2/cm2/h for mycelium with an area of 13 and 21 cm2 (Table 1). In F. pinicola (strain collected on Picea) at 10 °C, SEA equal to 19 μg CO2/cm2/h is recorded in mycelium with an area of 11 and 14 cm2, and in the strain collected on Betula 23 μg CO2/cm2/h in mycelium of 13 and 18 cm2. The same is observed at 30 °C: in the strain collected on Betula, the mycelium of 29 cm2 and 38 cm2 has SEA equal to 73 µg CO2/cm2/h, and in the strain collected on Picea 73˗74 µg CO2/cm2/h in the mycelium with an area of 27 cm2 and 35 cm2 (Table 2). There is also no relationship between SEA and mycelium area in the F. fomentarius s. str. and F. inzengae strains (Table 3).
The specific CO2 emission activity depends on the species of fungus and in the range 10-20 °C, its average value varies from 27.5±1.95 (F. betulina) to 118.8±9.53 μg CO2/cm2/h (F. inzengae). In F. betulina, F. pinicola it is significantly – F(1, 142) = 90.160, p = 0.001 – lower (varies from 27.5±1.95 to 47.4±4.19, on average 40.3±2.32 μg CO2/cm2/h) than in F. fomentarius s. str. and Ph. igniarius (varies from 60.1±4.59 to 118.8±9.53, on average 95.4±5.31 µg CO2/cm2/h). At the same time, F. pinicola strains isolated from basidiocarps collected on Betula and Picea have SEA of the same level (Table 2).
The response of total CO2 emission activity to an increase in temperature is more pronounced than in the case of specific activity. If, with an increase in temperature from 10 to 20 °C, SEA, as noted, increases by 1.3-2.1 times, on average 1.8 times only, then TEA increases by 3 (F. betulina) – 6 (F. fomentarius s. str.) times, on average 4 times. When the temperature increases from 20 to 30 °C, TEA increases by 2 (F. betulina) – 4 (F. fomentarius s. str., F. pinicola), on average 3 times, while SEA 1.6 times. An increase in temperature from 10 to 30 °C enhances the TEA of the mycelium of F. betulina and Ph. igniarius by 6, F. pinicola by 10, F. inzengae by 13 and F. fomentarius s. str. by 21 times – on average 11 times. At the same time, as noted above, SEA will increase by 2.9 times. Like SEA, TEA reaches its maximum at 30 °C; at 35 °C it decreases or remains at the same level as at 30 °C. TEA varies depending on the fungus species: the highest (2000-3000 μg CO2/h) in the mycelium of F. fomentarius s. str., F. inzengae, F. pinicola and 2-3 times lower (does not exceed 1000 μg CO2/h) in the mycelium F. betulina and Ph. igniarius (Table 1, 2, 3).
The total emission activity of the mycelium depends not only on temperature, but also on its size. For example, at 20 °C, an increase in the mycelium area of F. betulina by 1.6 times (from 13 to 21 cm2) is accompanied by a similar 1.6-fold increase in TEA (from 303 to 490 μg CO2/h). Increase in mycelium size Ph. igniarius by 1.5 times (from 6 to 9 cm2) at 20 °C leads to an increase in its TEA by 1.6 times (Table 1). In F. pinicola at 20 °C, an increase in the size of the mycelium by 1.2˗1.3 times is accompanied by an increase in TEA by 1.2˗1.5 times (Table 2). An increase in TEA proportional to the increase in mycelium area is also observed in the F. fomentarius s. str. and F. inzengae strains (Table 3).
The size of the mycelium reflects the intensity of its growth, which is positively related to temperature. The correlation coefficient of the daily increase in mycelium area with temperature for F. betulina is 0.61, F. pinicola 0.57 (strain collected on Picea) – 0.76 (strain collected on Betula), F. inzengae and Ph. igniarius 0.85, F. fomentarius s. str. 0.97. The temperature coefficient (Q10) of mycelium growth with an increase in temperature from 10 to 20 °C varies from 1.3 (F. inzengae) to 2.0 (F. fomentarius s. str.), and on average is 1.5; it has the same average value when the temperature increases from 20 to 30 °C. At 30 °C growth rate of F. betulina and Ph. igniarius mycelium reaches its maximum, and F. pinicola, F. inzengae, F. fomentarius s. str. – at 35 °C (Table 1, Table 2 and Table 3).
4. Discussion
There is an opinion that for the majority of representatives of the boreal microbiota, adapted to an average summer temperature of about +15 °C, an increase in temperature to 30 °C will be tantamount to temperature shock [6]. However, as the results of this study show, in the range of 10-30 °C, xylotrophic fungi respond positively to increased temperature. Thus, in this range, the specific CO2 emission activity of the mycelium, which is an indicator of its respiratory activity, increases on average 1.7 times with an increase in temperature by 10 °C and 3 times with its increase from 10 to 30 °C: 1.7 x 1.7 = 2.9. In other words, the specific CO2 emission activity of the mycelium of xylotrophic fungi obeys the Van't Hoff rule and this determines the linear nature of its temperature dynamics. The specific emission activity of the mycelium does not depend on the size of the mycelium and its relationship with temperature is described by the following equation (5):
where SEAT1 and SEAT2 are specific CO2 emission at temperature T1 and T2, respectively; Q10SEA – temperature coefficient of specific CO2 emission activity.
SEAT2 = SEAT1 x Q10SEA (T2-T1)/10,
Thus, the only driver of the specific CO2 emission activity of the mycelium of xylotrophic fungi is temperature, or rather its temperature sensitivity, the indicator of which is the temperature coefficient. The latter, in the range of 10-30 °C, varies depending on the species from 1.2 to 2.1, with an average of 1.7. We also recorded similar Q10 values of specific CO2 emission activity when analyzing the gas exchange of wood residues destroyed by xylotrophic fungi: 2.0-2.1 [12,29]. The close positive relationship between specific emission activity and temperature determines its unstable nature; one of the results of this is a fluctuation in the intensity of CO2 gas exchange of wood residues during the day: an increase in the daytime and a decrease in the night [30].
The total CO2 emission activity of the mycelium is determined by its specific emission activity and size. Accordingly, its temperature dynamics has two drivers: temperature sensitivity of a) specific emission and b) mycelium growth, indicators of which are the temperature coefficients of specific emission and mycelium growth. The relationship between total emission and temperature is described by the following equation (6):
where TEAT2 and TEAT1 are the total CO2 emission at temperature T1 and T2, respectively; Q10SEA and Q10SM are the temperature coefficient of specific CO2 emission and mycelium growth, respectively.
TEAT2 = TEAT1 x Q10SEA (T2-T1)/10 x Q10SM (T2-T1)/10,
Depending on the species of fungi, the Q10 of mycelium growth ranges from 1.3 to 2.0, and on average it is 1.5 and the almost identical Q10 of specific emission − 1.7. Therefore, an increase in temperature in the range of 10-30 °C causes an almost equal increase in two unidirectional processes – specific CO2 emission activity and mycelium growth. Their joint action causes an exponential increase in total CO2 emissions. The dependence on the mycelium size determines another very important feature of the total CO2 emission activity of xylotrophic fungi. Due to the fact that the growth of mycelium is an irreversible increase in its size and mass, the temperature dynamics of the total emission also has the character of a directed, irreversible process. The total emission reaches its maximum at 30-35 °C, a temperature at which both the maximum specific CO2 emission activity and the size of the mycelium are observed.
5. Conclusions
In the range of summer temperatures (10-30 °C) that are relevant for temperate latitudes, the CO2 emission activity of xylotrophic fungi is closely and positively related to temperature. Their specific CO2 emission activity determined by the respiratory activity of the mycelium and does not depend on its size. The only driver of specific emissions is temperature, an increase in which causes its proportional (linear) increase. The total CO2 emission activity, which is an indicator of the amount of CO2 emitted, depends on the size and specific emission activity of the mycelium. It has the character of an irreversible, directional process that increases exponentially with increasing temperature to 30˗35 °C. This gives fairly strong grounds to assume that climate warming will lead to an exponential increase in the CO2 emission activity of woody debris, which, in turn, could potentially contribute to the acceleration of climate change.
Author Contributions
Conceptualization, V.A.M.; methodology, V.A.M. and D.K.D.; validation, V.A.M., formal analysis, D.K.D. and V.A.M.; investigation, D.K.D. and E.V.Zh.; resources, E.V.Zh. and D.K.D.; writing–original draft preparation, V.A.M. and D.K.D.; translation into English, V.A.M.; writing–review and editing E.V.Zh., and D.K.D.; visualization D.K.D and E.V.Zh. All authors have read and agreed to the published version of the manuscript.
Funding
The study was supported by the Russian Science Foundation (project No. 24-24-00404).
Data Availability Statement
Data are contained within the article.
Acknowledgments
We thank two anonymous reviewers for their valuable comments and suggestions, which helped to improve this paper.
Conflicts of Interest
The authors declare no conflicts of interest. The funders had no role in the design of the study; in the collection, analyses, or interpretation of data; in the writing of the manuscript; or in the decision to publish the results.
References
- Kudeyarov, V.; Zavarzin, G.; Blagodatskii, S.; Borisov, A.; Voronin, P.Y.; Demkin, V.; Demkina, T.; Evdokimov, I.; Zamolodchikov, D.; Karelin, D.; et al. Pools and Fluxes of Carbon in Terrestrial Ecosystems of Russia; Federal State Unitary Enterprise "Academic Scientific Publishing, Production, Printing and Book Distribution Center “Science”: Moscow, 2007; (in Russian).
- Mukhin, V.A.; Voronin, P.Yu. Mycogenic Decomposition of Wood and Carbon Emission in Forest Ecosystems. Russ J Ecol 2007, 38, 22–26, doi:10.1134/S1067413607010043.
- Wu, J.; Zhang, X.; Wang, H.; Sun, J.; Guan, D. Respiration of Downed Logs in an Old-Growth Temperate Forest in North-Eastern China. Scandinavian Journal of Forest Research 2010, 25, 500–506, doi:10.1080/02827581.2010.524166.
- Safonov, S.S.; Karelin, D.V.; Grabar, V.A.; Latyshev, B.A.; Grabovskiy; Uvarova, N.E.; Zamolodchikov, D.G.; Korotkov, V.N.; Gytarsky, M.L. Carbon emissions from the decomposition of dead wood in the southern taiga spruce forest. Russian Journal of Forest Science 2012, 44–49.
- Journeaux, K.L.; Boddy, L.; Rowland, L.; Hartley, I.P. A Positive Feedback to Climate Change: The Effect of Temperature on the Respiration of Key Wood-Decomposing Fungi Does Not Decline with Time. Global Change Biology 2024, 30, e17212, doi:10.1111/gcb.17212.
- Zavarzin, G.A.; Zavarzina, A.G. Xylotrophic and Mycophilic Bacteria in Formation of Dystrophic Waters. Microbiology 2009, 78, 523–534, doi:10.1134/S0026261709050014.
- Rayner, A.D.M.; Boddy, L. Fungal Decomposition of Wood: Its Biology and Ecology; Wiley, 1988; ISBN 978-0-471-10310-3.
- Boddy, L.; Watkinson, S.C. Wood Decomposition, Higher Fungi, and Their Role in Nutrient Redistribution. Botany 1995, 73, 1377–1383.
- Watkinson, S.; Bebber, D.; Darrah, P.; Fricker, M.; Tlalka, M.; Boddy, L. The Role of Wood Decay Fungi in the Carbon and Nitrogen Dynamics of the Forest Floor. In Fungi in Biogeochemical Cycles; Gadd, G.M., Ed.; British Mycological Society Symposia; Cambridge University Press: Cambridge, 2006; pp. 151–181 ISBN 978-0-521-84579-3.
- Baldrian, P.; Lindahl, B. Decomposition in Forest Ecosystems: After Decades of Research Still Novel Findings. Fungal Ecology 2011, 4, 359–361, doi:10.1016/j.funeco.2011.06.001.
- Mukhin, V.A.; Diyarova, D.K. Eco-Physiological Adaptations of the Xylotrophic Basidiomycetes Fungi to CO2 and O2 Mode in the Woody Habitat. Journal of Fungi 2022, 8, 1296, doi:10.3390/jof8121296.
- Mukhin, V.A.; Diyarova, D.K.; Gitarskiy, M.L.; Zamolodchikov, D.G. Carbon and Oxygen Gas Exchange in Woody Debris: The Process and Climate-Related Drivers. Forests 2021, 12, 1156, doi:10.3390/f12091156.
- Kirschbaum, M.U.F. The Temperature Dependence of Soil Organic Matter Decomposition, and the Effect of Global Warming on Soil Organic C Storage. Soil Biology and Biochemistry 1995, 27, 753–760, doi:10.1016/0038-0717(94)00242-S.
- Davidson, E.A.; Janssens, I.A. Temperature Sensitivity of Soil Carbon Decomposition and Feedbacks to Climate Change. Nature 2006, 440, 165–173, doi:10.1038/nature04514.
- Soloviev, V.A. Respiratory Gas Exchange of Wood 1987. (in Russian).
- Chen, H.; Harmon, M.E.; Griffiths, R.P.; Hicks, W. Effects of Temperature and Moisture on Carbon Respired from Decomposing Woody Roots. Forest Ecology and Management 2000, 138, 51–64, doi:10.1016/S0378-1127(00)00411-4.
- Zhou, L.; Dai, L.; Gu, H.; Zhong, L. Review on the Decomposition and Influence Factors of Coarse Woody Debris in Forest Ecosystem. J. of For. Res. 2007, 18, 48–54, doi:10.1007/s11676-007-0009-9.
- Mukhin, V.A.; Voronin, P.Yu.; Sukhareva, A.V.; Kuznetsov, Vl.V. Wood Decomposition by Fungi in the Boreal-Humid Forest Zone under the Conditions of Climate Warming. Dokl Biol Sci 2010, 431, 110–112, doi:10.1134/S0012496610020110.
- Olajuyigbe, S.; Tobin, B.; Nieuwenhuis, M. Temperature and Moisture Effects on Respiration Rate of Decomposing Logs in a Sitka Spruce Plantation in Ireland. Forestry: An International Journal of Forest Research 2012, 85, 485–496, doi:10.1093/forestry/CPS045.
- Gitarskiy, M.L.; Zamolodchikov, D.G.; Mukhin, V.A.; Grabar, V.A.; Diyarova, D.K.; Ivashchenko, A.I. Carbon Fluxes from Coarse Woody Debris in Southern Taiga Forests of the Valdai Upland. Russ J Ecol 2017, 48, 539–544, doi:10.1134/S1067413617060030.
- Gitarskiy, M.L.; Zamolodchikov, D.G.; Mukhin, V.A.; Diyarova, D.K.; Grabar; Karelin, D.V.; Ivaschenko, A.I.; Marunich, A.S. Seasonal Variations in Carbon Dioxide Emissions during the Fallen Spruce Trees Decomposition in Southern Taiga. 2020, 239–249, doi:10.31857/S0024114820030055.
- Diyarova, D.K.; Vladykina, V.D.; Mukhin, V.A. Temperature Effect on CO2 Emission by Two Xylotrophic Fungi and by Wood Debris. Russ J Ecol 2023, 54, 213–220, doi:10.1134/S1067413623030025.
- Methods of Experimental Mycology; Bilay, V.I., Ed.; Naukova Dumka: Kyiv, 1982; (in Russian).
- Ryvarden, L.; Gilbertson, R.L. European Polypores: Abortiporus - Lindtneria; European Polypores; Fungiflora, 1993; ISBN 978-82-90724-12-7.
- Index Fungorum Home Page Available online: https://www.indexfungorum.org/ (accessed on 28 May 2024).
- Judova, J.; Dubikova, K.; Gaperova, S.; Gaper, J.; Pristas, P. The Occurrence and Rapid Discrimination of Fomes Fomentarius Genotypes by ITS-RFLP Analysis. Fungal Biology 2012, 116, 155–160, doi:10.1016/j.funbio.2011.10.010.
- Peintner, U.; Kuhnert-Finkernagel, R.; Wille, V.; Biasioli, F.; Shiryaev, A.; Perini, C. How to Resolve Cryptic Species of Polypores: An Example in Fomes. IMA Fungus 2019, 10, 17, doi:10.1186/s43008-019-0016-4.
- Zhuykova, E.V.; Mukhin, V.A. Diversity and Ecological Features of Phylogenetic Lineages of Tinder Fungus in the Urals. Russ J Ecol 2022, 53, 366–372, doi:10.1134/S1067413622050113.
- Mukhin, V.A.; Vladykina, V.D.; Diyarova, D.K. Temperature Dynamics of Growth, CO2 Gas Exchange and Competitiveness of Daedaleopsis confragosa and D. tricolor. Mycology and Phytopathology 2023, 57, 42–47, doi:10.31857/S0026364823010105. (in Russian).
- Diyarova, D.K. Carbon-Oxygen Gas Exchange of Wood Debris during Mycogenic Decomposition, Institute of Plant and Animal Ecology, Ural Branch of the Russian Academy of Sciences: Ekaterinburg, Russia, 2020. (in Russian).
Figure 1.
Dikaryotic mycelium of Fomitopsis betulina (a, d) F. pinicola collected on Betula (b, e) and Picea (c, f), Phellinus igniarius (g, j), Fomes fomentarius (h, k) and Fomes inzengae (i, l) at the beginning of the experiment (I, III) and after five days (II, IV).
Figure 1.
Dikaryotic mycelium of Fomitopsis betulina (a, d) F. pinicola collected on Betula (b, e) and Picea (c, f), Phellinus igniarius (g, j), Fomes fomentarius (h, k) and Fomes inzengae (i, l) at the beginning of the experiment (I, III) and after five days (II, IV).
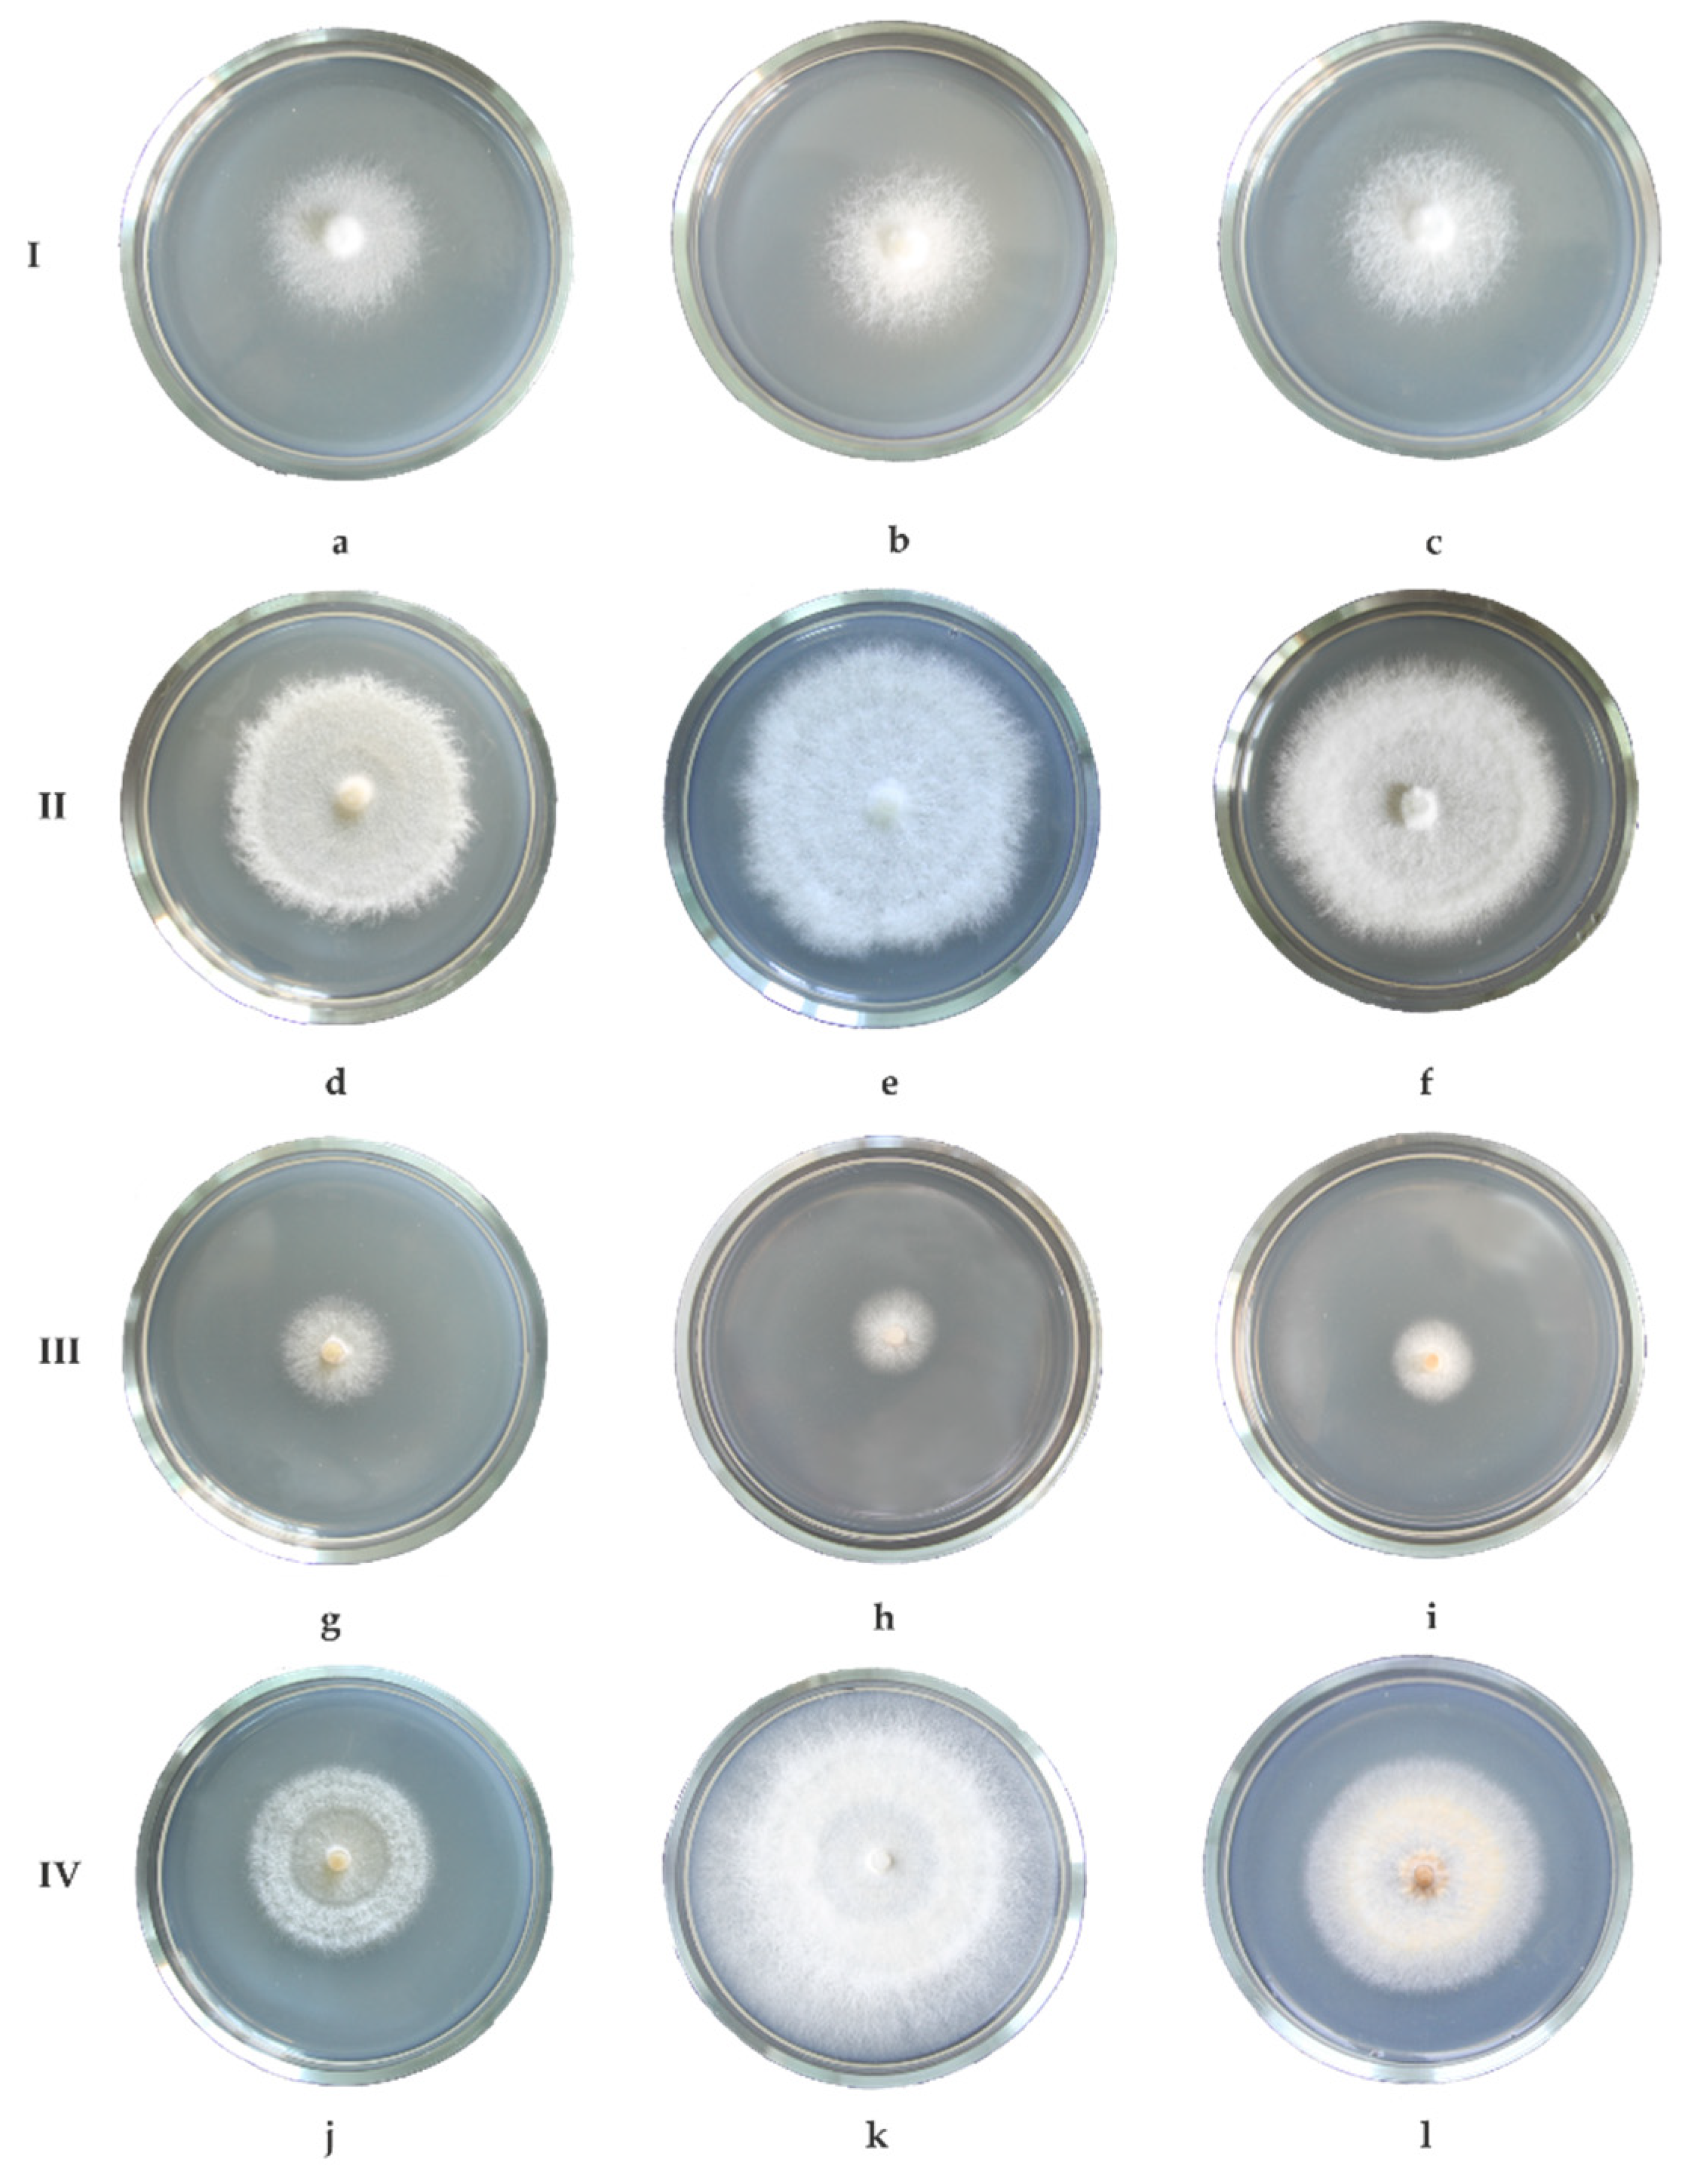
Figure 2.
Dynamics of specific (blue, the approximation confidence value on the left) and total (red, approximation confidence value on the right) CO2 emission activity (m ± SE) of dikaryotic mycelium at MA in the range of 10-30 °C of Fomes fomentarius sensu stricto (a), F. inzengae (b), Fomitopsis pinicola (collected on Betula) (c), Fomitopsis pinicola (collected on Picea) (d), Fomitopsis betulina (e) and Phellinus nigricans (f).
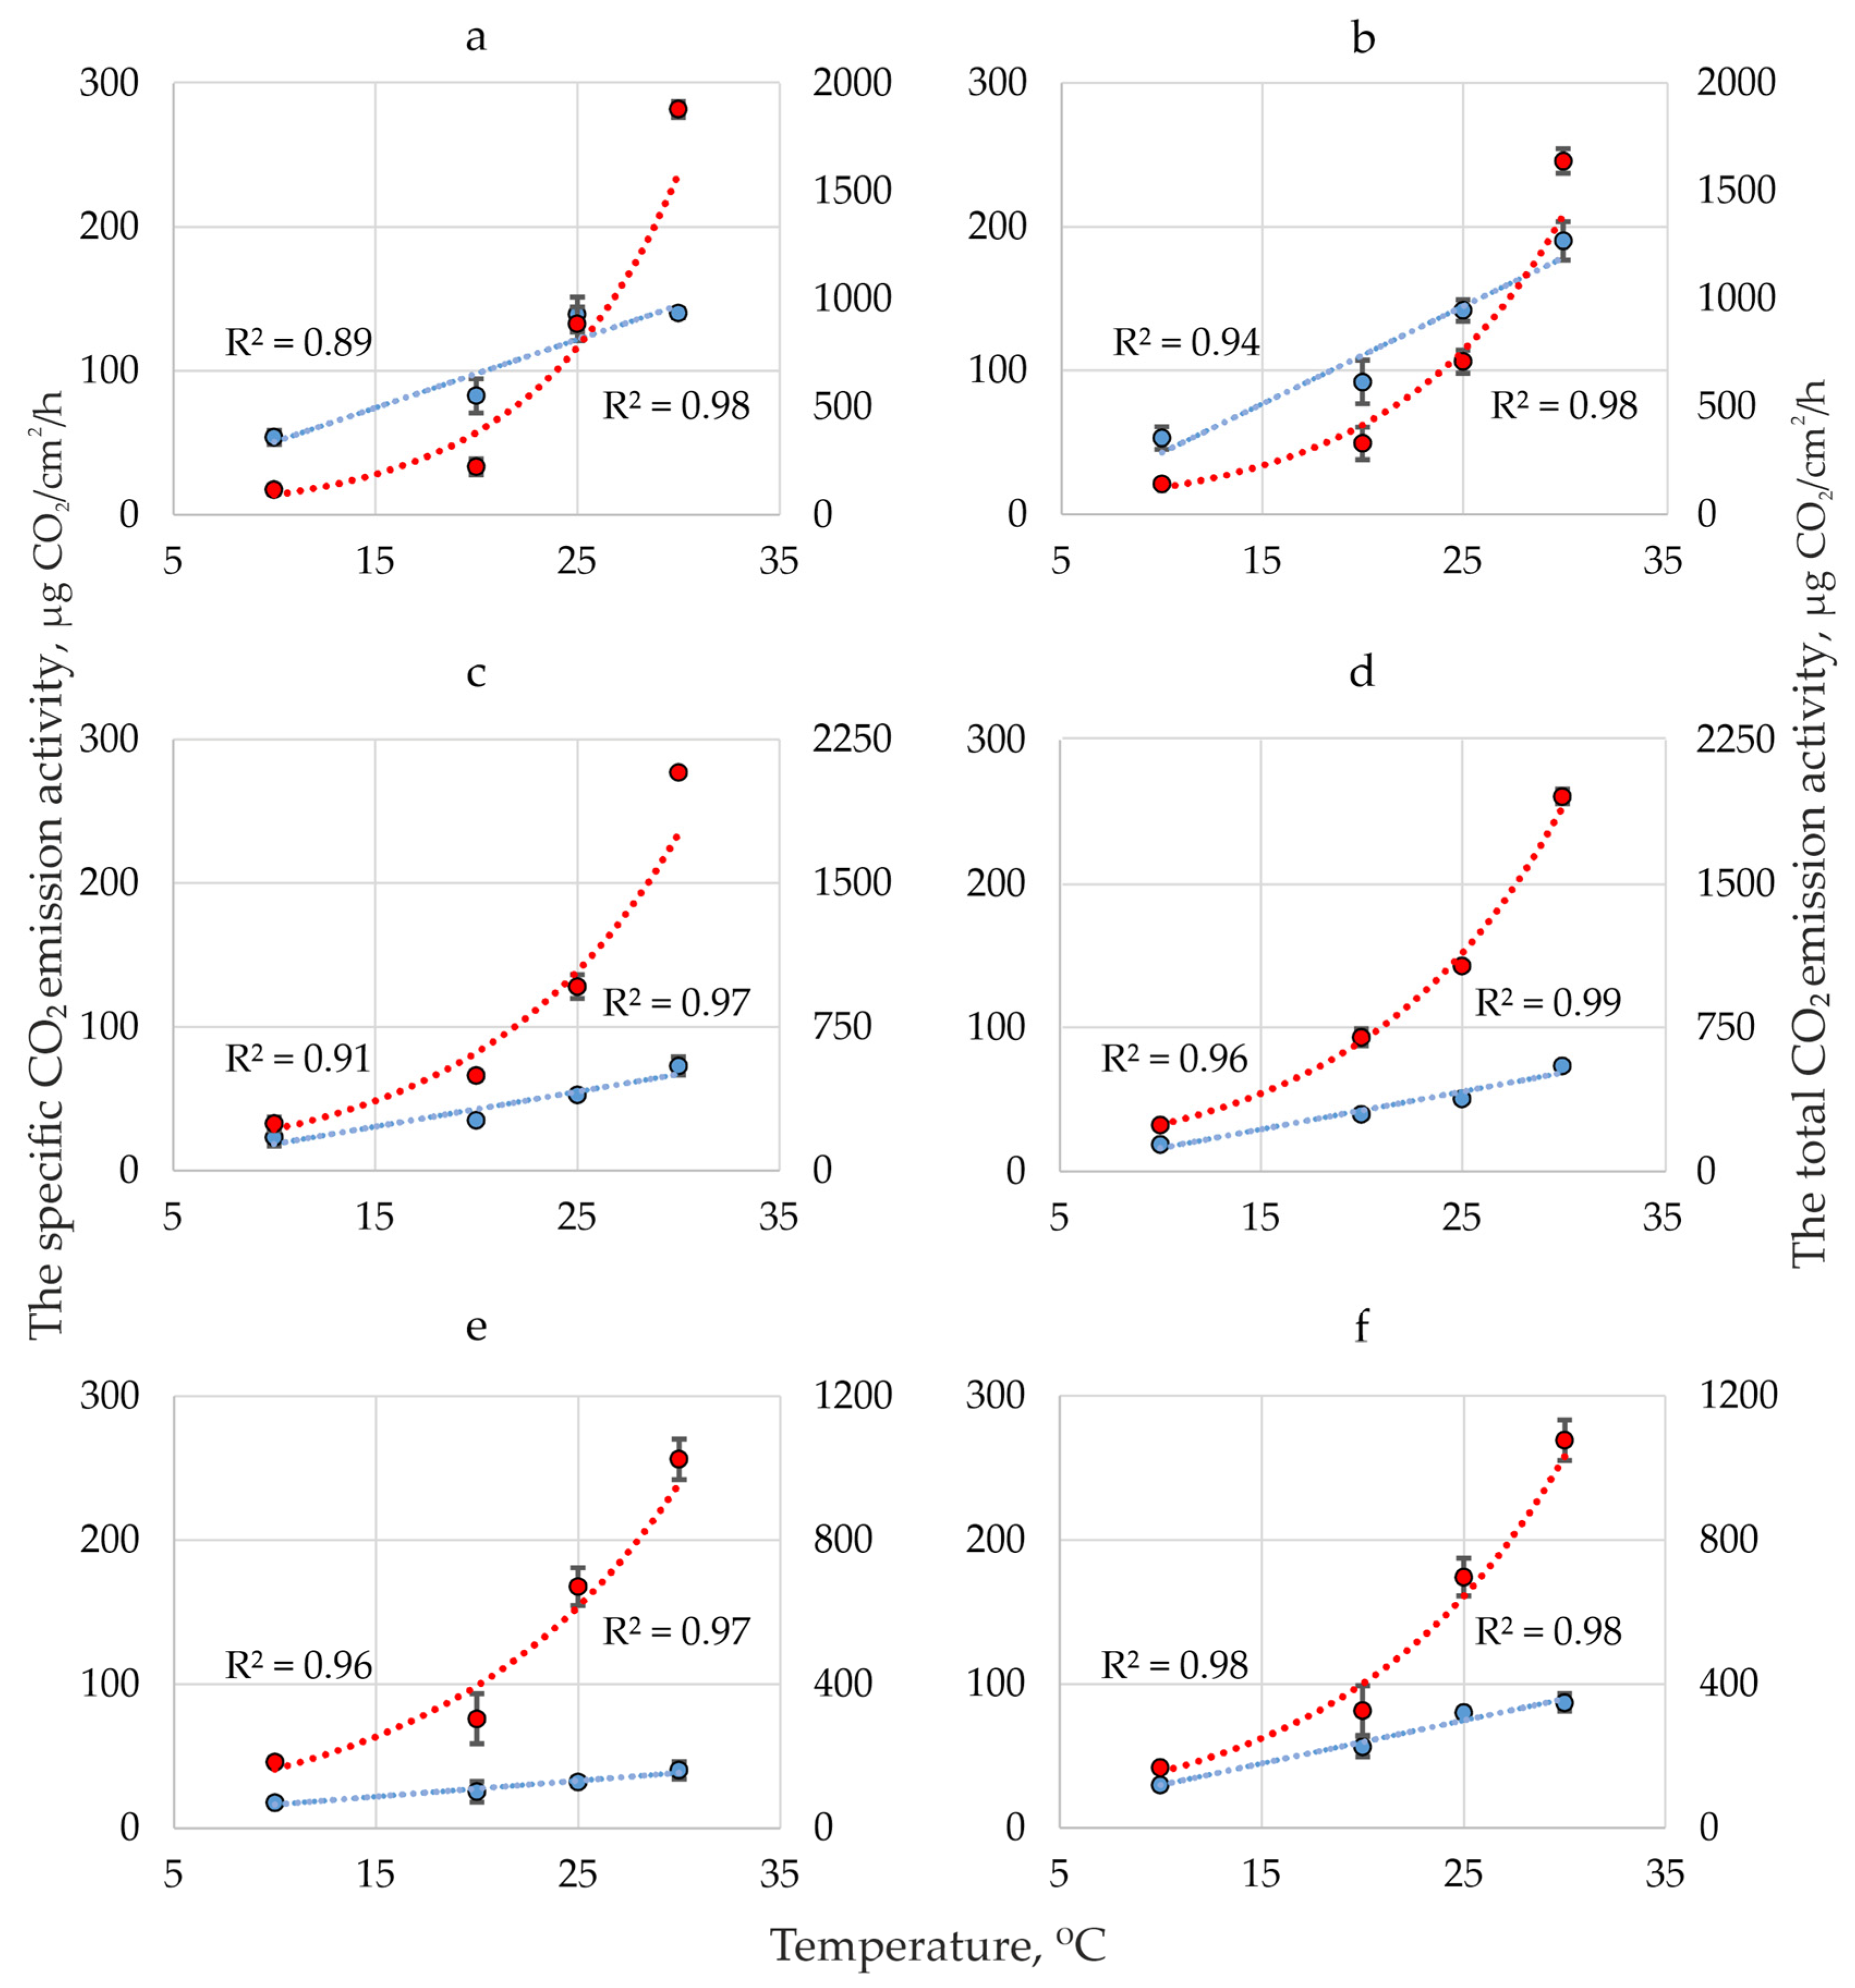

Table 1.
The total and specific CO2 emission activity of the dikaryotic mycelium of Fomitopsis betulina / Phellinus igniarius and their relationship with its area and temperature.
Table 1.
The total and specific CO2 emission activity of the dikaryotic mycelium of Fomitopsis betulina / Phellinus igniarius and their relationship with its area and temperature.
| Temperature, °С |
Mycelium area, cm2 |
Emission | |
|---|---|---|---|
| Total, µg CO2/h |
Specific, µg CO2/cm2/h |
||
| 10 | 10±0.5 / 6±0.2 | 182±5.0 / 168±12.0 | 18±0.8 / 30±2.8 |
| *13±1.4 / 6±0.2 | 233±1.1 /165±47.1 | 19±2.0 / 30±8.7 | |
| 20 | 13±1.4 / 6±0.2 | 303±69.2 / 326±21.9 | 25±7.1 / 56±4.3 |
| *21±1.6 / 9±0.5 | 490±10.2 / 517±11.2 | 24±2.2 / 60±4.9 | |
| 25 | 21±1.6 / 9±0.5 | 671±52.5 / 697±20.1 | 32±2.6 / 80±2.7 |
| *27±3.0 / 13±0.8 | 789±34.7 / 988±46.8 | 30±2.6 /80±5.2 | |
| 30 | 27±3.0 / 13±0.8 | 1024±56.4 / 1077±16.9 | 40±6.0 / 87±7.3 |
| *35±3.9 / 18±0.6 | 1076±87.3 /1062±49.6 | 33±5.9 / 60±4.7 | |
| 35 | 35±3.9 / 18±0.6 | 1049±129.5 / 946±92.8 | 32±6.8 / 53±4.2 |
| *35±3.1 / 19±0.5 | 917±27.4 / 645±24.7 | 27±2.4 / 35±0.4 | |
Note: * – here and further in the tables the area of mycelium after 24 hours.
Table 2.
The total and specific CO2 emission activity of the dikaryotic mycelium of Fomitopsis pinicola (collected on Betula / Picea), and their relationship with its area and temperature.
Table 2.
The total and specific CO2 emission activity of the dikaryotic mycelium of Fomitopsis pinicola (collected on Betula / Picea), and their relationship with its area and temperature.
| Temperature, °С |
Mycelium area, cm2 |
Emission | |
|---|---|---|---|
| Total, µg CO2/h |
Specific, µg CO2/cm2/h |
||
| 10 | 11±1.3 / 13±0.8 | 244±34.7 / 242±17.6 | 23±6.0 / 19±0.5 |
| *14±1.3 / 18±1.2 | 319±20.4 / 336±22.4 | 23±3.7 / 19±2.5 | |
| 20 | 14±1.3 / 18±1.2 | 495±22.8 / 699±44.7 | 35±1.7 / 40±2.9 |
| *18±1.8 / 21±1.4 | 740±36.9 / 856±0.6 | 41±4.3 / 40±2.5 | |
| 25 | 18±1.8 / 21±1.4 | 959±62.3 / 1072±18.5 | 52±2.2 / 50±2.7 |
| *29±2.3 / 27±1.3 | 1698±22.0 / 1416±26.6 | 59±4.4 / 53±2.3 | |
| 30 | 29±2.3 / 27±1.3 | 2076±13.1 / 1955±37.7 | 73±6.4 / 73±2.6 |
| *38±2.5 / 35±1.4 | 2736±44.3 / 2551±35.0 | 73±6.5 / 74±3.5 | |
| 35 | 38±2.5 / 35±1.4 | 2771±34.1 / 2382±49.2 | 74±5.7 / 69±1.6 |
| *42±2.3 / 43±0.9 | 2670±83.9 / 2290±33.7 | 65±5.2 / 53±1.2 | |
Table 3.
The total and specific CO2 emission activity of the dikaryotic mycelium of Fomes fomentarius sensu stricto / Fomes inzengae and their relationship with its area and temperature.
Table 3.
The total and specific CO2 emission activity of the dikaryotic mycelium of Fomes fomentarius sensu stricto / Fomes inzengae and their relationship with its area and temperature.
| Temperature, °С |
Mycelium area, cm2 |
Emission | |
|---|---|---|---|
| Total, µg CO2/h |
Specific, µg CO2/cm2/h |
||
| 10 | 2±0.1 / 3±0.2 | 116±1.1 / 141±15.2 | 54±4.7 / 53±7.8 |
| *3±0.1 / 4±0.5 | 147±17.5 / 250±42.4 | 55±7.8 / 69±3.6 | |
| 20 | 3±0.1 / 4±0.5 | 222±36.3 / 328±75.4 | 83±11.9 / 92±15.2 |
| *6±0.2 / 5±0.5 | 681±98.0 / 516±13.7 | 106±11.8 / 104±7.5 | |
| 25 | 6±0.2 / 5±0.5 | 884±78.6 / 707±53.2 | 139±12.0 / 142±7.4 |
| *13±0.2 / 9±0.7 | 2064±133.9 / 1269±98.9 | 154±9.2 / 146±2.7 | |
| 30 | 13±0.2 / 9±0.7 | 1878±36.9 / 1637±56.9 | 140±3.0 / 190±13.4 |
| *19±0.8 / 12±0.8 | 2401±41.0 / 1868±26.2 | 127±3.0 / 155±8.2 | |
| 35 | 19±0.8 / 12±0.8 | 2588±127.5 / 1777±82.6 | 137±1.3 / 147±6.6 |
| *25±1.3 / 16±1.0 | 2042±183.5 / 1650±78.9 | 84±10.7 / 102±10.5 | |
Disclaimer/Publisher’s Note: The statements, opinions and data contained in all publications are solely those of the individual author(s) and contributor(s) and not of MDPI and/or the editor(s). MDPI and/or the editor(s) disclaim responsibility for any injury to people or property resulting from any ideas, methods, instructions or products referred to in the content. |
© 2024 by the authors. Licensee MDPI, Basel, Switzerland. This article is an open access article distributed under the terms and conditions of the Creative Commons Attribution (CC BY) license (http://creativecommons.org/licenses/by/4.0/).
Copyright: This open access article is published under a Creative Commons CC BY 4.0 license, which permit the free download, distribution, and reuse, provided that the author and preprint are cited in any reuse.


