
Submitted:
22 May 2024
Posted:
23 May 2024
You are already at the latest version
Abstract
Infrared thermography is a contactless imaging technique, useful to measure surface temperature at distance which has been widely applied in animal production. The possible applications within the pig husbandry include sow heat detection, reduction of the incidence of neonatal mortality, recognition of febrile state caused by pathogens, study of metabolic efficiency, evaluation of stress caused by heat, by constraints, or by aggressive interaction and meat quality prediction. Even if this technique could be easily influenced by environmental factors, the continuous improvement in the procedures and the decrease in the cost of the equipment will allow in the next future new and more applications in swine farming.
Keywords:
thermography
; infrared imaging
; pig farming
; breeding
; transport
; slaughter
; precision livestock farming
1. Introduction
Thanks to its characteristics, thermography is a very well suited technique to operate in extremely diverse contexts such as building, plant engineering, human medicine, and, likewise, precision animal husbandry [1]. Within animal husbandry, its applications are innumerable and they encompass silage control, udder health, oestrus detection, stress assessment and early diagnosis of certain diseases, to name a few [2].
Swine husbandry has good prospects because of its high feed conversion efficiency, quick body weight gain, high fecundity and prolificacy and economic aspects of a swine breeding depends on maintaining good herd health. The animals’ exposure to stressful conditions has been increased together with the intensity of pig production and could be harmful to their welfare and productivity [3].
In the field of pig farming, thermography is highly suitable to operate by remotely sensing the skin temperature, being able to measure temperatures without coming into contact or interacting with the individual, thus not altering their behavior, and in a completely noninvasive manner insofar as it does not require any restraint.
Such a range of applications makes infrared thermography a widely usable technique for obtaining some important information about the thermal status of animals, through which the management of production stages and operations on individuals can be faster and more effective [4].
The proper use of the thermal imaging camera is not uncomplicated and thermographic techniques at the farm should be carried out with care. Here below, the most relevant applications of this technique in the swine field will be briefly explained, in order to provide an overview of its potential (Table 1).
2. Application of Thermography in Pig Breeding
Within pig farming, thermography is used in many stages of production because it is noninvasive, it does not require contact with the surface to be measured, it can be applied to hard-to-approach or moving individuals, and its application can be advantageous along some industrial processing chains, such as the slaughter lines.
The application versatility of the thermal imaging camera, the instrument that can detect the amount of heat produced by a body or surface, should not overshadow the knowledge of factors that might influence thermometric measurement. Emissivity is a peculiar characteristic of any heat-emitting surface, therefore we need to calibrate the thermal imaging camera considering this parameter, which is considered to be 0.98 [5] for those parts that can be measured on livestock. Even the environment parameters of the place where the measurement is taken, i.e., relative temperature and humidity, are to be considered when setting up the thermal imaging camera, because this instrument may record different values in the presence of appreciable changes of such parameters. Moreover, the distance from the individual, as well as the viewing angle should be taken into account. The presence of water or dirt on the surfaces to be measured, the proximity to reflective planes, the solar radiation and the wind can also interfere with thermometric measurement (Table 2). For this reasons, when applying thermography to the animal husbandry field, special attention is to be paid to the maximum temperature value detected over the observed area. The body surface temperature of fattening pigs can be more accurately described by the maximum temperature of the thermal images [6]. In fact, the lowest value could be affected by the presence of dirt or liquid and could be, therefore, less relevant.
2.1. Oestrus Detection
Thermography is highly suitable for detecting changes in the surface temperature of the vulvar area (Figure 1) in gilts and sows during the heat period, because it is not covered in bristles. In addition, the changes can be easily measured by the operator, when the individual is placed inside an insemination cage and has its backside facing the passageway. A few studies on oestrus detection [7,8,9] have shown that the peak vulvar temperature reaches values just above 36° C, in the pre-ovulatory phase, while in gilts it is lower by about half a degree. Subsequently, 12 hours before ovulation these values decrease to 34.6° C and 33.9° C, respectively. [10], like the previous Authors, have confirmed the changes in vulvar temperature associated with oestrus, having found values slightly higher than those indicated above, and having noticed the absence of any relationship between vulvar temperature and rectal or buttock surface temperature [9]. Lately, Lee et al. have shown that the simultaneous application of the thermographic measurement and of the ultrasonic sensors one, destined to quantify the time sows remain standing, tends to improve the success of artificial insemination interventions [11].
Altogether, it seems clear that thermography is suitable for detecting changes in vulvar temperature at different stages of the ovarian cycle and may be an applicable technique, not only in detecting oestrus, but also in monitoring its lowering toward the ovulation phase. At present, the cost of thermographic sensors is still high, but it is expected to drop over the coming years, thus making their permanent placement possible inside sow farms, in order to identify the best moment to carry out inseminations.
2.2. Hypothermia in the Newborn Piglet
Neonatal hypothermia is known as a frequent cause of mortality in pre-weaning piglets, particularly affecting those individuals who have lower temperatures during the first few hours after their birth [12]. As a rule, those individuals who weigh less at birth have a hard time recovering from the initial drop in body temperature, which occurs during the first hour after birth, and they subsequently struggle to maintain it within an adequate level [13]. The use of a digital thermometer for measuring rectal temperature (RT) is considered the gold standard, so it has been widely used in the research on piglet viability. Thermography allows faster and continuous identification of those piglets requiring supportive interventions in the immediate postpartum, thus enabling the aforementioned interventions.
The thermoregulatory capacity of newborn piglets is related to their body energy and metabolism, which can be influenced by genetic differences among different existing breeds, such as average weight and metabolic efficiency. We also need to consider external factors, such as air temperature or the state of piglets’ skin (wet or dry). Drying piglets at birth, placing them near a heat source and providing them with some energetic supplementation improves their thermal status and prevents hypothermia, but it’s necessary to pay attention before shooting with the thermal camera, because emissivity of the wet skin is different from that of the dry one and the presence of heat sources can affect data [13,14]. Llamas Moya found out that the skin temperature was not related to birth weight, but was influenced by the huddling behaviour of piglets and their location (near or far) from a heat source [14] and Tabuarici found out that the IRT data were not predictive of mortality risk, however they could be used to predict shivering [15]. Note that although not all piglets suffering from hypothermia would shiver [16], IRT could be used to identify and help piglets in need, in order to limit mortality.
Schmitt has carried out a study regarding the possibility of applying thermography to the assessment of thermoregulation differences among piglets belonging to two genetic lines, whose growth efficiency is lower or higher: piglets belonging to the genetic line with higher efficiency showed higher temperature at both the 15th and 30th minute postpartum, particularly the ear temperature, suggesting an effect of the genetic selection for feeding efficiency on neonatal thermoregulation abilities [17].
Figure 2.
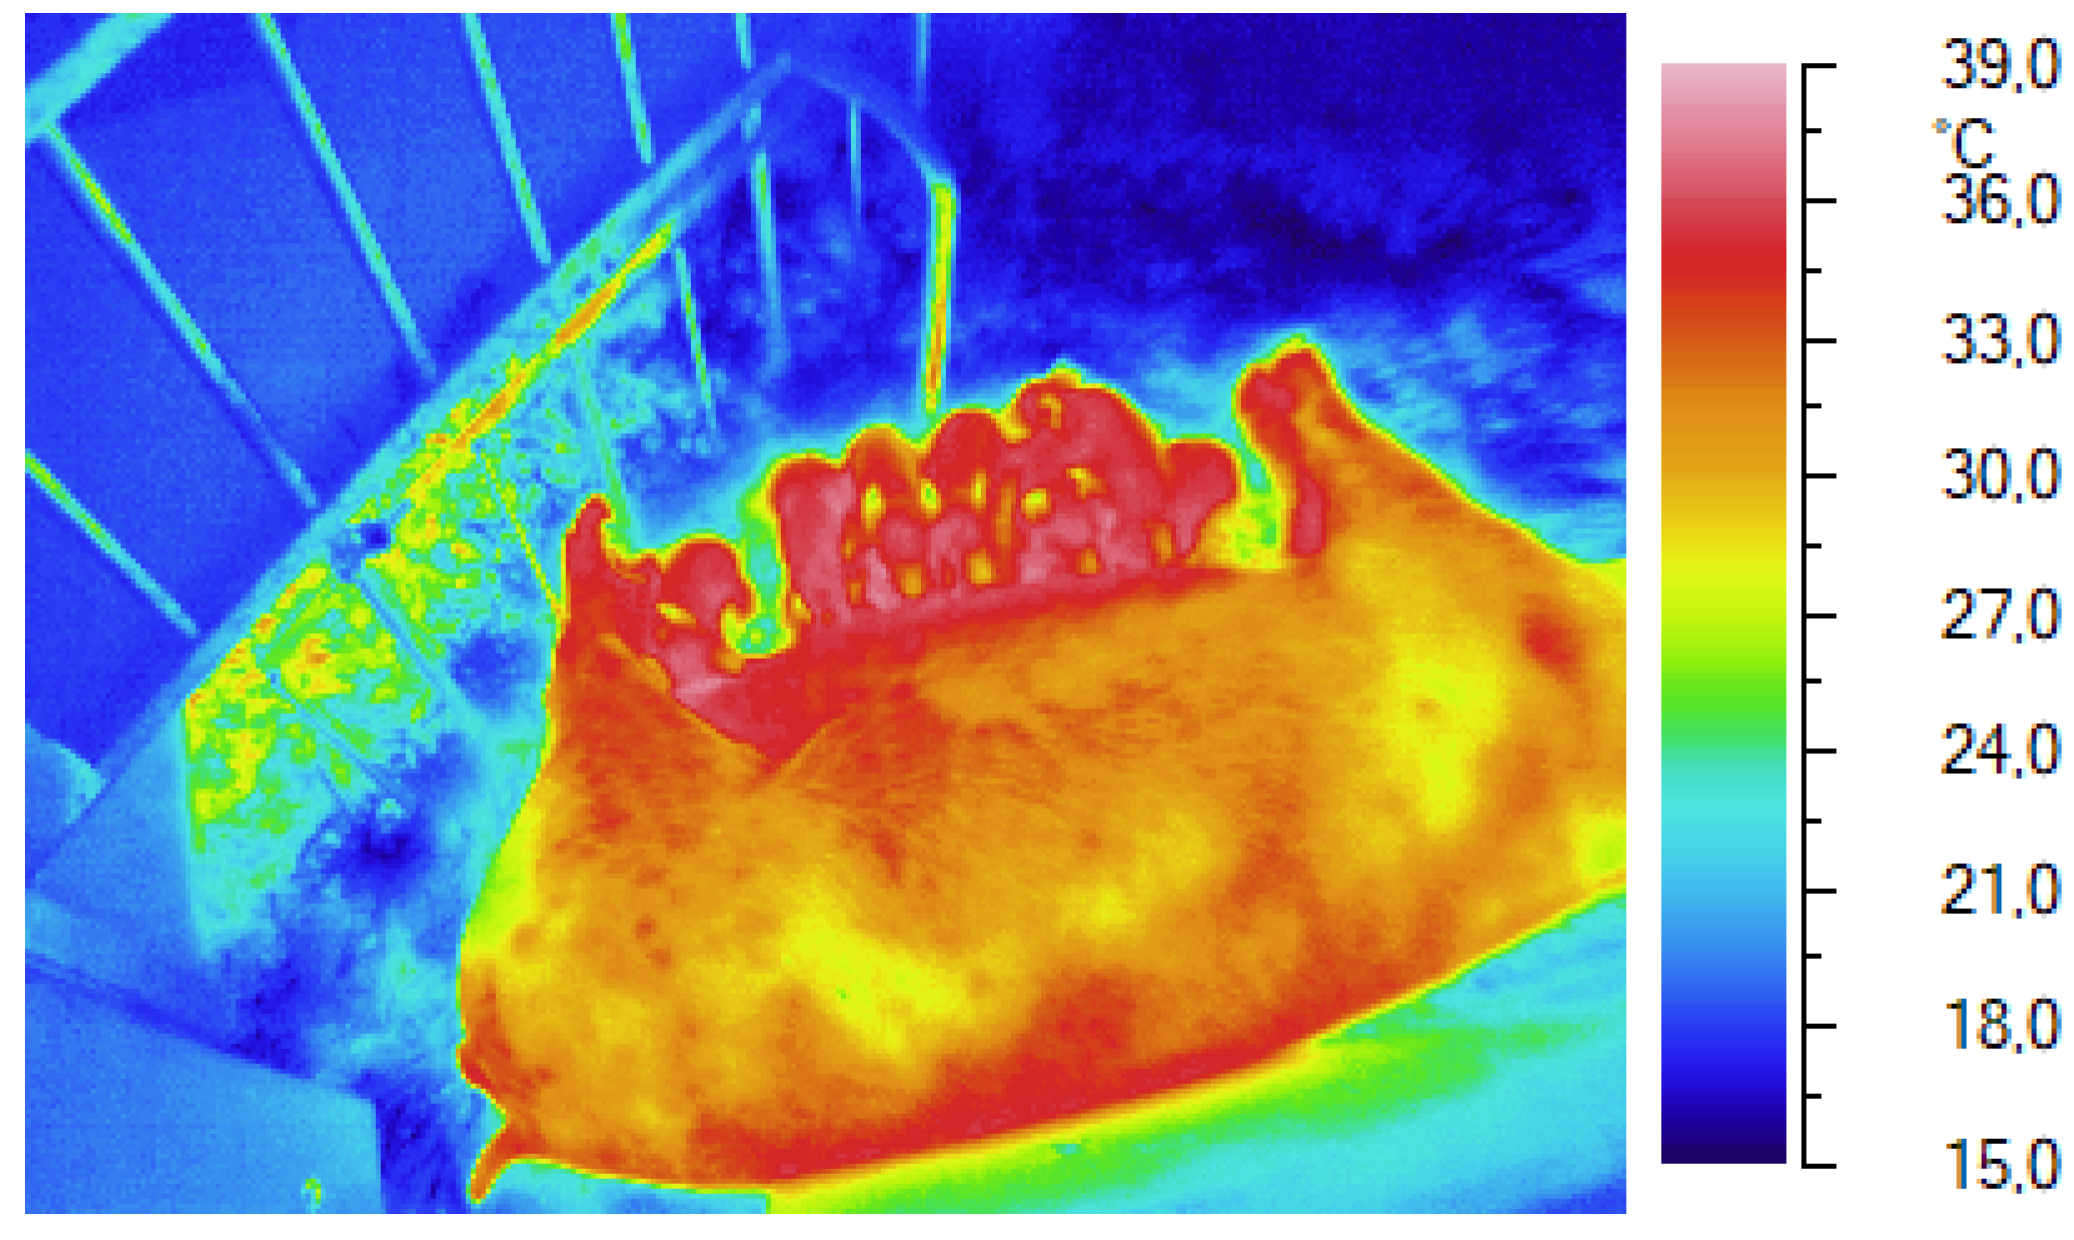
Control of skin and environmental temperatures during farrowing with an infrared camera.
2.3. Detection of Febrile State
The increase in body temperature in pigs caused by some bacterial or viral infection can be detected using the thermographic technique. After induced infections using pathogens, several examples of surface temperature measurement can be found for different parts of the body. In comparison with the rectal temperature, response times are more delayed yet still present. 6 days after classical swine fever virus inoculation, Johnson and Dunbar reported an increase in skin temperature by 5.8°, 12.0°, and 10.0° C on the edge of ear, foot, and on the entire body surface, respectively [18]. The same Authors have also observed that the maximum body temperature was detected on the inside of the hind legs and on the back of affected individuals. Similar results have been reported on pigs infected with the foot-and-mouth disease virus, showing increases of the maximum temperature on foot skin by more than 10° C, three days later than the infection [19].
2.4. Assessment of the Effects of Food Ingestion and Body Composition
In the context of evaluating temperature changes related to food intake and to its energy content, Loughmiller examined the effects of four diets that were characterized by increasing levels of metabolizable energy and equal to 0.75, 1.5, 2.5 and 4.7 (ad libitum) times the one of the maintenance energy diet (MEm) [23]. The thermographic images have been taken three times a day for three consecutive days starting from the fifth day after the onset of the trial, because the first four days were used for the adaptation to such diets. The pigs have been photographed at a 2-meter distance, perpendicularly to the flank, while standing free in their stalls. This study has confirmed that weight gain and feed ingestion increase the body surface temperature and, for the first time, it has shown the applicability of thermographic tracking to the study of temperature changes associated with feed ingestion. Moreover, it has highlighted the need for considering the timing of the thermographic shooting on the pig and the distance from the last feeding, since the associated temperature variation can affect the detected value.
Cook evaluated the application of thermography to the measurement of radiant heat loss in relation to the metabolic activity, in order to identify the most growth-efficient pigs [24]. The thermographic camera was placed above an automatic feed station capable of weighing the amount of supplied and remaining food, as well as of recording the individual’s actual weight. The part of the body detected by the camera was therefore the back. The data surveys involved 141 pigs that had been checked as actually weighing around 35, 65, and 105 kilos. The performance of a 24-hour fasting period revealed a decrease in the maximum dorsal surface temperature by 0.28° C. Moreover, this temperature presented a negative relationship with ingestion and growth. This suggested the possibility of identifying, through thermography, individuals with more efficient metabolic processes associated with lower energy losses in the form of radiant energy.
Lengling has recently evaluated whether, during the growth of animals, the use of thermography could identify fatter and leaner individuals [25]. Their initial hypothesis was that the increase in the back fat layer, due to its insulating power, could reduce the surface temperature detected on the back. However, the obtained results showed that we cannot discriminate this way, since the changes in the fat layer associated with the growth, measured by ultrasound, are not as remarkable as to cause a decrease in the surface temperature of pigs’ back. Furthermore, the methods employed to evaluate this possible application of thermography have shown how the effects of the environment conditions in which measurements are recorded can significantly interfere, when working on the detection of limited thermal variations.
2.5. Assessment of Restraint-Related Stress
Through thermography, Magnani et al. have assessed temperature changes on eye, back, belly and flank of piglets that had previously undergone the so-called “Backtest” [26]. This test is carried out on piglets aged between 10 and 17 days, holding an individual supine for one minute and observing its behavioral response, which can range from immobility (low-resisters or LR) to extreme struggle (high-resisters or HR). HR individuals show higher aggressiveness and reluctance to adapt to environment changes, while LR individuals explore the environment and show flexibility in their response to environment stimuli. Regardless of whether the piglets belonged to the LR or HR group, the Backtest resulted in a remarkable, yet small, decrease in skin temperature of the right ear and right eye. The decrease in temperature after the test indicates that the restraint causes some peripheral vasoconstriction due to the immobilization stress. With the sole exception of the dorsal part (which pigs were held supine over), the skin temperature values of the examined areas tended to be higher in HR individuals than in LR individuals, probably due to the stronger movement of the former in response to immobilization.
2.6. Assessment of Stress Related to Aggressive Interaction
Boileau et al. have employed thermography in order to assess changes in skin temperatures in response to a highly stressful event, such as an aggressive interaction between two individuals [27]. The problem of aggression among pigs is a common occurrence in all farms, and it is important to acquire some information to understand their physical and emotional responses, thanks to noninvasive techniques such as thermography. Forty-six pigs aged 13 weeks have been examined, entire males and females, who had undergone no tail cut and no teeth trimming. The test that has been carried out consisted of placing pairs of individuals unrelated to each other into an 11m2 arena, then of comparing male-male, female-female and male-female combinations in 69 encounters. The confrontation began with the entry of the two individuals into the arena and ended when three situations occurred: when there was an obvious winner, after 20 minutes of no interaction, and when a fear or mounting behavior occurred, even in a single individual. In this study, the back, particularly the area between the shoulder blades and the rump, was selected as thermal frame to analyze the exchanges of blood-irradiated areas.
In the case of an aggressive confrontation, at the time of termination due to the loser’s withdrawal, a decrease in back surface temperature was observed, although there were no differences between the winning and losing pigs. Conversely, duration of the confrontation, body weight and sex of participants were found to be of little influence. Since the drop in temperature at the end of the confrontation was independent from the physical effort required to win or defend, the vasoconstriction observed by thermography may be the result of psychological stress rather than that of physiological adaptation. This outcome highlighted through the thermographic application provides us with new evidence to evaluate aggressive behavior more thoroughly in terms of animal well-being and physiological response to such behaviors.
2.7. Relationship with Environment Temperature and Evaluation of Heat due to Stress during Transport
Loughmiller compared environment temperature changes measured inside a climate chamber with the surface skin temperature of pathogen-inoculated pigs and healthy pigs. In particular, it has been observed that the surface temperature of the latter linearly increased the moment the environment temperature did [21].
Thermography has been employed by Nanni Costa to continuously detect the skin temperature of some piglets during long-duration transports (Figure 3), precisely lasting 14 hours, in order to evaluate the relationships with the environment temperature inside the vehicle [28]. This study has made it possible not only to quantify the increase in surface temperature as a response to a rise in environment temperature, but also to show a linear relationship between skin temperature and environment temperature inside a vehicle. In fact, a 1° C rise inside the vehicle produced a 0.2° C rise in the maximum skin temperature. Such linear relationship was found to be similar to the one measured by Laughmiller by the above-mentioned study [21].
Figure 4.
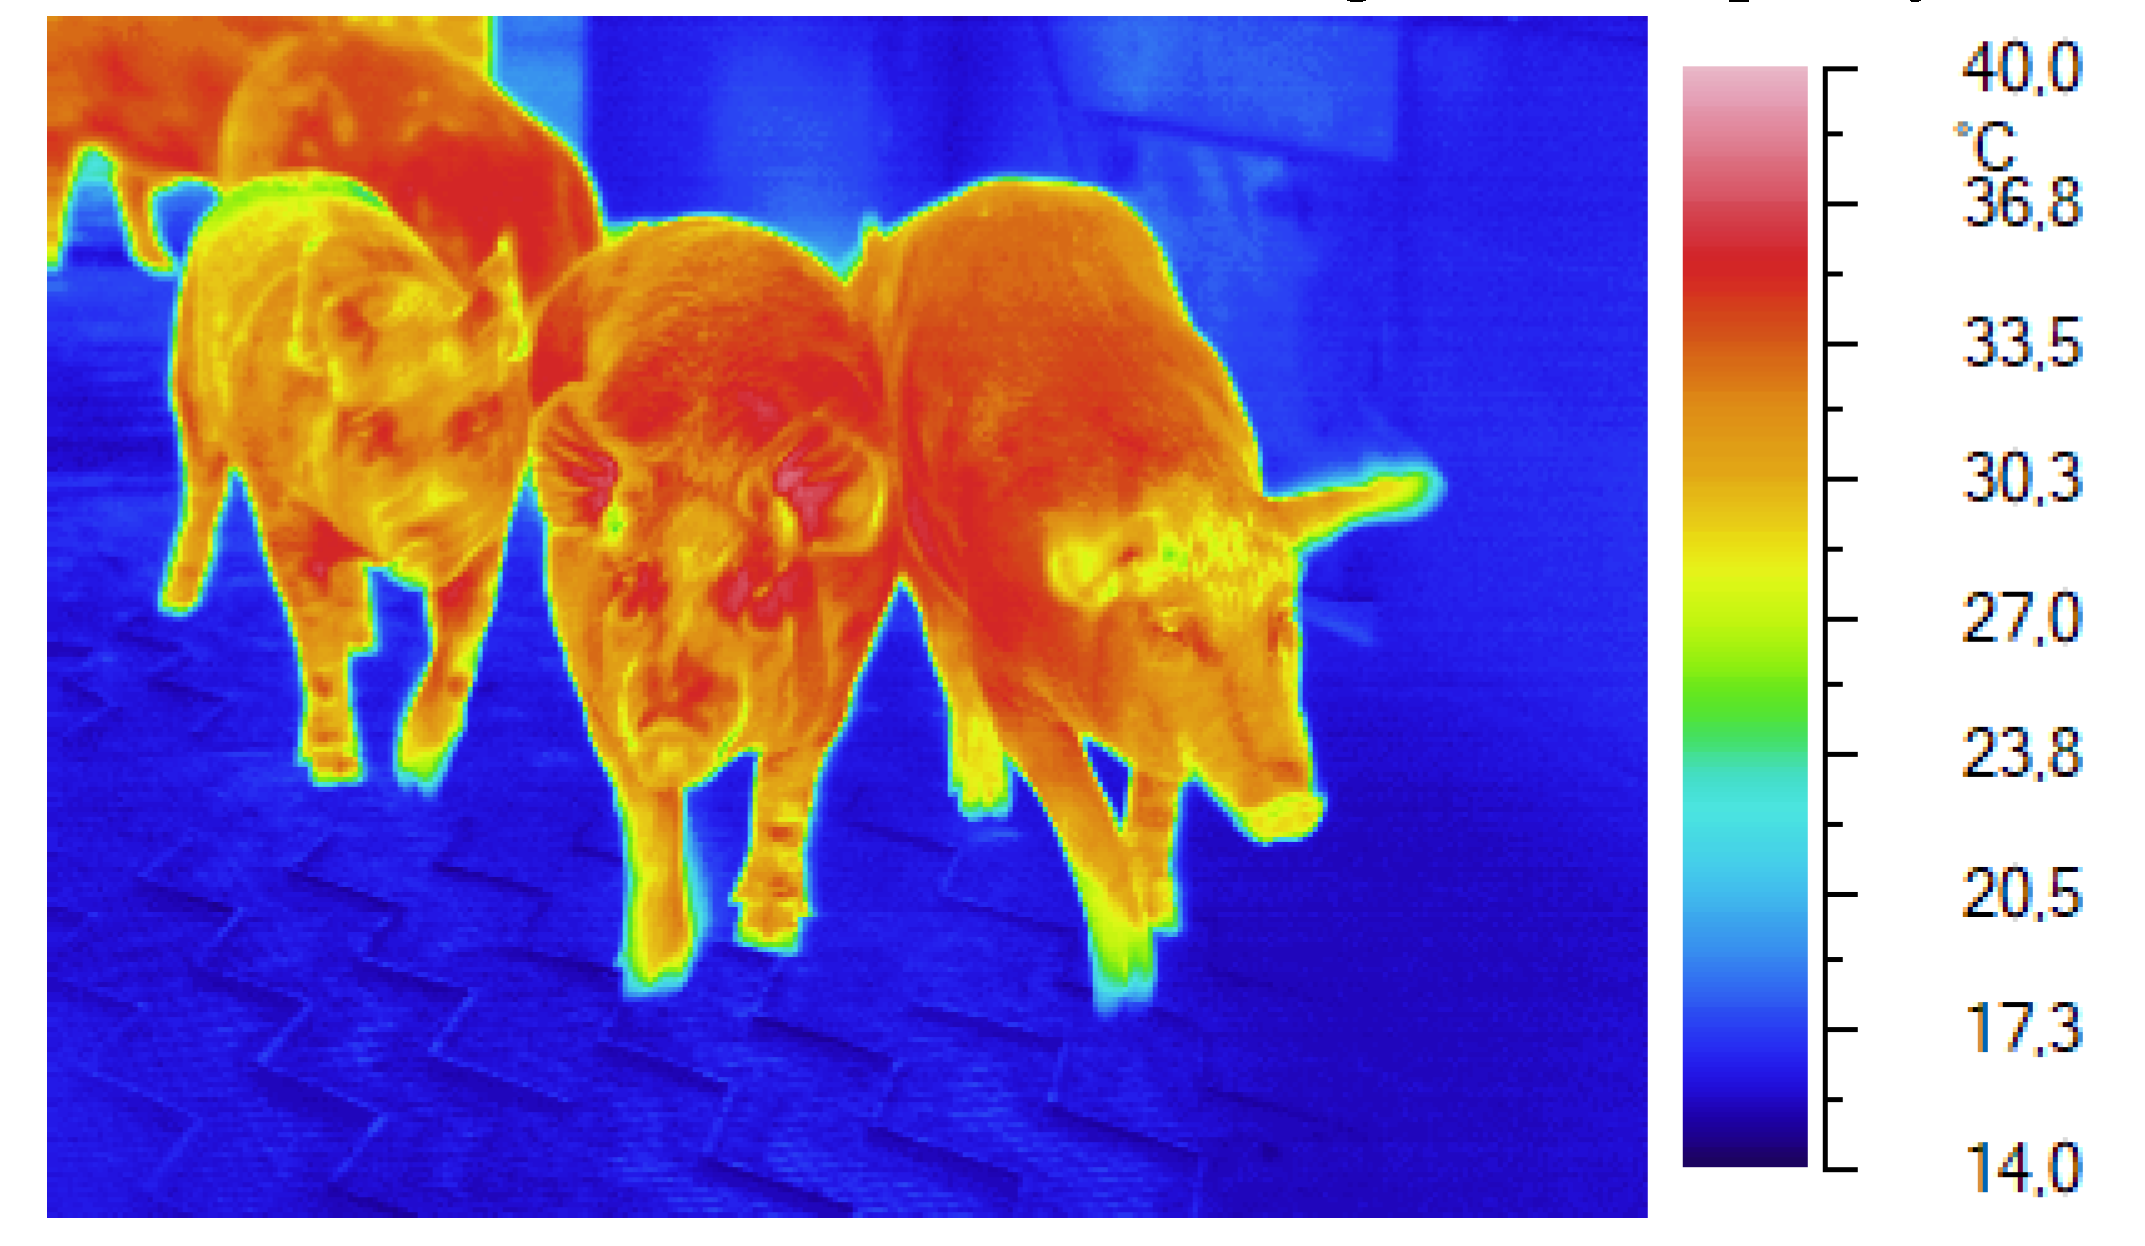
Monitoring the skin temperatures of pigs as they arrive at the slaughterhouse.
3. Applying Thermography to the Stages of Slaughter
In order to identify those pigs showing stress signs before slaughter, Warris measured ear temperature on three different locations through thermography, and they have compared it with blood temperature recorded using an infrared thermometer [29]. Also the blood levels of cortisol and creatine kinase, used as indicators of the animals’ stress level of the animals, have been determined. The correlation between ear and blood temperatures was statistically significant, but low (r = +0.11). The coefficients of correlation between ear temperature and Creatine kinase levels (r = +0.55) were higher, while cortisol was found to have a correlation with the average blood temperature. This confirmed that pigs having a higher stress level were showing the highest temperatures.
Through thermography, Weschenfelder et al. have measured the eye temperature of pigs placed into the restrainer within an automatic system of electrical stunning before the shock. The study determined that the eye temperature measured just before the stunning is partially correlated with both the blood lactate level and the measurements carried out for the quality assessment of meat. It is likely that the uncomfortable measurement conditions have affected the ocular temperature data collected during the experiment, which was not suitable to provide sufficient prediction of those parameters detectable postmortem [30].
For sure, thermography can be employed in the identification of the pigs that show some abnormally high temperature upon arrival at the resting stalls [31]. Obviously, this condition can be recognized without the aid of a thermal imaging camera, but we can envision the use of such a device on large groups of pigs that are stunned and sent to the rest areas, which are rooms with uncomfortable environment conditions, such as high levels of temperature and relative humidity.
Several studies have been conducted on the use of infrared thermography to predict the final quality of pork meat. Postmortem, Gariepy [32] assessed the quality of pork meat in pigs having high temperature values collected by thermography before the stunning. Based on color and water retention, the assessed pork meat has been classified as PSE (pale, soft, exuding), normal and DFD (dark, firm and dry). The thermographic values collected in vivo did not allow the prediction of PSE or DFD meat, but as the surface temperature of the back of the examined pigs increased, so did the frequency of flaws related to meat quality.
Lawrence et al. [33] carried out the following experiment: they have classified animals as “warm” or “normal” based on the temperature of their lumbar region measured with a thermographic camera, after having kept pigs at the slaughterhouse for some variable time span. The group of pigs kept in the rest area for a time span of 1 to 4 hours, the “warm” ones, had a lighter muscle color, while no difference in pH and water retention rates has been detected. In the group of pigs kept in the rest area for one night (12 to 16 hours), any difference in meat quality, both for “warm” and “normal” pigs, had disappeared. Pigs recovery from the previous stress, before the stunning, has reduced any difference among animals, and consequently, the effectiveness of thermography in predicting meat quality.
Schaefer [34] studied the use of thermography in measuring the surface temperature of those pigs being exempt, heterozygous and homozygous for the recessive allele of the Halothane gene. Images have framed the back and side surface of pigs kept in the rest area and on the outer and inner median of the midsection, 45 minutes after their death. Although the thermographic analysis showed no differences between genotypes, small localized areas with higher temperatures were observed on the dorsal surface of homozygous pigs for the recessive allele of the Halothane gene. Regardless of the genotype, pigs having lower average temperatures on the side tended to have meats with worse retention and lighter color. From this test, the need emerged for the identification of the most important anatomical parts on the animal’s body, the most useful temperature ranges for thermal imaging, and the most appropriate environment and handling conditions, suitable for a more effective use of infrared thermography in predicting pork meat quality.
Due to the complexity of conditions where a thermographic shooting can be carried out, its definition is still undergoing some evaluations. Lately, Rocha et al. [35] have tried to single out the best spots on pigs body for the thermographic shootings that aim at identifying the widest temperature variations on the skin surface, as a result of two different handling ways from stable to ramp (calm or rude), and consequent upon a 40-minute transportation. During this test, beside the use of the thermal camera, some stress indicators such as salivary cortisol rate, heart rate and rectal temperature have been used. The temperature measured in the orbital region is more sensitive to physical activity than the rectal one because of the different dissipation rate between internal and surface temperatures. The parasympathetic system reduces the gastrointestinal activity by decreasing the blood flow toward the intestinal tract, probably because of the vasoconstriction of the rectal wall in contrast to the orbital region.
The orbital regions and the one located at the posterior base of the ear have shown the best correlation coefficients with the salivary cortisol (r = + 0.49 e r = + 0.50, respectively), proving to be the most reliable spots to measure the body surface temperature. However, because of the low or moderate correlations with other physiological indicators, the Authors have concluded that thermography cannot be used as the sole tool for assessing the physiological conditions of pigs in response to stress and it needs to be complemented by other indicators in order to have a reliable assessment of the status of pigs after pre-slaughter handlings.
Similarly to the study by Lawrence, Dikeman et al. [36] used thermography to identify pigs having a warmer or cooler-than-normal surface skin temperature during the pre-slaughter rest. Over 500 pigs in various environment conditions ranging from -2° to + 26° C have been tested. When the environment temperature ranged between + 6° and +14° C, the “warm” pigs, having their temperature 1.3 standard deviations above average, had a kind of meat with lower water retention rates, while “cold” pigs, having their temperature 1.3 standard deviations below average, had the same fault, yet with a range of environment temperature between +21° and +26° C. Within the lowest temperature ranges, between -2° e -1° C, no differences have been detected in the meat quality belonging to the two groups of animals. The outcome of this study suggest that thermography may indeed play a role in predicting final meat quality, but its effectiveness is highly dependent on the environment conditions under which it operates.
Nanni Costa et al. [37] have considered the possibility of using thermography on the slaughter line to assess the quality of hams intended for their transformation into PDO hams. Images have been recorded 20 minutes after the stunning and a square area located in the center of the caudal surface of the thigh has been scanned. Beside the measurements to assess the quality of the Semimembranosus muscle, such as pH and color, another assessment was made on the thighs being trimmed for fat layer and for the identification of vein defects and reddened skin. The temperature of both hams was found to be very similar and unrelated to changes in pH and color of the muscle examined. Vein defects and reddened skin too have not shown any connection to thighs temperature. Conversely, the surface temperatures of thighs were different according to their fat layer. Those with a lighter fat layer showed higher temperatures, while those with a heavier fat layer have shown the lowest temperatures, because of the insulating effect of the fat layer around the thigh. The relationship between fat layer and surface temperature suggests that thermography could be a valuable, fast and noninvasive method to estimate the degree of adiposity.
4. Conclusion
Thermographic applications in pig farming include all stages of animal husbandry and management, from insemination of sows to slaughter of fattening pigs. The versatility typical of this technique is a great plus in finding useful applications in animal husbandry, but its use necessarily requires the knowledge of the principles on which it is based and the physiological phenomena it is meant to detect. Thus, it is not a technique that can be used in all contexts and that is valid for all conditions, even if can make a remarkably contribute in identifying important physiological phenomena. Certainly in the near future, other applications will be suggested, and the decrease in the cost of sensors will allow its integration into precision systems that can be adopted for the swine field.
Author Contributions
V.R. and L.N.C. visualized the concept and drafted the article. M.Z., P.M. and F.L. revised the content according to their expertise. All authors have read and agreed to the published version of the manuscript.
Institutional Review Board Statement
Not applicable
Informed Consent Statement
Not applicable.
Conflicts of Interest
The authors declare no conflicts of interest.
References
- Zheng, S.; Zhou, C.; Jiang, X.; Huang, J.; Xu, D. Progress on Infrared Imaging Technology in Animal Production: A Review. Sensors 2022, 22, 705. [Google Scholar] [CrossRef] [PubMed]
- McManus C.; Tanure C.B.; Peripolli V.; Seixas L.; Fischer V.; Gabbi A.M.; Menegassi S.R.O.; Stumpf M.T.; Dias G.J.; Costa J.B.G. (2016). Infrared thermography in animal production: An overview. Computers and Electronics in Agriculture, Volume 123, April 2016, Pages 10-16. [CrossRef]
- Guevara RD, Pastor JJ, Manteca X, Tedo G, Llonch P (2022) Systematic review of animal-based indicators to measure thermal, social, and immune-related stress in pigs. PLOS ONE 17(5): e0266524. [CrossRef]
- Yin M.; Ma R.; Hailing L.; Jun L.; Zhao Q.; Zhang M. (2023). Non-contact sensing technology enables precision livestock farming in smart farms. Computers and Electronics in Agriculture, Volume 212, September 2023, 108171. [CrossRef]
- Soerensen D. D., Clausen S., Mercer J. B., and Pedersen L. J. (2014). Determining the emissivity of pig skin for accurate infrared thermography. Computer Electronic Agriculture, 109, 52–58.
- Lengling, A.; Alfert, A.; Reckels, B.; Steinhoff-Wagner, J.; Büscher, W. (2020). Feasibility Study on the Use of Infrared Thermography to Classify Fattening Pigs into Feeding Groups According Their Body Composition. Sensors, 20, 5221.
- Scolari S., Evans R., Knox R., Tamassia M., Clark S. (2009). Determination of the relationship between vulvar skin temperatures and time of ovulation in swine using digital infrared thermography. Reproduction, Fertility and Development, 22, 178-178.
- Scolari S., Clark S., Knox R., Tamassia M. (2011). Vulvar skin temperature changes significantly during estrus in swine as determined by digital infrared thermography. Journal of Swine Health Production, 19, 151-155.
- Simões V., Lyazrhi F., Picard-Hagen N., Gayrard V., Martineau G., Waret-Szkuta A. (2014). Variations in the vulvar temperature of sows during proestrus and estrus as determined by infrared thermography and its relation to ovulation. Theriogenology, 82, 1080-1085.
- Sykes D.J., Couvillion J.S., Cromiak A., Bowers S., Schenck E., Crenshaw M., Ryan P.L. (2012). The use of digital infrared thermal imaging to detect estrus in gilts. Theriogenology, 78, 147-152.
- Lee J.H., Lee D.H., Yun W., Oh H.J., An J.S., Kim Y.G., Kim G.M., Cho J.H. (2019). Quantifiable and feasible estrus detection using the ultrasonic sensor array and digital infrared thermography. J Anim Sci Technol. 61(3):163–169.
- Schmitt O., Reigner S., Bailly J., Ravon L., Billon Y., Gress L., Bluy L., Canario L., Gilbert H., Bonnet A., Liaubet L. (2021). Thermoregulation at birth differs between piglets from two genetic lines divergent for residual feed intake. Animal. 15(1).
- Muns R., Nuntapaitoon M., Tummaruk P. (2016). Non-infectious causes of pre-weaning mortality in piglets. Livestock Science, 184, 46-57.
- Llamas Moya, S., Boyle L.A., Lynch P.B., Arkins S. (2006). Influence of teeth resection on the skin temperature and acute phase response in newborn piglet. Animal Welfare, 15, pp. 291-297. [CrossRef]
- Tabuarici P., Bunter K.L., Graser H.-U. (2012) Thermal imaging as a potential tool for identifying piglets at risk. AGBU Pig Genetics Workshop, 24–25 October 2012, Armidale, Australia, pp. 23-30.
- Herpin, p., Damon m., Le Dividich J. (2002). Development of thermoregulation and neonatal survival in pigs. Livestock Production Science, Volume 78, Issue 1, Pages 25-45. [CrossRef]
- Schmitt O., O’Driscoll K. (2021). Use of infrared thermography to noninvasively assess neonatal piglet temperature. Translation Animal Science, 5, (1), 1-9.
- Johnson, S.R., Dunbar M.R. (2010). Infrared thermography: its use and application for detecting infectious diseases in wildlife and domestic animals. In: InfraMation 2010 Proceedings: 2010; Las Vegas. 2010. p. 102-1–8.
- Bashiruddin, J.B., Mann J., Finch R., Zhang Z., Paton D. (2006). Preliminary study of the use of thermal imaging to assess surface temperatures during foot-and-mouth disease virus infection in cattle, sheep and pigs. Report of the 2006 Session of the Research Group of the Standing Technical Committee of the European Commission for the Control of Foot-and-Mouth Disease (Appendix 46), 2006 17–20 October; Paphos, Cyprus. Rome: Food and Agriculture Organization; 2006. p. 304–8.
- Wendt M., Eickhoff K., Koch R. (1997). Die Messung der Hauttemperatur als Methode zur Erkennung fieberhaft erkrankter Schweine. Deut. Tierarztl. Woch., 104, 29-33.
- Loughmiller J.A., Spire M.F., Dritz S.S., Fenwick B.W., Hosni M.H., Hogge S.B. (2001). Relationship between mean body surface temperature measured by use of infrared thermography and ambient temperature in clinically normal pigs and pigs inoculated with Actinobacillus pleuropneumoniae. American Journal Veterinary Research, 62, 676-681.
- Friendship R., Poljak Z., McIntosh K. (2009). Use of infrared thermography for early detection of disease causing sudden death in a swine finishing barn. Proceedings of the 28th Annual Centralia Swine Research Update, 28th January 2009, Ontario, Canada, pp. I27-I28.
- Loughmiller J.A., Spire M. F., Tokach M. D., Dritz S.S., Nelssen., J. L., Goodband R. D., Hogge S. B. (2005). An Evaluation of Differences in Mean Body Surface Temperature with Infrared Thermography in Growing Pigs Fed Different Dietary Energy Intake and Concentration. Journal of Applied Animal Research, 28, 73-80.
- Cook N., Chabot B., Liu T, Froehlich D., Basarab J., Juarez M. (2020) Radiated temperature from thermal imaging is related to feed consumption, growth rate and feed efficiency in grower pigs. Journal of Thermal Biology, 94, 102747.
- Lengling A, Alfert A, Reckels B, Steinhoff-Wagner J, Büscher W. Feasibility Study on the Use of Infrared Thermography to Classify Fattening Pigs into Feeding Groups According Their Body Composition. Sensors (Basel). 2020 Sep 13;20(18):5221. [CrossRef] [PubMed]
- Magnani D, Gatto M, Cafazzo S, Stelletta C, Morgante M, Costa L. (2011). Difference of surface body temperature in piglets due to the backtest and environmental condition. In: Animal Hygiene and Sustainable Livestock Production. Proceedings of the XVth International Congress of the International Society for Animal Hygiene. Vienna, Austria: Tribun EU. (2011). p. 1029–1032.
- Boileau, A., Farish M., Turner S.P., Camerlink I. (2019). Infrared thermography of agonistic behaviour in pigs. Physiology & Behavior, 210,112637.
- Nanni Costa, L., Redaelli V., Magnani D., Cafazzo S., Amadori M., Razzuoli E., Verga M., Luzi F. (2012). Preliminary study on the relationship between skin temperature of piglet measured by infrared thermography and environmental temperature in a vehicle in transit, in: Veterinary Science. Current Aspects in Biology, Animal Pathology, Clinic and Food Hygiene, Berlin, Springer-Verlag, 2012, pp. 193 - 198.
- Warriss P., Pope S., Brown S., Wilkins L., Knowles T. (2006). Estimating the body temperature of groups of pigs by thermal imaging. Veterinary Record, 158, 331–334.
- Weschenfelder A.V., Saucier L., Maldague X., Rocha L.M., Schaefer A.L., Faucitano L. (2013). Use of infrared ocular thermography to assess physiological conditions of pigs prior to slaughter and predict pork quality variation. Meat Science, 95, 616-620.
- Flores-Peinado, S., Mota-Rojas D., Guerrero-Legarreta I., Mora-Medina P., Cruz-Monterrosa R., Gómez-Prado J., Hernández M.G., Cruz-Playas J., Martínez-Burnes J. (2020). Physiological responses of pigs to preslaughter handling: infrared and thermal imaging applications, International Journal of Veterinary Science and Medicine, 8:1, 71-84.
- Gariepy C., Amiot J., Nadai S. (1989). Ante-mortem detection of PSE and DFD by Infrared Thermography of pigs before stunning. Meat Science, 25, 37-41.
- Lawrence, T. E., Spire, M. F., Dikeman, M. E., Hunt, M. C., Hogge, S. B., James B. W. (2001). Utilizing Infrared Thermography to Predict Pork Quality. Swine Day, 2001, 131-134.
- Schaefer, A.L.. D. M. Jones, A. C. Murray, A. P. Sather, and A. K. W. Tong. 1989. Infrared thermography of pigs with known genotypes for stress susceptibility in relation to pork quality. Canadian Journal of Animal Science, 69, 491–495.
- Rocha L.M., Devillers N., Maldague X., Kabemba F.Z., Fleuret J., Guay F., Faucitano L. (2019) Validation of anatomical sites for the measurement of infrared body surface temperature variation in response to handling and transport. Animals, 9, 425.
- Dikeman, M., Spire, M., Hunt, M., Lowak, S., 2003. Infrared Thermography of Market Hogs as a Predictor of Pork Quality. National Pork Board. Research ReportNP B #02-025, pp. 1-9.
- Nanni Costa, L., Stelletta C., Cannizzo C., Gianesella M., Lo Fiego D.P., Morgante M. (2007). The use of thermography on the slaughter-line for the assessment of pork and raw ham quality. Italian Journal of Animal Science, 6 (Supplement 1), 704 – 706.
Figure 1.
Infrared image of a sow’s vulvar area shows a temperature of 39.07°C at point A.
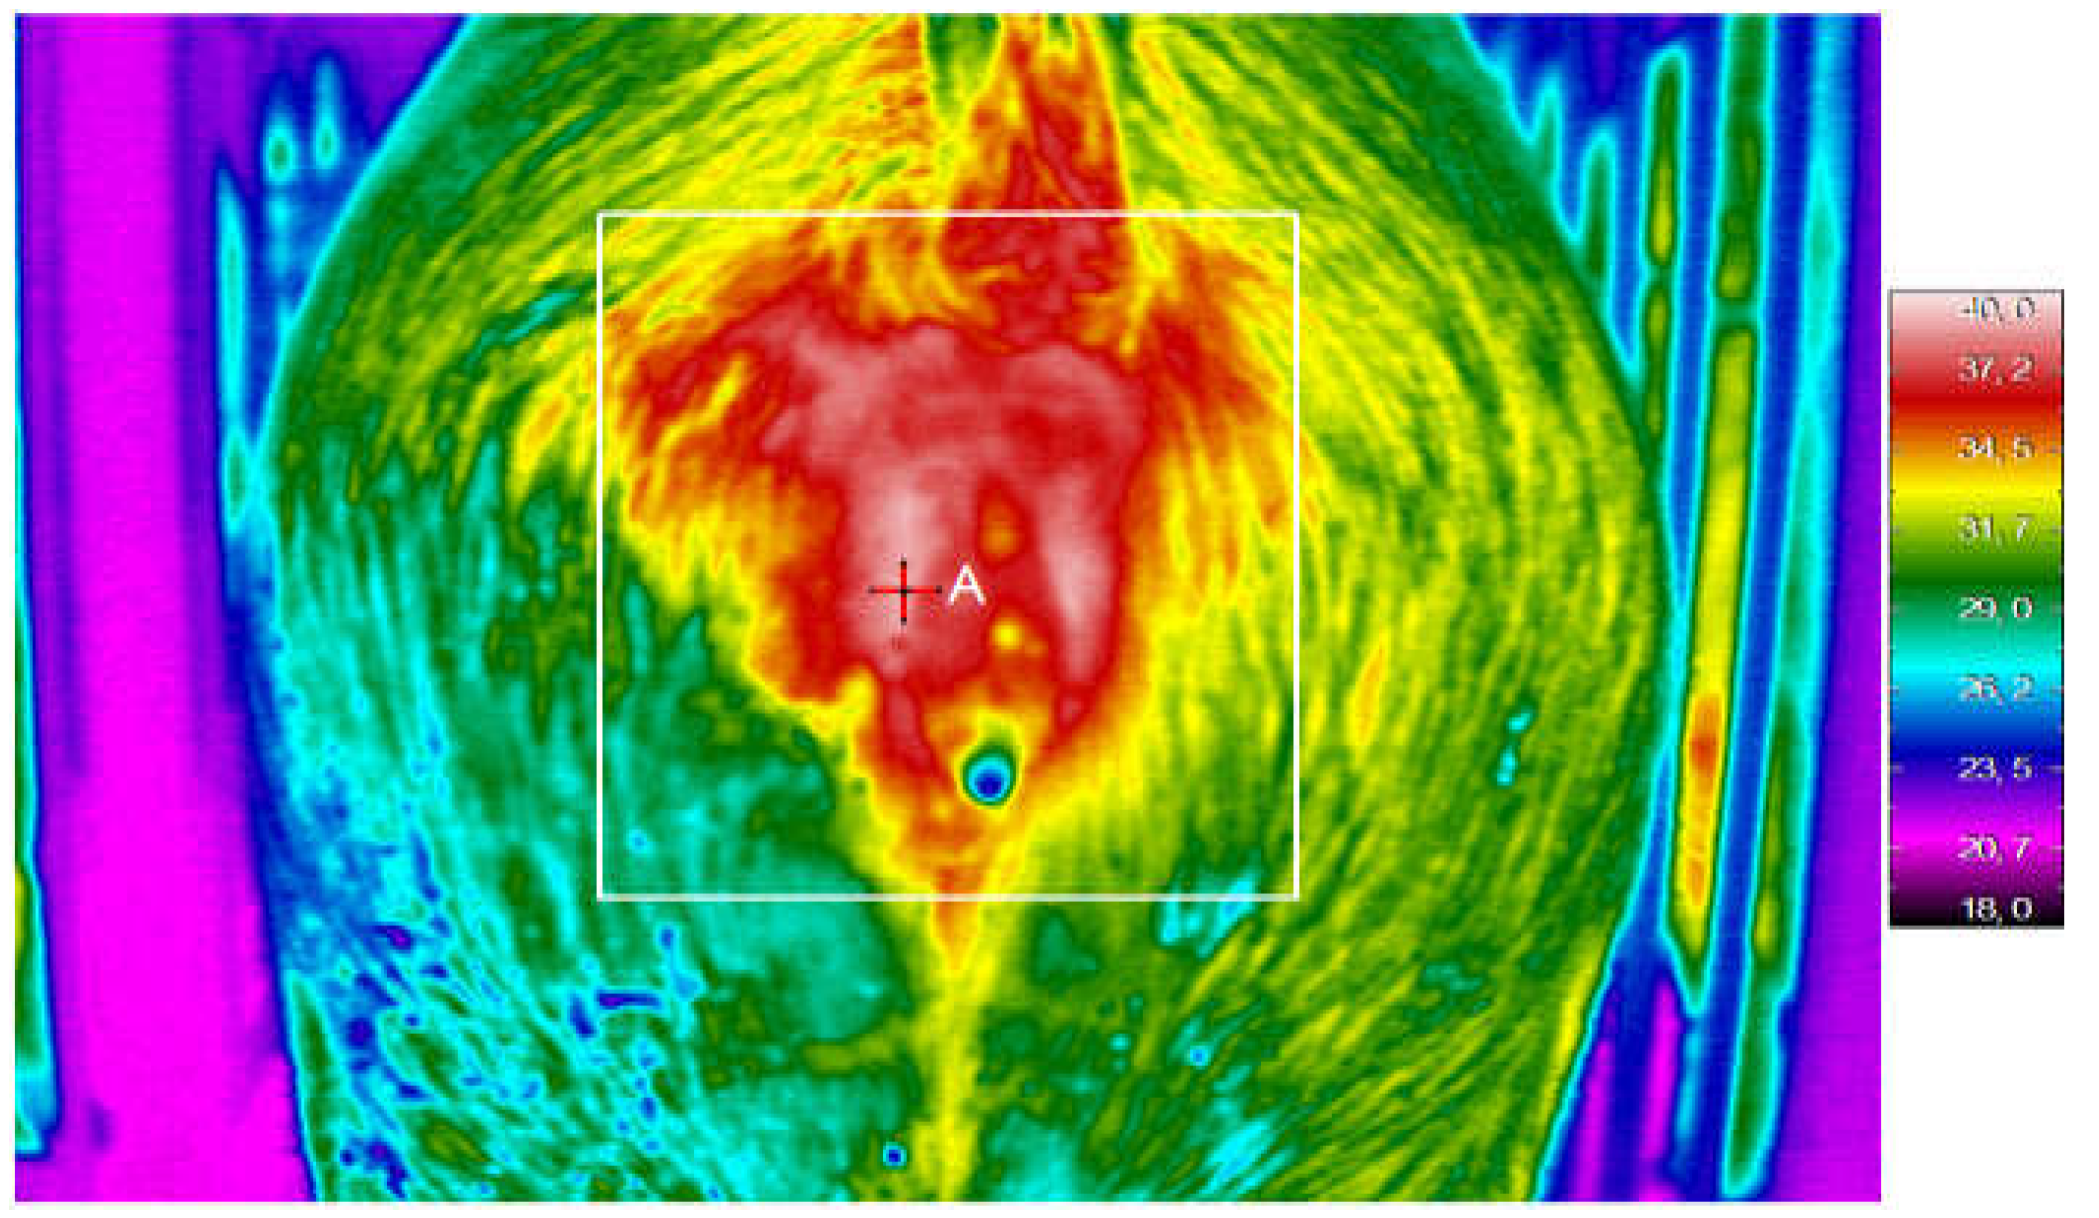
Figure 3.
The infrared image shows the skin temperature of some piglets and the environment during a long transport.
Figure 3.
The infrared image shows the skin temperature of some piglets and the environment during a long transport.
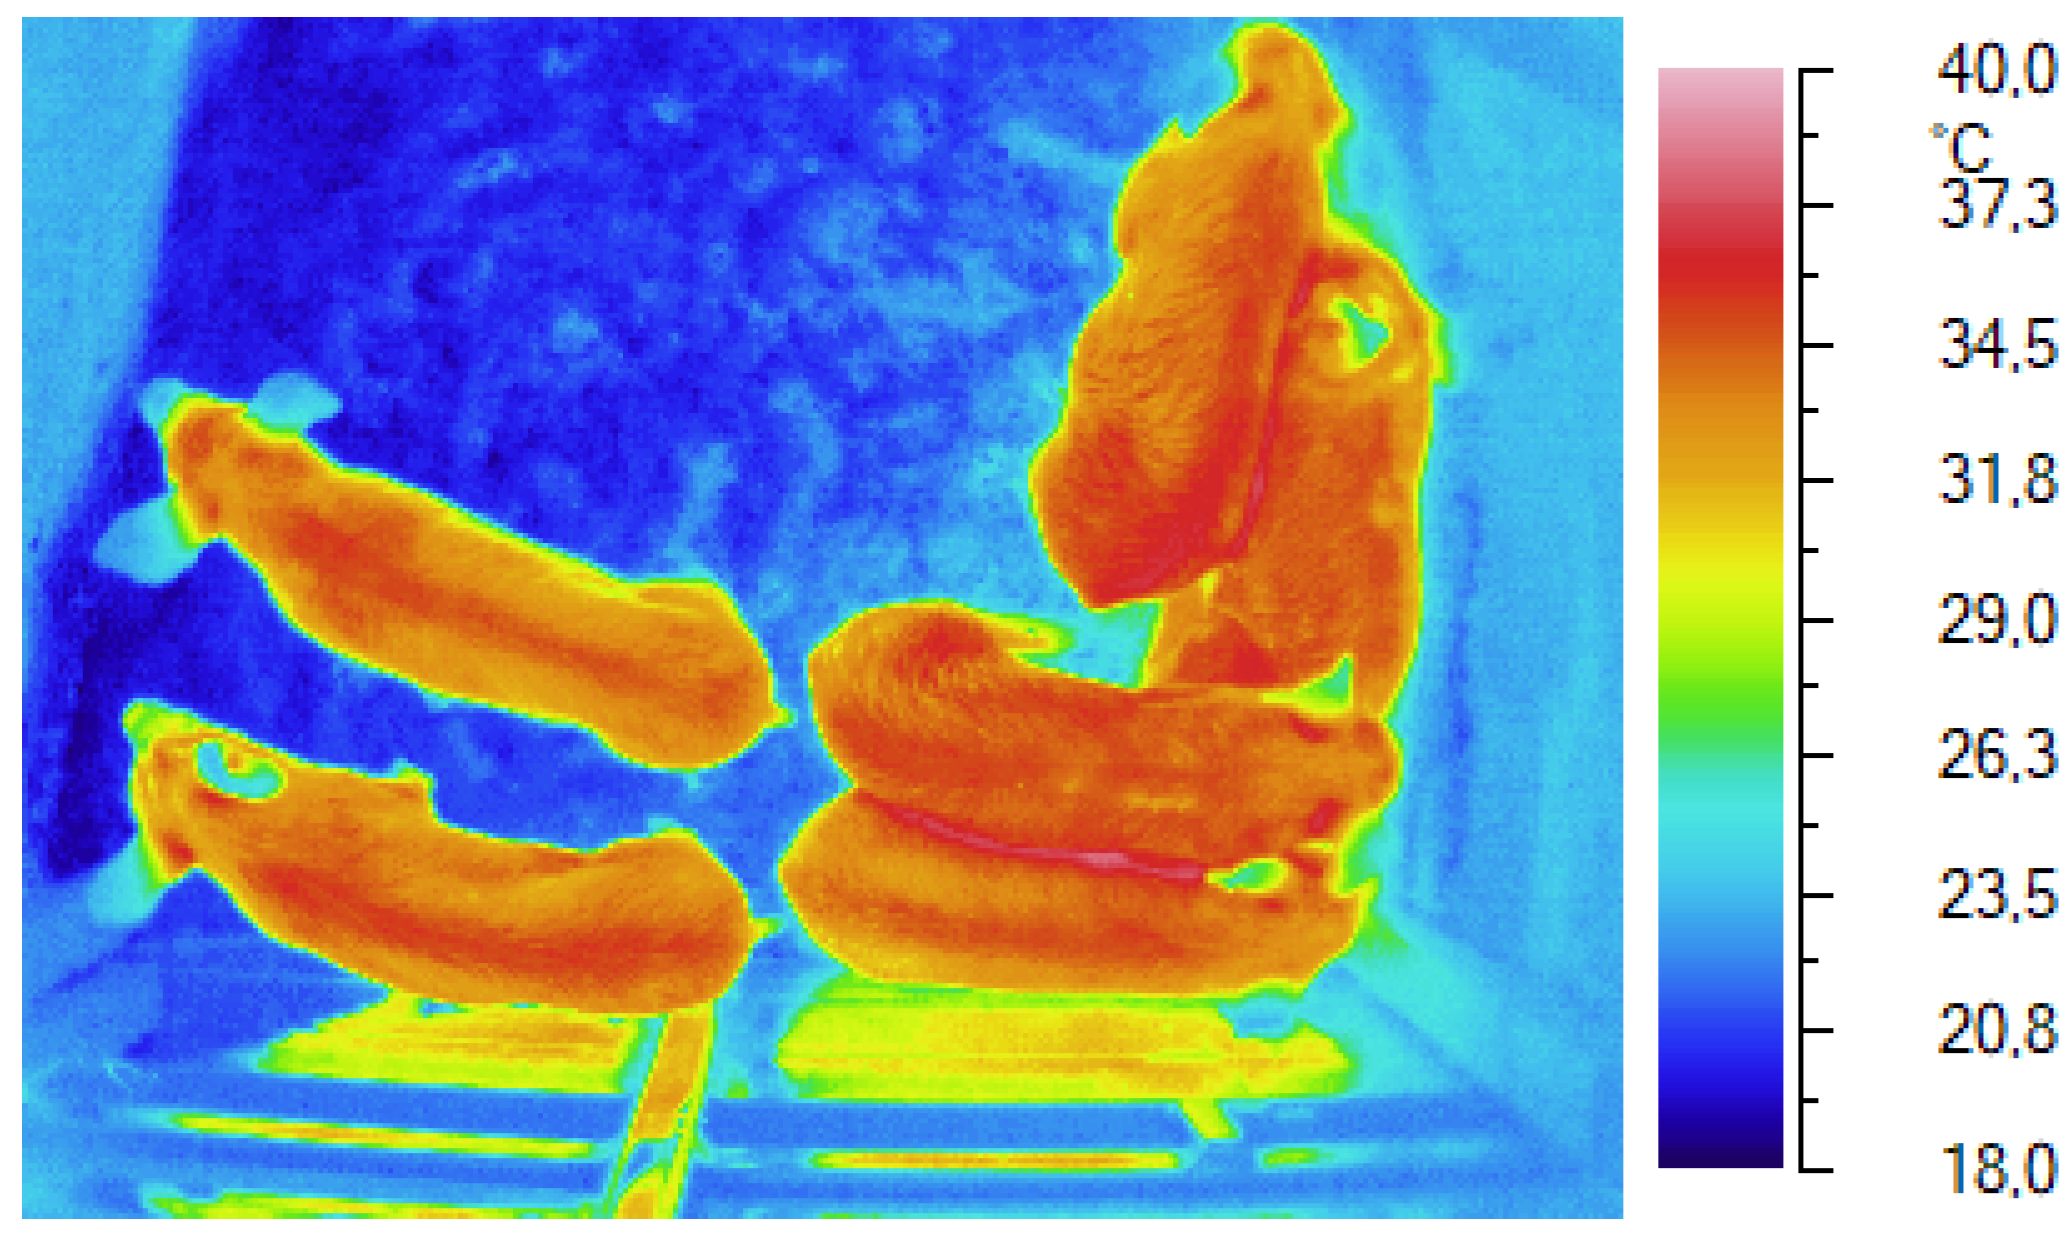

Table 1.
An overview of the thermography technique applications in pig farming.
| Application | Area of interest | References | |
|---|---|---|---|
| Enhance production | Oestrus Detection | Vulvar, Body, Eye | [7,8,9,10,11] |
| Neonatal mortality reduction | Dorsal, Body, Eye | [12,13,14,15,16,17] | |
| Growing pig efficiency | Dorsal, Eye, Body | [23,24,25] | |
| Meat quality prediction | Dorsal, Body, Eye | [30,33,34,36,37] | |
| Enhance animal welfare | Fever or diseases early detection | Eye, Ear, Body | [18,19,20,21,22] |
| Interaction or restraint stress assessment | Dorsal, Eye, Ear | [26,27,31,35] | |
| Environmental stress assessment | Dorsal, Eye, Ear | [21,28,29] |
Table 2.
Factors to pay attention that may alter the correct measurement of skin temperature on animals.
Table 2.
Factors to pay attention that may alter the correct measurement of skin temperature on animals.
| Individual variables | Skin emissivity |
| Body condition score | |
| Coat alterations | |
| Stress or disease | |
| Individual physiological variability | |
| Outer variables | Physical efforts |
| Kind and time of Feeding | |
| Timetable of the surveys | |
| Dirt, sweat or moisture on the skin | |
| Solar radiation or other heating sources nearby | |
| Wind | |
| Environmental temperature and humidity |
Disclaimer/Publisher’s Note: The statements, opinions and data contained in all publications are solely those of the individual author(s) and contributor(s) and not of MDPI and/or the editor(s). MDPI and/or the editor(s) disclaim responsibility for any injury to people or property resulting from any ideas, methods, instructions or products referred to in the content. |
© 2024 by the authors. Licensee MDPI, Basel, Switzerland. This article is an open access article distributed under the terms and conditions of the Creative Commons Attribution (CC BY) license (http://creativecommons.org/licenses/by/4.0/).
Copyright: This open access article is published under a Creative Commons CC BY 4.0 license, which permit the free download, distribution, and reuse, provided that the author and preprint are cited in any reuse.


