
Submitted:
17 May 2024
Posted:
19 May 2024
You are already at the latest version
Abstract
Seed potato treatment is vital for plant protection, yield enhancement, and product quality. In the conducted research, the plant biostimulator Supporter was applied to evaluate its impact on potato yields. Field studies were conducted in Northeastern, Northwestern, Western, and Southwest Poland from 2015 to 2017, using a randomized complete block design with a split-plot arrangement. The use of seed treatment technology with the Supporter product resulted in increased overall and commercial potato yields and improved yield tuber structure compared to traditional cultivation methods without tuber treatment before planting. Conclusion: The application of the plant biostimulator Supporter in seed potato treatment technology brings significant benefits, including, increased potato yield and improved yield structure. The cultivation location significantly influences potato yield and tuber structure. Understanding these differences can aid in better adapting cultivation practices and selecting varieties to specific local conditions, potentially leading to increased potato crop productivity. In terms of efficiency and yield quality, further research into its application in agricultural practice is recommended, which may contribute to further increasing potato production efficiency and quality. Developing more ecological and efficient farming practices can help meet society's growing food needs.
Keywords:
seed potato treatment
; potato yield
; plant biostimulators
; tuber structure
; cultivation location
; agricultural practice
; efficiency
; farming
; food production
1. Introduction
Potato (Solanum tuberosum L.) is a crop plant that, alongside wheat, rice, and maize, significantly contributes to the world's food supply [1]. Seed material is a fundamental element in plant production. Its high quality is one of the key factors in achieving high and good-quality potato yields [2]. Therefore, its preparation, including enhancement before planting, is crucial. Traditional methods of preparing seed material include techniques such as sorting and fractionation of tubers [3], stimulation or chitting [4], treating them against diseases and pests [5,6], and various chemical and physical treatments. The aim of enhancing the material is to improve its energy and germination vigor and to reduce variability in physical, physiological, and morphological traits [7]. Thanks to these fairly complex technologies, better plant growth and development are noticeable even in the next generation [8].
Chemical seed treatment of potato tubers involves subjecting them to the action of chemical agents, called seed treatments, in the form of dust or by soaking them in a solution of these agents [9]. Dry dusting of tubers is the oldest and cheapest method of tuber protection, involving applying a chemical substance in powder form to the surface of seed potatoes. This is most commonly done in stationary devices, where the appropriate dose of the substance is sprinkled onto a measured portion of seed potatoes and then thoroughly mixed. However, a drawback of this method is its low effectiveness due to poor coverage of the potato surface with the treatment. Wet seed treatment in the form of foam is a safer method that limits the amount of treatment used but requires the presence of a specialized seed treater located on a planter [10]. The foam substance is dosed into the hopper, where each seed potato is covered with a layer of foamy treatment. An advantage of this method is the minimal amount of active substance used. Additionally, its good adhesion prevents active substance loss, and the surrounding environment is not exposed to contact with it [11]. Another important parameter in this application method is the amount of treatment applied to the potato surface; too little may not provide sufficient potato protection, while too much may delay or even prevent emergence.
As seed treatments, plant biostimulants or growth bioregulators can be used. Biostimulants are products that improve plant growth or plant quality by enhancing (a) nutrient use efficiency, (b) tolerance to abiotic stresses, (c) qualitative traits, or (d) nutrient availability in the soil or rhizosphere. They are regulated by the European Union regulation on fertilizing products [12]. According to this regulation, the effects declared by the manufacturer must be relevant for the plants listed on the label. The literal text reads: "A plant biostimulant must elicit the effects claimed on the label for the plants specified therein" [13,14]. The definition of plant biostimulants is based on statements [15,16], indicating that it is the product's function, rather than its composition, that defines it as a biostimulant. Therefore, demonstrating that a product is indeed a biostimulant, acting in good faith, depends on proving its efficacy. However, this should not be confused with providing a specific level of effectiveness. Under no circumstances should the introduction of a biostimulant to the EU market be considered a guarantee of effectiveness under all conditions, as many factors can influence the performance of a biostimulant in the field.
One of the biostimulants recommended for treating potato seed tubers is Supporter. This biostimulant is an agricultural product designed to support plant growth and development and increase their resistance to environmental stresses [17]. It typically contains a mixture of active ingredients such as amino acids, vitamins, micronutrients, and metabolism-stimulating substances. The advantages of this biostimulant include enhancing plant resistance to diseases, pests, and environmental stress, thereby contributing to better yields. Regular use of the biostimulant can improve crop quality by increasing nutrient content and substances affecting aroma and taste [17,18]. Another advantage is the increased tolerance to extreme conditions. Plants treated with the biostimulant may be more resistant to adverse environmental conditions such as drought, high temperatures, or soil salinity. Additionally, its liquid form facilitates application through spraying or watering. Therefore, the aim of the research was to evaluate the impact of the biostimulant Supporter on the overall yield and commercial yield of potato tubers and their structure. This can be justified from several perspectives, such as:
The need to increase the efficiency of plant production, as modern agriculture imposes increasingly high demands on productivity and production quality. Research into new technologies, such as the use of plant biostimulants, aims to find ways to improve crop cultivation efficiency and increase yields.
Sustainable agricultural development: Biostimulants, such as Supporter, may contribute to more sustainable agricultural development by reducing the use of chemical substances potentially harmful to the environment and decreasing dependence on chemical pesticides and fertilizers.
Improving plant resistance: Research on the effect of the Supporter preparation on plant growth and development can provide information on its ability to increase plant resistance to environmental stresses such as drought, diseases, or pests.
In recent years, there has been increased interest in research on plant biostimulants, but studies on the Supporter product are seldom undertaken. Therefore, the conducted research aims to fill this gap in knowledge about biostimulants.
Therefore, an alternative research hypothesis was proposed in relation to the null hypothesis:
Alternative hypothesis (H1): The use of the biostimulant Supporter significantly increases potato tuber yield and improves the quality of yields by increasing the proportion of commercial tubers in the yield and increasing plant tolerance to environmental stresses.
Null hypothesis (H0): The use of the biostimulant Supporter has no significant effect on potato tuber yield and its structure.
2. Materials and Methods
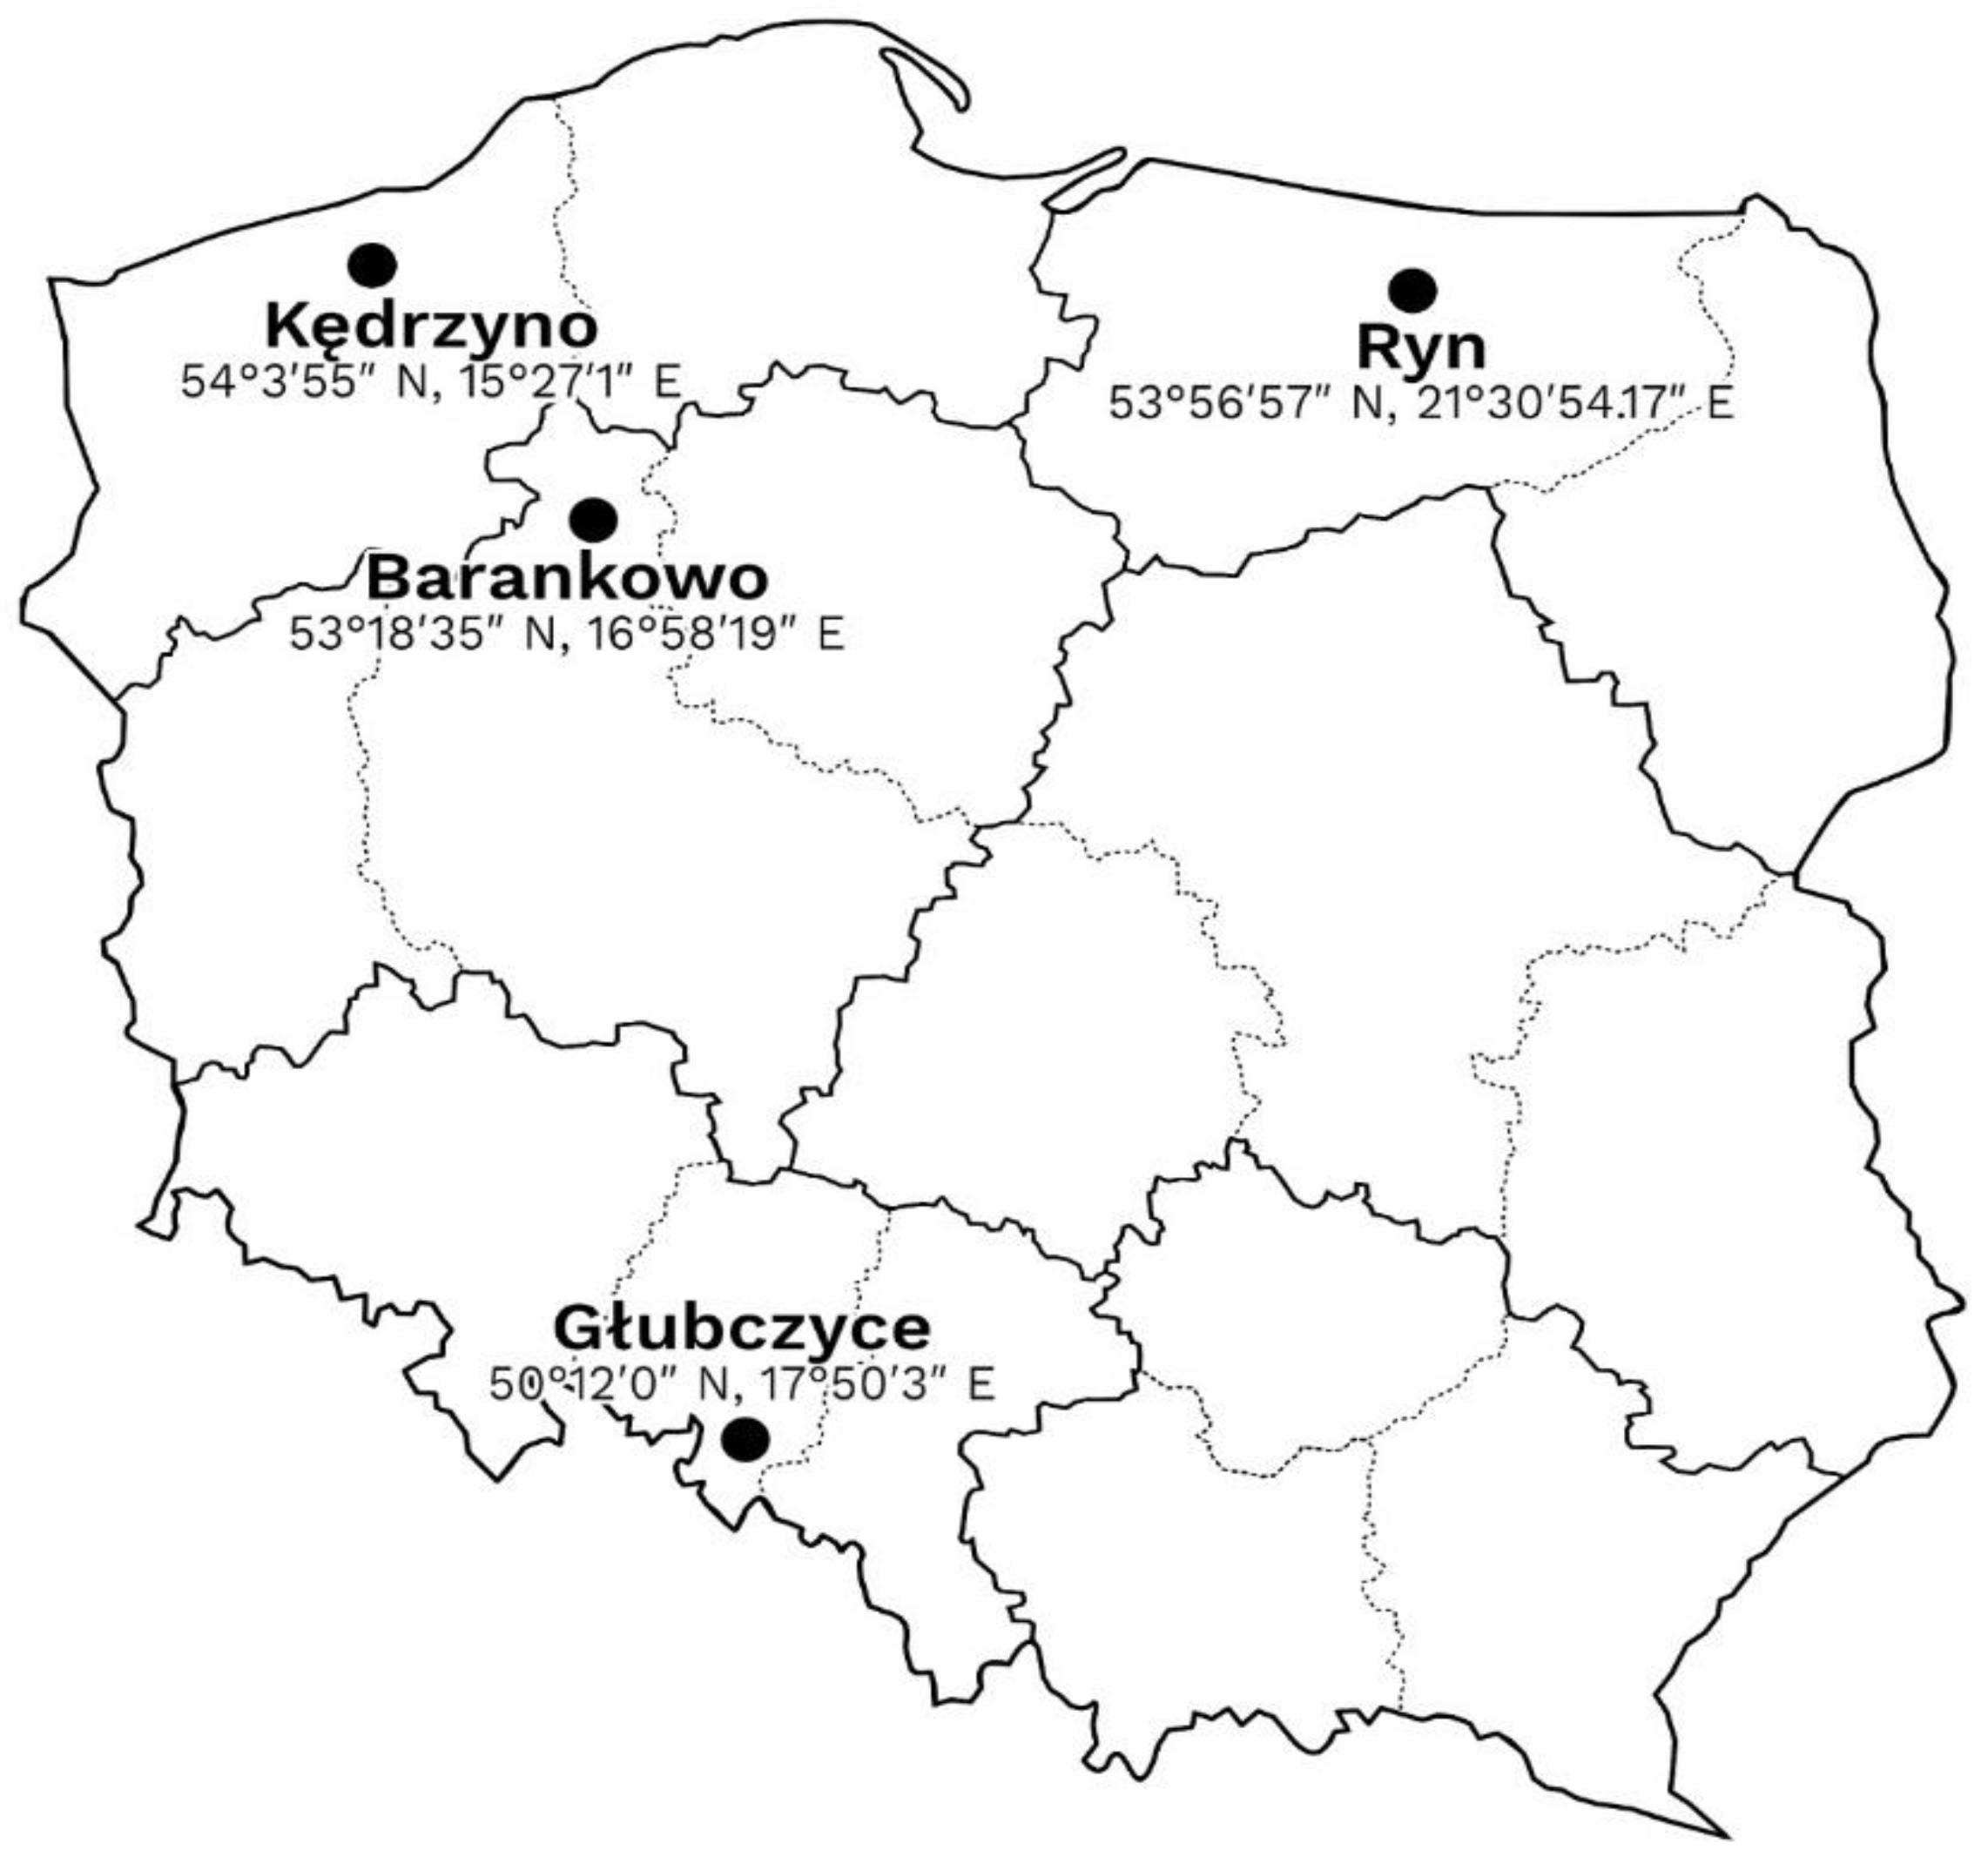
Field studies were conducted between 2015 and 2017 in four locations in Poland (Figure 1).
- -
- Barankowo (Greater Poland Voivodeship) – coordinates: 53°18′35″ N, 16°58′19″ E.
- -
- Głubczyce (Opole Voivodeship) – coordinates: 50°12′0″ N, 17°50′3″ E.
- -
- Kędrzyno (West Pomeranian Voivodeship) – coordinates: 54°3′55″ N, 15°27′1″ E.
- -
- Ryn (Warmian-Masurian Voivodeship) – coordinates: 53°56′57″ N, 21°30′54.17″ E.
Figure 1.
Research location in Poland. Source: own
2.1. Field Research
In the study, three factors were analyzed: cultivation technologies: (a) using the biostimulator Supporter as a seed treatment before planting potatoes, and (b) traditional cultivation, with soaking the tubers in distilled water before planting, as the control treatment; potato varieties ('Innovator', 'Lilly', 'Lady Claire', and 'Verdi'); and locations (Barankowo, Głubczyce, Kędrzyno, Ryn). The experiment was set up using a randomized complete block design with three replications. Tubers were grouted with Supporter mortar using a wet method immediately before planting using a potato treater (Figure 2), applying Supporter at a rate of 300 ml per hectare along with additional water to the basic mixture. Treatment with the Supporter product was carried out using a planter equipped with a treater.
2.2. Potato Cultivation and Protection
The basic activities and care procedures performed in the experiment are presented in Table 1.
The preceding crop for potatoes in all locations and years of the study was spring barley. Both organic and mineral fertilization for potatoes were at the same level (Biennial compost {straw + red clover + hay} – 35 t·ha−1, and 90 kg N·ha−1, 90 kg P·ha−1, 135 kg K·ha−1). The average mineral composition of the compost used in the research was as follows: 520 g of dry matter, 55.6 g of ash, 19.6 g of total nitrogen (N), 0.98 g of mineral nitrogen (N), 3.2 g of phosphorus (P), 32.2 g of potassium (K), 4.9 g of magnesium (Mg), 0.7 g of sodium (Na) per kg of dry matter of compost. Additionally, the compost contained: 0.45 mg of copper (Cu), 1.4 mg of cadmium (Cd), 15.6 mg of chromium (Cr), 7.10 mg of nickel (Ni), 36.2 mg of zinc (Zn), 36.9 mg of manganese (Mn), and 64.3 mg of iron (Fe) per kg of dry matter of compost.
Mineral fertilization was applied in spring in the form of polyphosphate with the composition: 6-20-30 (NPK), (S7), and the remaining nitrogen (N) was applied in the form of urea 46%. To reduce weed infestation in potato plantations, herbicides listed in the current list of plant protection products according to the Institute of Plant Protection – National Research Institute (IPP – NRI) [19] were used. For controlling broadleaf weeds, an herbicide based on the active substance linuron – a compound from the urea derivatives group – 450 g·dm−1 was used. The treatment for controlling broadleaf weeds was carried out directly after planting, just before potato plant emergence, after prior field preparation and harrowing, and in the case of monocotyledonous weeds, the preparation Fusilade Forte 150 EC, at a dose of 1.5 dm·ha−1, based on the active substance fluazifop-P-butyl (a compound from the aryloxy phenoxy group) was used. This treatment was performed from the stage of developing the first pair of leaves by potato plants to the beginning of tuber formation phases or after completing inter-row cultivation before inter-row closure (phase 12-40 on the BBCH scale). To control late blight, fungicides containing the active substances cyazofamid, fluopicolide, mancozeb, mandipropamide, and difenoconazole were used. The occurrence of the potato beetle was limited by using neonicotinoids and pyrethroids. Potatoes were planted in the second half of April at a spacing of 75 × 33 cm. The plot size for harvesting was 25 m2. The seed material was in EU class A, following the standards contained in the regulation of the Minister of Agriculture and Rural Development [20].
Potato harvesting was conducted using an elevator digger, during the technical maturity period of tubers (99° on the BBCH scale) [21], which, for early varieties, occurred in mid-August, and for mid-early varieties, in the first decade of September. During tuber harvesting, the tuber yield was determined, and samples were taken from beneath 10 plants for yield structure determinations, which were classified by fractions: <28, 28-35, 35-50, 55-60, >60 mm in diameter [22]. Marketable tuber yield was defined as the yield of tubers with a diameter >35 mm, excluding those damaged by pests or mechanically to a significant extent, following the requirements contained in the Journal of Laws of the Republic of Poland of November 26, 2014, item 165 [20].
2.3. Characteristics of Potato Varieties
The differences between the varieties concern their earliness (length of the vegetation period) and the color of the flesh, culinary type, starch content and yield. The consumption type of the examined varieties can be defined from B (general utility) to BC (general utility to mealy). The ‘Innovator’ variety is distinguished by the highest yield in COBORU tests [23], while ‘Verdi’ has the highest starch content in tubers. The cultivars ‘Lady Claire’, ‘Innovator’ and ‘Lilly’ had different starch contents (Table 2).
2.4. Characteristics of the Supporter Biostimulator
The full name of the preparation is SUPPORTERR YIELD MODULATOR' Spiess-Urania Chemicals GmbH European Community Trademark, no. 014199475 Figurative mark [18]. The product was introduced to the market on the basis of the Act on Fertilizers and Fertilization of July 10, 2007 - Article 5 [25]. The product Supporter® is not subject to classification and labeling criteria according to Regulation (EC) No 1272/2008 (CLP). Plant growth promoter. Marketed by: CERTIS EUROPE B.V Sp. z o.o. Polish branch, Al. Jerozolimskie, Warsaw, issued on the basis of registration LSN 008304-00/00 obtained in Germany by Spiess-Urania Chemicals GmbH; Frankenstraße 18b; D-20097 Hamburg [18]. This preparation is a yield biostimulator used to treat potato tubers and corn seeds. It contains synthetic amino acids and SL amino acids, which are designed to stimulate the growth and development of plants by optimizing the use of nutrients and developing an efficient root system. Thanks to this, plants become more resistant to environmental stress, such as drought or nutrient deficiency [18].
2.5. Soil Conditions
Each year, before starting the experiment in accordance with PN-R-04031 [26], 20 soil samples were taken as standard from the arable layer (0–20 cm) to create a sample weighing approximately 0.5 kg. These samples were analyzed to determine the granulometric composition of the soil, the content of available forms of phosphorus, potassium and magnesium, soil pH and humus [27]. Soil pH was measured in a suspension of 1 mol KCl dm−3 and in a water suspension using the potentiometric method [28]; available magnesium was determined using the Schachtschabel method [29]; available forms of phosphorus and potassium – by the Egner-Riehm method [30,31]. The humus content was determined using the Tiurin method, adapted by Simakov [32]. Soil pH was measured potentiometrically. Macro- and microelement analysis employed Atomic Absorption Spectrometry (AAS). The results of soil analyzes were compared with standard values provided by the Institute of Fertilization and Soil Science – National Research Institute [33]. Compost assessment involved specific procedures: dry mass, organic matter, and pH were evaluated according to [34] standards, with K, Ca, and Mg determined by PB 27, 2nd edition, 06.04.2009, and N assessed per [34] guidelines, while P was analyzed following PB 26, 2nd edition, dated 26/04/2009.
Mineral nitrogen levels were computed using the methodology outlined by Fotyma et al. [35]. Table 3 shows the content of macroelements (P2O5, K2O, Mg) and the pHKCl reaction in the soil in 2015-2017 in four different towns in Poland: Kędrzyno, Barankowo, Ryn and Głubczyce.
In the village of Kędrzyno, the content of available phosphorus decreased from 24.8 g·kg−1 in 2015 to 17.0 g·kg−1 in 2017, classifying the soils as phosphorus-poor. The content of available potassium ranged from 9.0-18.0 g·kg−1, categorizing it as soil with low to moderate fertility. Meanwhile, the magnesium content increased from 3.4 g·kg−1 in 2015 to 6.2 g·kg−1 in 2017. The soil pH was slightly acidic to neutral [33]. In the village of Barankowo, the available phosphorus content was high, ranging between 25.0 and 31.9 g·kg−1, while the potassium content ranged from 12.4 to 12.7 g·kg−1. The magnesium content ranged from 2.9 to 3.3 mg·kg−1, and the soil pH was slightly acidic [27,33]. In the village of Ryn, located in the northeast of Poland, the phosphorus content was the lowest (1.5-15.0 g·kg−1), with potassium content being average (16-19 g·kg−1), and the soil pH was slightly acidic [27,33]. In the village of Głubczyce, situated in the south of Poland, the phosphorus content ranged from 25.2-27.8 g·kg−1 in the years 2015-2016 to 21.8 g·kg−1 in 2017. The potassium content was high, ranging from 19.1-21.6 g·kg−1, and the magnesium concentration was also high. The soil pH ranged from slightly acidic to neutral [32,33].
The humus content in the examined soils depended on their location. In the case of Kędrzyno, Barankowo, and Ryn, it seemed relatively stable in each year, fluctuating between 1.0-1.4 g·kg−1 of soil. However, in Głubczyce, the humus content was higher compared to the other villages, ranging from 1.6-1.8 g·kg−1 of soil. Nevertheless, a decreasing trend was observed in 2016 and 2017, indicating soil degradation or other factors affecting humus content [27].
The organic matter content in the soil is an important indicator of soil quality as it affects its fertility, structure, water retention capacity, and other essential functions [27]. Lower humus content may indicate soil degradation, which may require appropriate actions such as improving agricultural practices or using soil structure-improving agents and humus conservation methods. Thus, soil analysis revealed variability in the content of macroelements and soil pH in the examined villages and years, which may have significant implications for agricultural cultivation and fertilization, especially for adjusting fertilization to changing soil conditions. The soil conditions in the selected villages were diverse. In Głubczyce, predominantly very good and good soils (wheat-beetroot) of class II prevailed. In Kędrzyno, potatoes were cultivated on podzolic soils formed on loamy clays and clayey sands. In Barankowo, in the western part of the country, potatoes were cultivated on podzolic soils, class IV. In the village of Ryn, in the northeast of the country, the experiment was established on proper brown soils formed from various rocks rich in calcium carbonate [27,36].
2.6. Meteorological Conditions
The study utilized meteorological observation results from COBORU experimental stations located within the research area. The highest rainfall, regardless of the year, was recorded in the West Pomeranian Voivodeship in the town of Kędrzyno (1572.8 mm over 3 years) and in the Opole Voivodeship, in the town of Głubczyce (1147.6 mm). The least rainfall, on the other hand, was recorded in the towns of Ryn (1042.9 mm) and Barankowo (1052.9 mm) (Table 4).
The rainfall level during the growing season in Kędrzyno was highest in 2017 (712.8 mm), while in Głubczyce it was in 2016 (472.3 mm). Kędrzyno is characterized by the highest rainfall totals and relatively lowest air temperatures compared to other locations. The average air temperature during the growing season was highest in Głubczyce, ranging from 15.2-15.9 °C, and lowest in Kędrzyno, ranging from 12.2-14.9 °C (Table 4). In Barankowo and Ryn, the thermal conditions were similar and ranged respectively from 13.4-15.3 °C and 13.8-14.5 °C.
In Barankowo, a significant increase in both rainfall totals and air temperatures during the potato growing season was observed in 2017 compared to previous years. In the town of Ryn, higher rainfall totals were recorded in all years of the study compared to Barankowo, while air temperature remained relatively unchanged. In Głubczyce, the highest average air temperature during the plant growing season was recorded compared to other locations, but rainfall totals remained slightly variable throughout the study period (Table 4).
Additionally, the Sielianinov hydrothermal coefficient values were determined for the potato growing season. This coefficient is a measure of rainfall effectiveness in a given month. Based on these coefficient values, the years 2015 and 2016 in Kędrzyno were classified as fairly humid, while 2017 was classified as very humid (Table 5). In Barankowo, the years 2015 (k = 0.8) and 2016 (k = 1.0) were classified as dry, while 2017 was classified as very humid (k = 1.9). In Ryn (Warmian-Masurian Voivodeship), the year 2015 was considered dry (k = 0.9), 2016 as fairly dry (k = 1.3), and 2017 as fairly humid (k = 1.8). The Sielianinov hydrothermal coefficient allowed the classification of the year 2015 in Głubczyce as very dry (k = 0.7), 2016 as optimal (k = 1.6), and 2017 as humid (k = 2.1) (Table 5). The values of the hydrothermal coefficient for the years 2015-2017 helped to identify regions and months with drier or more humid conditions within the study area. Significant spatial variation in the occurrence of extreme pluviometric conditions was also observed during the study period.
The Sielianinov coefficients for the towns of Barankowo and Ryn exhibited a tendency to remain within the range from dry to humid, with values close to each other. The hydrothermal coefficients for Głubczyce showed the greatest variability, with the lowest values in 2015 and the highest in 2017, indicating significant variation in hydrothermal conditions between years. Kędrzyno demonstrated the highest average values of the hydrothermal coefficient in all three years, suggesting a higher level of humidity compared to the other locations (Table 5).
2.7. Statistical Calculations
The statistical analysis was conducted using SAS 9.2 software [38]. The analyses were based on a three-factor model (years × varieties × technologies). Analysis of variance (ANOVA) was employed, and multiple Tukey's tests were performed to compare means between groups. The significance of the source of variability was assessed using the Fisher-Snedecor test. Tukey's multiple comparison tests enabled detailed comparative analyses, allowing for the identification of statistically homogeneous groups and the determination of the so-called least significant difference. Additionally, descriptive statistics of the studied characteristics were analyzed, and correlation coefficients between the variables were calculated [39].
3. Results
3.1. Total Tuber Yield
The average total tuber yield in the experiment was 40.35 t∙ha−1 (Table 6). Cultivation technologies significantly modified the value of this trait. The use of the Supporter product before potato planting resulted in a significant increase in tuber yield compared to traditional technology, on average by 13.3%. The most productive variety was ‘Lilly’ with an average yield of 47.95 t∙ha−1, while the least productive was the 'Innovator' variety with an average yield of 29.93 t∙ha−1. The varieties ‘Lady Claire’ and ‘Verdi’ proved to be homogeneous in terms of this trait (Table 6).
Meteorological conditions during the study years significantly influenced the total tuber yield. The lowest yields were recorded in the dry 2015, while the highest were in the thermally and precipitationally optimal 2016, with 2017 being homogeneous in this regard (Table 6).
Interaction between technology x variety and variety x year was also observed. Among the tested varieties, ‘Lilly’ responded best to the technology using the biostimulant Supporter. In the dry 2015, the highest yield was obtained by the ‘Lilly’ variety, while in the thermally and humidity optimal year, the ‘Lady Claire’ variety had the highest yield (Table 6).
Geographical location, regardless of experimental factors, had a significant impact on the total tuber yield. The highest value of this trait was found in Głubczyce, located in southern Poland (47.94 t∙ha−1), while the lowest was in Barankowo, located in the northeastern part of the country (29.93 t∙ha−1).
The interaction between research location and cultivation technology also proved significant. The highest positive effect of using cultivation technology with the Supporter biostimulant was noted in Głubczyce, where the difference between the two technologies was 7.05 t∙ha−1, resulting in a 15.9% increase in yield compared to traditional technology. Meanwhile, in Barankowo, where the yield levels were the lowest among all experimental locations, the difference between cultivation technologies was 6.88 t∙ha−1, representing a 26.0% increase in yield compared to traditional technology without pre-planting treatments. In Kędrzyno and Ryn, the yield increase under the influence of the Supporter biostimulant was homogeneous, constituting 7.9% and 7.6%, respectively, compared to traditional technology (Table 7). Thus, the obtained results suggest that in some locations, the technology with Supporter support yields better results on average than traditional technology.
3.2. The Structure of Tuber Yield
The structure of tuber yield depending on all experimental factors is presented in Table 8.
The proportion of individual tuber fractions in the total potato yield varied depending on the cultivation technology, variety, location, and harvest year. Among the individual fractions, only those with transverse diameters of 28–35, 50–55, 55–60, and >60 mm showed a different response to cultivation technologies. Potato plants produced a greater mass of tubers with calibers of 28–35 and 50-55 mm but a smaller mass of larger-sized tubers (55-60 and >60 mm in diameter) under the technology using the Supporter biostimulator (Table 8).
Differences in the proportion of individual tuber fractions were also significant among the tested potato varieties. The 'Verdi' variety seemed to produce a greater mass of tubers with diameters <28 and 35-50 mm compared to other varieties. In contrast, the 'Lilly' variety exhibited the highest proportion of tubers with a diameter of 50-55 mm, while the 'Lady Claire' variety produced the largest mass of the largest tubers in the yield, with calibers of 55-60 and >60 mm. The 'Innovator' variety, however, showed homogeneity compared to the 'Verdi' variety in the production of medium-sized tubers, with a transverse diameter of 35-50 mm (Table 8).
The location of the experiments also significantly influenced the structure of the potato tuber yield. The greatest small-sized tubers were observed in Kędrzyno, located in the northwest of Poland, on soil of IV soil evaluation class, while the largest proportion of large tubers, with diameters of 50-60 and >60 mm, was recorded in Głubczyce, in the south of the country, on soils of I and II evaluation class (Table 8).
Meteorological conditions during the study years significantly modified the caliber of tubers with diameters of 28-35, 35-50, 50-55, 55-60, and >60 mm. A significantly higher proportion of tubers with calibers of 28-35 and 35-50 mm was observed in the dry year of 2015 than in the other years. Conversely, a significantly higher proportion of large tubers, with calibers of 50-55, 55-60, and >60 mm, was noted in years with optimal thermal-humidity conditions. In 2015, tubers with a diameter greater than 60 mm were significantly less numerous than in 2016 and 2017 (Table 8).
Figure 3 illustrates the response of potato varieties to cultivation technology in terms of the proportion of mass of tubers of individual size fractions. The ‘Verdi’ variety responded by increasing the proportion of mass of large tubers with diameters of 50-55 and 55-60 mm in the total yield when using the technology with the Supporter biostimulator. The ‘Innovator’ variety, on the other hand, significantly responded by reducing the proportion of mass of tubers with diameters of 35-50 mm and 55-60 mm to this technology. The ‘Lilly’ variety responded to the technology with the use of the Supporter biostimulator by significantly increasing the proportion of mass of tubers with diameters of 35-50 mm and decreasing the proportion of mass of tubers with diameters of 55-60 mm. The ‘Lady Claire’ variety, in turn, responded by a significant increase in the mass of tubers with diameters of 28-35 mm and a simultaneous significant decrease in the proportion of tubers with calibers of 50-55 and 55-60 mm (Figure 3).
There was no interaction observed between locations and varieties, nor between locations and cultivation technologies. However, overall, these studies allow for an analysis of the influence of various factors on the yield of potatoes with different tuber sizes, which can be helpful in optimizing cultivation processes and selecting the best agricultural practices.
3.3. The Share of Marketable Tubers
The impact of experimental factors on the share of marketable tubers is presented in Figure 4 and Table 9. Tubers suitable for the market, without damage or greening, accounted for an average of 72.34%. Cultivation technologies or years did not significantly differentiate the share of marketable tuber mass in the overall yield. However, the factor significantly modifying this characteristic was the genetic traits of the tested varieties and their interaction with cultivation technologies and years of study. The variety with the lowest share of marketable tubers was ‘Verdi’, while ‘Lady Claire’ had the highest share of mass of these tubers, with ‘Lilly’ and 'Innovator' being homogeneous in terms of this characteristic. The tested varieties showed varied reactions to the applied cultivation technologies. Both traditional and cultivation technologies using the biostimulator Supporter showed the lowest share of marketable tubers with the ‘Verdi’ variety. The tested varieties exhibited varied reactions to the meteorological conditions in the years of study. In 2015 and 2017, the variety ‘Verdi’ had the lowest share of marketable tubers in the yield, while in 2016, it was the ‘Innovator’ variety (Table 9). On the other hand, the highest participation of marketable tubers in the yield, in the dry year of 2015, was observed with the ‘Innovator’ variety, while in the remaining years, it was the ‘Lady Claire’ variety. The ‘Lilly’ and ‘Lady Claire’ varieties were homogeneous in terms of this characteristic (Table 9).
It was also observed that there was an interaction between the research locations and cultivation technologies. In three locations: Kędrzyno, Głubczyce, and Ryn, the cultivation technology using the biostimulator Supporter showed a significant increase in the share of marketable tuber mass compared to traditional cultivation technology. In Barankowo, however, a positive trend towards increasing the share of marketable tubers was noted with the Supporter technology (Figure 4).
3.4. Yield of Marketable Tubers
The yield of marketable tubers was influenced by all experimental factors, but most significantly by the applied cultivation technologies (Table 10). Thanks to the use of the biostimulator Supporter, the marketable yield increased by 20.2% compared to traditional technology. The highest marketable yield was obtained by the 'Lady Claire' variety, while the 'Lilly' variety was homogeneous in terms of this characteristic, and the least productive was the 'Innovator' variety. The highest yield of marketable tubers was achieved in the optimal thermohydrometric year of 2016; the year 2017 was homogeneous compared to 2016, while the lowest yield was obtained in the dry year of 2015 (Table 10).
The varieties ‘Verdi’ and ‘Innovator’ showed different profitability over the years, with some improvement noted in 2017. The ‘Lilly’ variety consistently exhibited high yields throughout all years, regardless of the cultivation technology. The ‘Lady Claire’ variety showed relatively stable yields over the years, with only minor fluctuations.
Significant statistical differences were found in yield between varieties, cultivation technologies, locations, and years. In the case of double interactions, most of these differences were statistically significant. However, triple interactions between technologies, varieties, and years could not be statistically proven, suggesting that the observed variations likely fall within the expected range of natural variability. Therefore, the choice between traditional cultivation methods and those supported by Supporter may depend on factors other than yield, such as profitability, environmental impact, or labor requirements.
The location of the experiment was a significantly influencing factor on marketable yield. It was highest in the Ryn locality (37.21 t∙ha−1), in the northeast corner of Poland, on proper brown soils, while the lowest yield levels were found in the Barankowo locality (22.28 t∙ha−1), where potatoes were grown on the weakest soils, classified as class IV evaluation (Table 11). Additionally, for the Kędrzyno and Barankowo as well as Głubczyce and Ryn localities, the marketable yield was homogeneous (Table 11). The increase in marketable yield after using the growth modulator Supporter was highest in the Barankowo locality, as it amounted to as much as 27.8% compared to traditional technology, while it was lowest in the Ryn locality (increase in marketable yield by 10.8%); with a homogeneous effect observed in the Kędrzyno locality (increase in marketable yield by 11.1% compared to traditional technology). However, no interaction was found between cultivation technologies and experimental locations.
3.5. Variability of Tuber Yield and Its Characteristics
Table 12 provides descriptive statistics for eight variables, including the dependent variable (y) and 8 independent variables (x).
The average values for each variable differ significantly. For example, the mean total tuber yield (y1) is 40.34, while the average shares of tuber mass at different diameters (x2-x6) are significantly smaller. The standard deviation is substantial for most variables, indicating that the data are widely dispersed around the mean. For instance, the standard deviation for total tuber yield (y1) is 10.44. Other variables, such as the shares of tuber mass at different diameters and the commercial yield of tubers, also exhibit varied levels of means, standard deviations, and distributions. Standard errors, on the other hand, are measures of uncertainty in statistical estimates. The larger the standard error, the greater the uncertainty in the estimates. These values are calculated for each variable and can be used to determine the confidence in the estimates. Kurtosis and skewness provide information about the shape and distribution of the data. Positive kurtosis suggests a more peaked distribution, while negative kurtosis indicates a flatter distribution. Skewness measures the asymmetry of the distribution around its mean value. The coefficient of variation (CV), expressed as a percentage, informs us about the degree of variability in the data relative to their mean value. CV values above 100% indicate a high degree of variability.
Overall, these statistics allow for a better understanding of the dataset characteristics, which can be useful during analysis and interpretation of study results.
Skewness and kurtosis are measures of data distribution shape. These values provide information about the asymmetry and "weakness" of the distribution. Most evaluated variables exhibit some skewness and kurtosis, suggesting that the distributions may be somewhat asymmetrical and may contain outliers.
The range for each variable shows the differences between the maximum and minimum values. The range for total tuber yield (y1) is 47.3, indicating significant variability in tuber mass.
Minimum and maximum values provide information about the range of data. For example, the minimum value of total tuber yield is 18.06, and the maximum value is 65.36.
The coefficient of variation (CV) is used to compare the degree of variability between different sets of data. For individual features in the table, the coefficient of variation for each feature can help understand which of these features has relatively greater variability compared to other features. A high coefficient of variation (e.g., above 50%) indicates large fluctuations around the mean, meaning that the data are highly diverse and may be less stable or less certain.
Conversely, a low coefficient of variation (e.g., below 25%) indicates less variability in the data, suggesting that the data are more stable and less diverse around the mean. Therefore, this coefficient provides information about the degree of variability for each feature and is used to compare data stability between different variables. The higher the coefficient, the greater the variability, and the lower it is, the less variability there is. Therefore, Figure 3 provides comprehensive information about the data distribution for dependent and independent variables. Analyzing this data can help understand the dataset characteristics and make decisions in statistical analysis.
The values of simple correlations between variables are presented in Figure 5.
Figure 5 depicts Pearson correlation coefficients between the dependent variable (y) and the independent variables (x). Coefficients close to 1 indicate a strong positive relationship between variables. For example, the correlation coefficients between y1 (total tuber yield) and x1 (commercial yield) and the tuber mass >60 mm diameter are relatively high (0.86 and 0.45, respectively), suggesting a strong positive relationship between these variables. Coefficients close to -1 indicate a strong negative relationship between variables. Correlation coefficients close to zero suggest little or very weak linear relationship between variables.
The Figure 5. shows Pearson's simple correlation coefficients between the dependent variable (y1), representing the total tuber yield, and the independent variables (x1 - x8), representing different elements of yield related to tuber size. The correlation coefficient between y1 (total tuber yield) and x1 (share of tubers <28 mm diameter) was r = -0.15, indicating a weak negative correlation. The correlation coefficient between y1 and x2 (share of tubers 28-35 mm diameter) was -0.29, also indicating a weak negative correlation between these variables. A moderately negative correlation (-0.26) was observed between y1 and x3 (share of tubers 35-50 mm diameter). The correlation coefficient between y1 and x4 (share of tubers 50-55 mm diameter) was positive (r = 0.23), though weak. A moderately strong positive correlation (r = 0.46) was observed between y1 and x5 (share of tubers 55-60 mm diameter). The simple correlation coefficients between total yield and the share of tuber mass >60 mm diameter and the commercial yield of tubers were r = 0.42 and r = 0.28, respectively. The strongest positive correlation was found between total yield and commercial yield of tubers, with a correlation coefficient of r = 0.86.
4. Discussion
4.1. The Impact of Cultivation Techniques on Tuber Yield and Its Structure
Biostimulants are products of natural or synthetic origin containing substances that beneficially affect plant life processes. Seed treatment is considered a key technological procedure in potato cultivation aimed at improving natural soil and environmental conditions. The main advantages of this treatment include protection against early seedling decay caused by fungi, safeguarding tubers against damage and pest feeding, minimizing losses resulting from sudden outbreaks of diseases or pests, and reducing the need for chemical spraying in response to adverse weather conditions [40,41,42,43]. Studies conducted by Deising et al. [41], Cielucha [44], and Wharton et al. [45] have shown that covering seed surfaces with chemical substances not only increases yield but also improves its quality parameters. Additionally, it aids in reducing losses caused by above-ground pests such as the Colorado potato beetle [46].
According to the manufacturer [18], the Supporter preparation works by stimulating the development of the plant's root system, which is particularly important in the early growth stages. The active substances in the preparation meet the nutritional requirements of soil microorganisms, leading to symbiosis in the root zone and intensifying plant growth. Increased potato yields after the application of pre-sowing seed treatments have been observed in both domestic and foreign studies. Treating potato seed tubers with biological preparations, as reported by Orzaliyeva et al. [47], enhances yield by accelerating the pace of plant growth and development, increasing the assimilation surface area, and boosting resistance to potato diseases. Research by Pytlarz-Kozicka and Zagórski [48] showed that the use of Trianum + Proradix WG and Proradix WG seed treatments increased both total and commercial potato yields compared to the control. Studies by Pytlarz-Kozicka and Słabicki [49] evaluating the effects of Prestige 290 FS and Nuprid 600 FS seed treatments also demonstrated their positive impact on potato yields. Gazdanova et al. [50] found that the use of biological preparations increased potato yields, with the highest yield rates observed in the variant with the Biobacterial BisolbiSan. Gleń-Karolczyk et al. [6] also noted an increase in potato yields after treating tubers with Polyversum WP and Serenade ASO preparations, although it was not as effective as using growth stimulators such as Kelpak SL, Em Farma TM, soil conditioner UGMax, or Biogen Revital.
The alternative hypothesis was confirmed in the study, indicating that the use of the biostimulator Supporter led to a significant increase in tuber yield by increasing the proportion of large tubers in the yield.
4.2. The Impact of Varieties on Yield and Its Quantitative Characteristics
In the studies on the impact of varieties on yield and its quantitative characteristics, we conducted an analysis of the yield of several different potato varieties. We found significant differences in yield among different varieties of this species, regardless of cultivation techniques, years, or locations. Some varieties showed higher yields compared to others, which may be significant in terms of crop productivity.
Furthermore, analyzing quantitative characteristics of the yield, such as yield mass per unit area, structure of tuber mass of individual size fractions, or the proportion and yield of marketable tubers, we noticed that individual varieties exhibit different characteristics. Some varieties may have a higher yield mass per unit area, while others may appear more efficient in producing yield per plant. Similar observations regarding the yield of varieties have been noted in the works of other authors [2,3,51,52,53].
The yield analysis also allowed us to assess how the tested potato varieties perform in different environmental conditions. Some varieties proved to be more resistant to, for example, drought stress or other adverse meteorological and environmental phenomena, which may affect their ability to maintain stable yield under various cultivation conditions.
Genetic studies suggest that the response of potato varieties to different types of light may be associated with genetic diversity [54,55]. Adjusting the ratio of active phytochrome to total phytochrome can significantly improve plant production and yield quality. Potato plants respond differently to different types of light - red light may lead to elongation of stems and production of small leaves, while blue light may result in shorter, sturdier plants with well-developed leaves. Adding green light to red and blue light may increase chlorophyll content, photosynthesis, and production of smaller-sized tubers. A high proportion of red and blue light may increase tuber production, while adding green light may favor the production of smaller-sized tubers [55,56,57]. In summary, our research has shown the significant impact of potato varieties on yield and its quantitative characteristics. This allowed us to better understand which varieties may be more suitable in terms of yield performance under different cultivation conditions.
4.3. The Influence of Environmental Conditions on Yield and Its Structure
The threat to potato crops from excessive soil moisture during the growing season was lower than drought, which could significantly reduce the quantity and value of tuber yield. In four mesoregions of Poland, diverse thermo-hydric conditions affected potato yield, with the best conditions occurring in the south of Poland and the worst in the northeast of the country.
Research by Kalbarczyk & Kalbarczyk [56] showed that optimal conditions for potato yield include average air temperature during May-September (15.2 °C), lower than average rainfall in May (45 mm), moderate rainfall in June (65 mm), and above-average rainfall in July (90 mm), August (75 mm), and September (60 mm). Rainfall deficits compared to potato requirements, especially in northwestern and central-western Poland, can lead to yield reduction.
Studies by Skowera et al. [37,57] also indicate spatial and temporal differences in rainfall deficits during potato cultivation in Poland. The highest risk of rainfall deficit, according to them, occurs in June, which is unfavorable for potatoes, as potato plants are then in the tuberization phase and forming new tubers.
Optimization of potato yield also depends on the amount of light. Adjusting the ratio of active phytochrome to total phytochrome can significantly improve plant production and yield quality. Research on the influence of different types of light on potatoes has shown that red light may lead to stem elongation and production of smaller leaves, while blue light may favor shorter, sturdier plants with well-developed leaves. Adding green light to red and blue light may increase chlorophyll content, photosynthesis, and production of smaller-sized tubers [55].
Soil type and class also had a significant impact on yield and potato tuber structure. Here are several aspects that were considered:
Differences in soil chemical composition, such as nutrient content, pH, organic matter content, influenced the soil's ability to supply plants with necessary nutrients. Soils deficient in important chemical components for potatoes (e.g., in Barankowo and Kędrzyno) affected root development and nutrient uptake, which in turn influenced tuber size reduction and lower potato tuber yield compared to locations better supplied with these basic nutrients and higher organic matter content in the soil (e.g., Głubczyce).
Soil structure, including its granulation and porosity, also mattered for plant growth and development. Soils with good structure can provide better air and water permeability, leading to longer roots and better nutrient absorption. Conversely, soils with poor structure can limit root growth and contribute to uneven tuber development [27,32].
Soils with different water properties, such as water retention capacity and drainage, can affect water availability for plants. Excessive or insufficient water availability can negatively affect potato yield and tuber quality [58,59].
Soil temperature can also influence plant growth and development. Soils that warm poorly in spring, e.g., in Kędrzyno, can affect slower germination, weaker root growth, and potato tuber development [57,60].
Additionally, environmental conditions such as sunlight and atmospheric precipitation can also influence potato yield and tuber quality by regulating processes such as photosynthesis, transpiration, and nutrient translocation [55,57]. The best conditions were provided by locations in southern Poland (Głubczyce).
Soil structure, including its grain size distribution and porosity, also mattered for plant growth and development. Soils with good structure can provide better air and water permeability, leading to the formation of longer roots and improved absorption of nutrients. Conversely, soils with poor structure can limit root growth and contribute to uneven tuber development [27,32].
4.4. Local Conditions and Yield
In our research on the impact of location on potato yield and tuber structure, several significant aspects were observed, such as adaptation to local microclimates and soils, as well as variety adaptation to specific climatic and soil conditions. Growing locations can have a significant impact on potato yield, especially locations with different soil, climatic, and topographic conditions, which may favor different potato varieties or cultivation practices, ultimately leading to yield variation. Mocek [27] suggest that local environmental factors, such as growing region, soil type, and organic carbon content, should be considered. Our research results confirm this. The best overall and commercial yield was obtained in Głubczyce on Class I or II of soil, while the lowest yield was observed in Barankowo on Podzolic soil in Class IV.
Analysis of potato tuber yield structure, such as size, shape, weight, and the proportion of tubers in different size fractions, revealed significant differences between locations. Soil and climatic conditions can influence tuber development, leading to variability in their structure in different localities and geographic locations. The greatest miniaturization of tubers was observed in Kędrzyn, located in northwestern Poland, where the soil was in Class IV. Conversely, the highest proportion of large-sized tubers (diameter of 50-60 mm and >60 mm) was observed in Głubczyce, in the southern part of the country, where soils were in Class I or II.
Environmental factors such as soil moisture, temperature, sunlight, precipitation, and topographic conditions have a significant impact on potato yield and tuber structure. Locations with similar climatic conditions may exhibit similar yield patterns and tuber structural characteristics. Similar observations regarding potato yield in different terrain conditions were made by Kalbarczyk & Kalbarczyk [56] and Pszczółkowski et al. [58].
Variety adaptation to local conditions: our research suggests that different potato varieties may exhibit varying degrees of adaptation to local conditions. Varieties better adapted to specific environmental conditions in a given location may achieve higher yields and exhibit more favorable tuber structural characteristics.
4.5. Phenotypic Variability of Yield and Its Traits
Yield variability is a characteristic marked by fluctuations in the quantity of produced yields across different years or locations. It is a natural process that can be influenced by various factors such as variability in climatic, meteorological, or microclimatic conditions. Additionally, yield variability may result from fluctuations in soil conditions, variability in cultivation practices, interactions with fertilizers, biostimulants, or pesticides. Yield variability significantly impacts the stability of agricultural production, farmers' profits, and supply in the agricultural market. Therefore, it is an important research area in agriculture, and farmers often undertake actions to mitigate the impact of yield variability through various management strategies.
In the conducted research, the total yield of potato tubers (y1) was characterized by a relatively low coefficient of variation (CV) of 25.9%. This means that the differences in tuber yield between different samples are relatively small compared to the average yield value. On the other hand, the shares of potato tuber mass in different size categories (x1-x6) exhibited varied variability, with the highest coefficient of variation observed for the share of tuber mass with a diameter above 60 mm (x6) - as much as 150.5%. This may suggest that the distribution of tuber masses in this category is more diverse than in other size categories. The share of commercial tuber mass (x7) was characterized by a relatively low coefficient of variation of 17.8%, suggesting that differences in the mass of commercial tubers are relatively small compared to their average value. The yield of commercial tubers (x8) exhibited moderate variability, with a coefficient of variation of 33.16%. This means that differences in the yield of commercial tubers between different samples are moderately large compared to the average yield value.
Overall, the analysis of the coefficient of variation allows us to understand how diverse the examined traits are and how significantly they differ between different samples. This can be useful when planning actions aimed at optimizing potato cultivation processes and improving yield performance.
4.6. Potato Variety Response to Growth Biostimulant
The response of potato varieties to growth biostimulants involves their reaction to the application of biostimulating substances, which can stimulate plant growth, development, and productivity. In the case of potatoes, the use of biostimulants may contribute to increased yields by regulating tuber yield structure, improving resistance to abiotic stressors (e.g., drought, salinity), and enhancing tolerance to diseases and pests. Biostimulants can influence various physiological processes in plants, such as photosynthesis, enzymatic activity, metabolism, and nutrient transport.
In the conducted research, the variety 'Lilly' exhibited the best response to the biostimulant Supporter in terms of both total and commercial yield. In agricultural practice, the application of biostimulants may involve applying these substances to the foliage, soil, or through the plant's root system. The effectiveness of biostimulants depends on the type of substance used and the environmental and genetic characteristics of the potato variety. The relationship between the share of commercial tubers in the total yield and cultivated varieties was also observed by Pytlarz-Kozicka and Zagórski. The highest share of large tubers in the total yield (>50 mm in diameter) was obtained by Baranowska et al. when applying the herbicide Avatar 293 ZC and the GreenOK Universal-PRO preparation, confirming the influence of genotype-environment interaction. This was also confirmed by other authors.
Research by Pardo-García et al. on the impact of biostimulants on secondary metabolism showed that those derived from agricultural by-products can improve plant productivity by activating the expression of key enzymes for phenylpropanoid synthesis, such as PAL. Studies by Ertani et al. [66] demonstrated that biostimulants increased PAL enzyme activity in maize leaves. Biostimulants also enhance chlorophyll content, which is crucial for the photosynthesis process.
Therefore, the Supporter preparation acts as a biostimulant, improving the efficiency of nutrient utilization, tolerance to abiotic stresses, and plant quality characteristics. It complies with the regulations of the European fertilizer products legislation.
4.7. Impact of Biostimulants on Environmental Stress
Researchers Pytlarz-Kozicka and Zagórski found minimal rates of potato infection by diseases, ranging from 2.8% to 5.0% of plants affected by pathogens and from 2.5% to 4.9% by viruses. Noaema et al. demonstrated the role of the Supporter preparation in reducing the occurrence and severity of Rhizoctonia solani on potato tubers, irrespective of the variety. Additionally, they observed significantly higher yields of seed potatoes due to the reduction of this pathogen on potato plants. Gazdanova et al. [50] showed that the use of biological preparations for seed treatment positively affects potato tuber sprouting, increasing it by 6.3% to 8.7% compared to the control variant. They also demonstrated their high efficacy against fungal potato pathogens such as Phytophthora infestans and Rhizoctonia solani, ranging from 37.5% to 100%, resulting in a significant increase in potato yield.
Treating potato seedlings with biological preparations by Novikova et al. resulted in nearly a twofold increase in yields compared to the control. Furthermore, during the flowering stage, the biological effectiveness of these preparations reached close to 90% under optimal conditions and 50-75% under conditions of hydrothermal drought.
In the conducted research, the use of the bioregulator Supporter resulted in an increase in total potato tuber yield by 13.3% and commercial yield by over 20%, attributed to the increased mass of tubers in the 50-60 mm and >60 mm size categories. Potato yield was largely determined by the interaction of experiment location and cultivation technology. According to Noaema et al., the biostimulant Supporter, when used at a lower concentration (half the recommended dose), significantly reduces the occurrence of rhizoctonia on potato tubers.
The use of biostimulants can have varied effects on environmental stresses, depending on specific conditions, the type of biostimulant used, and its composition. Some biostimulants may assist plants in better coping with environmental stress by stimulating their natural resistance to stress factors such as drought, soil salinity, or high temperatures. The alternative hypothesis was confirmed in the study, indicating that the use of the biostimulator Supporter led to a significant increase in tuber yield by increasing the enhancing plant tolerance to environmental stresses.
Research on the mechanisms of action of the biostimulant Supporter in the context of plant resistance may be crucial for agriculture, especially considering changing environmental conditions and increasing demands for sustainable food production.
4.8. Correlations between Yield and Its Component Traits
The conducted research confirmed the existence of various degrees of relationships between parameters related to potato tuber yield. Both positive and negative correlations were observed between different variables. A strong positive correlation (r = 0.86) was found between total tuber yield and commercial yield, suggesting that a higher overall yield translates into a greater proportion of tubers suitable for sale. On the other hand, a weak negative correlation between total yield and the proportion of smaller-sized tubers (e.g., <28 mm in diameter) indicates that a larger overall yield does not necessarily lead to a proportional increase in the share of the smallest tubers. Moderate correlations between different tuber fractions (e.g., from 28 to 60 mm) and total yield suggest some relationships between tuber size distribution and overall yield, although they are not as strong as the correlation between commercial yield and total tuber yield.
Analyzing these relationships is often presented as a complex and multidimensional problem. Studies on potato tuber yield consider many factors such as weather conditions, soil, cultivation methods, as well as tuber traits, leading to diverse correlations between individual parameters. The interaction between variety and environment has been identified as a significant factor influencing tuber yield variability and structure. It is also essential to consider tuber size distribution because a higher overall yield does not always translate into a greater proportion of tubers of desired sizes.
Recent research aims to identify factors influencing these relationships, such as plant genetics, environmental conditions, cultivation methods, and fertilization, to better understand and optimize processes related to potato tuber yield.
4.9. Towards the Future
This consideration provides fertile ground for research aimed at elucidating the complex relationship between biostimulants and agroecosystems, fostering the evolution of sustainable agriculture paradigms. It also underscores the potential of biostimulants in shaping agricultural practices and formulating agro-environmental policies. Key directions for future research include:
Integration of biostimulants into agricultural practices, such as the use of the Supporter biostimulant, heralds a new era for sustainable agriculture. Ongoing research aimed at elucidating the mechanisms of biostimulant action and their environmental interactions will facilitate further refinement.
Exploration of synergies between biostimulants and other sustainable agriculture methodologies, such as agroecology and precision farming, promises to optimize agricultural productivity while minimizing environmental impact. Standardization of biostimulant production and implementation, such as Supporter, is necessary to unlock their full potential and support transformations towards sustainable agriculture.
Prospects for research on growth stimulants and biostimulants in potato cultivation are promising and encompass several key areas, including:
Optimization of biostimulant composition and action: Further research is needed on the composition of biostimulants and their effects on plants to better understand which components are most effective in stimulating potato growth. These studies may lead to the development of more efficient biostimulant formulations tailored to different growing conditions.
Mechanisms of biostimulant action: Understanding the molecular and physiological mechanisms through which biostimulants influence plants, including growth processes, root development, photosynthesis, and stress resistance, is important. Such research can help identify specific metabolic pathways and genes responsible for plant responses to biostimulants.
Optimization of dosage and application: Studies on optimal biostimulant dosing and application methods are essential to ensure maximum efficacy of these products with minimal environmental impact and may help reduce production costs for farmers.
Field and long-term studies: Conducting field and long-term studies to assess the effectiveness of biostimulants in various potato growing conditions and their impact on yield, tuber quality, and plant health is important. Such research can provide practical guidance on the best practices for using biostimulants in real-world growing conditions.
Sustainable agriculture: Research on biostimulants can contribute to promoting sustainable agriculture by increasing plant productivity and resilience, reducing chemical inputs, and improving the efficiency of natural resource utilization.
As research progresses in these areas, further development and refinement of biostimulants can be expected, which may bring benefits to agriculture by increasing potato cultivation efficiency while simultaneously reducing negative environmental impact.
5. Conclusions
Conclusions and Future Directions Based on Conducted Research on the Impact of the Plant Bioregulator Supporter on Potato Yield and Quality:
Positive Impact of Supporter: It has been demonstrated that the plant bioregulator Supporter positively influences potato yield and the quantitative and qualitative characteristics of the obtained produce. Therefore, the application of Supporter may constitute an effective strategy for improving potato production efficiency, which is crucial for ensuring food security.
Enhanced Environmental Resilience: Plants treated with the biostimulant Supporter exhibited greater resistance to environmental stresses such as drought or high temperatures. Consequently, further research on the mechanisms of action of Supporter in the context of plant resilience may be important for agriculture.
Variability in Yield Patterns: Some of the studied varieties showed stable yield patterns (e.g., 'Lilly' and 'Lady Claire'), while others were more variable in their productivity, regardless of the analyzed experimental factors.
Influence of Cultivation Location: Crop location significantly impacts potato yield and tuber structure. Understanding these differences can aid in better adapting cultivation practices and selecting varieties to specific local conditions, potentially increasing potato cultivation efficiency.
Environmental Factors: Environmental factors during the study years resulted in differences in potato yield and tuber structure depending on soil type and meteorological conditions. Considering these differences is important when planning potato cultivation and making decisions regarding fertilization and plant care.
Correlations in Yield Parameters: Strong positive correlation (r = 0.86) between total tuber yield and commercial yield suggests that higher total yield translates into a greater commercial yield. However, weak negative correlation between total yield and the proportion of smaller tubers suggests that higher yield does not necessarily mean a proportional increase in the share of the smallest tubers. Relationships between tuber size distribution and total yield were confirmed, although not as strong as in the case of commercial yield.
Future Research Directions: Continued research on the impact of Supporter on potato yield in different environmental conditions and soil types is necessary to gain a more comprehensive understanding of its effects. Studies on optimizing doses and application methods of Supporter are also important, as they may contribute to even better results in potato production.
Towards Sustainable Agriculture: In the context of the growing need for sustainable agriculture, further research on the impact of Supporter on crop production efficiency can contribute to the development of more environmentally friendly and efficient cultivation practices, thus meeting the increasing food needs of society.
Author Contributions
Conceptualization, P.B., B.S. and P.P.; methodology, P.B., P.P.; software, A.K.F.; validation, P.B., T.S.H., A.K.F.; formal analysis, A.K.F.; investigation, P.B.; resources, T.S.H., P.P., A.K.F.; data curation, A.K.F.; writing—original draft preparation, P.B., P.P., T.S.H., A.K.F.; writing—review and editing, B.S., P.B.; visualization, A.K.F., T.S.H.; supervision, B.S., P.P.; project administration, P.B.; funding acquisition, B.S. All authors have read and agreed to the published version of the manuscript.
Funding
This research received no external funding.
Data Availability Statement
The authors did not generate new data.
Acknowledgments
The authors would like to thank the COBORU Directorate in Słupia Wielka and the IHAR - PIB Directorate in Radzików for administrative and technical support.
Conflicts of Interest
The authors declare no conflicts of interest.
References
- Dzwonkowski, W. Potato market in Europe and in the world. Rynek Ziemniaka. Stan i Perspektywy 2022, 49, 6–10. (In Polish) [Google Scholar]
- Batur, F.; Bocci, R.; Bartha, B. Marketing farmers’ varieties in Europe: Encouraging pathways with missing links for the recognition and support of farmer seed systems. Agronomy 2021, 11, 2159. [Google Scholar] [CrossRef]
- Sadik, E.; Hussien, M.; Tewodros, A. Effects of seed tuber size on growth and yield performance of potato (Solanum tuberosum L.) varieties under field conditions. African Journal of Agricultural Research 2018, 13, 2077–2086. [Google Scholar] [CrossRef]
- Diop, P.; Sylla, E.S.; Diatte, M.; Labou, B.; Diarra, K. Effect of cut seed tubers and pre-germination on potato tuber yield. International Journal of Biological and Chemical Sciences 2019, 13, 3144–3156. [Google Scholar] [CrossRef]
- Porter, L.D.; Cummings, T.F.; Johnson, D.A. Effects of soil-applied late blight foliar fungicides on infection of potato tubers by Phytophthora infestans. Plant Disease 2006, 90, 964–968. [Google Scholar] [CrossRef]
- Gleń-Karolczyk, K.; Boligłowa, E.; Luty, L. Health parameters of potato tubers under the influence of soil applied bio-preparations and bio-stimulants. Appl. Sci. 2022, 12, 11593. [Google Scholar] [CrossRef]
- Pietruszewski, S. Improving the quality of seed material of plants cultivated using physical methods. [in:] New trends in agrophysics. Red. Dobrzański J., Grundas S., Nawrocki S., Rybczyński R. Wyd. Nauk. FRNA Lublin: 2008, 71–72 (in Polish).
- Jakubowski, T. Transfer of microwave irradiation effects of seed potatoes (Solanum tuberosum L.) to the plants of next generations. Bulg. J. Agric. Sci. 2015, 6, 1185–1193. [Google Scholar]
- Osowski, J. Fungicides registered for treating potato tubers and methods of their use. Earth. Half. 2021, 1, 16–24. [Google Scholar]
- Gierz, Ł. Modeling and optimization of a system for applying liquid pesticides to the surfaces of tubers and seeds during sowing and planting processes. Start PhD - Institute of Work Machines and Motor Vehicles, Poznań University of Technology, 2016 (In Polish).
- Gierz, Ł.; Przybył, K.; Koszela, K.; Semkło, Ł.; Kwiecień, S. An assessment of the functional and ecological aspect of novel intermittent stream valves for spraying seed potatoes. Agronomy 2020, 10, 541. [Google Scholar] [CrossRef]
- Regulations Regulation (EU) 2019/1009 of The European Parliament and of The Council of 5 June 2019 laying down rules on the making available on the market of EU fertilizing products and amending Regulations (EC) No 1069/2009 and (EC) No 1107/2009 and repealing Regulation (EC) No 2003/2003. Official Journal of the European Union, 25.6.2019.
- Ricci, M.; Tilbury, L.; Daridon, B.; Sukalac, K. General Principles to Justify Plant Biostimulant Claims. Front. Plant Sci. Sec. Crop and Product Physiology 2019, 10. [Google Scholar] [CrossRef]
- Regulation of The Minister of Agriculture and Rural Development of November 5, 2014. Journal of Laws of the Republic of Poland, Warsaw, November 26, 2014, item 1651, amending the regulation on the deadlines for submitting applications for field evaluation of seed material of individual groups of plants or species of agricultural and vegetable plants and detailed requirements for the production and quality of seed material of these plants. Based on Article. 40 of the Act of November 9, 2012 on seed production (Journal of Laws, item 1512 and of 2013, item 865). (In Polish).
- European Commission. Proposal for a Regulation of the European Parliament and of the Council Laying Down Rules on the Making Available on the Market of CE Marked Fertilizing Products and Amending Regulations (EC) No 1069/2009 and (EC) No 1107/2009 COM (2016) 0157 Final - 2016/0084 (COD). Brussels: European Commission.
- Council of the European Union (2018). Proposal for a Regulation of the European Parliament and of the Council Laying Down Rules on the Making Available on the Market of CE Marked Fertilizing Products and Amending Regulations (EC)No 1069/2009 and (EC) No 1107/2009-Analysis of the Final Compromise Text With a View to Agreement. Available online: http://data.consilium.europa.eu/doc/document/ST-15103-2018-INIT/en/pdf (accessed on 20 April 2024).
- Noaema, A.H.; Sawicka, B.; Barbaś, P.; Krochmal-Marczak, B. The effect of Supporter1 on the reduction of Rhizoctonia solani on potato tubers. 56th Scientific Session of the Institute of Plant Protection - National Research Institute, Poznań, Abstracts, 11-12.02. 2016, 103. [CrossRef]
- Supporter®. Agricultural crop yield modulator. Instruction for use: Supporter (PL) 2021. (In Polish). Available online: https://www.certiseurope.pl/fileadmin/PL/Pliki_do_pobranie/Supporter/20210505_Supporter_PL.pdf.
- Anonimous. Database of plant protection products, 2024. Available online: https://baza.ior.poznan.pl/srodki_ochrony_roslin.html (accessed on 23 April 2024).
- Journal of Laws of the Republic of Poland of November 26, 2014, item 165 [Regulation of the Ministry of Agriculture and Rural Development of November 5, 2014]. (In Polish).
- Bleinholder, H.; Buhr, L.; Feller, C.; Hack, H.; Hess, M.; Klose, R.; Meier, U.; Stauss, R.; van den Boom, T.; Weber, E.; Lancashire, P.D.; Munger, P. Compendium of Growth Stage Identification Keys for Mono- and Dicotyledonous Plants. The key to determining the development phases of mono- and dicotyledonous plants on the BBCH scale. Crowd. Adamczewski K., Matysiak K. Ed. IOR, Poznań, 15-33, 2005.
- Roztropowicz, S. Methodology of Observation, Measurements and Sampling in Agricultural Experiments with Potatoes; Plant Breeding and Acclimatization Institute: Section: Jadwisin, Poland, 1999:1-50. (In Polish).
- Lenartowicz, T.; Erlichowski, T. New potato varieties 2017. Polish Potato (In Polish). 2017, 27. [Google Scholar]
- Nowacki, W. (Ed.). Characteristics of the National Register of Potato Cultivars, 22nd ed.; IHAR-PIB: Jadwisin, Poland, 45 pp. 2020, (In Polish).
- Act of July 10, 2007 on fertilizers and fertilization. OJ 2007 No. 147 item 1033. Available online: https://isap.sejm.gov.pl/isap.nsf/DocDetails.xsp?id=wdu20071471033 [In Polish].
- PN-R-0403: 1997. Chemical and Agricultural Analysis of Soil. Sampling. Polish Committee for Standardization: Warsaw, Poland, 1997. (In Polish)
- Mocek, A. Soil science, 1st ed.; PWN Scientific Publishing House: Warsaw, Poland, 589 pp, 2015, 978-83-01-18795-8. (In Polish).
- Lützenkirchen, J.; Preočanin, T.; Kovačević, D.; Tomišič, V.; Lövgren, L.; Kallay, N. Potentiometric titrations as a tool for surface charge determination. Croat. Chem. Acta 2012, 85, 391–417. [Google Scholar] [CrossRef]
- PN-R-04020:1994+AZ1:2004; Chemical and Agricultural Analysis of Soil. Polish Committee for Standardizations: Warsaw, Poland, 2004. (In Polish).
- PN-R-04023:1996; Chemical and Agricultural Analysis of Soil. Determination of Available Phosphorus Content in Mineral Soils. Polish Committee for Standardizations: Warsaw, Poland, 1996. (In Polish).
- PN-R-04022:1996+AZ1:2002; Chemical and Agricultural Analysis of Soil. Determination of Available Potassium Content in Mineral Soils. Polish Committee for Standardization: Warsaw, Poland, 2002. (In Polish).
- Wójcikowska-Kapusta, A.; Niemczuk, B. Effect of type of use on content of various magnesium and potassium forms in profiles of rendzinas. Acta Agrophysica 2006, 8, 765–771. (In Polish) [Google Scholar]
- Nawrocki, S. Fertilizer Recommendations. Part. I. Limit Numbers for Valuation of Soils in Macro- and Microelements; IUNG, Puławy, Poland, pp. 44, 1991, (In Polish).
- PN-Z-15011-3: 2001. Polish version. Compost from municipal waste. Determination: pH, organic content, organic carbon, nitrogen, phosphorus and potassium. PKN Publisher, Warsaw, 2001 (In Polish).
- Fotyma, M.; Kęsik, K.; Pietruch, Cz. Mineral nitrogen in soils as an indicator of the fertilizer needs of plants and the condition of soil and groundwater purity. Nawozy i Nawożenie/Fertilizers and Fertilization 2010, 38, 5–80. (In Polish) [Google Scholar]
- WRB. 2014. World reference database for soil resources. Available online: http://www.fao.org/3/a-i3794e.pdf.
- Skowera, B.; Kopcińska, J.; Kopeć, B. Changes in thermal and precipitation conditions in Poland in 1971–2010. Ann. Wars. Univ. Life Sci. Land Reclam. 2014, 46, 153–162. [Google Scholar] [CrossRef]
- SAS Institute. SAS/STAT®9.2. User’s Guide; SAS Institute: Cary, NC, USA, 2008. [Google Scholar]
- Tatarczak, A. Statistics. Vol. I - Textbook Part II - Case studies. Ed. WSEI-Lublin, 277 pp., 2021, ISBN 978-83-66159-83-9. (In Polish).
- Cwalina-Ambroziak, B.; Trojak, A. The effect of seed potato dressing on the severity of rhizoctonia’s and anthracnose. Progress in Plant Protection/Postępy w Ochronie Roślin 2012, 52, 614–618. [Google Scholar]
- Deising, H.B.; Fraaije, B.; Mehl, A.; Oerke, E.C.; Sierotzld, H.; Stammler, G. Modern Fungicides and Antifungal Compounds VIII. In Proceedings of the 18th International Reinhardsbrunn Symposium, 24–28 April 2016, Fredrichroda, Germany. Persistent Identifier: urn:nbn:de:0294-sp-2017-Reinh-4. ISBN: 978-3-941261-15-0.
- Jamiołkowska, A.; Hetman, B. The mechanism of action of biological preparations used in plant protection against pathogens. Annales Universitatis Mariae Curie-Skłodowska. Sectio E. Agricultura 2016, 71, 13–29. [Google Scholar]
- Brauer, V.S.; Rezende, C.P.; Pessoni, A.M.; De Paula, R.G.; Rangappa, K.S.; Nayaka, S.C.; Gupta, V.K.; Almeida, F. Antifungal agents in agriculture: Friends and foes of public health. Biomolecules 2019, 9, 521. [Google Scholar] [CrossRef] [PubMed]
- Cieluch, P. Effect of Monceren 250 FS fungicide on quality and quantity of potato yield. Progress in Plant Protection 2009, 49, 427–435. [Google Scholar]
- Wharton, P.S.; Kirk, W.W.; Schafer, R.L.; Tumbalam, P. Evaluation of biological seed treatments in combination with management practices for the control of seed-borne late blight in potato. Biological Control 2012, 63, 326–332. [Google Scholar] [CrossRef]
- Ropek, D.; Kołodziejczyk, M. Efficacy of selected insecticides and natural preparations against Leptinotarsa decemlineata. Potato Research 2019, 62, 85–95. [Google Scholar] [CrossRef]
- Orzaliyeva, M.; Didanova, Y.; Zherukov, T.; Nazranov, K.; Ishnazarov, A. The effectiveness of using biological preparations in the production technology for seed material of potatoes. [In:] E3S Web of Conferences 2021, 262, 01028. [Google Scholar] [CrossRef]
- Pytlarz-Kozicka, M.; Zagórski, P. The influence of biological potato tuber treatments on health conditions of potato plants and potato yield. Progress in Plant Protection/Postępy w Ochronie Roślin 2013, 53, 333–339. [Google Scholar]
- Pytlarz-Kozicka, M.; Słabicki, W. The influence of seed potato dressing and harvest date on plant health and potato yield. Zeszyty Naukowe Uniwersytetu Przyrodniczego we Wrocławiu: Rolnictwo 2013, 596, 97–106. (In Polish) [Google Scholar]
- Gazdanova, I.; Gerieva, F.; Morgoev, T. The effectiveness of the use of biological preparations in the production of potatoes. Bulg. J. Agric. Sci. 2022, 28, 212–216. [Google Scholar]
- Zarzecka, K.; Gugała, M.; Dołęga, H.; Sikorska, A. The occurrence of tuber defect in potato yield after the application of soil fertilizer UGmax. Annales Universitatis Mariae Curie-Skłodowska Lublin – Polonia Sectio E 2014, 69, 70–79. [Google Scholar]
- Zarzecka, K.; Gugała, M.; Mystkowska, I.T.; Sikorska, A. Yield-Forming Effects of Herbicide and Biostimulants Application in Potato Cultivation. J. Ecol. Eng. 2022, 23, 137–144. [Google Scholar] [CrossRef]
- Sawicka, B.; Pszczółkowski, P. Phenotypic variability of yield and its structure of very early and early potato varieties. Fragment. Agron. 2017, 34, 76–91. (In Polish) [Google Scholar]
- Paradiso, R.; Arena, C.; Rouphael, Y.; d’Aquino, L.; Makris, K.; Vitaglione, P.; De Pascale, S. Growth, photosynthetic activity and tuber quality of two potato cultivars in controlled environment as affected by light source. Plant Biosyst. Int. J. Deal. All Asp. Plant Biol. 2019, 153, 725–735. [Google Scholar] [CrossRef]
- Rahman, M.H.; Islam, M.J.; Mumu, U.H.; Ryu, B.-R.; Lim, J.-D.; Azad, M.O.K.; Cheong, E.J.; Lim, Y.-S. The Growth and Tuber Yield of Potatoes (Solanum tuberosum L.) under Varying LED Light Spectrums in Controlled Greenhouse Conditions. Horticulture 2024, 10, 254. [Google Scholar] [CrossRef]
- Kalbarczyk, R.; Kalbarczyk, E. The needs and deficiency in atmospheric precipitation in cultivated mid-late and late potato in Poland. Infrastructure and Ecology of Rural Areas 2009, 129–140. (In Polish) [Google Scholar]
- Skowera, B.; Baranowska, A.; Węgrzyn, A.; Bartoszek, K.; Wojkowski, J.; Ivanišová, E. The Meteorological Conditions of Precipitation Deficits in the Cultivation of Winter Wheat in Central and Eastern Poland. Journal of Ecological Engineering 2023, 24, 50–62. [Google Scholar] [CrossRef] [PubMed]
- Pszczółkowski, P.; Sawicka, B.; Lenartowicz, T.; Pszczółkowski, M. The Dependence of Crop Potatoes on the Level of Irrigation under Polish Conditions. Agriculture 2021, 11, 84. [Google Scholar] [CrossRef]
- Si, J.; Wang, L.; Zhang, K.; Li, L.; Fudjoe, S.K.; Luo, Z. Irrigation as an Effective Way to Increase Potato Yields in Northern China: A Meta-Analysis. Agronomy 2024, 14, 448. [Google Scholar] [CrossRef]
- Skowera, B.; Puła, J. Pluviometric extreme conditions in spring season in Poland in the years 1971-2000. Acta Agroph. 2004, 3, 171–177. [Google Scholar]
- Baranowska, A.J.; Mystkowska, I.T.; Szczygielska, E. Impact of growth biostimulators and herbicide on the yield structure of edible potato tubers (Solanum tuberosum L.). Acta Agroph. 2019, 26, 25–36. [Google Scholar] [CrossRef]
- Mądry, W.; Iwańska, M. Usefulness of statistical methods and measures for evaluating cultivar stability and adaptation: an overview of research. Bulletin IHAR 2011, 260/261, 193–217. [Google Scholar] [CrossRef]
- Jankowska, J.; Pietraszko, M.; Lutomirska, B. The analysis of yielding stability of some potato (Solanum tuberosum L.) cultivars on light soil. Fragm. Agronom. 2015, 32, 32–43. [Google Scholar]
- Kołodziejczyk, M. Phenotypic variation of yielding of medium-early cultivars of edible potato. Biuletyn IHAR 2021, 294, 27–33. [Google Scholar] [CrossRef]
- Pardo-García, A.I.; Martínez-Gil, A.M.; Cadahía, E.; Pardo, F.; Alonso, G.L.; Salinas, M.R. Oak extract application to grapevines as a plant biostimulant to increase wine polyphenols. Food Res. Int. 2014, 55, 150–160. [Google Scholar] [CrossRef]
- Ertani, A.; Schiavon, M.; Altissimo, A.; Franceschi, C.; Nardi, S. Phenol-containing organic substances stimulate phenylpropanoid metabolism in Zea mays. J. Plant Nutr. Soil Sci. 2011, 174, 496–503. [Google Scholar] [CrossRef]
- Abdalla, M.M. The potential of Moringa oleifera extract as a biostimulant in enhancing the growth, biochemical and hormonal contents in rocket (Eruca vesicaria subsp. sativa) plants. Int. J. Plant Physiol. Biochem. 2013, 5, 42–49. [Google Scholar]
- Novikova, I.; Minin, V.; Titova, J.; Zakharov, A.; Krasnobaeva, I.; Boikova, I.; Murzaev, E. New polyfunctional biorationals use to achieve competitive yield of organic potatoes in the North-West Russian ecosystem. Plants 2022, 11, 962. [Google Scholar] [CrossRef] [PubMed]
- Kołodziejczyk, I.; Bałabusta, M.; Szewczyk, R.; Posmyk, M.M. The levels of melatonin and its metabolites in conditioned corn (Zea mays L.) and cucumber (Cucumis sativus L.) seeds during storage. Acta Physiol. Plant. 2015, 37, 105. [Google Scholar] [CrossRef]
Figure 2.
Planter with mounted dressing device; source: own.
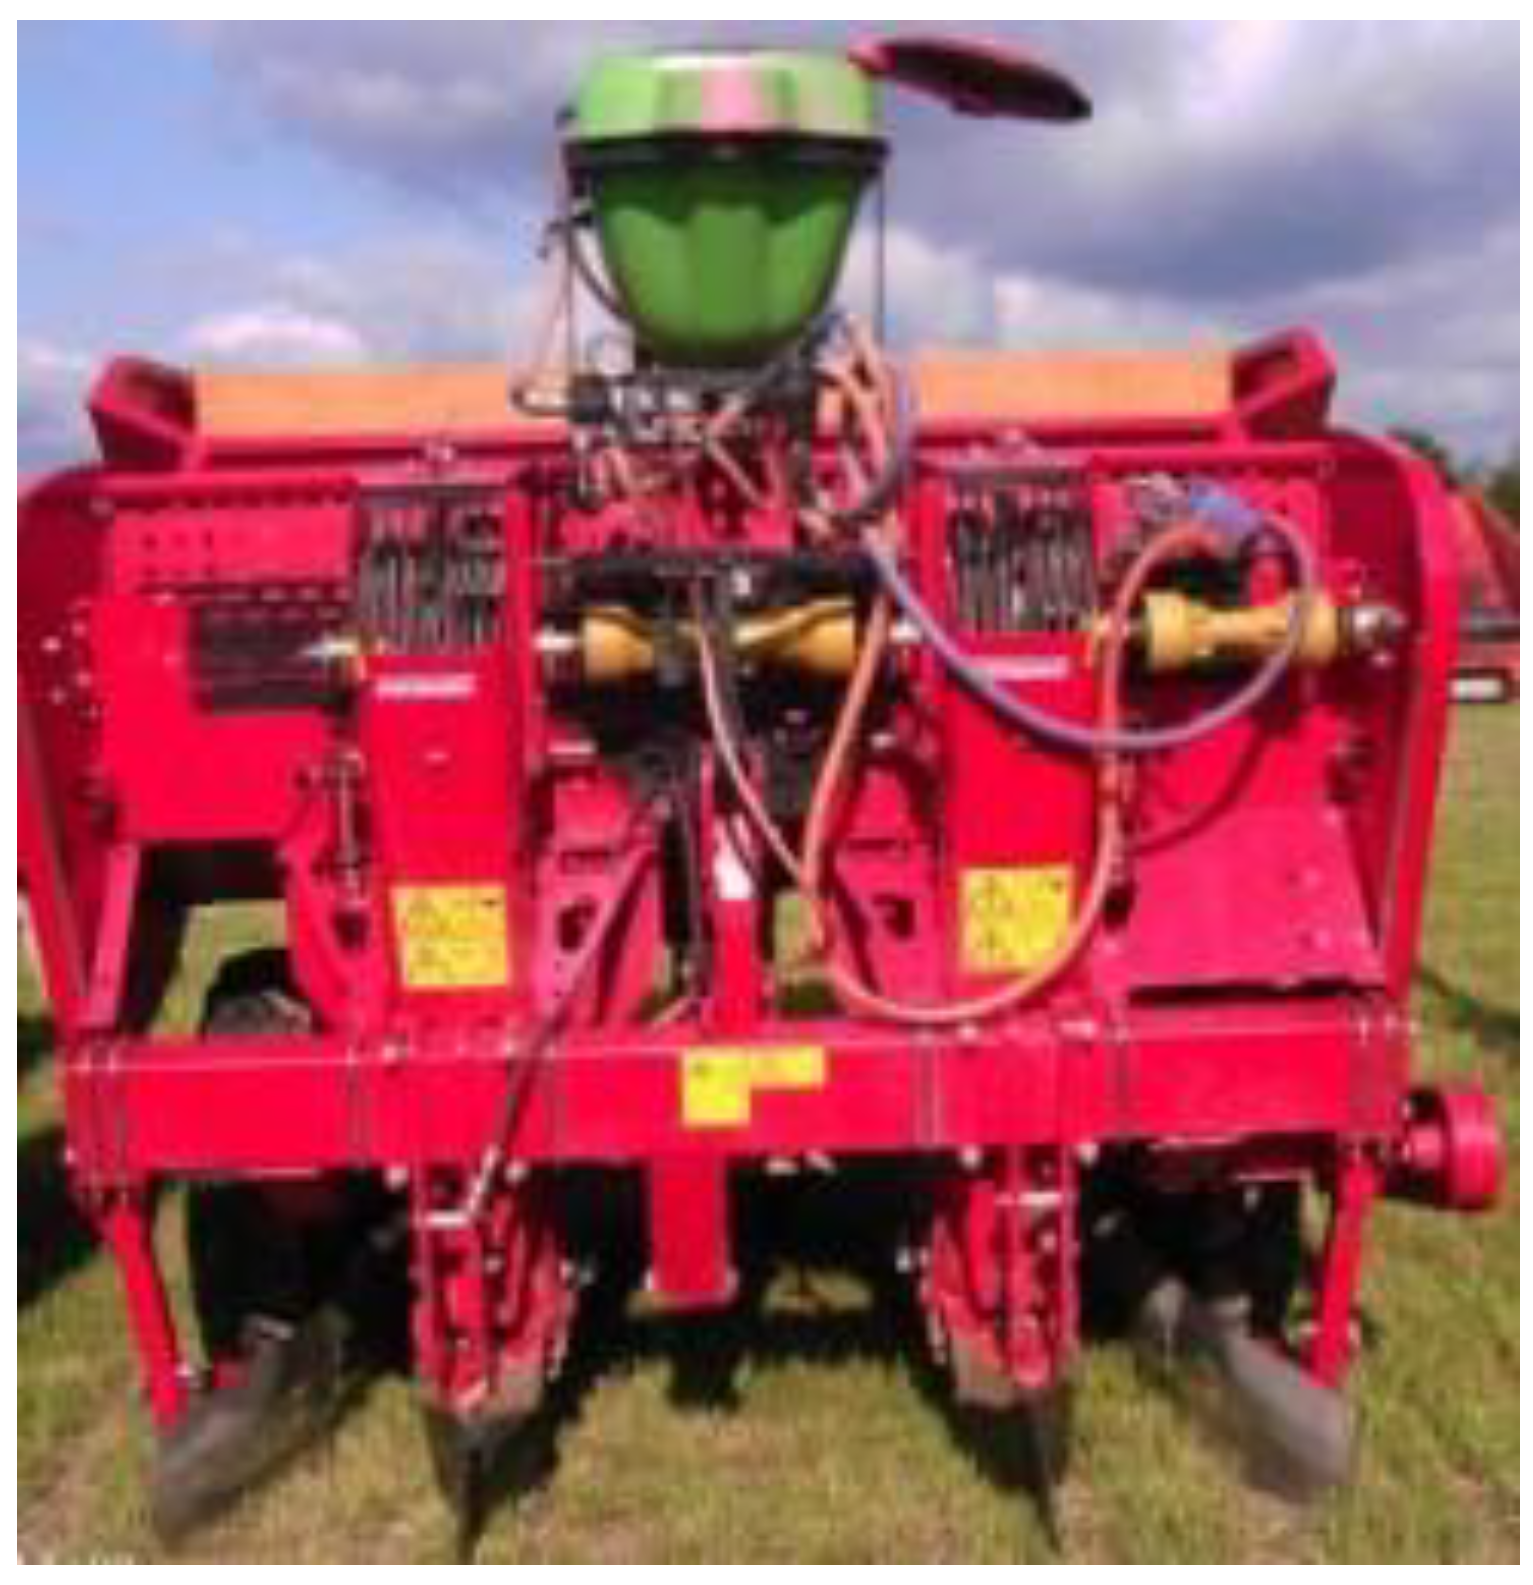
Figure 3.
The influence of potato varieties and cultivation technology on the mass share of tubers with a diameter of <28 mm, 28-35 mm, 35-50 mm, 50-55 mm, 55-60 mm and > 60 mm.
Figure 3.
The influence of potato varieties and cultivation technology on the mass share of tubers with a diameter of <28 mm, 28-35 mm, 35-50 mm, 50-55 mm, 55-60 mm and > 60 mm.
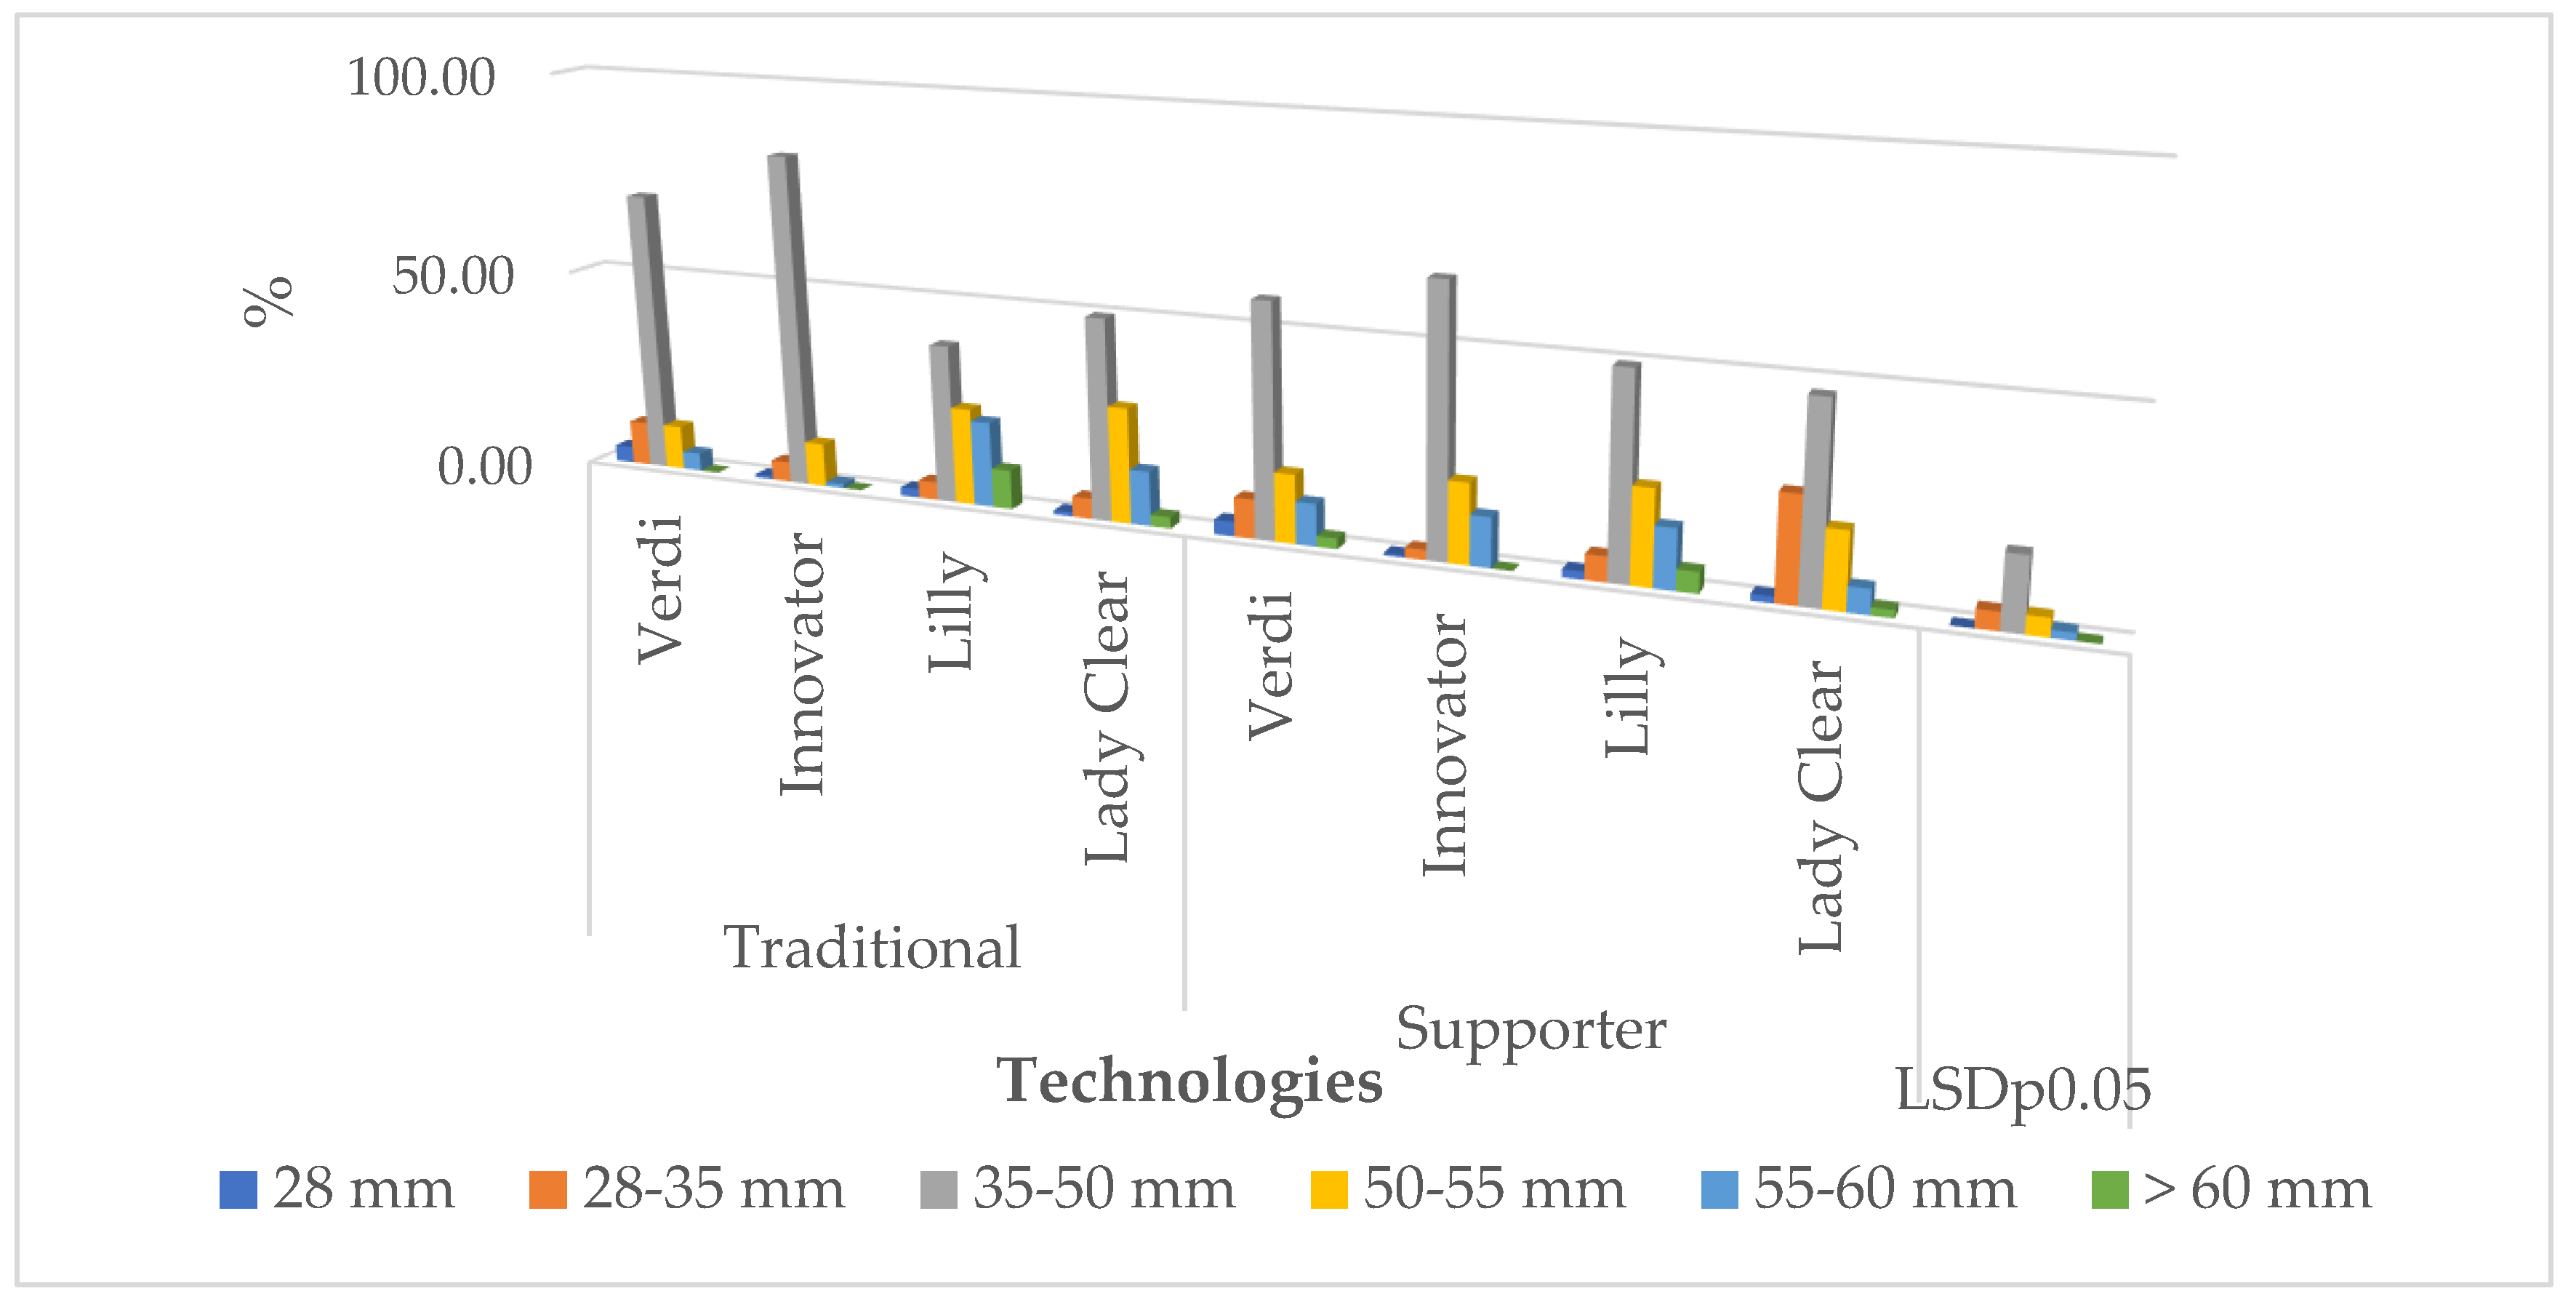
Figure 4.
The influence of cultivation technology and locations on the percentage of the mass of commercial tubers.
Figure 4.
The influence of cultivation technology and locations on the percentage of the mass of commercial tubers.
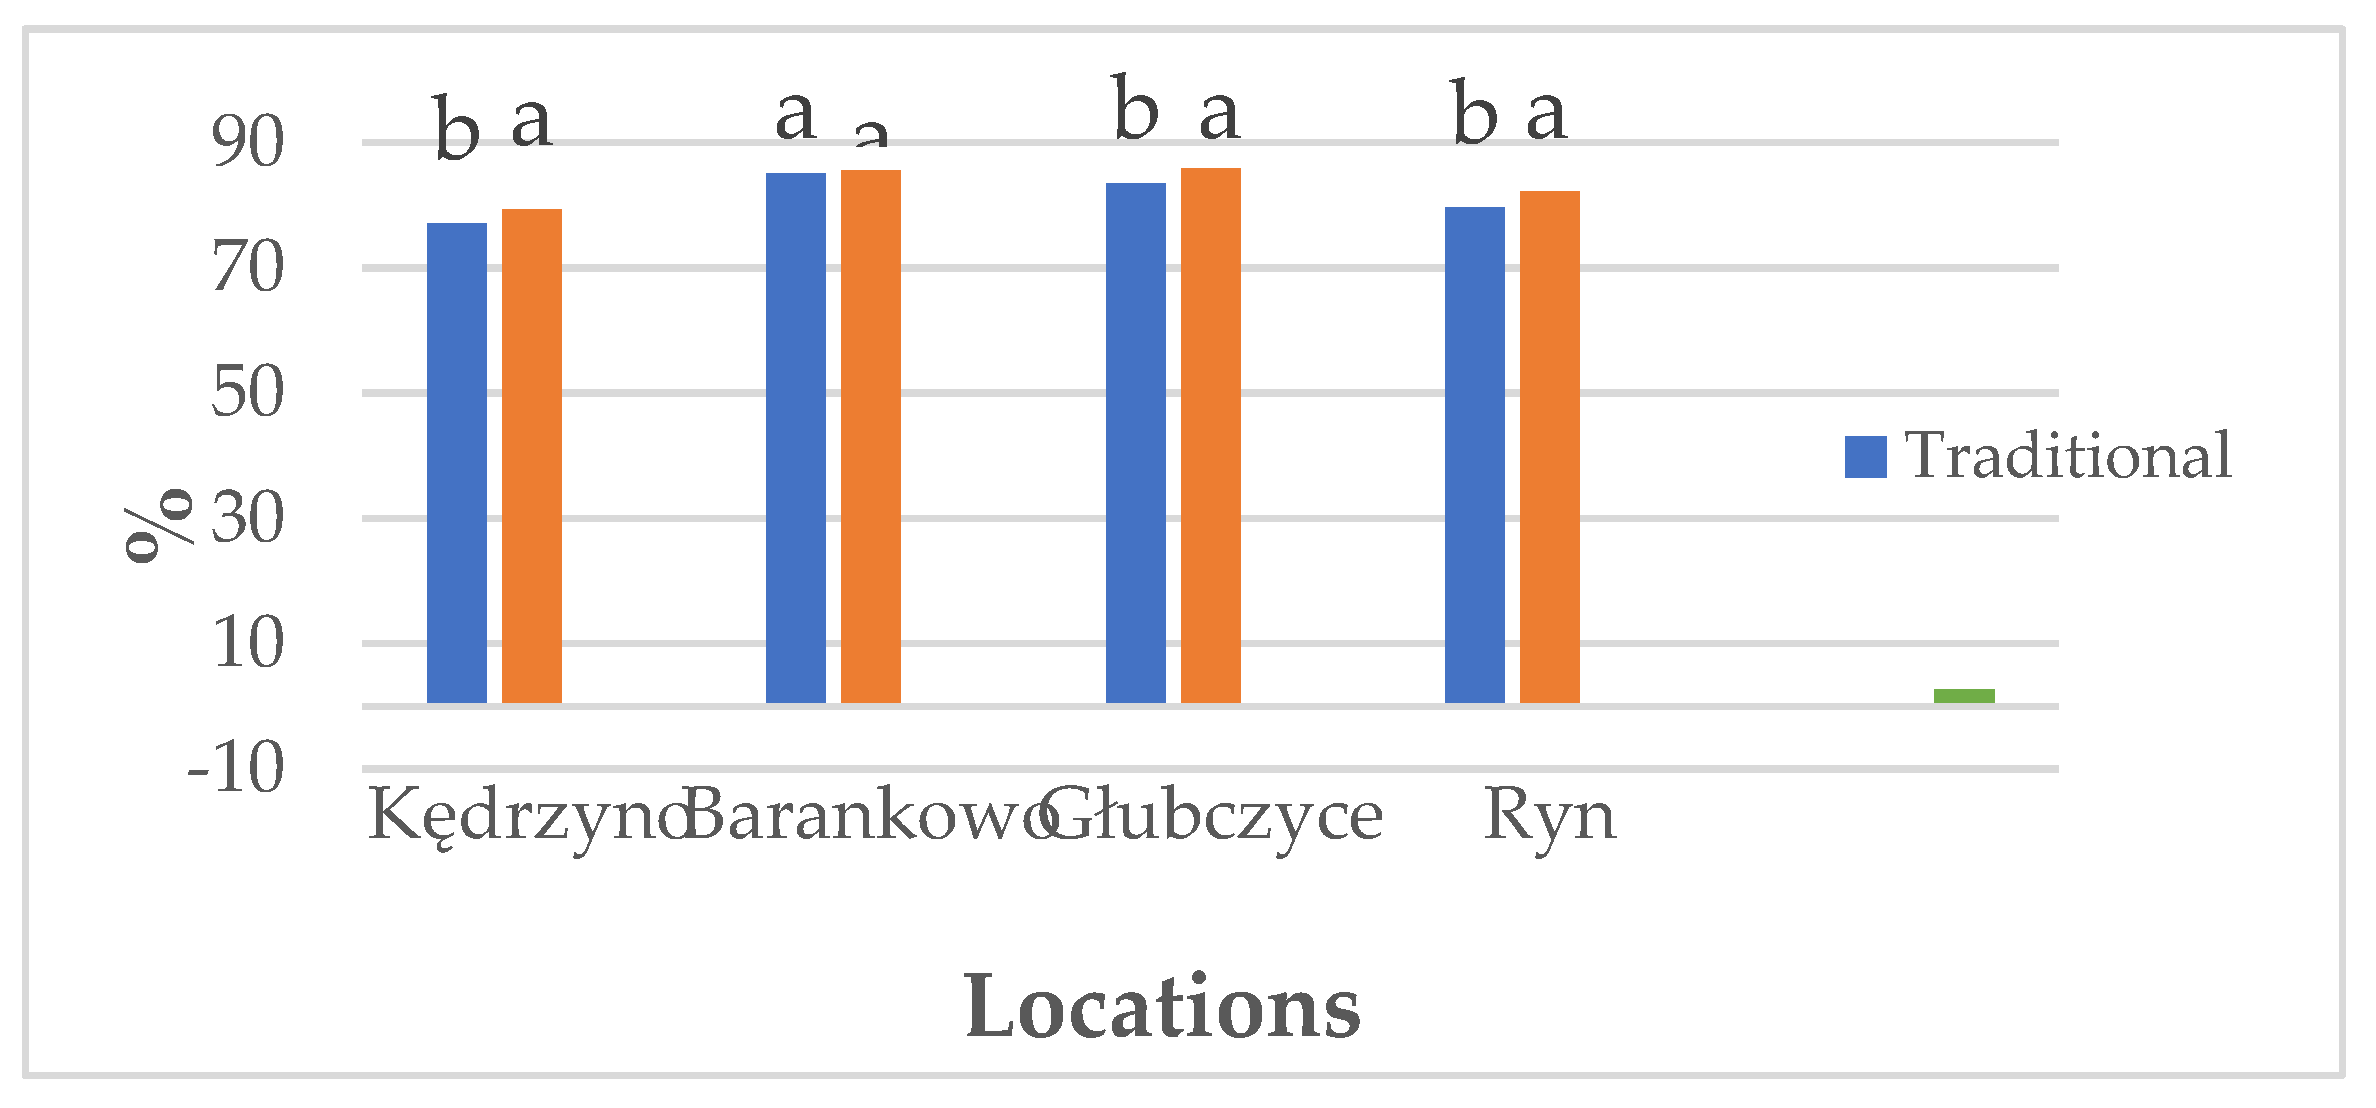
Figure 5.
The Pearson correlation coefficients between the dependent variable (y) and the independent variables (x). y – total tuber yield; x1 – mass share of tubers with diameter <28 mm; x2 – mass share of tubers with a diameter of 28-35 mm; x3 – mass share of tubers with a diameter of 35-50 mm; x4 – mass share of tubers with a diameter of 50-55 mm; x5 – mass share of tubers with a diameter of 55-60 mm; x6 – mass share of tubers with a diameter >60 mm; x7 – share of the mass of commercial tubers; x8 – marketable yield of tubers.
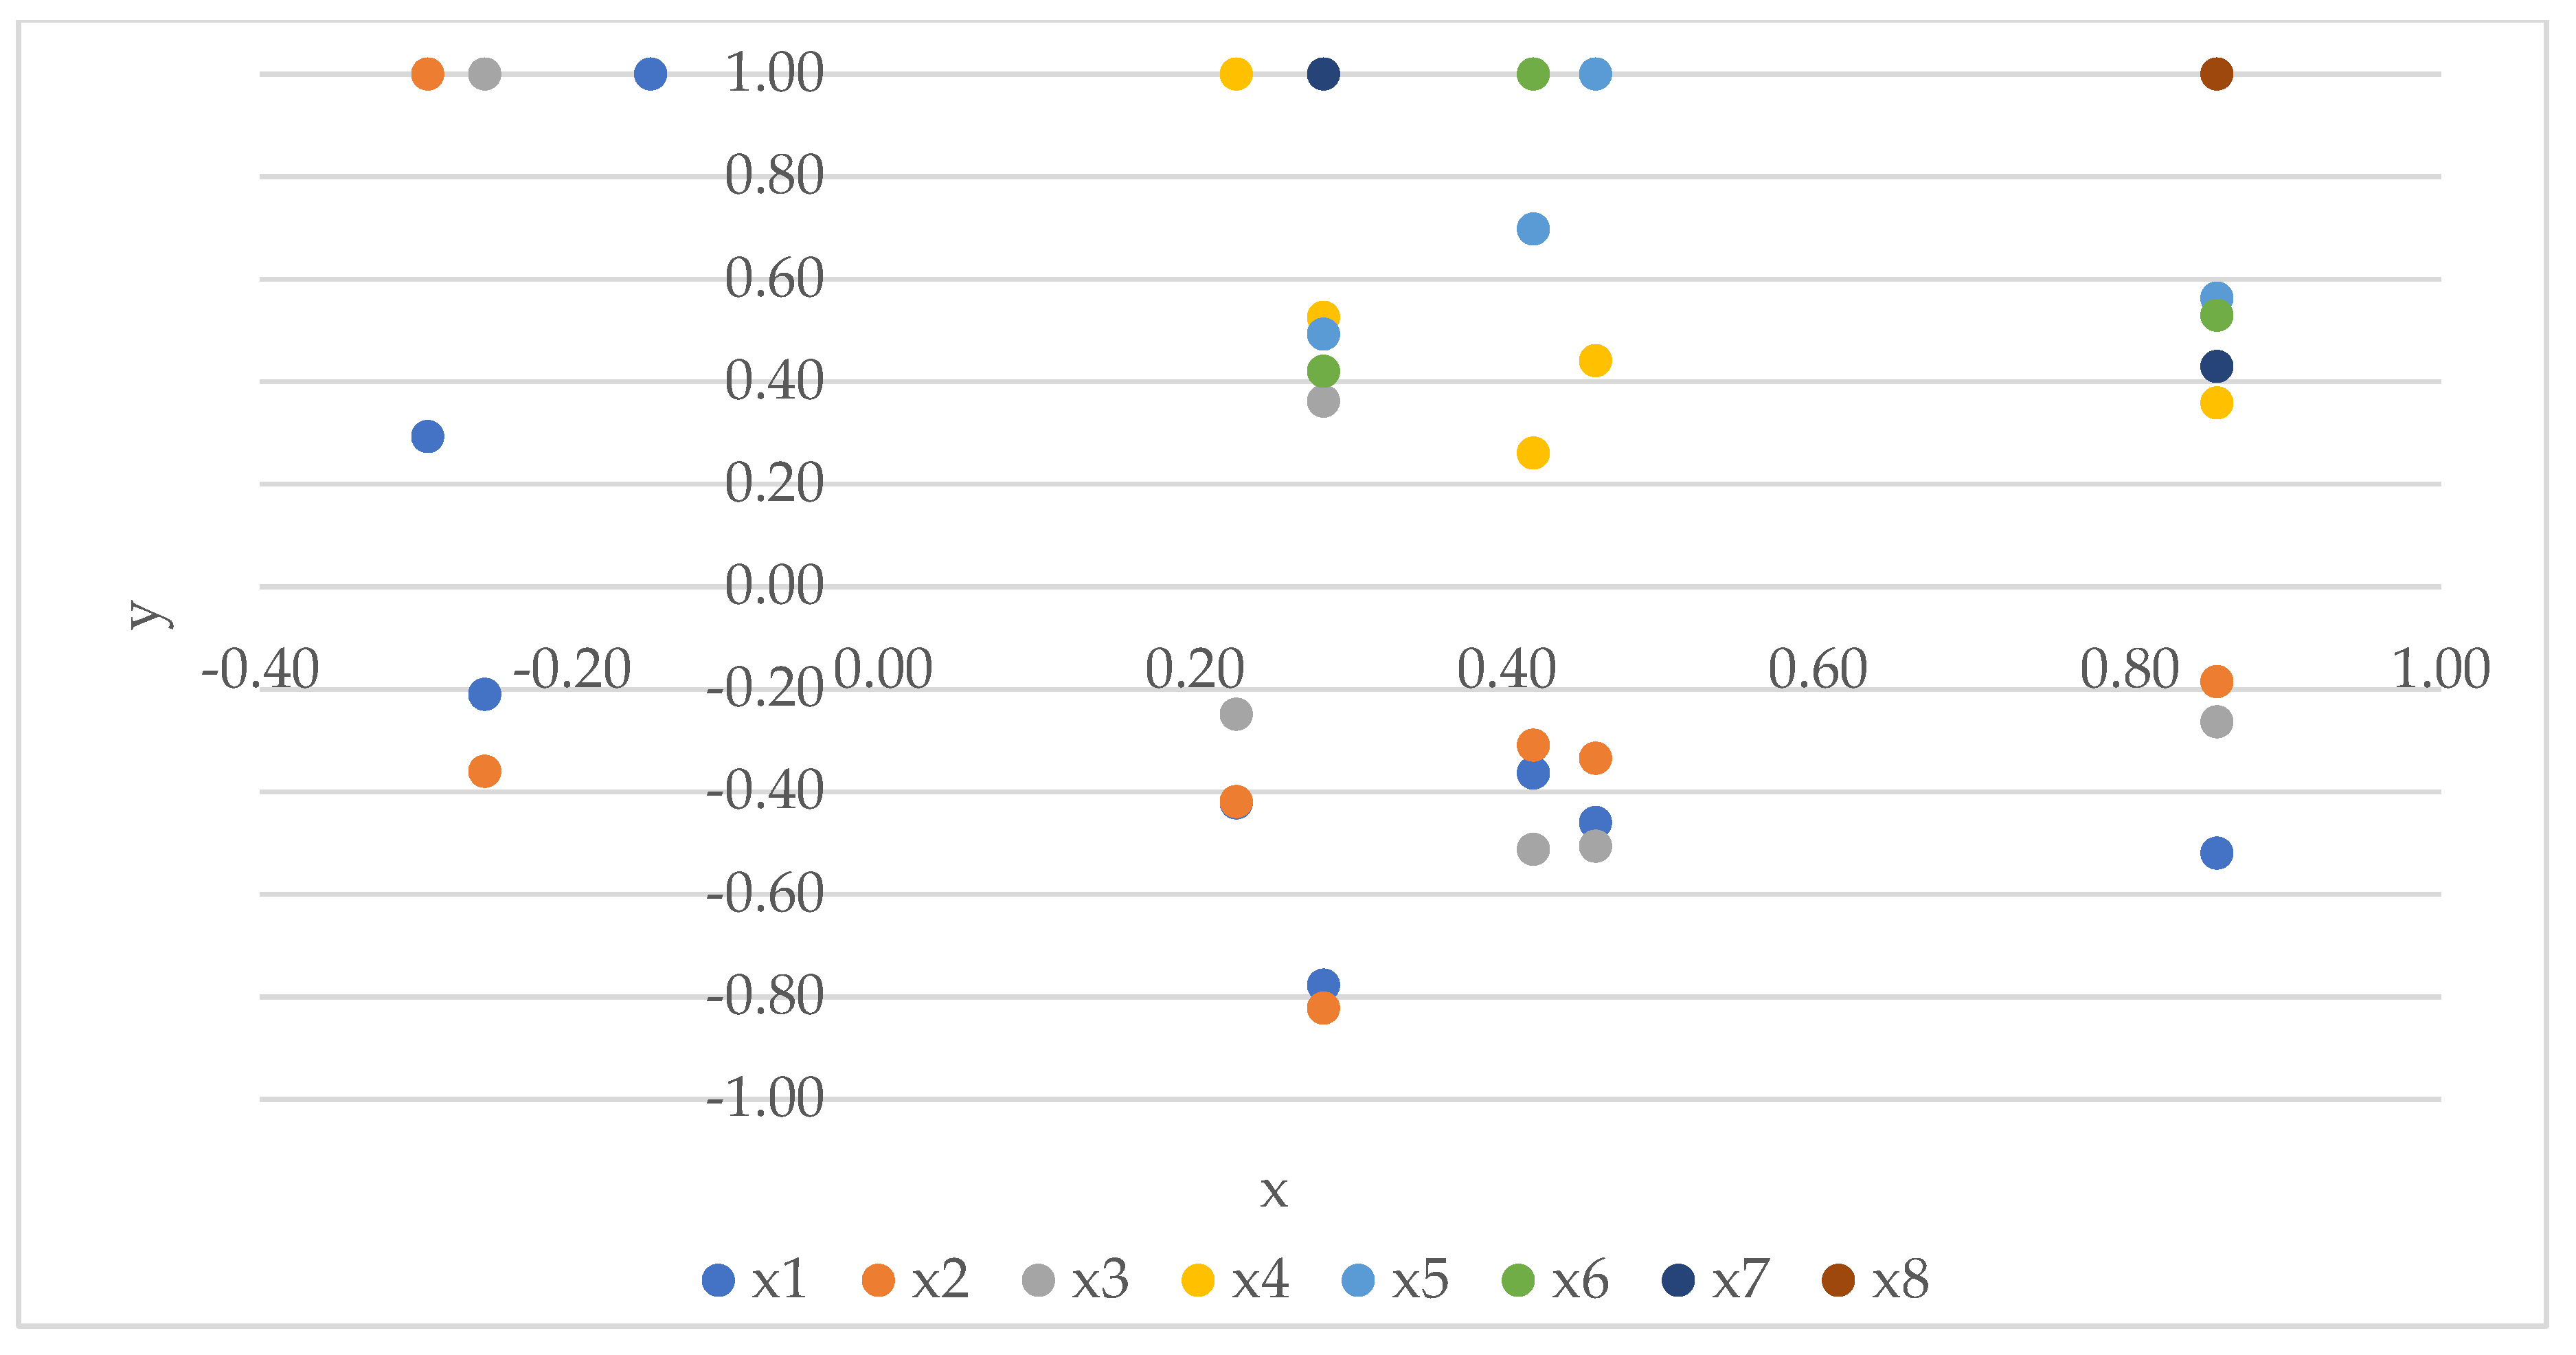

Table 1.
Selected elements of potato cultivation in the technologies of potato production.
| Specification* | Technologies | |
| Traditional | With Supporter | |
| Pre-planting treatments | With out | Supporter (300 ml + 30l water ·ha−1) |
| Fertilization | Biennial compost (straw + red clover + hay) – 35 t·ha−1 + NPK 90-90-135 kg ha−1 | Biennial compost (straw + red clover + hay) – 35 t·ha−1 + NPK 90-90-135 kg ha−1 |
| Weed control systems | Afalon 450 SC − 2 l·ha−1 Fusilade Super 125 EC − 2 1·ha−1 |
Afalon 450 SC − 2 l·ha−1 Fusilade Forte 150 EC – 1.5 1·ha−1 |
| Potato beetle control | Calypso 480 SC 0.1 1·ha−1 – 1 measure Actara 25 WG 0.08 kg·ha−1 – 1 measure Cyperkil Max 500 EC 0.05 1·ha−1 – 1 measure Karate Zeon 050CS 0.1 l·ha−1 – 1 measure |
Calypso 480 SC 0.1 1·ha−1 – 1 measure Actara 25 WG 0.08 kg·ha−1 – 1 measure Cyperkil Max 500 EC 0.05 1·ha−1 – 1 measure Karate Zeon 050CS 0.1 l·ha−1 – 1 measure |
| Potato blight control | Pyton Consento 450 SC 2.0 l·ha−1 – 1 measure Infinito 687.5 SC 1.6 l·ha−1 – 1 measure Ridomil Gold MZ 67.8 WG 2.0 kg·ha−1 – 1 measure Acrobat MZ 69 WG – 2.0 kg ha−1 – 1 measure |
Pyton Consento 450 SC 2.0 l·ha−1 – 1 measure Infinito 687.5 SC 1.6 l·ha−1 – 1 measure Ridomil Gold MZ 67.8 WG 2.0 kg·ha−1 – 1 measure Acrobat MZ 69 WG – 2.0 kg ha−1 – 1 measure |
| Harvest | Harvesting with an elevator digger at the time of technical ripeness of the tubers (99° in the BBCH scale) [Bleinholder i in. 2005] | Harvesting with an elevator digger at the time of technical ripeness of the tubers (99° On the BBCH scale) [Bleinholder i in. 2005] |
*Preceding crop - Potato – Spring barley – Faba bean – Winter wheat + Cover crop (White mustard).
Table 2.
Characteristics of the tested potato varieties.
| Varieties | Breeder | Peel color | Flesh color | Culinary type | Starch content (%) |
Yield of tubers (t · ha−1) |
| Early varieties | ||||||
| ‘Innovator’ | HZPC Holland, BV | yellow | creamy | B | 14.8 | 44.2 |
| ‘Lilly’ | Solana Polska | yellow | yellow | BC | 14.0-14.5 | 40.0 |
| ‘Lady Claire’ | HZPC Holland, BV | yellow | light yellow | BC | 16.7 | 38.4 |
| Moderately variety | ||||||
| ‘Verdi’ | Solana Polska | yellow | yellow | BC | 19-20 | 36.4 |
Table 3.
Content of available forms of phosphorus, potassium, magnesium humus and soil reaction (2015-2017).
Table 3.
Content of available forms of phosphorus, potassium, magnesium humus and soil reaction (2015-2017).
| Lata | Macroelements content [g · kg−1] | pHKCL | Humus [g·kg−1] |
||
| P2O5 | K2O | Mg | |||
| Kędrzyno | |||||
| 2015 | 24.8 | 9.0 | 3.4 | 5.6 | 1.01 |
| 2016 | 18.8 | 18.0 | 3.9 | 6.0 | 1.06 |
| 2017 | 17.0 | 15.0 | 6.2 | 6.4 | 1.12 |
| Barankowo | |||||
| 2015 | 31.9 | 14.8 | 3.3 | 5.8 | 1.2 |
| 2016 | 25.0 | 12.7 | 3.2 | 6.0 | 1.4 |
| 2017 | 30.4 | 12.4 | 2.9 | 5.9 | 1.3 |
| Ryn | |||||
| 2015 | 14.5 | 16.0 | 3.6 | 6.1 | 1.1 |
| 2016 | 14.7 | 17.5 | 3.8 | 6.3 | 1.3 |
| 2017 | 15.0 | 19.0 | 4.0 | 6.4 | 1.4 |
| Głubczyce | |||||
| 2015 | 27.8 | 22.6 | 11.8 | 6.6 | 1.8 |
| 2016 | 25.2 | 21.5 | 12.8 | 6.5 | 1.7 |
| 2017 | 21.8 | 19.1 | 12.0 | 6.4 | 1.6 |
Note. Source of own experiment results, which made in the Laboratory Central of Agro-Ecological, the University of Life Science in Lublin.
Table 4.
Total rainfall and average air temperature in Barankowo, Gołubczyce, Kędrzyno and Ryn in the period May- September (2015-2017).
Table 4.
Total rainfall and average air temperature in Barankowo, Gołubczyce, Kędrzyno and Ryn in the period May- September (2015-2017).
| Locations | Total rainfall [mm] | ||
| 2015 | 2016 | 2017 | |
| Barankowo | 237.1 | 306.9 | 508.9 |
| Głubczyce | 218.4 | 472.3 | 465.9 |
| Kędrzyno | 383.9 | 476.1 | 712.8 |
| Ryn | 241.3 | 350.0 | 451.6 |
| Average air temperature [ °C] | |||
| Barankowo | 13.4 | 15.3 | 14.1 |
| Głubczyce | 15.9 | 15.7 | 15.2 |
| Kędrzyno | 12.2 | 14.9 | 14.0 |
| Ryn | 14.5 | 13.8 | 14.1 |
Table 5.
Sielianinov hydrothermal coefficients (2015-2017).
| Localities | Month | Years | ||
| 2015 | 2016 | 2017 | ||
| Barankowo | April | 1.3 | 1.4 | 2.0 |
| May | 0.7 | 0.7 | 2.0 | |
| June | 1.3 | 1.2 | 2.2 | |
| July | 1.2 | 1.9 | 2.3 | |
| August | 0.3 | 1.1 | 1.9 | |
| September | 1.1 | 0.2 | 1.0 | |
| Mean | 0.9 | 1.0 | 1.9 | |
| Głubczyce | April | 0.8 | 2.1 | 5.6 |
| May | 0.8 | 2.5 | 1.2 | |
| June | 1.6 | 1.4 | 0.6 | |
| July | 0.5 | 2.7 | 1.2 | |
| August | 0.2 | 0.7 | 0.9 | |
| September | 0.5 | 0.5 | 3.1 | |
| Mean | 0.7 | 1.6 | 2.1 | |
| Kędrzyno | April | 1.1 | 1.2 | 4.1 |
| May | 1.9 | 1.6 | 1.0 | |
| June | 2.3 | 1.6 | 3.5 | |
| July | 3.6 | 3.0 | 3.2 | |
| August | 0.3 | 1.5 | 2.9 | |
| September | 2.3 | 0.8 | 2.2 | |
| Mean | 1.9 | 1.6 | 2.8 | |
| Ryn | April | 0.8 | 1.7 | 3.6 |
| May | 2.7 | 1.1 | 0.5 | |
| June | 0.4 | 0.9 | 1.1 | |
| July | 1.0 | 2.4 | 2.4 | |
| August | 0.4 | 1.5 | 1.0 | |
| September | 0.3 | 0.3 | 2.7 | |
| Mean | 0.9 | 1.3 | 1.8 | |
The value of the hydrothermal coefficient was calculated according to the formula: k = P/∑t × 10, where: P – monthly sum of precipitation in mm, ∑t – monthly sum of air temperatures >0 °C [37]. Extremely dry month: k ≤ 0.4; very dry −0.4 < k ≤ 0.7; Dry 0.7 < k ≤ 1.0; Fairly dry 1.0 < k ≤ 1.3; optimal 1.3 < k ≤ 1.6; quite humid 1.6 < k ≤ 2.0; humid 2.0 < k ≤ 2.5; very humid 2.5 < k ≤ 3.0; extremely humid k > 3.0.
Table 6.
The influence of cultivation technology, varieties and years on the total yield of potato tubers (t·ha−1) (average for location).
Table 6.
The influence of cultivation technology, varieties and years on the total yield of potato tubers (t·ha−1) (average for location).
| Varieties | Technologies | Mean | ||||||||||
| Traditional | With Supporter | |||||||||||
| Years | Mean | Years | Mean | Years | Mean | |||||||
| 2015 | 2016 | 2017 | 2015 | 2016 | 2017 | 2015 | 2016 | 2017 | ||||
| ‘Verdi’ | 33.19a | 43.43a | 38.19a | 38.27ab | 31.64a | 51.64a | 40.63a | 41.30b | 32.42b | 47.54a | 39.41b | 39.79b |
| ‘Innovator’ | 20.84a | 30.15a | 28.48a | 26.49b | 36.24a | 27.95a | 35.93a | 33.37c | 28.54c | 29.05b | 32.21c | 29.93c |
| ‘Lilly’ | 47.48a | 41.87a | 43.92a | 44.42a | 60.52a | 48.28a | 45.62a | 51.47a | 54.00a | 45.08a | 44.77a | 47.95a |
| ‘Lady Claire’ | 32.47a | 48.64a | 45.26a | 42.12a | 31.26a | 51.12a | 53.59a | 45.32ab | 31.87b | 49.88a | 49.43a | 43.72b |
| Mean | 33.50a | 41.02a | 39.0a | 37.83b | 39.92a | 44.75a | 43.94a | 42.87a | 36.71b | 42.89a | 41.45a | 40.35 |
| LSDp0.05 | ||||||||||||
| Technologies | 2.22 | |||||||||||
| Varieties | 4.44 | |||||||||||
| Years | 3.33 | |||||||||||
| Tech. × varieties | 8.88 | |||||||||||
| Varieties × years | 13.32 | |||||||||||
*Equal letter notations indicate that the mean values for different groups do not differ significantly from each other. This means that there is no significant statistical difference between the groups, indicating that we cannot reject the null hypothesis, which assumes no differences between the groups.
Table 7.
Total yield of potato tubers depending on technology and location (t ha−1) (Mean for varieties and years).
Table 7.
Total yield of potato tubers depending on technology and location (t ha−1) (Mean for varieties and years).
| Locations | Technologies | Mean | |
| Traditional | With Supporter | ||
| Barankowo | 26.49b* | 33.37c | 29.93c |
| Głubczyce | 44.42a | 51.47a | 47.94a |
| Kędrzyno | 38.27a | 41.30b | 39.78b |
| Ryn | 42.12a | 45.32a | 43.72ab |
| LSDp0.05 | 8.88 | 4.44 | |
| Mean | 37.83b | 42.87a | 40.34 |
| LSDp0.05 | 2.22 | ||
*Equal letter notations indicate that the mean values for different groups do not differ significantly from each other. This means that there is no significant statistical difference between the groups, indicating that we cannot reject the null hypothesis, which assumes no differences between the groups.
Table 8.
Share of potato tuber mass by diameter fractions (<28, 28-35, 35-50, 50-55, 55-60, and >60 mm) depending on cultivation technology, potato varieties, and harvest years (%) (Mean from locations).
Table 8.
Share of potato tuber mass by diameter fractions (<28, 28-35, 35-50, 50-55, 55-60, and >60 mm) depending on cultivation technology, potato varieties, and harvest years (%) (Mean from locations).
| Experimental factors | Tuber diameter fractions (mm) | ||||||
| <28 | 28–35 | 35–50 | 50–55 | 55–60 | >60 | ||
| Technologies | Traditional | 2.07a* | 5.84b | 50.49a | 18.62b | 13.06a | 9.92a |
| With Supporter | 2.01a | 7.52a | 49.11a | 20.29a | 12.54b | 8.53b | |
| LSD0.05 | ns** | 0.75 | 2.73 | 0.65 | 0.37 | 0.22 | |
| Varieties | ‘Verdi’ | 3.53a | 8.63a | 58.03a | 16.80c | 9.00d | 4.01c |
| ‘Innovator’ | 1.57b | 5.66bc | 56.39a | 19.55b | 10.61c | 6.22b | |
| ‘Lilly’ | 1.97b | 5.25c | 50.85b | 21.24a | 14.41b | 6.28b | |
| ‘Laidy Claire’ | 1.11bc | 7.13b | 33.98c | 20.19ab | 17.17a | 20.42a | |
| LSD0.05 | 1.51 | 1.51 | 5.47 | 1.30 | 0.74 | 0.44 | |
| Locations | Barankowo | 3.50a | 8.70a | 56.54a | 17.14c | 8.84d | 5,28c |
| Głubczyce | 1.66b | 5.60c | 56.32a | 19.78c | 10.65c | 5.99c | |
| Kędrzyno | 1.80b | 5.02d | 51.43b | 20.31a | 14.23b | 7.21b | |
| Ryn | 1.19c | 7.40b | 34.90c | 20.56a | 17.48a | 18.47a | |
| LSDp0.05 | 0.15 | 0.43 | 3.29 | 1.26 | 0.96 | 0.62 | |
| Years | 2015 | 1.95a | 8.60a | 57.47a | 18.92b | 10.32b | 2.74c |
| 2016 | 1.97a | 5.70b | 44.96b | 18.23b | 15.43a | 13.71a | |
| 2017 | 2.20a | 5.76b | 46.96b | 21.20a | 12.65b | 11.23b | |
| LSD0.05 | ns | 1.13 | 4.10 | 0.97 | 0.55 | 0.33 | |
| Mean | 2.04 | 6.68 | 49.80 | 19.45 | 12.80 | 9.23 | |
*Equal letter notations indicate that the mean values for different groups do not differ significantly from each other. This means that there is no significant statistical difference between the groups, indicating that we cannot reject the null hypothesis, which assumes no differences between the groups;**ns – not significant at p0.05.
Table 9.
The impact of cultivation technology, varieties and years on the share of commercial tubers in the total yield (%) (Mean for locations).
Table 9.
The impact of cultivation technology, varieties and years on the share of commercial tubers in the total yield (%) (Mean for locations).
| Varieties | Technologies | Mean | Mean | |||||||||
| Traditional | With Supporter | |||||||||||
| Years | Mean | Years | Mean | Years | ||||||||
| 2015 | 2016 | 2017 | 2015 | 2016 | 2017 | 2015 | 2016 | 2017 | ||||
| ‘Verdi’ | 60.95a | 69.51a | 54.14a | 61.53b | 61.42a | 72.89a | 55.63a | 63.31b | 61.19b | 71.20a | 54.89b | 62.42b |
| ‘Innovator’ | 83.82a | 61.40a | 76.22a | 73.81a | 87.20a | 61.93a | 73.05a | 74.06a | 85.51a | 61.67b | 74.64a | 73.94a |
| ‘Lilly’ | 74.92a | 75.93a | 73.81a | 74.89a | 77.97a | 64.35a | 83.02a | 75.11a | 76.45a | 70.14a | 78.42a | 75.00a |
| ‘Lady Claire’ | 76.26a | 84.21a | 73.91a | 78.13a | 61.50a | 86.36a | 85.74a | 77.87a | 68.88ab | 85.29a | 79.83a | 78.00a |
| Mean | 73.99a | 72.76a | 69.52a | 72.09a | 72.02a | 71.38a | 74.36a | 72.59a | 73.01a | 72.07a | 71.94a | 72.34 |
| LSD p0.05 | ||||||||||||
| Technologies | ns** | |||||||||||
| Varieties | 7.96 | |||||||||||
| Years | ns | |||||||||||
| Tech. x varieties | 15.92 | |||||||||||
| Varieties x years | 23.87 | |||||||||||
*Equal letter notations indicate that the mean values for different groups do not differ significantly from each other. This means that there is no significant statistical difference between the groups, indicating that we cannot reject the null hypothesis, which assumes no differences between the groups; **ns – not significant et p0.05.
Table 10.
The impact of cultivation technology, varieties and years on marketable yield (t·ha−1) (Mean for Locations).
Table 10.
The impact of cultivation technology, varieties and years on marketable yield (t·ha−1) (Mean for Locations).
| Varieties | Technologies | Mean | Mean | |||||||||
| Traditional | With Supporter | Years | ||||||||||
| Years | Mean | Years | Mean | |||||||||
| 2015 | 2016 | 2017 | 2015 | 2016 | 2017 | 2015 | 2016 | 2017 | ||||
| ‘Verdi’ | 20.41a | 30.19a | 20.72a | 23.77b | 19.39a | 37.60a | 22.52a | 26.50b | 19.90c | 33.90ab | 21.62 | 25.14b |
| ‘Innovator’ | 17.51a | 18.89a | 21.89a | 19.43bc | 31.55a | 17.69a | 26.17a | 25.14b | 24.53bc | 18.29c | 24.03b | 22.28bc |
| ‘Lilly’ | 36.12a | 31.17a | 32.45a | 33.25a | 47.24a | 30.94a | 37.95a | 38.71a | 41.68a | 31.06b | 35.20a | 35.98a |
| ‘Lady Claire’ | 24.81a | 40.94a | 33.49a | 33.08a | 33.92a | 44.14a | 45.97a | 41.34a | 29.37b | 42.54a | 39.73a | 37.21a |
| Mean | 24.71b | 30.30a | 27.14a | 27.38b | 33.03a | 32.59a | 33.15a | 32.92a | 28.87b | 31.45a | 30.15a | 30.15 |
| LSDp0.05 | ||||||||||||
| Technologies | 1.66 | |||||||||||
| Varieties | 3.32 | |||||||||||
| Years | 2.49 | |||||||||||
| Tech. x Var. | 6.64 | |||||||||||
| Tech. x Years | 4.98 | |||||||||||
| Var. x years | 9.96 | |||||||||||
*Equal letter notations indicate that the mean values for different groups do not differ significantly from each other. This means that there is no significant statistical difference between the groups, indicating that we cannot reject the null hypothesis, which assumes no differences between the groups.
Table 11.
The impact of location and cultivation technology on marketable yield (t.ha−1) (Mean for varieties and years).
Table 11.
The impact of location and cultivation technology on marketable yield (t.ha−1) (Mean for varieties and years).
| Locations | Technologies | Mean | |
| Traditional | With Supporter | ||
| Kędrzyno | 29.60a* | 32.88a | 31.24b |
| Barankowo | 22.32a | 28.53a | 25.42bc |
| Głubczyce | 36.90a | 44.19a | 40.54a |
| Ryn | 35.08a | 38.87a | 36.97a |
| LSDp0.05 | ns** | 8.94 | |
| Mean | 30.97b | 36.11a | 33.54 |
| LSDp0.05 | 4.47 | ||
*Equal letter notations indicate that the mean values for different groups do not differ significantly from each other. This means that there is no significant statistical difference between the groups, indicating that we cannot reject the null hypothesis, which assumes no differences between the groups; *ns – not significant at p0.05.
Table 12.
Descriptive statistics of dependent and independent variables.
| Specification | y1 | x1 | x2 | x3 | x4 | x5 | x6 | x7 | x8 |
| Mean | 40.34 | 2.04 | 6.68 | 49.80 | 19.45 | 12.80 | 9.23 | 72.34 | 30.15 |
| Standard error | 0.70 | 0.49 | 0.28 | 0.82 | 0.62 | 0.70 | 0.91 | 0.86 | 0.67 |
| Median | 38.62 | 1.74 | 6.16 | 50.00 | 19.12 | 10.81 | 4.29 | 74.26 | 29.66 |
| Standard deviation | 10.44 | 1.10 | 4.19 | 12.29 | 9.20 | 10.50 | 13.89 | 12.86 | 10.00 |
| Kurtosis | -0.77 | 0.03 | 0.41 | 1.10 | -0.49 | -0.72 | 3.34 | 2.84 | -0.86 |
| Skewness | 0.06 | 0.12 | 2.17 | 0.28 | 0.52 | 0.74 | 2.06 | -1.24 | 0.21 |
| Range | 47.30 | 4.46 | 33.30 | 71.97 | 41.23 | 41.27 | 52.88 | 75.38 | 41.17 |
| Minimum | 18.06 | 0.36 | 2.32 | 12.98 | 2.12 | 0.00 | 0.00 | 17.56 | 11.27 |
| Maximum | 65.36 | 4.82 | 35.62 | 84.95 | 43.45 | 41.27 | 52.88 | 92.94 | 52.44 |
| Coefficient of variation V (%) | 25.88 | 53.92 | 62.72 | 24.69 | 47.30 | 82.03 | 150.49 | 17.78 | 33.16 |
y1 – total tuber yield, x1 – share of the mass of tubers with a diameter of <28 mm, x2 – share of the mass of tubers with a diameter of 28-35 mm; x3 – mass share of tubers with a diameter of 35-50 mm; x4 – mass share of tubers with a diameter of 50-55 mm; x5 – mass share of tubers with a diameter of 55-60 mm; x6 – mass share of tubers with a diameter >60 mm; x7 – share of the mass of commercial tubers; x8 – marketable yield of tubers.
Disclaimer/Publisher’s Note: The statements, opinions and data contained in all publications are solely those of the individual author(s) and contributor(s) and not of MDPI and/or the editor(s). MDPI and/or the editor(s) disclaim responsibility for any injury to people or property resulting from any ideas, methods, instructions or products referred to in the content. |
© 2024 by the authors. Licensee MDPI, Basel, Switzerland. This article is an open access article distributed under the terms and conditions of the Creative Commons Attribution (CC BY) license (http://creativecommons.org/licenses/by/4.0/).
Copyright: This open access article is published under a Creative Commons CC BY 4.0 license, which permit the free download, distribution, and reuse, provided that the author and preprint are cited in any reuse.


