
Submitted:
17 March 2025
Posted:
18 March 2025
You are already at the latest version
Abstract
Irish potato (Solanum tuberosum) is a critical crop for food security and economic growth in Tsangano and Angónia districts, central Mozambique. Challenges like inconsistent yields and variable quality are often linked to suboptimal soil conditions, and limit production. This study aimed to classify and evaluate the suitability of soils for potato cultivation, filling gaps in detailed soil assessments for sustainable agriculture. Using combined pedological approach and laboratory soil analysis, four pedons TSA-P01 and TSA-P02 in Tsangano, and ANGO-P01 and ANGO-P02 in Angónia were analyzed for bulk density, texture, pH, organic carbon, and nutrient content. The pedons were very deep (> 150 cm) and had textures ranging from sandy clay loam to sandy loam. TSA-P02 had the lowest bulk density (0.78 Mg m-3) and the highest available water capacity (182.0 mm m-1). Soil pH ranged from 5.6 to 7.9, indicating neutral to slightly acidic conditions. Nutrient analysis revealed low total nitrogen (0.12 - 0.22%), varying soil organic carbon (0.16 - 2.73%), and cation exchange capacity (10.1 - 11.33 cmol(+) kg-1). Pedons TSA-P01, ANGO-P1, and ANGO-P02 were characterized by eluviation and illuviation as dominant pedogenic processes while in pedon TSA-P02 shrinking and swelling were the pedo-genic processes. Weathering indices identified ANGO-P01 as the most highly weathered, while TSA-P02 was the least weathered and had better fertility indicators. According to USDA Taxonomy, the soils were classified as Ultisols, Vertisols, and Alfisols, corresponding to Acrisols, Alisols, Vertisols, and Luvisols in the WRB for Soil Resources. All studied soils were marginally suitable for potato production (S3f) due to dominant fertility constraints but with varying minor limitations in climate, topography, and soil physical properties. The findings hence recommended targeted soil fertility management to enhance productivity and sustainability in potato cultivation.
Keywords:
Pedological characterization
; soil morphological properties
; pedons
; soil classification
; soil suitability assessment
; Irish potato
; Mozambique
1. Introduction
Irish potato (Solanum tuberosum) is a critical crop in global agriculture due to its high nutritional value and role as a staple food. In Mozambique, it holds particular importance in the Tsangano and Angónia districts of central Mozambique, which collectively contribute approximately 90% of the nation’s production [1]. Beyond its dietary significance, Irish potato cultivation underpins local economies, supporting food security and household income in these regions [2,3]. Despite its potential, productivity in Mozambique remains low, with average yields of 9 t ha-¹ [4] compared to global averages. Key constraints include declining soil fertility, inadequate precipitation, limited access to improved seed varieties, and poor fertilizer management. These challenges, combined with the crop’s vulnerability to diseases, lead to inconsistent yields and quality [5,6].
Soil quality is fundamental to addressing these constraints, as it directly influences agricultural productivity and crop health. High-quality soils fulfill essential functions, such as providing a reservoir for nutrients and water, promoting root development, and supporting soil microbial activity, which are critical for sustainable Irish potato cultivation [2,7]. However, achieving sustainable productivity requires a thorough understanding of the specific physical, chemical, and biological properties of soils, alongside their interactions with climatic and management factors.
Pedological description and soil classification play a pivotal role in this context. A detailed analysis of soil morphology, texture, organic matter, nutrient content, and pH can identify specific limitations to crop growth and guide interventions tailored to enhance soil health. This is particularly critical for Irish potato production, as the crop is highly sensitive to soil drainage, nutrient availability, and moisture-retentive properties [8]. Proper soil classification provides the foundation for selecting suitable management practices, determining appropriate fertilizer regimes, and mitigating soil constraints through targeted interventions.
Degradation of soil quality, driven by unsustainable land-use practices, poor soil management, and the expansion of cultivation into marginal areas, has led to extensive nutrient depletion and structural deterioration, especially in semi-arid regions [9,10,11].
In Mozambique, this issue poses a critical challenge to agricultural sustainability, threatening both productivity and food security. The situation is further aggravated by limited access to the resources and technologies required to mitigate soil degradation and restore soil functionality. Addressing this challenge requires a comprehensive assessment of soil physico-chemical properties, as highlighted in recent studies by, which emphasize the importance of these evaluations in guiding strategies to enhance soil health and support sustainable agricultural systems [12,13,14].
The concept of land suitability provides a framework for evaluating soil’s capacity to meet the requirements of specific crops, such as Irish potatoes. It involves assessing how well soil properties align with crop needs under defined levels of input and management [15,16,17]. The [18,19] classification systems categorize land suitability into four levels: orders (e.g., suitable [S] and not suitable [N]), classes (e.g., highly suitable [S1], moderately suitable [S2]), subclasses indicating specific limitations (e.g., soil fertility or moisture constraints), and units, reflecting minor variations within subclasses. These classifications provide actionable insights into the constraints affecting soil performance and potential pathways for optimization.
Despite the relevance of these tools, a significant gap remains in applying detailed pedological evaluations to improve potato cultivation in Mozambique. Limited research has focused on how specific soil properties, including drainage, nutrient content, and physical structure, influence potato yields in the districts of Tsangano and Angónia. This lack of localized data limits the formulation of effective recommendations for managing soil fertility and achieving optimal productivity. The present study addresses this gap by classifying soils in Tsangano and Angónia according to the USDA Soil Taxonomy [20] and to tier-2 of the FAO World Reference Base for Soil Resources [21]. Additionally, it evaluates the suitability of these soils for Irish potato cultivation using methodologies established by [18,19]. By providing specific recommendations for soil fertility management and the adoption of sustainable agricultural practices, this study seeks not only to enhance Irish potato yields but also to promote sustainability and long-term agricultural productivity in these strategic districts of Tete Province, Mozambique.
2. Materials and Methods
2.1. Description of the Study Areas
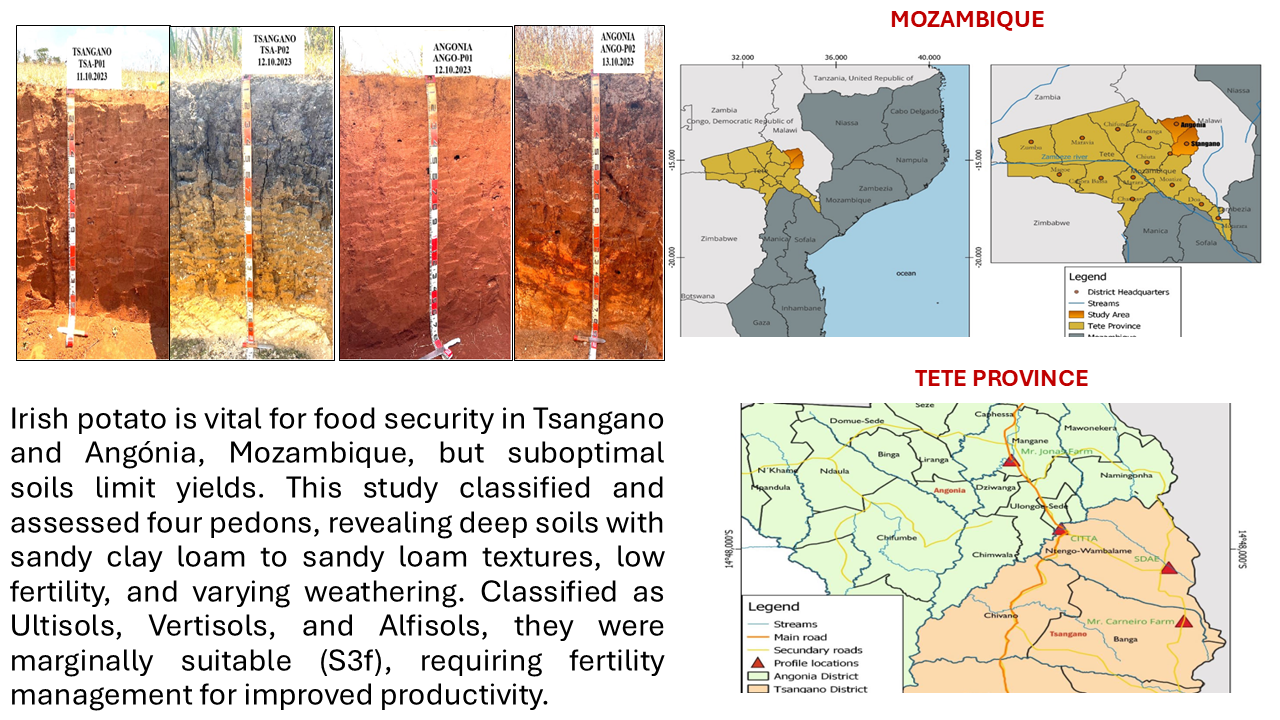
Tete Province is situated in the far northwest of Mozambique, sharing borders with three countries: the Republic of Malawi to the north and east, Zambia to the west, and Zimbabwe to the south. It also borders three other Mozambican provinces: Zambezia to the east, and Manica and Sofala to the south [22]. Geographically, Tete lies between the coordinates 14°00′S and 17°42′01”S latitude and 30°13′E and 35°20′07”E longitude. Spanning a total area of 100.742 km², the province consists of 98.230 km² of land and 2.494 km² of inland waters. This makes Tete the third largest province in Mozambique, following Niassa and Zambezia in terms of size [22]. The province is divided into 15 administrative Districts: Angónia, Moatize, Mutarara, Tsangano, Zumbu, Chifunde, Chiúta, Macanga, Marávia, and four districts in the south area of the Zambezi River, Cahora-Bassa, Changara, Mágoè, and Tete (see Figure 1).
The study was conducted in agricultural areas dedicated to Irish potato cultivation by examining four farms in Tsangano and Angónia Districts of Tete Province, Mozambique. Tsangano District covers 3,670 km², with altitudes ranging from 500 to 1,900 m.a.s.l., situated at approximately 15°37′17” S and 34°44′47” E. Angónia District spans 3,277 km², with altitudes ranging from 700 to 1,700 m.a.s.l., located near 14°42′57” S and 34°22′23” E [23,24]. Representative study sites included Mr. Manuel Carneiro’s farm and the SDAE farm in Ligowe and Ntengo-wa-mbalame villages, respectively, in Tsangano, and Mr. Jonas’ farm and the CITTA farm in Rinze and Ulónguè villages, respectively, in Angónia.
Both districts fall within Agro-Ecological Zone 10, characterized as high rainfall zones receiving annual precipitation of 800–1,200 mm [23,25]. The region has a unimodal rainfall distribution, primarily from November to April, and a humid tropical climate with mean annual temperatures ranging from 15–22°C [26,27]. The landforms in Tsangano range from hilly to peneplain, while in Angónia, they include plains and old alluvial plains with slopes between 5–16%. The geology comprises Precambrian Meso- and Neoproterozoic lithology dominated by quartz-feldspathic gneiss and amphibolic gneiss in Tsangano and basic rocks, migmatitic gneisses, and granulites in Angónia [27,28]. The primary soil types include Lixisols in Tsangano, known for moderate fertility but erosion susceptibility, and Ferralsols and Luvisols in Angónia, which vary in nutrient retention and degradation potential [23]. Irish potato cultivation, alongside maize, beans, soybeans, and vegetables, is prominent in both districts under rain-fed agriculture [22]. Specific site attributes, including coordinates, altitudes, soil and temperature regimes, and land use, are summarized in Table 1.
Table 1 highlights four representative sites, TSA-P01 and TSA-P02 in Tsangano and ANGO-P01 and ANGO-P02 in Angónia. These sites feature varied altitudes (1,200–1,427 m.a.s.l.), geological formations, and natural vegetation types, with land uses ranging from grazing and fallow to active agricultural cultivation. Despite their similarities in rainfall patterns and climatic conditions, differences in soil moisture regimes (Ustic vs. Aquic) and drainage characteristics influence the soil formation processes and their suitability for crop production.
2.2. Field work
Reconnaissance field survey was carried out using transect walks, auger observations and descriptions to establish representative study sites based on landforms and other physiographic attributes. Forms designed by the National Soil Service, Tanzania and adapted from the FAO Guidelines for Soil Description [29] were used to record site data at each observation point on landform, soil morphological characteristics (soil color, texture, consistence, structure, porosity, effective depth, parent material, natural vegetation, drainage, slope, altitude, erosion, and land use). Munsell color charts [30] were used to determine soil color. This aided in the selection of representative study sites for the design of experimental trials, soil sampling and excavation of soil profile pits.
After conducting reconnaissance field surveys in each study site, the point within each study site for soil profile excavation was identified and geo-referenced (Figure 2), by international coordinates using Global Positioning System (GPS).
In each representative study site, one soil profile pit of 150 cm width, 200 cm length and depth ranging from 155 - 200 cm was excavated. The profiles were named as TSA-P01 at Ligowe vilage and TSA-P02 at District Service of Agriculture and Economics Activities farm (SDAE) at Ntengo-wa-mbalame vilage in Tsanagno District, ANGO-P01 and ANGO-P02 at Rinze village and in the Angónia Research Centre and Technologies Transfer (CITTA) at Ulongue village, Angonia District respectively (Figure 3).
The genetic soil horizons in each soil profile pit were demarcated followed by collection of disturbed soil samples from each soil horizon and undisturbed soil samples (core samples) from three soil horizons at 0 - 10, 45 - 50 and 95 - 100 cm depths, packed and well labeled for laboratory analysis.
Soil penetration resistance was measured in each soil horizon using pocket cone penetrometer (Daiki Rika Kogyo penetrometer Model DIK-5551) [31]. Five different points were sampled within the respective horizon and averaged to get one mean penetration resistance value per horizon that was compared to the critical value of 3 MPa adopted as a critical value for plant growth [31,32,33,34]. Disturbed soil samples were air-dried, ground, and sieved through a 2 mm sieve, packed in paper bags and well labeled for determination of physical and chemical soil properties in the laboratory.
2.3. Laboratory Soil Analysis
Soil samples were analyzed at the LUANAR Soil Science Laboratory in Malawi for physical and chemical properties. Bulk density (BD) was determined gravimetrically by drying undisturbed core samples at 105°C for 24 hours, then calculating BD from the soil and core weights [35]. Total porosity was calculated as: Total porosity (%) = (1−BD/Particle density) ×100 [17]. Moisture content at field capacity (FC) and permanent wilting point (PWP) was determined using a pressure plate apparatus at -3 bar (300 kPa) and -15 bar (1500 kPa), respectively. These values were converted to volume percent (Vol%) using BD, and available water content (AWC) was calculated as the difference between FC and PWP, expressed in mm/m [35]. Particle size distribution was determined by the Bouyoucos hydrometer method after dispersing soil with sodium hexametaphosphate, and soil texture was classified using the USDA textural triangle [36]. Soil pH and electrical conductivity (EC) were measured potentiometrically in a 1:2.5 soil-water suspension [35]. Organic carbon (OC) was determined using the Walkley-Black method [35] and converted to organic matter (OM) using a factor of 1.724 [37,38]. Total nitrogen (TN) was quantified using the micro-Kjeldahl [35,39]. Available phosphorus (P) and exchangeable bases (Ca²⁺, Mg²⁺, K⁺, Na⁺) were extracted with the Mehlich 3 extractant [40] and analyzed using a UV spectrophotometer (P), atomic absorption spectrometer (Ca²⁺, Mg²⁺), and flame photometer (K⁺, Na⁺). Cation exchange capacity (CEC) was determined using the ammonium acetate method at pH 7 [36]. The cation exchange capacity of clay (CECclay) was calculated as:
[41]
The total exchangeable bases (TEB) were calculated as the sum of Ca²⁺, Mg²⁺, K⁺, and Na⁺ [42], while base saturation (BS%), the C:N ratio and silt:clay ratio was also calculated using the formula by [43].
Twelve selected horizon samples were analyzed at the GST Laboratory in Tanzania for total elemental composition using X-Ray Fluorescence Spectrometry (XRF) [44]. Samples were dried, ground to ≤177 µm, and pressed into pellets. Magnesium (Mg) and sodium (Na) oxides were quantified by atomic absorption spectroscopy, while other oxides were determined using a PANalytical Minipal 4 ED-XRF. Weathering indices, including silica/alumina and silica/sesquioxide ratios, were used to assess weathering potential.
2.4. Data interpretation and Soil classification
The results obtained from laboratory analysis of soil physical and chemical properties were interpreted and compared to established standards for soil classification. The studied soils were classified to family level of the USDA Soil Taxonomy and to tier-2 of the FAO World Reference Base for Soil Resources [21] using field data collected (site characteristics, climate and soil morphological characteristics).
2.5. Soil Suitability Assessment
In this study, the suitability assessment of experimental sites for Irish potato production was conducted using the simple limitation method proposed by [45], where the observed land characteristics, including rainfall, temperature, slope, drainage, soil texture, effective soil depth, and soil nutrient content, were compared with the ecological requirements of Irish potato crops to determine the suitability of the studied pedons [46]. According to the [18,45] framework, the land suitability orders are categorized as suitable (S) and not suitable (N). Within each order, suitability classes define the degree of suitability: highly suitable (S1), moderately suitable (S2), marginally suitable (S3), currently not suitable (N1), and permanently not suitable (N2). Subclasses indicate specific limitations or recommended improvement measures (e.g., S2c for climatic limitations, S2f for soil fertility issues, and S3me for constraints related to moisture availability and erosion), while units further differentiate minor variations in management needs within the subclasses where the first letter of the suffix generally represents the most critical limitation, and the other suffixes denote subordinate or less severe limitations. (e.g., S2e-1, S2e-2 or S3(e,s,c).
To evaluate the suitability of the soils under study for Irish potato cultivation, limits were established based on the crop’s agronomic requirements, as outlined by [47,48]. According to these authors, Irish potatoes thrive in areas with slopes of 0-15%, rainfall of 1000-1200 mm, temperatures of 7-20°C, moderately deep soils (> 40 cm), moderately to well-drained soils, and loam, sandy loam, and silty loam textures. [46,49] specify the following chemical soil characteristics as the nutritional requirements for Irish potato crops: pH (5.5-7.0), organic carbon (5-10%), total nitrogen (> 0.30%), phosphorus (> 20 mg kg⁻¹), potassium (> 0.89 cmol(+) kg-1), calcium (> 10 cmol(+) kg-1), magnesium (> 3 cmol(+) kg-1), electrical conductivity (< 4 dS m⁻¹), sodium saturation (ESP) < 6%, copper (> 0.20 mg kg⁻¹), manganese (> 1.1 mg kg⁻¹), iron (> 2.5 mg kg⁻¹), and zinc (> 0.6 mg kg⁻¹) which were used to access the suitability in the study pedons.
3. Results
3.1. Soil Morphological Characteristics of the Studied Pedons
The studied pedons were named as TSA-P01 and TSA-P02 for Tsangano District and Ango-P01 and Ango-P02 for Angónia District. According to [17], the effective soil depths of the studied soils were categorized as very deep, being at least 150 cm deep (Table 2). Their morphological characteristics reveal distinct differences and similarities, offering insights into their formation processes, environmental influences, and suitability for agricultural use.
The drainage patterns exhibited slight variations across the pedons. ANGO-P01 and ANGO-P02 were well-drained, while TSA-P01 ranged from well to excessively well-drained, and TSA-P02 was well to moderately well-drained. Soil color serves as an important indicator of organic matter content, drainage status, and mineral composition [50]. Among the studied pedons, TSA-P02 had darker dry and moist topsoil colors (e.g., very dark grey and black), suggesting a higher organic matter accumulation compared to TSA-P01, ANGO-P01, and ANGO-P02, which exhibited brown, dark brown, and dark reddish-brown hues [50]. Subsoil colors varied significantly. TSA-P01 displayed reddish to yellowish-red hues, indicative of oxidized iron compounds and better drainage, whereas TSA-P02 showed black to olive-yellow subsoil, reflecting reducing conditions and potential waterlogging [50]. The Angónia pedons also demonstrated darker subsoils, with ANGO-P02 tending toward dark brown and ANGO-P01 displaying reddish tones, indicative of better aeration compared to TSA-P02. These color variations underscore the impact of drainage on soil properties, distinguishing the well-drained TSA-P01, ANGO-P01, and ANGO-P02 from the moderately well-drained TSA-P02.
Consistence ratings reflect soil strength and plasticity, which are critical for understanding soil workability and root penetration [51]. TSA-P01 exhibited firm consistence in the topsoil, transitioning to very hard and slightly hard subsoils, implying moderate resistance to cultivation [50]. Conversely, TSA-P02’s extremely hard subsoils indicate significant challenges for root growth and mechanization (Table 2). Angónia pedons displayed slightly hard to very hard consistence, with ANGO-P01 being firmer than ANGO-P02, suggesting differences in compaction, organic matter contents, and soil moisture retention [50]. These differences in consistence help to distinguish TSA-P02 as having less favorable physical properties for crop production compared to the other pedons.
The observed soil structures ranged from subangular blocky to massive (structureless), indicating variations in soil stability, porosity, and water infiltration [51]. TSA-P01 and ANGO-P01 exhibited weak to moderate subangular blocky structures, conducive to moderate permeability, while TSA-P02 showed angular blocky to massive structures in the subsoil, which could impede root growth and water movement [50]. ANGO-P02 exhibited a mix of subangular blocky and slightly massive structures, suggesting variability in drainage and porosity. These differences in structural development emphasize the contrasting pedogenetic processes and environmental conditions between Tsangano and Angónia pedons. The presence of clay cutans in TSA-P01, ANGO-P01, and ANGO-P02 provides strong evidence of eluviation and illuviation processes [21]. These features signify the downward translocation of clay and sesquioxides, which are typical of pedogenic development in well-drained environments. In contrast, TSA-P02 was characterized by shrinking and swelling as the dominant pedogenic processes responsible for the typical morphological features of deep wide cracking, extremely hard consistence, and angular to subangular structural blocks.
3.2. Soil Physical and Chemical Characteristics of the Studied Pedons
3.2.1. Soil Texture, Silt:Clay Ratio
The analytical results on soil texture, silt:clay ratio, and penetrometer resistance are given in Table 3. Soil texture plays a crucial role in agricultural productivity, influencing crop growth and yield, soil moisture availability, root penetration, erodibility, nutrient and water movement. Additionally, it affects soil structure, consistence, and overall workability [52].
The topsoils of TSA-P01, TSA-P02, and ANGO-P01 are sandy clay loam (SCL) and sandy clay (SC). In contrast, ANGO-P02 has a clayey (C) topsoil texture [17,53]. The subsoils of TSA-P01 and ANGO-P01 exhibit heavier clay textures. TSA-P02 has sandy subsoils, whereas ANGO-P02 transitions to sandy loam (SL) [50]. The silt-clay ratio provides insights into soil susceptibility to erosion and degree of weathering. A lower ratio (< 0.5) indicates higher weathering and greater erosion susceptibility [17]. While soil erosion is also influenced by other factors such as bulk density, soil organic matter, and climatic conditions [52], the topsoil silt-clay ratios of the studied pedons reveal notable differences. TSA-P02 (0.44) and ANGO-P01 (0.47) exhibit moderate resistance to erosion, whereas TSA-P01 (0.29) and ANGO-P02 (0.25) appear more prone to erosion.
3.2.2. Soil Bulk Density, Porosity, Penetration Resistance and Available Water Capacity (AWC)
Bulk density (BD) is a key indicator of soil quality and ecosystem function [17]. The analytical results on BD, porosity, and penetration resistance are provided in Table 3. Topsoil BD across the studied pedons ranges from 0.78 to 1.58 kg m⁻³, whereas subsoil BD varies from 1.25 to 1.58 kg m⁻³. Notably, BD increases with depth in TSA-P02 but decreases with depth in ANGO-P01 and TSA-P01. In ANGO-P02, BD exhibits a non-linear trend, increasing from the Ap to BA horizons before decreasing in the CR horizon.
Porosity ranges from 37.3% to 66.5% in the topsoil and from 30.0% to 49.0% in the subsoil. TSA-P02 exhibits the highest topsoil porosity (66.54%), reflecting its greater OM content and better granulation, which support root proliferation and crop growth [50]. In contrast, TSA-P01 has the lowest topsoil porosity (37.3%), which is associated with compaction and lower OM levels. The depth-dependent porosity trends vary, with declines observed in TSA-P02 and ANGO-P01, while TSA-P01 and ANGO-P02 exhibit inconsistent patterns.
Penetration resistance follows BD trends, increasing with depth in TSA-P02 and ANGO-P02, while decreasing in TSA-P01 and ANGO-P01. The higher BD in the subsoils of TSA-P02 and ANGO-P02 corresponds to increased penetration resistance (1.68 - 1.79 MPa and 1.28 - 1.54 MPa, respectively), largely influenced by high clay content [54]. In contrast, TSA-P01 and ANGO-P01 exhibit higher topsoil penetration resistance (> 1.76 MPa).
The results of available water capacity are presented in Table 3. AWC values range from 84.9 to 128.6 mm m⁻¹ in TSA-P01, 132.0 to 166.6 mm m⁻¹ in TSA-P02, 101.0 to 182.0 mm m⁻¹ in ANGO-P01, and 94.0 to 173.4 mm m⁻¹ in ANGO-P02. Topsoil AWC values generally fall within the low to medium range (84.9 mm m⁻¹ - 182.0 mm m⁻¹), offering moderate suitability for crop production [33,55].
3.2.3. Soil pH and Electrical Conductivity (EC)
The analytical results on soil pH and electrical conductivity are presented in Table 4. The soil pHwater of the studied pedons ranged from medium acid (5.6) to slightly acid (6.7) [17,33]. In the TSA-P01 pedon, pH ranged from medium acid (5.6) to slightly acid (6.4); in TSA-P02 pH ranged from slightly acid (6.7) to slightly alkaline (7.9); in ANGO-P01 pH values were slightly acid ranging from (6.1 to 6.6), and in ANGO-P02 pH ranged from moderately acid (5.7) to slightly acid (5.9).
3.2.4. Soil Organic Carbon (SOC), Total Nitrogen (TN), and Available Phosphorus
SOC is a critical component of the global carbon cycle and influences several soil properties, including water infiltration, nutrient availability, and microbial activity [57,58]. In the studied pedons, topsoil SOC ranged from medium (1.35%) to high (2.73%), while subsoil SOC varied from extremely low (0.02%) to medium (1.58%) [33]. Total nitrogen (TN) levels ranged from low (0.12%) to medium (0.22%) in the topsoil and declined with depth in all pedons (17,33,55). The C/N ratio ranged from 11.07 to 12.4 in the topsoil, reflecting equilibrated range for agricultural soils [17]. All pedons showed a decreasing C/N ratio with depth, consistent with the decline in SOC relative to TN.
Analytical results on available phosphorus are given in Table 4. The available phosphorus (P) levels in the studied pedons varied from low (<22 mg kg-1) to medium (23 - 35 mg kg-1) [59,60]. A consistent trend of decreasing available P with increasing depth was observed in all pedons, except in TSA-P02, which showed an irregular pattern due to phosphorus leaching.
3.2.5. Exchangeable Bases, Cation Exchange Capacity, and Nutrient Balance
The analytical results on soil exchangeable bases and related properties of the studied pedons are presented in Table 5. Calcium (Ca²⁺) concentrations varied widely, ranging from very low (0.65 cmol(+) kg⁻¹) to very high (13.18 cmol(+) kg⁻¹). Magnesium (Mg²⁺) ranged from very low (0.2 cmol(+) kg⁻¹) to very high (3.08 cmol(+) kg⁻¹), while potassium (K⁺) ranged from low (0.08 cmol(+) kg⁻¹) to very high (1.19 cmol(+) kg⁻¹). Sodium (Na⁺) was consistently low, varying from very low (0.04 cmol(+) kg⁻¹) to low (0.14 cmol(+) kg⁻¹) [59,61]. Generally, Mg²⁺ content increased with depth in all profiles, while K⁺ levels decreased.
Cation exchange capacity (CEC) values ranged from low (8.8 cmol(+) kg⁻¹) to high (32.5 cmol(+) kg⁻¹) [17,55]. Pedon TSA-P02 had the highest topsoil CEC of 32.5 cmol(+) kg-1, reflecting high soil fertility, while pedon TSA-P01 had CEC of 23.0 cmol(+) kg-1; and both pedons ANGO-P01 and ANGO-P02 had topsoil CEC values of 18.0 cmol(+) kg-1, indicating medium fertility. CEC clay values, reflecting the clay mineralogy, ranged from 19.22 cmol(+) kg-1 to 135.38 cmol(+) kg-1, with TSA-P02 showing a notably high value (135.38 cmol(+) kg-1). Exchangeable sodium percentage (ESP) values remained below 15% across all pedons, classifying these soils as non-sodic [33,55]. Percentage base saturation (PBS) ranged from 0.38 to 1.15 in topsoils and 0.37 to 1.30 in subsoils, classified as non-sodic (ESP < 15) [33,55]. A general trend of increasing values with depth was observed likely due to the leaching and accumulation of exchangeable bases [62]. The nutrient balance analysis of the studied pedons, presented in Table 5, revealed notable variations. The Ca/Mg ratio in TSA-P01, ANGO-P01, and ANGO-P02 was below 4:1, which could potentially limit Ca and P availability for crops [17]. The Mg/K ratios ranged from 2.4 to 38.0, with ANGO-P02 displaying the highest values, indicating a potential risk of K deficiency [56]. The K/TEB ratios for TSA-P01, TSA-P02, and ANGO-P01 were favorable (>2%), supporting adequate K availability. However, ANGO-P02 exhibited lower values, signaling potential nutrient imbalances that may impact crop growth and soil fertility.

Table 5.
Exchangeable bases, and related properties of the studied pedons in Tsangano and Angonia Districts, Mozambique.
Table 5.
Exchangeable bases, and related properties of the studied pedons in Tsangano and Angonia Districts, Mozambique.
| Exchangeable bases | CECsoil | CECclay | TEB | Nutrient Balance (Nutrient Ratios) | ||||||||||||
| Ca | Mg | Na | K | PBS | ESP | Ca/Mg | Ca/TEB | Mg/K | % (K/TEB) | |||||||
| Pedons | Horizon | Depth (cm) | cmol (+) kg-1 | |||||||||||||
| TSA-P01 |
Ap |
0 - 8 |
0.65 | 0.98 | 0.06 | 0.4 |
23.0 |
53.96 |
2.09 | 19.3 | 0.55 | 0.66 UF | 0.31 UF | 2.4 F | 3.69 F | |
|
Bt1 |
8 - 45 | 0.83 | 1.03 | 0.05 | 0.25 |
23.5 |
47.00 |
2.16 | 20.0 | 0.46 | 0.81 UF | 0.38 F | 4.2 UF | 2.31 F | ||
|
Bt2 |
45 - 112 | 0.97 | 1.17 | 0.04 | 0.12 |
28.0 |
44.71 |
2.14 | 19.7 | 0.37 | 0.83 UF | 0.45 F | 10.0 UF | 1.10 UF | ||
|
Bt3 |
112 - 155+ | 1.19 | 1.66 | 0.04 | 0.15 |
16.0 |
24.44 |
3.04 | 30.0 | 0.39 | 0.72 UF | 0.39 F | 11.2 UF | 1.48 UF | ||
| TSA-P02 | Ap | 0 - 21 | 7.84 | 2.51 | 0.13 | 1.19 |
32.5 |
64.13 |
11.67 | 103.0 | 1.15 | 3.12 F | 0.67 UF | 2.1 F | 10.50 F | |
| BA1 | 21 - 41 | 4.63 | 1.78 | 0.14 | 0.47 |
22.0 |
39.41 |
7.02 | 64.9 | 1.30 | 2.60 UF | 0.66 UF | 3.7 F | 4.35 F | ||
| BA2k | 41 - 75/91 | 9.17 | 2.55 | 0.08 | 0.75 |
23.5 |
35.05 |
12.54 | 117.0 | 0.75 | 3.60 UF | 0.73 UF | 3.4 F | 7.00 F | ||
| BCgk | 75/91- 155/165 | 13.18 | 3.08 | 0.07 | 0.22 |
22.5 |
31.22 |
16.54 | 153.7 | 0.65 | 4.28 F | 0.80 UF | 13.6 UF | 2.04 F | ||
| CRgk | 155/165 - 200 | 1.5 | 0.64 | 0.08 | 0.13 |
11.4 |
135.38 |
2.33 | 23.2 | 0.80 | 2.34 UF | 0.64 UF | 4.6 UF | 1.29 UF | ||
| ANGO-P01 | Ap | 0 - 25/30 | 2.2 | 2.44 | 0.06 | 0.53 |
18.0 |
34.30 |
5.23 |
51.8 | 0.59 | 0.90 UF | 0.42 F | 4.6 UF | 5.25 F | |
| Bt1 | 25/30 - 70 | 1.53 | 1.91 | 0.05 | 0.22 |
25.5 |
35.68 |
3.71 | 34.6 | 0.47 | 0.80 UF | 0.41 F | 8.5 UF | 2.05 F | ||
| Bt2 | 70 - 120 | 1.51 | 2.26 | 0.05 | 0.28 |
17.5 |
19.92 |
4.1 | 39.2 | 0.48 | 0.67 UF | 0.37 F | 8.0 UF | 2.68 F | ||
| Bt3 | 120 - 181 | 1.79 | 2.66 | 0.06 | 0.22 |
24.5 |
30.64 |
4.73 | 44.3 | 0.56 | 0.67 UF | 0.38 F | 11.7 UF | 2.06 F | ||
| ANGO-P02 | Ap | 0 -29 | 2.37 | 1.92 | 0.04 | 0.12 |
18.0 |
23.50 |
4.45 | 42.8 | 0.38 | 1.23 UF | 0.53 UF | 15.0 UF | 1.15 UF | |
| BA | 29 - 50 | 2.39 | 0.2 | 0.04 | 0.11 |
18.5 |
25.06 |
3.1 | 30.7 | 0.40 | 11.95 UF | 0.77 UF | 1.8 F | 1.09 UF | ||
| Bt | 50 - 86/118 | 3.66 | 2.46 | 0.05 | 0.09 |
25.5 |
35.43 |
6.26 | 59.6 | 0.48 | 1.49 UF | 0.58 UF | 24.7 UF | 0.86 UF | ||
| CR | 86/118- 181 | 4.01 | 3.08 | 0.05 | 0.08 |
8.8 |
41.83 |
7.22 | 66.9 | 0.46 | 1.30 UF | 0.56 UF | 38.0 UF | 0.74 UF | ||
TSA-P01 = Tsangano pedon 1; TSA-P02 = Tsangano pedon 2; ANGO-P01 = Angónia pedon 1; ANGO-P02 = Angónia pedon 2; Chemical property: Ca = calcium; Mg = magnesium; K = potassium; Na = sodium; CEC = cation exchange capacity; ESP = exchangeable sodium percentage; BS = base saturation.Rating:  = Very Low,
  = Low,
  =Moderate,
  =High,
  =Very high; F = favorable; UF = unfavorable, [17,33,43,48,49,56,63].3.2.6. Micronutrient Contents of the Studied Pedons.
= Very Low, = Low, =Moderate, =High, =Very high; F = favorable; UF = unfavorable, [17,33,43,48,49,56,63].3.2.6. Micronutrient Contents of the Studied Pedons.Iron (Fe) levels are consistently low (<12 mg kg⁻¹) across all pedons, decreasing with depth [64,65]. TSA-P02 exhibits relatively higher Fe levels in the Ap horizon (10.96 mg kg⁻¹). Zinc (Zn) content remains consistently low across all horizons (<1 mg kg⁻¹), and Manganese (Mn) levels are high (>1 mg kg⁻¹), ranging from 1.44 to 3.22 mg kg⁻¹ across pedons [40,64], decreasing with depth. Copper (Cu) remains within the high range (>1 mg kg⁻¹) [40,64], with concentrations between 0.981 and 2.098 mg kg⁻¹ (Table 6).
3.2.7. Total Elemental Composition and Weathering Indices of the Studied Pedons
Results on the total elemental composition and weathering indices of the studied pedons are given in Table 7. The concentrations of elemental oxides were in the following order: SiO₂ > Al₂O₃ > Fe₂O₃ > MgO > P₂O₅ > TiO₂ > SO₃ > K₂O > CaO for pedon TSA-P01; SiO₂ > Al₂O₃ > Fe₂O₃ > CaO > MgO > P₂O₅ > SO₃ > TiO₂ > K₂O for pedon TSA-P02; SiO₂ > Al₂O₃ > Fe₂O₃ > P₂O₅ > TiO₂ > MgO > K₂O > SO₃ > CaO for pedon ANGO-P01; and SiO₂ > Al₂O₃ > Fe₂O₃ > P₂O₅ > MgO > TiO₂ > K₂O > SO₃ > CaO for pedon ANGO-P02.
The pattern reveals a consistent dominance of SiO₂ (silica) across all profiles, indicating a high proportion of quartz or quartz-rich minerals [41]. The SiO₂ concentrations in the studied pedons ranged from 38.5 to 69.12%, with TSA-P02 having the highest content and ANGO-P01 the lowest. The Al2O3 content in studied pedons ranged from 26.36 to 27.55% in TSA-P01, from 16.26 to 31.2% in TSA-P02, from 25.44 to 27.98% in ANGO-P01, and from 21.96 to 26.68% in ANGO-P02. The Fe2O3 content of TSA-P01 pedon ranged from 8.44 to 10.59%, in TSA-P02 from 1.15 to 6.49%, in ANGO-P01 from 10.69 to 13.95%, and in ANGO-P02 from 10.23 to 12.95%.
The level of SiO2/Al2O3 ranged from 1.67 - 2.26 in TSA-P01, from 1.08 - 4.25 in TSA-P02, from 1.41 - 1.81 in ANGO-P01, and from 1.44 - 2.51 in TSA-P02, whereas in the TSA-P01 pedon, the SiO₂/(Al₂O₃ + Fe₂O₃) ratio was 1.68, 1.21 and 1.26; in TSA-P02 it was 1.16, 1.08 and 3.97; in ANGO-P01, it was 1.28, 0.94 and 1.02; and in ANGO-P02, it was 0.98, 1.05 and 1.71 in the top, middle, and bottom horizons, respectively.
3.2.8. Concentrations of Barium (Ba), Zirconium (Zr), Strontium (Sr), and Lead (Pb) in the Studied Pedons
Table 8 presents results on Ba, Zr, Sr, and Pb concentrations in the study area. Ba concentrations are high in surface horizons and generally decrease with depth, except in ANGO-P02. ANGO-P01 exhibits unusually high Ba levels, up to 1075 mg dm-3, well above the typical range of 330 to 520 mg dm-3 [66], likely due to its sandy texture retaining weathering-resistant silicates [67].
Zr concentrations were higher (> 300 mg dm-3) [68] in the topsoil than in subsoil across all pedons, suggesting its immobility and resistance to weathering. Sr levels were relatively high in deeper horizons of TSA-P02 and ANGO-P02 (> 300 mg dm-3) [69], indicating percolation, whereas in TSA-P01 and ANGO-P01, Sr levels decreased with depth, behaving similarly to calcium in the soil (Andreasen and Thomsen, 2021). The average Pb concentration in topsoils of the studied pedons was lower than the levels reported for arable soils (10 - 67 mg dm-3) [69].
3.2.9. Classification of the Studied Pedons
Soil morphological and laboratory analytical data were used to define diagnostic horizons and other features for classifying the soils. Summaries of the classification according to the USDA Soil Taxonomy and the World Reference Base (WRB) [21,70] for Soil Resources Schemes are presented in Table 9 and Table 10.
According to USDA Soil Taxonomy [20], the soils of the study area were classified as Ultisols (Pedons TSA-P01 and ANGO-P01), Vertisols (Pedon TSA-P02), and Alfisols (Pedon ANGO-P02). According to the WRB for Soil Resources [21], the soils of the study area were classified at TIER-1 as Acrisols (Pedon TSA-P01), Vertisols (Pedon TSA-P02), Alisols (ANGO-P01), and Luvisols (ANGO-P02). At the first level of both classification systems, the taxa correspond well with their pedogenetic definitions. Soils that are well developed and have clay-enriched B-horizons were classified as Ultisols (TSA-P01 and ANGO-P01) and Alfisols (ANGO-P02), while the deep-cracking soils with material turnover were classified as Vertisols (TSA-P02). In the WRB system, these taxa translate to Acrisols, Alisols, Luvisols, and Vertisols, respectively.
3.2.10. Suitability Assessment Based on Ecological Requirements of Irish Potato and Field Conditions of the Studied Pedons
The assessment results, which consider field conditions and the ecological requirements of Irish potatoes, are presented in Table 11. In this study, all pedons were classified as marginally suitable (S3) for Irish potato cultivation, aligning with findings by[71] on the Angónia Plateau. The overall suitability classes (OSC) were determined as follows: TSA-P01: S3f(c), TSA-P02: S3f(cs), ANGO-P01: S3f(cts), and ANGO-P02: S3f(ct).
4. Discussion
4.1. Soil Morphological Characteristics
The variations in soil color, consistence, and structure observed across the studied pedons suggest differences in organic matter content, drainage status, and mineral composition [50]. The well-drained TSA-P01, ANGO-P01, and ANGO-P02 are more favorable for agricultural use compared to the moderately well-drained TSA-P02, which exhibits features indicative of waterlogging and reduced aeration. The presence of clay cutans in TSA-P01, ANGO-P01, and ANGO-P02 provides strong evidence of eluviation and illuviation processes, signifying downward translocation of clay and sesquioxides, typical of well-drained environments [21]. The structure and consistence of TSA-P02 highlight the presence of shrinking and swelling as the dominant pedogenic processes responsible for the observed deep wide cracking, extremely hard consistence, and angular to subangular structural blocks. This makes TSA-P02 less favorable for crop production compared to the other pedons, which have more friable and well-aggregated structures. These findings suggest that future land management interventions should focus on improving soil aeration and reducing compaction in TSA-P02 to enhance its agricultural productivity.
4.2. Soil Physical and Chemical Characteristics
Soil texture and structure play a vital role in determining soil fertility, water movement, and erosion potential. The observed sandy clay loam and sandy clay textures in TSA-P01, TSA-P02, and ANGO-P01 favor root penetration and water infiltration, making them more suitable for agricultural use compared to the clayey texture in ANGO-P02, which restricts drainage and aeration [17,53]. The presence of eluviation-illuviation processes in TSA-P01 and ANGO-P01, as indicated by their clay-sesquioxide cutans, supports their classification as highly weathered soils [50]. TSA-P02 has sandy subsoils, whereas ANGO-P02 transitions to sandy loam (SL), which enhances water movement compared to clay-dominated subsoils [50]. The silt:clay ratios further confirm that TSA-P01, ANGO-P01, and ANGO-P02 exhibit significant weathering, while TSA-P02 retains moderate weathering characteristics. With increasing depth, the ratio decreases across all profiles, reflecting advanced weathering in the subsoils. The higher silt:clay ratio in the topsoils than in the subsoils suggests clay accumulation in the deeper horizons due to eluviation and illuviation processes, a trend observed in other studies [73,74,75]. Among the pedons, TSA-P01, ANGO-P01, and ANGO-P02 appear highly weathered, while TSA-P02 displays moderate weathering characteristics.
The trends in BD, porosity, and penetration resistance highlight the importance of soil organic matter in maintaining soil structure and workability. TSA-P02 and ANGO-P02, which have higher OM, exhibit lower BD and greater porosity, promoting better root growth and moisture retention while the higher BD in TSA-P01 and ANGO-P01 topsoils is linked to lower OM and compaction from grazing [76,77,78]. Subsoil compaction, as indicated by higher BD, generally results from reduced OM, less aggregation, and limited pore space [33].
Tsa-P01 and ANGO-P01 profiles exibit higher topsoil penetration resistance, primarily due to compaction and low OM, consistent with higher BD values. Despite these variations, all studied pedons have penetration resistance values below the critical threshold (>3.0 MPa) that would significantly restrict root growth, indicating generally favorable conditions for plant development [33], suggesting that these soils generally provide a favorable rooting environment. AWC trends indicate that subsoils with higher clay content (166.6 mm m⁻¹, and 156.0 mm m⁻¹) retain more water, as seen in TSA-P02 and ANGO-P02 [54]. AWC trends with depth are consistent with findings by Hailu et al. (2015), indicating that soils with higher clay content tend to retain more water in deeper layers. This highlights the potential for these soils to support crops under varying moisture conditions, if drainage and aeration issues are managed effectively.
The observed variations in soil pH and electrical conductivity (EC) across the pedons reflect differences in organic matter content, leaching intensity, and base accumulation. TSA-P02 exhibited the highest pH range, which can be attributed to the increased content of Ca²⁺ and Mg²⁺ in the subsoil, helping to neutralize acidity. These pH variations across the pedons are consistent with findings by [44,78], who observed that increased pH with depth is typically linked to leaching and the accumulation of basic cations. The pH variations suggest that soil amendments may be necessary to optimize conditions for crop production. The electrical conductivity values indicate that salinity is not an issue in these soils, making them suitable for agriculture. Soil organic carbon (SOC) and TN levels varied across the pedons, with TSA-P02 having the highest SOC and TN contents, likely due to the incorporation of organic residues and nitrogen-fixing legumes [80] In contrast, TSA-P01, ANGO-P01, and ANGO-P02 had lower SOC and TN levels, possibly due to continuous cropping and residue removal [80]. The SOC and TN trend, with higher topsoil levels and a decline with depth, is consistent across all pedons, reflecting surface accumulation of plant residues [81,82] highlight the importance of organic matter management to sustain soil fertility.
The low levels of available phosphorus (P) suggest that phosphorus fertilization is necessary across all pedons, particularly in TSA-P01 and ANGO-P02, where P deficiency is more pronounced. The general decrease in available P content with soil depth aligns with similar findings of [79,83,84], which suggested that higher available P near the surface compared to subsurface horizons is attributed to higher SOC values in topsoils and to applied phosphatic fertilizers and manure. Additionally, higher SOC and frequent fertilizations also contribute to P leaching, particularly as the soil approaches its capacity limit for phosphorus sorption, as the soil silt:clay ratio decreases [85]. Favorable conditions such as the presence of clay and OM enhance P availability in deep layers in contrast to the surface layers, where P tends to bind more strongly to iron and aluminum minerals [75]. Similar trends have been reported by researchers in other regions [81,86]. According to [59], crops are very likely to respond to P fertilization when the soil test indicates that P-Mehlich is below 16 mg kg-1, and likely when P is above 16.1 mg kg-1. Therefore, for better crop yields, applications of phosphorus-containing fertilizers are deemed necessary in all studied pedons, particularly in pedons TSA-P02 and ANGO-P02.
The distribution of exchangeable bases across the pedons reveals variability in soil fertility. The relatively low Ca²⁺ and Mg²⁺ levels in TSA-P01 and ANGO-P01 suggest leaching effects, which are typical of highly weathered tropical soils. Conversely, TSA-P02 exhibited higher Ca²⁺ levels, likely due to the presence of calcareous materials that enhance base retention. CEC values indicate that TSA-P02 has a greater capacity for nutrient retention compared to the other pedons, which aligns with its high clay content and montmorillonitic mineralogy. CEC generally increased with depth in all pedons, except TSA-P02, likely due to higher clay content in the sublayers of B horizon and the leaching of Ca2+ and Mg2+ from the topsoil of these pedons [87]. The observed CECclay values in pedons TSA-P01, ANGO-P01 and ANGO-P02 (19.92 – 53.06 cmol (+) kg-1) reflect a mixed clay mineralogy predominantly composed of kaolinite, with possible trace amounts of 2:1 silicate clay mineral (most probably illite) which commonly has CECclay values between 30 to 40 cmol(+) kg-1 [17]. The prevalence of kaolinite clay minerals in the studied pedons except pedon TSA-P02 is typical of advanced weathering [43,88]. However, the CECclay value (135.5 cmol(+) kg-1) in the CRgk horizon of TSA-P02 profile suggests presence of 2:1 clay minerals, most likely smectite, which contributes to higher reserves of Mg, K, and Fe according to [41,88], typical of younger and less weathered soils [17,43], neo-formed when the soil solution has a relatively higher pH [51].
The increasing percentage base saturation (PBS) values with depth reflect base redistribution through leaching, contributing to the observed fertility differences across horizons. In soils with a high calcium content like, exchangeable cations saturate all accessible sites on the soil absorption complex, resulting in values of PBS greater than 100 [89] as seen in TSA-P02 pedon. PBS greater than 100 suggests the existence of free cations that are not bound to the soil complex, as well as soluble salts or lime. In the studied pedons PBS values increased with depth, likely due to leaching of cations such as Ca²⁺, Mg²⁺, and K⁺ [33]. This trend aligns with findings from [81], who reported that exchangeable bases tend to accumulate in lower slopes due to water and organic material migration, which also increases soil pH. Additionally, the high nitrogen and phosphorus concentrations in upper layers of the studied pedons may have reduced exchangeable base levels in those regions as documented by [90,91]. The non-sodic nature of all pedons, indicated by their low exchangeable sodium percentage (ESP), suggests that sodium does not pose a risk to soil structure or crop productivity.
The Ca/Mg and Mg/K ratios provide valuable insights into nutrient availability [92]. The low Ca/Mg ratios in TSA-P01, ANGO-P01, and ANGO-P02 suggest potential calcium and phosphorus deficiencies, which could hinder plant growth [17,73]. The high Mg/K ratios in ANGO-P02 may cause potassium deficiency due to competition between these cations for plant uptake [56]. The favorable K/total exchangeable bases (TEB) ratios in TSA-P01, TSA-P02, and ANGO-P01 indicate sufficient potassium availability, while the lower values in ANGO-P02 highlight the need for potassium fertilization.
Micronutrient analysis reveals deficiencies in iron (Fe) and zinc (Zn) which could impact plant metabolism. Decreasing Fe pattern reflects the effects of the parent material, organic matter and leaching intensity in the studied area, which depletes Fe from the upper soil layers, in accordance with the findings of [62,93]. TSA-P02 pedon demonstrates relatively higher Fe levels in the Ap horizon (10.96 mg kg⁻¹), likely due to limited leaching or organic matter cycling in the surface soil. The critical low Zn levels across all horizons is typical of tropical soils where Zn is lost through leaching or bound in forms unavailable to plants [94]. The slightly higher Zn levels in the Ap horizon of ANGO-P01 (0.383 mg kg⁻¹) may result from surface additions from Zn containing fertilizers and organic matter. Manganese (Mn) levels are consistently high (> 1 mg kg-1) [64] with values ranging from 1.446 to 3.223 mg kg⁻¹ across pedons. Mn availability generally decreases with depth [95], reflecting pedogenic depletion due to leaching and potential secondary mineral formation [75]. Copper (Cu), on the other hand, consistently falls within the high range (>1 mg kg⁻¹) across all horizons, as categorized by [60,64], with concentrations ranging from 0.981 to 2.098 mg kg⁻¹. This indicates that Cu is less prone to leaching compared to Fe, Zn, and Mn, likely due to the contribution of the parent rocks and minerals in the soil [96] and, its strong affinity for organic matter and clay minerals [69]. Higher Cu levels suggest that it is unlikely to be a limiting factor for crop production in these soils.
4.3. Total Elemental Composition and Weathering Indices of the Studied Pedons
The total elemental composition analysis confirms that the studied pedons have undergone varying degrees of weathering, with SiO₂ (silica) dominance consistent to intense leaching and quartz enrichment [41,97,98]. This suggests the soils are derived from materials with limited clay formation, typical of more weathered soils, often found in tropical and subtropical climates [99]. The presence of Al₂O₃ (alumina: 25% to 35%) and Fe₂O₃ (iron oxide: 5% to 10%) further supports this, reflecting the influence of aluminosilicate and iron-bearing minerals, which are common in tropical soils and indicative of advanced weathering processes [88,100]. The Fe₂O₃ content increased with depth in pedons TSA-P01 and ANGO-P01. In pedon ANGO-P02, the Fe₂O₃ content decreased with depth, similar to observations of [101], while in pedon TSA-P02, there was an increase from the first to the third horizon, followed by a decrease from the third to the last horizon. The high levels of Al₂O₃ and Fe₂O₃ in ANGO-P01 and TSA-P01 indicate substantial weathering, while higher concentrations of CaO and TiO₂ in TSA-P02 indicate the presence of calcareous minerals, suggesting it is less weathered than other pedons, where Al₂O₃, P₂O₅, and Fe₂O₃ dominate, pointing to more advanced weathering [43,102]. These findings align with studies on tropical soils where kaolinite, iron oxides, and aluminum hydroxides predominate in highly weathered environments [103,104]. The SiO₂/Al₂O₃ and SiO₂/(Fe₂O₃ + Al₂O₃) ratios further illustrate the weathering intensity, with TSA-P01 and ANGO-P02 showing the most advanced weathering stages. These ratios indicate that pedons with lower SiO₂/Al₂O₃ and SiO₂/(Fe₂O₃ + Al₂O₃) proportions have undergone significant desilication, resulting in more acidic and nutrient-depleted soils, necessitating soil fertility management interventions.
4.4. Concentrations of Barium (Ba), Zirconium (Zr), Strontium (Sr), and Lead (Pb) in the Studied Pedons
The observed Ba and Zr concentrations confirm variations in parent material composition and soil development. The exceptionally high Ba levels in ANGO-P01 suggest localized enrichment due to resistant silicate minerals [67], while the higher Zr levels in ANGO-P02 reflect the persistence of zirconium-bearing minerals in weathered profiles [68], consistent with the findings of [105]. Sr mobility varies across pedons, with TSA-P02 and ANGO-P02 showing Sr accumulation in deeper horizons, possibly due to leaching processes [69]. In contrast, TSA-P01 and ANGO-P01 exhibit decreasing Sr trends with depth, indicating a closer association with calcium cycling [66].
Pb concentrations in TSA-P01 exceed safe limits in the Bt2 horizon, raising concerns about potential contamination sources [69]. Generally, Pb concentrations decrease with depth, which is consistent with findings by [106,107]. While Pb is typically found at concentrations of 10 - 67 mg dm-3, values exceeding 100 mg dm-3 may indicate contamination from anthropogenic inputs [69]. Levels above 300 mg dm-3 suggest severe pollution [108], posing risks of root growth inhibition and potential toxicity if Pb enters the food chain. The higher Pb levels in pedon TSA-P01, particularly in the Bt2 horizon, are likely influenced by the parent material, consisting of quartz-feldspathic and amphibolic gneiss, which may have naturally higher lead content [62]. The increased OM and clay content in the Bt2 horizon promotes metal retention [61,109], while the acidic pH enhances Pb mobility within the soil profile [109].
4.5. Classification of the Studied Pedons
The classification of the studied pedons based on USDA Soil Taxonomy and WRB systems aligns with their pedogenetic characteristics. The identification of Ultisols and Alfisols in TSA-P01, ANGO-P01, and ANGO-P02 is consistent with the presence of argillic horizons and their relatively high degree of weathering. These pedons exhibit low base saturation and clay illuviation, which are typical features of highly leached tropical soils [21,70]. The classification of TSA-P02 as a Vertisol corresponds with its high clay content, shrink-swell properties, and deep-cracking characteristics, which significantly influence soil management and land use practices. The WRB classification further refines soil interpretation by incorporating key diagnostic properties. The Acrisols and Alisols identified in TSA-P01 and ANGO-P01 confirm the presence of low base saturation and clay illuviation, whereas the classification of ANGO-P02 as a Luvisol aligns with its relatively higher base status. TSA-P02, classified as a Vertisol with calcic and pellic properties, highlights the presence of montmorillonitic clays and seasonal moisture fluctuations.
4.6. Suitability Assessment for Irish Potato Cultivation
The land suitability assessment indicates that all studied pedons are marginally suitable (S3) for Irish potato cultivation due to significant fertility constraints. Low levels of organic carbon, total nitrogen, and available phosphorus, combined with unfavorable cation exchange capacity (CEC) and base saturation, pose major challenges for crop production. TSA-P02, despite its high clay content, has slightly better fertility conditions than the other pedons due to its greater nutrient retention capacity.
Topographic constraints, particularly in ANGO-P01 and ANGO-P02, further limit agricultural potential due to steep slopes (>12%), which increase erosion risks. Climate-related factors, such as temperature, also contribute to marginal suitability, as noted in previous studies on Irish potato cultivation in tropical highland regions [28,71]. The primary limitation across all pedons is soil fertility (f), with additional minor constraints related to climate (c), topography (t), and soil physical properties (s). TSA-P01 is affected by low organic carbon, total nitrogen, and exchangeable bases, leading to reduced CEC and base saturation, while TSA-P02 is constrained by low zinc levels, total nitrogen, and limited CEC. However, TSA-P02 exhibits fewer limitations than the other pedons, indicating moderate to significant constraints overall. Despite these challenges, the study suggests that Irish potato cultivation remains feasible. However, targeted soil fertility improvements are essential for enhancing productivity and ensuring sustainable crop production in the region.
5. Conclusion and Recommendations
5.1. Conclusions
The study sites in Tsangano and Angónia districts are characterized by high annual rainfall (800-1200 mm) and temperatures ranging from 15 to 22°C. Soil profiles exhibit considerable variation in depth, texture, and fertility. The studied pedons (TSA-P01, TSA-P02, ANGO-P01, ANGO-P02) show different drainage classes, colors, consistencies, and structures, affecting their suitability for Irish potato cultivation. The pedons displayed varying soil textures, bulk densities, and porosities, influencing root growth and water retention. Pedons TSA-P01 and ANGO-P02 are more susceptible to erosion due to higher sand content (44 - 56%) and lower topsoil silt/clay ratio (0.25 - 0.29). TSA-P02 has the highest SOC in the topsoil, while ANGO-P02 has the lowest. Available P ranged from 5.2 to 25.1 mg kg-1, with TSA-P02 having the highest available P and ANGO-P01 the lowest. Potassium levels ranged from 0.08 to 1.19 cmol(+) kg-1, with TSA-P01 and TSA-P02 exhibiting the higher K contents compared to ANGO-P01 and ANGO-P02. CEC ranged from 7.29 to 12.52 cmol(+) kg-1, with TSA-P02 having the highest CEC, indicating better nutrient retention capacity. ANGO-P01 is the most weathered pedon, with lower SiO₂/Al₂O₃ (1.41 - 1.81) and SiO₂/(Al₂O₃ + Fe₂O₃) (0.94 -1.28) ratios, indicating significant leaching and clay formation. In contrast, TSA-P02, with higher SiO₂/Al₂O₃ (1.30 - 4.25) and SiO₂/(Al₂O₃ + Fe₂O₃) (1.08 - 3.97) ratios, shows less weathering and greater silica retention. Pedons TSA-P01 and ANGO-P02 classified both as “Typic Haplustults” and “Ultic Haplustalfs” respectively, according to USDA Soil Taxonomy and as “Haplic Acrisols” and “Chromic Luvisols” respectively, according to FAO World Reference Base for Soil Resources. Pedon TSA-P02 and ANGO-P01 were classified as “Typic Calciusterts” and “Typic Paleustults” respectively, according to USDA Soil Taxonomy and as “Pellic Calcic Vertisols” and “Chromic Abruptic Alisols” respectively, according to FAO World Reference Base for Soil Resources. The evaluated pedons were classified as marginally suitable (S3) for Irish potato cultivation due to significant soil fertility limitations (f) and minor constraints related to climate (c), topography (t), and physical properties (s).
5.2. Recommendations
To enhance the suitability of soils in Tsangano and Angónia districts for Irish potato cultivation and address soil degradation issues, the following recommendations are made:
Incorporating organic amendments, such as compost or manure, and practicing crop rotation with legumes (especially in TSA-P01 and AGO-P01) can improve soil health and promote nitrogen fixation. TSA-P01 and ANGO-P01 present the greatest challenges due to low organic carbon and nitrogen levels, fertilization focusing on these deficiencies, particularly nitrogen and zinc, will be critical to improving nutrient availability, and regular soil testing, especially for these profiles, is recommended. Improving CEC and BS is crucial, particularly in TSA-P01, where these factors are most limiting. Strategies like adding organic matter, using mulch, and employing cover crops will help improve soil structure and water and nutrient retention. Soil conservation practices, such as contour plowing, terracing, and maintaining ground cover, should be implemented in all profiles, with special focus on TSA-P01 and ANGO-P01, due to higher erosion risks in the hilly areas.
Regarding climate, adjusting planting dates in TSA-P01 and ANGO-P01 to avoid critical heat periods and adopting drought- and heat-tolerant potato varieties is essential. In TSA-P02, where climatic conditions are more favorable, prioritizing the use of areas with similar characteristics can improve productivity.
Finally, continuous monitoring of soil conditions through regular testing is essential, especially for TSA-P02, which showed fewer limitations. Adaptive management, adjusted based on monitoring results, will ensure soil health is maintained, and more suitable practices are implemented according to the needs of each profile. By addressing these recommendations, the potential for Irish potato production in Tsangano and Angónia districts can be significantly improved, contributing to enhanced food security and economic development in central Mozambique.
Author Contributions
Conceptualization, T.S. and B.M.; methodology, T.S and B.M.; validation, T.S., B.S., A.A. and H.T.; formal analysis, T.S.; investigation, T.S and B.M.; resources, T.S.; data curation, T.S.; writing—original draft preparation, T.S, B.S and A.A.; writing—review and editing, T.S, B.M., A.A, H.T, J.S. and M.S.; visualization, T.S, B.M., A.A, H.T, J.S. and M.S.; supervision, B.M., A.A, H.T, J.S. and M.S.; funding acquisition, T.S. All authors have read and agreed to the published version of the manuscript.
Funding
This study was funded by the Regional Scholarship and Innovation Fund (RSIF) of the Partnership for Skills in Applied Sciences, Engineering and Technology (PASET) (Project Grant No. P165581) grant to SACIDS Africa Centre of Excellence for Infectious Diseases of Humans and Animals in Southern and East Africa (SACIDS-ACE) at the Sokoine University of Agriculture (SUA) and additional DOCTAS from Carnegie Corporation (Grant Number is G-22-59858). Tamara José Sande is a recipient of an RSIF-PASET doctoral scholarship at SUA.
Data Availability Statement
The raw data supporting the conclusions of this article will be made available by the authors on request.
Acknowledgments
We sincerely acknowledge the local authorities, the extension, and the farmers of Tsangano and Angónia Districts for their invaluable support during fieldwork.
Conflicts of Interest
The authors declare no conflicts of interest. The funders had no role in the design of the study; in the collection, analyses, or interpretation of data; in the writing of the manuscript; or in the decision to publish the results.
References
- Demo P, Dominguez S, Cumbi S, Walker T. The potato sub-sector and strategies for sustainable seed production in Mozambique report of a two-week potato sub-sector study conducted from 21 November to 4 December of 2005, Maputo, Moçambique. Maputo; 2006 Mar.
- Amede T, Desta LT, Harris D, Kizito F, Cai X. The Chinyanja triangle in the Zambezi River Basin, southern Africa: status of, and prospects for, agriculture, natural resources management and rural development. Colombo, Sri Lanka: International Water Management Institute (IWMI). CGIAR Research Program on …; 2014.
- António J. Análise da Cadeia Produtiva de Batata Reno na Região do Vale do Zambeze (Moçambique): Estrutura de Produção, Governança e Coordenação. 2009;1–229.
- Schelling N. Horticulture and Potato Market Study in Mozambique [Internet]. Pretoria; 2015 [cited 2022 May 1]. Available from: http://agriprofocus.com/upload/HorticultureandPotatoMarketStudyinMozambique1417448632.pdf.
- Harahagazwe D, Condori B, Barreda C, Bararyenya A, Byarugaba AA, Kude DA, et al. How big is the potato (Solanum tuberosum L.) yield gap in Sub-Saharan Africa and why? A participatory approach. Open Agric. 2018 Jan 1;3(1):180–9. [CrossRef]
- Niek Schelling, Schelling N. Horticulture and Potato Market Study in Mozambique [Internet]. Pretoria; 2015 [cited 2022 May 1]. Available from: http://agriprofocus.com/upload/HorticultureandPotatoMarketStudyinMozambique1417448632.pdf.
- Karlen DL, Andrews SS, Doran JW. Soil quality: Current concepts and applications. 2001;
- Estrada-Herrera IR, Hidalgo-Moreno C, Guzmán-Plazola R, Almaraz Suárez JJ, Navarro-Garza H, Etchevers-Barra JD. Soil quality indicators to evaluate soil fertility. Agrociencia. 2017;51(8):813–31.
- Hatfield JL. Soil degradation, land use, and sustainability. Convergence of Food Security, Energy Security and Sustainable Agriculture. 2014;61–74.
- Vlek PLG. The incipient threat of land degradation. Journal of the Indian Society of Soil Science. 2008;56(1):1–13.
- Zhang J. Soil Environmental Deterioration and Ecological Rehabilitation. Study of Ecological Engineering of Human Settlements. 2020;41–82.
- Osman KT, Osman KT. Soil resources and soil degradation. Soils: principles, properties and management. 2013;175–213.
- Veum KS, Goyne KW, Kremer RJ, Miles RJ, Sudduth KA. Biological indicators of soil quality and soil organic matter characteristics in an agricultural management continuum. Biogeochemistry. 2014;117:81–99. [CrossRef]
- Li J, Nie M, Powell JR, Bissett A, Pendall E. Soil physico-chemical properties are critical for predicting carbon storage and nutrient availability across Australia. Environmental Research Letters. 2020;15(9):094088.
- Manikandan K, Kannan P, Sankar M, Vishnu G. Concepts on land evaluation. Earth Science India (Popular Issue VI (I)). 2013;20–6.
- Rossiter DG. Land evaluation: Towards a revised framework. Geoderma. 2009 Apr;148(3):428–9.
- Landon JR. Booker Tropical Soil Manual: A handbook for soil survey and agricultural land evaluation in the tropics and subtropics. Paperback. J. R. Landon, editor. New York, USA: John Wiley & Sons, Inc.; 2013. 531 p.
- FAO. A framework for land evaluation. Vol. 32, Soil Bulletin. Rome: FAO Rome; 1976.
- Sys C, Van Ranst E, Debaveye J. Land Evaluation. Part I: principles in land evaluation and crop production calculations. Agricultural publication. 1991;(7).
- Soil Survey Staff. Keys to Soil Taxonomy. 13th ed. 2022. 410 p.
- IUSS Working Group WRB. World reference base for soil resources 2014, update 2015 International soil classification system for naming soils and creating legends for soil maps. 106th ed. FAO, editor. Vol. 106. Rome; 2015. 203 p.
- DNCI. Plano Operacional Da Comercialização Agrícola, Tete. Ministério Da Indústria E Comércio Direcção Nacional Do Comércio Interno. Direcção Nacional Do Comércio Interno (DNCI). Maputo; 2018.
- MEF M de E e F. Avaliação Ambiental Estratégica, Plano Multissectorial, Plano Especial de Ordenamento Territorial do Vale do Zambeze e Modelo Digital de Suporte a Decisões. PERFIL AMBIENTAL DISTRITAL DE TSANGANO. Maputo; 2015 Dec.
- MITADER. PERFIL AMBIENTAL DISTRITAL DE ANGÓNIA [Dezembro, 2015] Plano Multissectorial, Plano Especial de Ordenamento Territorial do Vale do Zambeze e Modelo Digital de Suporte a Decisões MINISTÉRIO DA ECONOMIA E FINANÇAS AGÊNCIA DE DESENVOLVIMENTO DO VALE DO ZAMBE. 2005th ed. MITADR, editor. Maputo: MEF; 2015. 97 p.
- JICA JICA. The study on the Integrated Development Master Plan of the Angonia Region in the Republic of Mozambique. Final Report. Master Plan Report. [Internet]. October, 2021. 2001 Oct [cited 2022 Jun 19]. Available from: https://openjicareport.jica.go.jp/pdf/11668704.pdf.
- Nkoka F, Veldwisch GJA, Bolding JA. Organisational modalities of farmer-led irrigation development in Tsangano District, Mozambique. Water Alternatives. 2014;7(2):414–33.
- Maereka EK, Makate C, Chataika BY, Mango N, Zulu RM, Munthali G, et al. Estimation and characterization of bean seed demand in Angonia district of Mozambique. 2015;
- Voortman R. L, Spiers F. B. Landscape Ecological Survey And Land Evaluation, For Rural Development Planning, Angonia District, Tete Province. Climate, agro-climatic zones and agro-climatic suitability Vol.5. Instituto Nacional de Investigacao Agronomica. Maputo; 1986 Mar.
- Amerling R, Winchester JF, Ronco C. Guidelines for Soil Description. Vol. 25, Blood Purification. 2006. 36–38 p.
- Kipfer BA. Munsell Soil Color Chart. Revised ed. Encyclopedic Dictionary of Archaeology. Windsor: MACBETH; 1994. 29 p.
- Klute A. Methods of soil analysis. Part 1. Physical and mineralogical methods. 1986.
- Cho SE. Effects of spatial variability of soil properties on slope stability. Eng Geol. 2007;92(3–4):97–109. [CrossRef]
- Hazelton P, Murphy B. INTERPRETING SOIL TEST RESULTS: What do the numbers mean? 3rd ed. Clayton South, Autralia; 2016. 186 p.
- Moraes MT de, Debiasi H, Carlesso R, Franchini JC, Silva VR da. Critical limits of soil penetration resistance in a rhodic Eutrudox. Rev Bras Cienc Solo. 2014;38:288–98. [CrossRef]
- Okalebo JR, Gathua WK, Woomer LP. LABORATORY METHODS OF SOIL AND PLANT ANALYSIS: A Working Manual. Second. Nairobi: SACRED Africa; 2002. 131 p.
- Estefan G, Sommer R, Ryan J. Methods of Soil, Plant, and Water Analysis: A manual for the West Asia and North. 2013. 1–243 p.
- ASTM. Standard Test Methods for Moisture, Ash, and Organic Matter of Peat and Other Organic Soils. In: American Society for Testing and Materials. D 2974-8. Philadelphia; 1987. p. 3.
- Rayment GE, Lyons DJ. Soil chemical methods: Australasia. Vol. 3. CSIRO publishing; 2011.
- Parkinson JA, Allen SE. A wet oxidation procedure suitable for the determination of nitrogen and mineral nutrients in biological material. Commun Soil Sci Plant Anal. 1975;6(1):1–11. [CrossRef]
- Mehlich A. Mehlich 3 soil test extractant: A modification of Mehlich 2 extractant. Commun Soil Sci Plant Anal. 1984;15(12):1409–16. [CrossRef]
- Baize D. Soil science analyses: a guide to current use. John Wiley & Sons Ltd.; 1993. 187 p.
- Tiecher T, Gatiboni L, Rheinheimer dos Santos D, Alberto Bissani C, Posselt Martins A, Gianello C, et al. Base saturation is an inadequate term for Soil Science. Brasilian Journal of Soil Science [Internet]. 2022 [cited 2023 Dec 3];6. Available from: https://doi.org/10.36783/18069657rbcs20220125. [CrossRef]
- Nile CB. The nature and properties of soils. Nile CB, editor. New York: Macmillan Publishing Company; 1984. 780 p.
- Kalala AM, Msanya BM, Amuri NA, Semoka JM. Pedological characterization of some typical alluvial soils of Kilombero District, Tanzania. 2017; [CrossRef]
- Sys C, Van Ranst E, Debaveye J. Land evaluation. Part 2: Methods in land evaluation. Agricultural publications; 1991.
- Iliquín Trigoso D, Salas López R, Rojas Briceño NB, Silva López JO, Gómez Fernández D, Oliva M, et al. Land suitability analysis for potato crop in the Jucusbamba and Tincas Microwatersheds (Amazonas, NW Peru): AHP and RS–GIS approach. Agronomy. 2020;10(12):1898.
- Asfaw M, Asfaw D. Agricultural Land Suitability Analysis for Potato Crop by Using Gis and Remote Sensing Technology, in the Case of Amhara Region, Ethiopia. 2017;7(11). Available from: www.iiste.org.
- Enang RK, Yerima BPK, Kome GK. Soil physico-chemical properties and land suitability evaluation for maize (Zea mays), beans (Phaseolus vulgaris) and Irish potatoes (Solanum tuberosum) in tephra soils of the western slopes of mount Kupe (Cameroon). Afr J Agric Res. 2016;11(45):4571–83.
- Mugo JN, Karanja NN, Gachene CK, Dittert K, Nyawade SO, Schulte-Geldermann E. Assessment of soil fertility and potato crop nutrient status in central and eastern highlands of Kenya. Sci Rep. 2020 Dec 1;10(1). [CrossRef]
- Peverill KI, Sparrow LA, Reuter KI. Soil analysis: An interpretation manual. Eds. Peverill KI, Sparrow LA, Reuter KI, editors. Collingwood: SCIROPublishing; 1999. 369 p.
- Buol SW, Southard RJ, Graham RC, McDaniel PA. Soil Genesis and Classification. 6th ed. Madison Wis, Buol SW, Hole FD, McCracken RJ, editors. West Sussex: John Wiley & Sons; 2011. 543 p.
- Wang L, He Z, Zhao W, Wang C, Ma D. Fine soil texture is conducive to crop productivity and nitrogen retention in irrigated cropland in a desert-oasis ecotone, Northwest China. Agronomy. 2022;12(7):1509. [CrossRef]
- NRCS U. Soil health. United States Department of Agriculture Natural Resources Conservation Service. 2019;
- Lardy JM, DeSutter TM, Daigh ALM, Meehan MA, Staricka JA. Effects of soil bulk density and water content on penetration resistance. Agricultural & Environmental Letters. 2022;7(2):e20096. [CrossRef]
- Msanya BM, Kimaro DN, Kimbi GG, Kileo EP, Mbogoni JJDJ. SOILS AND LAND RESOURCES OF MOROGORO RURAL AND URBAN DISTRICTS ISBN 9987 605 29 X VOLUME 4 LAND RESOURCES INVENTORY AND SUITABILITY ASSESSMENT FOR THE MAJOR LAND USE TYPES IN MOROGORO URBAN DISTRICT, TANZANIA. Morogoro; 2001.
- Msanya BM, Kimaro DN, Kimbi GG, Kileo EP, Mbogoni JJDJ. Land resources inventory and suitability assessment for the major land use types in Morogoro Urban District, Tanzania. Soils and Land Resources of Morogoro Rural and Urban Districts. Department of Soil Science, Faculty of Agriculture, Sokoine University of Agriculture, Morogoro, Tanzania. Vol. 4. Morogoro, Tanzania; 2001 May.
- Kononova MM. Soil organic matter: its nature, its role in soil formation and in soil fertility. Elsevier; 2013.
- Lehmann J, Kleber M. The contentious nature of soil organic matter. Nature. 2015;528(7580):60–8. [CrossRef]
- Heckman JR. Below Optimum Optimum Above Optimum Soil Fertility Test Interpretation Phosphorus, Potassium, Magnesium, and Calcium [Internet]. 2004. Available from: www.rce.rutgers.edu.
- Mumbach GL, Oliveira DA de, Warmling MI, Gatiboni LC. Phosphorus extraction by Mehlich 1, Mehlich 3 and Anion Exchange Resin in soils with different clay contents. Revista Ceres. 2018;65:546–54.
- Savoy H. Interpreting Mehlich 1 and 3 soil test extractant results for P and K in Tennessee. University of Tennessee, Institute of Agriculture. 2009;
- da Silva RJAB, da Silva YJAB, van Straaten P, do Nascimento CWA, Biondi CM, da Silva YJAB, et al. Influence of parent material on soil chemical characteristics in a semi-arid tropical region of Northeast Brazil. Environ Monit Assess. 2022 May 1;194(5). [CrossRef]
- Maria RM, Yost R. A survey of soil fertility status of four agroecological zones of Mozambique. Soil Sci [Internet]. 2006 Nov [cited 2022 Jul 20];171(11):902–14. Available from: https://journals.lww.com/soilsci/Fulltext/2006/11000/A_SURVEY_OF_SOIL_FERTILITY_STATUS_OF_FOUR.8.aspx. [CrossRef]
- Havlin JL. Soil: Fertility and nutrient management. In: Landscape and land capacity. CRC Press; 2020. p. 251–65.
- Soil and Plant Analysis Council. Soil analysis handbook of reference methods. CRC press; 1992. 265 p.
- Andreasen R, Thomsen E. Strontium is released rapidly from agricultural lime–implications for provenance and migration studies. Front Ecol Evol. 2021;8:588422. [CrossRef]
- Gregorauskienė V, Kadunas V. Vertical distribution patterns of trace and major elements within soil profile in Lithuania. Geological Quarterly. 2006;50(2):229–37.
- Shahid M, Ferrand E, Schreck E, Dumat C. Behavior and impact of zirconium in the soil–plant system: plant uptake and phytotoxicity. Reviews of Environmental Contamination and Toxicology Volume 221. 2012;107–27.
- Kabata-Pendias A. Trace elements in soils and plants. CRC press; 2000.
- Soil Survey Staff. Keys to soil taxonomy. Soil Conservation Service. Twelfth Ed. 2014;12:410.
- Voortman RL, Spires B, FAO. Landscape Ecological Survey And Land Evaluation, For Rural Development Planning, Angonia District, Tete Province. Land evaluation, land suitability and recommended land use. Instituto de Investigacao Agraria de Mocambique. Vol. 6. Maputo; 1986 Mar.
- Martinho CA, Lung C, Roda FA, Pereira R, Mofate OA, Naconha AE. Manual de maneio da cultura de batata reno. 2017;1–26.
- Dinssa B, Elias E. Characterization and classification of soils of bako tibe district, west shewa, Ethiopia. Heliyon. 2021;7(11). [CrossRef]
- Mohamed SH, Msanya BM, Tindwa HJ, Semu E. Pedological characterization and classification of selected soils of morogoro and mbeya regions of Tanzania. International Journal of Natural Resource Ecology and Management. 2021;6(2):79–92. [CrossRef]
- Uwingabire S, Msanya BM, Mtakwa PW, Uwitonze P, Sirikare S. Pedological Characterization of soils developed on gneissic granites in the Congo Nile Watershed Divide and Central Plateau zones, Rwanda. Int J Curr Res. 2016;(9):39489–501.
- Blanco-Canqui H, Stone LR, Schlegel AJ, Lyon DJ, Vigil MF, Mikha MM, et al. No-till induced increase in organic carbon reduces maximum bulk density of soils. Soil Science Society of America Journal. 2009;73(6):1871–9. [CrossRef]
- Chichongue O, van Tol J, Ceronio G, Du Preez C. Effects of tillage systems and cropping patterns on soil physical properties in Mozambique. Agriculture. 2020;10(10):448.
- Takele L, Chimdi A, Abebaw A. Dynamics of soil fertility as influenced by different land use systems and soil depth in West Showa Zone, Gindeberet District, Ethiopia. Agriculture, Forestry and Fisheries. 2014;3(6):489–94.
- Hailu AH, Kibret K, Gebrekidan H. Characterization and classification of soils of kabe subwatershed in south wollo zone, northeastern Ethiopia. African Journal of Soil Science. 2015;3(7):134–46.
- Pereira MJSL, Esteves da Silva J. Environmental Stressors of Mozambique Soil Quality. Environments. 2024;11(6):125.
- Dessalegn D, Beyene S, Ram N, Walley F, Gala TS. Effects of topography and land use on soil characteristics along the toposequence of Ele watershed in southern Ethiopia. Catena (Amst). 2014;115:47–54. [CrossRef]
- Alemayehu Y, Gebrekidan H, Beyene S. Pedological characteristics and classification of soils along landscapes at Abobo, southwestern lowlands of Ethiopia. Journal of Soil Science and Environmental Management. 2014;5(6):72–82.
- Uwingabire S, Msanya B, Mtakwa PW, Uwitonze P, Sirikare S. PEDOLOGICAL CHARACTERIZATION OF SOILS DEVELOPED ON GNEISSIC CONGO NILE WATERSHED DIVIDE AND CENTRAL PLATEAU. 2016 Sep;8(09):39489–501. Available from: http://www.journalcra.com.
- Gebrehanna B, Beyene S, Abera G. Impact of Topography on Soil Properties in Delboatwaro Subwatershed, Southern Ethiopia. Asian Journal of Soil Science and Plant Nutrition. 2022;(8):4. [CrossRef]
- Condron LM, Sinaj S, McDowell RW, Dudler-Guela J, Scott JT, Metherell AK. Influence of long-term irrigation on the distribution and availability of soil phosphorus under permanent pasture. Soil Research. 2006;44(2):127–33. [CrossRef]
- Ortiz C, Pierotti S, Molina MG, Bosch-Serra ÀD. Soil Fertility and Phosphorus Leaching in Irrigated Calcareous Soils of the Mediterranean Region. Environ Monit Assess. 2023;195(11):1376. [CrossRef]
- Solly EF, Weber V, Zimmermann S, Walthert L, Hagedorn F, Schmidt MWI. A critical evaluation of the relationship between the effective cation exchange capacity and soil organic carbon content in Swiss forest soils. Frontiers in Forests and Global Change. 2020;3:98. [CrossRef]
- Kumaragamage D, Warren J, Spiers G. Soil Chemistry. Digging into Canadian Soils. 2021;
- Tomašic M, Zgorelec Ž, Jurišic A, Kisic I. Cation exchange capacity of dominant soil types in the Republic of Croatia. Journal of Central European Agriculture. 2013; [CrossRef]
- Lu X, Mao Q, Gilliam FS, Luo Y, Mo J. Nitrogen deposition contributes to soil acidification in tropical ecosystems. Glob Chang Biol [Internet]. 2014 Dec 1 [cited 2025 Mar 13];20(12):3790–801. Available from: https://onlinelibrary.wiley.com/doi/full/10.1111/gcb.12665. [CrossRef]
- Niu G, Wang R, Hasi M, Wang Y, Geng Q, Wang C, et al. Availability of soil base cations and micronutrients along soil profile after 13-year nitrogen and water addition in a semi-arid grassland. Biogeochemistry [Internet]. 2021 Feb 1 [cited 2025 Mar 13];152(2–3):223–36. Available from: https://link.springer.com/article/10.1007/s10533-020-00749-5. [CrossRef]
- Hodges SC. Soil Fertility Basics. Soil Science Extension North Carolina State University. [Internet]. Academic Press; 2007 [cited 2024 Dec 6]. 75 p. Available from: http//.plantstress.com/Articles/min_deficiency_i/soil_fertility.pdf.
- Dhaliwal SS, Sharma V, Kaur J, Shukla AK, Hossain A, Abdel-Hafez SH, et al. The Pedospheric Variation of DTPA-Extractable Zn, Fe, Mn, Cu and Other Physicochemical Characteristics in Major Soil Orders in Existing Land Use Systems of Punjab, India. Sustainability 2022, Vol 14, Page 29 [Internet]. 2021 Dec 21 [cited 2024 Dec 8];14(1):29. Available from: https://www.mdpi.com/2071-1050/14/1/29/htm. [CrossRef]
- Liang B, Han G, Zhao Y. Zinc isotopic signature in tropical soils: A review. Science of the Total Environment. 2022;820:153303. [CrossRef]
- Walna B, Spychalski W, Ibragimow A. Fractionation of iron and manganese in the horizons of a nutrient-poor forest soil profile using the sequential extraction method. Pol J Environ Stud. 2010;19(5):1029–37.
- Uwitonze P, Msanya BM, Mtakwa PW, Uwingabire S, Sirikare S. Pedological Characterization of Soils Developed from Volcanic Parent Materials of Northern Province of Rwanda. Agriculture, Forestry and Fisheries. 2016;(6):225–36. [CrossRef]
- Abdoulaye ODM, Yao BK, Ahmed AM, Adouby K, Abro DMK, Drogui P. Mineralogical and morphological characterization of a clay from Niger. Jour Mater Environ Sci. 2019;10(7):582–9.
- Nguetnkam JP, Kamga R, Villiéras F, Ekodeck GE, Yvon J. Altération différentielle du granite en zone tropicale. Exemple de deux séquences étudiées au Cameroun (Afrique Centrale). Comptes Rendus Géoscience. 2008;340(7):451–61.
- Miranda-Trevino JC, Coles CA. Kaolinite properties, structure and influence of metal retention on pH. Appl Clay Sci. 2003;23(1–4):133–9. [CrossRef]
- Buol SW, Southard RJ, Graham RC, McDaniel PA. Soil genesis and classification. 6th ed. Chichester, West Sussex: Jihn Wiley & Sons, Inc.; 2011. 531 p.
- Msanya B, Munishi J, Amuri N, Semu E, Mhoro L, Malley Z. Morphology, Genesis, Physico-chemical Properties, Classification and Potential of Soils Derived from Volcanic Parent Materials in Selected Districts of Mbeya Region, Tanzania. Int J Plant Soil Sci. 2016 Jan 10;10(4):1–19. [CrossRef]
- Khawmee K, Suddhiprakarn A, Kheoruenromne I, Singh B. Surface charge properties of kaolinite from Thai soils. Geoderma. 2013;192:120–31. [CrossRef]
- Abaga NOZ, Nfoumou V, M’voubou M. Influence of the parent rock nature on the mineralogical and geochemical composition of ferralsols used for sedentary agriculture in the Paleoproterozoic Franceville sub-basin (Gabon). Int J Biol Chem Sci. 2023;17(4):1778–89. [CrossRef]
- Ofem KI, John K, Ediene VF, Kefas PK, Ede AM, Ezeaku VI, et al. Pedological data for the study of soils developed over a limestone bed in a humid tropical environment. Environ Monit Assess. 2023;195(5):628. [CrossRef]
- Anda M, Chittleborough DJ, Fitzpatrick RW. Assessing parent material uniformity of a red and black soil complex in the landscapes. Catena (Amst). 2009;78(2):142–53. [CrossRef]
- Kabała C, Szerszeń L. Profile distributions of lead, zinc, and copper in Dystric Cambisols developed from granite and gneiss of the Sudetes Mountains, Poland. Water Air Soil Pollut. 2002;138:307–17. [CrossRef]
- Teutsch N, Erel Y, Halicz L, Banin A. Distribution of natural and anthropogenic lead in Mediterranean soils. Geochim Cosmochim Acta. 2001;65(17):2853–64. [CrossRef]
- Nieder R, Benbi DK, Reichl FX, Nieder R, Benbi DK, Reichl FX. Role of potentially toxic elements in soils. Soil components and human health. 2018;375–450.
- Zhang J, Wu Y, Xu Y. Factors Affecting the Levels of Pb and Cd Heavy Metals in Contaminated Farmland Soils. 2016.
Figure 1.
Map showing the geographic location of Tete province and the districts headquarters, Mozambique.
Figure 1.
Map showing the geographic location of Tete province and the districts headquarters, Mozambique.
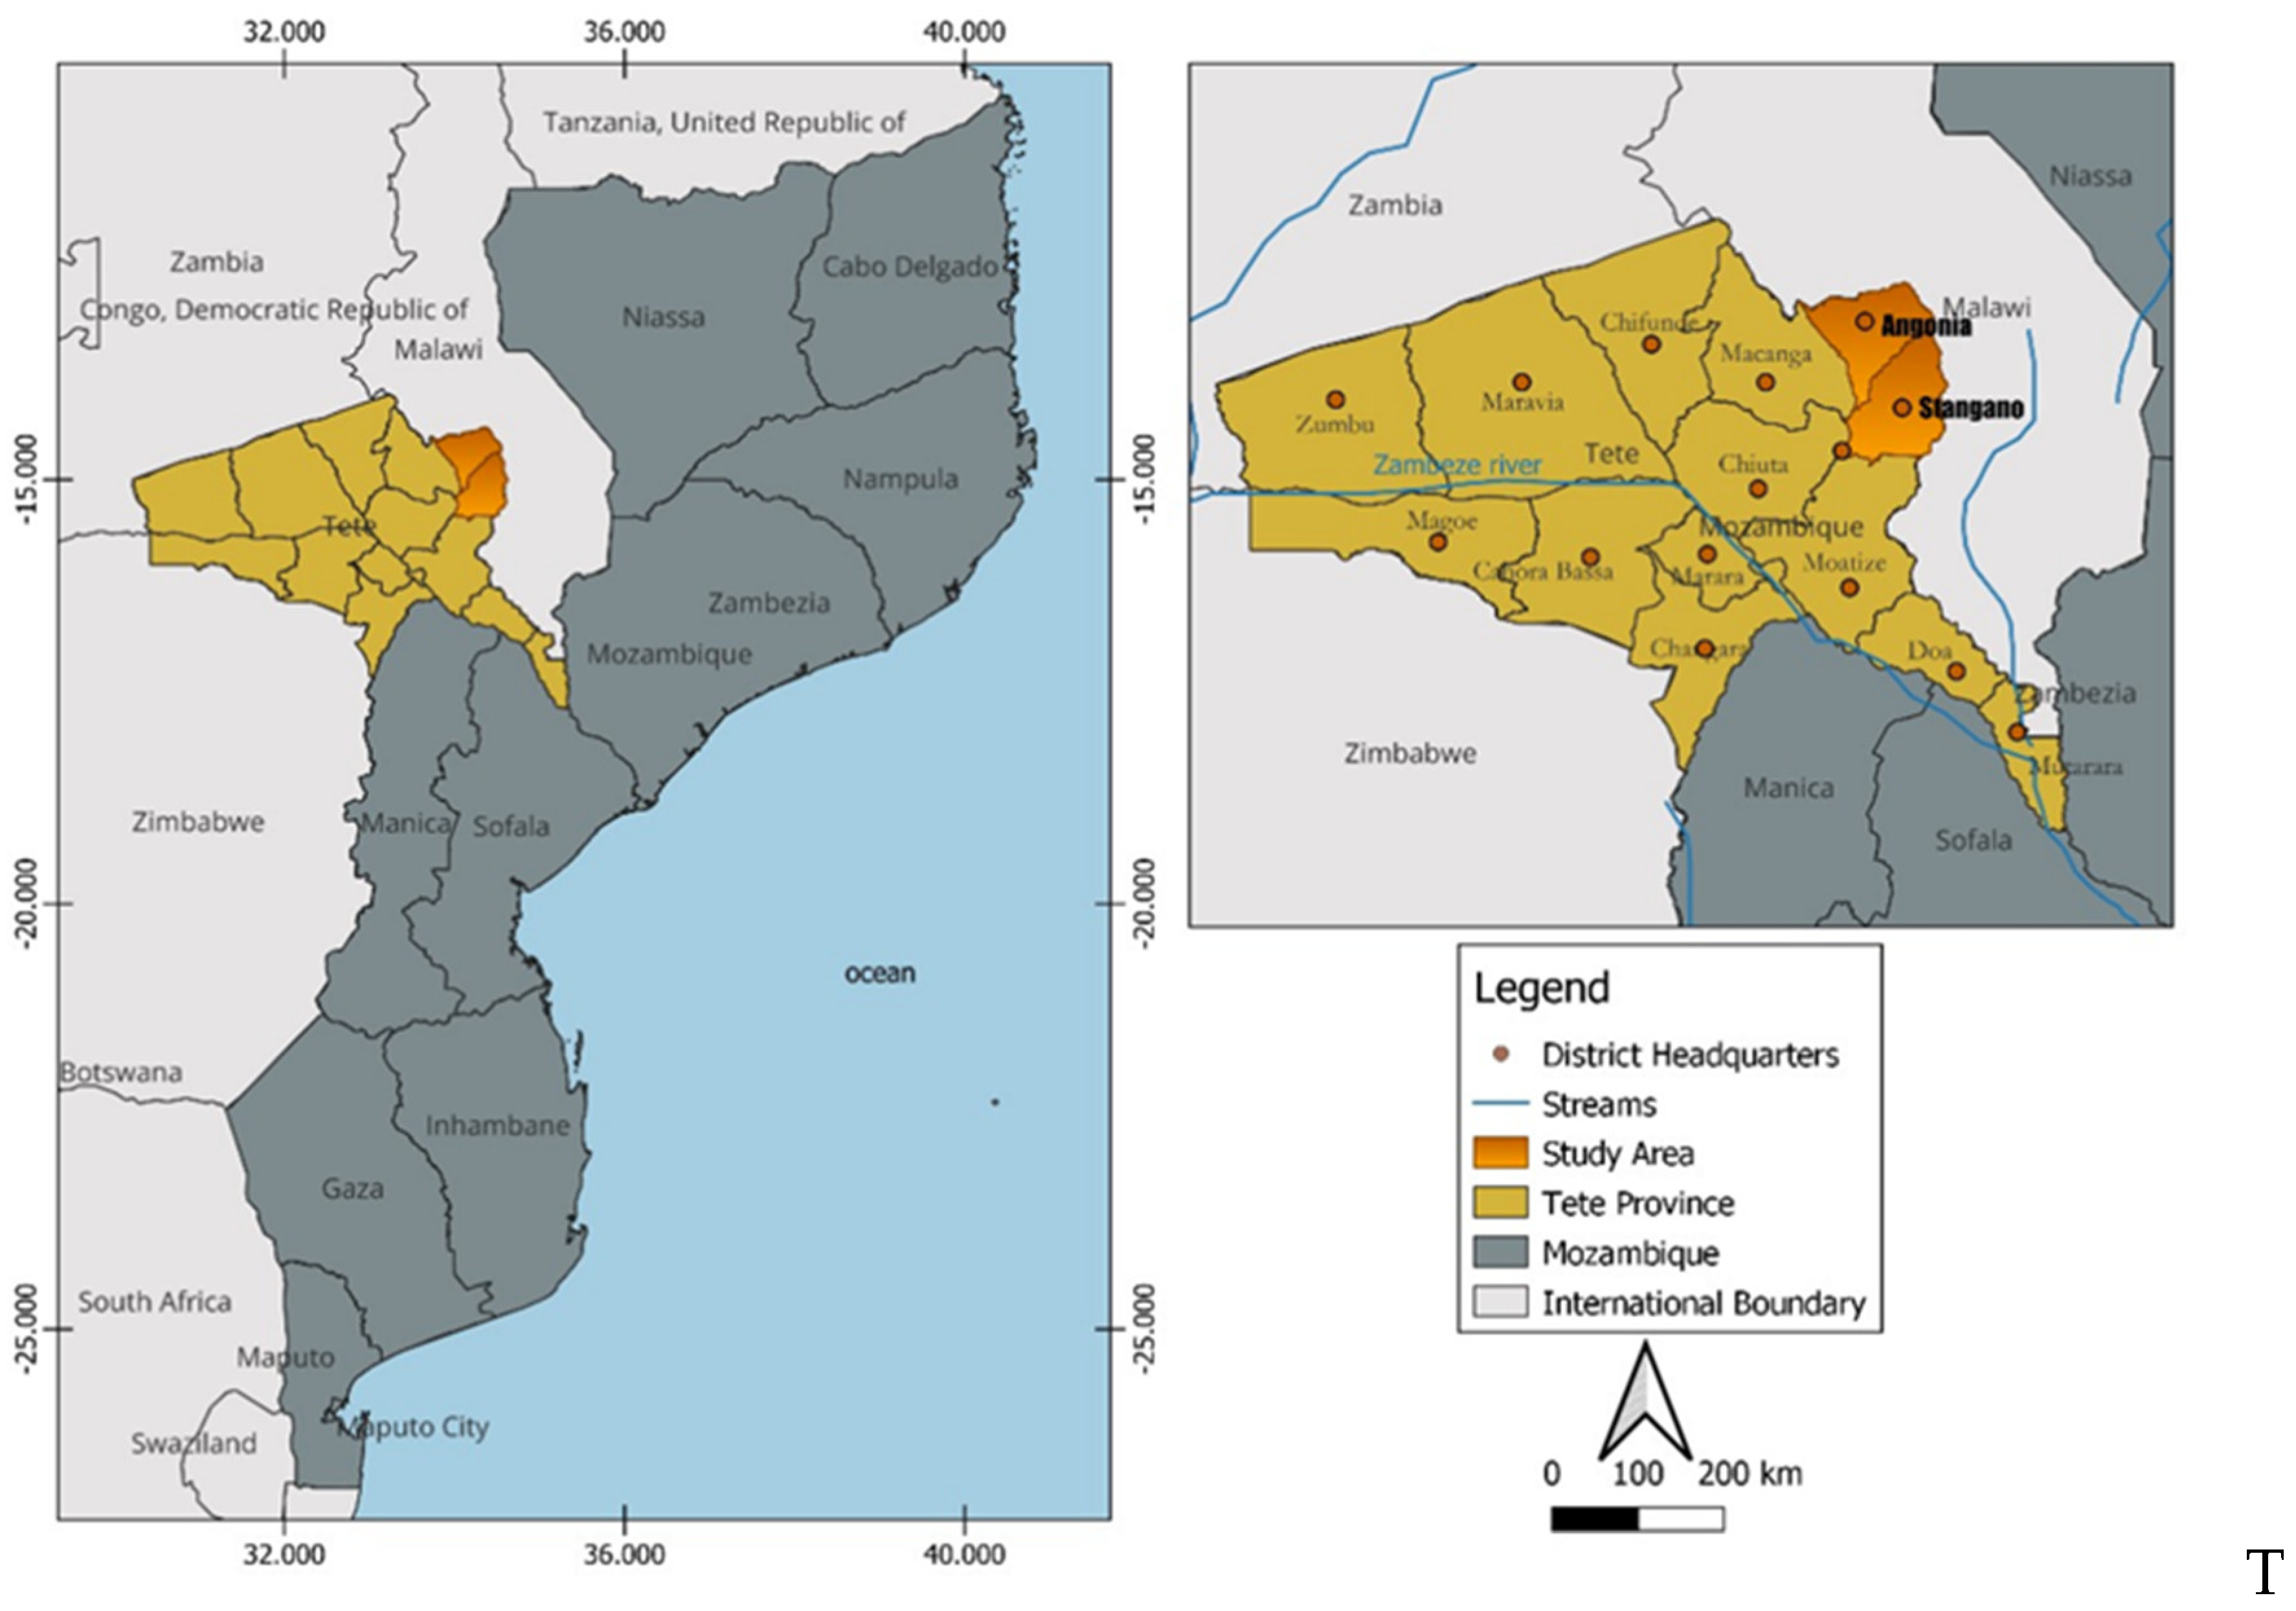
Figure 2.
Location of profile excavation sites, Mr. Carneiro Farm = Profile 1 (TSA-P01), SDAE = Profile 2 (TSA-P02), Mr. Jonas Farm = Profile 1 (ANGO-P01) and CITTA = Profile 2 (ANGO-P02).
Figure 2.
Location of profile excavation sites, Mr. Carneiro Farm = Profile 1 (TSA-P01), SDAE = Profile 2 (TSA-P02), Mr. Jonas Farm = Profile 1 (ANGO-P01) and CITTA = Profile 2 (ANGO-P02).
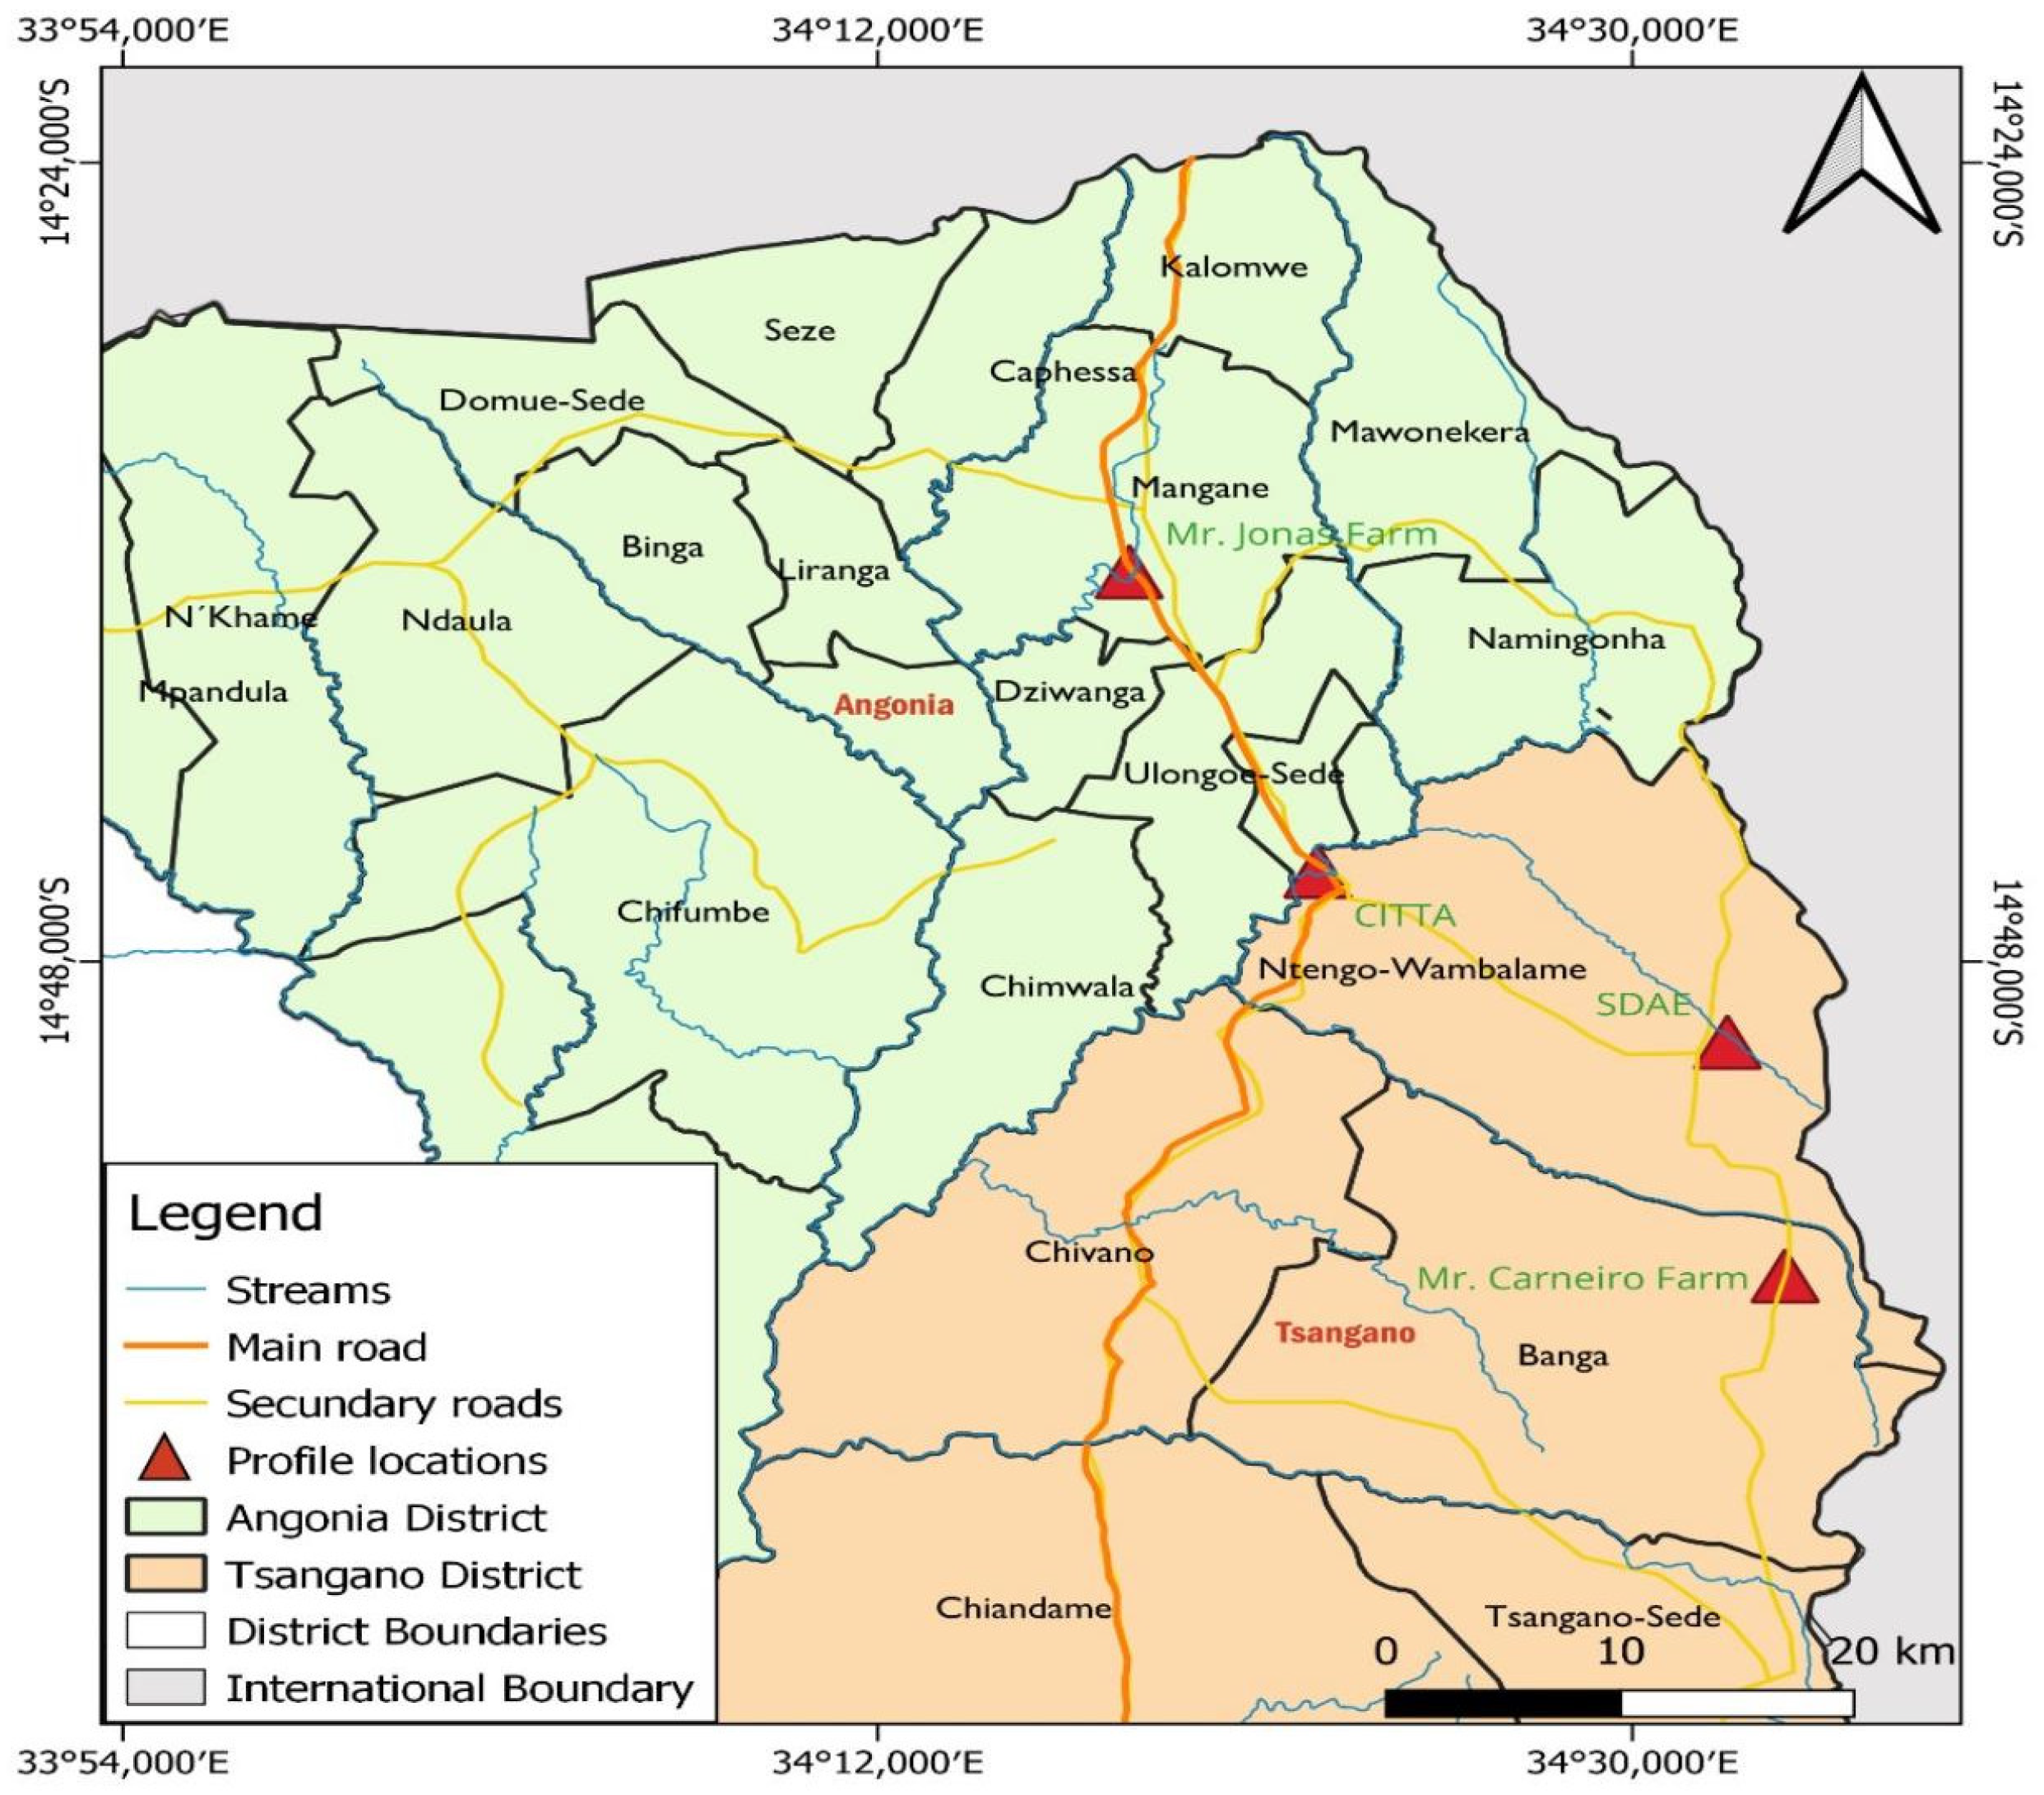
Figure 3.
Soil profiles excavated at Ligowe (TSA-P01), Ntengo-Wambalame at SDAE (TSA-P02), Rinze (ANGO-P01) and Ulongue -CITTA (ANGO-P02) in Tsangano and Angonia Districts, respectively.
Figure 3.
Soil profiles excavated at Ligowe (TSA-P01), Ntengo-Wambalame at SDAE (TSA-P02), Rinze (ANGO-P01) and Ulongue -CITTA (ANGO-P02) in Tsangano and Angonia Districts, respectively.
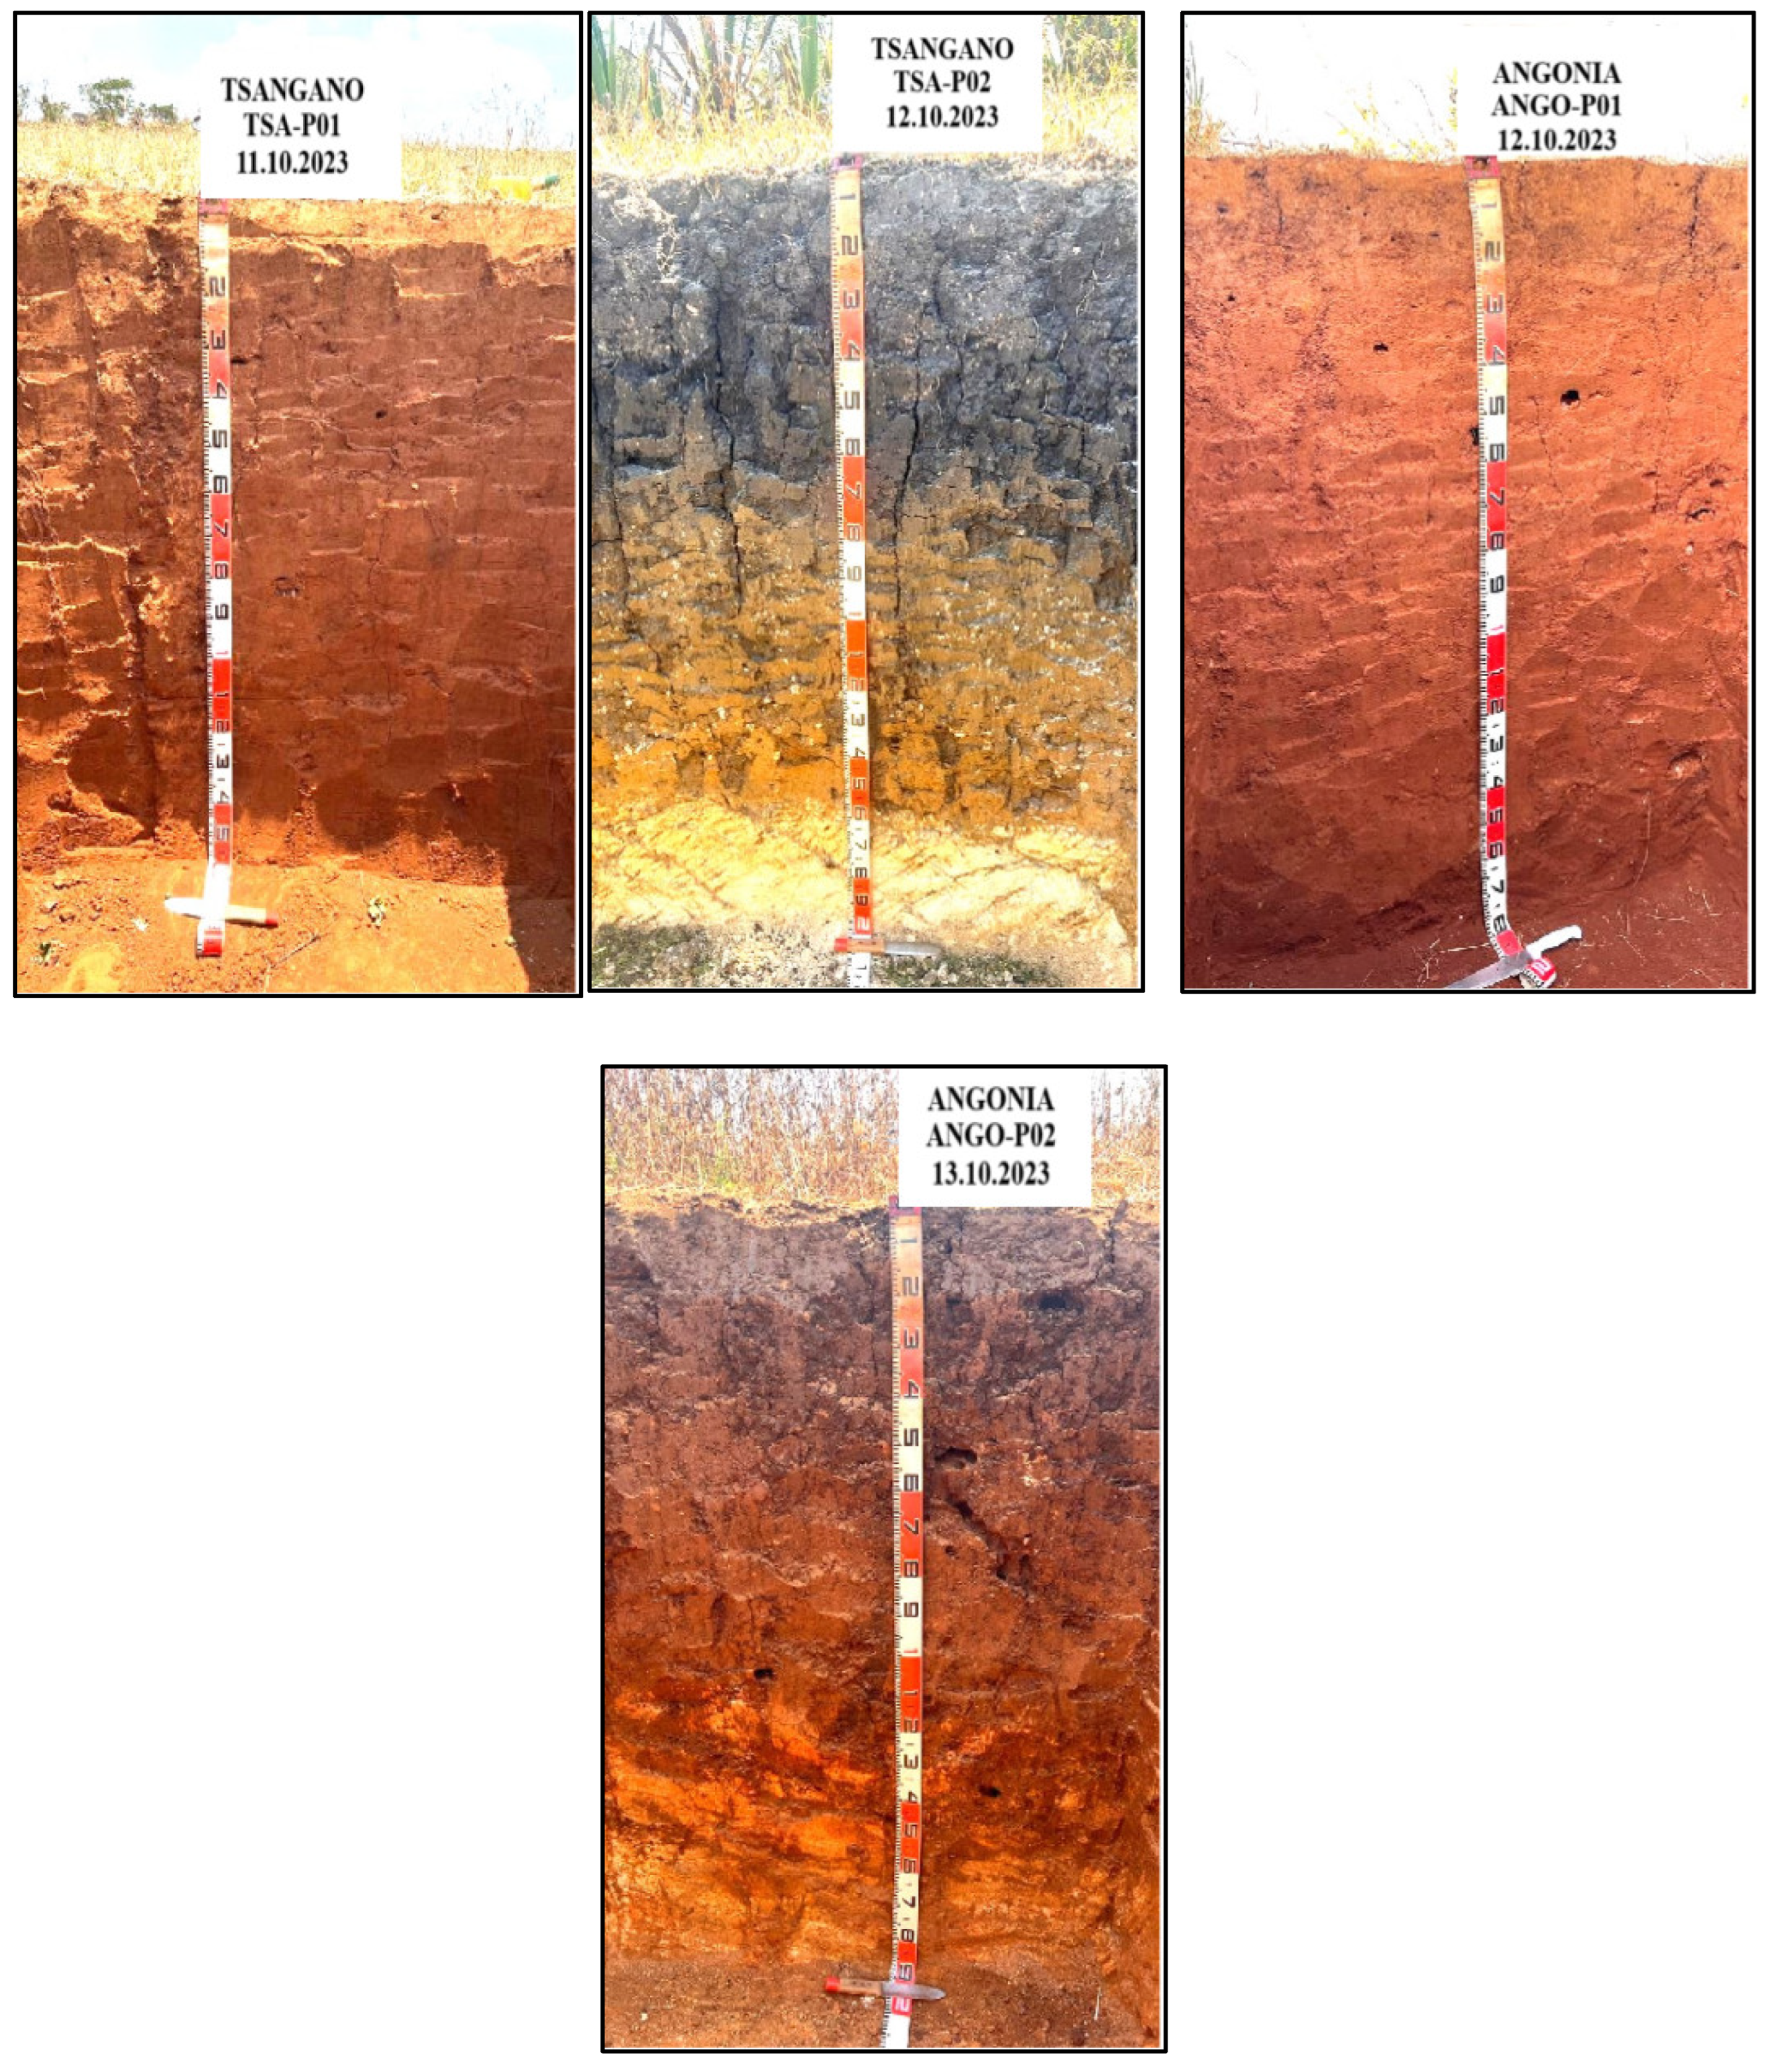
Table 1.
Characteristics of the representative study sites in Tsangano and Angónia Districts, Mozambique.
Table 1.
Characteristics of the representative study sites in Tsangano and Angónia Districts, Mozambique.
| District | Tsangano | Angónia | ||
|---|---|---|---|---|
| Village | Ligowe | Ntengo-Wambalame | Rinze | Ulónguè |
| Location | Mr. M. Carneiro’s Farm | SDAE farm | Mr. Jonas’ farm | CITTA farm |
| Attributes | Description | |||
| Pedon symbol | TSA-P01 | TSA-P02 | ANGO-P01 | ANGO-P02 |
| Agro-Ecological Zone 10 | high rainfall zone | high rainfall zone | high rainfall zone | high rainfall zone |
| Coordinates | 14° 52′ 47″ S/ 34° 21′ 30″ E | 14° 50′ 25″ S/ 34° 32′ 16″ E | 14° 36′ 17″ S/ 34° 18′ 0″ E | 14° 45′ 17″ S/ 34° 22′ 30″ E |
| Altitudes (m.a.s.l.) | 1427 | 1340 | 1260 | 1200 |
| Landform | hilly | plain | hilly | hilly |
| Geology/Lithology | Precambrian Meso- and Neoproterozoic geological eons dominated by quartz-feldspathic gneiss and amphibolic gneiss |
Precambrian Meso- and Neoproterozoic geological eons dominated by quartz-feldspathic gneiss and amphibolic gneiss |
Precambrian Meso- and Neoproterozoic geological eons dominated by basic rocks, migmatitic gneisses and granulites | Precambrian Meso- and Neoproterozoic geological eons dominated by basic rocks, migmatitic gneisses and granulites |
| Slope gradient (%) | 16 | 2-5 | 16 | 12 |
| Land use/vegetation | Agriculture but currently under grazing and fallow for 4 years | Agriculture and area under maize, conservation strategy (matuto) | Agriculture for maize, soybean, potatoes, vegetables | Agriculture and area under fallow for 4 years |
| Natural vegetation | Various grasses | Eucalyptus, mangoes, sisal boundary, legume shrubs, vinegar grass, Mexican sunflower (Tithonia diversifolia) | Mangoes, legumes, shrubs | Various grasses |
| Natural drainage | well to excessively well drained | well to moderately well drained | well drained | well drained |
| Flooding | None | None | None | None |
| Erosion | water, slight sheet (interill) | water, slight sheet (interill) | water, slight sheet (interill) | water, slight sheet |
| Annual rainfall (mm) | 1000 - 1200 | 1000 - 1200 | 800 - 1200 | 800 - 1200 |
| Soil moisture regime (SMR) | ustic | aquic | ustic | ustic |
| Mean annual temperature (oC) | 15 - 20 | 15 - 20 | 15 - 22 | 15 - 22 |
| Soil temperature regime (STR) | thermic | thermic | thermic | thermic |
SDAE = District Service of Agriculture and Economics Activities, CITTA = Angónia Research Centre and Technologies Transfer. TSA-P01 = Tsangano pedon 1; TSA-P02 = Tsangano pedon 2; ANGO-P01 = Angonia pedon 1; ANGO-P02 = Angonia pedon 2.
Table 2.
Morphological characteristics of studied pedons in Tsangano and Angonia Districts, Mozambique.
Table 2.
Morphological characteristics of studied pedons in Tsangano and Angonia Districts, Mozambique.
| Location | Pedon | Horizon | Depth (cm) | Dry colour1) | Moist colour2) | Consistence3) | Structure4) | Cutans5 | Slickensides6 | Pores7) | Roots8) | Horizon boundary9) |
| Ligowe | TSA-P01 | Ap | 0 – 8 | b(7.5YR4/4) | db(2.5YR3/3) | sh, fi, ss& sp | w-m&c,sbk | - | - | c&f | f-c&f-m | c&w |
| Bt1 | 8 – 45 | rd(5YR4/4) | drb(5YR3/4) | vha, fi, spl | w-m, m&c, sbk | m-f, cs | - | c&f | f-f | gd&s | ||
| Bt2 | 45 - 112 | yr(5Y4/6) | drb(5YR3/4) | vha, vfr, spl | m-m, sbk | m-f, cs | - | c&f | f-f | gd&s | ||
| Bt3 | 112 - 155+ | yr(5YR5/8) | yr(5 YR4/6) | sha, vfr, spl | m, f&m, sbk | m-f&m, cs | - | c&f | vf-f | NA | ||
| Ntengo-wa-mbalame | TSA-P02 | Ap | 0 – 21 | vdg(5YR3/1) | bl(5YR2.5/1) | h, fr, spl | m&m, sbk | - | - | m-f&m, f-c | m-f, c-m&f-c | c&s |
| BA1 | 21 – 41 | bl(7.5YR2.5/1) | bl(2.5YR2.5/1) | eha, fr, vst&vpl | m, m&c, ab-sbk | - | mds | c-f&m | c-f&fm | c&s | ||
| BA2k | 41 - 75/91 | bl(2.5YR2.5/1) | bl(5YR2.5/1) | eha, fi, vst&vpl | m-s, m&c, ab-sbk | - | mds | c-f&m | f-f | c&w | ||
| BCgk | 79/91 - 155/165 | g(7.5YR6/1) | lob(2.5Y5/4) | vha, fi, vst&vpl | m-m&c, ab&sbk | - | - | f-f&m | vf-f | a&w | ||
| CRgk | 155/165 - 200 | w(5Y2/1) | oy(2.5Y6/6) | sha, fr, ns&np | sg | - | - | m-f, m&c-m | n | NA | ||
| Rinze | ANGO-P01 | Ap | 0 - 25/30 | db(7.5YR3/4) | db(7.5YR3/2) | sha, vfr, ss&sp | w-f&m, sbk | - | - | m-f&m | c-f | cw |
| Bt1 | 25/30 - 70 | b(7.5YR4/4) | vdb(7.5YR2.5/3) | sha, vfr, sp | m-m, sbk | f-vf, c | - | m-f&m | f-f | d&s | ||
| Bt2 | 70 - 120 | r(2.5YR4/6) | dr(2.5YR3/6) | sha, vfr, sp | s-f&m, sbk | m-f&m, cs | - | m-f&m | f-vf | d&s | ||
| Bt3 | 120 - 181 | r(2.5YR4/8) | r(2.5 YR4/6) | ha, fi, sp | s-f&m, sbk | m-vf, cs | - | m-f&m | vf-vf | NA | ||
| CITTA | ANGO-P02 | Ap | 0 – 29 | drb(5YR3/2) | bl(5YR2.5/1) | vha, vfr, ss&sp | m-m&c, sbk | - | - | f-m&m-f | m-f | c&s |
| BA | 29 – 50 | drb(5YR3/3) | drb(5YR3/2) | vha, fr, spl | m-m&c, sbk | - | - | m-f&c-m | c-f | c&s | ||
| Bt | 50 - 86/118 | drb(5YR3/4) | drb(5YR3/3) | vha, fr, spl | w-m&c, sbk | m-f, cs | - | m-f&c-m | f-f | c&w | ||
| CR | 86/118-181 | sb(7.5YR5/8) | sb(7.5 YR5/6) | so, vfr, ns&np | sg | - | - | m-f, m-m&c | n | NA |
TSA-P01 = Tsangano profile 1; TSA-P02 = Tsangano profile 2; ANGO-P01 = Angonia profile 1; ANGO-P02 = Angonia profile 2. 1); 2) Soil colour: g = gray; bl = black; b = brown; yr = yellowish red; sb = strong brown, db = dark brown; vdb = very dark brown; lob = light olive brown; oy = olive-yellow drb = dark reddish brown, r = red, dr = dark red, vdg = very dark grey, w = white. 3) Consistence: sh = slightly hard; h = hard; vh = very hard; eha = extremely hard; fr = friable; vfr = very friable; fi = firm; ns&np = non-sticky and non-plastic; ss&sp = slightly sticky and slightly plastic; s&p = sticky and plastic, vs&vp = very sticky and very plastic; spl = sightly plastic. 4) Structure: m- f&m = moderate, fine and medium; m-m = moderate medium; w-f&m = weak, fine and medium; m-m&c = moderate, medium and coarse; w-m&c = weak medium and coarse; w-m, m&c = weak to moderate, medium and coarse, sg = single grain; s-f&m = strong, fine and medium; m-s, m&c = moderate to strong medium and coarse; ab = angular; sbk = subangular blocky. 5) Cutans: m-f, cs = many fine clay sesquioxides; m-f&m, cs = many fine and medium clay sesquioxides; f-vf, c = few very fine clays. 6) Slickensides: mds = many distinct slickensides. 7) Pores: m-f, m-m&c = many fine, and may medium and coarse; m-f&c-m = many fine and common medium; m-f&m = many fine and medium; m-f&m, f-c = many fine and medium, few common; c-f = common fine; m-f = many fine; f-m&m-f = few medium and many fine; f-f&m = few fine and medium; c-f&m = common fine and medium. 8) Roots: f-c&f-m = few common and few medium; f-f = few fine; vf- f = very few fine; m-f, c-m&f-c = many fine, common medium and few coarse; c-f&f-m = common fine and few medium, n = none; c-f = common fine; f-fv = few very fine; m-f = many fine. 9) Horizon boundary: a&w = abrupt and wavy; c&w = clear and wavy; c&s = clear and smooth; g-d&s = gradual to difuse and smooth; d&s = diffuse and smooth; NA = not applicable.
Table 3.
Selected physical properties of the studied pedons in Tsangano and Angonia Districts, Mozambique.
Table 3.
Selected physical properties of the studied pedons in Tsangano and Angonia Districts, Mozambique.
|
Pedon |
Horizon | Depth (cm) | Texture | Silt/clay ratio |
Bulk density (kg m-3) |
Porosity (%) | AWC (mm m-1) | Penetration resistance (MPa) | |||
| Clay % | Silt % | Sand % | Texture class | ||||||||
|
TSA-P01 |
Ap | 0 - 8 | 34 | 10 | 56 | SCL | 0.29 | 1.58 | 37.31 | 84.9 | 1.75 |
| Bt1 | 8 - 45 | 42 | 10 | 48 | SC | 0.23 | 1.55 | 38.71 | 110.5 | 1.64 | |
| Bt2 | 45 - 112 | 58 | 10 | 32 | C | 0.17 | 1.47 | 37.03 | 128.6 | 1.63 | |
| Bt3 | 112 - 155+ | 58 | 10 | 32 | C | 0.17 | nd | nd | nd | 1.56 | |
| Ap | 0 - 21 | 36 | 16 | 48 | SC | 0.44 | 0.78 | 67.54 | 132.1 | 1.68 | |
| TSA-P02 | BA1 | 21 - 41 | 42 | 14 | 44 | SC | 0.33 | nd | nd | nd | 1.74 |
| BA2k | 41 - 75/91 | 58 | 14 | 28 | C | 0.24 | 1.54 | 34.84 | 149.5 | 1.79 | |
| BCgk | 75/91- 155/165 | 66 | 14 | 20 | C | 0.21 | 1.58 | 36.82 | 166.6 | 1.53 | |
| CRgk | 155/165 - 200 | 8 | 6 | 86 | S | 0.75 | nd | nd | nd | 1.36 | |
|
ANGO-P01 |
Ap | 0 - 25/30 | 38 | 18 | 44 | SC | 0.47 | 1.44 | 46.71 | 101.0 | 1.67 |
| Bt1 | 25/30 - 70 | 62 | 14 | 24 | C | 0.22 | 1.41 | 41.82 | 132.9 | 1.61 | |
| Bt2 | 70 - 120 | 78 | 14 | 8 | C | 0.17 | 1.31 | 43.73 | 182.6 | 1.58 | |
| Bt3 | 120 - 181 | 74 | 18 | 8 | C | 0.24 | nd | nd | nd | 1.50 | |
|
ANGO-P02 |
Ap | 0 -29 | 54 | 14 | 32 | C | 0.25 | 1.26 | 47.69 | 94.7 | 1.28 |
| BA | 29 - 50 | 62 | 14 | 24 | C | 0.22 | 1.38 | 42.14 | 156.0 | 1.67 | |
| Bt | 50 - 86/118 | 64 | 16 | 20 | C | 0.25 | nd | nd | nd | 1.54 | |
| CR | 86/118- 181 | 16 | 8 | 76 | SL | 0.5 | 1.25 | 49.72 | 173.4 | 1.18 | |
TSA-P01 = Tsangano profile 1; TSA-P02 = Tsangano profile 2; ANGO-P01 = Angónia profile 1; ANGO-P02 = Angónia profile 2; SCL = sandy clay loam; SL = sandy loam; SC = sandy clay; C = Clay; nd = not determined, AWC = available water capacity.
Table 4.
Some chemical properties of the studied pedons in Tsangano and Angonia Districts, Mozambique.
Table 4.
Some chemical properties of the studied pedons in Tsangano and Angonia Districts, Mozambique.
| Pedon | Horizon | Depth (cm) | pHwater | pH CaCl2 | EC dS m-1 | Organic C (%) | Total N (%) | C/N | Avail. P Mehlich-3 (mg kg-1) |
|---|---|---|---|---|---|---|---|---|---|
| TSA-P01 | Ap | 0 - 8 | 5.6 | 4.4 | 0.06 | 1.35 | 0.12 | 11.3 | 20.94 |
| Bt1 | 8 - 45 | 5.5 | 4.1 | 0.03 | 1.09 | 0.1 | 10.9 | 15.54 | |
| Bt2 | 45 - 112 | 6.0 | 4.9 | 0.02 | 0.6 | 0.07 | 8.6 | 14.18 | |
| Bt3 | 112 - 155+ | 6.4 | 5.2 | 0.02 | 0.53 | 0.06 | 8.8 | 13.37 | |
| TSA-P02 | Ap | 0 - 21 | 6.7 | 5.4 | 0.10 | 2.73 | 0.22 | 12.4 | 15.00 |
| BA1 | 21 - 41 | 7.1 | 5.9 | 0.10 | 1.58 | 0.14 | 11.3 | 13.10 | |
| BA2k | 41 - 75/91 | 7.3 | 6.1 | 0.13 | 0.92 | 0.09 | 10.2 | 28.51 | |
| BCgk | 75/91- 155/165 | 7.9 | 6.6 | 0.28 | 0.55 | 0.06 | 9.2 | 17.83 | |
| CRgk | 155/165 - 200 | 7.9 | 6.5 | 0.09 | 0.16 | 0.04 | 4.0 | 19.05 | |
| ANGO-P01 | Ap | 0 - 25/30 | 6.1 | 5.0 | 0.04 | 1.44 | 0.13 | 11.1 | 17.56 |
| Bt1 | 25/30 - 70 | 6.2 | 4.6 | 0.01 | 0.98 | 0.09 | 10.9 | 14.18 | |
| Bt2 | 70 - 120 | 6.6 | 4.9 | 0.01 | 0.57 | 0.07 | 8.1 | 14.05 | |
| Bt3 | 120 - 181 | 6.4 | 5.1 | 0.01 | 0.53 | 0.06 | 8.8 | 15.67 | |
| ANGO-P02 | Ap | 0 -29 | 5.7 | 4.7 | 0.03 | 1.54 | 0.13 | 11.8 | 14.59 |
| BA | 29 - 50 | 6.0 | 4.7 | 0.02 | 0.86 | 0.09 | 9.6 | 14.32 | |
| Bt | 50 - 86/118 | 6.1 | 5.0 | 0.03 | 0.82 | 0.08 | 10.3 | 14.32 | |
| CR | 86/118- 181 | 5.9 | 5.1 | 0.05 | 0.62 | 0.03 | 0.7 | 14.86 |
TSA-P01 = Tsangano pedon 1; TSA-P02 = Tsangano pedon 2; ANGO-P01 = Angónia pedon 1; ANGO-P02 = Angónia pedon 2; Chemical properties: OC = organic carbon; OM = organic matter; TN = total nitrogen; C:N = carbon: nitrogen ratio; Mehlich-3 P = Mehlich-3 phosphorus; EC = electrical conductivity, Rating:  = Very Low,
  =Low,
=Low,  =Moderate.
= Very Low, =Low, =Moderate.
Table 6.
Selected extractable micronutrients contents of the studied pedons of Tsangano and Angónia sites, Mozambique.
Table 6.
Selected extractable micronutrients contents of the studied pedons of Tsangano and Angónia sites, Mozambique.
| Pedons | Horizon | Depth (cm) | Micronutrients (mg kg-1) | |||
|---|---|---|---|---|---|---|
| Fe | Zn | Mn | Cu | |||
| TSA-P01 | Ap | 0 - 8 | 6.24 | 0.154 | 3.194 | 1.649 |
| Bt1 | 8 - 45 | 4.28 | 0.103 | 3.108 | 1.965 | |
| Bt2 | 45 - 112 | 3.44 | 0.038 | 2.978 | 1.569 | |
| Bt3 | 112 - 155+ | 3.48 | 0.023 | 2.863 | 1.316 | |
| TSA-P02 | Ap | 0 - 21 | 10.96 | 0.202 | 3.144 | 2.098 |
| BA1 | 21 - 41 | 6.32 | 0.065 | 3.173 | 1.930 | |
| BA2k | 41 - 75/91 | 3.84 | 0.091 | 2.007 | 1.836 | |
| BCgk | 75/91- 155/165 | 4.52 | 0.058 | 2.691 | 1.593 | |
| CRgk | 155/165 - 200 | 1.88 | 0.035 | 1.446 | 1.403 | |
| ANGO-P01 | Ap | 0 - 25/30 | 8.40 | 0.383 | 3.223 | 1.548 |
| Bt1 | 25/30 - 70 | 4.44 | 0.058 | 3.144 | 1.204 | |
| Bt2 | 70 - 120 | 2.88 | 0.023 | 2.763 | 1.148 | |
| Bt3 | 120 - 181 | 3.56 | 0.083 | 3.050 | 1.068 | |
| ANGO-P02 | Ap | 0 -29 | 4.72 | 0.096 | 2.957 | 1.262 |
| BA | 29 - 50 | 3.44 | 0.048 | 2.367 | 1.187 | |
| Bt | 50 - 86/118 | 3.00 | 0.065 | 2.317 | 0.981 | |
| CR | 86/118- 181 | 4.40 | 0.098 | 3.072 | 0.981 | |
TSA-P01 = Tsangano pedon 1; TSA-P02 = Tsangano pedon 2; ANGO-P01 = Angónia pedon 1; ANGO-P02 = Angónia pedon 2. Rating: =Low, =High.
=Low, =High.
Table 7.
Total elemental composition and weathering indices in the studied pedons of Tsangano and Angónia sites, Mozambique.
Table 7.
Total elemental composition and weathering indices in the studied pedons of Tsangano and Angónia sites, Mozambique.
| Profile | Horizon | Depth (cm) | Total elemental composition % | Weathering Indices | |||||||||||
|---|---|---|---|---|---|---|---|---|---|---|---|---|---|---|---|
|
L.O.I. |
SiO2 | Al2O3 | Fe2O3 | MgO | P2O5 | CaO | TiO2 | SO3 | K2O | Total | SiO2/Al2O3 | SiO2/(Al2O3+Fe2O3) | |||
| TSA-P01 | Ap | 0 - 8 | 9.39 | 54.60 | 24.13 | 8.44 | 0.37 | 0.68 | 0.43 | 0.66 | 0.37 | 0.33 | 99.4 | 2.26 | 1.68 |
| Bt2 | 45 - 112 | 10.16 | 45.96 | 27.55 | 10.49 | 1.68 | 1.06 | 0.32 | 0.84 | 0.50 | 0.37 | 98.93 | 1.67 | 1.21 | |
| Bt3 | 112 - 155+ | 10.15 | 46.67 | 26.36 | 10.59 | 2.78 | 1.31 | 0.25 | 0.85 | 0.44 | 0.35 | 99.75 | 1.77 | 1.26 | |
| TSA-P02 | Ap | 0 - 21 | 15.84 | 40.78 | 29.67 | 5.41 | 2.56 | 1.73 | 1.37 | 0.75 | 1.09 | 0.52 | 99.72 | 1.37 | 1.16 |
| BA2k | 41 - 75/91 | 14.31 | 40.53 | 31.2 | 6.49 | 1.63 | 1.11 | 1.02 | 0.86 | 1.28 | 0.7 | 99.13 | 1.30 | 1.08 | |
| CRgk | 155/165 - 200 | 3.17 | 69.12 | 16.26 | 1.15 | 1.23 | 0.98 | 5.86 | 0.09 | 0.77 | 0.09 | 98.72 | 4.25 | 3.97 | |
| ANGO-P01 | Ap | 0 - 25/30 | 9.69 | 46.12 | 25.44 | 10.69 | 0.87 | 3.76 | 0.49 | 1.21 | 0.56 | 0.94 | 99.77 | 1.81 | 1.28 |
| Bt2 | 70 - 120 | 14.63 | 39.40 | 27.98 | 13.76 | 0.65 | 0.57 | 0.27 | 1.08 | 0.30 | 0.44 | 99.08 | 1.41 | 0.94 | |
| Bt3 | 120 - 181 | 14.28 | 41.11 | 26.5 | 13.95 | 1.31 | 0.54 | 0.27 | 1.13 | 0.35 | 0.43 | 99.87 | 1.55 | 1.02 | |
| ANGO-P02 | Ap | 0 - 29 | 14.95 | 38.50 | 26.68 | 12.48 | 1.38 | 2.97 | 0.42 | 1.04 | 0.7 | 0.5 | 99.62 | 1.44 | 0.98 |
| Bt | 50 - 186/118 | 14.21 | 40.70 | 25.64 | 12.95 | 1.03 | 2.77 | 0.31 | 0.92 | 0.52 | 0.43 | 99.48 | 1.59 | 1.05 | |
| CR | 86/118 - 181 | 7.62 | 55.16 | 21.96 | 10.23 | 0.66 | 0.66 | 0.68 | 0.59 | 0.65 | 1.13 | 99.34 | 2.51 | 1.71 | |
Tsangano pedon 1 = TSA-P01; Tsangano pedon 2 = TSA-P02; Angónia pedon 1= ANGO-P01; Angónia pedon 2 = ANGO-P02; L.O.I. = Loss on Ignition.
Table 8.
Abundances of Barium (Ba), Zirconium (Zr), Strontium (Sr) and Lead (Pb) in the studied pedons of Tsangano and Angonia Sites, Mozambique.
Table 8.
Abundances of Barium (Ba), Zirconium (Zr), Strontium (Sr) and Lead (Pb) in the studied pedons of Tsangano and Angonia Sites, Mozambique.
| Profile | Horizon | Depth | Ba | Zr | Sr | Pb |
| mg dm-3 | ||||||
| TSA-P01 | Ap | 0 - 8 | 209 | 206 | 91 | 129 |
| Bt2 | 45 - 112 | 237 | 141 | 67 | 443 | |
| Bt3 | 112 - 155+ | 190 | 151 | 56 | 39 | |
| TSA-P02 | Ap | 0 - 21 | 380 | 258 | 247 | 62 |
| BA2k | 41 - 75/91 | 579 | 358 | 295 | 51 | |
| CRgk | 155/165 - 200 | 189 | 5 | 342 | 41 | |
| ANGO-P01 | Ap | 0 - 25/30 | 1075 | 783 | 389 | 85 |
| Bt2 | 70 - 120 | 600 | 295 | 164 | 66 | |
| Bt3 | 120 - 181 | 535 | 370 | 158 | 22 | |
| ANGO-P02 | Ap | 0 - 29 | 761 | 1056 | 328 | 32 |
| Bt | 50 - 186/118 | 677 | 650 | 284 | 33 | |
| CR | 86/118 - 181 | 1011 | 448 | 573 | 50 | |
TSA-P1 = Tsangano pedon 1; TSA-P2 = Tsangano pedon 2; ANGO-P1 = Angónia pedon 1; ANGO-P02 = Angónia profilepedon 2; Ba = Barium; Zr = Zirconium; Sr = Strontium; Pb = Lead.
Table 9.
Summary of morphological and diagnostic features of the studied pedons in Tsangano and Angónia Districts, in Mozambique and classification according to USDA Soil Taxonomy [20].
Table 9.
Summary of morphological and diagnostic features of the studied pedons in Tsangano and Angónia Districts, in Mozambique and classification according to USDA Soil Taxonomy [20].
| Pedon | Diagnostic horizons | Other diagnostic features | Order | Suborder | Great group | Sub-group | Family |
| TSA-P01 | Ochric epipedon; argillic subsurface horizon | Moderately steep, very deep, highly weathered clayey subsoil, Ustic SMR, medium acid to slightly acid, thermic STR, mixed to dominantly kaolinitic, many clay+sesquioxide cutans | Ultisols | Ustults | Haplustults | Typic Haplustults | Moderately steep, very deep, clayey, medium acid to slightly acid, mixed to dominantly kaolinitic, thermic, Typic Haplustults |
| TSA-P02 | Ochric epipedon. Calcic horizon in the subsoil (strongly effervescent) |
Almost flat to gently sloping mbuga (slope about 3%), very deep, black clayey soil (heavy clay), ustic SMR, mildly alkaline, thermic STR, presence of deep wide cracks, wedge-shaped and extremely hard prismatic aggregates, many distinct slickensides, presence of gilgai micro-relief | Vertisols | Usterts | Calciusterts | Typic Calciusterts |
Almost flat to gently sloping, very deep, clayey, mildly alkaline, mixed to dominantly montimorrilonitic; thermic, Typic Calciusterts |
| ANGO-P01 | Mollic epipedon; argillic subsurface horizon | Moderately steep, very deep, highly weathered clayey subsoil, Ustic SMR, slightly acid, thermic STR, mixed to dominantly kaolinitic, many clay+sesquioxide cutans | Ultisols | Ustults | Paleustults | Typic Paleustults | Moderately steep, very deep, clayey, slightly acid, mixed to dominantly kaolinitic, thermic, Typic Paleustults |
| ANGO-P02 | Umbric epipedon; argillic subsurface | Strongly sloping, very deep, highly weathered clayey subsoil, Ustic SMR, medium acid, thermic STR, mixed to dominantly kaolinitic, many clay+sesquioxide cutans | Alfisols | Ustalfs | Haplustalfs | Ultic Haplustalfs | Strongly sloping, very deep, clayey, medium acid, mixed to dominantly kaolinitic, thermic, Ultic Haplustalfs |
TSA-P01 = Tsangano pedon 1; TSA-P02 = Tsangano pedon 2; ANGO-P01 = Angónia pedon 1; ANGO-P02 = Angónia pedon 2.
Table 10.
Diagnostics horizons and classification of the studied pedons in Tsangano and Angónia Districts, Mozambique, according to WRB for soil Resources [21].
Table 10.
Diagnostics horizons and classification of the studied pedons in Tsangano and Angónia Districts, Mozambique, according to WRB for soil Resources [21].
| Pedon | Diagnostic horizons, properties and materials | Reference soil group (RSG) - TIER-1 | Principal Qualifiers | Supplementary Qualifiers | WRB soil name - TIER- 2 |
| TSA-P01 | Ochric horizon; argic horizon with CEC of ≥ 24 cmol(+) kg-1 and low BS of < 50%) | Acrisols | Haplic | Clayic, Cutanic, Hyperdystric, Humic, Profondic | Haplic Acrisols (Clayic, Cutanic, Hyperdystric, Humic, Profondic) |
| TSA-P02 | Vertic horizon, ≥ 30% clay between the soil surface and the vertic horizon, shrink-swell cracks, gilgai microrelief |
Vertisols | Calcic, Pellic | Calcaric, Hypereutric, Gilgaic, Mazic, Humic | Pellic Calcic Vertisols(Calcaric, Hypereutric, Gilgaic, Mazic, Humic) |
| ANGO-P01 | Mollic horizon; argic horizon with CEC of greater part of argic ≥ 24 cmol(+) kg-1 and low BS < 50%) | Alisols | Abruptic, Chromic | Clayic, Cutanic, Hyperdystric, Humic, Profondic | Chromic Abruptic Alisols(Clayic, Cutanic, Hyperdystric, Humic, Profondic) |
| ANGO-P02 | Mollic horizon; argic horizon with CEC of argic ≥ 24 cmol(+) kg-1 and high BS ≥ 50%) | Luvisols | Chromic | Clayic, Cutanic, Humic, Profondic | Chromic Luvisols (Clayic, Cutanic, Humic, Profondic) |
TSA-P1 = Tsangano pedon 1; TSA-P2 = Tsangano pedon 2; ANGO-P1 = Angónia pedon 1; ANGO-P02 = Angónia pedon 2.
Table 11.
Suitability assessment based on ecological requirement of Irish potato and actual field conditions of the studied pedons in Tsangano and Angónia Districts, Mozambique.
Table 11.
Suitability assessment based on ecological requirement of Irish potato and actual field conditions of the studied pedons in Tsangano and Angónia Districts, Mozambique.
| Land quality | Diagnostic factor | Required range | Actual field range | Rating | ||||||
|---|---|---|---|---|---|---|---|---|---|---|
| TSA-P01 | TSA-P02 | ANGO-P01 | ANGO-P02 | TSA-P01 | TSA-P02 | ANGO-P01 | ANGO-P02 | |||
| Climate (c) | Annual rainfall | 700 - 2600 | 1000 - 1200 | 1000 -1200 | 800 - 1200 | 800 - 1200 | S1 | S1 | S1 | S1 |
| Temperature | 8 - 18 | 15 - 20 | 15 - 20 | 15 -22 | 15 - 22 | S3 | S3 | S3 | S3 | |
| Topography (t) | Slope (%) | 0 -12 | 16 | 5 | 16 | 12 | S1 | S2 | S1 | S1 |
| Elevation | 1500 - 3200 | 1427 | 1340 | 1260 | 1200 | S2 | S2 | S3 | S3 | |
| Soil physical property (s) | Soil texture | L, SL, SiL | C, SC, SCL | C, SC | C, SC | C, SL | S2 | S3 | S3 | S2 |
| Effective depth | > 40 cm | > 181 cm | > 181 cm | > 151 cm | > 200 cm | S1 | S1 | S1 | S1 | |
| Soil drainage | Well drained | Well drained | Well drained | Well to excessively well drained | Well to moderately well drained | S1 | S1 | S1 | S1 | |
| Soil toxicity (n) | EC (dSm-1) | < 4.0 | 0.02 - 0.06 | 0.09 - 0.28 | 0.01 - 0.04 | 0.02 - 0.05 | S1 | S1 | S1 | S1 |
| ESP | < 6 | 0.37 - 0.55 | 0.65 - 1.30 | 0.47 - 0.59 | 0.38 - 0.48 | S1 | S1 | S1 | S1 | |
| Soil fertility (f) | Soil pH water | 5.5 – 7 | 5.5 - 6.4 | 6.7 - 7.9 | 6.1 - 6.4 | 5.9 - 6.1 | S1 | S1 | S1 | S1 |
| (CEC cmol(+) kg-1) |
> 25 | 10.15 - 10.85 | 10.06 - 10.81 | 10.1 - 10.72 | 10.1 - 10.8 | S3 | S3 | S3 | S3 | |
| OC (%) | > 1.8 | 0.53 - 1.35 | 0.16 - 2.73 | 0.53 - 1.44 | 0.62 - 1.54 | S3 | S1 | S3 | S3 | |
| TN (%) | > 0.3 | 0.06 - 0.12 | 0 04 - 0.22 | 0 06 - 0.13 | 0 03- 0.3 | S3 | S2 | S3 | S3 | |
| Avail. P mg dm-3 | > 35 | 13.3 - 20.9 | 13.1 - 28.5 | 14.0 - 17.56 | 14.31 - 14.86 | S3 | S3 | S3 | S3 | |
| K (CEC cmol(+) kg-1) |
> 0.89 | 0.12 - 0.4 | 0.13 - 1.19 | 0.22 - 0.53 | 0.08 - 0.12 | S3 | S1 | S2 | S3 | |
| Ca (CEC cmol(+) kg-1) |
> 10 | 0.65 - 1.19 | 1.5 - 13.18 | 1.51 - 2.2 | 2.37 - 4.01 | S3 | S1 | S3 | S3 | |
| Mg (CEC cmol(+) kg-1) | > 3 | 0.98 - 1.66 | 0.64 - 3.08 | 1.91 - 2.66 | 0.2 - 3.08 | S3 | S1 | S2 | S1 | |
| BS (%) | > 61 | 19.3 - 30.0 | 23.2 - 153,7 | 34.6 - 51.8 | 30.7 - 66.9 | S3 | S1 | S2 | S1 | |
| Cu (mg kg-1) | > 0.2 | 1.31 - 1.96 | 1.40 - 2.09 | 1.06 - 1.54 | 0.98 - 1.26 | S1 | S1 | S1 | S1 | |
| Mn (mg kg-1) | > 1.1 | 2.86 - 3.19 | 1.44 - 3.14 | 2.76 - 3.22 | 2.31 - 3.07 | S1 | S1 | S1 | S1 | |
| Fe (mg kg-1) | > 2.5 | 3.44 - 6.24 | 1.88 - 10.96 | 2.88 - 8.40 | 3.00 - 4.72 | S1 | S1 | S1 | S1 | |
| Zn (mg kg-1) | > 0.6 | 0.02 - 0.15 | 0.03 - 0.20 | 0.05 - 0.38 | 0.04 - 0.09 | S3 | S3 | S3 | S3 | |
| Overall suitability class (OSC) | S3f(c) | S3f(cs) | S3f(cts) | S3f(ct) | ||||||
Adapted from [33,46,47,48,49,72]. TSA-P1 = Tsangano pedon 1; TSA-P2 = Tsangano pedon 2; ANGO-P1 = Angónia pedon 1; ANGO-P02 = Angónia pedon 2; Zn = zinc; Fe = iron; Mn = manganese; Cu = copper; Ca = calcium; Mg = magnesium; K = potassium; OC = organic carbon; TN = total nitrogen; P = Phosphorus, EC = electrical conductivity. Suitability classes: S1 = Highly suitable; S2 = Moderately suitable; S3 = Marginally suitable.
Disclaimer/Publisher’s Note: The statements, opinions and data contained in all publications are solely those of the individual author(s) and contributor(s) and not of MDPI and/or the editor(s). MDPI and/or the editor(s) disclaim responsibility for any injury to people or property resulting from any ideas, methods, instructions or products referred to in the content. |
© 2025 by the authors. Licensee MDPI, Basel, Switzerland. This article is an open access article distributed under the terms and conditions of the Creative Commons Attribution (CC BY) license (http://creativecommons.org/licenses/by/4.0/).
Copyright: This open access article is published under a Creative Commons CC BY 4.0 license, which permit the free download, distribution, and reuse, provided that the author and preprint are cited in any reuse.


