
Submitted:
19 October 2024
Posted:
21 October 2024
You are already at the latest version
Abstract
Soil acidity is a major limiting factor for potato production in Peru's high Andean region. Predicting the spatial variability of acidity is essential for recommending site-specific liming treatments. A total of 90 soil samples, taken from a depth of 0-30 cm, were collected from five locations in the province of Pachitea, Huánuco. Descriptive statistics, principal component analysis (PCA), and Pearson correlation analysis were used to identify the soil properties contributing most to total variance and those most strongly correlated with soil acidity. The ordinary geostatistical kriging method evaluated the predictive accuracy for 23 soil properties and liming requirements over a 28,463-ha area. Results showed that the Plaza Punta and Buenos Aires locations had more de-graded acidic soils, with frequencies between 55% and 100% above the general mean (30.94 ± 24.87%) and the critical threshold (25%) for potato cultivation. Variables such as exchangeable calcium percentage (ECP), Ca²⁺, Mg²⁺, sand content, and organic matter strongly correlated with soil acidity, while exchangeable H⁺ and ECP were the main contributors to the total variance. Ge-ostatistical analysis revealed that Mg²⁺ and Ca²⁺ had the highest R² values (0.87 and 0.76, respec-tively), indicating a strong fit between observed and predicted values in the spatial analysis of soil acidity. The spatial analysis predicted a liming requirement for a 28,463-ha area, ranging from 2 to 14 t∙ha⁻¹ of dolomite.
Keywords:
Fertilidad del suelo
; acidez del suelo
; interpolación geoestadística
; análisis espacial
1. Introduction
Potato has historically played a vital role in global food security, with an annual worldwide production of approximately 3,740.7 million tonnes, making it the sixth most important crop after sugarcane, maize, wheat, rice, and oil palm [1]. Peru is the leading potato producer in the Andean region, with a total output exceeding 6 million tonnes [1]. This crop supports the livelihoods of over 700,000 families, most of whom are engaged in small-scale farming, contributing 10.1% to the country’s gross value of agricultural production (GVP) [2]. The Huánuco region stands out regarding cultivated area and production [2] and is one of the key centers of potato diversity [3,4]. However, Huánuco is among Peru’s poorest regions, with some of the highest extreme poverty levels [2]. It ranks as one of the most food-insecure areas, with a vulnerability index of 0.54, where values closer to 1 signify greater vulnerability [5]. This issue is further compounded by soil conditions, such as acidity, which significantly limit crop production in the region.
Soil acidity is one of the major constraints to crop production globally [6]. In South America, acidic soils account for 52% of the total agricultural area [7]. In Peru, pH values in the central Andes range between 4.2 and 4.6, classifying these soils as strongly acidic [8]. Acidic soils are typically characterized by severe deficiencies in essential nutrients like phosphorus, calcium, magnesium, and molybdenum while exhibiting toxic levels of aluminum, iron, and manganese [9]. These degraded, low-fertility soils exacerbate the vulnerability of native potato agroecosystems in the high Andean regions of Peru.
Several studies highlight that the integrated use of inorganic and organic fertilizers and liming amendments significantly enhances the physicochemical properties of acidic soils [10]. Specifically, liming raises soil pH to optimal levels, increases the availability of exchangeable calcium (Ca²⁺) and magnesium (Mg²⁺), and reduces phosphorus immobilization [11]. This practice also improves the soil’s physical and biological quality, increasing crop productivity [12].
However, soil properties and nutrient concentrations often fluctuate across crop fields due to the varying effects of soil-forming factors [13]. As a result, fertilizer applications can create areas of nutrient excess or deficiency [14]. In regions with excessive fertilizer levels, leaching can lead to water contamination, while insufficient fertilizer dosages can limit crop yields [15]. To address this, soil fertility maps, created using geostatistical methods, allow for precise scheduling of variable fertilizer and lime applications by predicting the spatial variation in soil properties [16].
The present study aims to predict the spatial variation of lime requirements for potato cultivation across five locations in the Pachitea province, Huánuco, Peru. The geostatistical interpolation method, Ordinary Kriging (OK), was employed to accurately assess the spatial variability of soil properties and generate characterization maps. Additionally, the study seeks to identify the physicochemical characteristics most strongly associated with soil acidity. Pearson correlation analysis and principal component analysis (PCA) were conducted on 23 soil physicochemical properties to achieve this.
2. Materials and Methods
2.1. Study Area
The study area is situated in the Peruvian highlands, specifically in the villages of Huarichaca, Chagragoto, Rumichaca, Plaza Punta, and Buenos Aires, located in the districts of Umari, Chaglla, Molino, and Panao, within the province of Pachitea, Huánuco region (Figure 1). The area experiences an average annual precipitation of 865.31 mm and a mean annual relative humidity of 78.46%. Minimum temperatures range from 9.36 °C in June to 5.4 °C in August, while maximum temperatures vary between 25.02 °C in September and 24.44 °C in November. These historical averages were calculated using data from the Chaglla meteorological station (9°50′49.9”S; 75°54′54.0”W; 2800 m.a.s.l.) managed by the National Service of Meteorology and Hydrology of Peru (SENAMHI) as shown in Figure 2.
2.2. Soil Sampling and Analysis
The R software [17] was used to determine the sampling points through the sample function from the sp package [18]. The R script generated the sampling coordinates by integrating a raster layer with high-resolution satellite imagery (e.g., Sentinel-2) as the base map, and stratified sampling was selected as the method. Ninety soil samples were collected at a depth of 30 cm from fields managed by native potato growers.
The soil samples were analyzed at INIA’s Soil, Water, and Foliar Laboratories network. The variables assessed were part of a comprehensive soil characterization using established reference methodologies. Soil texture (sand, silt, and clay percentages) was determined using the Bouyoucos hydrometer method [19]. pH was measured following EPA guidelines [20], while electrical conductivity (EC) was determined using the saturation extract method [21]. Organic matter content (OM) was analyzed using NOM-021-RECNAT-2000 [19] and total nitrogen (N) using ISO standards [22]. Available phosphorus for both neutral and acidic soils was measured using the Bray and Kurtz method [19], and available potassium (K), according to Bazán Tapia [23]. Exchangeable cations (H+, Al+3, Ca+2, Mg+2, K+, and Na+) were also quantified [19]. Bulk density (BD) values were obtained from the global digital soil mapping system, SoilGrids [24], with a spatial resolution of 250 meters, focusing on the 15-30 cm depth. The data were retrieved in TIFF format and processed using QGIS to extract the relevant values.
2.3. Estimation of the Liming Requirement for Soils
CEC (mEq∙100 g⁻¹) refers to the effective cation exchange capacity, determined by summing the exchangeable bases in acid soils. TSW (t∙ha⁻¹) indicates the topsoil weight at a depth of 30 cm that is suitable for potato cultivation. EAP (%) represents the exchangeable acidity percentage, calculated as the ratio of the soil’s exchangeable acidity to the effective CEC. LR (kg∙ha⁻¹) denotes the agricultural lime requirement, determined based on the mEq∙100 g⁻¹ of calcium necessary to neutralize the EAP up to the permissible acidity saturation (PAS) for potato crops. A threshold of 25% PAS is considered optimal for potato cultivation, and agricultural lime with a calcium oxide (CaO) content of 55% is used. For the agricultural dolomite requirement (DR), a CaO content of 30% is considered. Application of DR is recommended for plots where the percentage of exchangeable magnesium in the soil is less than 10%.
2.4. Geostatistical Interpolation
Understanding spatial variability through the appropriate geostatistical semivariogram model is essential for mapping and delineating the spatial variability of soil fertility, thereby optimizing fertilization programs [26]. Utilizing georeferencing, the soil analysis results from the province of Pachitea—on bulk density, percentages of sand, silt, and clay, pH, electrical conductivity (EC), organic matter (OM), available phosphorus (P) and potassium (K), effective cation exchange capacity (CEC), concentrations of exchangeable cations (H⁺, Al³⁺, Ca²⁺, Mg²⁺, K⁺, and Na⁺), and liming requirements—were employed for geostatistical analysis. Interpolations were performed using the Ordinary Kriging (OK) method, with the SAGA [27] and QGIS [28] software utilized throughout the process.
2.5. Model Validation
The nugget (C0), sill (C0 + C), range (R), and sill-nugget ratio (PSV) (6) are key parameters in semivariogram analysis that describe the spatial autocorrelation of the data. These parameters are derived from fitting the semivariogram model for geostatistical interpolation [29].
The semivariogram model is selected based on criteria such as the root mean square error (RMSE) and the coefficient of determination (R²) [29]. Ideally, the chosen model should exhibit RMSE values close to zero (7) and R² values close to one, as these indicate the accuracy and quality of the model, respectively [30]. The kriging interpolations for each soil property were cross-validated using the leave-one-out method [31].
Where n represents the number of samples, ) and represent the predicted and observed values at site i, respectively.
3. Results
3.1. Descriptive Statistics for Soil Acidity
Table 1 presents the results of the soil samples’ physical-chemical analysis. The pH values ranged from 3.9 to 5.8, with a mean of 4.69 ± 0.39. The exchangeable acidity percentage (H+ + Al+3) varied between 0% and 72.75%, yielding a mean of 30.94 ± 24.87%. The variance for pH was 0.16, while the exchangeable acidity percentage (EAP) exhibited a variance of 618.73, indicating a high dispersion of potential acidity data within narrow pH ranges. All locations displayed mean pH values below the critical threshold (5.5) necessary for optimal potato crop growth. Plaza Punta and Buenos Aires were identified as the most degraded sites, characterized by pH values below the overall mean (Figure 4).
Regarding the potential acidity of the soils, the localities of Buenos Aires, Plaza Punta, Chagragoto, and Rumichaca exhibit EAP that exceeds the overall mean of 30.94 ± 24.87% (Figure 5). However, only the localities of Buenos Aires and Plaza Punta have averages that surpass both the general mean and the critical threshold (25%) for potato cultivation. Among these, the acid soils in Plaza Punta were the most degraded, showing a frequency of 100% of the data above the critical value. In contrast, the acid soils of Huarichaca were the least degraded, with 85% of the data falling below the critical threshold (Figure 5).
3.2. Principal Component Analysis of Soil Properties
Principal component analysis (PCA) was conducted on 23 soil physicochemical characteristics. As shown in Figure 5, the first two components account for 59% of the variance across the five studied locations. The biplot indicates that the variables contributing the most to the variance explained by Component I are exchangeable H+, exchangeable acidity percentage (EAP), and exchangeable calcium percentage (ECP). The soils in Plaza Punta and Buenos Aires show a stronger association with exchangeable acidity (H+ + Al+3), sand percentage, and organic matter (OM), which reflect a greater need for liming. Plaza Punta soils, in particular, exhibit high EAP and an inverse relationship with the exchangeable magnesium percentage (EMP) and cation exchange capacity (CEC), indicating a higher requirement for dolomite. Conversely, the variance related to acidity is not associated with the soils from Chagragoto and Huarichaca, which have higher pH, ECP, and bulk density (BD) values, indicating no liming requirement. However, the Rumichaca soil variance has no clear relationship with the studied physico-chemical variables.
3.3. Pearson’s Correlation Analysis of Soil Properties and Their Relationship with Soil Acidity
Pearson correlation analysis was conducted for the 23 evaluated variables (Figure 6). The most strongly correlated variable with soil pH is the exchangeable calcium percentage (ECP), with a positive correlation of 0.77 (Figure 7d). Additionally, there is a significant negative correlation between ECP and both the exchangeable acidity percentage (EAP) (Figure 7a) and exchangeable H+ (Figure 7b), with correlation values of -0.96 and -0.84, respectively. The exchangeable magnesium percentage (EMP) also shows a strong negative correlation with EAP, reaching a value of -0.74 (Figure 7c). Increasing ECP and EMP can reduce exchangeable H+ concentrations and raise soil pH. Furthermore, a noteworthy positive correlation exists between soil acidity with the sand percentage and organic matter (OM), with values of 0.63 and 0.71, respectively. Several variables also exhibit a high positive correlation with pH, including exchangeable Mg+2, Ca+2, K+, clay content, available K, and bulk density (BD), with respective values of 0.52, 0.65, 0.66, 0.59, 0.66, and 0.50. These relationships are critical, as soils with higher sand content and high OM levels require larger lime doses. In contrast, treatments that integrate different exchangeable bases and improve soil bulk density will enhance the effectiveness of liming on acidic Andean soils.
3.4. Spatial Variation of Soil Acidity in the Localities of Plaza Punta and Buenos Aires
Table 2 presents the parameters of the semivariogram models obtained using the Ordinary Kriging (OK) interpolation method and the cross-validation results based on RMSE and R² values for model evaluation. The Linear and Exponential semivariogram models provided the best parameterization for predicting unknown values of the soil parameters under study. In the locations of Plaza Punta and Buenos Aires, the soil physicochemical variables with the highest spatial predictability were Al+3 (mEq∙100 g⁻¹), Ca+2 (mEq∙100 g⁻¹), Mg+2 (mEq∙100 g⁻¹), exchangeable calcium percentage (ECP), and exchangeable acidity percentage (EAP), with R² values of 0.60, 0.76, 0.87, 0.57, and 0.53, respectively. These R² values indicate a strong correlation between observed and predicted values in unsampled areas. Notably, Ca+2 (mEq∙100 g⁻¹) and Mg+2 (mEq∙100 g⁻¹) emerged as significant variables for explaining the variance in the soils’ physicochemical properties in the PCA. Both variables show high negative correlations with EAP, at -0.71 and -0.66, respectively. Furthermore, they exhibit significant R² values in the prediction of spatial variability. Based on these findings, spatial variation maps were produced for EAP (Figure 8), Ca+2 (Figure 9), and Mg+2 (Figure 10), as these characteristics play a crucial role in explaining soil acidity and liming requirements.
3.5. Spatial Variation of Soil Acidity in the Localities of Huarichaca, Chagragoto and Rumichaca
Table 3 presents the parameters of the semivariogram models derived using the Ordinary Kriging (OK) interpolation method alongside the cross-validation results based on RMSE and R² values for evaluation. The semivariogram models with Linear and Gaussian parameterization proved to be the most suitable for predicting unknown values of the studied soil parameters. In the localities of Chagragoto, Huarichaca, and Rumichaca, the soil physicochemical variables with the highest spatial predictability were bulk density (g∙cm⁻³), exchangeable magnesium percentage (EMP), and exchangeable potassium percentage (EPP), with R² values of 0.79, 0.54, and 0.54, respectively. These values indicate a strong alignment between observed and predicted data in non-sampled areas, reflecting a high model fit. Notably, EMP (%) and EPP (%) emerged as significant variables in explaining the variance of the soil’s physicochemical characteristics in the principal component analysis (PCA). They showed strong negative correlations of -0.74 and -0.18 with exchangeable acidity percentage (EAP). Additionally, these variables exhibited substantial R² values for predicting spatial variability. Consequently, spatial distribution maps were generated for bulk density (Figure 11), magnesium (Figure 12), and potassium (Figure 13), which are crucial for understanding soil acidity and liming requirements (Figure 14) for these locations.
3.6. Liming Requirement
Figure 13 illustrates the spatial variation in liming requirements for the localities of Plaza Punta and Buenos Aires, where calcium (Ca²⁺) and magnesium (Mg²⁺) levels exhibited a significant correlation with observed and predicted values (R² values of 0.76 and 0.87, respectively) (Figure 14a). Both variables also showed strong positive correlations with soil pH, with correlation coefficients (R) of 0.64 and 0.51, respectively. Furthermore, linear regression analysis indicates that the observed values of Ca²⁺ closely align with the predicted liming requirements (Figure 14b).
The spatial variation map of soil acidity identifies five zones with differing requirements for lime and dolomite (Figure 15). Specifically, 34.07% of the areas necessitate liming with dolomite, while 18.68% require agricultural lime. In Plaza Punta, the liming requirement averages 5.1 ± 2.8 t·ha⁻¹, predominantly in regions with a higher demand for agricultural dolomite (Figure 15). In contrast, Buenos Aires has an average liming requirement of 3.4 ± 5.5 t·ha⁻¹, primarily in areas with moderate needs for agricultural lime. Rumichaca shows a liming requirement of 2.5 ± 4.4 t·ha⁻¹, more commonly found in regions with elevated agricultural lime needs (Figure 15). Chagragoto exhibits an average requirement of 1.6 ± 2.8 t·ha⁻¹, typically in areas with higher demands for agricultural dolomite. Finally, the locality of Huarichaca has liming values of 0.1 ± 0.3 t·ha⁻¹, which are more prevalent in areas with low requirements for agricultural lime.
4. Discussion
4.1. Soil Acidity in Potato Cultivation and Its Relationship with the Soil Physicochemical Properties
Potatoes are a crop with high nutritional demands, particularly for macronutrients. It requires 1.7 kg of nitrogen (N), 0.7 kg of phosphorus (P), and 3.15 kg of potassium (K) per ton of production [32]. However, when grown in acidic soils with pH levels below 5.5, potatoes experience severe nutrient deficiencies at the leaf level [33]. Furthermore, high exchangeable aluminum (Al³⁺) concentrations in acidic soils have been reported to be toxic to potato growth [34,35]. Elevated levels of potential soil acidity (Al³⁺ + H⁺), ranging from 20% to 25%, hinder root cell division and respiration, increase cell wall rigidness, and interfere with calcium and magnesium uptake and transport [36,37]. In this study, the soils from the five potato-producing localities exhibited average pH values of 4.69 ± 0.39 and an exchangeable acidity percentage of 30.94 ± 24.87%, creating limiting conditions for crop growth and development.
To address this issue, it is essential to prioritize liming in fertilization plans for potato crops to raise soil pH [38]. In this study, neutralizing the potential acidity method to a critical threshold of 25% for potato cultivation estimated an average liming requirement of 2.78 ± 3.77 t∙ha⁻¹. Furthermore, principal component analysis revealed that variables related to soil acidity, such as EAP and ECP, accounted for the most variance among the 23 physicochemical characteristics evaluated. These findings highlight significant spatial variability in the severity of acid soil degradation across Pachitea province.
The localities of Plaza Punta and Buenos Aires exhibit the lowest pH values (4.41 ± 0.2 and 4.48 ± 0.18, respectively), which can be attributed to high rainfall intensity, with mean annual precipitation of 1035.33 mm and 1159.37 mm, respectively. Elevated rainfall enhances the chemical weathering of soil clay minerals and introduces significant amounts of acid pollutants, such as SO₂ and nitrogenous compounds (NO, NO₂, and N₂O) [39]. However, the soils in Plaza Punta have lower cation exchange capacity (CEC) than those in Buenos Aires (4.8 ± 1.17 and 7.99 ± 1.98 mEq∙100 g⁻¹, respectively). This difference in CEC explains the variation in the severity of soil potential acidity between both localities. Plaza Punta has the highest exchangeable acidity percentage (EAP) (56.91 ± 13.49%) among the five localities and the highest liming requirement (5.1 ± 2.8 t ha⁻¹).
Differences in the severity of soil acidity and its negative impact on fertility potential between localities are likely due to mineralogical variations [40]. Soils rich in gibbsite (aluminum hydroxides) tend to have low CEC values, ranging from 1 to 4 mEq∙100 g⁻¹, while soils rich in kaolinite (1:1 phyllosilicates) typically have higher CEC values, between 4 and 15 mEq∙100 g⁻¹ [41]. This suggests that Plaza Punta soils may be high in gibbsite, whereas Huarichaca, Buenos Aires, and Chagragoto soils, with CEC values of 9.6, 8, and 6.2 mEq∙100 g⁻¹, respectively, are more kaolinite-rich. Gibbsite is a secondary mineral formed in soils experiencing intense 2:1 and 1:1 chemical weathering of aluminosilicates [42], which likely explains these mineralogical differences.
The results obtained in the Pearson correlation analysis suggest that the source of soil acidity is strongly linked to both clay and organic matter content. The clay percentage shows a strong negative correlation with exchangeable acidity percentage (EAP) (-0.71), while organic matter content is highly positively correlated with exchangeable soil acidity (0.71). This indicates that the dominant pedogenic processes responsible for soil acidity in these areas are clay illuviation and organic matter accumulation. One hypothesis posits that acidic kaolinitic ultisols, where these processes predominate, contain kaolinite minerals interbedded with minerals formed from hydroxylated vermiculite weathering [43]. Intercalation with hydroxylated minerals in such acidic soils significantly reduces their CEC, sometimes leading to misclassification of their mineralogy as kaolinitic [44]. This characteristic suggests that there may be greater potential to increase the CEC of these soils, as observed in the Chagragoto locality, where maximum CEC values exceeding 20 mEq∙100 g⁻¹ were found. This points to higher potential fertility in these soils due to the effect of the pH increase.
The positive effect of liming on potato crops is likely attributed to the soil’s increased CEC, resulting from a higher density of pH-dependent variable charges [39], which effectively enhances the soil’s nutrient storage capacity. Studies have confirmed that it is possible to increase potato yields on strongly acidic ultisols by raising the soil pH with dolomitic lime or by applying calcium and magnesium phosphate fertilizers without altering the pH [45]. This highlights the critical role of calcium and magnesium fertilization in managing acidic soils. In our study, Ca²⁺ (mEq∙100 g⁻¹) and Mg²⁺ (mEq∙100 g⁻¹) were the key variables in reducing soil acidity, showing a strong negative correlation with exchangeable soil acidity (-0.71 and -0.66, respectively) concerning the exchangeable acidity percentage (EAP). These findings suggest that the mass effect on the cation exchange of H⁺ and Al³⁺ ions for Ca²⁺ and Mg²⁺ is the most critical factor in acidic soil management [39].
In this context, recommended liming doses ranging from 2 to 14 t∙ha⁻¹ are expected to enhance the soil’s potential fertility. It is also likely that treatments aimed at increasing pH-dependent charges will improve the physicochemical properties of acidic high Andean soils. Several studies support the importance of these agricultural practices. Bordoloi et al. [46] highlight that applying 0.4 t∙ha⁻¹ of agrarian lime, supplemented with 1 t∙ha⁻¹ of vermicompost, increased soil pH from 4.54 to 5.12, reducing fertilizer usage by 50% and boosting potato yields by 36-54%.
4.2. Spatial Variability of Soil Acidity and Liming Requirement
Geostatistical analysis using semivariogram models and the Ordinary Kriging (OK) method enables precise identification of soil variables with the highest spatial predictability related to soil acidity [16]. Key indicators like the coefficient of determination (R²) and root mean square error (RMSE) are critical in evaluating the fit of these models between observed and predicted values in unsampled areas [47]. Models with R² values approaching 1 and low RMSE indicate a superior fit, making them effective tools for soil management in acidic soil regions and facilitating the optimization of practices such as liming and fertilization [48].
Several key variables have been identified in predicting soil acidity, with Ca²⁺ and Mg²⁺ being the most influential in determining the spatial variability of soil fertility, particularly in the localities of Buenos Aires and Plaza Punta. These exchangeable cations are strongly correlated with soil acidity, allowing for the generation of precise maps for agricultural management using geostatistical methods like Ordinary Kriging [49]. R² values ranging from 0.70 to 0.85, along with low RMSE in predictions for Ca²⁺ and Mg²⁺, are adequate for accurately forecasting soil fertility and acidity levels. Additionally, variables like bulk density and exchangeable potassium percentage (EPP) have proven to be critical in acidic soils found in grazing areas, with significant spatial model adjustments, particularly in the localities of Huarichaca, Chagragoto, and Rumichaca. This suggests that the relevance of predictive variables can vary depending on climatic conditions, land use, the extent of acid soil degradation, and other soil properties [50].
5. Conclusions
Using soil fertility maps enables the application of variable liming doses, leveraging geostatistical methods that accurately capture the spatial variation in soil acidity and potential fertility. This approach is relevant to food security and potato productivity among small farmers in the Pachitea province, Huánuco. The study identifies the key factors influencing soil acidity by conducting robust statistical analyses of soil chemical properties. Precision agriculture tools, such as these soil fertility maps, facilitate targeted liming interventions, enabling the calibration of optimal liming doses and the development of soil management strategies at a regional level.
The soil fertility analysis revealed that 47.25% of the total producers do not require liming, while 52.75% do need liming to enhance the chemical properties of their soil. Of the producers needing liming, 34.07% require dolomite, and 18.68% require agricultural lime. The average recommended application dose for lime and dolomite across all locations is 2.78 ± 3.77 t∙ha⁻¹.
It is essential first to restore the degraded acidic soils of the high Andean region, particularly those with pH values below 5.5 and exchangeable acidity percentages exceeding 25%. This can be achieved through liming treatments, complemented by strategies aimed at increasing the soil’s variable charges tailored to the specific needs of each locality. Such an approach will facilitate the development of optimal and sustainable fertilization plans for potato agroecosystems in the Peruvian Andean highlands. Furthermore, soil fertility maps generated from geostatistical data are invaluable for farmers, researchers, and policymakers, enabling improved soil management strategies, optimized liming applications, and enhanced potato crop productivity. The methodological approach applied in this study has effectively demonstrated the strong spatial dependence of the analyzed soils.
Author Contributions
For research articles with several authors, a short paragraph specifying their individual contributions must be provided. The following statements should be used “Conceptualization, K.Q., P.V., and R.S.; methodology, K.Q., L.A., and R.S.; software, S.M. and C.C.; validation, R.S. and L.A.; formal analysis, K.Q. and S.M.; investigation, K.Q., and S.M.; writing—original draft preparation, K.Q. and S.M.; All authors have read and agreed to the published version of the manuscript”.
Funding
This research was funded by the INIA project “Mejoramiento de los servicios de investi-gación y transferencia tecnológica en el manejo y recuperación de suelos agrícolas degradados y aguas para riego en la pequeña y mediana agricultura en los departamentos de Lima, Áncash, San Martín, Cajamarca, Lambayeque, Junín, Ayacucho, Arequipa, Puno y Ucayali” CUI 2487112.
Data Availability Statement
The data presented in this study are available on request from the corresponding author.
Conflicts of Interest
The authors declare no conflicts of interest.
References
- FAO Una Guía Sobre El Día Internacional de La Papa de 2024 2024.
- MIDAGRI Presentó Marco Orientador de Cultivos (MOC) de La Campaña Agrícola 2024/2025 - Noticias - Ministerio de Desarrollo Agrario y Riego - Plataforma Del Estado Peruano Available online: https://www.gob.pe/institucion/midagri/noticias/1010824-midagri-presento-marco-orientador-de-cultivos-moc-de-la-campana-agricola-2024-2025 (accessed on 9 October 2024).
- Velasquez Milla, D.Á. Peasant Strategies for In Situ Conservation of Genetic Resources in Andean Agroecosystems of the Sierra of Peru: Cajamarca and Huánuco, México, 2009.
- Egúsquiza, B.R. The Potato: Production, Transformation, and Marketing; International Potato Center, 2000.
- Documento Para Discusión Perú: Evaluación de La Seguridad Alimentaria Ante Emergencias (ESAE), 2021 - Midis Available online: https://evidencia.midis.gob.pe/esae-seguridad-alimentaria-2021-documento-discusion/ (accessed on 10 October 2024).
- Sadeghian, S. La acidez del suelo una limitante común para la producción de café. Avances Técnicos Cenicafé, 466, 1-12. 2016.
- Sanz Scovino, J.I. Sistemas Mejorados Arroz-Pasturas Para Sabana Nativa y Pasturas Degradadas En Suelos Ácidos de América Del Sur. Sistemas agropastoriles en sabanas tropicales de América Latina 1999, 232.
- Garay Canales, Ó.; Ochoa Acevedo, Á. Primera Aproximación Para La Identificación de Los Diferentes Tipos de Suelo Agrícola En El Valle Del Río Mantaro. 2010.
- Ayarza, M.A. Efecto de Las Propiedades Químicas de Los Suelos Ácidos En El Establecimiento de Las Especies Forrajeras. In Establecimiento y renovación de pasturas; Lascano, C. E: CIAT, 1991; pp. 161–185 ISBN 958-9183-26-3.
- Junior, E.C.; Jr, A.C.G.; Seidel, E.P.; Ziemer, G.L.; Zimmermann, J.; Oliveira, V.H.D. de; Schwantes, D.; Zeni, C.D. Effects of Liming on Soil Physical Attributes: A Review. Journal of Agricultural Science 2020, 12, p278. [CrossRef]
- Huanca Bizarro, A.F. Uso de La Cáscara de Huevo Molida Como Material Encalante En Suelos Ácidos Del Perú, 2018.
- Quinto Carhuancho, C.E. Propiedades físicas, químicas y biológicas del suelo bajo la influencia de tres sistemas de uso de la tierra en el Distrito José Crespo y Castillo, Leoncio Prado, 2016.
- Balta-Crisólogo, R.A.; Rodríguez-Del Castillo, Á.M.; Guerrero-Abad, R.; Cachique, D.; Alva-Plasencia, E.; Arévalo-López, L.; Loli, O. ABSORCIÓN Y CONCENTRACIÓN DE NITRÓGENO, FÓSFORO Y POTASIO EN SACHA INCHI (Plukenetia Volubilis L.) EN SUELOS ÁCIDOS, SAN MARTÍN, PERÚ. Folia Amazónica 2015, 24, 23. [CrossRef]
- Cotrina-Cabello, V.R.; Alejos-Patiño, I.W.; Cotrina-Cabello, G.G.; Córdova-Mendoza, P.; Córdova-Barrios, I.C.; Cotrina-Cabello, V.R.; Alejos-Patiño, I.W.; Cotrina-Cabello, G.G.; Córdova-Mendoza, P.; Córdova-Barrios, I.C. Efecto de Abonos Orgánicos En Suelo Agrícola de Purupampa Panao, Perú. Centro Agrícola 2020, 47, 31–40.
- Arce, A. Desarrollo Del Mercado de Fertilizantes Compuestos En El Perú y Su Impacto En Cultivos Tradicionales de La Selva Peruana, 2021.
- Chen, S.; Lin, B.; Li, Y.; Zhou, S. Spatial and Temporal Changes of Soil Properties and Soil Fertility Evaluation in a Large Grain-Production Area of Subtropical Plain, China. Geoderma 2020, 357, 113937. [CrossRef]
- R Core Team (2018) R A Language and Environment for Statistical Computing. R Foundation for Statistical Computing, Vienna. - References - Scientific Research Publishing Available online: https://www.scirp.org/reference/ReferencesPapers?ReferenceID=2342186 (accessed on 10 October 2024).
- Pebesma, E.J.; Bivand, R.S. Classes and Methods for Spatial Data in R. R News 2005, 5, 9–13.
- NOM-021-RECNAT-2000 NOM-021-RECNAT-2000. Natural Resources and Environment Secretary. Mexican Official Standard. Specifications of Fertility, Salinity, and Soil Classification. Study, Sampling and Analysis. Official Journal of the Federation 2002.
- EPA, U. Method 9045D: Soil and Waste PH. Soil Waste PH 2004, 1–5.
- Standardization), I.S.O. (International O. for ISO 11265:1994 Soil Quality — Determination of the Specific Electrical Conductivity 1994.
- Standardization), I.S.O. (International O. for ISO 11261:1995 Soil Quality — Determination of Total Nitrogen — Modified Kjeldahl Method 1995.
- Bazán Tapia, R. Manual de procedimientos de los análisis de suelos y agua con fines de riego. Instituto Nacional de Innovación Agraria 2017.
- Hengl, T.; Mendes De Jesus, J.; Heuvelink, G.B.M.; Ruiperez Gonzalez, M.; Kilibarda, M.; Blagotić, A.; Shangguan, W.; Wright, M.N.; Geng, X.; Bauer-Marschallinger, B.; et al. SoilGrids250m: Global Gridded Soil Information Based on Machine Learning. PLoS One 2017, 12, e0169748. [CrossRef]
- Havlin, J.L. Soil: Fertility and Nutrient Management. Landscape and Land Capacity 2020, 251–265. [CrossRef]
- Tunçay, T. Comparison Quality of Interpolation Methods to Estimate Spatial Distribution of Soil Moisture Content. Commun Soil Sci Plant Anal 2021, 52, 353–374. [CrossRef]
- Bock, M.; Böhner, J.; Köthe, R.; Conrad, O.; Köthe, R.; Ringeler, A. Methods for Creating Functional Soil Databases and Applying Digital Soil Mapping with SAGA GIS. RC Scientific and Technical Reports, Office for Official Publications of the European Communities, Luxembourg 2007, 1, 31–37.
- Martínez, C.R. Modelado Geoestadístico de Fertilidad de Un Terreno Agrícola Mediante Mapas de Kriging Que Interpolan Los Datos de Análisis Químico de Suelos. Producción Agropecuaria y Desarrollo Sostenible 2021, 9, 63–84. [CrossRef]
- Gallardo Correa, A. Geostadística. 2006.
- Fu, Y.; Song, J.; Guo, J.; Fu, Y.; Cai, Y. Prediction and Analysis of Sea Surface Temperature Based on LSTM-Transformer Model. Reg Stud Mar Sci 2024, 78, 103726. [CrossRef]
- Fernández Villafañez, S. Métodos de regresión y clasificación basados en árboles. 2022.
- Burton, A. Influence of Solution Management Techniques on Nutrient Use Efficiency in Hydroponically Grown Salad-Type Plants, 2018.
- Mugo, James.N.; Karanja, N.N.; Gachene, C.K.; Dittert, K.; Nyawade, S.O.; Schulte-Geldermann, E. Assessment of Soil Fertility and Potato Crop Nutrient Status in Central and Eastern Highlands of Kenya. Sci Rep 2020, 10, 7779. [CrossRef]
- He, H.; Li, Y.; He, L.F. Aluminum Toxicity and Tolerance in Solanaceae Plants. South African Journal of Botany 2019, 123, 23–29. [CrossRef]
- George, E.; Horst, W.J.; Neumann, E. Adaptation of Plants to Adverse Chemical Soil Conditions. Marschner’s Mineral Nutrition of Higher Plants: Third Edition 2012, 409–472. [CrossRef]
- Cakmak, I.; Brown, P.; Colmenero-Flores, J.M.; Husted, S.; Kutman, B.Y.; Nikolic, M.; Rengel, Z.; Schmidt, S.B.; Zhao, F.-J. Micronutrients. In Marschner’s Mineral Nutrition of Plants; Elsevier, 2023; pp. 283–385 ISBN 978-0-12-819773-8.
- Rout, G.R.; Samantaray, S.; Das, P. Aluminium Toxicity in Plants: A Review. Agronomie 2001, 21, 3–21. [CrossRef]
- Jovovic, Z.; Dolijanovic, Z.; Spalevic, V.; Dudic, B.; Przulj, N.; Velimirovic, A.; Popovic, V. Effects of Liming and Nutrient Management on Yield and Other Parameters of Potato Productivity on Acid Soils in Montenegro. Agronomy 2021, 11, 980. [CrossRef]
- Havlin, J.L.; Tisdale, S.L.; Nelson, W.L.; Beaton, J.D. Soil Fertility and Fertilizers; Pearson Education India, 2016; Vol. 8; ISBN 978-93-325-7034-4.
- McGahan, D.G.; Southard, R.J.; Zasoski, R.J. Mineralogical Comparison of Agriculturally Acidified and Naturally Acidic Soils. Geoderma 2023, 114, 355–368. [CrossRef]
- Kome, G.K.; Enang, R.K.; Tabi, F.O.; Yerima, B.P.K.; Kome, G.K.; Enang, R.K.; Tabi, F.O.; Yerima, B.P.K. Influence of Clay Minerals on Some Soil Fertility Attributes: A Review. Open Journal of Soil Science 2019, 9, 155–188. [CrossRef]
- Bhattacharyya, T.; Pal, D.K.; Srivastava, P. Formation of Gibbsite in the Presence of 2:1 Minerals: An Example from Ultisols of Northeast India. Clay Miner 2000, 35, 827–840. [CrossRef]
- Srivastava, P.; Pal, D.K. New Criteria to Identify Argillans as Evidence of Clay Illuviation. In Micromorphology of Soils and Paleosols of India; Springer Nature Singapore: Singapore, 2023; pp. 7–20 ISBN 978-981-9965-59-5 978-981-9965-60-1.
- Sahoo, S.; Vasu, D.; Paul, R.; Sen, T.K.; Ray, S.K.; Chandran, P. Acid Soils of Manipur of the North-Eastern Region of India: Their Mineralogy, Pedology, Taxonomy and Edaphology. Clay Research 2020, 39, 31–43. [CrossRef]
- Lee, C.R.; MacDonald, M.L. Influence of Soil Amendments on Potato Growth, Mineral Nutrition, and Tuber Yield and Quality on Very Strongly Acid Soils. Soil Science Society of America Journal 1977, 38, 573–577. [CrossRef]
- Bordoloi, P. Indian Research Journal of Extension Education. 2021, p. 202.
- Wang, Y.; Liu, G.; Zhao, Z. Spatial Heterogeneity of Soil Fertility in Coastal Zones: A Case Study of the Yellow River Delta, China. J Soils Sediments 2021, 21, 1826–1839. [CrossRef]
- Campisi, N.; Kulu, H.; Mikolai, J.; Klüsener, S.; Myrskylä, M. Spatial Variation in Fertility across Europe: Patterns and Determinants. Popul Space Place 2020, 26, e2308. [CrossRef]
- Trujillo-González, J.M.; Torres-Mora, M.A.; Ballesta, R.J.; Brevik, E.C. Spatial Variability of the Physicochemical Properties of Acidic Soils along an Altitudinal Gradient in Colombia. Environ Earth Sci 2022, 81, 108. [CrossRef]
- Erraez, R.M.M.; Vásquez, E. Enmienda de Cal En Suelos Degradados Por La Ganadería En La Parroquia Panguintza, Cantón Zumbi, Provincia de Zamora Chinchipe. Bosques Latitud Cero 2023, 13, 49–67. [CrossRef]
Figure 1.
Soil monitoring locations in Pachitea province, Huánuco, Peru.
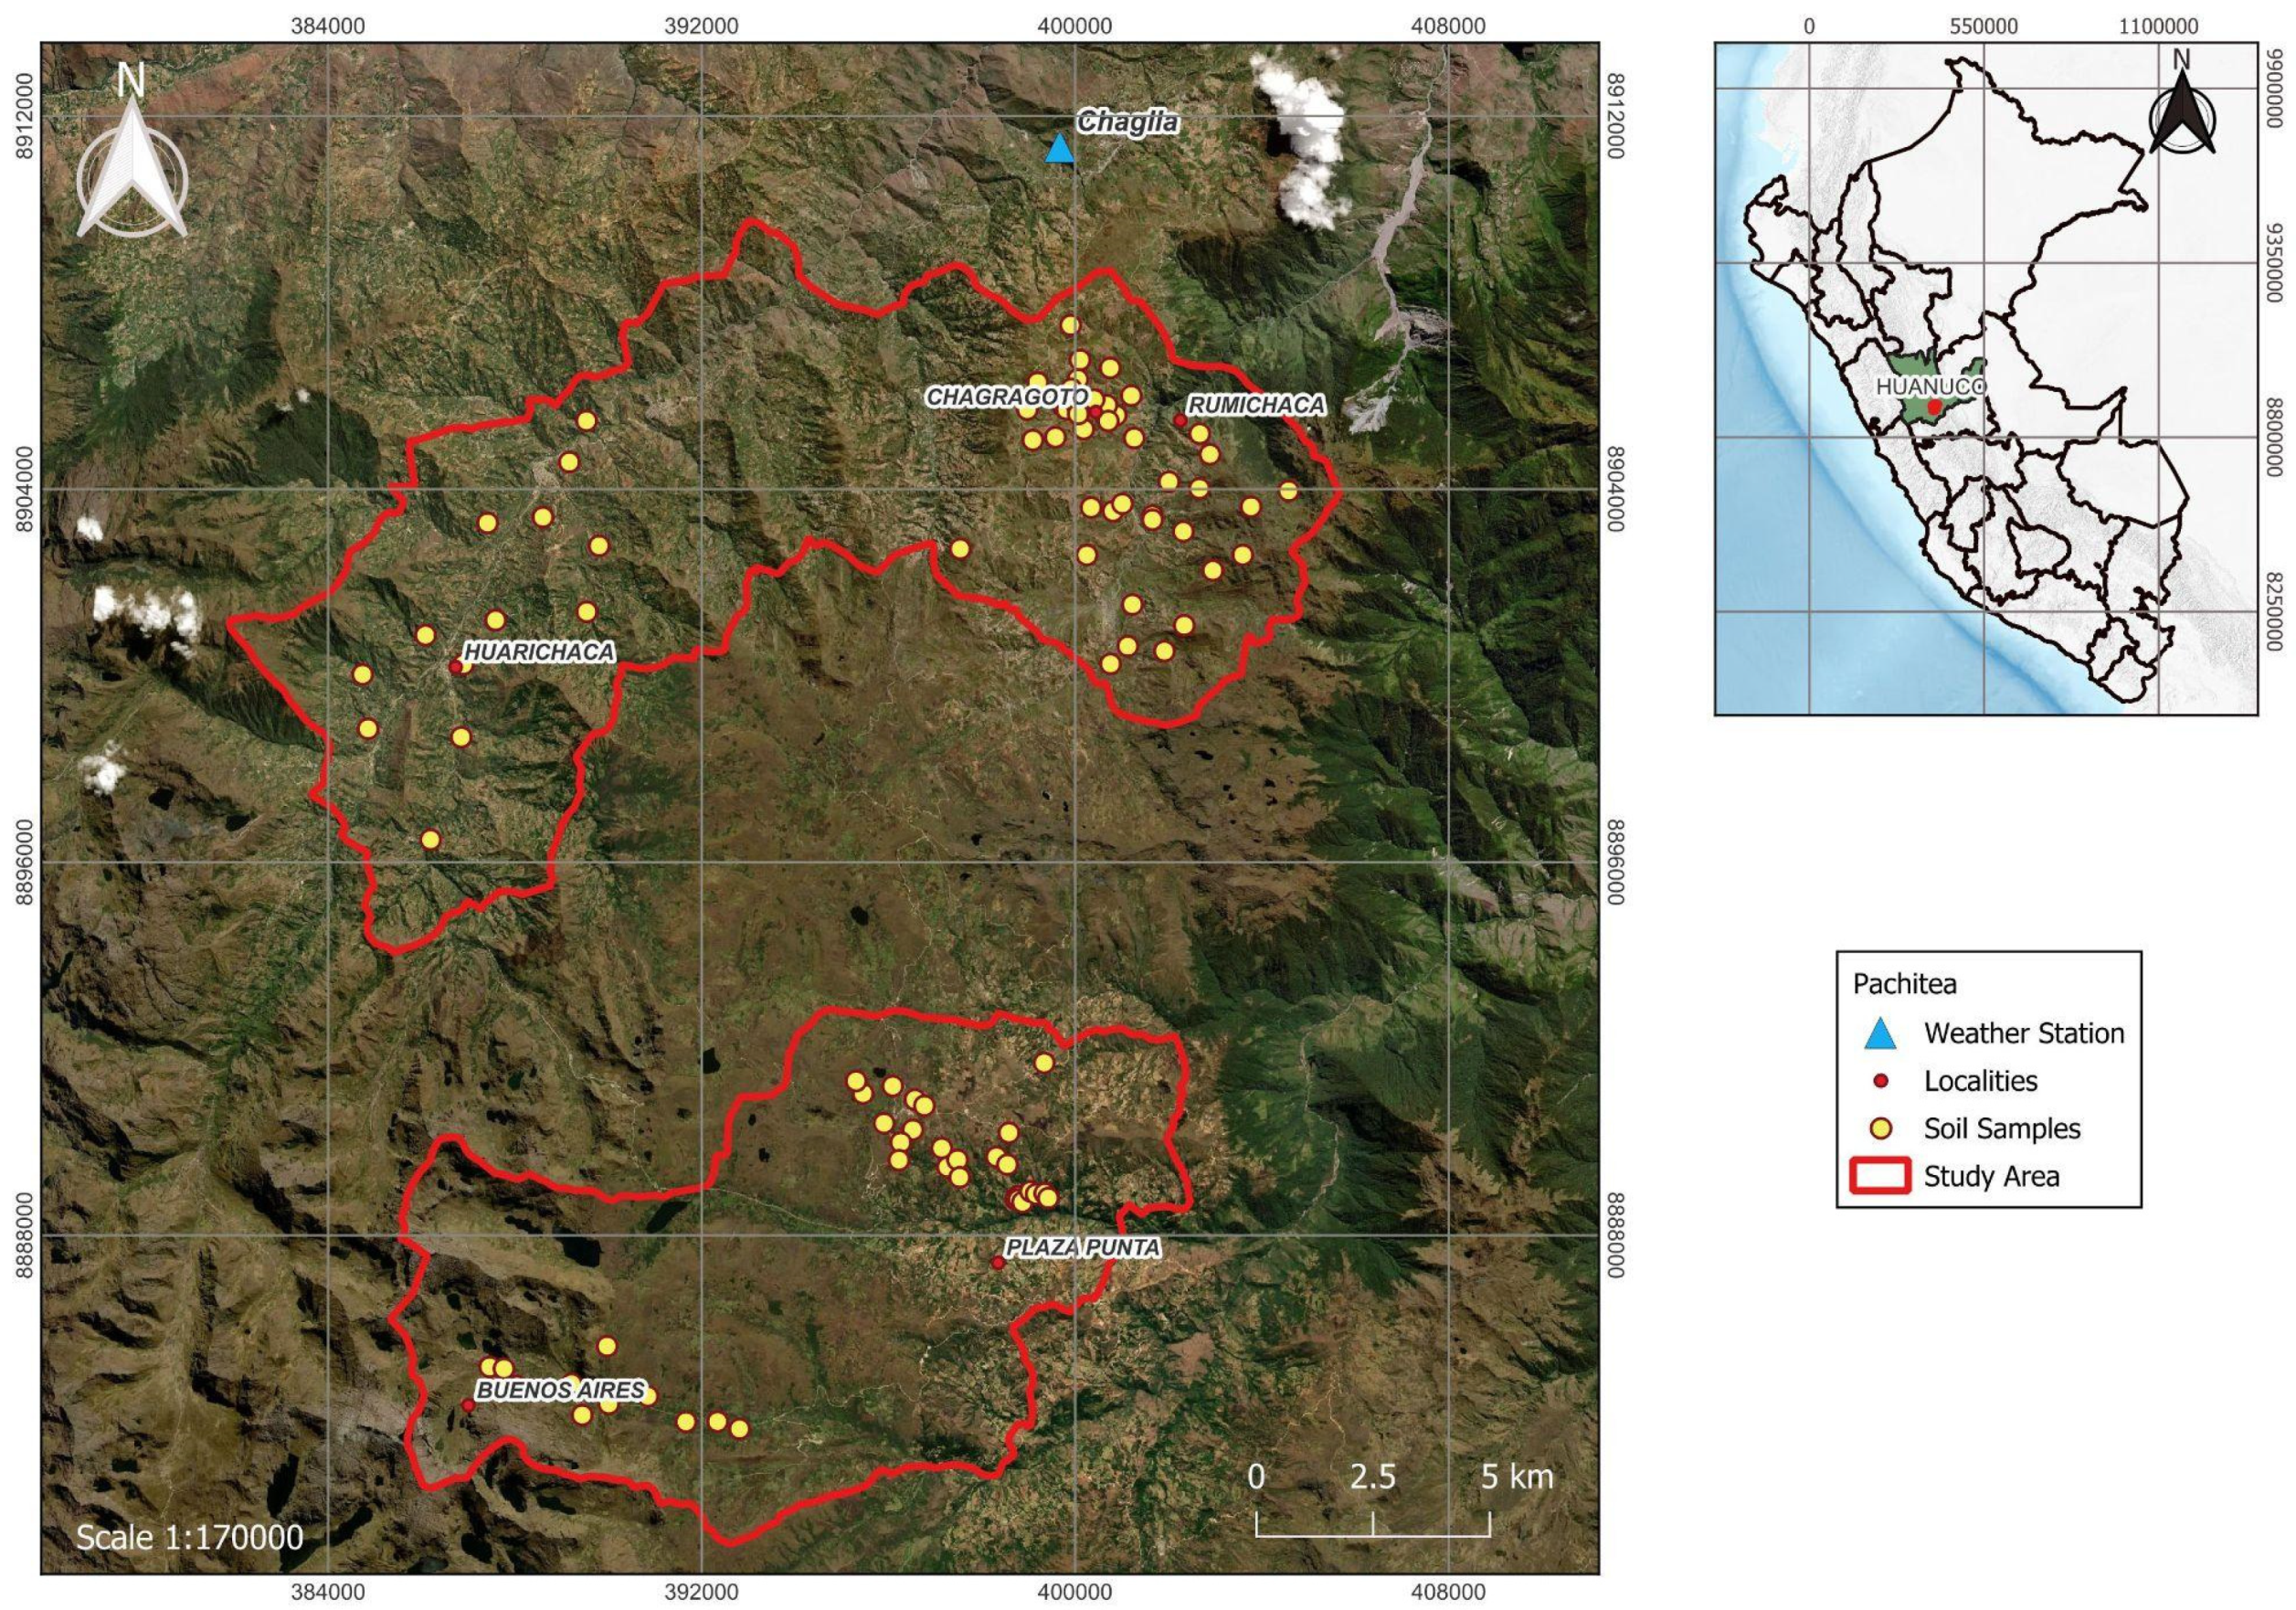
Figure 2.
Average temperature and average precipitation in the study area.
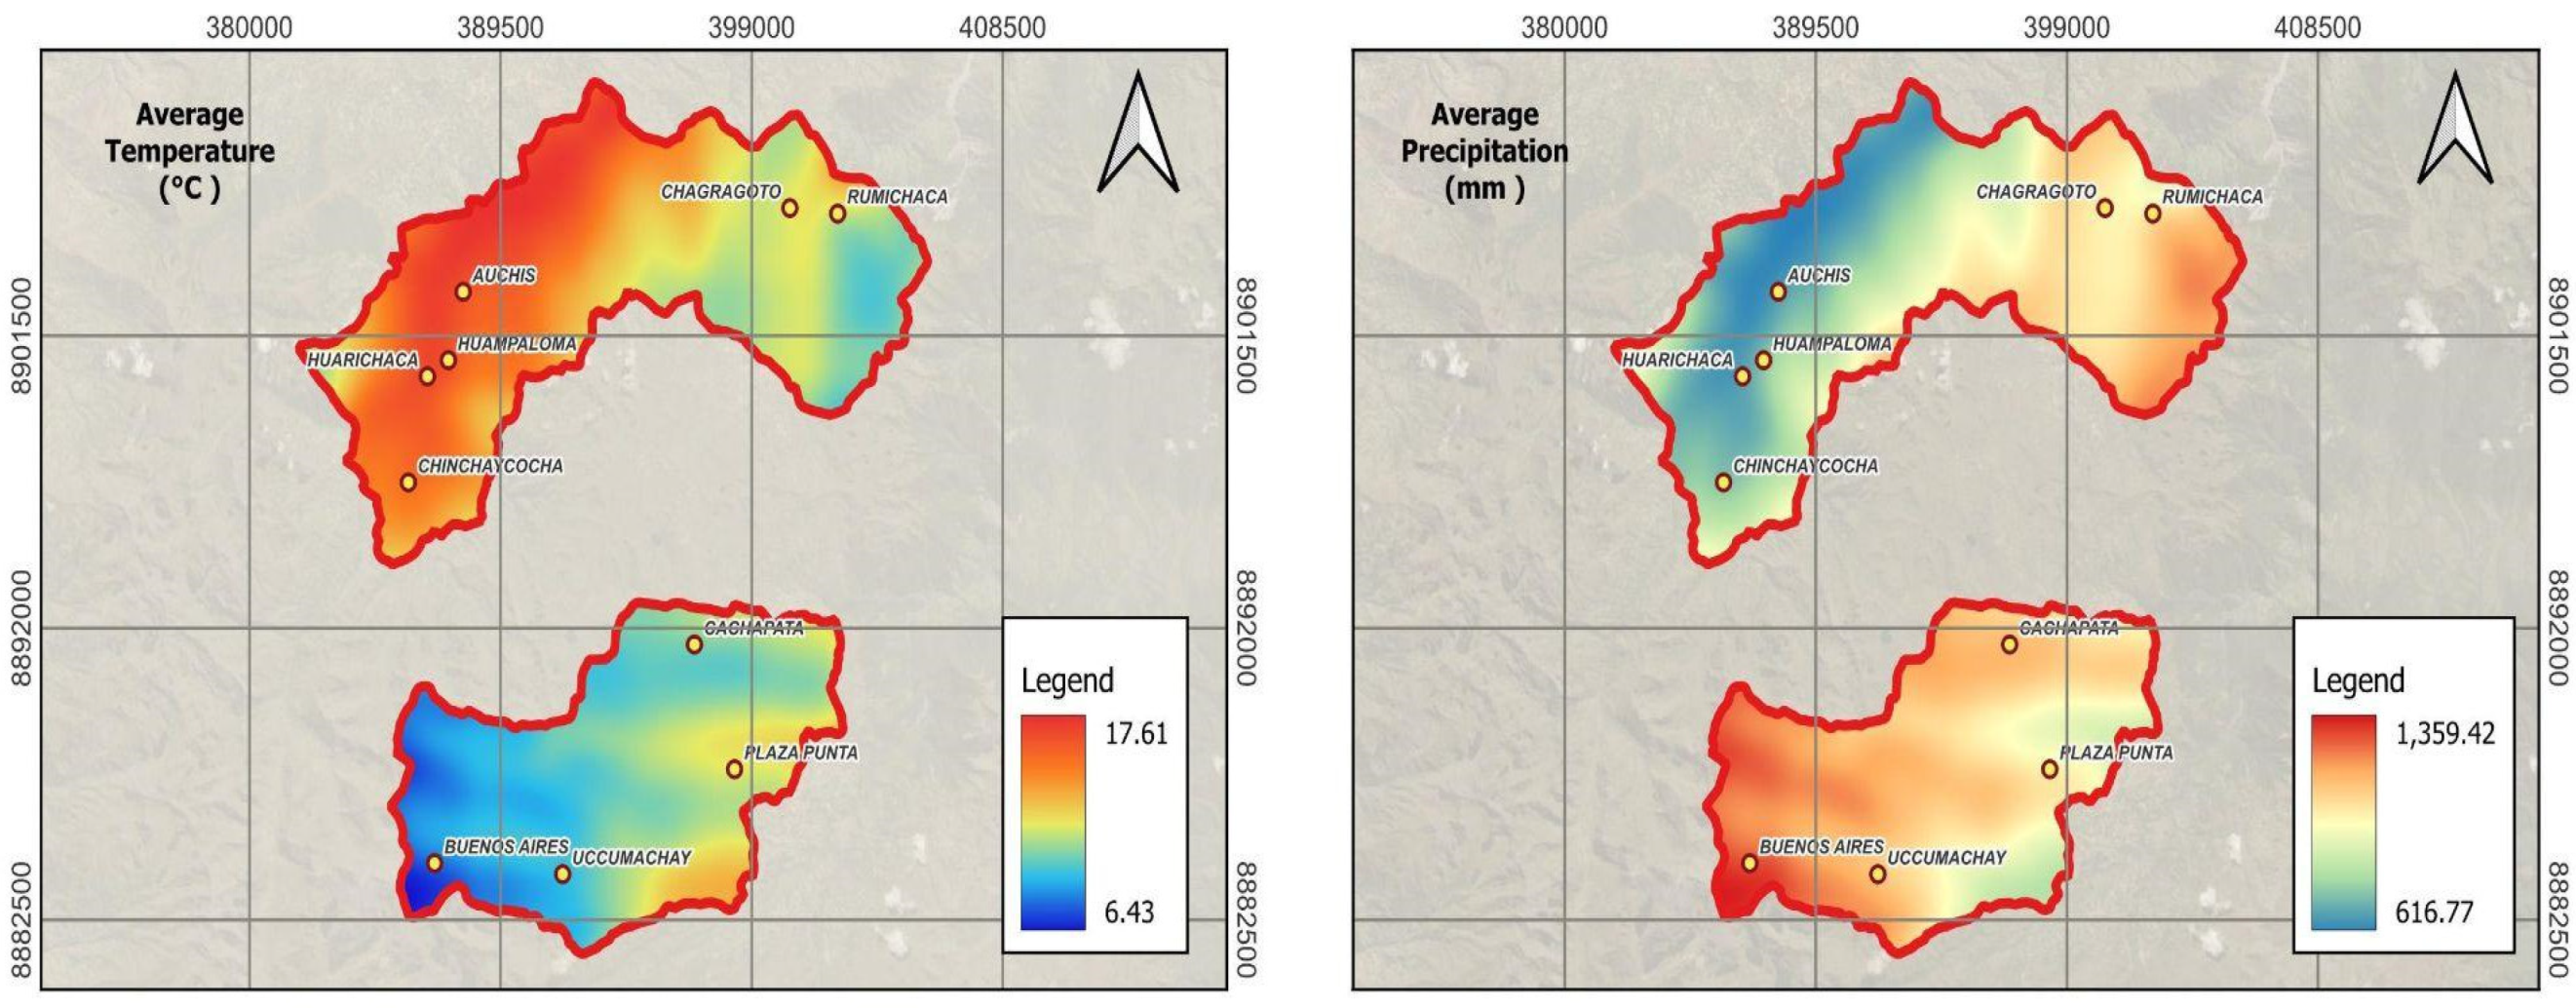
Figure 3.
Descriptive statistics for pH.
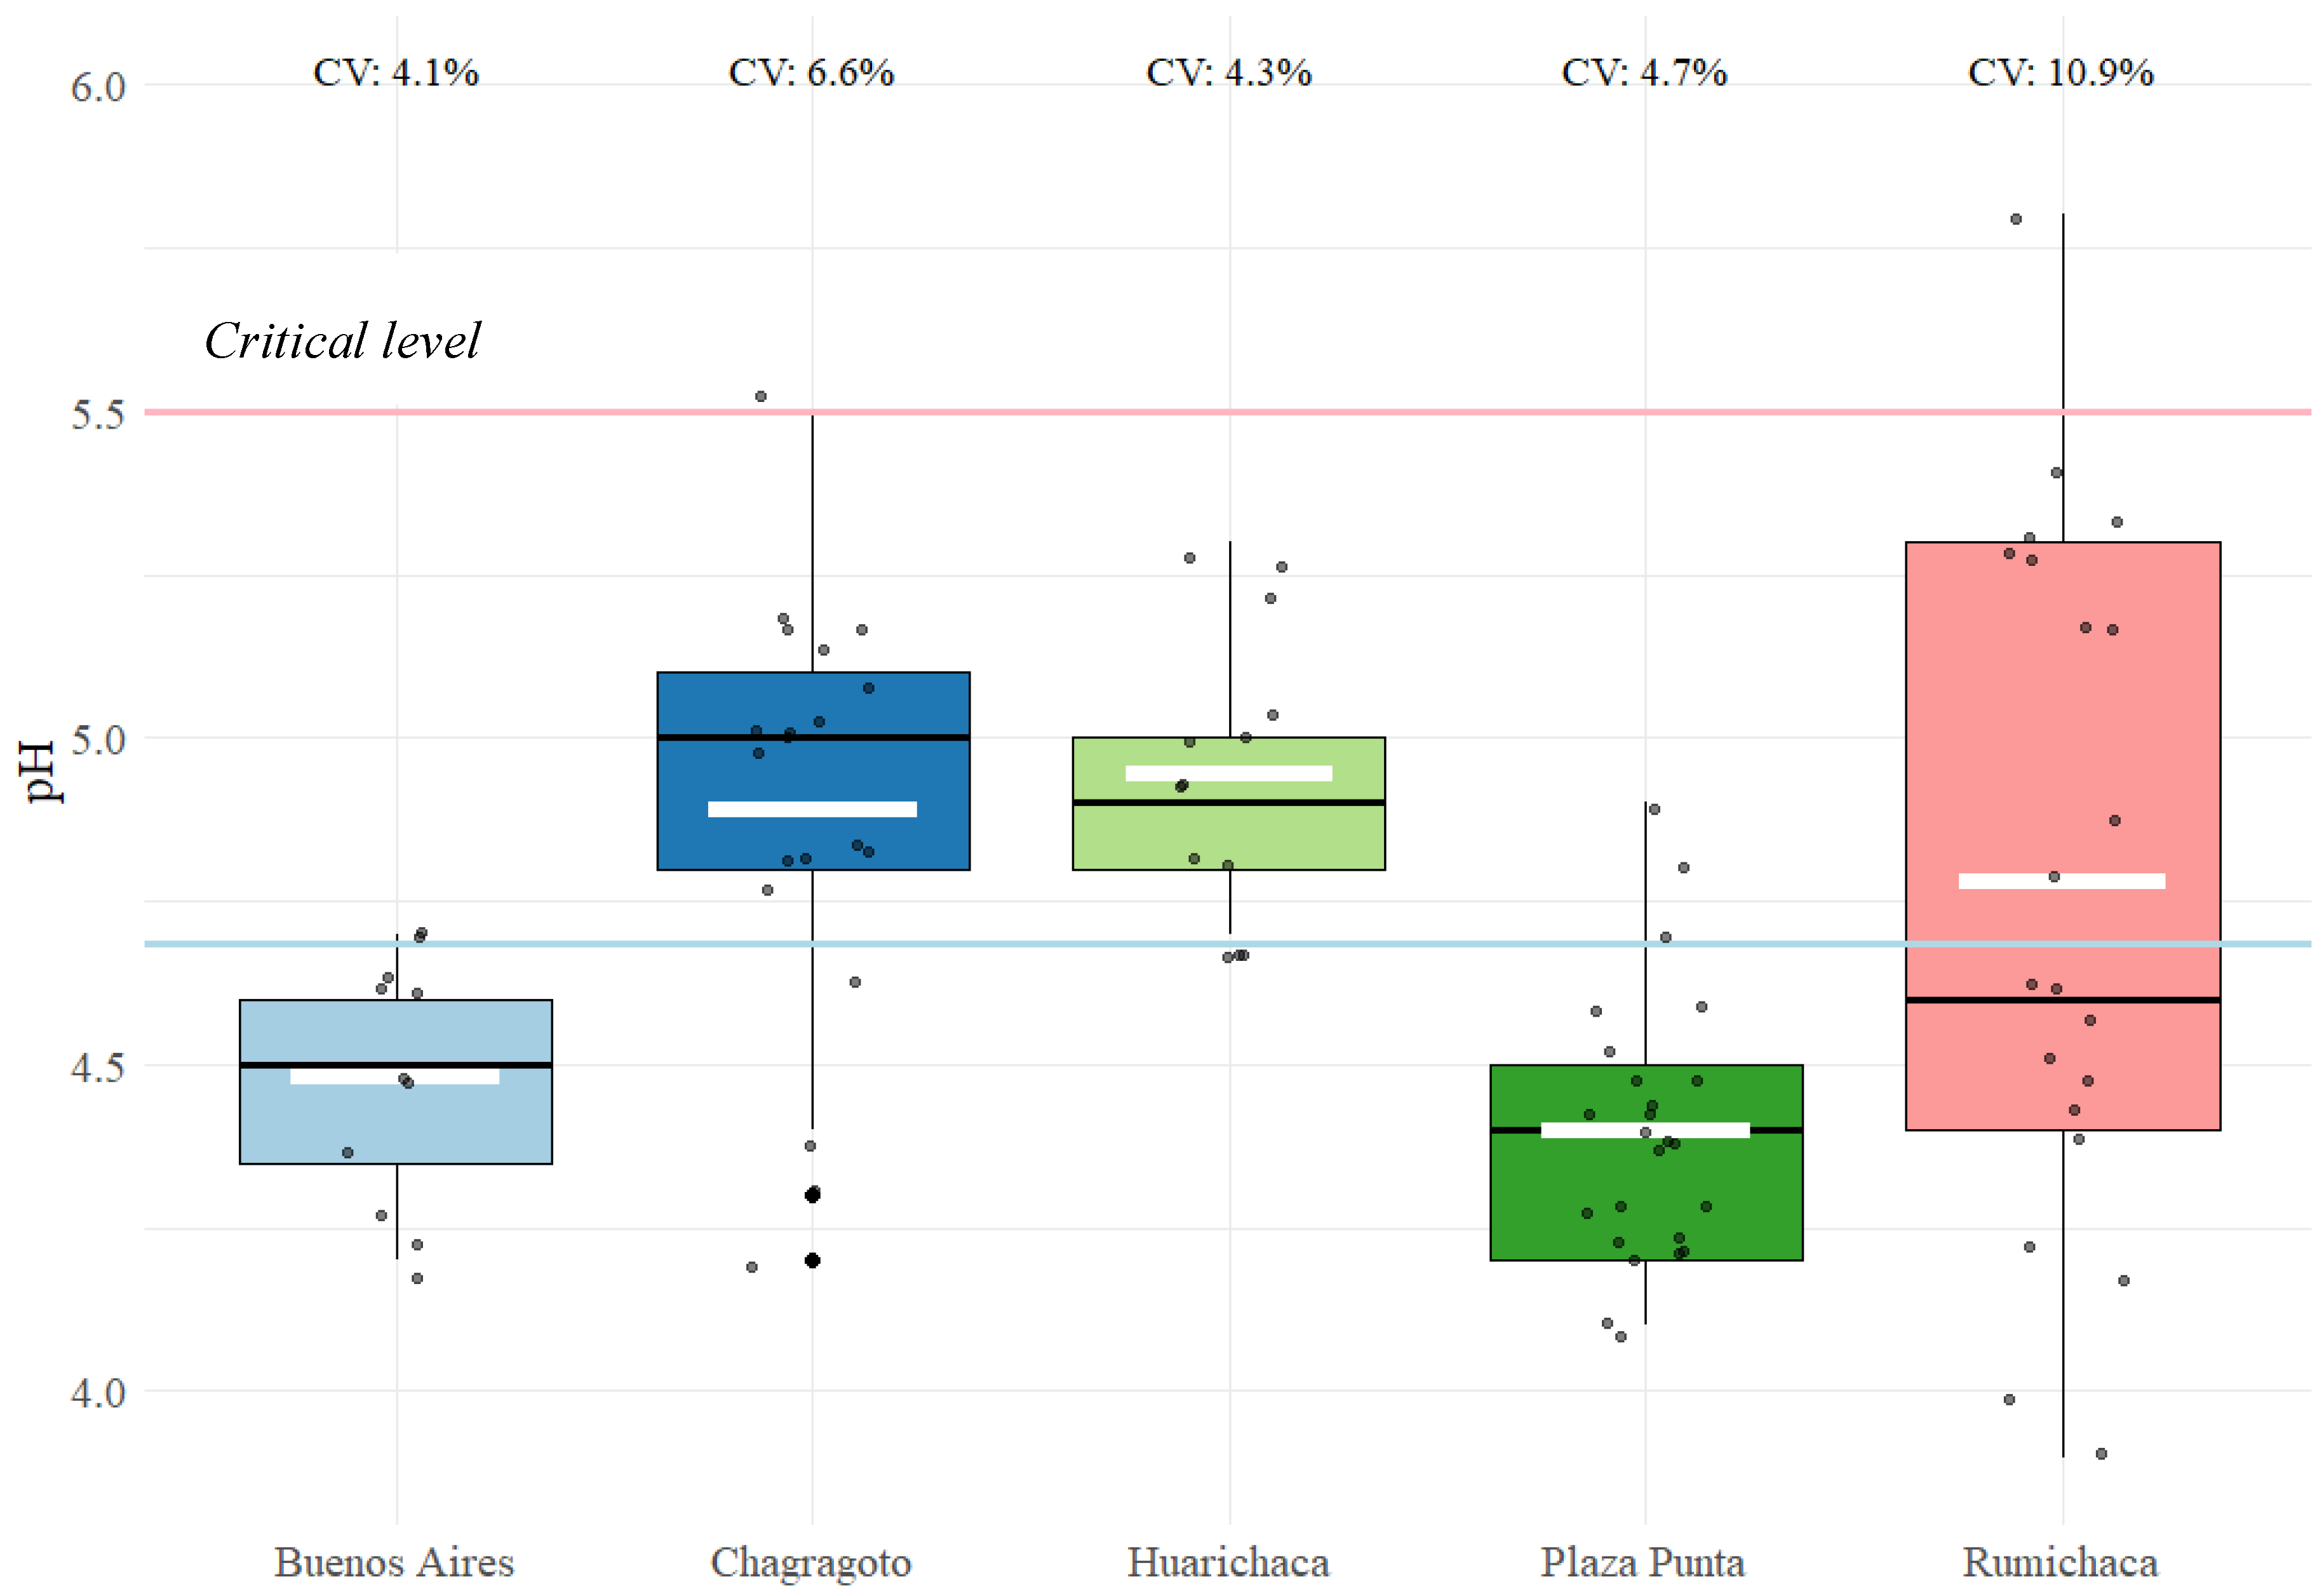
Figure 4.
Descriptive statistics for EAP.
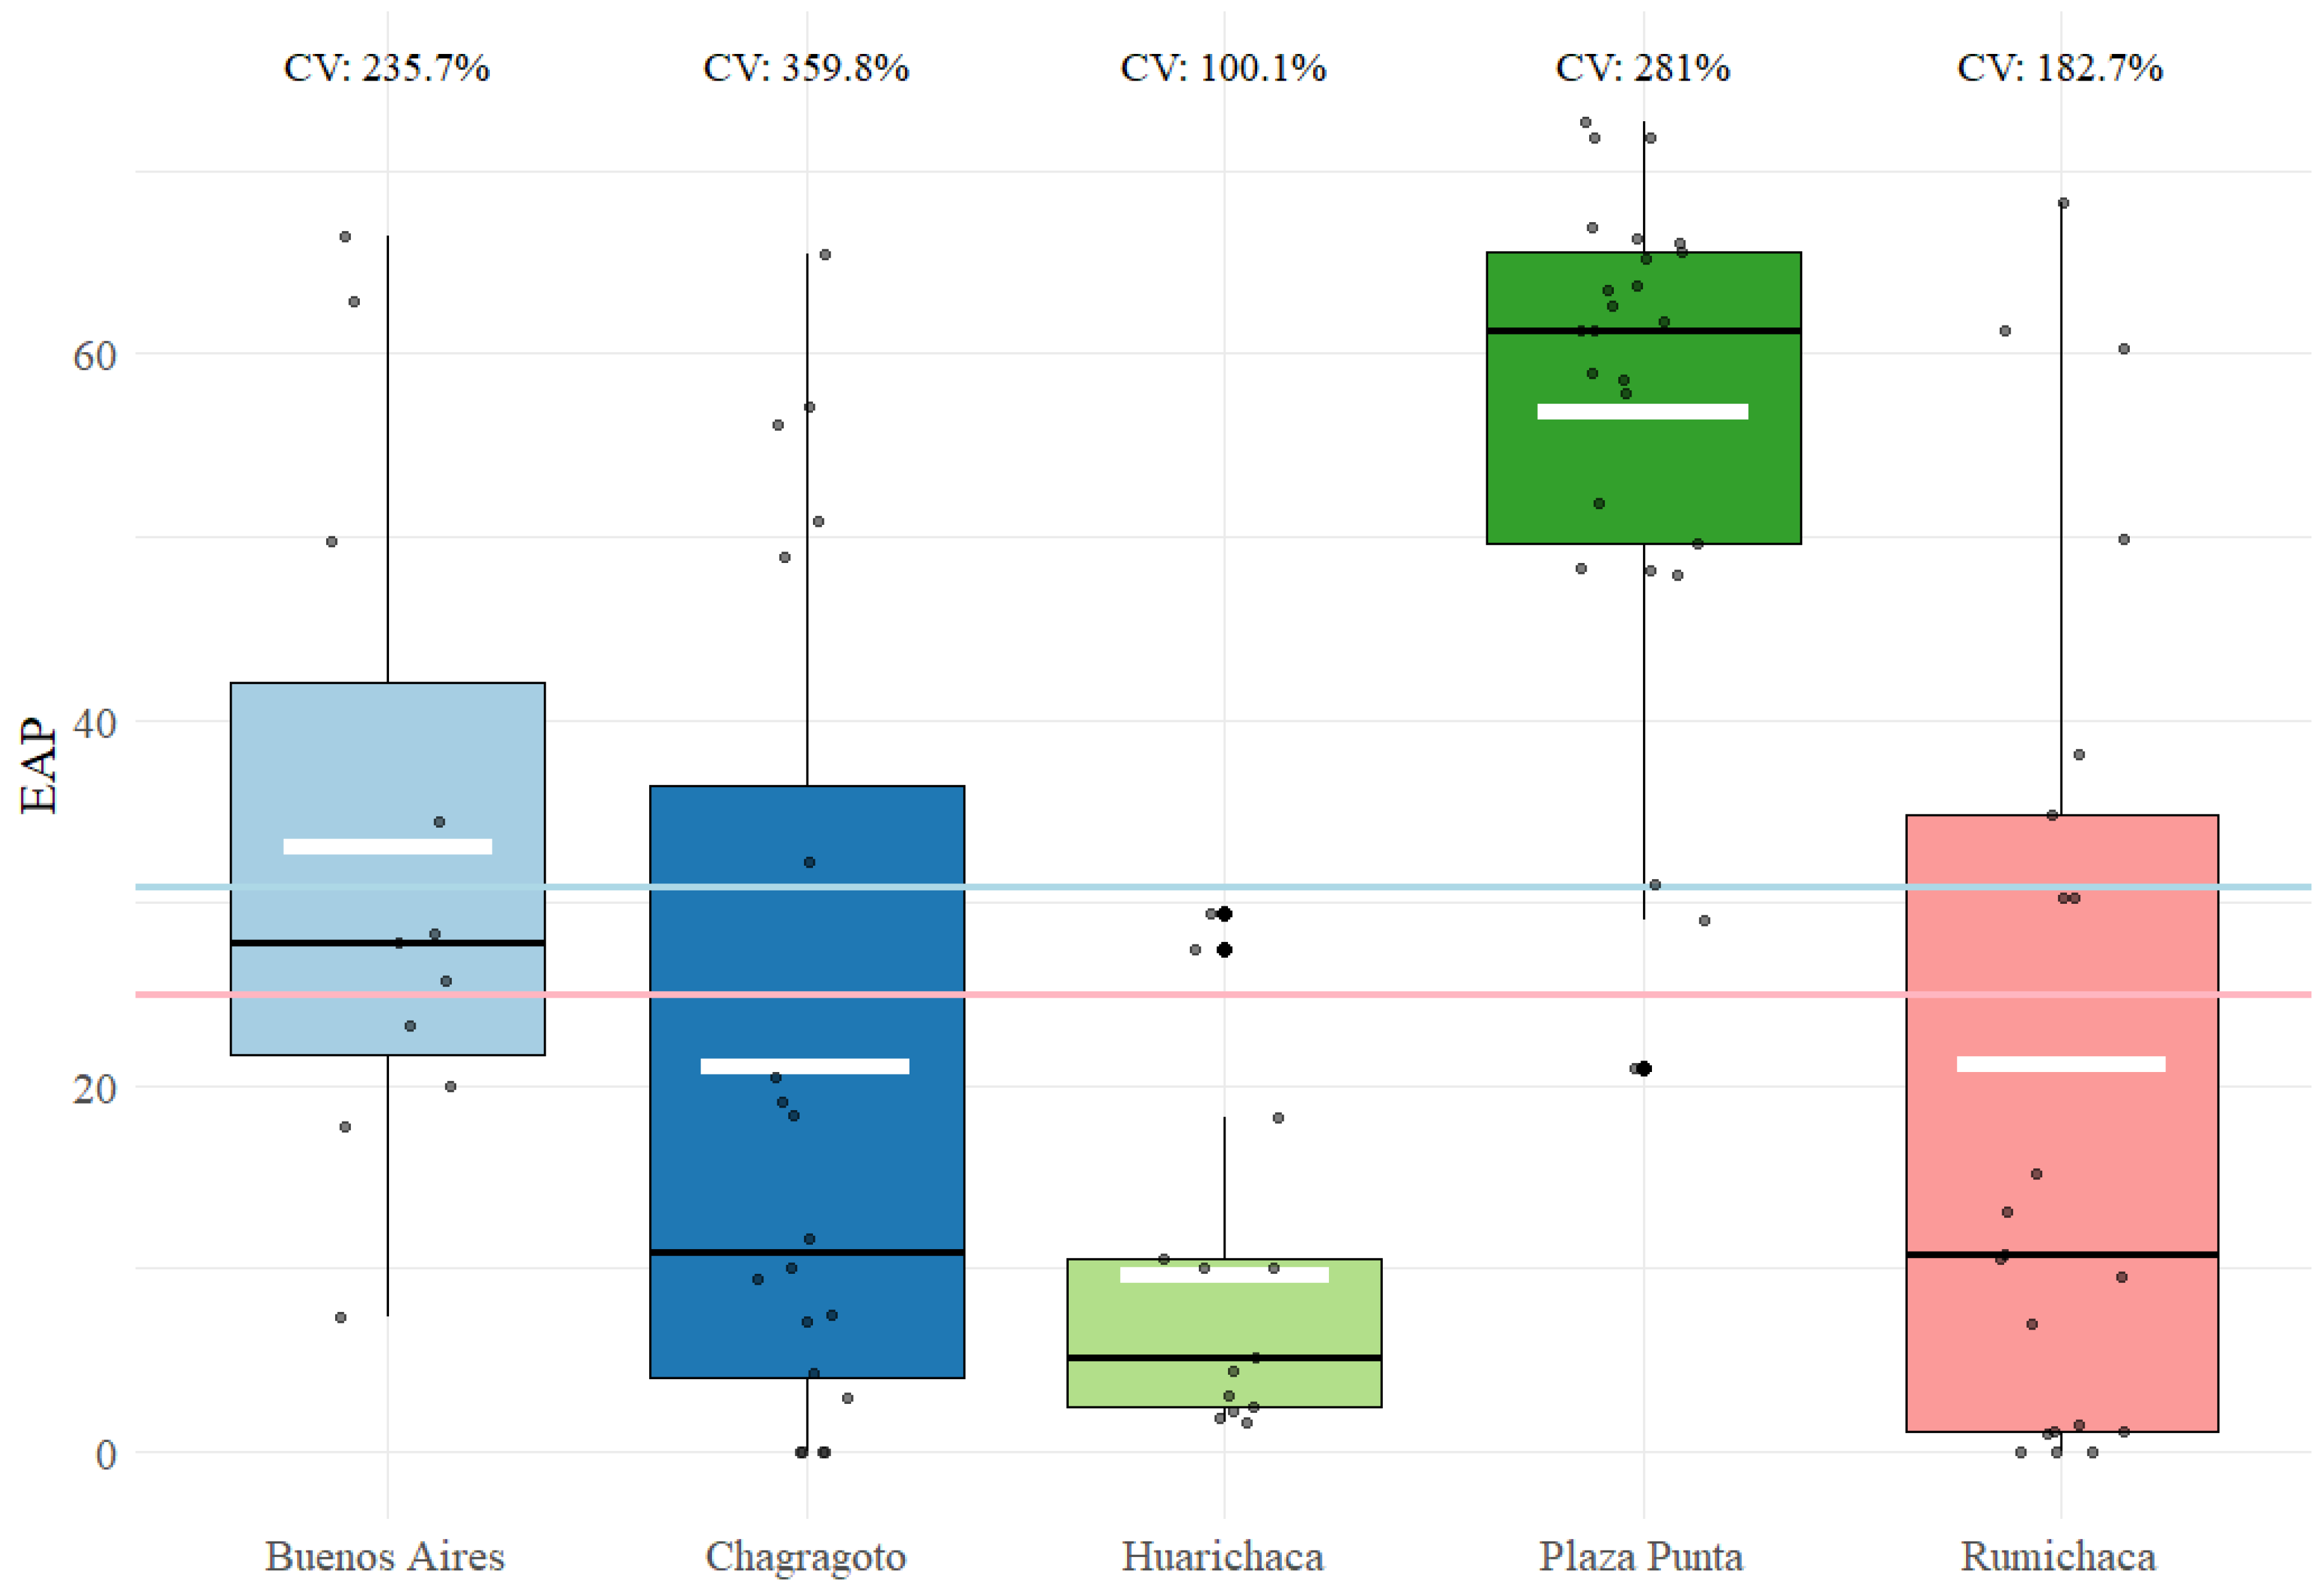
Figure 5.
Principal component analysis (PCA) of the soil’s physicochemical properties in five Pachitea, Huánuco, Peru locations.
Figure 5.
Principal component analysis (PCA) of the soil’s physicochemical properties in five Pachitea, Huánuco, Peru locations.
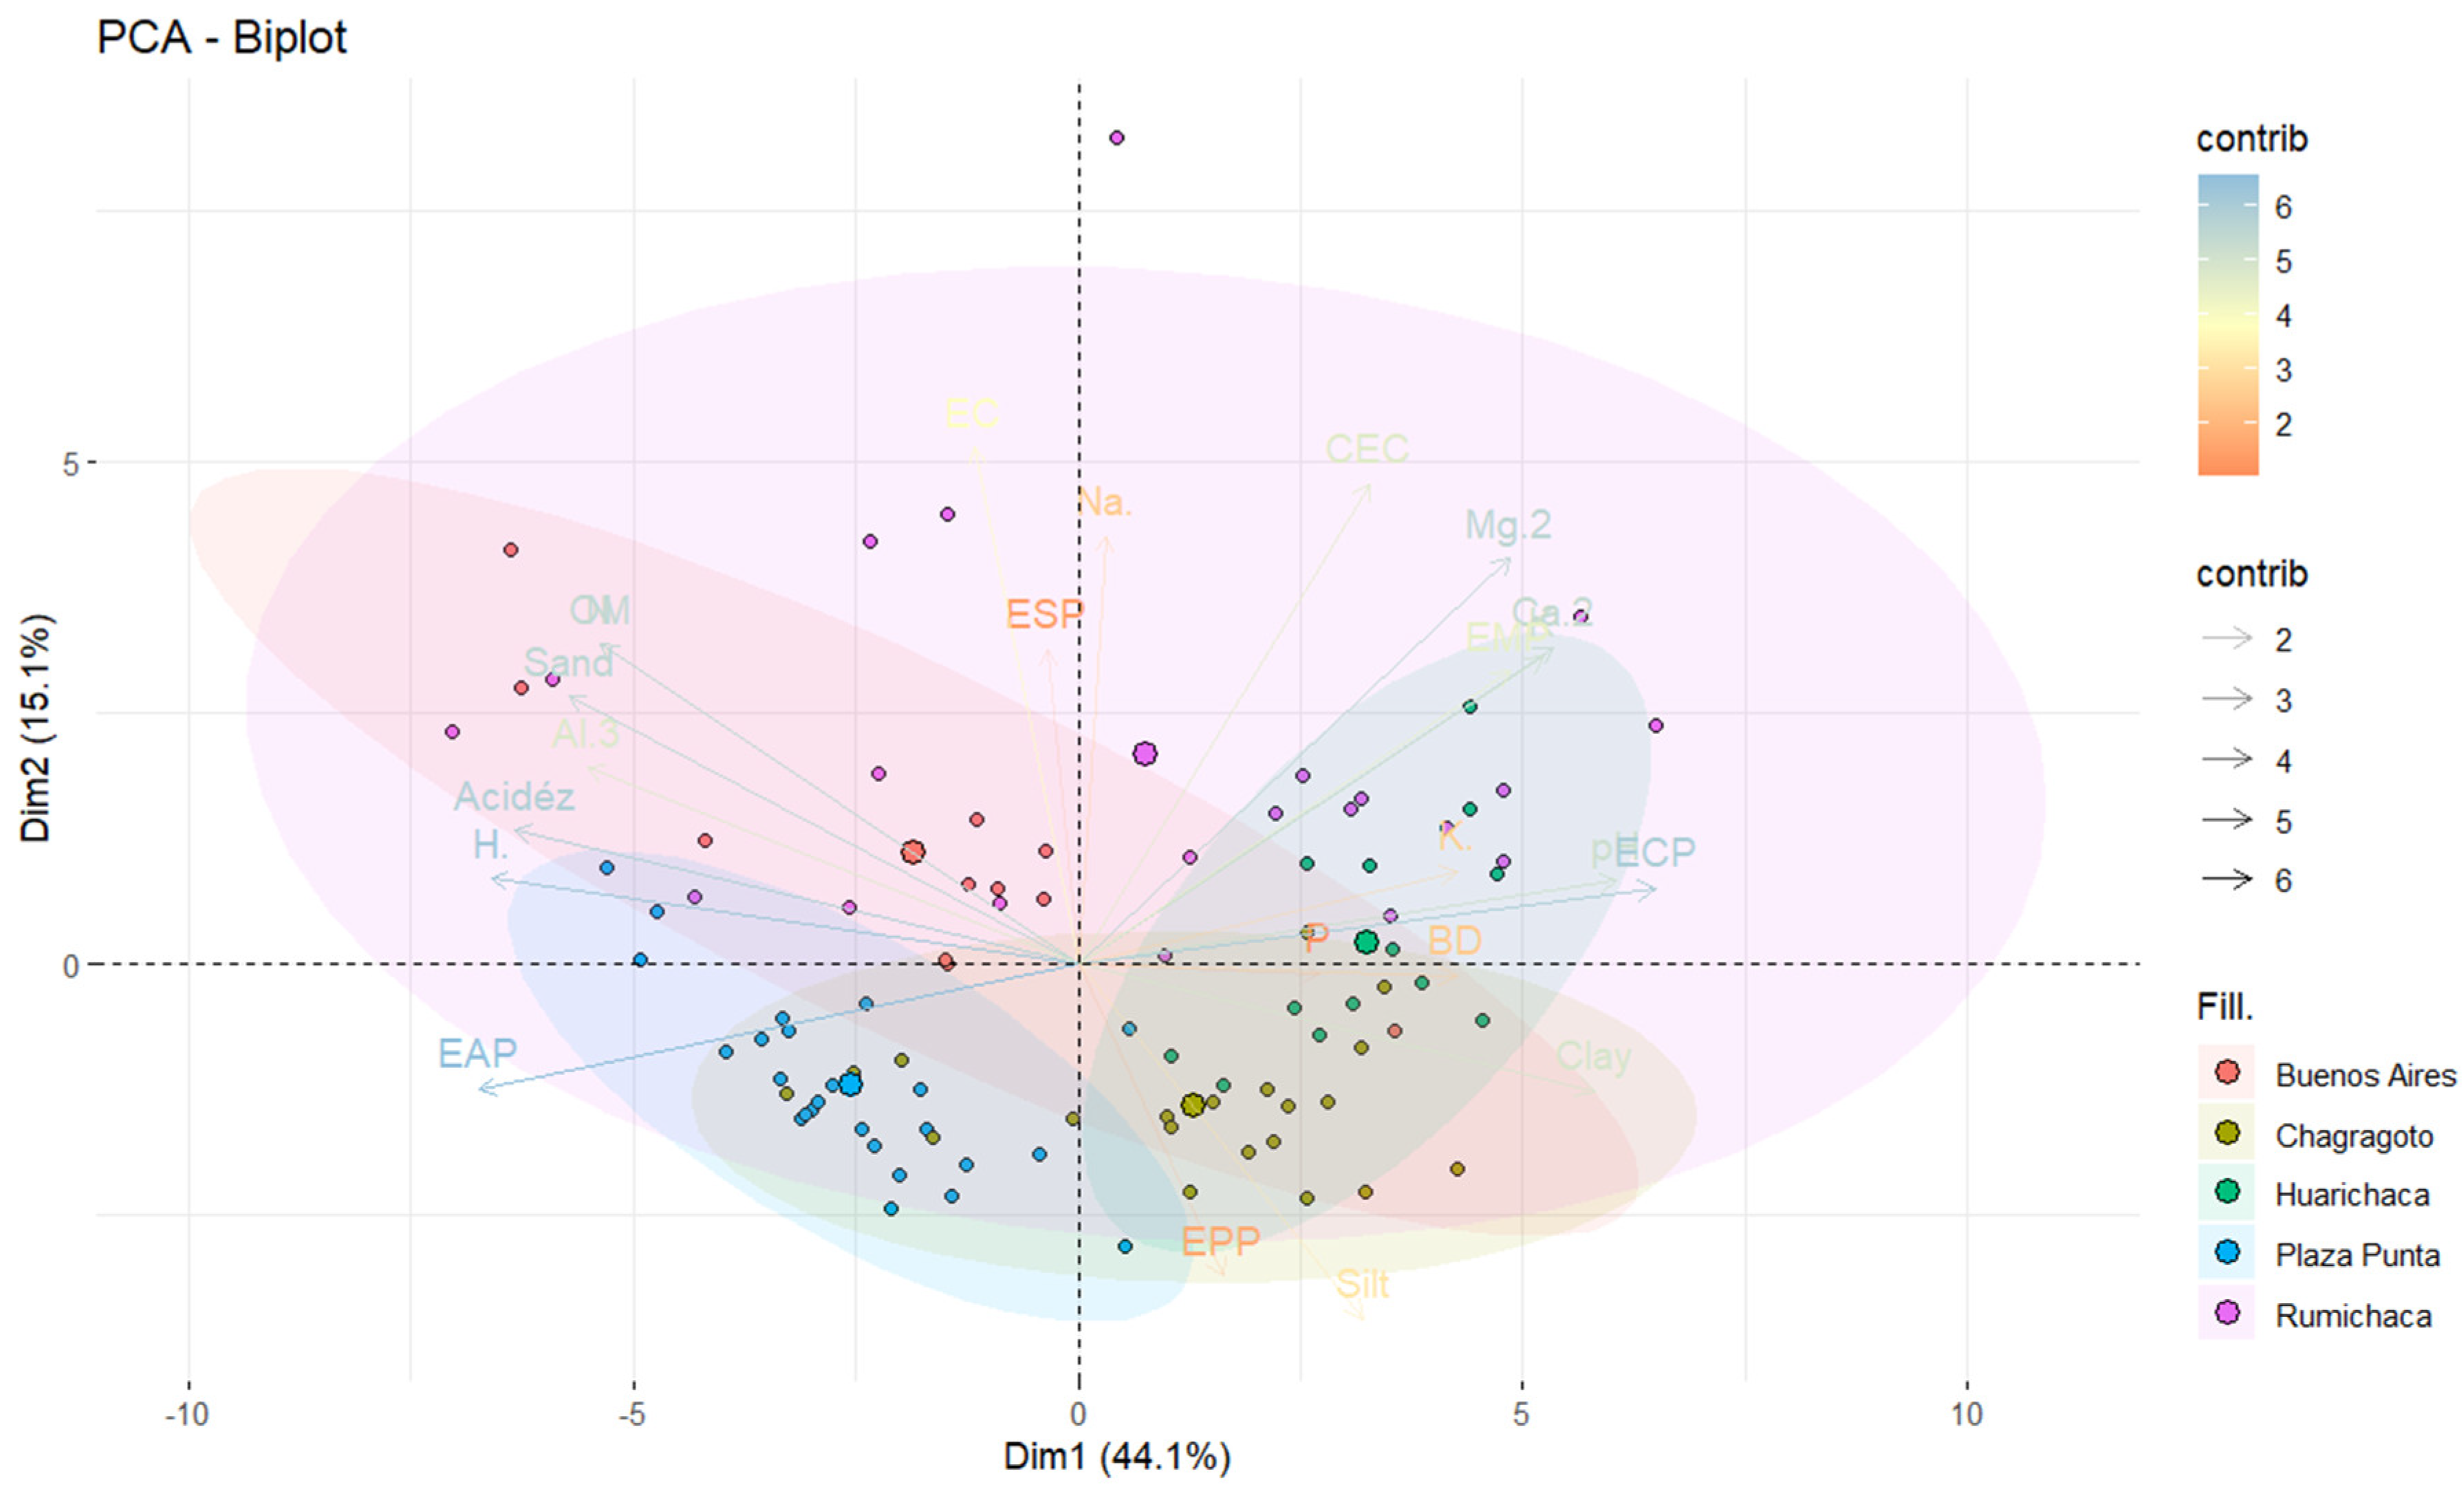
Figure 6.
Pearson correlation matrix among soil fertility parameters.
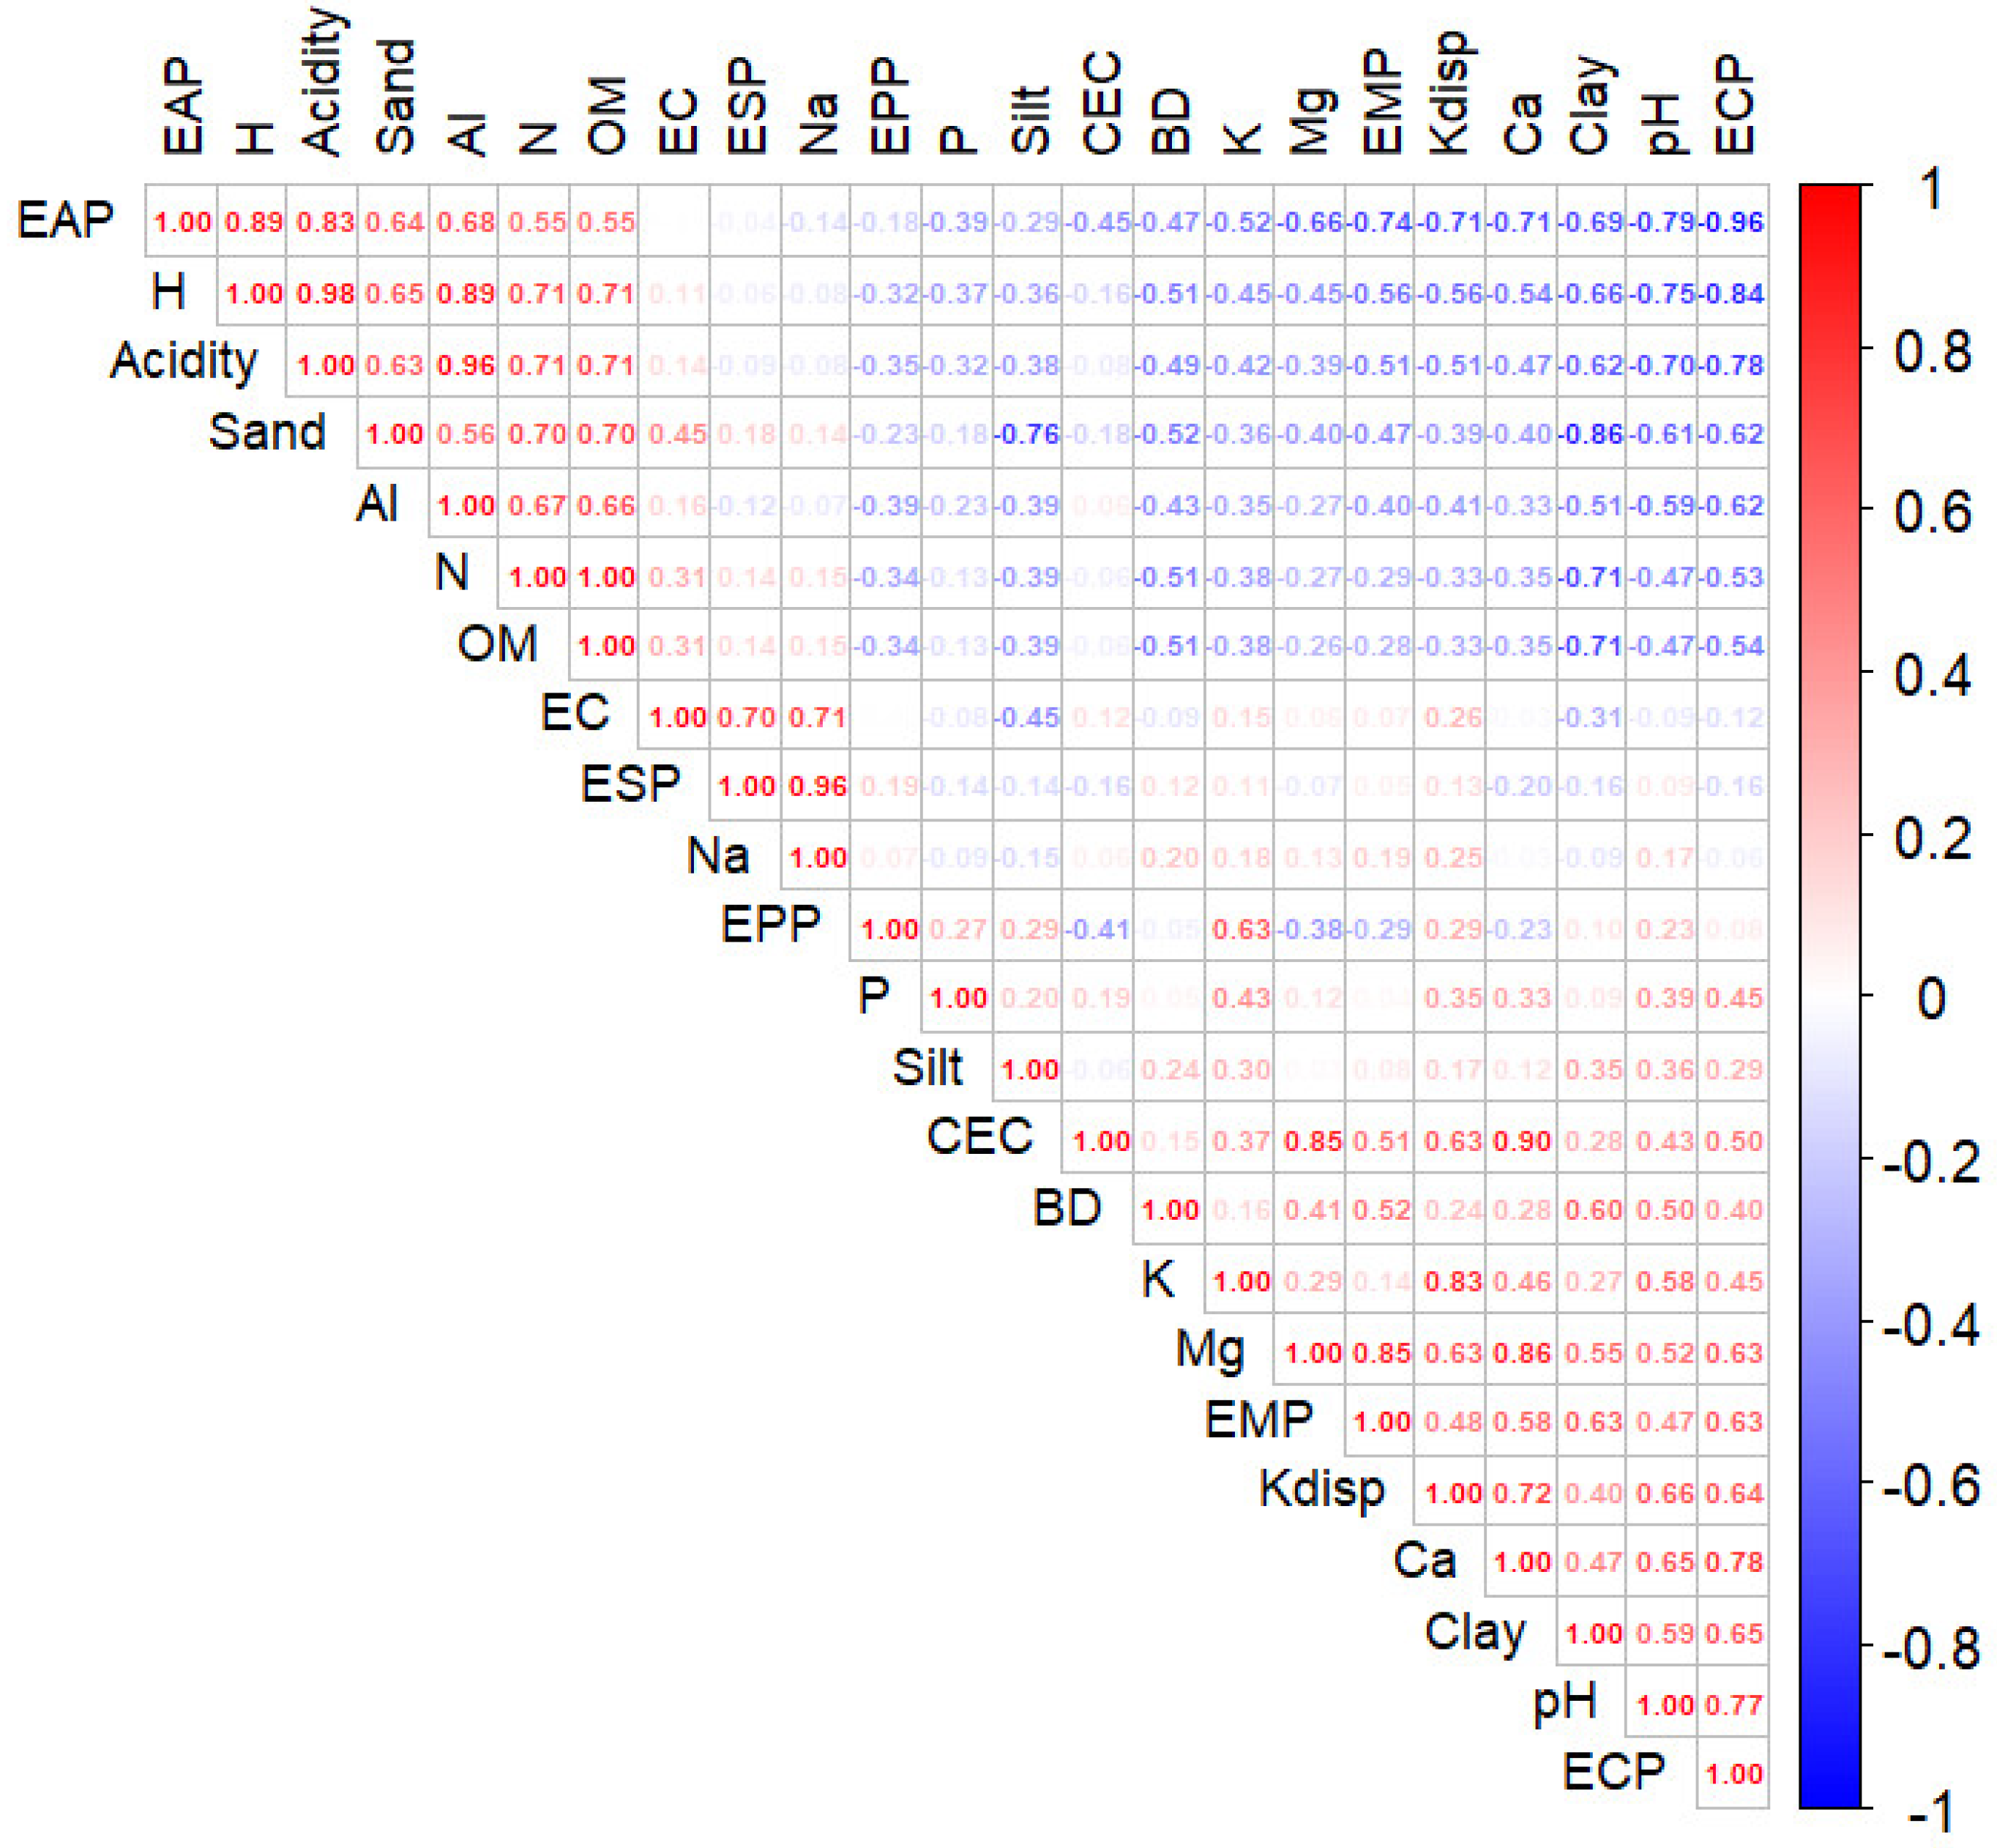
Figure 7.
Linear regression analysis between different physical-chemical parameters associated with soil acidity: (a) linear regression between exchangeable calcium percentage and exchangeable acidity percentage, (b) linear regression between exchangeable calcium percentage and exchangeable hydrogen, (c) linear regression between exchangeable acidity percentage and exchangeable magnesium percentage, and (d) linear regression between exchangeable calcium percentage and soil pH.
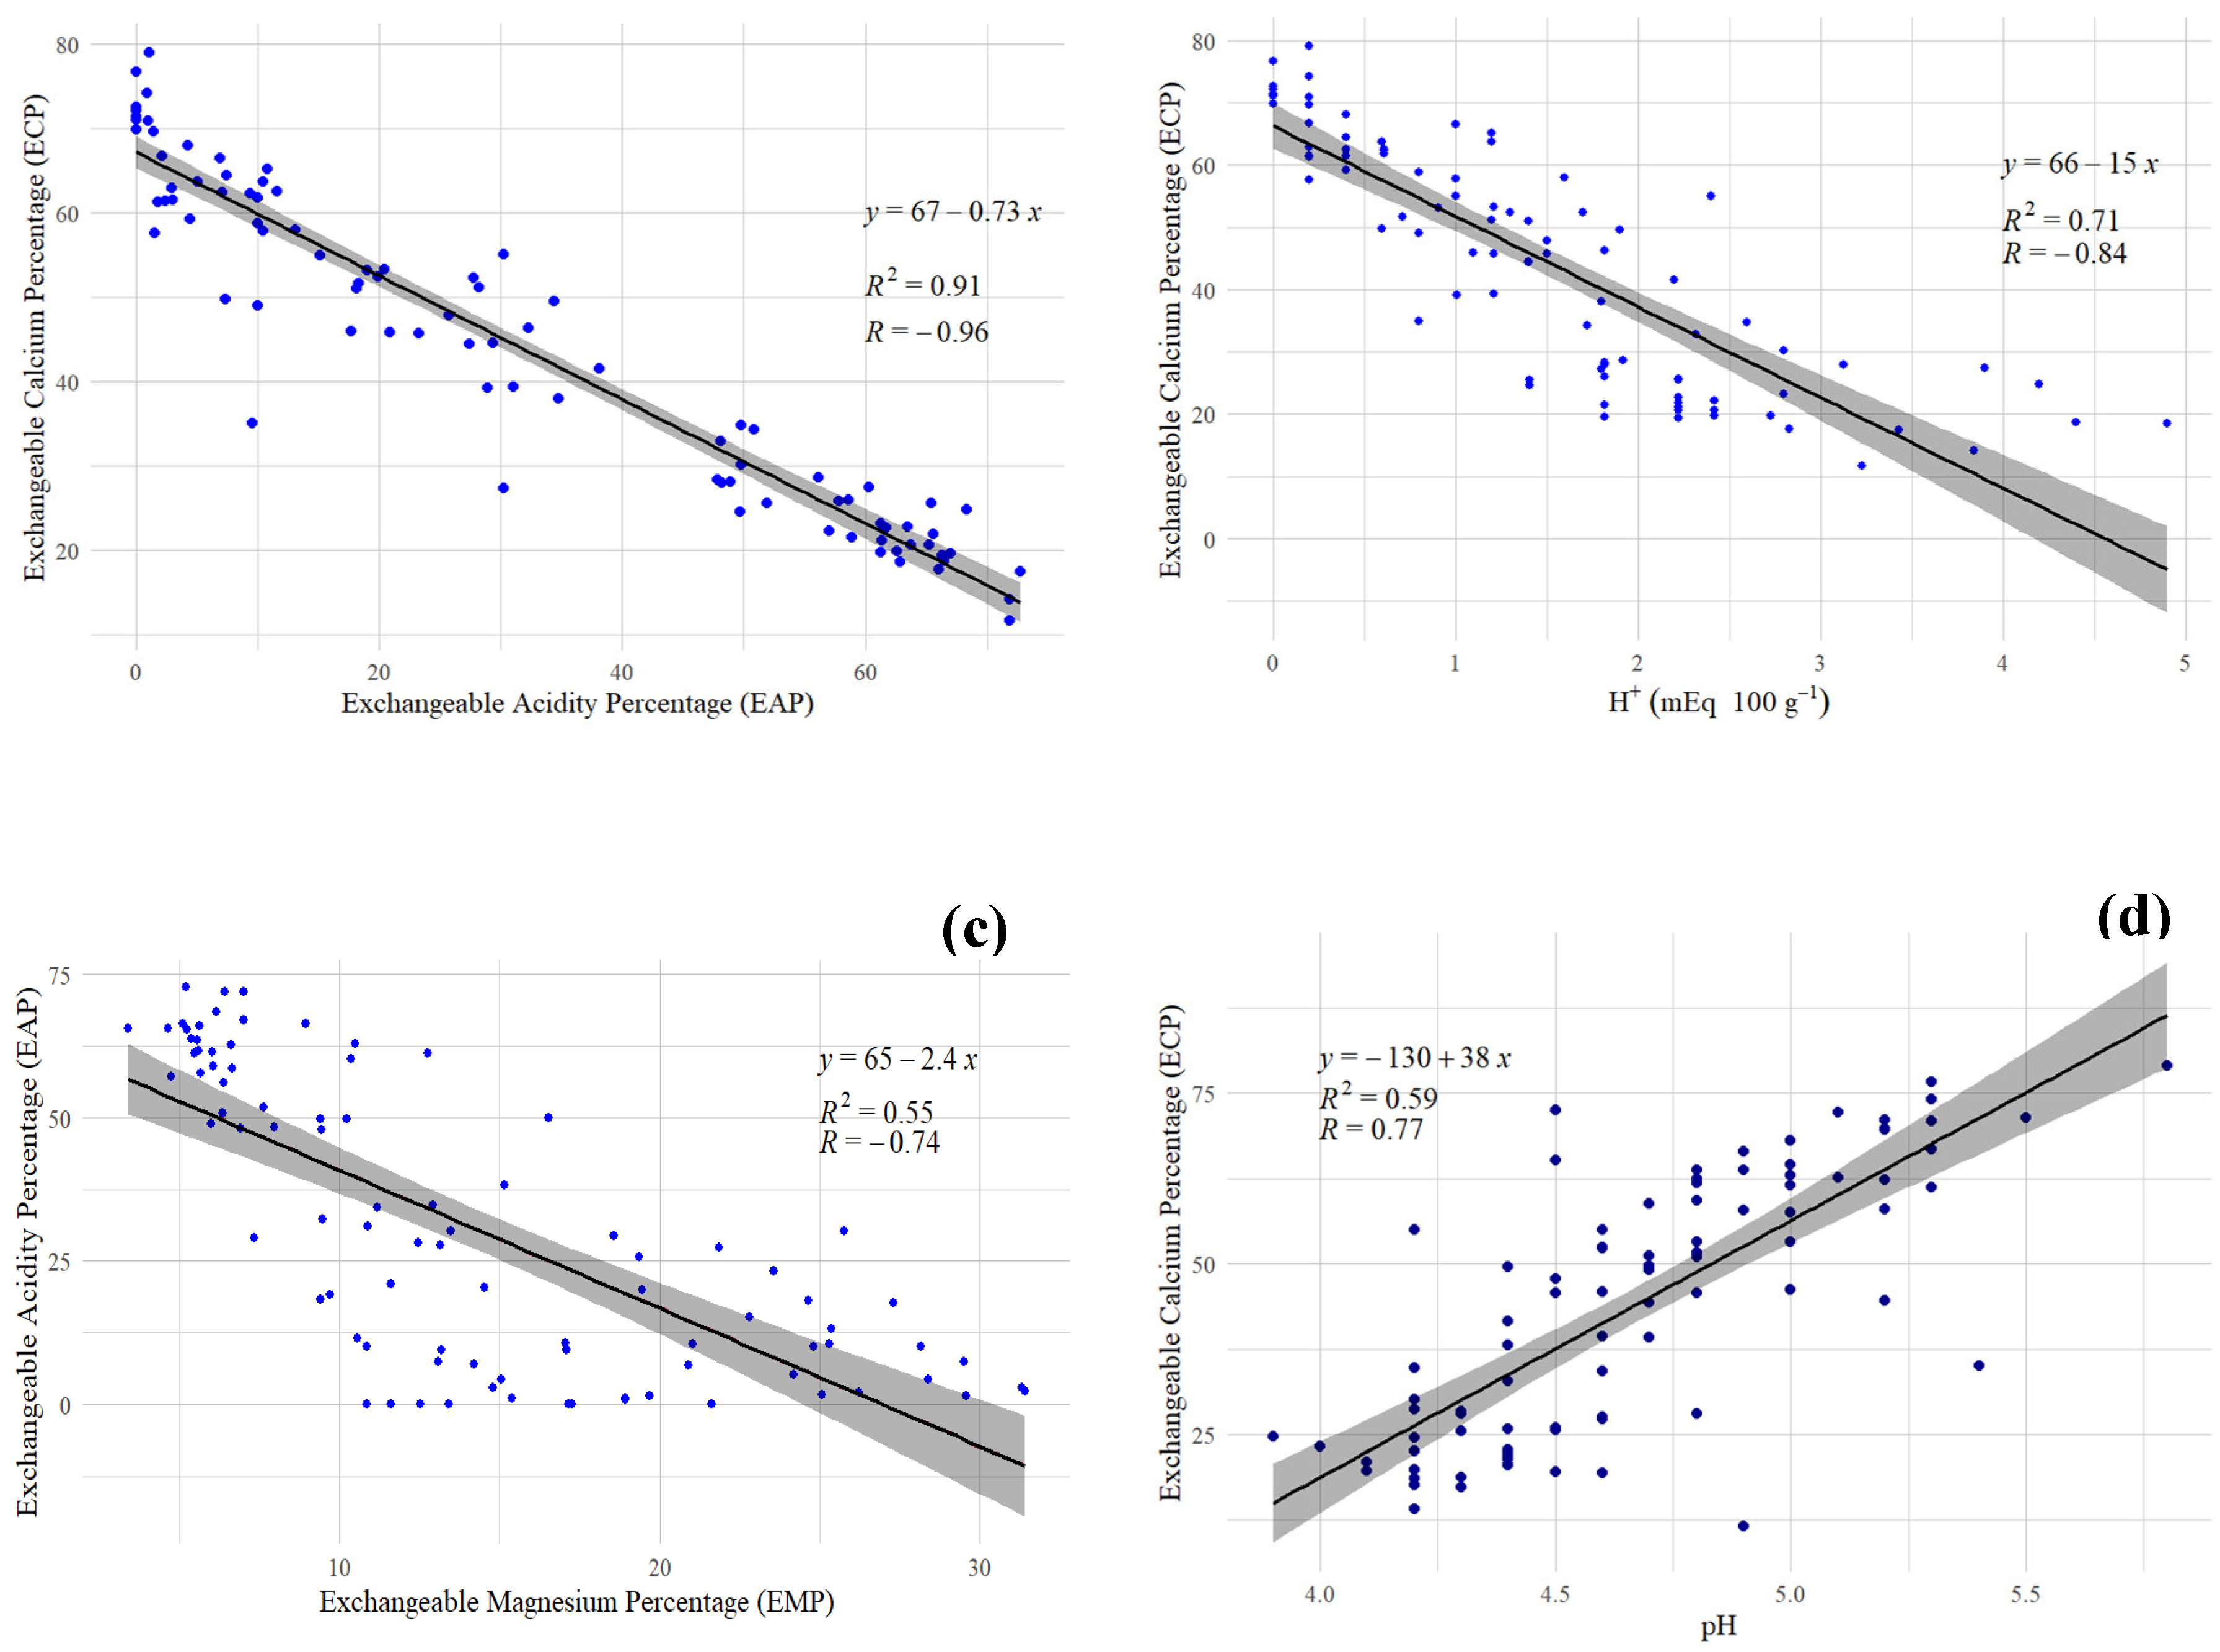
Figure 8.
Soil exchangeable acidity in the communities of Pachitea.
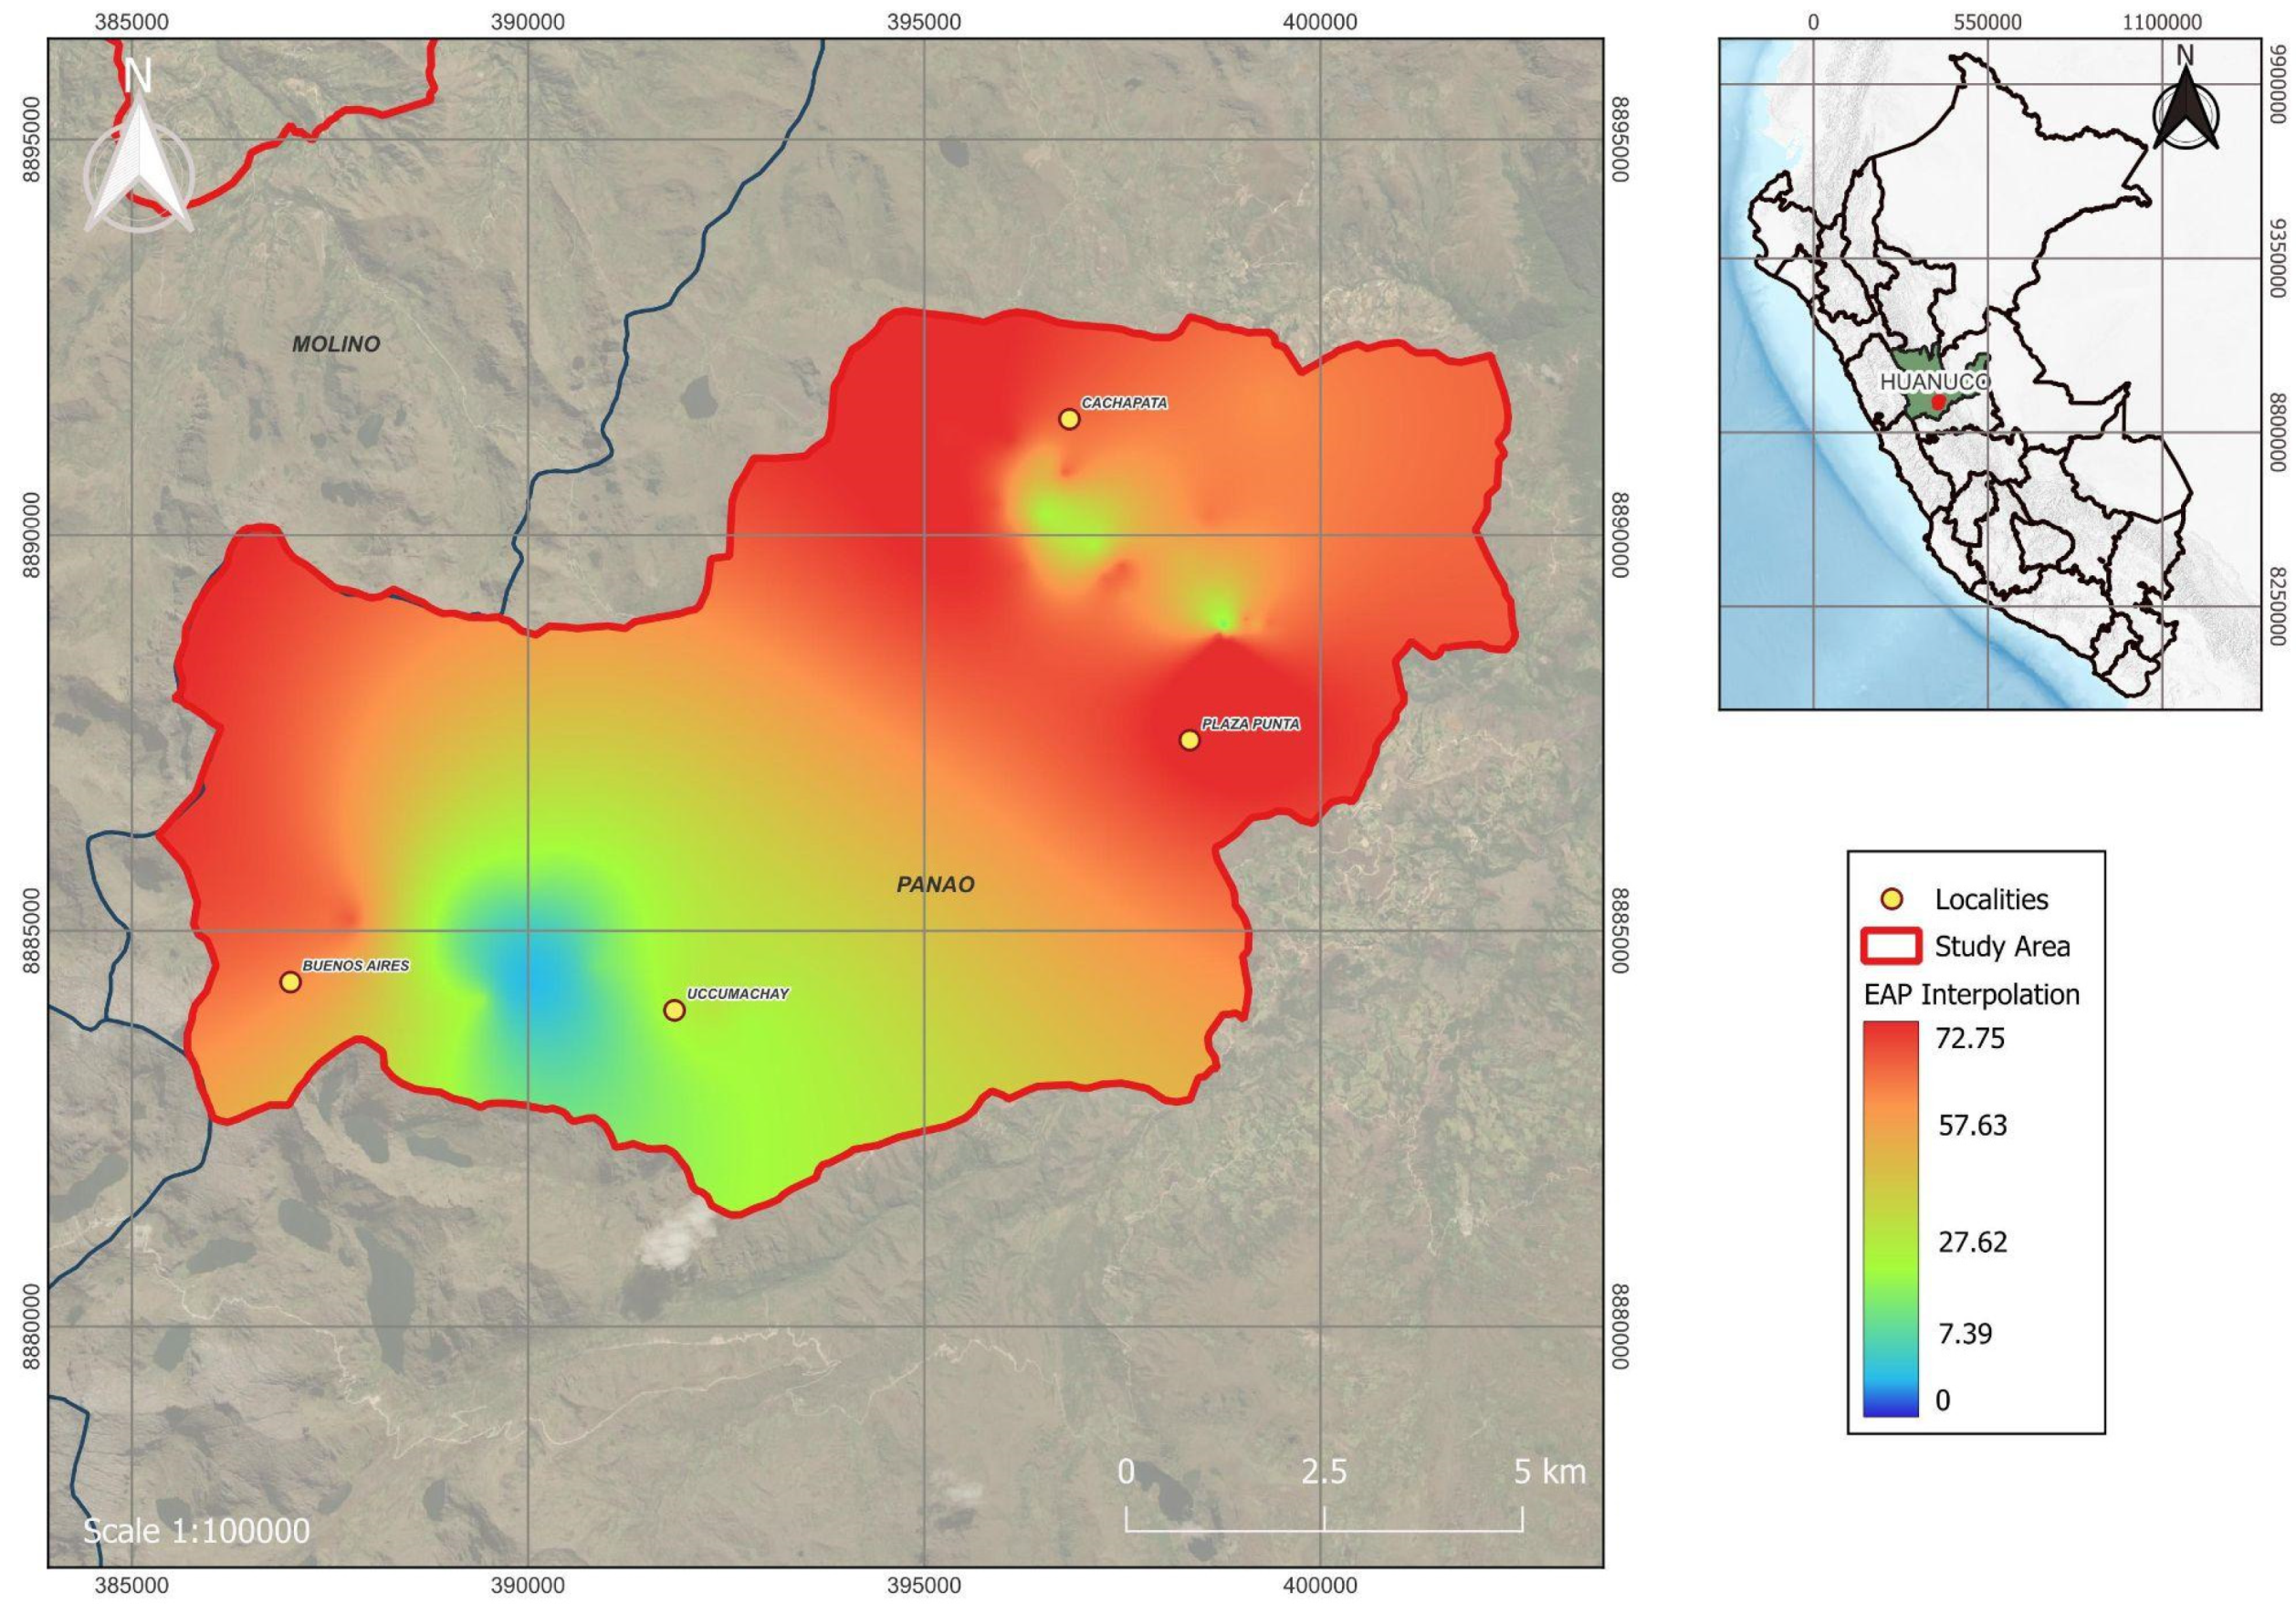
Figure 9.
Soil exchangeable calcium in the communities of Pachitea.
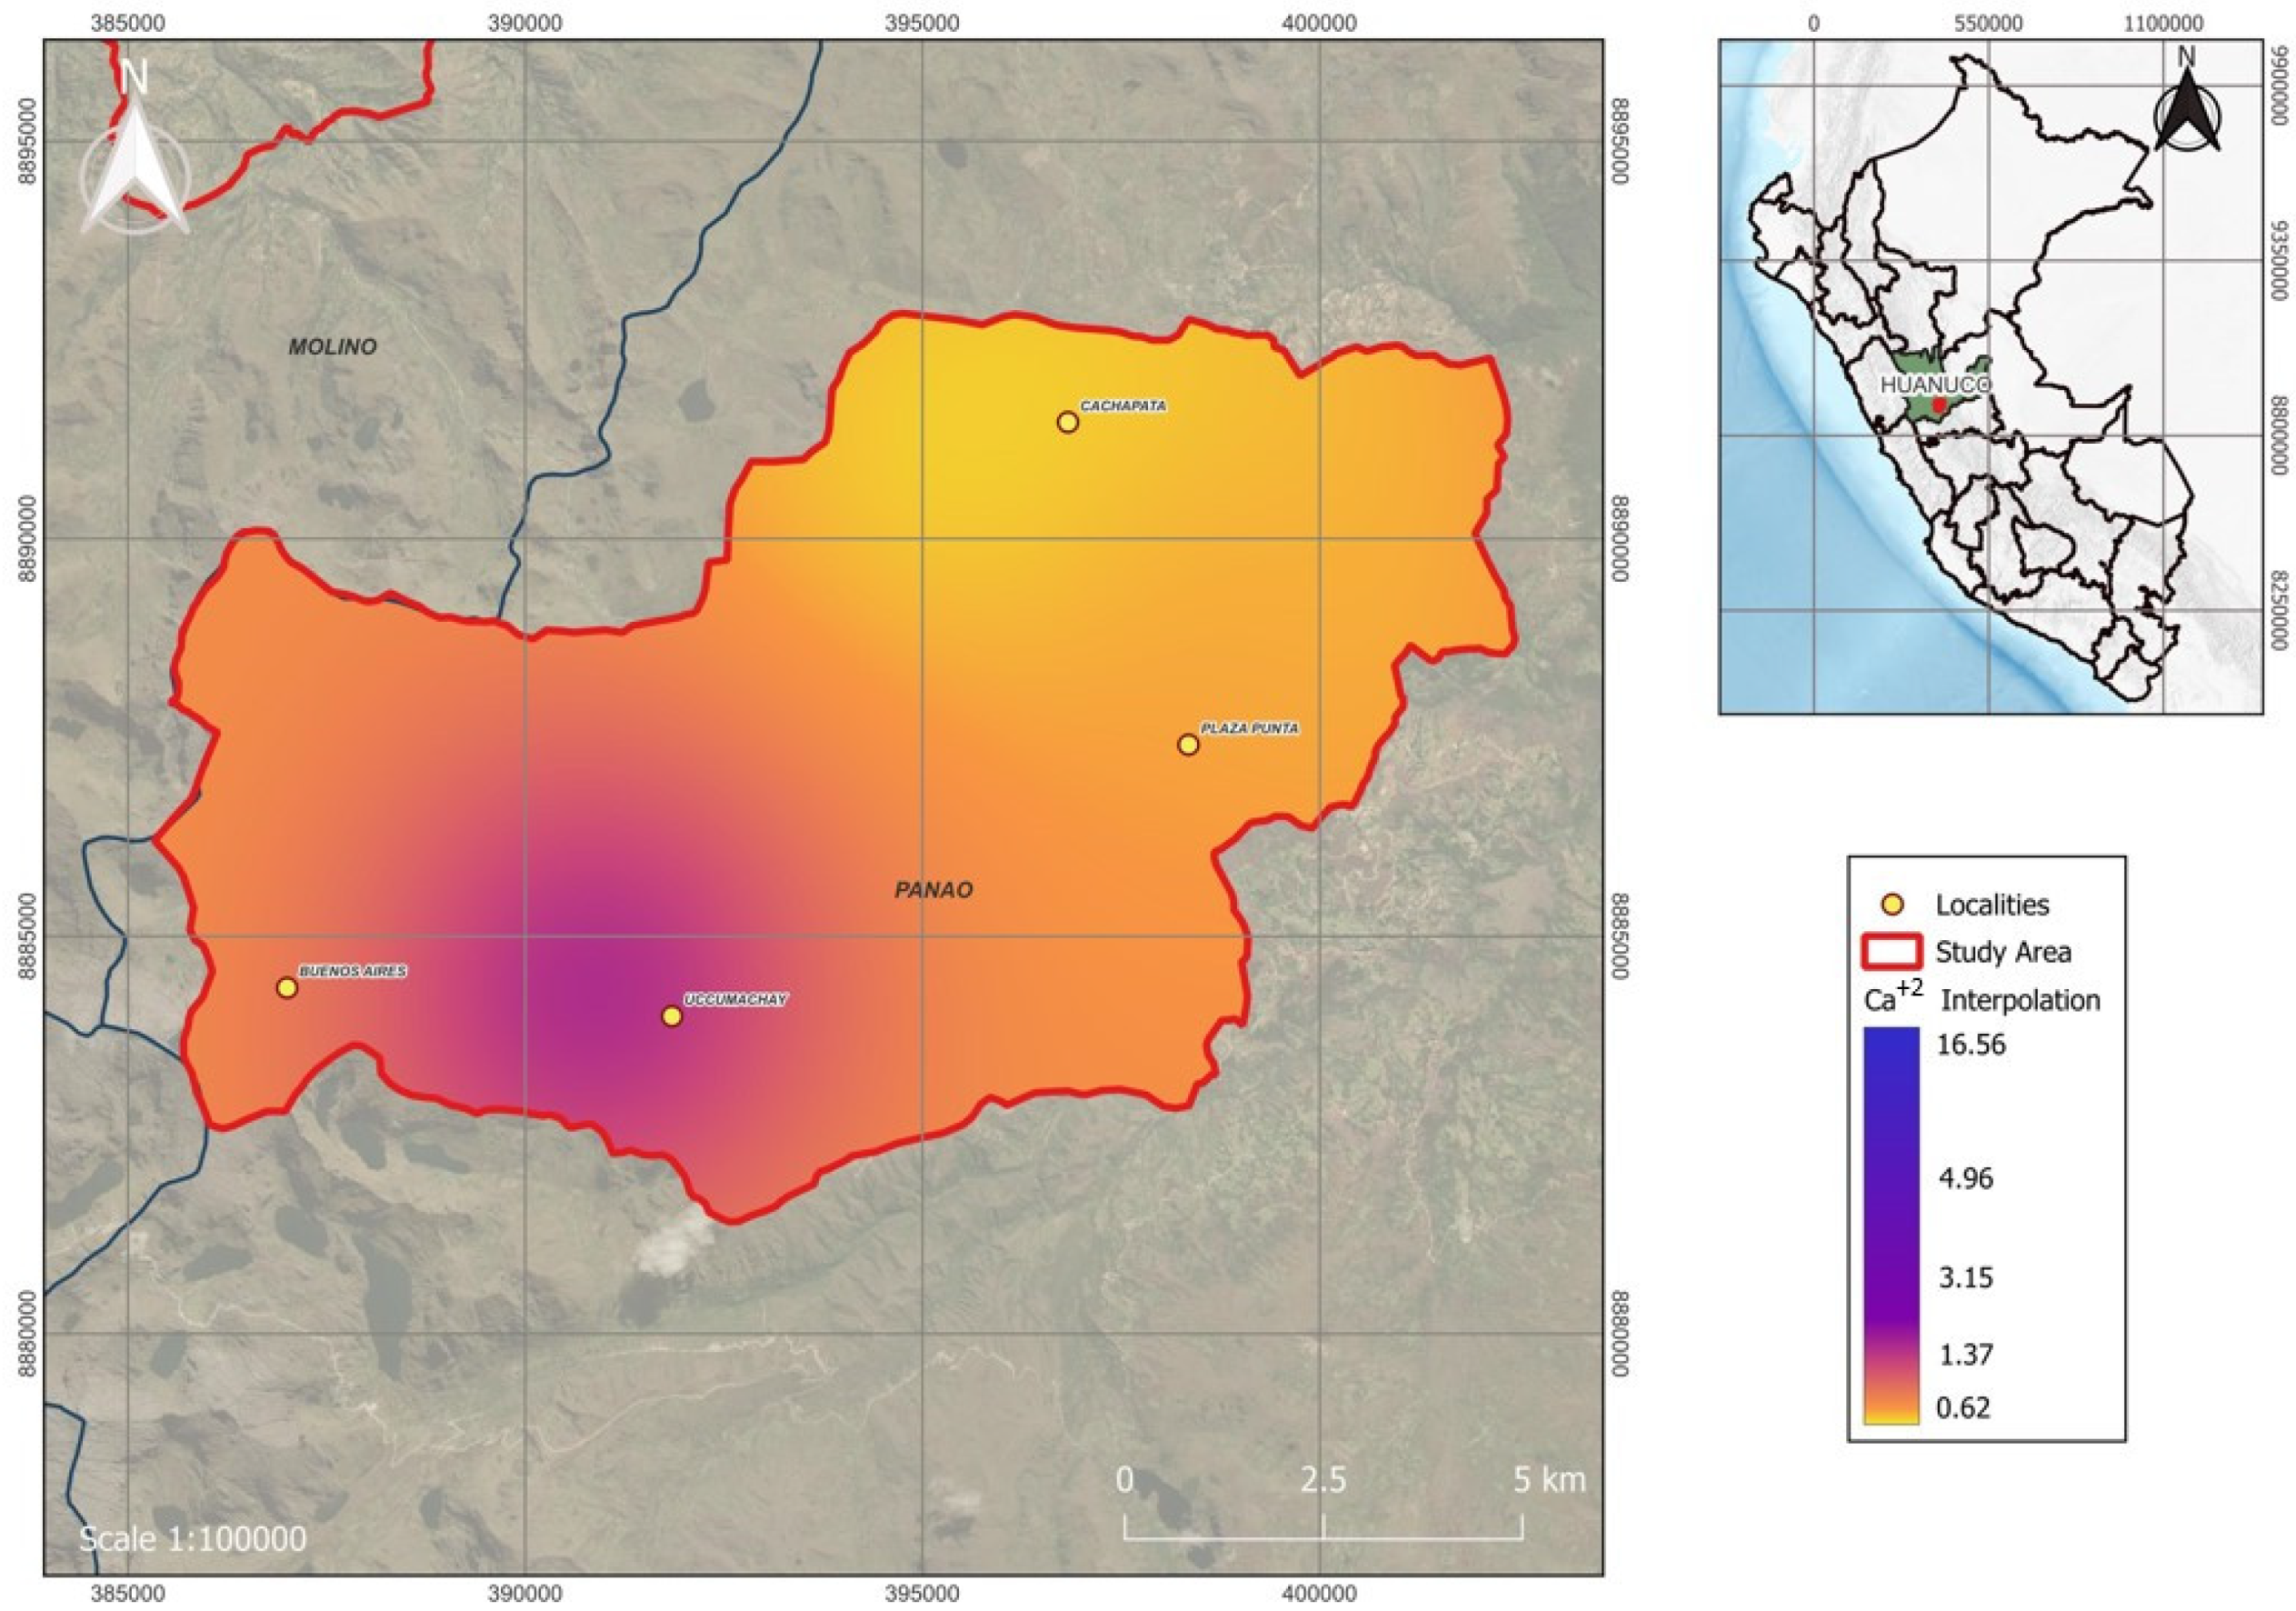
Figure 10.
Soil exchangeable magnesium in the communities of Pachitea.
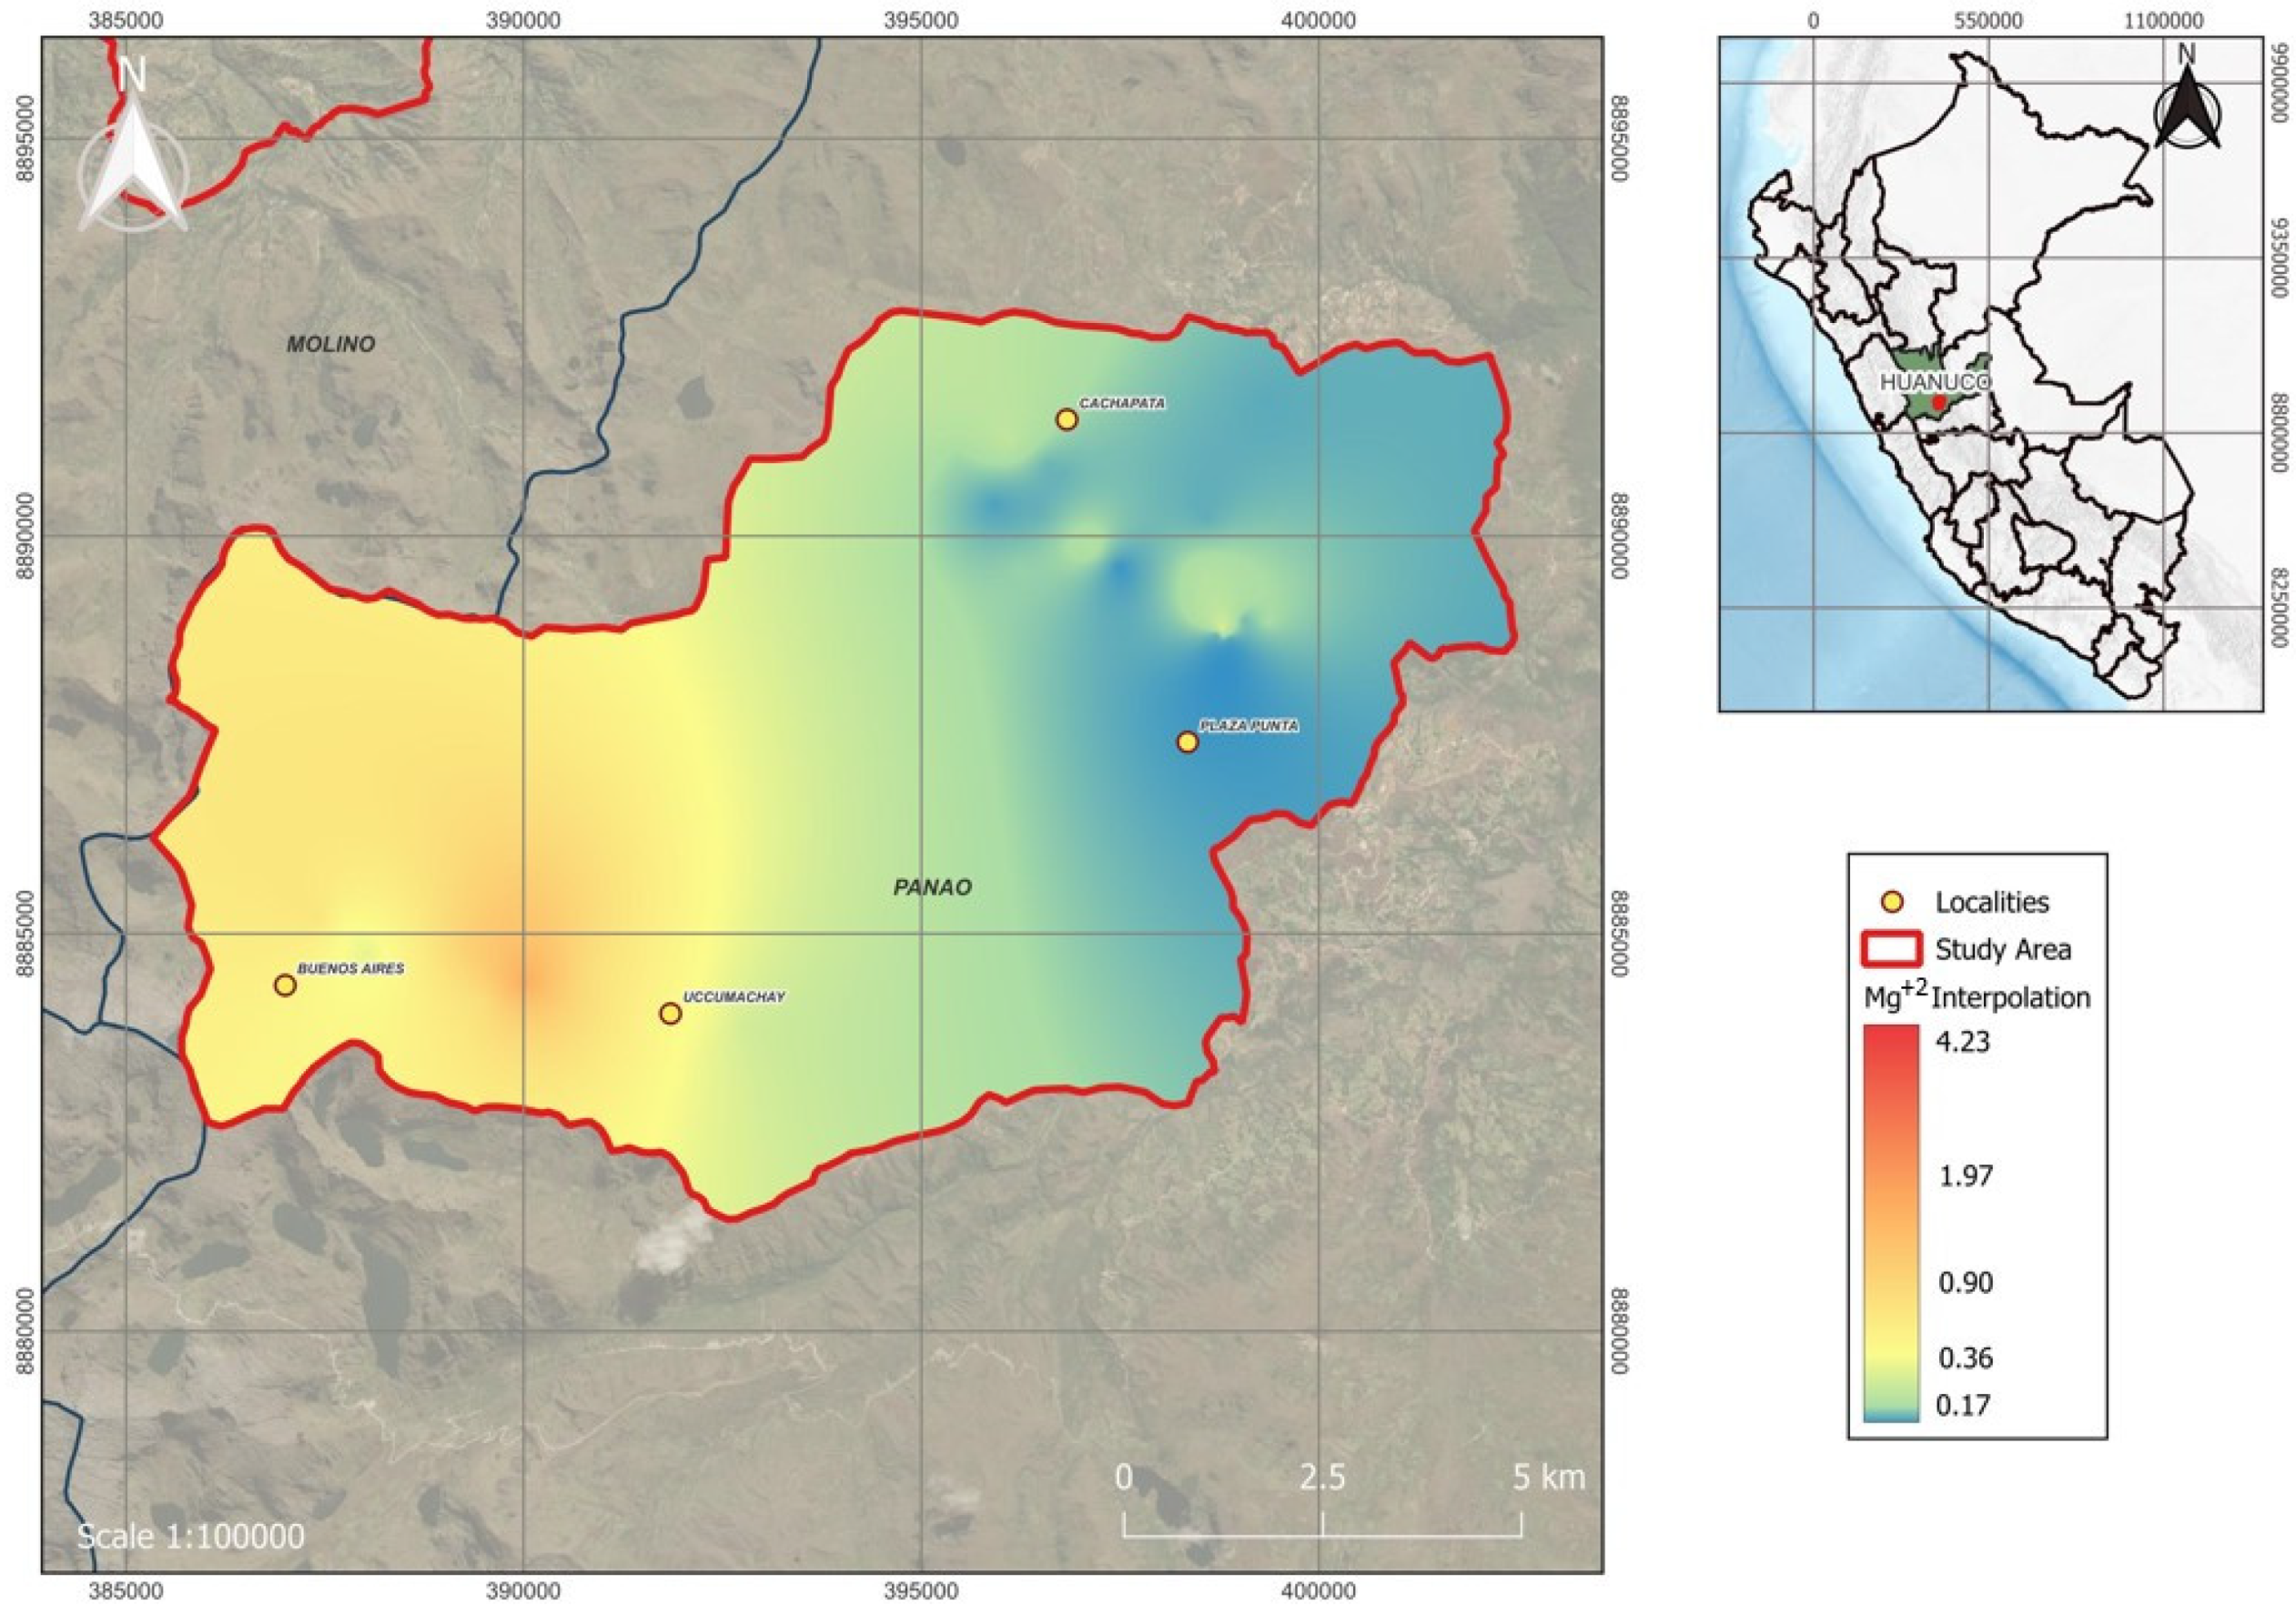
Figure 11.
Soil bulk density in the communities of Pachitea.

Figure 12.
Soil’s exchangeable magnesium percentage in the communities of Pachitea.
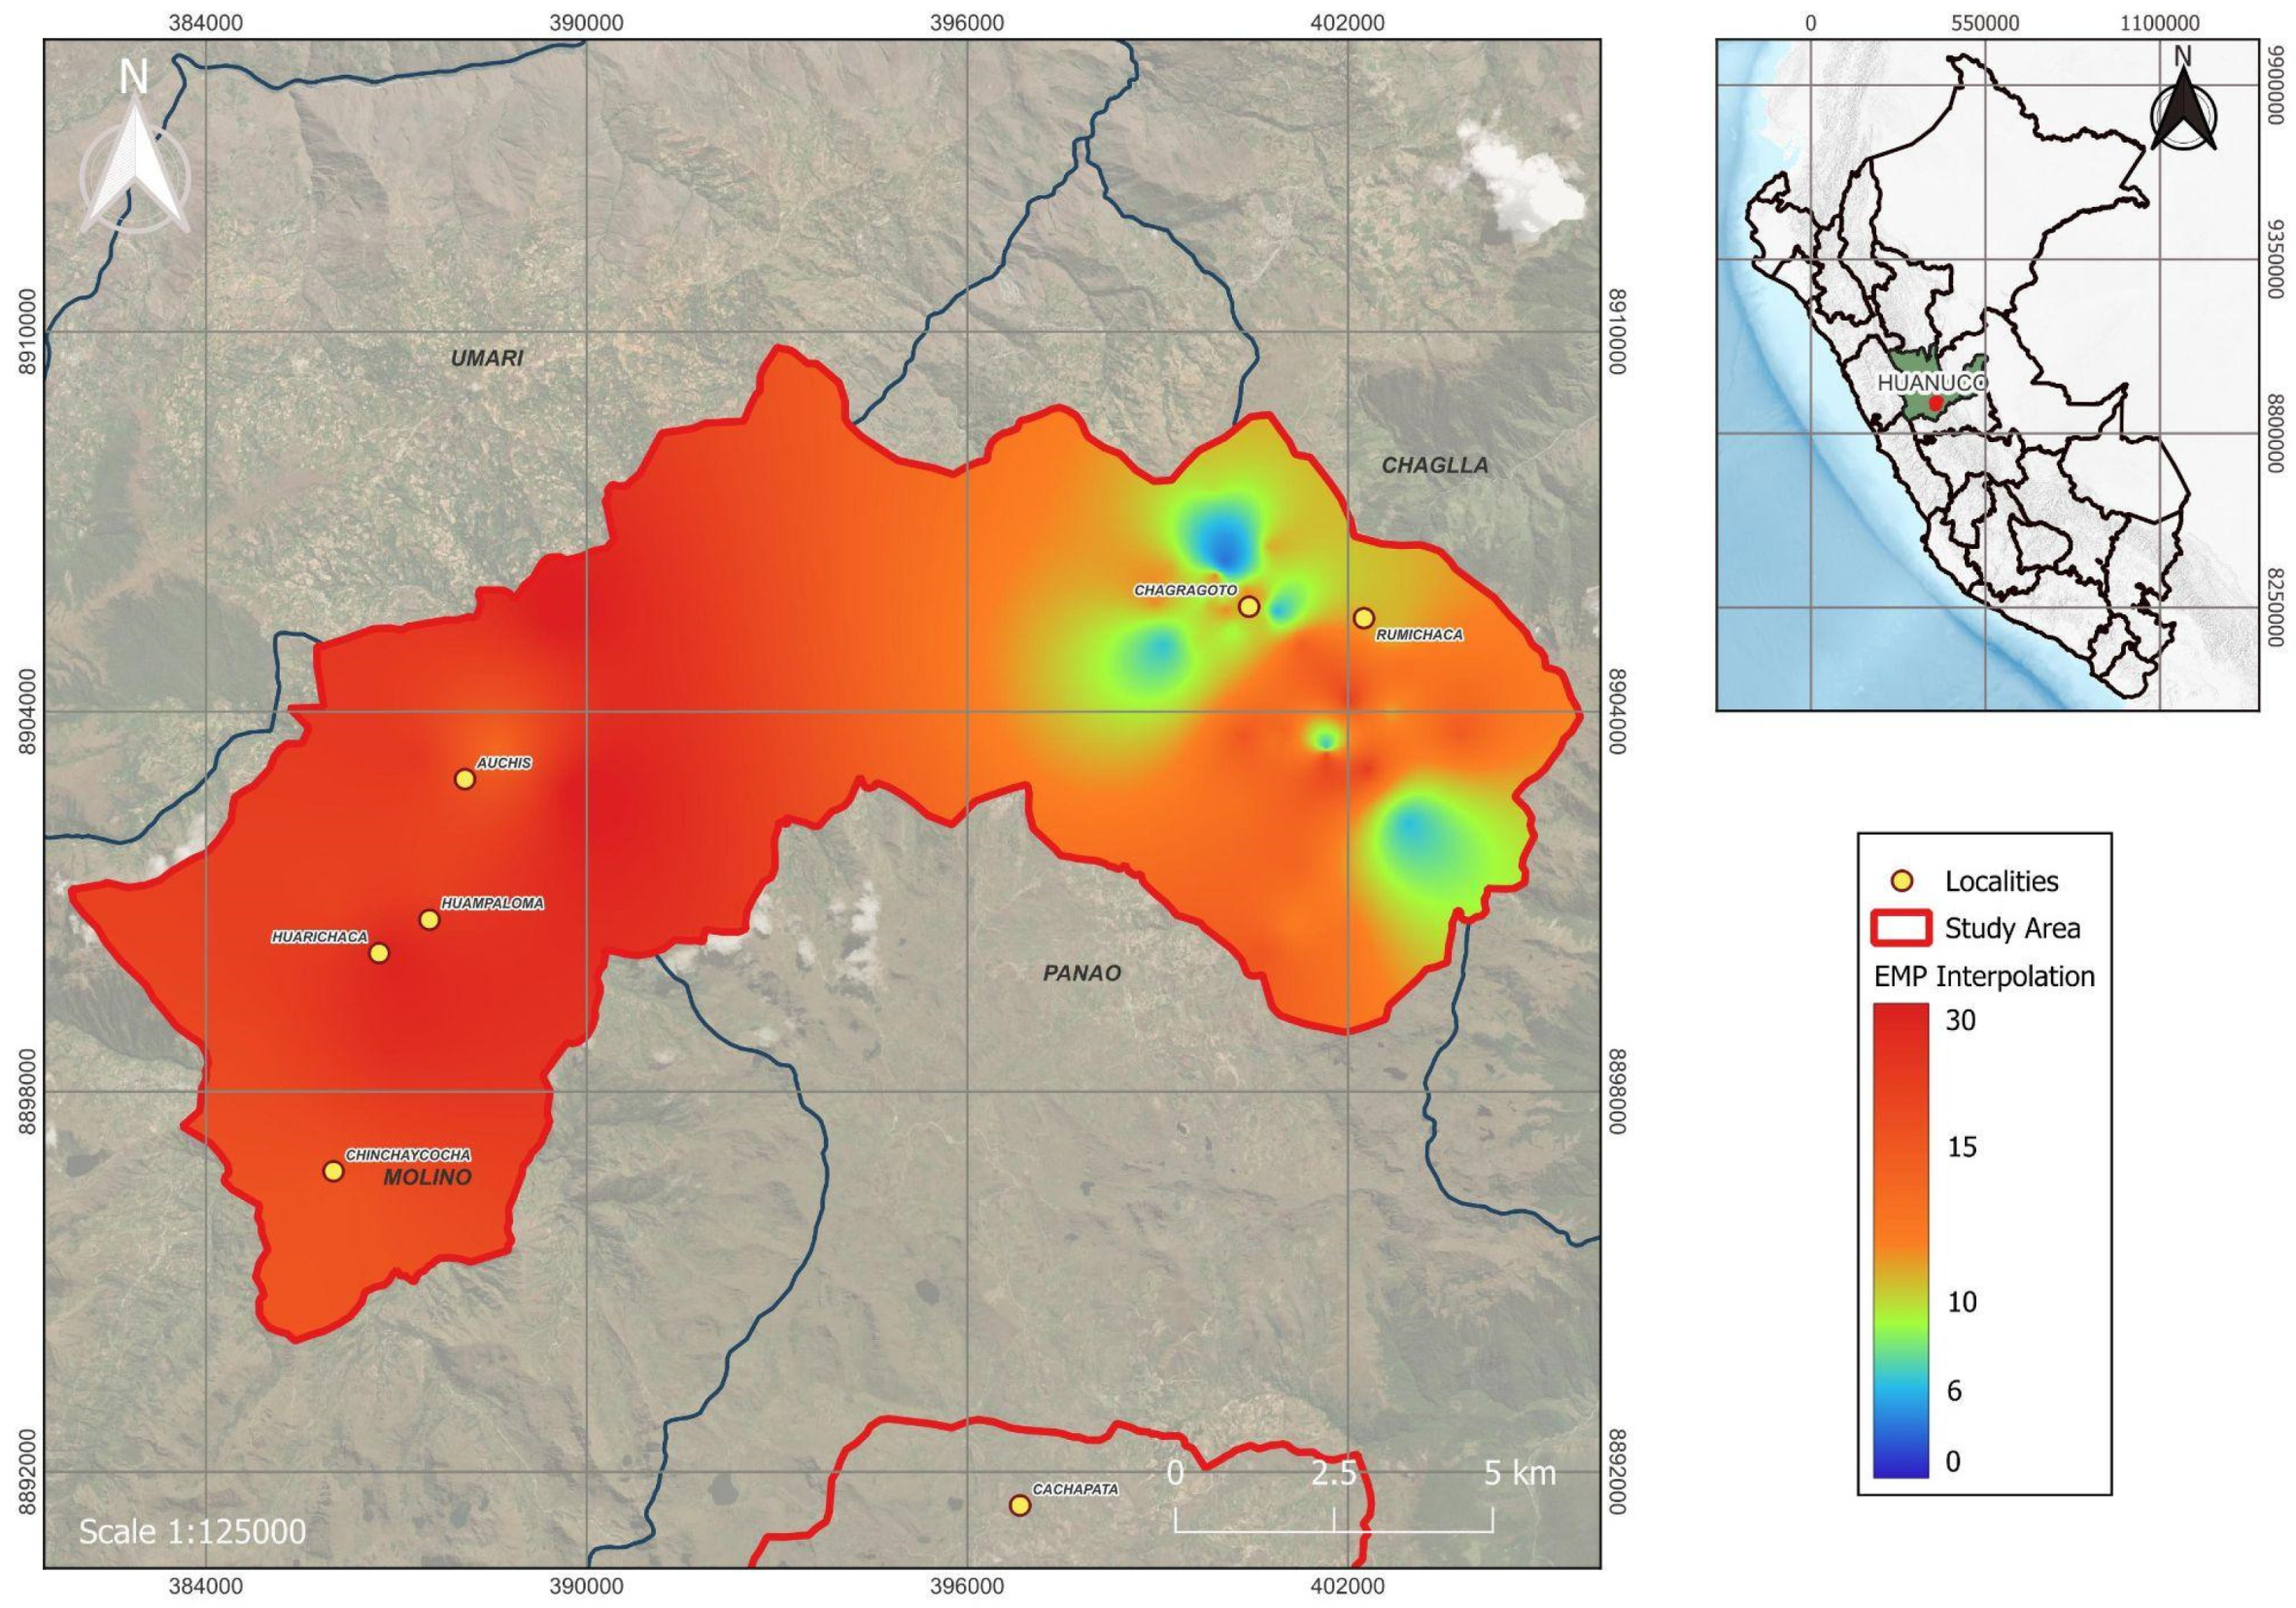
Figure 13.
Soil’s exchangeable potassium percentage in the communities of Pachitea.
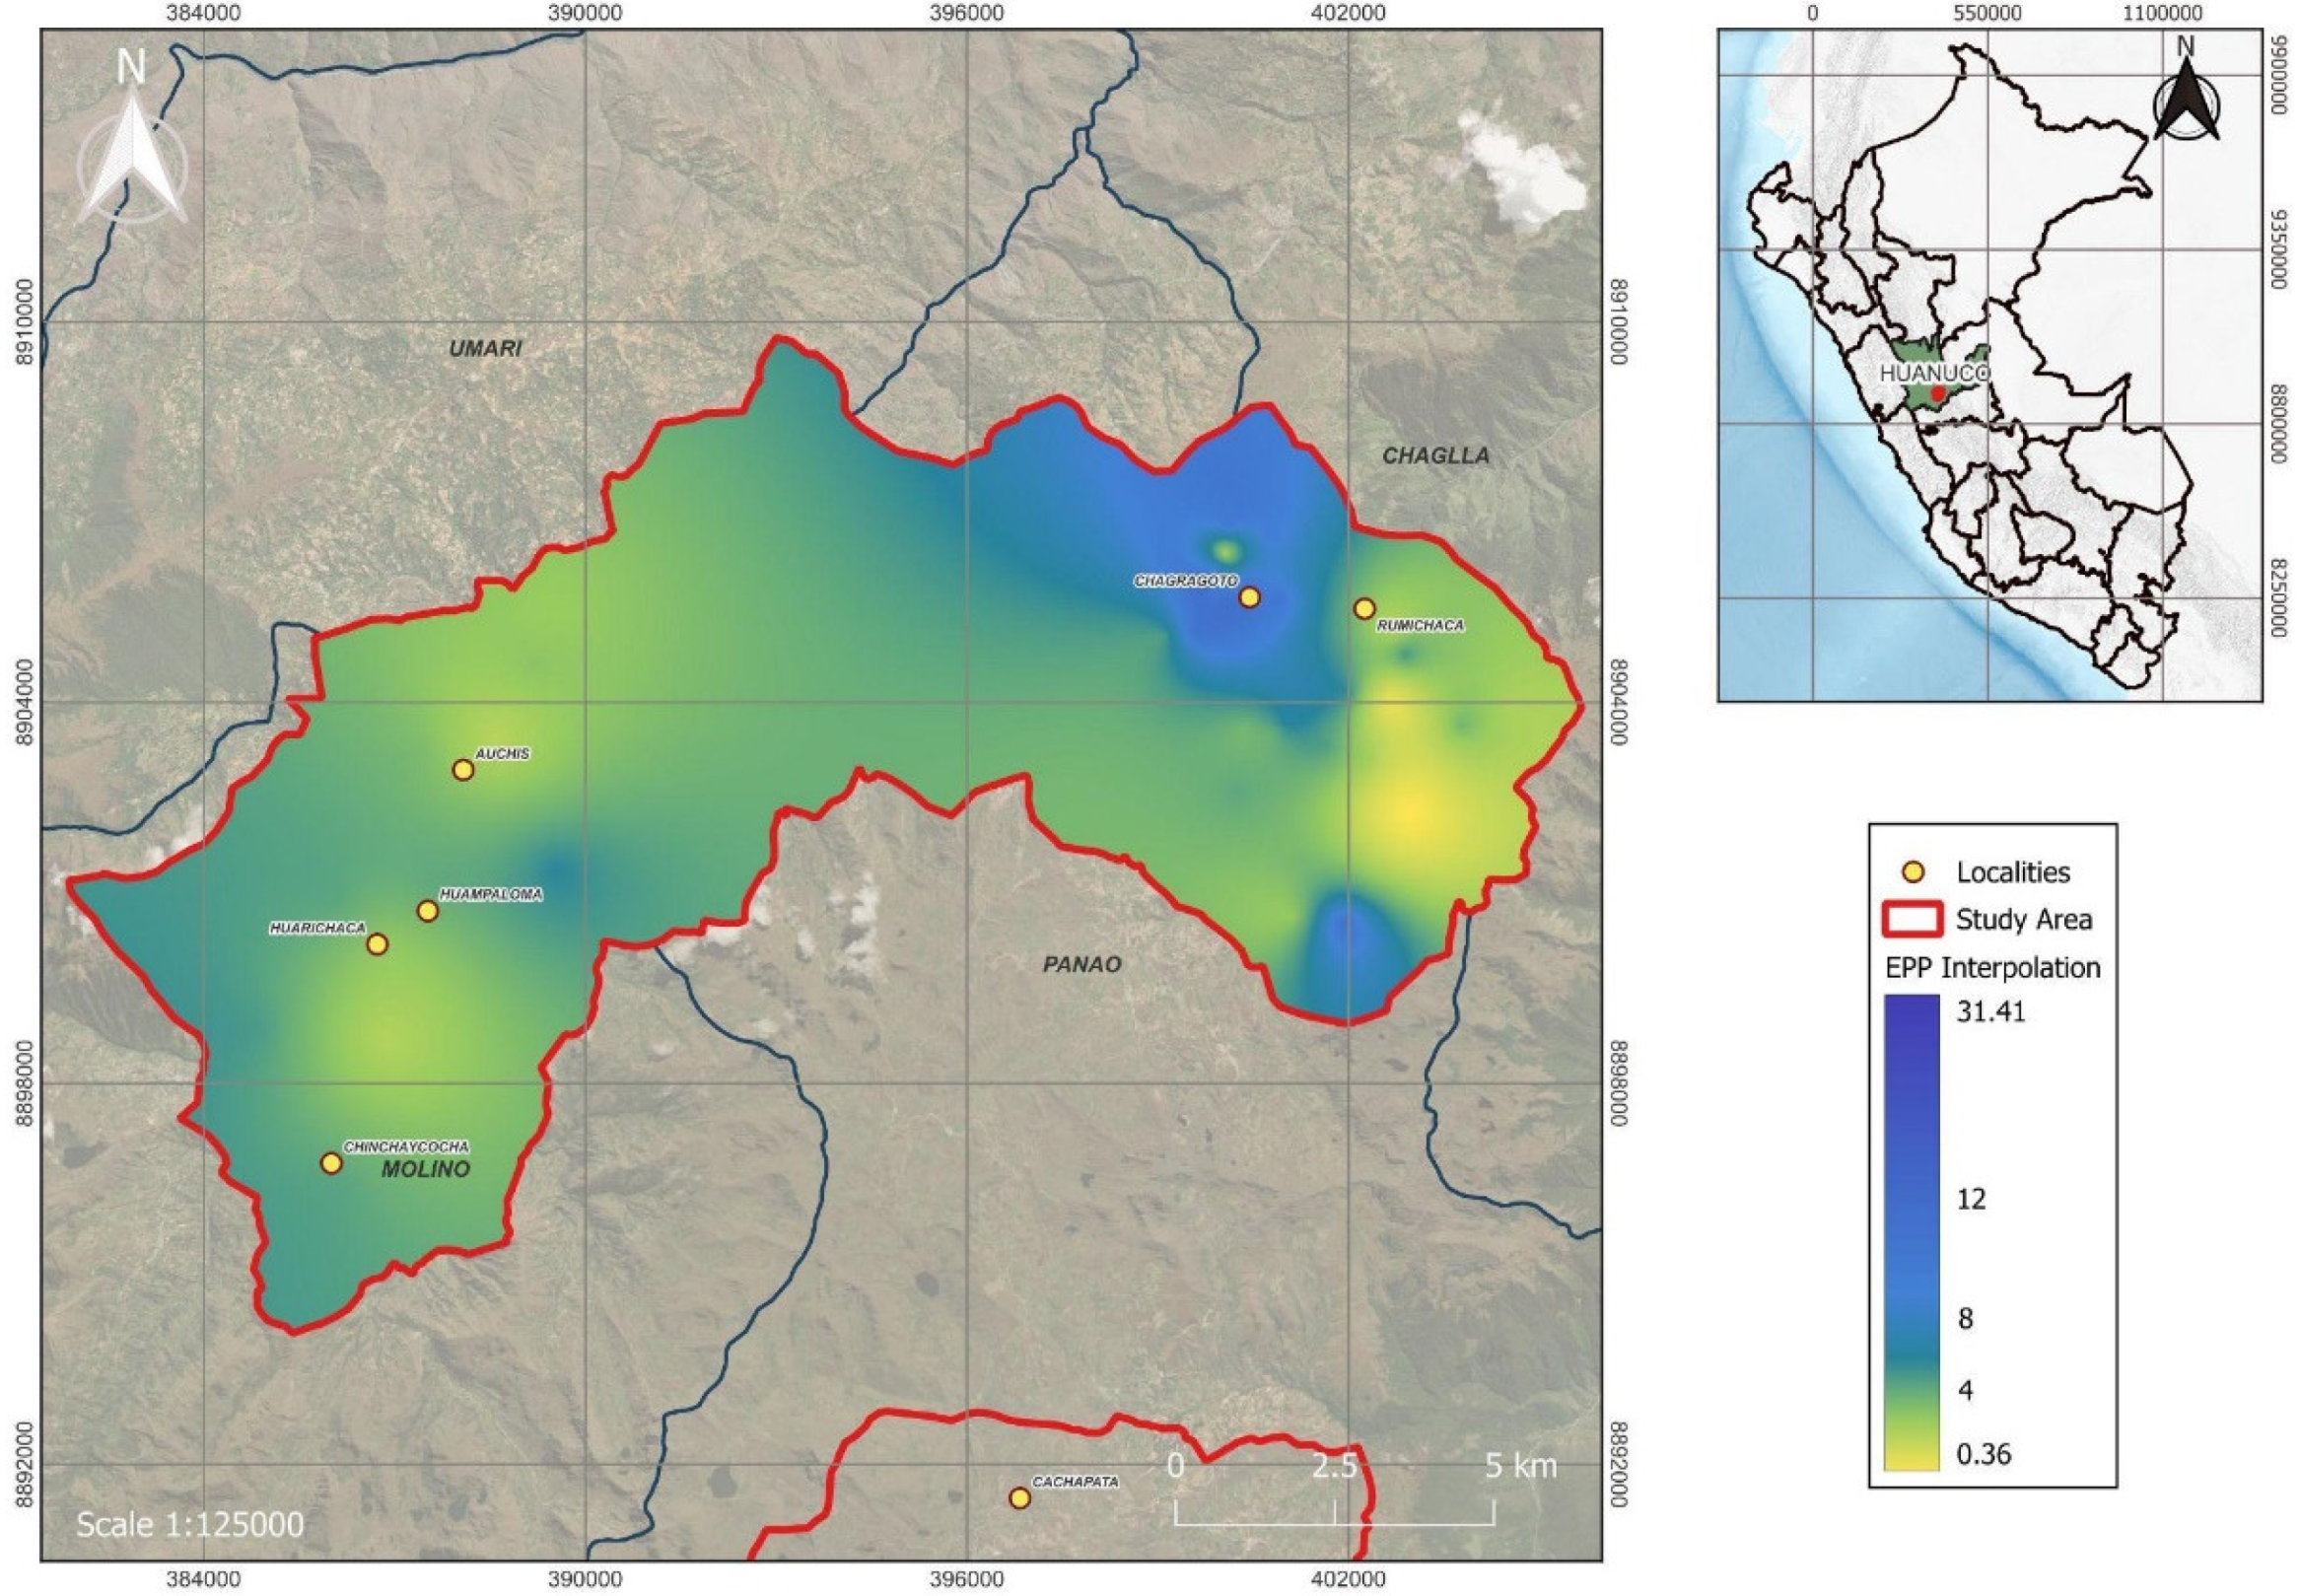
Figure 14.
Linear regression analysis between observed and predicted values of exchangeable calcium (a) observed values of exchangeable calcium; (b) predicted values of liming requirement (LR).
Figure 14.
Linear regression analysis between observed and predicted values of exchangeable calcium (a) observed values of exchangeable calcium; (b) predicted values of liming requirement (LR).
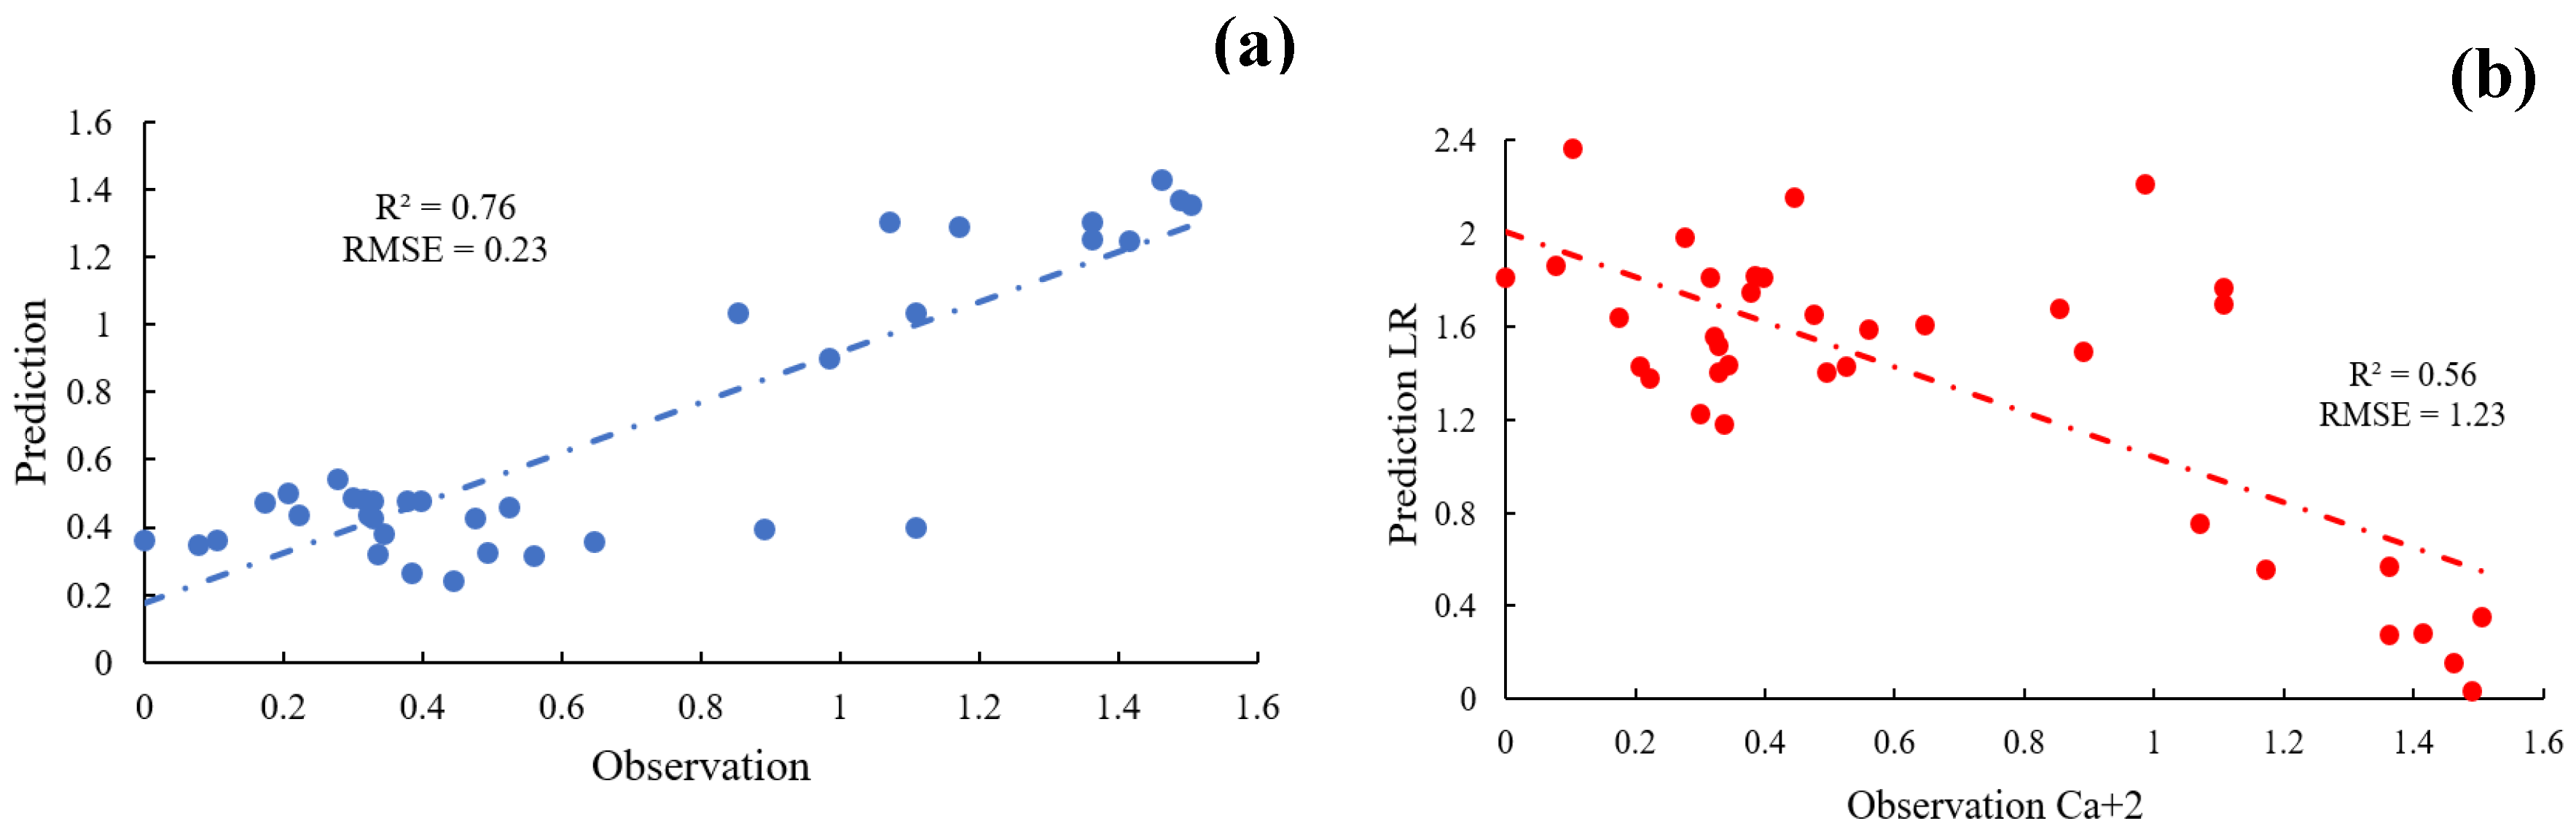
Figure 15.
Liming requirements in the communities of Pachitea.
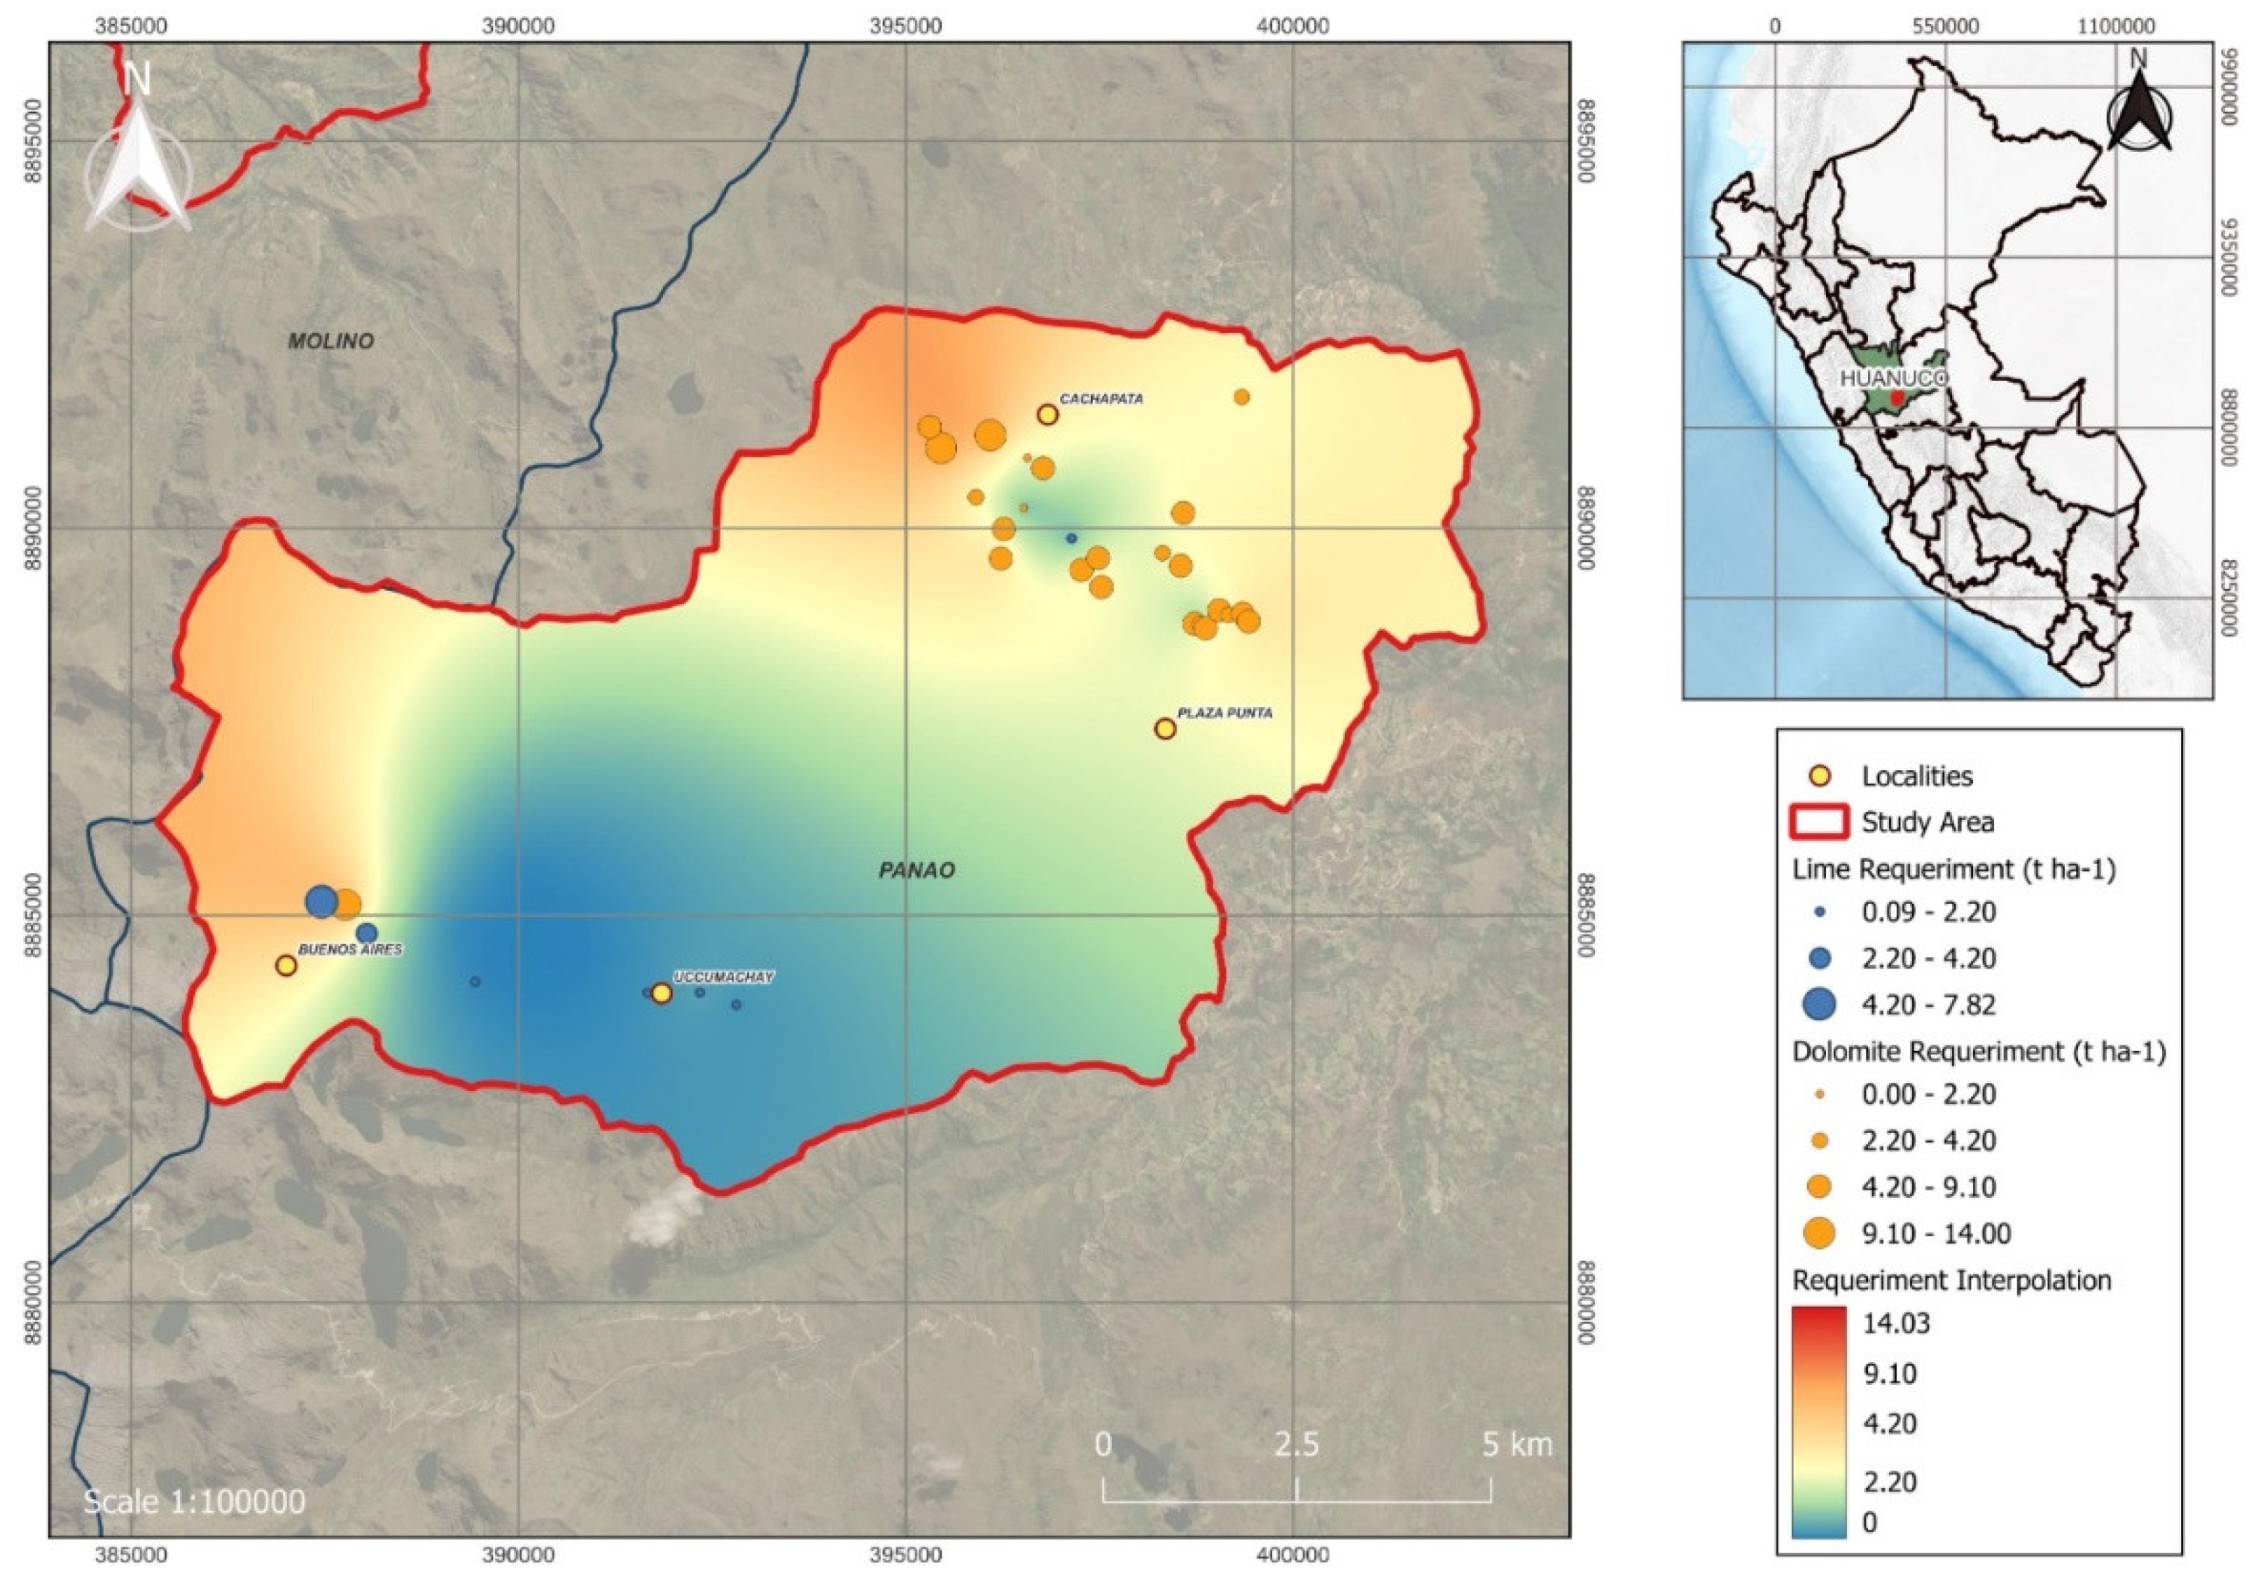

Table 1.
Descriptive statistics of soil’s physicochemical properties in the study area.
| Parameter | min | max | mean | median | var | sd |
|---|---|---|---|---|---|---|
| Sand (%) | 42.00 | 94.00 | 70.75 | 70.00 | 157.06 | 12.53 |
| Silt (%) | 1.00 | 37.00 | 15.52 | 15.42 | 43.38 | 6.59 |
| Clay (%) | 0.27 | 35.00 | 13.77 | 11.00 | 80.11 | 8.95 |
| pH | 3.90 | 5.80 | 4.69 | 4.60 | 0.16 | 0.39 |
| OM (%) | 1.00 | 32.90 | 9.16 | 7.40 | 47.32 | 6.88 |
| EC (dS∙m-1) | 0.01 | 0.80 | 0.09 | 0.06 | 0.01 | 0.11 |
| P (mg∙kg-1) | 0.00 | 478.98 | 41.60 | 26.30 | 3494.27 | 59.11 |
| K (mg∙kg-1) | 29.99 | 616.00 | 183.70 | 169.80 | 12267.40 | 110.76 |
| CEC (mEq∙100 g-1) | 2.85 | 22.33 | 7.96 | 7.30 | 14.72 | 3.84 |
| H+ (mEq∙100 g-1) | 0.00 | 4.90 | 1.49 | 1.40 | 1.23 | 1.11 |
| Al+3 (mEq∙100 g-1) | 0.00 | 3.40 | 0.55 | 0.30 | 0.55 | 0.74 |
| Acidity (mEq∙100 g-1) | 0.00 | 7.80 | 2.04 | 1.80 | 3.25 | 1.80 |
| Ca+2 (mEq∙100 g-1) | 0.62 | 16.56 | 3.91 | 3.10 | 10.49 | 3.24 |
| Mg+2 (mEq∙100 g-1) | 0.17 | 4.23 | 1.27 | 0.85 | 1.15 | 1.07 |
| K+ (mEq∙100 g-1) | 0.04 | 1.65 | 0.58 | 0.51 | 0.11 | 0.33 |
| Na+ (mEq∙100 g-1) | 0.00 | 1.80 | 0.16 | 0.10 | 0.06 | 0.25 |
| ECP (%) | 11.63 | 78.99 | 44.57 | 45.95 | 364.56 | 19.09 |
| EMP (%) | 3.40 | 31.41 | 14.12 | 12.74 | 58.35 | 7.64 |
| EPP (%) | 0.36 | 21.68 | 8.15 | 6.61 | 22.10 | 4.70 |
| ESP (%) | 0.00 | 21.49 | 2.22 | 2.01 | 8.07 | 2.84 |
| EAP (%) | 0.00 | 72.75 | 30.94 | 27.82 | 618.73 | 24.87 |
Table 2.
Semivariogram models for the soil properties in the localities of Plaza Punta and Buenos Aires.
Table 2.
Semivariogram models for the soil properties in the localities of Plaza Punta and Buenos Aires.
| Soil Property | Model | Nugget (C0) | Sill (C0+C) | Range (m) | PSV (C / C0+C) |
Cross-validation | |
|---|---|---|---|---|---|---|---|
| 1R2 | 2RMSE | ||||||
| pH | Exponential | 0.0045 | 0.0387 | 7155.83 | 0.1161 | 0.20 | 0.1582 |
| P (mg∙kg-1) | Gaussian | 1.3691 | 2.3057 | 7155.83 | 0.5938 | 0.11 | 1.2467 |
| K (mg∙kg-1) | Gaussian | 1.7494 | 0.1700 | 7155.83 | 10.2925 | 0.26 | 1.1112 |
| EC (dS∙m-1) | Linear | 0.0000 | 0.0000 | 7155.83 | 0.0000 | 0.36 | 0.0388 |
| OM (%) | Cubic | 0.3263 | 0.5905 | 7155.83 | 0.5526 | 0.31 | 0.6909 |
| H+ (mEq∙100 g-1) | Gaussian | 0.2938 | 2.0557 | 7155.83 | 0.1429 | 0.43 | 0.6984 |
| Al+3 (mEq∙100 g-1) | Linear | 0.0000 | 0.0000 | 7155.83 | 0.0000 | 0.60* | 0.2301 |
| Acidity (mEq∙100 g-1) | Linear | 0.0000 | 0.0000 | 7155.83 | 0.0000 | 0.46 | 0.4068 |
| CIC (mEq∙100 g-1) | Linear | 0.0000 | 0.0000 | 7155.83 | 0.0000 | 0.51 | 0.4446 |
| Ca+2 (mEq∙100 g-1) | Gaussian | 0.0343 | 0.1405 | 7155.83 | 0.2442 | 0.76* | 0.2280 |
| Mg+2 (mEq∙100 g-1) | Linear | 0.0000 | 0.0000 | 7155.83 | 0.0000 | 0.87* | 0.1170 |
| K+ (mEq∙100 g-1) | Linear | 0.0234 | 0.0000 | 7155.83 | 0.0000 | 0.38 | 0.2630 |
| Na+ (mEq∙100 g-1) | Linear | 0.0000 | 0.0000 | 7155.83 | 0.0000 | 0.69 | 0.0411 |
| BD (g∙cm-3) | Linear | 0.0008 | 0.0000 | 7155.83 | 0.0000 | 0.44 | 0.0416 |
| EAP (%) | Linear | 0.0000 | 0.0000 | 7155.83 | 0.0000 | 0.53* | 0.6665 |
| ECP (%) | Linear | 0.0000 | 0.0000 | 7155.83 | 0.0000 | 0.57* | 0.5826 |
| EMP (%) | Linear | 0.1844 | 0.0000 | 7155.83 | 0.0000 | 0.44 | 0.5295 |
| EPP (%) | Linear | 0.1844 | 0.0000 | 7155.83 | 0.0000 | 0.44 | 0.5295 |
| ESP (%) | Linear | 0.0000 | 0.0000 | 7155.83 | 0.0000 | 0.42 | 0.3157 |
| Liming (t∙ha-1) | Linear | 0.0975 | 0.0000 | 7155.83 | 0.0000 | 0.52* | 0.5972 |
1coefficient of determination; 2root-mean-square error; *Selected variables with higher R2, due to a high fit degree between the observed and predicted values, are shown with uppercase asterisks.
Table 3.
Semivariogram models for the soil properties in the localities of Huarichaca, Chagragoto, and Rumichaca.
Table 3.
Semivariogram models for the soil properties in the localities of Huarichaca, Chagragoto, and Rumichaca.
| Soil Property | Model | Nugget (C0) | Sill (C0+C) | Range (m) | PSV (C / C0+C) |
Cross-validation | |
|---|---|---|---|---|---|---|---|
| 1R2 | 2RMSE | ||||||
| pH | Exponential | 0.0307 | 0.0505 | 11349.19 | 0.6075 | 0.11 | 0.2096 |
| P (mg∙kg-1) | Linear | 0.0000 | 0.0000 | 11349.19 | 0.0000 | 0.27 | 1.3337 |
| K (mg∙kg-1) | Linear | 0.0000 | 0.0000 | 11349.19 | 0.0000 | 0.22 | 1.4363 |
| EC (dS∙m-1) | Linear | 0.0000 | 0.0000 | 11349.19 | 0.0000 | 0.51 | 0.0669 |
| OM (%) | Linear | 0.0000 | 0.0000 | 11349.19 | 0.0000 | 0.45 | 0.5599 |
| H+ (mEq∙100 g-1) | Linear | 0.1870 | 0.0000 | 11349.19 | 0.0000 | 0.37 | 0.5132 |
| Al+3 (mEq∙100 g-1) | Linear | 0.0000 | 0.0000 | 11349.19 | 0.0000 | 0.32 | 0.4610 |
| Acidity (mEq∙100 g-1) | Linear | 0.0000 | 0.0000 | 11349.19 | 0.0000 | 0.36 | 0.6046 |
| CIC (mEq∙100 g-1) | Linear | 0.0000 | 0.0000 | 11349.19 | 0.0000 | 0.43 | 0.6176 |
| Ca+2 (mEq∙100 g-1) | Gaussian | 0.4994 | 0.3408 | 11349.19 | 1.4656 | 0.39 | 0.7875 |
| Mg+2(mEq∙100 g-1) | Power | 0.0883 | 0.0000 | 11349.19 | 0.0000 | 0.18 | 0.3680 |
| K+ (mEq∙100 g-1) | Linear | 0.0558 | 0.0000 | 11349.19 | 0.0000 | 0.39 | 0.4773 |
| Na+ (mEq∙100 g-1) | Linear | 0.0000 | 0.0000 | 11349.19 | 0.0000 | 0.28 | 0.2053 |
| BD (g∙cm-3) | Gaussian | 0.0009 | 0.0042 | 11349.19 | 0.2180 | 0.79* | 0.0267 |
| EAP (%) | Linear | 2.1710 | 0.0000 | 11349.19 | 0.0000 | 0.16 | 1.7022 |
| ECP (%) | Linear | 1.1814 | 0.0000 | 11349.19 | 0.0000 | 0.28 | 1.1638 |
| EMP (%) | Linear | 0.0000 | 0.0000 | 11349.19 | 0.0000 | 0.54* | 0.4758 |
| EPP (%) | Linear | 0.0000 | 0.0000 | 11349.19 | 0.0000 | 0.54* | 0.4758 |
| ESP (%) | Spherical | 0.0684 | 0.6601 | 11349.19 | 0.1036 | 0.22 | 0.7406 |
| Liming (t∙ha-1) | linear | 0.7501 | 0.0000 | 11349.19 | 0.0000 | 0.30 | 1.0868 |
1coefficient of determination; 2root-mean-square error; *Selected variables with higher R2, due to a high fit degree between the observed and predicted values, are shown with uppercase asterisks.
Disclaimer/Publisher’s Note: The statements, opinions and data contained in all publications are solely those of the individual author(s) and contributor(s) and not of MDPI and/or the editor(s). MDPI and/or the editor(s) disclaim responsibility for any injury to people or property resulting from any ideas, methods, instructions or products referred to in the content. |
© 2024 by the authors. Licensee MDPI, Basel, Switzerland. This article is an open access article distributed under the terms and conditions of the Creative Commons Attribution (CC BY) license (http://creativecommons.org/licenses/by/4.0/).
Copyright: This open access article is published under a Creative Commons CC BY 4.0 license, which permit the free download, distribution, and reuse, provided that the author and preprint are cited in any reuse.


