
Submitted:
30 July 2025
Posted:
31 July 2025
You are already at the latest version
Abstract
This study analyses the potential of artificial neural networks (ANN) in accurately predicting potato yields based on 11 parameters characterising the soil environment. Accurate yield forecasting is crucial for optimising potato production, especially in the context of potato processing. Due to the significant impact of soil properties on yield, there is a need for comprehensive predictive models that take these factors into account. The field studies (2021-2024) included an analysis of soil parameters determining potato tuber yield. The developed ANN model was highly accurate, as evidenced by the following indicators: R² = 0.8227, RMSE = 4.19 t∙ha⁻¹, MAE = 3.35 t∙ha⁻¹, MAPE = 7.34%. Global sensitivity analysis showed that cation exchange capacity (CEC), base saturation percentage (V) and sum of exchangeable bases (S) are key parameters influencing tuber yield. The results indicate that neural networks are effective in modelling complex relationships between soil parameters and potato yield, and that soil properties play a fundamental role in increasing yields and improving potato quality. The approach used may contribute to optimising the nutrient content of potato tubers intended for French fry production. Future studies should include climate data and micronutrients to further improve predictive models.
Keywords:
yield prediction
; soil properties
; artificial neural network
; MAPE
; CEC
1. Introduction
The potato (Solanum tuberosum L.) remains one of the most important crops globally, playing a key role in ensuring food security and economic stability in many regions [1]. Population growth and changing climatic conditions pose a challenge to agriculture to increase agricultural production efficiency, including potato yields. [2]. Optimising potato cultivation for processing, particularly for French fries, is crucial to meeting the growing demand for high-quality food products. Effective yield prediction, taking into account the influence of various parameters: meteorological, phenological, and soil-related, is therefore becoming an indispensable tool in production planning and supply for the processing industry [3,4,5,6,7,8]. Accurate yield forecasting allows for the optimisation of production processes, minimisation of losses and ensuring a stable supply of raw materials with the appropriate quality parameters, which has a direct impact on the efficiency of potato processing into French fries [9,10].
The success of potato cultivation is strongly linked to soil quality and its physicochemical properties. Studies have shown that soil parameters such as potassium (K2O) and magnesium (Mg) content have a direct impact on tuber development and overall plant health [11]. Hydrolytic acidity, the total content of alkaline cations and the sorption capacity of the soil determine the availability of nutrients and the stability of soil pH, which is crucial for the proper growth of potatoes [12]. The granulometric composition of soil, including the content of sand, dust and clay, affects water retention and air permeability, which has a direct impact on root system development and nutrient uptake efficiency [13]. The organic carbon and humus content improves soil structure, increases its ability to retain water and nutrients, and stimulates soil biological activity, which translates into better conditions for plant growth [14]. In addition, the total nitrogen (N) content is essential for the synthesis of proteins and other organic compounds, which affects plant growth and development [15]. Deficiencies or excesses of these components can lead to serious physiological disorders, reduced resistance to diseases and pests, and a significant decrease in yields [16].
A thorough understanding of the soil environment is the foundation of sustainable potato crop management. Unlike traditional methods, which are based on average soil parameter values, modern precision farming systems use advanced technologies to monitor soil variability in space and time. Measuring soil fertility in key nutrients such as nitrogen, phosphorus and potassium is essential for optimising fertilisation and ensuring suitable growing conditions for plants. Taking soil variability into account and adapting fertilisation to the specific needs of individual areas of the field can lead to significant increases in yields and reductions in fertiliser losses, which has important economic and environmental implications. In addition, detailed knowledge of soil parameters enables the optimisation of irrigation, minimisation of erosion risk and improvement of the efficiency of natural resource use, which is in line with the principles of sustainable agricultural development [5,17,18,19].
Previous studies on the impact of soil parameters on potato yield have often focused on the analysis of individual factors or limited sets of variables, without taking into account the complex interactions occurring in the soil environment. As a result, there is an urgent need to develop advanced predictive models that take into account the synergistic effects of various soil parameters and enable more accurate yield forecasting [20,21]. In recent years, there has been dynamic development and implementation of advanced forecasting tools in the agricultural sector, including machine learning methods such as artificial neural networks (ANN) [22,23]. Neural networks, in particular multilayer perceptron (MLP) models, are characterised by their ability to approximate non-linear relationships and effectively process multidimensional data sets, making them a promising tool for predicting crop yields based on heterogeneous soil data [24]. Furthermore, ANNs are resistant to noise and data gaps, which is a common problem with soil and meteorological data.
In light of the above, this work focuses on the application of artificial neural networks to model the impact of various soil parameters on potato yield, with the aim of identifying key factors determining crop productivity. In particular, the aim is to develop and validate a predictive model that will allow the assessment of the impact of parameters such as soil macro- and microelement content, grain size, and chemical properties (pH, organic matter content, sorption properties) on potato tuber yield with low prediction error.
2. Materials and Methods
Between 2021 and 2024, field research was conducted on a private farm located in the coastal zone of northern Poland (Baltic Sea region). The study area covered farmland in the vicinity of Damno (53.9733° N, 19.0961° E), Bobrowniki (53.9550° N, 19.0597° E) and Świtały (54.0492° N, 19.0658° E). The climate of the area is characterised by typical temperate conditions, with an average annual air temperature of 7.5–8.5°C and annual precipitation of 650–750 mm. Over a period of four years, monoculture cultivation of the Ludmilla potato variety was carried out on all fields. The annual research area was approximately 100 ha, which allowed for a large number of measurement points in the fields to be included in the study. The locations were selected to minimise differences in habitat conditions, allowing for comparability of results throughout the experiment. This selection of locations ensured stable environmental conditions conducive to the cultivation of the Ludmilla potato variety, especially in the context of French fry production, which requires specific soil and climate parameters.
During the study, differences in soil conditions between fields were identified. In 2021–2024, fields 1- 2021 (Figure 1), 2- 2022 (Figure 2) and 3- 2023 (Figure 3) were dominated by soils classified as Luvisols according to the FAO/WRB (2022) system [25]. In 2024, Cambisols were found in field 4 (Figure 4).
2.1. Field and Laboratory Research
2.1.1. Field Management Practices
Potatoes were cultivated using the ploughing system, with a row spacing of 90 cm. The planting dates for the tubers in each year were as follows: 15 April 2021, 19 April 2022, 17 April 2023 and 14 May 2024. Mineral fertilisation was applied in doses varying according to soil fertility. For average soil fertility, a total of 220 kg N/ha, 120 kg P2O5∙ha-1 and 300 kg K2O∙ha-1 were applied. Phytosanitary protection of the plantation was comprehensive, taking into account the current recommendations of decision support systems, ensuring effective control of key pathogens, including Phytophthora infestans. The plantation was managed without irrigation. Approximately two weeks before the planned harvest, the haulms were desiccated. The tubers were harvested annually between 10 September and 1 October.
2.1.2. Methodology for Soil Sampling and Preparation
Before planting, the soil was scanned using an EM-38 electromagnetic scanner to determine management zones within the field. The EM-38 scanner, based on electrical conductivity (ECa) measurements, enables precise determination of soil property variability within the field (e.g., texture, moisture, salinity). Based on the data obtained, management zones were designated, consisting of homogeneous plots ranging from 3 to 5 ha in size, which were treated as separate experimental plots in further analysis. In 2021, 2022, 2023 and 2024, 19, 17, 33 and 16 management zones were identified, respectively. Three soil samples were randomly collected from each zone at a depth of 0-30 cm, each weighing approximately 1.5 kg (fresh weight). The location of the soil sampling points was precisely recorded using a CHCNAV LT60H RTK GPS receiver (CHC Navigation). The soil samples were transported to the laboratory, where they were dried at 105°C and then ground in a mortar. Further processing of the samples, including preparation for analysis, was carried out in accordance with the analytical methodologies specific to the parameters being determined.
2.1.3. Analysis of the Physicochemical Properties of Soil
Laboratory soil analyses included the following determinations. P2O5 content was determined by extraction and determination of available phosphorus, in accordance with PN-R-04023:1996 [26], K2O content was determined by extraction and determination of available potassium, in accordance with PN-R-04022:1996 [27]. Mg content was determined by extraction and determination of available magnesium, in accordance with PB 31 ed.2 methodology [28]. Hydrolytic acidity was determined using the Kappen method (extraction of H+ ions from the soil with calcium acetate (Ca(CH3COO)2) solution, titration with sodium hydroxide (NaOH) solution). The sum of exchangeable cations (S) was determined using the Kappen method (displacement of base cations with 0.1M HCl solution, titration with NaOH) [29]. Soil sorption capacity (T): calculated as the sum of hydrolytic acidity and the sum of exchangeable cations. The saturation of the sorption complex with base cations (V) was calculated using the formula: V = (Sum of exchangeable bases / Cation exchange capacity) * 100% [29]. The content of granulometric fractions (sand, dust, clay) was determined by laser diffraction using a Mastersizer 3000+ particle size analyzer. The organic carbon content was determined using a TOC aj-analyzer multi EA 4000 analyzer; multi-Win 5.5. Humus content was calculated based on organic carbon content (Böhm’s conversion factor: humus content (%) = organic carbon content (%) * 1.724) [29]. Total nitrogen was determined using a FlashSmart series CHNS analyzer Manufacturer: Thermo Scientific. Soil pH was measured in KCl solution, in accordance with standard PB 31 ed.2 [28].
2.1.4. Methodology for Sampling Potato Tubers Before Harvest
In order to assess the potato tuber yield, two weeks before the planned harvest, samples were taken each year at precisely located points in the field. The location of the yield sampling points corresponded to the location of the soil sampling points. In situations where the soil sampling point fell on a technological path, the yield sampling point was moved by a maximum of 2 m, with the exact location of the moved point being recorded. A single sample consisted of tubers dug from an area of 3 m2. After harvesting, the samples were transported to the laboratory and weighed. Based on the results obtained, the final yield was converted to t∙ha-1.
2.2. Data Analysis and Model Development
2.2.1. Dependent and Independent Variables for Building and Verifying a Neural Network Model
Table 1 presents a summary of variables included in the statistical analysis aimed at modelling potato tuber yield (YP) based on soil properties. The YP variable, representing potato tuber yield expressed in tonnes per hectare (t∙ha-1), acts as the dependent variable. The other variables are independent variables (predictors) and include chemical and physical parameters of the soil. The table contains variable symbols, their descriptions and the ranges of values observed in the data set.
2.2.2. Correlation Analysis and Elimination of Collinearity
Before starting the potato tuber yield modelling process, a detailed analysis of the collinearity of potential independent variables was carried out, covering a wide range of soil parameters. This analysis was performed exclusively on the data set intended for model construction, in accordance with the procedures described in section 2.8. Collinearity, understood as the occurrence of high correlations between independent variables, is a significant factor threatening the stability and interpretability of regression models. To minimise the risk associated with this phenomenon, a correlation matrix was used, calculated using Statistica software (v13.3). On this basis, pairs of variables with high correlation coefficients were identified and further selected to ensure the consistency and reliability of the predictive model being developed.
Pearson’s correlation matrix analysis (N = 214, p < 0.05) (Table 2) revealed the presence of significant collinearity between selected independent variables, which required appropriate measures to ensure the stability and interpretability of the model. It was found that the correlations between soil granulometric fractions – sand (SAND), silt (SILT) and clay (CLAY) – exceeded the critical value of 0.9 (r = -0.92 between SAND and SILT; r = -0.91 between SAND and CLAY; r = 0.93 between SILT and CLAY), indicating the need to limit the number of variables describing the granulometric composition. In addition, an excellent correlation (r = 1.000) was observed between organic carbon (OC) content and humus (H) content, which implied the need to exclude one of these variables from further analysis. In order to reduce the risk associated with the collinearity problem, it was decided to eliminate the H variable and reduce the granulometric variables, leaving only one variable representing granulometric composition in the analysis – SAND.
2.3. Data Preprocessing
The data were preliminarily analysed, including the calculation of basic statistical measures and the assessment of variable distributions. In order to ensure high data quality, nine observations representing extreme outliers were identified and removed. In addition, a process of standardisation or normalisation of variables was carried out to minimise the impact of differences in measurement scales. Where necessary, transformations of distributions were applied to make them closer to normal distributions, which increased the accuracy and stability of further statistical analyses.
2.3.1. Method of Creating a Neural Network Model
In order to ensure the proper construction and validation of predictive models, the entire dataset was strategically divided into two separate subsets. Set A, comprising 214 cases, was used for training regression models and neural networks. Set B, containing 26 cases, served as a validation set for evaluating and verifying the effectiveness of the trained models. It should be emphasised that the selection of cases for set B was not entirely random; six cases were selected at random from each field in the experiment and supplemented with two cases selected completely at random to ensure the representativeness and diversity of this test set.
In order to develop an optimal predictive model, a method of automatic neural network architecture design based on a structure optimisation algorithm was used. The data was divided into three separate sets: training – 70%, validation – 15%, and testing – 15%, which enabled an independent assessment of the final effectiveness of the trained model. Work on the model was carried out in Statistica version 13.3. During the process, as many as 10,000 network configurations were searched, which ensured a wide range of solutions and increased the likelihood of finding the optimal model. The most suitable architecture was selected based on criteria for minimising the difference between the quality of the training and test sets, which is crucial for ensuring the stability and generalisation of the model. To this end, metrics such as the coefficient of determination (R2), mean square error (MSE) and mean absolute error (MAE) were evaluated, aiming to maximise prediction quality while minimising errors. In addition, smaller networks (with a limited number of neurons in the hidden layer) were preferred in the selection process, which helped to reduce the complexity of the model and improve its interpretability. The network was trained using the Levenberg-Marquardt algorithm (also known as the BFGS 88 algorithm), which allowed for quick and stable parameter fitting. The training process consisted of 50 epochs, which proved sufficient to achieve convergence without excessive adaptation to the training data. The selected model is a multilayer perceptron (MLP) network with an 11-5-1 architecture, i.e., containing 11 neurons in the input layer, 5 neurons in the hidden layer and 1 output neuron. The activation function in the hidden layer was set as hyperbolic tangent, while the activation function in the output layer is linear, which corresponds to the characteristics of the regression problem.
In addition, a sensitivity analysis was performed on the test set to assess the stability and robustness of the model to changes in the input data. As a result of this analysis, information was obtained on which independent variables have the greatest impact on the dependent variable and how individual factors shape the model’s results. Such an analysis allows for a better understanding of the mechanisms of the network’s operation, as well as confirming the reliability and resilience of the model to potential data disturbances, which increases confidence in its practical applications.
2.3.2. Model Evaluation
In order to verify the predictive properties of the developed model, a post hoc analysis of prediction errors was performed using several commonly used evaluation measures. In particular, six different statistics were used, including: 1) global relative approximation error (RAE), 2) root mean square error (RMS), 3) mean absolute error (MAE), 4) mean absolute percentage error (MAPE), 5) maximum error value calculated for the entire model (MAX), 6) maximum percentage error (MAXP), 7) coefficient of determination R2.
All of the above measures were calculated based on the results obtained from the test set (B). The methods for calculating individual errors are described in detail in the authors’ previous literature. [30,31,32]. Their use allowed for a comprehensive assessment of the accuracy and reliability of the model, both in terms of overall prediction quality and response to local deviations.
3. Results
3.1. Basic Statistical Measures of Predictive Model Variables
Table 3 presents basic descriptive statistics for selected soil and chemical parameters in three data sets: training, test, and validation data for the MLP 11-5-1 neural network. This analysis serves to assess the distribution, range of values, and stability of the input data, which is crucial for evaluating their representativeness and preparing them for further predictive models. The results indicate consistency and an appropriate level of variability of the variables at different stages of the analysis, confirming their applicability in the modelling process.
An analysis of the basic descriptive statistics of the input variables showed that the ranges of values and the dispersion of data are diverse, but remain relatively stable in the individual sets: training, test and validation. The minimum and maximum values for most parameters show similar ranges, which confirms the representativeness of the samples. The mean values and standard deviations indicate moderate data diversity, with variables such as ‘OC’ and ‘TN’ characterised by lower variance, while variables “V” and ‘SAND’ show wider ranges and higher standard deviations. Similar trends are observed in all analysed sets, confirming the consistency of the input data and the adequacy of their quality for further stages of analysis and modelling.
3.2. Forecasting Properties of Neural Model
Table 4 presents the basic indicators for assessing the quality of the developed predictive model. The coefficient of determination (R2) value of 0.9743 indicates a very high accuracy of fit, explaining almost the entire variance of the response variable. The forecast errors, including RMSE and MAE, are 5.69 and 4.30 t∙ ha−1, respectively, which indicates the high precision of the predictive models. The MAPE index of 10.86% suggests that the relative errors are at an acceptable level for practical applications, while the maximum deviations (MAX) and the largest percentage error (MAXP) are 9.36 t∙ ha−1 and 55.70%, respectively. Overall, the results confirm the high effectiveness of the model and its potential in forecasting applications.
Figure 5 shows a scatter plot illustrating the relationship between actual and predicted yields per hectare (Yp, in tons per hectare). The points on the graph are individual observations that show how well the model predicts yield levels. The regression line, determined by the least squares method, showing the best linear fit, indicates the direction and strength of the relationship between these variables. This line is surrounded by a band representing the confidence interval, which allows us to assess how accurate the forecasts are. Statistical results, such as the correlation coefficient r ≈ 0.91, the p-value = 0.00, and the coefficient of determination (R2) at around 0.82, indicate a strong, statistically significant linear relationship between the observed and predicted values. The scores clustered around the regression line indicate the high accuracy of the model in predicting results.
3.3. Sensitivity Analysis of MLP 11-5-1 Neural Network
The results of the global sensitivity analysis of the MLP 11-5-1 network are presented below. Response surfaces illustrating (Figure 6 and Figure 7) the impact of the most important variables from the above analysis on the formation of the dependent variable have also been prepared.
As part of the global sensitivity analysis (Table 5), the three variables with the greatest impact on the predicted tuber yield are: CEC, V, and S, which occupy the first, second, and third positions in the impact ranking, respectively. These variables have the highest impact value, which indicates their key role in shaping the model’s results. On the other hand, the TN variable, which ranks last with the lowest impact value, has the least potential to modify the predicted yield value, suggesting its relatively marginal importance in the analyzed model.
The three-dimensional visualization shows the interactions between two input variables – cation exchange capacity (CEC) and base saturation percentage (V) – and the predicted potato tuber yield. The surface topography, characterized by the presence of peaks and grooves, reflects changes in the predicted yield as a function of the levels of the analyzed parameters. The color scheme of the surface illustrates the range of predicted yield values and the impact of extreme values of the variables: areas marked in red indicate a strong influence of extreme values of the factors, while areas marked in green and blue suggest a relatively smaller influence. The graphical analysis reveals high dynamics of changes in the predicted yield in the area of extreme parameter values, which implies that deviations from the average values may result in significant fluctuations in the results. This picture confirms the key role of CEC and V in shaping the projected yields, with extreme values of these parameters being important determinants of deviations from average production results. In addition, there is a tendency to achieve higher tuber yields at high cation exchange capacity values. Yield increase also correlates with high values of the saturation degree of the sorption complex with base cations and with cultivation on soils with a loose structure, characterized by a predominance of the sand fraction.
4. Discussion
The present work aimed to develop a predictive model of potato tuber yield based on soil parameters, using artificial neural networks (ANN). The results obtained confirm the high efficiency of the method used, as reflected in the qualitative indicators: coefficient of determination (R2 = 0.8227), low prediction errors (RMSE = 4.19 t∙ha-1, MAE = 3.35 t∙ha-1) and relatively low mean percentage absolute error (MAPE = 7.34%). According to the criteria of Peng et al. (cited by Piekutowska et al., 2023) [30,33], MAPE of 7.34% indicates an excellent fit of the model to the data, placing it among the predictive tools with high reliability and potential for practical application. In the scientific literature, these results confirm the high performance of ANN. Basir et al. (2021), analyzing the prediction of rice yield, achieved R2 = 0.994 and RMSE = 4.577 g/m2, indicating a very accurate representation of the relationship between sowing parameters and yield [34]. In contrast, Bharti et al. (2023) used the 7-5-5-1 architecture in an apple yield prediction study and achieved higher performance, with a difference in R2 of 18.6% relative to linear regression models, and below: RMSE, MAD and MAPE in both stages settled for the lowest values [35]. In a study by Hara et al. (2023) conducted on different locations, the ANN model for pea yield forecast obtained R2 from 0.94 to 0.99 and low errors, confirming its high versatility and ability to model complex nonlinear relationships in agriculture [36]. The results of the study by Piekutowska et al. (2021) showed that ANN models achieve high success rates in predicting potato yields, obtaining R2 in the range of 0.79 to 0.84 and MAPE of about 8-9%.[30]. They were built on a broader set of independent variables compared to the set of such variables in this study. These data confirm that neural networks are a competitive and versatile forecasting tool in agricultural production analysis, both for potato yields and other crops.
Particularly noteworthy is the analysis of global sensitivity, which showed that cation exchange capacity (CEC), base saturation percentage (V) and sum of exchangeable bases (S) are the most important parameters influencing potato yield in the studied model. This result highlights the importance of soil sorption properties as a key factor determining crop productivity. The high position of CEC in the sensitivity ranking indicates the fundamental role of the soil’s ability to retain and release nutrients to plants [37,38]. Cation exchange capacity affects the availability of both macroelements (nitrogen, phosphorus, potassium) and microelements (iron, manganese, zinc), which are essential for the proper growth and development of potatoes, as well as their resistance to environmental stresses such as drought or disease. Maintaining an appropriate CEC value ensures a stable supply of nutrients to plants, minimising the risk of deficiencies and improving fertilisation efficiency [39]. High V and S values suggest that maintaining the appropriate soil pH and availability of alkaline cations (calcium, magnesium, potassium) is crucial for optimal potato growth and development. These cations play important roles in plant physiological processes such as photosynthesis, assimilate transport, protein synthesis and water management [40,41]. Calcium is essential for cell wall construction and root system development, magnesium is a component of chlorophyll and an enzyme activator, and potassium regulates water management and sugar transport. In addition, calcium and magnesium affect soil structure, improving its permeability and water availability for plants [41,42]. Ensuring the right proportion and availability of alkaline cations affects the quality of potato tubers, improving their taste, texture and nutritional value [43]. Increasing the potassium content in the soil leads to an increase in the starch content in potato tubers [44], which is particularly desirable in the case of potatoes intended for processing into French fries.
An unexpected result of the sensitivity analysis is the relatively low position of total nitrogen (TN) among the factors influencing potato tuber yield [45]. However, it should be noted that the TN measurements in this study refer to the baseline total nitrogen content in the soil in the 0-30 cm layer, taken before planting and fertilisation. Therefore, the results obtained may primarily reflect the nitrogen resources in the soil before cultivation, which do not necessarily determine the availability of this element to plants during the intensive growing season, characterised by high nutrient requirements and regular fertilisation. Therefore, it is possible that under conditions of optimal nitrogen fertilisation during the growing season, the impact of the base TN content on yield is relatively smaller, and the availability of nitrogen from fertilisers, which is more easily absorbed by plants, plays a key role. The potential reasons for the relatively low position of TN in the sensitivity analysis may therefore be as follows: 1) TN measurements do not reflect the dynamics of nitrogen availability during the growing season, 2) the model better reflects the impact of factors related to current fertilisation than the base TN resources, 3) the impact of TN is indirectly taken into account by other variables correlating with soil fertility (e.g., organic matter content, pH). However, it should be emphasised that regardless of the results of the sensitivity analysis, nitrogen remains an irreplaceable macroelement in potato nutrition, and maintaining its optimal availability during the growing season is crucial for obtaining high yields of good quality. It should be noted that this study has certain limitations. The model does not take into account the impact of climatic factors such as temperature and precipitation, which are known to have a significant impact on potato yields. Furthermore, the soil data used in the analysis comes from a limited geographical area, which potentially narrows the scope of generalisation of the results obtained to other regions. In future studies, it is recommended to extend the analysis to include additional soil parameters, such as micronutrient content, and to consider the interaction between soil and climatic factors. It would also be useful to conduct a comparative assessment of the effectiveness of different machine learning algorithms in the context of potato yield prediction.
5. Conclusions
This study has demonstrated that artificial neural networks are a promising tool for modelling the impact of soil parameters on potato yield. The results obtained can be used to optimise selected agricultural practices and potentially contribute to increasing the efficiency and sustainability of potato production. However, it should be emphasised that the relationship between basic soil parameters and final yield is complex and influenced by many factors that may occur during the growing season. For this reason, this model should be treated as a pilot study, the main purpose of which was to identify the key soil factors determining yield. Future research should focus on developing more comprehensive predictive models that take into account not only soil factors but also agronomic data (e.g., fertilisation, plant protection), meteorological data and remote sensing data reflecting plant productivity. Such an interdisciplinary approach, integrating data from various sources, may in the future result in the creation of a highly accurate potato yield prediction model dedicated to potato cultivation for French fries in the Baltic Sea region.
Author Contributions
For research articles with several authors, a short paragraph specifying their individual contributions must be provided. The following statements should be used “Conceptualization, M.P. and G.N.; methodology, M.P.; software, M.P. and G.N.; validation, M.P. and G.N.; formal analysis, M.P.; investigation, M.P.; resources, M.P.; data curation, M.P.; writing—original draft preparation, M.P. and G.N.; writing—review and editing, M.P. and G.N.; visualization, M.P.; supervision, M.P. and G.N.; project administration, M.P.; funding acquisition, M.P.
Conflicts of Interest
The authors declare no conflicts of interest.
References
- The State of Food and Agriculture 2023; FAO, 2023; ISBN 978-92-5-138167-0.
- Ray, D.K.; Mueller, N.D.; West, P.C.; Foley, J.A. Yield Trends Are Insufficient to Double Global Crop Production by 2050. PLoS One 2013, 8, e66428. [CrossRef]
- Lin, Y.; Li, S.; Duan, S.; Ye, Y.; Li, B.; Li, G.; Lyv, D.; Jin, L.; Bian, C.; Liu, J. Methodological Evolution of Potato Yield Prediction: A Comprehensive Review. Front. Plant Sci. 2023, 14. [CrossRef]
- Kurek, J.; Niedbała, G.; Wojciechowski, T.; Świderski, B.; Antoniuk, I.; Piekutowska, M.; Kruk, M.; Bobran, K. Prediction of Potato (Solanum Tuberosum L.) Yield Based on Machine Learning Methods. Agriculture 2023, 13, 2259. [CrossRef]
- Piekutowska, M. Using Artificial Intelligence for Sustainable Crop Production – a Comprehensive Review with a Focus on Potato Production. J. Water L. Dev. 2025. [CrossRef]
- Niedbała, G., Piekutowska, M. Application of Artificial Neural Networks for the Prediction of Quality Characteristics Potato Tubers- Innovator Variety. J. Res. Appl. Agric. Eng. 2018, 64, 132–138.
- Wang, R.-F.; Su, W.-H. The Application of Deep Learning in the Whole Potato Production Chain: A Comprehensive Review. Agriculture 2024, 14, 1225. [CrossRef]
- Li, D.; Miao, Y.; Gupta, S.K.; Rosen, C.J.; Yuan, F.; Wang, C.; Wang, L.; Huang, Y. Improving Potato Yield Prediction by Combining Cultivar Information and UAV Remote Sensing Data Using Machine Learning. Remote Sens. 2021, 13, 3322. [CrossRef]
- Allal, L.G.; Bennekrouf, M.; Bettayeb, B.; Sahnoun, M. Technologies and Strategies for Optimizing the Potato Supply Chain: A Systematic Literature Review and Some Ideas for Application in the Algerian Context. Comput. Electron. Agric. 2025, 234, 110171. [CrossRef]
- Pszczółkowski, P.; Sawicka, B.; Skiba, D.; Barbaś, P. Enhancing Potato Quality in Fries Production Using Ultrasonic Techniques. Sustainability 2025, 17, 828. [CrossRef]
- Xing, Y.; Niu, X.; Wang, N.; Jiang, W.; Gao, Y.; Wang, X. The Correlation between Soil Nutrient and Potato Quality in Loess Plateau of China Based on PLSR. Sustainability 2020, 12, 1588. [CrossRef]
- Zhang, S.; Zhu, Q.; de Vries, W.; Ros, G.H.; Chen, X.; Muneer, M.A.; Zhang, F.; Wu, L. Effects of Soil Amendments on Soil Acidity and Crop Yields in Acidic Soils: A World-Wide Meta-Analysis. J. Environ. Manage. 2023, 345, 118531. [CrossRef]
- Lipiec, J.; Kuś, J.; Słowińska-Jurkiewicz, A.; Nosalewicz, A. Soil Porosity and Water Infiltration as Influenced by Tillage Methods. Soil Tillage Res. 2006, 89, 210–220. [CrossRef]
- Khan, M.T.; Aleinikovienė, J.; Butkevičienė, L.-M. Innovative Organic Fertilizers and Cover Crops: Perspectives for Sustainable Agriculture in the Era of Climate Change and Organic Agriculture. Agronomy 2024, 14, 2871. [CrossRef]
- Zayed, O.; Hewedy, O.A.; Abdelmoteleb, A.; Ali, M.; Youssef, M.S.; Roumia, A.F.; Seymour, D.; Yuan, Z.-C. Nitrogen Journey in Plants: From Uptake to Metabolism, Stress Response, and Microbe Interaction. Biomolecules 2023, 13, 1443. [CrossRef]
- Ahmed, N.; Zhang, B.; Chachar, Z.; Li, J.; Xiao, G.; Wang, Q.; Hayat, F.; Deng, L.; Narejo, M.-N.; Bozdar, B.; et al. Micronutrients and Their Effects on Horticultural Crop Quality, Productivity and Sustainability. Sci. Hortic. (Amsterdam). 2024, 323, 112512. [CrossRef]
- Mazur, P.; Gozdowski, D.; Wójcik-Gront, E. Soil Electrical Conductivity and Satellite-Derived Vegetation Indices for Evaluation of Phosphorus, Potassium and Magnesium Content, PH, and Delineation of Within-Field Management Zones. Agriculture 2022, 12, 883. [CrossRef]
- Serrano, J.; Shahidian, S.; Marques da Silva, J.; Paniágua, L.L.; Rebollo, F.J.; Moral, F.J. Temporal Stability of Management Zone Patterns: Case Study with Contact and Non-Contact Soil Electrical Conductivity Sensors in Dryland Pastures. Sensors 2024, 24, 1623. [CrossRef]
- Hara, P.; Piekutowska, M.; Niedbała, G. Selection of Independent Variables for Crop Yield Prediction Using Artificial Neural Network Models with Remote Sensing Data. Land 2021, 10, 609. [CrossRef]
- Larkin, R.P.; Griffin, T.S.; Honeycutt, C.W.; Olanya, O.M.; He, Z. Potato Cropping System Management Strategy Impacts Soil Physical, Chemical, and Biological Properties over Time. Soil Tillage Res. 2021, 213, 105148. [CrossRef]
- Dubois, A.; Teytaud, F.; Verel, S. Short Term Soil Moisture Forecasts for Potato Crop Farming: A Machine Learning Approach. Comput. Electron. Agric. 2021, 180, 105902. [CrossRef]
- Khorramifar, A.; Rasekh, M.; Karami, H.; Malaga-Toboła, U.; Gancarz, M. A Machine Learning Method for Classification and Identification of Potato Cultivars Based on the Reaction of MOS Type Sensor-Array. Sensors 2021, 21, 5836. [CrossRef]
- Niedbała, G. Simple Model Based on Artificial Neural Network for Early Prediction and Simulation Winter Rapeseed Yield. J. Integr. Agric. 2019, 18, 54–61. [CrossRef]
- Verma, G.; Kumar, B. Multi-Layer Perceptron (MLP) Neural Network for Predicting the Modified Compaction Parameters of Coarse-Grained and Fine-Grained Soils. Innov. Infrastruct. Solut. 2022, 7, 78. [CrossRef]
- WRB World Reference Base for Soil Resources. International Soil Classification Systems for Naming Soils and Creating Legends for Soil Maps. 4th Edition; Internationl Union of Soil Science IUSS, 2022;
- Polish Standard PN-R-04023:1996 Determination of Plant-Available Phosphorus in Mineral Soils — Methodology’ 1999.
- Polish Standard PN-R-04022:1996 Determination of Available Potassium in Soils — Extraction and Measurement Method 1996.
- Polish Standard PB 31:2010 Soil - Determination of Available Magnesium by Extraction and Chemical Measurement’ 2010.
- Kabała, A; Karczewski C. Methodology of Laboratory Analysis of Soil and Plants; 2008;
- Piekutowska, M.; Niedbała, G.; Piskier, T.; Lenartowicz, T.; Pilarski, K.; Wojciechowski, T.; Pilarska, A.A.; Czechowska-Kosacka, A. The Application of Multiple Linear Regression and Artificial Neural Network Models for Yield Prediction of Very Early Potato Cultivars before Harvest. Agronomy 2021, 11, 885. [CrossRef]
- Piekutowska, M.; Hara, P.; Pentoś, K.; Lenartowicz, T.; Wojciechowski, T.; Kujawa, S.; Niedbała, G. Predicting Starch Content in Early Potato Varieties Using Neural Networks and Regression Models: A Comparative Study. Agronomy 2024, 14, 3010. [CrossRef]
- Hara, P.; Piekutowska, M.; Niedbała, G. Prediction of Protein Content in Pea (Pisum Sativum L.) Seeds Using Artificial Neural Networks. Agriculture 2022, 13, 29. [CrossRef]
- Peng, J.; Kim, M.; Kim, Y.; Jo, M.; Kim, B.; Sung, K.; Lv, S. Constructing Italian Ryegrass Yield Prediction Model Based on Climatic Data by Locations in South Korea. Grassl. Sci. 2017, 63, 184–195. [CrossRef]
- Basir, M.S.; Chowdhury, M.; Islam, M.N.; Ashik-E-Rabbani, M. Artificial Neural Network Model in Predicting Yield of Mechanically Transplanted Rice from Transplanting Parameters in Bangladesh. J. Agric. Food Res. 2021, 5, 100186. [CrossRef]
- Bharti; Das, P.; Banerjee, R.; Ahmad, T.; Devi, S.; Verma, G. Artificial Neural Network Based Apple Yield Prediction Using Morphological Characters. Horticulturae 2023, 9, 436. [CrossRef]
- Hara, P.; Piekutowska, M.; Niedbała, G. Prediction of Pea (Pisum Sativum L.) Seeds Yield Using Artificial Neural Networks. Agriculture 2023, 13, 661. [CrossRef]
- Rawal, A.; Chakraborty, S.; Li, B.; Lewis, K.; Godoy, M.; Paulette, L.; Weindorf, D.C. Determination of Base Saturation Percentage in Agricultural Soils via Portable X-Ray Fluorescence Spectrometer. Geoderma 2019, 338, 375–382. [CrossRef]
- Zhang, J.; Qu, X.; Song, X.; Xiao, Y.; Wang, A.; Li, D. Spatial Variation in Soil Base Saturation and Exchangeable Cations in Tropical and Subtropical China. Agronomy 2023, 13, 781. [CrossRef]
- Gupta, U.C.; WU, K.; LIANG, S. Micronutrients in Soils, Crops, and Livestock. Earth Sci. Front. 2008, 15, 110–125. [CrossRef]
- Mostofa, M.G.; Rahman, M.M.; Ghosh, T.K.; Kabir, A.H.; Abdelrahman, M.; Rahman Khan, M.A.; Mochida, K.; Tran, L.-S.P. Potassium in Plant Physiological Adaptation to Abiotic Stresses. Plant Physiol. Biochem. 2022, 186, 279–289. [CrossRef]
- Vreugdenhil, D., Bradshaw, J., Gebhardt, C., Govers, F., MacKerron, D., Taylor, M., & Ross, H. Potato Biology and Biotechnology: Advances and Perspectives. Elsevier B.V.; 2007; ISBN 9780444510181.
- The Mechanisms of Absorption and Nutrients Transport in Plants: A Review. Trop. J. Nat. Prod. Res. 2022, 6, 8–14. [CrossRef]
- Khan, M.Z.; Akhtar, M.E.; Mahmood-ul-Hassan, M.; Mahmood, M.M.; Safdar, M.N. POTATO TUBER YIELD AND QUALITY AS AFFECTED BY RATES AND SOURCES OF POTASSIUM FERTILIZER. J. Plant Nutr. 2012, 35, 664–677. [CrossRef]
- Liszka-Skoczylas, M. Wpływ Nawożenia Roślin Ziemniaka (Solanum Tuberosum L.) Na Zawartość i Jakość Skrobi w Bulwach. Zywn. Nauk. Technol. Jakosc/Food Sci. Technol. Qual. 2020, 122, 31–46. [CrossRef]
- Trawczyński, C. Wpływ Nawożenia Mineralnego Azotem Na Plon i Jakość Bulw Bardzo Wczesnych i Wczesnych Odmian Ziemniaka Uprawianych Na Wczesny Zbiór. Agron. Sci. 2023, 78, 81–96. [CrossRef]
Figure 1.
Management zones with locations of soil and crop sampling sites. Field 1.
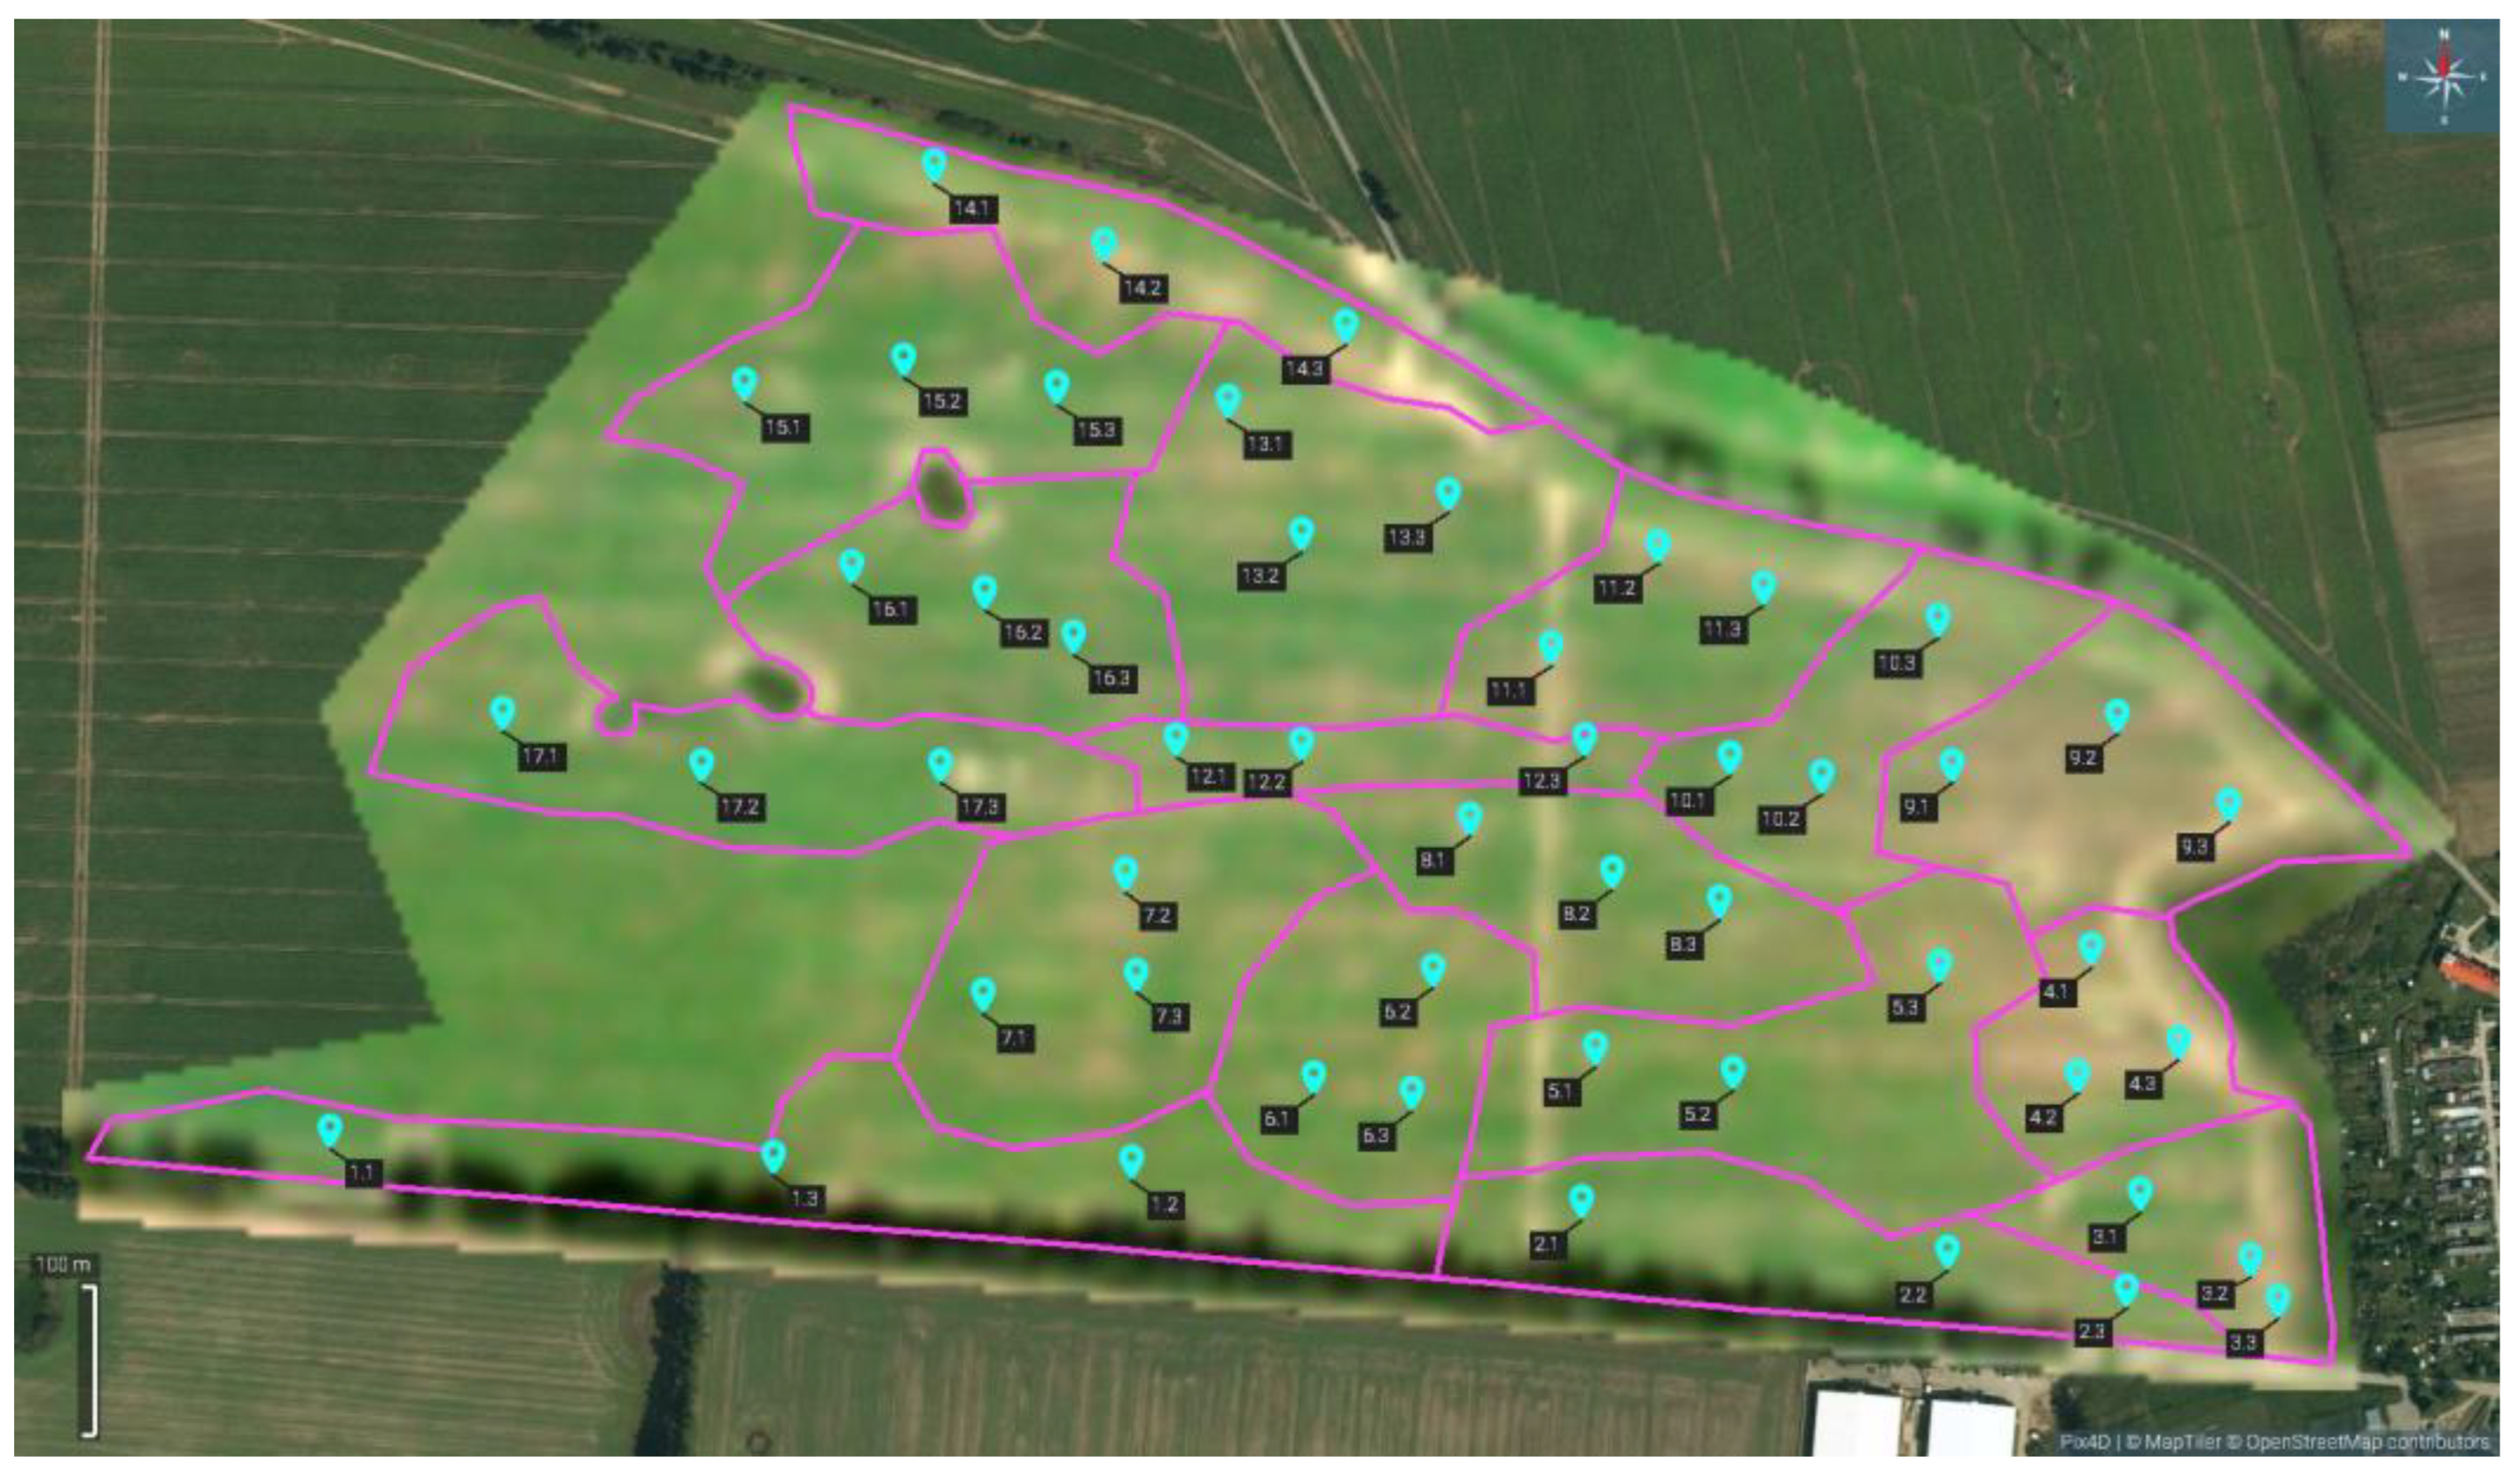
Figure 2.
Management zones with locations of soil and crop sampling sites. Field 2.
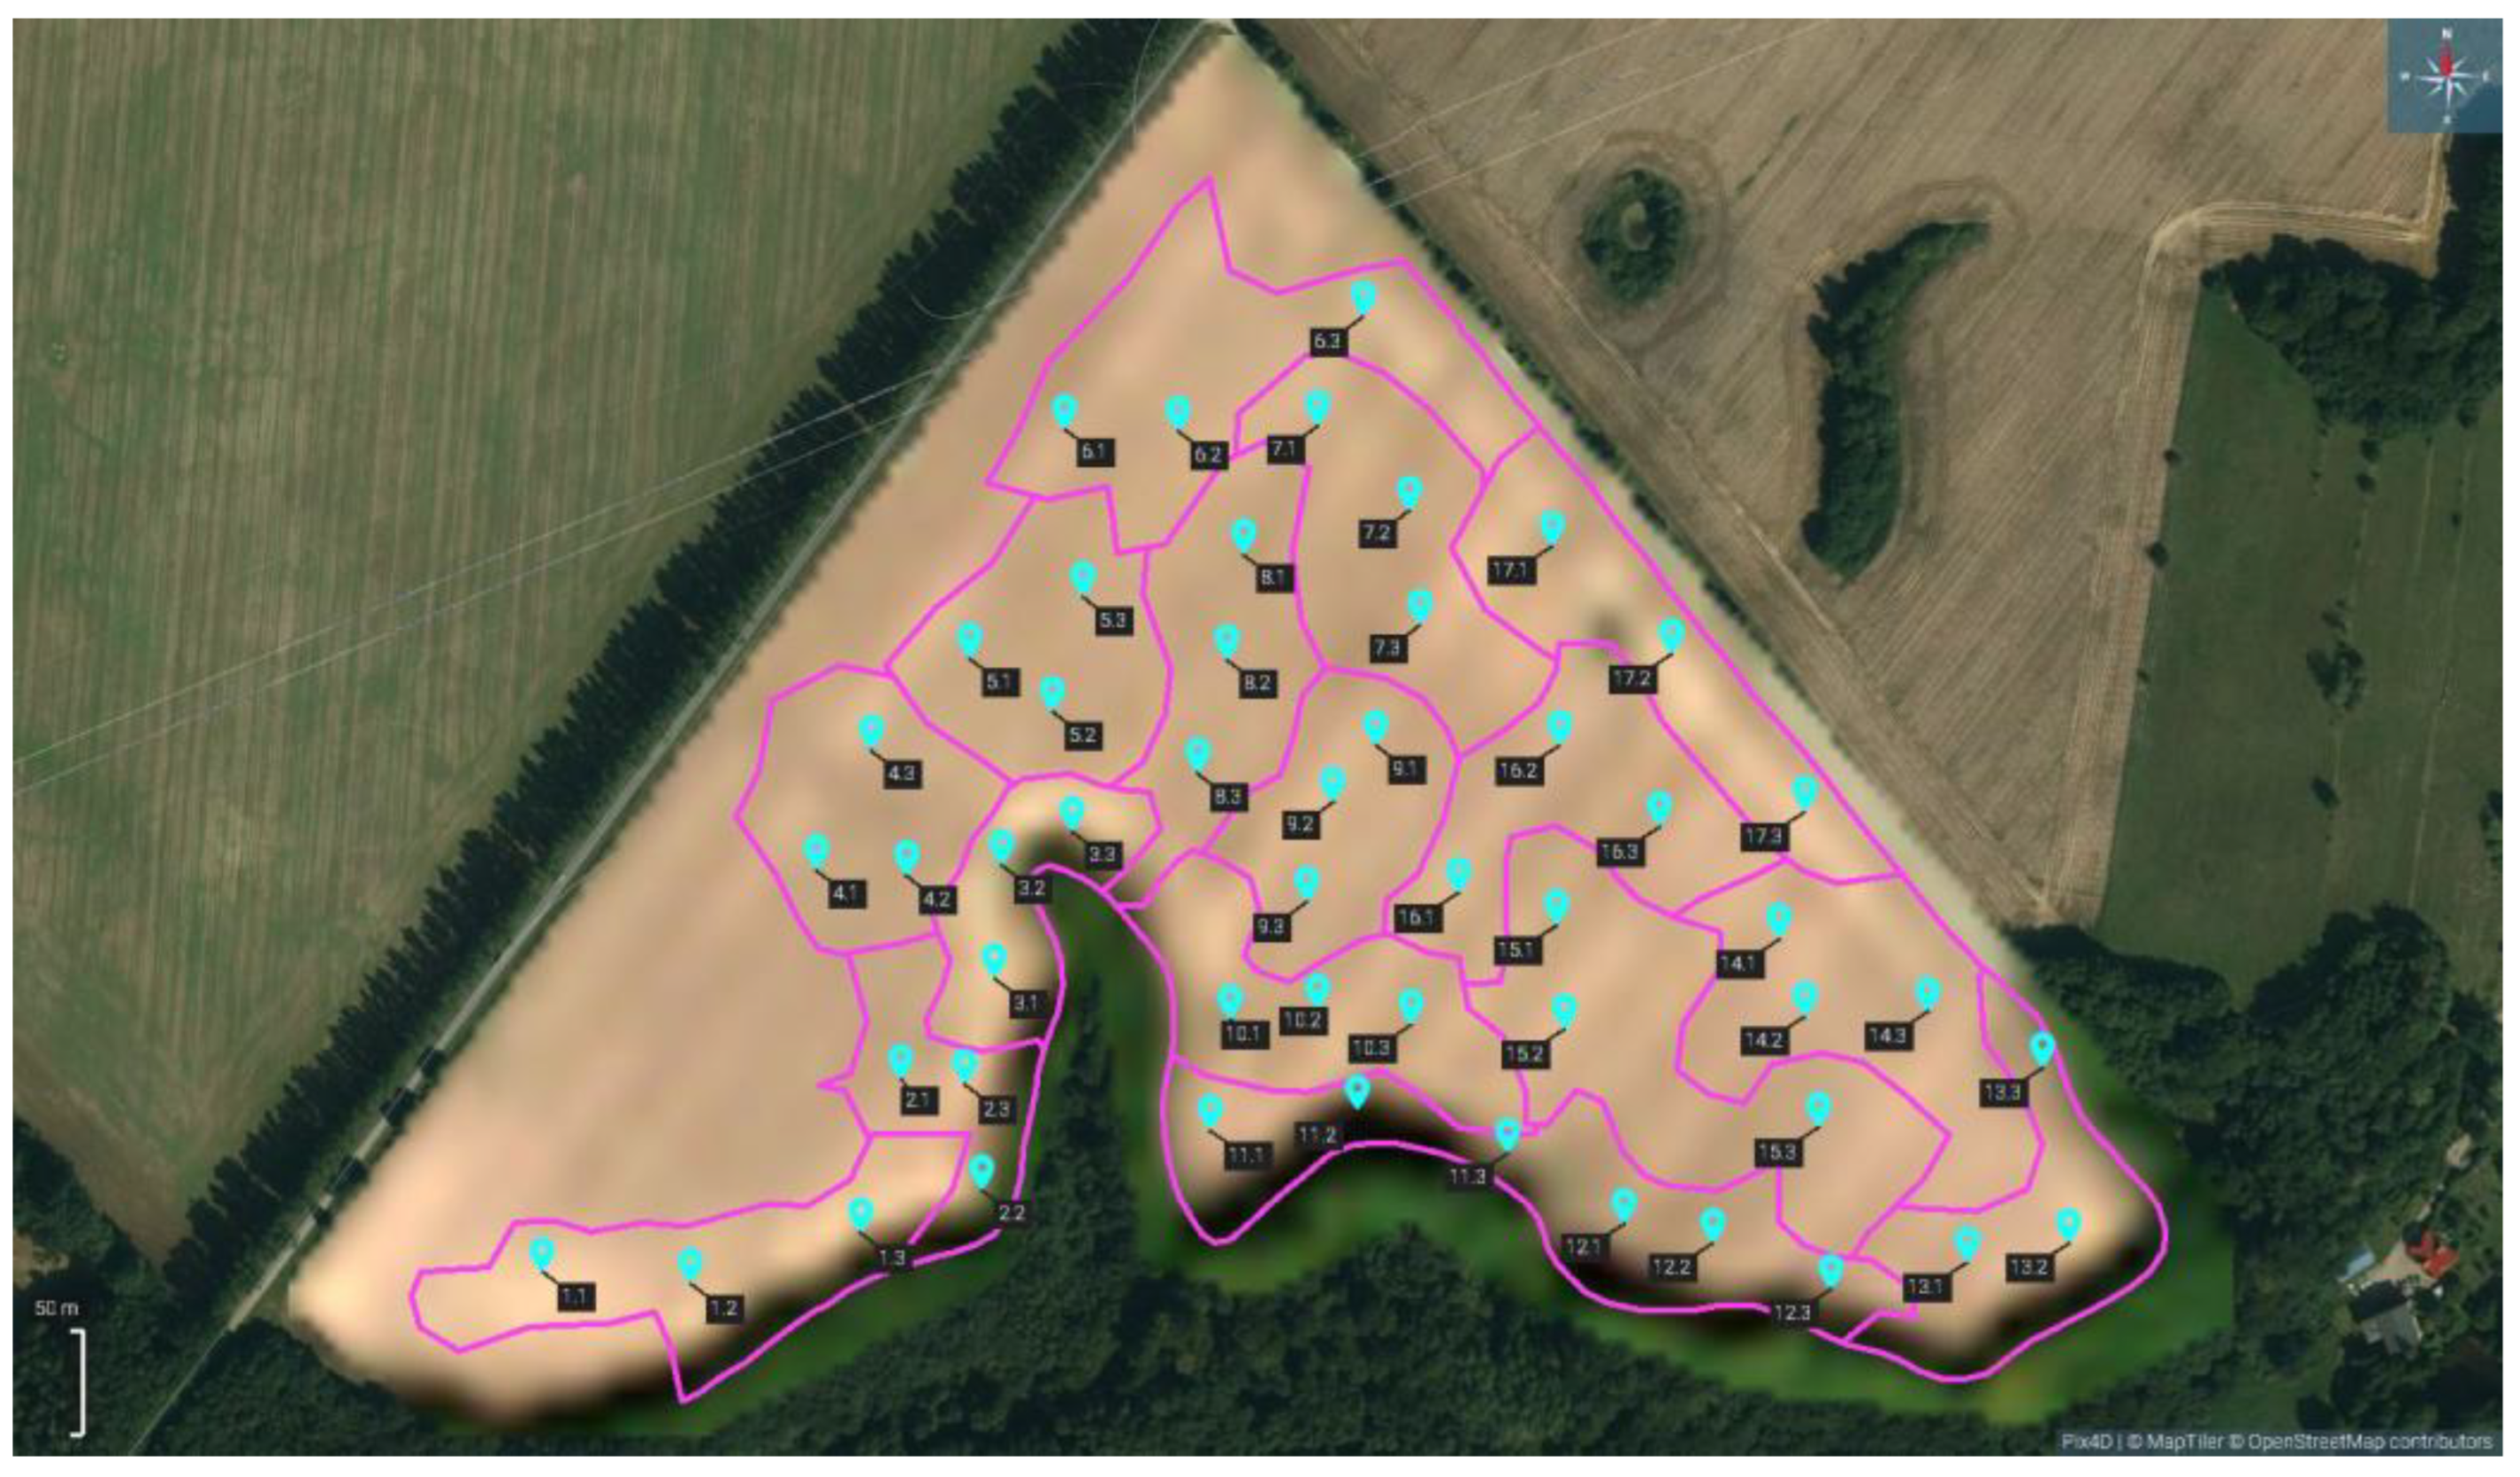
Figure 3.
Management zones with locations of soil and crop sampling sites. Field 3.
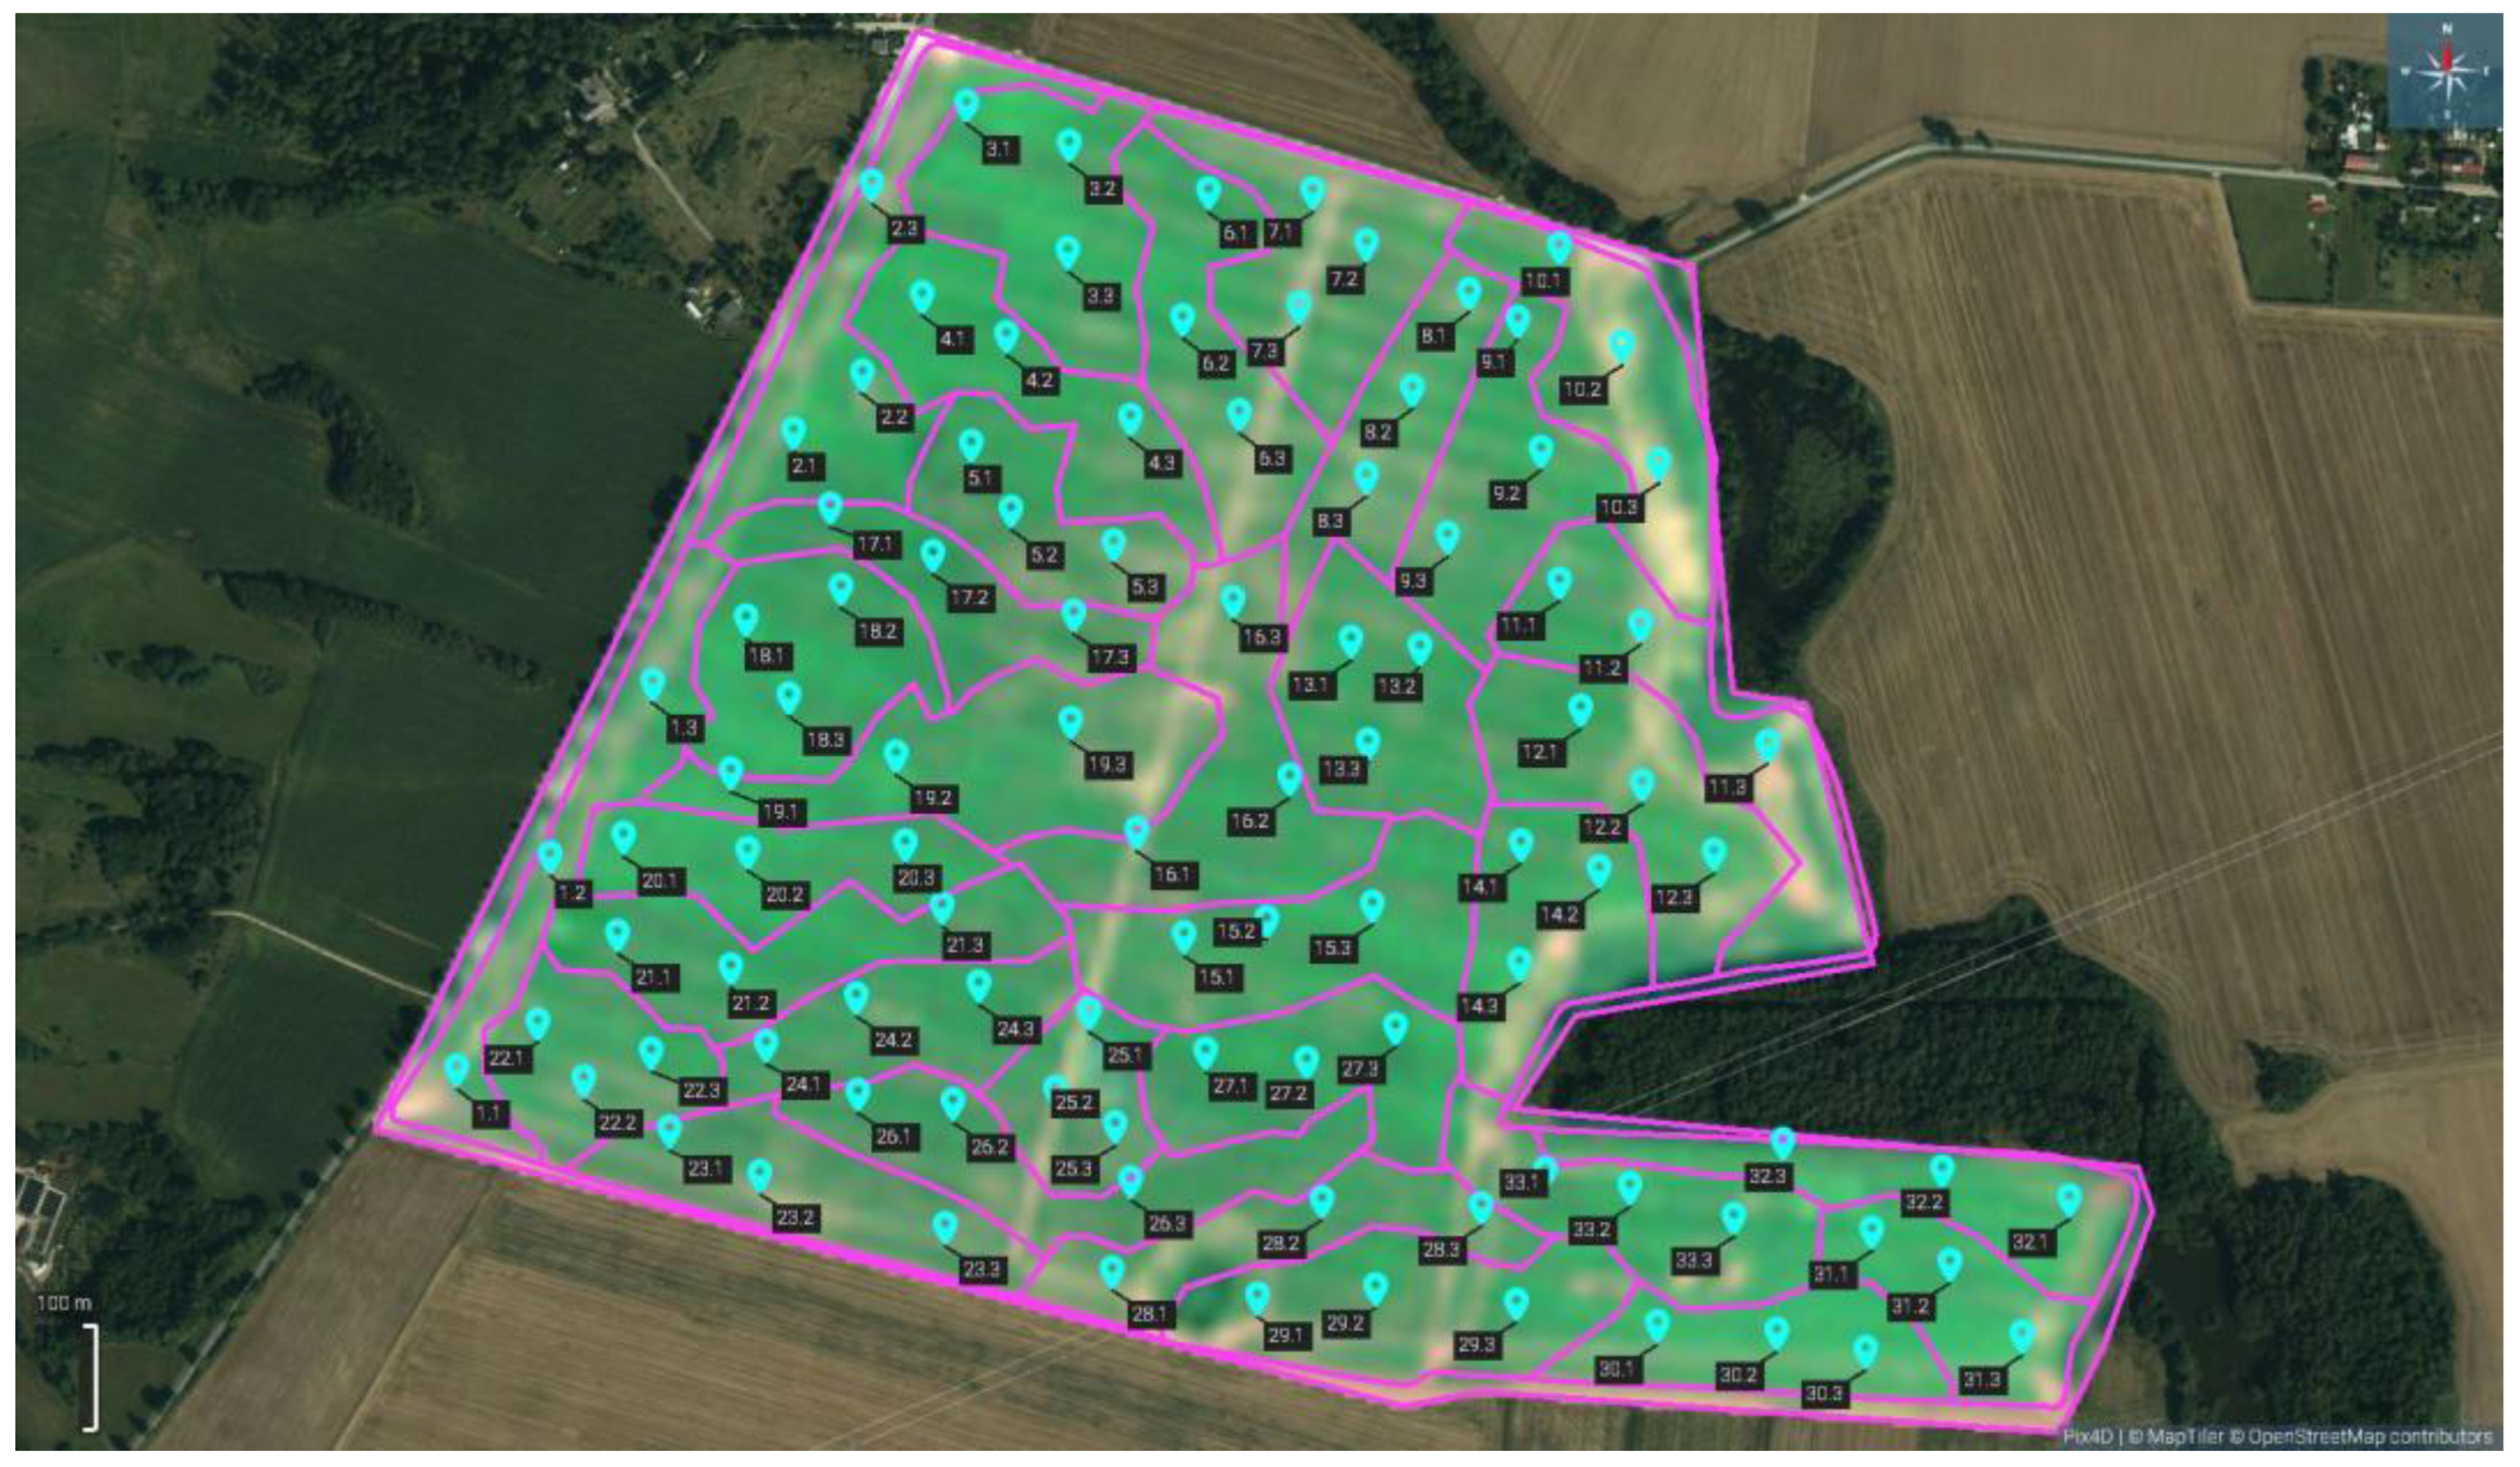
Figure 4.
Management zones with locations of soil and crop sampling sites. Field 4.
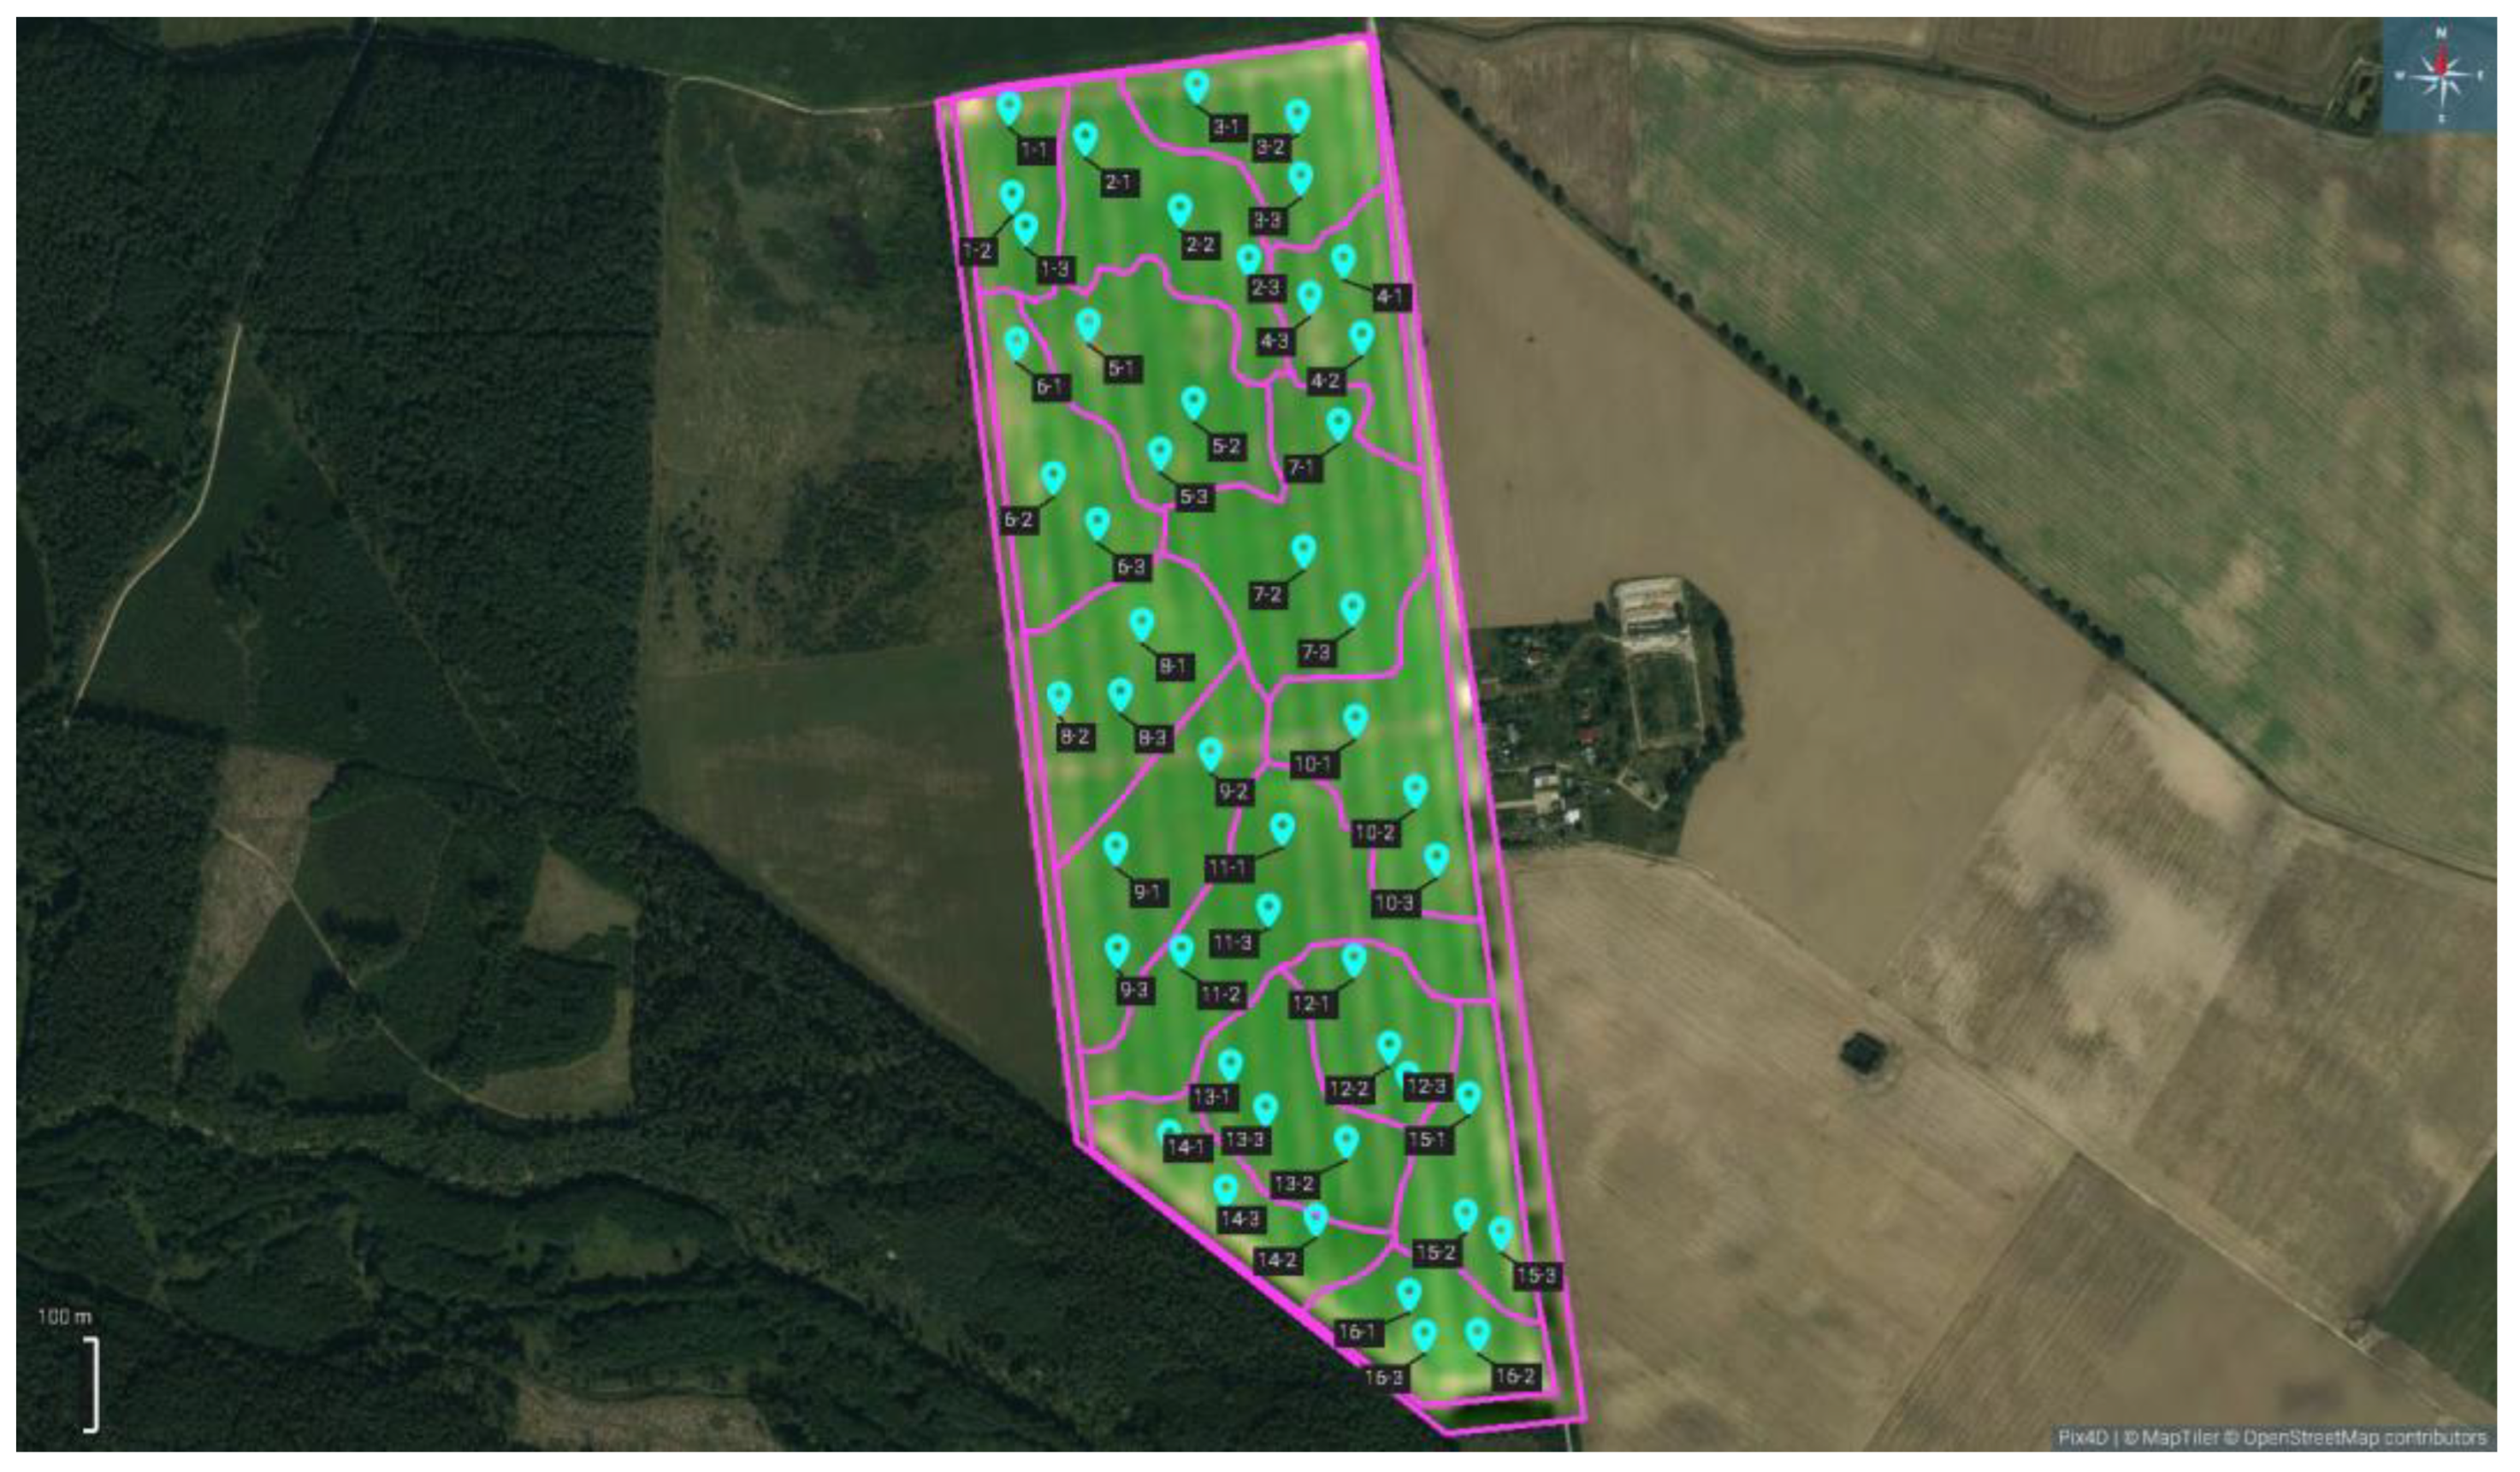
Figure 5.
Scatter plot of observed and predicted YP values.

Figure 6.
Graph showing the relationship between the independent variables CEC and V and the dependent variable YP.
Figure 6.
Graph showing the relationship between the independent variables CEC and V and the dependent variable YP.
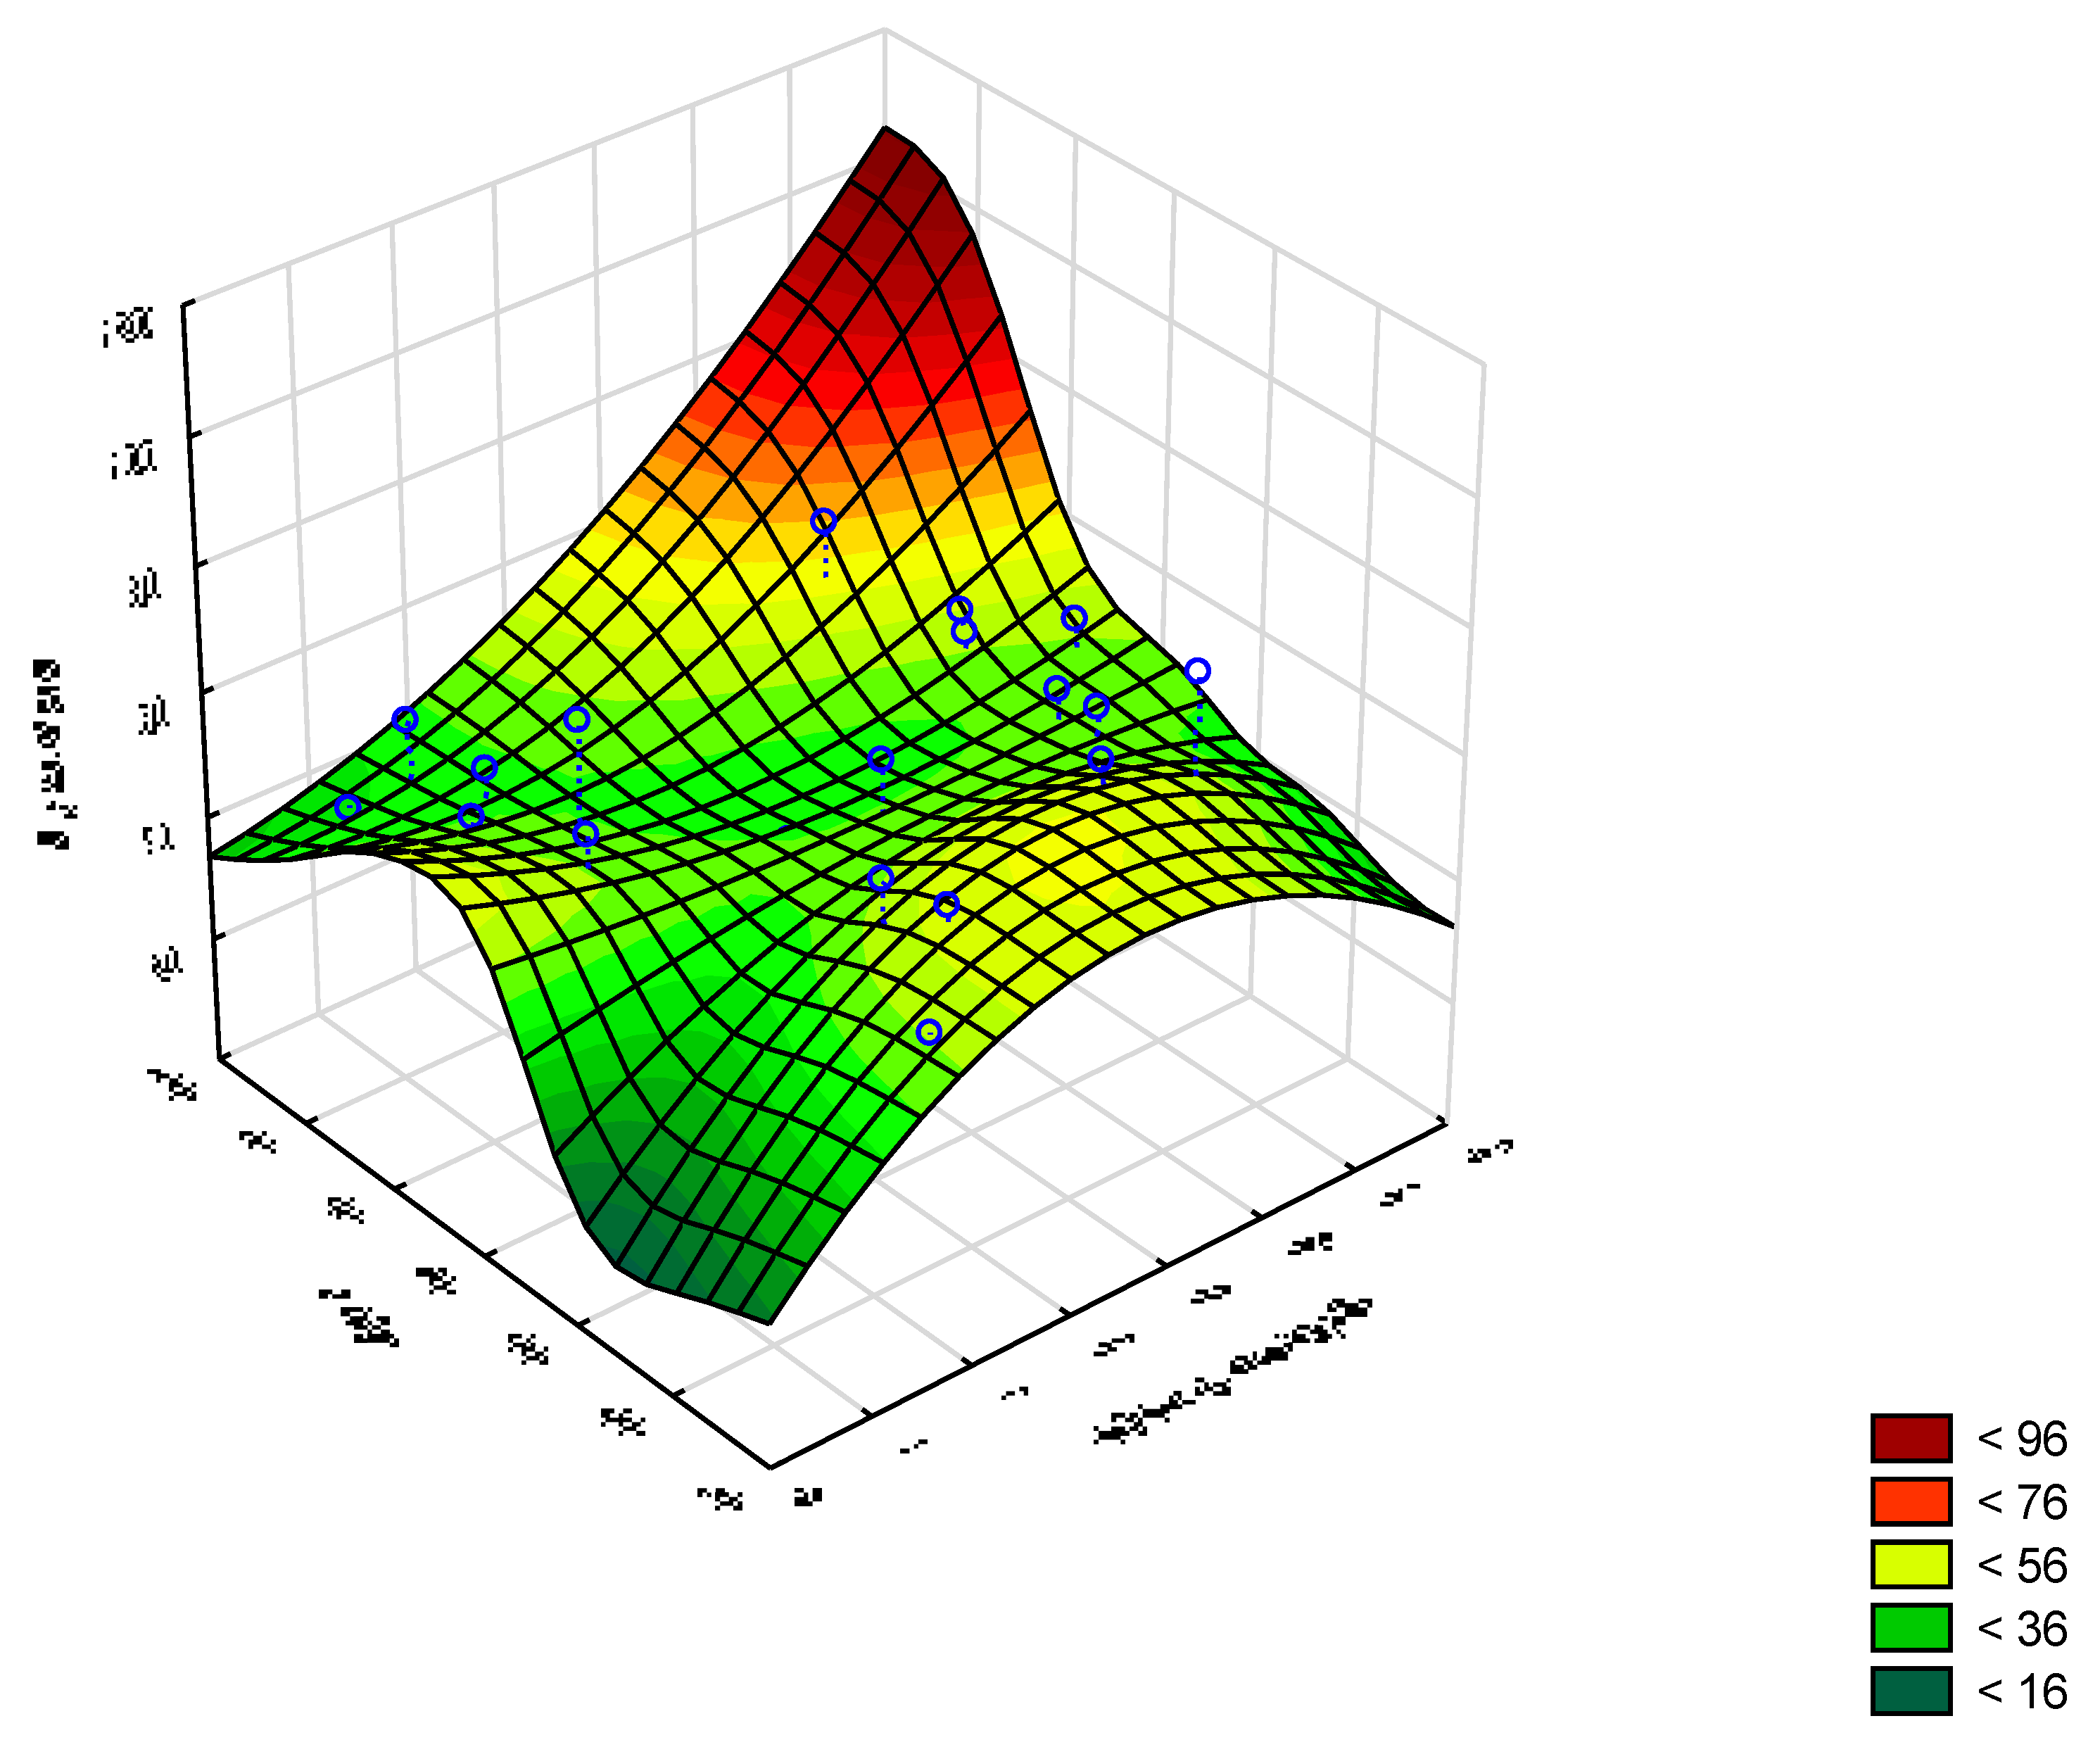
Figure 7.
Graph showing the relationship between the independent variables CEC and SAND and the dependent variable YP.
Figure 7.
Graph showing the relationship between the independent variables CEC and SAND and the dependent variable YP.
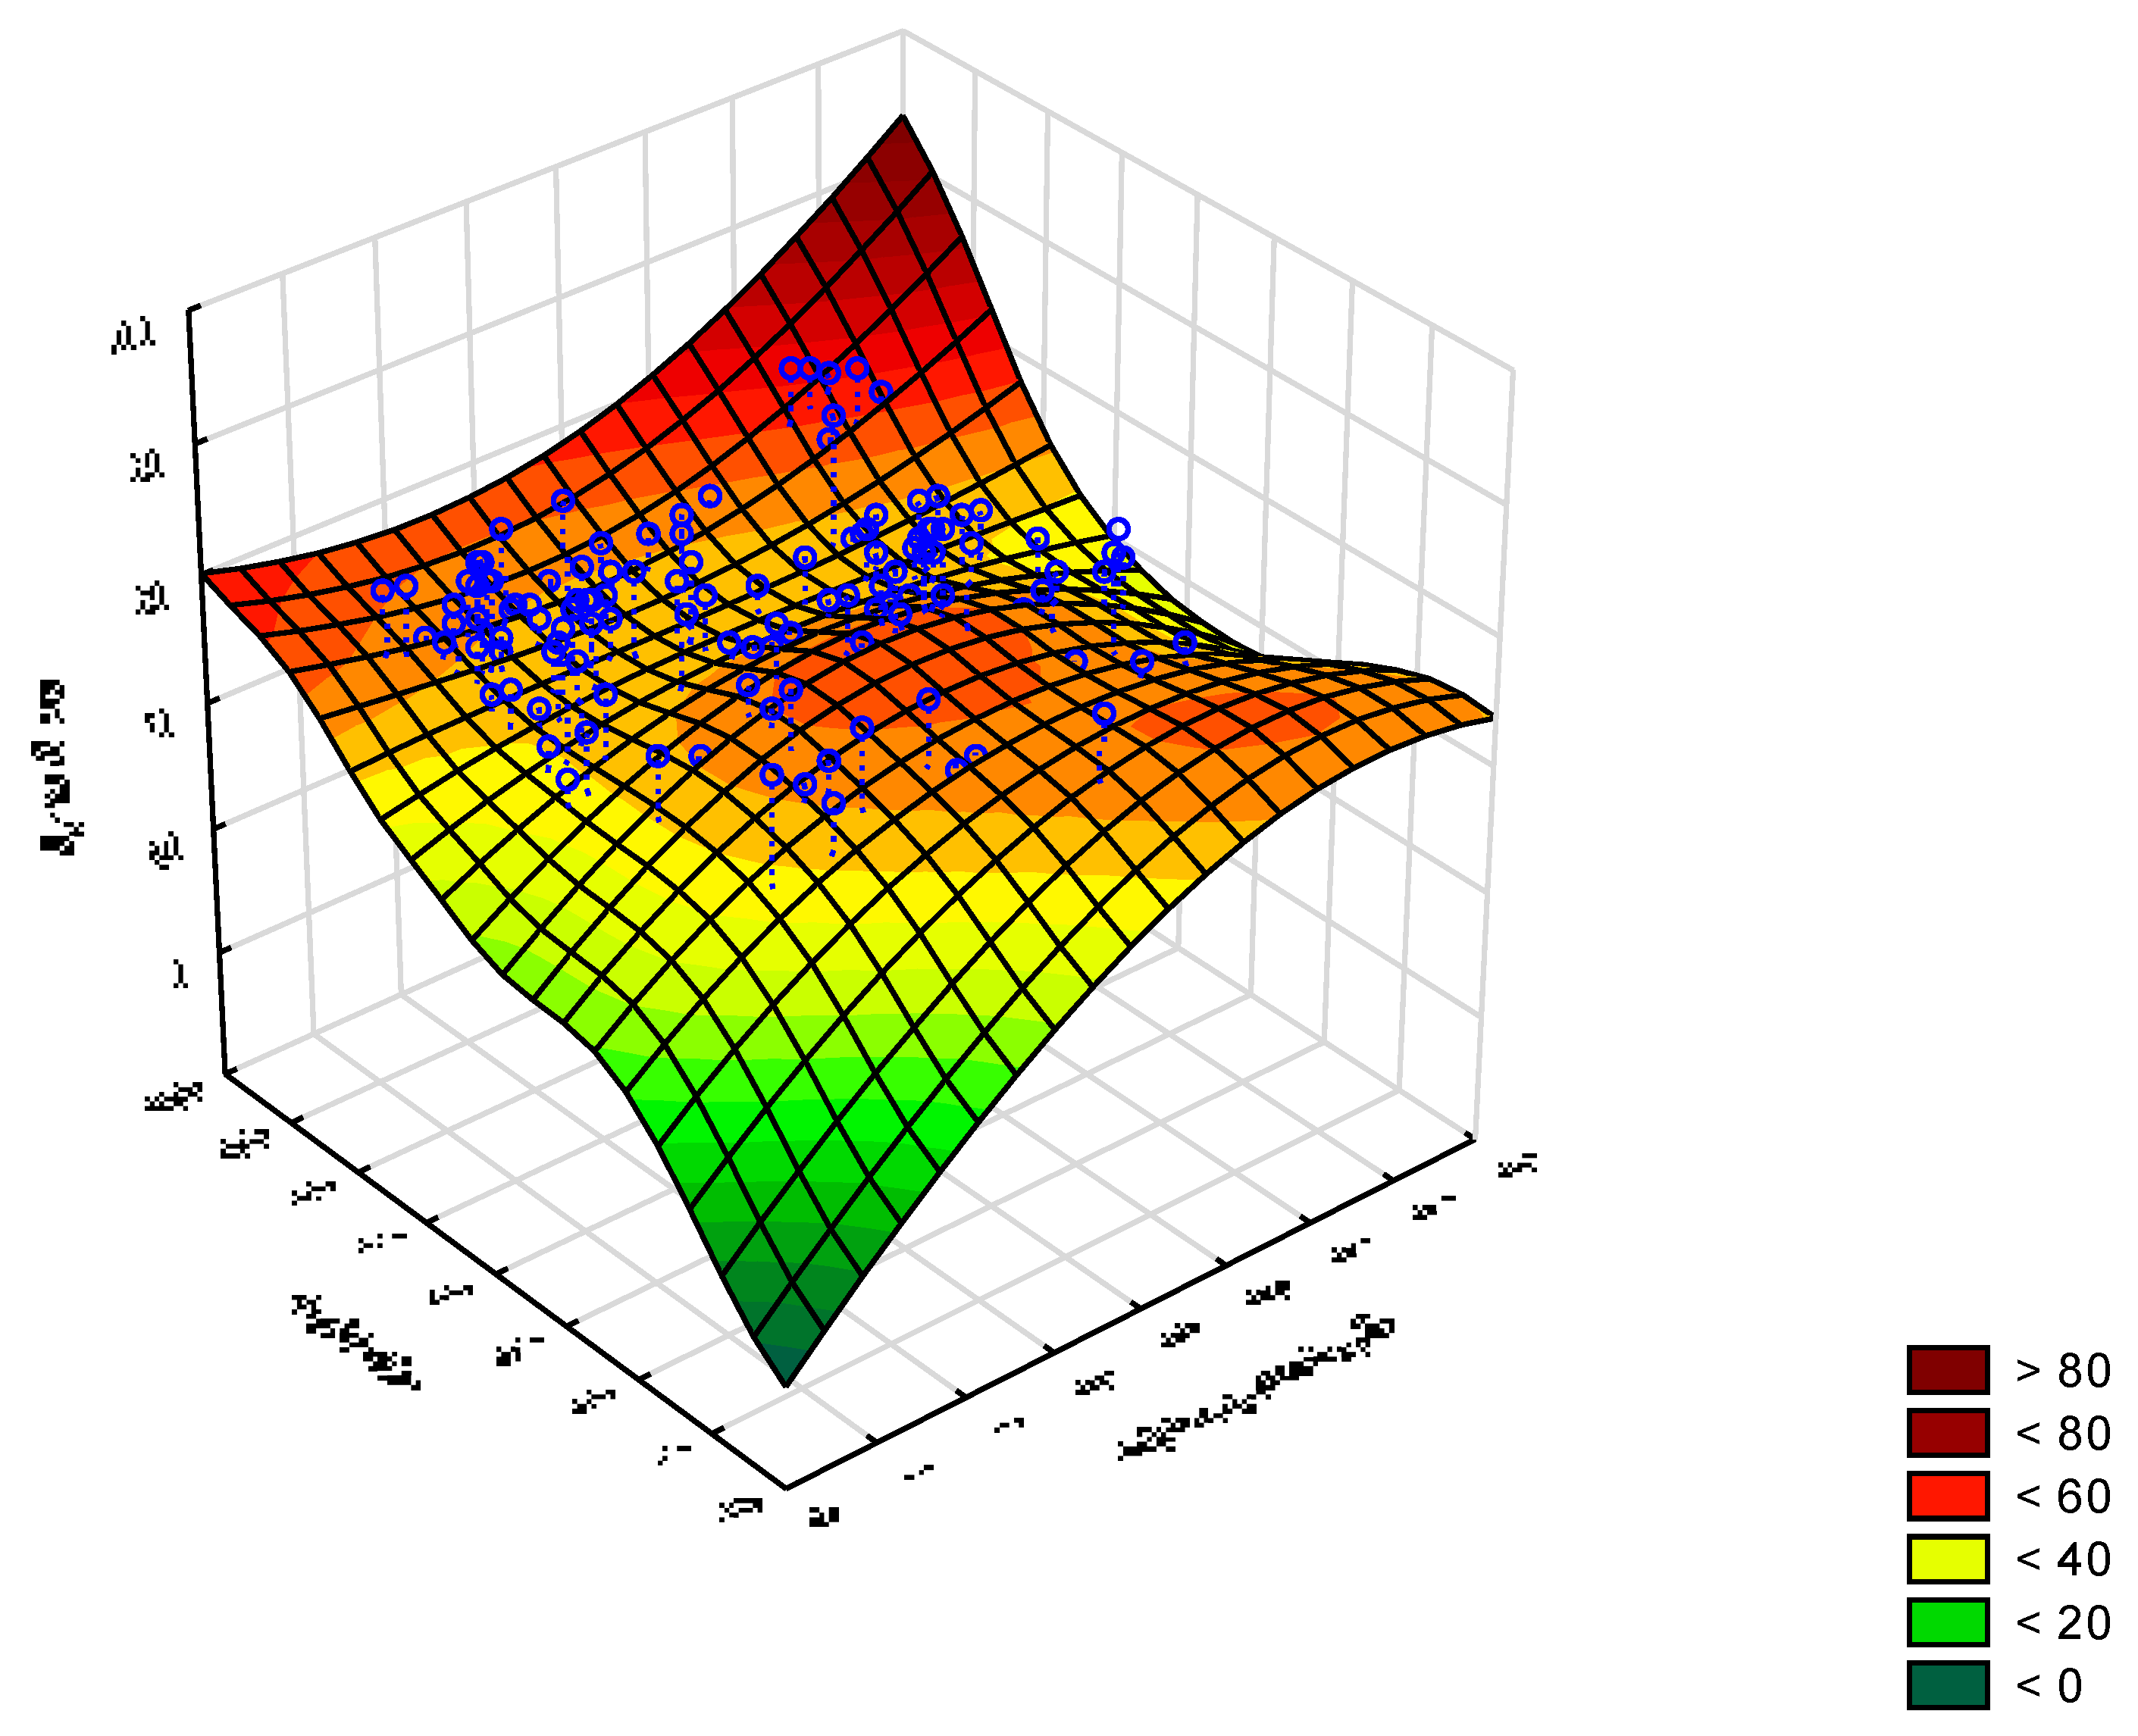

Table 1.
Definitions and ranges of values of soil and potato tuber yield variables considered in modeling.
Table 1.
Definitions and ranges of values of soil and potato tuber yield variables considered in modeling.
| Symbol of variable | Description | Data Range |
|---|---|---|
| INDEPENDET VARIABLES | ||
| PH | Soil pH measured in KCl | 5.5-7.2 |
| P_SOIL | Soil content of P2O5 (mg/100g) | 8.4-36.2 |
| K_SOIL | Soil content of K2O (mg/100g) | 8.0-26.0 |
| Mg_SOIL | Soil content of Mg (mg/100g) | 3.0-24.6 |
| HH | Hydrolytic acidity (cmol(+)∙kg-1) | 0.1-2.66 |
| S | Sum of exchangeable bases (cmol(+)∙kg-1) | 3.76-11.1 |
| CEC | Soil sorption capacity (cmol(+)∙kg-1) | 7.98-14.07 |
| V | Base saturation percentage (%) | 37.22-89.49 |
| SAND | Percentages of sand (%) | 65.24-96.16 |
| SILT | Percentages of silt (%) | 3.79-32.39 |
| CLAY | Percentages of clay (%) | 0.0-1.54 |
| OC | Organic carbon content (%) | 0.1-3.16 |
| H | Soil humus content (%) | 0.174-5.5 |
| TN | Total nitrogen (%) | 0.02-0.25 |
| DEPENDENT VARIABLE | ||
| YP | Yield of potato tubers (t∙ha-1) | 25.5-68.67 |
Table 2.
Pearson correlation matrix displaying relationships between soil parameters. Correlation coefficients are significant at a significance level of p < 0.05.
Table 2.
Pearson correlation matrix displaying relationships between soil parameters. Correlation coefficients are significant at a significance level of p < 0.05.
| CEC | PH | P_SOIL | K_SOIL | Mg_SOIL | HH | S | V | SAND | SILT | CLAY | OC | H | TN | |
|---|---|---|---|---|---|---|---|---|---|---|---|---|---|---|
| CEC | 1,00 | -0,18 | 0,10 | 0,07 | -0,10 | -0,06 | 0,35 | -0,45 | -0,20 | 0,25 | 0,18 | -0,27 | -0,27 | -0,36 |
| PH | -0,18 | 1,00 | 0,37 | 0,07 | 0,13 | -0,67 | 0,31 | 0,45 | 0,07 | -0,15 | -0,04 | 0,17 | 0,17 | 0,14 |
| P_SOIL | 0,10 | 0,37 | 1,00 | 0,46 | 0,18 | -0,27 | 0,12 | 0,05 | -0,22 | 0,20 | 0,27 | 0,10 | 0,10 | -0,33 |
| K_SOIL | 0,07 | 0,07 | 0,46 | 1,00 | 0,35 | -0,04 | -0,07 | -0,09 | -0,44 | 0,45 | 0,42 | -0,08 | -0,08 | -0,34 |
| Mg_SOIL | -0,10 | 0,13 | 0,18 | 0,35 | 1,00 | -0,08 | -0,04 | 0,03 | -0,16 | 0,08 | 0,16 | 0,08 | 0,08 | -0,01 |
| HH | -0,06 | -0,67 | -0,27 | -0,04 | -0,08 | 1,00 | -0,60 | -0,51 | 0,04 | 0,03 | -0,09 | -0,17 | -0,17 | -0,11 |
| S | 0,35 | 0,31 | 0,12 | -0,07 | -0,04 | -0,60 | 1,00 | 0,67 | -0,16 | 0,13 | 0,19 | -0,01 | -0,01 | -0,11 |
| V | -0,45 | 0,45 | 0,05 | -0,09 | 0,03 | -0,51 | 0,67 | 1,00 | -0,01 | -0,06 | 0,05 | 0,20 | 0,20 | 0,16 |
| SAND | -0,20 | 0,07 | -0,22 | -0,44 | -0,16 | 0,04 | -0,16 | -0,01 | 1,00 | -0,92 | -0,91 | 0,22 | 0,22 | 0,35 |
| SILT | 0,25 | -0,15 | 0,20 | 0,45 | 0,08 | 0,03 | 0,13 | -0,06 | -0,92 | 1,00 | 0,93 | -0,28 | -0,28 | -0,43 |
| CLAY | 0,18 | -0,04 | 0,27 | 0,42 | 0,16 | -0,09 | 0,19 | 0,05 | -0,91 | 0,93 | 1,00 | -0,22 | -0,22 | -0,37 |
| OC | -0,27 | 0,17 | 0,10 | -0,08 | 0,08 | -0,17 | -0,01 | 0,20 | 0,22 | -0,28 | -0,22 | 1,00 | 1,00 | 0,21 |
| H | -0,27 | 0,17 | 0,10 | -0,08 | 0,08 | -0,17 | -0,01 | 0,20 | 0,22 | -0,28 | -0,22 | 1,00 | 1,00 | 0,21 |
| TN | -0,36 | 0,14 | -0,33 | -0,34 | -0,01 | -0,11 | -0,11 | 0,16 | 0,35 | -0,43 | -0,37 | 0,21 | 0,21 | 1,00 |
Table 3.
Descriptive statistics of soil and chemical variables across datasets.
| Variable | Statistic | Training | Testing | Validation |
|---|---|---|---|---|
| pH | Min | 5.5 | 5.6 | 5.7 |
| Max | 7.2 | 6.6 | 7.1 | |
| Mean | 6.29 | 6.19 | 6.23 | |
| SD | 0.31 | 0.30 | 0.45 | |
| P_SOIL | Min | 8.4 | 8.4 | 8.9 |
| Max | 36.2 | 25.6 | 36.2 | |
| Mean | 17.96 | 17.46 | 17.36 | |
| SD | 4.66 | 3.44 | 7.20 | |
| K_SOIL | Min | 8 | 8 | 8 |
| Max | 26 | 22 | 24.6 | |
| Mean | 16.44 | 15.92 | 15.95 | |
| SD | 3.35 | 3.06 | 5.92 | |
| Mg_SOIL | Min | 3 | 3 | 3 |
| Max | 24.6 | 17 | 24.6 | |
| Mean | 6.31 | 5.95 | 6.35 | |
| SD | 2.60 | 2.43 | 6.37 | |
| HH | Min | 0.1 | 1 | 1 |
| Max | 2.66 | 2.5 | 2.24 | |
| Mean | 1.43 | 1.47 | 1.51 | |
| SD | 0.37 | 0.43 | 0.33 | |
| S | Min | 3.76 | 4 | 5 |
| Max | 11.1 | 10.3 | 10.4 | |
| Mean | 7.39 | 7.71 | 7.19 | |
| SD | 1.47 | 1.55 | 1.48 | |
| CEC | Min | 8 | 7.98 | 8 |
| Max | 14.07 | 13.5 | 14 | |
| Mean | 10.66 | 10.83 | 10.86 | |
| SD | 1.74 | 1.94 | 1.53 | |
| V | Min | 37.22 | 44.44 | 38.96 |
| Max | 89.49 | 85.86 | 89.05 | |
| Mean | 65.38 | 67.39 | 6265 | |
| SD | 14.25 | 14.75 | 15.08 | |
| SAND | Min | 65.24 | 71.04 | 76.28 |
| Max | 96.16 | 95.17 | 95.17 | |
| Mean | 85.74 | 85.12 | 87.09 | |
| SD | 7.11 | 6.25 | 11.16 | |
| OC | Min | 0.044 | 0.096 | 0.1 |
| Max | 1.36 | 1.16 | 3.16 | |
| Mean | 0.81 | 0.81 | 0.85 | |
| TN | Min | 0.02 | 0.02 | 0.02 |
| Max | 0.2549 | 0.126 | 0.138 | |
| Mean | 0.056 | 0.053 | 0.054 | |
| SD | 0.041 | 0.034 | 0.038 | |
| YP | Min | 26.6 | 27.13 | 27 |
| Max | 68.67 | 66.87 | 65.2 | |
| Mean | 46.83 | 46.44 | 51 | |
| SD | 9.21 | 9.16 | 8.00 |
Table 4.
Model Performance Metrics.
| Abbreviation | Unit | Value |
|---|---|---|
| R2 | - | 0,8227 |
| RMSE | t∙ha-1 | 4.19 |
| MAE | t∙ha-1 | 3.35 |
| MAPE | % | 7.34 |
| MAX | t∙ha-1 | 9.35 |
| MAXP | % | 17.54 |
Table 5.
Ranking of independent variables according to their impact on the results of the global sensitivity analysis.
Table 5.
Ranking of independent variables according to their impact on the results of the global sensitivity analysis.
| Variable | Impact Value | Rank |
|---|---|---|
| CEC | 12.84 | 1 |
| V | 8.50 | 2 |
| S | 6.80 | 3 |
| K_SOIL | 2.97 | 4 |
| SAND | 1.69 | 5 |
| P_SOIL | 1.68 | 6 |
| PH | 1.15 | 7 |
| OC | 1.26 | 8 |
| HH | 1.19 | 9 |
| Mg_SOIL | 1.22 | 10 |
| TN | 1.00 | 11 |
Disclaimer/Publisher’s Note: The statements, opinions and data contained in all publications are solely those of the individual author(s) and contributor(s) and not of MDPI and/or the editor(s). MDPI and/or the editor(s) disclaim responsibility for any injury to people or property resulting from any ideas, methods, instructions or products referred to in the content. |
© 2025 by the authors. Licensee MDPI, Basel, Switzerland. This article is an open access article distributed under the terms and conditions of the Creative Commons Attribution (CC BY) license (http://creativecommons.org/licenses/by/4.0/).
Copyright: This open access article is published under a Creative Commons CC BY 4.0 license, which permit the free download, distribution, and reuse, provided that the author and preprint are cited in any reuse.


