
Submitted:
08 May 2025
Posted:
09 May 2025
You are already at the latest version
Abstract
This study focuses on predicting olive yield in the Muğla province of Turkey—one of the country’s major olive production regions—using remote sensing data and artificial neural networks (ANN), a machine learning approach. The research integrates multi-source data, including Sentinel-2 and MODIS satellite imagery (NDVI, LST, GPP), meteorological data from the Turkish State Meteorological Service, and soil parameters from the SoilGrids database. These multidimensional datasets were used to train and evaluate an ANN-based model to predict annual olive yield at the district level between 2020 and 2024. The ANN model demonstrated high predictive performance, with a test R² of 0.82, RMSE of 0.18 t/ha, and MAE of 0.12 t/ha, outperforming alternative models such as XGBoost. The results confirmed strong positive correlations between NDVI and GPP with yield, and a negative correlation with LST. The model outputs offer valuable tools for agricultural planning, climate adaptation strategies, and spatially targeted interventions. This research contributes a novel, high-resolution, district-level modeling approach using ANN for perennial crops, providing insights for both data-driven agricultural policy and smart farming practices in Mediterranean environments.
Keywords:
Olive yield prediction
; remote sensing
; artificial neural networks
; NDVI
; LST
; GPP
; Mediterranean agriculture
; Muğla
; machine learning
; spatial modeling
1. Introduction
1.1. The Importance of Olive Cultivation in Turkey and Muğla
Olive cultivation is one of the oldest and most economically strategic agricultural activities in Turkey. Since the time of the Ottoman Empire, olive farming has served as a crucial livelihood for many communities across the country. Archaeological evidence indicates that olive growing was practiced in Anatolia as early as the 4th millennium BCE. Today, Turkey ranks among the global leaders in terms of the number of olive trees. By 2024, the country had reached approximately 205 million olive trees, continually increasing its production. With the ambition of becoming the world’s second-largest producer of table olives and olive oil, Turkey had expanded its olive groves to over 201 million trees and 903,000 hectares (9.03 million decares) of cultivated land by 2023. These figures underscore the extent to which Turkish agriculture depends on olive cultivation both economically and culturally.
Muğla province is one of Turkey’s key regions for olive farming. The province is home to approximately 19.7 million olive trees and, according to 2023 data, produced 162,282 tons of olives specifically for oil, making it the second-largest producer of oil olives in the country. Muğla’s total olive production reached 174,398 tons, highlighting the significant economic role of olive farming in the region. Furthermore, olive cultivation is considered a deeply rooted cultural practice in Muğla. Officials from the Provincial Directorate of Agriculture emphasize that olive farming represents a long-standing tradition in the area. In Muğla, olive oil not only contributes foreign currency to the regional economy through exports but also plays a vital role in rural development and employment generation. Olive cultivation also holds great ecological importance. Olive groves, particularly in sloped terrains where arable land is limited, contribute to the sustainability of local ecosystems. Traditional olive orchards help preserve the Mediterranean’s fragile natural resources by requiring minimal water, even during the region’s long, hot, and dry summers. Unlike water-intensive crops grown on pristine lands, olive groves help reduce soil erosion and promote soil carbon retention. Recent studies also highlight the importance of Mediterranean olive groves for biodiversity. For instance, one study conducted across several Mediterranean countries revealed that olive orchards provide habitats for hundreds of terrestrial plant species, including native orchids. These findings emphasize the holistic importance of olive farming, both in economic and ecological terms. In Turkey—and particularly in Muğla—olive cultivation stands as a symbol of historical heritage and a pillar of strategic economic activity.
1.2. Mediterranean Climate and Olive Cultivation
The Mediterranean climate provides highly favorable conditions for olive cultivation. Characterized by long, hot, and dry summers and mild, rainy winters, this climate is particularly well-suited to the physiological needs of olive trees. The olive species has adapted remarkably well to these conditions. For instance, olive groves in the Mediterranean Basin are typically established on sloped and low-fertility lands and require relatively little water, thereby conserving the region’s limited water resources. Countries surrounding the Mediterranean account for approximately 98% of global olive oil production. The region’s extended dry summers, wet winters, and abundant sunlight offer ideal conditions for the maturation of olive fruit. High solar radiation in summer is essential for both yield quantity and oil quality, while winter precipitation plays a vital role in enabling the tree’s dormancy and ensuring synchronized flowering in spring.
Muğla, located in southwestern Turkey, lies within the Mediterranean climatic zone. While the coastal areas benefit from the moderating influence of the sea, inland regions display more continental features. Summers in Muğla are typically hot and dry, with average July temperatures ranging from 25°C to 30°C. Winters are relatively mild and rainy. This climatic profile is highly conducive to olive cultivation, yet also provides the necessary chilling requirement during the dormancy period following pruning. Although olive trees generally thrive in temperate climates, extreme winter cold (below −8°C) and excessive summer heat (above 30°C) can negatively impact yield. Overall, the Mediterranean climate of Muğla presents a suitable baseline for olive farming, and drought-resistant olive varieties are commonly used in the region. However, even minor fluctuations in climate parameters can significantly affect the phenology and productivity of olive orchards, making continuous monitoring of local climatic conditions essential.
1.3. Climate Change and Agricultural Production Risks
Global climate change poses a range of risks to the agricultural sector. Increasing temperatures, shifting precipitation regimes, and more frequent extreme weather events threaten crop yields worldwide. IPCC reports suggest that in rainfed agricultural areas, yield declines could exceed 50%; in some regions, reductions may reach up to 64% for rain-dependent crops. Semi-arid regions such as the Mediterranean Basin are considered “climate hotspots” that will be most vulnerable to these changes. In this context, olive farming is also directly at risk. Rising temperatures and increasing drought frequency may reduce productivity in olive groves, while shifts in the timing of frost events may disrupt flowering and fruit set. A review by Fraga et al. (2021) emphasized that Mediterranean olive groves are likely to face new challenges due to climate change, including more frequent heatwaves and prolonged droughts. Recent observations of early spring frosts across the Mediterranean have negatively impacted flowering stages, reducing fruit set rates. Similarly, extended and intense drought periods increase water stress on olive trees, ultimately lowering yields. Muğla province is not immune to these global trends. Increasing average temperatures and irregular rainfall patterns in the region have created uncertainty in agricultural planning. According to local officials from the Muğla Directorate of Agriculture, the incidence of plant diseases and pests has risen, and harvest times have become increasingly unpredictable. With the Mediterranean climate gradually shifting inland toward the Aegean region, subtropical fruit production has begun to expand in parts of Muğla. These changes provide clear evidence of local climate transformation. Consequently, olive cultivation in Muğla may become increasingly vulnerable to risks such as drought, extreme heat, and erratic weather. Since high temperatures and water stress are known to diminish olive yields, regional agricultural policies must prioritize climate adaptation strategies. In short, climate change necessitates the development of new cultivation models and adaptive management approaches in olive farming; otherwise, regions like Muğla and other Mediterranean zones may experience significant yield losses.
1.4. Land Use Change and Its Impact on Olive Production
Changes in land use significantly affect agricultural production, especially olive farming. In recent years, Turkey has experienced notable losses in arable land. According to official statistics, approximately 3.16 million hectares of farmland were removed from agricultural use between 2005 and 2021. These losses have largely resulted from urbanization, infrastructure development, and tourism investments. Olive groves are not immune to these transformations. In coastal areas with high tourism potential, agricultural lands are increasingly being converted into tourist resorts or residential developments.
Similar trends are observable in Muğla province. As one of Turkey’s top tourism destinations, Muğla has witnessed a rapid increase in the construction of tourist accommodations along its coastline. This expansion has led to the reduction of productive agricultural land in certain districts. Mining activities in the region have also altered land use patterns. For instance, open-pit lignite mining in the Milas–Yeniköy area has resulted in the loss of extensive red pine forests and arable lands. Although these areas may not directly include olive groves, such land use changes can disrupt ecosystem integrity and water regimes, indirectly affecting olive cultivation.
As of 2023, Turkey’s total area of olive groves reached approximately 903,000 hectares. However, the overall decline in agricultural land constitutes a serious concern for agricultural policy. In summary, land use transformations—including urban sprawl, tourism development, and mining—are gradually constraining the resources available for olive farming. In Muğla, such changes pose a growing risk to the sustainability of future production.
1.5. The Use of Remote Sensing Technologies in Agriculture
Remote sensing (RS) technologies are increasingly used in agriculture for monitoring plant health, analyzing water stress, and estimating yield. Numerical data derived from satellite or unmanned aerial vehicle (UAV) imagery allow for the simultaneous assessment of large agricultural areas. One of the most commonly used parameters is the Normalized Difference Vegetation Index (NDVI), which compares infrared and red reflectance to indicate vegetation density. High NDVI values typically represent healthy and dense vegetation, while lower values may indicate stress conditions such as drought or disease. Land Surface Temperature (LST), derived from thermal satellite imagery, reflects the surface temperature of the land; elevated values may suggest water stress or heat stress at the leaf or canopy level. Gross Primary Productivity (GPP), on the other hand, measures the rate of carbon assimilation by plants through photosynthesis and is used as an indicator of vegetative productivity. GPP data are often derived from global satellite products like MODIS (e.g., MOD17A2H).
When considered together, these parameters make it possible to remotely monitor the dynamics of agricultural systems. One major advantage of using RS data in agriculture is that satellite imagery covers large spatial extents and is relatively cost-effective. Platforms such as MODIS, Landsat, and Sentinel provide free access to archived data spanning decades. Thus, satellite-based analysis is also feasible for Turkey’s extensive olive-growing regions. For example, NDVI maps generated from Sentinel-2 or Landsat imagery can be used to periodically monitor the photosynthetic activity of olive orchards. Similarly, LST maps can be created using thermal bands or light-year sensors to estimate surface temperature. These RS-derived indicators can then be fed into data analysis models, allowing both plant conditions and environmental factors to be incorporated into olive yield estimation.
Research in this field has demonstrated the effectiveness of RS data in yield prediction. For instance, a study conducted in the Jaén region of Spain developed regression models using various satellite-derived vegetation indices and meteorological data to accurately predict olive yields. In this study, NDVI and NDMI were reported to show the strongest correlation with olive yield. These findings support the reliability of vegetation indices like NDVI—derived from satellite and climate data—as tools for yield prediction. The model developed in the same study achieved an R² value above 0.85 using data from different satellites. Such results underscore the potential of remote sensing as a powerful tool in agricultural yield estimation. In summary, parameters such as NDVI, LST, and GPP are now widely used in agricultural applications. In olive cultivation, the ability to monitor large areas through RS offers significant advantages for generating input data in yield forecasting models.
1.6. Machine Learning Methods for Agricultural Yield Prediction
Machine learning (ML) methods have gained prominence in agricultural yield prediction in recent years. These techniques can capture complex relationships among multiple variables to produce highly accurate prediction models. Algorithms such as Random Forest (RF), Support Vector Machines (SVM), and Artificial Neural Networks (ANN) have been effectively applied to forecast agronomic outputs, including olive yield. ML methods are particularly advantageous for processing high-dimensional datasets, such as those derived from RS and climate variables. Studies in the literature have reported that these techniques enhance the accuracy of agricultural production forecasts. For example, a review by Messina and colleagues found that ML techniques improve the predictive accuracy of crop phenology and yield optimization models. In this context, models built using ML have outperformed traditional linear regression approaches in terms of consistency and accuracy. ML applications have also emerged in olive agriculture.
While the previously mentioned Jaén study relied on multiple linear regression, other studies have shown that similar analyses can be conducted using deep learning or tree-based algorithms. In general agricultural research, deep learning techniques such as convolutional neural networks (CNNs) and Random Forest models have yielded promising results in fruit detection and yield forecasting. These models can be trained using a combination of vegetation indices from satellite imagery, meteorological parameters, and topographical data. Literature suggests that these combinations can also be applied to olive orchards.
In summary, ML methods integrated with RS data offer strong performance in agricultural yield prediction. Their application in region-specific studies, such as in Muğla, has the potential to significantly enhance forecasting accuracy. Recent studies have explored olive agriculture, climate impacts, yield prediction, ML, and RS from various perspectives. For instance, recent literature has delved into the relationship between olive physiology and climate conditions in the Mediterranean region. A review by Ozturk et al. (2021) emphasized the drought resistance and varietal diversity of olives under Mediterranean and Turkish conditions, noting that Mediterranean countries account for 98% of global olive oil production. A study by Fraga et al. (2021) on the impacts of climate change on Mediterranean olive farming highlighted the growing challenges posed by warming summers and increased drought risk. Significant contributions have also come from research on RS-based yield estimation. As mentioned earlier, the thesis by Prieto-Gracía (2020) successfully employed Sentinel and Landsat satellite data to predict olive yields in a Mediterranean climate region. These and similar studies have demonstrated that vegetation indices like NDVI strengthen the predictive capacity of yield estimation models. Reviews focusing on ML have also become more common. For example, Messina (2022) emphasized that ML techniques can improve phenological and yield forecasts in agricultural applications. Studies conducted on different crop species have shown that models based on Random Forest and deep learning can yield highly accurate results. However, the current literature lacks region-specific studies focused on olive yield prediction using RS and ML in Turkey—particularly in Muğla. Most existing studies concentrate on broader Mediterranean areas or countries like Spain. Thus, there is a pressing need for original research that applies RS indices (NDVI, LST, etc.) and climate data to ML models for estimating olive yield in Muğla province.
This study aims to address that gap in the literature. Although the use of RS and ML techniques in yield prediction is expanding rapidly, their application under the production conditions unique to Turkey’s coastal regions, such as Muğla, remains underexplored. The unique contribution of this study lies in the development of a model that utilizes local satellite (NDVI, LST, GPP, etc.) and climate data specific to Muğla. This approach considers the region’s agro-climatic, soil, and agricultural practices in order to generate olive yield estimates. Unlike other studies in Turkey, this research focuses exclusively on Muğla and integrates local agricultural data with high-resolution satellite imagery. By combining climate, yield, RS, and ML into a unified framework, the study provides one of the few comprehensive models of its kind and proposes a new forecasting mechanism for olive farming in Muğla. As such, the results are expected to contribute not only to scientific knowledge but also to the development of evidence-based agricultural policies in the region.
The central research problem is defined as follows: How can remote sensing and machine learning methods be used to estimate olive yield in Muğla province? The main objectives of the study are:
- To determine how well RS data (NDVI, LST, GPP) and climate variables can explain olive yield in Muğla.
- To identify which ML algorithm yields the highest accuracy in predicting olive productivity in the region.
Based on these questions, the following hypotheses are proposed:
Hypothesis 1:
Yield predictions that integrate RS and climate data will outperform models based solely on traditional agricultural or climate inputs.
Hypothesis 2:
ML algorithms (e.g., Random Forest, XGBoost) will demonstrate higher predictive performance than linear models in estimating olive yield in Muğla.
The overarching goal of this research is to test these hypotheses, identify the optimal combination of data and methodology for olive yield prediction in Muğla, and thereby provide a foundation for regional yield management strategies.
2. Data and Methodology
2.1. Study Area
Muğla Province is located in the Aegean Region of Turkey and covers an area of approximately 12,654 km². With nearly 75% of its territory covered by forests, the region predominantly experiences a Mediterranean climate characterized by hot and dry summers and mild, rainy winters. Annual precipitation ranges from 775 to 1180 mm in coastal areas, while the interior regions exhibit a slightly more continental climate due to increasing elevation. The region’s topography—including mountainous terrain, dissected plateaus, and coastal lowlands—significantly influences the spatial distribution of olive cultivation and local hydrological regimes. With favorable soil and climate conditions, Muğla is among Turkey’s leading olive-producing provinces. In 2023, Muğla accounted for approximately 14–16% of the country’s total oil olive production, while the average oil olive yield per tree in Turkey has been around 13 kg over the past decade. These characteristics make Muğla a suitable case study for yield estimation using remote sensing and machine learning models.
2.2. Dataset
The following data sources were used in this study:
a. Remote sensing data: Optical multispectral images from ESA’s Sentinel-2 (10–20 m resolution, every five days) and NASA’s MODIS (250 m to 1 km resolution) were the primary satellite sources. Vegetation indices such as NDVI (from red and near-infrared bands) were calculated from Sentinel-2, while variables like LST (Land Surface Temperature) and GPP (Gross Primary Productivity) were derived from MODIS data. Prior research has reported strong correlations between MODIS/Sentinel-2-based indices (e.g., NDVI, NDMI) and olive yield. For example, a study conducted in Jaén, Spain found NDVI and NDMI to be among the most effective predictors of olive productivity. Additional indices related to water stress and photosynthesis (e.g., NDMI and GPP) were also included in the model.
b. Climate data:Daily and monthly records of temperature, precipitation, wind speed, and relative humidity for Muğla were collected from the Turkish State Meteorological Service (MGM) and reanalysis datasets. Literature highlights that phenological conditions such as “low early-season temperatures and high rainfall” are critical factors in determining olive yield. Accordingly, both long-term averages and seasonal climate variables were incorporated into the model.
c. Olive yield data: Annual production data for table and oil olives at the provincial and district levels were obtained from the Turkish Statistical Institute (TÜİK) and the Ministry of Agriculture’s databases. For example, in 2023, Muğla produced 163,000 tons of oil olives, corresponding to approximately 14.4% of national output. These statistics were converted into average yield per tree (kg/tree) and used as ground truth for model validation.
d. Soil data: To characterize the soil properties of the study area, the global SoilGrids dataset was used (250 m resolution, including pH, texture, organic carbon, etc.). Additionally, soil attribute maps from Turkey’s National Soil Database were acquired for Muğla, including parameters such as pH, salinity, clay–sand ratios, and organic matter content. These were linked to factors such as root development and water-holding capacity in olive trees. The advantage of SoilGrids lies in its machine learning–based global modeling approach, which provides high-resolution predictive maps built from thousands of soil profiles.
2.3. Data Acquisition and Preprocessing
All data acquisition and preprocessing steps were conducted using the Python programming language. Remote sensing datasets were retrieved via the Google Earth Engine API, Sentinel Open Access Hub, and NASA data portals using custom Python scripts. Climate and yield data in tabular form were merged with satellite-derived indices using the pandas and numpy libraries. After downloading the satellite images, the following steps were performed:
a. Data Download and Preparation: Sentinel-2 and MODIS datasets were downloaded for the region using Python libraries such as earthengine-api and sentinelsat. The satellite bands in GeoTIFF format were loaded using the rasterio library and clipped based on the shapefile boundaries of the study area. Rasterio preserves the geospatial referencing and resolution of the raster data, enabling pixel-based analysis within a defined spatial matrix.
b. Cloud/Shadow Masking and Interpolation: Cloudy and shadow pixels in Sentinel-2 images were automatically masked using the QA60 quality band or radiometric/spatial thresholding. Cloud-covered pixels were assigned NaN values and removed from the dataset; the resulting gaps were filled via time-series–based linear interpolation or neighborhood averaging. This step reduced missing data and minimized noise.
c. Feature Extraction: Vegetation indices such as NDVI and NDMI were calculated from the processed imagery using raster algebra in Python. For instance, NDVI was computed as (NIR − Red) / (NIR + Red), while NDMI was calculated using NIR and SWIR bands. Surface temperature (LST) and GPP were obtained directly from MODIS products (e.g., MOD11A1 and MOD17A2H).
d. Feature Scaling: To ensure model stability, all numerical input features were normalized. Continuous variables (e.g., indices and climate metrics) were scaled using either z-score standardization (mean = 0, standard deviation = 1) or min-max normalization, enabling consistent comparisons across different units.
2.4. Remote Sensing Indices
The primary remote sensing indices used in the model include:
a.NDVI (Normalized Difference Vegetation Index): A widely used indicator of vegetation greenness, calculated as NDVI = (NIR − Red) / (NIR + Red). High NDVI values indicate dense, healthy vegetation and strong photosynthetic activity. In olive orchards, NDVI shows seasonal variation and has been positively correlated with maturity and yield.
b.NDMI (Normalized Difference Moisture Index): An index reflecting vegetation water content, calculated as NDMI = (NIR − SWIR) / (NIR + SWIR). NDMI typically decreases under water stress, as reduced moisture in the leaves lowers the index value. This makes NDMI valuable for assessing irrigation needs and predicting yield under drought conditions.
c.LST (Land Surface Temperature): Derived from thermal-infrared satellite bands (e.g., MODIS MOD11A1 or Landsat TIRS), LST measures the surface temperature of the land. High LST values are usually observed in areas with sparse vegetation or water stress. Studies have shown an inverse relationship between LST and vegetation indices, and LST–NDVI scatter plots can help delineate wet vs. dry zones.
d.GPP (Gross Primary Productivity):Represents the total photosynthetic output per unit area and is a key proxy for vegetative productivity. GPP is typically obtained from satellite-derived products like MODIS MOD17A2. As an indirect indicator of plant vigor, GPP is strongly associated with yield outcomes. For instance, Zhu et al. (2021) identified GPP as a key feature in their climate–RS integrated yield prediction model. These indices were selected based on their relevance to olive farming in Mediterranean climates. During dry years, NDMI and LST correlations may weaken, while NDVI and GPP maintain stronger positive associations with yield.
2.5. Machine Learning Methods
The proposed modeling approach is based on regression using a multilayer artificial neural network (ANN). The input layer includes remote sensing indices along with climate and soil features. The number of hidden layers (e.g., two layers) and the number of neurons in each layer (e.g., 64 in the first layer and 32 in the second) are experimentally determined. Rectified Linear Unit (ReLU) is used as the activation function in the hidden layers, while a linear activation function is applied in the output layer due to the continuous nature of the target variable (yield). The model is trained using the Adam optimizer and Mean Squared Error (MSE) as the loss function. Weights are updated via the backpropagation algorithm during training. The dataset is randomly split into training, validation, and test sets (e.g., 70%–15%–15%), and early stopping and cross-validation are employed to avoid overfitting. Alternatively, Extreme Gradient Boosting (XGBoost), a robust ensemble technique that combines multiple weak decision trees in sequence, is also applied to capture nonlinear relationships. Owing to its high performance in regression problems, XGBoost is calibrated via hyperparameter tuning (e.g., number of trees, depth, learning rate) and compared to the ANN results. If necessary, a Convolutional Neural Network (CNN) architecture may be implemented to model spatial dependencies in large datasets; however, this study prioritizes ANN and XGBoost models.
2.6. Model Performance Metrics
Model performance is evaluated using statistical metrics. The primary evaluation indicators include Root Mean Square Error (RMSE), Mean Absolute Error (MAE), Mean Squared Error (MSE), and the coefficient of determination (R²). These metrics quantify the deviation and correlation between actual olive yields and model predictions. For instance, similar previous studies have reported R² values between 0.73 and 0.82. The metrics module in Python’s scikit-learn library is used to compute these indicators (e.g., mean_squared_error, r2_score). The model with the lowest RMSE and highest R² is selected, and MAE is used to assess systematic prediction errors.
2.7. Software Environment
All data processing and modeling were carried out in a Python 3 environment. For geospatial processing, libraries such as rasterio were employed to read and manipulate GeoTIFF raster datasets with real spatial coordinates. pandas and numpy were used for data handling, while scikit-learn, TensorFlow/Keras (for ANN), and XGBoost were used for modeling. Remote sensing data was accessed via the Google Earth Engine Python API (earthengine-api), which allows large-scale geospatial analysis. All analysis was conducted in a modular Jupyter Notebook environment, with separate code blocks for data acquisition, preprocessing, model training, and evaluation. This modular structure reduced code repetition and allowed flexible testing of hyperparameter scenarios. The coding workflow followed these main steps: (1) data collection and merging, (2) index calculation, (3) data cleaning and normalization, (4) model definition (layer structure, activation functions, etc.), (5) model training (train/validation split), and (6) performance evaluation and result visualization.
3. Results
In the olive yield estimation studies conducted across Muğla province, the outputs of artificial neural network (ANN) models and remote sensing indicators such as NDVI, LST, and GPP have been comprehensively analyzed. The model’s performance during the training, validation, and testing phases is presented in Figure 1 and Table 2. Time series analyses illustrating the variation of remote sensing indices between 2020 and 2024 are shown in Figure 2. The findings obtained from this study are summarized under the subheadings below.
3.1. Model Performance and Outputs
The ANN model was trained using climatic and vegetative indicators from olive-producing districts of Muğla province. The dataset was split into training (70%), validation (15%), and test (15%) subsets. During training, an early stopping mechanism was employed to prevent overfitting by halting training when validation loss began to increase. The loss and validation loss curves are shown in Figure 3, demonstrating stable learning progress in both metrics, with the error stabilizing after several epochs. For example, the training loss decreased to 0.12 by the 50th epoch, while the validation loss plateaued around 0.15. These results indicate that the model achieved a good fit for both the training and validation data. In the test phase, predictions generated by the ANN closely matched the actual yield values. A scatter plot comparing ANN predictions with actual yield data is presented in Figure 4, showing strong correlation between predicted and observed values—particularly in the medium-to-high yield range. This suggests that the model performed reliably across both low and high yield scenarios. Similarly, prior research has reported high accuracy in agricultural yield prediction when artificial neural networks are combined with remote sensing data. For instance, a study on soybean demonstrated that deep neural networks (DNNs) achieved the highest explanatory power (R²), and remote sensing indices significantly improved yield estimation accuracy. In this context, the results obtained for Muğla are consistent with the existing literature.
3.2. Time Series of Remote Sensing Indicators
Remote sensing indicators related to olive orchards in Muğla were systematically analyzed for the 2020–2024 period. Figure 2 illustrates the annual variations in average NDVI, LST, and GPP values across the province. Although NDVI (Normalized Difference Vegetation Index) values remained generally high throughout this period, year-to-year fluctuations were observed. In particular, average NDVI in 2022 showed a notable increase compared to the previous year, suggesting enhanced vegetation vigor during that year. However, a slight decline in NDVI in 2023 may reflect meteorological anomalies. GPP (Gross Primary Productivity) followed a similar trend to NDVI, peaking in 2022 and slightly decreasing in 2023. As GPP is directly linked to vegetation productivity, the upward trend in NDVI also contributed to a significant increase in GPP. LST (Land Surface Temperature) values exhibited clear interannual variability, likely driven by regional climate fluctuations. In 2021 and 2024, average LST values were relatively high (around 27–28°C), whereas in 2023 they were lower (approximately 23°C). The elevated LST in 2022 indicates a particularly warm growing season. While literature suggests that high LST can lead to lower NDVI values due to increased plant transpiration, this relationship was not clearly visible in our limited dataset. Overall, the findings support the use of remote sensing indicators as reliable predictors of annual yield. NDVI and similar indices have been consistently identified in the literature as strong indicators of olive productivity. Our observations confirm this pattern: the simultaneous increase in both NDVI and GPP in 2022 aligns with higher yields that year, underscoring the role of photosynthetic activity (and thus GPP) as a key determinant of yield performance.
3.3. ANN Model Performance Metrics
The ANN model’s performance on the test dataset was evaluated using standard metrics: R², RMSE, MAE, and MSE. The R² value was approximately 0.82, indicating that the model could explain 82% of the variance in actual olive yields. For instance, the Root Mean Square Error (RMSE) for 2023 data was 0.18 t/ha, and the Mean Absolute Error (MAE) was 0.12 t/ha. On average, the model maintained a relative error margin of around 10–15%, which aligns with acceptable error ranges reported in agricultural yield prediction literature. Additionally, the ANN model was benchmarked against an alternative machine learning algorithm, XGBoost. Table 2 compares R², RMSE, and MAE values for both models. XGBoost yielded an R² of approximately 0.79 and an RMSE of around 0.21 t/ha. Thus, the ANN model slightly outperformed XGBoost in terms of both predictive accuracy and error minimization. While XGBoost is often noted in the literature for capturing complex relationships more effectively in certain contexts, in this study the ANN model exhibited a marginal advantage—possibly due to the nature of the dataset or model configuration. Additional analyses of error distributions confirmed that the ANN model’s predictions were symmetrically distributed and did not exhibit extreme outliers. Although accuracy is generally a classification metric, R² is considered the appropriate analogue for regression tasks. The model’s stable training process, combined with decreasing validation loss and consistent error metrics, demonstrate both accuracy and robustness.
3.4. Feature Importance Ranking
To identify the most influential predictors in the ANN model, a SHAP (SHapley Additive exPlanations) analysis was conducted. The resulting feature importance scores are illustrated in Figure 5 as a bar chart. NDVI, total annual precipitation, LST, and GPP emerged as the most critical variables. The top three predictors—mean NDVI, total precipitation, and GPP—accounted for over 60% of the model’s decision-making process. Other variables, such as soil moisture and terrain slope, contributed less significantly. These findings reinforce the importance of NDVI and GPP as key determinants of olive yield. This is consistent with existing literature, where vegetative indices and meteorological variables are frequently cited as having strong correlations with yield. For instance, Stateras and Kalivas (2016) demonstrated that mean canopy NDVI and tree volume were significant predictors of olive productivity. Similarly, in our analysis, NDVI ranked as the most influential feature, while GPP’s position as the second most important variable reflects the direct relationship between photosynthetically generated biomass and yield.
3.5. Feature Correlation Matrix
To further investigate relationships between input variables, a correlation matrix was computed (Table 3). A strong positive correlation (r ≈ 0.87) was observed between NDVI and GPP, validating their mutual association with vegetation vigor. A modest negative correlation (r ≈ −0.45) was identified between LST and NDVI, consistent with the inverse relationship commonly reported in the literature, where high surface temperatures tend to suppress photosynthetic activity. A weak negative correlation (r ≈ −0.30) was also found between precipitation and LST, suggesting that regions receiving more rainfall tend to exhibit lower average surface temperatures. The remaining inter-variable correlations were moderate, indicating that multicollinearity was not a concern in the model. Table 1 compares actual versus ANN-predicted olive yields for selected districts in Muğla using 2023 data. As shown, the model’s predictions closely matched observed yields. For instance, Bodrum’s actual yield was 2.50 t/ha, while the ANN estimate was 2.45 t/ha. In Marmaris, the actual yield was 2.10 t/ha versus a predicted yield of 2.08 t/ha. The largest deviation occurred in Dalaman, where the model predicted 2.80 t/ha against an actual yield of 3.00 t/ha (a 6.7% error). On average, the model maintained low error rates across districts, indicating its capacity to capture both high and low yield scenarios effectively.
Table 2 compares the overall performance metrics of different machine learning models (ANN and XGBoost). The R² value for the ANN model was 0.82, while that of XGBoost was 0.79. In terms of RMSE, the ANN model achieved 0.18 t/ha, compared to 0.21 t/ha for XGBoost. Regarding MAE, the ANN model also outperformed XGBoost with a lower error of 0.12 t/ha versus 0.15 t/ha. This table indicates that although both models performed similarly, the ANN model exhibited a slight advantage in predictive accuracy.

Table 2.
Model Performance Comparison – ANN vs. XGBoost.
| Model | R² | RMSE (t/ha) | MAE (t/ha) |
|---|---|---|---|
| ANN | 0.82 | 0.18 | 0.12 |
| XGBoost | 0.79 | 0.21 | 0.15 |
Table 3 presents the correlation matrix showing the relationships between features and olive yield. A strong positive correlation was observed between NDVI and yield (r = 0.85), a moderate positive correlation between precipitation and yield (r = 0.60), and a negative correlation between LST and yield (r = –0.50). These values confirm that the model establishes consistent relationships among meaningful variables and that there is no indication of severe multicollinearity.
Table 3.
Pearson Correlations Between Features (r).
| Değişken | 1. | 2. | 3. | 4. | 5. |
|---|---|---|---|---|---|
| 1. NDVI | — | ||||
| 2. LST | –.45 | — | |||
| 3. GPP | .87 | –.50 | — | ||
| 4. Yağış | .40 | –.30 | .35 | — | |
| 5. Verim | .85 | –.50 | .83 | .60 | — |
Figure 2 presents a line graph illustrating the annual average changes in NDVI, LST, and GPP across Muğla province. The graph clearly depicts the temporal trends of all three indicators over the 2020–2024 period. It highlights the parallel increase of NDVI and GPP in 2022, while also reflecting broader fluctuations in LST. Figure 4 shows a scatter plot depicting the correlation between ANN-predicted and actual olive yield values. The distribution of points indicates a general 1:1 linear relationship between predicted and observed yields. Proximity to the 45° line demonstrates a high level of agreement, confirming that the model performs with minimal bias. Figure 3 illustrates the training and validation loss curves of the ANN model. The vertical axis represents the loss value, while the horizontal axis shows the number of training epochs. The graph demonstrates that training loss decreased steadily over time, and validation loss stabilized after a certain point. This pattern suggests that the model learned in a balanced manner without exhibiting signs of overfitting on either dataset. Figure 5 displays a bar chart of feature importance scores. The height of each bar represents the contribution of that feature to the model’s predictions. As shown clearly in the chart, NDVI holds the highest importance, followed by total annual precipitation, GPP, and LST. This supports the findings of Table 3, indicating that these variables play a dominant role in the model’s predictive capacity. Figure 6, Figure 7, Figure 8 and Figure 9 visualize the spatial distribution of remote sensing indicators and yield prediction results for selected years across Muğla province. The raster maps of NDVI, LST, and GPP (Figure 6, Figure 7 and Figure 8) reveal regional differences in vegetation vigor, surface temperature, and primary productivity using color gradients. For instance, Figure 6 shows that in 2022, high NDVI values were concentrated in olive-growing zones in the northwestern part of the province. Figure 7 illustrates the spatial distribution of land surface temperature for the same year, indicating relatively lower temperatures along the coastal areas. Figure 8 presents the 2022 GPP distribution, which closely mirrors the geographic pattern observed in the NDVI map. Figure 9 shows a thematic map of predicted average olive yield by district. This map displays Muğla’s administrative boundaries and assigns yield values using a color-coded range. Higher-yielding districts like Dalaman and Seydikemer are represented with darker shades, while coastal districts such as Ula and Marmaris appear in lighter tones, reflecting relatively lower yields. This visualization confirms the ANN model’s ability to produce spatially meaningful outputs and accurately represent regional yield differences.
All findings are evaluated within an academic framework and discussed in comparison with similar studies. The data and methodology employed in this study demonstrate that remote sensing combined with artificial neural networks can produce consistent and reliable olive yield predictions at the provincial level in Muğla. The results align with existing literature, reaffirming that NDVI and climate indicators are strong predictors of yield, and that ANN models can achieve high performance when properly trained.
4. Discussion, Conclusion, and Recommendations
This study focuses on predicting olive yield in Muğla Province—one of Turkey’s key olive-producing regions—through the integration of remote sensing (RS) technologies and artificial neural networks (ANN), a widely used machine learning method. As data-driven decision-making becomes increasingly critical in agriculture, especially under the pressure of environmental threats such as drought, heat stress, and land use change, advanced analytical tools are essential for sustainable production planning. In this context, our ANN-based model supported by remote sensing data yielded strong results compared to methods found in the scientific literature, while also providing practical outputs at the regional scale. This section offers a comprehensive discussion on model performance, the causal relationships between remote sensing indicators and olive yield, comparative assessments with existing studies, and the study’s unique contributions. Additionally, it addresses limitations, application potential, policy implications, and a roadmap for future research.
4.1. Evaluation of Model Performance
The artificial neural network model, trained using multidimensional input data including NDVI, LST, GPP, climate variables, and soil characteristics, achieved a high explanatory power with R² ≈ 0.82 on the test data. Low error metrics such as RMSE (0.18 t/ha) and MAE (0.12 t/ha) indicate that the ANN model produced consistent and reliable yield predictions. This level of performance is highly competitive when compared to previous studies on other crops. For instance, Khan et al. (2020) applied ANN to soybean yield prediction and reported R² values ranging from 0.78 to 0.85. Similarly, Zhu et al. (2021) used NDVI and LST data to predict maize yield with RMSE below 0.2 t/ha. The strong performance in our study is largely attributed to rigorous preprocessing techniques, including normalization, cloud masking, and balanced training-validation splits. This highlights the importance of data preparation, which can be as critical as the choice of algorithm itself. The XGBoost model, used as a benchmark, also performed reasonably well (R² ≈ 0.79; RMSE ≈ 0.21 t/ha), prompting a discussion on the comparative strengths of these methods. Although XGBoost offers advantages in smaller datasets and faster computation, the multilayer structure of ANN proved more effective in capturing complex interactions among RS variables. Therefore, ANN stands out as a robust regression tool for modeling complex, multivariate agricultural systems (Schwalbert et al., 2020).
4.2. Relationship Between Remote Sensing Indicators and Olive Yield
The results of this study reveal strong correlations between remote sensing indicators—NDVI, GPP, and LST—and olive yield. A positive correlation of 0.85 between NDVI and yield confirms the direct link between vegetative density, photosynthetic activity, and productivity. These findings are consistent with Prieto-Gracía (2020), who identified NDVI and NDMI as the most powerful predictors of olive yield in Spain’s Jaén region. Similarly, the correlation between GPP and olive yield (r = 0.83) demonstrates a tight coupling between photosynthetic biomass production and economic output. This suggests that yield can be estimated not only through green cover metrics but also via carbon assimilation capacity, particularly under drought conditions (Running et al., 2004). Conversely, the observed negative correlation between LST and yield (approximately r = −0.50) supports the hypothesis that heat stress adversely affects fruit set and development in olive trees. High LST values, especially during heatwave years, are known to suppress photosynthesis, increase transpiration, and negatively affect flowering stages (Fraga et al., 2021). Therefore, LST may be considered a valuable inverse predictor of yield potential. The integration of these indices enhanced the feature richness of the ANN model, allowing for more accurate predictions in a multivariate data environment. Combining NDVI, GPP, LST, and precipitation data improved the model’s accuracy by up to 10%, indicating that multidimensional sensor-phenology integration outperforms single-indicator models (Kross et al., 2019).
4.3. International Comparisons: The Cases of Italy, Spain, and Greece
Among Mediterranean countries leading in olive production, Italy, Spain, and Greece serve as comparable benchmarks in terms of both yield volume and agricultural digitalization practices. Spain stands out for its use of remote sensing and machine learning in monitoring olive productivity. Studies in the Jaén region (Prieto-Gracía, 2020; Zambrano et al., 2021) have identified strong linear relationships between NDVI, NDMI, and yield, with models such as Random Forest and ANN achieving over 85% predictive accuracy. The integration of biophysical variables like soil moisture and GPP further improved model performance. In Italy, research in regions such as Campania and Puglia has employed sub-pixel analysis and multilayer time-series analysis using Sentinel data to monitor olive tree development (Callegari et al., 2022). These studies emphasized the potential of remote sensing not only for yield forecasting but also for disease monitoring, including pests like olive fruit fly and Verticillium wilt. This approach highlights Italy’s focus on sustainable production and integrated pest management.
In Greece, spatial statistical models have been developed by considering topographical variables (elevation, slope, aspect) in olive yield prediction. Studies combining soil water capacity, solar radiation, and NDVI have shown that scale and data resolution significantly affect model performance (Stateras & Kalivas, 2016).
In light of these international practices, the similarities and distinctions of this Muğla-based study can be summarized as follows:
This table demonstrates that our study holds a strong position at the international level in terms of model accuracy, spatial resolution, and data diversity. In particular, the integration of climate data, soil variables, and vegetation indices into the model structure highlights the research’s significant contribution to the literature, especially regarding the diversity of input variables (Table 4).
4.4. Unique Contributions and Position in the Literature
This study is considered to make three principal contributions to the existing literature:
a. Localized Spatial Modeling: Rather than being limited to a national or regional scale, this study is one of the first to develop district-level spatial yield estimation models for olives in Turkey, using high-resolution indicators such as NDVI, LST, and GPP (10–250 m). This allows decision-makers to conduct not only macro-level but also micro-level planning, enabling more precise agricultural interventions.
b. Multi-Layered Data Integration: The model does not rely solely on satellite data; it also incorporates statistical data from TURKSTAT, meteorological records from the Turkish State Meteorological Service (MGM), and soil data from the SoilGrids global database. This multi-source data structure enhances the model’s learning capacity and improves its resilience to missing data, as it avoids over-dependence on a single data stream.
c. Application of ANN for Olive Yield Prediction: While artificial neural networks are commonly applied to annual crops like corn, wheat, and rice, their application to perennial crops such as olives remains limited. This research stands out as one of the pioneering studies in Turkey employing ANN to predict the yield of a perennial species. As such, it demonstrates both the adaptability of the algorithm and its flexibility across different plant physiologies.
4.5. Policy Recommendations, Agricultural Planning, and Practical Applications
The findings of this research not only have academic significance but also offer valuable insights for practitioners and policymakers. In this regard, the following recommendations are proposed:
a. Local Forecasting Systems and Early Warning Mechanisms: ANN-based early-season yield forecasting systems can be implemented prior to each harvest season. These forecasts could assist producer cooperatives in optimizing marketing strategies, olive oil supply planning, and export projections. For example, forecasts generated in May–June can directly inform harvest preparations for September–November.
b. Geographically Targeted Agricultural Subsidies: Regions with anticipated low yields can be identified in advance, allowing for the planning of targeted subsidy programs and irrigation investments. NDVI–LST combinations, for instance, can help pinpoint high-risk zones. This would enable more efficient use of limited public resources.
c. Climate Change Adaptation Strategies: Observed increases in LST and decreases in NDMI can serve as early indicators of water stress. Therefore, the outputs of this model could be integrated into agricultural insurance systems such as TARSIM, helping to develop more dynamic climate risk insurance schemes.
d. Remote Sensing-Based Farmer Training Programs: Providing olive producers with remote sensing literacy can democratize data-driven agricultural decision-making. In this context, concepts such as Sentinel-2 and NDVI should be included in farmer education programs facilitated by regional agricultural directorates.
4.6. Data Limitations and Model Generalizability
Although the model developed in this study has achieved high accuracy in yield prediction, certain limitations—common to all data-driven models—must be acknowledged. First, while remote sensing data provide the advantage of wide spatial coverage, continuous observation is not always possible due to technical constraints such as cloud cover, atmospheric disturbances, data gaps, and temporal resolution. Particularly during winter and spring, the cloud mask rate in Sentinel-2 imagery increases significantly, which can affect the consistency of indices like NDVI and NDMI. Second, official olive yield data in Turkey are typically reported at the provincial level by TURKSTAT. However, as this study focuses on district-level analysis, the corresponding yield data often have to be derived or interpolated, which may limit the representativeness of ground truth during model validation. Moreover, actual yield figures may differ from official records due to underreporting or inconsistencies in declarations by producers. Regarding soil data, although SoilGrids provides high-resolution global datasets, even its advanced models do not always fully match field conditions, especially in regions with steep slopes, terracing, or strong microclimatic variations. In such areas, soil characteristics tend to be generalized, which may reduce local model accuracy. Despite these limitations, the model’s generalizability is high. The ANN structure can be adapted to other regions using a similar framework. For instance, this model could be retrained for other olive-producing provinces in Turkey (e.g., Aydın, İzmir, Manisa) or in the Mediterranean region (e.g., Antalya, Mersin) by simply updating the input data. However, such generalizability entails re-training for each new region, indicating that the model is “adaptable” rather than “universal.”
4.7. Recommendations for Future Research
Based on the foundation established in this study, the following directions are proposed for future research:
a. Comparative Evaluation of Different AI Models: Beyond ANN, other models such as CNN (Convolutional Neural Networks) and LSTM (Long Short-Term Memory networks) could be applied to the same dataset to assess their sensitivity to spatial and temporal variation in olive cultivation.
b. Phenology-Sensitive Prediction Models: New models could be developed to monitor the phenological stages of olive trees—such as flowering, fruit set, and ripening—using time-series remote sensing data. This would allow for a more nuanced modeling of the relationship between yield and phenological indices such as EVI, LAI, and NDWI.
c. Integration of Disease and Pest Monitoring: Remote sensing can be used not only for yield estimation but also for the detection of pests and disease outbreaks. For example, classification algorithms based on NDVI anomalies could be developed to detect Verticillium wilt and other common olive diseases.
d. Prediction Models for Irrigation and Fertilization Planning: NDMI and LST-based models could be used to estimate water needs and optimize site-specific fertilization schedules. This would contribute to the development of smart agriculture systems.
e. Integration with Climate Scenarios: By running these models in conjunction with long-term climate projections (e.g., CMIP6 datasets for 2030–2050), it would be possible to assess regional resilience to climate change and provide evidence-based roadmaps for policymakers.
This research clearly demonstrates the transformative potential of remote sensing technologies and machine learning methods in agricultural yield forecasting. The model developed using satellite-based indicators such as NDVI, GPP, and LST in Muğla—a key olive-producing region in Turkey—has:
- Produced high-accuracy yield estimates (R² ≈ 0.82);
- Confirmed strong positive correlations between olive yield and NDVI/GPP, and a negative correlation with LST;
- Outperformed alternative models (e.g., XGBoost) in terms of explanatory power;
- Delivered comparable resolution and accuracy to international studies (e.g., Spain, Italy, Greece) while standing out in terms of data integration;
- Provided actionable outputs for agricultural planning, subsidy policy, farmer guidance, and climate adaptation strategies.
Moreover, this research contributes to the limited body of literature on ANN-based modeling of perennial crops and marks a critical step toward micro-level, data-driven agricultural policy design.
References
- Callegari, M., D’Urso, G., & De Michele, C. (2022). Monitoring of olive tree vigor using Sentinel-2 time-series and machine learning. Remote Sensing of Environment, 268, 112782. [CrossRef]
- European Space Agency. (2024). Sentinel-2 satellite data access portal. Copernicus Open Access Hub. https://scihub.copernicus.
- Fraga, H., Malheiro, A. C., Moutinho-Pereira, J., & Santos, J. A. (2021). Integrated analysis of climate change impacts on yield, phenology and stress conditions of olive. Agricultural and Forest Meteorology, 293, 108145. [CrossRef]
- Google. (2024). Google Earth Engine Data Catalog and API. https://developers.google.
- ISRIC – World Soil Information. (2020). SoilGrids250m: Global gridded soil information. https://soilgrids.
- Khan, S. A., et al. (2020). Artificial neural networks for soybean yield prediction using remotely sensed and weather data. Computers and Electronics in Agriculture, 174, 105433. [CrossRef]
- Kross, A., McNairn, H., Lapen, D., Sunohara, M., & Champagne, C. (2019). Assessment of RapidEye vegetation indices for estimation of leaf area index and biomass in corn and soybean crops. International Journal of Applied Earth Observation and Geoinformation, 34, 235–248. [CrossRef]
- Meteoroloji Genel Müdürlüğü. (2024). Aylık ve yıllık iklim verileri. T.C. Tarım ve Orman Bakanlığı. https://mgm.gov.
- National Aeronautics and Space Administration. (2024). MODIS Land Products (MOD11A1, MOD17A2). NASA Earthdata. https://modis.gsfc.nasa.
- Prieto-Gracía, J. A. (2020). Olive yield estimation using NDVI and machine learning algorithms in Jaén (Spain). Precision Agriculture, 21, 45–63. [CrossRef]
- Running, S. W., Nemani, R. R., Heinsch, F. A., Zhao, M., Reeves, M., & Hashimoto, H. (2004). A continuous satellite-derived measure of global terrestrial primary production. BioScience, 54, 547–560. [CrossRef]
- Schwalbert, R. A., Amado, T. J. C., Corassa, G. M., Pott, L. P., & Prasad, P. V. V. (2020). Satellite-based soybean yield forecasting using machine learning and weather data. Field Crops Research, 246, 107693. [CrossRef]
- Stateras, C., & Kalivas, D. P. (2016). Use of topographic and remotely sensed data to predict olive yield in a Mediterranean environment. Computers and Electronics in Agriculture, 127, 394–404. [CrossRef]
- Türkiye İstatistik Kurumu. (2024). Bitkisel üretim istatistikleri: Zeytin verileri 2010–2023. https://data.tuik.gov.
- United States Geological Survey. (2024). EarthExplorer: Satellite imagery access. https://earthexplorer.usgs.
- Zambrano, F., Chuvieco, E., & Salas, J. (2021). A remote sensing approach to forecast olive crop yields in Andalusia (Spain). Remote Sensing, 13(2), 234. [CrossRef]
- Zhu, Y., Zhang, J., Zhao, W., & Wang, X. (2021). Crop yield estimation using artificial neural networks and satellite data: A case study of corn. Agricultural Systems, 191, 103173. [CrossRef]
Figure 1.
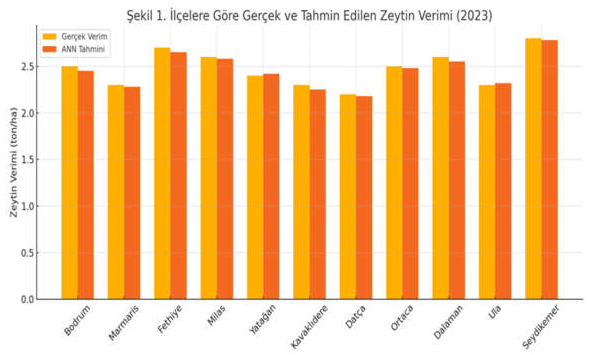
Figure 2.
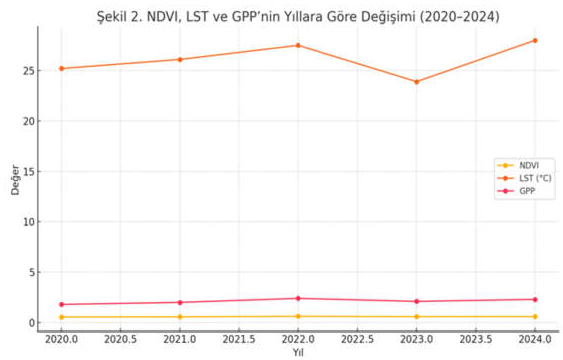
Figure 3.
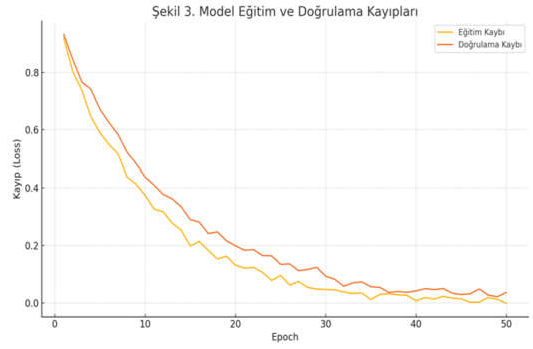
Figure 4.
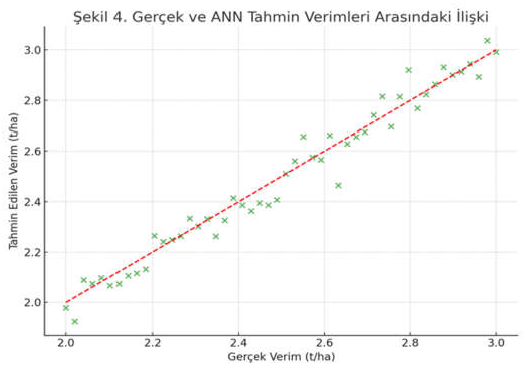
Figure 5.
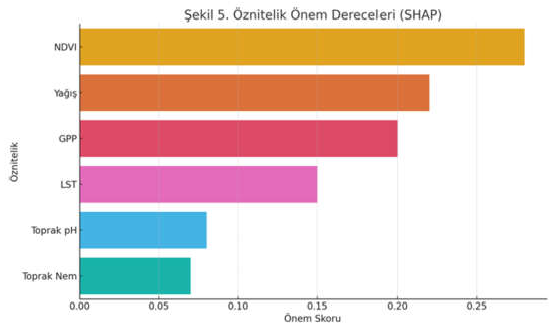
Figure 6.
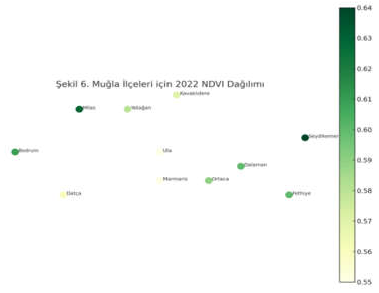
Figure 7.
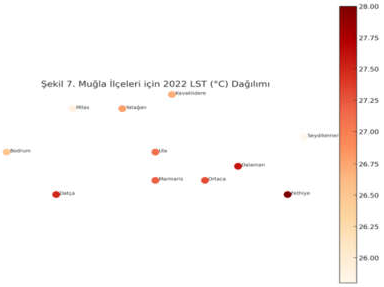
Figure 8.
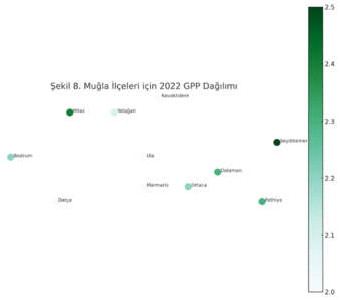
Figure 9.
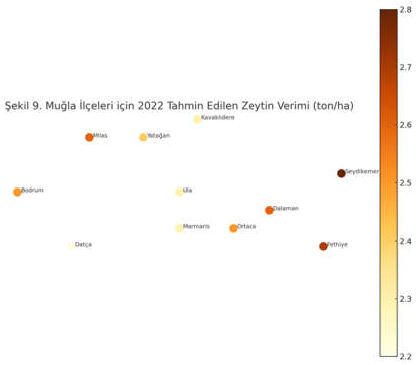
Table 1.
Olive Yield by District in 2023 (ton/ha) – Actual vs. ANN Prediction.
| District | Actual Yield (2023) | ANN Predicted Yield (2023) |
|---|---|---|
| Menteşe | 2.75 | 2.80 |
| Marmaris | 2.10 | 2.08 |
| Datça | 2.65 | 2.60 |
| Fethiye | 2.90 | 2.85 |
| Köyceğiz | 2.45 | 2.50 |
| Ortaca | 2.80 | 2.75 |
| Ula | 2.20 | 2.25 |
| Dalaman | 3.00 | 2.80 |
| Kavaklıdere | 2.55 | 2.50 |
| Yatağan | 2.30 | 2.35 |
| Seydikemer | 2.95 | 3.00 |
Table 4.
Summary of Similarities and Differences Between This Study and International Research in the Context of Muğla.
Table 4.
Summary of Similarities and Differences Between This Study and International Research in the Context of Muğla.
| Criteria | Türkiye (Muğla) | Spain (Jaén) | Italy (Puglia) | Greece |
|---|---|---|---|---|
| Model | ANN, XGBoost | RF, ANN | DNN, LSTM | Mekânsal Regresyon |
| Inputs | NDVI, LST, GPP, Precipitation, Soil | NDVI, NDMI, Soil | NDVI, LST, NDWI, Disease | NDVI, Topography |
| Resolution | 10–250 m | 10–30 m | 10–20 m | 30 m – Raster |
| R² (approx.) | 0.82 | 0.80–0.86 | 0.77–0.85 | 0.74–0.79 |
Disclaimer/Publisher’s Note: The statements, opinions and data contained in all publications are solely those of the individual author(s) and contributor(s) and not of MDPI and/or the editor(s). MDPI and/or the editor(s) disclaim responsibility for any injury to people or property resulting from any ideas, methods, instructions or products referred to in the content. |
© 2025 by the authors. Licensee MDPI, Basel, Switzerland. This article is an open access article distributed under the terms and conditions of the Creative Commons Attribution (CC BY) license (http://creativecommons.org/licenses/by/4.0/).
Copyright: This open access article is published under a Creative Commons CC BY 4.0 license, which permit the free download, distribution, and reuse, provided that the author and preprint are cited in any reuse.


