
Submitted:
29 April 2024
Posted:
16 May 2024
You are already at the latest version
Abstract
In the early stage of new vehicle development, the requirements of maximum performance of the air conditioning (AC) system are obtained through Amesim software simulation, but the calibration control of the AC system is usually carried out in the prototype-build vehicle test stage, and the test time is spanned up to 10 months after spring (autumn), summer and winter, of which up to 2 months are for environment chamber tests. Due to the long calibration cycle of AC control in the road test, which seriously affects the vehicle launch time, virtual calibration technology of air conditioning system is developed to shorten the calibration cycle of AC systems and ensure the quality of vehicles. In the project development stage, the calibration control of the vehicle AC system can be realized to carry out the functional test of the AC system in advance. In that, the grade of maturity for the AC system control can be improved, the on-road calibration test cycle can be shortened, and the development cost can be saved.
Keywords:
Air conditioning system
; Virtual calibration
; the grade of maturity
; Calibration cycle
; Thermal sensation
1. Forword
At present, the air conditioning system (AC) accounts for about 40% of the total energy consumption of electric vehicles (EV) and is the most important auxiliary system for vehicles. Based on the results from the 2022 Autohome winter test @-30℃, and taking the extended range/plug-in vehicle model as an example to evaluate the driving range change in pure EV affected by the temperature inside the car. The results indicated that the Haval H6 new energy vehicle has a low pure electric range change, but the temperature inside the car is 3.1℃, is poor comfortable. Only through the reduction of AC energy consumption, the H6 EV range can be increased. The pure EV range of the Ideal L8 varies significantly at 60.25%, but the temperature inside the car is 30.2℃, and is very comfortable. Its AC system maintained a good cabin temperature during the winter road test, as shown in Table 1.
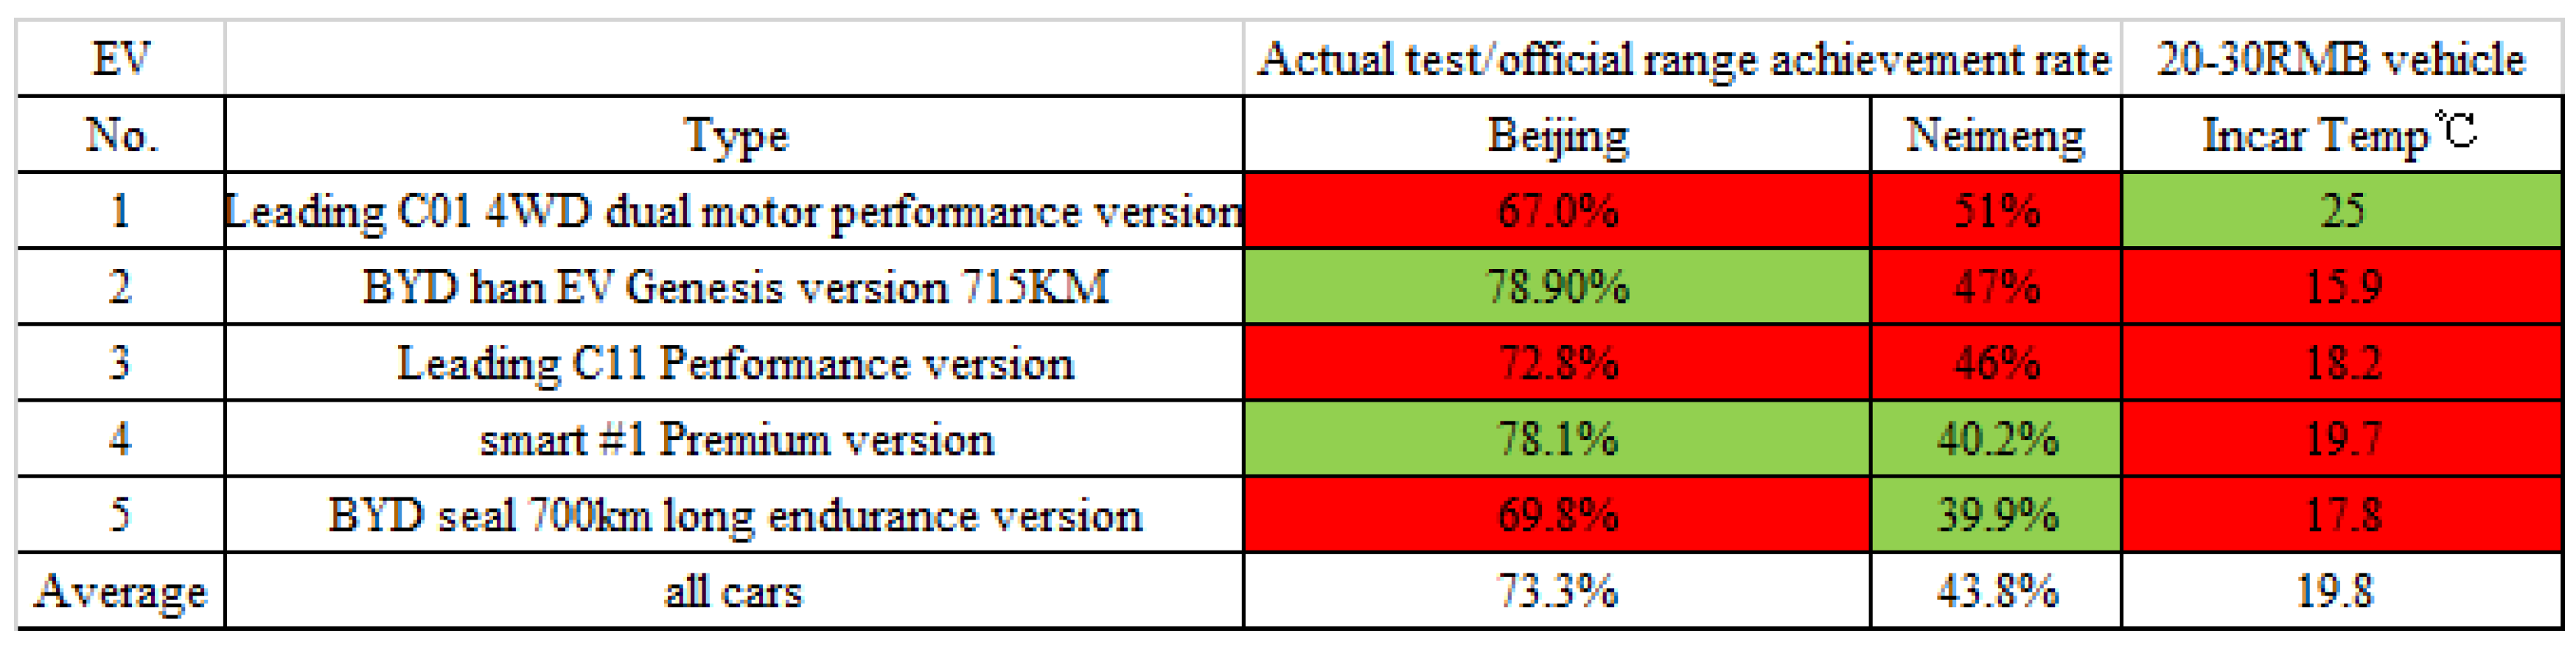
For EV models priced between 200000 and 300000 RMB, in extreme cold tests, the Leading C01 achieved a much higher range and interior temperature than its peers. The BYD Seal 700km long rear wheel drive version has a lower actual/official range achievement rate than the average, at less than 40%, and the temperature inside the car remains at 17.8℃. From the analysis results of the 5 tested cars, the overall range achievement rate in Inner Mongolia's low-temperature environment is relatively low, with only the Leading C01 reached a temperature of 25℃, which is relatively comfortable comparing to BYD’s. Please refer to Table 2 for details.
Overall, the low temperature environment in winter has a significant impact on the pure electric range of the vehicle. The working status of the AC system affects the pure EV range tremendously, and the calibration control of the AC system is particularly important in this aspect. Therefore, the preliminary AC system calibration control using simulation tool is applied to evaluate the total energy consumption of the vehicle. This article introduces the method of AC PID control, and by using virtual calibration technology to optimize the PID control strategy for improving calibration efficiency and customer comfort requirements.
PID is an algorithm that uses proportional, differential and integral methods for the controller. This control algorithm is simple, easy to implement, and is widely used in the air conditioning control. The parameters of PID needs to be fine-tuned by test engineer during actual vehicle calibration.
The PID control technology of air conditioning is an advanced control method used to ensure that the air conditioning system can efficiently and accurately achieve and maintain the set temperature. PID stands for Proportional, Integral, and Derivative, and these three elements work together in the control system to minimize the deviation between the actual temperature and the set temperature.
Proportional control (P): Based on the deviation between the current temperature and the set temperature, proportional control immediately generates an output proportional to the deviation to try to correct it. The proportional coefficient (Kp) determines the sensitivity of the output to the deviation.
Integral control (I): Integral control considers the cumulative effect of temperature deviations over a period of time. If there is a persistent deviation in the system (even a small one), integral control gradually increases its output to eliminate this cumulative deviation. The integral time constant (Ti) determines the response speed of integral control.
Derivative control (D): Derivative control predicts future temperature deviations and adjusts the output based on the rate of change of the deviation. If the deviation is rapidly increasing or decreasing, derivative control responds in advance to prevent further expansion of the deviation. The derivative time constant (Td) determines the predictive ability of derivative control.
In an air conditioning system, the PID controller receives actual temperature information feedback from temperature sensors and compares it with the set temperature to calculate the deviation value. Based on the deviation value and its rate of change, the PID controller adjusts the cooling or heating output of the air conditioning system to make the indoor temperature reach and stabilize near the set value as quickly as possible. This control method not only improves the comfort and energy efficiency of the air conditioning system but also helps to extend the service life of the system.
The evaluation method for comfort adopts the Dynamic Comfort Evaluation approach, which refers to the state of comfortable thermal environment perceived by the human body under constantly changing environmental conditions. This state is not only related to the physical parameters of the environment (such as temperature, humidity, wind speed, etc.), but also influenced by various factors such as human activity level, clothing condition, and individual differences. Dynamic Thermal Comfort emphasizes the human body's ability to adapt and regulate in a changing thermal environment, as well as the comfortable feeling of the human body in such an environment. Currently, the dynamic comfort evaluation method is mainly based on Fiala comfort evaluation, which is a thermal comfort evaluation method that comprehensively considers the interaction between the human body and the environment. It is mainly applied to the comfort evaluation of closed environments such as automobiles, involving multiple aspects such as the comfort of the seats, sound insulation effects, and thermal comfort inside the vehicle. Through this method, the comfort of automobiles can be evaluated more scientifically and accurately, providing important references and guidance for the design and manufacture of modern automobiles. The thermal sensation scale is typically divided into 7 levels, which are: Cold(-3), Cool(-2), Slightly Cool(-1), Neutral(0), Slightly Warm(+1), Warm(+2), and Hot(+3). These levels are used to describe the subjective perception of ambient temperature by the human body.
2. Physical Model
A coupled subsystem model based on Amesim and MATLAB/Simulink is developed. Amesim establishes the thermal management architecture, including sub-models such as AC system, motor and battery system, water and coolant circuit, passenger compartment model, AC box model, etc. Also apply MATLAB/Simulink tool to establish an AC control model and achieve signal interaction through the establishment of an FMU interface.
This article is based on a virtual calibration modeling of the AC system for a traditional fossil fuel powered vehicle. The AC system mainly consists of a condenser, compressor, and air conditioning assembly (evaporator, expansion valve), and refrigerant pipeline, as shown in Figure 1.
The AC box is an important connecting part of the AC assembly. Figure 2 shows the detailed sub-model of the AC box, which takes on the opening of the air doors at different positions, and determines the flow ratio at different positions under operation modes such as face blowing and feet blowing. To display the effect, complex detailed sub-models of AC boxes can be encapsulated in Amesim, as shown in Figure 3.
Build the 1D simulation model and divide the passenger compartment area into four parts: driver area, passenger area, rear left area, and rear right area. Each area is further divided into two parts: upper and lower areas, totaling eight areas; The airflow exchange between each area is calculated through CFD simulation. Four working conditions were considered: internal circulation, external circulation, blowing face, and blowing foot; This model can reflect the influence of vehicle structural dimensions, material properties, etc. Detail sub model of cabin as shown in Figure 4 and Figure 5 is Encapsulation of cabin model.
Figure 6 shows the control interface model in the Amesim main program. The control inputs are those related to the cabin environment and external environment like ambient temperature, vehicle speed, light intensity, etc. and the control outputs are those related to the compressor speed, air conditioning off/on signal, door ratio of two zone air conditioning, internal and external circulation door opening, blower air volume, etc.
Virtual calibration involves many calculations and the main control parameters for the calibration include:
1. Parameters for the targeted air outlet temperature, including set temperature, exterior temperature, interior temperature, and factors affecting sunlight intensity;
2. Parameters for temperature damper calculation, including TAO and evaporator temperature influence factor;
3. Parameters for mode dampers, including switching points for blowing surface, blowing foot, and blowing foot modes;
4. Parameters of blower voltage, relationship curve between voltage and TAO;
5. Parameters for internal and external circulation dampers, relationship between switching points and TAO values;
6. Parameters for Variable displacement compressor displacement control, such as the relationship curve between air conditioning low pressure and control current;
7. Parameters for frost and pressure protections.
The accuracy of the sub-model is the prerequisite for a successful virtual calibration, and the establishment of the model should meet the calibration requirements from the physical characteristics of the system and the performance parameters, because the final calibration parameters, in order to serve as a base for future calibration optimization, depend on the accuracy of the signals output and performance parameters of the model.
The established virtual calibration model should meet both accuracy and real-time application requirements. Therefore, the model should be appropriately modified or some other advanced technologies should be applied to fulfill these real-time application requirements.
The reusability of this successful real-time sub-models can be extended to other vehicle programs. For a new vehicle program development, besides cost benefits, the common sub-model platform can achieve much faster development turn-around time as well.
The efficiency of virtual calibration requires both software simulation and calibration hands-on testing knowledge, or to cooperate with simulation and calibration engineers to carry out calibration work. Currently, a collaborative model is adopted for rapid development.
3. Air Conditioning Control Process
The control core of automatic AC is the accurate estimation of the head temperature in order to achieve the control of the system’s critical functional parameters (outlet temperature, blower air volume, mode damper, temperature damper, blower voltage demand, and circulating damper). When there is a cooling demand, it is to achieve a balance between the actual and target temperature of the evaporator, and use that balanced temperature to control the speed demand of the compressor. The core control technology mainly involves PID control of the head temperature, which aims to accurately control the temperature and quickly reach the target set temperature. However, to achieve stable temperature control, PI control is used instead. Similarly, PI control is also used for the evaporator. Based on the head temperature setting and estimated PI control, the controlled operation of the entire AC system has been achieved. The return-loop control demand also needs to be feedback in real-time according to the external environment condition, and the system output power needs to be adjusted during the entire process to achieve infinite cycle and dynamic balance until the air conditioning is turned off. The specific air conditioning control process is shown in Figure 7.
4. Virtual Calibration
Test conditions: Under ambient temperature of 24℃, and the auto testing temperature profile as 22℃-18℃-20℃-22℃-24℃-26℃-22℃, to conduct AC testing control and optimization. The purpose of this test is to meet the requirements of AC PI control. When the air conditioner receives a customer cooling request, it may detect a rapid cooling trend in the head temperature once system starts cooling process. but it is difficult to control temperature to an appropriate level that exactly meets the control target value, resulting in overshoot as shown in Figure 8. The control logic adjusts and optimizes the AC’s KP control based on the difference between the monitoring head temperature and the control target of head temperature, as shown in Figure 9., Thus, the overshoot phenomenon is reasonably controlled. Also, during the initial controlling simulation process, poor temperature tracking between the monitoring and control target of head temperature occurred, resulting in a significant deviation between the actual monitored temperature and the control target temperature throughout the calibration process. By adjusting the KI control, reasonably good follow-up can be achieved.
5. Subjective Evaluation
Test the current production car “A” with the original control program and the optimized control program. The ambient temperature was 14 ℃, and the auto testing temperature profile of as 22 ℃ -18 ℃ -20 ℃ -22 ℃ -24 ℃ -26 ℃ -22 ℃. The temperature at the measuring point was required to be stable to switch when tested. The vehicle speed was 45km/h, and the cabin air outlet mode was blowing face and blowing foot mode. The relative humidity inside the vehicle was 44.6%. The actual vehicle AC control program was to be tested. Select the less crowed route around Baoding, Hebei Province for road testing. The road was flat and has low traffic flow, makes it more suitable for actual road testing.
Figure 10.
Test road.

It was found that the main reason for poor temperature tracking between 22 and 18 ℃ was due to the poor vehicle condition. Nevertheless, through analysis, the improved control logic is still superior to the original logic.
Figure 11.
Simulation and road test temperature tracking analysis.
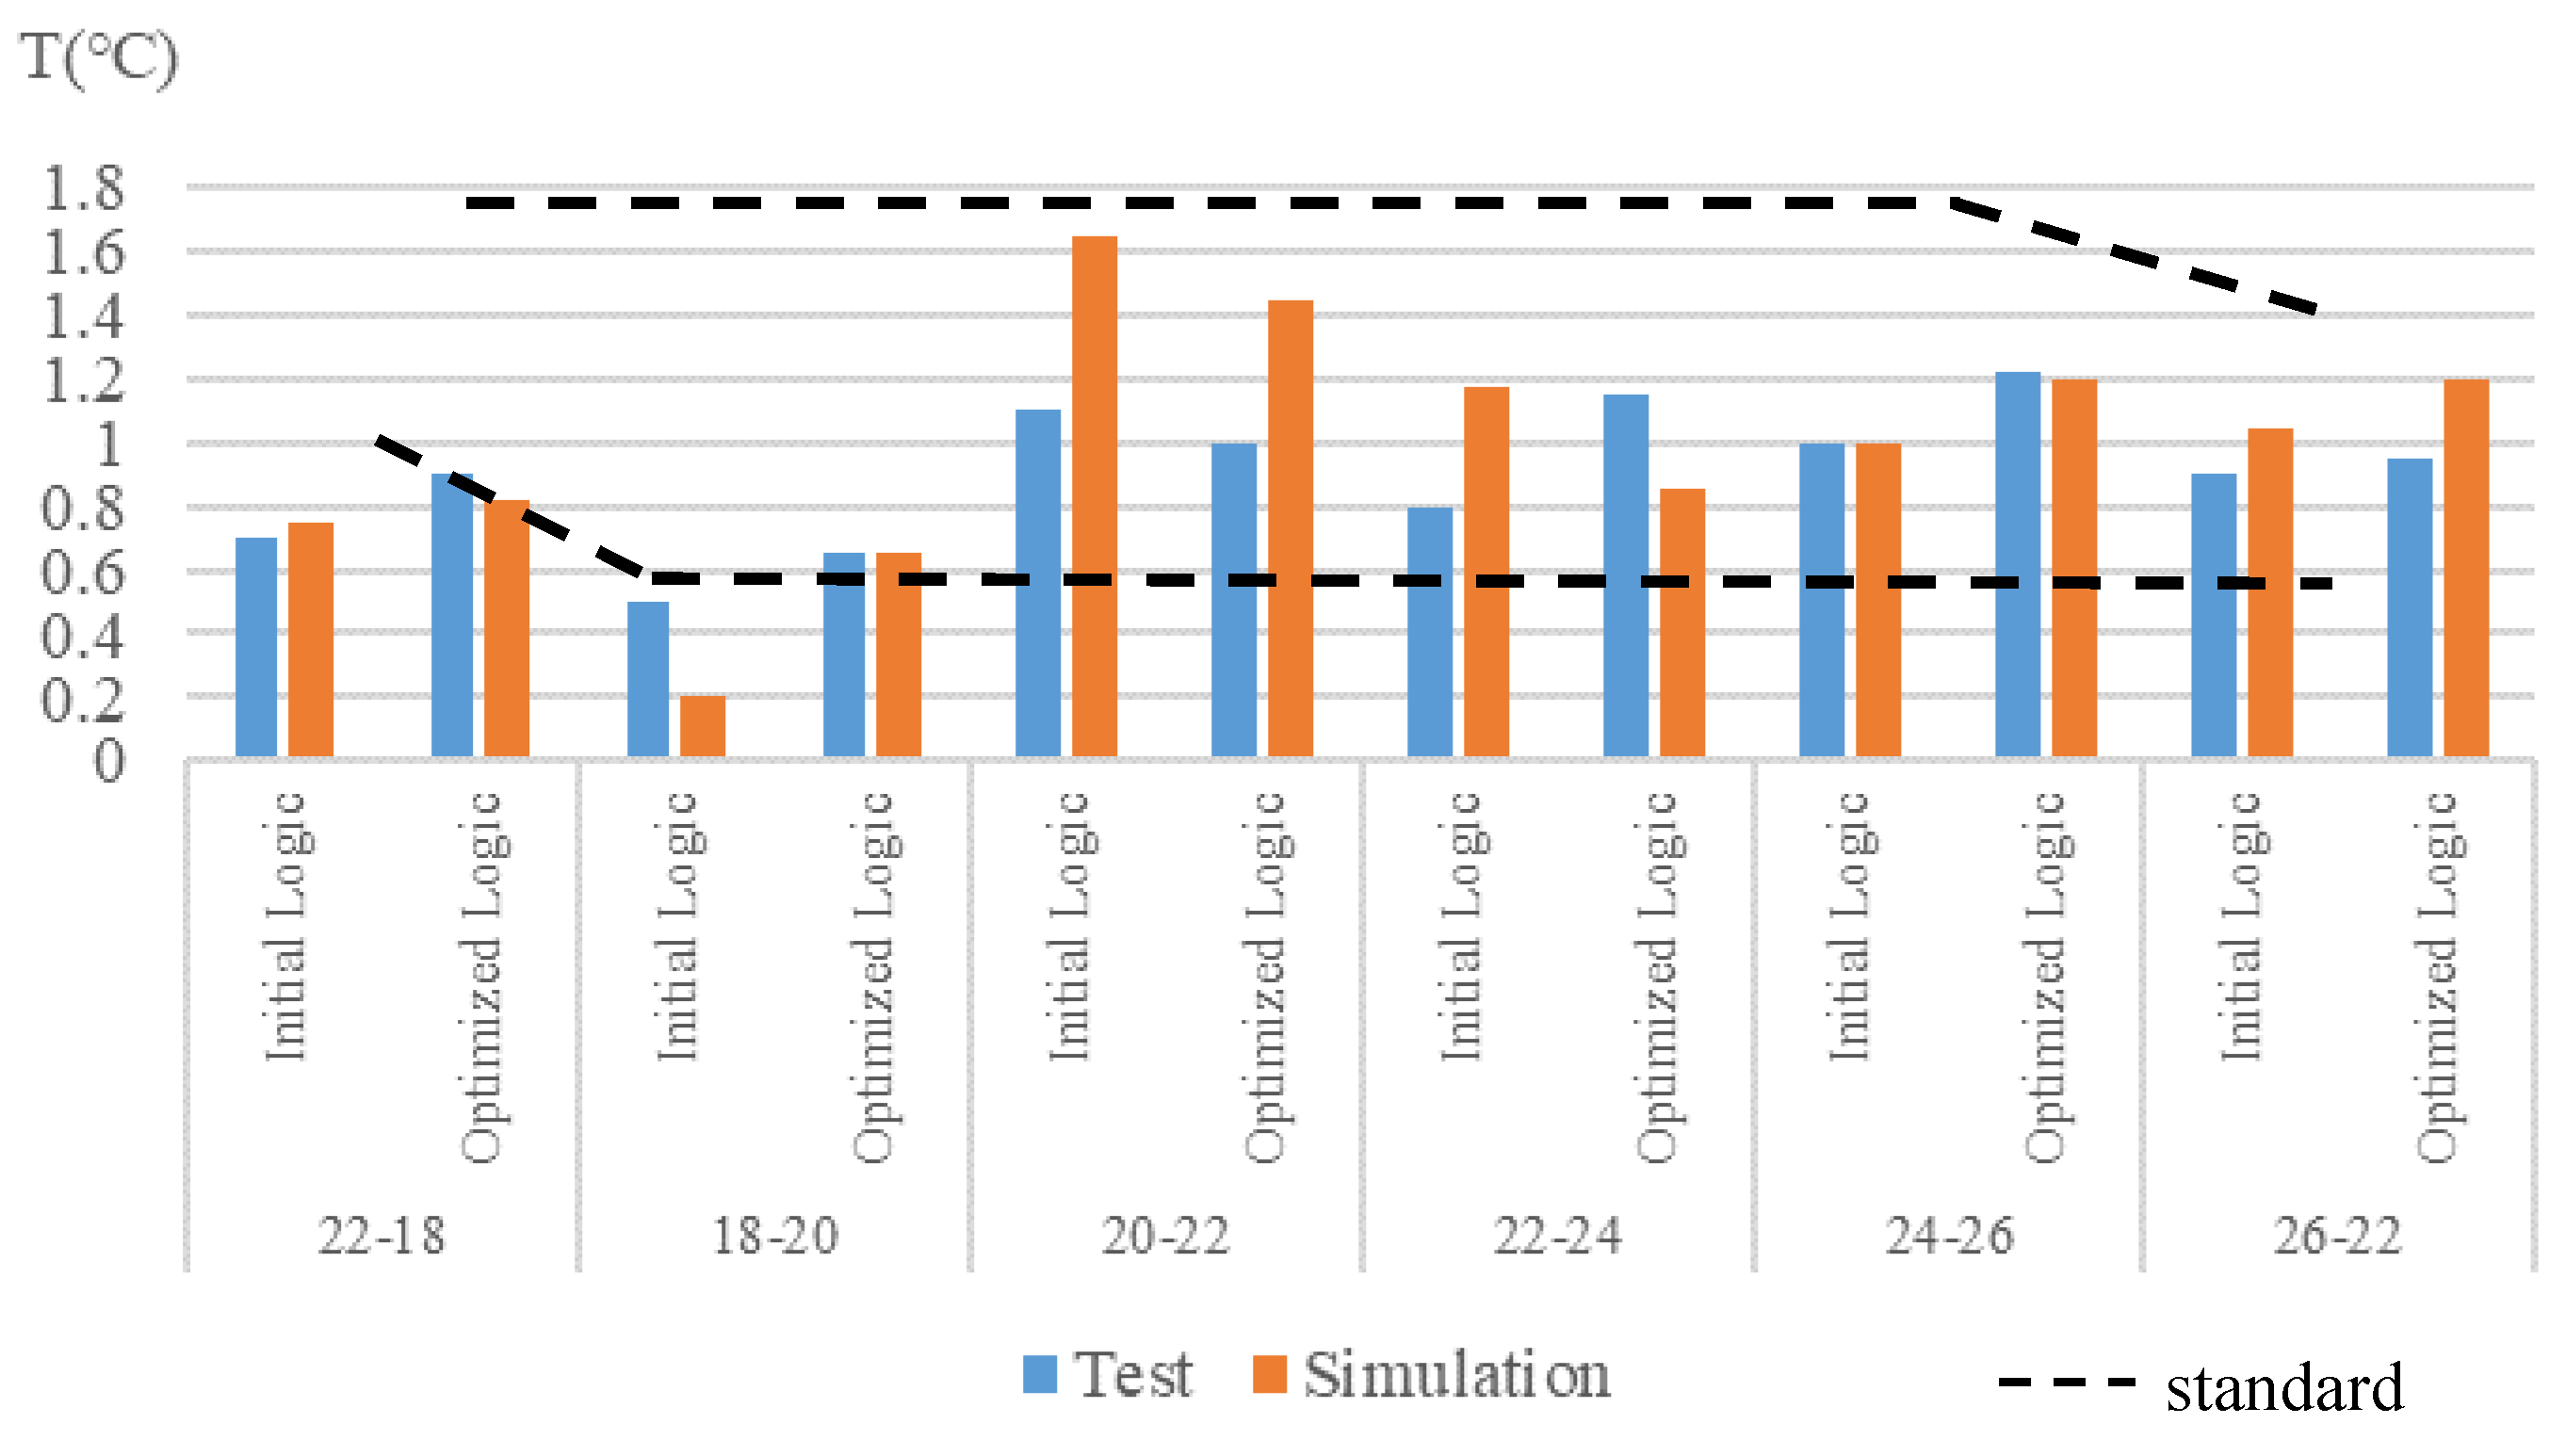
The subjective evaluation results of thermal sensation are relatively in agreement of the simulation results, with similar trends and difference errors are within ± 1. Although the logic of the improved version reduces the temperature overshoot, the change in the minimum heat sensation is not significant, but the cooling time is significantly reduced, as shown in Figure 12 and Figure 13.
The influencing factors were also analyzed. The lowest point of the first cooling occurs when the air volume begins to decrease, especially in the initial version logic; During the heating process, the improved logic resulted in more thermal sensation changes due to drastic changes in air flow.
6. Conclusions
Through the coupling simulation analysis of AC system control, the typical single actual vehicle AC test takes 5000s (1.4 hours) to complete, and through virtual calibration, it takes only 400s (7 minutes) of CPU time. The virtual simulation speed is more than ten times than that of the actual vehicle test.
The workload of 1-day simulation is equivalent to more than 10 days of testing in the environmental simulation laboratory, saving about 300000 RMB in testing costs (3600 RMB/hour * 8 hours * 10 days=288000 RMB).
It is beneficial to use virtual calibration methods in early stage to find the problems imbedded in the AC control module. With the performance differences between the Pre-Prototype development vehicle and the Production vehicles, the successful virtual calibration of the head temperature can be applied to further verify the effectiveness of virtual calibration for enhancing the control logic of the AC system. The virtual calibration technology based on comfort is a novel technique or method that performs virtual calibration on the basis of dynamic comfort, and this technology is the first to emerge or be applied in related fields.
“The authors declared that they have no conflict of interest”
References
- Li Mingzhe, Chen Yuhua, Li Mengwei. Application Design of Multi-point Temperature Change Real-time Recorder for Air Conditioning System of New Energy Vehicles[J]. Journal of Shangqiu Vocational and Technical College, 2020, 19, 78-81.
- Ding Peng, Wang Zhong, Ge Ruhai, st. Multi-heat Source Staged Collaborative Heating System for New Energy Vehicles[J]. Journal of Automotive Engineering, 2020, 42, 375-382.
- Li Ruiqing, Zhang Rongbiao, Bai Shoujun, st. Application of Fuzzy PID in Temperature Control of Automobile Air Conditioner[J]. Microcomputer Information (Embedded and SOC) 2008, 24, 235-237.
- Wang Qing, Tang Liping, Ou yangwenbin. Energy-saving Air-conditioning Control Algorithm Based on Thermal Comfort[J]. Journal of Donghua University (Natural Science Edition) 2010, 36, 57-60.
- LIU B L. Calibration Technology of Vehicle Powertrain Electronic Control System[M]. Beijing: China Machine Press, 2022.
- DU L. Research on Model-Based Calibration of GDI Engine[D]. Changchun: Jilin University,2013.
- ZHANG P F, LU F, YANG X F, et al. Research on Model-Based Vehicle Calibration[J]. Auto Electric, 2018(3): 21-23.
- WENIG M, ARTUKOVIC D, ARMBRUSTER C, et al. vRDE-A Virtual Extension of the RDE Tool Chain[C]// Internationals Stuttgarter Symposuim. Wiesbaden: Springer Vieweg, 2017:365-381. [CrossRef]
- NEUSSER H J, KAHRSTEDT J, DORENKAMP R, et al. Die Euro-6-Motoren des Modularen Dieselbaukastens von Volkswagen[J]. Motorechnische Zeitschrift, 2013, 74(6): 440-444+447. [CrossRef]
- WANG Z J. Model Based Calibration of Common Rail Diesel Engine[D]. Kunming: Kunming University of Science and Technology,2015.
- Fiala, D. Modelling the active system. In: Dynamic Simulation of Human Heat Transfer and Thermal Comfort (PhD thesis). Leicester, UK: IESD, De Montfort Univ., 1998, chapt. 4.
Figure 1.
main components of AC model.
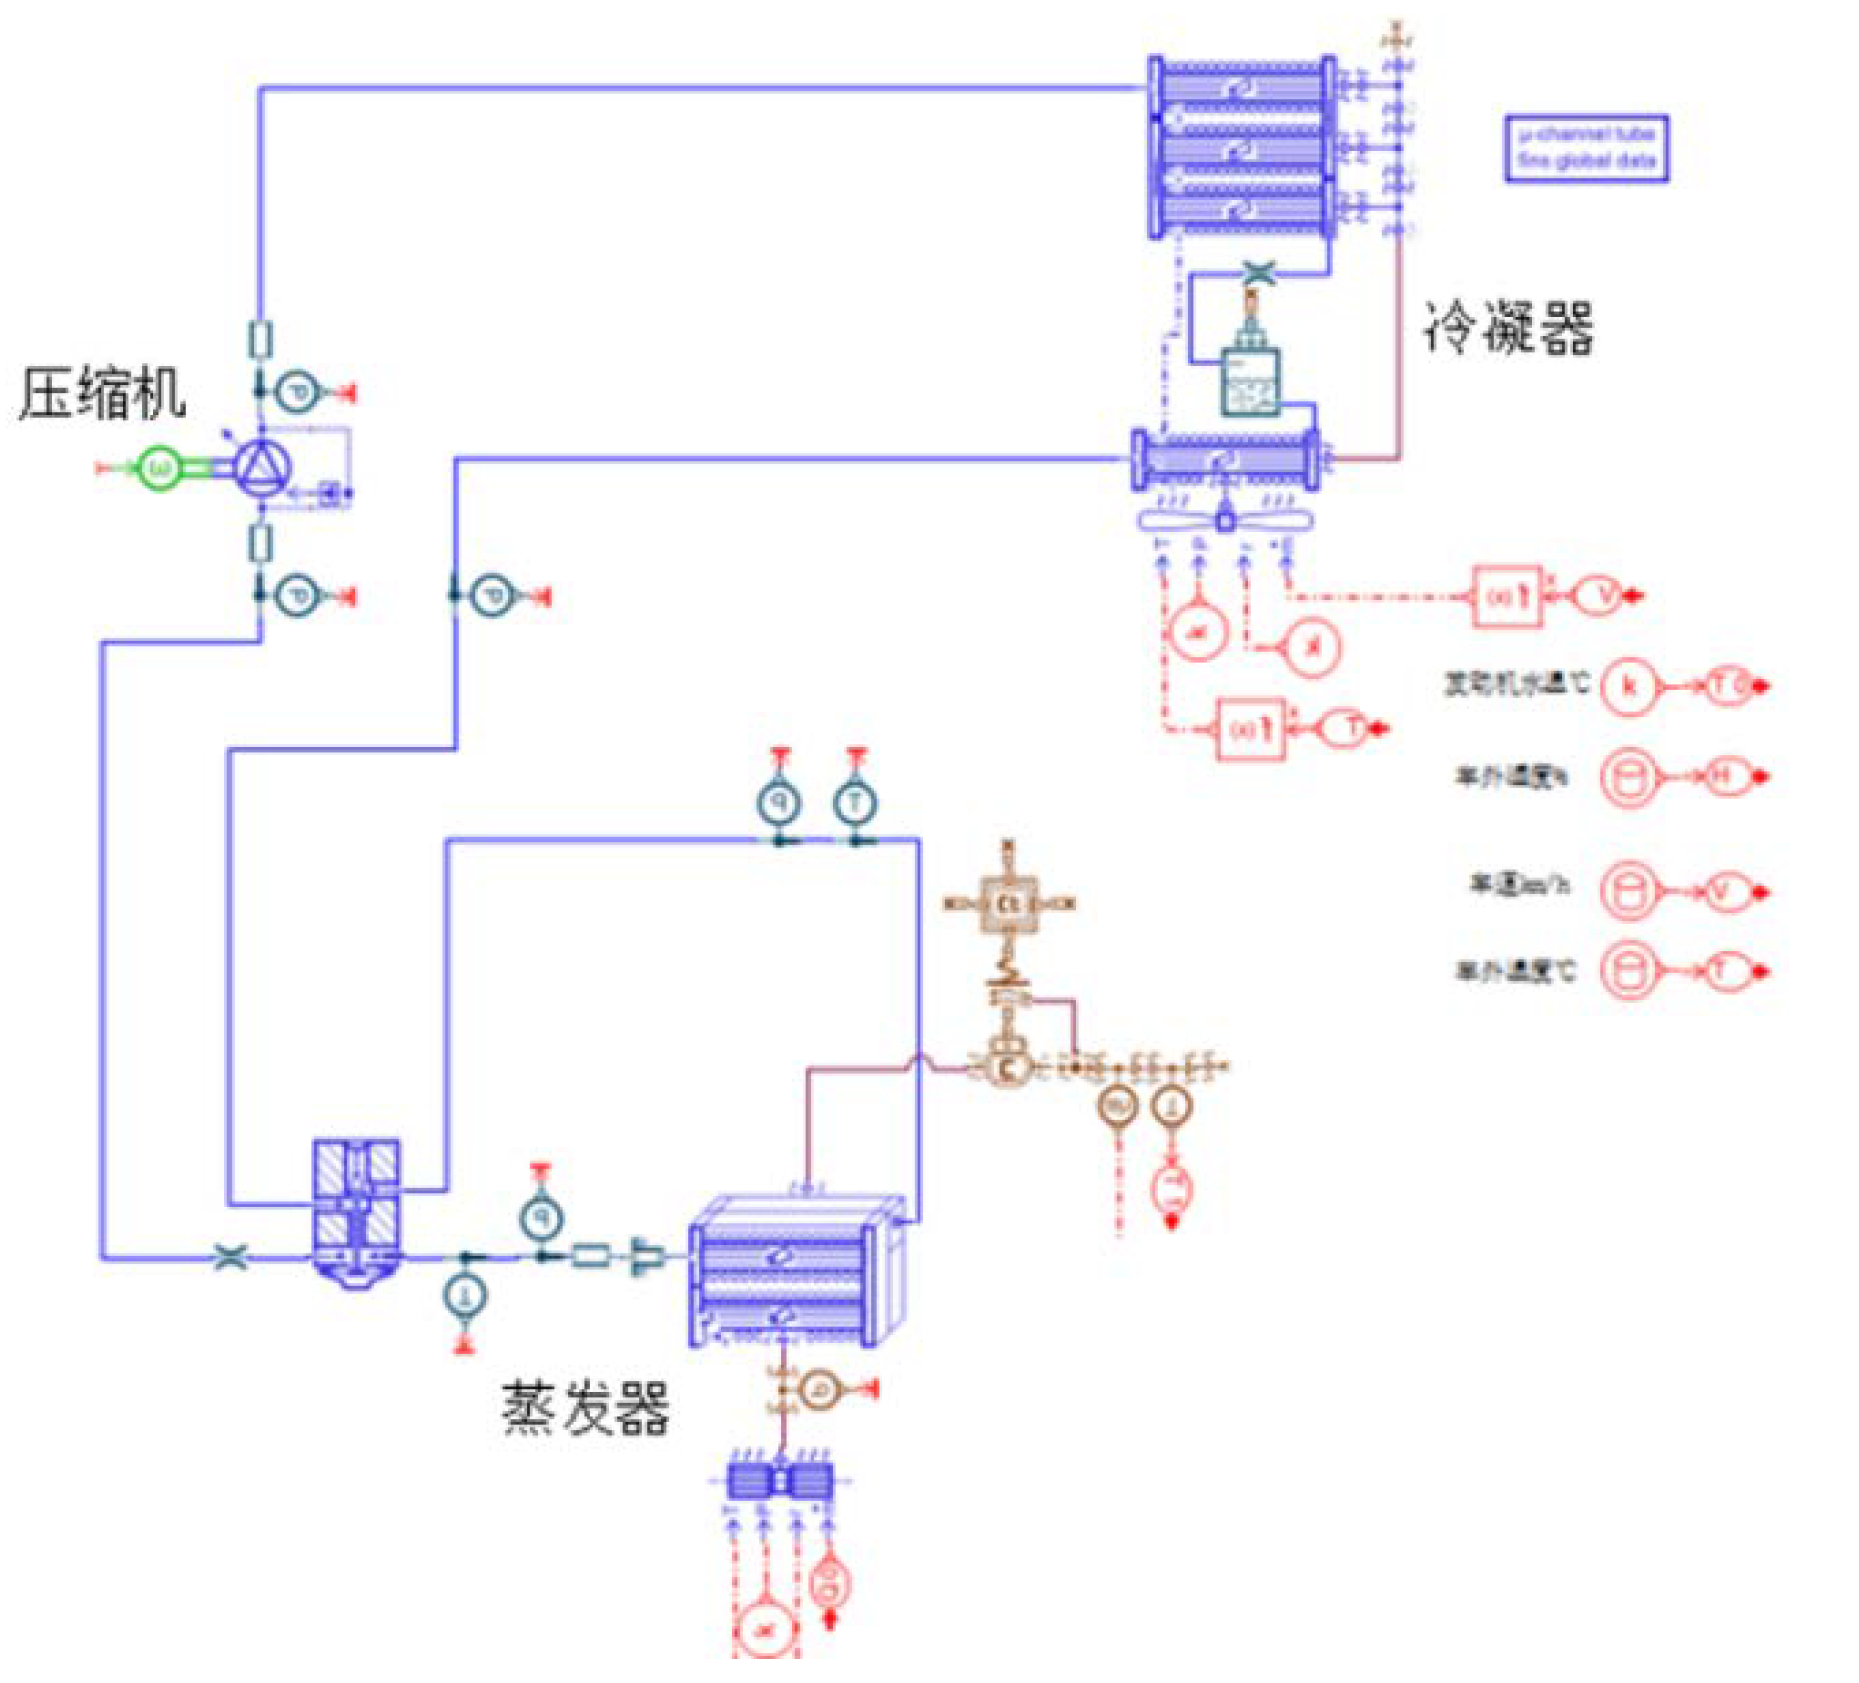
Figure 2.
Detailed sub model for AC box.

Figure 3.
AC box model packaging.
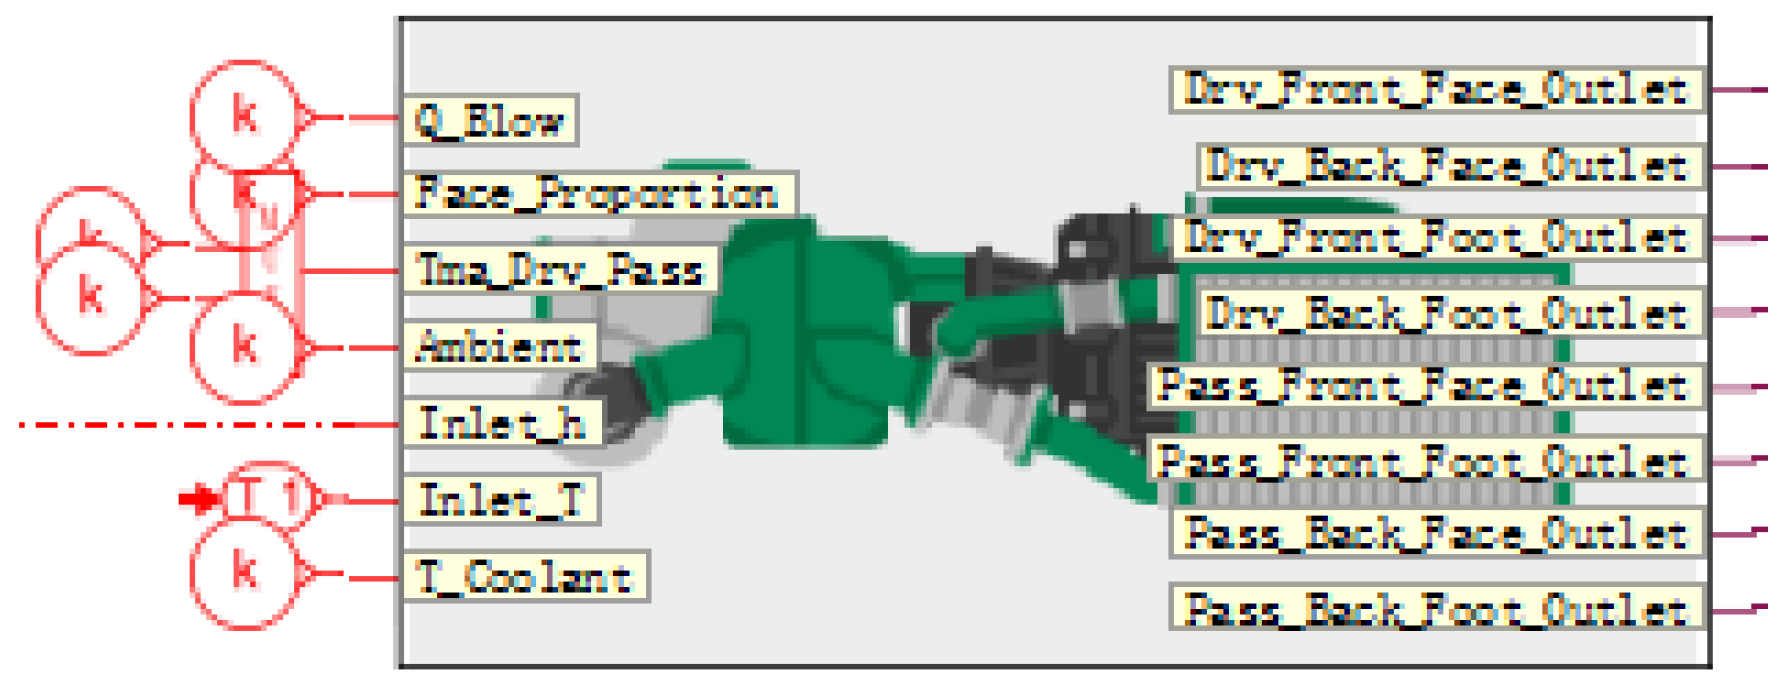
Figure 4.
Detail sub model of cabin.

Figure 5.
Encapsulation of cabin model.
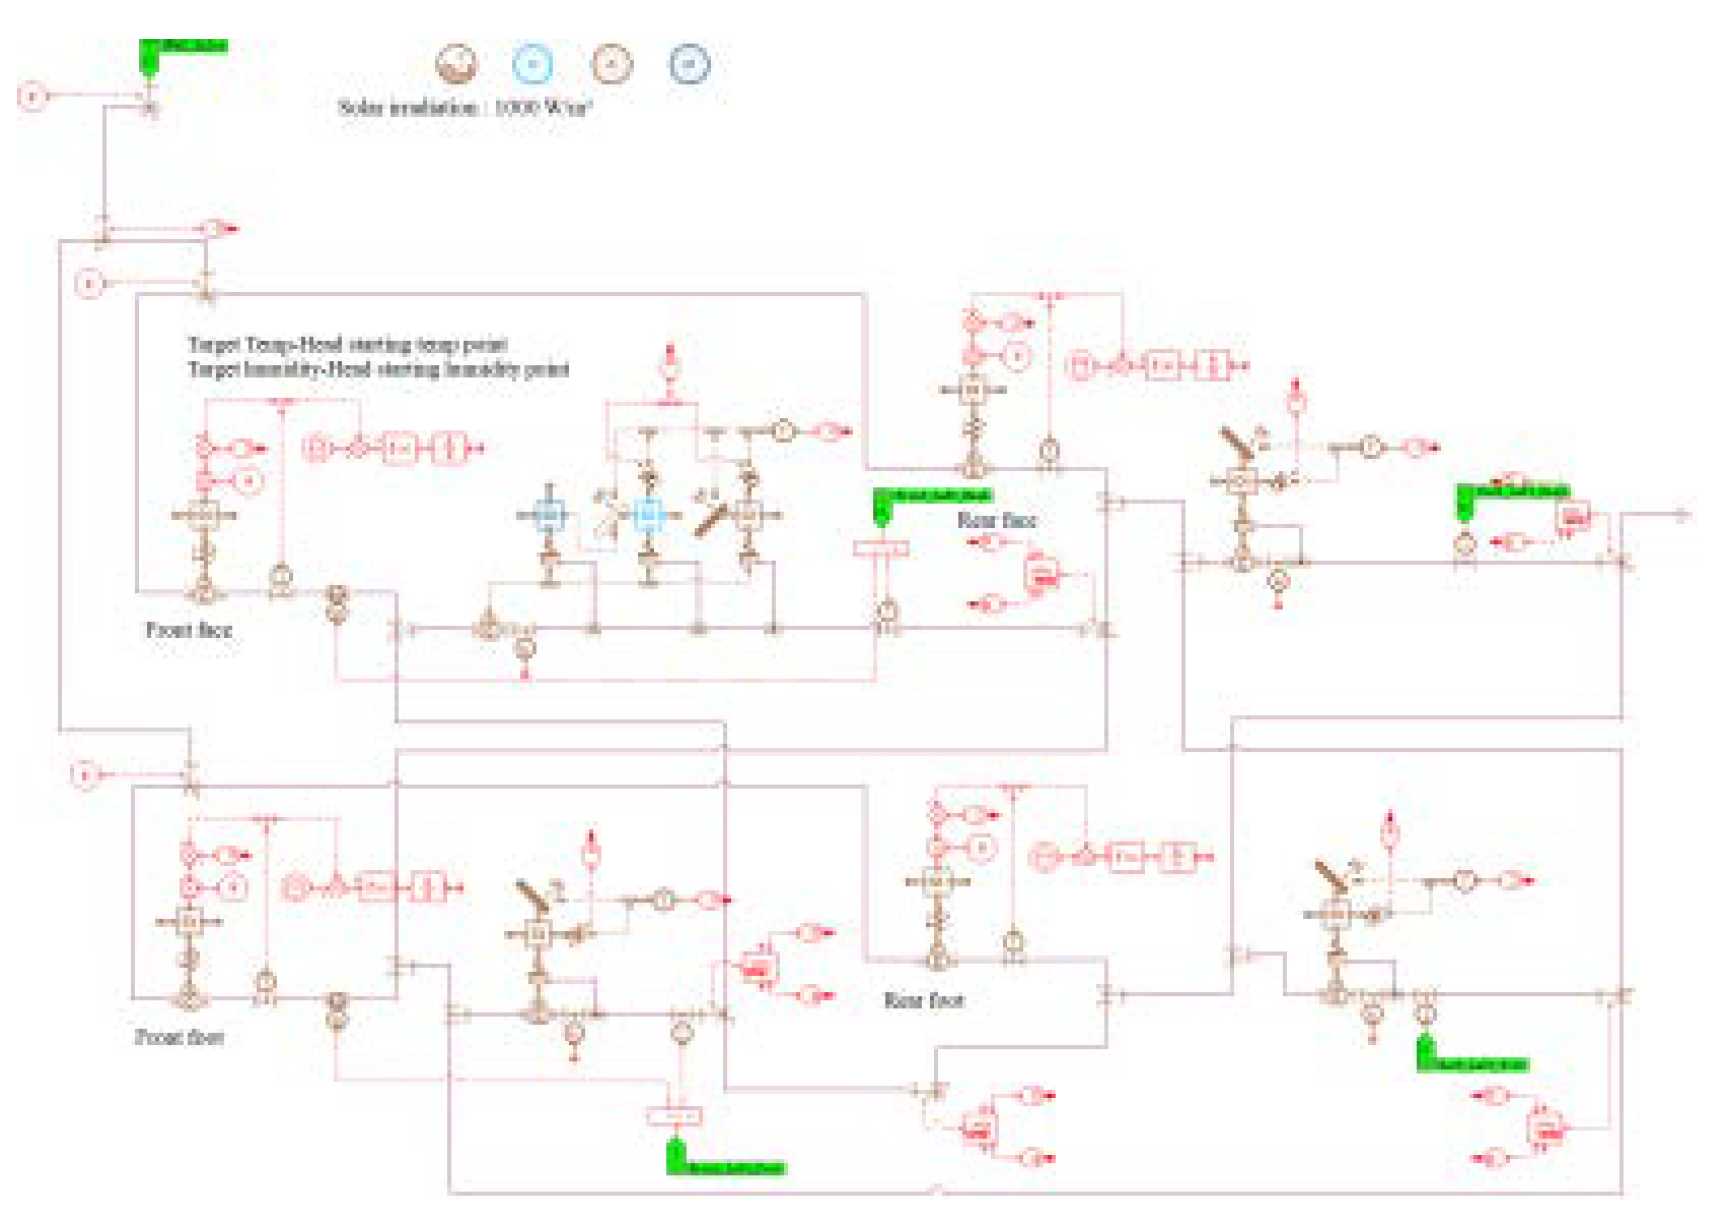
Figure 6.
Control model interface.
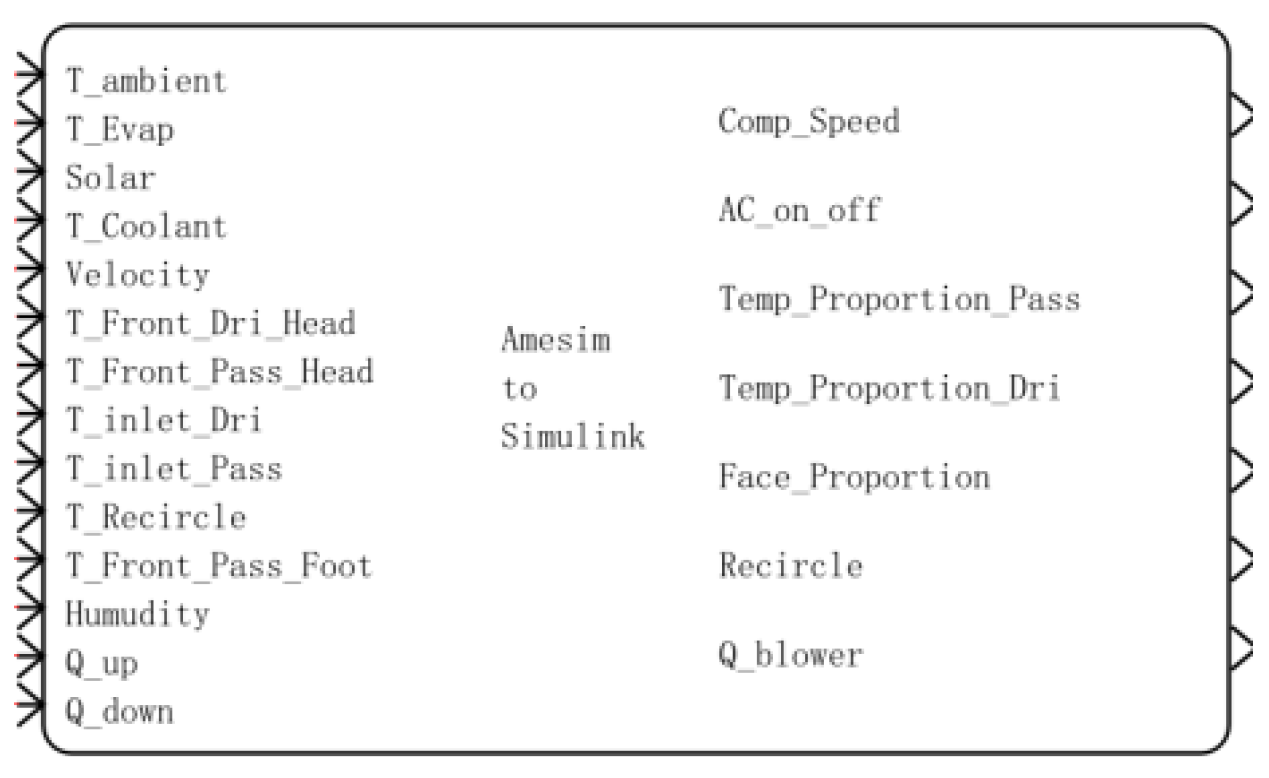
Figure 7.
Auto air condition control process.
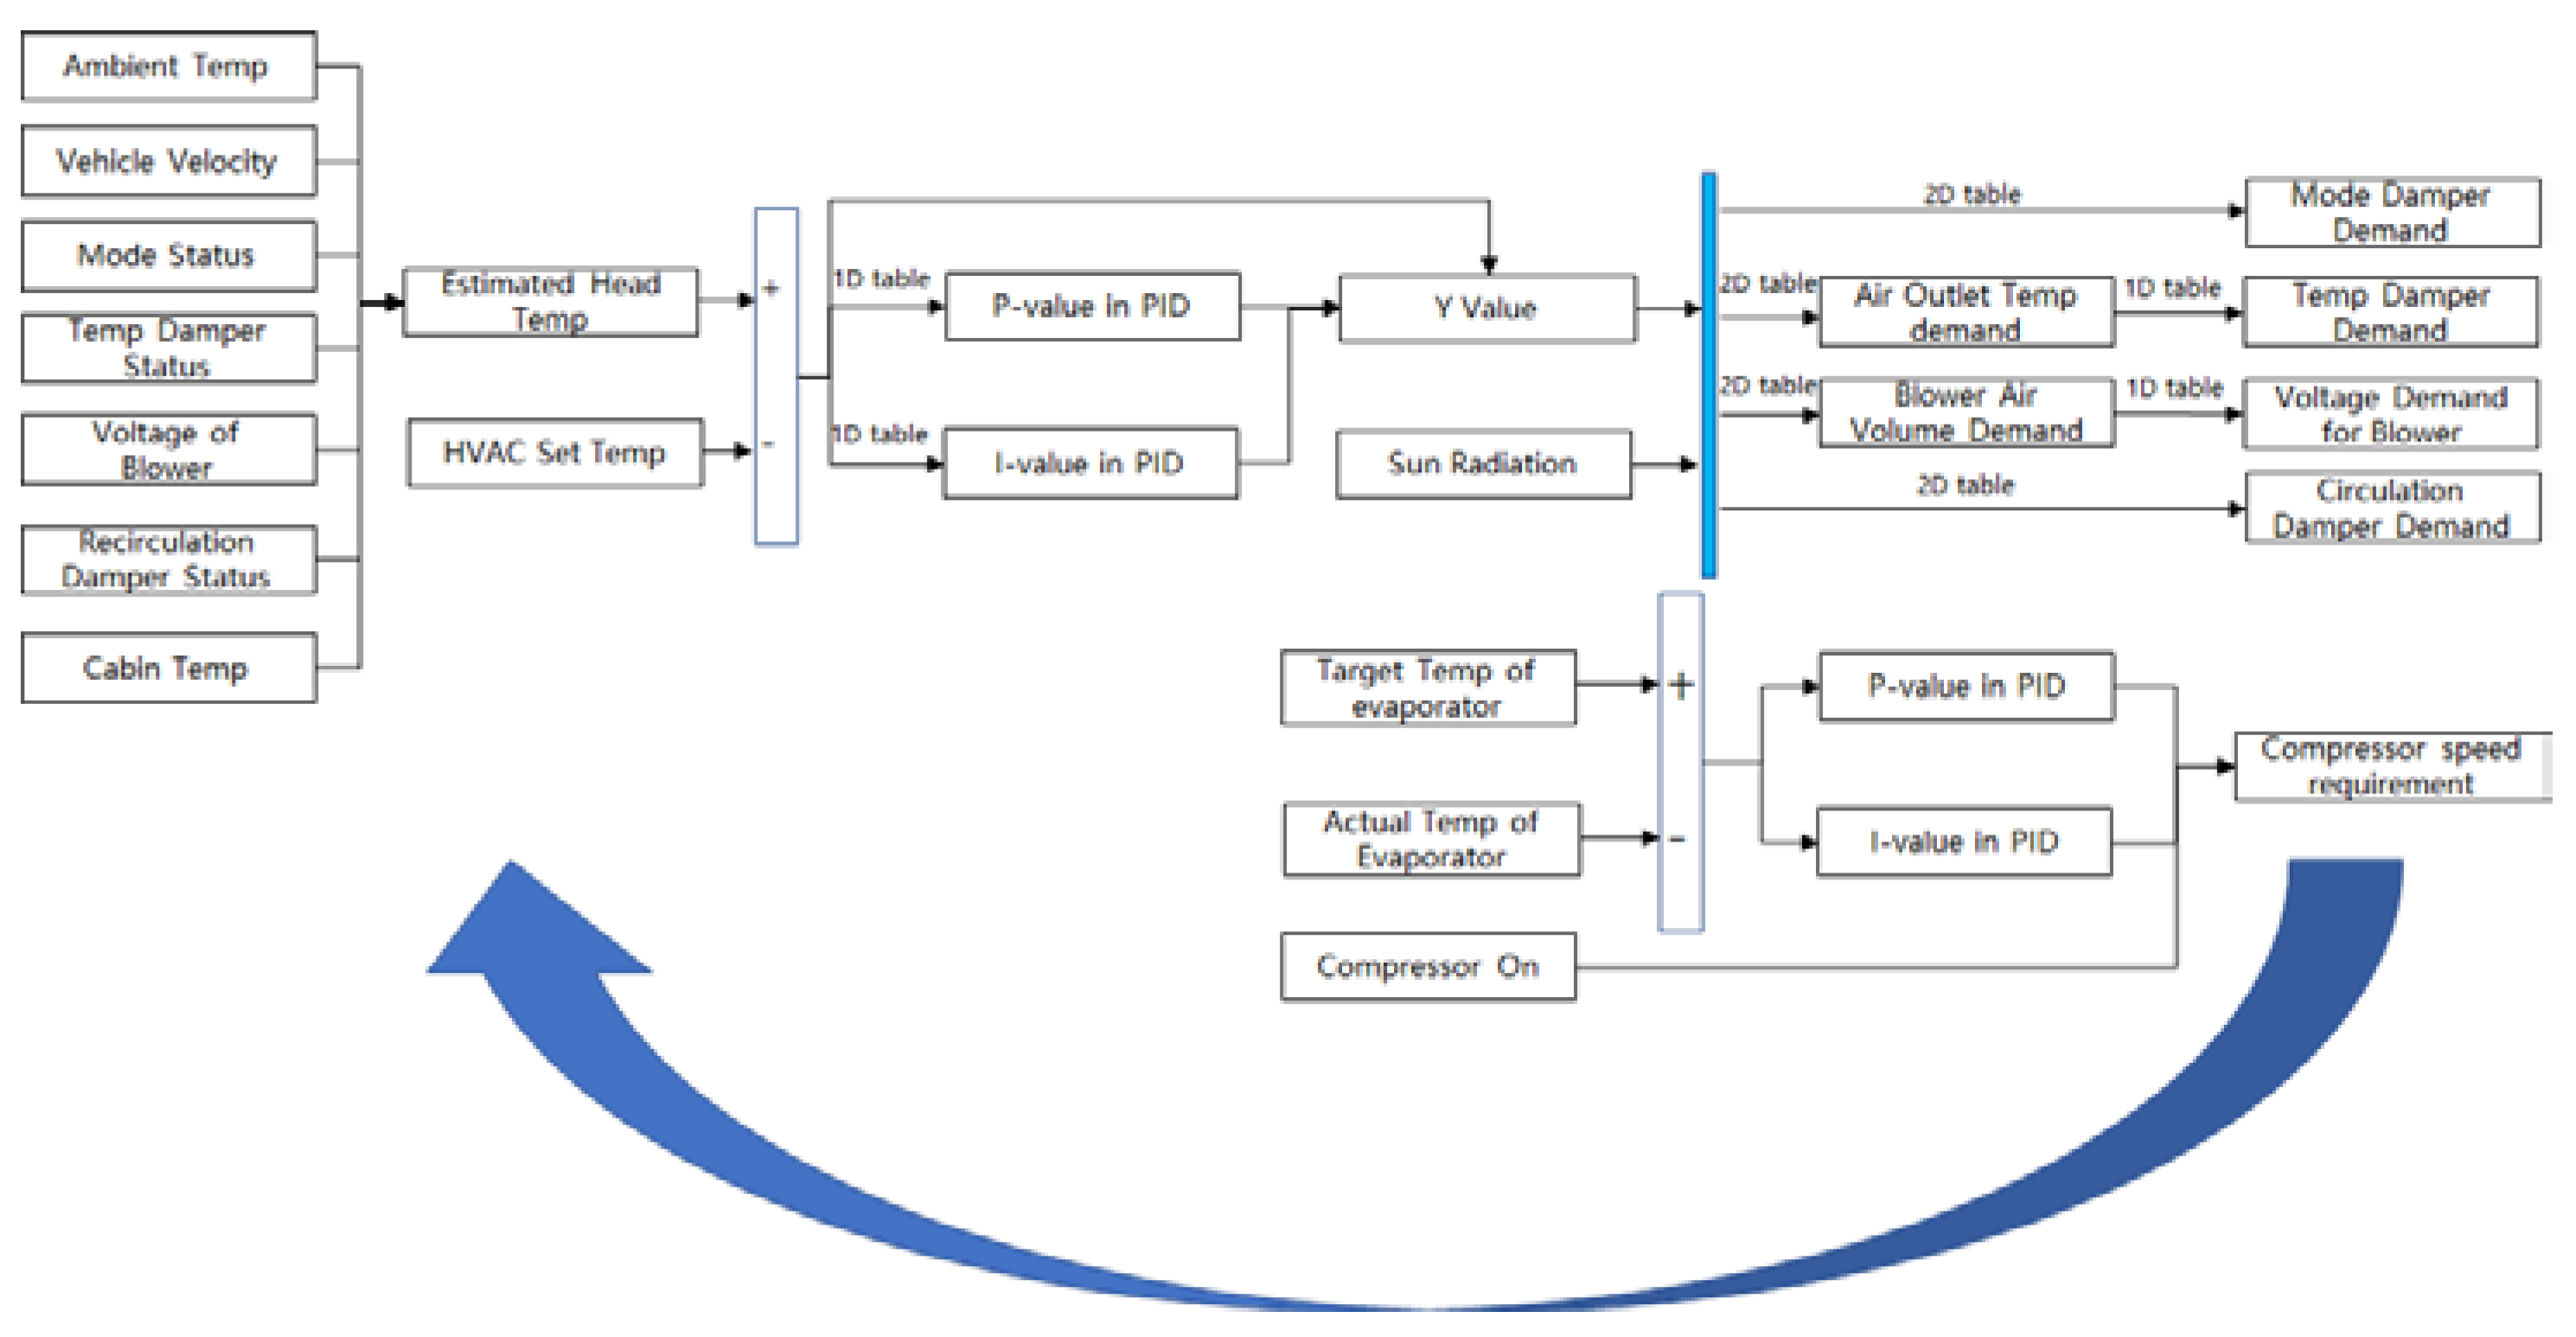
Figure 8.
Head temperature of initial logic.
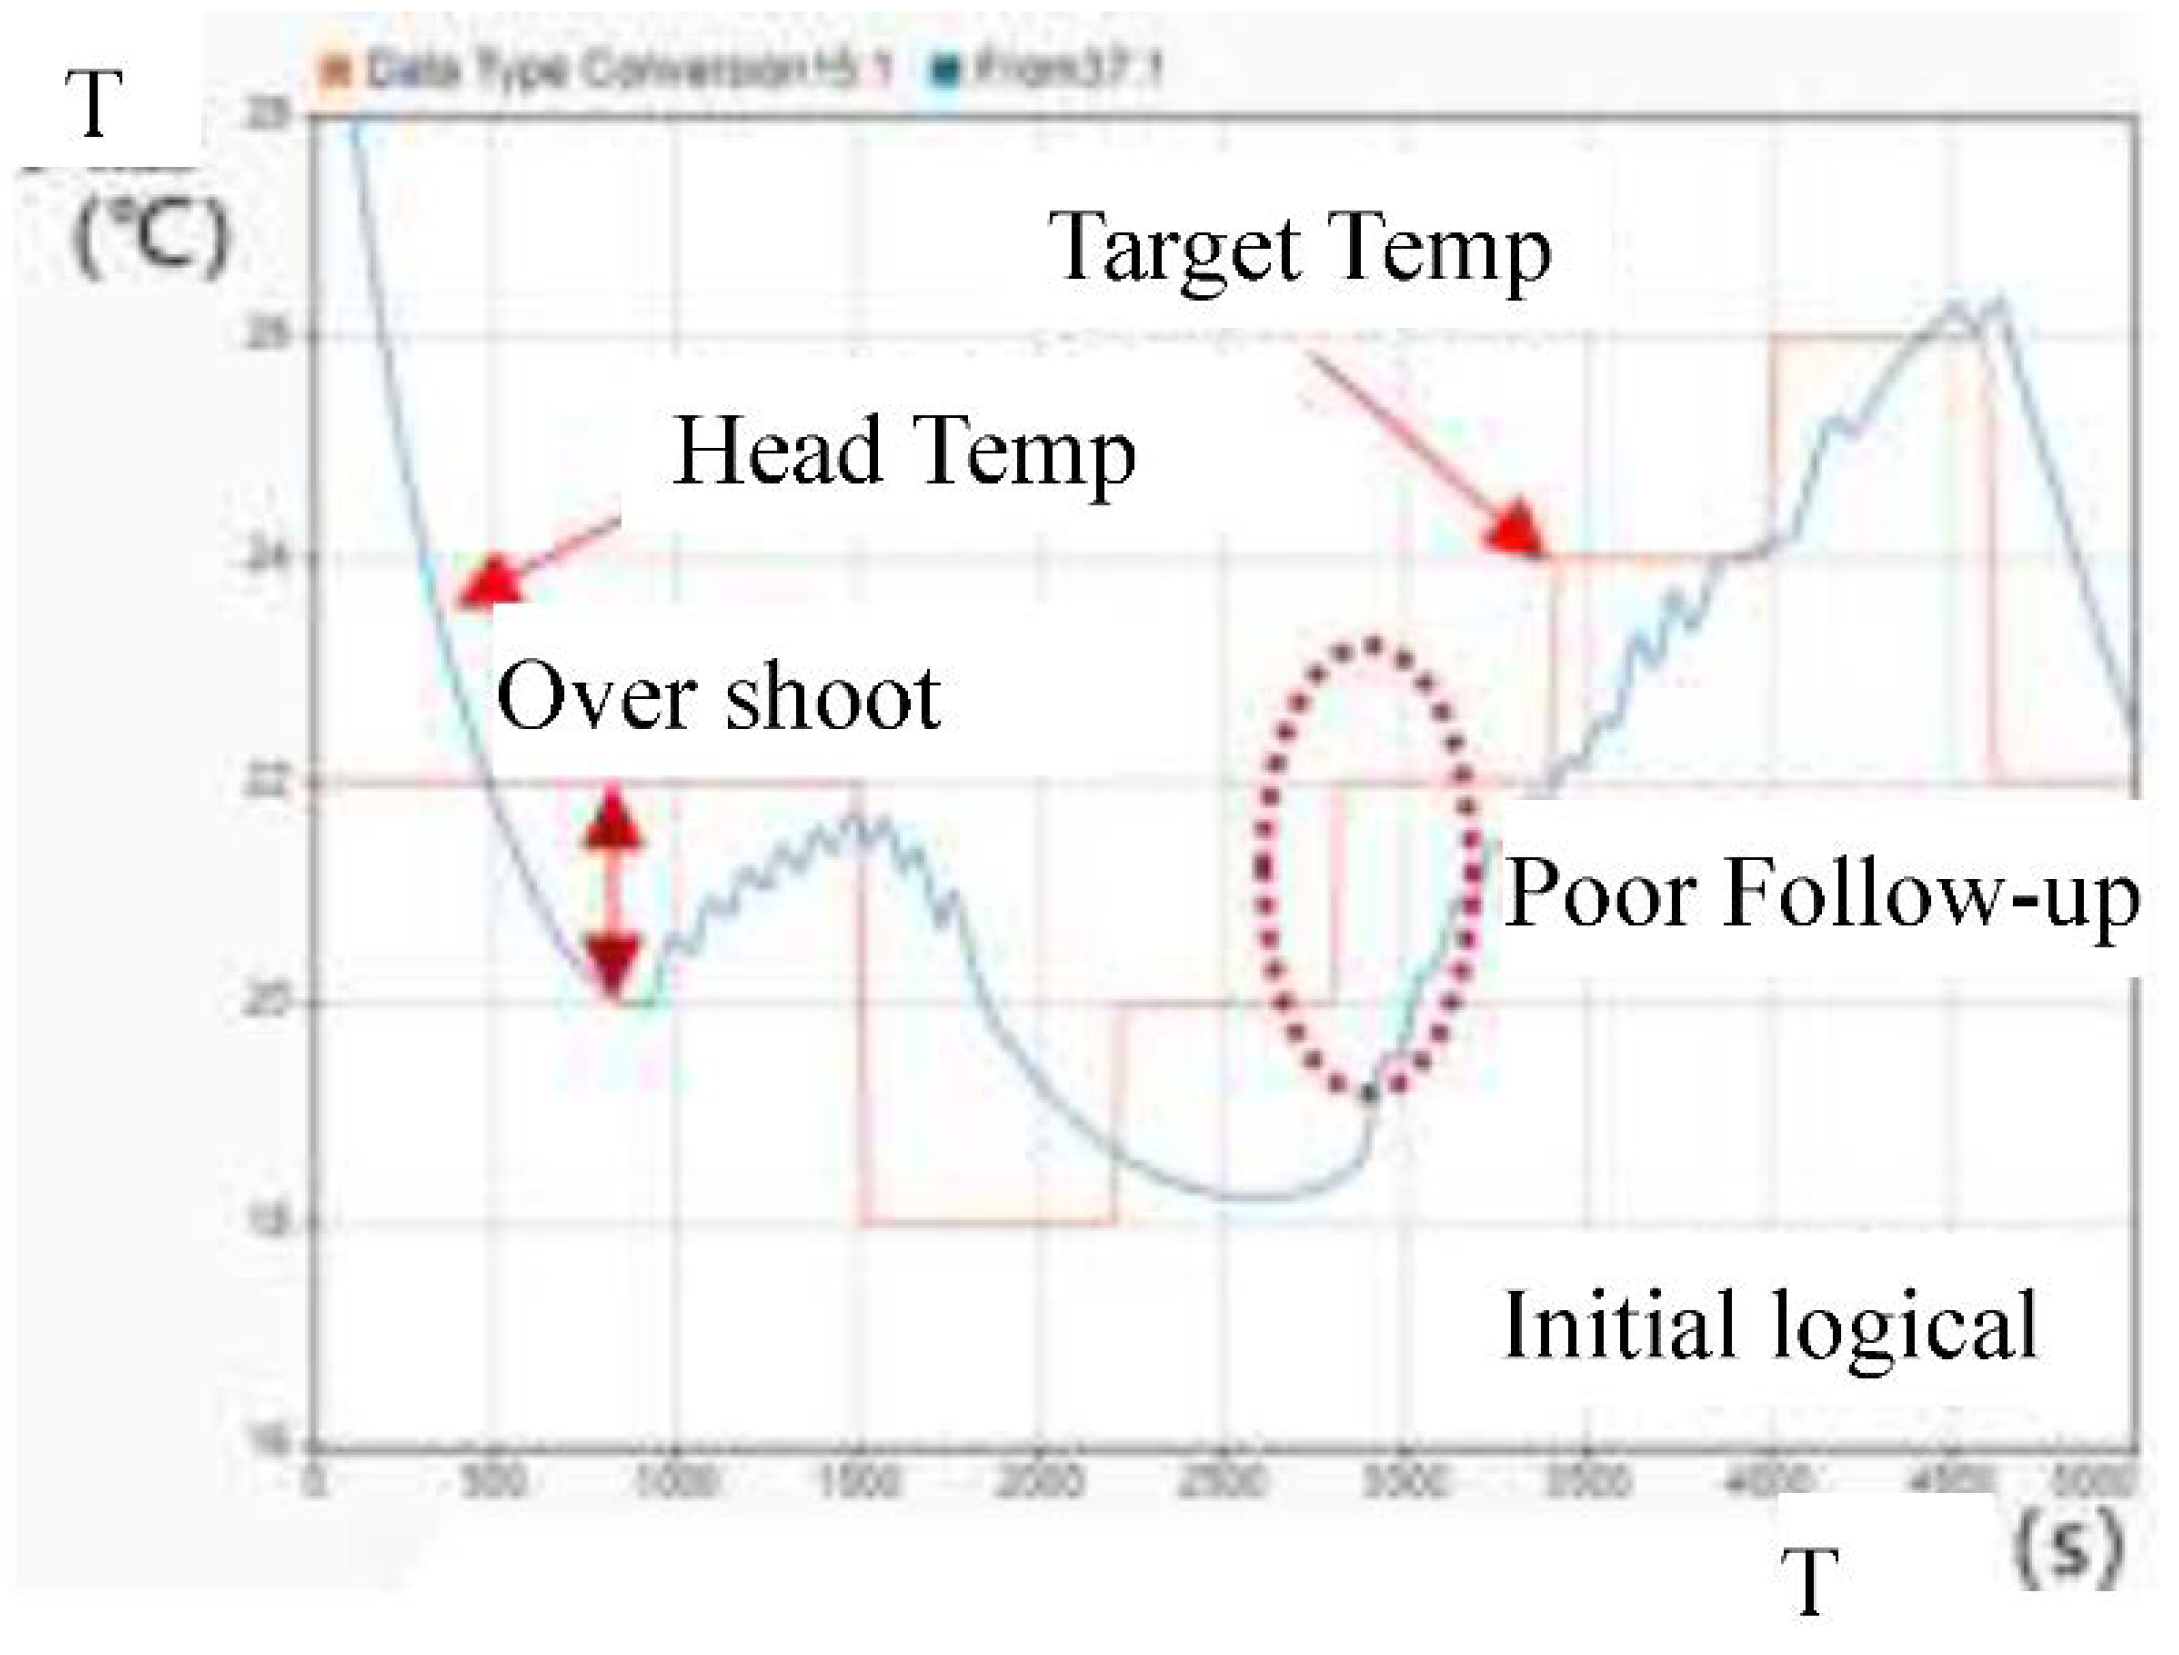
Figure 9.
Head temperature of optimized logic.
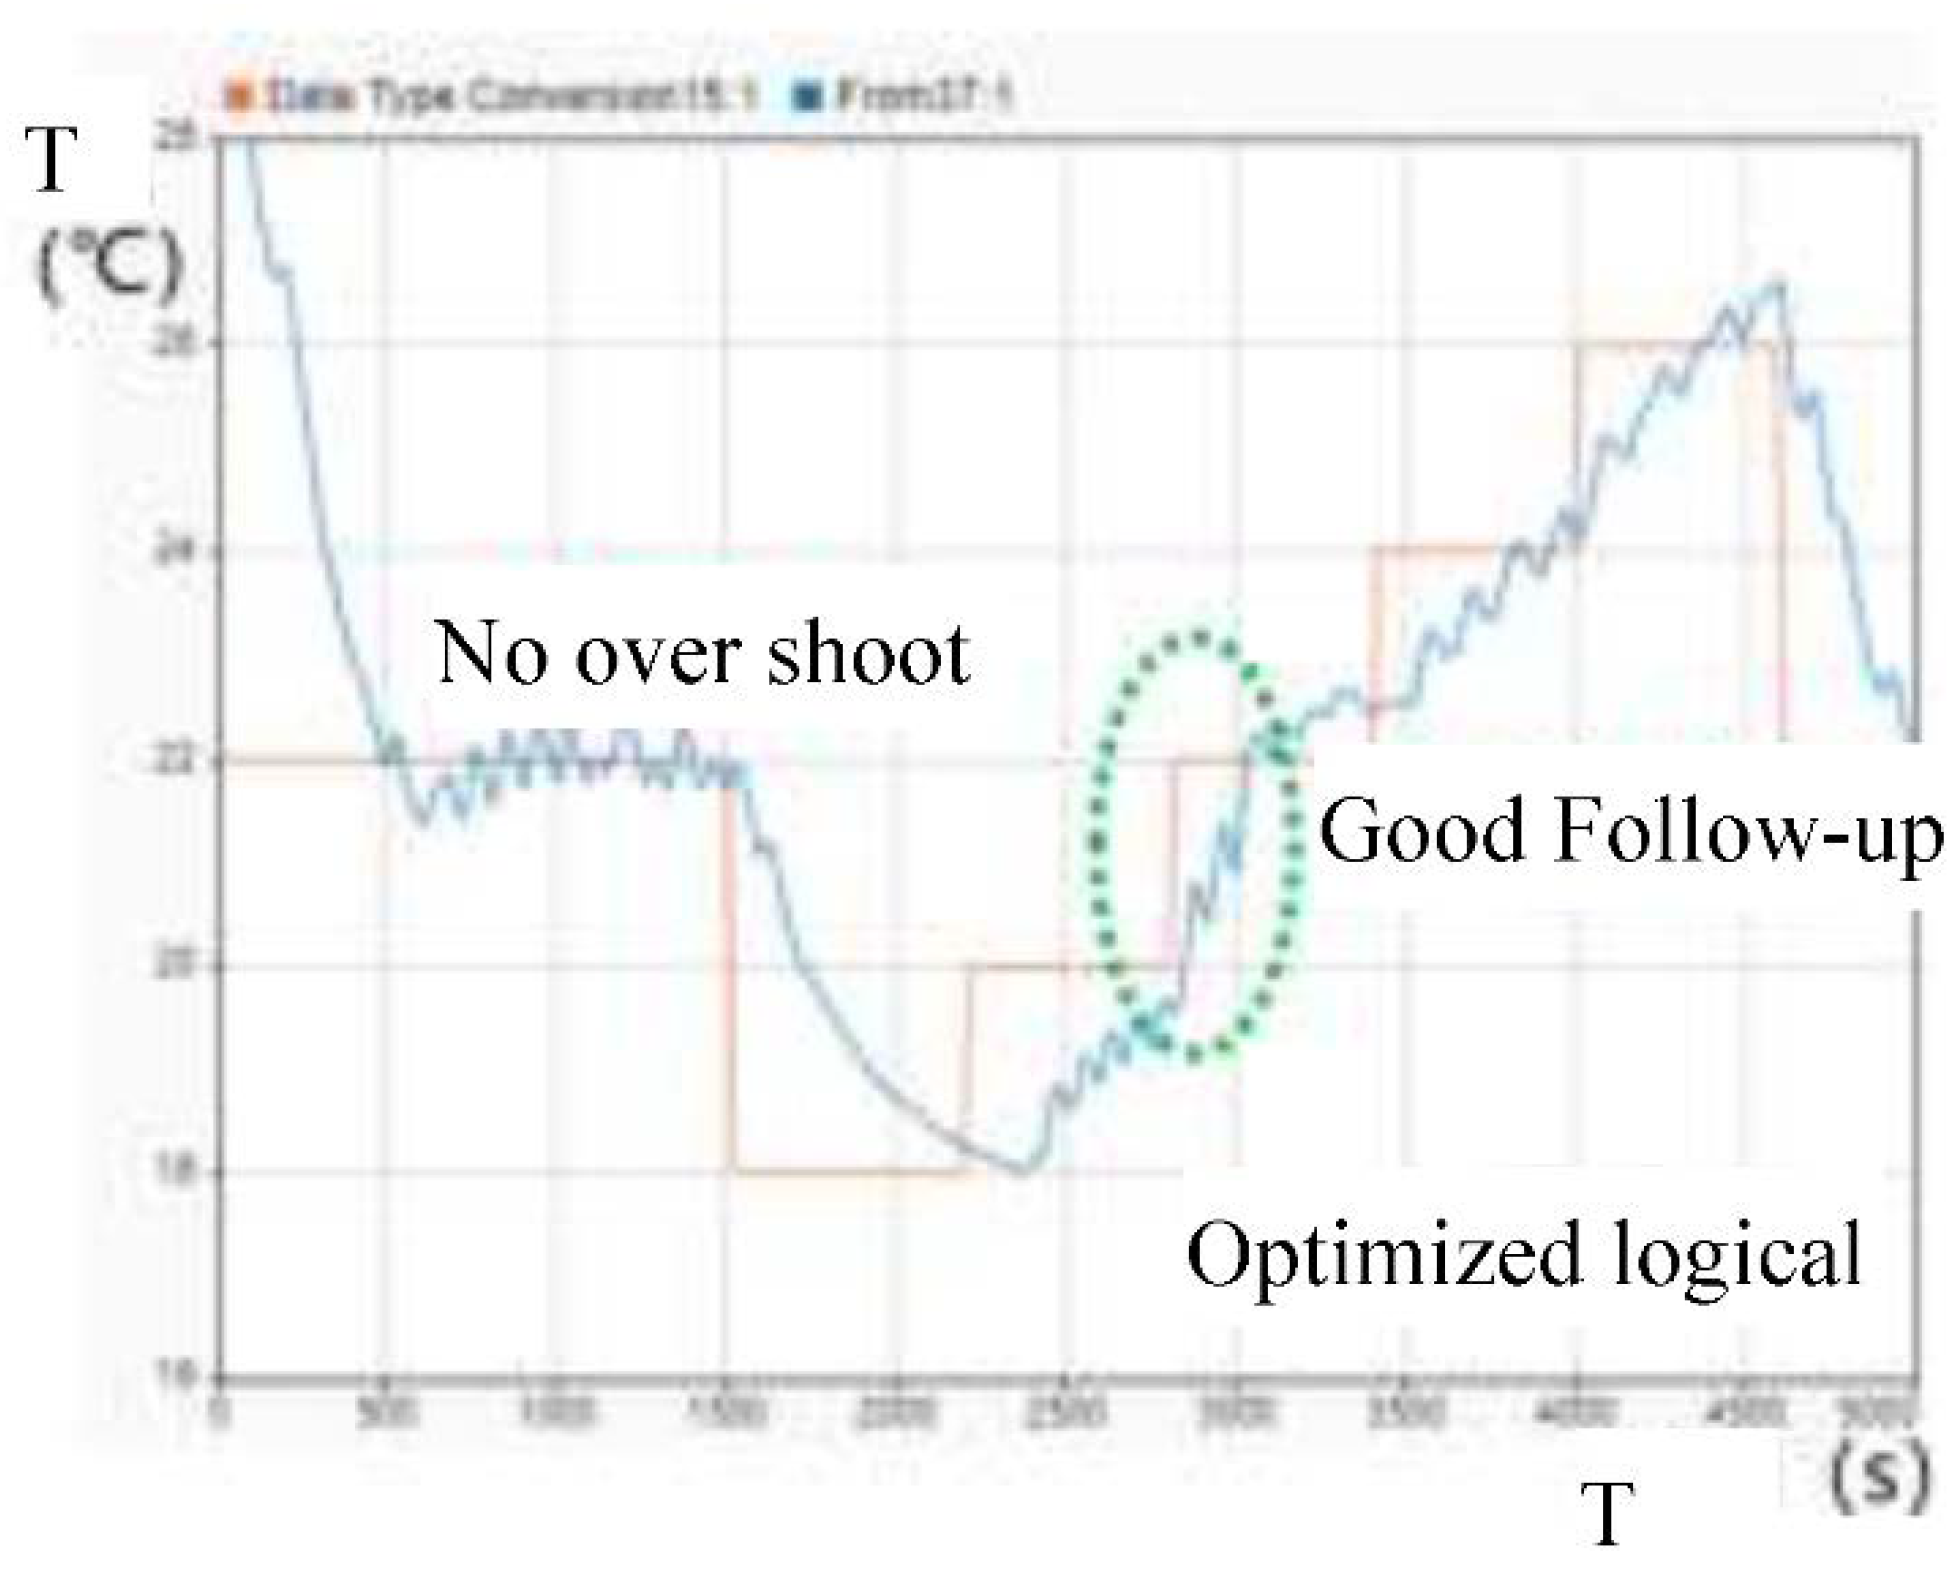
Figure 12.
Sensation of initial logic.
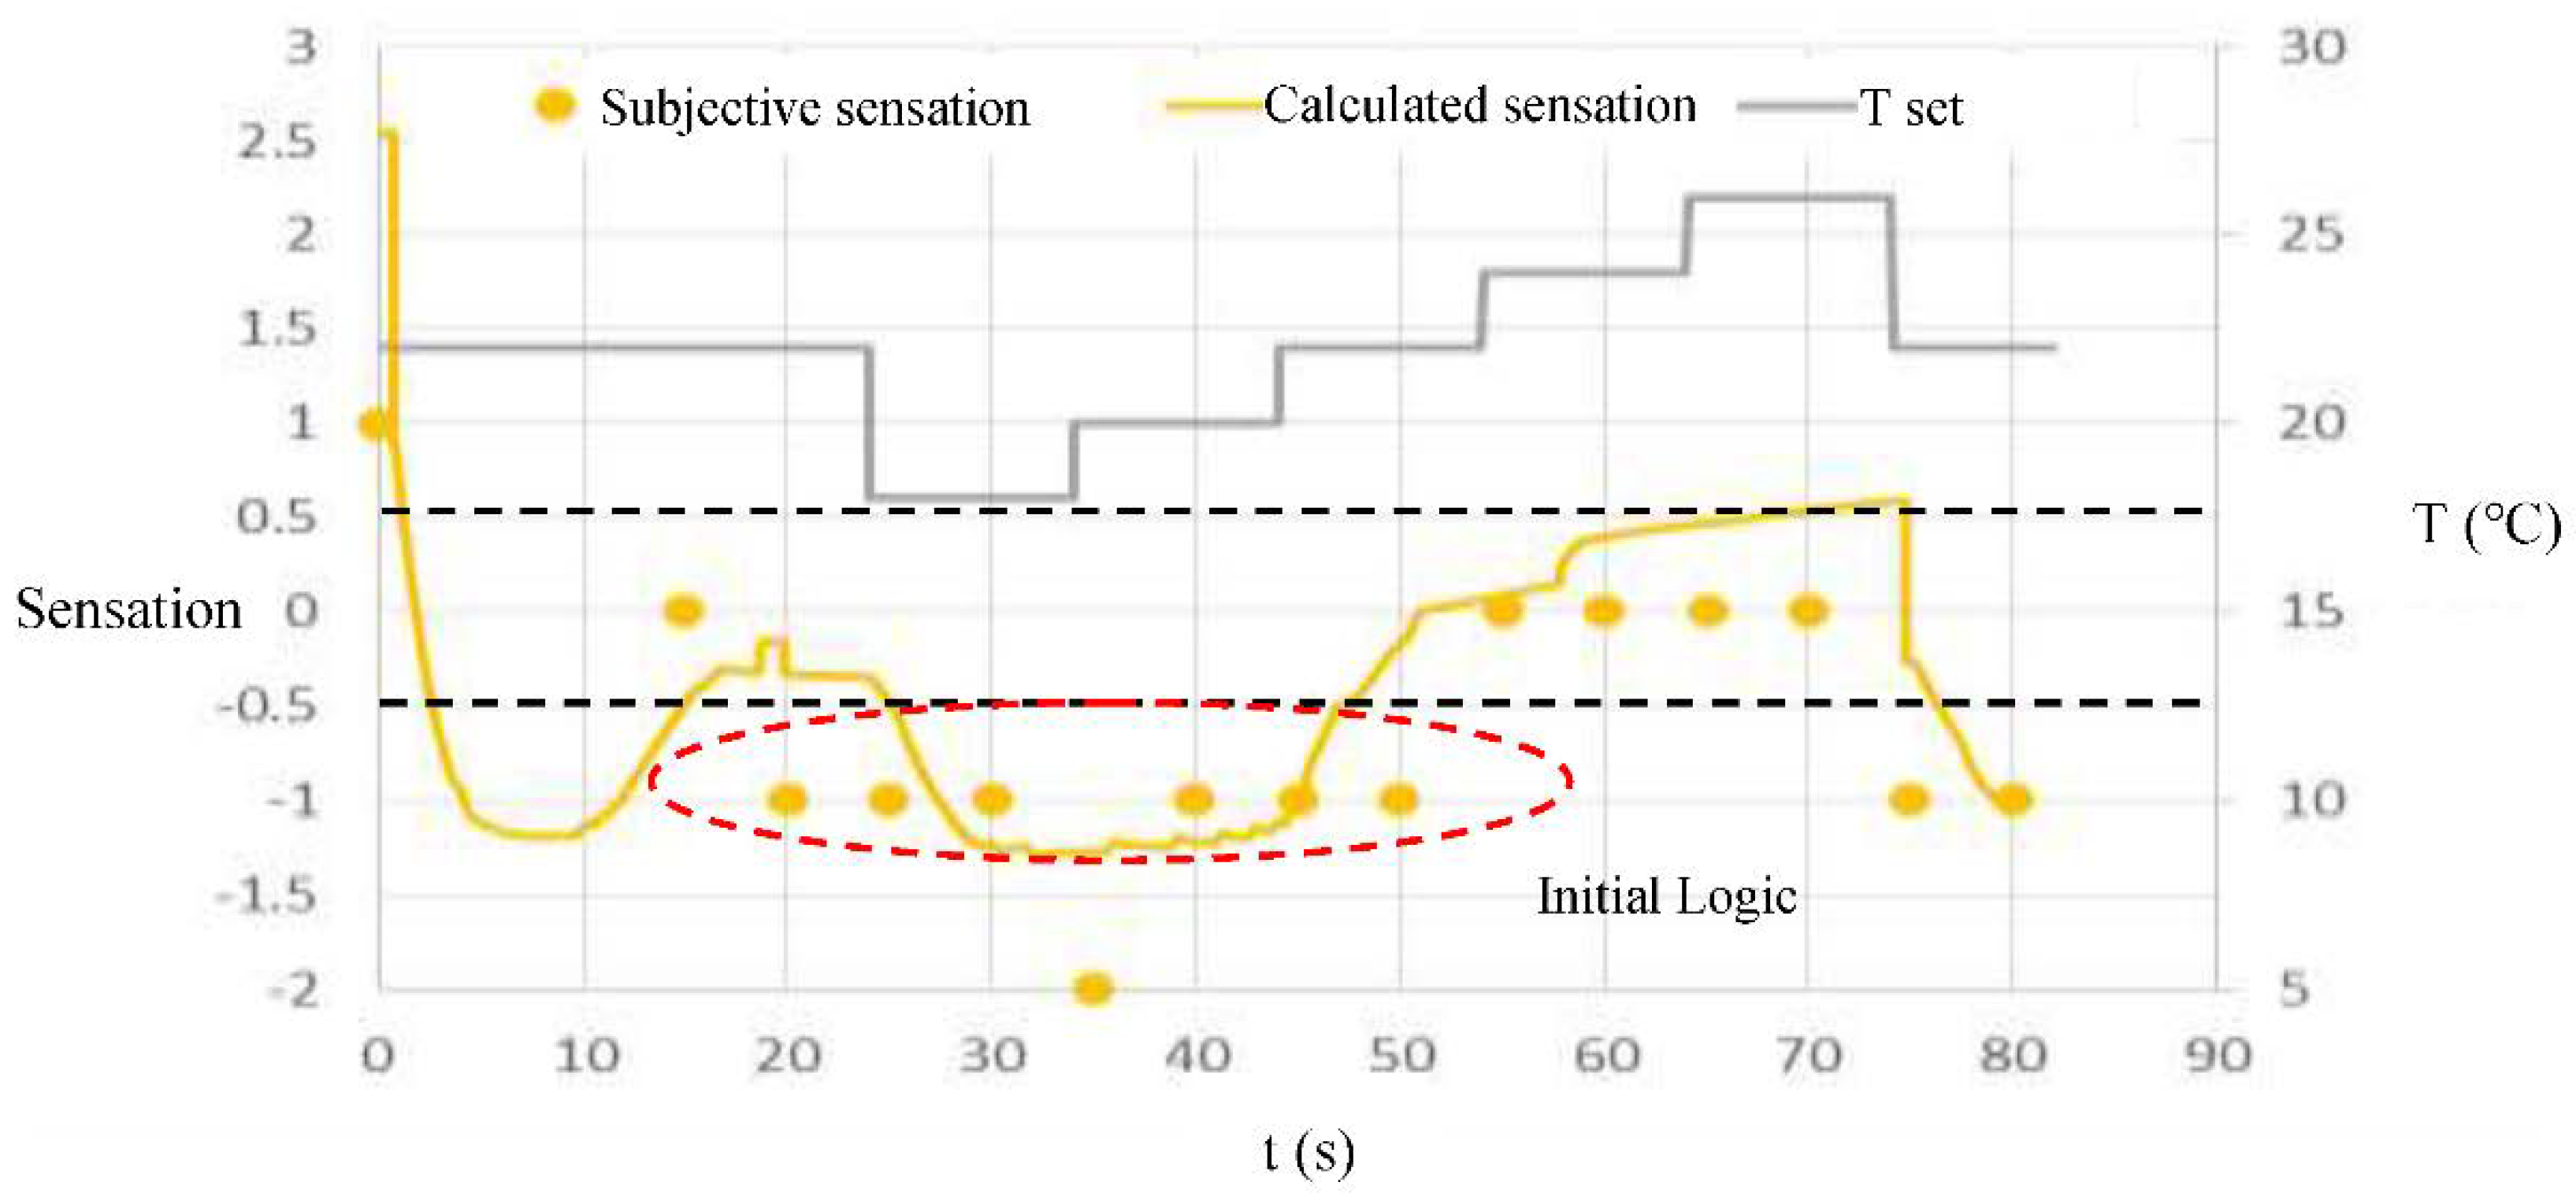
Figure 13.
sensation of optimized logic.


Table 1.
Relationship between plug-in/extended range pure electric range and interior temperature.
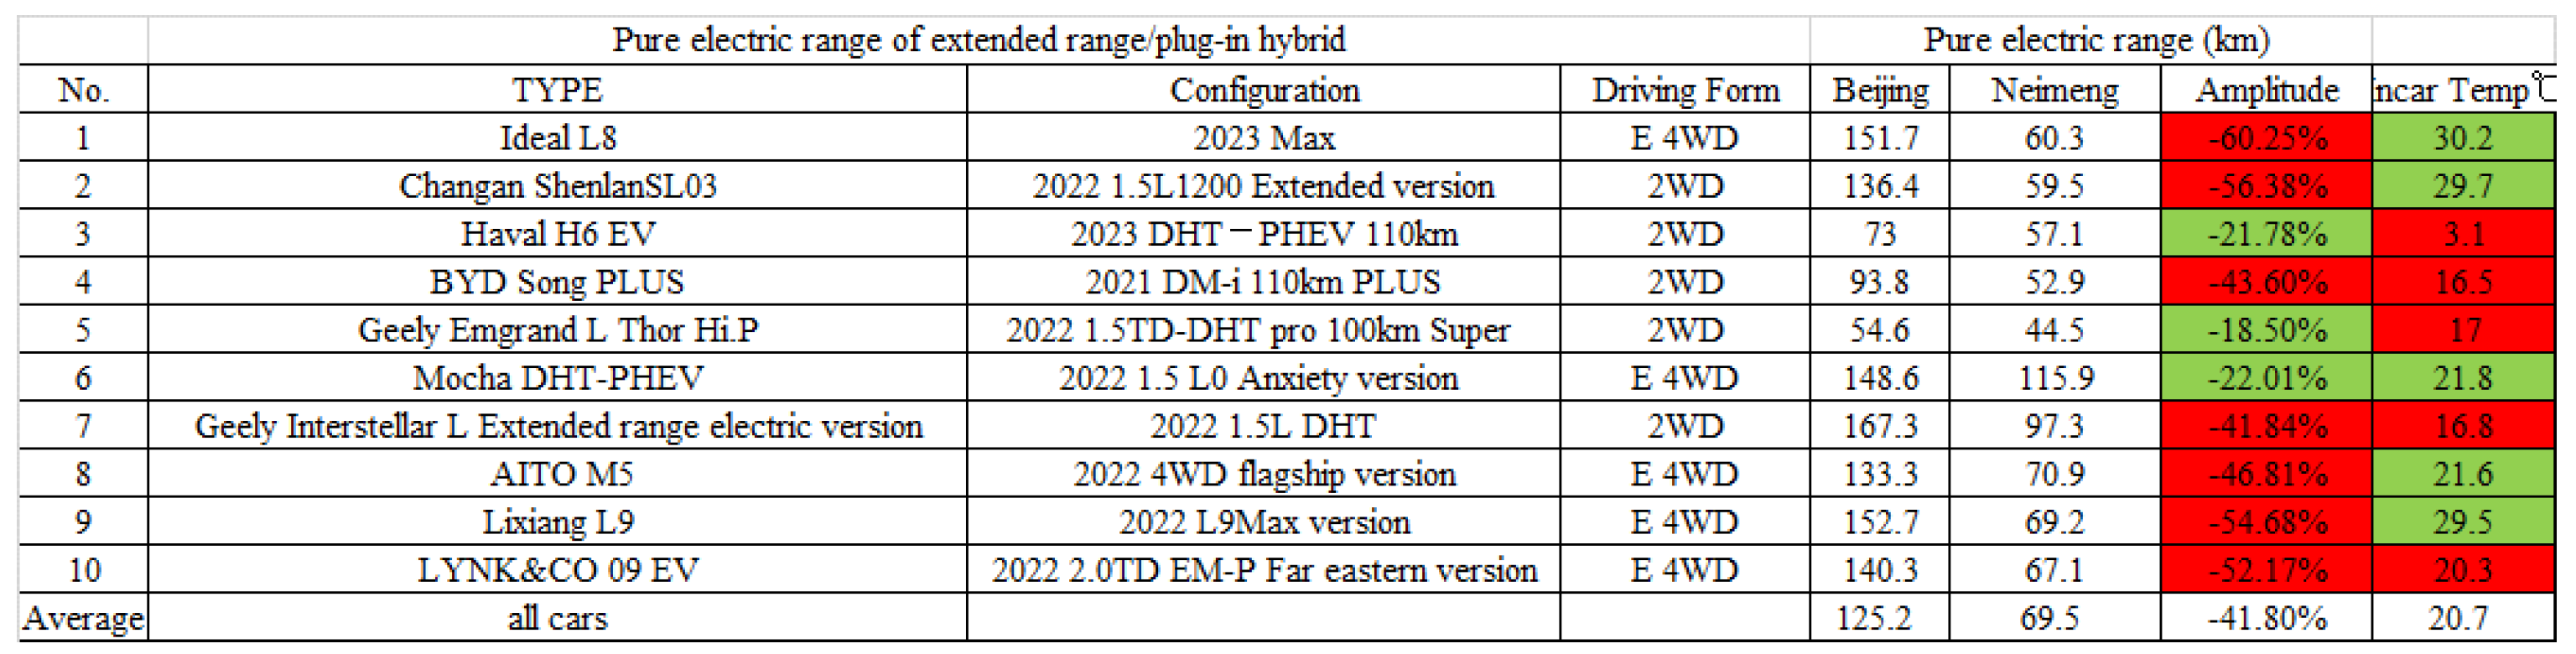
Table 2.
The relationship between the range and interior temperature of EV.
Disclaimer/Publisher’s Note: The statements, opinions and data contained in all publications are solely those of the individual author(s) and contributor(s) and not of MDPI and/or the editor(s). MDPI and/or the editor(s) disclaim responsibility for any injury to people or property resulting from any ideas, methods, instructions or products referred to in the content. |
© 2024 by the authors. Licensee MDPI, Basel, Switzerland. This article is an open access article distributed under the terms and conditions of the Creative Commons Attribution (CC BY) license (http://creativecommons.org/licenses/by/4.0/).
Copyright: This open access article is published under a Creative Commons CC BY 4.0 license, which permit the free download, distribution, and reuse, provided that the author and preprint are cited in any reuse.


