
Submitted:
30 April 2024
Posted:
30 April 2024
You are already at the latest version
Abstract
This study proposed the combination system consisting of biogas dry reforming reactor and solid oxide fuel cell (SOFC). Since a biogas dry reforming is an endothermic reaction, this study adopted a membrane reactor operated due to the non-equilibrium state with H2 separation from the reaction space. This study aimed to clarify the characteristics of Ni/Cr/Ru catalyst using for a biogas dry reforming membrane reactor. Additionally, this study also investigated the comparison of the characteristics of Ni/Cr/Ru catalyst with that of Ni/Cr catalyst. The impact of operation temperature, the molar ratio of CH4 : CO2, the differential pressure between the reaction chamber and the sweep chamber and the introduction of sweep gas on the characteristics of the biogas dry reforming membrane reactor using Pd/Cu membrane and Ni/Cr/Ru catalyst was examined. The concentration of H2 using Ni/Cr/Ru catalyst was larger than that using Ni/Cr catalyst by 2871 ppmV for the molar ratio of CH4 : CO2 = 1.5 : 1 at the reaction temperature of 600 ℃ and the differential pressure of 0 MPa without a sweep gas, especially. Under this condition, CH4 conversion, H2 yield and thermal efficiency were 67.4 %, 1.77×10⁻² % and 0.241 %, respectively.
Keywords:
Biogas dry reforming
; Membrane reactor
; Ni/Cr/Ru catalyst
; Ni/Cr catalyst
; Operation condition
1. Introduction
Since H2 is a secondary energy source, it is thought to be one of promising fuels to solve the global warming problem in the world. Many countries including Japan are trying to develop the technology in order to produce H2 as well as the system using H2 as a fuel. Though there are many approaches to produce H2, this study focuses on a biogas dry reforming to produce H2. Generally, biogas is a fuel consisting of CH4 (55 – 75 vol%) and CO2 (25 – 45 vol%) [1], which is generally produced from fermentation by the action of anaerobic microorganisms on raw materials, e.g. garbage, livestock excretion and sewage sludge. In 2020, 1.46 EJ of produced biogas was obtained in the world, which was approximately five times larger than that produced in 2020 [2]. It can be expected that the amount of produced biogas will increase more. Therefore, this study thinks that the biogas will be a promising source to produce H2.
Generally speaking, a biogas is utilized as a fuel for a gas engine or a micro gas turbine [3]. Biogas contains CO2 of 40 vol% approximately, indicating that the efficiency of the power generation is reduced because of the smaller heating value compared with a natural gas. This study has already proposed the combination system consisting of biogas dry reforming reactor and solid oxide fuel cell (SOFC) [4,5,6]. SOFC can use H2 as well as CO which is a by-product from biogas dry reforming as a fuel. Therefore, this study thinks that this system can be available for wider operation range of the proposed system.
Many studies were investigated by some researchers [7,8,9,10,11,12,13]. The selection of the catalyst used for biogas dry reforming is important. According to the literature survey by the authors [7,8,9,10,11], a Ni-based catalyst is the most popular catalyst type for biogas dry reforming. Tang et al. developed [7] Ni/Rh catalyst and revealed that the reaction of CH* → C* becomes difficult after doping of Rh, which prevented the formation of C*. After that, the formation of carbon deposits was reduced and the carbon deposition resistance of the Rh-Ni catalyst was improved. Ni/Al/LDF developed by Rosset et al. [8] performed the CH4 conversion of 88 % and the CO2 conversion of 93 % at the reaction temperature of 700 ℃. Bimetallic Ni/Ru and Ni/Re catalysts developed by Moreno et al. [9] performed the CH4 conversion of 75 % and the CO2 conversion of 82 % at the reaction temperature of 1023 K. Ni-Ce/TiO2-ZrO2 developed by Shah and Modal [10] performed the maximum produced CH4 of approximately 90 % and H2/CO ratio of 0.75 when CO2/CH4 ratio was 1.5. Ni/CO/TiO2 developed by Sharma and Dhir [11] performed the CH4 conversion of 87.13 % and the CO2 conversion of 92.6 % with 41.1 % production of H2.
In addition, a Ru-based catalyst is also popular catalyst type for biogas dry reforming. Ru/ZrO2-La2O3 catalyst developed by Soria et al. [12] performed the increase in the CH4 conversion and the CO2 conversion with temperature. The CH4 conversion and the CO2 conversion increased up to 25 % and 20 % at the reaction temperature of 500 ℃, respectively. Ru/Ni/Al2O3/MgAl2O4/YSZ catalyst developed by Andraos et al. [13] performed the CH4 conversion of 96 % and the CO2 conversion of 98 % at 750 ℃. Ru/γ-Al2O3 investigated the molar ratio of CH4 : CO2 on the CH4 conversion and the CO2 conversion, the highest CH4 conversion and CO2 conversion were obtained in case of the molar ratio of CH4 : CO2 = 1.6 and 1.8, respectively. The highest CH4 conversion and the CO2 conversion were 56 % and 20 %, respectively.
Though several Ni-based bimetallic catalysts have been investigated, Ni/Cr catalyst has not been investigated well without the authors’ previous study [5]. In addition, there is no study on the characteristics of Ni/Cr/Ru catalyst used for biogas dry reforming yet. Therefore, this study adopts a Ni/Cr/Ru catalyst for a biogas dry reforming in order to clarify the characteristics of Ni/Cr/Ru catalyst. In addition, this study compares the characteristics of Ni/Cr/Ru catalyst using for a biogas dry reforming with that of Ni/Cr catalyst using for a biogas dry reforming.
In addition, it is important to operate lower temperature for the improvement of the thermal energy efficiency of the biogas dry reforming since the biogas dry reforming is an endothermic reaction. For this purpose, a membrane reactor is one effective procedure since the H2 production is promoted by providing the non-equilibrium state with H2 separation from the reaction space [5]. According to the authors’ previous study, the experimental investigation on the biogas dry reforming membrane reactor using Pd/Cu membrane and Ni/Cr catalyst. Compared to pure Ni catalyst, the concentration of produced H2 was higher when using Ni/Cr catalyst. Therefore, this study adopts using Pd/Cu membrane.
The aim of this study is to clarify the characteristics of Ni/Cr/Ru catalyst using for a biogas dry reforming membrane reactor. In addition, this study also conducts the comparison of the characteristics of Ni/Cr/Ru catalyst with that of Ni/Cr catalyst. The impact of operation temperature, the molar ratio of CH4 : CO2, the differential pressure between the reaction chamber and the sweep chamber and the introduction of sweep gas on the characteristics of the biogas dry reforming membrane reactor using Pd/Cu membrane and Ni/Cr/Ru catalyst is examined. The molar ratio of CH4 : CO2 = 1.5 : 1 simulates a biogas in this study.
The reaction scheme of CH4 dry reforming (DR) is described as follows:
CH4 + CO2 ↔ 2CO + 2H2 + 247 kJ/mol
Moreover, the following reaction schemes can be considered as the phenomena in this study:
where Equation (2) is a reverse water gas shift reaction (RWGS), Equation (3) is a methanation reaction, and Equation (4) is a steam reforming of CH4. Regarding a carbon deposition, the following reaction scheme can be considered:
CO2 + H2 ↔ CO + H2O + 41 kJ/mol
CO2 + 4H2 ↔ CH4 + 2H2O − 164 kJ/mol
CH4 + H2O ↔ CO + 3H2 − 41 kJ/mol
H4 ↔ C + 2H2 + 75 kJ/mol
2CO ↔ C + CO2 − 173 kJ/mol
CO2 + 2H2 ↔ C + 2H2O − 90 kJ/mol
CO + H2 ↔ C + H2O − 131 kJ/mol
2. Experiment
2.1. Experimental Apparatus
Figure 1 illustrates the schematic drawing of the experimental apparatus of this study. The experimental apparatus consists of a gas cylinder, mass flow controllers (S48-32; HORIBA METRON INC.), pressure sensors (KM31), valves, a vacuum pump, a reactor composed of reaction chamber and sweep chamber, and gas sampling taps. The reactor is installed in an electric furnace. The temperature in the electric furnace is controlled by far-infrared heaters (MCHNS1; MISUMI). CH4 gas with a purity over 99.4 vol% and CO2 gas with a purity over 99.9 vol% are controlled by mass flow controllers and mixed before flowing into the reaction chamber. The pressure of the mixed gas at the inlet of the reaction chamber is measured by pressure sensors. Ar gas with a purity over 99.99 vol% is controlled by a mass flow controller, and the pressure of Ar gas is measured by a presser sensor. Ar is provided as a sweep gas. The exhausted gas at the outlet of reaction chamber and sweep chamber is suctioned by a gas syringe via the gas sampling taps. The concentration of sampled gas is measured by TCD gas chromatograph (GL Science). The minimum resolution of TCD gas chromatograph and the methanizer is 1 ppmV. The gas pressure at the outlet of the reactor is measured by a pressure sensor. The gas concentration and pressure are measured at the outlet of reaction chamber and sweep chamber, respectively.
Figure 2 illustrates the detail of the reactor in this study. The reactor is composed of a reaction chamber, a sweep chamber and a H2 separation membrane. The reaction chamber and the sweep chamber are made of stainless steel with a size of 40 mm × 100 mm × 40 mm. The volume of reaction space is 16 × 10-5 m3. A porous Ni/Cr/Ru (Ni: 69.2 wt%, Cr: 29.6 wt%, Ru: 1.2 wt%) catalyst is charged in the reaction chamber. In addition, Ni/Cr (Ni: 65 wt%, Cr: 35 wt%) catalyst is also charged in the reaction chamber as a reference catalyst. The mean hole diameter of Ni/Cr/Ru catalyst and Ni/Cr catalyst is 1.95 mm. From the manufacture’s brochure, the porosity of Ni/Cr/Ru catalyst and Ni/Cr catalyst is 0.93. The weight of charged Ni/Cr/Ru catalyst and Ni/Cr catalyst is 66.3 g and 55.3 g, respectively.
Figure 3 displays a photo of the catalyst filled in the reactor of this study. Pd/Cu membrane (Cu of 40 wt%; Tanaka Kikinzoku) is selected as a H2 separation membrane. The thickness of Pd/Cu membrane is 20 μm. The temperature at the inlet, the middle and the outlet of the reaction and the sweep chamber are measured by K-type thermocouples. The initial reaction temperature is controlled and set by far-infrared heater, which is confirmed by the thermocouples. The measured temperature and pressures are controlled by a data logger (GL240; Graphic Corporation).
Table 1 lists the experimental parameters in this study. The molar ratio of provided CH4 : CO2 is changed by 1.5 : 1, 1 : 1 and 1 : 1.5. The molar ratio of CH4 : CO2 simulates a biogas in this study. According to the authors’ previous study [14], the feed ratio of sweep gas to supply gas defined as the flow rate of sweep gas divided by the flow rate of supply gas composing of CH4 and CO2 has been set at 1.0, which is the optimum feed ratio of sweep gas to supply gas [14]. This study investigates the effect of installation of sweep gas. The differential pressure between the reaction chamber and the sweep chamber is varied to 0 MPa, 0.010 MPa and 0.020 MPa. This differential pressure is measured and confirmed by the pressure sensors installed at the outlet of the reaction chamber and the outlet of sweep chamber. The initial reaction temperature which is the initial temperature of reactor is varied to 400 ℃, 500 ℃ and 600 ℃. The initial reaction temperature is measured by thermocouples before suppling the mixed gas of CH4 and CO2 as well as the sweep gas into the reactor. The gas concentrations at the outlet of the reaction chamber and the sweep chamber are detected by an FID gas chromatograph (GC320; GL Science) and a methanizer (MT221; GL Science). This study shows the average data of five trials for each experimental condition in the following figures. The distribution of each gas concentration is below 10 %.
2.2. Assessment Factor to Evaluate the Performance of Membrane Reactor
This study evaluates the performance of proposed membrane reactor by gas concentration at the outlet of the reaction chamber and the sweep chamber. Using these data, CH4 conversion (XCH4), CO2 conversion (XCO2), H2 yield (YH2), H2 selectivity (SH2) and CO selectivity (SCO) are evaluated. These assessment factors are defined as follows:
XCH4 = (CCH4, in – CCH4, out)/(CCH4, in) × 100
XCO2 = (CCO2, in – CCO2, out)/(CCO2, in) × 100
YH2 = (1/2)(CH2, out)/(CCH4, in) × 100
SH2 = (CH2, out)/(CH2, out + CCO, out) × 100
SCO = (CCO, out)/(CH2, out + CCO, out) × 100
where CCH4, in means a concentration of CH4 at the inlet of reaction chamber [ppmV],
CCH4, out means a concentration of CH4 at the outlet of reaction chamber [ppmV],
CCO2, in means a concentration of CO2 at the inlet of reaction chamber [ppmV], CCO2, out is
a concentration of CO2 at the outlet of reaction chamber [ppmV], CH2, out means a
concentration of H2 at the outlet of reaction chamber and sweep chamber [ppmV], and
CCO, out means a concentration of CO at the outlet of reaction chamber [ppmV].
Moreover, H2 permeability (H) and permeation flux (F) are evaluated as follows:
where CH2, out, sweep means a concentration of H2 at the outlet of sweep chamber [ppmV],
H = (CH2, out, sweep)/(CH2, out, sweep + CH2, out, react) × 100
CH2, out, react means a concentration of H2 at the outlet of reaction chamber [ppmV], P means
a permeation factor [mol/(m·s·Pa0.5)], Preact, ave means an average pressure of reaction
chamber [MPa], Psweep, ave means an average pressure of sweep chamber [MPa] and δ means
the thickness of Pd/Cu alloy membrane [m].
Furthermore, the thermal efficiency of the membrane reactor (η) is also evaluated,
which is defined as follows:
where QH2 means the heating value of produced H2 based on the lower heating value [W],
WR.C. means the amount of pre-heat of supply gas for the reaction chamber [W], WS.C. means
the amount of pre-heat of the sweep gas for the sweep chamber [W], and Wp is the pump
power to give the differential pressure between the reaction chamber and the sweep
chamber [W].
3. Results and Discussion
3.1. Comparison of Each Gas Concentration in Reaction Chabmber and Sweep Chamber Using Ni/Cr/Ru Catalyst with That Using Ni/Cr Catalyst Changing the Reaction Temperature and the Differential Pressure between the Reaction Chamber and The Sweep Chamber
Figure 4 and Figure 5 show the impact of reaction temperature on each gas concentration in the reaction chamber and the concentration of H2 in the sweep chamber, respectively. The differential pressure between the reaction chamber and the sweep chamber is changed by 0 MPa, 0.010 MPa and 0.020 MPa. In these figures, the molar ratio of CH4 : CO2 is 1.5 : 1. In addition, W and W/O indicates the condition with a sweep gas and that without a sweep gas, respectively in these figures. Each gas concentration in the reaction chamber and the sweep chamber using Ni/Cr/Ru catalyst is compared to that using Ni/Cr catalyst in these figures. According to Figure 4, it is seen that the concentration of H2 in the reaction chamber increases with the increase in the reaction temperature. DR is an endothermic reaction as shown in Equation (1), resulting that the reaction is progressed with the increase in the reaction temperature well according to the theoretical kinetic study [15]. This tendency is confirmed irrespective of catalyst type as well as the differential pressure between the reaction chamber and the sweep chamber. On the other hand, it is seen from Figure 5 that the concentration of H2 in sweep chamber increases with the increase in the reaction temperature. The concentration of H2 in the reaction chamber is higher at higher reaction temperature, resulting that the driving force to penetrate Pd/Cu membrane is larger due to the large H2 partial differential pressure between the reaction chamber and the sweep chamber, i.e. large concentration difference of H2 between the reaction chamber and the sweep chamber. As a result, the higher concentration of H2 in the sweep chamber is obtained.
Regarding the impact of differential pressure between the reaction chamber and the sweep chamber, it is thought from Figure 4 and Figure 5 that the concentration of H2 in the reaction chamber and the sweep chamber is higher with the decrease in the differential pressure. As to the differential pressure of 0.020 MPa, the differential pressure is too high, resulting that the separation rate of H2 might be higher than the production rate of H2 in the reaction chamber. Since the permeation flux at the differential pressure of 0.020 MPa is 7.07 × 10⁻⁴ mol/(m2·s) which is the largest among the investigated differential pressures, the effect of pressure on the H2 separation performance is the largest. As a result, it is thought that the effective non-equilibrium state can not be obtained. Comparing the concentration of H2 in the reaction chamber shown in Figure 4, the concentration of H2 at the differential pressure of 0.020 MPa is relatively lower than that at the differential pressures. It is revealed that the production performance of H2 is lower at the differential pressure of 0.020 MPa according to this tendency.
As to the impact of sweep gas, it is not large according to Figure 4 and Figure 5. Since the produced H2 is not high, the driving force, i.e. the difference in the partial pressure of H2 between the reaction chamber and the sweep chamber is not high. As a result, it is thought that the improvement of H2 separation is not obtained by the introduction of sweep gas.
Comparing the performance of catalyst type, the concentration of H2 in the reaction chamber and that in the sweep chamber using Ni/Cr/Ru catalyst are much higher than those using Ni/Cr catalyst according to Figure 4 and Figure 5. This tendency is confirmed irrespective of the reaction temperature and the differential pressure. It is revealed from Figure 4 that the concentration of H2 using Ni/Cr/Ru catalyst is higher than that using Ni/Cr catalyst by 2871 ppmV for the molar ratio of CH4 : CO2 = 1.5 : 1 at the reaction temperature of 600 ℃ and the differential pressure of 0 MPa without a sweep gas, especially. Since there is no previous study investigating the performance of Ni/Cr/Ru catalyst, it is a new knowledge obtained by this study. According to the previous study investigating Ni/Ru/Al2O3, Ni/Ru/MgAl2O4 and Ni/Ru/YSZ [13], the supported material, e.g. MgAl2O4 having the high sintering resistance played a very important role during DR reaction. In addition, these supported materials exhibited a high interaction between Ni and them, resulting that high activity and stability. On the other hand, Cr was investigated as a co-catalyst in the authors’ precious study [5]. As a result, it has been revealed that Ni/Cr is superior to Ni as a catalyst for biogas DR. In other words, Cr performs as a catalyst, not a supported material. In this study, Ni, Ru and Cr have been selected as catalyst. This study thinks that the synergy effect of them is obtained.
3.2. Comparison of each Gas Concentration in Reaction Chabmber and Sweep Chamber Using Ni/Cr/Ru Catalyst with That Using Ni/Cr Catalyst Changing The Molar Ratio and the Differential Pressure between the Reaction Chamber and the Sweep Chamber
Figure 6 and Figure 7 show the impact of molar ratio on each gas concentration in the reaction chamber and the concentration of H2 in the sweep chamber, respectively. The differential pressure between the reaction chamber and the sweep chamber is changed by 0 MPa, 0.010 MPa and 0.020 MPa. In these figures, the reaction temperature is 600 ℃. In addition, W and W/O indicates the condition with a sweep gas and that without a sweep gas, respectively in these figures. Each gas concentration in the reaction chamber and the sweep chamber using Ni/Cr/Ru catalyst is compared to that using Ni/Cr catalyst in these figures.
It is seen from Figure 6 that the highest concentration of H2 is obtained for the molar ratio of CH4 : CO2 = 1.5 : 1 at 600 ℃ irrespective of the differential pressure and the catalyst type. The tendency that the highest concentration of H2 is obtained for the molar ratio of CH4 : CO2 = 1.5 : 1 among the investigated molar ratios matches with the authors’ previous study investigating Ni and Ni/Cr catalyst [5]. The reaction mechanism to explain why the highest concentration of H2 is obtained for the molar ratio of CH4 : CO2 = 1.5 : 1 can be explained as follows [5]: Since the amount of CH4 is larger in this case, (i) H2 is produced by the reactions shown in Equation (1) and (5), (ii) the produced H2 is consumed by the reaction shown in Equation (2), resulting in CO production, (iii) a part of CO produced by the reactions shown in Equations (1) and (2) is consumed by Equation (6), (iv) H2O produced by the reactions shown in Equation (2) and (3) are consumed during Equation (4).
According to Figure 7, the concentration of H2 in the sweep chamber is the highest for the molar ratio of CH4 : CO2 = 1.5 : 1 among the investigated molar ratios. The concentration of H2 in the reaction chamber is higher at higher reaction temperature, resulting that the driving force to penetrate Pd/Cu membrane is larger due to the large H2 partial differential pressure between the reaction chamber and the sweep chamber, i.e. large concentration difference of H2 between the reaction chamber and the sweep chamber. As a result, the higher concentration of H2 in the sweep chamber is obtained.
Comparing the performance of catalyst type, the concentration of H2 in the reaction chamber and that in the sweep chamber using Ni/Cr/Ru catalyst are much higher than those using Ni/Cr catalyst, especially for the molar ratio of CH4 : CO2 = 1.5 : 1 according to Figure 6 and Figure 7. It is revealed that the superiority of Ni/Cr/Ru catalyst is obtained following the reaction mechanism as explained above. As to carbon deposition which is explained by Equations (5) and (6), this study has confirmed by the photo shown in Figure 8. We can observe that the color of catalyst is changed into black, which indicates a carbon deposition after the experiment. In addition, as to H2O formation which is explained by Equations (2) and (3), this study has confirmed by the naked observation using gas bag shown in Figure 9. The left figure in Figure 9 is the gas bag to capture H2O which remains in the red circle shown in Figure 9. The changed color area on the white bar to capture H2O, which is shown in the right figure in Figure 9, indicates the formation of liquid H2O. During the experiment, H2O exists as a vapor since the reaction temperature is over 400 ℃. After capturing H2O by gas bag, the phase of H2O changes into a liquid due to temperature drop.
3.3. Comparison of Assement Factor among the Investifated Experimental Conditions
To investigate the preformance of proposed membrane reactor using Ni/Cu/Ru catalyst and Pd/Cu membrane, Table 2, Table 3 and Table 4 list comparison of CH4 conversion, CO2 convresion, H2 yield, H2 selectivity, CO selectivity, H2 permeability, permeation flux and thermal efficiency for the different temperature, the molar ratio of CH4 : CO2 and the diffenretial pressure between the reaction chamber and the sweep chamber, respectevely. In these tables, the assement factors for Ni/Cu are also listed as a reference.
It is found from Table 2, Table 3 and Table 4 that the most of the CO2 conversion shows a negative value. According to the concentration of H2, CH4 and CO2 shown in Figure 4, Figure 5, Figure 6 and Figure 7 as well as CH4 conversion and CO2 conversion listed in Table 2, Table 3 and Table 4, the reaction consuming CH4 and producing CO2 occurs [5]. In addition, it is seen from Table 2, Table 3 and Table 4 that CO selectivity is much higher than H2 selectivity. Though H2 is moved to the sweep chamber as shown in Figure 5 and Figure 7, some H2 which is produced remains in the reaction chamber as shown in Figure 6 and Figure 8. Then, all H2 produced does not meve to the sweep chamber. Thereore, the reaction mechanism can be explained as follows [5]: (i) H2 is produced by the reactions shown in Equaton (1) and (5); (ii) the produced H2 is consumed by the reaction shown in Equation (2), resutling that CO is produced; (iii) a part of CO produced by the reactions shown in Equations (1) and (2) is consumed during the reacion shown in Equation (6); (iv) H2O produced during the reactions of Equations (2) and (3) are consumed by Equation (4). The productoin of carbon and H2O has been confirmed as explained before.
From the investigation by this study, the highest concentration of H2 using Ni/Cr/Ru catalyst is obtained for the molar ratio of CH4 : CO2 = 1.5 : 1 at the reaction temperature of 600 ℃ and the differential pressure of 0 MPa without a sweep gas, which is 3080 ppmV. Under this condition, CH4 conversion, H2 yield and thermal efficiency are 67.4 %, 1.77×10⁻² % and 0.241 %, respectively. This result is not high compared to the previous study using Ni based catalyst and Ru based catalyst [7,8,9,10,11,12,13]. To improve the performance of H2 production and thermal efficiency, the following subjects can be considered: (i) the optimization of catalyst shape and composition, i.e., the pore size and the weight ratio of Ni, Cr and Ru, (ii) the optimization of thickness and composition of Pd/Cu membrane, i.e. the thinner membrane and the smaller ratio of Cu, (iii) matching of the H2 separation rate of Pd/Cu membrane and the H2 production rate of the catalyst, e.g. Ni/Cr/Ru, deciding the optimum operation condition. They are the future work in this study.
4. Conclusions
This study has investigated to clarify the characteristics of Ni/Cr/Ru catalyst using for a biogas dry reforming membrane reactor. In addition, this study has also investigated the comparison of the characteristics of Ni/Cr/Ru catalyst with that of Ni/Cr catalyst. The impact of operation temperature, the molar ratio of CH4 : CO2, the differential pressure between the reaction chamber and the sweep chamber and the introduction of sweep gas on the characteristics of the biogas dry reforming membrane reactor using Pd/Cu membrane and Ni/Cr/Ru catalyst has been examined. As a result, the following conclusions can be drawn:
- (i)
-
It is revealed that the concentration of H2 in the reaction chamber increases with theincrease in the reaction temperature. This tendency is confirmed irrespective of thecatalyst type as well as the differential pressure between the reaction chamber and thesweep chamber.
- (ii)
-
It is revealed that the concentration of H2 in the sweep chamber increases with theincrease in the reaction temperature. Since the concentration of H2 in the reactionchamber is higher at higher reaction temperature, the driving force to penetrate Pd/Cumembrane is larger due to the large H2 partial differential pressure between thereaction chamber and the sweep chamber. As a result, the higher concentration of H2in the sweep chamber is obtained.
- (iii)
-
It is revealed that the concentration of H2 in the reaction chamber and the sweepchamber is higher with the decrease in the differential pressure. As to the differentialpressure of 0.020 MPa, the differential pressure is too high, resulting that theseparation rate of H2 might be higher than the production rate of H2 in the reactionchamber. As a result, it is thought that the effective non-equilibrium state can not beobtained.
- (iv)
-
Regarding the effect of sweep gas, since the produced H2 is not high, the driving force,i.e. the difference in partial pressure of H2 between the reaction chamber and thesweep chamber is not high. As a result, it is thought that the improvement of H2separation is not obtained by the introduction of sweep gas.
- (v)
-
Comparing the performance of catalyst type, the concentration of H2 in the reactionchamber and that in the sweep chamber using Ni/Cr/Ru catalyst are much larger thanthose using Ni/Cr catalyst. This tendency is confirmed irrespective of the reactiontemperature and the differential pressure.
- (vi)
-
From the investigation by this study, the concentration of H2 using Ni/Cr/Ru catalystis larger than that using Ni/Cr catalyst by 2871 ppmV for the molar ratio of CH4 : CO2= 1.5 : 1 at the reaction temperature of 600 ℃ and the differential pressure of 0 MPawithout a sweep gas, especially. This study thinks that the synergy effect of them isobtained.
- (vii)
-
It is revealed that the highest concentration of H2 is obtained for the molar ratio ofCH4 : CO2 = 1.5 : 1 at 600 ℃ irrespective of the differential pressure and the catalysttype. The tendency that the highest concentration of H2 is obtained for the molar ratioof CH4 : CO2 = 1.5 : 1 among the investigated molar ratios matches with the authors’previous study investigating Ni and Ni/Cr catalyst.
- (viii)
-
According to the assessment evaluation, the CO2 conversion shows a negative valueand CO selectivity is much higher than H2 selectivity. The reaction mechanism can beexplained as follows: (i) H2 is produced by the reactions shown in Equation (1) and(5); (ii) the produced H2 is consumed by the reaction shown in Equation (2), resultingthat CO is produced; (iii) a part of CO produced by the reactions shown in Equations(1) and (2) is consumed during the reaction shown in Equation (6); (iv) H2O producedduring the reactions of Equations (2) and (3) are consumed by Equation (4).
- (ix)
-
From the investigation by this study, the highest concentration of H2 using Ni/Cr/Rucatalyst is obtained for the molar ratio of CH4 : CO2 = 1.5 : 1 at the reaction temperatureof 600 ℃ and the differential pressure of 0 MPa without a sweep gas, which is 3080ppmV. Under this condition, CH4 conversion, H2 yield and thermal efficiency are67.4 %, 1.77×10⁻² % and 0.241 %, respectively.
Author Contributions
Conceptualization and writing—original draft preparation, A.N.; methodology and data curation, M.I.; validation, S.Y. and R. I.
Funding
The present research was funded by the Iwatani Naoji Foundation and the joint research program of the Institute of Materials and Systems for Sustainability, Nagoya University.
Data Availability Statement
The authors agree to share the data of the article published in this journal.
Acknowledgments
The authors acknowledge the financial support from the Iwatani Naoji Foundation and the joint research program of the Institute of Materials and Systems for Sustainability, Nagoya University.
Conflicts of Interest
The authors declare no conflicts of interest.
References
- Kalai, D.Y.; Stangeland, K.; Jin, Y.; Tucho, W.M.; Yu, Z. Biogas dry reforming for syngas production on La promoted hydrotalcitederived Ni catalyst. Int. J. Hydrog. Energy 2018, 43, 19438–19450. [CrossRef]
- World Bioenergy Association. Global Bioenergy Statistics. Available online: https://worldbioenergy.org./global-bioenergy-statistics (accessed on 2 April 2024).
- The Japan Gas Association. Available online: https://www.gas.or.jp/gas-life/biogas/ (accessed on 2 April 2024).
- Nishimura, A.; Takada, T.; Ohata, S.; Kolhe, M. L. Biogas dry reforming for hydrogen through membrane reactor utilizing negative pressure. fuels 2021, 2. [CrossRef]
- Nishimura, A.; Hayashi, Y.; Ito, S.; Kolhe, M. L. Performance analysis of hydrogen production for a solid oxide fuel cell system using a biogas dry reforming membrane reactor with Ni and Ni/Cr catalysts. fuels, 2023, 4. [CrossRef]
- Nishimura, A.; Sato, R.; Hu, E. An energy production system powered by solar heat with biogas dry reforming reactor and solar heat with biogas dry reforming reactor and solid oxide fuel cell. Smart Grid and Renewable Energy 2023, 14, 85-106. [CrossRef]
- Tang, L.; Huang, X.; Ran, J.; Guo, F.; Niu, J.; Qiu, H.; Ou, Z.; Yan, Y.; Yang, Z.; Qin, C. Density functional theory studies on direct and oxygen assisted activation of C-H bond for dry reforming of methane over Rh-Ni catalyst. International Journal of Hydrogen Energy 2022, 47, 30391-30403. [CrossRef]
- Rosset, M.; Feris, L. A.; Perez-Lopez, O. W. Biogas dry reforming using Ni-Al-LDH catalysts reconstructed with Mg and Zn. International Journal of Hydrogen Energy 2021, 46, 20359-20376. [CrossRef]
- Moreno, A. A.; Ramirez-Reina, T.; Ivanova, S.; Roger, A. C.; Centeno, M. A.; Odriozola, J. A. Bimetallic Ni-Ru and Ni-Re catalysts for dry reforming of methane: understanding the synergies of the selected promoters. Frontiers in Chemistry 2021, 9. [CrossRef]
- Shah, M.; Mondal, P. Optimization of CO2 reforming of methane process for the syngas production over Ni-Ce/TiO2-ZrO2 catalyst using the Taguchi method. International Journal of Hydrogen Energy 2021, 46, 22769-22812. [CrossRef]
- Sharma, H.; Dhir, A. Hydrogen augmentation of biogas through dry reforming over bimetallic nickel-cobalt catalysts supported on titania. Fuel 2020, 279. [CrossRef]
- Soria, M. A.; Mateos-Pedrero, C.; Guerrero-Ruiz, A.; Rodriguez-Ramos, I. Thermodynamic and experimental study of combined dry and steam reforming of methane on Ru/ZrO2-La2O3 catalyst at low temperature. International Journal of Hydrogen Energy 2011, 36, 15212-15220. [CrossRef]
- Andraos, S.; Abbas-Ghaleb, R.; Chlala, D.; Vita, A.; Italiano, C.; Lagana, M.; Pino, L.; Nakhl, M.; Specchia, S. Production of hydrogen by methane dry reforming over ruthenium-nickel based catalysts deposited on Al2O3 MgAl2O4 and YSZ. International Journal of Hydrogen Energy 2019, 44, 25706-25716. [CrossRef]
- Nishimura, A.; Ohata, S.; Okukura, K.; Hu, E. The impact of operating conditions on the performance of a CH4 dry reforming membrane reactor for H2 production. Journal of Energy and Power Technologies 2020, 2. [CrossRef]
- Cherbanski, R.; Kotkowski, T.; Molga, E. Thermogravimetric analysis of coking during dry reforming of methane. International Journal of Hydrogen Energy 2023, 48, 7346-7360. [CrossRef]
Figure 1.
Schematic drawing of experimental apparatus [5].
Figure 1.
Schematic drawing of experimental apparatus [5].
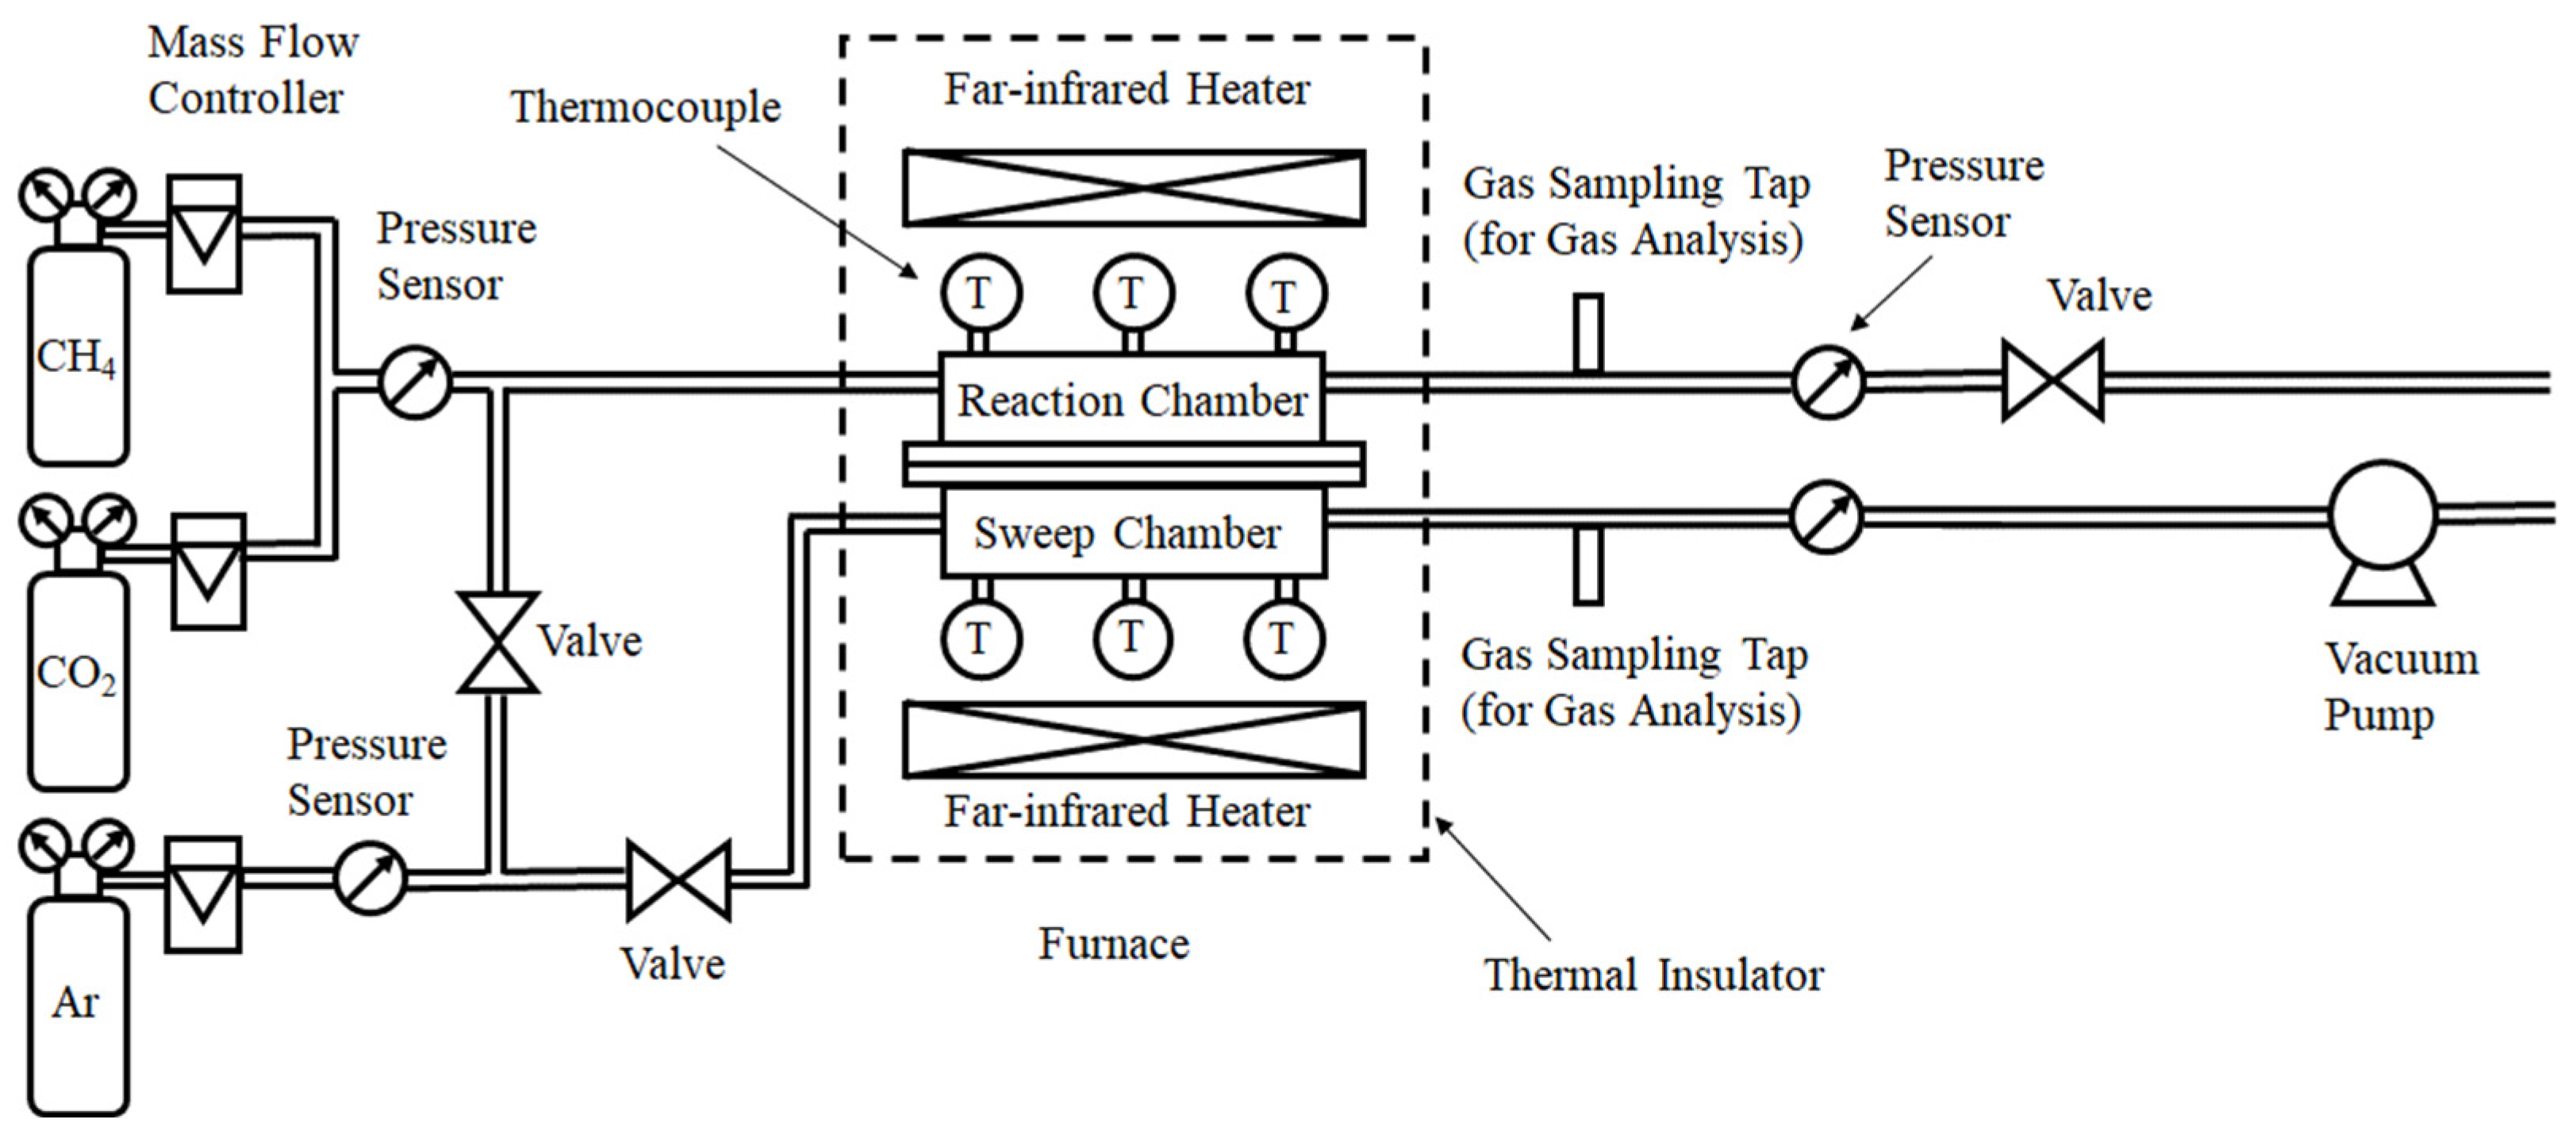
Figure 2.
Schematic drawing of detail of reactor part.
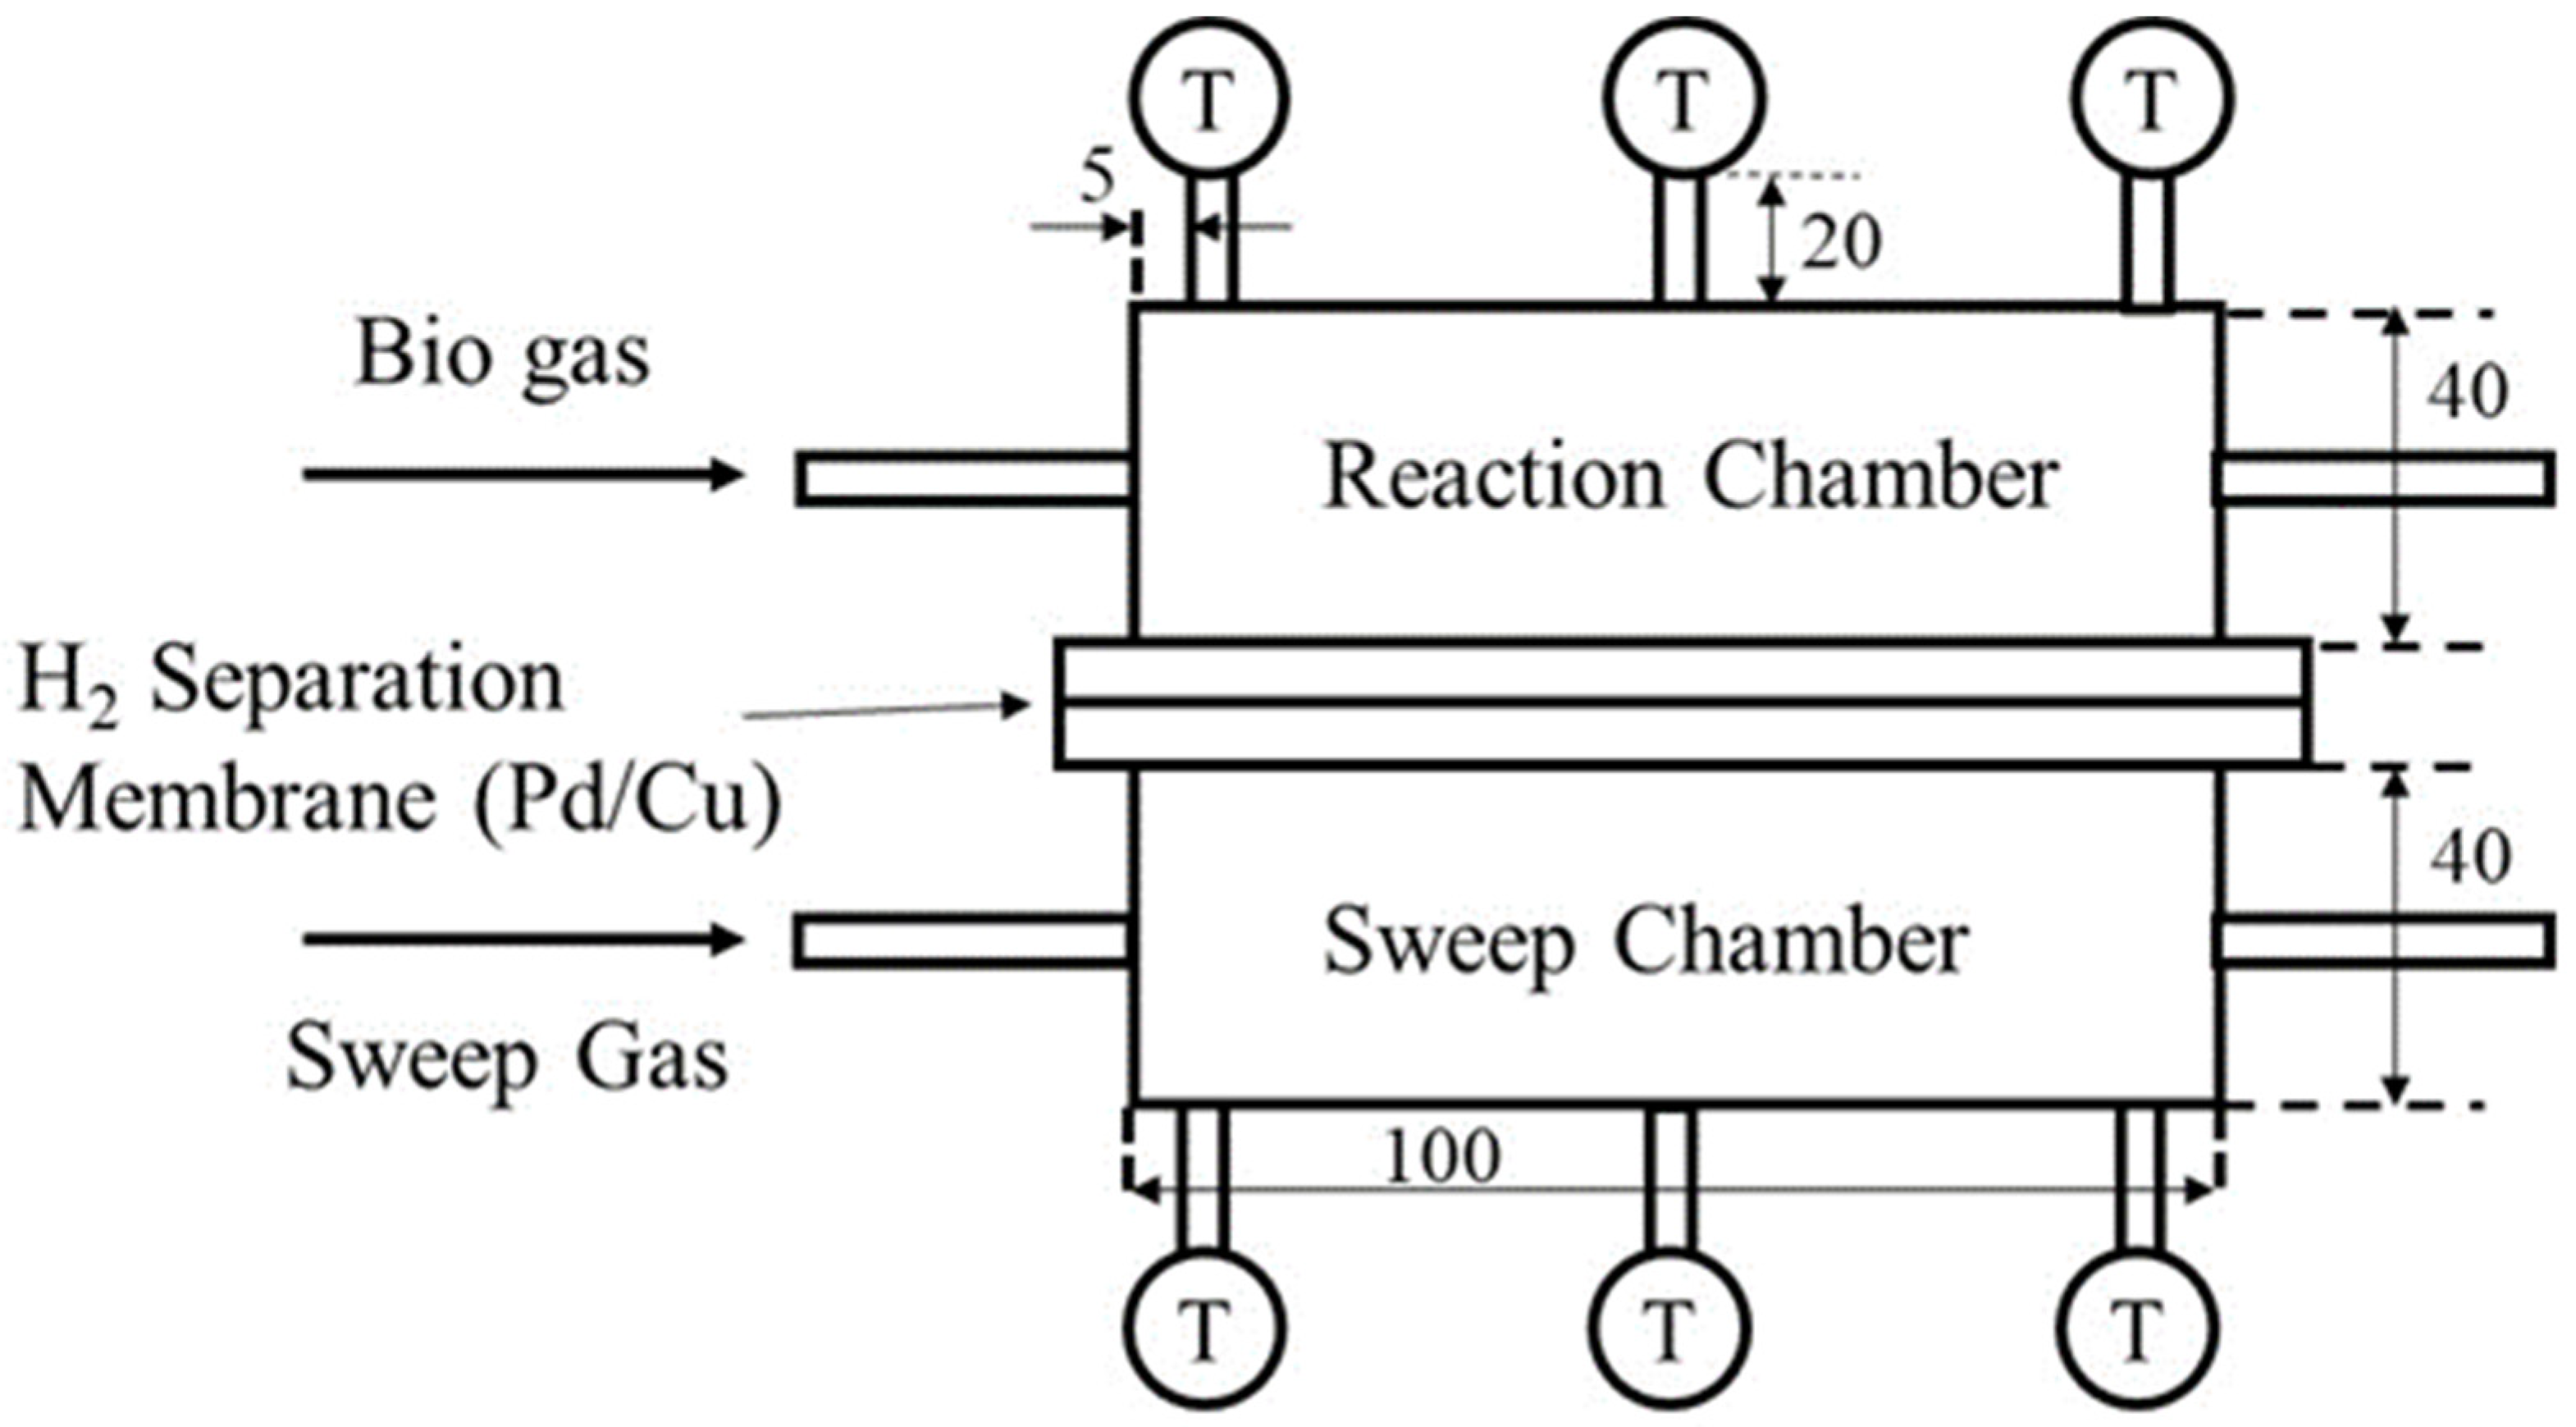
Figure 3.
Photo of charged Ni/Cr/Ru catalyst in the reactor.
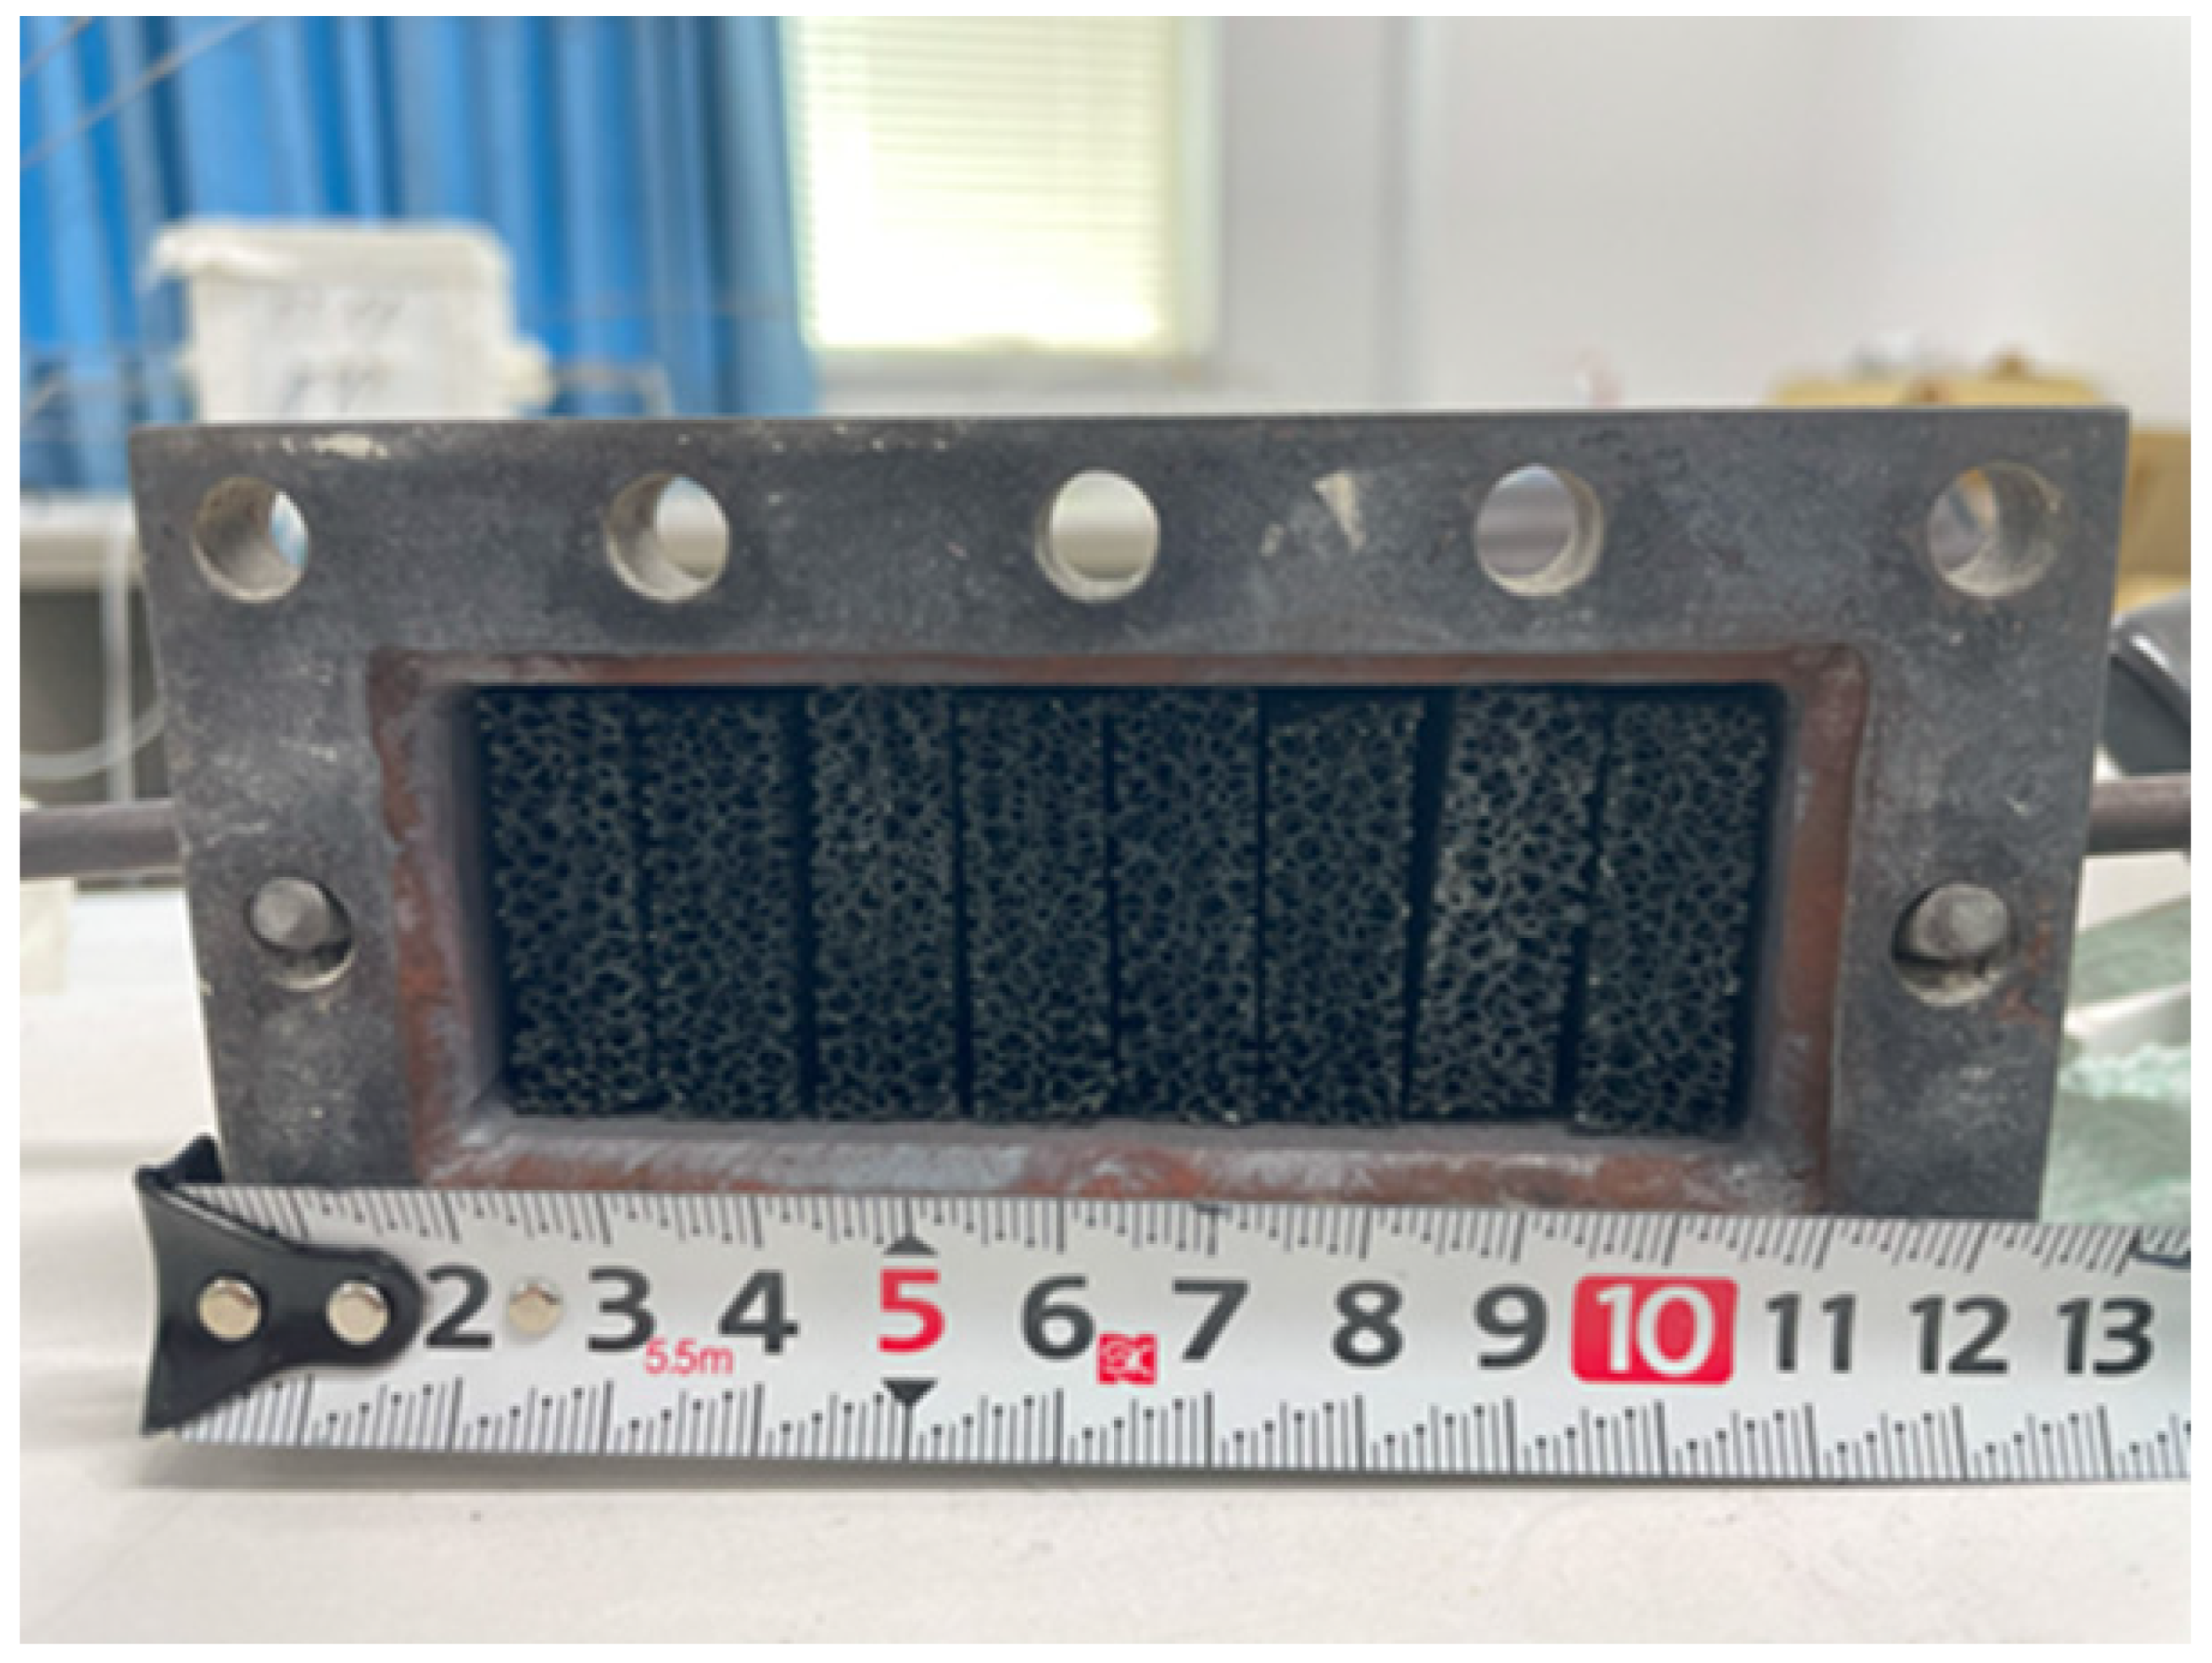
Figure 4.
Comparison of each gas concentration in reaction chamber using Ni/Cr/Ru catalyst with using Ni/Cr catalyst changing reaction temperature (CH4 : CO2 = 1.5 : 1, differential pressure: a): 0 MPa, b): 0.010 MPa, c): 0.020 MPa).
Figure 4.
Comparison of each gas concentration in reaction chamber using Ni/Cr/Ru catalyst with using Ni/Cr catalyst changing reaction temperature (CH4 : CO2 = 1.5 : 1, differential pressure: a): 0 MPa, b): 0.010 MPa, c): 0.020 MPa).
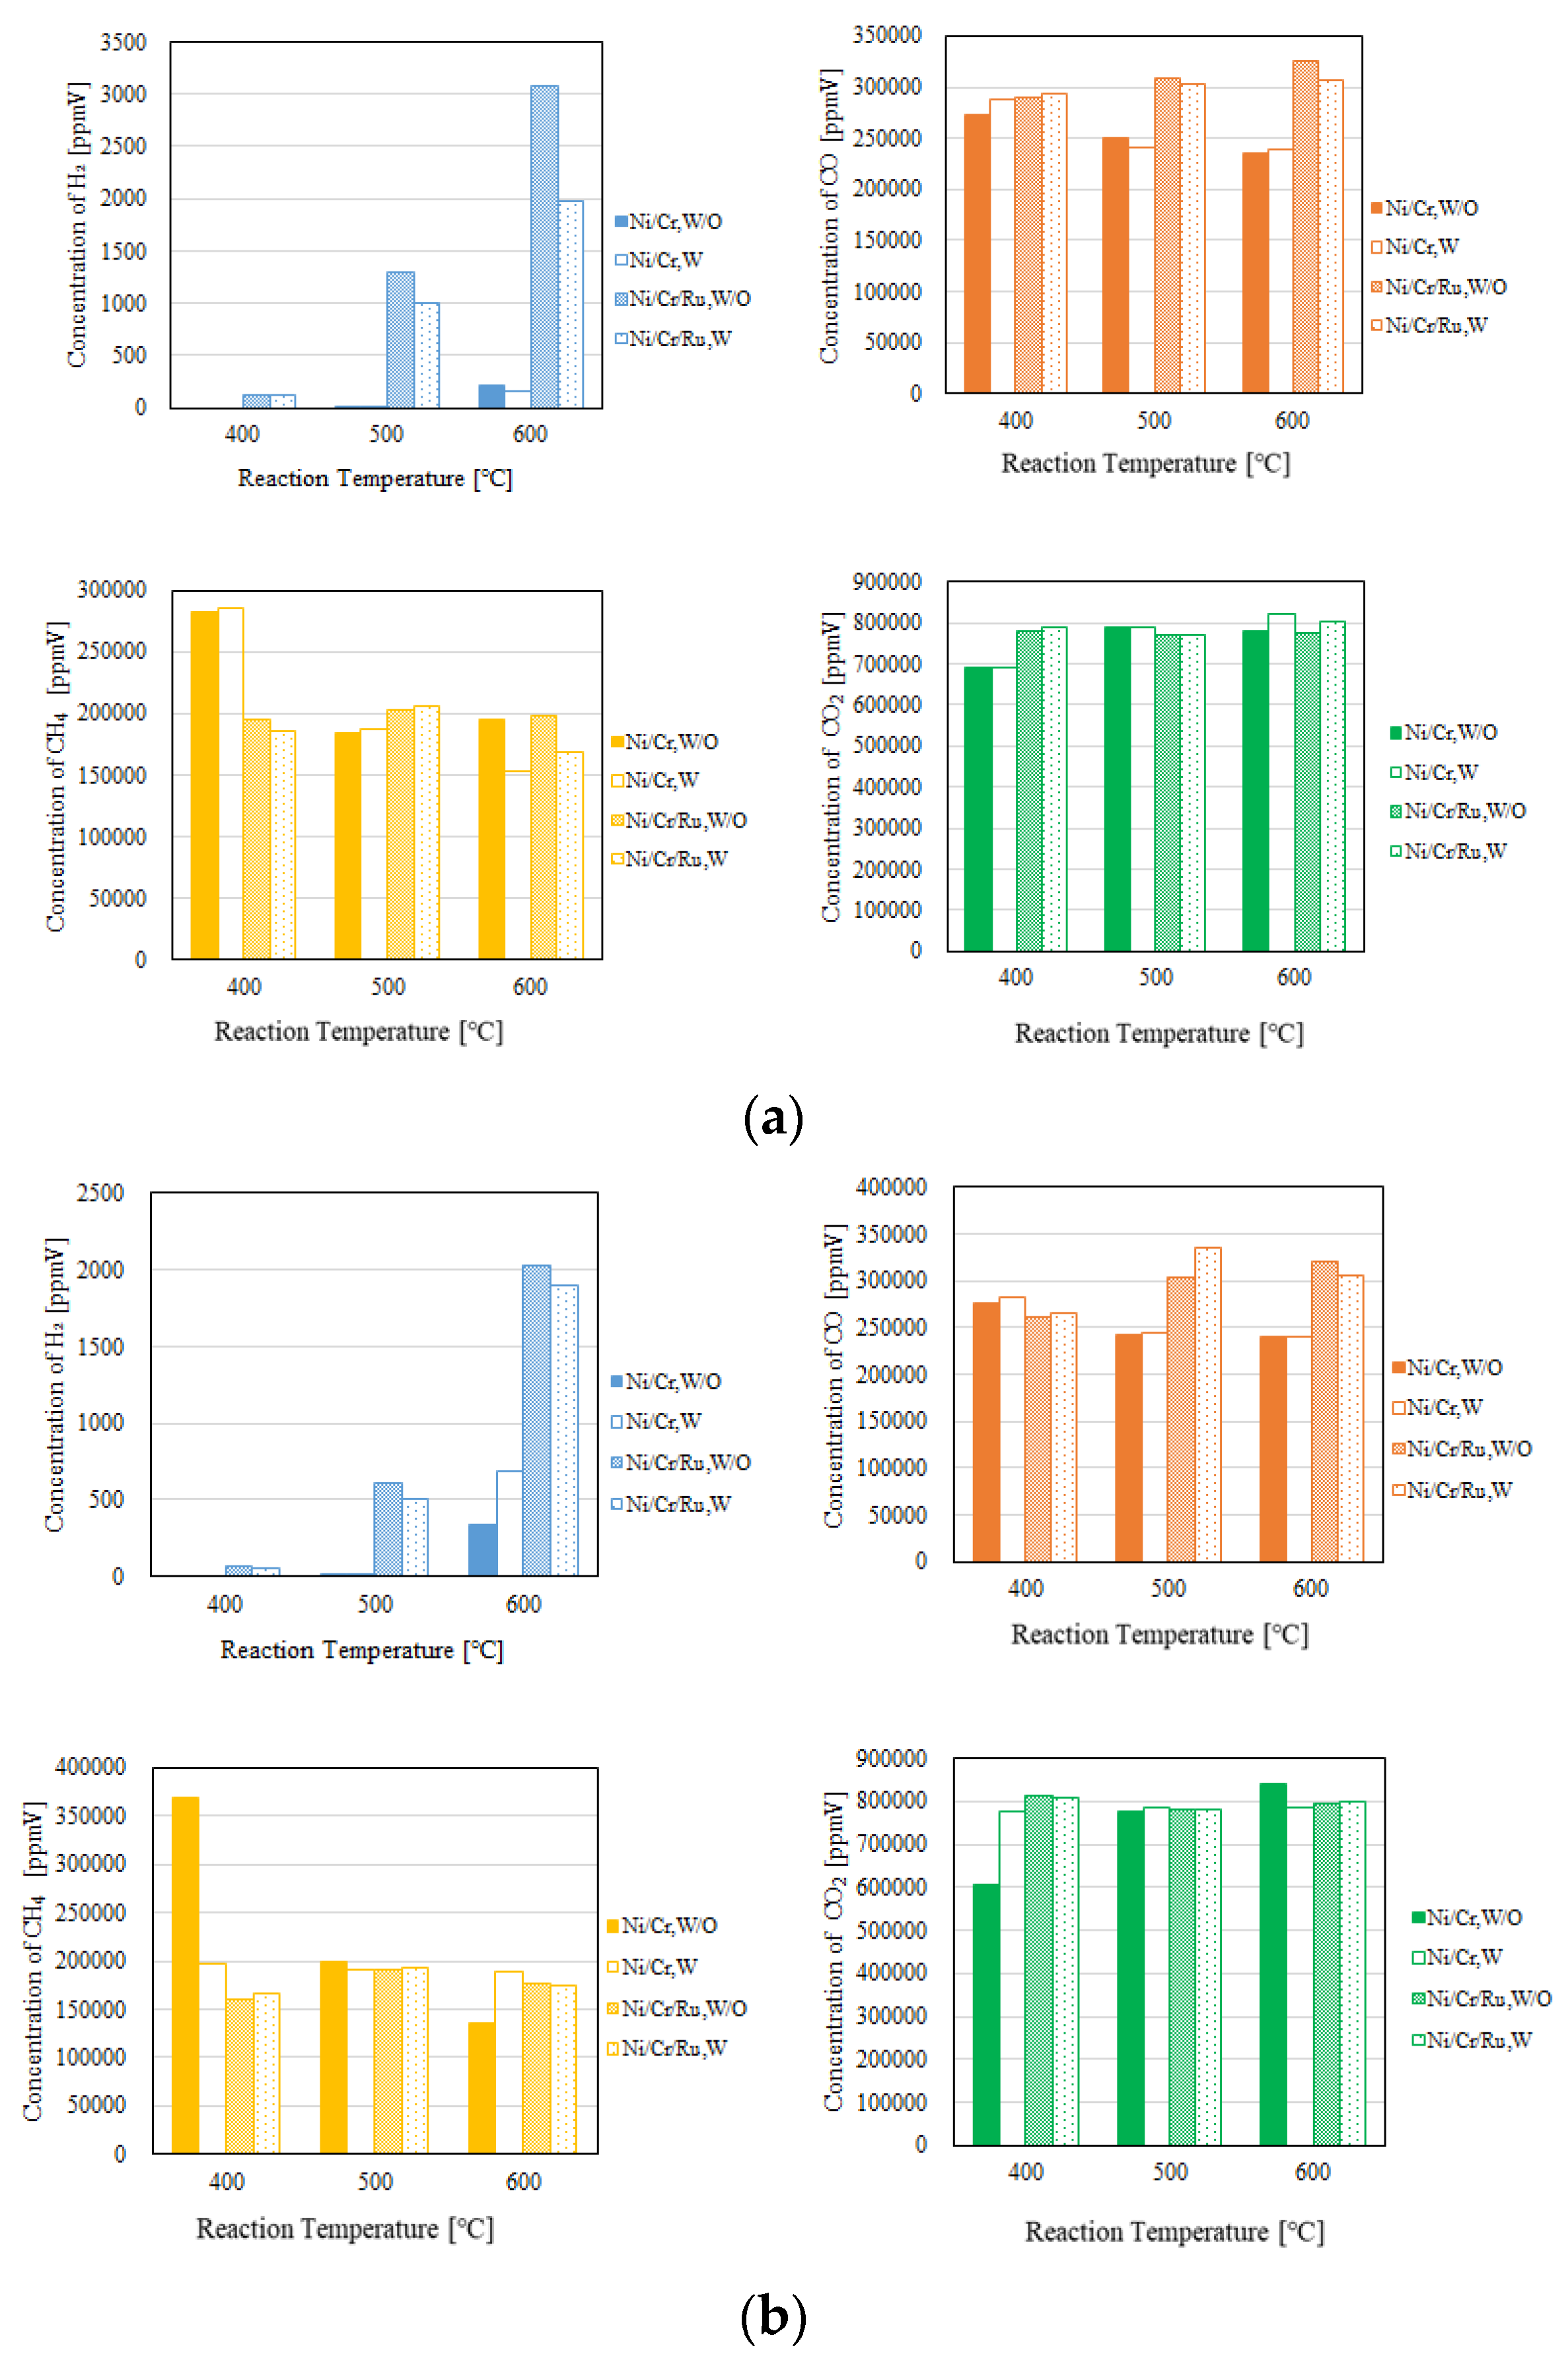
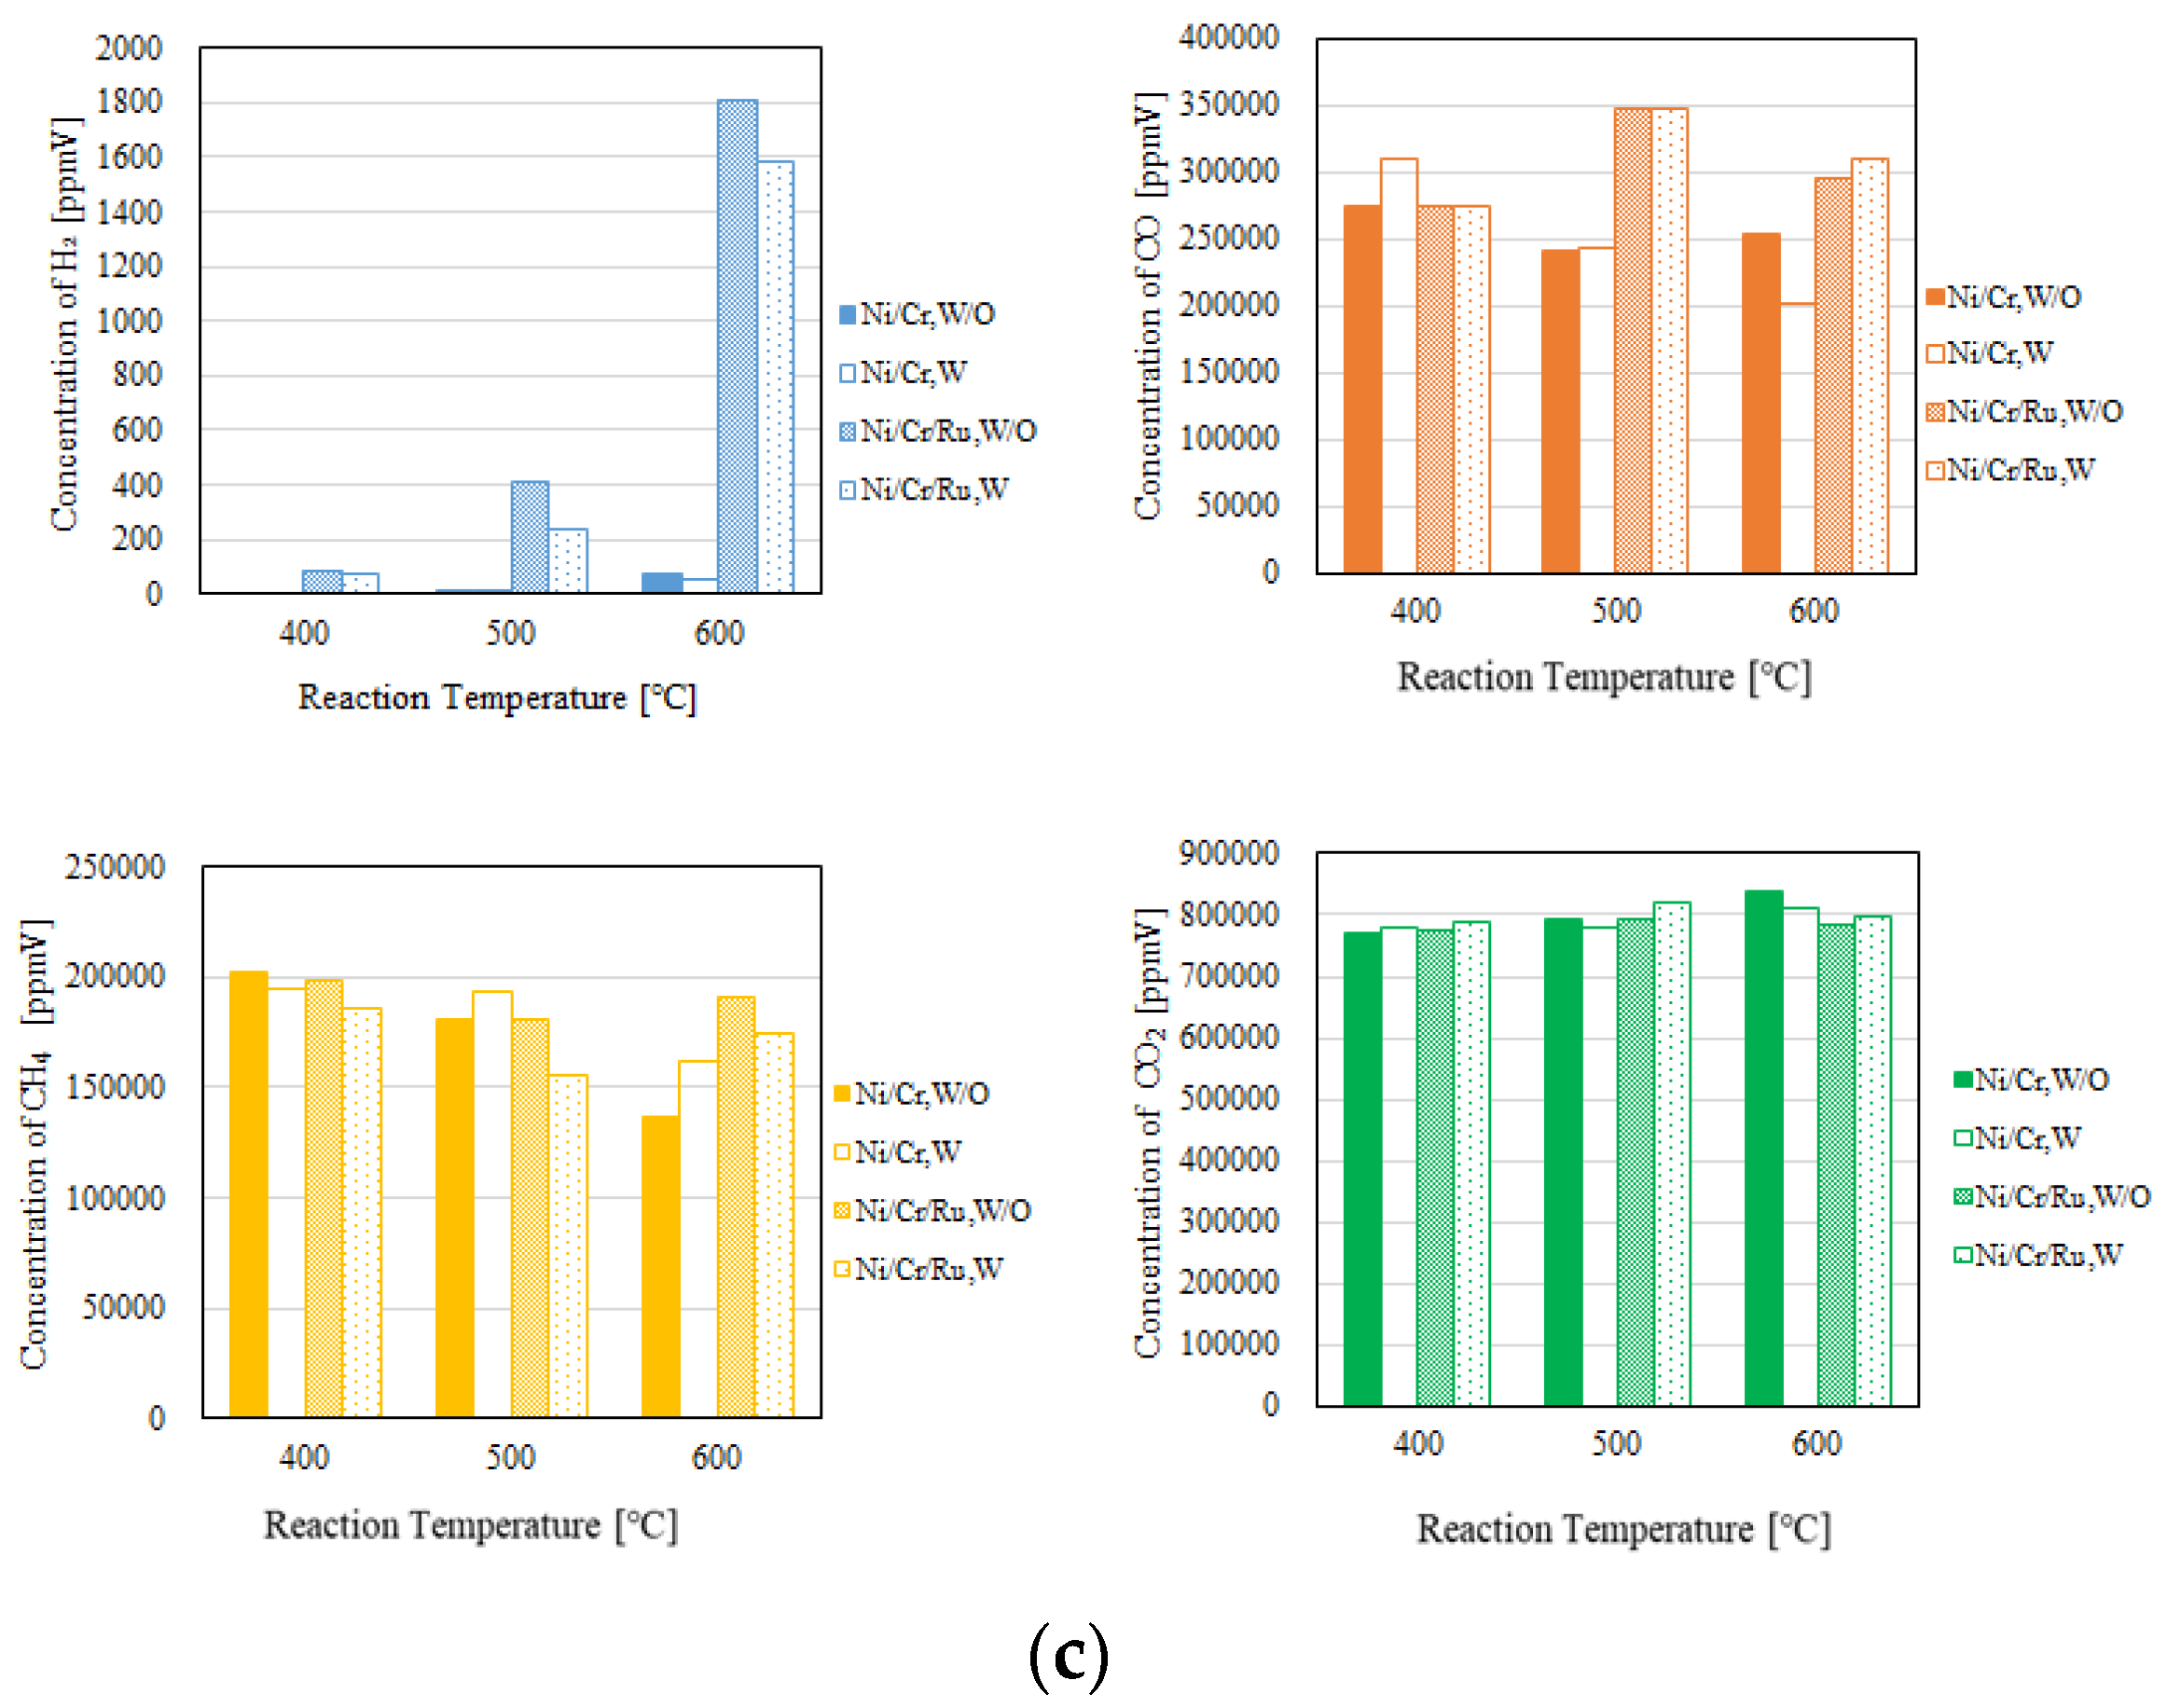
Figure 5.
Comparison of each gas concentration in sweep chamber using Ni/Cr/Ru catalyst with using Ni/Cr catalyst changing reaction temperature (CH4 : CO2 = 1.5 : 1, differential pressure: a): 0 MPa, b): 0.010 MPa, c): 0.020 MPa).
Figure 5.
Comparison of each gas concentration in sweep chamber using Ni/Cr/Ru catalyst with using Ni/Cr catalyst changing reaction temperature (CH4 : CO2 = 1.5 : 1, differential pressure: a): 0 MPa, b): 0.010 MPa, c): 0.020 MPa).
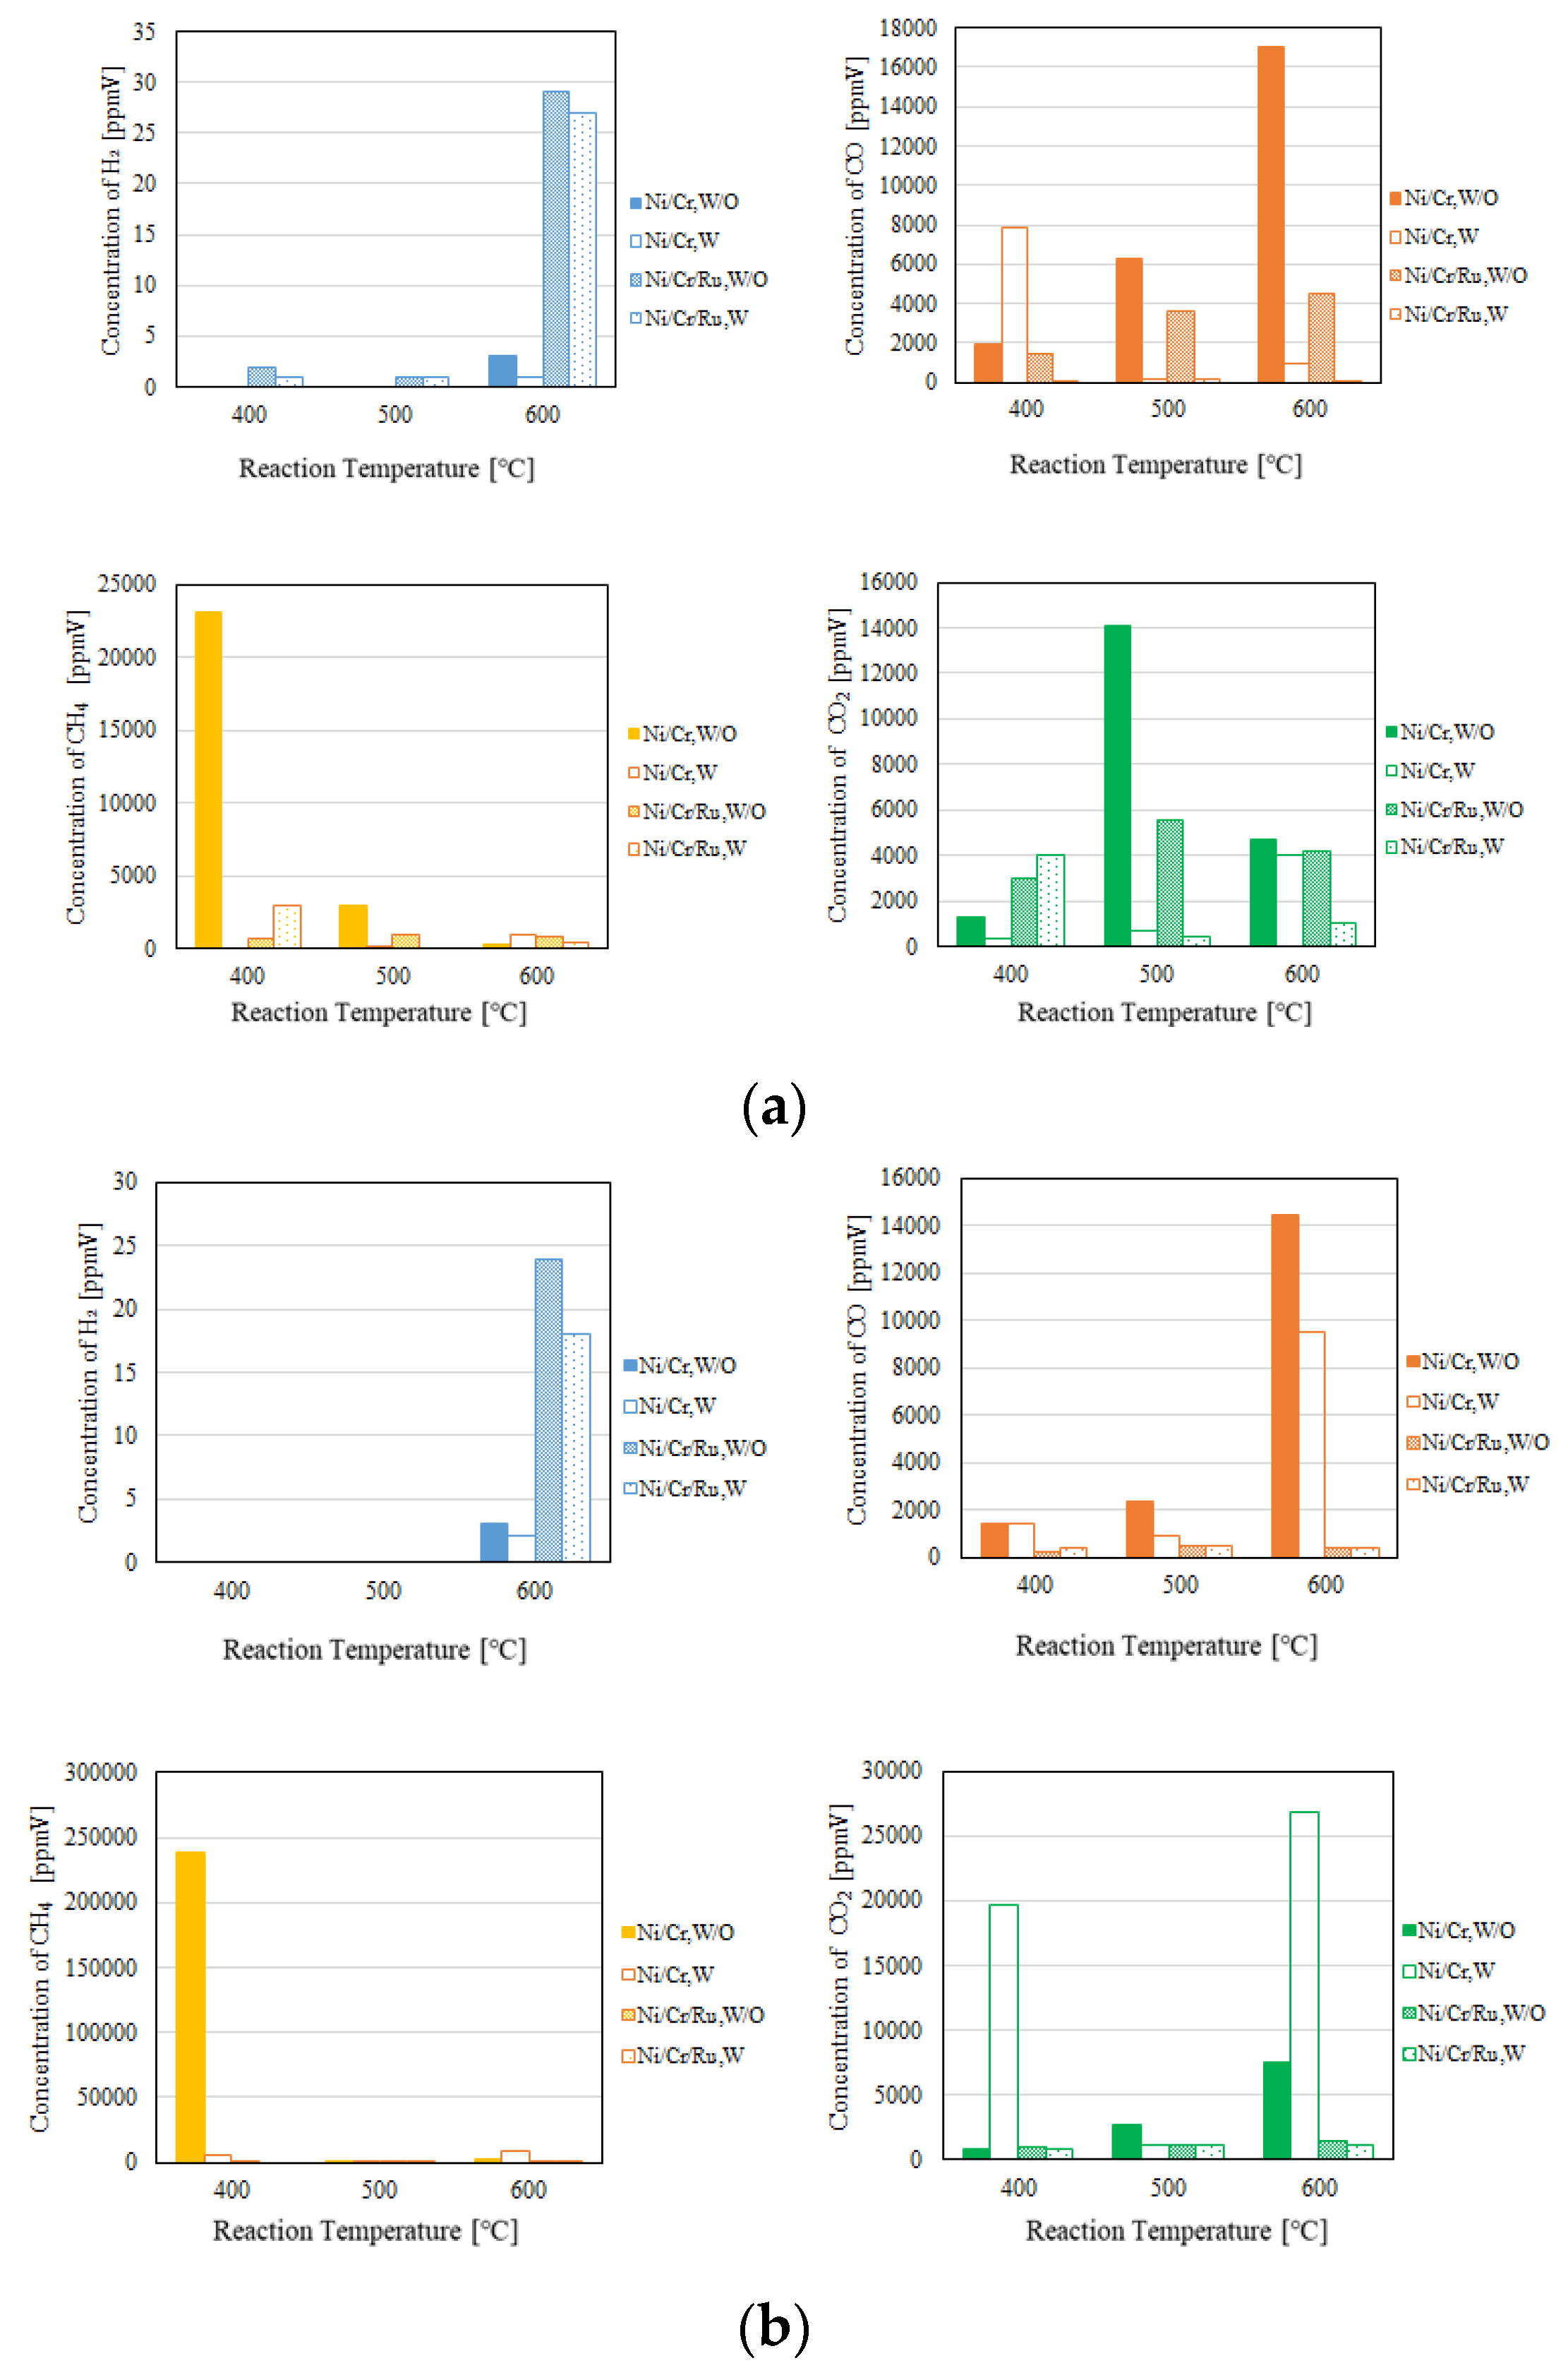
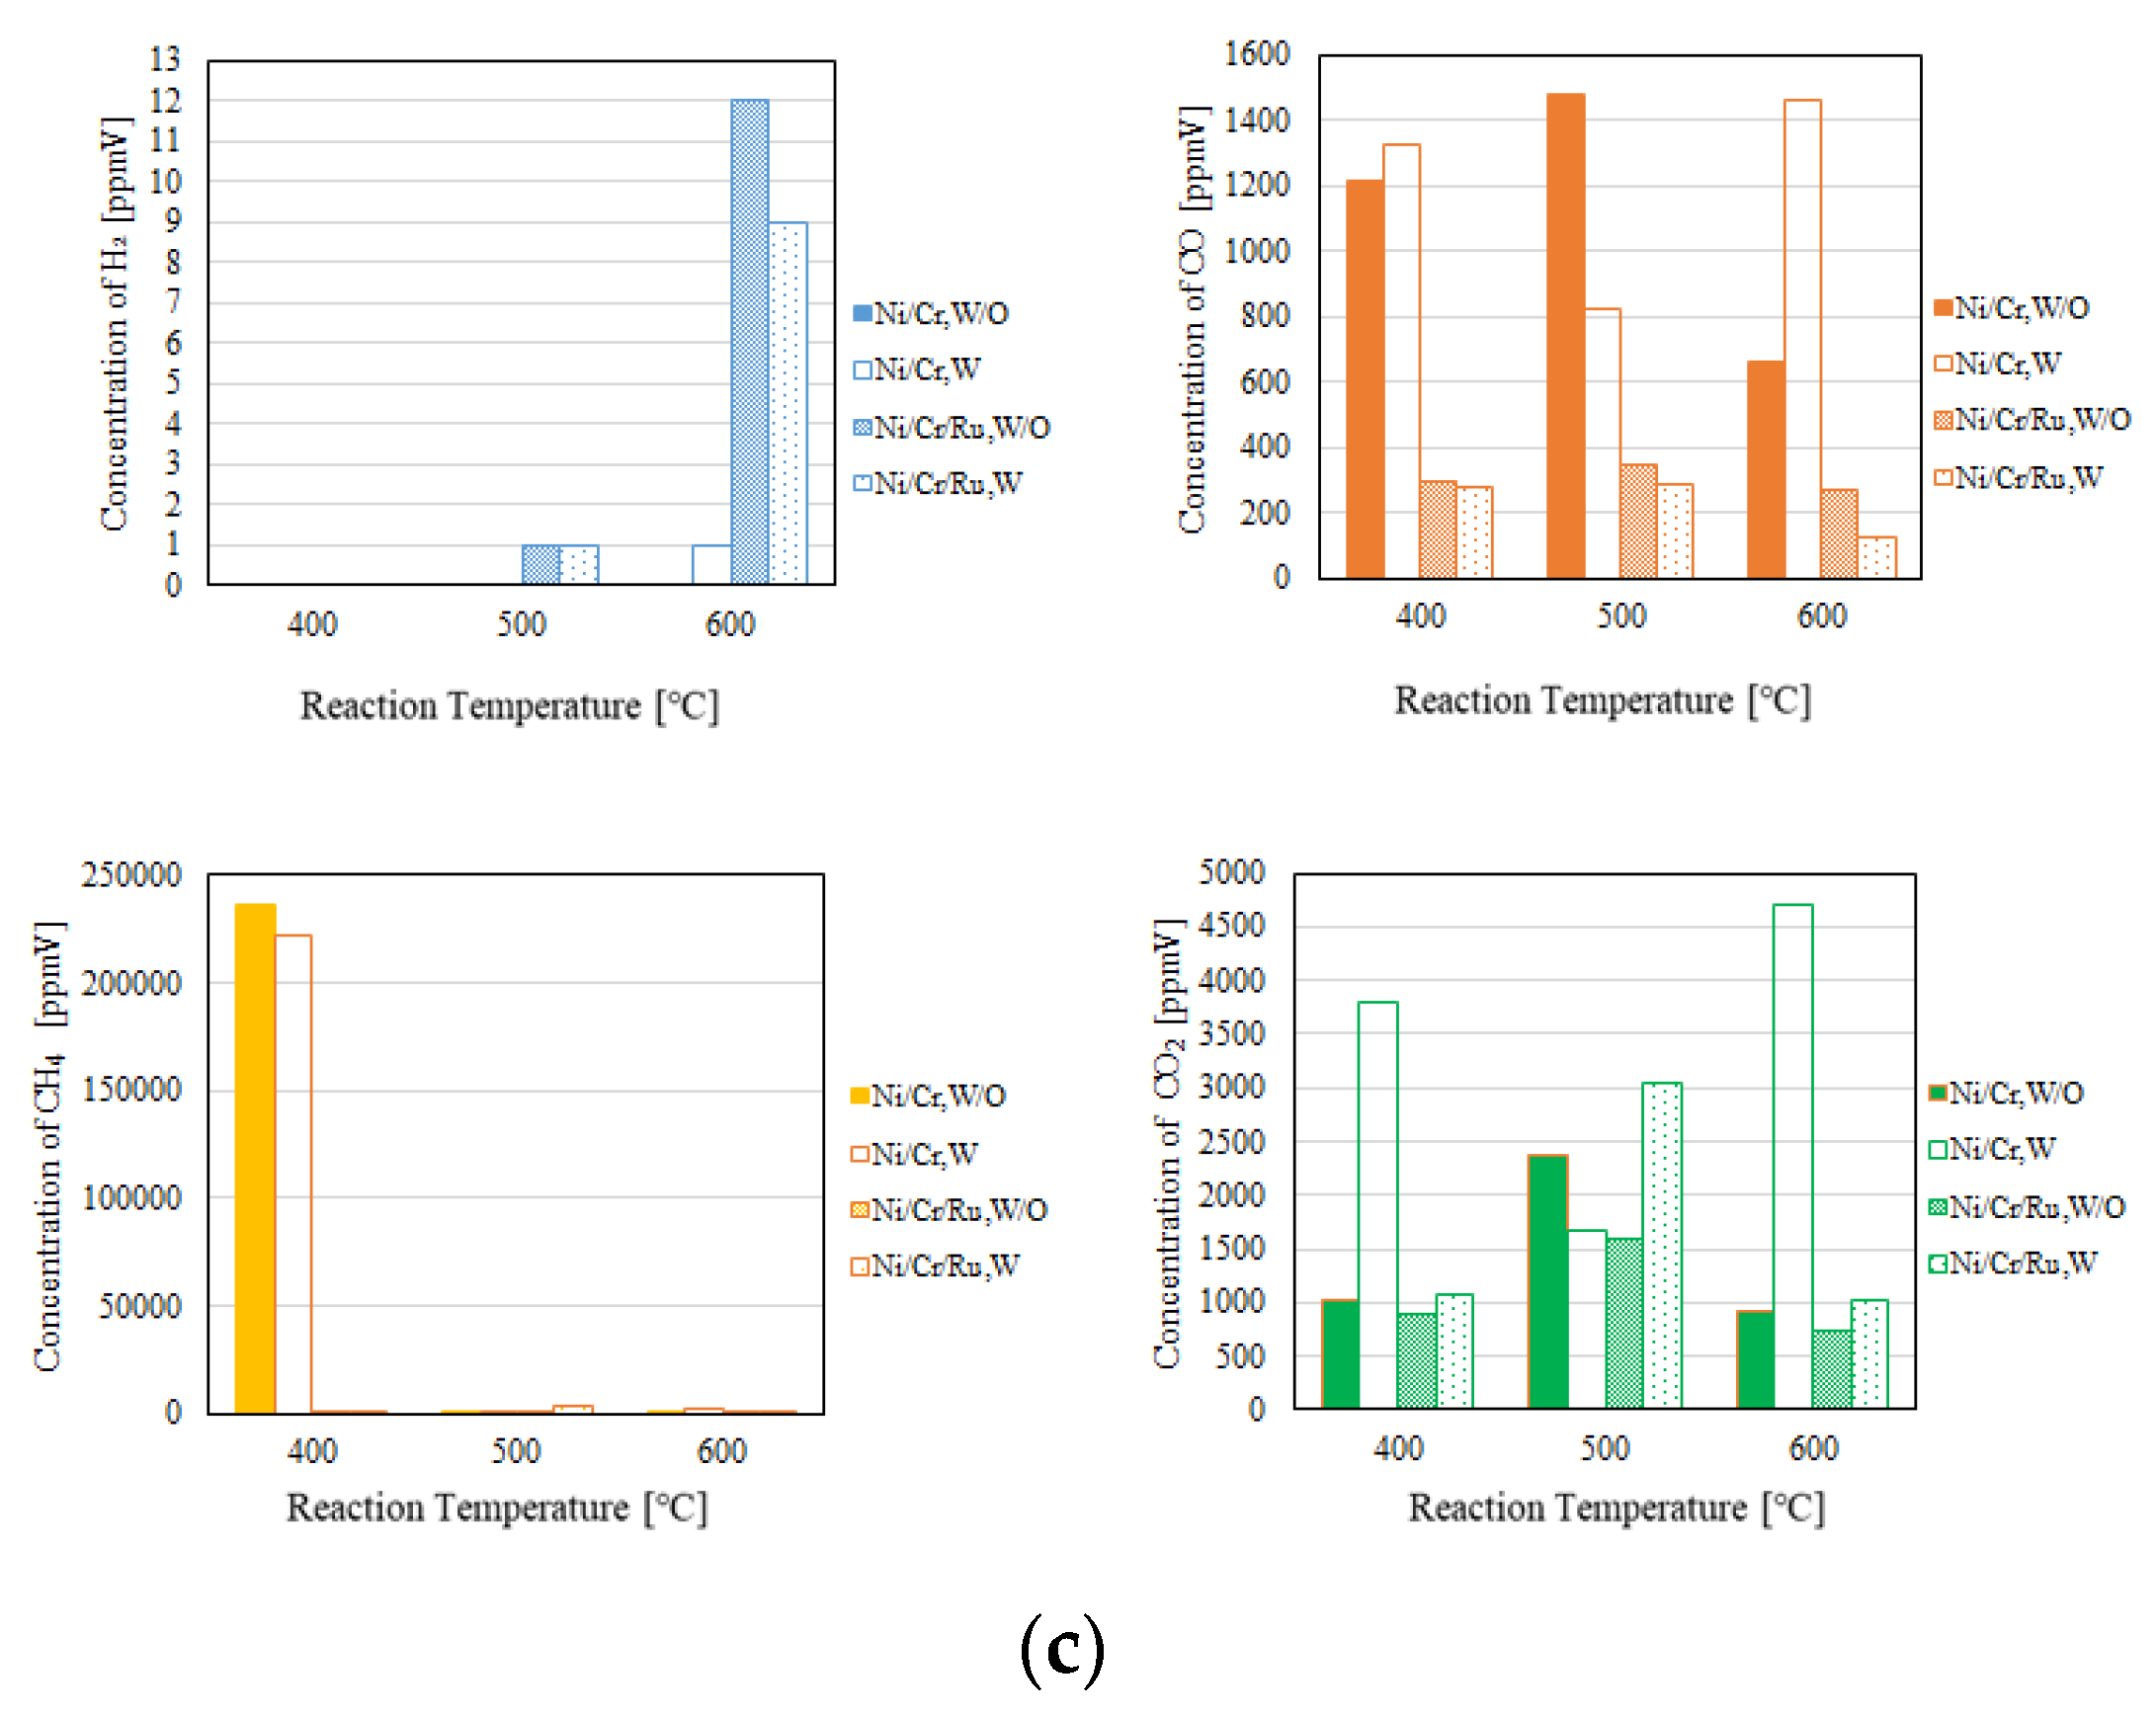
Figure 6.
Comparison of each gas concentration in reaction chamber using Ni/Cr/Ru catalyst with using Ni/Cr catalyst changing molar ratio (CH4 : CO2 = 1.5 : 1, differential pressure: a): 0 MPa, b): 0.010 MPa, c): 0.020 MPa).
Figure 6.
Comparison of each gas concentration in reaction chamber using Ni/Cr/Ru catalyst with using Ni/Cr catalyst changing molar ratio (CH4 : CO2 = 1.5 : 1, differential pressure: a): 0 MPa, b): 0.010 MPa, c): 0.020 MPa).
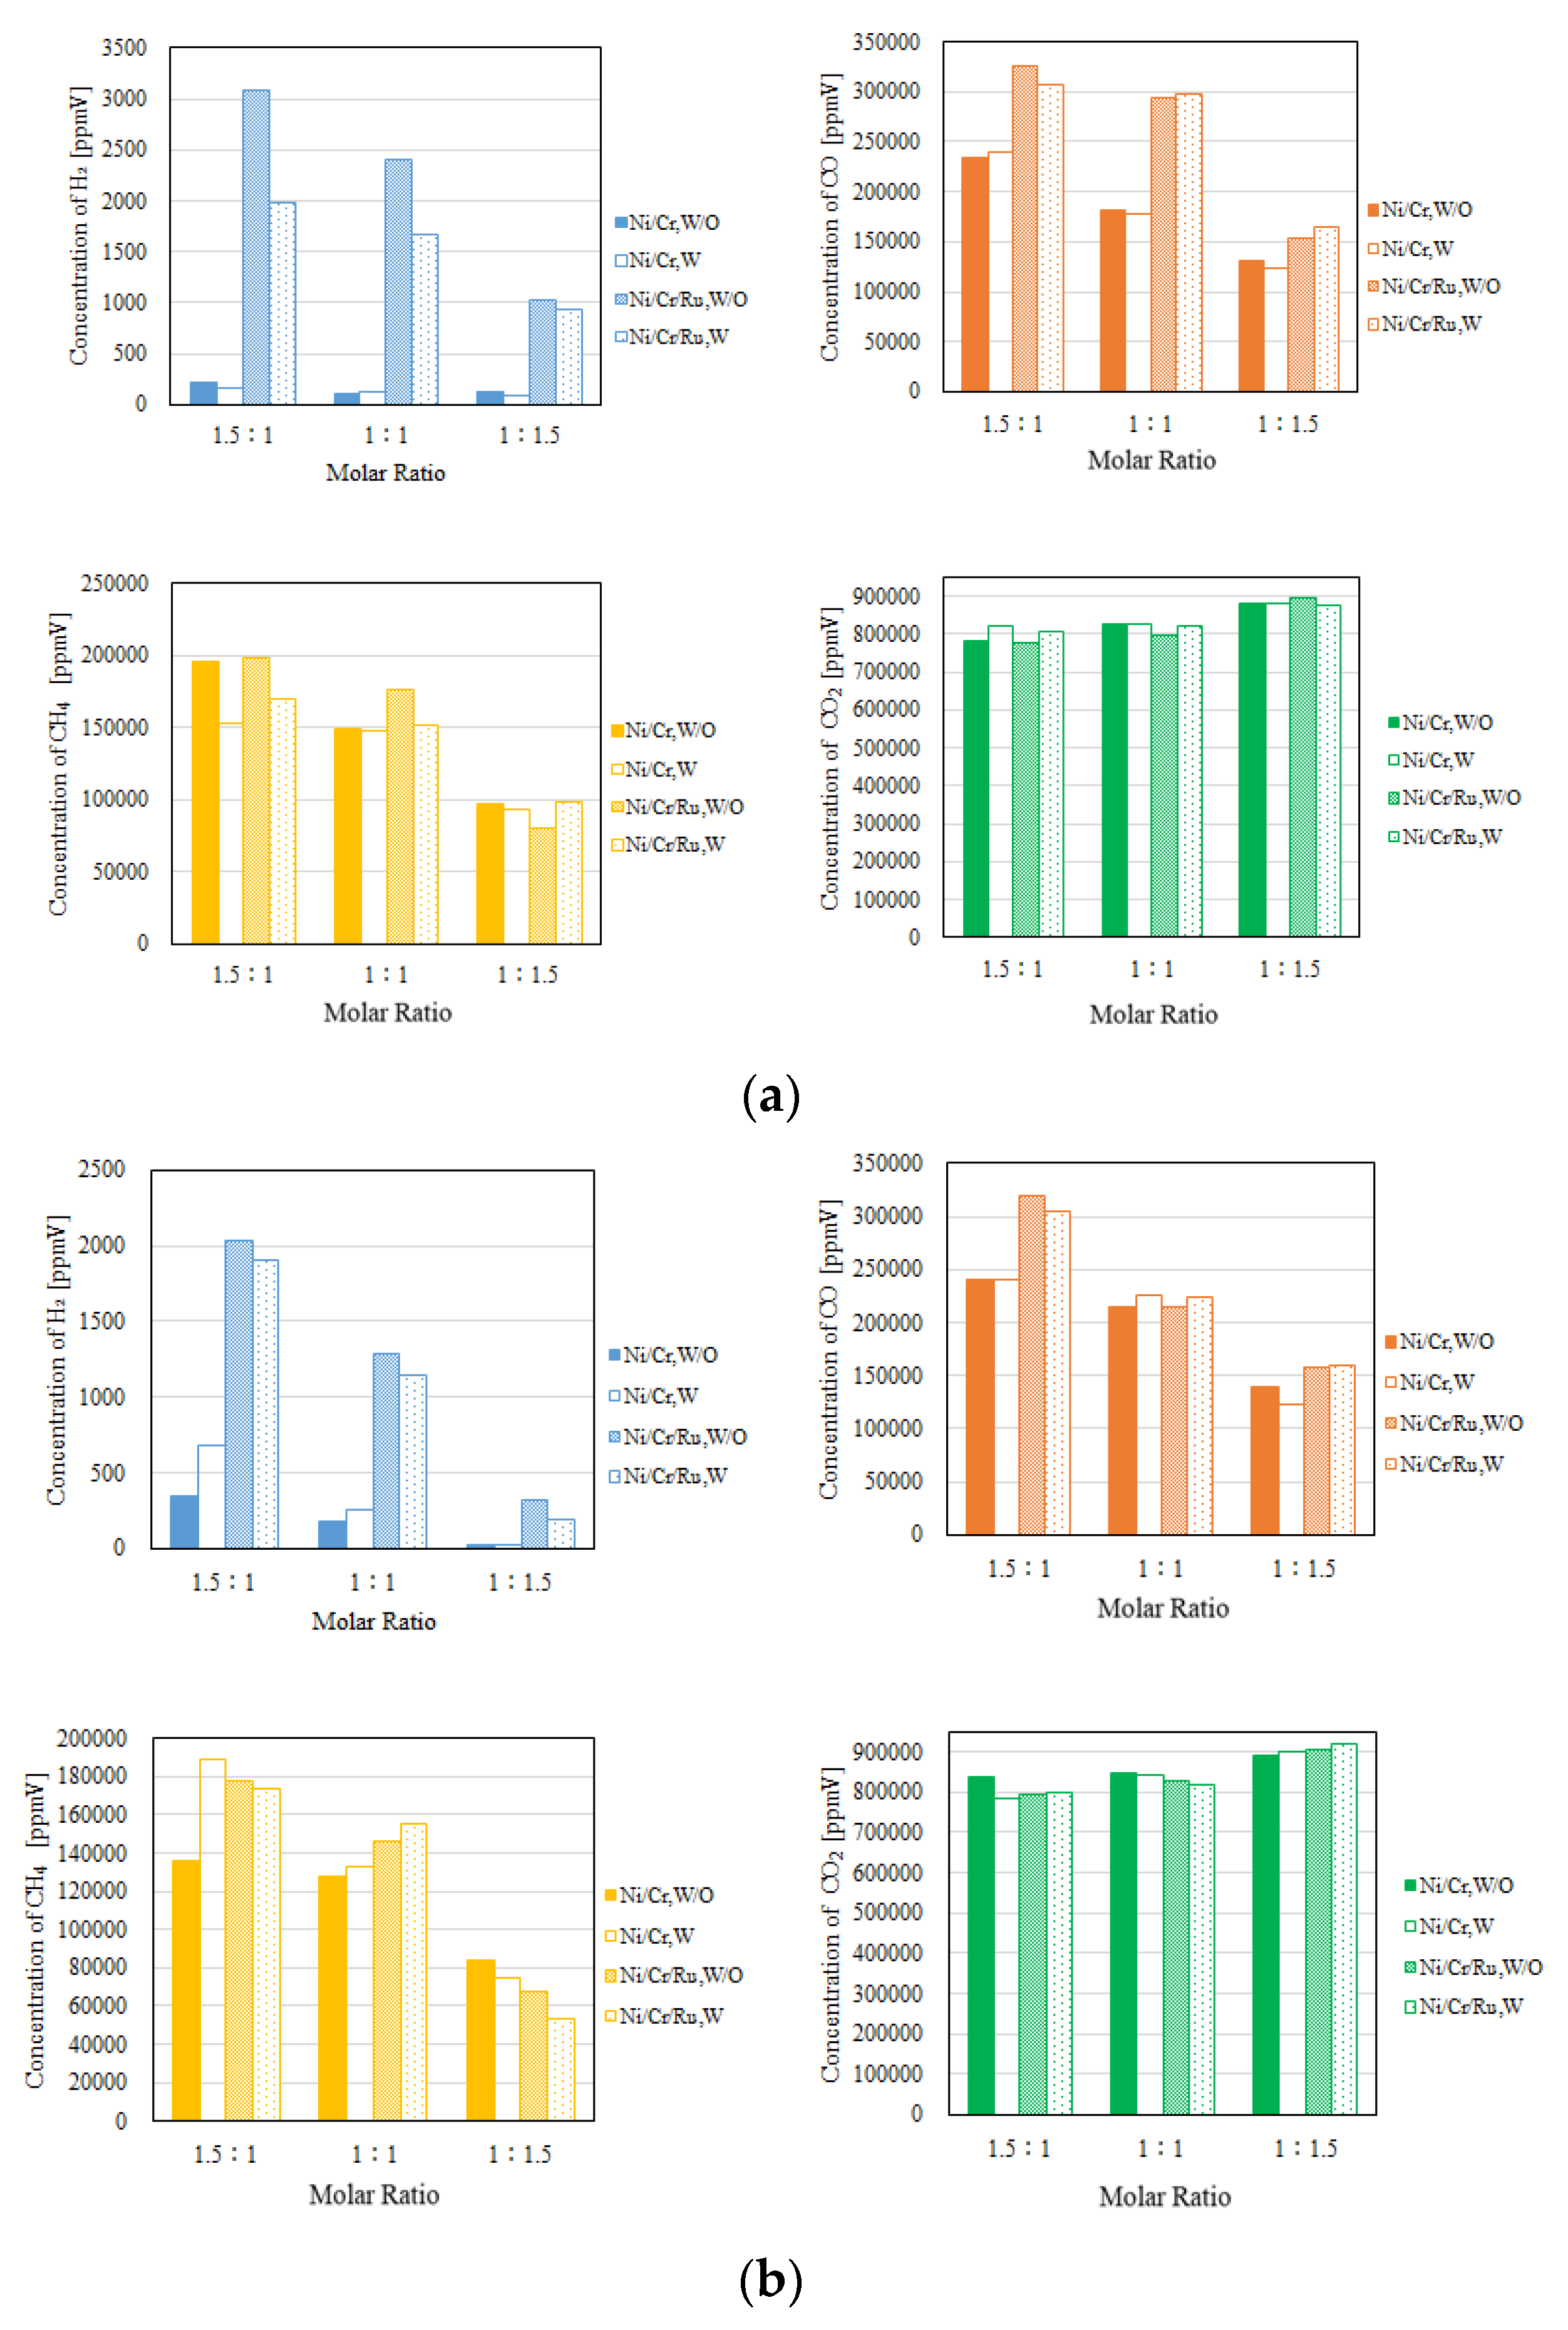
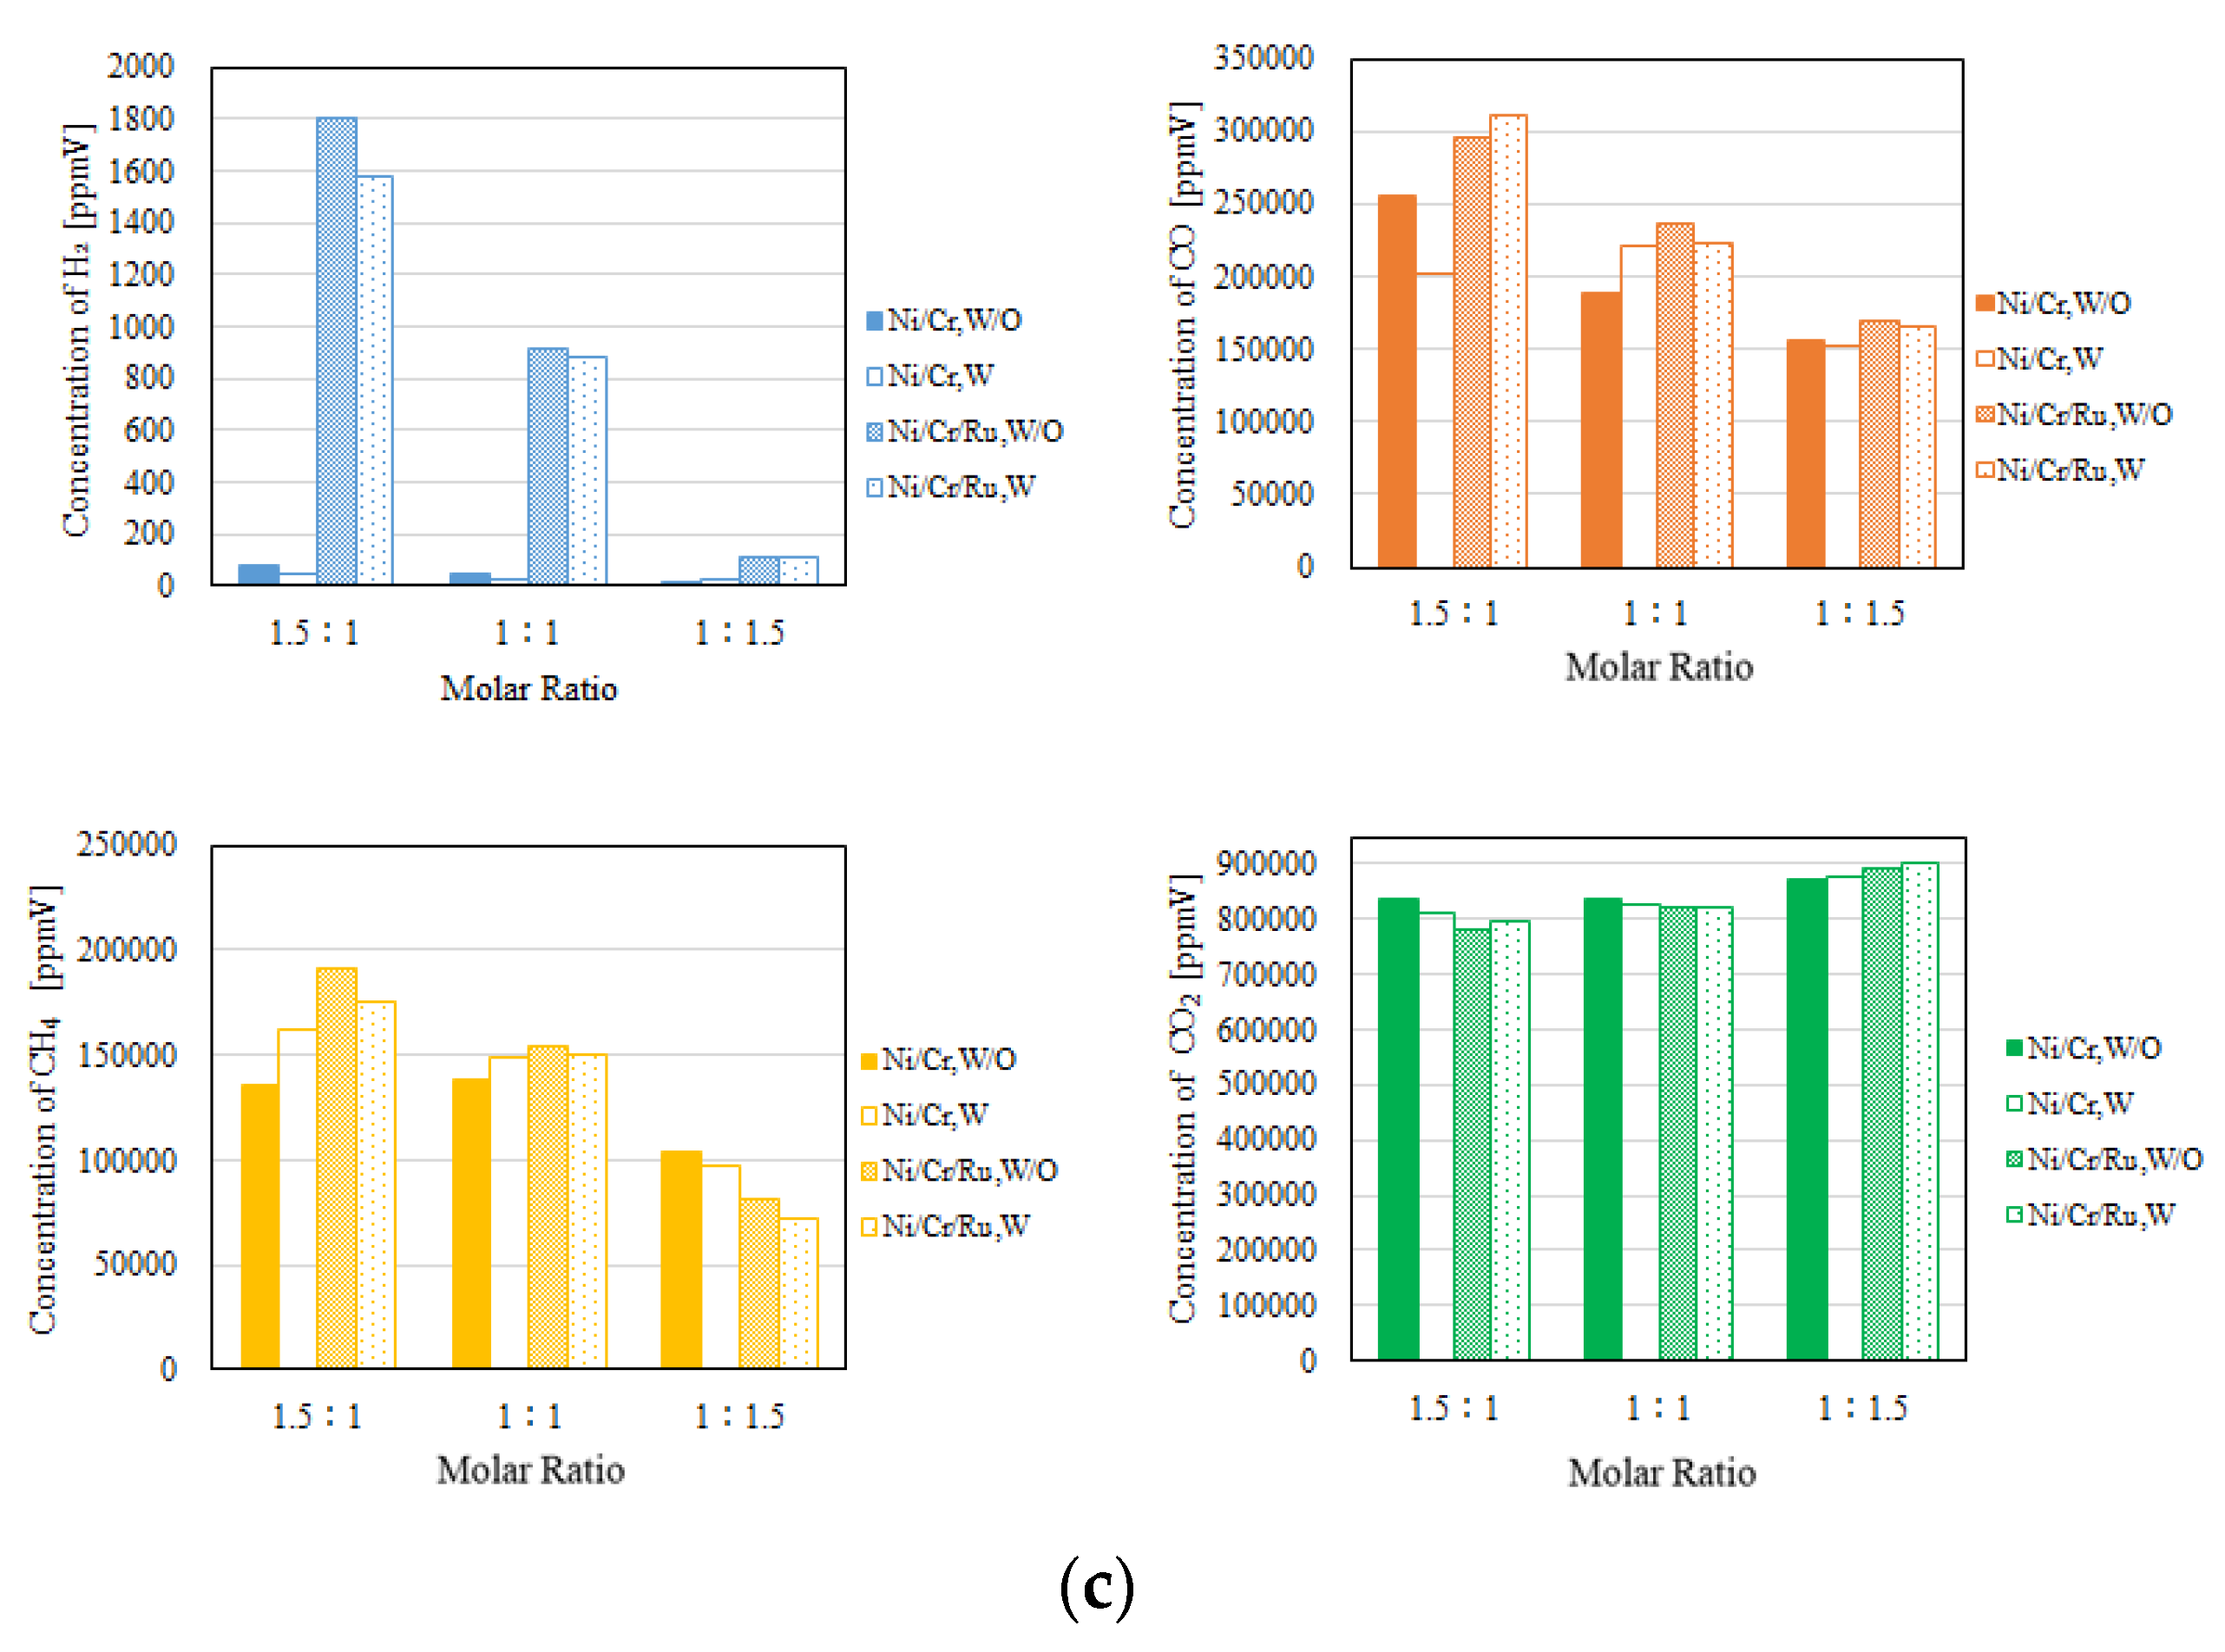
Figure 7.
Comparison of each gas concentration in sweep chamber using Ni/Cr/Ru catalyst with using Ni/Cr catalyst changing molar ratio (CH4 : CO2 = 1.5 : 1, differential pressure: a): 0 MPa, b): 0.010 MPa, c): 0.020 MPa).
Figure 7.
Comparison of each gas concentration in sweep chamber using Ni/Cr/Ru catalyst with using Ni/Cr catalyst changing molar ratio (CH4 : CO2 = 1.5 : 1, differential pressure: a): 0 MPa, b): 0.010 MPa, c): 0.020 MPa).
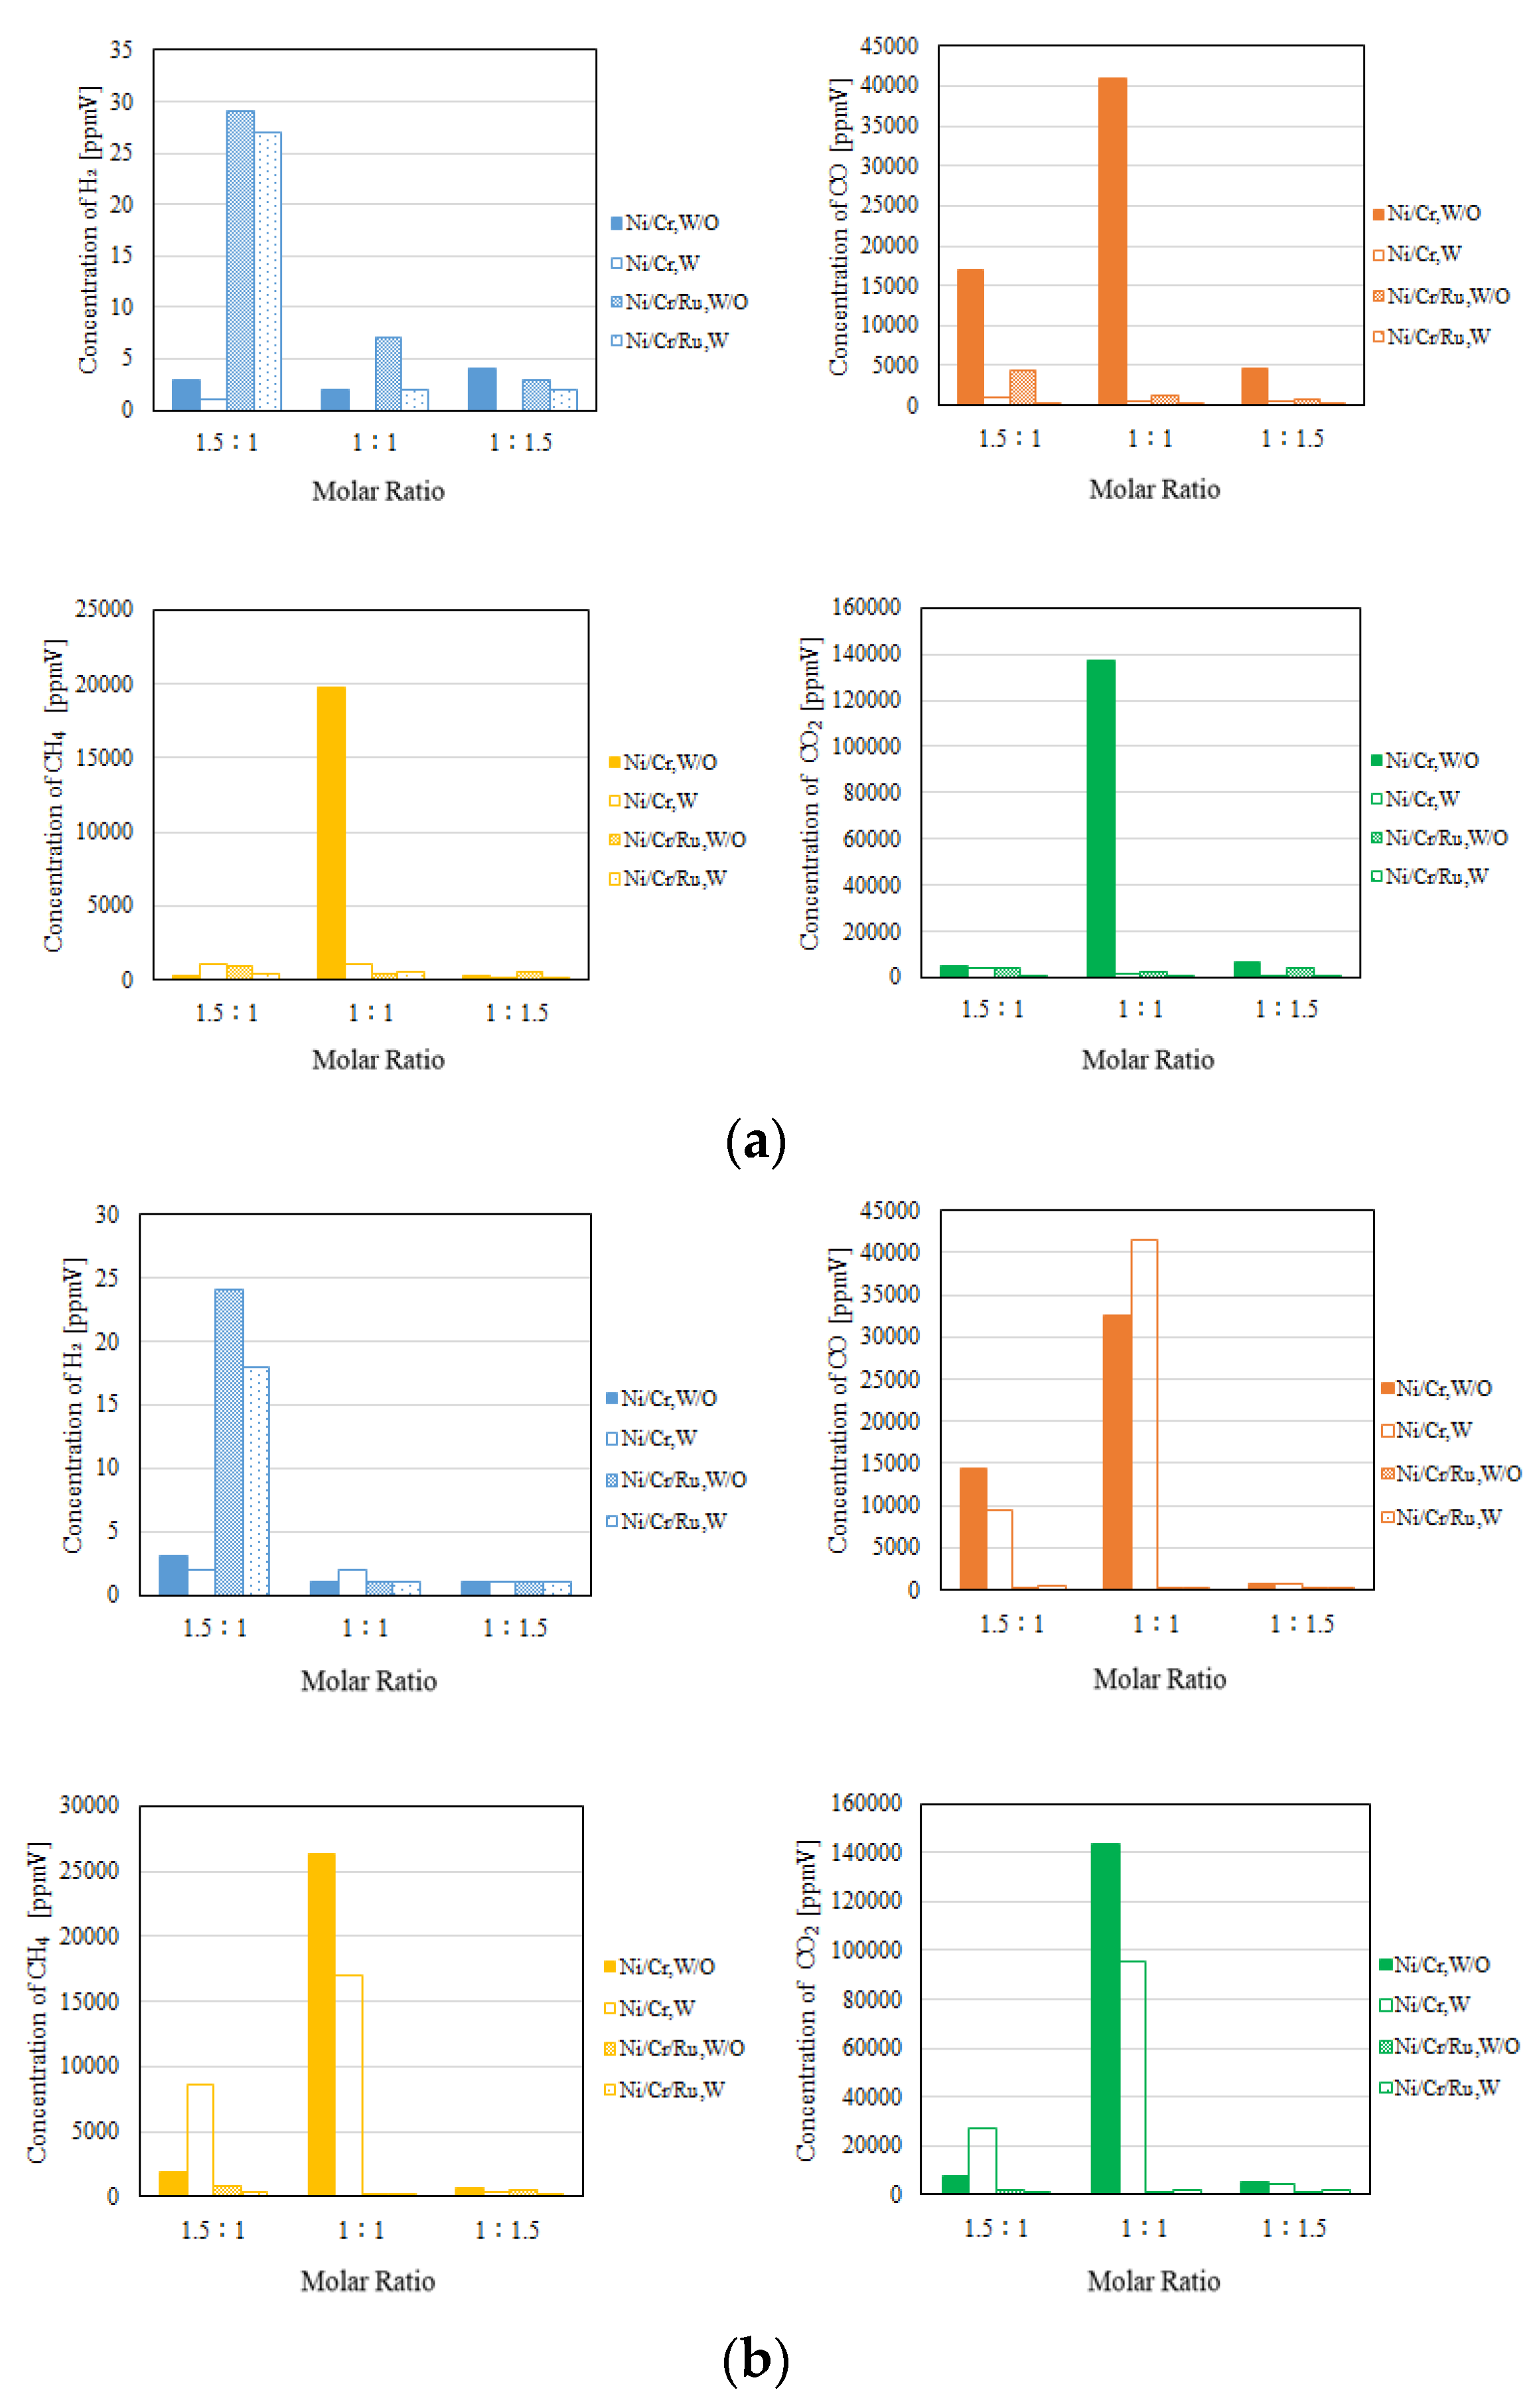
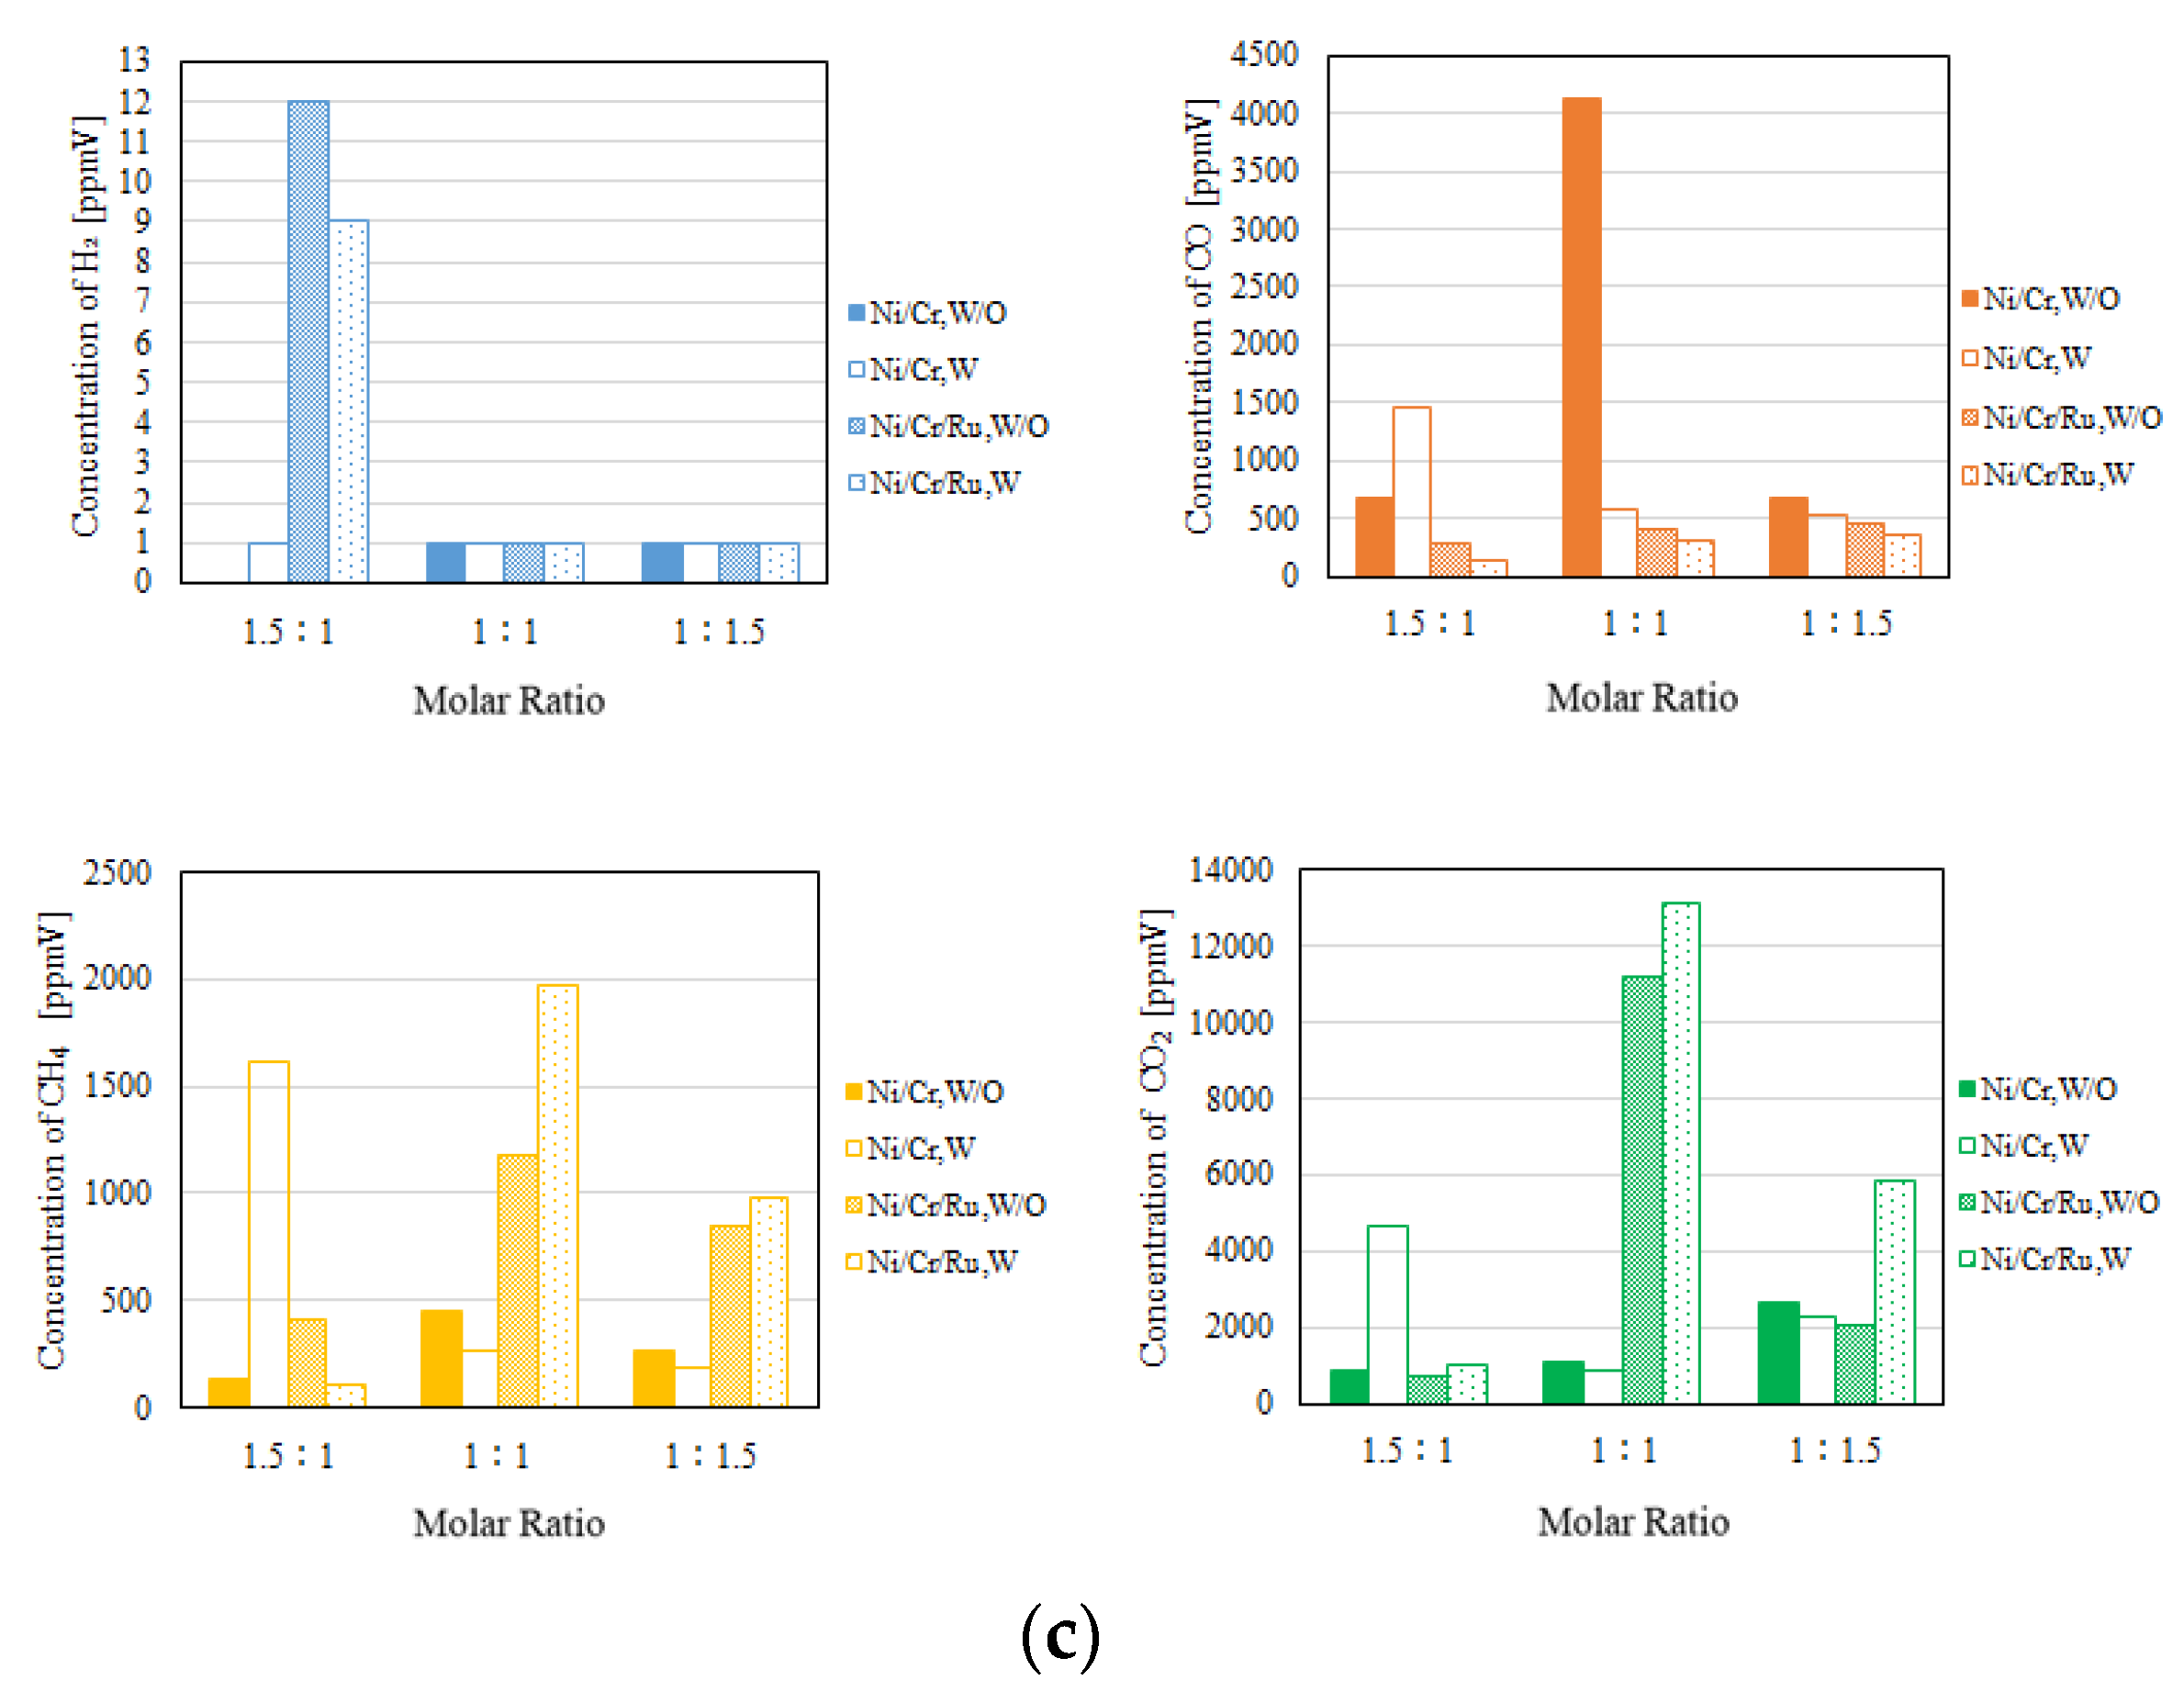
Figure 8.
Photo of used catalyst (left: before experiment, right: after experiment).
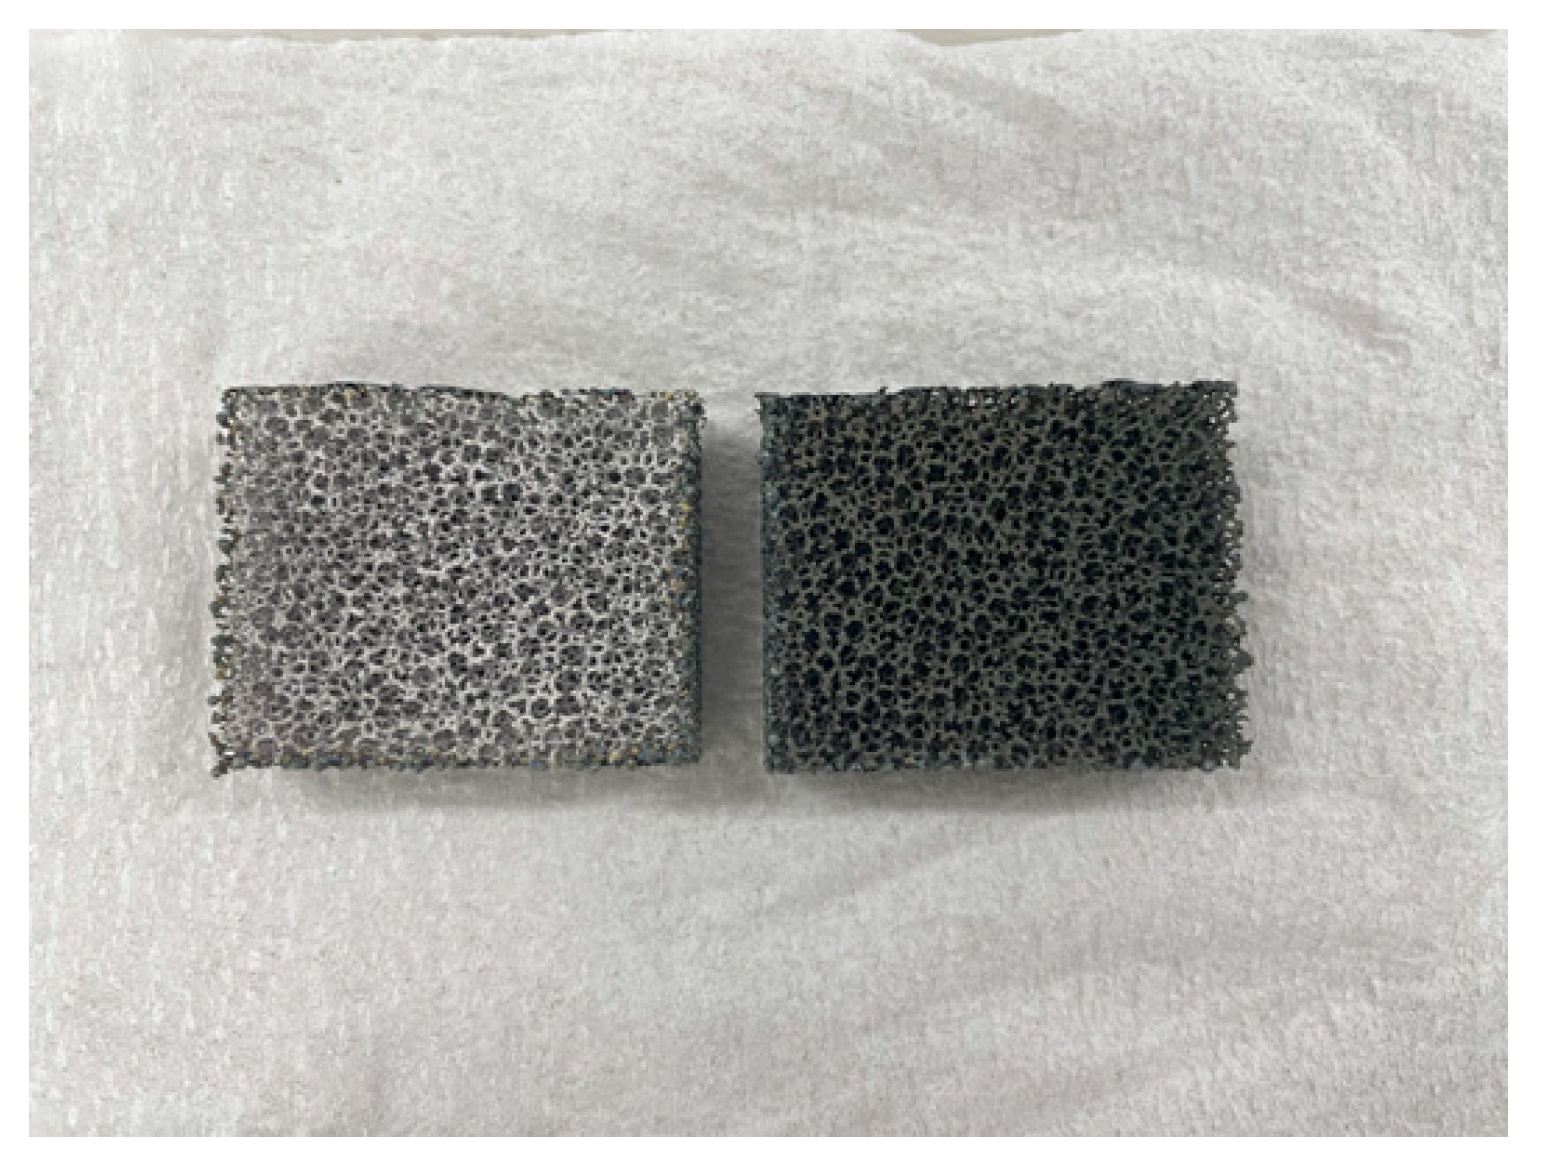
Figure 9.
Photo of captured H2O by gas bag.
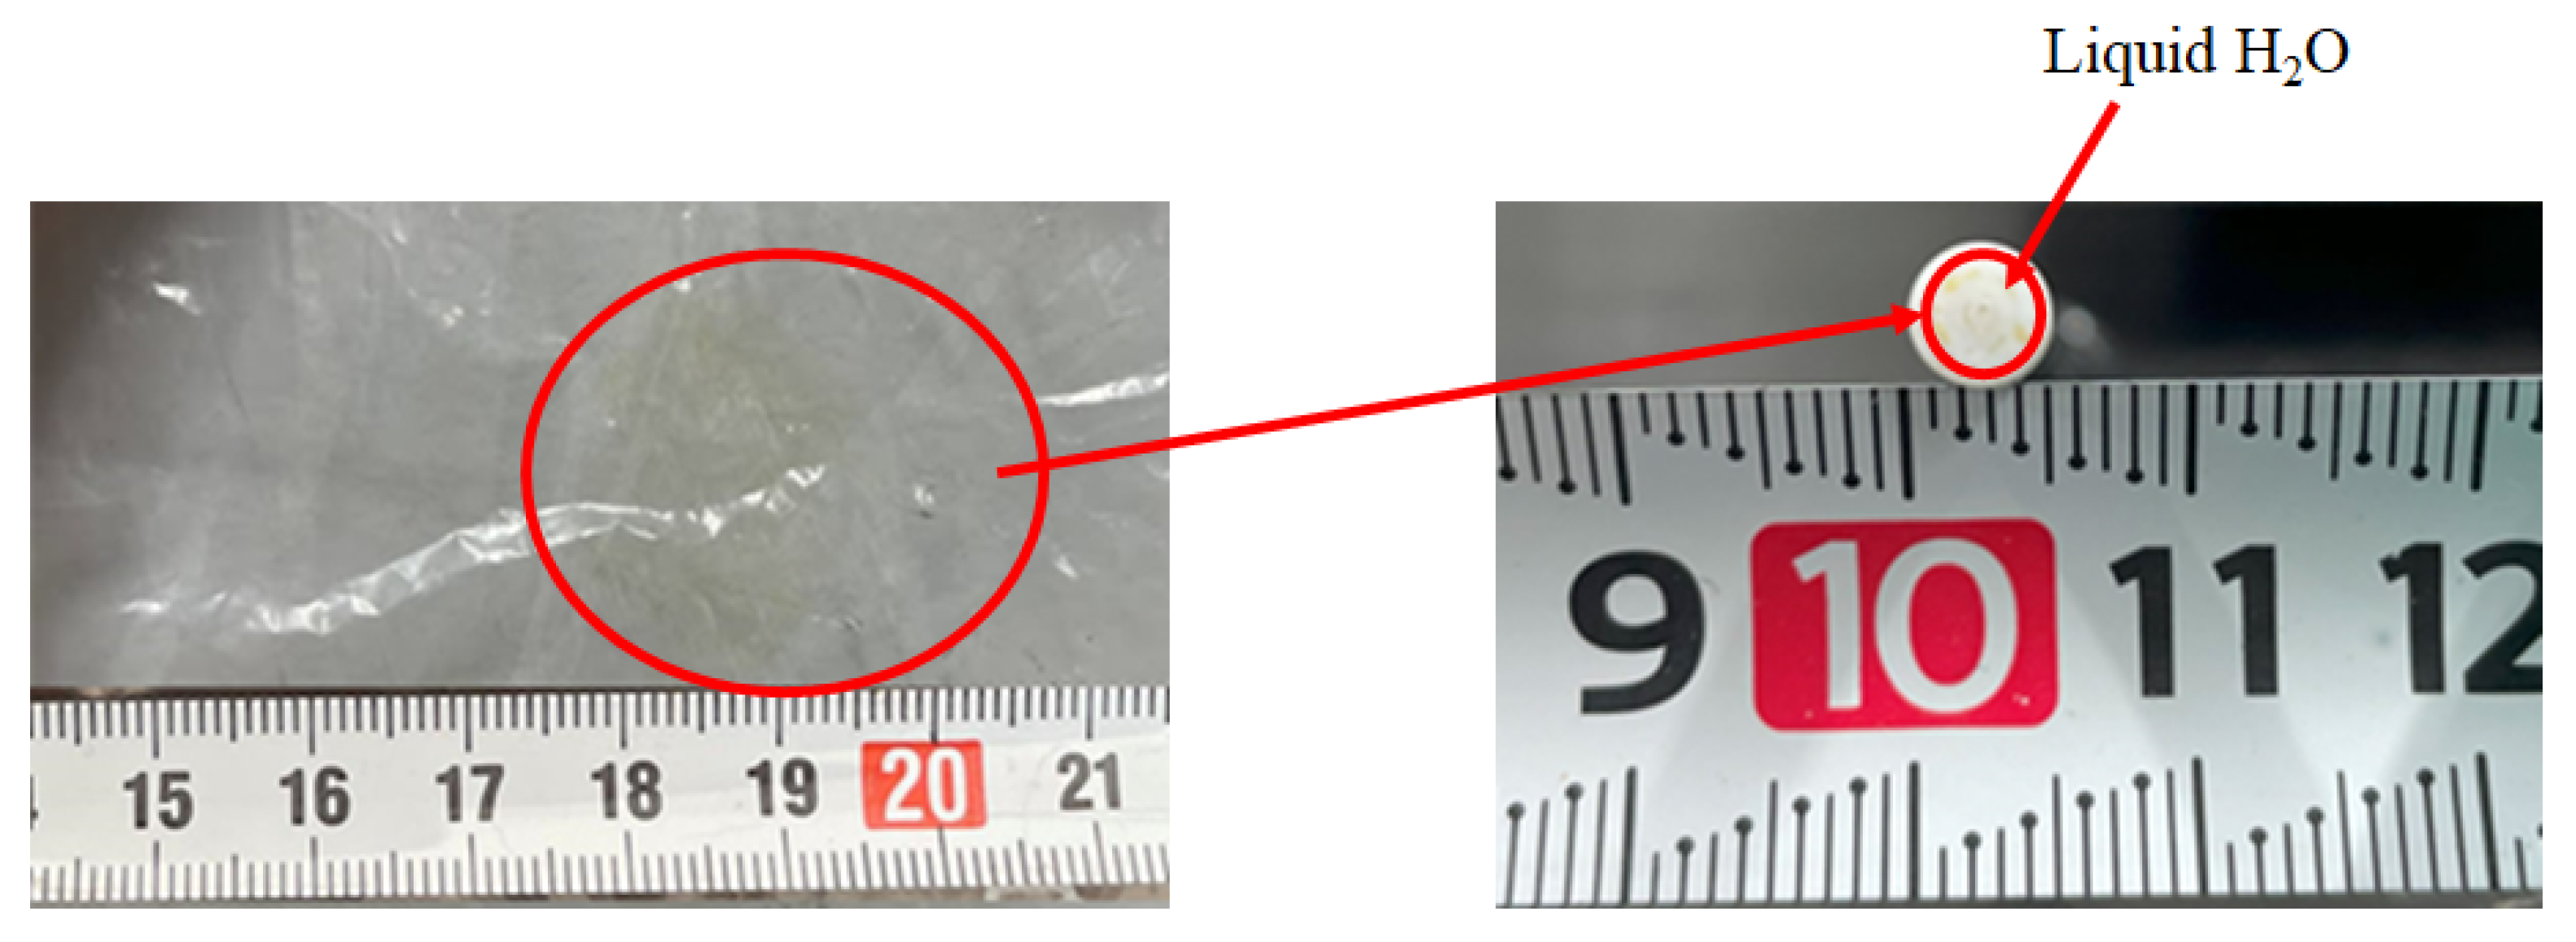

Table 1.
Parameters of experimental conditions.
| Parameters | Information |
| Initial reaction temperature (Pre-set reaction temperature) [℃] | 400, 500, 600 |
| Pressure of supply gas [MPa] | 0.10 |
| Differential pressure between the reaction chamber and the sweep chamber [MPa] | 0, 0.010 and 0.020 |
| Molar ratio of provided CH4 : CO2 (Flow rate of provided CH4 : CO2 [NL/min]) | 1.5 : 1, 1 : 1 and 1 : 1.5 (1.088 : 0.725, 0.725 : 0.725, 0.725 : 1.088) |
| Feed ratio of sweep gas to supply gas [-] | 0 (W/O), 1.0 (W) |
Table 2.
Comparison of CH4 conversion, CO2 conversion, H2 yield, H2 selectivity, CO selectivity, H2 permeability, permeation flux and thermal efficiency (pressure difference: 0 MPa; (a) CH4 : CO2 = 1.5 : 1, (b) CH4 : CO2 = 1 : 1, (c) CH4 : CO2 = 1 : 1.5).
Table 2.
Comparison of CH4 conversion, CO2 conversion, H2 yield, H2 selectivity, CO selectivity, H2 permeability, permeation flux and thermal efficiency (pressure difference: 0 MPa; (a) CH4 : CO2 = 1.5 : 1, (b) CH4 : CO2 = 1 : 1, (c) CH4 : CO2 = 1 : 1.5).
| Reaction temperature [℃] | Catalyst | Sweep gas | CH4 conversion [%] | CO2 conversion [%] | H2 yield [%] | H2 selectivity [%] | CO selectivity [%] | H2 permeability [%] | Permeation flux [mol/(m2·s)] | Thermal efficiency [%] |
| (a) | ||||||||||
| 400 | Ni/Cr | W/O | 52.9 | -73.0 | 0 | 0 | 100 | 0 | 0 | 0 |
| W | 52.5 | -72.5 | 0 | 0 | 100 | 0 | 0 | 0 | ||
| Ni/Cr/Ru | W/O | 67.4 | -94.8 | 1.03×10⁻² | 4.23×10⁻² | 100 | 1.63 | 0 | 0.213 | |
| W | 69.0 | -97.2 | 1.05×10⁻² | 4.29×10⁻² | 100 | 0.794 | 0 | 0.141 | ||
| 500 | Ni/Cr | W/O | 69.3 | -97.7 | 0 | 2.34×10⁻³ | 100 | 0 | 0 | 8.36×10⁻³ |
| W | 68.9 | -97.0 | 0 | 1.66×10⁻³ | 100 | 0 | 0 | 3.55×10⁻³ | ||
| Ni/Cr/Ru | W/O | 66.2 | -92.7 | 0 | 2.34×10⁻³ | 100 | 0 | 0 | 8.36×10⁻³ | |
| W | 65.7 | -92.1 | 8.41×10⁻² | 0.332 | 99.7 | 9.91×10⁻² | 0 | 0.895 | ||
| 600 | Ni/Cr | W/O | 67.4 | -94.9 | 1.77×10⁻² | 8.41×10⁻² | 99.9 | 1.42 | 0 | 0.241 |
| W | 74.5 | -105 | 1.33×10⁻² | 6.65×10⁻² | 99.9 | 0.625 | 0 | 0.117 | ||
| Ni/Cr/Ru | W/O | 67.4 | -94.9 | 1.77×10⁻² | 8.41×10⁻² | 99.9 | 1.42 | 0 | 0.241 | |
| W | 71.8 | -101 | 0.167 | 0.649 | 99.4 | 1.34 | 0 | 1.46 | ||
| (b) | ||||||||||
| 400 | Ni/Cr | W/O | 55.0 | -50.0 | 0 | 0 | 100 | 0 | 0 | 0 |
| W | 63.7 | -58.7 | 0 | 0 | 100 | 0 | 0 | 0 | ||
| Ni/Cr/Ru | W/O | 66.9 | -61.9 | 9.40×10⁻³ | 4.26×10⁻² | 100 | 1.06 | 0 | 0.164 | |
| W | 70.0 | -650. | 7.50×10⁻³ | 3.35×10⁻² | 100 | 1.33 | 0 | 8.31×10⁻² | ||
| 500 | Ni/Cr | W/O | 74.2 | -69.2 | 0 | 0 | 100 | 0 | 0 | 0 |
| W | 75.8 | -70.8 | 0 | 0 | 100 | 0 | 0 | 0 | ||
| Ni/Cr/Ru | W/O | 72.2 | -67.0 | 6.22×10⁻² | 0.253 | 99.7 | 0.161 | 0 | 0.861 | |
| W | 72.7 | -67.6 | 4.08×10⁻² | 0.171 | 99.8 | 0.245 | 0 | 0.360 | ||
| 600 | Ni/Cr | W/O | 70.3 | -65.3 | 1.15×10⁻² | 5.17×10⁻² | 99.9 | 1.74 | 0 | 0.130 |
| W | 69.8 | -64.5 | 0.167 | 0.557 | 99.4 | 0.120 | 0 | 9.01×10⁻² | ||
| Ni/Cr/Ru | W/O | 64.9 | -59.4 | 0.241 | 0.812 | 99.2 | 0.290 | 0 | 2.76 | |
| W | 69.8 | -64.5 | 0.167 | 0.557 | 99.4 | 0.120 | 0 | 1.22 | ||
| (c) | ||||||||||
| 400 | Ni/Cr | W/O | 79.4 | -48.8 | 0 | 0 | 100 | 0 | 0 | 0 |
| W | 79.5 | -48.8 | 0 | 0 | 100 | 0 | 0 | 0 | ||
| Ni/Cr/Ru | W/O | 77.4 | -47.5 | 2.00×10⁻³ | 1.14×10⁻² | 100 | 6.25 | 0 | 2.63×10⁻² | |
| W | 77.5 | -47.5 | 2.38×10⁻³ | 1.48×10⁻² | 100 | 0 | 0 | 2.13×10⁻² | ||
| 500 | Ni/Cr | W/O | 74.1 | -45.2 | 0 | 0 | 100 | 0 | 0 | 0 |
| W | 74.4 | -45.4 | 0 | 0 | 100 | 0 | 0 | 0 | ||
| Ni/Cr/Ru | W/O | 76.8 | -47.0 | 2.06×10⁻² | 8.86×10⁻² | 99.9 | 0 | 0 | 0.229 | |
| W | 77.5 | -47.5 | 1.30×10⁻² | 5.69×10⁻² | 99.9 | 0 | 0 | 9.21×10⁻² | ||
| 600 | Ni/Cr | W/O | 75.9 | -46.4 | 1.70×10⁻² | 0.101 | 99.9 | 2.94 | 0 | 0.151 |
| W | 76.9 | -47.1 | 1.11×10⁻² | 7.16×10⁻² | 99.9 | 0 | 0 | 6.51×10⁻² | ||
| Ni/Cr/Ru | W/O | 80.0 | -49.0 | 0.129 | 0.660 | 99.3 | 0.291 | 0 | 1.18 | |
| W | 75.5 | -46.0 | 0.116 | 0.561 | 99.4 | 0.216 | 0 | 0.677 | ||
Table 3.
Comparison of CH4 conversion, CO2 conversion, H2 yield, H2 selectivity, CO selectivity, H2 permeability, permeation flux and thermal efficiency (pressure difference: 0.010 MPa; (a) CH4 : CO2 = 1.5 : 1, (b) CH4 : CO2 = 1 : 1, (c) CH4 : CO2 = 1 : 1.5).
Table 3.
Comparison of CH4 conversion, CO2 conversion, H2 yield, H2 selectivity, CO selectivity, H2 permeability, permeation flux and thermal efficiency (pressure difference: 0.010 MPa; (a) CH4 : CO2 = 1.5 : 1, (b) CH4 : CO2 = 1 : 1, (c) CH4 : CO2 = 1 : 1.5).
| Reaction temperature [℃] | Catalyst | Sweep gas | CH4 conversion [%] | CO2 conversion [%] | H2 yield [%] | H2 selectivity [%] | CO selectivity [%] | H2 permeability [%] | Permeation flux [mol/(m2·s)] | Thermal efficiency [%] |
| (a) | ||||||||||
| 400 | Ni/Cr | W/O | 38.4 | -51.3 | 0 | 0 | 100 | 0 | 5.00×10⁻³ | 0 |
| W | 67.2 | -94.5 | 0 | 0 | 100 | 0 | 5.00×10⁻³ | 0 | ||
| Ni/Cr/Ru | W/O | 73.2 | -104 | 5.92×10⁻³ | 2.71×10⁻² | 100 | 0 | 5.00×10⁻³ | 0.125 | |
| W | 72.2 | -102 | 4.08×10⁻³ | 1.84×10⁻² | 100 | 0 | 5.00×10⁻³ | 5.51×10⁻² | ||
| 500 | Ni/Cr | W/O | 67.0 | -94.2 | 0 | 1.23×10⁻³ | 100 | 0 | 5.00×10⁻³ | 4.18×10⁻³ |
| W | 68.2 | -96.0 | 0 | 2.45×10⁻³ | 100 | 0 | 5.00×10⁻³ | 5.33×10⁻³ | ||
| Ni/Cr/Ru | W/O | 68.1 | -95.7 | 5.12×10⁻² | 0.201 | 99.8 | 0 | 5.00×10⁻³ | 0.856 | |
| W | 68.0 | -95.6 | 4.27×10⁻² | 0.152 | 99.8 | 0 | 5.00×10⁻³ | 0.455 | ||
| 600 | Ni/Cr | W/O | 77.4 | -110 | 2.90×10⁻² | 0.136 | 99.9 | 0 | 5.00×10⁻³ | 0.397 |
| W | 68.5 | -96.3 | 5.74×10⁻² | 0.275 | 99.7 | 0 | 5.00×10⁻³ | 0.504 | ||
| Ni/Cr/Ru | W/O | 70.4 | -98.9 | 0.171 | 0.638 | 99.4 | 1.167 | 5.00×10⁻³ | 2.34 | |
| W | 71.0 | -99.8 | 0.160 | 0.624 | 99.4 | 0.938 | 5.00×10⁻³ | 1.40 | ||
| (b) | ||||||||||
| 400 | Ni/Cr | W/O | 47.4 | -42.4 | 0 | 0 | 100 | 0 | 5.00×10⁻³ | 0 |
| W | 26.8 | -21.8 | 0 | 0 | 100 | 0 | 5.00×10⁻³ | 0 | ||
| Ni/Cr/Ru | W/O | 69.7 | -64.7 | 7.80×10⁻³ | 3.86×10⁻² | 100 | 0 | 5.00×10⁻³ | 0.137 | |
| W | 72.7 | -67.7 | 6.70×10⁻³ | 3.34×10⁻² | 100 | 0 | 5.00×10⁻³ | 7.53×10⁻² | ||
| 500 | Ni/Cr | W/O | 78.7 | -73.7 | 0 | 1.66×10⁻³ | 100 | 0 | 5.00×10⁻³ | 4.16×10⁻³ |
| W | 81.6 | -76.6 | 0 | 1.13×10⁻³ | 100 | 0 | 5.00×10⁻³ | 1.77×10⁻³ | ||
| Ni/Cr/Ru | W/O | 68.4 | -63.3 | 4.44×10⁻² | 0.186 | 99.8 | 0 | 5.00×10⁻³ | 0.616 | |
| W | 74.2 | -69.1 | 3.68×10⁻² | 0.126 | 99.9 | 0 | 5.00×10⁻³ | 0.326 | ||
| 600 | Ni/Cr | W/O | 74.5 | -69.5 | 1.83×10⁻² | 7.41×10⁻² | 99.9 | 0.546 | 5.00×10⁻³ | 0.209 |
| W | 73.5 | -68.4 | 2.60×10⁻² | 9.70×10⁻² | 99.9 | 0.769 | 5.00×10⁻³ | 0.189 | ||
| Ni/Cr/Ru | W/O | 70.8 | -65.6 | 0.128 | 0.595 | 99.4 | 7.80×10⁻² | 5.00×10⁻³ | 1.47 | |
| W | 68.9 | -63.7 | 0.115 | 0.509 | 99.5 | 0.087 | 5.00×10⁻³ | 0.841 | ||
| (c) | ||||||||||
| 400 | Ni/Cr | W/O | 97.4 | -60.8 | 0 | 0 | 100 | 0 | 5.00×10⁻³ | 0 |
| W | 76.2 | -46.6 | 0 | 0 | 100 | 0 | 5.00×10⁻³ | 0 | ||
| Ni/Cr/Ru | W/O | 76.9 | -47.1 | 2.25×10⁻³ | 1.21×10⁻² | 100 | 5.56 | 5.00×10⁻³ | 2.98×10⁻² | |
| W | 74.3 | -45.3 | 2.25×10⁻³ | 1.22×10⁻² | 100 | 0 | 5.00×10⁻³ | 2.02×10⁻² | ||
| 500 | Ni/Cr | W/O | 76.2 | -46.6 | 0 | 0 | 100 | 0 | 5.00×10⁻³ | 0 |
| W | 77.0 | -47.2 | 0 | 0 | 100 | 0 | 5.00×10⁻³ | 0 | ||
| Ni/Cr/Ru | W/O | 72.7 | -44.3 | 1.46×10⁻² | 6.48×10⁻² | 99.9 | 0 | 5.00×10⁻³ | 0.162 | |
| W | 75.4 | -46.1 | 9.50×10⁻³ | 4.12×10⁻² | 100 | 1.32 | 5.00×10⁻³ | 6.64×10⁻² | ||
| 600 | Ni/Cr | W/O | 79.0 | -48.5 | 3.75×10⁻³ | 2.14×10⁻² | 100 | 3.33 | 5.00×10⁻³ | 3.32×10⁻² |
| W | 81.2 | -50.0 | 3.50×10⁻³ | 2.26×10⁻² | 100 | 3.57 | 5.00×10⁻³ | 1.97×10⁻² | ||
| Ni/Cr/Ru | W/O | 83.2 | -51.2 | 4.01×10⁻² | 0.202 | 99.8 | 0.312 | 5.00×10⁻³ | 0.366 | |
| W | 86.7 | -53.6 | 2.34×10⁻² | 0.117 | 99.9 | 0.535 | 5.00×10⁻³ | 0.136 | ||
Table 4.
Comparison of CH4 conversion, CO2 conversion, H2 yield, H2 selectivity, CO selectivity, H2 permeability, permeation flux and thermal efficiency (pressure difference: 0.020 MPa; (a) CH4 : CO2 = 1.5 : 1, (b) CH4 : CO2 = 1 : 1, (c) CH4 : CO2 = 1 : 1.5).
Table 4.
Comparison of CH4 conversion, CO2 conversion, H2 yield, H2 selectivity, CO selectivity, H2 permeability, permeation flux and thermal efficiency (pressure difference: 0.020 MPa; (a) CH4 : CO2 = 1.5 : 1, (b) CH4 : CO2 = 1 : 1, (c) CH4 : CO2 = 1 : 1.5).
| Reaction temperature [℃] | Catalyst | Sweep gas | CH4 conversion [%] | CO2 conversion [%] | H2 yield [%] | H2 selectivity [%] | CO selectivity [%] | H2 permeability [%] | Permeation flux [mol/(m2·s)] | Thermal efficiency [%] |
| (a) | ||||||||||
| 400 | Ni/Cr | W/O | 66.3 | -93.2 | 0 | 0 | 100 | 0 | 7.07×10⁻³ | 0 |
| W | 67.6 | -95.1 | 0 | 0 | 100 | 0 | 7.07×10⁻³ | 0 | ||
| Ni/Cr/Ru | W/O | 67.0 | -94.2 | 7.08×10⁻³ | 3.08×10⁻² | 100 | 0 | 7.07×10⁻³ | 0.150 | |
| W | 68.9 | -97.1 | 6.00×10⁻³ | 2.63×10⁻² | 100 | 0 | 7.07×10⁻³ | 8.08×10⁻² | ||
| 500 | Ni/Cr | W/O | 69.9 | -98.6 | 0 | 1.64×10⁻³ | 100 | 0 | 7.07×10⁻³ | 5.57×10⁻³ |
| W | 67.7 | -95.3 | 0 | 2.45×10⁻³ | 100 | 0 | 7.07×10⁻³ | 5.33×10⁻³ | ||
| Ni/Cr/Ru | W/O | 69.9 | -98.5 | 3.40×10⁻² | 0.117 | 99.9 | 0.245 | 7.07×10⁻³ | 0.567 | |
| W | 74.0 | -105 | 1.97×10⁻² | 6.78×10⁻² | 99.9 | 0.424 | 7.07×10⁻³ | 0.209 | ||
| 600 | Ni/Cr | W/O | 77.3 | -110 | 6.17×10⁻³ | 2.90×10⁻² | 100 | 0 | 7.07×10⁻³ | 8.53×10⁻² |
| W | 72.9 | -103 | 4.33×10⁻³ | 2.56×10⁻² | 100 | 1.92 | 7.07×10⁻³ | 3.75×10⁻² | ||
| Ni/Cr/Ru | W/O | 68.2 | -95.6 | 0.151 | 0.611 | 99.4 | 0.661 | 7.07×10⁻³ | 2.08 | |
| W | 70.8 | -99.6 | 0.132 | 0.508 | 99.5 | 0.567 | 7.07×10⁻³ | 1.16 | ||
| (b) | ||||||||||
| 400 | Ni/Cr | W/O | 67.2 | -62.2 | 0 | 0 | 100 | 0 | 7.07×10⁻³ | 0 |
| W | 25.5 | -20.5 | 0 | 0 | 100 | 0 | 7.07×10⁻³ | 0 | ||
| Ni/Cr/Ru | W/O | 72.9 | -67.8 | 4.80×10⁻³ | 2.37×10⁻² | 100 | 0 | 7.07×10⁻³ | 8.46×10⁻² | |
| W | 74.4 | -69.4 | 4.00×10⁻³ | 1.87×10⁻² | 100 | 0 | 7.07×10⁻³ | 4.49×10⁻² | ||
| 500 | Ni/Cr | W/O | 69.8 | -64.8 | 0 | 4.32×10⁻³ | 100 | 0 | 7.07×10⁻³ | 1.39×10⁻³ |
| W | 69.4 | -64.4 | 0 | 1.81×10⁻³ | 100 | 0 | 7.07×10⁻³ | 3.54×10⁻³ | ||
| Ni/Cr/Ru | W/O | 73.3 | -68.2 | 3.47×10⁻² | 0.139 | 99.9 | 0 | 7.07×10⁻³ | 0.481 | |
| W | 71.5 | -66.4 | 2.79×10⁻² | 0.113 | 99.9 | 0.358 | 7.07×10⁻³ | 0.246 | ||
| 600 | Ni/Cr | W/O | 72.3 | -67.3 | 5.00×10⁻³ | 2.59×10⁻² | 100 | 2.00 | 7.07×10⁻³ | 5.63×10⁻² |
| W | 70.1 | -65.1 | 2.20×10⁻³ | 9.92×10⁻³ | 100 | 4.55 | 7.07×10⁻³ | 1.54×10⁻² | ||
| Ni/Cr/Ru | W/O | 69.1 | -63.9 | 9.12×10⁻² | 0.384 | 99.6 | 0.110 | 7.07×10⁻³ | 1.05 | |
| W | 69.9 | -64.7 | 8.87×10⁻² | 0.396 | 99.6 | 0.113 | 7.07×10⁻³ | 0.649 | ||
| (c) | ||||||||||
| 400 | Ni/Cr | W/O | 66.3 | -93.2 | 0 | 0 | 100 | 0 | 7.07×10⁻³ | 0 |
| W | 67.6 | -95.1 | 0 | 0 | 100 | 0 | 7.07×10⁻³ | 0 | ||
| Ni/Cr/Ru | W/O | 67.0 | -94.2 | 7.08×10⁻³ | 3.08×10⁻² | 100 | 0 | 7.07×10⁻³ | 0.150 | |
| W | 68.9 | -97.1 | 6.00×10⁻³ | 2.63×10⁻² | 100 | 0 | 7.07×10⁻³ | 8.09×10⁻² | ||
| 500 | Ni/Cr | W/O | 78.7 | -48.3 | 0 | 0 | 100 | 0 | 7.07×10⁻³ | 0 |
| W | 81.1 | -49.9 | 0 | 0 | 100 | 0 | 7.07×10⁻³ | 0 | ||
| Ni/Cr/Ru | W/O | 76.6 | -46.9 | 1.19×10⁻² | 5.35×10⁻² | 99.9 | 1.05 | 7.07×10⁻³ | 0.130 | |
| W | 78.0 | -47.8 | 9.50×10⁻³ | 4.02×10⁻² | 100 | 0 | 7.07×10⁻³ | 6.73×10⁻² | ||
| 600 | Ni/Cr | W/O | 73.9 | -45.1 | 2.25×10⁻³ | 1.15×10⁻² | 100 | 5.56 | 7.07×10⁻³ | 1.94×10⁻² |
| W | 75.6 | -46.2 | 3.88×10⁻³ | 2.04×10⁻² | 100 | 3.23 | 7.07×10⁻³ | 2.19×10⁻² | ||
| Ni/Cr/Ru | W/O | 79.7 | -48.9 | 1.41×10⁻² | 6.62×10⁻² | 99.9 | 0.885 | 7.07×10⁻³ | 0.128 | |
| W | 81.8 | -50.4 | 1.35×10⁻² | 6.51×10⁻² | 99.9 | 0.926 | 7.07×10⁻³ | 7.82×10⁻² | ||
Disclaimer/Publisher’s Note: The statements, opinions and data contained in all publications are solely those of the individual author(s) and contributor(s) and not of MDPI and/or the editor(s). MDPI and/or the editor(s) disclaim responsibility for any injury to people or property resulting from any ideas, methods, instructions or products referred to in the content. |
© 2024 by the authors. Licensee MDPI, Basel, Switzerland. This article is an open access article distributed under the terms and conditions of the Creative Commons Attribution (CC BY) license (http://creativecommons.org/licenses/by/4.0/).
Copyright: This open access article is published under a Creative Commons CC BY 4.0 license, which permit the free download, distribution, and reuse, provided that the author and preprint are cited in any reuse.


