Submitted:
28 April 2024
Posted:
29 April 2024
You are already at the latest version
Abstract
Telecommunication infrastructure, as a technology-intensive industry, provides fundamental support for informatization construction. This paper empirically studies the impact of telecommunication infrastructure construction on economic and social innovative development using provincial panel data from China spanning from 2009 to 2022. The research findings indicate the following: (1) Telecommunication infrastructure significantly promotes innovation in terms of R&D investment, knowledge output, and application output. (2)At various stages of telecommunication technology development, the impact on innovative development varies. Iterative updates in telecommunication technology drive higher R&D expenditures, facilitating better utilization of innovation outcomes in industries. (3) There are regional disparities in the influence of telecommunication infrastructure on economic and social innovative development. In the eastern regions, telecommunication infrastructure construction primarily promotes mobile communication, with clear spillover effects. In contrast, in western regions, it mainly facilitates fixed communication networks. Therefore, in the new development stage of China, further strengthening telecommunication infrastructure construction provides a new impetus and space for economic and social innovative development. It is essential to persistently advance the coordinated construction of mobile and fixed communication infrastructure to achieve regional development coordination.
Keywords:
telecommunication infrastructure
; innovation development
; regional disparities
1. Introduction
Telecommunication infrastructure, as a vital component of “new infrastructure,” is at the forefront of the technological revolution. Traditional infrastructure construction has seen diminishing marginal utility and returns over the years, while “new infrastructure,” driven by technological innovation, is playing an increasingly critical role in the new economy, represented by the digital economy. Consequently, the relationship between telecommunications infrastructure development and the level of innovation development has become a widely discussed topic in the academic community. Both central and local governments attach great importance to telecommunication infrastructure construction and provide robust policy support. In 2021 and 2022, China issued the “14th Five-Year National Informatization Plan” and the “14th Five-Year Digital Economy Development Plan,” emphasizing that the next 3-5 years would represent a crucial period for the large-scale development of 5G technology in terms of expanding the breadth and depth of 5G applications, empowering various industries, and driving the intelligent and digital development of the digital economy. According to statistics from the Ministry of Industry and Information Technology, the number of telephone users in the country surged from only 1.93 million households in 1978 to 1.824 billion households by 2022. The mobile phone penetration rate increased from less than half a unit per hundred people in 1978 to 116.3 units per hundred people in 2022. In this context, how does the development of telecommunication infrastructure affect innovation development, and what differential effects does it have on innovation development in different regions? Research on these questions holds significant theoretical and practical significance for the formulation and implementation of relevant national policies.
Most scholars believe that the development of information and communication technology has positive external effects on economic growth. Scholars studying the role of the internet in promoting total factor productivity have argued that the internet, as an information highway, possesses powerful network effects. Due to these significant network effects, the internet has a substantial positive impact on total factor productivity [1,2]. Kong believe that the application of telecommunication technology can lead to innovation in industry products, production processes, and business models, with significant economic spillover effects [3].Hulten focused on the Indian manufacturing industry and found a positive relationship between the development of Indian telecommunication infrastructure and total factor productivity. Domestic scholars hold similar views [4]. Liu and Bai believe that the three types of infrastructure, transportation, energy, and information, all have spillover effects on China’s total factor productivity [5,6]. David conducted a study on the spatial spillover effects of telecommunication infrastructure and found that local telecommunication infrastructure has a positive impact local technical efficiency and technological progress within the region [7]. Furthermore, the telecommunication infrastructure of other regions has a positive impact on local technical efficiency, leading to significant positive spatial spillover effects on total factor productivity [8]. The existence of spatial spillover effects requires local governments to consider the actions of other regions when formulating economic policies. While maintaining the optimal scale of telecommunication infrastructure, they must make proactive adjustments to economic policies to ensure the continuous growth of total factor productivity. Han believes that the rapid development of the internet has significantly improved the efficiency of regional innovation in China [9]. The rapid development of the internet not only promotes the efficiency of regional innovation but also accelerates financial development, industrial upgrading, and human capital accumulation, indirectly benefiting regional innovation efficiency [10,11].
Additionally, scholars have explored the threshold values at which the external effects of telecommunication infrastructure come into play. Koutroumpis argued that the network effects of the internet in European Union countries began to manifest when the internet penetration rate reached 20% [12]. For OECD countries, the critical threshold was found to be when the fixed telephone penetration rate reached 40% [13]. In China, when the broadband penetration rate reached 10%, network effects became evident. Among China’s 31 provinces and cities, 40% were found to have a broadband penetration rate exceeding 10%, indicating that network effects were already present in terms of total factor productivity [14].
In summary, the literature lacks comprehensive research on the direct impact of telecommunication infrastructure construction on innovative development. Most domestic and international studies either analyze this from the perspective of the vertical structure of the telecommunication infrastructure industry or focus on industries such as the internet, information technology, and intelligence. Both approaches overlook the fundamental role of telecommunication infrastructure in facilitating these industries. Furthermore, research on the economic impact of telecommunication infrastructure, both domestically and internationally, primarily concentrates on its role in economic growth. However, innovation is the driving force behind economic growth, and as a high-tech industry, telecommunication infrastructure promotes innovative development, which, in turn, stimulates economic growth. Therefore, further research on the direct impact of telecommunication infrastructure on innovative development is needed. This paper aims to make contributions in the following three aspects: (1) It connects telecommunication infrastructure construction with the level of innovative development and measures the impact of telecommunication infrastructure on R&D investment, knowledge output, and application output from the dimensions of mobile communication infrastructure and fixed communication infrastructure. This provides a new perspective for understanding how to enhance the level of innovative development. (2) It analyzes the different impacts of telecommunication infrastructure on innovation at different stages of telecommunication technology development. (3) It analyzes regional disparities in the impact of telecommunication infrastructure on economic and social innovative development. These findings offer guidance for policy regarding the role of telecommunication infrastructure in ensuring the foundation for technological and convergent innovation.
2. Analytical Framework and Research Hypotheses
With the improvement in telecommunication infrastructure and its penetration into various industries, the level of social innovative development has undergone significant changes. The deep integration and development of the information and communication industry have provided guarantees for the innovation of production methods in other industries. This paper will analyze the underlying mechanisms by which telecommunication infrastructure impacts the level of social innovative development through the transmission mechanism and propose several important hypotheses.
2.1. Analysis of the Impact of Telecommunication Infrastructure Construction on Innovative Development
Compared to non-high-tech industries, telecommunication infrastructure possesses characteristics of advanced technology, high investment, and high penetration. It plays a crucial role in promoting innovation development upstream and downstream of the industry chain.
First, telecommunication infrastructure affects innovation development in upstream industries. Telecommunication technology patents provide fundamental support for the entire industry chain and are at the core of the information industry. The telecommunication industry has a closed nature, requiring high standards for patent technology and standardization. The development of telecommunication infrastructure construction to some extent drives the R&D of telecommunication technology [15,16]. In the history of the development of the telecommunications industry, electronic equipment companies often occupy the commanding heights of the telecommunications industry chain by mastering telecommunication technology patents [17]. In telecommunication infrastructure construction, the R&D of telecommunication technology must have a high level of innovation to effectively support it. This includes the development of core technology patents, chip manufacturing, and component equipment research [18]. High-quality and diverse telecommunication technology capabilities are conducive to improving telecommunication infrastructure applications [19]. All of these aspects place higher demands on R&D departments, prompting them to continuously develop new telecommunication technologies, build new R&D platforms, and enhance their telecommunication technology service capabilities and innovation efficiency, thereby promoting innovation spillover effects in R&D departments.
Second, telecommunication infrastructure construction and development have spillover effects on downstream industries. Telecommunication infrastructure must have high technical capabilities and network support to provide effective communication service capabilities to downstream industries. This includes providing advanced communication networks for the restructuring of the industry terminal market, driving investment in cloud computing and data centers, and advancing exploration in the field of industrial internet [20]. High-quality and diversified communication service capabilities facilitate the transformation of innovation methods and the emergence of innovation in downstream industries [21].
Finally, as telecommunication networks penetrate various industries, the innovative value of telecommunication infrastructure empowering various industries gradually emerges. First, it provides crucial support for the effective integration and rapid transmission of information. Information and communication technology can improve the way information is obtained by reducing time and space barriers, enhancing information sharing, and enabling the entire society to accumulate knowledge through the process of information acquisition, understanding, analysis, and reprocessing during information dissemination and sharing. This is conducive to improving the knowledge level of the workforce and accelerating the process of technological innovation. On the other hand, the foundation of digital transformation and network transformation in various industries is the rapid acquisition and efficient management of information. Therefore, the low latency and high bandwidth of telecommunication networks can meet the demand for real-time information transmission, covering the information range in various production and management stages, enhancing the matching of information, improving the speed and quality of production and management activities, and promoting the efficiency of innovation. Second, telecommunication infrastructure helps reduce production and transaction costs. Regarding production costs, in traditional industries, production and manufacturing processes often require manual on-site operations. Telecommunication networks have high transmission efficiency and reliability, and when combined with artificial intelligence, they make remote control and unmanned operations possible, thereby reducing labor costs in production and manufacturing [22]. On the other hand, for complex industries, as the production process becomes more specialized, the resulting execution costs and transaction costs increase. This leads to lower organizational efficiency [23]. Information and communication technology, combined with big data, identifies, calculates, and performs process and step recognition during the production organization process, thereby improving production efficiency [24]. In terms of transaction costs, high-tech industries have high R&D costs, large capital investment, and rapid product updates. The information network established by telecommunication infrastructure helps high-tech companies capture changes in market demand and changes between upstream and downstream links of the supply chain, reducing market frictions and lowering transaction costs. It reduces the risk of mismatch between high-tech R&D and the market, increases the targeted allocation of innovation resources, and enhances innovation efficiency [25]. Based on this, this paper proposes the following research hypothesis:
Hypothesis 1: Given the completeness of China’s telecommunication infrastructure and its deep integration into its own upstream and downstream industry chains and other industries, it has a positive effect on the level of social innovative development. That is, telecommunication infrastructure promotes innovative development in China.
2.2. Analysis of Effects of Telecommunication Infrastructure Construction on Innovation Development
The previous analysis examined the general effects of telecommunication infrastructure on innovation development without considering cross-sectional differences. Previous studies have found differences in the impact of telecommunication infrastructure in different construction stages on R&D intensity, innovation knowledge output, and innovation application output, as well as different responses to external environmental shocks, such as economic conditions and market competition in different regions.
Regarding different stages of telecommunication infrastructure construction, Scherngell suggested that mobile telecommunication infrastructure construction affects the level of data transmission in the mobile Internet, and innovation efficiency is sensitive to data information transmission speed [26]. Concerning the different levels of telecommunication infrastructure in different regions, the widespread diffusion and effective utilization of telecommunication infrastructure construction in regional innovation systems cannot be achieved without matching differences in inputs such as technology, organization, and institutions. Due to differences in resource endowments, investment in regional innovation systems and their subsystems varies, resulting in different spillover effects of telecommunication infrastructure in regional innovation systems [27]. In addition, differences in factors such as economic development level, innovation capability, and science and technology policies can affect the innovation spillover of telecommunication infrastructure in regional innovation systems. Based on these considerations, this paper proposes the following research hypothesis:
Hypothesis 2: The innovation spillover effect of telecommunication infrastructure construction exhibits certain heterogeneity characteristics in different time stages and regions.
3. Methodology
3.1. Regression Framework
This study analyzes panel data samples from 31 provincial-level regions in China from 2009 to 2022. The samples may include unobservable factors that vary by province. To address the common problem of unobservable individual effects in panel data, two different estimation methods are available: if unobservable individual effects are correlated with some explanatory variables, the fixed effects model is used; if unobservable individual effects are uncorrelated with all explanatory variables, the random effects model is used. The choice between the fixed effects model and the random effects model is determined by data, with the main criterion being whether unobservable individual effects are related to explanatory variables [28,29]. This paper uses the Hausman test to make this determination. The null hypothesis of the Hausman test is that unobservable individual effects are unrelated to explanatory variables [30]. In this paper, the Hausman test rejects the null hypothesis, indicating that the fixed effects model should be used for analysis.
Previous research has shown a significant correlation between telecommunication infrastructure and innovation [31,32]. Building on these research findings, this paper constructs a panel data model including the R&D expenses of large-scale industrial enterprises, the number of patent applications, the industrial output value of high-tech enterprises, the number of mobile communication base stations, the number of broadband access ports, and other control variables. The basic econometric model is as follows:
n addition, mobile communication may have both complementary and substitution effects on fixed communication, and the impact of one type of communication on innovation development may be influenced by the other type. To account for this, interaction terms for mobile communication and fixed communication are included in the model, as shown below:
where is the level of innovation development in province i in year t. Innovation development is measured in three dimensions: R&D investment, patent applications, and the industrial output value of high-tech enterprises. , is the number of mobile communication base stations, and is the number of broadband access ports. is per capita GDP. is the proportion of urban population to the total population in each province is used to reflect the level of urbanization. is the growth rate of the labor force, the population aged 15 to 64 years, is used to represent labor force growth. is the proportion of the population with a high school education or higher to the population. is the ratio of the total import and export value of operating units to GDP is used to measure the intensity of foreign trade. is an error term.
3.2. Data Sources
In January 2009, China officially entered the era of third-generation mobile communication with the issuance of 3G licenses. Commercial 4G first came into use in 2014, and 2020 was the first year of commercial 5G. To effectively measure the impact of communication infrastructure, panel data from 2009 to 2022 for 31 provinces, municipalities, and autonomous regions in China are selected as the sample. The main data sources include the “China Statistical Yearbook,” “China Labor Statistical Yearbook,” “Statistical Compilation of China’s Sixty Years,” and “Statistical Yearbook of the Ministry of Science and Technology.” Data for the telecommunications industry mainly come from the “China Communication Statistics Yearbook Report” and the annual reports of Chinese communication operators. Missing data are supplemented using the interpolation method. Descriptive statistical analysis for major variables provides mean, standard deviation, median, minimum, and maximum values (Table 1).
Additionally, based on the socioeconomic conditions of different regions and references to the regional development policies of the State Council and the National Development and Reform Commission, as well as the consideration of regional differences in the popularization of communication technology applications, the 31 provinces and municipalities are classified into three regions: Eastern, Central, and Western China.
4. Results and Discussion
4.1. Baseline Regression of Telecommunication Infrastructure and Innovation Development
In this study, we analyzed panel data samples from 31 provincial-level regions in China for the years 2009-2022. The Hausman test was employed to make a determination. The null hypothesis of the Hausman test assumes that unobservable individual effects are unrelated to explanatory variables. The Hausman test results in this study rejected the null hypothesis, implying that a fixed effects model should be used for the analysis.
The dependent variable in the regression analysis is the R&D expenditure of industrial enterprises above a certain scale, as shown in Table 2. In Table 2, the first column presents the Log of the number of mobile communication base stations the core explanatory variable, and the second column uses the Log of the number of broadband access ports. The regression coefficients in both columns are positive and statistically significant at the 1% level. In the third column, both the number of mobile communication base stations and the number of broadband access ports are included as explanatory variables for R&D expenditure, testing the robustness of the previous results. The results show that the regression coefficients for both variables remain significantly positive at the 1% level, confirming the conclusions of the first and second columns. The fourth column presents the regression results after introducing the interaction term between mobile base stations and broadband access. The coefficient is 0.048, and it is statistically significant at the 1% level. This result suggests that mobile and fixed communications have a significant positive impact on R&D expenditure, indicating a complementary effect between the two. With the improvement in mobile communication network capabilities, the development of associated infrastructure is synchronized, enhancing the capabilities of fixed communication networks and thereby promoting an increase in R&D expenditure.
The results for the number of patent applications as the dependent variable are shown in Table 3. The first and second columns of Table 3 show that the regression coefficients for the number of mobile communication base stations and the number of broadband access ports are 1.532 and 1.294, respectively, and both are statistically significant at the 1% level. This implies that for every 1% increase in the number of mobile communication base stations, there is a 1.532% increase in the number of patent applications, and for every 1% increase in the number of broadband access ports, there is a 1.294% increase in the number of patent applications. The third column includes both the number of mobile communication base stations and the number of broadband access ports as variables, and the results show that their regression coefficients remain significantly positive at the 1% level, confirming the robustness of the previous results. The fourth column shows the regression results after introducing the interaction term between mobile base stations and broadband access. The coefficient is 0.048, and it is statistically significant at the 1% level. This indicates that mobile and fixed communications have a significant positive impact on the number of patent applications, but there is no significant complementary effect between them.
The regression results for the total industrial output value of high-tech enterprises are shown in Table 4. The first and second columns of Table 4 show that the regression coefficients for the number of mobile communication base stations and the number of broadband access ports are 1.631 and 1.394, respectively, and both are statistically significant at the 1% level. This implies that for every 1% increase in the number of mobile communication base stations, there is a 1.631% increase in the total industrial output value of high-tech enterprises, and for every 1% increase in the number of broadband access ports, there is a 1.394% increase in the total industrial output value of high-tech enterprises. The third column shows the joint test of the number of mobile communication base stations and the number of broadband access ports, and both coefficients are statistically significant at the 1% level, indicating the robustness of the results in the first and second columns. The fourth column shows that the interaction term between the number of mobile communication base stations and the number of broadband access ports is significantly positive at the 1% level, indicating a complementary effect between mobile and fixed communications that promotes the increase in the total industrial output value of high-tech enterprises.
The above research results indicate the following. First, in terms of economic and social innovation development measured from the dimensions of innovation R&D input, innovation knowledge output, and innovation application output, all dimensions are significantly positively affected by the improvement in telecommunication infrastructure. The regression coefficients for mobile communication networks are generally higher than those for fixed communication networks. Second, compared to other factors, mobile communication network capability has the largest regression coefficient for the total industrial output value of high-tech enterprises, followed by the number of patent applications and R&D expenditure. Fixed communication network capability exhibits similar results. This indicates that the supporting function of telecommunication infrastructure for applying innovative technology to economic industries needs further improvement.
Additionally, from Table 2, Table 3 and Table 4, it can be observed that other control variables also play roles: (1) Economic development level promotes economic and social innovation activities. In all three regression models, the regression coefficients for per capita GDP, representing the economic development level, are positive and statistically significant at the 1% and 5% levels. This result suggests that the economic development level lays the foundation for innovation R&D input, innovation knowledge output, and innovation application output. Economic development is an essential accelerator for innovation development. (2) The level of urbanization contributes positively to the promotion of innovation development. The aforementioned regression results indicate that urbanization, in most cases, significantly enhances innovation R&D investment, the generation of innovative knowledge, and the advancement of innovation application. Higher levels of urbanization represent more comprehensive urban infrastructure and public service provisions, particularly in the development of digital infrastructure, which can significantly bolster innovation efforts by businesses and research institutions. (3) The significance of labor force supply for the impact of economic and social innovation development varies. The supply of the labor force can, potentially result in stronger economies of scale, as individuals accumulate experience while simultaneously producing goods and providing services, thereby contributing to increased production efficiency.
4.2. Estimation Results of the Development Phases of Telecommunication Infrastructure
To investigate the impact of telecommunication infrastructure development on innovation R&D expenditure, innovation knowledge output, and innovation application output, this study constructs dummy variables for different periods, representing the years 2009-2013 and 2014-2022. The period from 2009 to 2013 marked the era of 3G mobile communication technology application in China, which presented an improvement in voice and data transmission speeds and met the basic demands for mobile internet access. The years from 2014 to 2022 witnessed the construction of 4G and 5G communication networks, which provided higher-speed data communication capabilities, significantly enhanced data upload and download speeds, and fostered the development of mobile payments and short video applications.
The regression results for the R&D expenditure of large-scale industrial enterprises as the dependent variable are shown in Table 5. According to the results in Table 5, innovation R&D expenditure increases with the expansions of telecommunication infrastructure. (1) Specifically, during the period from 2009 to 2013, the regression coefficients for mobile communication and fixed-line communication are 1.287 and 1.112, respectively, both significant at the 1% level. The interaction term between mobile communication and fixed-line communication is not significant. (2) In the period from 2014 to 2022, the regression coefficients for mobile communication and fixed-line communication are 1.415 and 1.208, respectively, both significant at the 1% level. The interaction term between mobile communication and fixed-line communication is significantly positive. Based on the above results, two observations can be made. First, the development of telecommunication network infrastructure during different periods has a significant positive impact on innovation R&D expenditure, with this impact becoming more pronounced after 2014 when new-generation communication technologies were widely adopted. Second, from 2014 to 2022, with the extensive commercialization of new-generation communication technologies and the implementation of the “Broadband China” strategy, the synergistic effect of mobile communication and fixed-line communication on innovation R&D expenditure significantly increased.
For the dependent variable of patent applications, models (1) to (3) are re-estimated, as shown in Table 6. According to the results in Table 6, the growth of telecommunication infrastructure stock consistently promotes innovation knowledge output, but this promotion does not increase with the development of new-generation communication technologies. (1) Specifically, during the period from 2009 to 2013, the regression coefficients for mobile communication and fixed-line communication infrastructure with respect to the number of patent applications are 1.546 and 1.326, respectively, both significant at the 1% level. The regression results for the interaction term between the two are not significant. (2) In the period from 2014 to 2022, the regression coefficients for the number of mobile communication base stations and broadband port quantities are 1.493 and 1.270, respectively, both significant at the 1% level. The regression results for the interaction term between them are not significant. Summarizing the regression analysis results above, two main points can be made. First, for innovation knowledge output, both mobile communication and fixed-line communication networks have significant positive effects. However, the progress in communication technology after 2014 did not enhance this impact. Second, for the number of patent applications, there is no complementary effect between mobile communication and fixed-line communication for innovation knowledge output.
For the dependent variable of the total industrial output value of high-tech enterprises, models (1) to (3) are re-estimated, as shown in Table 7. The output of innovative applications increases with the growth of telecommunication infrastructure stock, and there is a significant complementary effect between mobile communication infrastructure and broadband infrastructure. (1) Specifically, during the period from 2009 to 2013, an increase of one percentage point in the number of mobile communication base stations leads to an increase of 1.497 percentage points in the total industrial output value of high-tech enterprises, while an increase of one percentage point in the number of broadband access ports results in an increase of 1.296 percentage points, both significant at the 1% level. The interaction term is significant at the 10% level. (2) In the period from 2014 to 2022, the regression coefficients for the numbers of mobile communication base stations and broadband access ports increase to 1.739 and 1.498, respectively, both significant at the 1% level. The significance of the interaction term increases to the 5% level. The above regression results indicate that after 2014, when the telecommunications industry entered a mature phase, a complementary effect between mobile communication and fixed-line communication emerged, increasing the total industrial output value of high-tech enterprises. This suggests that in the process of transforming innovative knowledge into innovative output, the better integration of mobile communication and fixed-line communication, along with their complementary advantages and collaboration, promote innovation development.
4.3. Estimation Results of Regional Disparities in Telecommunication Infrastructure
In terms of economic development level, economic structure, and openness, there are significant differences between the eastern coastal areas and inland regions in China. Domestic infrastructure investment is highly unevenly distributed across regions, so the level of infrastructure development has different effects on economic growth. This is of great significance for analyzing the key aspects of telecommunication infrastructure construction investment.
The regional regression results for R&D expenditure reveal significant differences in the effects of telecommunication infrastructure construction on the growth of R&D expenditure for large-scale industrial enterprises across the eastern, central, and western regions. The regression coefficients for mobile communication infrastructure are higher than those for broadband access in all three regions. In particular, the regression coefficients for mobile communication base stations and broadband access in the eastern region are 1.706 and 1.505, respectively, the highest among the three regions. Furthermore, the interaction term between mobile communication and broadband access in the western region has a regression coefficient of 0.123, which is significant at the 1% level. These empirical results indicate the following. First, for all regions, both mobile communication networks and fixed-line communication networks have significant positive effects on R&D expenditure, with mobile communication networks having a slightly larger impact. Second, in terms of the regression coefficients, the eastern region has the highest values, followed by the western and central regions. This suggests that in the eastern region, the impact of mobile communication network infrastructure development on R&D expenditure is more significant. Third, in the western region, the interaction term between mobile communication and broadband access is most significant, reaching the 1% level. This indicates that the western region exhibits the most pronounced complementary effect between mobile communication and fixed-line communication, and the synergistic role of mobile communication and fixed-line communication in promoting R&D expenditure is more significant in this region.
The regression results for innovation knowledge output (Table 9) show that the regression coefficients for mobile communication infrastructure in the eastern, central, and western regions are all higher than the coefficients for broadband access. Specifically, in the eastern region, the regression coefficient for mobile communication base stations is 1.506, the highest among the three regions. In the western region, the regression coefficient for broadband access is 1.781, which is also the highest among the three regions. However, the regression coefficients for the interaction terms between these two factors are not statistically significant. An analysis of the above regression results reveals the following conclusions. First, for all regions, both mobile communication networks and fixed-line communication networks have a significant positive impact on the number of patents granted. However, mobile communication networks have a slightly greater impact than fixed-line communication networks. Second, the regression coefficient for mobile communication infrastructure is the highest in the eastern region, followed by the western and central regions. This suggests that in the eastern region, investments in mobile communication networks have a more favorable effect on innovation knowledge output. In contrast, the impact of fixed-line communication on the number of patent acceptances is greater in the western region. This may be explained by the lower construction costs and easier implementation of fixed-line communication infrastructure. In regions with lower economic development levels, such as the western region, meeting basic network communication needs is a priority. Therefore, the increase in patents granted, as a component of innovation knowledge output, depends more on the construction of fixed-line communication infrastructure. Third, there is no significant complementary effect between mobile communication and fixed-line communication in terms of patents granted. This suggests that, in the context of innovation knowledge output, the synergistic role played by the combination of mobile and fixed-line communication is not particularly strong at the theoretical and knowledge innovation levels.
The regression results for innovation application output (Table 10) indicate that the regression coefficients for mobile communication infrastructure and broadband access are all higher than those for innovation application output in the eastern, central, and western regions. Specifically, in the eastern region, the regression coefficients for mobile communication base stations and broadband access ports are the highest, at 1.706 and 1.505, respectively. In the western region, the regression coefficients for these two core explanatory variables are 1.328 and 1.216. An analysis of these regression results reveals the following. First, both mobile and fixed-line communication infrastructure have a significant positive impact on innovation application output in both the eastern and western regions. Mobile communication has a greater impact on the increase in the industrial output value of high-tech enterprises. Second, mobile communication network development has a slightly greater impact on innovation application output in the eastern region than in the western region. The impact of fixed-line communication network development is similar in both regions. This may be due to the lower construction costs of fixed-line communication infrastructure and its widespread development across the country, leading to similar spillover effects on innovation application output in different regions. In contrast, the weaker coverage of mobile communication networks in the western region and the less saturated mobile communication market there result in smaller spillover effects on innovation application output.
4.4. Robustness Test and Endogeneity Test
Based on the previous regression results, it is evident that both mobile and fixed-line communication infrastructure construction and improvement play a significant role in promoting economic and social innovation development. To verify the reliability of the estimated results, this study constructs various alternative variables that measure communication network capabilities and conducts robustness analyses. Substituting variables that reflect communication infrastructure capabilities for the previous explanatory variables is one approach.
First, the numbers of mobile and fixed-line users are used as explanatory variables, replacing the previous variables of the number of mobile communication base stations and broadband access ports. The regression results are shown in Table 11. Second, mobile and fixed-line business revenues are used as explanatory variables, replacing the previous variables of the number of mobile communication base stations and broadband access ports. The regression results are shown in Table 12. The regression analysis results indicate that different indicators reflecting communication network capabilities continue to show similar significant results. Both mobile communication networks and fixed-line communication networks have a promoting effect on R&D investment, innovation knowledge output, and innovation application output. Specifically, communication network construction and improvement have the greatest impact on R&D investment, followed by innovation knowledge output and innovation application output. The regression coefficients for mobile communication networks are still slightly higher than those for fixed-line communication networks, indicating that mobile communication plays a greater role in promoting economic and social innovation development.
To further establish the causal relationship between communication infrastructure and socioeconomic innovation development, this study needs to address the challenge of endogeneity. There exists reverse causality between the development and improvement of communication infrastructure and innovation development. In other words, the more advanced the communication network construction is, the higher the level of innovation it promotes. Conversely, higher innovation vitality in the economy and society also stimulates the development of communication technology, making it more likely to provide technical support for communication infrastructure construction. To tackle the issue of reverse causality, this study employs the method of instrumental variables, where effective instrumental variables need to satisfy the criteria of relevance and endogeneity [37].
The estimated results using the market share of telecom operators as instrumental variables for both the Log of the number of mobile communication base stations and the Log of the number of broadband access ports in the regression are shown in Table 13. From the results in the first column, the third column, and the fifth column, it can be observed that the instrumental variable has a p value of 0.004, which is significant at the 1% level, indicating a strong correlation between the instrumental variable and the explanatory variable, the number of mobile communication base stations. The first-stage F-statistic is 21.4, which is greater than 10, indicating that the null hypothesis of a “weak instrumental variable” can be rejected. Therefore, the market share of a certain telecom operator is suitable as an instrumental variable for the number of mobile communication base stations. In the results of the second column, the fourth column, and the fifth column, the p value of the instrumental variable is 0.000, which is significant at the 1% level, indicating a strong correlation between this instrumental variable and the explanatory variable, the number of broadband access ports. The first-stage F-statistic of 30.87 is greater than 10, rejecting the null hypothesis of a “weak instrumental variable” and indicating the appropriateness of choosing the market share of a certain telecom operator as an instrumental variable for the number of broadband access ports.
In the second stage, when the explanatory variables, the Log of the number of mobile communication base stations and the Log of the number of broadband access ports, are regressed against the dependent variables, the coefficients are consistent in sign and significant at the 1% level with the previous analysis. Thus, considering endogeneity issues, the construction and improvement of communication infrastructure significantly promote R&D investment, innovation knowledge output, and innovation application output. This conclusion aligns with the findings of the basic regression analysis. The growth rate in the region is slightly lower than that in the western region, at 143.05%. On the other hand, the western region has advantages in terms of energy, geology, climate, etc., making it more suitable for the development of data centers based on broadband networks. Regions such as Ningxia, Guizhou, and Inner Mongolia actively deploy data centers to meet the demand for data center construction from eastern regions, accelerating the construction of fixed communication infrastructure.
5. Mechanisms of the Impact of Communication Infrastructure on Innovation Development Level
Combining the empirical analysis results discussed above, it can be observed that the analysis of the promotion role of communication infrastructure on innovation development can be divided into two aspects: from different stages and from different regions. The construction and improvement of communication infrastructure not only increases R&D investment and innovation application output upstream and downstream of the communication industry chain but also penetrates into other related industries, generating spillover effects. From the perspective of different regions, mobile communication and fixed communication play different roles, and when combined with regional characteristics, they support local innovation activities.
5.1. The Impact of Communication Infrastructure on Innovation Development at Different Stages
Network construction varies significantly at different stages of communication development. In the 3G development stage, mobile communication technology began to support data transmission. During this period, mobile phones could support SMS and voice services, enhance multimedia services, and enable users to browse web pages and send/receive emails directly on their mobile phones, ushering in the era of mobile internet. After the official commercialization of 4G in 2014, there was a large-scale development of mobile internet. Figure 1 illustrates the situation of fixed asset investment completion in the telecommunications industry from 2009 to 2022. In 2015, a peak of investment in communication infrastructure was reached, with a total investment of 453.9 billion yuan, mainly used for the construction of 4G communication network infrastructure. The period from 2020 to 2022 heralded the deployment and construction of 5G communication networks, and the investment in the communication industry gradually increased. Figure 2 and Figure 3 show the number and growth rate of mobile communication base stations and broadband access ports. The total number of mobile communication base stations in the country increased from 3.39 million in the 3G era to 9.31 million in the 4G era and further to 10.83 million in the 5G era. According to the “Telecommunications Industry Statistical Yearbook” data, in the following years, with the development of mobile communication network construction, the mobile phone penetration rate increased from 90.8 per 100 people in the 3G era to 113.9 per 100 people in the 4G era. During this period, the development of communication infrastructure allowed the mobile internet to penetrate into various aspects of the economy and society, changing people’s ways of production and living.
In terms of fixed telecommunication infrastructure, the country has been actively promoting the “Broadband China” strategy, enhancing the level of broadband infrastructure, and accelerating the pace of broadband network upgrading. Figure 3 shows the changes in the number of broadband access ports. From 2009 to 2013, the number of broadband access ports increased from 135 million to 359 million. After the implementation of the “Broadband China” strategy, fixed communication became a strategic public infrastructure for the country, and from 2014 to 2022, the number of broadband access ports increased significantly from 401 million to 1.071 billion. The implementation of this strategy demonstrates the nation’s determination to improve network infrastructure construction. Fixed communication networks, as essential information infrastructure, support the development of innovative industries.
5.2. The Supportive Role of Telecommunication Infrastructure in Innovation Development in Different Regions
Analysis of the regression results mentioned above indicates that in the three aspects of innovation R&D investment, innovation knowledge output, and innovation application output, the regression coefficients of mobile communication infrastructure in the eastern region are greater than those in the central and western regions. This suggests that the development of mobile communication networks has a greater impact in the eastern region, while the role of fixed communication infrastructure in supporting innovation development is more prominent in the western region.
First, concerning the impact of the location and layout of mobile and fixed communication infrastructure on innovation development, due to the higher construction and maintenance costs of mobile communication networks compared to fixed communication network facilities, mobile communication base stations are located with the aim to cover more population and focus on densely populated areas. Because mobile communication network construction is optimized and improved based on population distribution, areas with population densities exceeding 2,000 people per square kilometer are prioritized. Data from the “Statistical Bulletin of National Economic and Social Development” were used to calculate the population density of each province. It can be observed that provinces and cities with higher population density have a greater distribution of mobile communication base stations. In contrast, the western regions have a more scattered population distribution. For the coverage of industrial parks and commercial buildings, broadband access is a cost-effective way to achieve better network coverage.
Second, considering the development level of mobile and fixed communication infrastructure markets, the construction of fixed communication networks serves as the foundation of communication networks. After the infrastructure of fixed networks was improved, the development of mobile communication networks gradually began. For the eastern region, where communication infrastructure is relatively developed, the market for fixed communication networks is relatively saturated. In contrast, the central and western regions are still in the stage of new urbanization, and the market for fixed communication networks is still in a development stage. Expanding the coverage of broadband access networks and improving broadband user access rates remain the focus of communication network development in these regions. According to data from the “China Communication Yearbook,” by the end of 2022, the number of broadband access ports in the western region reached 282 million, an increase of 262.8% compared to 2013. The growth rate in the eastern region is slightly lower, at 143.05%. On the other hand, the western region has advantages in energy, geology, climate, etc., making it more suitable for the construction of data centers based on broadband networks. Regions such as Ningxia, Guizhou, and Inner Mongolia have actively deployed data centers to meet the demand for data center construction from the eastern region, accelerating the pace of fixed communication infrastructure construction.
6. Conclusion and Implications
Using provincial panel data from 2009 to 2022 in China and employing fixed-effect econometric models, this paper considers the foundational role of telecommunication infrastructure, quantifies telecommunication infrastructure capabilities, and examines the impact of telecommunication infrastructure on innovation R&D investment, knowledge output, and application output in the three dimensions of mobile communication infrastructure and fixed communication infrastructure. Heterogeneity analysis is also conducted for different stages and regions. The main conclusions are as follows.
First, from a comprehensive perspective, between 2009 and 2022, both mobile communication infrastructure and fixed communication infrastructure had a significant promoting effect on innovation R&D investment, innovation knowledge output, and innovation application output. The impact of mobile communication infrastructure was slightly greater than that of fixed communication infrastructure. The development of communication network infrastructure had the most significant impact on innovation R&D investment, followed by innovation knowledge output and innovation application output. These conclusions still hold after robustness checks using alternative explanatory variables and endogeneity tests for instrument variables.
Second, the impact of telecommunication infrastructure on innovation exhibited different characteristics in different stages. Before 2014, during the 3G era, the construction of both mobile communication and fixed communication infrastructure had a certain positive effect on innovation R&D investment, innovation knowledge output, and innovation application output. After 2014, with the mass commercialization and popularization of new-generation communication technologies, the promoting effect of mobile communication infrastructure and fixed communication infrastructure on innovation R&D investment and innovation application output significantly increased. Furthermore, the interaction terms between the two became more significant after 2014, indicating that the iteration and update of communication technologies promoted the convergence of mobile and fixed communication, thereby driving companies to invest more in R&D expenses, facilitating the better application of innovation outcomes in industries, and ultimately increasing the output value of high-tech enterprises.
Finally, the impact of telecommunication infrastructure on economic and social innovation development varies by region. In the eastern region, mobile communication network capabilities play a predominant role in all three innovation dimensions, while in the western region, the promoting effects of mobile and fixed communication are similar. Moreover, for innovation knowledge output and innovation application output, the regression coefficient of fixed communication infrastructure in the western region is the highest among the three regions. This suggests that for innovation development in different regions, telecommunication infrastructure should leverage the different characteristics of mobile and fixed communication. In the eastern region, telecommunication infrastructure should primarily play the role of promoting mobile communication, further deepening the spillover effects of mobile communication infrastructure. In contrast, in the western region, the promoting role of fixed communication networks for the construction of telecommunication infrastructure should be fully utilized, and policy support and funding for the construction and operation of broadband networks should be increased to ultimately achieve coordinated regional development of telecommunication network infrastructure.
Empirical research demonstrates that the construction of telecommunication infrastructure has a significant positive effect on innovation development. The following insights can be drawn:
6.1. Strengthened Telecommunication Infrastructure Construction Provides a New Impetus and Space for Economic and Social Innovation Development
This study shows that the operation of telecommunication infrastructure construction plays a crucial and positive role in economic and social innovation development. Under the impetus of telecommunication infrastructure construction, the total output and labor productivity of the whole society have increased, and the industrial structure has changed. Telecommunication infrastructure has a significant promoting effect on innovation R&D investment, innovation knowledge output, and innovation application output. Furthermore, the impact of telecommunication infrastructure on innovation development exhibits different characteristics at different stages. The iterative update of communication technology drives companies to invest more in R&D expenses, enabling innovation outcomes to be better applied in various industries.
Due to its characteristics of high technological intensity and substantial investment, telecommunication infrastructure capabilities have a significant impact on economic and social innovation development. With the development of 5G communication technology, its characteristics of high bandwidth and low latency have brought about a new leap in communication network performance. The commercialization of 5G not only represents technological innovation but also promotes the deep integration and innovation of the communication network industry with various industries, providing a new impetus and space for economic and social innovation development. With the large-scale commercialization and popularization of new-generation communication technology, the promoting effect of telecommunication infrastructure construction on innovation R&D investment and innovation application output has significantly increased. Therefore, in the construction of telecommunication infrastructure, 5G should be the driving force to promote the reconstruction and transformation of telecommunication infrastructure, explore new models for industrial Internet products and services, construct a new industrial ecosystem, accelerate the cultivation of new technologies and new industries, and provide a powerful new impetus for economic and social innovation development, opening up a broader and deeper innovation space.
6.2. Persist in Promoting the Coordinated Construction of Mobile and Fixed Telecommunication Infrastructure to Achieve Regional Development Coordination
This study shows that the impact of telecommunication infrastructure construction on innovation development exhibits regional differences. For the overall promotion of innovation quantity and innovation output in the country, the impact of mobile communication infrastructure construction is greater than that of fixed communication infrastructure construction. In the interaction between telecommunication infrastructure and urbanization, on the basis of urbanization, mobile communication can play a better complementary role than fixed communication. Mobile communication networks and fixed communication networks, as the two most important components of telecommunication infrastructure construction, play different roles in economic and social innovation development. Due to the ability of mobile communication infrastructure to provide wireless network signal coverage, ensuring that smart terminals can receive and transmit data anytime and anywhere during mobility, broader coverage of communication capabilities can be guaranteed, thereby better meeting the requirements of high-speed and low-latency communication. On the other hand, fixed communication infrastructure, with features such as broadband access for households, industries, and offices, as well as lower construction costs and lower construction difficulty, can meet the most basic communication needs of areas with lower economic development levels first.
Therefore, in the construction of telecommunication infrastructure, we should persist in promoting the coordinated construction of mobile and fixed telecommunication infrastructure, make full use of their differentiated characteristics and respective advantages, and build a comprehensive telecommunication infrastructure system to provide solid and robust network support for high-quality economic and social development. For the eastern region, the construction of telecommunication infrastructure should primarily promote mobile communication, further deepening the spillover effects of mobile communication infrastructure. For the western region, the construction of telecommunication infrastructure should fully leverage the promoting role of fixed communication networks, advance the upgrading of network infrastructure construction, gradually extend broadband network coverage to rural population centers, production areas, and other regions, and support the consolidation of poverty alleviation achievements and effective integration with rural revitalization. Moreover, the policy support and financial support for the construction and operation of fixed communication infrastructure should be increased. Ultimately, this will promote regional coordinated development of telecommunication network infrastructure.
References
- Laitsou, E.; Kargas, A.; Varoutas, D. How ICT affects economic growth in the Euro area during the economic crisis. Economic Research and Electronic Networking 2020, 21, 59–81. [Google Scholar] [CrossRef]
- Katz, M.L.; Shapiro, C. Systems competition and network effects. Journal of Economic Perspectives 1994, 8, 93–115. [Google Scholar] [CrossRef]
- Kong, D.C.; Lin, L.; Zhang, J. Information accessibility and corporate innovation. Management Science 2022, 68, 7837–7860. [Google Scholar] [CrossRef]
- Hulten, C.R.; Bennathan, E.; Srinivasan, S. Infrastructure, externalities and economic development: a study of the Indian manufacturing industry. The World Bank Economic Review 2006, 20, 291–308. [Google Scholar] [CrossRef]
- Liu, S.L.; Hu, A.G. Transportation infrastructure and economic growth: a perspective on regional disparities in China. China Industrial Economy 2010, 4, 14–23. (In Chinese) [Google Scholar]
- Bai, J.H.; Wang, X.Y.; Bian, Y.C. The impact of Internet development on factor distortion. Quantitative and Technical Economics 2022, 11, 71–90. (In Chinese) [Google Scholar]
- David, O.O. Nexus between telecommunication infrastructures, economic growth and development in Africa: Panel vector autoregression (P-VAR) analysis. Telecommunications Policy 2019, 43, 101–116. [Google Scholar] [CrossRef]
- Thompson, H.G.; Garbacz, C. Economic impacts of mobile versus fixed broadband. Telecommunications Policy 2011, 35, 999–1009. [Google Scholar] [CrossRef]
- Han, X.F.; Song, W.F.; Li, B.X. Can the Internet become a new driving force for improving China’s regional innovation efficiency? China Industrial Economy 2019, 7, 119–136. (In Chinese) [Google Scholar]
- Ma, W.N.; Zhang, R.R. ; The impact of R&D subsidy on innovation: evidence from New Zealand firms. Economics of innovation and new technology 2017, 26, 429–452. [Google Scholar]
- Wang, Y.; Qamruzzaman, M.; Kor, S. Greening the Future: Harnessing ICT, Innovation, Eco-Taxes, and Clean Energy for Sustainable Ecology—Insights from Dynamic Seemingly Unrelated Regression, Continuously Updated Fully Modified, and Continuously Updated Bias-Corrected Models. Sustainability 2023, 15, 16417. [Google Scholar] [CrossRef]
- Koutroumpis, P. The economic impact of broadband on growth: A simultaneous approach. Telecommunications Policy 2009, 33, 471–485. [Google Scholar] [CrossRef]
- Roller, L.; Waverman, L. Telecommunications infrastructure and economic development: A simultaneous approach. American Economic Review 2001, 91, 909–923. [Google Scholar] [CrossRef]
- Han, B.G.; Zhu, P.F. Empirical Analysis of the Impact of Broadband on China’s Economic Growth. Statistical Study 2014, 31, 49–54. (In Chinese) [Google Scholar]
- Peha, J.M. Cellular economies of scale and why disparities in spectrum holdings are detrimental. Telecommunications Policy, 2017, 41, 792–801. [Google Scholar] [CrossRef]
- Acemoglu, D.; Restrepo, P. 2018. The race between man and machine: implications of technology for growth, factor shares, and employment. American Economic Review 2018, 108, 1488–1542. [Google Scholar] [CrossRef]
- Rahman, H.U.; Ali, G.; Zaman, U. Role of ICT Investment and Diffusion in the Economic Growth: A Threshold Approach for the Empirical Evidence from Pakistan. International Journal of Financial Studies 2021, 9, 14–25. [Google Scholar] [CrossRef]
- Acemoglu, D.; Restrepo, P. The race between man and machine:implications of technology for growth, factor shares, and employment. American Economics Review 2018, 1, 1488–1542. [Google Scholar] [CrossRef]
- Rodolfo, E.M.; Ananth, S. Frictionless technology diffusion: The Case of Tractors. Academy of Management journalAmerican Economic Review 2014, 104(4), 1368–1391. [Google Scholar]
- Kumar, R.R.; Stauvermann, P.J.; Samitas, A. The effects of ICT on output per worker: A study of the Chinese economy. Telecommunications Policy 2016, 40, 102–115. [Google Scholar] [CrossRef]
- Czernich, N.; Falck, O.; Kretschmer, T. Broadband infrastructure and economic growth. The Economic Journal 2011, 121, 505–532. [Google Scholar] [CrossRef]
- Kshetri, N.; Palvia, P.; Dai, H. Chinese institutions and standardization: the case of government support to domestic third generation cellular standard. Telecommunications Policy 2011, 35, 399–412. [Google Scholar] [CrossRef]
- Costinot, A.; Vogel, J. Matching and Inequality in the World Economy. The Journal of political economy 2010, 118, 747–786. [Google Scholar] [CrossRef]
- Bresnahan, T.F.; Brynjolfsson, E.; Hitt, L.M. Information Technology, Workplace Organization, and the Demand for Skilled Labor: Firm-Level Evidence. The Quarterly journal of economics 2002, 117, 339–376. [Google Scholar] [CrossRef]
- Kuhn, P.; Skuterud, M. Internet Job Search and Unemployment Durations. American Economic Review 2004, 94, 218–232. [Google Scholar] [CrossRef]
- Scherngell, T.; Rohde, C.; Neuländtner, M. The dynamics of global R&D collaboration networks in ICT: Does China catch up with the US. Plos One 2020, 15, 237–264. [Google Scholar]
- Sampson, R.C. R&D alliances and firm performance: The impact of technological diversity and alliance organization on innovation. Academy of Management journal 2007, 50, 364–374. [Google Scholar]
- Arellano, M.; Bover, O. Another look at the instrumental variable estimation of error-components models. Journal of Econometrics 1995, 68, 29–51. [Google Scholar] [CrossRef]
- Greenaway, D.; Kneller, R. Firm Heterogeneity, Exporting and Foreign Direct Investment. Economic Journal 2007, 117, 134–161. [Google Scholar] [CrossRef]
- Wooldridge, J.M. Econometric Analysis of Cross Section and Panel Data, 9rd ed.; Massachusetts Institute of Technology Press: Cambridge, British, 2002; pp. 153–172. [Google Scholar]
- Han, M.M.; Yuan, G.D.; Zhang, S.F. Technological Innovation and Employment Effects of Enterprises: Empirical Analysis Based on Micro enterprise Survey Data. Population And Economics 2016, 6, 114–124. (In Chinese) [Google Scholar]
- Zahra, S.A.; George, G. Absorptive capacity: A review, reconceptualization, and extension. The Academy of Management review 2002, 27, 185–203. [Google Scholar] [CrossRef]
- Kou, M.; Yang, Y.; Chen, K. The impact of external R&D financing on innovation process from a supply-demand perspective. Economic Modelling 2020, 92, 375–387. [Google Scholar]
- Roberts, N. Absorptive capacity, organizational antecedents, and environmental dynamism. Journal of business research 2015, 68, 2426–2433. [Google Scholar] [CrossRef]
- Nahapiet, J.; Ghoshal, S. Social Capital, Intellectual Capital, and the Organizational Advantage. The Academy of Management review 1998, 23, 242–266. [Google Scholar] [CrossRef]
- Inglesi-Lotz, R.; Hakimi, A.; Karmani, M. Threshold effects in the patent-growth relationship: a PSTR approach for 60 developed and developing countries. Applied Economics 2020, 52, 3512–3524. [Google Scholar] [CrossRef]
- Staiger, D.; Stock, J.H. Instrumental variables regression with weak instruments. Econometrica 1997, 65, 557–586. [Google Scholar] [CrossRef]
Figure 1.
Fixed Asset Investment in the Telecommunications Industry from 2009 to 2022.
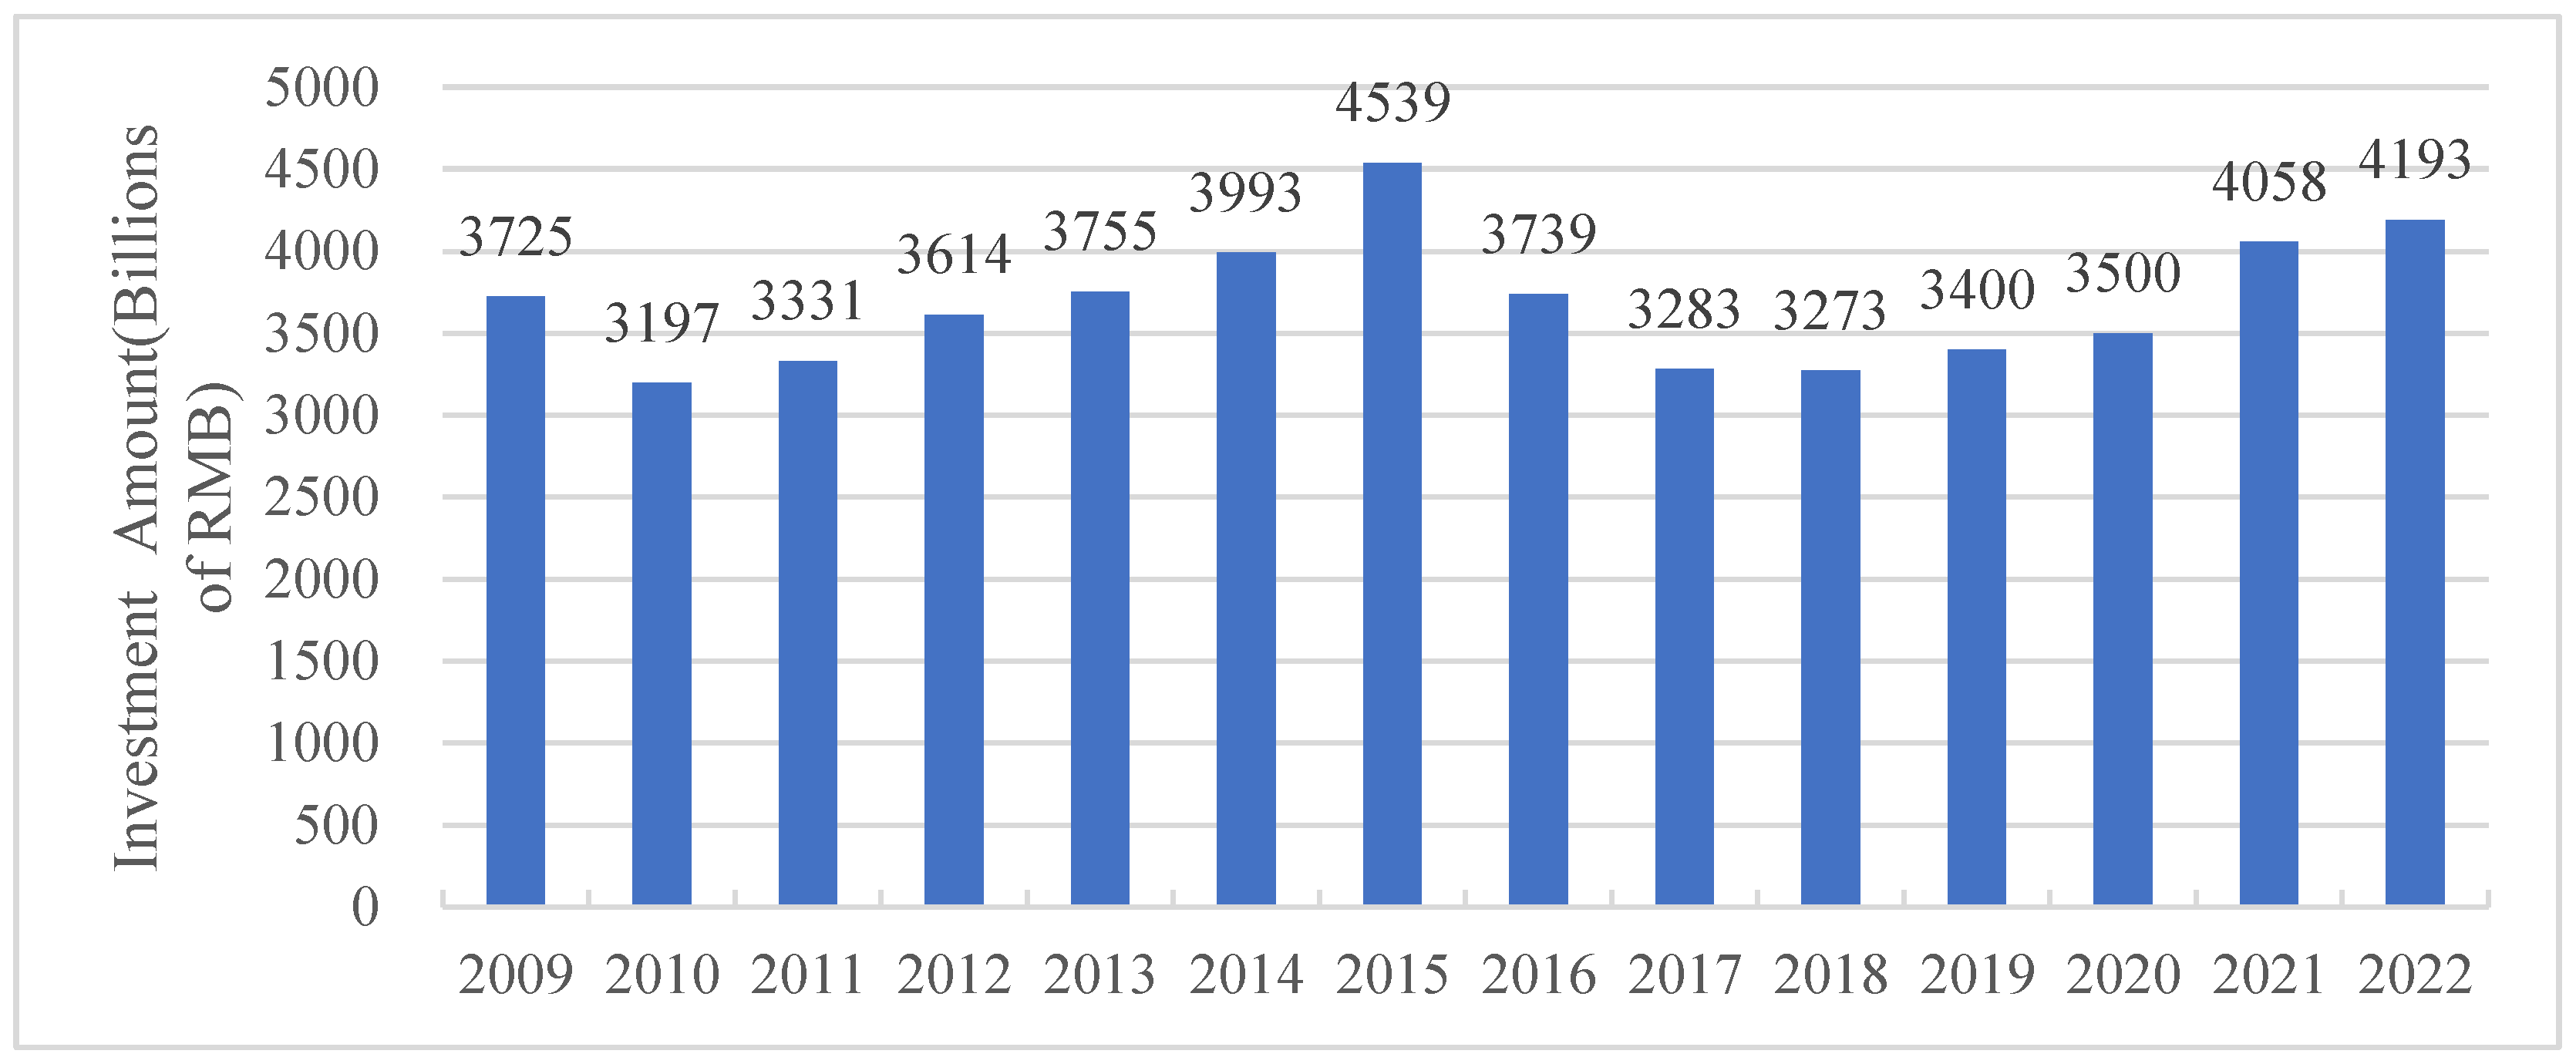
Figure 2.
Number and Growth Rate of Mobile Communication Base Stations from 2009 to 2022.
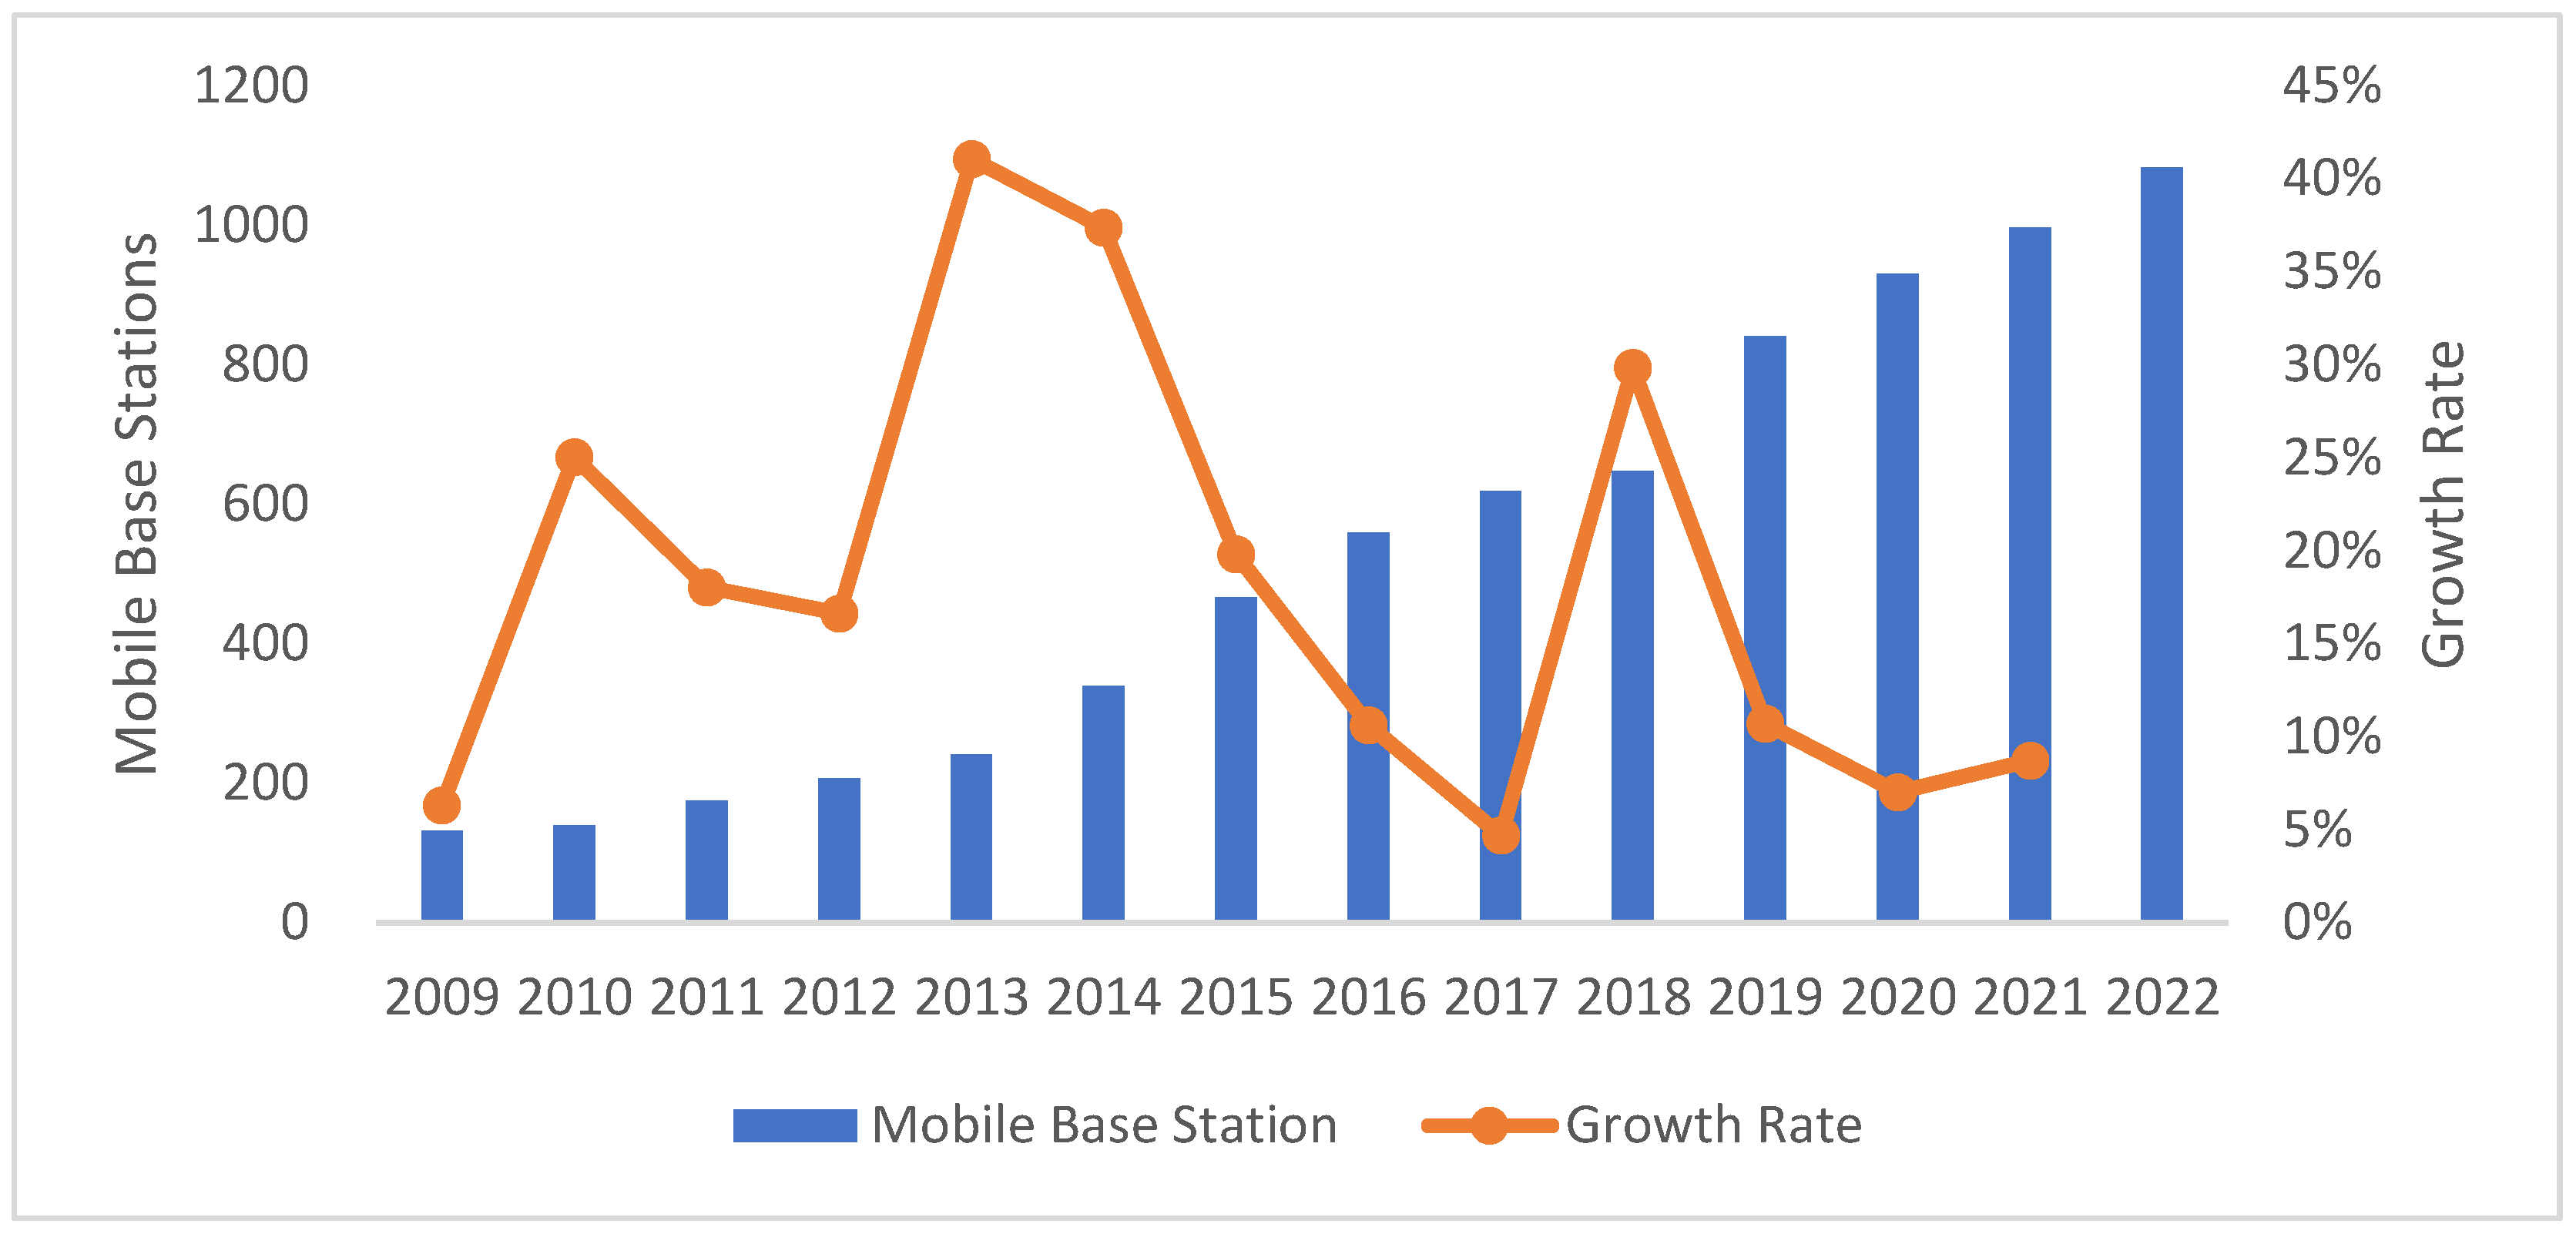
Figure 3.
Number and Growth Rate of Broadband Access Ports from 2009 to 2022.
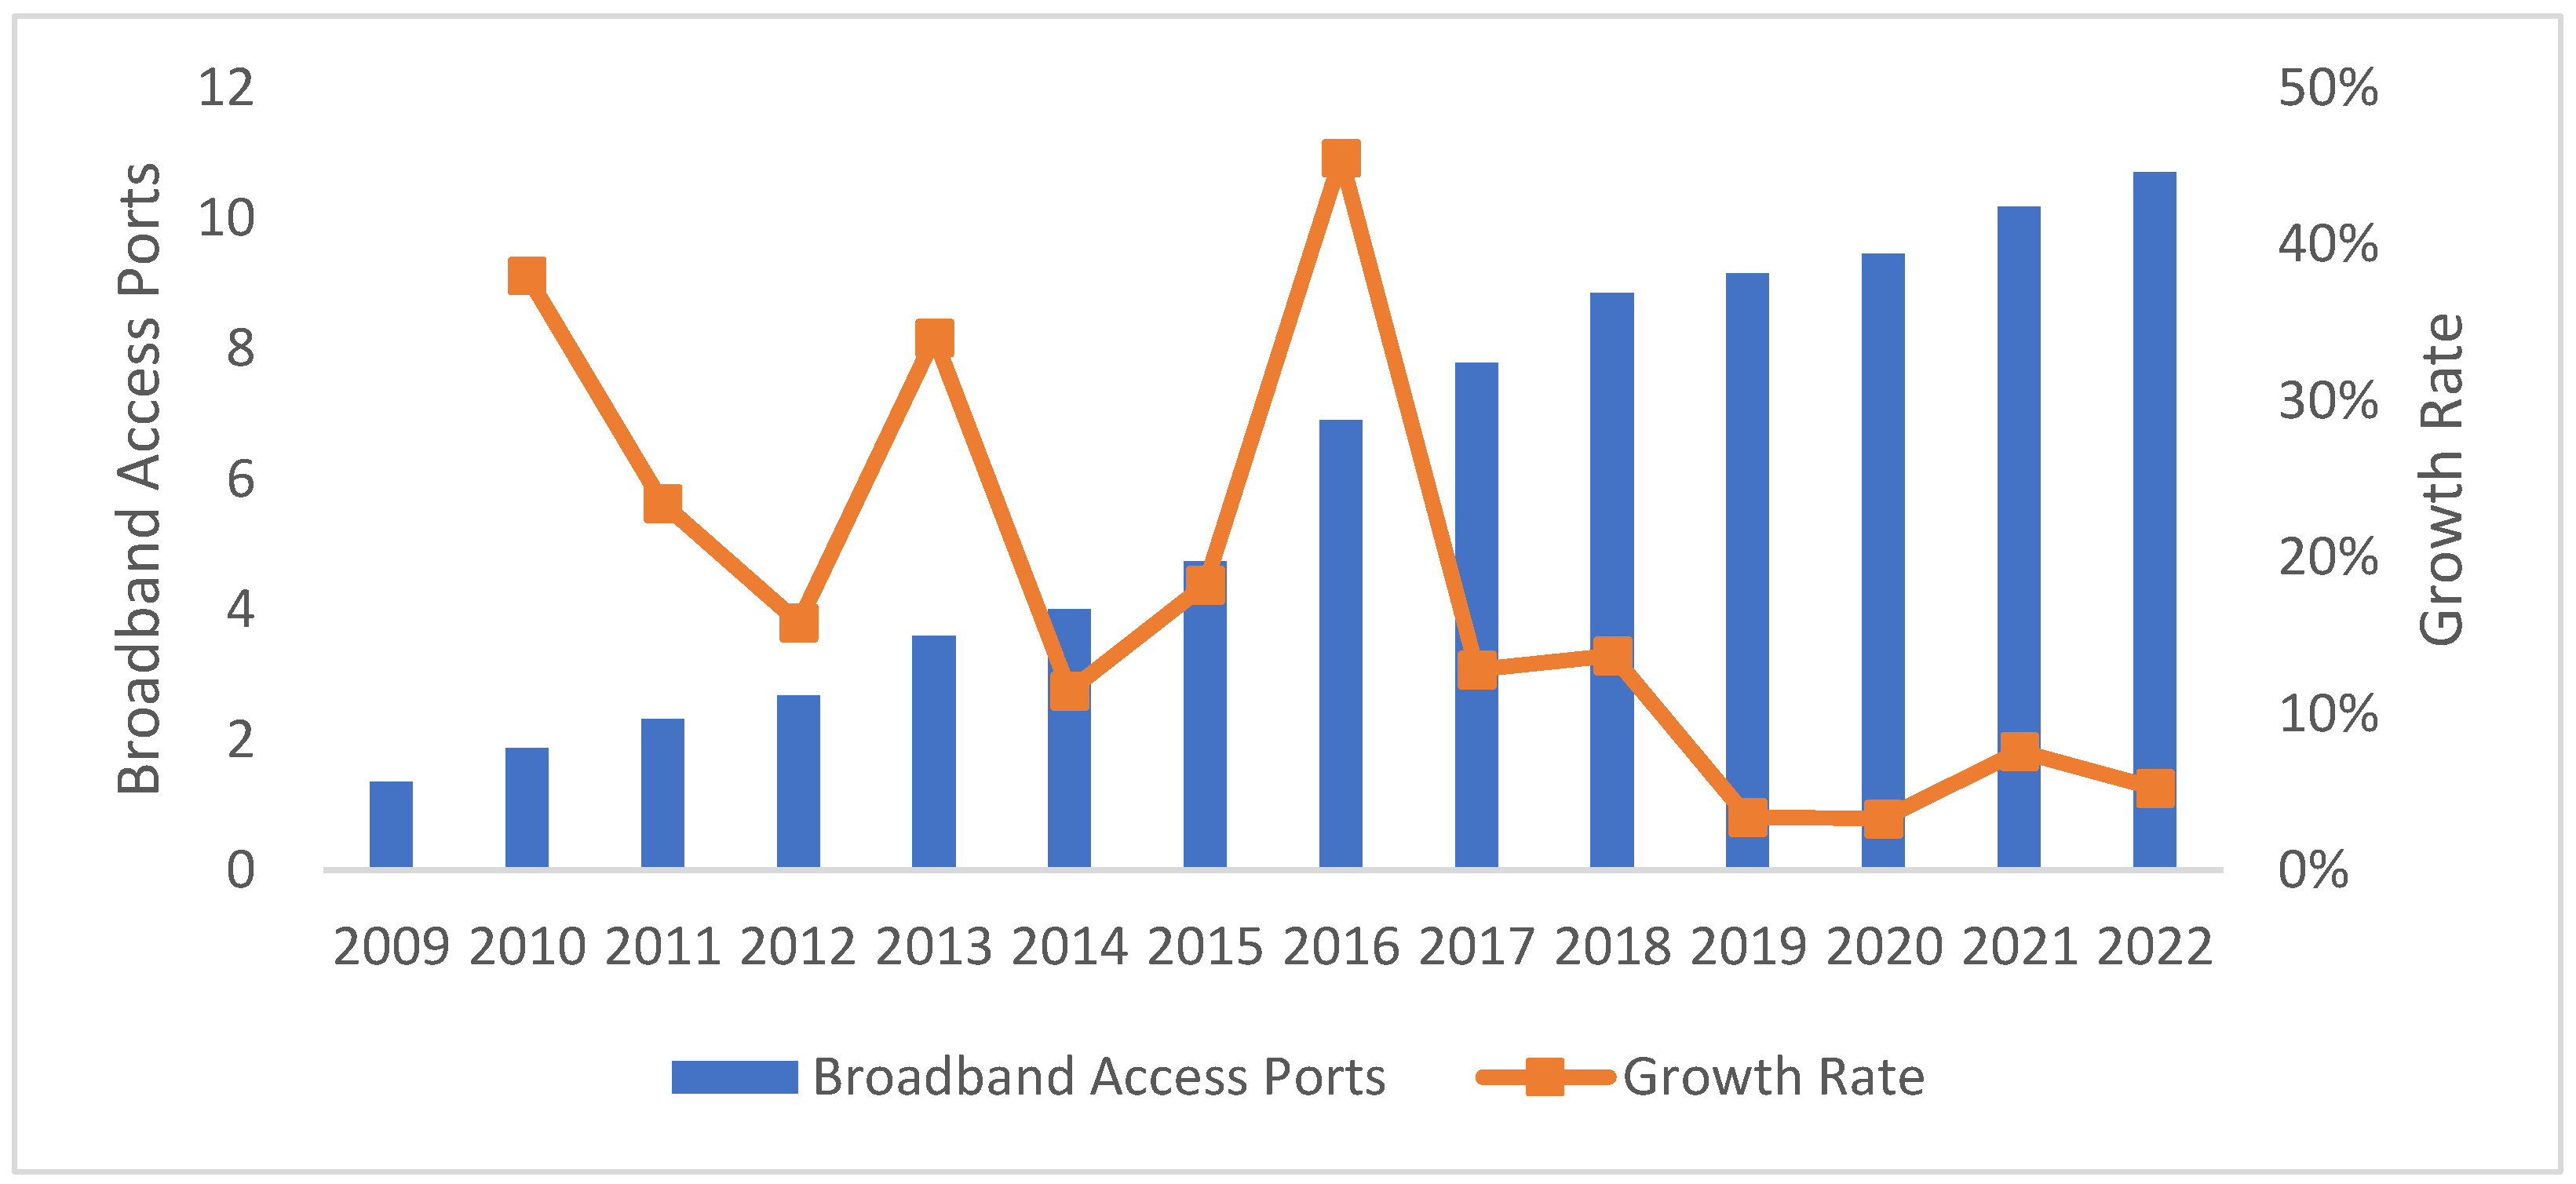

Table 1.
Descriptive Statistics of Main Variables.
| Symbols | Observations | Mean | Std. Dev. | Min | Max |
|---|---|---|---|---|---|
| 372 | 4.797 | 1.704 | -1.832 | 7.973 | |
| 372 | 10.367 | 1.662 | 5.088 | 13.795 | |
| 372 | 18.667 | 2.709 | 7.362 | 22.797 | |
| 372 | 11.435 | 1.021 | 8.381 | 13.715 | |
| 372 | 6.927 | 1.159 | 2.753 | 9.141 | |
| 372 | 10.686 | 0.515 | 9.289 | 12.141 | |
| 372 | 0.562 | 0.138 | 0.222 | 0.942 | |
| 372 | 0.005 | 0.027 | -0.074 | 0.232 | |
| 372 | 0.159 | 0.038 | 0.039 | 0.252 | |
| 372 | 0.266 | 0.283 | 0.011 | 1.398 |
Table 2.
The Relationship between Telecommunication Infrastructure in China and R&D Expenditure of Industrial Enterprises above a Certain Scale: 2009-2022.
Table 2.
The Relationship between Telecommunication Infrastructure in China and R&D Expenditure of Industrial Enterprises above a Certain Scale: 2009-2022.
| Independent Variables | Dependent Variable: R&D Expenditure of Industrial Enterprises above a Certain Scale | |||
|---|---|---|---|---|
| (1) | (2) | (3) | (4) | |
| 1.361*** (0.042) |
0.466*** (0.157) |
0.138 (0.198) |
||
| 1.158*** (0.0342) |
0.780*** (0.132) |
0.264 (0.234) |
||
| 0.048*** (0.018) |
||||
| 0.729*** (0.135) |
0.942*** (0.129) |
0.856*** (0.131) |
0.790*** (0.132) |
|
| 1.010** (0.492) |
-0.949** (0.458) |
-0.221 (0.515) |
0.174 (0.531) |
|
| -2.071 (1.297) |
-1.295 (1.257) |
-1.409 (1.244) |
-1.535 (1.234) |
|
| 5.304*** (1.239) |
4.114*** (1.207) |
4.299*** (1.196) |
4.227*** (1.186) |
|
| 0.353** (0.161) |
0.322** (0.156) |
0.318** (0.154) |
0.223 (0.157) |
|
| Constant | -6.199*** (1.278) |
0.371 (1.227) |
-1.849 (1.425) |
2.082 (2.048) |
| Observations | 372 | 372 | 372 | 372 |
| R-squared | 0.872 | 0.881 | 0.884 | 0.886 |
* represents significance at the 10% level, ** at the 5% level, and *** at the 1% level; standard errors are in parentheses.
Table 3.
The Relationship between Telecommunication Infrastructure in China and the Number of Patent Applications: 2009-2022.
Table 3.
The Relationship between Telecommunication Infrastructure in China and the Number of Patent Applications: 2009-2022.
| Independent Variables | Dependent Variable: Number of Patent Applications | |||
|---|---|---|---|---|
| (1) | (2) | (3) | (4) | |
| 1.523*** (0.041) |
0.548*** (0.154) |
0.458** (0.196) |
||
| 1.294*** (0.033) |
0.848*** (0.129) |
0.708*** (0.232) |
||
| 0.0133 (0.0182) |
||||
| 0.661*** (0.134) |
0.900*** (0.127) |
0.798*** (0.129) |
0.780*** (0.131) |
|
| 2.943*** (0.488) |
0.747* (0.451) |
1.603*** (0.505) |
1.710*** (0.526) |
|
| 1.179 (1.286) |
-0.324 (1.24) |
-0.458 (1.22) |
-0.492 (1.222) |
|
| 0.355 (1.228) |
-0.956 (1.191) |
-0.738 (1.173) |
-0.758 (1.174) |
|
| 0.26 (0.16) |
0.228 (0.153) |
0.222 (0.151) |
0.197 (0.155) |
|
| Constant | -15.88*** (1.267) |
-8.535*** (1.21) |
-11.14*** (1.398) |
-10.07*** (2.027) |
| Observations | 372 | 372 | 372 | 372 |
| R-squared | 0.891 | 0.898 | 0.902 | 0.902 |
* represents significance at the 10% level, ** at the 5% level, and *** at the 1% level; standard errors are in parentheses.
Table 4.
The Relationship between Telecommunication Infrastructure in China and the Total Industrial Output Value of High-tech Enterprises: 2009-2022.
Table 4.
The Relationship between Telecommunication Infrastructure in China and the Total Industrial Output Value of High-tech Enterprises: 2009-2022.
| Independent Variables | Dependent Variable: Total Industrial Output Value of High-tech Enterprises | |||
|---|---|---|---|---|
| (1) | (2) | (3) | (4) | |
| 1.631*** -0.0434 |
0.438*** -0.156 |
-0.243 -0.191 |
||
| 1.394*** -0.034 |
1.039*** -0.131 |
-0.0317 -0.225 |
||
| 0.101*** -0.0177 |
||||
| 0.313** (0.140) |
0.563*** (0.129) |
0.482*** (0.131) |
0.343*** (0.127) |
|
| 3.713*** (0.508) |
1.390*** (0.455) |
2.073*** (0.513) |
2.892*** (0.512) |
|
| -3.170** (1.338) |
-2.180* (1.251) |
-2.288* (1.239) |
-2.548** (1.188) |
|
| 6.645*** (1.278) |
5.132*** (1.201) |
5.306*** (1.191) |
5.155*** (1.141) |
|
| -0.149 (0.166) |
-0.191 (0.155) |
-0.196 (0.153) |
-0.392*** (0.151) |
|
| Constant | -20.29*** (1.318) |
-12.41*** (1.221) |
-14.49*** (1.420) |
-6.332*** (1.971) |
| Observations | 372 | 372 | 372 | 372 |
| R-squared | 0.897 | 0.911 | 0.913 | 0.920 |
* represents significance at the 10% level, ** at the 5% level, and *** at the 1% level; standard errors are in parentheses.
Table 5.
Relationship between Telecommunication Infrastructure Development in Different Development Phases and R&D Expenditure of Large-scale Industrial Enterprises.
Table 5.
Relationship between Telecommunication Infrastructure Development in Different Development Phases and R&D Expenditure of Large-scale Industrial Enterprises.
| Independent Variables | Dependent Variable: R&D Expenditure of Large-scale Industrial Enterprises | |||||
|---|---|---|---|---|---|---|
| 2009-2013 | 2014-2022 | |||||
| (1) | (2) | (3) | (4) | (5) | (6) | |
| 1.287*** (0.074) |
0.241 (0.393) |
1.415*** (0.049) |
0.089 (0.283) |
|||
| 1.112*** (0.058) |
1.564** (0.600) |
1.208*** (0.041) |
-0.195 (0.394) |
|||
| -0.0441 (0.053) |
0.077** (0.032) |
|||||
| 1.258*** | 1.437*** | 1.556*** | 0.584*** | 0.812*** | 0.633*** | |
| (0.301) | (0.276) | (0.319) | (0.139) | (0.135) | (0.136) | |
| -0.727 | -2.946*** | -3.393*** | 1.723*** | -0.056 | 1.262** | |
| (1.022) | (0.921) | (1.197) | (0.523) | (0.492) | (0.562) | |
| -0.903 (2.427) |
0.922 (2.278) |
0.83 (2.298) |
-1.673 (1.551) |
-0.438 (1.527) |
-1.35 (1.486) |
|
| 4.628** (2.204) |
3.524* (2.058) |
3.352 (2.08) |
6.061*** (1.422) |
4.925*** (1.409) |
5.309*** (1.358) |
|
| 0.374 (0.254) |
0.343 (0.236) |
0.428* (0.258) |
0.251 (0.206) |
0.22 (0.203) |
0.064 (0.205) |
|
| Constant | -8.365*** (2.658) |
-2.042 (2.499) |
-5.477 (4.959) |
-6.852*** (1.385) |
-0.145 (1.335) |
3.464 (3.121) |
| Observations | 155 | 155 | 155 | 217 | 217 | 217 |
| R-squared | 0.845 | 0.866 | 0.867 | 0.903 | 0.907 | 0.915 |
* represents significance at the 10% level, ** at the 5% level, and *** at the 1% level; standard errors are in parentheses.
Table 6.
Relationship between Telecommunication Infrastructure Development in Different Development Phases and the Number of Patent Applications.
Table 6.
Relationship between Telecommunication Infrastructure Development in Different Development Phases and the Number of Patent Applications.
| Independent Variables | Dependent Variable: Number of Patent Applications | |||||
|---|---|---|---|---|---|---|
| 2009-2013 | 2014-2022 | |||||
| (1) | (2) | (3) | (4) | (5) | (6) | |
| 1.546*** (0.071) |
-0.123 (0.369) |
1.493*** (0.052) |
0.625** (0.310) |
|||
| 1.326*** (0.054) |
0.500 (0.564) |
1.270*** (0.044) |
0.520 (0.431) |
|||
| 0.063 (0.050) |
0.014 (0.035) |
|||||
| 0.676** (0.288) |
0.905*** (0.261) |
0.688** (0.299) |
0.654*** (0.149) |
0.896*** (0.146) |
0.754*** (0.149) |
|
| 3.147*** (0.978) |
0.452 (0.870) |
1.502 (1.124) |
2.862*** (0.559) |
0.973* (0.533) |
2.046*** (0.615) |
|
| -2.162 (2.322) |
-0.121 (2.151) |
-0.134 (2.158) |
0.182 (1.660) |
1.465 (1.654) |
0.882 (1.626) |
|
| -0.596 (2.109) |
-1.821 (1.942) |
-1.497 (1.953) |
1.313 (1.522) |
0.164 (1.526) |
0.429 (1.486) |
|
| 0.222 (0.243) |
0.193 (0.222) |
0.070 (0.242) |
0.298 (0.221) |
0.268 (0.220) |
0.237 (0.224) |
|
| Constant | -15.45*** (2.544) |
-7.926*** (2.359) |
-4.027 (4.656) |
-16.15*** (1.483) |
-9.073*** (1.446) |
-11.33*** (3.415) |
| Observations | 155 | 155 | 155 | 217 | 217 | 217 |
| R-squared | 0.884 | 0.902 | 0.904 | 0.897 | 0.898 | 0.905 |
* represents significance at the 10% level, ** at the 5% level, and *** at the 1% level; standard errors are in parentheses.
Table 7.
Relationship between Telecommunication Infrastructure Development in Different Development Phases and the Total Industrial Output Value of High-tech Enterprises.
Table 7.
Relationship between Telecommunication Infrastructure Development in Different Development Phases and the Total Industrial Output Value of High-tech Enterprises.
| Independent Variables | Dependent Variable: Total Industrial Output Value of High-tech Enterprises | |||||
|---|---|---|---|---|---|---|
| 2009-2013 | 2014-2022 | |||||
| (1) | (2) | (3) | (4) | (5) | (6) | |
| 1.497*** (0.065) |
-0.473 (0.320) |
1.739*** (0.057) |
-0.0229 (0.317) |
|||
| 1.296*** (0.047) |
0.437 (0.489) |
1.498*** (0.045) |
0.123 (0.441) |
|||
| 0.084* (0.043) |
0.081** (0.035) |
|||||
| 0.105 (0.266) |
0.310 (0.227) |
0.083 (0.260) |
0.410** (0.161) |
0.682*** (0.149) |
0.515*** (0.152) |
|
| 3.922*** (0.903) |
1.346* (0.759) |
2.182** (0.975) |
4.125*** (0.607) |
1.987*** (0.543) |
3.209*** (0.629) |
|
| -4.783** (2.144) |
-2.630 (1.876) |
-2.448 (1.872) |
-0.198 (1.802) |
1.395 (1.686) |
0.520 (1.663) |
|
| 5.111*** (1.948) |
3.808** (1.694) |
4.135** (1.694) |
7.881*** (1.652) |
6.286*** (1.556) |
6.651*** (1.520) |
|
| 0.045 (0.224) |
0.008 (0.194) |
-0.152 (0.210) |
-0.347 (0.240) |
-0.396* (0.224) |
-0.559** (0.229) |
|
| Constant | -15.54*** (2.348) |
-8.170*** (2.058) |
-1.537 (4.040) |
-23.86*** (1.609) |
-15.63*** (1.474) |
-11.29*** (3.494) |
| Observations | 155 | 155 | 155 | 217 | 217 | 217 |
| R-squared | 0.895 | 0.922 | 0.924 | 0.911 | 0.922 | 0.927 |
* represents significance at the 10% level, ** at the 5% level, and *** at the 1% level; standard errors are in parentheses.
Table 8.
Relationship between Telecommunication Infrastructure Development in Different Regions and R&D Expenditure of Large-scale Industrial Enterprises.
Table 8.
Relationship between Telecommunication Infrastructure Development in Different Regions and R&D Expenditure of Large-scale Industrial Enterprises.
| Independent Variables | Eastern China | Central China | Western China | ||||||
|---|---|---|---|---|---|---|---|---|---|
| (1) | (2) | (3) | (4) | (5) | (6) | (7) | (8) | (9) | |
| 1.706*** (0.092) |
-0.593 (0.473) |
1.248*** (0.146) |
-0.173 (0.584) |
1.328*** (0.048) |
-0.086 (0.223) |
||||
| 1.505*** (0.073) |
-0.103 (0.511) |
1.026*** (0.137) |
-1.549 (1.051) |
1.216*** (0.040) |
0.025 (0.277) |
||||
| lnStationit ×lnBroadbandit | 0.080*** (0.019) |
0.156* (0.0813) |
0.123*** (0.045) |
||||||
| -0.0819 (0.246) |
0.259 (0.219) |
0.169 (0.224) |
2.306*** (0.192) |
2.200*** (0.211) |
2.156*** (0.191) |
-0.729*** (0.215) |
-0.560*** (0.200) |
-0.668*** (0.189) |
|
| 4.287*** (0.889) |
2.464*** (0.777) |
3.688*** (0.863) |
0.0569 (0.846) |
-2.324*** (0.715) |
-0.240 (0.821) |
8.390*** (0.818) |
6.261*** (0.758) |
7.268*** (0.782) |
|
| -2.289 (2.186) |
-1.777 (2.022) |
-3.197 (2.014) |
2.835 (1.793) |
4.932** (1.872) |
2.406 (1.797) |
-1.113 (1.971) |
-0.801 (1.832) |
-0.966 (1.709) |
|
| -0.838 (2.970) |
-1.242 (2.740) |
-3.157 (2.778) |
-6.804*** (1.247) |
-2.059 (1.377) |
-6.087*** (1.544) |
8.319*** (1.960) |
5.281*** (1.853) |
6.092*** (1.764) |
|
| 0.772*** (0.260) |
0.667*** (0.241) |
0.612** (0.234) |
-1.273 (0.916) |
-2.654*** (0.930) |
-2.792** (1.105) |
0.217 (0.511) |
-0.939* (0.486) |
-1.003** (0.483) |
|
| Constant | -16.39*** (2.179) |
-9.977*** (2.019) |
-1.331 (4.382) |
-32.27*** (2.483) |
-23.391*** (2.182) |
-15.993** (7.757) |
-8.565*** (2.185) |
-1.797 (1.951) |
1.541 (2.449) |
| Observations | 132 | 132 | 132 | 96 | 96 | 96 | 144 | 144 | 144 |
| R-squared | 0.848 | 0.870 | 0.881 | 0.908 | 0.896 | 0.918 | 0.950 | 0.957 | 0.963 |
* represents significance at the 10% level, ** at the 5% level, and *** at the 1% level; standard errors are in parentheses. * 2. “Mobile” represents the Log of the number of mobile communication base stations, “Broadband” represents the Log of the number of broadband access ports, and “Interaction Term” represents the product of the Log of the number of mobile communication base stations and the Log of the number of broadband access ports.
Table 9.
Relationship between Telecommunication Infrastructure Development in Different Regions and the Number of Patent Applications.
Table 9.
Relationship between Telecommunication Infrastructure Development in Different Regions and the Number of Patent Applications.
| Independent Variables | Eastern China | Central China | Western China | ||||||
|---|---|---|---|---|---|---|---|---|---|
| (1) | (2) | (3) | (4) | (5) | (6) | (7) | (8) | (9) | |
| 1.506*** (0.066) |
0.620* (0.372) |
1.425*** (0.207) |
0.830 (0.866) |
1.405*** (0.072) |
-0.615* (0.331) |
||||
| 1.275*** (0.061) |
-0.056 (0.402) |
1.124*** (0.195) |
-0.112 (1.559) |
1.324*** (0.056) |
1.781*** (0.412) |
||||
| lnStationit ×lnBroadbandit | 0.048 (0.036) |
0.039 (0.121) |
0.005 (0.028) |
||||||
| 0.947*** (0.177) |
1.312*** (0.183) |
1.043*** (0.177) |
2.302*** (0.273) |
2.207*** (0.299) |
2.198*** (0.284) |
-0.018 (0.322) |
0.197 (0.280) |
0.250 (0.281) |
|
| 2.797*** (0.639) |
0.965 (0.649) |
2.579*** (0.679) |
3.240*** (1.202) |
0.371 (1.014) |
2.969** (1.218) |
1.252 (1.227) |
-1.014 (1.059) |
-1.912 (1.164) |
|
| -0.743 (1.571) |
-0.365 (1.687) |
-1.106 (1.584) |
-1.929 (2.548) |
0.516 (2.655) |
-1.722 (2.666) |
-1.166 (2.958) |
-0.458 (2.560) |
-0.510 (2.541) |
|
| 1.347 (2.135) |
0.603 (2.286) |
0.438 (2.185) |
-19.071*** (1.772) |
-13.79*** (1.952) |
-17.73*** (2.292) |
9.545*** (2.941) |
5.706** (2.588) |
4.673* (2.624) |
|
| 0.376** (0.187) |
0.342* (0.201) |
0.314* (0.184) |
-0.967 (1.301) |
-2.609* (1.319) |
-1.501 (1.639) |
0.404 (0.767) |
-0.968 (0.679) |
-1.430** (0.718) |
|
| Constant | -19.064*** (1.566) |
-13.532*** (1.684) |
-13.217*** (3.447) |
-28.517*** (3.528) |
-18.254*** (3.095) |
-23.068** (11.51) |
-7.926** (3.279) |
-1.285 (2.726) |
2.303 (3.642) |
| Observations | 132 | 132 | 132 | 96 | 96 | 96 | 144 | 144 | 144 |
| R-squared | 0.848 | 0.870 | 0.881 | 0.908 | 0.896 | 0.918 | 0.950 | 0.957 | 0.963 |
* represents significance at the 10% level, ** at the 5% level, and *** at the 1% level; standard errors are in parentheses. * 2. “Mobile” represents the Log of the number of mobile communication base stations, “Broadband” represents the Log of the number of broadband access ports, and “Interaction Term” represents the product of the Log of the number of mobile communication base stations and the Log of the number of broadband access ports.
Table 10.
Relationship Between Communication Infrastructure Construction in Different Regions and the Industrial Output Value of High-Tech Enterprises.
Table 10.
Relationship Between Communication Infrastructure Construction in Different Regions and the Industrial Output Value of High-Tech Enterprises.
| Independent Variables | Eastern China | Central China | Western China | ||||||
|---|---|---|---|---|---|---|---|---|---|
| (1) | (2) | (3) | (4) | (5) | (6) | (7) | (8) | (9) | |
| 1.706*** (0.092) |
-0.593 (0.473) |
1.248*** (0.146) |
-0.173 (0.584) |
1.328*** (0.048) |
-0.086 (0.223) |
||||
| 1.505*** (0.073) |
-0.103 (0.511) |
1.026*** (0.137) |
-1.549 (1.051) |
1.216*** (0.041) |
0.025 (0.277) |
||||
| lnStationit ×lnBroadbandit | 0.123*** (0.045) |
0.156* (0.081) |
0.080*** (0.018) |
||||||
| -0.082 (0.246) |
0.259 (0.219) |
0.169 (0.224) |
2.306*** (0.192) |
2.200*** (0.211) |
2.156*** (0.191) |
-0.729*** (0.215) |
-0.560*** (0.200) |
-0.668*** (0.189) |
|
| 4.287*** (0.889) |
2.464*** (0.777) |
3.688*** (0.863) |
0.0569 (0.846) |
-2.324*** (0.715) |
-0.240 (0.821) |
8.390*** (0.818) |
6.261*** (0.758) |
7.268*** (0.782) |
|
| -2.289 (2.186) |
-1.777 (2.022) |
-3.197 (2.014) |
2.835 (1.793) |
4.932** (1.872) |
2.406 (1.797) |
-1.113 (1.971) |
-0.801 (1.832) |
-0.966 (1.709) |
|
| -0.838 (2.970) |
-1.242 (2.740) |
-3.157 (2.778) |
-6.804*** (1.247) |
-2.059 (1.377) |
-6.087*** (1.544) |
8.319*** (1.960) |
5.281*** (1.853) |
6.092*** (1.764) |
|
| 0.772*** (0.260) |
0.667*** (0.241) |
0.612** (0.234) |
-1.273 (0.916) |
-2.654*** (0.930) |
-2.792** (1.105) |
0.217 (0.511) |
-0.939* (0.486) |
-1.003** (0.483) |
|
| Constant | -16.39*** (2.179) |
-9.977*** (2.019) |
-1.331 (4.382) |
-32.27*** (2.483) |
-23.39*** (2.182) |
-15.99** (7.757) |
-8.565*** (2.185) |
-1.797 (1.951) |
1.541 (2.449) |
| Observations | 132 | 132 | 132 | 96 | 96 | 96 | 144 | 144 | 144 |
| R-squared | 0.848 | 0.870 | 0.881 | 0.908 | 0.896 | 0.918 | 0.950 | 0.957 | 0.963 |
* represents significance at the 10% level, ** at the 5% level, and *** at the 1% level; standard errors are in parentheses. * 2. “Mobile” represents the Log of the number of mobile communication base stations, “Broadband” represents the Log of the number of broadband access ports, and “Interaction Term” represents the product of the Log of the number of mobile communication base stations and the Log of the number of broadband access ports.
Table 11.
Robustness Test - Alternative Variables: Log of the Number of Mobile and Fixed-Line Users.
Table 11.
Robustness Test - Alternative Variables: Log of the Number of Mobile and Fixed-Line Users.
| Independent Variables | R&D Expenses of Large-Scale Industrial Enterprises | Number of Patent Applications | Total Industrial Output Value of High-Tech Enterprises | |||
|---|---|---|---|---|---|---|
| (1) | (2) | (3) | (4) | (5) | (6) | |
| mobile users | 1.537*** | 1.432*** | 1.256*** | |||
| (0.036) | (0.040) | (0.040) | ||||
| broadband users | 1.348*** | 1.260*** | 1.109*** | |||
| (0.032) | (0.034) | (0.035) | ||||
| 0.614*** | 0.464*** | 1.003*** | 0.859*** | 1.048*** | 0.919*** | |
| (0.121) | (0.122) | (0.133) | (0.132) | (0.135) | (0.133) | |
| 2.423*** | 2.358*** | 1.657*** | 1.615*** | -0.254 | -0.279 | |
| (0.432) | (0.433) | (0.478) | (0.471) | (0.485) | (0.475) | |
| -1.906 | -4.339*** | 1.134 | -1.070 | 0.280 | -1.614 | |
| (1.427) | (1.415) | (1.579) | (1.539) | (1.602) | (1.553) | |
| 4.067*** | 3.033*** | -2.110* | -3.144** | 3.134** | 2.181* | |
| (1.139) | (1.152) | (1.260) | (1.253) | (1.278) | (1.264) | |
| -0.261* | -0.172 | 0.105 | 0.184 | 0.259 | 0.325** | |
| (0.145) | (0.145) | (0.161) | (0.158) | (0.163) | (0.160) | |
| Constant | -15.99*** | -10.34*** | -12.41*** | -7.129*** | -2.248* | 2.396* |
| (1.143) | (1.151) | (1.265) | (1.252) | (1.283) | (1.263) | |
| Observations | 341 | 341 | 341 | 341 | 341 | 341 |
| R-squared | 0.927 | 0.926 | 0.897 | 0.900 | 0.877 | 0.882 |
* represents significance at the 10% level, ** at the 5% level, and *** at the 1% level; standard errors are in parentheses.
Table 12.
Robustness Test: Alternative Variable – Telecommunication Business Revenue.
| Independent Variables | R&D Expenses of Large-Scale Industrial Enterprises | Number of Patent Applications | Total Industrial Output Value of High-Tech Enterprises | |||
|---|---|---|---|---|---|---|
| (1) | (2) | (3) | (4) | (5) | (6) | |
| mobile service income | 1.643*** | 1.584*** | 1.378*** | |||
| (0.048) | (0.045) | (0.047) | ||||
| broadband service income | 1.570*** | 1.555*** | 1.347*** | |||
| (0.054) | (0.047) | (0.048) | ||||
| -0.042 | -0.160 | 0.339** | 0.180 | 0.478*** | 0.344** | |
| (0.151) | (0.171) | (0.142) | (0.149) | (0.147) | (0.154) | |
| 3.579*** | 0.703 | 2.942*** | 0.259 | 0.826 | -1.517*** | |
| (0.534) | (0.573) | (0.503) | (0.500) | (0.519) | (0.516) | |
| -4.291** | -3.604* | -0.536 | 0.580 | -1.310 | -0.391 | |
| (1.708) | (1.928) | (1.609) | (1.683) | (1.662) | (1.734) | |
| 5.522*** | 9.630*** | -1.307 | 2.323* | 3.963*** | 7.157*** | |
| (1.366) | (1.494) | (1.288) | (1.304) | (1.330) | (1.343) | |
| -0.479*** | -0.798*** | -0.147 | -0.502*** | 0.049 | -0.254 | |
| (0.177) | (0.202) | (0.167) | (0.177) | (0.173) | (0.182) | |
| Constant | -21.44*** | -16.38*** | -17.71*** | -12.88*** | -6.847*** | -2.637* |
| (1.393) | (1.548) | (1.313) | (1.351) | (1.356) | (1.392) | |
| Observations | 341 | 341 | 341 | 341 | 341 | 341 |
| R-squared | 0.893 | 0.866 | 0.892 | 0.883 | 0.865 | 0.855 |
* represents significance at the 10% level, ** at the 5% level, and *** at the 1% level; standard errors are in parentheses.
Table 13.
Endogeneity Test: Instrumental Variable - Telecom Operator Market Share.
| IndependentVariables | R&D Expenses of Large-Scale Industrial Enterprises | Number of Patent Applications | Total Industrial Output Value of High-Tech Enterprises | |||
|---|---|---|---|---|---|---|
| (1) | (2) | (3) | (4) | (5) | (6) | |
| 1.387*** (0.300) |
0.247 (0.534) |
0.720** (0.358) |
||||
| 0.893*** (0.216) |
0.159 (0.354) |
0.463* (0.254) |
||||
| 0.467* (0.281) |
0.891*** (0.233) |
1.707*** (0.501) |
1.783*** (0.382) |
1.260*** (0.336) |
1.480*** (0.274) |
|
| 2.819** | -0.082 | -2.177 | -2.694* | -1.592 | -3.098*** | |
| (1.309) | (0.860) | (2.329) | (1.413) | (1.564) | (1.014) | |
| -7.156** | -9.531*** | -14.21** | -14.64*** | -8.143** | -9.377** | |
| (3.429) | (3.341) | (6.103) | (5.487) | (4.097) | (3.937) | |
| 8.955*** | 11.46*** | 12.51** | 12.96*** | 11.11*** | 12.41*** | |
| (3.166) | (2.997) | (5.635) | (4.921) | (3.783) | (3.531) | |
| 0.0670 | 0.259 | 1.132** | 1.166*** | 0.812** | 0.912*** | |
| (0.270) | (0.268) | (0.481) | (0.441) | (0.323) | (0.316) | |
| Constant | -19.03*** | -12.77*** | -11.87*** | -10.76*** | -3.397* | -0.148 |
| (1.698) | (1.620) | (3.022) | (2.660) | (2.029) | (1.908) | |
| Instrumental variable p-value | 0.004 | 0.000 | 0.004 | 0.000 | 0.004 | 0.000 |
| First-stage F-statistic | 21.4 | 30.87 | 21.4 | 30.87 | 21.4 | 30.87 |
| Observations | 341 | 341 | 341 | 341 | 341 | 341 |
* represents significance at the 10% level, ** at the 5% level, and *** at the 1% level; standard errors are in parentheses.
Disclaimer/Publisher’s Note: The statements, opinions and data contained in all publications are solely those of the individual author(s) and contributor(s) and not of MDPI and/or the editor(s). MDPI and/or the editor(s) disclaim responsibility for any injury to people or property resulting from any ideas, methods, instructions or products referred to in the content. |
© 2024 by the authors. Licensee MDPI, Basel, Switzerland. This article is an open access article distributed under the terms and conditions of the Creative Commons Attribution (CC BY) license (http://creativecommons.org/licenses/by/4.0/).
Copyright: This open access article is published under a Creative Commons CC BY 4.0 license, which permit the free download, distribution, and reuse, provided that the author and preprint are cited in any reuse.


