
Submitted:
25 September 2025
Posted:
26 September 2025
You are already at the latest version
Abstract
Digital technology transfer plays a crucial role in reshaping innovation spaces and developing the digital economy. This study constructs an inter-city digital technology transfer network based on digital technology patents. It examines the impact of such transfers on urban digital technology innovation from a multi-scale perspective. Findings reveal: (1) China's inter-city digital technology transfer network has grown increasingly complex and dense, forming a “diamond-shaped” structure centered on Beijing, Shanghai, Guangzhou, and Shenzhen, with multiple urban clusters serving as hubs, significantly enhancing network efficiency. (2) Although the proportion of intra-city digital technology transfer has decreased, the number of participating cities continues to grow, showing a diffusion pattern from core cities to inland provincial capitals. (3) Benchmark regression indicates that both inter-city and intra-city technology transfer significantly enhance urban digital innovation capabilities, with inter-city transfer exhibiting a much greater marginal effect than intra-city transfer. (4) Heterogeneity analysis reveals that technology transfer has a more substantial positive impact on the innovation capabilities of cities with lower administrative levels.
Keywords:
Innovation geography
; Digital technology transfer
; Social networks
; Innovation capacity
1. Introduction
The Fourth Industrial Revolution has emerged, propelling society toward a hybrid form that blends digital and physical spaces[1,2]. Digital technology has become a key driver for high-quality economic development[3], ushering in the era of digital technology. Against this backdrop, the digital economy and digital space have become new battlegrounds for great power competition. Governments worldwide are successively formulating innovation policies centered on digital technology, aiming to unleash new productive forces and shape new competitive advantages. In 2023, the Central Committee of the Communist Party of China and the State Council issued the “Overall Plan for Building a Digital China,” explicitly stating that “building a Digital China is a vital engine for advancing Chinese-style modernization in the digital era.” It further identifies “establishing a self-reliant and self-strengthening digital technology innovation system” as a key lever. Digital technology innovation requires the aggregation and optimized restructuring of scientific resources and innovation factors within specific geographic spaces to gain sustainable development momentum. Cities serve as hubs for highly concentrated innovation resources[4], and urban development driven by digital technology innovation is in full swing[5]. Technology transfer facilitates the efficient flow and organic integration of innovation factors, thereby propelling industrial transformation and internal innovation. This ultimately leads to optimized resource allocation and enhanced synergistic benefits of innovation. Since the introduction of the Digital China concept in 2015, accelerating its development has become a vital national strategy. Digital technologies have experienced exponential growth, with technology transfer becoming increasingly active and expanding in scale. As digital technologies transfer across different scales, their impact on urban digital innovation varies. Therefore, clarifying the relationship between digital technology transfer and urban digital innovation holds significant research value.
In the realm of technology transfer, it is recognized as a mechanism that optimizes the flow of regional innovation resources and promotes coordinated regional development. Research methodologies primarily employ social network analysis [6,7,8] and multidimensional proximity [9,10], focusing on analyzing the network attributes, spatial characteristics, and influencing factors of knowledge transfer. Regarding urban innovation development, research emphasizes comparative studies of regional innovation capabilities and spatial disparities. Significant gaps exist in innovation efficiency across different regions, and regional R&D activities also vary [9,10]. Key factors influencing urban technological innovation capabilities are analyzed using methods such as the SPDM model [11] and fixed-effects models [12]. As research deepens, scholars have begun examining the connection between urban technology transfer and urban innovation. Recent empirical studies have found that cities more embedded in technology-transfer networks exhibit significantly higher innovation outputs, suggesting that technology transfer plays a positive role in enhancing urban innovation capacity [13,14]. Intercity connectivity and cross-city technology transfers appear particularly effective in delivering heterogeneous and complex knowledge, thereby enhancing urban innovation performance [15,16]. As the dominant technology in the new round of technological revolution, digital technology has not yet received sufficient attention regarding its relationship with urban digital innovation capabilities. Existing research has not fully revealed the operational patterns and effectiveness of digital technology transfer in the Chinese context. Specifically, a critical yet unresolved question remains: Do digital technology transfers at different spatial scales—such as local, inter-city, and inter-provincial—exhibit systematic differences in their impact on enhancing urban digital innovation capabilities? Clarifying this issue would not only fill the aforementioned theoretical gap but also provide crucial decision-making support for governments to optimize digital technology transfer policy frameworks and precisely unlock the potential of innovation factor flows across different scales, thereby powerfully advancing the high-quality development of the digital economy.
Digital technology within the new economic landscape faces severe constraints from issues such as deglobalization, unilateralism, and technological nationalism, which significantly hinder global digital technology transfer [17,18]. International digital technology transfer now encounters multiple barriers. As a major player in digital technology, China must activate its domestic economic circulation and deepen cross-regional digital technology transfer within the country. This represents a crucial response to evolving international conditions and a forward-looking strategy to solidify the foundation of China’s digital economy and enhance its independent innovation capabilities. Therefore, how to strengthen China’s own digital technology development to foster an efficient and collaborative domestic technology transfer system has become a critical research topic. By systematizing and theorizing the successful experiences and solutions China has developed in digital technology application, governance, and cross-regional transfer, it can contribute “Chinese wisdom” to address the technology transfer challenges currently faced by developing countries worldwide
2. Theoretical Foundations and Research Hypotheses
In technology transfer activities, innovation entities promote the cross-regional transfer of patented technologies by exchanging and sharing technical knowledge [19]. Technology transfer refers to the systematic movement of technological elements across organisations and regions under institutionalized sharing mechanisms, with the core objective of transforming inventions into products and services that benefit society, thereby narrowing the gap between technological advancement and economic growth [20].ss As the core spatial carriers in global technological competition[21], cities serve not only as vital venues for technology transfer but also as strategic frontiers where nations vie for dominance in the new wave of technological revolution and industrial transformation. Within urban innovation systems, technology transfer exhibits spatial imbalance, primarily manifested as the gradient transfer of technological elements from cities with high innovation potential to those with lower potential through knowledge spillover effects [22]. For technology recipients, technology transfer effectively reduces knowledge complexity, enabling integration and innovation upon existing knowledge bases to accelerate technological catch-up. For technology exporters, it optimizes spatial innovation layouts and enhances overall competitiveness. Notably, the characteristics of digital technologies help overcome geographical and interpersonal constraints in traditional technology transfer, facilitating the transmission of tacit knowledge and laying a more solid foundation for re-innovation by recipients. Therefore, this paper proposes the following hypothesis:
Hypothesis 1: Urban digital technology transfer contributes to enhancing a city’s digital technological innovation capabilities.
Digital technologies, exemplified by cloud computing, the Internet of Things, and artificial intelligence, are extensively applied in R&D, manufacturing, and other processes. They effectively overcome issues such as information fragmentation, compartmentalization, and asymmetry, improve the efficiency of supply-demand matching, and facilitate the adequate flow of production factors among various innovation entities [23]. Due to differences in geographical location and resource endowments, the impact of digital technology transfer on a city’s digital technological innovation varies. On the one hand, enterprises serve as the primary agents of technology transfer in China. By leveraging emerging internet technologies to deepen industrial digital transformation, they generate multiplier effects for economic growth and comprehensively elevate total factor productivity. Digital transformation has become a critical lever for enterprises transitioning from scale expansion to quality enhancement [24]. However, China’s high-tech enterprises exhibit an uneven distribution, with a heavy concentration in economically robust, transportation-accessible regions with vast market potential—such as the eastern coastal areas, inland provincial capitals, and municipalities directly under the central government[22]. On the other hand, cities with high innovation levels control the diffusion and application rights of innovation resources within inter-city digital technology transfer networks. As their innovation capabilities continue to rise, the “disruptive” technologies available through local technology transfer become increasingly limited, hindering further advancement in innovation. In contrast, cities with lower innovation levels face no resource redundancy or overload issues that would impede their capacity to enhance innovation through technology transfer. Thus, we propose the following hypotheses:
Hypothesis 2: The impact of inter-city digital technology transfer on digital technology innovation capabilities exhibits regional heterogeneity across cities.
Hypothesis 3: Inter-city technology transfer exerts a more substantial promotional effect on a city’s digital technology innovation capabilities than intra-city digital technology transfer.
3. Research Methods and Data Sources
3.1. Date Source
Data was sourced from the China National Intellectual Property Administration (CNIPA) through web scraping, capturing patent transfer data from 2000 to 2024. Retrieved data elements include: patent title, patent IPC classification number, applicant’s address before transfer, applicant’s address after transfer, postal code, legal status, registration effective date, and other relevant metrics. During data processing and analysis, multiple patents were identified with legal statuses involving transfers to numerous assignees. Following established practices, the format P1→P2P3 was restructured into P1→P2 and P1→P3 (where P2 and P3 represent the transferring and receiving entities, respectively, and → indicates the transfer direction).
Python was used for data cleansing, filtering entries by registration effective date and IPC patent number to extract patent transfer data from 2020 to 2024. By comparing whether the origin and destination locations were identical, the patent data were further categorized into intra-city technology transfer and inter-city technology transfer. Inter-city technology transfer occurs when a patent originates from and is assigned to different cities; intra-city technology transfer occurs when a patent originates from and is assigned to the same city.
3.1.1. Data Recognition
The “Classification System for Key Digital Technology Patents (2023)” compiled by the state in 2023 encompasses seven patent classification systems: artificial intelligence, high-end chips, quantum information, the Internet of Things, blockchain, the Industrial Internet, and the metaverse. It extracts the relevant IPC patent numbers, including G06F3*, G06F8*, G06F9*, G06F11*, G06F12*, G06F13*, G06F15*, G06F16*, G06F17*, G06F21*, and G06F30*. The asterisk (*) denotes inclusion of all classification codes at this level and below within the International Patent Classification system.
3.1.2. Phases of Digital Technology Transfer
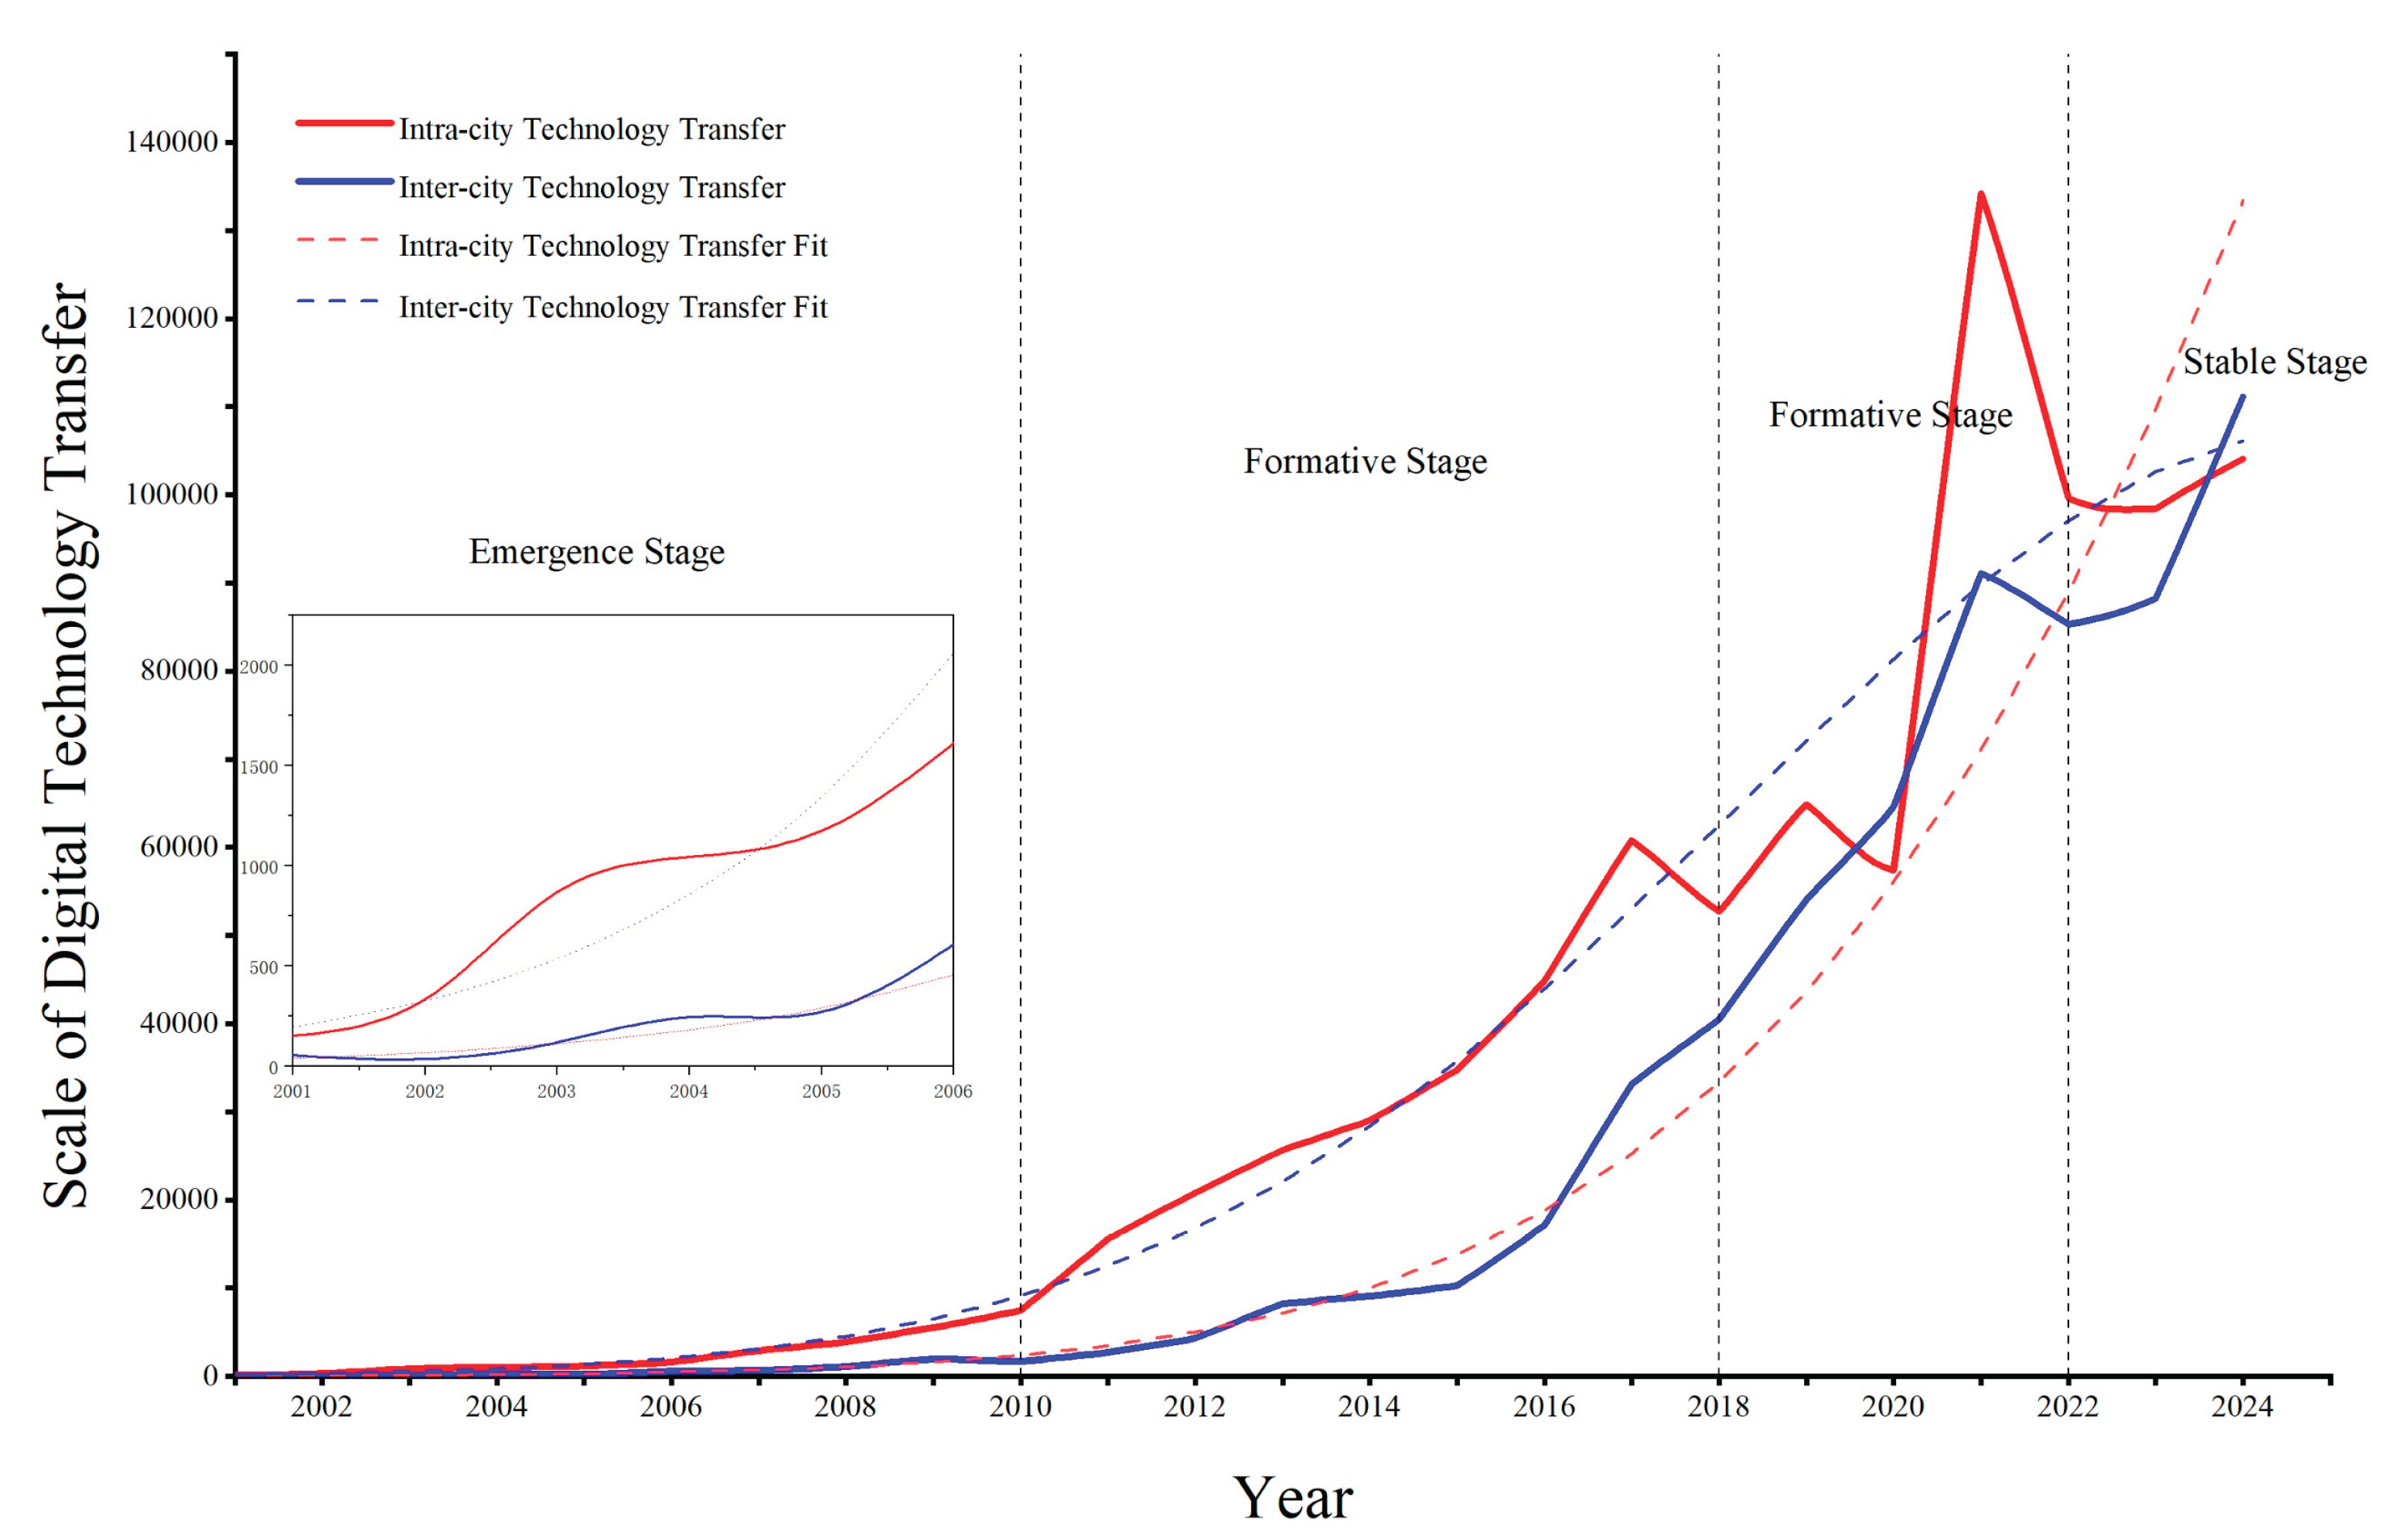
National policy incentives are closely linked to technology transfer. Since China acceded to the WTO in 2001, the opening of foreign markets and domestic independent innovation have synergized, driving a rapid surge in patent numbers. Based on the Implementation Plan for the National Technology Transfer Promotion Action, the Law of the People’s Republic of China on the Transformation of Scientific and Technological Achievements, the National Technology Transfer System Construction Plan, the Science and Technology Progress Law of the People’s Republic of China, the Notice on the National Technology Transfer System Construction Plan, the Statistical Classification of the Digital Economy and Its Core Industries (2021), and the Key Digital Technology Patent Classification System (2023), China’s digital technology transfer is categorized into three phases: the embryonic stage (2000-2010), Formative Stage (2011–2018), Growth Stage (2019–2021), and Stabilization Stage (2022–2024).
Figure 1.
Scale of Technology Transfer, 2000–2024.
3.2. Variable Specification and Econometric Model Design
3.2.1. Variable Declaration
(1) Dependent Variable: Digital Patents: This study measures digital technological innovation capacity using the number of digital technology patents granted at the city level. Compared to the comprehensive concept of “urban innovation capacity,” existing multi-indicator systems often suffer from double-counting and difficulties in aligning measurement criteria, making it challenging to accurately reflect all levels [25]. In the digital economy era, digital technologies—represented by artificial intelligence, blockchain, cloud computing, and big data—continue to push beyond the boundaries of traditional innovation, accelerating the intelligent transformation of cities. These technologies deeply integrate the real economy with the digital economy, becoming the core force driving China’s high-quality economic development. Patents are the direct result of innovation and a significant outcome of innovative output. As the earliest and most widely used data in the field of scientific innovation, patents were ultimately selected. The city-level digital economy patent authorization data from the CNRDS database covering 2001–2023 was chosen to represent the level of urban digital innovation.
(2) Core Explanatory Variables: This study selects the sum of patents involving both intra-city and inter-city technology transfers as the independent variable. Intra-city technology transfer occurs when the patent holder, before and after the transfer, resides in the same city; inter-city technology transfer occurs when the patent holder, before and after the transfer, resides in different cities.
3.2.2. Model Construction
The dependent variable is lagged. Let denote the number of digital patent grants for an individual in year , ultimately expressed in tens of thousands. (intra-city technology transfer)、 (inter-city technology transfer) represents a series of control variables, as shown in Table 1, and denotes relevant fixed effects, is the constant term, and are the fitting coefficients, and is the random disturbance term.
4. Digital Technology Transfer Across Different Geographical Scales
4.1. Spatio-Temporal Evolution of Intercity Digital Technology Transfer
As shown in Table 1, this paper employs Gephi software to measure the various stages of the technology transfer network. Overall, from 2000 to 2024, China’s inter-city digital technology transfer level has significantly improved, laying a solid foundation for the further development of digital technologies. The network visualization reveals a transformation from a sparse network to a more complex and dense one. Network density increased markedly from 0.011 to 0.255, reflecting intensified interregional technological exchanges. The average clustering coefficient rose from 0.573 to 0.693, indicating pronounced regional clustering characteristics within the technology transfer network and tighter connections between nodes. Both the average degree and average weighted degree have increased substantially. The average degree rose from 3.957 to 83.575, while the average weighted degree increased from 35.473 to 1518.054. This indicates a continuous growth in the number of nodes within the digital technology transfer network, alongside a significant improvement in the quality of technological interactions between nodes [25]. Inter-city connectivity has progressively become more comprehensive and deepened, while simultaneously exhibiting a certain degree of “core-periphery” differentiation.

Table 2.
Structural Characteristics of Intercity Digital Technology Transfer Networks, 2000–2024.
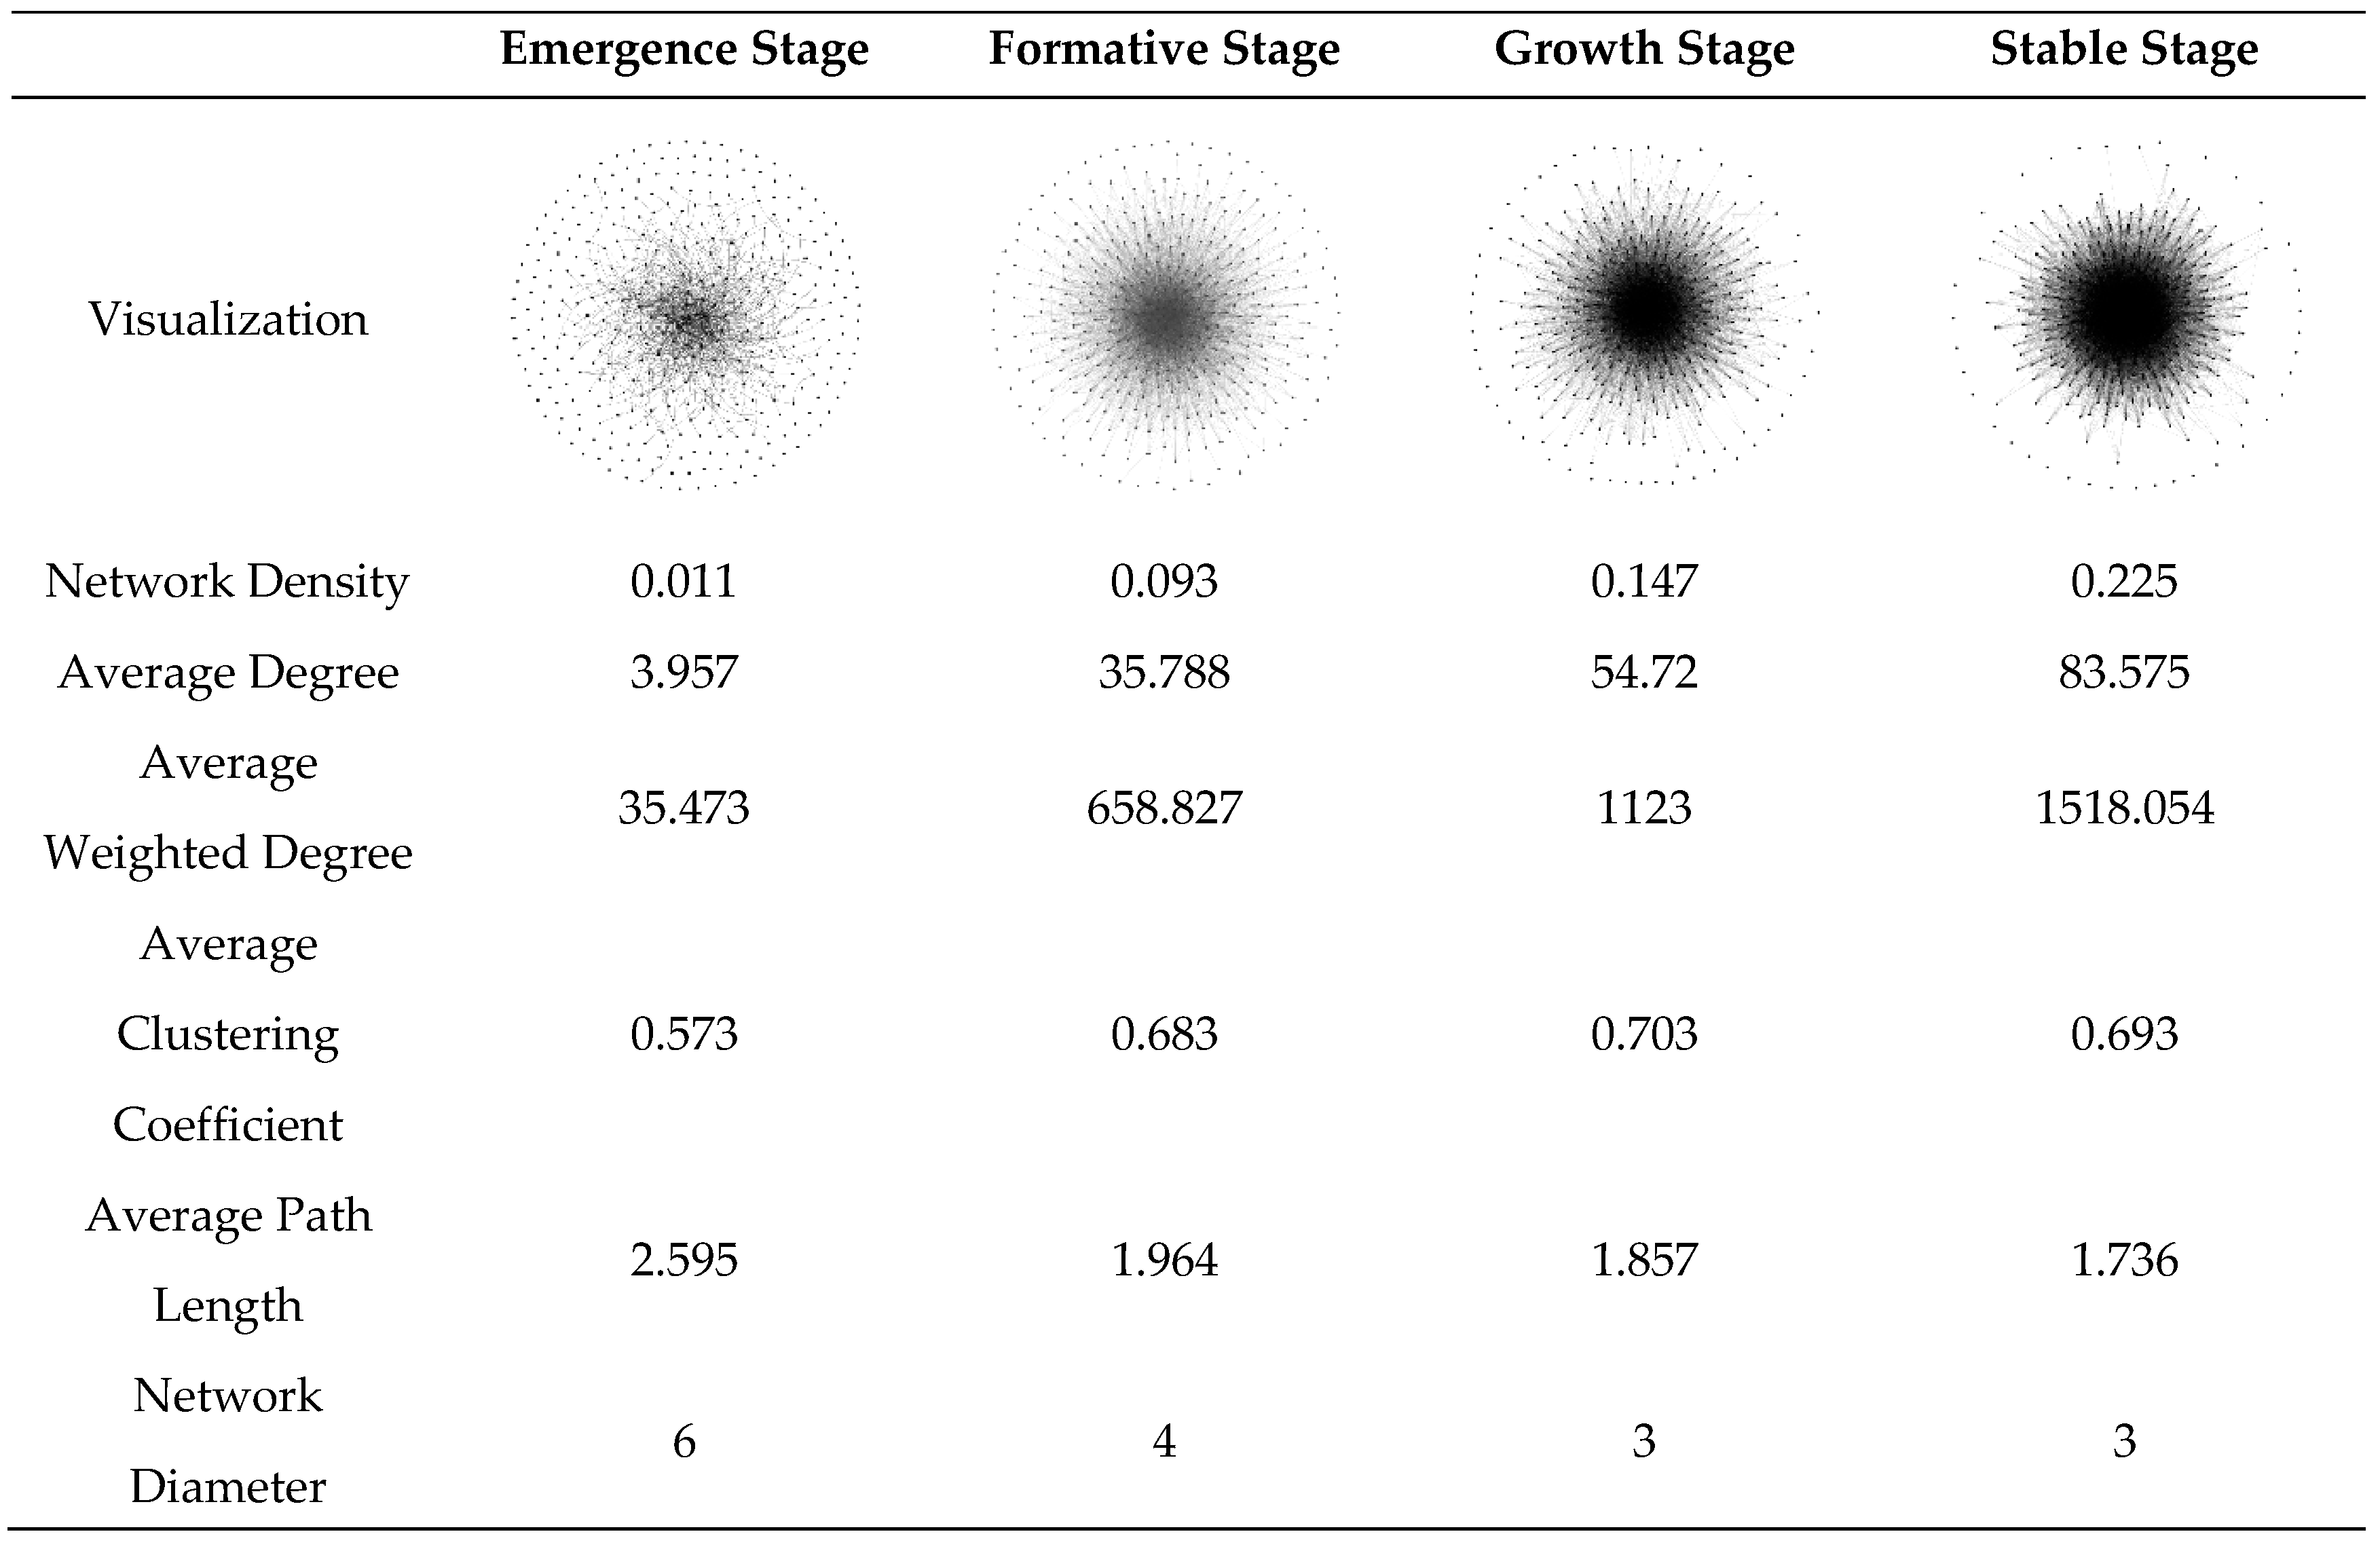 |
In the initial stage, metrics such as the number of edges, network density, average degree, and network diameter remained at relatively low levels. The overall connectivity for inter-city digital technology transfer was weak, with most cities facing the dilemma of either “no transfer” or “difficult transfer” of digital technologies. During the formation period, connectivity for inter-city digital technology transfer improved, with significant increases observed in metrics like the number of edges, network density, average degree, and diameter. During the growth phase, the network structure continues to deepen. As the scale of technology transfer continues to expand, the average path length decreases to 1.857. This indicates that with the increase in cities connected by high-speed rail and the advancement of internet technology, an average of approximately 1.8 steps is required to achieve digital technology transfer interactions between cities. Moreover, the longest path does not exceed 3.000, consistent with the “small-world” phenomenon. During the growth phase, regional clustering in digital technology transfer between cities moderated, decreasing from 0.703 in 2019-2022 (growth phase) to 0.693. This indicates that in the new phase, digital transfers between cities are no longer confined to urban clusters like “Beijing-Tianjin-Hebei,” “Yangtze River Delta,” “Pearl River Delta,” and “Guangdong-Hong Kong-Macao.” Increasingly, cities outside these clusters are participating in digital technology transfer activities.
PageRank indices and proximity centrality were calculated in Gephi for the Emergence, Formation, Growth, and Stabilization phases to observe changes in the status and functions of nodes within the digital technology transfer network. Due to the large number of cities, the top 20 cities are listed in Table 3. The PageRank index provides a more comprehensive measure of the centrality of individual nodes within China’s urban digital technology transfer network [26]. Closeness centrality indicates a node’s ability to avoid being controlled by other nodes[27]. Nodes with high closeness centrality can effectively acquire and disseminate information rapidly throughout the network. Based on node rankings by PageRank and proximity centrality, Beijing, Shenzhen, Shanghai, and Guangzhou consistently ranked among the top cities from 2001 to 2024. These cities serve as the core of the digital technology transfer network and are significant sources of digital technology. Overall, the “status” of highly influential city nodes within the digital technology transfer network remained essentially unchanged across different periods. Leveraging their robust research capabilities, economic strength, and abundant talent pools, the “Beijing-Shanghai-Guangzhou-Shenzhen” quartet exerts significant radiating and leading influence within the established diamond-shaped network structure of technology transfer. With the rapid advancement of digital technologies, other cities have progressively enhanced their digital infrastructure, leading to the flow of specific digital technologies toward industrial powerhouses like Suzhou, Xi’an, and Hefei. Nevertheless, the eastern coastal regions, characterized by higher levels of industrial development, remain the core area within the digital technology transfer network.
From 2000 to 2024, as shown in Figure 2, China’s inter-city technology transfer network has evolved from a triangular pattern to a diamond-shaped structure as the number of participating cities in inter-city digital technology transfer activities continues to grow. The overall digital technology transfer network exhibits an “easternly dense, westernly sparse” pattern, which has become increasingly stable and consolidated. This has formed a diamond-shaped network structure with core hubs in the Beijing-Tianjin-Hebei region, the Pearl River Delta, the Yangtze River Delta, the Chengdu-Chongqing region, and the middle and lower reaches of the Yangtze River. Following the introduction of the Digital China concept in 2015, accelerating the development of Digital China became a key national strategy, leading to exponential growth in digital technologies. From 2018 to 2024, the inter-city digital technology transfer network stabilized, forming a diamond-shaped structure radiating from core nodes, such as Beijing, Shanghai, Guangzhou, Shenzhen, Nanjing, Chengdu, Chongqing, and Wuhan, to surrounding and nationwide cities. The most significant digital technology transfer scale from 2000 to 2010 was Beijing → Shenzhen (749). By 2022–2024, the most significant cross-city digital technology transfer remained Beijing → Shenzhen, reaching 5,143 items.
4.2. Spatial-Temporal Evolution of Technology Transfer in Urban Areas
Between 2000 and 2004, cities experiencing large-scale intra-city digital technology transfers were highly concentrated in eastern coastal urban clusters, including Beijing-Tianjin-Hebei, the Yangtze River Delta, Chengdu-Chongqing, and the Pearl River Delta. Inland regions saw transfer activities primarily centered in provincial capitals, such as Zhengzhou, Hefei, and Jinan. From 2000 to 2010, 25,081 digital technology patents underwent ownership transfers across 217 cities. While eastern coastal cities exhibited substantial intra-city transfers, cities in central, western, and northeastern regions also demonstrated significant intra-city transfer volumes. For instance, Shenyang and Jinan recorded 507 and 214 intra-city digital technology transfers, respectively, during this period. From a city-wide perspective, 54 cities recorded over 50 digital technology transfers during this period. Beijing, Shenzhen, Shanghai, Hangzhou, and Guangzhou ranked 1st to 5th nationally with 5,438, 4,083, 3,316, 849, and 763 transfers, respectively. From 2011 to 2017, intra-city digital technology transfers increased to 284,031 cases, though their share of total transfers declined to 69%. The number of cities engaging in intra-city digital technology transfers rose to 311, with 59 cities exceeding 500 cases each. Among these, Beijing, Shenzhen, and Guangzhou each surpassed 10,000 intra-city digital technology transfers. During the 2019–2021 phase, the proportion of intra-city digital technology transfers further declined to 55%. A total of 315 cities engaged in intra-city digital transfers during this period, with provincial capitals and municipalities directly under the central government conducting more such activities internally. Beijing, Shanghai, Shenzhen, and Guangzhou continued to maintain their leading positions. Between 2022 and 2024, Beijing, Shenzhen, and Guangzhou all experienced a decline in the scale of intra-city digital technology transfers compared to the period from 2019 to 2021. Conversely, Shanghai and Hangzhou, both in the top five, exhibited a significant upward trend, indicating a continuous expansion in the scale of digital transfers. The proportion of intra-city digital technology transfers dropped to 52%, with a total of 326 cities participating in such activities. Overall, while the scale of digital technology transfers within core cities decreased, a greater number of cities engaged in intra-city digital technology transfer activities.
Table 4.
Ranking of Digital Technology Transfer Hubs Within the City.
| Emergence Stage | Formative Stage | Growth Stage | Stable Stage | |
| 1 | Beijing | Beijing | Beijing | Beijing |
| 2 | Shenzhen | Shenzhen | Shenzhen | Shenzhen |
| 3 | Shanghai | Shanghai | Guangzhou | Shanghai |
| 4 | Hangzhou | Guangzhou | Shanghai | Guangzhou |
| 5 | Guangzhou | Hangzhou | Suzhou | Hangzhou |
| 6 | Nanjing | Suzhou | Hangzhou | Suzhou |
| 7 | Suzhou | Nanjing | Nanjing | Nanjing |
| 8 | Shenyang | Chengdu | Dongguan | Wuhan |
| 9 | Wuhan | Dongguan | Jinan | Chengdu |
| 10 | Tianjin | Wuhan | Wuhan | Chongqing |
| 11 | Chongqing | Wuxi | Chengdu | Xi’an |
| 12 | Chengdu | Tianjin | Chongqing | Tianjin |
| 13 | Dongguan | Zhengzhou | Qingdao | Jinan |
| 14 | Xi’an | Chongqing | Xi’an | Hefei |
| 15 | Ningbo | Ningbo | Tianjin | Qingdao |
| 16 | Xiamen | Changzhou | Wuxi | Dongguan |
| 17 | Qingdao | Foshan | Changsha | Wuxi |
| 18 | Jiaxing | Qingdao | Nanchang | Changsha |
| 19 | Wuxi | Xi’an | Harbin | Changzhou |
| 20 | Jinan | Jinan | Hefei | Xuzhou |
5. The Impact of Digital Technology Transfer on Urban Digital Innovation Capabilities
5.1. Baseline Regression
Columns (1) and (2) respectively report the regression results with urban digital technology innovation capacity (number of authorized patents in the digital economy) as the dependent variable. Column (1) uses intra-city digital technology transfer as the core explanatory variable, while Column (2) uses inter-city digital technology transfer as the core explanatory variable. The regression results in Table 5 reveal that the estimated coefficients for the core explanatory variables are positive and statistically significant at the 1% level. This indicates that both intra-city and inter-city digital technology transfer significantly enhance a city’s digital technology innovation capacity, thereby validating Hypothesis 1. Regarding the regression coefficients, the estimated coefficient for inter-city digital technology transfer is considerably larger than that for intra-city digital technology transfer. Compared to intra-city digital technology transfer, inter-city digital technology transfer has a more pronounced effect on enhancing a city’s digital innovation capability, thereby validating Hypothesis 3.
5.2. Stability Test
Table 6 presents the robustness test results for the number of digital patent grants, lagged by one and two periods, as the dependent variable. The regression structure indicates that inter-city digital technology transfer exerts a more substantial promotional effect on a city’s digital technology innovation capacity than intra-city digital technology transfer. Consistent with the benchmark regression results, this further substantiates the reliability of the study’s conclusions. Given the unique characteristics of municipalities directly under the central government and the significant disparity in digital technology innovation capabilities between cities like Beijing, Shanghai, Guangzhou, and Shenzhen and other cities, this study conducted a regression analysis after excluding specific samples to test the robustness of the conclusions. The results are presented in Table 4, Columns (1) and (2): After excluding municipalities directly under the central government, both intra-city digital technology transfer and inter-city technology transfer exert a significant positive impact on a city’s digital technology innovation capability, confirming Hypothesis 1. The potential mechanism lies in the fact that cities with relatively lagging overall development, under pressure to achieve high-quality growth, enhance their innovation capabilities through cross-regional flows of technological factors. This enables “technological catch-up,” becoming a key pathway to boost digital technological innovation capabilities and subsequently drive high-quality development of the digital economy.
The regression coefficient for inter-city digital technology transfer is higher than that for intra-city transfer, confirming Hypothesis 3. This is attributed to the “combination-based” nature of digital technology innovation, where technological interactions between heterogeneous cities facilitate the cross-recombination of innovation resources. Concurrently, knowledge gradients and disparities in infrastructure and talent endowments between cities amplify knowledge exchange and spillover effects, thereby further catalyzing digital technology innovation.
Table 6 presents the robustness test results for the number of digital patent grants, lagged by one and two periods, as the dependent variable. The regression structure indicates that inter-city digital technology transfer exerts a more substantial promotional effect on a city’s digital technology innovation capacity than intra-city digital technology transfer. Consistent with the benchmark regression results, this further substantiates the reliability of the study’s conclusions
5.3. Heterogeneity Test
Resource availability and policy regulations, such as limitations in R&D talent, funding, and institutional support, constrain the effectiveness of technology transfer. This results in varying impacts of technology transfer on urban innovation capacity across different administrative tiers of cities[12]. Drawing on relevant research, cities are categorized into higher-tier cities (including municipalities directly under the central government, sub-provincial cities, and provincial capitals) and lower-tier cities. As shown in Table 7, the regression coefficients for both high-level and low-level cities are positive and statistically significant at the 1% level. However, the coefficient for low-level cities is higher than that for high-level cities, indicating that the impact of digital technology transfer on urban digital technology innovation capabilities exhibits heterogeneity based on administrative level, thus supporting Hypothesis 2. In terms of regression coefficients, lower-tier cities exhibit significantly higher coefficients than higher-tier cities. This stems from higher-tier cities generally possessing more advanced industrial foundations, more robust technological infrastructure, higher levels of informatization, and denser concentrations of universities and research institutions, resulting in higher overall digital technology innovation levels and stronger innovation capabilities. To further elevate their digital technology innovation capabilities, cities require the inflow of “disruptive” technologies. Given the limited information and resources available locally, they should actively engage in digital technology interactions with internationally renowned innovation hubs, such as those in New York and Tokyo.
6. Conclusions and Discussion
This paper utilizes IPC patent numbers referenced in the “Classification System for Key Digital Technology Patents (2023)” to screen data, constructing a digital technology transfer network spanning 2000–2024. It conducts an in-depth exploration of the evolutionary characteristics of this digital technology transfer network. Due to data availability constraints, the CNRDS database was selected to obtain the number of authorized digital economy inventions from 2001 to 2023, which represents cities’ digital technology innovation capabilities. This study investigates whether digital technology transfer can effectively enhance cities’ digital technology innovation capabilities. The main conclusions are as follows:
Between 2000 and 2024, China’s digital technology transfer experienced rapid development. Key characteristics include a continuous rise in the share of inter-city technology transfer. In contrast, the intra-city transfer share declined steadily, yet still accounted for 50% of total digital technology transfer. Evolutionary patterns are summarised across inter-city and intra-city dimensions:
First, inter-city digital technology transfer features:(1) The inter-city digital technology transfer network has become increasingly dense, with transfer efficiency continuously improving and the “distance” of digital technology interactions between cities steadily decreasing. (2) China’s inter-city technology transfer network has formed a diamond-shaped structure centered on core hubs in the Beijing-Tianjin-Hebei region, Pearl River Delta, Yangtze River Delta, Chengdu-Chongqing region, and middle-lower Yangtze River urban areas. (3) The number of city nodes participating in inter-city digital technology transfer continues to increase.
Second, characteristics of intra-city digital technology transfer: (1) Large-scale intra-city digital technology transfer is concentrated in eastern coastal city clusters, provincial capitals in inland regions, and municipalities directly under the central government. (2) Cities like Beijing, Shanghai, and Shenzhen, which previously exhibited large-scale intra-city digital technology transfer, remain among the top cities for intra-city technology transfer nationwide. However, their scale has decreased compared to the past. (3) A greater number of cities are engaging in intra-city digital technology transfer.
Third, based on demonstrating the importance of digital technology transfer for urban digital innovation, the following conclusions are drawn: (1) Digital technology transfer significantly enhances a city’s digital technology innovation capacity. (2) Inter-city digital technology transfer has a greater promotional effect than intra-city digital technology transfer. (3) The impact of digital technology transfer on urban innovation development is influenced by factors such as regional policies, leading to heterogeneity in cities’ digital technology innovation capabilities.
Based on these findings, the following recommendations are proposed: (1) Eastern China, as a key source and absorber of digital technologies, should leverage its geographical and innovation clustering advantages to organize local high-tech enterprises in digital innovation actively. (2) At the inter-city level—the hub for digital innovation generation and flow in China—efforts to strengthen “digital city” development should continue to enhance regional digital innovation capabilities. (3) To address market failures in technological innovation within underdeveloped regions, governments must establish effective corrective mechanisms. On the one hand, they should adjust distortions in innovation caused by overly stringent intellectual property protection. On the other hand, incentive policy design should fully incorporate constraints such as environmental regulations. By leveraging the complementary effects of institutional frameworks, a systematic institutional support system should be established to efficiently incentivize digital technology innovation.
Author Contributions
Conceptualisation: Haining Wang; Data curation: Wanglai Cui; Formal analysis: Haining Wang; Funding acquisition: Wanglai Cui ;.
Funding
Wanglai Cui’s report was supported by the Major Project of the National Social Science Foundation (22&ZD152).
Institutional Review Board Statement
Not applicable.
Data Availability Statement
The dataset and Stata code used in this study are available from the corresponding author on request.
Conflicts of Interest
The authors declare that they have no conflicts of interest.
References
- Schwab, K. 8. The Fourth Industrial Revolution-What It Means and How to Respond. Handbook of Research on Strategic Leadership in the Fourth Industrial Revolution 2024, 29.
- Chui, M.; Issler, M.; Roberts, R.; Yee, L. Technology trends outlook 2023. 2023.
- Gal, P.; Nicoletti, G.; von Rüden, C.; Sorbe, S.; Renault, T. Digitalization and productivity: in search of the holy grail-firm-level empirical evidence from European countries. International Productivity Monitor 2019, 37, 39-71.
- Fritsch, M.; Wyrwich, M. Is innovation (increasingly) concentrated in large cities? An international comparison. Research Policy 2021, 50, 104237.
- Bevilacqua, C.; Pizzimenti, P.; Ou, Y. Cities in transition and urban innovation ecosystems: Place and innovation dynamics in the case of Boston and Cambridge (USA). Sustainability 2023, 15, 13346.
- Al-Omoush, K.S.; Ribeiro-Navarrete, S.; Lassala, C.; Skare, M. Networking and knowledge creation: Social capital and collaborative innovation in responding to the COVID-19 crisis. Journal of Innovation & Knowledge 2022, 7, 100181.
- Argote, L.; Guo, J.; Park, S.-S.; Hahl, O. The mechanisms and components of knowledge transfer: The virtual special issue on knowledge transfer within organizations. Organisation Science 2022, 33, 1232-1249.
- Ezenwa, M.O.; Smith, T.B.; Richey, J.; Smith, U.D.; Stern, M.C.; Reams, R.; Wilkie, D.J. Social network analysis of the CaRE2 health equity center: Team science in full display. Clinical and Translational Science 2024, 17, e13747.
- Li, J.; Wu, X. Research on the impact of government R&D funding on regional innovation quality: analysis of the spatial Durbin model based on 283 cities in China. Complexity 2021, 2021, 2217588.
- Li, L.; Li, M.; Ma, S.; Zheng, Y.; Pan, C. Does the construction of innovative cities promote urban green innovation? Journal of environmental management 2022, 318, 115605.
- Cao, J.; Law, S.H.; Samad, A.R.B.A.; Mohamad, W.N.B.W.; Wang, J.; Yang, X. Effect of financial development and technological innovation on green growth—analysis based on spatial Durbin model. Journal of Cleaner Production 2022, 365, 132865.
- Gao, K.; Yuan, Y. Government intervention, spillover effect and urban innovation performance: Empirical evidence from national innovative city pilot policy in China. Technology in Society 2022, 70, 102035.
- Liang, X.; Hidalgo, C.A.; Balland, P.-A.; Zheng, S.; Wang, J. Intercity connectivity and urban innovation. Computers, Environment and Urban Systems 2024, 109, 102092.
- Fan, F.; Wen, Z.; Shao, X.; Zhang, H.; Yang, B. Do Technology Transfer Networks Impact Urban Innovation Capacity? Evidence From Chinese Cities. International Regional Science Review 2024, 01600176241283897.
- Cai, H.; Feng, Z.; Zhou, W.; Chen, J.; Chen, Z. Understanding the spatial polarization pattern of technology transfer network in the Guangdong–Hong Kong–Macao Greater Bay area. Growth and Change 2023, 54, 4-25.
- Wei, L.; Zeng, B. Urban technology transfer, spatial spillover effects, and carbon emissions in China. Sustainability 2024, 16, 9662.
- Capri, A. Techno-nationalism via semiconductors. Hinrich Foundation, June 2021.
- Edler, J.; Blind, K.; Kroll, H.; Schubert, T. Technology sovereignty as an emerging frame for innovation policy. Defining rationales, ends and means. Research Policy 2023, 52, 104765.
- Weng, Z.; Fan, F.; Yang, B.; Zhang, H. Regional differences and drivers of patent transfer-in between Chinese cities: a city absorptive capacity perspective. Technology Analysis & Strategic Management 2024, 36, 4113-4127.
- Compagnucci, L.; Spigarelli, F. Improving knowledge transfer and innovation services: A roadmap for Knowledge Transfer Offices. Journal of Innovation & Knowledge 2024, 9, 100577.
- Wen, Z.; Shao, X. Do Spatial Spillovers of Technology Transfer Networks Impact Urban Innovation Capacity? Evidence from Chinese Cities. Regional Science and Environmental Economics 2025, 2, 12.
- Zhao, D.; Tang, C.; Huang, X. Innovation network, knowledge spillover, and urban green economic performance. Frontiers in Physics 2025, 13, 1537110.
- Lu, J.; Li, H. Can digital technology innovation promote total factor energy efficiency? Firm-level evidence from China. Energy 2024, 293, 130682.
- Wang, J.; Li, S.; Chen, J.; Ding, S. Study on the evolution of multi-level collaborative innovation networks in China’s cloud manufacturing industry. Technology Analysis & Strategic Management 2024, 1-22.
- Shi, X.; Sui, F.; Huang, X. Green technology transfer for firms in a multi-layer network perspective: The dual impact of knowledge resources and regional environment. Environmental Technology & Innovation 2025, 39, 104291.
- Wang, H.; Liu, P. Characteristics of China’s digital economy network and its impact on carbon emissions. Frontiers in Ecology and Evolution 2023, 11, 1243360.
- Huang, J.; Liu, K. The Spatial Correlation Network of China’s Urban Digital Economy and Its Formation Mechanism. Sustainability 2025, 17, 5382.
Figure 2.
Scale of Technology Transfer, 2000–2024.
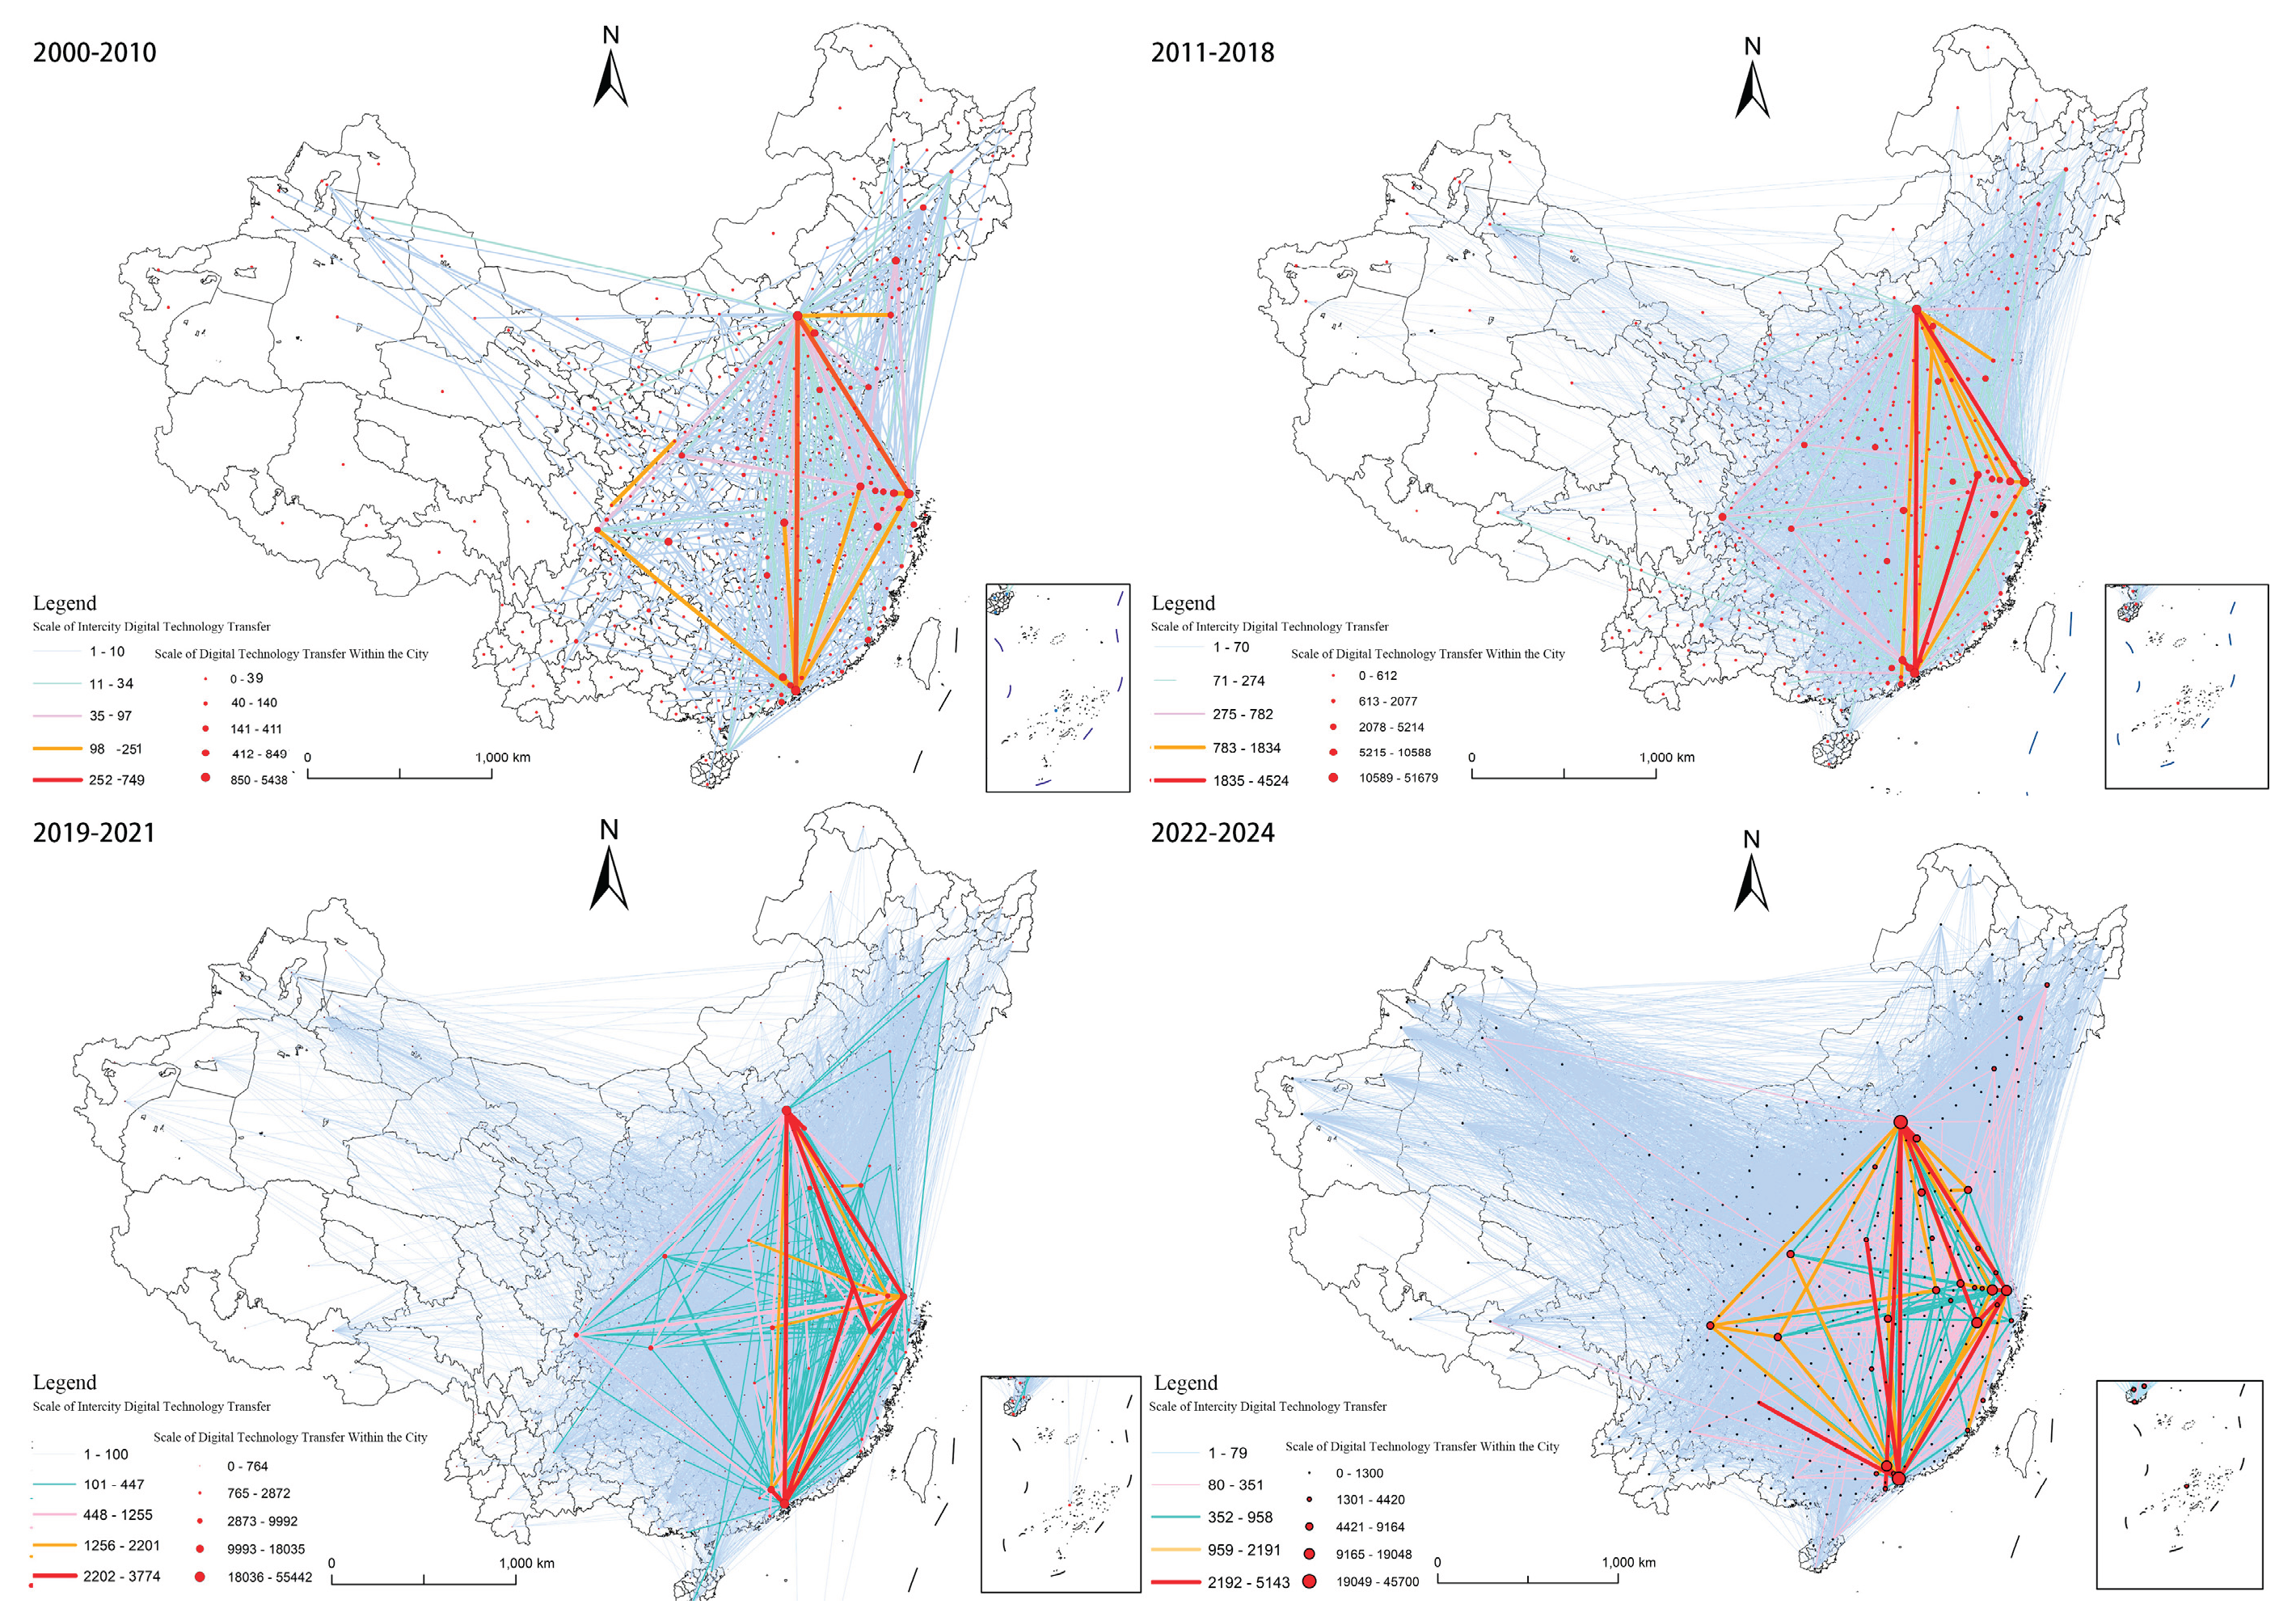
Table 1.
Description of Related Variables.
| Variable Name | Measurement | Data Source | |
| Dependent variable | Urban Digital Technology Innovation Capability | Digital Economy Patent Authorizations | CNRDS Database |
| Independent variables | Intercity Digital Technology Transfer | Transfer of Digital Patent Technologies Between Prefecture-Level Cities | State Intellectual Property Office |
| Digital Technology Transfer Within the City | Digital Patent Technology Transfer Within Prefecture-Level Cities | State Intellectual Property Office | |
| Control variables | Level of economic development | GDP per capita | City Statistical Yearbook |
| Human capital | Number of Full-time Faculty Members at Regular Higher Education Institutions | City Statistical Yearbook | |
| Foundations of Higher Education | Number of employees in comprehensive scientific research technical services | City Statistical Yearbook | |
| Scientific Expenditure | City Statistical Yearbook | ||
| Share of Fixed Asset Investment | Share of Fixed Asset Investment | City Statistical Yearbook | |
| Technology R&D | Research and Development Personnel | City Statistical Yearbook |
Table 3.
2000–2024 PageRank and Proximity Centrality.
| Emergence Stage | Formative Stage | Growth Stage | Stable Stage | |||||
| PageRank | Closeness | PageRank | Closeness | PageRank | Closeness | PageRank | Closeness | |
| 1 | Beijing | Beijing | Beijing | Beijing | Beijing | Beijing | Guangzhou | Guangzhou |
| 2 | Shenzhen | Shenzhen | Shenzhen | Shenzhen | Shenzhen | Shenzhen | Shenzhen | Shenzhen |
| 3 | Shanghai | Shanghai | Guangzhou | Guangzhou | Shanghai | Shanghai | Beijing | Beijing |
| 4 | Guangzhou | Guangzhou | Shanghai | Shanghai | Chengdu | Guangzhou | Shanghai | Shanghai |
| 5 | Hangzhou | Nanjing | Chengdu | Chengdu | Guangzhou | Chengdu | Suzhou | Suzhou |
| 6 | Chengdu | Hangzhou | Suzhou | Suzhou | Hangzhou | Hangzhou | Xi’an | Xi’an |
| 7 | Nanjing | Suzhou | Tianjin | Dongguan | Quanzhou | Shaoxing | Hefei | Hefei |
| 8 | Wuhan | Dongguan | Dongguan | Tianjin | Shaoxing | Suzhou | Nanjing | Chengdu |
| 9 | Suzhou | Chengdu | Quanzhou | Quanzhou | Suzhou | Quanzhou | Chengdu | Nanjing |
| 10 | Xi’an | Tianjin | Chongqing | Chongqing | Nanjing | Nanjing | Hangzhou | Hangzhou |
| 11 | Tianjin | Wuhan | Shaoxing | Shaoxing | Hefei | Hefei | Chongqing | Chongqing |
| 12 | Jinan | Wenzhou | Ningbo | Ningbo | Wuhan | Wenzhou | Wuhan | Wuhan |
| 13 | Dalian | Wuxi | Hangzhou | Hangzhou | Wenzhou | Wuhan | Tianjin | Tianjin |
| 14 | Dongguan | Changchun | Wuxi | Nanjing | Tianjin | Dongguan | Quanzhou | Jinan |
| 15 | Wenzhou | Xi’an | Nanjing | Wuxi | Xi’an | Xi’an | Jinan | Quanzhou |
| 16 | Wuxi | Shenyang | Nantong | Nantong | Dongguan | Tianjin | Wuxi | Wuxi |
| 17 | Shenyang | Changzhou | Taizhou | Taizhou | Taizhou | Taizhou | Harbin | Harbin |
| 18 | Changchun | Jinan | Wuhan | Foshan | Qingdao | Chongqing | Xuzhou | Dongguan |
| 19 | Changsha | Dalian | Foshan | Qingdao | Zhengzhou | Zhengzhou | Dongguan | Xuzhou |
| 20 | Ningbo | Ningbo | Qingdao | Wenzhou | Chongqing | Xuzhou | Foshan | Foshan |
Table 5.
Baseline regression results.
| Variable | (1) | (2) |
| Intra-city Technology Transfer | 1.234*** | |
| (3.33) | ||
| Inter-city Technology Transfer | 4.455*** | |
| (6.58) | ||
| Time Fixed | Yes | Yes |
| City Fixed | Yes | Yes |
| Sample Size | 6153 | 6153 |
| R2 | 0.8270 | 0.8760 |
Table 6.
Robustness Test Results.
| Exclude certain samples | One-period Lag | Two-period Lag | ||||
| Variable | (1) | (2) | (3) | (4) | (5) | (6) |
| Intra-city Technology Transfer | 3.859*** | 1.336* | 1.074* | |||
| (6.58) | (2.05) | (2.08) | ||||
| Inter-city Technology Transfer | 4.739*** | 4.455*** | 3.823*** | |||
| (8.35) | (6.58) | (7.76) | ||||
| Time Fixed | Yes | Yes | Yes | Yes | Yes | Yes |
| City Fixed | Yes | Yes | Yes | Yes | Yes | Yes |
| Sample Size | 6069 | 6069 | 6446 | 6446 | 6153 | 6153 |
| 0.7780 | 0.7793 | 0.7255 | 0.8132 | 0.6778 | 0.7708 | |
Table 7.
Results of the Regional Heterogeneity Test.
| High Administrative Level | Low Administrative Level | |||
| Variable | (1) | (2) | (3) | (4) |
| Intra-city Technology Transfer | 1.258*** | 4.036*** | ||
| (3.50) | (3.73) | |||
| Inter-city Technology Transfer | 4.346*** | 5.835*** | ||
| (5.17) | (6.58) | |||
| Time Fixed | Yes | Yes | Yes | Yes |
| City Fixed | Yes | Yes | Yes | Yes |
| Sample Size | 756 | 756 | 5397 | 5397 |
| R2 | 0.8341 | 0.8846 | 0.7121 | 0.7217 |
Disclaimer/Publisher’s Note: The statements, opinions and data contained in all publications are solely those of the individual author(s) and contributor(s) and not of MDPI and/or the editor(s). MDPI and/or the editor(s) disclaim responsibility for any injury to people or property resulting from any ideas, methods, instructions or products referred to in the content. |
© 2025 by the authors. Licensee MDPI, Basel, Switzerland. This article is an open access article distributed under the terms and conditions of the Creative Commons Attribution (CC BY) license (http://creativecommons.org/licenses/by/4.0/).
Copyright: This open access article is published under a Creative Commons CC BY 4.0 license, which permit the free download, distribution, and reuse, provided that the author and preprint are cited in any reuse.


