
Submitted:
23 May 2024
Posted:
24 May 2024
You are already at the latest version
Abstract
This study presents an in-depth analysis of land use and land cover change on the Kerch Peninsula over a period spanning three decades. Utilizing convolutional neural networks alongside satellite imagery analysis, we have mapped and quantified the changes in land use and cover, revealing significant trends and transformations within the peninsula's landscape. The research aims to elucidate the interplay between anthropogenic activities, climatic variations, and policy interventions in shaping land cover dynamics, thereby providing insights into the environmental and socio-economic impacts of these changes. Our findings indicate a marked increase in urban expansion at the expense of natural ecosystems, including forests and wetlands, underscoring the urgent need for sustainable land management strategies. The study highlights the role of agricultural intensification and expansion in altering the peninsula's ecological balance and emphasizes the critical importance of integrating change analysis and prediction. By leveraging advanced remote sensing and GIS technologies, our analysis not only enhances the understanding of the complex dynamics driving land use and land cover change but also showcases the potential of predictive modeling in forecasting future land cover scenarios. The implications of this study extend beyond the Kerch Peninsula, offering valuable lessons for managing land use changes and conserving natural landscapes in similar regions globally.
Keywords:
land use and land cover change
; Kerch Peninsula
; convolutional neural networks
; satellite imagery
; urban expansion
; sustainable land management
1. Introduction
Understanding the dynamics of land use and land cover change (LULCC) is crucial for grasping the intricate relationship between human activities and environmental changes. This understanding not only illuminates the patterns and drivers behind changes in our landscapes and ecosystems but also underpins the development of sustainable land management, conservation strategies, and policy formulations necessary to navigate towards sustainable development [1]. The importance of LULCC lies in its capability to inform decision-making processes, offering insights into how to mitigate climate change impacts and promote environmental stewardship.
The study of LULCC models reveals their powerful role in explaining and predicting the interactions between human activities and environmental changes. These models, by delineating the causes and consequences of land cover dynamics, become indispensable tools for supporting better land management decisions [2]. Furthermore, in the context of urban development, LULCC modeling serves as a cornerstone in urban planning. It aids in integrating policy frameworks into the planning process, thereby facilitating sustainable urban expansion and management [3].
The advancements in remote sensing and GIS have significantly bolstered the assessment techniques for LULCC. These technologies offer enhanced accuracy and efficiency in monitoring land cover changes, thereby contributing to more effective environmental management practices [4]. Despite these advancements, implementing LULCC in models that contribute to climate change assessments presents challenges. These include the over-simplification of anthropogenic land-use activities and the pressing need for integrated modeling frameworks. Such frameworks are essential for a nuanced understanding of land-use climate interactions, which in turn, could enhance the efficacy of climate change mitigation and adaptation strategies [5].
In the comprehensive analysis presented in our previous work [6], we delved into the intricacies of LULCC on the Kerch Peninsula over the last three decades. Utilizing advanced satellite imagery and spatial modeling techniques, including Landsat 5, 7, and 8 data, we employed convolutional neural networks (CNN) to achieve enhanced classification accuracy of various LULCC classes. This methodological innovation allowed for a detailed examination of the region’s dynamic landscape transformations, revealing significant trends such as the notable increase in urbanized areas and the concurrent decline in natural ecosystems like forests and wetlands. These findings underscore the profound impact of sustained urban growth and agricultural expansion on the peninsula’s ecological fabric, necessitating informed land management and conservation strategies to mitigate these effects.
Expanding upon this foundational work, our objective now evolves to include not only a nuanced analysis of LULCC over different periods but also to incorporate change analysis and prediction. This progression aims to dissect the underlying environmental and socioeconomic drivers catalyzing these land cover changes. By integrating additional layers of analysis, we endeavor to construct a more holistic understanding of the forces shaping the Kerch Peninsula’s landscape.
The motivation behind broadening our research scope stems from the need to address the intricate web of factors influencing LULCC. It’s increasingly clear that changes in land use and cover are not merely the result of natural ecological processes but are deeply intertwined with human activities and climatic shifts. For instance, our analysis indicated that the area of croplands has fluctuated significantly over the years, influenced by political dynamics, climate change, and urban development. Similarly, grasslands and barren lands have shown variable trends, reflecting the impact of human activity and climatic factors on these ecosystems.
Incorporating change analysis and prediction into our research will allow us to identify potential future trends in LULCC on the Kerch Peninsula, informed by both past patterns and current drivers. This approach is essential for developing effective land management policies and conservation strategies that can adapt to changing environmental conditions and socioeconomic needs. By understanding the likely directions of future land cover changes, stakeholders can better prepare for and mitigate the adverse impacts of these transformations on the region’s ecological systems and human communities.
Our expanded research will employ a combination of quantitative methods, including advanced spatial modeling and predictive analytics, to analyze the interactions between environmental and socioeconomic drivers of LULCC. Through this comprehensive analysis, we aim to provide valuable insights into the sustainable planning and management of land resources on the Kerch Peninsula, contributing to the broader field of environmental science and policymaking. This endeavor not only builds upon our previous findings but also opens new avenues for understanding and addressing the complex challenges of land use and cover changes in a changing world.
The advancements in remote sensing and GIS have been pivotal in enhancing the study of LULCC, providing an array of tools and technologies to improve the accuracy, efficiency, and depth of analysis. These advancements are illustrated through a variety of examples and case studies that demonstrate their significant contributions to LULCC analysis.
Remote sensing technology has revolutionized the field of LULCC studies by providing valuable insights into environmental monitoring. The use of Landsat imagery has become increasingly popular due to its cost-effectiveness and availability. Piekkoontod [7] demonstrated the effectiveness of combining Landsat imagery with high-resolution imagery from unmanned aerial vehicles (UAVs) to classify LULCC classes with high accuracy. The integration of UAV data with Landsat imagery not only reduces costs but also provides immediate access to high-resolution data, making it a valuable tool for real-world applications. Li [8] proposed a hybrid approach that integrates Google Earth imagery with Landsat data to improve the accuracy of land cover mapping. By combining deep convolutional neural network-based classifiers with traditional machine learning classifiers, the study achieved a classification accuracy of 84.40%, surpassing previous state-of-the-art accuracy. This approach not only enhances the discrimination of land cover types but also reduces misclassifications between certain vegetation types and improves the identification of impervious areas. Moon [9] evaluated the quality of land surface phenology (LSP) information derived from PlanetScope imagery by comparing it with Harmonized Landsat 8 and Sentinel-2 imagery. The study found high temporal correlation and agreement between LSP metrics derived from different data sources, highlighting the potential of integrating features of datasets at different resolutions to produce more reliable land cover maps. This comparison provides valuable insights into the quality and character of LSP metrics derived from different sources. Overall, the integration of Landsat imagery with other high-resolution datasets and advanced algorithms has significantly enhanced the accuracy and reliability of LULCC studies, providing valuable insights into environmental monitoring and land cover mapping.
The use of tools such as the MOLUSCE plugin in QGIS has allowed researchers to analyze spatiotemporal changes and predict future land use patterns [10]. Previous studies have shown that modeling LULCC can provide valuable insights into the rate of change and essential components of land use and land cover [11]. Additionally, the integration of tools like MOLUSCE with other techniques such as SVM and Sentinel-2 imagery has enabled researchers to analyze the effects of LULCC on various phenomena like flood simulation [12]. The MOLUSCE plugin has been widely used in research to analyze and predict changes in land use and land cover. For example, a study on the Pakhal Lake area in Telangana utilized the MOLUSCE plugin to detect LULCC and predict future changes in the landscape [13]. Similarly, cellular automata-based artificial neural network model incorporated the MOLUSCE plugin to assess changes in various LULC classes over time [14]. Furthermore, the MOLUSCE plugin has been instrumental in monitoring and simulating landscape changes over long periods. Studies have shown that by using MOLUSCE in QGIS, researchers can model decadal LULCC patterns and understand the expansion and contraction of different land cover classes [15]. This tool has also been used for predicting LULCC along the Boteti-Thamalakane river system, highlighting the importance of understanding land use changes in specific regions [16].
Machine learning techniques, including artificial neural networks and deep learning, have shown potential in accelerating and advancing LULCC studies [17]. The use of deep learning in LULCC studies has been particularly highlighted in a study conducted in Adama District, Ethiopia, where deep learning was employed for the first time to analyze LULCC patterns [1]. Furthermore, machine learning algorithms such as random forests, support vector machines, and deep neural networks have been applied in numerous studies for LULC/LULCC classification, showcasing the effectiveness of these methods in analyzing land cover changes [18]. Additionally, the integration of machine learning models with remote sensing data, such as Landsat satellite images, has enabled the mapping and analysis of LULCC patterns in various regions [19]. Overall, the combination of machine learning techniques and remote sensing data has provided new evaluation tools for studying LULCC, allowing for the efficient analysis of large datasets and the extraction of valuable information on land cover changes.
The impact of different driver variables LULCC has been widely explored. These variables are integral to understanding the dynamics of LULCC as they provide insights into the biophysical and anthropogenic factors driving these changes. The rationale for selecting these variables in LULCC studies is grounded in their ability to indicate changes in vegetation cover, urbanization levels, moisture content, and climatic conditions, which are crucial for assessing environmental impacts and guiding sustainable land management practices. NDVI is widely used to assess vegetation health and changes. Studies have shown a negative correlation between NDVI and land surface temperature (LST), indicating that areas with dense vegetation tend to have lower temperatures, highlighting the importance of vegetation in regulating urban climates and mitigating the urban heat island effect [20]. SMI and NDWI are crucial for monitoring moisture availability and water bodies, respectively. These indices help in understanding the hydrological changes resulting from LULCC, such as the reduction of water bodies due to urban expansion, which can significantly affect local climates and biodiversity [21]. NDBI is a key indicator of urbanization and built-up areas. It has been positively correlated with increases in LST, demonstrating the role of urbanization in contributing to higher temperatures and the urban heat island phenomenon [22]. Changes in species density directly reflect alterations in habitat quality and biodiversity due to LULCC. Studies leveraging remote sensing data have linked habitat fragmentation and loss with LULCC, emphasizing the need to incorporate biodiversity considerations in land use planning [23]. Population data are critical in assessing anthropogenic pressures on land resources. Rapid population growth often leads to increased demand for housing and agricultural land, driving LULCC and affecting environmental sustainability [24]. Climate variables such as air temperature and precipitation are both drivers and consequences of LULCC. Changes in land cover, such as deforestation and urbanization, can alter local climate patterns, leading to variations in temperature and precipitation, which in turn influence land cover states [25].
Integrating diverse datasets and predictive modeling in LULCC analysis is expected to make significant contributions to our understanding and management of land cover changes, especially in regions like the Kerch Peninsula. This integration allows for a comprehensive analysis that combines satellite imagery, climate data, population statistics, and ecological information to uncover the multifaceted drivers of land cover change. It moves beyond simply observing changes to understanding why these changes occur, considering economic, policy, demographic, and climatic influences.
The use of predictive modeling, informed by this rich dataset, enables researchers and planners to forecast future land cover scenarios. This forward-looking capability is crucial for planning sustainable development, implementing effective conservation strategies, and mitigating adverse impacts on the environment and local communities. By anticipating how different factors might shape the landscape, stakeholders can make informed decisions that balance development needs with environmental preservation.
Furthermore, this approach can reveal novel insights into the specific conditions and processes driving land cover changes in the Kerch Peninsula. It supports evidence-based planning by providing a detailed, data-driven foundation for decision-making. This not only aids in addressing current environmental and socio-economic challenges but also in preparing for future changes. Ultimately, the integration of diverse datasets and predictive modeling stands to significantly enhance our ability to manage land resources sustainably, protect biodiversity, and support the well-being of local communities in the Kerch Peninsula and beyond.
These driver variables are selected in LULCC studies due to their comprehensive representation of the ecological, hydrological, and anthropogenic factors influencing land cover dynamics. By integrating these variables, researchers can better understand the complex interactions between human activities, vegetation cover, water resources, and climate, facilitating the development of strategies for sustainable land management and conservation.
2. Materials and Methods
2.1. Research Area
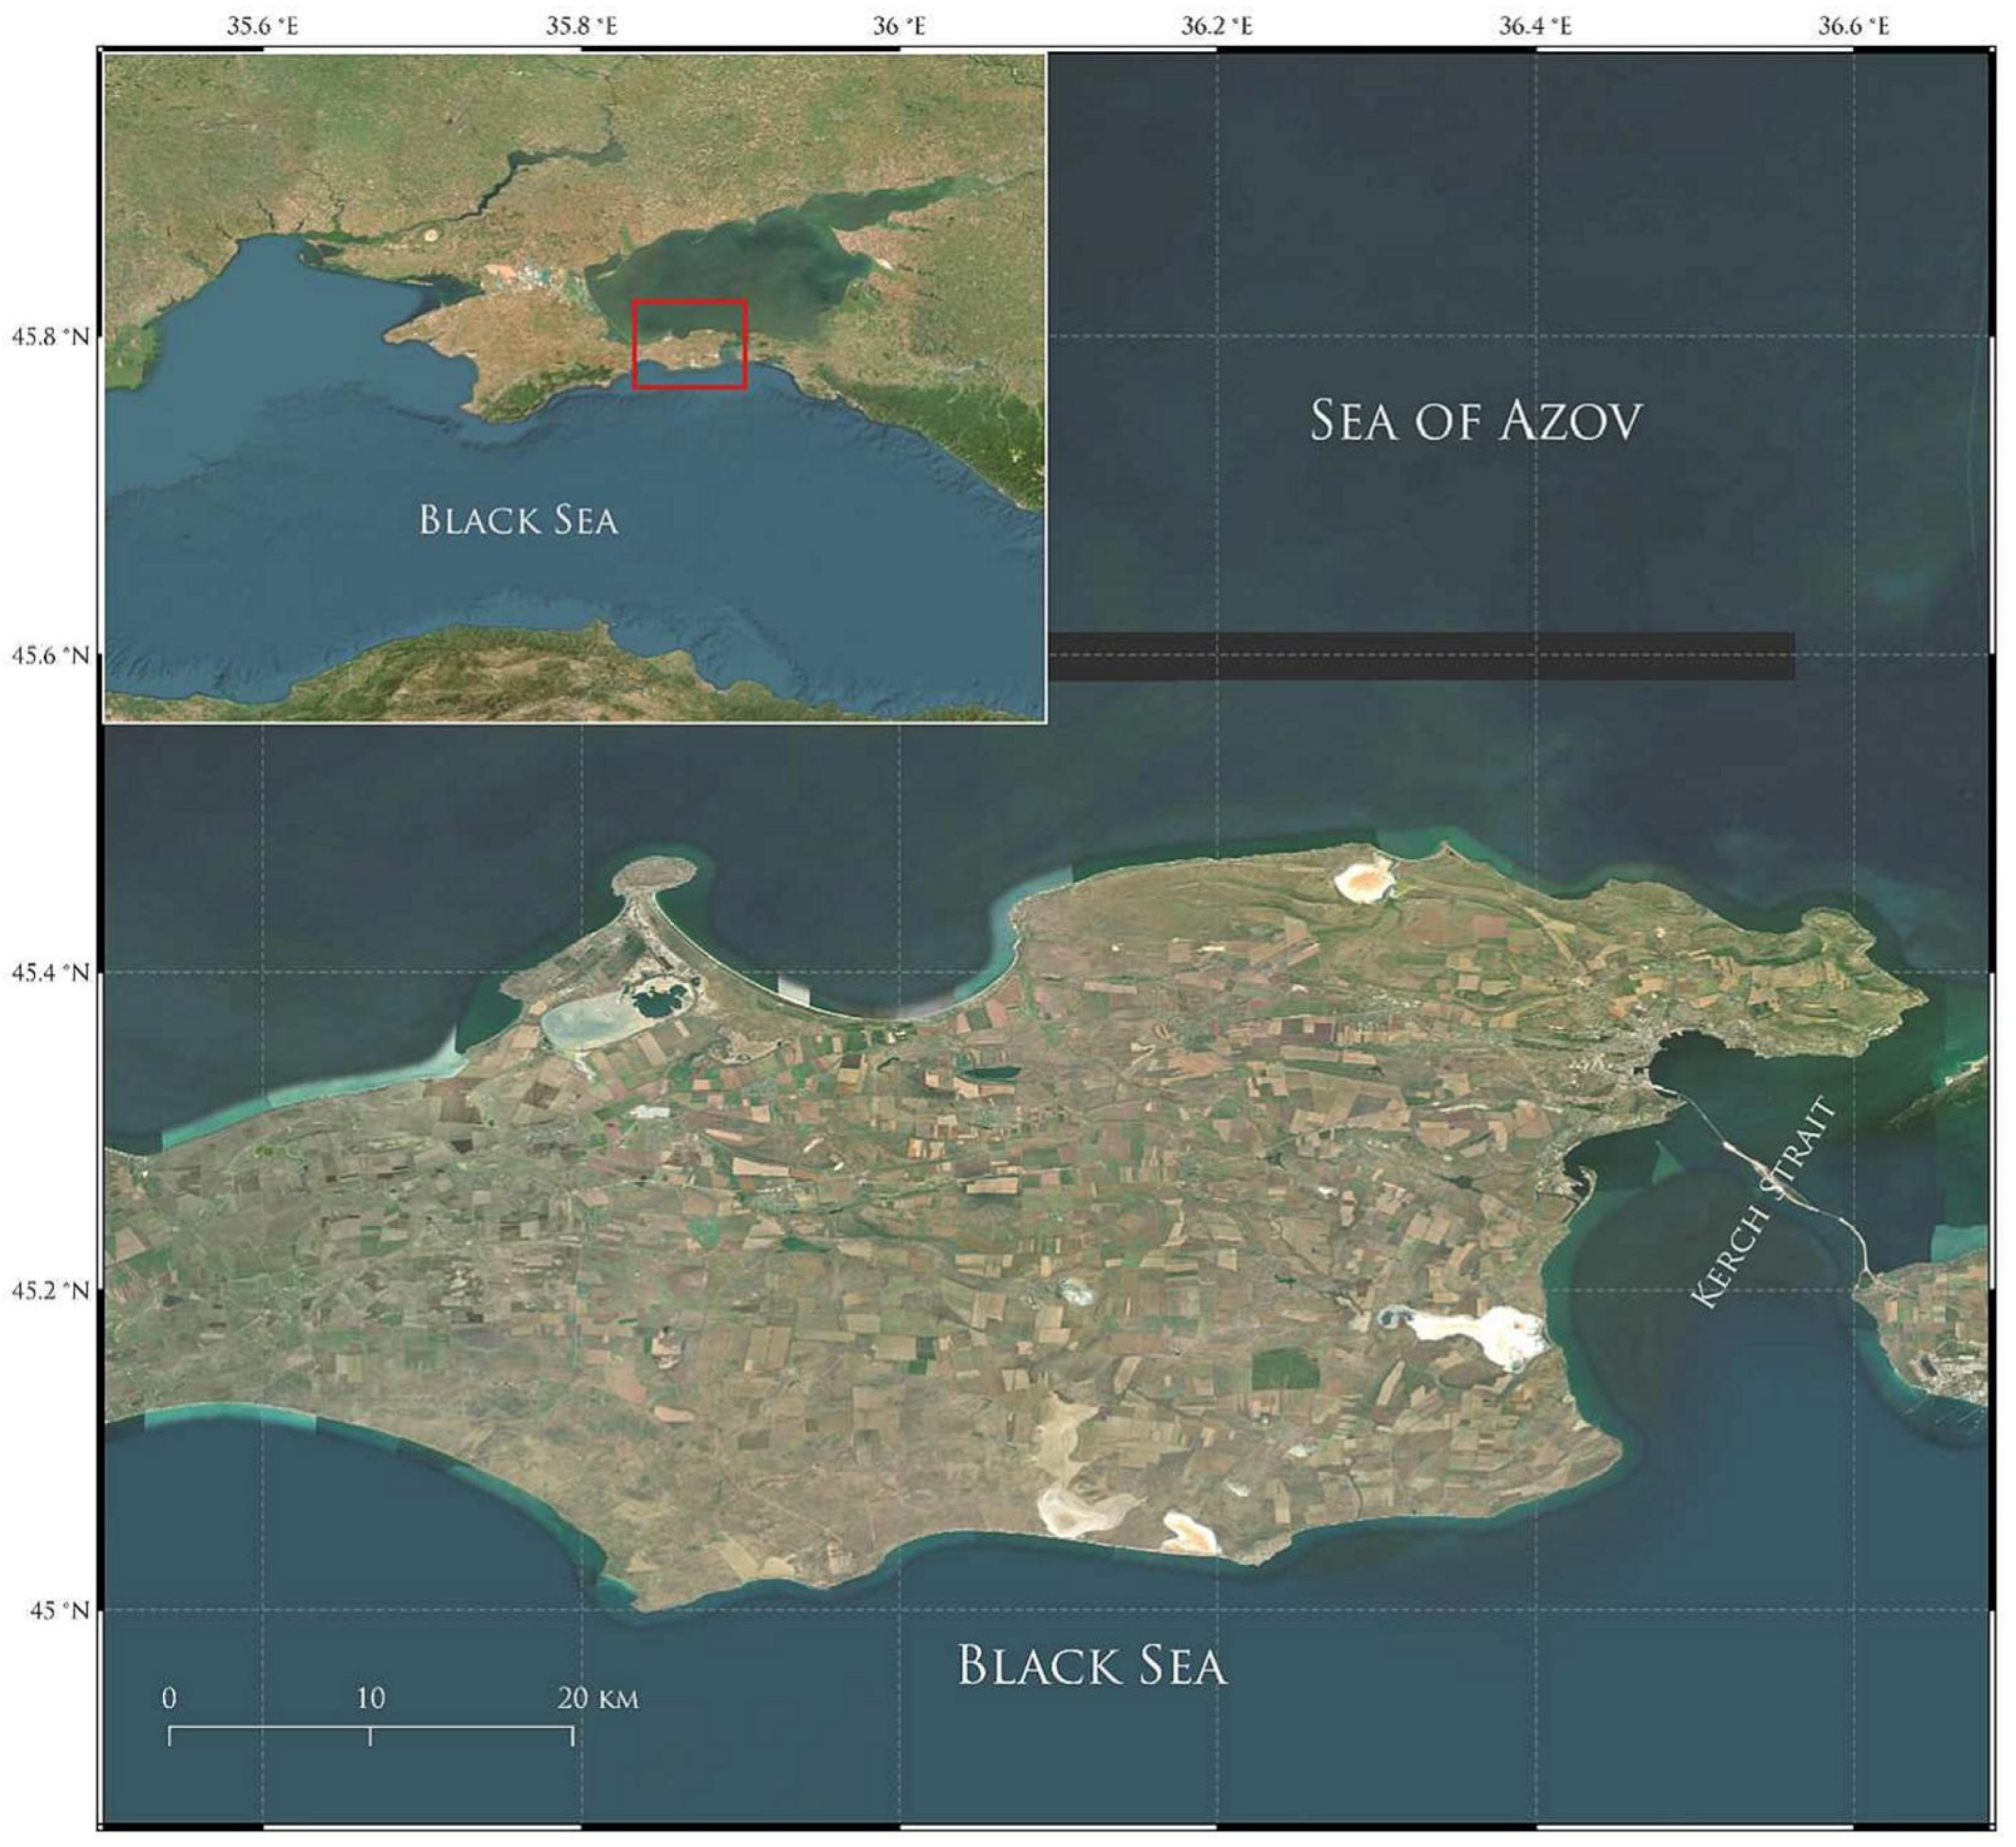
The Kerch Peninsula is located in the eastern part of Crimea, bounded by the Black Sea to the south, the Sea of Azov to the north, and the Kerch Strait to the east. On its western side, the Kerch Peninsula is connected to the rest of Crimea by the Akmonai Isthmus, which is about 17 kilometers wide. This is the natural border between the peninsula and the Crimean mainland [26].
Figure 1.
Schematic map of the research area [6].
Figure 1.
Schematic map of the research area [6].
Geologically, the Kerch Peninsula is characterized by stratified rock formations that are the product of different geological epochs. These formations determine the relief and soil types prevalent throughout the region and influence its mineral wealth, making it a focal point for mining activities, particularly for iron ore, limestone, clay, sand, and table salt. The relief of the peninsula generally consists of steppe hills, with a notable division into gentler southern and western parts and more rugged northern and eastern sections [27,28,29]. This varied topography significantly influences the distribution and diversity of local flora and fauna, contributing to the ecological richness of the peninsula.
The soils of the Kerch Peninsula exhibit notable diversity due to the region’s varied relief, lithological structure, and hydrological conditions. The region is predominantly characterized by the presence of southern solonetzic chernozems, dark chestnut soils, and solonetzes. The soil types are shaped by the peninsula’s intricate geological history and the current hydrological regime. The southwestern portion of the peninsula is distinguished by the prevalence of dense, saline, heavy clay soils, whereas the northeastern region, with its more pronounced topography, has superior drainage and consequently, less saline soils. In lowland areas, a combination of hydromorphic solonetzes and chestnut-meadow soils is typically observed, which are characterised by high salinity levels due to the region’s elevated soil salinity [30,31,32,33].
The Kerch Peninsula is situated in a region of the world that is characterized by a dry, moderately hot continental climate. This climate, coupled with the peninsula’s strategic location between the Black Sea and the Sea of Azov, enhances its appeal as a destination for tourism and recreation. The average annual air temperature and precipitation levels not only influence the natural vegetation and wildlife but also determine the human activities that can be sustainably supported in the region [34].
The region’s water resources are experiencing significant stress due to a combination of natural factors and human consumption. The river network of the Kerch Peninsula is relatively sparse, comprising several small rivers, including the Malyi Indol, the Bulganak, and the Melek-Chesme. The rivers in question frequently experience low water levels, particularly during the summer months, which further exacerbates the challenges associated with water supply [35].
The modern landscapes of the Kerch Peninsula exemplify the intricate interrelationship between the region’s natural endowments and the consequences of human activity. The ongoing economic development, particularly the construction of the Crimean Bridge, is poised to alter the region’s logistical and economic landscape, further intensifying anthropogenic pressures on the natural ecosystems. This evolving dynamic underscores the necessity for integrated landscape management approaches that consider both the natural and economic subsystems of the peninsula. Such strategies should aim to achieve a harmonious balance between economic growth and the preservation of the peninsula’s natural heritage. This would ensure that development is both equitable and ecologically sustainable [26].
2.2. LULCC Analysis and Prediction Using MOLUSCE
MOLUSCE operates on the premise that land use changes are driven by a combination of biophysical, environmental, and socioeconomic factors. The plugin employs various algorithms, including cellular automata (CA), artificial neural networks (ANN), and logistic regression, to simulate changes based on these drivers [11].
The general equation representing the change prediction model in MOLUSCE can be expressed as:
where is the probability of change in cell at time , represents the set of driver variables for cell , is the current land cover state of the cell at time . The function embodies the predictive model derived from historical data analysis.
The first step in LULCC modeling with MOLUSCE is the preparation and importation of spatial datasets. For the Kerch Peninsula, this involves historical and current LULC maps and driver variables - NDVI, NDWI, NDBI, SMI, population density, species distribution, air temperature, and precipitation data formatted as raster layers.
Model calibration is crucial for ensuring accurate predictions. MOLUSCE allows users to perform this by analyzing the relationship between land cover changes and driver variables [36]. This involves statistical analysis to identify significant predictors and understand their influence on LULCC. The calibration process might employ logistic regression or ANN, depending on the model chosen.
With calibrated models, MOLUSCE can simulate future land cover changes. The plugin uses the CA algorithm for spatial simulations, where the state of each cell is determined by its current state, the states of its neighbors, and the influence of driver variables. The CA model is defined as:
where is the land cover state of cell at time , is the current land cover state, represents the states of neighboring cells, are the driver variables affecting the cell.
2.3. Data Collection
The collection and pre-processing of diverse datasets was critical to this study to investigate LULC changes and the driving forces behind these changes. The primary datasets included satellite imagery, remote sensing indices, demographic data, species distribution records, and climate variables (Table 1). These diverse data sources were integrated to provide a robust analysis of historical and current landscape configurations and to support the development of predictive models.
Satellite imagery, primarily from the Landsat program, served as the cornerstone of the LULC analysis. Additional datasets such as NDVI, NDWI, NDBI, SMI, population density, species distribution, and climate variables were used to provide a multifaceted view of the factors influencing LULC change. These datasets were sourced from the Google Earth Engine (GEE) platform and other global data repositories to ensure high quality and consistent data for analysis.
In this study, the collection of LULC data was essential for understanding historical and current landscape configurations and for training predictive models. The LULC data were obtained from Landsat 5, 7, and 8 satellite imagery using the Thematic Mapper (TM) and Operational Land Imager (OLI) sensors. These sensors capture Earth observation data in multiple spectral bands, including visible and infrared spectra, which are critical for distinguishing different land cover types.
The satellite images were obtained from the archives of the United States Geological Survey (USGS) via the Google Earth Engine (GEE) platform using “geemap” [37] package, providing a temporal snapshot of the study area from 1990 to 2019. The Landsat program was chosen because of its extensive historical archive and ability to provide consistent, repeatable measurements of the Earth’s surface, facilitating analysis of LULC changes over time.
To process and analyze these images, the “geemap” library was used, which interfaces with GEE to provide robust and scalable geospatial analysis. This approach allowed for the extraction of median composite images over the specified time frame, reducing cloud cover and atmospheric disturbances to produce clear and reliable LULC data.
In the absence of comprehensive field survey data for the study period, ancillary data sources were used to supplement the satellite imagery. These included archival cadastral data, topographic maps from the “Genshtab” for the years 1990-1991, and scientific articles. This historical data provided essential context for the classification process, offered insight into land use patterns, and aided in the interpretation of satellite-derived observations. To classify the territory of the Kerch Peninsula, a sample of 12,580 points were manually annotated based on the interpretation of high-resolution satellite data available in Google Earth Pro’s historical imagery feature. These points were then categorized into different LULC classes, including water bodies, urban areas, agricultural lands, and various vegetation cover types. The sample points were then divided into a training set and a test set, maintaining a 70:30 ratio to ensure rigorous validation of the machine learning models used for LULC classification.
Several remote sensing indices and datasets were also utilized to analyze and understand the drivers of LULC changes. These indices and datasets were derived from the Landsat series and other global sources, providing essential information on vegetation health, water presence, urbanization, soil moisture, human settlement patterns, species distribution, and climate variables.
NDVI (Normalized Difference Vegetation Index) is calculated from the visible and near-infrared light reflected by vegetation and is used to assess vegetation health and cover. High NDVI values indicate healthy, dense vegetation, while low values indicate sparse or unvegetated areas. The methodology involves processing the reflected light in both the red and near-infrared spectra to calculate the NDVI for each pixel, allowing detailed analysis of vegetation patterns over time.
NDWI (Normalized Difference Water Index) uses green and near-infrared light to highlight water bodies while minimizing the presence of vegetation and developed areas. This index is effective in distinguishing water features in the landscape. NDWI data was calculated using multispectral imagery from the Landsat satellites from the same data sets mentioned above.
The Normalized Difference Built-up Index (NDBI) uses the reflective properties of built-up materials in the shortwave infrared spectrum to highlight urban areas. It contrasts these areas with the surrounding land cover, making it a valuable tool for detecting and monitoring urban expansion. NDBI data were derived from Landsat imagery using the same data sets.
The Soil Moisture Index (SMI) estimates soil moisture using remote sensing techniques. SMI data was derived by analyzing Landsat imagery using algorithms that consider the reflective characteristics of wet and dry soils. Different spectral bands are compared to estimate moisture content, providing a spatially explicit measure of soil moisture across landscapes.
The Global Human Settlement Layer (GHSL) provides detailed information on human settlements worldwide, derived from satellite imagery and census data. GHSL data have been used to map and quantify human settlements, facilitating analysis of human impacts on land cover change.
Climate variables such as air temperature and precipitation were essential for understanding the climatic drivers of land cover change. These data were obtained from the ERA5 reanalysis dataset, which provides hourly data on a wide range of climate variables. ERA5 data provide detailed information on weather and climate conditions, generated by combining historical observations with modern forecast models.
By integrating these indices and datasets, the study was able to comprehensively analyze the drivers of LULC change, facilitating the development of predictive models and informing land management strategies.
2.4. General Scheme of LULCC Analysis
The study began with the systematic collection of LULC data and various environmental and socio-economic variables at each specified time step. This comprehensive dataset forms the basis for the analysis and predictive modeling facilitated by the MOLUSCE QGIS plugin (Figure 2).
Initially, both baseline and follow-up LULC data ( and ) were gathered for each time interval. This included a wide array of relevant variables such as vegetation indices (e.g., NDVI), climate data (e.g., temperature, precipitation), and demographic information (e.g., population density). Integrating these datasets into the MOLUSCE plugin allowed for a cohesive analysis framework, ensuring that each time step’s data ( and ) were accurately represented and used.
In the “Area changes” phase, the study focused on elucidating the relationships between the collected variables and LULC changes. This involved calculating correlation coefficients between variables to identify their influence on land cover dynamics. Detailed class statistics and transition matrices were then calculated to provide quantitative insights into the transitions between different LULC types. These matrices were critical for understanding the extent and nature of land cover change over time. A comprehensive change map was then produced to visually represent these transitions and highlight areas of significant change.
The “Transition potential modeling” phase involved the application of advanced machine learning techniques. An artificial neural network (ANN) was meticulously trained to model the transition potential of different land cover types. This training process involved using historical data to learn the patterns and probabilities of land cover transitions, informed by the input variables. The ANN model aimed to predict the likelihood of specific transitions, providing a nuanced understanding of the driving forces behind LULC change.
Following the modeling of transition potential, a hybrid cellular automata-artificial neural network (CA-ANN) model was employed in the “Cellular automata simulation” phase. This model used the spatial modeling capabilities of cellular automata combined with the predictive power of ANN to simulate likely LULC changes. The simulation used spatially explicit data and incorporated the quantitative influence of driver variables to predict future landscape configurations. This phase was critical in visualizing potential trajectories of LULC change under different scenarios.
In the “Validation” phase, the results of the simulation were rigorously validated against ground truth data to ensure the accuracy and reliability of the model. This involved comparing the predicted LULC changes with the actual observed changes, using statistical metrics to assess the model’s performance. Validation is essential to confirm that the model accurately captures the dynamics of land cover change and can reliably predict future scenarios.
Finally, the “Landscape metrics calculation” stage involved a detailed analysis of the landscape structure using the PyLandStats package. Several landscape metrics were calculated, including patch size distribution, edge density, and landscape diversity indices. These metrics provided a comprehensive assessment of the spatial and ecological characteristics of the landscape, providing insight into the impact of LULC changes on ecosystem structure and function.
2.5. Landscape Metrics
Landscape metrics are quantitative measures used to characterize the structure, composition, and configuration of landscapes. These metrics are essential for understanding the ecological processes and patterns resulting from LULCC. In this study, landscape metrics such as Shannon diversity index, contagion index, entropy, number of patches, proportion of landscape and patch density were calculated using the PyLandStats package, which provides a comprehensive set of tools for analyzing spatial patterns and dynamics of landscapes [38].
The Shannon diversity index (SHDI) is a measure of landscape diversity. It considers both the abundance and the evenness of different LULC types:
where is the proportion of the landscape occupied by LULC type , – is the number of different LULC types
The contagion index (CONTAG) measures the degree of clumping or dispersion of different LULC types across the landscape. Higher values indicate a more clumped (contagious) distribution, while lower values indicate a more dispersed distribution.
where is the proportion of the landscape occupied by LULC type , is the edge length between LULC types and , is the number of LULC types.
Entropy, in the context of landscape ecology, quantifies the degree of disorder or randomness in the distribution of LULC types.
where is the proportion of landscape occupied by LULC type , – is the number of different LULC types.
The number of patches (NP) metric simply counts the total number of discrete patches of each LULC type within the landscape.
where is the number of patches of LULC type , – number of different LULC types.
The proportion of landscape (PLAND) metric quantifies the percentage of the landscape occupied by each LULC type.
where is the area of LULC type , is the area of the landscape
Patch density (PD) is a measure of the number of patches of a particular LULC type per unit area of the landscape.
where NP – the total number of patches for a particular LULC type, - the total area of the landscape.
3. Results
The latter part of the 20th century, particularly the decade from 1990 to 1999, saw the Kerch Peninsula undergo significant shifts in LULC, which can be attributed to a complex interplay of socio-economic transformations and climatic variability. The disintegration of the Soviet Union ushered in a period of economic transition, marked by industrial decline and the contraction of arable land, which led to profound alterations in the landscape. From a socio-economic perspective, the 1990s were characterized by a de-intensification of agriculture due to economic downturns. The arable land in Crimea by the mid-1990s had diminished to 1154 thousand hectares, which reflects the broader trend of agricultural land abandonment witnessed across many post-Soviet landscapes. Such transitions in land use have often led to land cover changes, including the succession of previously cultivated areas into early-seral stages or grasslands, which in turn may evolve into shrublands or forests over time if left uncultivated. Concomitantly, climatic shifts became particularly influential. A warming trend evident since the late 1980s has led to increased winter and spring temperatures, significantly affecting the LULC. These warmer temperatures contributed to an increased incidence of late frosts, such as the catastrophic frosts of 1999, which obliterated burgeoning agricultural yields. These late frosts, paired with the previous warm spells, suggest an increased phenological vulnerability of the peninsula’s vegetation, potentially leading to a more delicate and fluctuating agricultural landscape.
The transition matrix (Table 2) for the 1990-1999 period presents a quantitative synthesis of these dynamics, indicating the probabilities of land cover changes from one class to another. Notably, the matrix reveals substantial inertia within the croplands class, but also significant transitions to grasslands. This suggests that while certain agricultural areas remained stable, a notable portion reverted to grassland states, potentially due to abandonment or following practices. Urban expansion was another discernible trend, with transitions from high vegetation and barren lands to urban areas suggesting increasing urban sprawl and industrial land development.
The data of class dynamics (Table 3) underscores a substantial increase in croplands of 8.98% over the five-year period, suggesting intensified agricultural activity. Conversely, there was a sharp decline in high vegetation of 2.26%, which could be due to deforestation or land development pressures. Shrublands saw a reduction by 5.14%, indicating potential land degradation or conversion to other uses. Urban areas expanded by 0.36%, which is consistent with global trends of urbanization. Water bodies also increased slightly, perhaps due to changes in hydrological management or natural fluctuations.
The LULC maps for the 1990-1994 and 1995-1999 (Figure 3) periods reveal a spatial distribution dominated by expansive cropland areas, especially in the central regions of the peninsula, indicative of an agriculturally driven landscape. The interface between croplands and grasslands likely delineates areas in transitional states, either set aside from cultivation or evolving into higher-successional stages due to reduced agricultural activity.
The LULC changes observed during this period are not merely the outcome of natural successional processes but are also significantly shaped by human activities, including the strategic socio-economic decisions that influenced land management practices. The interrelation between these anthropogenic factors and the natural climatic variability produced a dynamic and evolving LULC pattern on the Kerch Peninsula. The region’s LULC transformations, especially the shrinkage in high vegetation and the concomitant growth in urban areas, resonate with global trends but are uniquely modulated by the local socio-economic and environmental contexts. The shift in LULC on the Kerch Peninsula thus exemplifies the broader transitions occurring across the post-Soviet space, where ecological, economic, and climatic forces converge to reshape the landscape, reflecting the peninsula’s adaptation to both its internal stressors and the broader post-Cold War restructuring.
During the period from 1995 to 2004, the Kerch Peninsula witnessed a complex mosaic of LULC transformations (Table 4). The substantial decline in croplands, as seen in the reduction of agricultural areas by 438.51 km², can be directly associated with the socio-economic turbulence of the post-Soviet transition.
Economic instability and shifts in agricultural policy led to land abandonment or a reorientation of land use, potentially coupled with a growing recognition of the importance of sustainable land management practices. In this context, the increase in grasslands by 303.31 km² may be interpreted as either a sign of agricultural land being set aside and gradually reverting to a more natural state or a deliberate policy shift towards extensive farming practices. The remarkable tripling of high vegetation areas by 116.87 km² points to a concerted effort towards afforestation or the natural succession of abandoned lands towards forested areas, a response perhaps to both economic incentives and environmental concerns. The slight increase in bare soils, despite being modest, raises questions about soil conservation and the long-term sustainability of land use on the peninsula. At the same time, the modest decrease in urban areas and water bodies could reflect a stagnation in urban development or a re-evaluation of hydrological infrastructure, possibly influenced by the changing economic priorities of the era.
These shifts are visually corroborated by the LULC maps of the respective periods (Figure 4), which exhibit a contraction of the green spaces associated with croplands and an expansion of grasslands and high vegetation zones. These spatial transformations highlight a period of transition for the Kerch Peninsula, with the reconfiguration of the agricultural landscape being a standout feature.
The transition matrix for 1995-2004 (Table 5) shows that the transition from croplands to grasslands and bare soils underscores the dynamic changes within the agricultural sector. Concurrently, the robustness of grasslands, as evidenced by their high probability of remaining unchanged, could indicate a landscape in equilibrium or a stabilization of land use practices that favor grassland conservation or extensification.
High vegetation’s stability suggests a landscape recovering from previous uses, possibly benefiting from less human intervention and more protective environmental policies. The transition of barren lands into urban areas and water bodies could be attributed to both the expansion of urban frontiers into less fertile lands and efforts to manage water resources more effectively, considering the ecological and economic value of these areas.
The LULC dynamics on the Kerch Peninsula from 2000 to 2009 (Table 6) marked by significant ecological shifts and human activities, saw notable alterations in land use patterns, underscored by quantitative changes.
Croplands showed a considerable reduction, decreasing from 315.25 km² in 2000-2004 to 289.35 km² by 2005-2009, marking a decline of 25.90 km². This 0.89% decrease in the cropland area could be indicative of a shift away from intensive agriculture, possibly due to changing economic conditions that made certain agricultural practices less viable or due to policy-driven efforts towards more sustainable land use practices. The reduction in croplands also reflects the broader socio-economic transformations during this period, including the impact of climatic changes on agricultural productivity. Grass lands, conversely, saw an increase of 255.35 km², expanding from 1160.78 km² to 1416.13 km². This 8.80% increase highlights a significant transition, likely driven by the abandonment of agricultural lands, which subsequently reverted to natural vegetation, or by deliberate changes in land management practices favoring the conservation of grassland ecosystems. The growth in grasslands suggests a landscape adapting to both the withdrawal of human agricultural activity and possibly benefiting from conservation policies aimed at preserving these ecosystems. High vegetation areas witnessed a sharp decrease of 84.12 km², plummeting from 153.66 km² to just 69.55 km². This decline points to deforestation or the conversion of forested areas for other uses, such as agriculture or urban development. The loss of high vegetation areas underscores the pressure on forest ecosystems during this decade, possibly exacerbated by the demand for timber, expansion of agricultural lands, and urban sprawl. Barren lands saw a marginal increase, rising by 30.97 km² from 40.03 km² to 70.99 km². This suggests a slight intensification of land degradation processes or the conversion of other land types into barren lands due to activities such as extraction or construction, highlighting concerns over soil health and land stability. Shrublands and bare soils also experienced changes, with shrublands decreasing by 87.20 km² and bare soils by 99.92 km². These shifts could reflect natural succession processes where shrublands evolve into other vegetation types or the impact of land use changes that either encourage or discourage the presence of these land covers. Urban areas remained relatively stable, with a slight increase of 0.26 km², reflecting gradual urban expansion in line with global urbanization trends, albeit at a slower rate. This stability suggests a balance between development pressures and efforts to conserve natural landscapes. Water bodies increased marginally by 10.56 km², possibly reflecting changes in hydrological management, climate-induced variations in water availability and efforts to enhance water conservation.
The LULC changes from 2000 to 2009, particularly the transition from croplands to grasslands and the decrease in high vegetation areas, can be attributed to a combination of factors, including climatic changes, economic shifts, and policy decisions affecting land use. The late frosts of 1999 and significant agricultural damage from 2000 to 2004 highlight the vulnerability of the region’s agriculture to climatic extremes. Additionally, the increase in high temperatures and the delay in May frosts by 10-15 days due to warmer winter and spring months underscore the climatic challenges facing the region.
In the transition from 2000-2004 to 2005-2009 (Table 7), there was an increase in Grass Lands of about 8.80%, suggesting a continuing trend of cropland conversion to natural vegetation or a change in land management practices. This might be due to agricultural land abandonment or the transition towards more extensive forms of farming. High Vegetation areas saw a substantial decrease of almost 2.90%, which could indicate deforestation or conversion to other land use types, possibly for agricultural expansion or urban development.
Barren Lands increased slightly, possibly due to natural soil degradation processes or the conversion of other land types into barren land due to extraction activities or construction. Conversely, Bare Soils saw a decrease, indicating possible soil conservation efforts or land cover changes due to revegetation or development projects. Urban Areas remained relatively stable with a slight increase, reflecting a gradual urban expansion that is in line with the global trend of increasing urbanization, although at a lower rate. Water Bodies saw a small increase, possibly due to climatic variations affecting water levels or changes in water management practices.
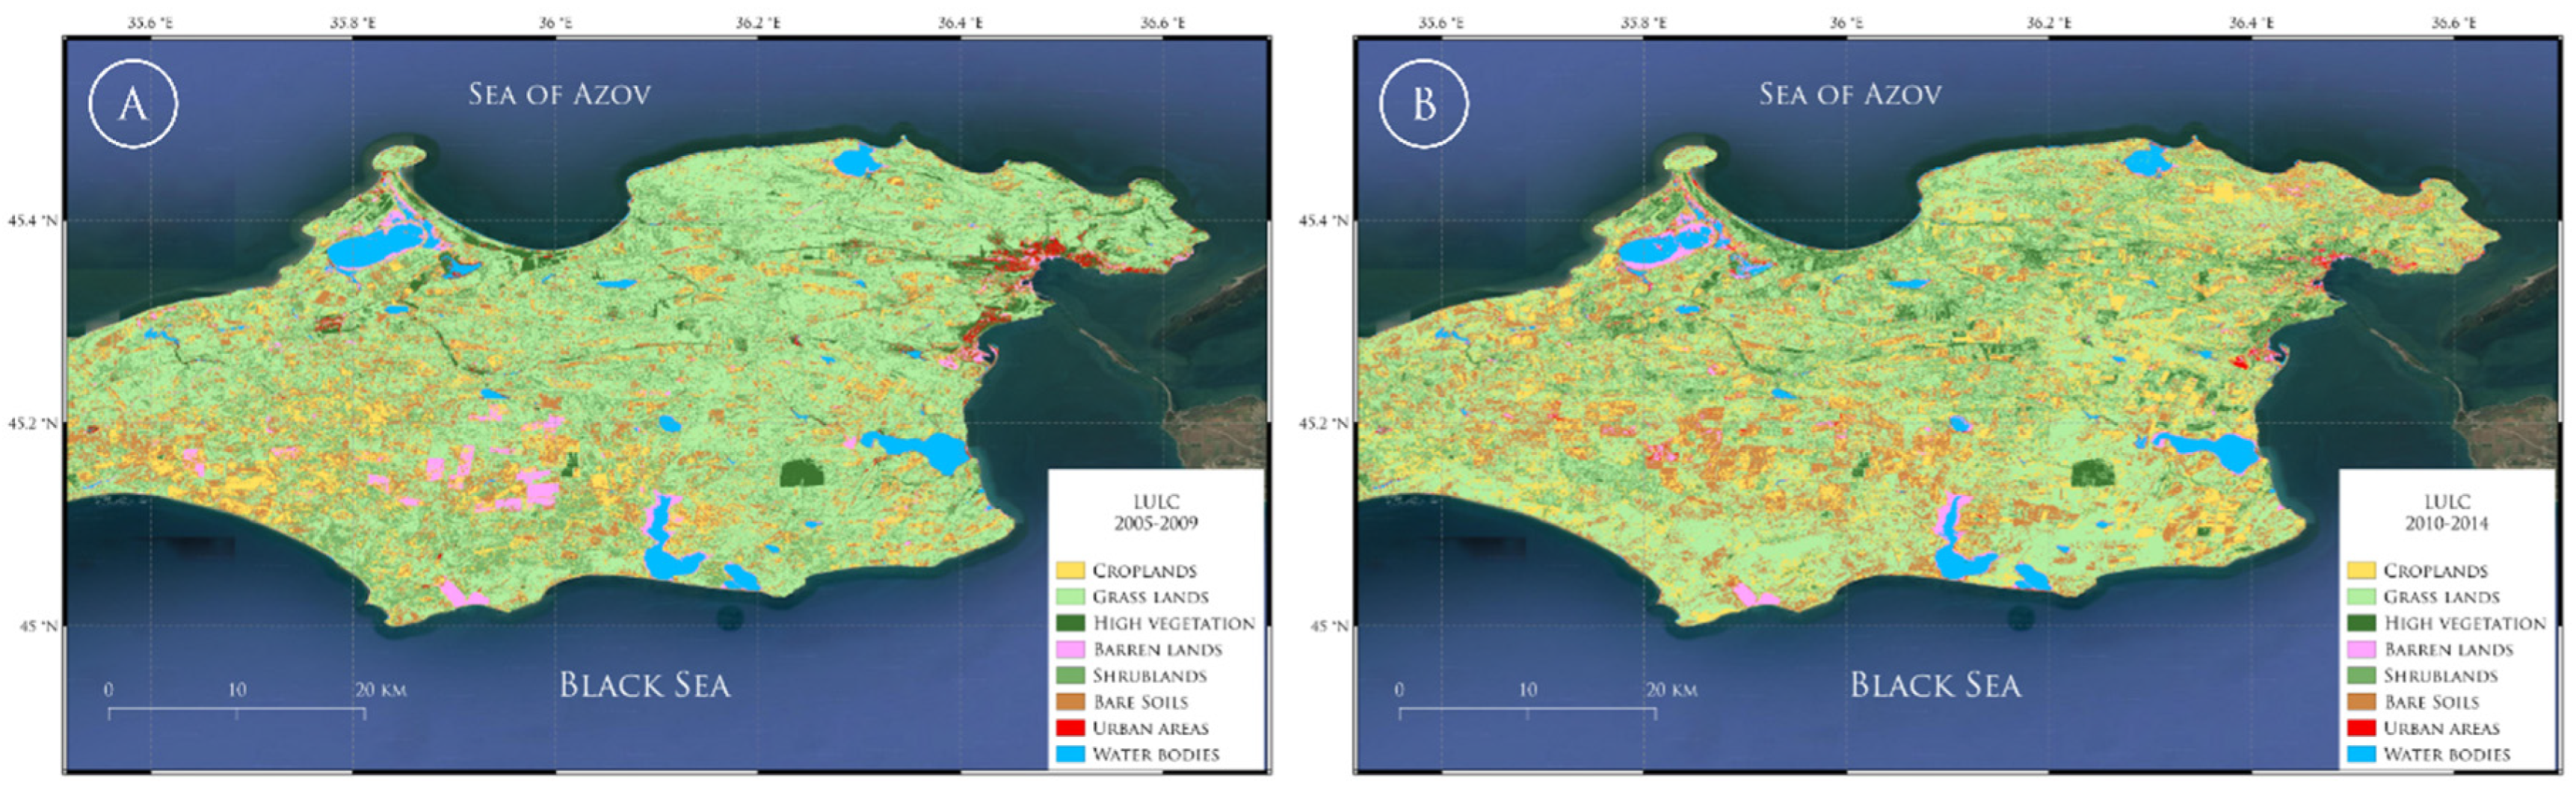
Spatial analysis of the LULC maps for 2000-2004 and 2005-2009 (Figure 5) shows these changes. From 2000 to 2005, we observe a noticeable contraction of cropland areas. This reduction can be interpreted as either a response to lessened agricultural activity or a shift towards different land uses such as fallow land, which could later evolve into grass Lands.
The substantial increase in grass lands corroborates this theory, as it may indicate the natural progression of fields left uncultivated or the conscious conversion of land for conservation purposes. It’s also possible that these areas represent a transition towards more extensive, low-intensity agricultural practices, reflecting a regional shift in farming strategies possibly driven by economic or policy changes. High vegetation areas have markedly decreased, which could be attributed to both anthropogenic and natural factors. Deforestation for timber, clearing for agriculture, urban expansion, or natural disturbances such as fires could contribute to this decline. Meanwhile, an increase in grass lands and a decrease in bare soils could indicate a maturing of ecological succession processes, where grasses and shrubs begin to colonize previously bare or disturbed lands. The slight uptick in barren lands is intriguing. This could suggest new developments in areas that were previously unused or the degradation of existing land covers due to factors like construction activities, mining, or soil erosion. The stability of shrublands and the moderate increase in urban areas reflect a slow yet steady urbanization process, which may be linked to population growth and economic development on the peninsula. However, this urbanization does not appear to be at the expense of green spaces, as often seen in other regions undergoing rapid urban expansion. Water Bodies exhibit a small increase, which may reflect changes in water management, such as the creation of reservoirs, or natural variations in water levels. This stability is crucial for maintaining regional biodiversity and water resources for agricultural and human consumption.
In examining the LULC transitions, we delve into a period of continued environmental change and development on the Kerch Peninsula. The LULC class statistics (Table 8) and spatial analysis (Figure 6) of the 2005-2014 period offer a comprehensive overview of these changes, highlighted by a decrease in grass lands by 4.82%, signaling potential agricultural encroachment and a reevaluation of land management practices favoring the use of areas previously designated as grasslands for agricultural purposes. This period saw croplands expand by approximately 191 km², suggesting an intensification or expansion of agricultural activities, possibly driven by broader economic trends or policy incentives aimed at enhancing agricultural productivity.
Conversely, the observed reduction in grass lands from 1416.27 km² to 1276.56 km² might reflect a reallocation of land resources, where grasslands were converted to support agricultural expansion or subjected to urban development. The slight increase in high vegetation of 0.48%, although modest, signals a gradual but positive shift towards the recovery or planting of forested areas, possibly indicative of environmental conservation efforts or natural forest regeneration initiatives. This change, from 69.55 km² to 83.54 km², although not vast, is significant in the context of ecological restoration and land management practices on the peninsula.
The decline in barren lands by 0.82% and shrublands by 4.77% could be attributed to a variety of factors, including soil conservation initiatives that transform barren landscapes into more productive land covers or the natural succession processes where shrubs give way to other vegetation forms. This suggests an improvement in landscape management and a possible increase in land cover diversity, enhancing the ecological stability of the region.
Figure 7.
LULC maps of the Kerch peninsula for 2005-2009 and 2010-2014 periods.
Urban areas showed a slight decrease, which, within the global context of increasing urbanization, suggests a localized trend of urban consolidation or potential decay. This reduction, albeit slight from 21.08 km² to 18.72 km², could indicate a deliberate policy shift towards limiting urban sprawl, promoting urban greening initiatives, or perhaps demographic changes affecting urban growth patterns. Water bodies also experienced a decrease, which might be attributed to natural variations in precipitation and evaporation rates, changes in water management practices, or land reclamation efforts for agricultural or urban development. This slight reduction, from 92.25 km² to 76.96 km², underscores the challenges in maintaining water resources amidst changing land use patterns and climatic conditions.
The transition matrix (Table 9) further solidifies these observations. Croplands, once a dominant class, ebbed significantly, suggesting either a decline in agricultural exploitation or a transformative rest period leading to the resurgence of natural grasslands. This is indicated by the marked flow from croplands to grass lands, which could point to a fallow strategy in farming or perhaps a strategic shift towards extensive grazing practices or conservation initiatives that allow for ecological recovery. Grass lands, displaying a robust self-renewal, still surrendered a significant fraction to shrublands, underscoring a potential narrative of land abandonment or natural succession. This transition could also signify a landscape recovering from agricultural use, moving towards a more complex ecological state with increased biodiversity. Conversely, high vegetation, representing the dense arboreal tapestry, saw a notable fraction succumb to the advance of Shrublands, reflecting possible deforestation or the conversion of forested areas for other uses. Nonetheless, a significant part of this class showed resilience, persisting through the time span, potentially due to conservation efforts or less aggressive land-use policies. The slight rise in barren lands, areas often denuded of significant vegetation, indicated either a loss of productive land to degradation or an intentional setting aside of land for future use. Meanwhile, the gradual transformation of barren lands into bare soils might suggest soil erosion processes at play, or the reversion of previously used lands to a more primal state. Urban areas, which usually burgeon with the advance of time, portrayed a narrative twist as they integrated back into natural land classes such as grass lands and high vegetation. This suggests a rare phenomenon of urban contraction or the greening of urban spaces, reflecting a community and policy-driven preference for urban sustainability and natural aesthetics. The water bodies, typically a static feature in land cover analyses, held their ground with little variation. However, a slight encroachment by barren lands hints at the impacts of intense agricultural practices, infrastructural developments, or the shifting patterns of water management.

Table 9.
Transition matrix for the 2004-2014 period.
| From/To (Class) | Croplands | Grass Lands | High Vegetation | Barren Lands | Shrublands | Bare Soils | Urban Areas | Water Bodies |
| Croplands | 0.232 | 0.400 | 0.007 | 0.008 | 0.073 | 0.272 | 0.006 | 0.001 |
| Grass Lands | 0.165 | 0.500 | 0.009 | 0.001 | 0.162 | 0.161 | <0.001 | <0.001 |
| High Vegetation | 0.016 | 0.072 | 0.455 | 0.002 | 0.417 | 0.031 | 0.004 | 0.002 |
| Barren Lands | 0.189 | 0.068 | 0.001 | 0.311 | 0.005 | 0.302 | 0.105 | 0.019 |
| Shrublands | 0.142 | 0.490 | 0.046 | 0.002 | 0.175 | 0.143 | 0.001 | <0.001 |
| Bare Soils | 0.221 | 0.413 | 0.008 | 0.009 | 0.098 | 0.232 | 0.017 | 0.001 |
| Urban Areas | 0.009 | 0.482 | 0.354 | 0.005 | 0.073 | 0.052 | 0.023 | 0.002 |
| Water Bodies | <0.001 | 0.006 | 0.001 | 0.172 | <0.001 | 0.002 | 0.007 | 0.812 |
Table 9.
LULC dynamics on the Kerch peninsula in 2010-2019.
| Class | 2010-2014 (km2) | 2015-2019 (km2) | Δ (km2) | 2010-2014 (%) | 2015-2019 (%) | Δ (%) |
| Croplands | 480.59 | 262.46 | -218.13 | 16.57% | 9.05% | -7.52% |
| Grass Lands | 1276.55 | 1270.07 | -6.48 | 44.01% | 43.79% | -0.22% |
| High Vegetation | 83.54 | 23.38 | -60.16 | 2.88% | 0.81% | -2.07% |
| Barren Lands | 45.35 | 71.39 | +26.04 | 1.56% | 2.46% | +0.89% |
| Shrublands | 415.80 | 486.42 | +70.62 | 14.33% | 16.77% | +2.44% |
| Bare Soils | 501.71 | 702.91 | +201.20 | 17.30% | 24.24% | +6.94% |
| Urban Areas | 18.40 | 50.63 | +32.24 | 0.63% | 1.75% | +1.11% |
| Water Bodies | 78.04 | 32.70 | -45.34 | 2.69% | 1.13% | -1.56% |
From 2010 to 2014, and then to 2015-2019, the Kerch Peninsula’s landscape was subject to significant changes coinciding with Crimea’s political transition and the subsequent shutdown of the North Crimean Canal. This period, while marked by challenges, also presented an opportunity to reflect on positive adaptations and resilience within the region’s land use and management.
Despite the constriction in water resources post-2014, which significantly impacted agricultural practices, croplands experienced only a slight decrease. This suggests an adaptation towards more water-efficient agricultural methods or a shift to crops less dependent on large water inputs. Meanwhile, the area under grass lands remained remarkably stable, indicating the robustness of these ecosystems or a potential increase in rain-fed pasturelands compensating for the reduction in irrigated fields (Table 10).
Table 10.
Transition matrix for the 2010-2019 period.
| From/To (Class) | Croplands | Grass Lands | High Vegetation | Barren Lands | Shrublands | Bare Soils | Urban Areas | Water Bodies |
| Croplands | 0.120 | 0.434 | 0.001 | <0.001 | 0.168 | 0.273 | 0.004 | 0.000 |
| Grass Lands | 0.069 | 0.522 | 0.001 | <0.001 | 0.167 | 0.227 | 0.014 | <0.001 |
| High Vegetation | 0.029 | 0.200 | 0.145 | 0.001 | 0.333 | 0.158 | 0.133 | <0.001 |
| Barren Lands | 0.079 | 0.022 | 0.001 | 0.567 | 0.029 | 0.239 | 0.046 | 0.016 |
| Shrublands | 0.033 | 0.493 | 0.023 | <0.001 | 0.236 | 0.205 | 0.010 | <0.001 |
| Bare Soils | 0.186 | 0.342 | 0.001 | 0.001 | 0.125 | 0.333 | 0.012 | <0.001 |
| Urban Areas | 0.164 | 0.037 | 0.005 | 0.065 | 0.138 | 0.199 | 0.391 | 0.001 |
| Water Bodies | 0.004 | 0.002 | <0.001 | 0.558 | 0.003 | 0.018 | 0.008 | 0.407 |
The high vegetation class saw a notable reduction, possibly due to the re-purposing of land for agriculture to compensate for the loss of water-intensive crops or changes in forestry management. Yet, it is the resilience and slight expansion of barren lands that demonstrate a noteworthy adaptation to the new hydrological realities, possibly through the introduction of land management practices aimed at mitigating soil degradation and promoting conservation. Shrublands and bare soils show a dynamic interplay, with shrublands increasing, possibly due to natural succession processes that fill the gaps left by reduced agricultural use. Bare soils also increased, suggesting a response to the loss of irrigated lands, with these areas possibly being set aside for future development or reclamation projects. Urban areas expanded modestly, reflecting continued growth and development in the region, despite the broader geopolitical changes. The ability of urban areas to continue to develop in this period highlights the adaptive capacity of local governance and urban planning in the face of significant challenges. Water bodies experienced a decrease, likely a direct result of the canal shutdown. However, the region’s response, potentially through improved water conservation and management strategies, underscores a commitment to overcoming the constraints posed by the new water resource dynamics.
The LULC maps for 2010-2014 and 2015-2019 (Figure 8) visually capture these changes. The 2010-2014 map shows a diversified landscape, with a rich tapestry of croplands and natural vegetation. In contrast, the 2015-2019 map reveals adjustments in land use, with increased barren and shrubland areas and a contraction in high vegetation zones, reflecting both the challenges and the adaptive strategies implemented in the wake of the canal closure.
Figure 8.
LULC maps of the Kerch peninsula for 2010-2014 and 2015-2019 periods.
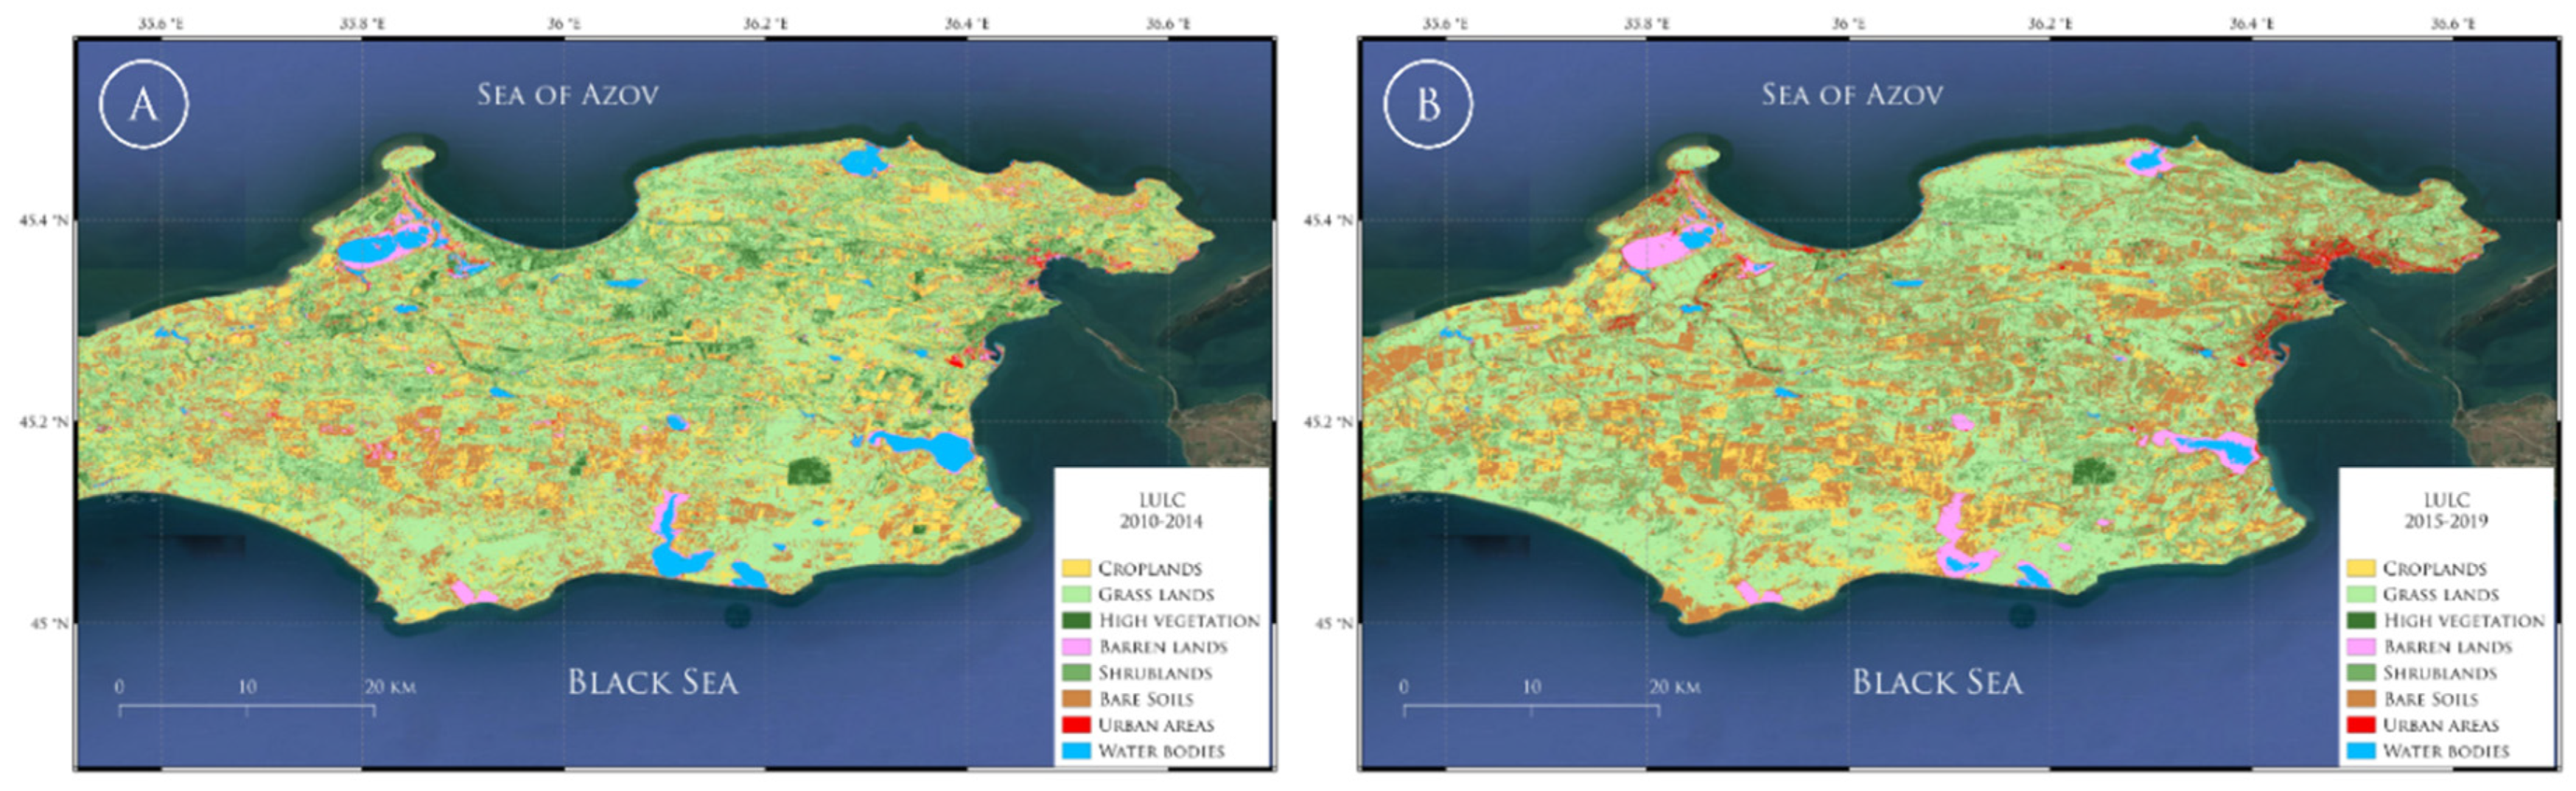
The transition matrix for this period (Table 10) reveals the probabilities of each land cover type evolving into another, shedding light on the adaptive strategies in place. The matrix showed that, while some croplands converted to grass lands and bare soils, there was also a significant retention, reflecting the continued importance and resilience of agriculture in the region. Furthermore, the transition from grass lands to shrublands and from high vegetation to both shrublands and bare soils indicates a landscape in ecological flux, potentially moving towards a new equilibrium. Urban areas saw a positive increase, which might be linked to the strategic development of infrastructure and housing to support the region’s population and economy.
3.1. Landscape Metrics Analysis
The Shannon diversity index for the Kerch Peninsula, as depicted in the graph (Figure 9), reveals a narrative of landscape transformation over a span of two decades, influenced by socio-political dynamics and environmental policies.
Figure 9.
Dynamics of the Shannon diversity index for the Kerch peninsula in 1990-2019.
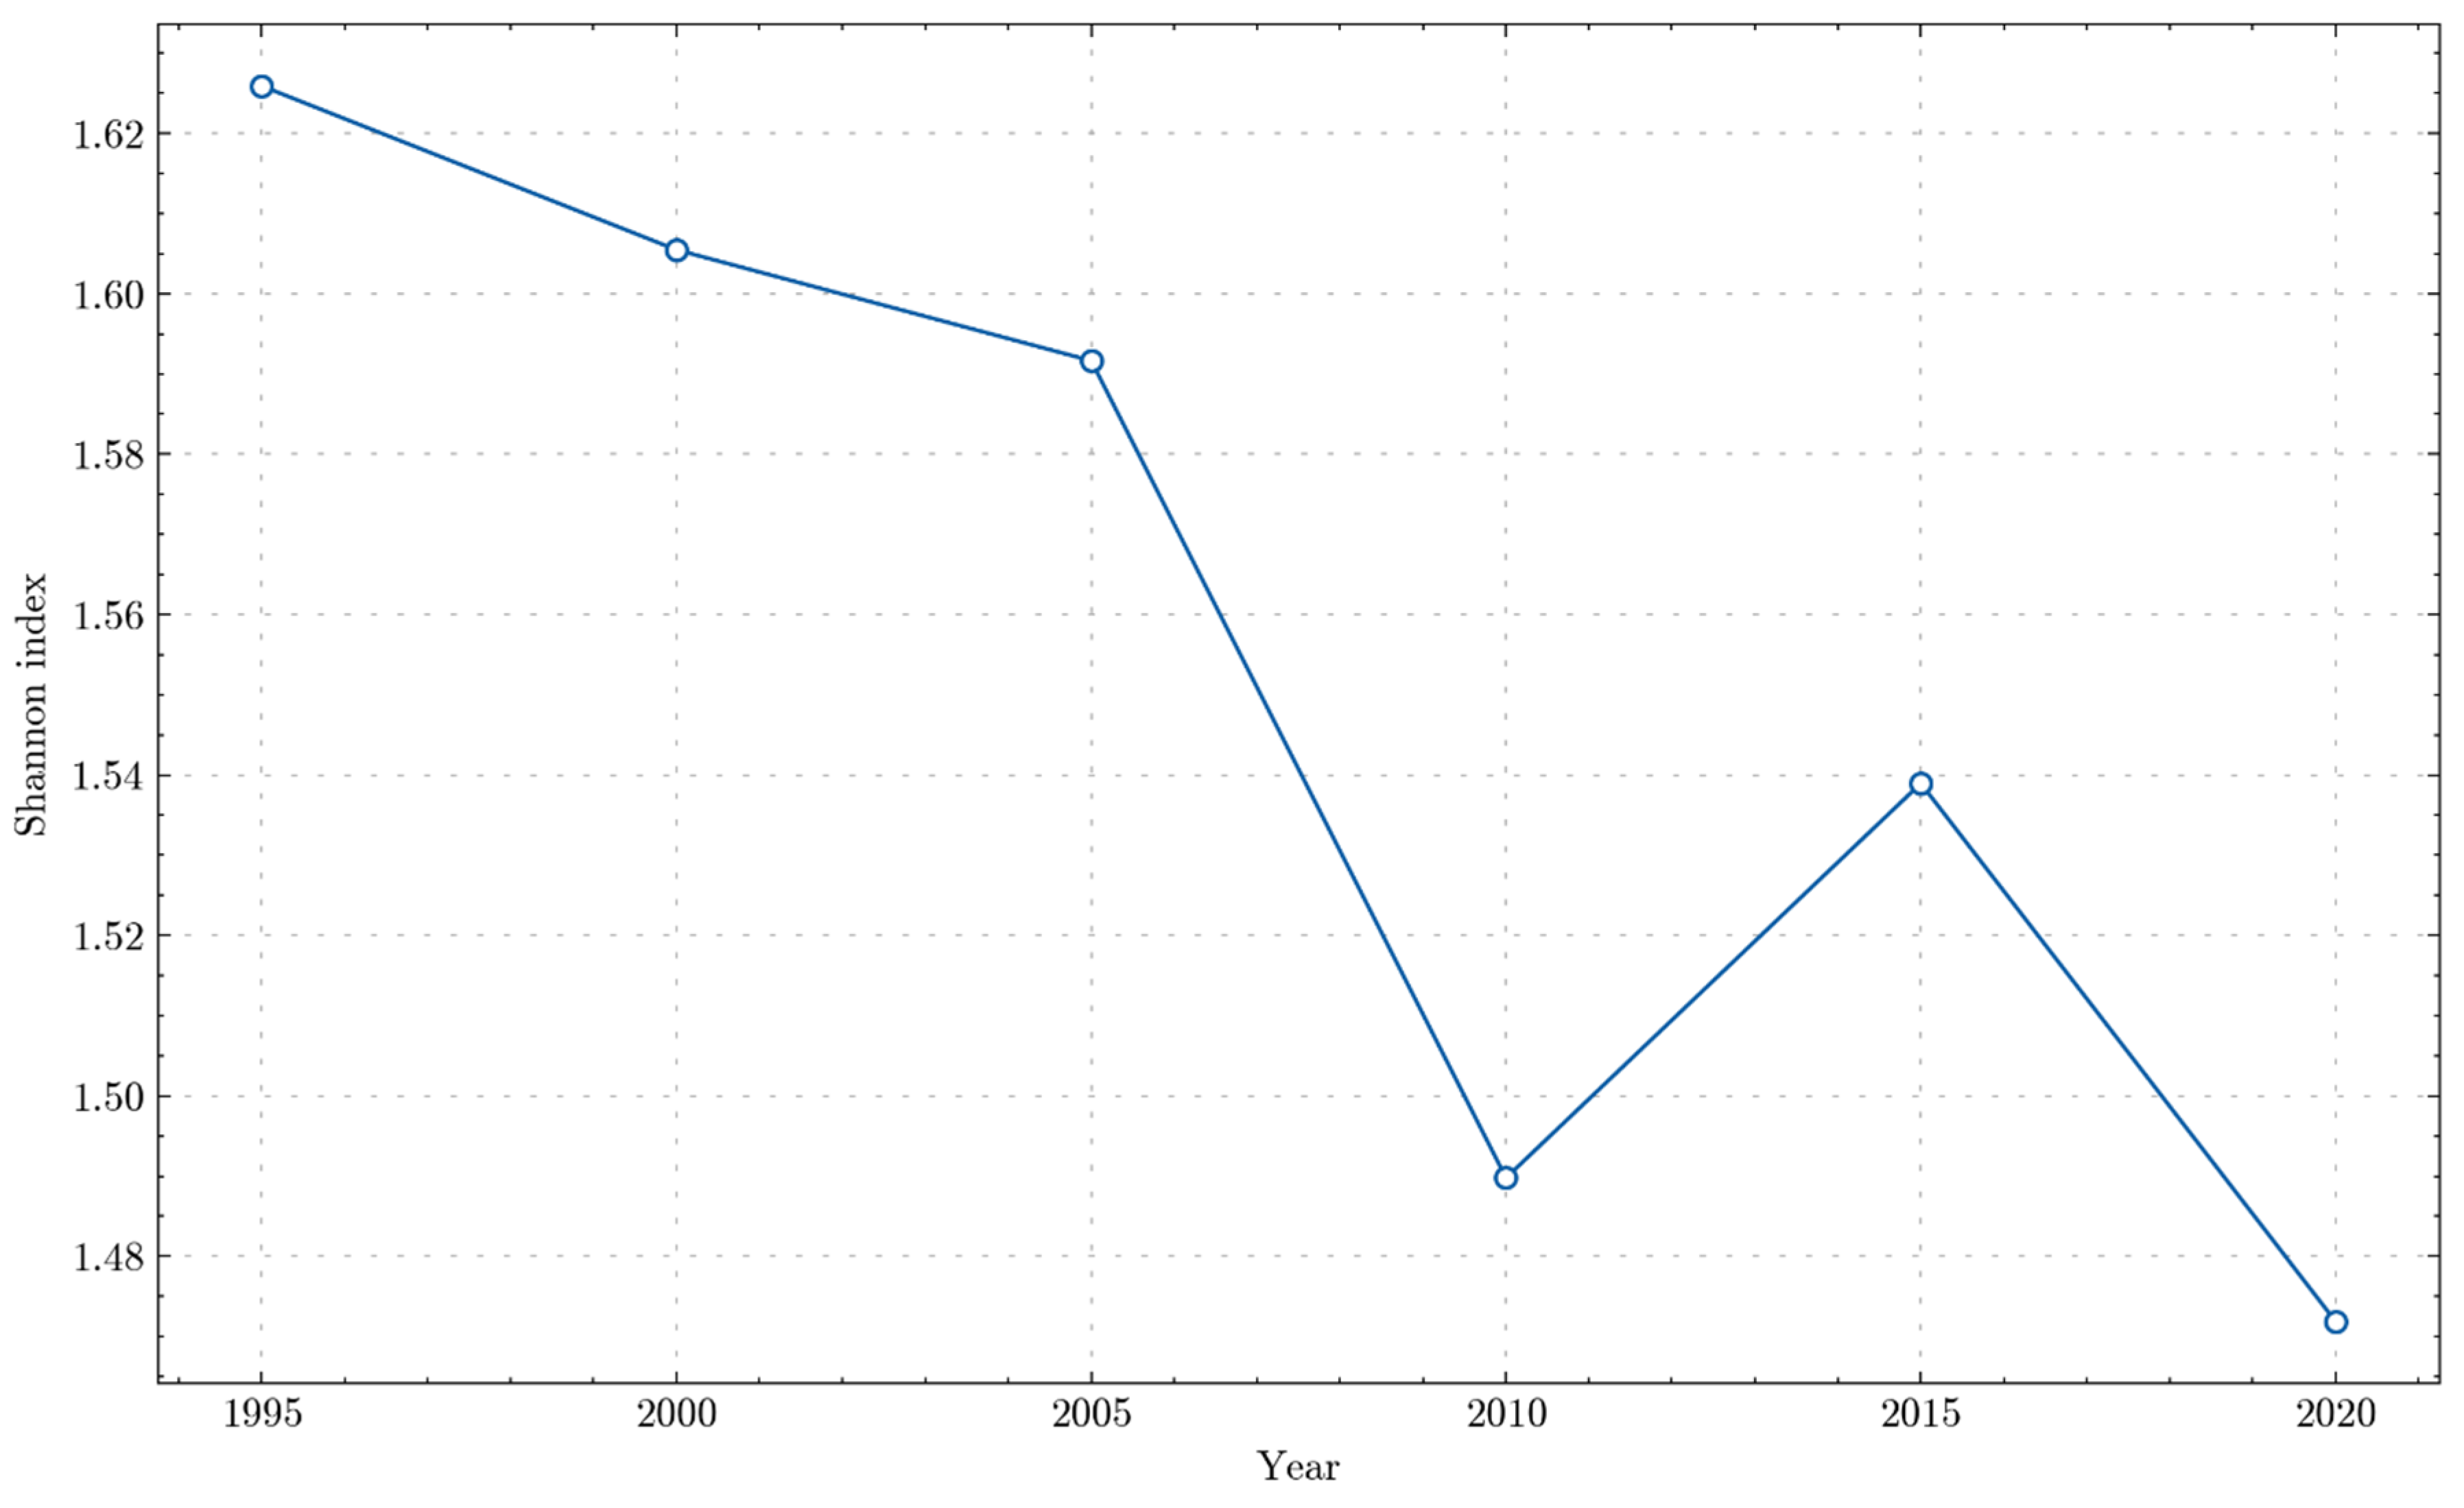
Starting in the mid-1990s, there’s a discernible downtrend in the index, indicating a gradual homogenization of the landscape. During this time, agricultural intensification or the expansion of urban areas may have led to a simplification of the landscape, reducing the variety of land cover types. This decline reflects a broader trend where economic development often comes at the cost of ecological diversity. The most striking feature of the graph is the precipitous fall in the Shannon Index between 2005 and 2010. This period likely corresponds to substantial land-use changes such as the conversion of varied natural habitats to agriculture or urban sprawl. The change suggests a concentration of land use activities, possibly driven by policy shifts or economic imperatives that favor certain types of land cover over others. Post-2010, there is a recovery in the diversity index, peaking around 2015, which could signify efforts to diversify land use possibly through environmental conservation programs or a deliberate policy-driven approach to balance agricultural, urban, and natural spaces. This increase could be indicative of positive environmental stewardship where the region saw a resurgence of various natural habitats or the implementation of sustainable land management practices. However, the index takes a downturn once more in the latter half of the decade, pointing to another phase of landscape consolidation. This could be tied to the geopolitical changes in the region, such as the reunification with the Russian Federation, and the subsequent alterations in land management, including the impact of the North Crimean Canal shutdown. The resulting water scarcity would have undoubtedly affected land use, potentially leading to the abandonment of certain agricultural practices and a consequent reduction in landscape diversity.
Throughout these years, the fluctuating Shannon index underscores the Kerch Peninsula’s sensitivity to both ecological shifts and human impacts. It suggests a landscape caught between the push of human economic activity and the pull of environmental conservation, with each force leaving its imprint on the diversity of the region’s mosaic of land covers.
Observing the graph (Figure 10) representing the contagion index for the Kerch Peninsula, we can discern significant variations over the years, reflective of underlying land-use dynamics.
Figure 10.
Dynamics of the contagion index for the Kerch peninsula in 1990-2019.
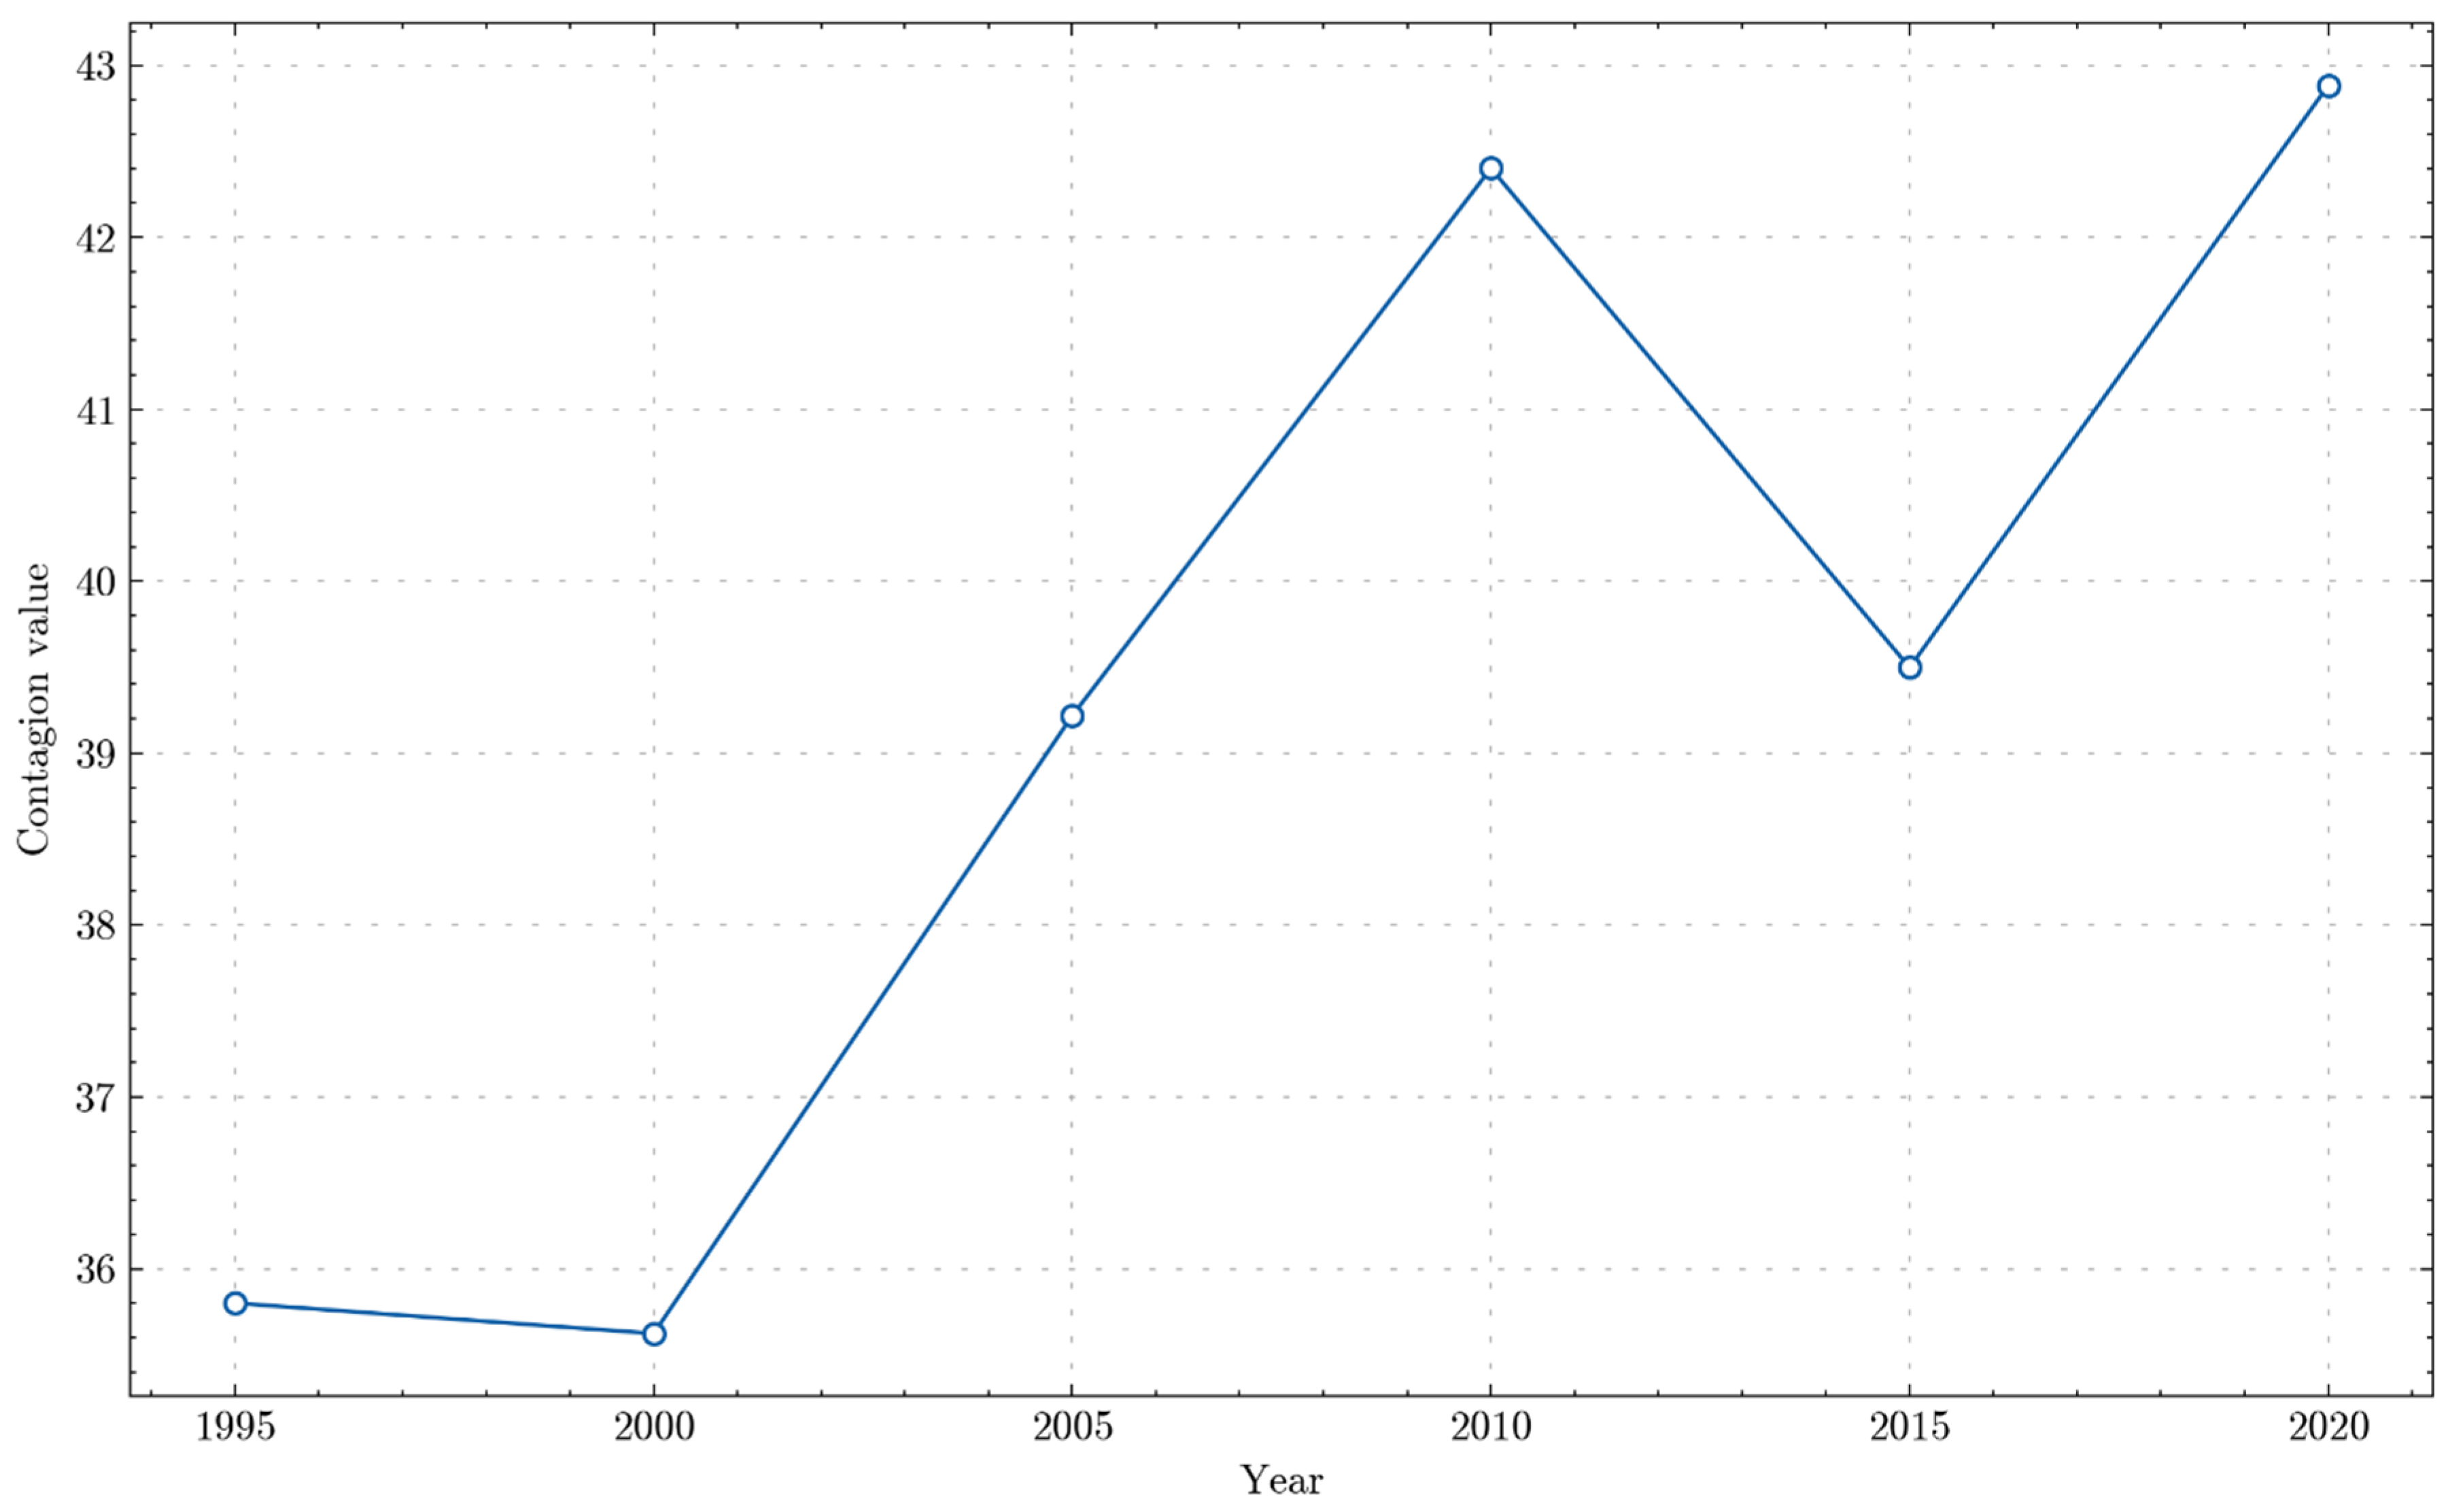
In the early phase, from 1995 to 2005, there’s a steady increase in the contagion index. This progression suggests a trend toward larger, more contiguous patches of the same land cover type, likely indicative of agricultural expansion or the consolidation of natural areas. Such a trend could be associated with policy initiatives aimed at boosting agricultural efficiency or possibly the result of large-scale land management practices promoting homogeneous habitats, like forest plantations or nature reserves. Between 2005 and 2010, the contagion index peaked, which could signal the apex of land cover consolidation. At this point, the landscape could be characterized by extensive, uninterrupted expanses of certain land cover types, such as vast fields of a single crop type or large areas of natural vegetation, potentially reducing edge effects and habitat fragmentation. From 2010 to 2015, there is a dramatic dip in the index. This sharp decline might be attributed to a significant restructuring of the landscape, possibly due to the fragmentation of previous land cover types into smaller, more disparate patches. This could result from various factors such as land redistribution, changes in agricultural practices due to economic shifts, or the introduction of more diverse land use regulations that promote mixed-use landscapes. Interestingly, after 2015, the contagion index once again rises sharply, suggesting a reconsolidation of the land cover types. In the context of the Kerch Peninsula, this could be interpreted as a positive response to the challenges brought on by geopolitical changes and water shortages. The landscape might have witnessed a reorganization where agricultural lands were redefined, potentially leading to the emergence of larger, more water-efficient agricultural patches or the regrouping of natural habitats as a part of ecological restoration efforts.
The fluctuations in the contagion index across these three decades underscores the dynamism of the Kerch Peninsula’s landscape. The shifts in the index capture the region’s adaptability and resilience in the face of significant environmental and political transformations, reflecting an ongoing negotiation between human activity and the need for sustainable land management and environmental conservation.
The entropy metric in landscape ecology is like the Shannon diversity index in that it measures the diversity of LULC types and their distribution across the landscape. However, entropy specifically gauges the randomness in the distribution of these patches. Higher entropy values indicate a more complex and diverse landscape configuration, where land cover types are more equally distributed and there’s a higher level of disorder or randomness. Conversely, lower values suggest a more ordered landscape with less complexity, possibly dominated by fewer land cover types.
Analyzing the entropy graph for the Kerch Peninsula from 1995 to around 2020 (Figure 11), we observe an initial gradual decline. This suggests the landscape was becoming less complex and more orderly, potentially due to the consolidation of land cover types. This might be the result of the expansion of monoculture in agriculture or the growth of uniform urban areas that reduce landscape complexity. The significant drop in entropy around 2005 indicates a rapid simplification of the landscape, which could correspond with intense land development or agricultural expansion that homogenized the land cover types. The uniformity implied by this drop could also be related to land policies or economic activities that promoted extensive areas of similar land uses, potentially reducing habitat heterogeneity, and increasing vulnerability to environmental changes. After 2010, there’s a noticeable increase in entropy, reaching a peak around 2015. This suggests a reversal of the previous trend, with the landscape becoming more diverse and complex. The recovery in entropy could be related to changes in land management that encouraged a variety of land uses, such as the introduction of diverse crop types, the abandonment of less profitable agricultural land which then returned to natural states, or policies aimed at enhancing environmental conservation and land use planning. The subsequent decline post-2015 could reflect another period of simplification, potentially exacerbated by the geopolitical changes in the region, including the rejoin of Crimea to Russian Federation and the subsequent loss of water resources. The entropy decrease in this phase might indicate a transition towards less diverse land uses because of the new constraints, leading to more uniformity in the landscape.
Figure 11.
Dynamics of the entropy index for the Kerch peninsula in 1990-2019.
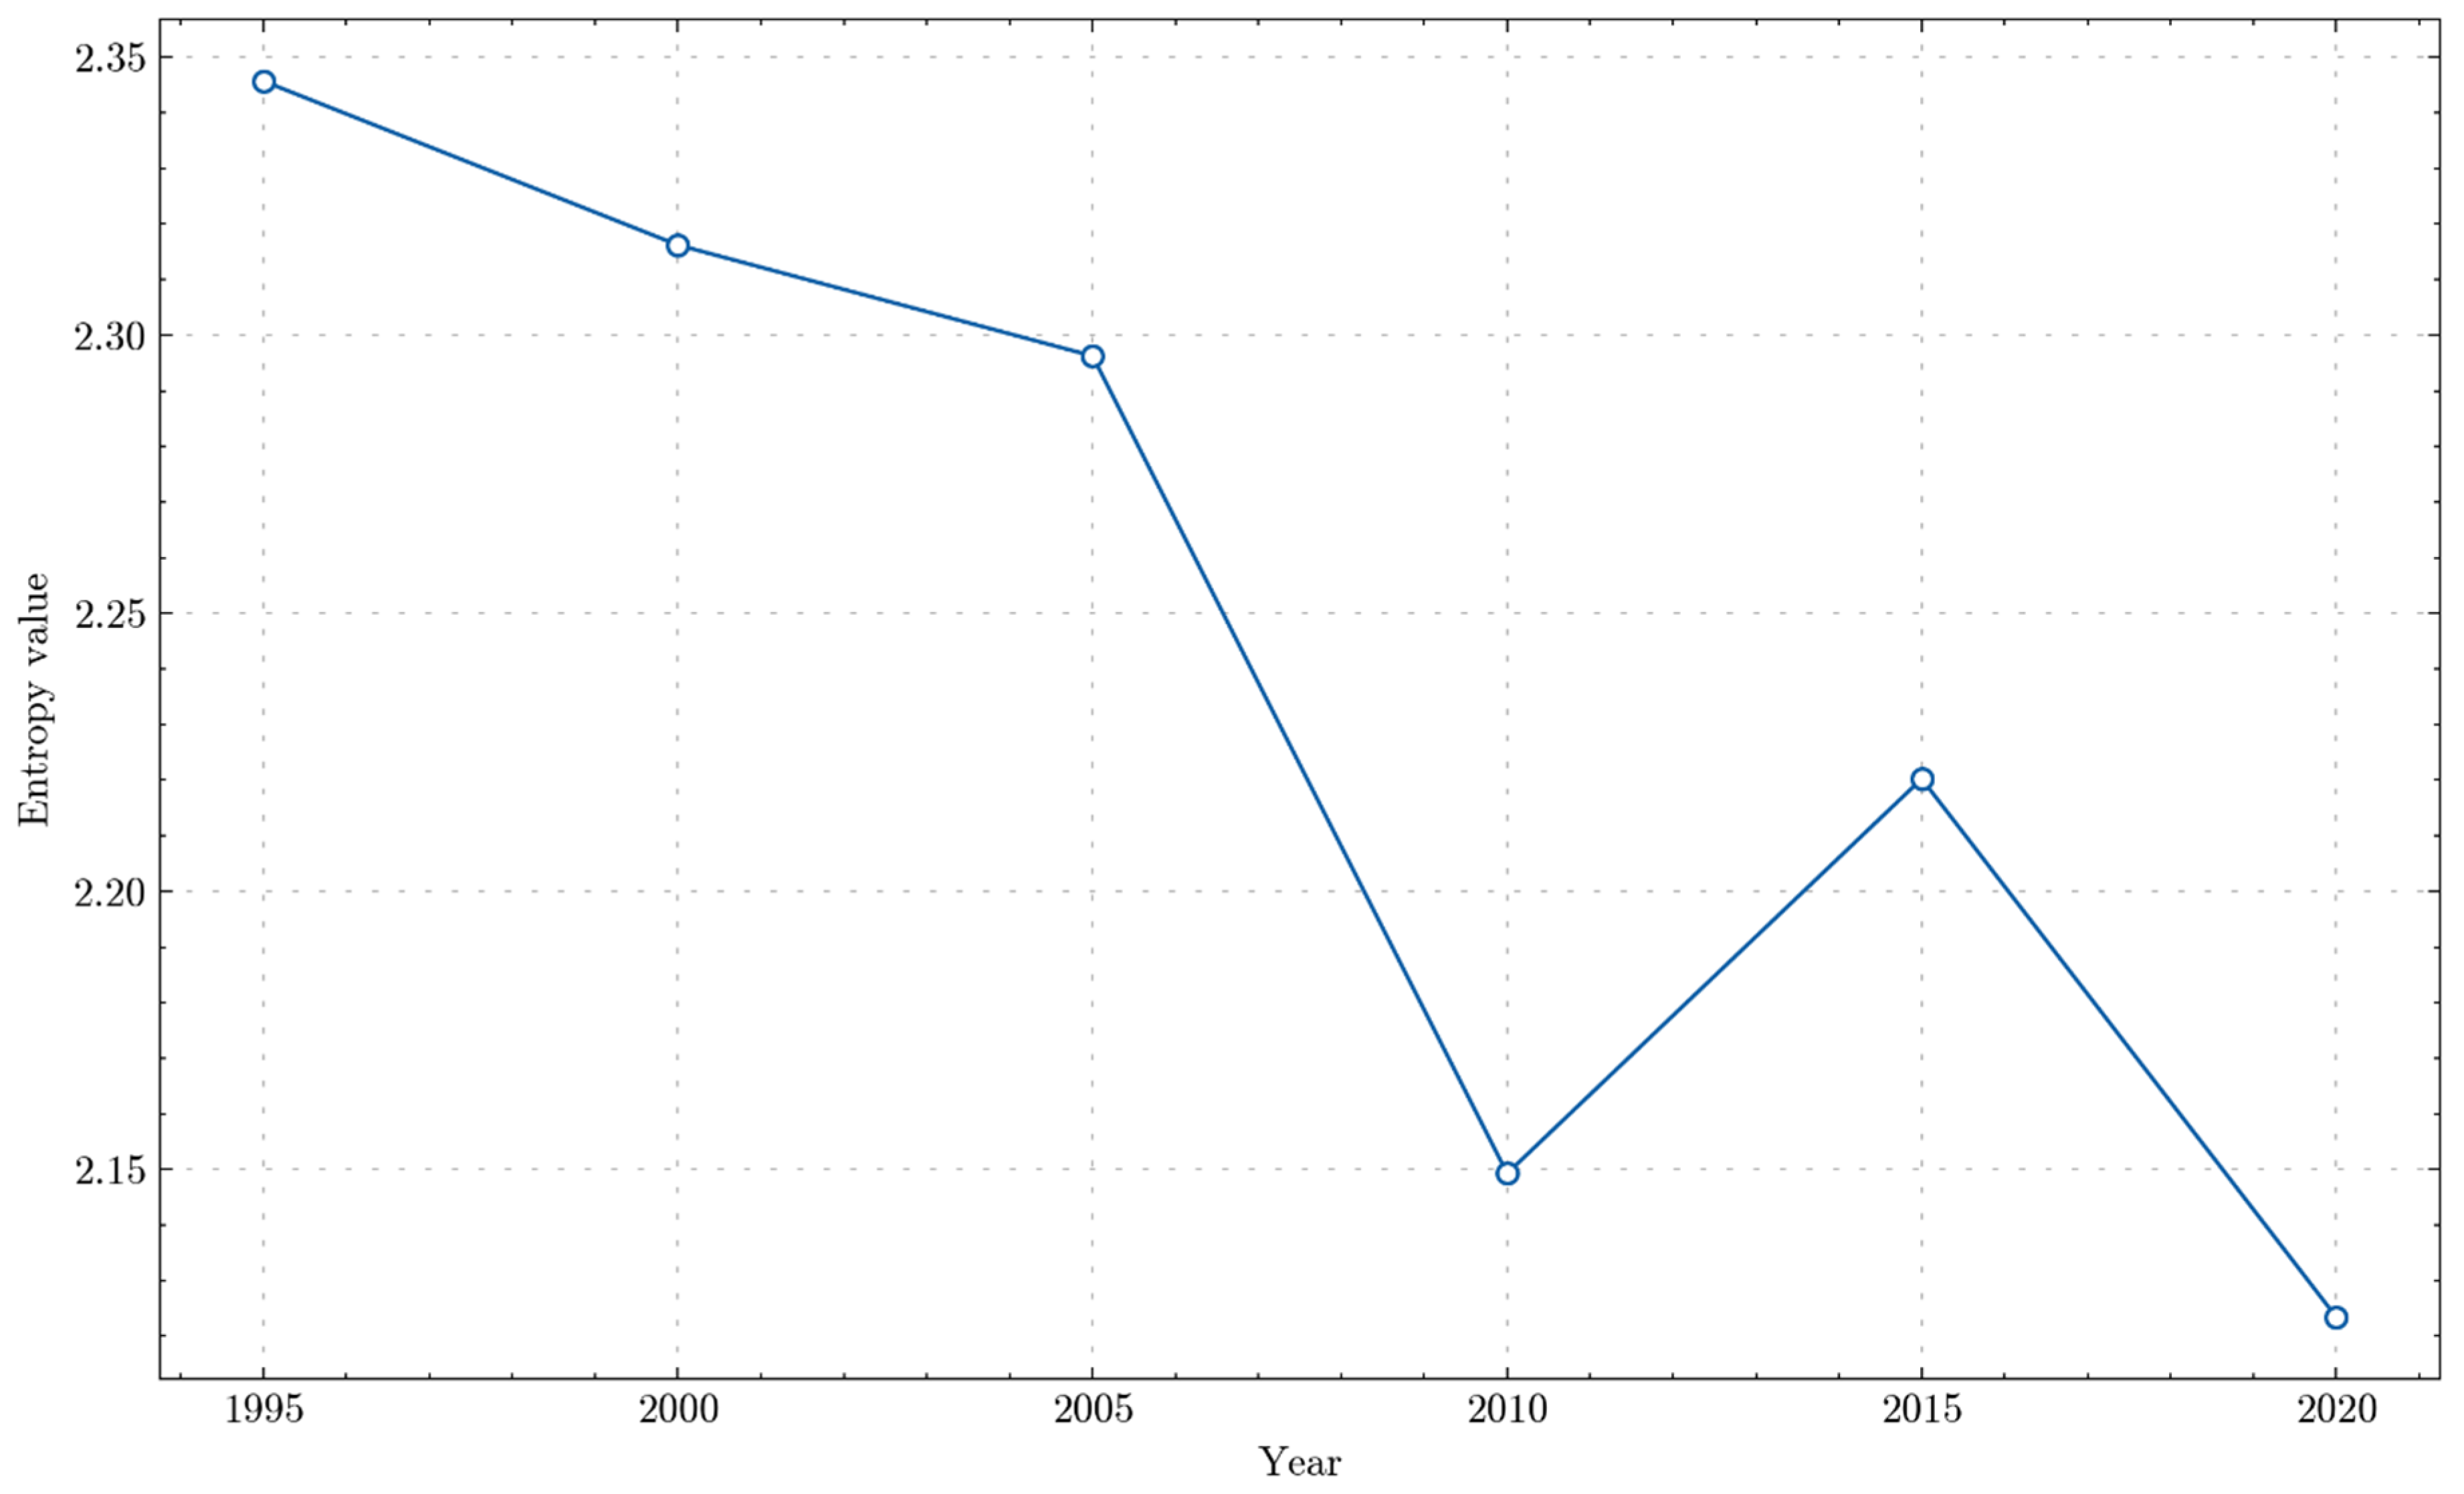
Overall, the entropy trend highlights the adaptive response of the Kerch Peninsula’s landscape to both internal management decisions and external geopolitical forces. The complexity of the landscape, as measured by entropy, offers insights into the resilience of the region’s ecological and socio-economic systems in facing change and managing diversity.
The proportion of landscape (PLAND) metric quantifies the percentage of the landscape occupied by each LULC class (Table 11).
Table 11.
Dynamics of the PLAND on the Kerch peninsula in 1990-2019 in %.
| Class name | 1990-1994 | 1995-1999 | 2000-2004 | 2005-2009 | 2010-2014 | 2015-2019 |
| Croplands | 17.00 | 26.00 | 10.86 | 9.98 | 16.56 | 9.05 |
| Grass Lands | 29.87 | 29.58 | 40.00 | 48.82 | 43.98 | 43.80 |
| High Vegetation | 3.53 | 1.27 | 5.29 | 2.40 | 2.88 | 0.81 |
| Barren Lands | 1.68 | 1.71 | 1.39 | 2.45 | 1.64 | 2.46 |
| Shrublands | 27.33 | 22.21 | 22.05 | 19.06 | 14.32 | 16.77 |
| Bare Soils | 17.52 | 15.08 | 16.83 | 13.39 | 17.29 | 24.24 |
| Urban Areas | 0.39 | 0.75 | 0.72 | 0.73 | 0.65 | 1.75 |
| Water Bodies | 2.67 | 3.41 | 2.86 | 3.18 | 2.70 | 1.13 |
In 1990-1994, croplands and grass lands were already prominent features of the landscape, with substantial coverage of shrublands as well. Notably, high vegetation, which represents forested areas, and bare Soils, also comprised a significant portion of the landscape. By the period 1995-1999, there was a noticeable increase in the proportion of croplands, which could be due to intensified agricultural practices or the conversion of other land cover types to agriculture. Conversely, high vegetation saw a decrease, possibly because of deforestation or land clearing for agriculture. In 2000-2004, a marked increase in the proportion of grass lands was observed, possibly reflecting a shift from intensive agricultural practices to more extensive, possibly grazing-oriented land use. This is consistent with the decreased proportion of croplands, suggesting some agricultural land might have been abandoned or converted back to natural states, increasing the heterogeneity of the landscape. By 2005-2009, grass lands dominated the landscape, perhaps a consequence of continued land-use changes or natural succession on abandoned agricultural lands. Meanwhile, croplands saw a further reduction, and urban areas remained a small but consistent feature, reflecting controlled urban growth. In 2010-2014, croplands increased again, reflecting a possible resurgence of agricultural activity, perhaps due to new agricultural policies or practices following the reunification. However, by 2015-2019, there is another reduction in croplands, alongside a significant increase in bare soils. This dramatic increase could be a direct consequence of the water shortages following the North Crimean Canal shutdown, leading to the abandonment of water-intensive crops and an increase in non-vegetated, potentially degraded lands. Throughout these years, the proportions of grass lands remain relatively stable, suggesting that grassland ecosystems have been less affected by changes in land use policies or environmental conditions. The continual presence of urban areas, although small, indicates ongoing but measured development within the region.
The fluctuating proportions of each LULC class across the 30-year span reflect the Kerch Peninsula’s dynamic response to a combination of environmental challenges and regional policies. The landscape’s adaptability is evident in the shifting PLAND values, showcasing how land use has evolved to meet changing socio-economic needs while also responding to environmental constraints.
The number of patches (NP) metric in landscape ecology provides an understanding of fragmentation or subdivision of each LULC class across a landscape. It indicates how many discrete spatial units or “patches” exist for each class. Higher NP values suggest a more fragmented landscape with smaller, isolated patches of a given class, while lower values suggest larger, more contiguous patches (Table 12).
Table 12.
Dynamics of the number of patches on the Kerch peninsula in 1990-2019.
| Class name | 1990-1994 | 1995-1999 | 2000-2004 | 2005-2009 | 2010-2014 | 2015-2019 |
| Croplands | 47831 | 47037 | 22842 | 33214 | 44249 | 19944 |
| Grass Lands | 44573 | 53443 | 26078 | 19135 | 26656 | 24728 |
| High Vegetation | 15038 | 2792 | 18034 | 3727 | 7333 | 2179 |
| Barren Lands | 2412 | 3774 | 2013 | 3918 | 3314 | 1498 |
| Shrublands | 34804 | 41173 | 41501 | 52831 | 30776 | 43533 |
| Bare Soils | 39807 | 42192 | 38257 | 47167 | 40987 | 45437 |
| Urban Areas | 2584 | 5227 | 4297 | 3392 | 4371 | 7750 |
| Water Bodies | 639 | 690 | 603 | 502 | 625 | 509 |
In 1990-1994, the Kerch Peninsula exhibited high NP values for croplands, grass lands, and bare soils, indicating a fragmented agricultural landscape and a patchy distribution of non-vegetated areas. Shrublands and high vegetation also showed significant fragmentation. From 1995-1999, there was an increase in the number of patches for most classes, especially notable for grass lands and bare soils. This could reflect changes in land management practices, leading to a more heterogeneously managed landscape or the subdivision of agricultural land. Notably, high vegetation patches decreased dramatically, which could be indicative of consolidation efforts or deforestation leading to fewer but larger forest patches. In 2000-2004, croplands patches decreased substantially, perhaps due to consolidation of farmland or a shift towards larger agricultural holdings. Meanwhile, high vegetation patches increased significantly, possibly due to reforestation initiatives or natural forest regeneration leading to more but smaller patches of forested areas. By 2005-2009, the number of patches increased for shrublands, bare soils, and particularly for croplands, indicating a reversal from previous consolidation trends, possibly due to land abandonment or the diversification of agricultural practices. In 2010-2014, the NP for croplands soared, reflecting a further fragmentation of agricultural lands. This could be due to the subdivision of land for different uses or the impact of policy changes. Urban areas also saw an increase in the NP, suggesting ongoing urban expansion and development into smaller discrete units. By 2015-2019, the number of patches for croplands decreased once again, indicating a possible reconsolidation of agricultural lands, perhaps as an adaptive response to changing environmental conditions such as water scarcity. Conversely, shrublands and bare soils saw their highest number of patches in the 30-year span, which may reflect land cover changes due to natural succession on abandoned lands or the spread of non-vegetated areas due to the water crisis.
In 1990-1994, the Kerch Peninsula had relatively high patch density (PD) values for croplands and grass lands, and even higher for bare soils, indicating a highly fragmented landscape with numerous small patches. This could be a result of varied agricultural practices or the existence of many small natural areas within a matrix of other land uses (Table 13).
Table 13.
Dynamics of the number of patches on the Kerch peninsula in 1990-2019.
| Class name | 1990-1994 | 1995-1999 | 2000-2004 | 2005-2009 | 2010-2014 | 2015-2019 |
| Croplands | 16.48 | 16.22 | 7.87 | 11.45 | 15.24 | 6.88 |
| Grass Lands | 15.36 | 18.43 | 8.99 | 6.60 | 9.18 | 8.53 |
| High Vegetation | 5.18 | 0.96 | 6.21 | 1.28 | 2.53 | 0.75 |
| Barren Lands | 0.83 | 1.30 | 0.69 | 1.35 | 1.14 | 0.52 |
| Shrublands | 11.99 | 14.20 | 14.30 | 18.21 | 10.60 | 15.01 |
| Bare Soils | 13.72 | 14.55 | 13.18 | 16.26 | 14.12 | 15.67 |
| Urban Areas | 0.89 | 1.80 | 1.48 | 1.17 | 1.51 | 2.67 |
| Water Bodies | 0.22 | 0.24 | 0.21 | 0.17 | 0.22 | 0.18 |
From 1995-1999, there’s a slight decrease in PD for croplands, but an increase for grass lands and bare soils, suggesting a continued fragmentation of these classes. Interestingly, the PD for high vegetation drops significantly, possibly due to consolidation into larger forested areas or afforestation efforts. In 2000-2004, croplands show a substantial decrease in PD, hinting at the consolidation of agricultural lands into larger patches, possibly due to changes in agricultural policies or practices. High vegetation sees an increase in PD, indicating more, but smaller, patches of forested areas, which could be due to natural regeneration or deliberate reforestation. By 2005-2009, croplands’ PD rises again, which might reflect a subdivision of agricultural lands into smaller units. This period also shows a rise in PD for shrublands, suggesting an increase in fragmentation of these areas, which could be due to natural land cover changes or shifts in land use. In 2010-2014, the PD for croplands spiked, pointing to a significant fragmentation of agricultural land, which could be related to the diversification of crop types. However, by 2015-2019, the PD for croplands falls, suggesting a trend towards fewer, larger agricultural patches. Throughout these years, urban areas also show an increasing trend in PD, reflecting the ongoing development of urban spaces into many small, scattered units. The decrease in PD for high vegetation by 2015-2019 suggests possible deforestation or consolidation of forest patches.
3.3. LULC Prediction
Analyzing the Table 14 comparing predicted and actual areas of LULC for the Kerch Peninsula between 2000-2004, we observe interesting trends and discrepancies. The predicted areas for croplands were much larger than the actual, which could imply the model’s drivers overestimated agricultural expansion or didn’t fully account for factors limiting growth, like policy changes or market shifts. Grasslands, conversely, were underpredicted, possibly indicating a shift in land use to more extensive pastoral activities or natural reclamation of abandoned farmlands, which weren’t captured by the model.
Table 14.
Comparison of LULC class areas between actual and predicted scenarios in 2000-2004 period on Kerch Peninsula.
Table 14.
Comparison of LULC class areas between actual and predicted scenarios in 2000-2004 period on Kerch Peninsula.
| LULC Class | Predicted Area, km² | Actual Area, km² | Difference, km² |
| Croplands | 681.48 | 315.25 | +366.23 |
| Grass Lands | 945.19 | 1160.78 | -215.59 |
| High Vegetation | 42.39 | 153.66 | -111.27 |
| Barren Lands | 59.20 | 40.03 | +19.17 |
| Shrublands | 651.65 | 640.07 | +11.58 |
| Bare Soils | 383.33 | 488.43 | -105.10 |
| Urban Areas | 27.12 | 20.82 | +6.30 |
| Water Bodies | 108.88 | 81.70 | +27.18 |
High vegetation areas also saw a shortfall in prediction, suggesting that conservation efforts or natural forest regeneration may have been more successful than anticipated, pointing to possible gaps in the model’s environmental consideration. For barren lands, the slight overprediction hints at an expected degree of land degradation that may have been mitigated by effective land management or an underestimation of the landscape’s natural resilience. Shrublands predictions were close to reality, showing that the model was well-tuned to the factors affecting this land cover type. Bare soils had a noticeable underprediction, which might reflect unanticipated erosion or other ecological processes exposing more soil than expected. Urban areas were slightly overestimated by the model, suggesting an optimistic forecast of urban sprawl or perhaps an overestimation of development pressures. Lastly, water bodies were overrepresented in the predictions, which could result from not fully considering changes in water management practices or the impacts of climatic variations on water levels.
The spatial analysis of the maps (Figure 12) reveals the nuanced interplay of land cover changes. Predicted croplands expansively blanket the landscape, suggesting an optimistic view of agricultural spread that reality does not mirror. Actual grasslands, however, seem to creep into spaces where other land covers were expected, a testament to the land’s natural succession or a shift in land management that eluded the model’s foresight. Observing high vegetation, the actual map is more generous with its swathes of green than the predicted, hinting at successful forestation efforts or nature’s unfettered reclamation of land. Conversely, the predicted map’s barren lands paint a harsher picture than what came to pass, overestimating environmental degradation. Shrublands align closely between predicted and actual, indicating a well-calibrated aspect of the model. However, the reality of bare soils tells a story of greater exposure than expected, possibly reflecting activities that stripped the land more than the model could predict. Urban expansion is modestly overrepresented in the prediction, suggesting an anticipated growth that materialized less aggressively, possibly curbed by planning regulations or other societal factors. Finally, the predicted abundance of water bodies does not hold water when compared to the actual landscape, where such features are less prominent, likely altered by human intervention or ecological changes.
Figure 12.
Actual (A) and predicted (B) LULC maps for 2000-2004 period.
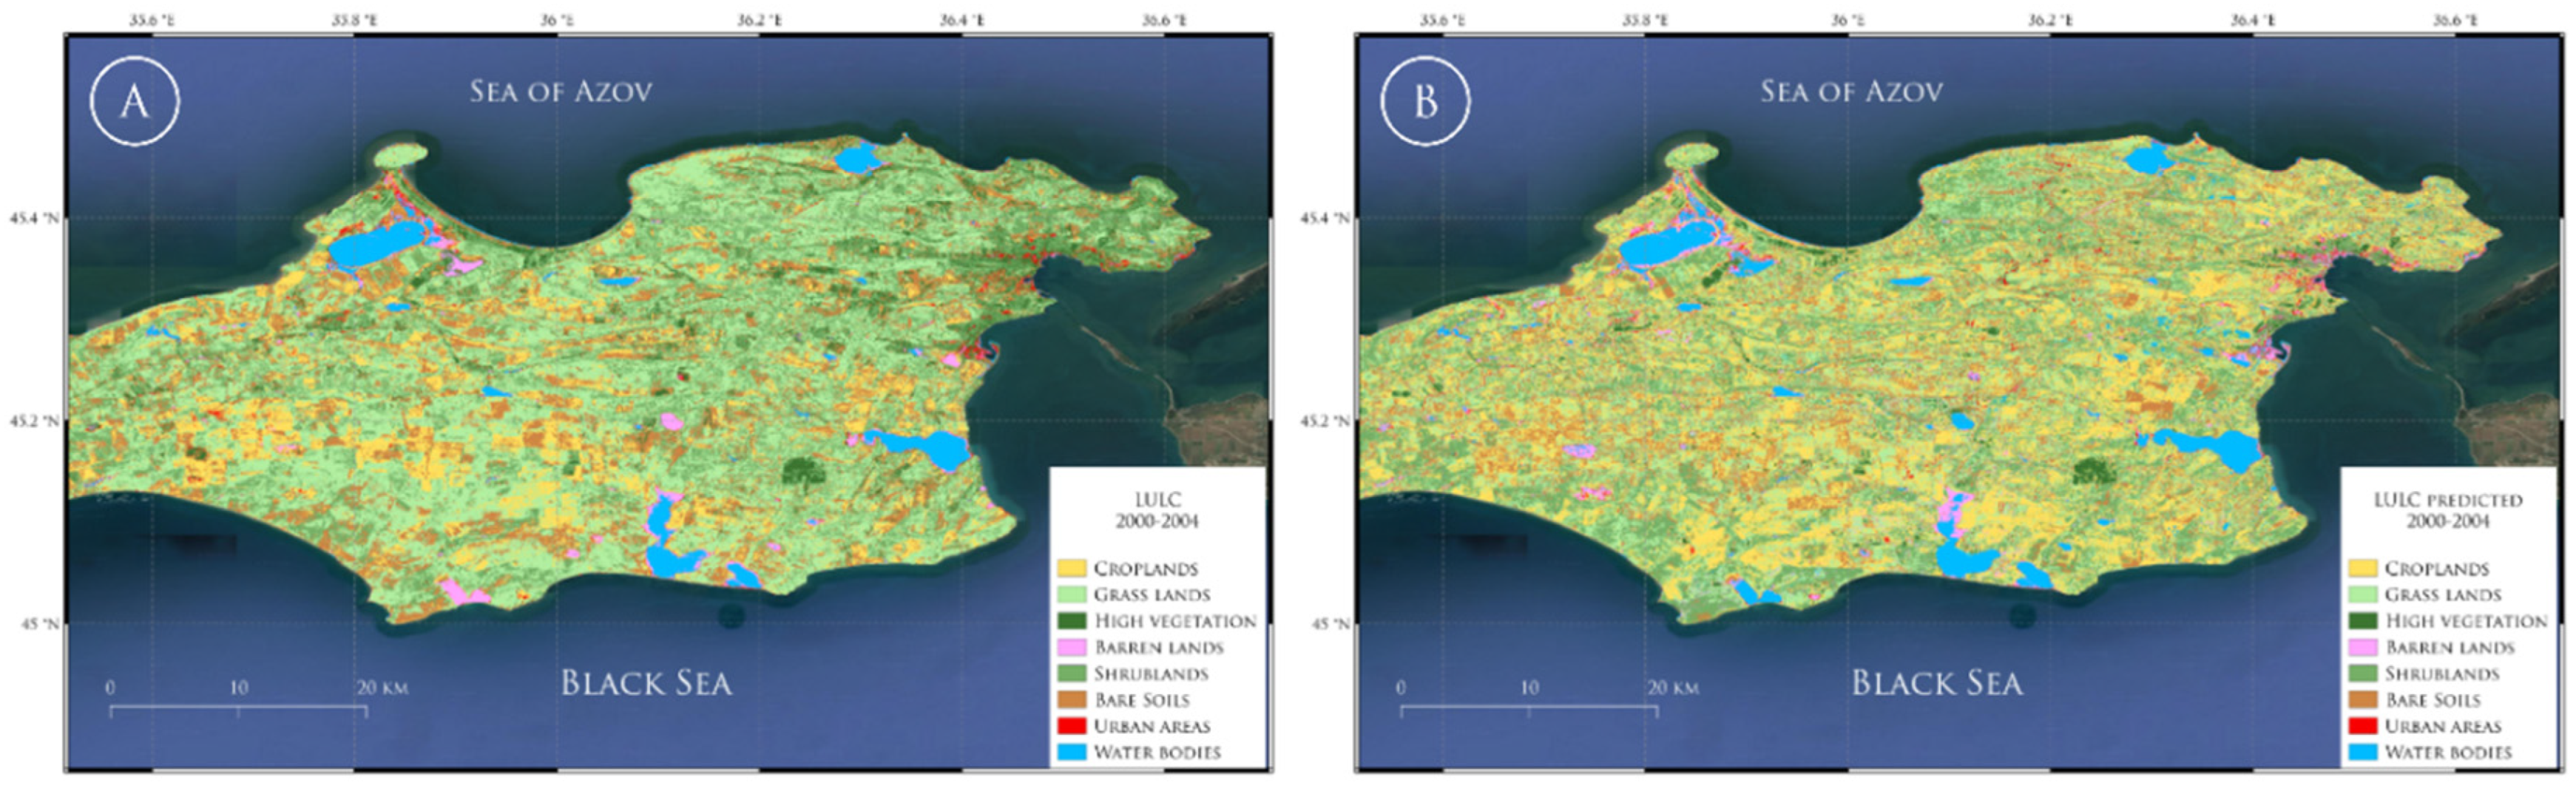
The spatial distribution in the predicted of the predicted and actual LULC areas for the period 2005-2009 on the Kerch Peninsula map shows notable variations, implying that the underlying drivers used in the prediction may have failed to capture all the factors influencing land use changes.
Analyzing the Table 15, the croplands were underpredicted by around 100 km², which may reflect an underestimation of agricultural development or failure to consider factors that would lead to its expansion during this period. In contrast, grass lands were overpredicted by approximately 175 km², possibly pointing to an overestimation of the transition from other LULC types to grass lands or an assumption about land management practices that did not occur as expected. High vegetation showed a surplus in the predicted area by about 57 km². This could mean the model predicted a larger scale of afforestation or natural vegetation growth than what was realized, or it could reflect the impacts of conservation efforts that were overestimated. The prediction for barren lands was less than the actual by around 32 km², which may indicate the model did not account for certain degradative processes affecting this LULC type. For shrublands, the model also underestimated the area by nearly 69 km², which could suggest a prediction that didn’t align with the natural progression or management of these lands. Bare soils showed a small underestimation in the model prediction by about 11 km², pointing to possible unexpected erosion or land clearing events. Urban areas were also underestimated by around 8 km², indicating the model may not have fully captured the extent of urban sprawl or development pressures. Water bodies were slightly overpredicted by the model by approximately 10 km², possibly due to not accounting for the impacts of climate variation or water management changes that could have reduced the extent of water bodies.
Table 15.
Comparison of LULC class areas between actual and predicted scenarios in 2005-2009 period on Kerch Peninsula.
Table 15.
Comparison of LULC class areas between actual and predicted scenarios in 2005-2009 period on Kerch Peninsula.
| LULC Class | Predicted Area, km² | Actual Area, km² | Difference, km² |
| Croplands | 189.13 | 289.52 | -100.39 |
| Grass Lands | 1591.08 | 1416.27 | +174.81 |
| High Vegetation | 126.65 | 69.55 | +57.10 |
| Barren Lands | 38.89 | 71.08 | -32.19 |
| Shrublands | 484.21 | 552.96 | -68.75 |
| Bare Soils | 377.34 | 388.54 | -11.20 |
| Urban Areas | 12.78 | 21.08 | -8.30 |
| Water Bodies | 82.14 | 92.25 | -10.11 |
The spatial analysis based on the maps for the 2005-2009 period (Figure 13) reveals a disparity in land cover distribution between the predicted and actual scenarios. In the predicted map, croplands do not extend as far as they do, pointing towards a conservative estimate of agricultural growth by the model. This suggests that actual developments in agricultural policy or market dynamics promoting cultivation were likely not fully integrated into the predictive framework. Grasslands, which sprawl over larger areas in the predicted map than in the actual one, suggest an overestimation of either the conversion of other lands into grasslands or the persistence of existing grasslands. It could reflect a misjudgment of either ecological succession or land management trends, perhaps assuming a continuity that was disrupted by changing land use practices. High vegetation is another category where prediction exceeds reality, indicating an expectation for more significant afforestation or natural regrowth than what transpired. This could hint at an overoptimistic view of conservation efforts or natural processes within the model’s assumptions. Conversely, barren lands appear underrepresented in the prediction, revealing an oversight of factors leading to land degradation or a lack of accounting for the resilience of certain landscapes that remained productive or recovered to other land cover types. The prediction closely approaching actual urban areas might signify a nuanced understanding of urban development factors within the model, though it still slightly underestimates the actual urban sprawl, potentially missing some nuances of urbanization trends or regulatory changes that encouraged development. Water bodies display minor overestimation in the predicted map, which could mean that the model did not fully consider the hydrological alterations or changes in water management that could lead to a reduction in water bodies’ extent.
Figure 13.
Actual (A) and predicted (B) LULC maps for 2005-2009 period.
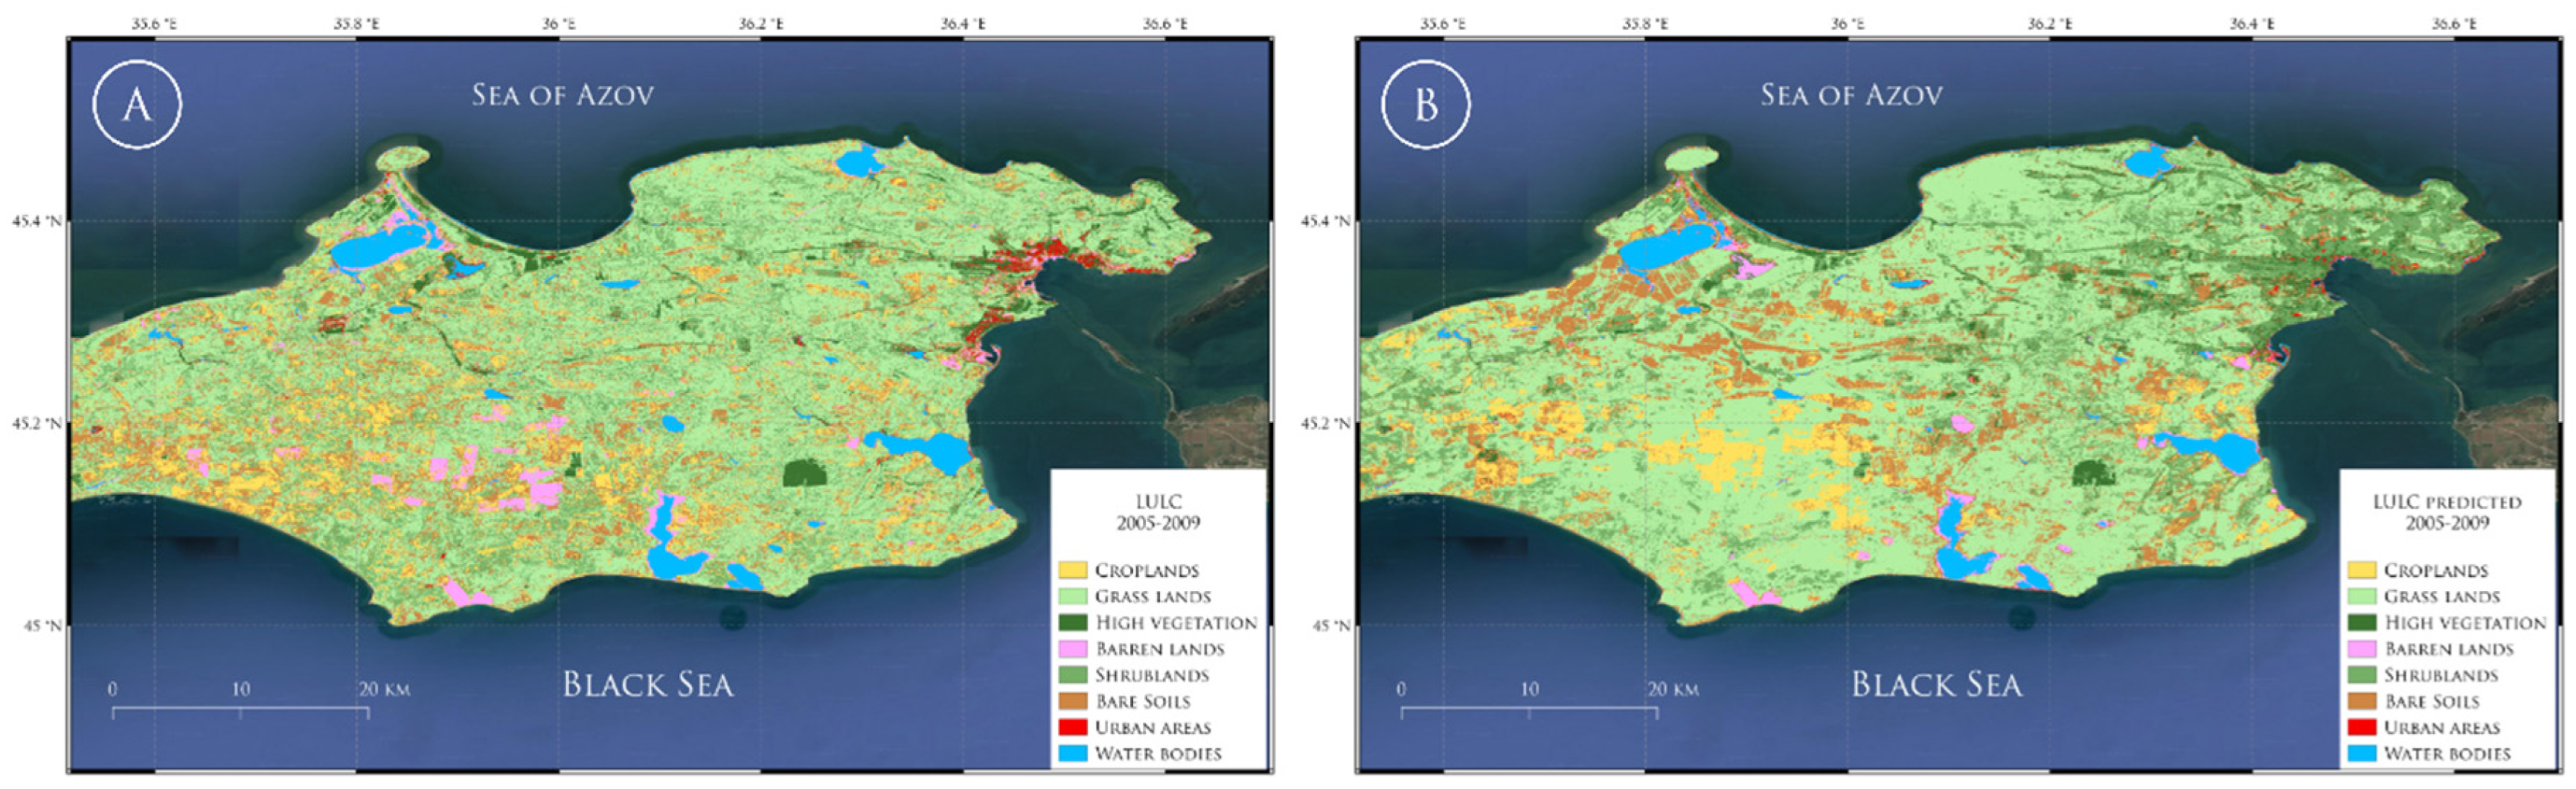
The period from 2010 to 2014 for the Kerch Peninsula shows a distinct difference in land cover when comparing the predicted values with the actual ones. In the actual scenario, croplands expanded more than the model predicted, which may indicate economic or policy changes favoring agricultural development were not anticipated (Table 16).
Table 16.
Comparison of LULC class areas between actual and predicted scenarios in 2010-2014 period on Kerch Peninsula.
Table 16.
Comparison of LULC class areas between actual and predicted scenarios in 2010-2014 period on Kerch Peninsula.
| LULC Class | Predicted Area, km² | Actual Area, km² | Difference, km² |
| Croplands | 260.87 | 480.59 | -219.72 |
| Grass Lands | 2040.24 | 1276.55 | +763.69 |
| High Vegetation | 73.83 | 83.54 | -9.71 |
| Barren Lands | 73.92 | 45.35 | +28.57 |
| Shrublands | 225.41 | 415.80 | -190.39 |
| Bare Soils | 112.08 | 501.71 | -389.63 |
| Urban Areas | 19.50 | 18.40 | +1.10 |
| Water Bodies | 95.40 | 78.04 | +17.36 |
The model’s overestimation of grassland areas could reflect an assumption about land conservation or usage that did not manifest as expected. The high vegetation predicted values were less than the actual, possibly pointing to effective environmental policies or natural regrowth that the model did not account for. Meanwhile, the predicted barren lands were over-calculated compared to the actual ones, perhaps due to an overestimation of land degradation or a lack of recovery factors included in the model. Shrublands and bare soils are both underrepresented in the prediction, hinting at a transition between these land cover types that the model did not fully capture, or other influencing factors such as climate variability that were not considered. The predicted urban area is notably less than the actual, which may signify the model did not fully incorporate factors driving urban expansion. Finally, the model slightly overestimates water bodies, suggesting a misalignment with actual hydrological changes or water management strategies implemented during this period.
The actual LULC map for 2010-2014 reveals that croplands are more extensively distributed than predicted, suggesting that agricultural expansion has been more robust than anticipated (Figure 14). This could be a result of policy initiatives promoting agriculture or better-than-expected crop yields. The visual analysis suggests that these expansions are primarily at the expense of areas that were predicted to remain as grasslands and shrublands, indicating a possible shift in land-use priorities. Grasslands were predicted to occupy the largest area, but the actual map shows a lesser extent. This deviation could point to a conversion of grassland areas to agricultural uses, possibly due to increased demand for food production or changes in land management practices. The disparity might also reflect ecological transitions, such as grasslands developing into shrublands or other types due to climatic or human-induced changes not captured by the predictive model. The predicted map underestimates the actual spread of barren lands and bare soils. This may be due to unanticipated erosive processes, perhaps exacerbated by human activities like construction or natural factors such as less rainfall, leading to a loss of vegetative cover and an increase in barren lands. Urban areas show a slight increase in actual size compared to predictions. This could be attributed to an acceleration in urban development, potentially driven by economic growth that the model did not fully account for. This urban expansion often appears to encroach upon areas that were predicted to remain as agricultural or natural lands. Lastly, the predicted map overestimates the water bodies compared to the actual map, suggesting changes in water management or inaccuracies in modeling water dynamics. This could result from alterations in water usage, such as the construction of dams, or natural changes like drought conditions leading to a reduction in water bodies.
Figure 14.
Actual (A) and predicted (B) LULC maps for 2010-2014 period.
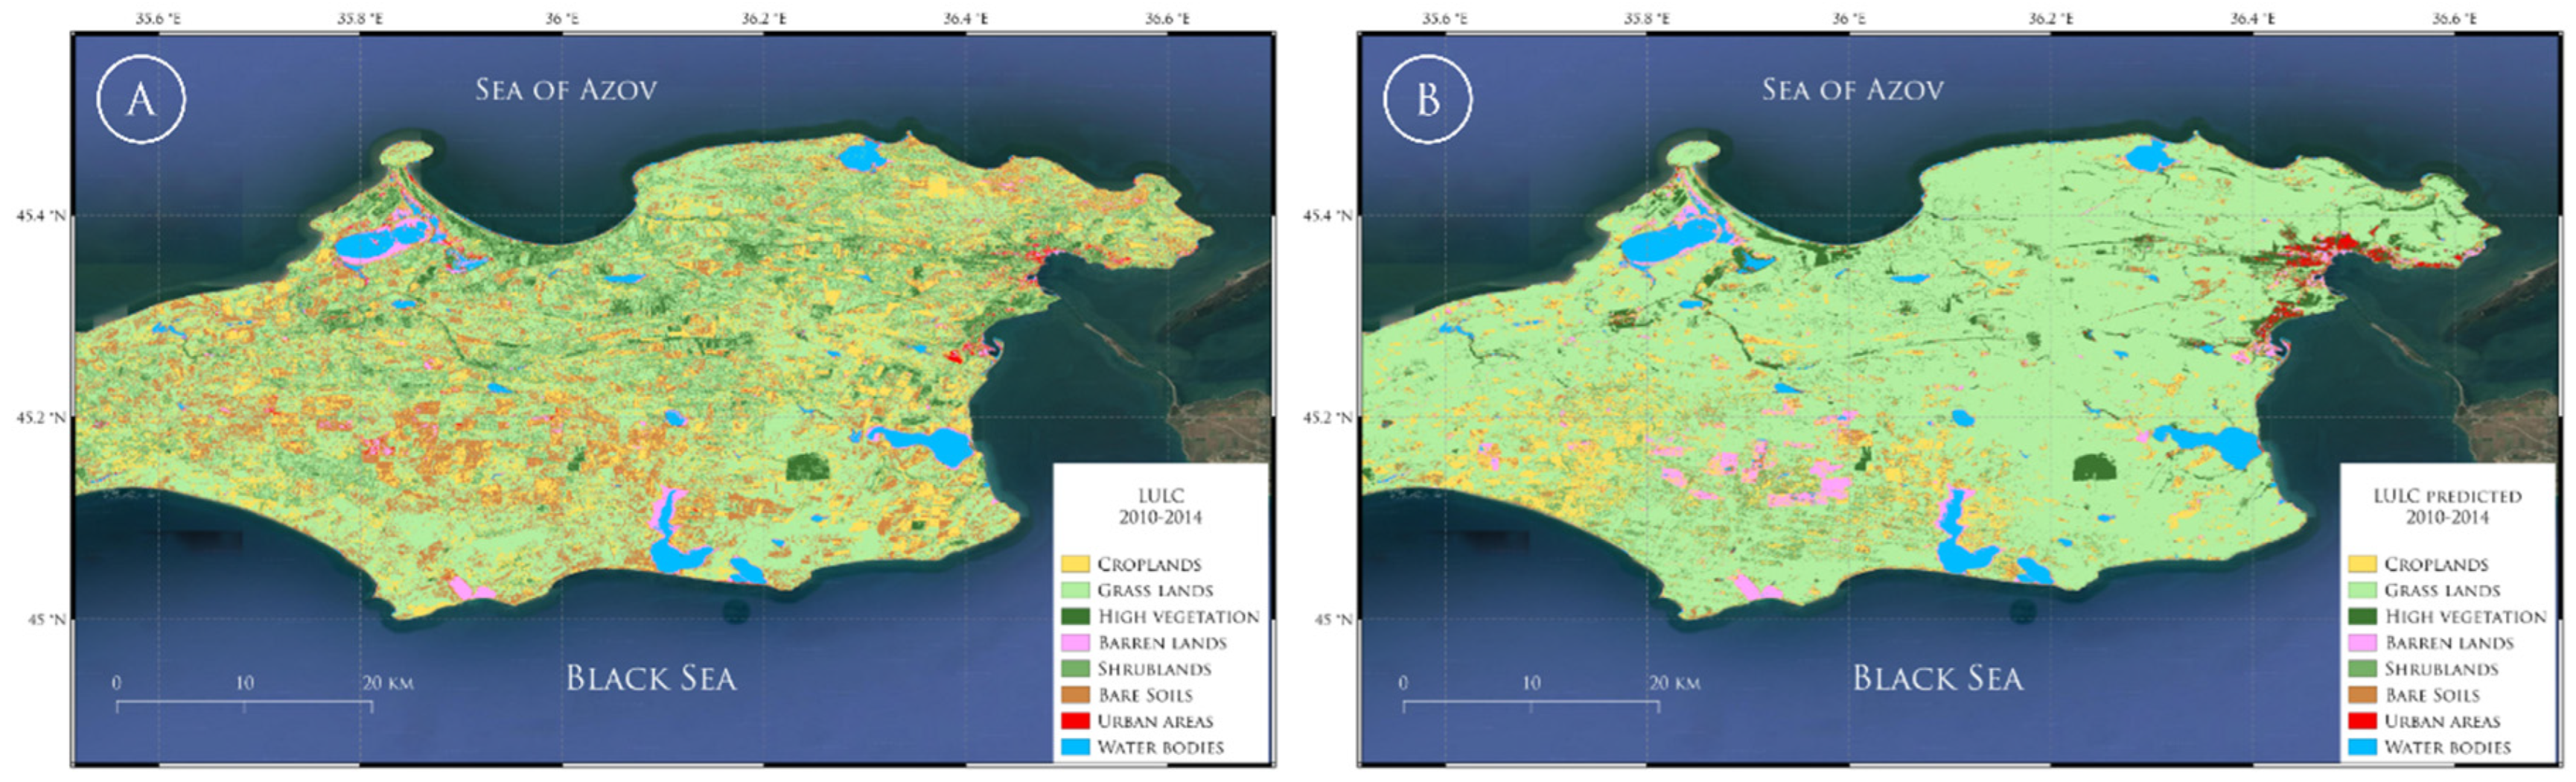
For the 2015-2019 period, the analysis of the actual versus predicted LULC data in the Kerch Peninsula reveals that predicted area for croplands was lower than the actual area, indicating a considerable expansion of agricultural activity beyond what was anticipated. This might suggest that drivers such as policy changes favoring agriculture, shifts in crop demand, or even improved agricultural techniques could have played a role in accelerating cropland spread (Table 17).
Table 17.
Comparison of LULC class areas between actual and predicted scenarios in 2015-2019 period on Kerch Peninsula.
Table 17.
Comparison of LULC class areas between actual and predicted scenarios in 2015-2019 period on Kerch Peninsula.
| LULC Class | Predicted Area, km² | Actual Area, km² | Difference, km² |
| Croplands | 327.46 | 262.46 | -65.00 |
| Grass Lands | 1665.97 | 1270.07 | -395.90 |
| High Vegetation | 90.74 | 23.38 | -67.36 |
| Barren Lands | 45.13 | 71.39 | +26.26 |
| Shrublands | 203.78 | 486.42 | +282.64 |
| Bare Soils | 481.21 | 702.91 | +221.70 |
| Urban Areas | 12.99 | 50.63 | +37.64 |
| Water Bodies | 75.46 | 32.70 | -42.76 |
Grasslands were significantly overrepresented in the predictions, with the actual area being substantially smaller. This suggests that the model’s assumptions about grassland persistence or expansion were not met, potentially due to these areas being repurposed for agriculture or urban development. High vegetation areas saw a dramatic reduction in the actual area compared to the predictions. This large discrepancy might be attributed to deforestation or conversion to other land uses, possibly for agricultural expansion or infrastructure development. The predicted areas for barren lands were less than the actual areas, suggesting that land degradation or natural processes like erosion could have been more prevalent than expected, leading to a loss of vegetative cover. For shrublands, the predicted areas were again smaller than the actual areas. This increase could be due to natural succession from grasslands to shrublands or from croplands lying fallow and returning to a more natural state. The model predicted more bare soils than were actually present, which could imply that soil conservation efforts have been more successful than anticipated, or that areas previously bare have been converted to other uses. Urban areas were predicted to be smaller than they actually were, pointing to a trend of urban expansion that exceeded model expectations. This could reflect economic growth leading to the expansion of existing urban areas or the creation of new ones. Lastly, the predicted area of water bodies was larger than the actual area, suggesting that water bodies have been reduced, possibly due to changes in climate patterns, increased water extraction for agricultural or urban use, or natural sedimentation processes filling in these areas.
Comparison of actual and predicted LULC maps for 2015-2019 period shows (Figure 15) that anticipated expansion of agricultural land, as posited by predictive models, was not fully realized in observed outcomes. This discrepancy may be attributed to an overestimation of agricultural proliferation, potentially neglecting the nuances of policy alterations or market forces that constrained agricultural growth. The variance underscores the challenge in accurately forecasting land use trends, emphasizing the necessity to integrate a comprehensive suite of variables into predictive algorithms. Contrastingly, grasslands were considerably overrepresented in predictions. This suggests a potential oversight in the model’s calibration, perhaps underestimating the resilience of grasslands to conversion or misjudging the rate of land use transition. The actual diminution of grasslands, in favor of shrublands and urban development, indicates a dynamic ecological succession and urbanization process not fully captured by the model. Such transitions underscore the imperative of incorporating adaptive land management and policy frameworks into LULC change models. Moreover, the projected versus actual areas of high vegetation and barren lands highlight a critical analysis point. The shortfall in high vegetation areas could point to a systemic underestimation of factors leading to deforestation or land repurposing for agriculture and urban expansion. Conversely, the actual increase in barren lands suggests a more pronounced environmental degradation or alteration in land management practices than the model anticipated, raising concerns about the peninsula’s ecological resilience and the accuracy of degradation predictors within LULC models. Urban expansion, exceeding model predictions, reflects the formidable impact of economic development and demographic shifts, outpacing historical trends and model expectations. This expansion into areas designated for alternate uses in predictions illustrates the potent influence of socio-economic drivers on land cover change, underscoring the need for models to adaptively account for socio-economic trends. Lastly, the overestimation of water bodies in predictions versus actual observations may indicate an optimistic projection of hydrological stability or a misapprehension of water management practices’ impact. This aspect accentuates the critical role of accurate hydrological modeling and the integration of water policy dynamics into comprehensive LULC predictive frameworks.
Figure 15.
Actual (A) and predicted (B) LULC maps for 2015-2019 period.
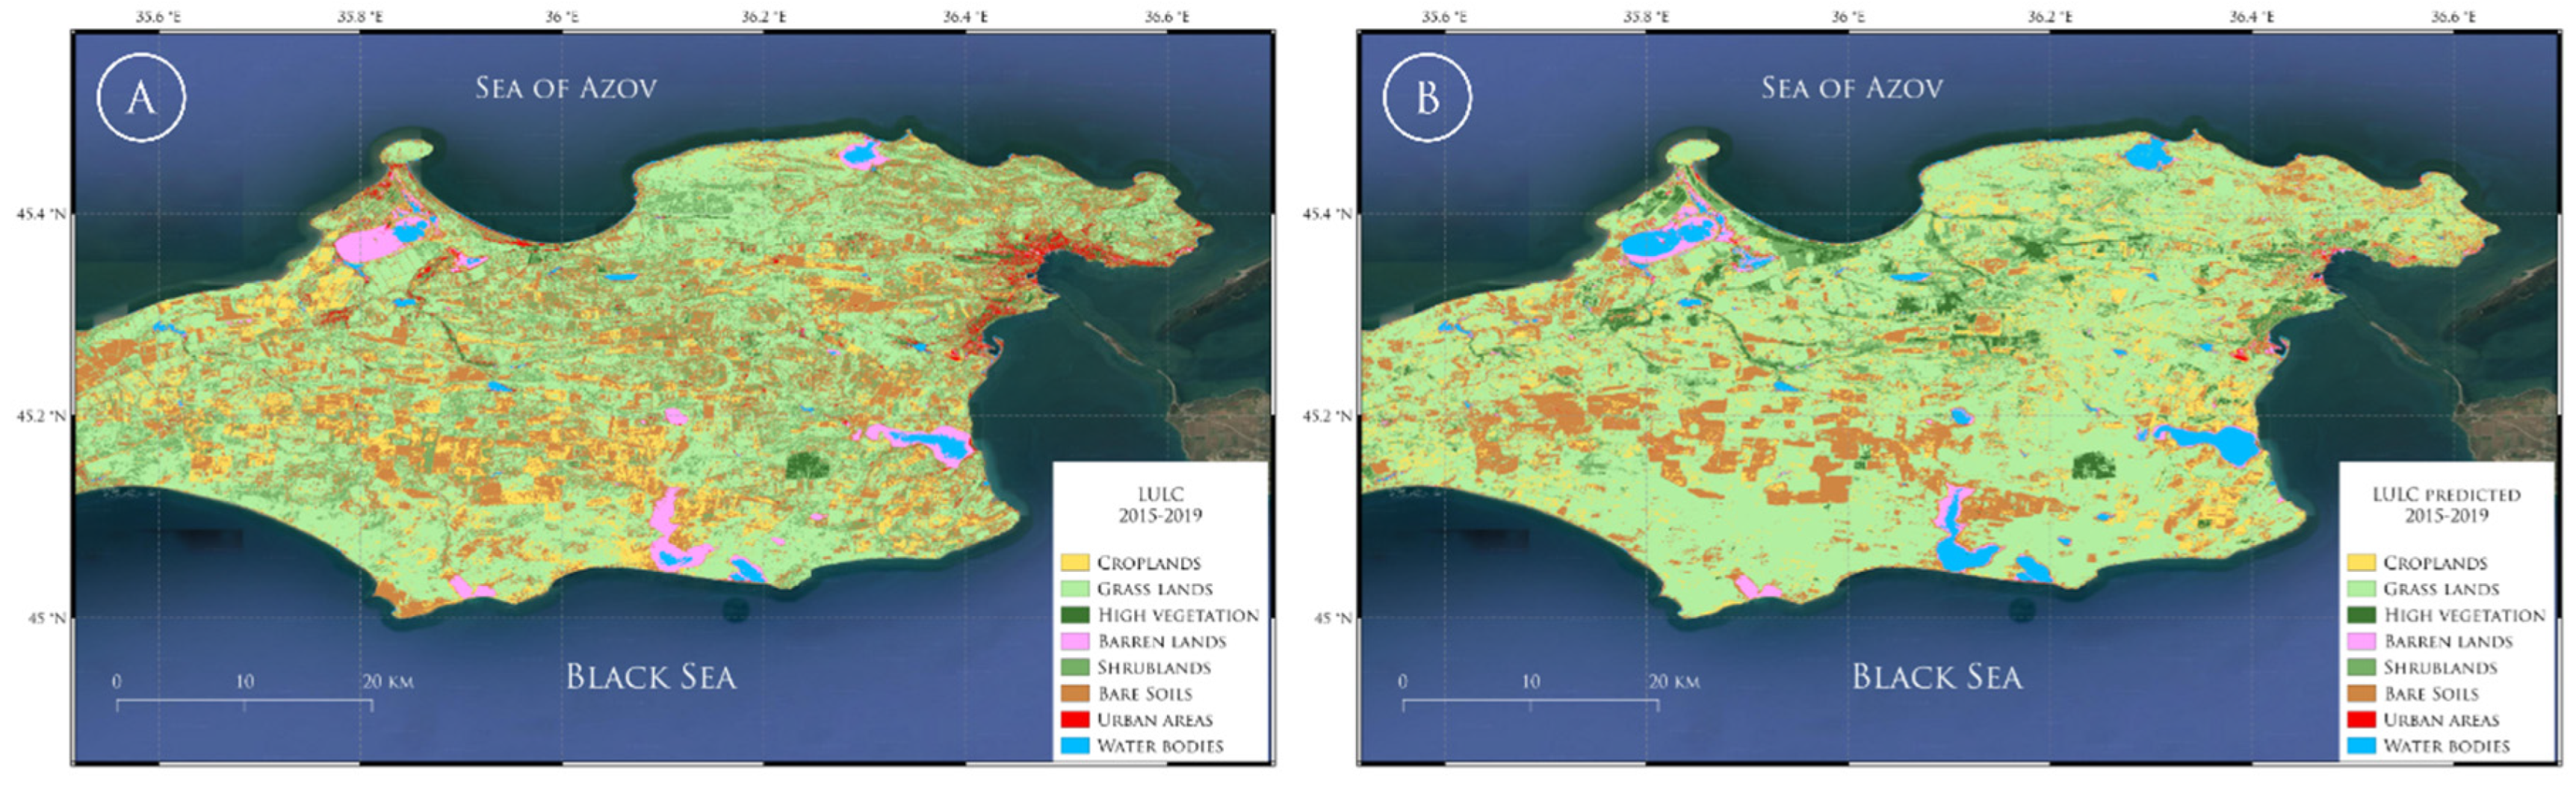
Analyzing the LULC data for the Kerch Peninsula from the 2015-2019 period (Figure 16) and comparing it with the predicted data for 2020-2024 can be seen that croplands have seen a significant decrease from the actual 262.46 km² in the 2015-2019 period to a predicted 131.99 km² for 2020-2024. This drastic reduction could be attributed to a shift in agricultural policies, changes in land use priorities, or the influence of natural factors that render the land less suitable for farming. grass lands, conversely, show a substantial increase from an actual 1270.07 km² to a predicted 1553.43 km². This expansion may reflect a move towards conserving natural grasslands, a decline in intensive agricultural practices, or possibly the natural succession of grasses over previously cultivated lands. High vegetation sees a slight decrease from 23.38 km² to 21.95 km² in the predicted period. The marginal change suggests relative stability in forested or vegetated areas, possibly due to successful conservation efforts or a balance between deforestation and reforestation initiatives. barren lands have increased from 71.39 km² to 75.79 km². This suggests ongoing soil erosion issues or land clearance activities that are striking the land off its vegetative cover, leading to more exposed terrain. Shrublands are predicted to decrease from 486.42 km² to 318.69 km², pointing to potential land conversion for other uses or changes in vegetation patterns due to climate or human influences. Bare soils, on the other hand, have shown a significant increase from 702.91 km² to an alarming 732.03 km². This could raise concerns regarding desertification processes, land mismanagement, or overexploitation of the land for construction and other developmental activities. Urban areas show a decrease in the predicted period, from 50.63 km² to 38.23 km². This unexpected decline could indicate a trend toward decentralization and rural development or successful policies limiting urban sprawl. Lastly, water bodies have reduced from 32.70 km² to 27.82 km². This reduction could be a result of water extraction for agricultural or urban needs, climate-induced changes affecting hydrological cycles, or the repurposing of water bodies for land development.
Figure 16.
Predicted LULC map for the 2020-2024 period.
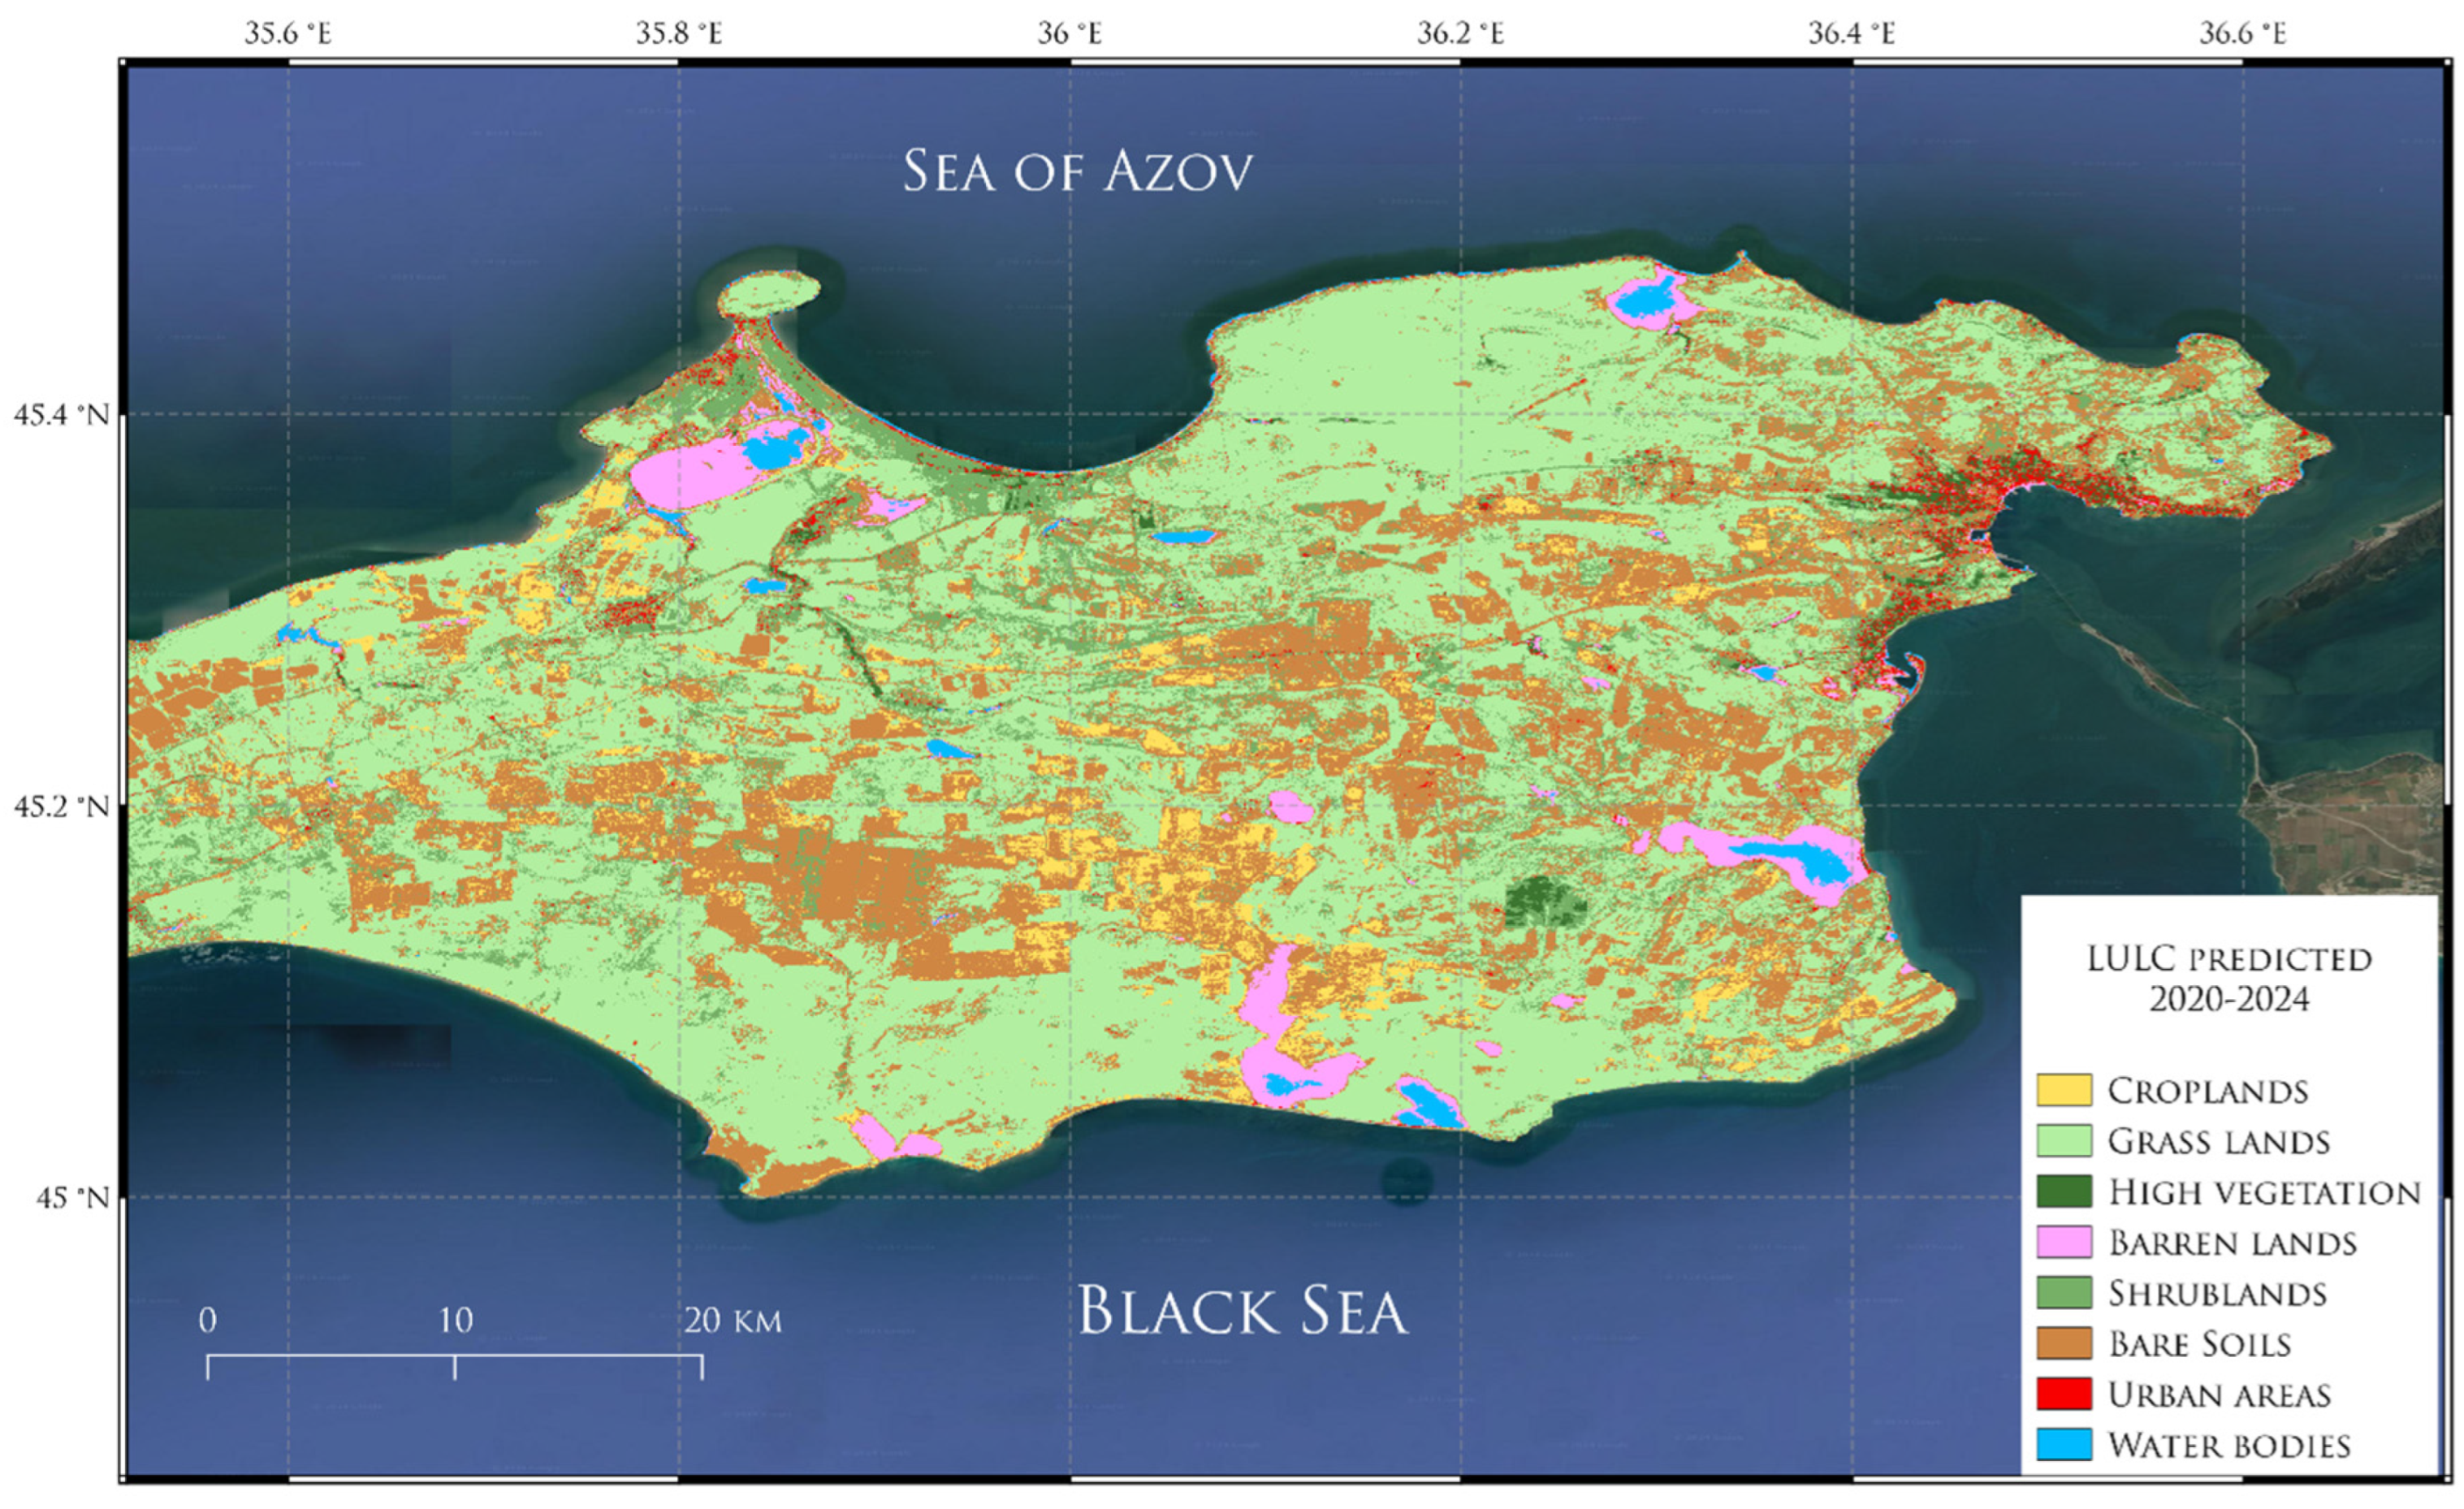
For the next predicted timestep the expansion of croplands to 145.45 km² in the 2025-2029 period (Figure 17) could reflect successful policy implementation or favorable agronomic conditions. Grasslands, the dominant landscape, have seen a noticeable increase in extent, suggesting either natural progression due to secondary succession in abandoned fields or perhaps the influence of land management policies prioritizing grassland conservation. This expansion from 1553.44 km² to 1760.74 km² could also be a response to changing grazing patterns or a shift in the ecological equilibrium favoring grassland biomes. Conversely, high vegetation areas have witnessed a contraction. This decline from 21.95 km² to 17.59 km² might hint at underlying stressors impacting forested regions and other densely vegetated habitats, including potential deforestation, urbanization, or changes in land management practices that favor other land uses over forest conservation. Similarly, barren lands have slightly diminished in area, suggesting either a restoration of vegetative cover in previously degraded lands or a change in land use where these areas are being converted for more productive purposes. The modest reduction to 74.68 km² in the 2025-2029 period could be indicative of either successful ecological restoration efforts or the exploitation of these lands for development purposes.
Figure 17.
Predicted LULC map for the 2025-2029 period.
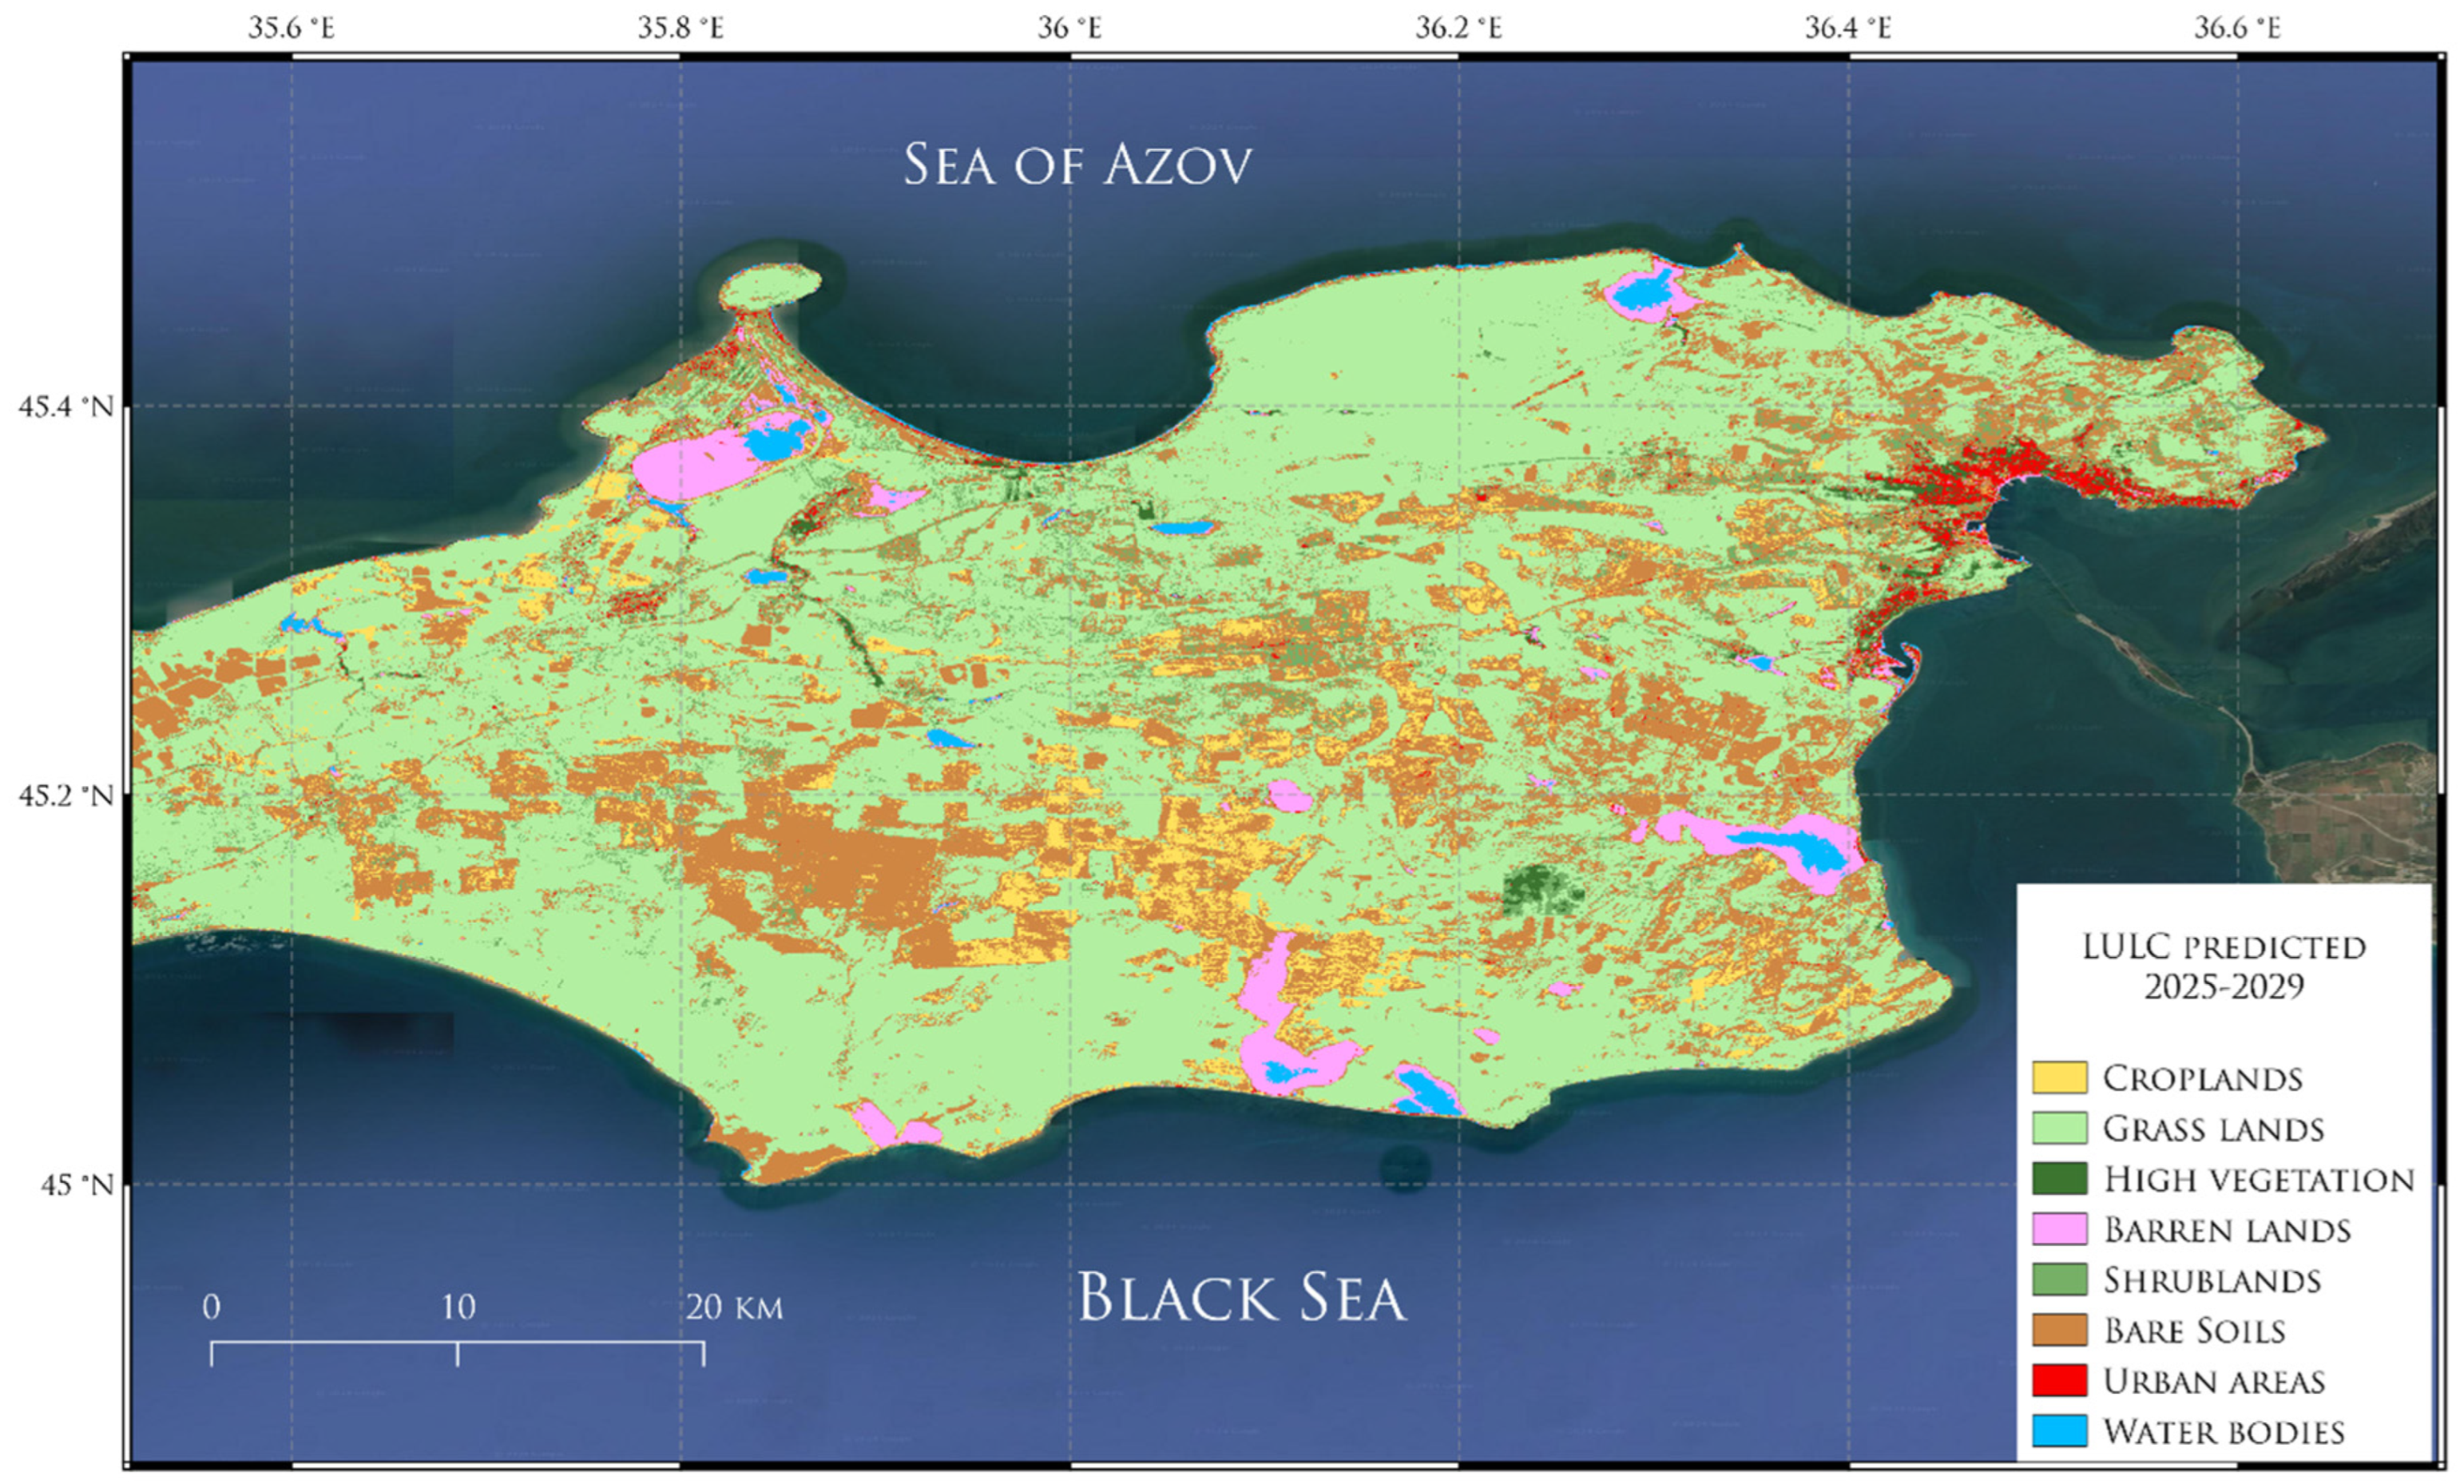
4. Discussion
Previous works [6,35,39] have laid a solid foundation in understanding the multifaceted nature of LULCC and its impacts on the Kerch Peninsula. However, the extant literature and our previous research have illuminated several areas where knowledge remains incomplete, underscoring the necessity for a continued and focused investigation.
Firstly, despite advancements in remote sensing and GIS technologies, the integration of socio-economic drivers with biophysical data remains underdeveloped in LULCC models. This gap hinders our ability to fully understand the complex interplay between human activities and land cover changes. Our current research endeavors to bridge this gap by employing a multidimensional approach that synthesizes socio-economic variables with spatial data, thereby offering a more nuanced understanding of LULCC drivers on the Kerch Peninsula.
Secondly, the dynamic and bidirectional relationship between LULCC and climate variability necessitates a more granular exploration. Previous studies have primarily focused on the unidirectional impacts of human activity on land cover or vice versa. This research aims to advance the discourse by examining how LULCC simultaneously influences and is influenced by climate variability, employing a holistic model that accounts for these bidirectional interactions.
Moreover, the specificity of LULCC impacts at the local and regional scales, particularly in areas undergoing rapid urbanization like the Kerch Peninsula, calls for a tailored analysis that can inform localized land management and conservation strategies. While our prior investigations have significantly contributed to the regional understanding of LULCC, the current study seeks to refine these insights by incorporating recent developments in LULCC modeling and analysis techniques. This includes the use of deep learning algorithms for enhanced classification accuracy and the analysis of long-term data sets for understanding temporal trends in land cover changes.
The results obtained in this paper on the Kerch Peninsula over recent decades, we’ve observed a complex interplay of socio-economic transformations, climatic variability, and the profound impacts of geopolitical shifts on LULCC. The intricate dynamics of these factors have shaped the peninsula’s landscape, driving significant alterations in agricultural practices, urban development, and natural habitats. The disintegration of the Soviet Union and the subsequent economic transitions marked the initial phase of our study period, leading to industrial decline and a contraction in arable land. This era was characterized by a noticeable de-intensification of agriculture, resulting in a reduction of cropland areas and a shift in land cover, as agricultural lands were abandoned or reverted to natural states. Concurrently, climatic shifts, notably warming trends, influenced LULCC, affecting vegetation phenology and agricultural yields. Our analysis highlighted a notable increase in urban areas, underscoring the ongoing urban sprawl and industrial development, which further intensified the anthropogenic pressures on the peninsula’s natural ecosystems. This urban expansion, coupled with agricultural extension, necessitated a reevaluation of land management and conservation strategies to mitigate the adverse impacts on the region’s ecological fabric. Throughout the subsequent years, the Kerch Peninsula experienced various land cover transformations, including the expansion of grasslands and high vegetation areas, possibly reflecting land abandonment or the transition towards more extensive farming practices. These changes suggest a landscape adapting to both the withdrawal of human agricultural activity and conservation policies aimed at preserving these ecosystems. The recent period, marked by Crimea’s political transition and the shutdown of the North Crimean Canal, presented new challenges but also opportunities for adaptation and resilience within the region’s LULC management. Despite the reduction in water resources, which significantly impacted agricultural practices, there was only a slight decrease in croplands, indicating an adaptation towards more water-efficient agricultural methods or a shift to less water-dependent crops. The resilience of grasslands, the slight expansion of barren lands, and the dynamic interplay between shrublands and bare soils, alongside modest urban development, reflect the peninsula’s adaptive capacity to environmental and socio-economic challenges. The landscape’s response to these challenges underscores the critical importance of sustainable land management practices in balancing development needs with environmental conservation.
The specific socio-political transformations, climatic variability, and environmental policies were identified as key drivers of LULCC in the Kerch Peninsula include the disintegration of the Soviet Union and subsequent economic transitions, which led to industrial decline and a reduction in arable land. This period was marked by a decline in agricultural intensity, resulting in a reduction in cropland areas and the abandonment of agricultural lands, which reverted to a natural state. Concurrently, climatic shifts, particularly warming trends, influenced LULCC by affecting vegetation phenology and agricultural yields. The increase in high temperatures and delayed May frosts due to warmer winter and spring months further underscored the climatic challenges impacting the region. Furthermore, geopolitical shifts, such as Crimea’s political transition and the shutdown of the North Crimean Canal, presented new challenges but also opportunities for adaptation and resilience in LULC management. The reduction in water resources had a significant impact on agricultural practices, leading to a shift towards more water-efficient agricultural methods or less water-dependent crops. The sustainable land management practices also played a crucial role. Conservation policies aimed at preserving grassland ecosystems led to the expansion of grasslands and high vegetation areas, reflecting a landscape adapting to both the withdrawal of human agricultural activity and conservation efforts.
Our research on the Kerch Peninsula elucidated the intricate dynamics between socio-economic factors, climatic variability, and the impacts of geopolitical shifts on LULCC. Like our findings, studies in other regions with comparable ecological and socio-economic conditions have documented substantial LULCC driven by a mix of natural and anthropogenic factors. For instance, the study by Paudel [40] on Nepal underscores the constant flux in LULC due to human activities and natural phenomena, mirroring our observations on the Kerch Peninsula regarding the dual influence of human and environmental drivers on LULCC.
Moreover, Chughtai [4] emphasize the role of remote sensing technology in monitoring LULCC, a methodological approach that was pivotal in our study as well. Their review highlights the utility of post-classification change detection methods, which aligns with our methodological rigor in detecting and analyzing LULCC over time. This common reliance on advanced technological tools underscores the growing importance of remote sensing in providing accurate, timely, and scalable insights into LULCC across diverse regions. Ren [2] synthesis of LULCC models further complements our analytical framework by delineating the spectrum of approaches from pattern- to process-based models. Their discussion on the challenges of integrating human-environment interactions into LULCC modeling resonates with our efforts to capture the complex interplay between anthropogenic activities and environmental changes on the Kerch Peninsula. This parallel underscore a broader challenge within LULCC research: the need for models that can holistically account for the multifaceted drivers and impacts of land cover changes. However, the comparative analysis also reveals divergences in LULCC dynamics across regions, attributed to specific local or regional drivers. For example, the study by Goldewijk [41] and Abdullah [42] on the advancements in LULCC classification techniques points to the significant role of agricultural expansion in driving LULCC, a factor that, while present, plays out differently on the Kerch Peninsula due to its unique socio-political and ecological context. This divergence highlights the importance of context-specific analyses in understanding LULCC processes.
The Kerch Peninsula has witnessed a pronounced increase in urban areas at the expense of natural ecosystems, such as forests and wetlands. This trend is reflected in other studies, including those conducted in the Amazon Basin and the Ethiopian Highlands. In the Amazon Basin, urban expansion has similarly encroached upon forested areas, driven by economic development and population growth [43]. The Ethiopian Highlands have also experienced agricultural intensification, which has led to deforestation and soil degradation. This phenomenon is comparable to the agricultural expansion observed in the Kerch Peninsula [44].
The socio-political upheavals that occurred in the post-Soviet era had a significant impact on LULC on the Kerch Peninsula. This led to the abandonment of agricultural land and subsequent natural succession. This pattern is comparable to the experiences in Eastern Europe, where the dissolution of the Soviet Union led to widespread changes in land use and rural depopulation [45]. Similarly, the effects of climate change, including rising temperatures and altered precipitation patterns, have intensified land cover changes in the Kerch Peninsula. Studies conducted in South Asia have demonstrated that climate variability has significantly influenced agricultural practices and land cover, resulting in a shift from crop lands to more resilient land cover types, such as grasslands and shrublands [46].
The findings from the Kerch Peninsula underscore the necessity for integrated land management strategies that strike a balance between development and environmental conservation. This is consistent with global trends indicating that sustainable land use planning is becoming increasingly crucial. For instance, in the Mekong Delta, sustainable agricultural practices are being promoted in order to mitigate the adverse effects of intensive farming and urbanization on the ecosystem [47]. These strategies include crop diversification, agroforestry, and the establishment of protected areas, which are also relevant recommendations for managing land cover changes on the Kerch Peninsula.
In discussing the limitations and their potential impact on the results of the research on LULCC on the Kerch Peninsula, several key factors emerge that could influence the interpretation and applicability of the findings. These limitations also provide a pathway for future research directions, helping to refine and expand our understanding of LULCC dynamics.
One significant limitation is the reliance on available data, which might not cover all relevant aspects of LULCC comprehensively. For instance, historical land use data may be sparse, incomplete, or not available at a desirable spatial or temporal resolution. This limitation can lead to gaps in understanding the full extent of land use transitions over time, potentially underestimating, or overestimating the rate and nature of changes. Furthermore, inconsistencies in data collection methods across different time periods or regions can introduce biases, affecting the comparability and consistency of the results.
The methodological approaches employed to analyze LULCC, including remote sensing and GIS techniques, carry inherent limitations. For example, the accuracy of satellite imagery in identifying specific land cover types can vary, influenced by factors such as sensor resolution, atmospheric conditions, and the presence of similar spectral signatures between different land cover types. Additionally, the interpretation of remote sensing data requires substantial expertise, and the choice of classification algorithms can significantly impact the outcomes of the analysis. These methodological constraints might lead to misclassification errors, influencing the perceived extent and patterns of LULCC.
The misclassification of remote sensing data has a significant impact on the perceived extent and patterns of LULCC, making it crucial to address these errors for accurate analysis. A variety of methods, including smoothing algorithms, discriminant space-based techniques, support vector machines (SVM), CVAPS, and kernel filters, have been demonstrated to effectively reduce the impact of these errors. Smoothing algorithms enhance classification accuracy, yet they may engender inaccuracy in landscape pattern indices and underestimate habitat fragmentation [48]. Discriminant space-based methods facilitate consistency in area-class mapping and uncertainty modeling [49]. SVMs provide unbiased area estimates by balancing misclassification errors across land cover classes [50]. CVAPS reduces error accumulation by analyzing posterior probabilities, thereby improving land cover change detection [51]. In contrast, kernel filters enhance robustness against classification errors by leveraging redundancy in land cover maps [52]. Misclassification can result in significant biases in areal estimates, which can impact resource inventories and management plans [53]. Errors in classified maps can propagate into landscape metrics, leading to unreliable analyses [54]. The failure to account for misclassification in satellite data leads to biased parameter estimates in land-use models, which in turn affects the formulation of policy recommendations.
The incorporation of high-resolution satellite imagery and multi-source data, including drones and ground-based observations, into land cover change assessments presents several potential limitations. The generation of large volumes of data by high-resolution imagery requires substantial storage, processing power, and time for analysis, which is challenging at national or global scales [55]. Ensuring consistent radiometric and geometric properties across images from different sensors and times is a complex process that necessitates radiometric normalization [56]. Integrating data from satellites, drones, and ground-based sensors involves handling different spatial, temporal, and spectral resolutions, which makes cohesive analysis difficult [57]. The acquisition of high-resolution optical satellite imagery is often impeded by cloud cover and atmospheric conditions, which can obscure the land surface and introduce errors [58]. The cost of acquiring high-resolution imagery can limit its use for large-scale or long-term monitoring, despite increasing availability [59]. Ensuring consistency and quality across different data sources is challenging due to variations in data quality, resolution, and acquisition conditions [60]. Additionally, the analysis of high-resolution and multi-source data requires advanced technical expertise and resources, with sophisticated algorithms needed for data fusion, classification, and change detection [61].
The research might not fully account for the complex interplay of socio-economic and political factors driving LULCC. While attempts can be made to incorporate these factors into the analysis, quantifying their direct and indirect impacts is challenging. Policies, economic shifts, and social dynamics can rapidly alter land use patterns, and without a nuanced understanding of these drivers, the research might not capture the complete picture of LULCC. Moreover, future changes in these areas could alter the trajectories of land use, posing a limitation to the predictability of current models.
The discrepancies between actual and predicted land cover maps cannot be attributed solely to the limitations of predictive models. Several other factors play a significant role. The quality and resolution of input data influence the accuracy of predictions. Higher resolution data provide more detail but also more noise and classification errors [62]. The accuracy of modeling techniques and assumptions, such as those employed in the CA-Markov model, is contingent upon calibration data and environmental factors considered [63]. Furthermore, temporal dependence of errors in land cover maps affects change detection accuracy, as errors from one time point can propagate to subsequent points [64]. Furthermore, environmental and socioeconomic factors, such as geographic distribution changes, landscape heterogeneity, and human activities, influence land cover independently of model predictions [65]. Effective validation and calibration are crucial, yet often complex and resource intensive.
To improve the accuracy and reliability of future land use scenarios, it is essential to consider feedback loops, non-linear dynamics, and stochastic events. Feedback loops are an inherent feature of complex systems, such as land-use systems, where the actions and reactions between human and environmental systems continuously influence each other. For example, agent-based models such as LUDAS incorporate both primary and secondary feedback loops to simulate how environmental feedback influences land-use decisions over time [66]. Furthermore, non-linear dynamics in hydrological systems can be modeled using system dynamics approaches, which account for interdependent biophysical processes through feedback loops [67]. Stochastic events are frequently incorporated into models using probabilistic methods, which allow for the accounting of uncertainties present in future development scenarios and environmental conditions. For instance, stochastic field development optimization in oilfields accounts for uncertainties in geology and future development plans, thereby providing robust solutions that hedge against uncertain future events [68]. These intricate interrelationships engender considerable uncertainty in model projections. Feedback loops can give rise to unforeseen emergent behaviors, non-linear dynamics can result in disproportionate responses to minor changes, and stochastic events can cause unpredictable variations. These uncertainties are managed using advanced modeling techniques that incorporate dynamic updates and recalibrations based on new data. For example, closed-loop stochastic optimization entails the continuous recalibration of models with new data to adjust decision variables dynamically [68].
The potential impacts of LULCC on ecosystems and climate are multifaceted and not entirely predictable. While the research can identify trends and correlations, the causal mechanisms underlying these relationships may be complex and not fully understood. Changes in land cover can affect biodiversity, ecosystem services, and climate feedback processes in ways that are difficult to quantify precisely.
Future studies could leverage advancements in remote sensing technologies, incorporating high-resolution satellite imagery and multi-source data, including drones and ground-based observations. This would enhance the accuracy of land cover classification and change detection, allowing for more detailed analyses of subtle changes and patterns. Additionally, integrating data from social media and mobile devices could offer insights into human activities related to land use, complementing traditional data sources.
Another prominent direction in LULCC research is the use of social media and mobile device data in analysis. The integration of social media and mobile device data into land use analysis offers a novel perspective on the understanding of urban dynamics and human activities. This novel data source includes geolocated content from platforms such as Twitter, Foursquare, and Instagram, offering valuable insights into human movement patterns and urban land use. For example, geolocated tweets can be clustered to determine land uses in urban areas by analyzing patterns in tweeting activity [69]. Similarly, social media check-in data from platforms like Foursquare can be utilized to infer land use types through unsupervised clustering and supervised learning methods, effectively identifying different land use types given sufficient data [70]. However, several challenges emerge when utilizing these non-traditional data sources. Firstly, the heterogeneity and multidimensionality of social media data present significant challenges in terms of integration and analysis. The data encompass a multitude of spatial, social, temporal, and topical attributes that must be managed and harmonized [71]. Furthermore, biases in social media data can affect the reliability of insights, as the data may not be representative of the entire population due to differing usage patterns among demographic groups [72]. Furthermore, concerns regarding data privacy arise when utilizing social media data, necessitating the implementation of robust measures to safeguard user information [73]. Finally, the unstructured nature of social media data necessitates the application of advanced data mining and text analysis techniques to extract meaningful information, which can be technically demanding [74].
Future research should adopt a socio-ecological systems perspective, recognizing the intertwined nature of human and natural systems. This involves studying LULCC not just as a physical transformation of the landscape but as a component of broader socio-ecological dynamics. Research should explore the impacts of LULCC on ecosystem services, biodiversity, and human well-being, as well as how these changes feedback into land use decisions.
5. Conclusions
Our extensive study on the Kerch Peninsula over the past three decades has provided profound insights into the dynamics of LULCC, driven by a complex interplay of socio-political transformations, climatic variability, and environmental policies. Through the innovative use of convolutional neural networks and advanced satellite imagery, we have unveiled significant trends that highlight the profound impacts of urban growth, agricultural expansion, and the introduction of sustainable land management practices on the region’s ecological fabric.
The transition matrices and LULC dynamics underscore the peninsula’s adaptive responses to changing socio-economic conditions, policy shifts, and environmental challenges. Notably, the increase in urban areas and the concurrent decline in natural ecosystems like forests and wetlands illuminate the critical need for informed land management and conservation strategies to mitigate these effects.
Our findings emphasize the critical role of integrating change analysis and prediction in LULCC research. This approach allows for a nuanced understanding of the forces shaping the Kerch Peninsula’s landscape, offering a foundation for developing effective land management policies and conservation strategies that can adapt to changing environmental conditions and socioeconomic needs.
The study has demonstrated the invaluable role of remote sensing and GIS technologies in enhancing LULCC analysis, enabling a deeper understanding of the intricate dynamics at play. These tools have not only facilitated a detailed examination of the region’s landscape transformations but also underscored the potential for predictive modeling to forecast future land cover scenarios. Such insights are pivotal for planning sustainable development, implementing effective conservation strategies, and ensuring the ecological and socio-economic well-being of local communities.
Furthermore, our research has highlighted the importance of considering the broad spectrum of drivers influencing LULCC, from demographic shifts and economic trends to environmental factors and policy frameworks. Understanding these drivers is crucial for anticipating future land cover changes and devising strategies that balance development needs with environmental preservation.
Author Contributions
Writing – review & editing, Writing – original draft, Visualization, Validation, Supervision, Software, Resources, Project administration, Methodology, Investigation, Funding acquisition, Formal analysis, Data curation, Conceptualization: DK.
Funding
This research received no external funding.
Data Availability Statement
The authors do not have permission to share data.
Conflicts of Interest
The authors declare no conflicts of interest.
References
- Bojer, A.K.; Ahmed, M.E.; Bekalo, D.J.; Debelee, T.G.; Al-Quraishi, A.M.F.; Deche, A. Analysis of Land Use/Land Cover Change (LULCC) and Debris Flow Risks in Adama District, Ethiopia, Aided by Numerical Simulation and Deep Learning-Based Remote Sensing. Stoch Environ Res Risk Assess 2023, 37, 4893–4910. [Google Scholar] [CrossRef]
- Ren, Y.; Lü, Y.; Comber, A.; Fu, B.; Harris, P.; Wu, L. Spatially Explicit Simulation of Land Use/Land Cover Changes: Current Coverage and Future Prospects. Earth-Science Reviews, 2019. [Google Scholar] [CrossRef]
- Gaur, S.; Singh, R. A Comprehensive Review on Land Use/Land Cover (LULC) Change Modeling for Urban Development: Current Status and Future Prospects. Sustainability 2023. [Google Scholar] [CrossRef]
- Chughtai, A.H.; Abbasi, H.; Karas, I.R. A Review on Change Detection Method and Accuracy Assessment for Land Use Land Cover. Remote Sensing Applications: Society and Environment 2021, 22. [Google Scholar] [CrossRef]
- Prestele, R.; Arneth, A.; Bondeau, A.; Noblet-Ducoudré, N.; Pugh, T.; Sitch, S.; Stehfest, E.; Verburg, P. Current Challenges of Implementing Anthropogenic Land-Use and Land-Cover Change in Models Contributing to Climate Change Assessments. Earth System Dynamics Discussions 2017, 8, 369–386. [Google Scholar] [CrossRef]
- Krivoguz, D. Geo-Spatial Analysis of Urbanization and Environmental Changes with Deep Neural Networks: Insights from a Three-Decade Study in Kerch Peninsula. Ecological Informatics 2024, 80, 102513. [Google Scholar] [CrossRef]
- Piekkoontod, T.; Pachana, B.; Hrimpeng, K.; Charoenjit, K. Assessments of Nipa Forest Using Landsat Imagery Enhanced with Unmanned Aerial Vehicle Photography. Applied Environmental Research 2020, 42, 49–59. [Google Scholar] [CrossRef]
- Li, W.; Dong, R.; Fu, H.; Wang, J.; Yu, L.; Gong, P. Integrating Google Earth Imagery with Landsat Data to Improve 30-m Resolution Land Cover Mapping. Remote Sensing of Environment 2020, 237, 111563. [Google Scholar] [CrossRef]
- Moon, M.; Richardson, A.D.; Friedl, M.A. Multiscale Assessment of Land Surface Phenology from Harmonized Landsat 8 and Sentinel-2, PlanetScope, and PhenoCam Imagery. Remote Sensing of Environment 2021, 266, 112716. [Google Scholar] [CrossRef]
- Muhammad, R.; Zhang, W.; Abbas, Z.; Guo, F.; Gwiazdzinski, L. Spatiotemporal Change Analysis and Prediction of Future Land Use and Land Cover Changes Using QGIS MOLUSCE Plugin and Remote Sensing Big Data: A Case Study of Linyi, China. Land 2022, 11, 419. [Google Scholar] [CrossRef]
- Alshari, E.A.; Gawali, B.W. Modeling Land Use Change in Sana’a City of Yemen with MOLUSCE. Journal of Sensors 2022, 2022, e7419031. [Google Scholar] [CrossRef]
- Makinano-Santillan, M.; Bolanio, K.P.; Valeroso, J.D.; Yu, L.G. ANALYZING THE EFFECTS OF LAND USE / COVER CHANGE (LULCC) SIMULATION ON FLOODING: A CASE STUDY IN LAS NIEVES, AGUSAN DEL NORTE, MINDANAO, PHILIPPINES. The International Archives of the Photogrammetry, Remote Sensing and Spatial Information Sciences, 2023; XLVIII-4-W6-2022, 211–216. [Google Scholar] [CrossRef]
- Amgoth, A.; Rani, H.P.; Jayakumar, K.V. Exploring LULC Changes in Pakhal Lake Area, Telangana, India Using QGIS MOLUSCE Plugin. Spat. Inf. Res. 2023, 31, 429–438. [Google Scholar] [CrossRef]
- Sajan, B.; Mishra, V.N.; Kanga, S.; Meraj, G.; Singh, S.K.; Kumar, P. Cellular Automata-Based Artificial Neural Network Model for Assessing Past, Present, and Future Land Use/Land Cover Dynamics. Agronomy 2022, 12, 2772. [Google Scholar] [CrossRef]
- Nkolokosa, C.; Stothard, R.; Jones, C.M.; Stanton, M.; Chirombo, J.; Tangena, J.-A.A. Monitoring and Simulating Landscape Changes: How Do Long-Term Changes in Land Use and Long-Term Average Climate Affect Regional Biophysical Conditions in Southern Malawi? Environ Monit Assess 2023, 195, 1247. [Google Scholar] [CrossRef] [PubMed]
- Gondo, R.; Kolawole, O.D.; Mfundisi, K.B. Land Use and Land Cover Changes along the Boteti-Thamalakane River System in Ngamiland District, Botswana. Scientific African 2023, 20, e01595. [Google Scholar] [CrossRef]
- Wang, J.; Bretz, M.; Dewan, M.A.A.; Delavar, M.A. Machine Learning in Modelling Land-Use and Land Cover-Change (LULCC): Current Status, Challenges and Prospects. Science of The Total Environment 2022, 822, 153559. [Google Scholar] [CrossRef] [PubMed]
- Shimizu, K.; Murakami, W.; Furuichi, T.; Estoque, R.C. Mapping Land Use/Land Cover Changes and Forest Disturbances in Vietnam Using a Landsat Temporal Segmentation Algorithm. Remote Sensing 2023, 15, 851. [Google Scholar] [CrossRef]
- Gidey, E.; Mhangara, P. An Application of Machine-Learning Model for Analyzing the Impact of Land-Use Change on Surface Water Resources in Gauteng Province, South Africa. Remote Sensing 2023, 15, 4092. [Google Scholar] [CrossRef]
- Faqe Ibrahim, G. Urban Land Use Land Cover Changes and Their Effect on Land Surface Temperature: Case Study Using Dohuk City in the Kurdistan Region of Iraq. Climate 2017, 5, 13. [Google Scholar] [CrossRef]
- Zhang, Y.; Odeh, I.O.A.; Han, C. Bi-Temporal Characterization of Land Surface Temperature in Relation to Impervious Surface Area, NDVI and NDBI, Using a Sub-Pixel Image Analysis. International Journal of Applied Earth Observation and Geoinformation 2009, 11, 256–264. [Google Scholar] [CrossRef]
- Chen, X.-L.; Zhao, H.-M.; Li, P.-X.; Yin, Z.-Y. Remote Sensing Image-Based Analysis of the Relationship between Urban Heat Island and Land Use/Cover Changes. Remote Sensing of Environment 2006, 104, 133–146. [Google Scholar] [CrossRef]
- Ronald, K.; Singh, K.J.; Lodhi, M.S. Land Use and Land Cover Change Study Using RS-GIS and Its Impact on Biodiversity: Study from Arunachal Pradesh, India. Asian Journal of Environment & Ecology 2023, 22, 120–132. [Google Scholar] [CrossRef]
- Sun, J.; He, J. Influence of Land Use and Land Cover Change on Land Surface Temperature. E3S Web Conf. 2021, 283, 01038. [Google Scholar] [CrossRef]
- Feng, Y.; Li, H.; Tong, X.; Chen, L.; Liu, Y. Projection of Land Surface Temperature Considering the Effects of Future Land Change in the Taihu Lake Basin of China. Global and Planetary Change 2018, 167, 24–34. [Google Scholar] [CrossRef]
- Pozachenyuk, E.; Fedor, L.; Kalinchuk, I.; Asanova, A.; Ignatenko, I. Modern Landscapes of the Kerch Peninsula. In Proceedings of the Bioscience Biotechnology Research Communications, Albena, Bulgaria, 2019; Vol. 12. [Google Scholar]
- Simonov, D.; Zakharov, V.S.; Bryantseva, G. Complex Geomorphological, Morphological, and Fractal Analysis of the Most Recent Vertical Tectonic Movements of the Kerch Peninsula. Moscow University Geology Bulletin 2019, 74, 549–558. [Google Scholar] [CrossRef]
- Kokh, S.N.; Shnyukov, Y.F.; Sokol, E.V.; Novikova, S.A.; Kozmenko, O.A.; Semenova, D.V.; Rybak, E.N. Heavy Carbon Travertine Related to Methane Generation: A Case Study of the Big Tarkhan Cold Spring, Kerch Peninsula, Crimea. Sedimentary Geology 2015, 325, 26–40. [Google Scholar] [CrossRef]
- Sokol, E.V.; Kokh, S.N.; Kozmenko, O.A.; Lavrushin, V.Y.; Belogub, E.V.; Khvorov, P.V.; Kikvadze, O.E. Boron in an Onshore Mud Volcanic Environment: Case Study from the Kerch Peninsula, the Caucasus Continental Collision Zone. Chemical Geology 2019, 525, 58–81. [Google Scholar] [CrossRef]
- Ergina, E.I.; Zhuk, V.O. Risks and Permissible Rates of Soil Erosion in the Agrolandscapes of the Crimea. In Advances in Understanding Soil Degradation; Saljnikov, E., Mueller, L., Lavrishchev, A., Eulenstein, F., Eds.; Springer International Publishing: Cham, 2022; pp. 257–270. ISBN 978-3-030-85682-3. [Google Scholar]
- Ergina, E.I.; Gorbunov, R.V.; Tabunshchik, V.A.; Petlyukova, E.A. Soil Diversity of the Crimean Peninsula. UNNCRNSS 2023, 61–69. [Google Scholar] [CrossRef]
- Kimeklis, A.K.; Gladkov, G.V.; Zverev, A.O.; Kichko, A.A.; Andronov, E.E.; Ergina, E.I.; Kostenko, I.V.; Abakumov, E.V. Microbiomes of Different Ages in Rendzic Leptosols in the Crimean Peninsula. PeerJ 2021, 9, e10871. [Google Scholar] [CrossRef]
- Kimeklis, A.; Gladkov, G.; Zverev, A.; Kichko, A.; Andronov, E.; Ergina, E.; Kostenko, I.; Abakumov, E. Influence of Soil Factors on the Microbiome of Rendzic Leptosols Chronosequence in the Crimean Peninsula; Copernicus Meetings, 2021.
- Krivoguz, D.; Bespalova, L. Analysis of Kerch Peninsula’s Climatic Parameters in Scope of Landslide Susceptibility. Bulletin of KSMTU 2018, 5–11. [Google Scholar]
- Krivoguz, D.; Ioshpa, A.; Bespalova, L.; Zhilenkov, A.; Chernyi, S.; Goryachev, I.; Tsareva, P.; Voronova, A. Assessing Long-Term Lake Dynamics in Response to Climatic Variability: A Comprehensive Statistical Analysis. Journal of Marine Science and Engineering 2023, 12, 68. [Google Scholar] [CrossRef]
- Gao, C.; Cheng, D.; Iqbal, J.; Yao, S. Spatiotemporal Change Analysis and Prediction of Future Land Cover Changes Using QGIS MOLUSCE Plugin on a Large Regional Scale and the Relationship Analysis with Mountain Hazards: A Case Study of the Great Yellow River Region (GYRR). China. Land.
- Wu, Q. Geemap: A Python Package for Interactive Mapping with Google Earth Engine. Journal of Open Source Software 2020, 5, 2305. [Google Scholar] [CrossRef]
- Bosch, M. PyLandStats: An Open-Source Pythonic Library to Compute Landscape Metrics. PLOS ONE 2019, 14, e0225734. [Google Scholar] [CrossRef] [PubMed]
- Krivoguz, D.; Chernyi, S.G.; Zinchenko, E.; Silkin, A.; Zinchenko, A. Using Landsat-5 for Accurate Historical LULC Classification: A Comparison of Machine Learning Models. Data 2023, 8, 138. [Google Scholar] [CrossRef]
- Paudel, B.; Zhang, Y.; Li, S.; Liu, L.; Wu, X.; Khanal, N. Review of Studies on Land Use and Land Cover Change in Nepal. Journal of Mountain Science 2016, 13, 643–660. [Google Scholar] [CrossRef]
- Klein Goldewijk, K.; Ramankutty, N. Land Cover Change over the Last Three Centuries Due to Human Activities: The Availability of New Global Data Sets. GeoJournal 2004, 61, 335–344. [Google Scholar] [CrossRef]
- Abdullah, S.A.; Hezri, A.A. From Forest Landscape to Agricultural Landscape in the Developing Tropical Country of Malaysia: Pattern, Process, and Their Significance on Policy. Environmental Management 2008, 42, 907–917. [Google Scholar] [CrossRef] [PubMed]
- Soares-Filho, B.S.; Nepstad, D.C.; Curran, L.M.; Cerqueira, G.C.; Garcia, R.A.; Ramos, C.A.; Voll, E.; McDonald, A.; Lefebvre, P.; Schlesinger, P. Modelling Conservation in the Amazon Basin. Nature 2006, 440, 520–523. [Google Scholar] [CrossRef] [PubMed]
- Regasa, M.S.; Nones, M. A Review on Land Use and Land Cover Change in Ethiopian Basins. Land 2021. [Google Scholar] [CrossRef]
- Kuemmerle, T.; Levers, C.; Erb, K.; Estel, S.; Jepsen, M.R.; Müller, D.; Plutzar, C.; Stürck, J.; Verkerk, P.J.; Verburg, P.H.; et al. Hotspots of Land Use Change in Europe. Environ. Res. Lett. 2016, 11, 064020. [Google Scholar] [CrossRef]
- Dissanayake, S.; Asafu-Adjaye, J.; Mahadeva, R. Addressing Climate Change Cause and Effect on Land Cover and Land Use in South Asia. Land Use Policy 2017, 67, 352–366. [Google Scholar] [CrossRef]
- Sebesvari, Z.; Le, H.T.T.; Van Toan, P.; Arnold, U.; Renaud, F.G. Agriculture and Water Quality in the Vietnamese Mekong Delta. In The Mekong Delta System: Interdisciplinary Analyses of a River Delta; Renaud, F.G., Kuenzer, C., Eds.; Springer Netherlands: Dordrecht, 2012; pp. 331–361. ISBN 978-94-007-3962-8. [Google Scholar]
- Langford, W.T.; Gergel, S.E.; Dietterich, T.G.; Cohen, W. Map Misclassification Can Cause Large Errors in Landscape Pattern Indices: Examples from Habitat Fragmentation. Ecosystems 2006, 9, 474–488. [Google Scholar] [CrossRef]
- ZHANG, J.; TANG, Y. Misclassification Error Propagation in Land Cover Change Categorization. Geo-spatial Information Science 2012, 15, 171–175. [Google Scholar] [CrossRef]
- Puertas, O.L.; Brenning, A.; Meza, F.J. Balancing Misclassification Errors of Land Cover Classification Maps Using Support Vector Machines and Landsat Imagery in the Maipo River Basin (Central Chile, 1975–2010). Remote Sensing of Environment 2013, 137, 112–123. [Google Scholar] [CrossRef]
- Chen, J.; Chen, X.; Cui, X.; Chen, J. Change Vector Analysis in Posterior Probability Space: A New Method for Land Cover Change Detection. IEEE Geoscience and Remote Sensing Letters 2011, 8, 317–321. [Google Scholar] [CrossRef]
- Kempeneers, P.; Sedano, F.; Strobl, P.; McInerney, D.O.; San-Miguel-Ayanz, J. Increasing Robustness of Postclassification Change Detection Using Time Series of Land Cover Maps. IEEE Transactions on Geoscience and Remote Sensing 2012, 50, 3327–3339. [Google Scholar] [CrossRef]
- Czaplewski, R. Misclassification Bias in Areal Estimates. Photogrammetric Engineering and Remote Sensing 1992. [Google Scholar]
- Chen, X.; Yamaguchi, Y.; Chen, J. Weighted Misclassification Rate: A New Measure of Classification Error Designed for Landscape Pattern Index. Remote Sensing Letters 2012, 3, 57–65. [Google Scholar] [CrossRef]
- Sawaya, K.E.; Olmanson, L.G.; Heinert, N.J.; Brezonik, P.L.; Bauer, M.E. Extending Satellite Remote Sensing to Local Scales: Land and Water Resource Monitoring Using High-Resolution Imagery. Remote Sensing of Environment 2003, 88, 144–156. [Google Scholar] [CrossRef]
- Du, Y.; Teillet, P.M.; Cihlar, J. Radiometric Normalization of Multitemporal High-Resolution Satellite Images with Quality Control for Land Cover Change Detection. Remote Sensing of Environment 2002, 82, 123–134. [Google Scholar] [CrossRef]
- Huang, X.; Li, J.; Liao, W.; Chanussot, J. Information Extraction from Remote Sensing Imagery. Geo-spatial Information Science 2017, 20, 297–298. [Google Scholar] [CrossRef]
- Cigna, F.; Bateson, L.B.; Jordan, C.J.; Dashwood, C. Simulating SAR Geometric Distortions and Predicting Persistent Scatterer Densities for ERS-1/2 and ENVISAT C-Band SAR and InSAR Applications: Nationwide Feasibility Assessment to Monitor the Landmass of Great Britain with SAR Imagery. Remote Sensing of Environment 2014, 152, 441–466. [Google Scholar] [CrossRef]
- Boyle, S.A.; Kennedy, C.M.; Torres, J.; Colman, K.; Pérez-Estigarribia, P.E.; Sancha, N.U. de la High-Resolution Satellite Imagery Is an Important yet Underutilized Resource in Conservation Biology. PLOS ONE 2014, 9, e86908. [Google Scholar] [CrossRef] [PubMed]
- Leach, N.; Coops, N.C.; Obrknezev, N. Normalization Method for Multi-Sensor High Spatial and Temporal Resolution Satellite Imagery with Radiometric Inconsistencies. Computers and Electronics in Agriculture 2019, 164, 104893. [Google Scholar] [CrossRef]
- Bai, T.; Sun, K.; Deng, S.; Li, D.; Li, W.; Chen, Y. Multi-Scale Hierarchical Sampling Change Detection Using Random Forest for High-Resolution Satellite Imagery. International Journal of Remote Sensing 2018, 39, 7523–7546. [Google Scholar] [CrossRef]
- Clark, M.L.; Aide, T.M.; Grau, H.R.; Riner, G. A Scalable Approach to Mapping Annual Land Cover at 250 m Using MODIS Time Series Data: A Case Study in the Dry Chaco Ecoregion of South America. Remote Sensing of Environment 2010, 114, 2816–2832. [Google Scholar] [CrossRef]
- Liping, C.; Yujun, S.; Saeed, S. Monitoring and Predicting Land Use and Land Cover Changes Using Remote Sensing and GIS Techniques—A Case Study of a Hilly Area, Jiangle, China. PLOS ONE 2018, 13, e0200493. [Google Scholar] [CrossRef] [PubMed]
- Burnicki, A.C.; Brown, D.G.; Goovaerts, P. Simulating Error Propagation in Land-Cover Change Analysis: The Implications of Temporal Dependence. Computers, Environment and Urban Systems 2007, 31, 282–302. [Google Scholar] [CrossRef]
- Cardillo, M.; Macdonald, D.W.; Rushton, S.P. Predicting Mammal Species Richness and Distributions: Testing the Effectiveness of Satellite-Derived Land Cover Data. Landscape Ecology 1999, 14, 423–435. [Google Scholar] [CrossRef]
- Le, Q.B.; Seidl, R.; Scholz, R.W. Feedback Loops and Types of Adaptation in the Modelling of Land-Use Decisions in an Agent-Based Simulation. Environmental Modelling & Software 2012, 27–28, 83–96. [Google Scholar] [CrossRef]
- Khan, S.; Yufeng, L.; Ahmad, A. Analysing Complex Behaviour of Hydrological Systems through a System Dynamics Approach. Environmental Modelling & Software 2009, 24, 1363–1372. [Google Scholar] [CrossRef]
- Jahandideh, A.; Jafarpour, B. Closed-Loop Stochastic Oilfield Optimization for Hedging against Geologic, Development, and Operation Uncertainty. Comput Geosci 2020, 24, 129–148. [Google Scholar] [CrossRef]
- Frias–Martinez, V.; Soto, V.; Sánchez, A.; Frias–Martinez, E. Consensus Clustering for Urban Land Use Analysis Using Cell Phone Network Data. International Journal of Ad Hoc and Ubiquitous Computing 2014, 17, 39–58. [Google Scholar] [CrossRef]
- Zhan, X.; Ukkusuri, S.V.; Zhu, F. Inferring Urban Land Use Using Large-Scale Social Media Check-in Data. Netw Spat Econ 2014, 14, 647–667. [Google Scholar] [CrossRef]
- Psyllidis, A. Revisiting Urban Dynamics through Social Urban Data. A+BE | Architecture and the Built Environment 2016, 1–334. [Google Scholar] [CrossRef]
- Lopez, B.E.; Magliocca, N.R.; Crooks, A.T. Challenges and Opportunities of Social Media Data for Socio-Environmental Systems Research. Land 2019, 8, 107. [Google Scholar] [CrossRef]
- Hou, Q.; Han, M.; Cai, Z. Survey on Data Analysis in Social Media: A Practical Application Aspect. Big Data Mining and Analytics 2020, 3, 259–279. [Google Scholar] [CrossRef]
- Grant-Muller, S.M.; Gal-Tzur, A.; Minkov, E.; Nocera, S.; Kuflik, T.; Shoor, I. Enhancing Transport Data Collection through Social Media Sources: Methods, Challenges and Opportunities for Textual Data. IET Intelligent Transport Systems 2015, 9, 407–417. [Google Scholar] [CrossRef]
Figure 2.
General scheme of LULCC analysis on Kerch peninsula.
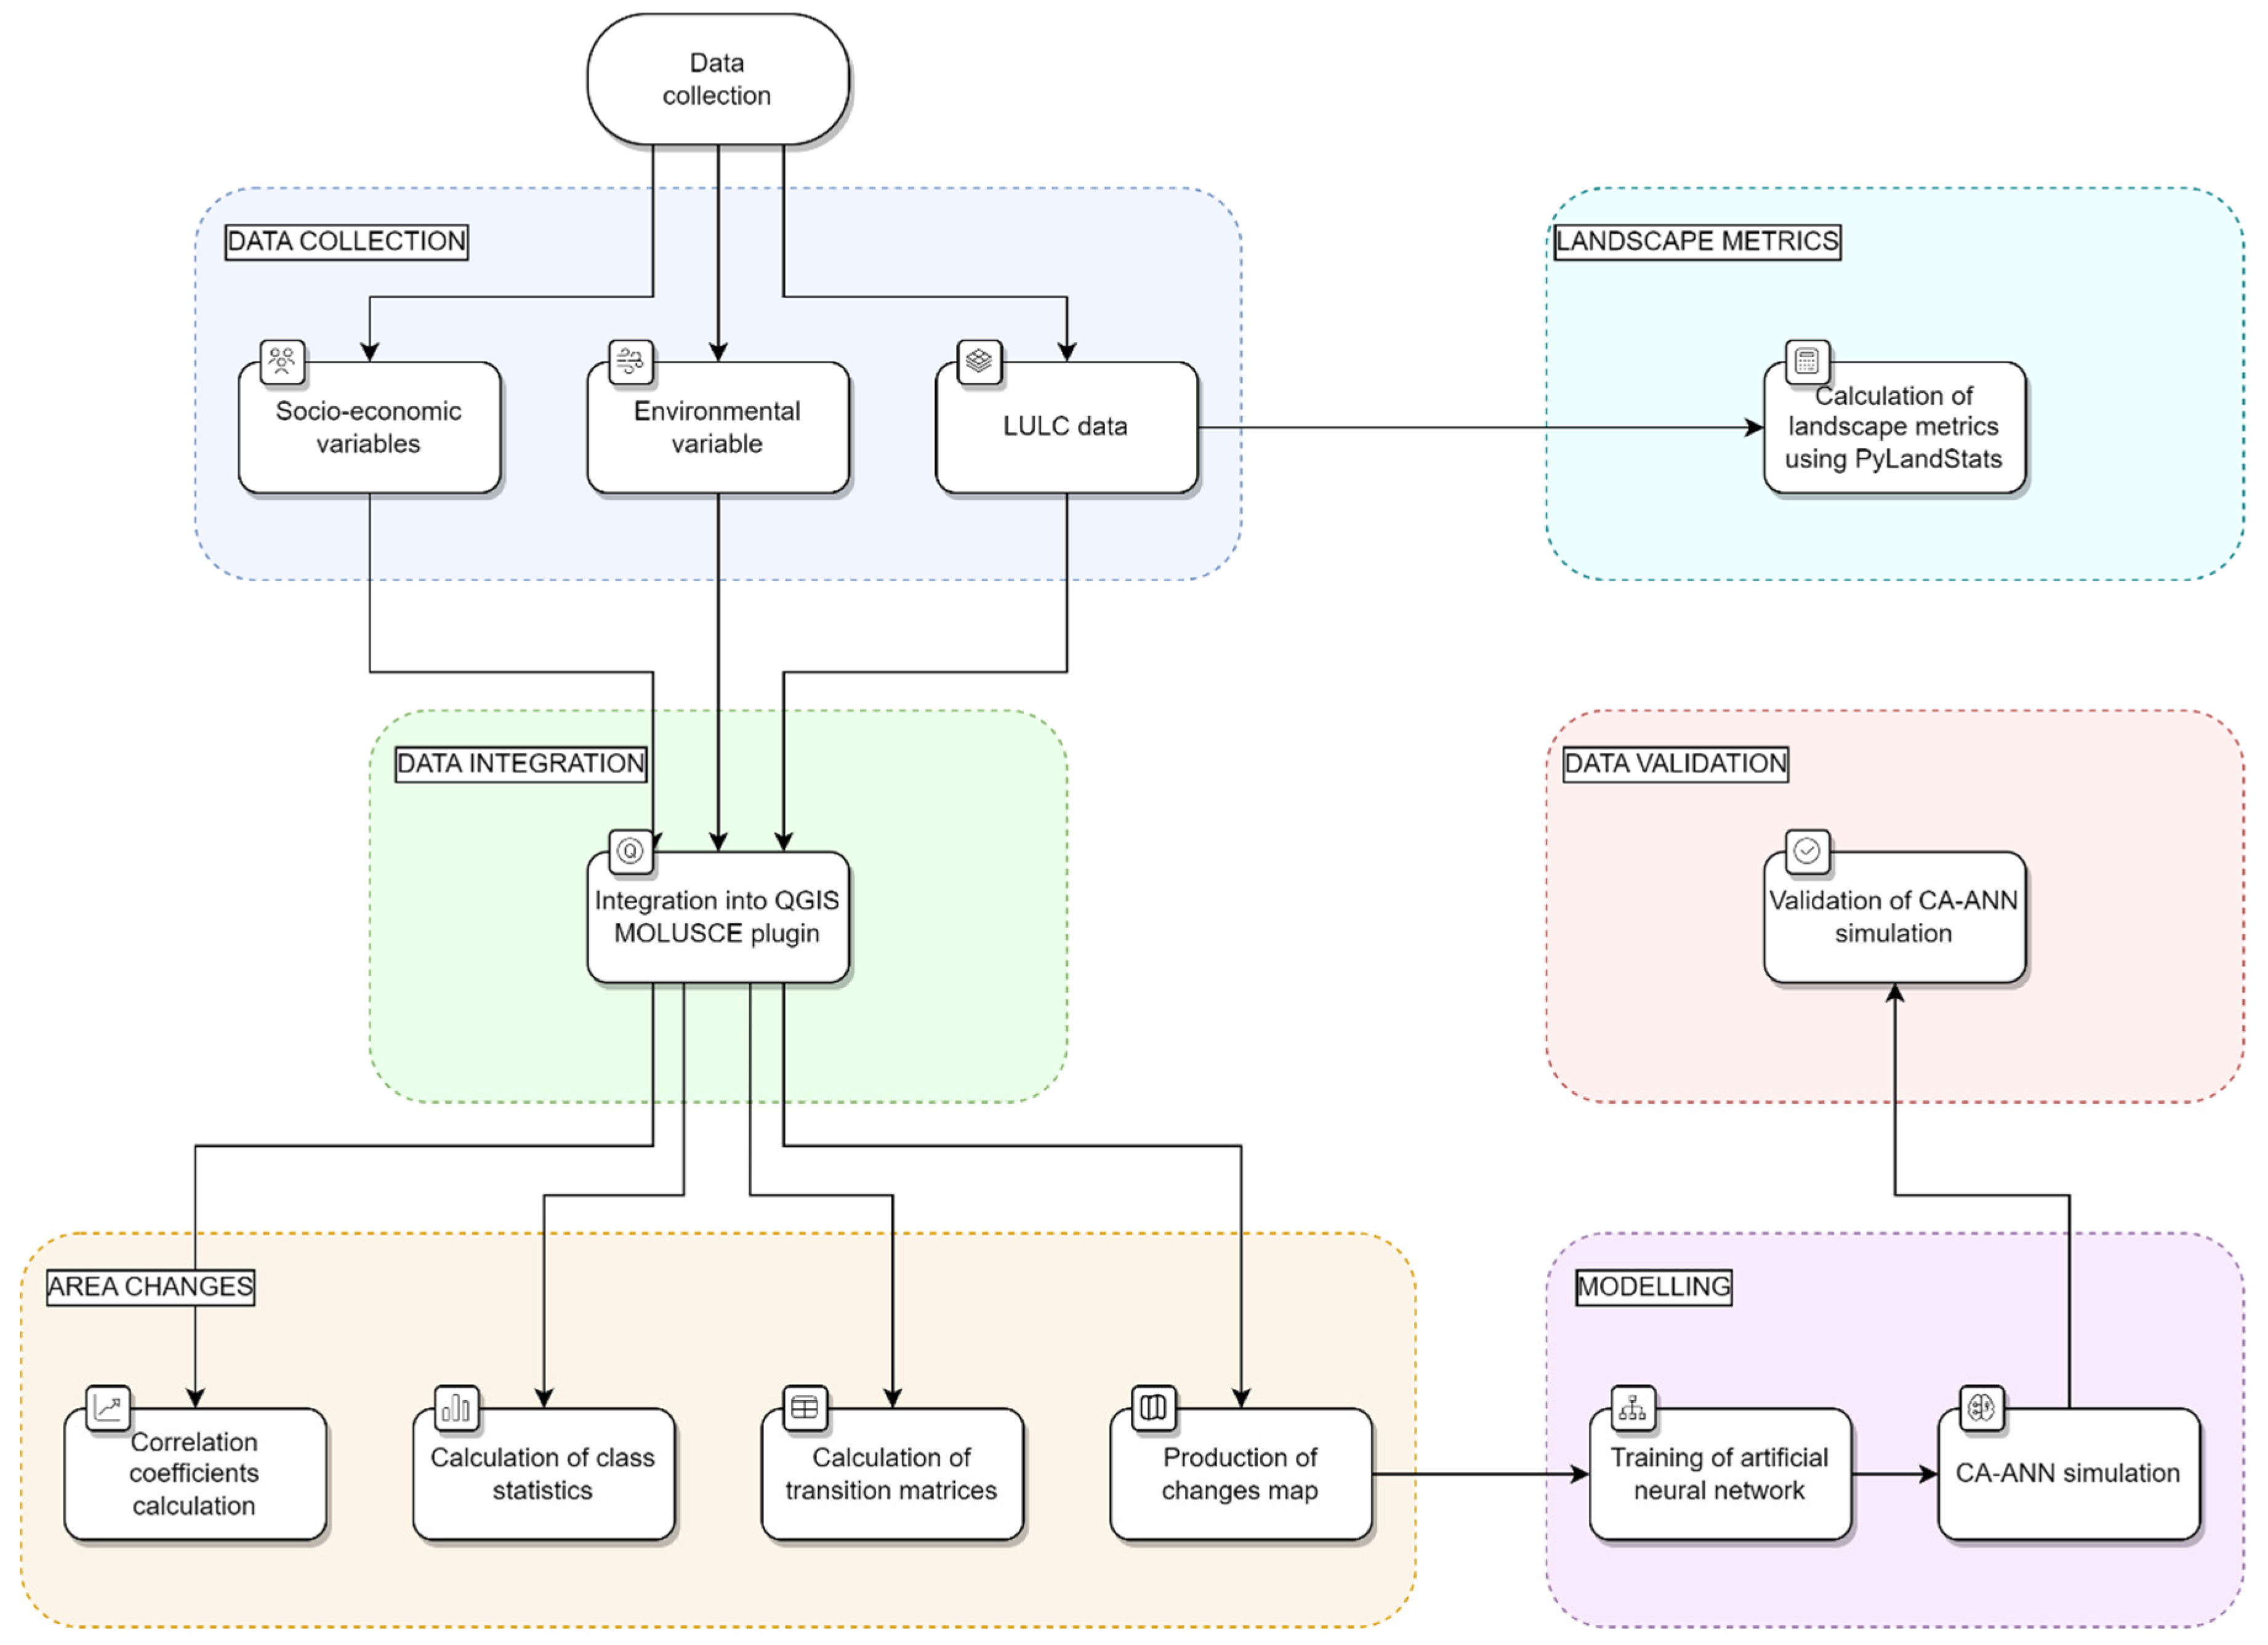
Figure 3.
LULC maps of the Kerch peninsula for 1990-1994 (A) and 1995-1999 (B) periods.
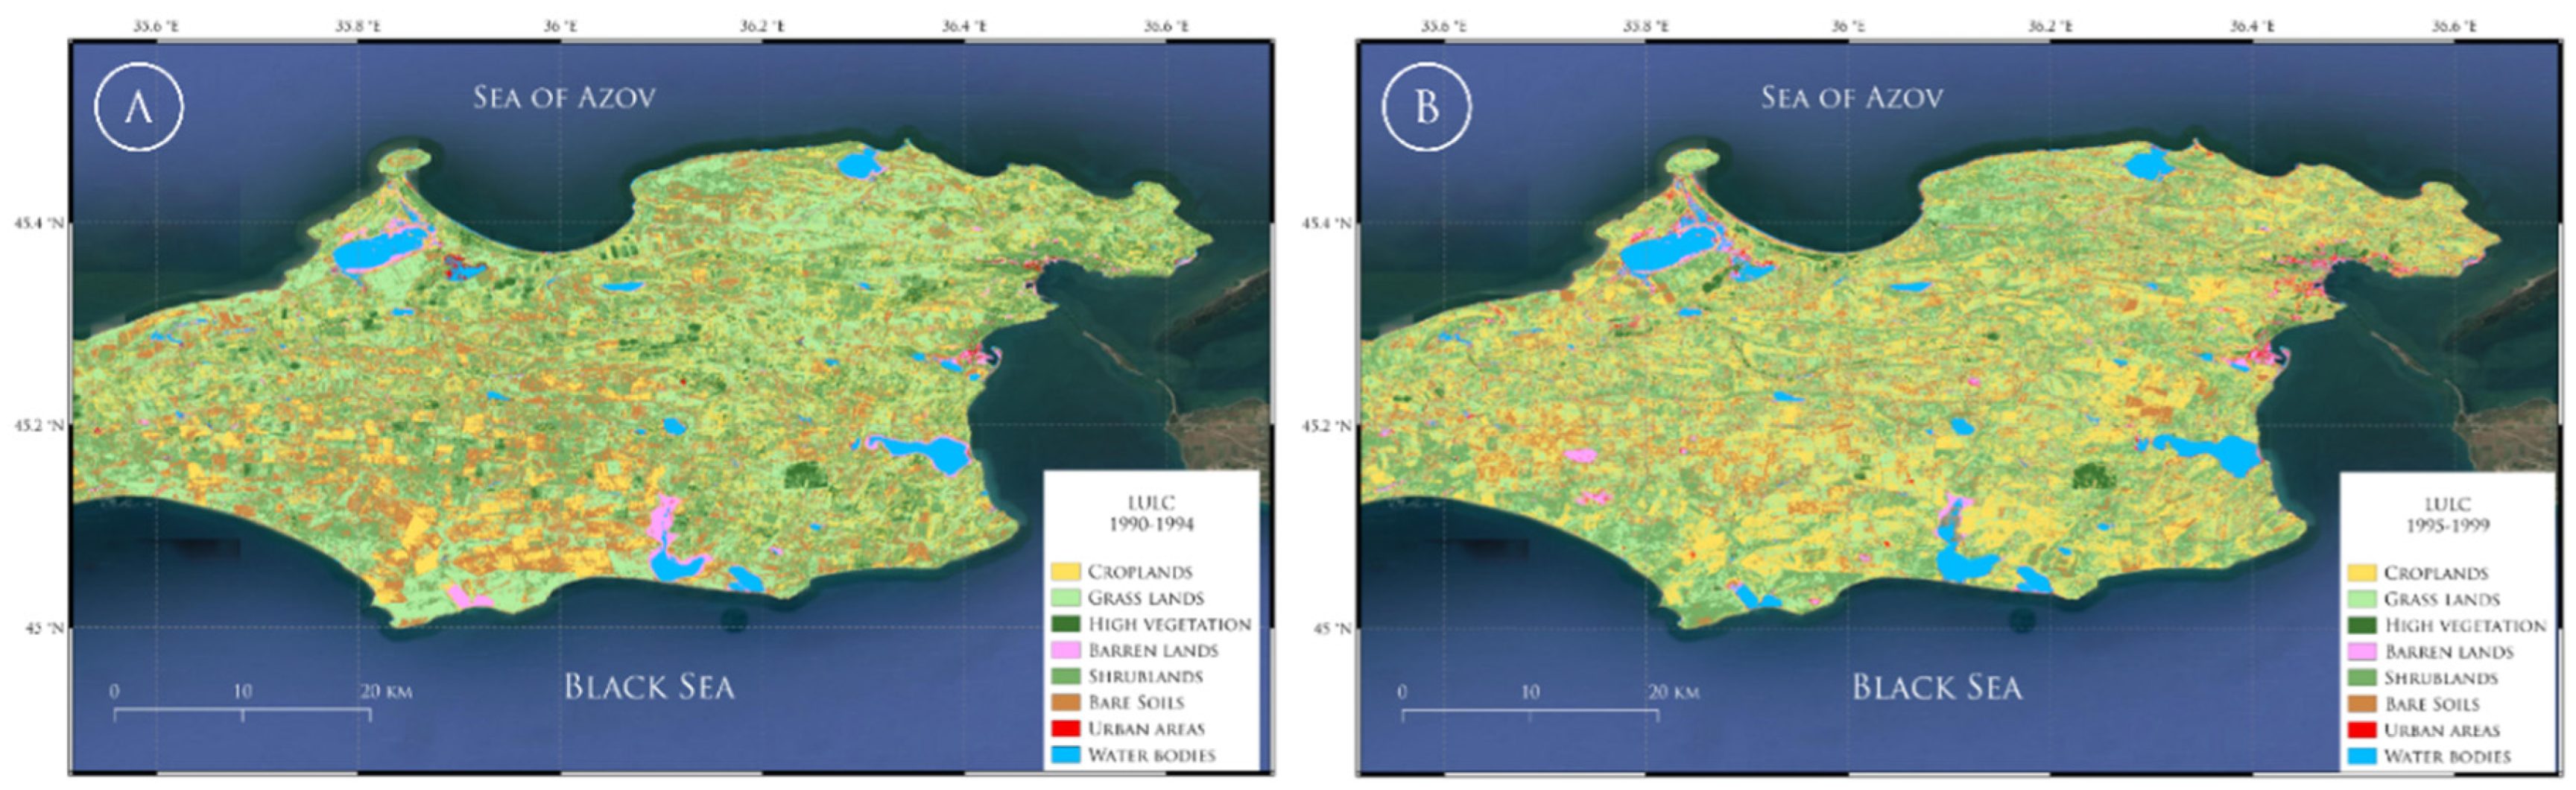
Figure 4.
LULC maps of the Kerch peninsula for 1995-1999 (A) and 2000-2004 (B) periods.
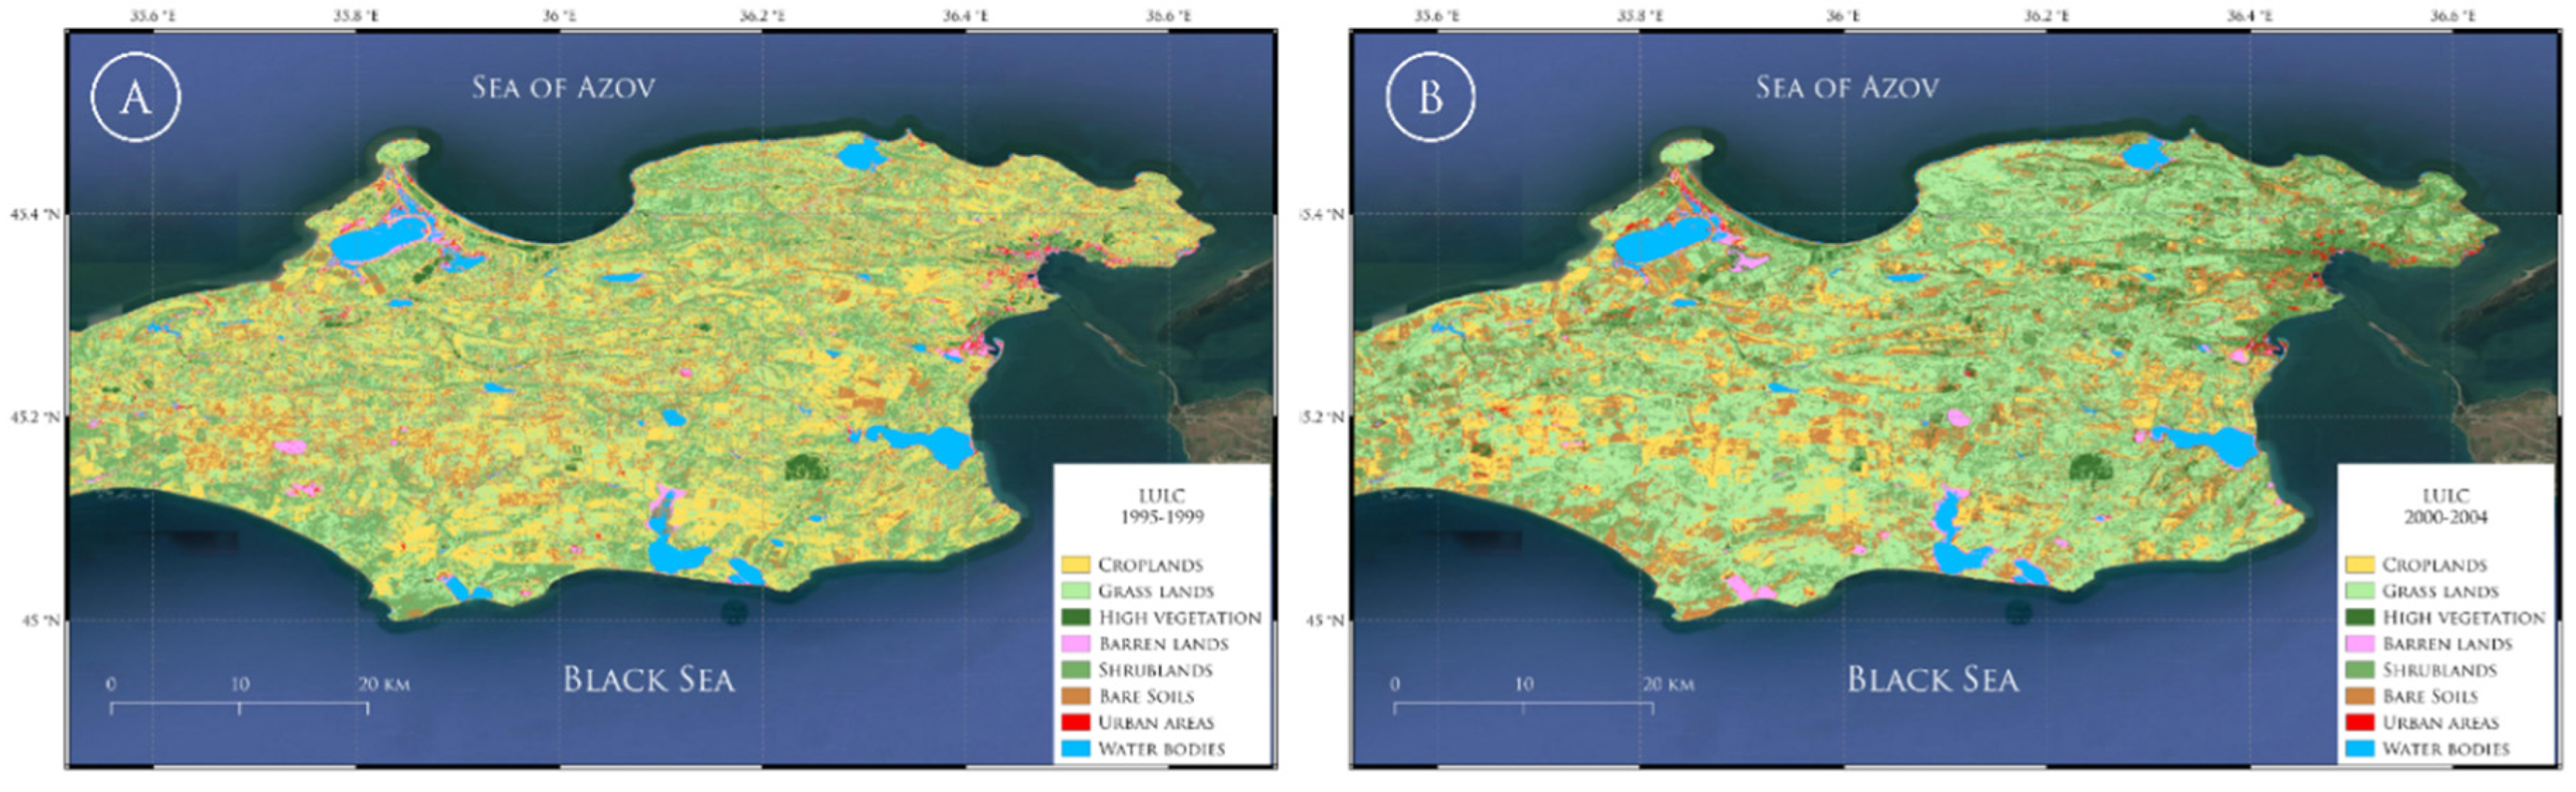
Figure 5.
LULC maps of the Kerch peninsula for 2000-2004 (A) and 2005-2009 (B) periods.
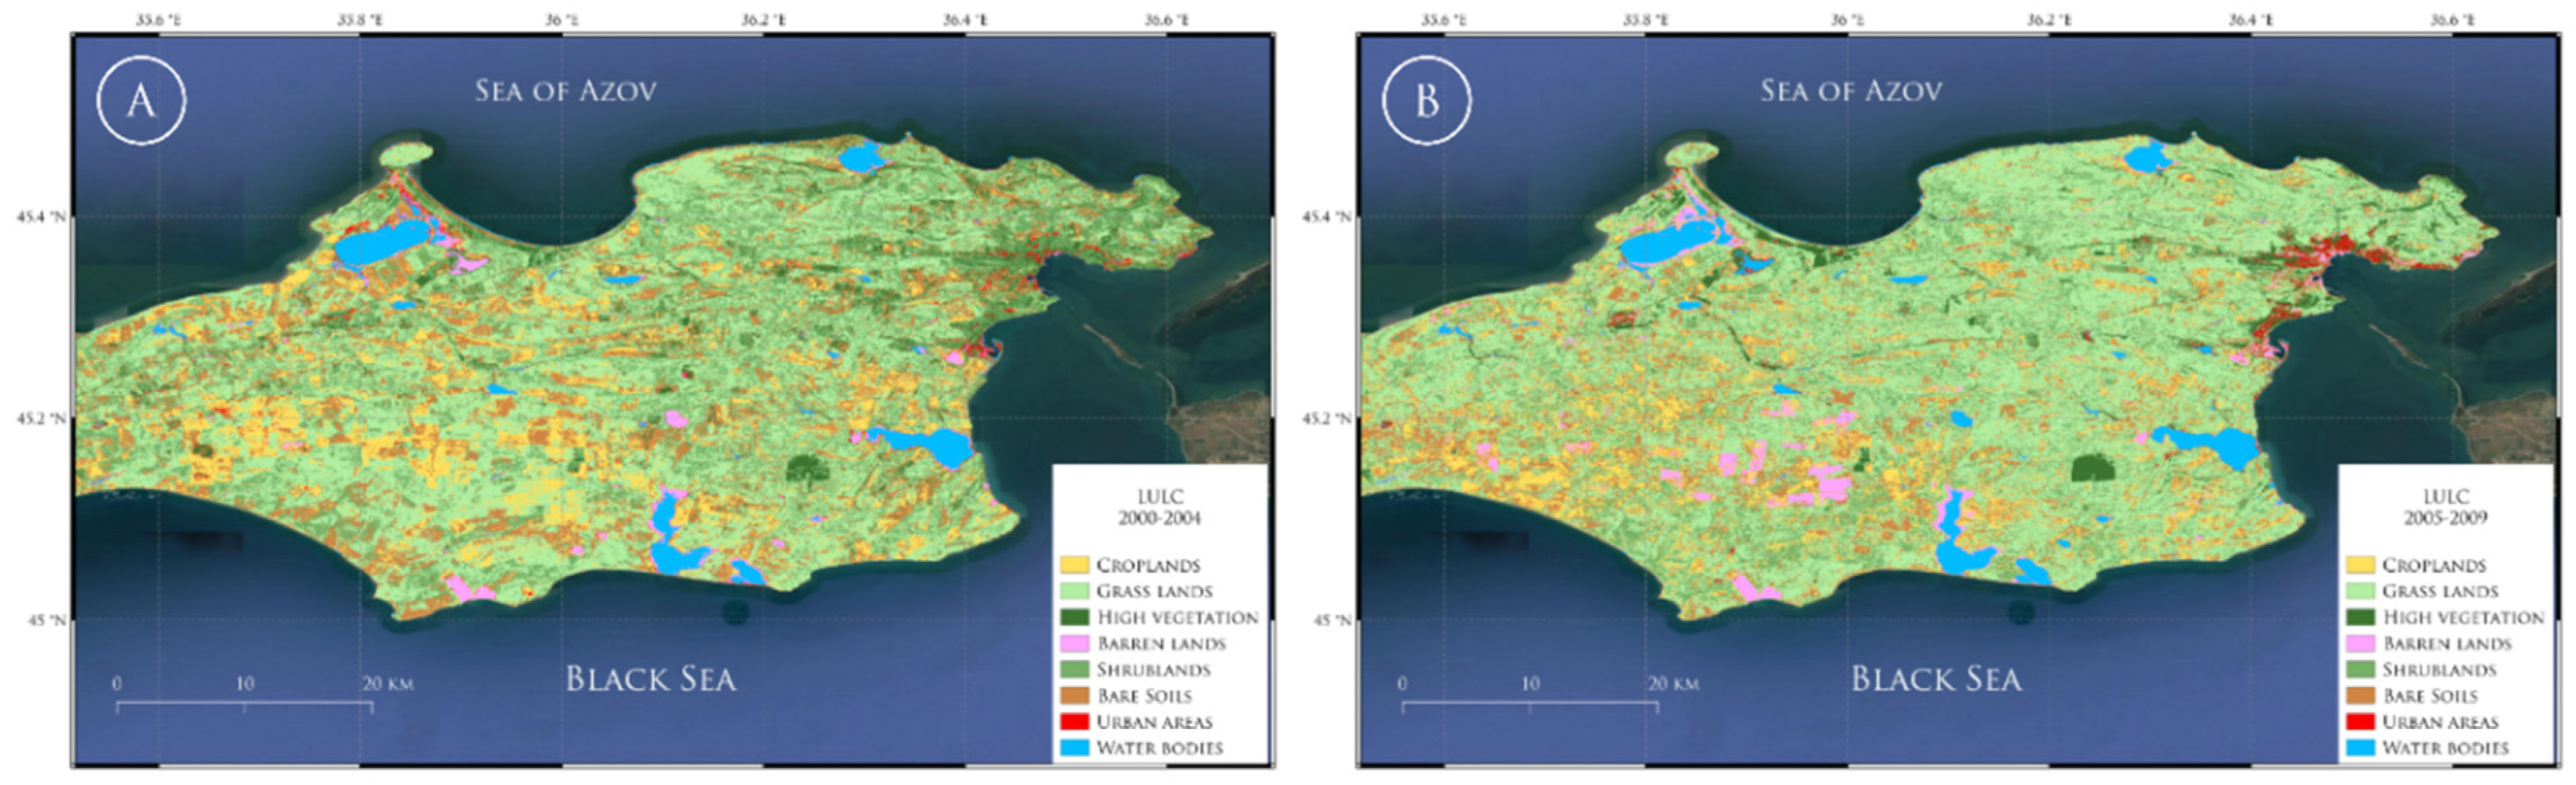
Table 1.
The datasets utilized in this study.
| Data type | Dataset name |
| Landsat 5 (TM) | LANDSAT/LT05/C02/T1-L2 |
| Landsat 7 (ETM+) | LANDSAT/LE07/C02/T1-L2 |
| Landsat 8 (OLI/TIRS) | LANDSAT/LC08/C02/T1-L2 |
| NDVI | Calculated from Landsat dataset |
| NDWI | Calculated from Landsat dataset |
| NDBI | Calculated from Landsat dataset |
| SMI | Calculated from Landsat dataset |
| Population density | CIESIN/GPWv411/GPW_Population_Density |
| Species distribution | GBIF |
| Climate Variables (Temperature and Precipitation) | ECMWF/ERA5/DAILY |
Table 2.
Transition matrix for the 1990-1999 period.
| From/To | Croplands | Grass Lands | High Vegetation | Barren Lands | Shrublands | Bare Soils | Urban Areas | Water Bodies |
| Croplands | 0.353 | 0.307 | 0.003 | 0.019 | 0.141 | 0.158 | 0.016 | 0.002 |
| Grass Lands | 0.213 | 0.324 | 0.001 | 0.005 | 0.290 | 0.160 | 0.006 | <0.001 |
| High Vegetation | 0.339 | 0.244 | 0.105 | 0.012 | 0.103 | 0.193 | 0.004 | 0.001 |
| Barren Lands | 0.014 | 0.003 | <0.001 | 0.436 | 0.004 | 0.008 | 0.057 | 0.478 |
| Shrublands | 0.259 | 0.300 | 0.029 | 0.003 | 0.247 | 0.159 | 0.002 | <0.001 |
| Bare Soils | 0.301 | 0.317 | 0.001 | 0.008 | 0.225 | 0.145 | 0.003 | 0.001 |
| Urban Areas | 0.017 | 0.015 | 0.016 | 0.523 | 0.140 | 0.038 | 0.184 | 0.067 |
| Water Bodies | 0.003 | 0.001 | <0.001 | 0.026 | 0.002 | 0.006 | 0.004 | 0.959 |
Class dynamics presents changes in land cover from 1990 to 1999 in the study area.
Table 3.
LULC dynamics on the Kerch peninsula in 1990-1999.
| Class Name | 1990-1994 (km²) | 1995-1999 (km²) | Δ (km²) | 1990-1994 (%) | 1995-1999 (%) | Δ (%) |
| Croplands | 493.39 | 753.76 | +260.37 | 17.02 | 26.00 | +8.98 |
| Grass Lands | 866.85 | 857.47 | -9.38 | 29.91 | 29.58 | -0.32 |
| High Vegetation | 102.29 | 36.79 | -65.50 | 3.52 | 1.26 | -2.26 |
| Barren Lands | 45.97 | 48.60 | +2.63 | 1.58 | 1.67 | +0.09 |
| Shrublands | 793.13 | 643.90 | -149.23 | 27.36 | 22.21 | -5.14 |
| Bare Soils | 508.28 | 437.26 | -71.03 | 17.53 | 15.08 | -2.45 |
| Urban Areas | 11.30 | 21.83 | +10.52 | 0.39 | 0.75 | +0.36 |
| Water Bodies | 76.99 | 98.59 | +21.60 | 2.66 | 3.40 | +0.74 |
Table 4.
LULC dynamics on the Kerch peninsula in 1995-2004.
| Class Name | 1995-1999 (km²) | 2000-2004 (km²) | Δ (km²) | 1995-1999, % | 2000-2004, % | Δ, % |
| Croplands | 753.76 | 315.25 | -438.51 | 26.00 | 10.87 | -15.13 |
| Grass Lands | 857.47 | 1160.78 | +303.31 | 29.58 | 40.04 | +10.46 |
| High Vegetation | 36.79 | 153.66 | +116.87 | 1.26 | 5.30 | +4.04 |
| Barren Lands | 48.60 | 39.65 | -8.95 | 1.67 | 1.36 | -0.31 |
| Shrublands | 643.90 | 640.06 | -3.84 | 22.21 | 22.08 | -0.13 |
| Bare Soils | 437.26 | 488.43 | +51.17 | 15.08 | 16.85 | +1.77 |
| Urban Areas | 21.83 | 20.81 | -1.02 | 0.75 | 0.72 | -0.03 |
| Water Bodies | 98.59 | 80.08 | -18.51 | 3.40 | 2.76 | -0.64 |
Table 5.
Transition matrix for the 1995-2004 period.
| From/To | Croplands | Grass Lands | High Vegetation | Barren Lands | Shrublands | Bare Soils | Urban Areas | Water Bodies |
| Croplands | 0.180 | 0.365 | 0.050 | 0.001 | 0.163 | 0.239 | 0.002 | <0.001 |
| Grass Lands | 0.102 | 0.456 | 0.041 | <0.001 | 0.235 | 0.164 | <0.001 | <0.001 |
| High Vegetation | 0.003 | 0.037 | 0.582 | <0.001 | 0.368 | 0.011 | <0.001 | 0.000 |
| Barren Lands | 0.101 | 0.016 | 0.139 | 0.319 | 0.019 | 0.118 | 0.211 | 0.077 |
| Shrublands | 0.047 | 0.490 | 0.026 | 0.001 | 0.327 | 0.109 | <0.001 | <0.001 |
| Bare Soils | 0.121 | 0.403 | 0.073 | 0.001 | 0.208 | 0.191 | 0.003 | <0.001 |
| Urban Areas | 0.154 | 0.026 | 0.149 | 0.056 | 0.011 | 0.313 | 0.288 | 0.003 |
| Water Bodies | 0.002 | 0.001 | 0.004 | 0.211 | 0.001 | 0.007 | 0.005 | 0.771 |
Table 6.
LULC dynamics on the Kerch peninsula in 2000-2009.
| Class | 2000-2004 (km2) | 2005-2009 (km2) | Δ (km2) | 2000-2004 (%) | 2005-2009 (%) | Δ (%) |
| Croplands | 315.25 | 289.35 | -25.90 | 10.87% | 9.97% | -0.89% |
| Grass Lands | 1160.78 | 1416.13 | +255.35 | 40.01% | 48.81% | +8.80% |
| High Vegetation | 153.66 | 69.55 | -84.12 | 5.29% | 2.40% | -2.89% |
| Barren Lands | 40.03 | 70.99 | +30.97 | 1.38% | 2.44% | +1.06% |
| Shrublands | 640.07 | 552.86 | -87.20 | 22.07% | 19.09% | -3.00% |
| Bare Soils | 488.43 | 388.52 | -99.92 | 16.84% | 13.39% | -3.44% |
| Urban Areas | 20.82 | 21.08 | +0.26 | 0.72% | 0.73% | +0.01% |
| Water Bodies | 81.70 | 92.25 | +10.56 | 2.82% | 3.18% | +0.36% |
Table 7.
Transition matrix for the 2000-2009 period.
| From/To | Croplands | Grass Lands | High Vegetation | Barren Lands | Shrublands | Bare Soils | Urban Areas | Water Bodies |
| Croplands | 0.216 | 0.405 | <0.001 | 0.050 | 0.123 | 0.205 | <0.001 | <0.001 |
| Grass Lands | 0.081 | 0.601 | 0.001 | 0.007 | 0.194 | 0.116 | <0.001 | <0.001 |
| High Vegetation | 0.037 | 0.328 | 0.184 | 0.009 | 0.291 | 0.104 | 0.047 | 0.001 |
| Barren Lands | 0.019 | 0.003 | 0.008 | 0.483 | 0.012 | 0.111 | 0.011 | 0.353 |
| Shrublands | 0.069 | 0.488 | 0.062 | 0.001 | 0.250 | 0.110 | 0.019 | <0.001 |
| Bare Soils | 0.150 | 0.464 | 0.001 | 0.021 | 0.171 | 0.191 | 0.001 | <0.001 |
| Urban Areas | 0.155 | 0.032 | 0.001 | 0.547 | 0.017 | 0.238 | 0.007 | 0.003 |
| Water Bodies | <0.001 | 0.000 | 0.000 | 0.042 | <0.001 | 0.003 | 0.001 | 0.953 |
Table 8.
LULC dynamics on the Kerch peninsula in 2005-2014.
| Class | 2005-2009 (km2) | 2010-2014 (km2) | Δ (km2) | 2005-2009 (%) | 2010-2014 (%) | Δ (%) |
| Croplands | 289.52 | 480.63 | +191.10 | 9.97% | 16.57% | +6.59% |
| Grass Lands | 1416.27 | 1276.56 | -139.71 | 48.82% | 44.00% | -4.82% |
| High Vegetation | 69.55 | 83.54 | +13.99 | 2.39% | 2.88% | +0.48% |
| Barren Lands | 71.08 | 47.29 | -23.78 | 2.44% | 1.63% | -0.82% |
| Shrublands | 552.96 | 415.80 | -137.16 | 19.05% | 14.33% | -4.77% |
| Bare Soils | 388.54 | 501.75 | +113.21 | 13.39% | 17.29% | +3.90% |
| Urban Areas | 21.08 | 18.72 | -2.36 | 0.73% | 0.65% | -0.08% |
| Water Bodies | 92.25 | 76.96 | -15.29 | 3.18% | 2.65% | -0.53% |
Disclaimer/Publisher’s Note: The statements, opinions and data contained in all publications are solely those of the individual author(s) and contributor(s) and not of MDPI and/or the editor(s). MDPI and/or the editor(s) disclaim responsibility for any injury to people or property resulting from any ideas, methods, instructions or products referred to in the content. |
© 2024 by the author. Licensee MDPI, Basel, Switzerland. This article is an open access article distributed under the terms and conditions of the Creative Commons Attribution (CC BY) license (https://creativecommons.org/licenses/by/4.0/).
Copyright: This open access article is published under a Creative Commons CC BY 4.0 license, which permit the free download, distribution, and reuse, provided that the author and preprint are cited in any reuse.


