
Submitted:
17 September 2025
Posted:
18 September 2025
You are already at the latest version
Abstract
Bangladesh is highly susceptible to land use land cover (LULC) changes due to its geographical location. These changes have significant effects on food security, urban development, and natural resource management. Policy planning and resource management largely depend on accurate and detailed LULC maps. However, Bangladesh does not have its own national scale detailed high-resolution LULC maps. This study aims to develop high-resolution land use land cover (HRLULC) maps for Bangladesh for the years 2020 and 2023 using a deep learning method based on convolutional neural network (CNN), and to analyze LULC changes between these years. We used an advanced LULC classification algorithm, namely SACLASS2, that was developed by JAXA to work on multi-temporal satellite data from different sensors. Our HRLULC maps with 14 categories achieved an overall accuracy of 94.55% ± 0.41% with Kappa coefficient 0.93 for 2020 and 94.32% ± 0.42% with Kappa coefficient 0.93 for 2023, which is higher than the commonly accepted standard of around 87% overall accuracy for 14 category LULC map. Between 2020 and 2023, the most notable LULC increase were observed in single cropland (17% ± 4%), aquaculture (20% ± 5%), and brickfield (56% ± 25%). Conversely, decrease occurred for salt pans (47% ± 16%), bare land (24% ± 3%), and built-up (13% ± 3%). These findings offer valuable insights into the spatio-temporal patterns of LULC in Bangladesh, which can support policymakers in making informed decisions and developing effective conservation strategies aimed at promoting sustainable land management and urban planning.
Keywords:
land use land cover (LULC)
; convolutional neural network (CNN)
; sentinel-2
; palsar-2
; sentinel-1
; change detection
; Bangladesh
1. Introduction
High-resolution land use land cover (HRLULC) maps provide clear advantages over coarse or moderate-resolution maps, especially in highly fragmented landscapes like Bangladesh. Bangladesh is predominantly characterized by flat terrain formed from the alluvial floodplains of numerous rivers, making it one of the most disaster-prone countries in the world [1,2,3]. The country experiences a wide range of natural hazards, including tropical cyclones, floods, tornadoes, sea-level rise, soil salinization, storm surges, droughts, and heatwaves [4,5]. In addition to these environmental challenges, Bangladesh faces a significant demographic pressure due to its persistent population growth [6,7,8]. Together, frequent natural disasters and rapid population expansion are the primary drivers of LULC changes in the country. An accurate HRLULC map is essential for assessing ecosystem and biodiversity risks, ensuring food security, mitigating natural hazards, and supporting effective urban planning and sustainable development [9,10,11]. It also provides critical insights into a range of human-induced processes, including climate change [12], urban expansion [13], changes in terrestrial carbon storage [14], occurrence and impacts of natural disasters [15], and the development of effective mitigation and adaptation strategies [16]. As such, LULC maps serve as indispensable tools in environmental modeling, facilitating the understanding of both natural and socio-economic processes. However, the accuracy and reliability of these maps are heavily influenced by the quality and nature of the data used in their development.
Satellite imagery is a widely used and reliable data source for mapping LULC [17]. Single-temporal datasets often lack sufficient information to capture the dynamic processes of LULC. In contrast, multi-temporal LULC mapping can address these limitations by incorporating temporal variability to provide better classification accuracy [18,19,20]. In recent years, deep learning particularly Convolutional Neural Networks (CNNs) has demonstrated strong performance across various applications, including image classification [21,22,23], object detection [24], semantic segmentation [25,26], and even pixel-level LULC classification [27,28]. CNNs are well-suited for satellite imagery due to their ability to process multi-dimensional spatial data efficiently [29]. However, conventional CNNs typically perform convolutions along the spatial dimensions of single-time-point imagery, which limits their ability to capture detailed LULC patterns and temporal dynamics. To address this, Hirayama et al. (2022) developed SACLASS2 [30], a CNN-based classification framework that integrates multi-temporal satellite imagery with down-sampling and fully connected layers for pixel-based classification to preserve spatial detail and improve accuracy. This method has previously been applied to generate 12-category HRLULC maps for Japan [30] and Vietnam [31], achieving high overall accuracies of 88.85 % and 90.5 %, respectively.
Several global LULC datasets such as Esri Land Cover [32], ESA WorldCover [33], and Dynamic World (DW) [34] are publicly available. However, their accuracy and consistency often vary across geographic scales, from continental to national and regional levels [35]. A common limitation of these global products is their LULC classification system offering a limited number of categories, which restricts their applicability for local-scale planning and environmental assessment. Consequently, their performance is often inadequate in ecologically diverse and heterogeneous regions. To overcome these limitations, the development of country-specific, high-resolution LULC maps is essential for accurate land resource monitoring and evidence-based policymaking.
Bangladesh lacks an up-to-date, national-scale, high-resolution time-series-based LULC dataset. The only major national initiative to date is the Land Cover Atlas of Bangladesh 2015 [36], developed using commercial SPOT satellite imagery under the project Strengthening National Forest Inventory and Satellite Land Monitoring System in support of REDD+. However, the atlas has not been updated since its release, significantly limiting its potential for up-to-date land use planning, environmental monitoring, and policy development. In the last decade, several studies have produced small-scale or region-specific LULC maps for various parts of Bangladesh, primarily using single-temporal, moderate or coarse-resolution satellite imagery. These include efforts focused on Greater Dhaka [37], Chattogram [38], Gazipur [39], Bhanga [40], the RAMSAR site Hakaluki Haor [41], and Barishal [42], among others. While these studies provide valuable localized insights, they are limited in the number of categories, geographic scope, unable to provide national-scale land use dynamics for broad-scale environmental assessments and policy planning. To address these limitations, this study aims to develop comprehensive, high-resolution (10 m) LULC maps for Bangladesh at the national scale. The maps have 14 popular LULC categories, including some unique categories, such as jhum, brickfields, and salt pans. In addition, LULC change detection was performed to assess spatial transformations in land cover between 2020 and 2023.
2. Materials and Methods
2.1. Study Area
The study was conducted across the entire territory of Bangladesh, encompassing all 64 administrative Districts. Geographically, the study area spans from 20°34° to 26°38′ north latitude and from 88∘01′ to 92∘41′ east longitude (see Figure 1). For analytical purposes, Bangladesh is divided into 27 tiles, each tile covering 1∘ latitude by 1∘ longitude . The region features a diverse topography, including mountainous areas in the east, an extensive coastal belt, and a vast deltaic plain in the south. Bangladesh is bordered by India on three sides (i.e., the north, west, and a portion of the east) and also shares a southeastern border with Myanmar [43]. The climate is tropical and is traditionally characterized by six distinct seasons: Summer, Rainy, Autumn, Late Autumn, Winter, and Spring.
2.2. LULC Classification System Design
A classification system for LULC was developed to identify the dominant LULC types relevant to the study area and its specific objectives [44,45]. Given Bangladesh’s geographical, topographical, and climatic heterogeneity, the country presents a complex and diverse landscape. Therefore, the definition of LULC categories must account for local geographic conditions, specific developmental needs, and both spatial and temporal variations. This study employs 14 distinct LULC categories, formulated using local knowledge in conjunction with the Land Cover Classification System (LCCS) developed by the Food and Agriculture Organization (FAO) of the United Nations (see Table 1). Some of these categories are unique to Bangladesh and reflect its national significance and socio-environmental context. For instance, jhum (shifting cultivation) is a traditional agricultural practice predominantly observed in the Chattogram Hill Tracts (CHT), where indigenous communities rely on it for subsistence and cultural continuity. Another noteworthy category is brickfields, which are widespread in Bangladesh due to the escalating demand for construction materials. In the southeastern coastal region, salt pans are used for the solar evaporation of seawater, primarily during the dry season. These small-scale operations are critical to national salt production and play a significant role in meeting domestic consumption needs.
2.3. Input Datasets
2.3.1. Optical Sensor Data (Sentinel-2/MSI)
Sentinel-2/MSI 10 m and 20 m resolution data were used as optical sensor data for this study (see Table 2). Specifically, the Sentinel-2 Level-2A [46] product was employed, which provides surface reflectance images that have been radiometrically calibrated for accurate analysis. Sentinel-2 Level-2A products are the result of advanced processing from Level-1C (Top-of-Atmosphere Reflectance) using Sen2Cor software [47]. Optical satellite imagery is frequently affected by cloud cover; therefore, cloud masking is applied to exclude cloud-contaminated pixels. In this study, images with more than 30% cloud cover were first filtered out to minimize the impact of excessive cloud contamination. Then, we used a combination of Sentinel-2 Cloud Probability (s2cloudless), Cloud Displacement Index (CDI), and Directional Distance Transform (DDT) to mask clouds and their shadows. This technique was applied to effectively remove cloud and shadow effects from Level-2A images [48].
2.3.2. Synthetic Aperture Radar Data (Sentinel-1 and PALSAR-2/ScanSAR)
This study utilized Sentinel-1 Ground Range Detected (GRD) C-band SAR imagery at 10 m resolution [49], preprocessed with thermal noise removal, radiometric calibration, and terrain correction using the angular-based method [50] with the SRTM DEM and default vegetation model. Speckle noise was reduced via the Refined Lee Filter (3×3 window), as recommended by Hird et al. (2017) [51]. Dual-polarization (VV and VH) bands were used to compute both the difference and ratio (Equations 1 and 2), and calibrated to gamma-naught () for cross-date comparability. Two texture metrics namely Sum Average and Dissimilarity were calculated for each polarization using the ee.Image.glcmTexture() function in Google Earth Engine, resulting in 8 final bands: VV, VH, difference, ratio, and 4 texture features.
Additionally, 25-meter PALSAR-2 ScanSAR Level 2.2 SAR data from JAXA [52], which are widely used L-band SAR datasets for forest mapping and coastal change analysis [53], were included. Speckle filtering was performed with the Refined Lee Filter (5×5 window), and pixel values were converted to in decibels using Equation 3 with a calibration factor (CF) of dB [54]. The final set of features included three bands: HH (horizontal transmit, horizontal receive), HV (horizontal transmit, vertical receive), and the local incidence angle (LIN).
2.3.3. Ancillary Data (AW3D30 and OpenStreetMap)
Digital Surface Models (DSMs) and OpenStreetMap (OSM) data are widely used to enhance the accuracy of LULC classification [55,56,57]. In this study, we incorporated slope and aspect derived from the 30 m resolution ALOS World 3D (AW3D30) DSM [58], generated using the Panchromatic Remote-sensing Instrument for Stereo Mapping (PRISM) onboard ALOS. This topographic information helps distinguish natural landforms from human-made features. Additionally, vector data for road and river networks were obtained from GeoFabrik’s OpenStreetMap repository [59]. These were converted to raster format in QGIS to produce distance-to-road and distance-to-river maps, which were subsequently integrated into the SACLASS2 pixel-based classification algorithm.
2.4. Satellite Images Pre-Processing
To capture seasonal changes of LULC and minimize image noise, seasonal median composites were generated from satellite imagery, aligned with Bangladesh’s six-season, each spanning two months (see Table 3). This seasonal framework reflects not only climatic variations but also agricultural cycles and socio-cultural practices. To address cloud contamination and data gaps, we adopted a multi-year time series compositing method, adapted from Truong et al. (2024) [31]. For the 2023 HRLULC map, monthly median composites were generated using data from 2022, 2023, and 2024. Similarly, for 2020, data from 2019, 2020, and 2021 were used. Seasonal composites were then created by merging monthly images, with higher weighting assigned to the target year (2023 or 2020) to retain its temporal integrity. All Sentinel-2 pre-processing was conducted on Google Earth Engine, with final datasets exported via the Earth Engine Python API for local analysis.
2.5. Remote Sensing Indices
To improve feature extraction and classification accuracy, a range of spectral and radar-derived indices were calculated, as summarized in Table 4. Vegetation indices including NDVI, EVI, GNDVI, and GRVI were used to assess vegetation health and density, facilitating the distinction of vegetation-related land cover types such as cropland and forest. For water body detection, modified variant of NDWI, and NDPI were employed, offering strong sensitivity to surface water and aiding in the identification of flooded areas and aquaculture ponds. To differentiate built-up areas and bare soil, we used GSI, BSI, and NDTI. Additionally, to compensate for limitations of optical imagery particularly under dense vegetation or persistent cloud cover SAR-based indices such as the Radar Vegetation Index (RVI) were incorporated to enhance classification robustness.
In this research, we used a variety of input data to feed into our CNN based deep learning classification algorithm SACLASS2. A summary of the input features is presented in Table 5.
2.6. Reference Data Collection
Reference data is critical for supervised LULC classification, as it provides both training inputs for the classifier and validation data for accuracy assessment. The quality of this data directly affects the reliability of the resulting LULC maps. In this study, reference data were compiled through a combination of field observations, random sampling and label checking from existing high-quality LULC maps, and manual interpretation of satellite imagery. A total of 67,034 reference data were used for the year 2023 and 45,515 for the year 2020. Figure 2 illustrates the spatial distribution of the training and validation data used in generating the HRLULC maps for Bangladesh in 2023.
2.6.1. Random Reference Data Collection from Existing LULC Maps
Reference data were derived from two authoritative land-use/land-cover (LULC) products: the ESA Global Land Cover map [70] and the Esri 10 m Annual Land Cover dataset [71]. LULC categories were first harmonized to match the study’s classification scheme, after which stratified random sampling was performed within each selected category to generate candidate reference data. Each data was then independently checked through multi-source cross-checks, including time-series vegetation indices, multi-temporal Google Earth Pro imagery, Mapillary street-view imagery, and true- and false-color Sentinel-2 composite images. We excluded data points that were difficult to interpret; around 50% of the total points were removed for this reason.
Labels were corrected as necessary to ensure consistency and minimize classification bias.
2.6.2. Visual Interpretation
Visual interpretation of high-resolution satellite imagery remains a widely used and effective approach for generating large volumes of reference data in remote sensing studies. The incorporation of local knowledge further enhances the reliability and accuracy of such data, particularly in complex or heterogeneous landscapes. In the present study, reference data collection for LULC categories not represented in the existing LULC maps was supported through a combination of tools, including Google Earth Engine, Google Earth Pro, and the open-source GIS platform QGIS.
2.6.3. Field Work
Field work in this study served two key purposes: (1) to collect high-quality reference data, and (2) to obtain contextual insights into local LULC conditions and changes. Field-based knowledge enhances classification accuracy. Fieldwork was carried out in January 2025, focusing on 10 Districts that encompasses roughly 20% of the study area in Bangladesh. Ground truth data were collected using cameras including GoPro MAX, smartphone, and digital camera as well as a custom web-based application (Figure 3) (https://smmanik.com/sample/). A total of 1,128 valid ground truth data were collected and used as reference data. Figure 4 presents example images and corresponding LULC categories. Despite its benefits, field data collection is constrained by time, cost, and logistics, which limit the total number of reference data that can be acquired.
2.7. Classification Algorithm
In this study, we employed the multi-temporal LULC classification model SACLASS2 developed by JAXA (Figure 5). SACLASS2 is a pixel-based, supervised classification algorithm built on a CNN architecture. Unlike conventional CNNs that operate primarily in the spatial domain, SACLASS2 performs convolutions across both temporal and spectral dimensions. Each geographic pixel (defined by a specific latitude and longitude) was thus represented by a 38×6 matrix, corresponding to 38 features over six two-month intervals. SACLASS2 processes this matrix to generate an output vector of 14 elements, each indicating the classification probability for one of the 14 land cover categories. When these probabilities are arranged spatially, the result is a probability map, which serves as an intermediate product. The final LULC map is then derived by assigning each pixel to the category with the highest probability. Both the probability map and the final classified LULC map are output and stored. For the sake of suitable feature selection we tested 3 different feature combinations with same validation data and picked up the best one. The classification process was conducted in a high-performance computing environment running Ubuntu 22.04.5 LTS, equipped with an Intel Core i9-12900K processor, 128 GB of RAM, and an NVIDIA RTX A6000 GPU (48 GB VRAM). The software environment included Python 3.9.15 and CUDA 12.2.
2.8. Reference Data Migration for HRLULC of Year 2020
We created the reference data for the year 2020 by using the automatic reference data migration technique proposed by Huang et al. (2020) [72]. This method migrates reference data from the reference year (the year 2023) to the target year (the year 2020) by comparing temporal spectral signatures between these two years. The reference year denotes the period with available labeled reference data, while the target year refers to the period requiring reference data. For each reference data point, we calculated spectral angle distance (SAD) and euclidean distance (ED) between two vectors and for both the reference and the target year. Let represent the spectral vector at a reference data in the reference image, and represent the corresponding vector in the target image at the same geographical location, where n denotes the number of spectral bands in the Sentinel-2 images (n = 10). Instead of using seasonal data, we used only the 1-year median composite image of Sentinel-2 (10 bands) to simplify the calculation of SAD and ED. These metrics are formalized in Equations 4 and 5, respectively.
When the spectral band values in the target image closely match those in the reference image, the ED approaches 0, and the SAD approaches 1. Leveraging this principle, multiple threshold combinations were tested during the 2020 HRLULC classification. The highest classification accuracy was achieved with thresholds of ED = 0.02 and SAD = 0.998, which were thus adopted as optimal for reference data migration. The resulting volume of migrated reference samples was sufficient for both training and validation of the classification model. LULC change analysis between 2020 and 2023 was then conducted.
2.9. Estimating Accuracy and Area of Change
Classification accuracy generally refers to how closely the remotely sensed data matches with reference information [73]. Classification accuracy can be influenced by the methods used, the process followed, and the timing and location of the analysis [38]. Overall Accuracy (OA), defined as the proportion of correctly classified samples, remains the most widely adopted metric for evaluating classification performance. The reference dataset was randomly divided into 80% for training and 20% for validation purposes. To ensure a statistically robust evaluation of the LULC map accuracy, we adopted the methodology proposed by Olofsson et al. (2014) [75]. First, a sample count error matrix was constructed using the validation data. Table 6 shows a generalized example of such an error matrix for a LULC map with q categories. Second, an estimated error matrix (Table 7) was generated by multiplying each row of Table 6 by the area proportion of the corresponding map category. The estimated area proportion in cell of Table 7 was calculated using Equation 6:
where is the area proportion of the category i on the map (, in which is mapped area of category i and is the total area of the map), and are from Table 6. The user’s accuracy (), the producer’s accuracy () of category i, and overall accuracy () are as follows:
The estimated variance of the overall accuracy [], user’s accuracy [] of category i are as follows:
For producer’s accuracy [] of reference class , the estimated variance is
where is the estimated marginal total number of pixels of reference class j, is the mapped area (in pixels) of map class j, and is the total number of sample units in map class j.
The area proportions for each reference-defined category j are estimated from the column totals () in Table 7. An unbiased estimator of the total area for category j (based on the reference classification) is then given by:
Equation 13 can be re-expressed in an expanded alternate form that more clearly reveals the estimator as a stratified estimator:
This stratified estimator can be interpreted as an “error-adjusted” estimate of area, as it accounts for omission errors by including the area of category j that was incorrectly mapped as another class. At the same time, it excludes commission errors areas incorrectly mapped as category j. The estimated standard error of the area proportion for category j is given by Cochran, 1977 [76]:
The standard error of the error-adjusted estimated area is
An approximate 95% confidence interval for is
The margin of error is defined as the product of the z-score and the standard error, where the z-score corresponds to a percentile from the standard normal distribution. This value determines the width of the confidence interval (i.e., the “±” part). For a 95% confidence level, the z-score is 1.96, which is approximated as 2 in this study for simplicity of presentation.
3. Results
3.1. Case Study Using Different Satellite Images
Using the SACLASS2 framework, three classification phases were tested with satellite imagery from six different seasonal periods to evaluate performance. Phase 1 utilized only Sentinel-1 C-band SAR (GRD) images. Phase 2 employed optical imagery from the Sentinel-2 MSI sensor. Phase 3 integrated both optical (Sentinel-2) and SAR data (Sentinel-1 and PALSAR-2). To ensure consistency across all phases, identical training and validation datasets, were applied throughout. Results showed that only SAR data (phase-1) produced the lowest overall accuracy (79.62% ± 1.6%), while optical imagery alone (phase-2) achieved a slightly higher accuracy (82.37% ± 1.5%). The best performance was observed in the combined dataset (phase-3), reaching an overall accuracy of 94.32% ± 0.42% for the year 2023. This fusion also led to notable improvements in user’s and producer’s accuracy across most land cover categories. Classification outputs for all phases are compared in Figure 6 alongside true-color reference imagery. Figure 7 shows the final HRLULC maps for Bangladesh, developed from phase 3.
3.2. Category-Wise Performance of HRLULC
A confusion matrix was employed to assess the classification accuracy of the generated LULC maps for both 2020 and 2023 (Table 8). In 2020, the classification achieved an overall accuracy of 94.55% and a Kappa coefficient of 0.93. For 2023, the overall accuracy was 94.32%, with a Kappa coefficient of 0.93. These results indicate a high level of classification accuracy and strong agreement beyond chance for both years. The lowest user accuracy was observed in the jhum category, suggesting some confusion with other categories. In contrast, the highest user accuracy was achieved for the mangrove, aquaculture, rubber tree, and multiple cropland categories.
This study identified several important LULC categories often missing from existing maps, including salt pans, brickfields, and aquaculture ponds. While salt pans cover a small area in Bangladesh, they contribute significantly to the local economy and land management. Brickfields, though vital for construction, pose serious environmental risks such as air and water pollution, soil degradation, and CO2 emissions when unregulated. Unlike most LULC maps that group all water features into a single category, this study differentiates between large natural waterbodies (e.g., rivers and seas) and aquaculture ponds, which are smaller, human-made, and usually used for fish farming. These aquaculture ponds are widespread across Bangladesh. Figure 8 highlights the clear identification of brickfields, aquaculture, and salt pans.
3.3. Comparison with Global Land Use Land Cover Maps
Three global LULC datasets ESA WorldCover 10 m v200, Dynamic World V1, and ESRI were employed for comparison with our HRLULC 2023 dataset. As these products differ in their native classification schemes, all maps were reclassified into a unified legend to ensure consistency. Specifically, all datasets were harmonized into seven common LULC categories: Water, Built-up, Cropland, Forest, Orchards, Bare Land, and Mangrove. A visual comparison for the Bangladesh region is presented in Figure 9.
A pairwise comparison was conducted to evaluate the percentage of matched and mismatched pixels between our HRLULC map and the global products. A match was defined when pixels at the same spatial location were assigned to the same LULC category in both maps. The overall agreement was measured by the proportion of matched pixels. Among the comparisons, our map showed the highest agreement with ESA, achieving 68% matched pixels, followed by the ESRI and DW land cover products (Figure 10). To assess category-level agreement, the number of matched pixels per LULC category was divided by the total number of pixels in that category (based on our map), yielding the percentage of matched pixels for each category. These results are visualized using spider plots, which illustrate category wise agreement patterns (Figure 11). The analysis revealed notable variation in agreement levels across LULC categories.
3.4. LULC Change in Bangladesh Between 2020 and 2023
In many developing countries, including Bangladesh, population growth is a key driver of LULC change [77,78]. LULC changes in Bangladesh between 2020 and 2023 revealed significant transformations across multiple categories (Figure 12). Over this three-year period, single cropland showed the positive change, increasing by 17.23 ± 4.08% from an initial area of around 14827.7 ± 337.9 km², indicating significant expansion. Figure 13 displays the identified hotspots of single cropland expansion.
Aquaculture areas also grew notably, with a 20.17 ± 4.94% increase, reflecting the rapid development of fish farming. Conversely, bare land experienced the greatest decline, decreasing by 23.77 ± 4.27%, suggesting widespread conversion to other land cover types. Figure 14 highlights the areas where bare land has decreased most significantly compared to other regions. In this study, we identified three major bare land decrease hotspots: areas adjacent to the Padma River, the capital city Dhaka, and the newly developed city of Purbachal, located near Dhaka.
During the study period, brickfield areas expanded by 56.11 ± 25.33%. Figure 15 illustrates the locations of newly developed brickfields. In 2020, these areas were primarily used for orchard plantations, but by 2023, they had been converted into brickfields. Detailed estimates of LULC changes, derived using the area-adjusted method proposed by Olofsson et al. (2014) [75], are presented in Table 9.
4. Discussion
4.1. Accuracy of HRLULC Maps
A high-resolution (10-meter), 14-category HRLULC map was developed for Bangladesh for the years 2020 and 2023. The maps were generated using a fusion of multi-sensor, multi-temporal, and multi-resolution satellite imagery, complemented by ancillary datasets. The classification achieved an overall accuracy of 94.55% for 2020 and 94.32% for 2023. Several factors contributed to the high classification accuracy and low uncertainty observed in the HRLULC maps. Firstly, a comprehensive training dataset comprising 53,627 points for the year 2023 and 36,412 points for 2020 was collected across the study area. This extensive dataset significantly improved the performance of the CNN classifier by enabling more robust and accurate differentiation among various land cover types. Second, a total of 38 features comprising spectral bands, remote sensing indices, and ancillary data were selected from both satellite imagery and supplementary datasets. Although up to 48 features were tested, no substantial improvement in accuracy was observed beyond 38. Notably, increasing the feature count from 25 to 33 resulted in a 5% gain in accuracy (from 87% to 92%), but further increases yielded diminishing returns while also raising computational costs. Additionally, redundancy among similar indices, such as multiple built-up indices (e.g., normalized difference built-up index, urban index, built-up index), tended to cause misclassification. Therefore, using one representative index per land cover category proved more effective. Third, the integration of optical and SAR data specifically Sentinel-1 and ALOS-2/PALSAR-2 significantly improved classification outcomes. Lastly, the deep learning-based CNN approach outperformed traditional machine learning algorithms such as decision trees, support vector machines (SVM), and random forests, which are commonly used in LULC mapping and change detection [79].
The mangrove forest coverage in Bangladesh is estimated to be approximately 6,000 km² [80,81,82]. Our HRLULC analysis estimates the mangrove area at approximately 6220.5 ± 121.1 km² in 2020 and 5513.6 ± 91.9 km² in 2023, which closely aligns with previous studies. Similarly, the total area under rubber cultivation in Bangladesh is reported to be around 416.85 km² [83], which closely matches our remote sensing-based estimates of 466.1 ± 58.3 km² in 2020 and 440.2 ± 42.1 km² in 2023. These results provide strong validation for the accuracy and reliability of the HRLULC maps developed for Bangladesh. According to the official estimate by the Bangladesh Bureau of Statistics (BBS) [84], the area under the single cropland category is approximately 20,571.3 km². In comparison, our HRLULC-based estimation for the year 2023 indicates an area of 17,383.0 ± 502.6 km². This relatively close correspondence suggests that our classification is generally reliable. However, the observed deviation may be due to differences in the methodology used for area estimation, such as classification definitions, resolution, or sampling techniques.
4.2. Spatial Details and Comparative Evaluation
Our HRLULC products offer greater spatial detail and pixel-level accuracy compared to global land cover datasets, largely due to their national-scale focus and finer resolution. In rural areas of Bangladesh, most households are surrounded by various tree species particularly fruit trees such as mango, guava, jujube, jackfruit, litchi, and papaya, alongside woody vegetation. Global LULC products often fail to detect small built-up structures obscured by dense vegetation in these settings. In contrast, our map successfully identifies these hidden built-up areas (see Figure 9). Similarly, riverine bare lands in Bangladesh are frequently misclassified in global maps. Our HRLULC product effectively captures and classifies these areas with improved accuracy.
Our HRLULC maps offer enhanced spatial detail by integrating two types of SAR data alongside optical imagery. ALOS-2/PALSAR-2 provides L-band radar, which penetrates dense vegetation such as forest canopies, improving classification accuracy in areas like mangroves and flooded vegetation. Sentinel-1 supplies C-band radar, which is particularly effective for detecting wetland rice cultivation. Although rice crops were not explicitly classified, most single and multiple cropland areas in Bangladesh are primarily used for rice production, reflecting its status as the national staple. The synergistic use of L-band SAR (ALOS-2), C-band SAR (Sentinel-1), and optical data (Sentinel-2) improves class separability and yields high-resolution LULC maps with enhanced thematic accuracy. We employed a time-feature CNN model, which effectively handles multi-source input data with varying spatial and temporal resolutions. Incorporating time-series information enables the model to capture seasonal dynamics, significantly improving classification performance over traditional single-date approaches. Finally, global LULC products are designed for worldwide application, often sacrificing local accuracy. These broad-scale maps may overlook regional variability and context. In contrast, our maps are locally focused and tailored to the specific conditions of Bangladesh, incorporating local knowledge and data. This localized approach ensures higher accuracy and greater relevance for national and regional applications.
4.3. LULC Conversion from 2020 to 2023
Overall, there has been an increase in single cropland area and a corresponding decrease in bare land across the country. However, this trend is not uniform nationwide (see Figure 16). The most notable expansion of single cropland has occurred in the Khulna and Sylhet Divisions (see Figure 13). Khulna, located adjacent to the coast, is frequently affected by tropical cyclones, storm surges and tidal floods, which contribute to saline water intrusion. This salinity plays a significant role in shifting agricultural practices from multiple cropping systems to single cropland. Additionally, the growing presence of aquaculture particularly shrimp farming in this region has further contributed to the expansion of single cropland, as the same land is often used for dual purposes. Flash floods, sudden and rapid flooding triggered by intense rainfall within a short period [85], are common natural hazards in the northeastern region of Bangladesh, particularly in the Sylhet area. These recurrent flood events frequently damage agricultural crops, households, and infrastructure [86,87,88]. As a result, farmers in the region are increasingly shifting to single cropping practices to minimize potential losses and adapt to the unpredictable flood conditions.
The Bare land category, comprising mainly char lands (riverine islands) and fallow land, experienced a significant decline of −3173.8 ± 570.5 km² over the study period. In COVID-19 context, governmental advocacy “don’t leave an inch of land uncultivable”, modern agricultural technologies, along with population pressure, has likely contributed to the expansion of agricultural land and decline of bare land. According to Figure 14, one of the bare land decrease hotspots is located in Purbachal. This area was previously bare land. To alleviate the growing population pressure on Dhaka, the Government of Bangladesh initiated a planned urban development project in the surrounding areas, aiming to provide high-quality, permanent residential accommodations for the expanding population [89].
An interesting finding from the 2023 data is the decrease in built-up area over the past three years. This reduction is unusual for a developing country like Bangladesh, where urban expansion is generally expected to follow a continuous upward trend. However, a similar trend was reported by Abdullah et al. (2019) [90], who observed a sudden decrease in built-up area in 2000, attributed to the devastating flood that severely affected large parts of the country. In a similar context, the years 2022 and 2023 experienced several severe cyclones most notably cyclonic storm Sitrang in October 2022, very severe cyclonic storm Hamoon, and severe cyclonic storm Midhili in late 2023 which may have contributed to the recent decline in built-up areas by damaging infrastructure and displacing settlements. Additionally, urban growth has increasingly taken a vertical form, with more multi-story buildings replacing the need for horizontal expansion. This shift may explain the decline in the built area observed in this study, despite ongoing development. Furthermore, in 2023, orchard areas, especially those related to homestead gardening in rural regions of Bangladesh, where households are commonly surrounded by a diverse mix of fruit and woody tree species, exhibited increased vegetation density. As a result, some small rural built-up areas are misclassified as orchards rather than accurately identified as built-up.
Jhum cultivation areas increased by approximately 39.25 ± 34.43%, indicating a rise in shifting cultivation practices among the indigenous communities of the Chattogram Hill Tracts (CHT). Although the uncertainty of this estimate is high, a recent study reveals that tribal farmers now cultivate around 30 different crop varieties through Jhum, compared to only 15–20 varieties in previous years [91]. This suggests a more intensive and diversified use of Jhum cultivation than in the past. An upward trend in Jhum cultivation, as reported by the Department of Agricultural Extension [92], supports the findings presented in this study.
According to our estimation, mangrove forest coverage in Bangladesh declined by approximately 11.36 ± 2.44% between 2020 and 2023. Recent studies have also documented a continued reduction in mangrove extent, primarily driven by deforestation, urban expansion, and changing agricultural practices [93,94]. These findings highlight the growing pressure on mangrove ecosystems and the need for strengthened conservation efforts.
Aquaculture is one of the most prominent and rapidly growing sectors in Bangladesh, playing a vital role in nutrition, livelihoods, and national economic development. In many regions, it has proven to be more profitable than traditional crop farming, leading to a noticeable shift among farmers toward aquaculture-based practices. The sector has demonstrated a steady upward trend from 2001 to 2022 [95]. This aligns with the findings of the present study, which observed an increase in aquaculture area from 5732.5 ± 232.6 km² in 2020 to 6888.5 ± 161.5 km² in 2023.
Salt farming and processing in Bangladesh holds significant potential for improving livelihoods in vulnerable coastal communities [96]. However, our study reveals that the area under salt pans has decreased by approximately −47.38 ± 16.32% between 2020 and 2023, indicating a notable contraction of this land use category. According to the Land Cover Atlas of Bangladesh (2015), the area was estimated to be 373 km² [36]. In comparison, our HRLULC data show that the area was 480.8 ± 70.1 km² in 2020, which closely aligns with the 2015 estimate. However, by 2023, this area had declined significantly to 253.0 ± 35.2 km².
4.4. Impact of Land Use Land Cover Changes
LULC changes have profound and far-reaching impacts on both the environment and the socio-economic well-being of communities. Bangladesh, with its high population density, relies heavily on agricultural land and aquaculture ponds to sustain its growing population. According to the findings of this study, both agricultural and aquaculture areas have expanded in recent years. This expansion has contributed to Bangladesh’s official attainment of self-sufficiency in food production, particularly in staple food grains and freshwater fish [97]. Although the expansion of multiple cropland areas observed in this study is not statistically significant (0.84 ± 1.14%), multiple cropping still occupies a substantial portion of the land cover. This dominance may not always be favorable for sustainable crop production. Continuous cultivation of the same land throughout the year exerts considerable pressure on soil fertility and productivity, potentially leading to long-term degradation of agricultural land [98]. On the other hand, the increasing single cropland area may pose risks to long-term food security.
The decline in bare land particularly char lands and fallow lands has contributed significantly to achieving national food security. This transformation is largely attributed to the adoption of advanced agricultural technologies and practices [99]. According to Figure 14, the decrease in bare land along the Padma River can be seen as a positive impact, as these char lands are increasingly being converted into cultivated areas. In contrast, the reduction of bare land in the capital city, Dhaka, is viewed as a negative trend, as it leads to the loss of open and free spaces, contributing to increased urban density and reduced livability for city dwellers. The decrease in bare land in the Purbachal area may help alleviate the housing shortage in Dhaka by reducing pressure on the capital through the development of planned residential zones.
In the past, Jhum was the primary cultivation practice for farmers in the CHT. Although agricultural technologies have modernized in recent years offering alternatives to shifting cultivation many farmers continue to practice Jhum. This persistence is largely due to their long-standing familiarity with the method, as they have been trained in Jhum culture for decades, making it difficult for them to transition to other forms of agriculture [91]. Jhum remains the primary food production system for many ethnic minority communities; however, it poses negative impacts not only on the soil of the cultivated land but also on the surrounding environment [100] and the broader ecosystem (lose of different types of bird and animal species) [101].
During the study period, brickfield areas increased by 1,019.6 ± 460.3 km². Although this change may seem relatively limited in spatial extent, as it is accompanied by a high uncertainty of ±25.33%. Despite its contribution to the national economy, the brick sector presents significant environmental and social challenges. Brick production leads to soil degradation and reduced agricultural productivity [102], the depletion of natural resources [103], and increased air pollution and greenhouse gas emissions [104]. Moreover, it is associated with serious health risks [105] and persistent social issues, including labor rights violations and gender-based discrimination [106].
The findings related to mangrove forests are particularly alarming. Within just three years, approximately 706.9 ± 152.0 km² of natural mangrove cover has been lost. This sharp decline raises significant concern, as mangroves offer a wide range of critical ecosystem services, including phytoremediation, carbon sequestration, and the regulation of hydrological and ecological processes [107]. Furthermore, mangroves serve as a natural barrier against tropical cyclones, playing a crucial role in protecting coastal communities and sustaining their livelihoods. Continued degradation of mangrove ecosystems threatens these essential functions and could severely disrupt coastal food webs. The resulting ecological imbalance would likely have far-reaching socio-economic consequences, particularly for vulnerable coastal populations that depend heavily on these natural resources for their survival and well-being.
Salt has traditionally been produced in the southeastern coastal region of Bangladesh through the use of open salt pans. As a highly commercialized commodity with substantial global demand, sea salt plays a critical role in both domestic and international markets. Despite its widespread use, the livelihoods of many coastal communities in Bangladesh remain heavily dependent on small-scale salt production. However, a noticeable decline in the area devoted to salt pans poses a serious threat to the socio-economic stability of these communities. This trend also carries broader national implications, as salt in Bangladesh is consumed across three main sectors: human consumption, animal feed, and industrial applications. A reduction in domestic production could disrupt the national salt supply and adversely affect the economic well-being of those engaged in the industry.
Overall, the built-up area shows a net decrease; however, a visual inspection of the HRLULC map reveals localized increases in built-up areas near major cities. In contrast, more remote regions, particularly those far from the capital, have experienced a notable decline in built-up land. This pattern is likely driven by population migration toward urban centers, which in turn places increased pressure on city infrastructure and resources.
4.5. Scope of Development
Bangladesh exhibits a highly diverse and dynamic landscape; however, due to time and resource limitations, several important LULC categories were not incorporated into the HRLULC maps developed for 2020 and 2023. As a rice-dominant nation, the inclusion of a dedicated rice paddy category in future iterations is strongly recommended, given its substantial agricultural and economic significance. Further refinement within the forest category is also advisable, particularly by differentiating between evergreen, deciduous, and plantation forests. In the southern region, brackish water aquaculture commonly associated with shrimp farming constitutes a major land use and warrants recognition as a distinct subcategory under aquaculture ponds. Additionally, Bangladesh’s high population density and rapidly evolving land use practices introduce challenges related to seasonal variability. For instance, in the southeastern coastal zone, shrimp ponds are often converted into salt pans during the dry season, while char lands (riverine islands formed by sediment deposition) are cultivated only during specific months. These dynamic land use patterns highlight the need for developing dynamic LULC maps, which represent a promising direction for future research.
5. Conclusions
Satellite remote sensing remains a robust and reliable approach for generating LULC maps. This study developed national-scale, high-resolution (10 m) LULC maps for Bangladesh for the years 2020 and 2023 using a time-series CNN model that integrates both optical and SAR data. To the best of our knowledge, these are the first national-scale LULC maps of Bangladesh produced at this resolution using multi-temporal inputs and encompassing a comprehensive classification of 14 land cover categories. Locally significant but often underrepresented LULC types such as brickfields, salt pans, jhum cultivation, and aquaculture ponds were successfully identified. The resulting HRLULC datasets offer valuable support for environmental monitoring, agricultural planning, and policy development, particularly for government agencies such as the Ministries of Agriculture, Fisheries and Livestock, and Environment. The study also reveals notable LULC changes in single cropland, aquaculture ponds, built-up areas, brickfields, salt pans, and bare land. Brickfields, often located near croplands, present environmental challenges due to pollution and land degradation. Meanwhile, the rapid expansion of aquaculture ponds, though beneficial for food security, may reduce cropland availability, raising concerns about long-term sustainability. These dynamic changes, driven by growing food security needs and recurring natural disasters, underscore the critical need for frequent, high-resolution LULC monitoring to inform sustainable land management and resource planning.
Author Contributions
Conceptualization, M.M.S. and K.N.N.; methodology, M.M.S. and V.T.T.; software, V.T.T., S.H., N.H., and Y.M.; data curation, M.M.S., D.C., and S.C.; formal analysis, M.M.S.; investigation, S.I., D.C., and M.A.A.B.; resources, S.H., T.T., and K.N.N.; validation, M.I.P., S.C., S.I., and M.A.A.B.; writing—original draft preparation, M.M.S.; writing—review and editing, D.C., Y.M., and K.N.N.; visualization, M.M.S., M.I.P., and N.H.; supervision, K.N.N.; project administration, K.N.N.; funding acquisition, S.H., T.T., and K.N.N. All authors have read and agreed to the published version of the manuscript.
Funding
This research was conducted with the support of the Project for Human Resource Development Scholarship (JDS), funded by the Japanese Grant Aid. Additional support was provided by the Ecosystem Group at the Earth Observation Research Center (EORC) of JAXA.
Institutional Review Board Statement
Not applicable.
Data Availability Statement
All source data used in this study are publicly available and appropriately cited. The final HRLULC products generated from this research are available at: https://pen.envr.tsukuba.ac.jp/~utlulc/.
Acknowledgments
We gratefully acknowledge the computational support provided by Google Earth Engine. We also thank the European Space Agency (ESA) and Japan Aerospace Exploration Agency (JAXA)for providing satellite images.
Conflicts of Interest
The authors declare no conflicts of interest..
References
- Karim, M. Z.; Al-Mamun, M.; Eva, M. A.; Ali, M. H.; Kalam, A.; Uzzal, N. I.; Das, P. K. Understanding mental health challenges and associated risk factors of post-natural disasters in Bangladesh: a systematic review. Frontiers in Psychology, 2024, 15, 1466722.
- Sattar, M. A.; Cheung, K. K. Tropical cyclone risk perception and risk reduction analysis for coastal Bangladesh: Household and expert perspectives. International journal of disaster risk reduction, 2019, 41, 101283.
- Abedin, M. A.; Parvin, G. A.; Habiba, U.; Kibria, M. G.; Ahsan, R.; Onitsuka, K.; Rahman, M. M.; Kobeasy, M. I.; Gaber, A. ICT Uses, Constraints, and Challenges in Flash Flood Risk Management: A Case Study in North-Eastern Haor Areas of Bangladesh. Sustainability, 2022, 14(13), 8018. [CrossRef]
- Akash, S. H.; Sarkar, S. K.; Bindajam, A. A.; Kumari, R.; Talukdar, S.; Mallick, J. Assessment of coastal vulnerability using integrated fuzzy analytical hierarchy process and geospatial technology for effective coastal management. Environmental Science and Pollution Research, 2024, 31(41), 53749-53766. [CrossRef]
- Chakraborty, T.; Sarkar, S. K.; Morshed, M. M. Big data and remote sensing for multi-decadal drought impact assessment on Shorea robusta. Theoretical and Applied Climatology, 2022, 148(3), 1587-1602. [CrossRef]
- Karim, R.; Pk, M. B.; Dey, P.; Akbar, M. A.; Osman, M. S. A study about the prediction of population growth and demographic transition in Bangladesh. Journal of Umm Al-Qura University for Applied Sciences, 2025, 11(1), 91-103. [CrossRef]
- Ullah, M. S.; Mostafa, G. Analyzing and Projection of Future Bangladesh Population Using Logistic Growth Model. Journal of Emerging Trends in Engineering and Applied Sciences, 2024, 15(1), 34-37. [CrossRef]
- Streatfield, P. K.; Karar, Z. A. Population challenges for Bangladesh in the coming decades. Journal of health, population, and nutrition, 2008, 26(3), 261. [CrossRef]
- Izumisawa, H.; Hirayama, S.; Mizukami, Y.; Nasahara, K. N. Creation of a high-resolution land use and land cover map for Okinawa Island by integrated localization. Journal of the Remote Sensing Society of Japan, 2023, 43(2), 73-85.
- Riva, F.; Nielsen, S. E. A functional perspective on the analysis of land use and land cover data in ecology. Ambio, 2021, 50(5), 1089-1100. [CrossRef]
- Gorelick, N.; Hancher, M.; Dixon, M.; Ilyushchenko, S.; Thau, D.; Moore, R.. Google Earth Engine: Planetary-scale geospatial analysis for everyone. Remote Sensing of Environment, 2017, 202, 18-27. [CrossRef]
- Brovkin, V.; Boysen, L.; Arora, V. K.; Boisier, J. P.; Cadule, P.; Chini, L.; Claussen, M.; Friedlingstein, P.; Gayler, V.; Van den hurk, B. J. J. M.; Hurtt, G. C.; Jones, C. D.; Kato, E.; De noblet-ducoudre, N.; Pacifico, F.; Pongratz, J.; Weiss, M. Effect of anthropogenic land-use and land-cover changes on climate and land carbon storage in CMIP5 projections for the twenty-first century. Journal of Climate, 2013, 26(18), 6859-6881. [CrossRef]
- Naikoo, M. W.; Rihan, M.; Ishtiaque, M.; Shahfahad. Analyses of land use land cover (LULC) change and built-up expansion in the suburb of a metropolitan city: Spatio-temporal analysis of Delhi NCR using landsat datasets. Journal of Urban Management, 2020, 9(3), 347-359. [CrossRef]
- Khachoo, Y. H.; Cutugno, M.; Robustelli, U.; Pugliano, G. Impact of Land Use and Land Cover (LULC) Changes on Carbon Stocks and Economic Implications in Calabria Using Google Earth Engine (GEE). Sensors, 2024, 24(17), 5836.
- Feddema, J. J.; Oleson, K. W.; Bonan, G. B.; Mearns, L. O.; Buja, L. E.; Meehl, G. A.; Washington, W. M. The importance of land-cover change in simulating future climates. Science, 2005, 310(5754), 1674-1678. [CrossRef]
- Munawar, H. S.; Hammad, A. W. A.; Waller, S. T. Remote sensing methods for flood prediction: A review. Sensors, 2022, 22(3), 960.
- Abd El-Kawy, O. R.; Rød, J. K.; Ismail, H. A.; Suliman, A. S. Land use and land cover change detection in the western Nile delta of Egypt using remote sensing data. Applied Geography, 2011, 31(2), 483-494. [CrossRef]
- Gómez, C.; White, J. C.; Wulder, M. A. Optical remotely sensed time series data for land cover classification: A review. ISPRS Journal of Photogrammetry and Remote Sensing, 2016, 116, 55-72.
- Gillanders, S. N.; Coops, N. C.; Wulder, M. A.; Gergel, S. E.; Nelson, T. Multitemporal remote sensing of landscape dynamics and pattern change: describing natural and anthropogenic trends. Progress in Physical Geography, 2008, 32(5), 503-528.
- Lopes, M.; Frison, P. L.; Crowson, M.; Warren-Thomas, E.; Hariyadi, B.; Kartika, W. D.; Agus, F.; Hamer, K. C.; Stringer, L.; Hill, J. K.; Pettorelli, N. Improving the accuracy of land cover classification in cloud persistent areas using optical and radar satellite image time series. Methods in Ecology and Evolution, 2020, 11(4), 532-541. [CrossRef]
- Naushad, R.; Kaur, T.; Ghaderpour, E. Deep Transfer Learning for Land Use and Land Cover Classification: A Comparative Study. Sensors, 2021, 21(23), 8083.
- Li, Y.; Zhu, Z.; Yu, J. G.; Zhang, Y. Learning deep cross-modal embedding networks for zero-shot remote sensing image scene classification. IEEE Transactions on Geoscience and Remote Sensing, 2021, 59(12), 10590-10603. [CrossRef]
- Chandra, M. A.; Bedi, S. S. Survey on SVM and their application in image classification. International Journal of Information Technology, 2021, 13(5), 1-11.
- Ma, W.; Li, N.; Zhu, H.; Jiao, L.; Tang, X.; Guo, Y.; Hou, B.. Feature split–merge–enhancement network for remote sensing object detection. IEEE Transactions on Geoscience and Remote Sensing, 2022, 60, 1-17.
- Li, H.; Li, Y.; Zhang, G.; Liu, R.; Huang, H.; Zhu, Q.; Tao, C.. Global and local contrastive self-supervised learning for semantic segmentation of HR remote sensing images. IEEE Transactions on Geoscience and Remote Sensing, 2022, 60, 1-14. [CrossRef]
- Liu, R.; Mi, L.; Chen, Z. AFNet: Adaptive fusion network for remote sensing image semantic segmentation. IEEE Transactions on Geoscience and Remote Sensing, 2020, 59(9), 7871-7886. [CrossRef]
- Lilay, M. Y.; Taye, G. D. Semantic segmentation model for land cover classification from satellite images in Gambella National Park, Ethiopia. SN Applied Sciences, 2023, 5(3), 76.
- Chen, L.; Zhao, Y.; Yao, J.; Chen, J.; Li, N.; Chan, J. C. W.; Kong, S. G. Object tracking in hyperspectral-oriented video with fast spatial-spectral features. Remote Sensing, 2021, 13(10), 1922.
- Jozdani, S. E.; Johnson, B. A.; Chen, D. Comparing deep neural networks, ensemble classifiers, and support vector machine algorithms for object-based urban land use/land cover classification. Remote Sensing, 2019, 11(14), 1713.
- Hirayama, S.; Tadono, T.; Mizukami, Y.; Ohki, M.; Imamura, K.; Hirade, N.; Ohgushi, F.; Dotsu, M.; Yamanokuchi, T.; Nasahara, K. N. Generation of the High-Resolution Land-Use and Land-Cover Map in Japan Version 21.11. Journal of The Remote Sensing Society of Japan, 2022, 42, 199–216.
- Truong, V. T.; Hirayama, S.; Phan, D. C.; Hoang, T. T.; Tadono, T.; Nasahara, K. N. JAXA’s new high-resolution land use land cover map for Vietnam using a time-feature convolutional neural network. Scientific Reports, 2024, 14(1), 3926. [CrossRef]
- Karra, K.; Kontgis, C.; Statman-Weil, Z.; Mazzariello, J.; Mathis, M.; Brumby, S. Global Land Use/Land Cover with Sentinel-2 and Deep Learning. Proceedings of the IGARSS 2021—2021 IEEE International Geoscience and Remote Sensing Symposium, Brussels, Belgium, 11–16 July 2021; IEEE: New York, NY, USA, 2021, 4704–4707.
- Zanaga, D.; Van De Kerchove, R.; Daems, D.; De Keersmaecker, W.; Brockmann, C.; Kirches, G.; Wevers, J.; Cartus, O.; Santoro, M.; Fritz, S. ESA WorldCover 10 m 2021 v200. OpenAIRE, 2022.
- Brown, C. F.; Brumby, S. P.; Guzder-Williams, B.; Birch, T.; Hyde, S. B.; Mazzariello, J.; Czerwinski, W.; Pasquarella, V. J.; Haertel, R.; Ilyushchenko, S.; Schwehr, K.; Weisse, M.; Stolle, F.; Hanson, C.; Guinan, O.; Moore, R.; Tait, A. M. Dynamic World, Near real-time global 10 m land use land cover mapping. Scientific Data, 2022, 9(1), 1-17. [CrossRef]
- Xu, P.; Tsendbazar, N.-E.; Herold, M.; de Bruin, S.; Koopmans, M.; Birch, T.; Carter, S.; Fritz, S.; Lesiv, M.; Mazur, E.; Pickens, A.; Potapov, P.; Stolle, F.; Tyukavina, A.; Van De Kerchove, R.; Zanaga, D. Comparative validation of recent 10 m-resolution global land cover maps. Remote Sensing of Environment, 2024, 311, 114316. [CrossRef]
- GoB. Land Cover Atlas of Bangladesh 2015 (in support of REDD+). Forest Department, Ministry of Environment, Forest and Climate Change, Government of the People’s Republic of Bangladesh, 2020.
- Dewan, A. M.; Yamaguchi, Y. Land use and land cover change in Greater Dhaka, Bangladesh: Using remote sensing to promote sustainable urbanization. Applied Geography, 2009, 29(3), 390-401.
- Biswas, J.; Jobaer, M. A.; Haque, S. F.; Islam Shozib, M. S.; Limon, Z. A.. Mapping and monitoring land use land cover dynamics employing Google Earth Engine and machine learning algorithms on Chattogram, Bangladesh. Heliyon, 2023, 9(11), e21245. [CrossRef]
- Arifeen, H. M.; Phoungthong, K.; Mostafaeipour, A.; Yuangyai, N.; Yuangyai, C.; Techato, K.; Jutidamrongphan, W. Determine the land-use land-cover changes, urban expansion and their driving factors for sustainable development in Gazipur Bangladesh. Atmosphere, 2021, 12(10), 1353.
- Parvin, M. I.; Islam, M. A.; Perveen, M. F.; Jamal, M. R.; Faruque, M. J.; Hossen, B.; Islam, K.; Sarker, M. M. Assessment of land use transition and crop intensification using geospatial technology in Bangladesh. Case Studies in Chemical and Environmental Engineering, 2024, 9, 100660. [CrossRef]
- Siddique, A. B.; Rayhan, E.; Sobhan, F.; Das, N.; Fazal, M. A.; Riya, S. C.; Sarker, S.. Spatio-temporal analysis of land use and land cover changes in a wetland ecosystem of Bangladesh using a machine-learning approach. Frontiers in Water, 2024, 6, 1394863. [CrossRef]
- Zaman, W.; Real, H. R. K.. Machine Learning-based Spatio-Temporal Assessment of Land Use/Land Cover Change in Barishal District of Bangladesh between 1988 and 2024. Environmental Challenges, 2025, 19, 101168.
- Mosleh, M. K.; Hassan, Q. K. Development of a remote sensing-based “Boro” rice mapping system. Remote sensing, 2014, 6(3), 1938-1953.
- Jepsen, M. R.; Levin, G. Semantically based reclassification of Danish land-use and land-cover information. International Journal of Geographical Information Science, 2013, 27(12), 2375-2390.
- Verburg, P. H.; Crossman, N.; Ellis, E. C.; Heinimann, A.; Hostert, P.; Mertz, O.; Nagendra, H.; Sikor, T.; Erb, K.-H.; Golubiewski, N.; Grau, R.; Grove, M.; Konaté, S.; Meyfroidt, P.; Parker, D. C.; Chowdhury, R. R.; Shibata, H.; Thomson, A.; Zhen, L. Land system science and sustainable development of the earth system: A global land project perspective. Anthropocene, 2015, 12, 29-41. [CrossRef]
- European Union/ESA/Copernicus. Sentinel-2 MSI: Multispectral Instrument, Level-2A. Google Earth Engine Data Catalog. Available online: https://developers.google.com/earth-engine/datasets/catalog/COPERNICUS_S2_SR (accessed on 1 August 2024).
- Main-Knorn, M.; Pflug, B.; Louis, J.; Debaecker, V.; Müller-Wilm, U.; Gascon, F. Sen2Cor for sentinel-2. Image and Signal Processing for Remote Sensing XXIII, 2017, 10427, 37-48. [CrossRef]
- Frantz, D. FORCE—Landsat+ Sentinel-2 analysis ready data and beyond. Remote Sensing, 2019, 11(9), 1124.
- European Union/ESA/Copernicus. Sentinel-1 SAR GRD: C-band Synthetic Aperture Radar Ground Range Detected, Log Scaling. Google Earth Engine. Available online: https://developers.google.com/earth-engine/datasets/catalog/COPERNICUS_S1_GRD (accessed on 24 July 2024).
- Vollrath, A.; Mullissa, A.; Reiche, J. Angular-based radiometric slope correction for Sentinel-1 on google earth engine. Remote Sensing, 2020, 12(11), 1867.
- Hird, J. N.; DeLancey, E. R.; McDermid, G. J.; Kariyeva, J. Google Earth Engine, open-access satellite data, and machine learning in support of large-area probabilistic wetland mapping. Remote Sensing, 2017, 9(12), 1315.
- Japan Aerospace Exploration Agency (JAXA), Earth Observation Research Center (EORC). PALSAR-2 ScanSAR Level 2.2. Google Earth Engine. Available online: https://developers.google.com/earth-engine/datasets/catalog/JAXA_ALOS_PALSAR-2_Level2_2_ScanSAR (accessed on 25 August 2024).
- Ottinger, M.; Kuenzer, C. Spaceborne L-Band synthetic Aperture Radar Data for geoscientific analyses in coastal land applications: A review. Remote Sensing, 2020, 12(14), 1-36.
- Shimada, M.; Isoguchi, O.; Tadono, T.; Isono, K. PALSAR radiometric and geometric calibration. IEEE Transactions on Geoscience and Remote Sensing, 2009, 47(12), 3915–3932. [CrossRef]
- Ito, S.; Hirayama, S.; Tadono, T.; Imamura, K.; Hirade, N.; Ohgushi, F.; Satake, R.; Nasahara, K. Trial of new categories and accuracy improvement for JAXA’s high-resolution land use and land cover maps. Journal of The Remote Sensing Society of Japan, 2025, 45(3), In press.
- Lee, D. G.; Shin, Y. H.; Lee, D. C. Land cover classification using SegNet with slope, aspect, and multidirectional shaded relief images derived from digital surface model. Journal of Sensors, 2020, 2020(1), 8825509.
- Hurskainen, P.; Adhikari, H.; Siljander, M.; Pellikka, P. K. E.; Hemp, A. Auxiliary datasets improve accuracy of object-based land use/land cover classification in heterogeneous savanna landscapes. Remote Sensing of Environment, 2019, 233, 111354. [CrossRef]
- Japan Aerospace Exploration Agency (JAXA), Earth Observation Research Center (EORC). ALOS Global Digital Surface Model “ALOS World 3D - 30m (AW3D30)”. Japan Aerospace Exploration Agency. Available online: https://www.eorc.jaxa.jp/ALOS/en/dataset/aw3d30/aw3d30_e.htm (accessed on 2 August 2024).
- Geofabrik. OpenStreetMap Data Extracts. Geofabrik GmbH. Available online: http://download.geofabrik.de/ (accessed on 2 August 2024).
- Rouse, J. W.; Haas, R. H.; Schell, J. A.; Deering, D. W. Monitoring vegetation systems in the Great Plains with ERTS. NASA Special Publication, 1974, 351, 309–317.
- Huete, A. R.; Liu, H. Q.; Batchily, K. V; Van Leeuwen, W. A comparison of vegetation indices over a global set of TM images for EOS-MODIS. Remote Sensing of Environment, 1997, 59(3), 440–451.
- Tucker, C. J. Red and photographic infrared linear combinations for monitoring vegetation. Remote Sensing of Environment, 1979, 8(2), 127-150.
- Xiao, J.; Shen, Y.; Tateishi, R.; Bayaer, W. Development of topsoil grain size index for monitoring desertification in arid land using remote sensing. International Journal of Remote Sensing, 2006, 27(12), 2411-2422. [CrossRef]
- Xu, H. Modification of normalised difference water index (NDWI) to enhance open water features in remotely sensed imagery. International Journal of Remote Sensing, 2006, 27(14), 3025–3033.
- Chen, W.; Liu, L.; Zhang, C.; Wang, J.; Wang, J.; Pan, Y.. Monitoring the seasonal bare soil areas in Beijing using multitemporal TM images. IEEE International Geoscience and Remote Sensing Symposium, 2004, 5, 3379–3382. [CrossRef]
- Lacaux, J. P.; Tourre, Y. M.; Vignolles, C.; Ndione, J. A.; Lafaye, M. Classification of ponds from high-spatial resolution remote sensing: Application to Rift Valley Fever epidemics in Senegal. Remote Sensing of Environment, 2007, 106(1), 66–74.
- Osgouei, P. E.; Kaya, S.; Sertel, E.; Alganci, U. Separating built-up areas from bare land in mediterranean cities using Sentinel-2A imagery. Remote Sensing, 2019, 11(3), 1-24.
- Gitelson, A.; Merzlyak, M. N. Spectral reflectance changes associated with autumn senescence of Aesculus hippocastanum L. Journal of Plant Physiology, 1994, 143(3), 286-292.
- Kim, Y.; Van Zyl, J. J. A time-series approach to estimate soil moisture using polarimetric radar data. IEEE Transactions on Geoscience and Remote Sensing, 2009, 47(8), 2519-2527.
- European Space Agency (ESA). ESA WorldCover 10 m 2021 Global Land Cover Map. European Space Agency. Available online: https://esa-worldcover.org/en (accessed on 29 August 2024).
- Esri. Esri 10-meter Land Cover Map (Powered by WorldCover). ArcGIS Living Atlas of the World. Available online: https://livingatlas.arcgis.com/landcover/ (accessed on 10 August 2024).
- Huang, H.; Wang, J.; Liu, C.; Liang, L.; Li, C.; Gong, P.. The migration of training samples towards dynamic global land cover mapping. ISPRS Journal of Photogrammetry and Remote Sensing, 2020, 161, 27-36. [CrossRef]
- Congalton, R. G. A review of assessing the accuracy of classifications of remotely sensed data. Remote Sensing of Environment, 1991, 37(1), 35-46.
- Vallet, A.; Dupuy, S.; Verlynde, M.; Gaetano, R. Generating high-resolution land use and land cover maps for the greater Mariño watershed in 2019 with machine learning. Scientific Data, 2024, 11(1), 915. [CrossRef]
- Olofsson, P.; Foody, G. M.; Herold, M.; Stehman, S. V.; Woodcock, C. E.; Wulder, M. A. Good practices for estimating area and assessing accuracy of land change. Remote sensing of Environment, 2014, 148, 42-52. [CrossRef]
- Cochran, W.G. Sampling Techniques, 3rd ed.; John Wiley & Sons: New York, NY, USA, 1977.
- Rahman, M. N.; Saleheen, M. M.; Islam, A. R. M. T.; Sohel, M. S.; Islam, M. S. Assessing and predicting the dynamics of land use/land cover in northern Bangladesh using cellular Automata-Markov chain model. Geology, Ecology, and Landscapes, 2024, 1-17.
- Rash, A.; Mustafa, Y.; Hamad, R.. Quantitative assessment of Land use/land cover changes in a developing region using machine learning algorithms: A case study in the Kurdistan Region, Iraq. Heliyon, 2023, 9(11), e21253. [CrossRef]
- Carranza-García, M.; García-Gutiérrez, J.; Riquelme, J. C. A Framework for Evaluating Land Use and Land Cover Classification Using Convolutional Neural Networks. Remote Sensing, 2019, 11(3), 274.
- Hossain, M.; Saha, C.; Saha, S. Mangrove Restoration in Bangladesh. Open Journal of Forestry, 2024, 15(1), 35-52.
- Mukul, S. A.; Huq, S.; Herbohn, J.; Seddon, N.; Laurance, W. F. Saving the Sundarbans from development. Science, 2020, 368(6496), 1198-1198.
- Mukul, S. A.; Alamgir, M.; Sohel, M. S. I.; Pert, P. L.; Herbohn, J.; Turton, S. M.; Khan, M. S. I.; Munim, S. A.; Reza, A. H. M. A.; Laurance, W. F. Combined effects of climate change and sea-level rise project dramatic habitat loss of the globally endangered Bengal tiger in the Bangladesh Sundarbans. Science of The Total Environment, 2019, 663, 830–840. [CrossRef]
- Rahman, Md. Mahbubur; Parvin; Waheeda; Islam, J. Natural Rubber Cultivation in Bangladesh-A review. Bangladesh Journal of Forest Science, 2022, 38(1 & 2), 1–16.
- Bangladesh Bureau of Statistics (BBS). Yearbook of Agricultural Statistics 2023. Ministry of Planning, Government of the People’s Republic of Bangladesh, 2023. Available online: http://www.bbs.gov.bd (accessed on 20 August 2025).
- Haque, M. N.; Siddika, S.; Sresto, M. A.; Saroar, M. M.; Shabab, K. R. Geo-spatial analysis for flash flood susceptibility mapping in the North-East Haor (Wetland) Region in Bangladesh. Earth Systems and Environment, 2021, 5(2), 365-384. [CrossRef]
- Chowdhury, M. S. Flash flood susceptibility mapping of north-east depression of Bangladesh using different GIS based bivariate statistical models. Watershed Ecology and the Environment, 2024, 6, 26-40.
- Islam, M. J.; Abdullah, M. S.; Alam, M. Flooding crisis in Bangladesh: urgent measures required. Biodiversity, 2024, 25(2), 95-98.
- Ahmed, M. R.; Rahaman, K. R.; Kok, A.; Hassan, Q. K. Remote sensing-based quantification of the impact of flash flooding on the rice production: A case study over Northeastern Bangladesh. Sensors, 2017, 17(10), 2347.
- Rajdhani Unnayan Kartripakkha (RAJUK). Purbachal New Town Project. Government of the People’s Republic of Bangladesh. Available online: https://rajuk.gov.bd/ (accessed on 14 August 2025).
- Abdullah, A. Y. M.; Masrur, A.; Adnan, M. S. G.; Baky, M. A. A.; Hassan, Q. K.; Dewan, A. Spatio-temporal patterns of land use/land cover change in the heterogeneous coastal region of Bangladesh between 1990 and 2017. Remote Sensing, 2019, 11(7), 790.
- Chakma, K.; Mozumder, S.; Pasha, K. The impact of Jhum cultivation on hilly area (Rangamati, Khagrachari). International Research Journal of Science, Technology, Education, and Management, 2021, 1(1), 97-107.
- Department of Agricultural Extension (DAE). Ministry of Agriculture. Government of the People’s Republic of Bangladesh. Available online: https://dae.gov.bd/ (accessed on 14 August 2025).
- Roy, S. K.; Mojumder, P.; Chowdhury, M. A. A.; Hasan, M. M. Evaluating mangrove forest dynamics and fragmentation in Sundarbans, Bangladesh using high-resolution Sentinel-2 satellite images. Global Ecology and Conservation, 2025, 58, e03493. [CrossRef]
- Akbar Hossain, K.; Masiero, M.; Pirotti, F. Land cover change across 45 years in the world’s largest mangrove forest (Sundarbans): the contribution of remote sensing in forest monitoring. European Journal of Remote Sensing, 2024, 57(1), 2097450. [CrossRef]
- Samanta Chandan, C. S.; Roy, P. Aquaculture practices in Bangladesh: A synopsis on prospects, productivity, and problems. Journal of the World Aquaculture Society, 2024, 55(1), 4-25.
- Hossain, M. S.; Hossain, M. Z.; Chowdhury, S. R. An analysis of economic and environmental issues associated with sea salt production in Bangladesh and Thailand coast. International Journal of Ecology and Environmental Sciences, 2006, 32(2), 159-172.
- Khan, T. H.; Eva, S. Bangladesh’s food security under input problems: An analysis of constrains and policy response. World Food Policy, 2023, 9(2), 181-203. [CrossRef]
- Pervaiz, Z. H.; Iqbal, J.; Zhang, Q.; Chen, D.; Wei, H.; Saleem, M. Continuous cropping alters multiple biotic and abiotic indicators of soil health. Soil Systems, 2020, 4(4), 59. [CrossRef]
- Sarker, U. K.; Kaysar, M. S.; Uddin, M. R.; Hossain, M. A.; Hassan, S.; Hassan, M. M. Exploring Farmers’ Insight on Cropping Pattern for Sustainable Crop Production in Char Area of Bangladesh. Sustainability, 2022, 14(3), 1745.
- Begum, M. E. A.; Miah, M. M.; Rashid, M. A.; Hossain, M. I. Factors affecting the technical efficiency of turmeric farmers in the slash and burn areas of Bangladesh. Agroforestry Systems, 2019, 93(6), 2205-2212. [CrossRef]
- Ahmed, F. U. An Ethnographic Perspective on the CHT: The People and the Resources. In Farming Practices and Sustainable Development in the Chittagong Hill Tracts; CHTDB and VEFP-IC: Bangladesh, 2002; pp. 11-34.
- Haque, S. E.; Shahriar, M. M.; Nahar, N.; Haque, M. S.. Impact of brick kiln emissions on soil quality: A case study of Ashulia brick kiln cluster, Bangladesh. Environmental Challenges, 2022, 9, 100640.
- Akter, R.; Uddin, M. J.; Hossain, M. F.; Parveen, Z. Influence of brick manufacturing on phosphorus and sulfur in different agro-ecological soils of Bangladesh. Bangladesh Journal of Scientific Research, 2016, 29(2), 123-131.
- Guttikunda, S. K.; Begum, B. A.; Wadud, Z. Particulate pollution from brick kiln clusters in the Greater Dhaka region, Bangladesh. Air Quality, Atmosphere & Health, 2013, 6(2), 357-365. [CrossRef]
- Tusher, T. R.; Ashraf, Z.; Akter, S. Health effects of brick kiln operations: A study on largest brick kiln cluster in Bangladesh. South East Asia Journal of Public Health, 2018, 8(1), 32-36. [CrossRef]
- Hossain, M. A.; Zahid, A. M.; Arifunnahar, M.; Siddique, M. N. A. Effect of brick kiln on arable land degradation, environmental pollution and consequences on livelihood of Bangladesh. Journal of Science, Technology and Environment Informatics, 2019, 6(02), 474-488. [CrossRef]
- Islam, M. M.; Rahman, M. S.; Kabir, M. A.; Islam, M. N.; Chowdhury, R. M. Predictive assessment on landscape and coastal erosion of Bangladesh using geospatial techniques. Remote Sensing Applications: Society and Environment, 2020, 17, 100277. [CrossRef]
Figure 1.
Study area overview. (a) Location of Bangladesh on the world map. (b) Administrative Divisions of Bangladesh, highlighting the regions visited during fieldwork for ground-truth data collection. Data source: https://data.humdata.org/
Figure 1.
Study area overview. (a) Location of Bangladesh on the world map. (b) Administrative Divisions of Bangladesh, highlighting the regions visited during fieldwork for ground-truth data collection. Data source: https://data.humdata.org/
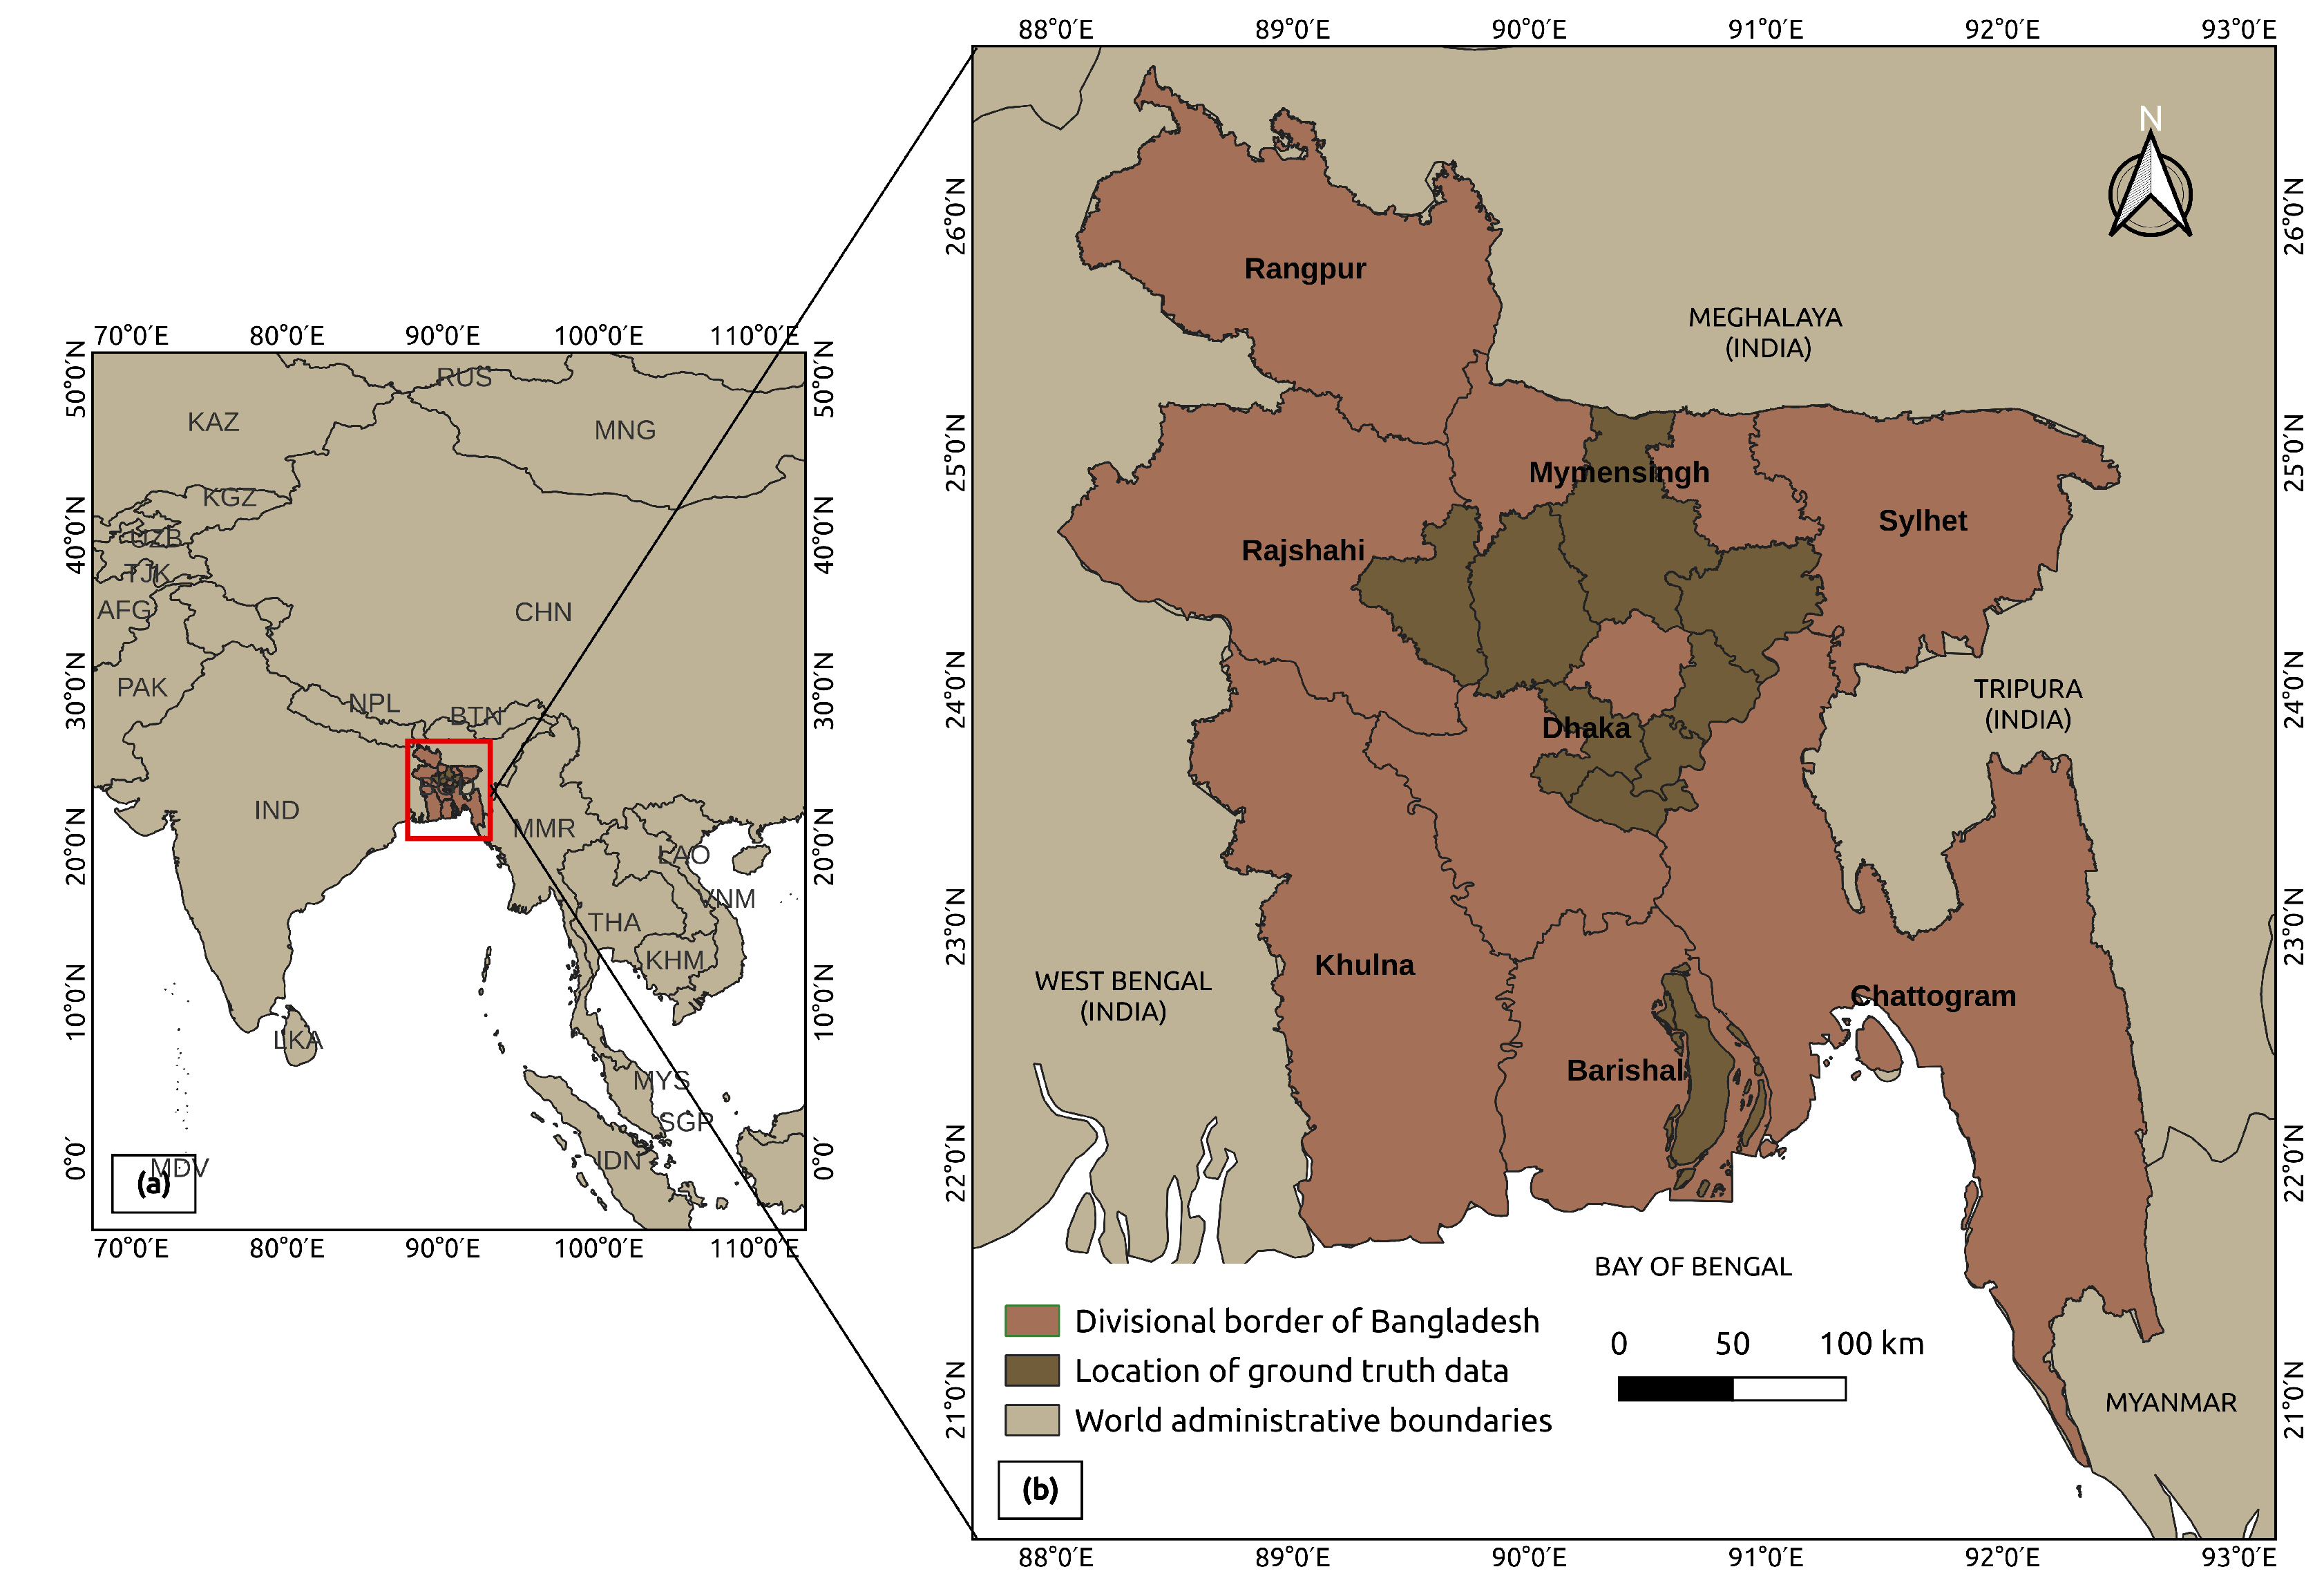
Figure 2.
Spatial distribution of training and validation points across Bangladesh. Panel (a) shows the distribution of training data collected over each 1°×1° tile, while panel (b) presents the validation data obtained through stratified random sampling.
Figure 2.
Spatial distribution of training and validation points across Bangladesh. Panel (a) shows the distribution of training data collected over each 1°×1° tile, while panel (b) presents the validation data obtained through stratified random sampling.
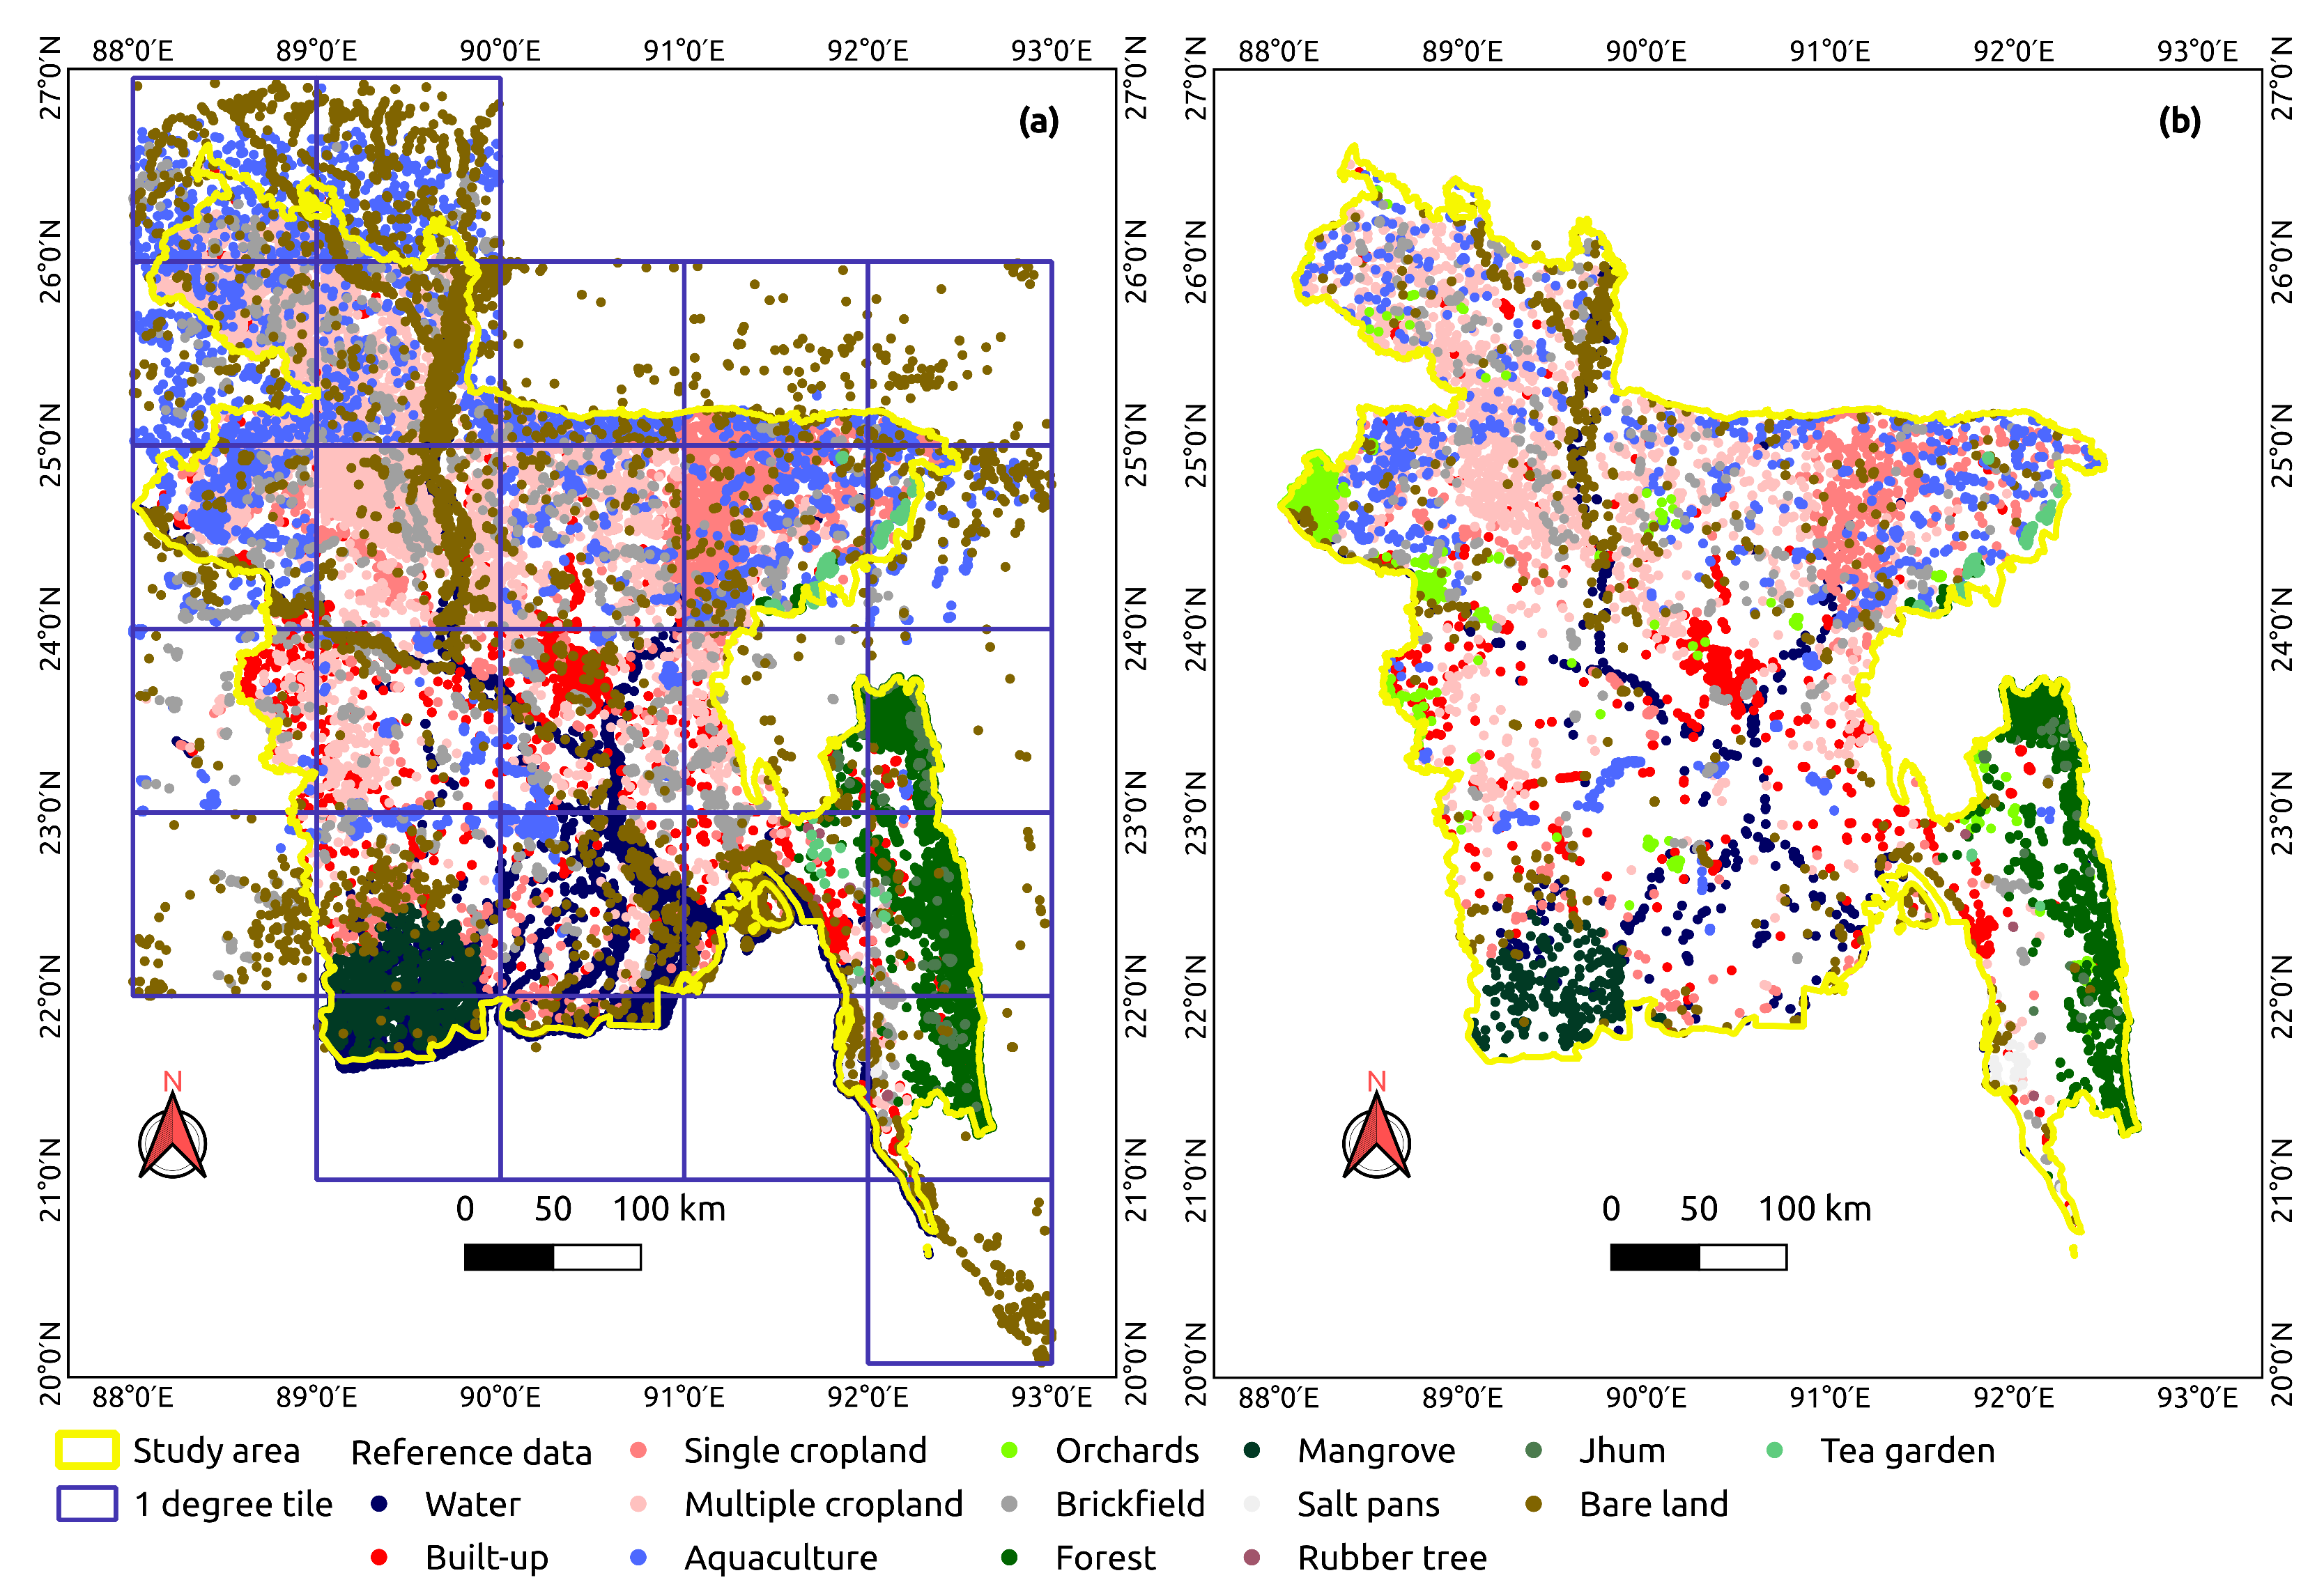
Figure 3.
Devices utilized during field trips for collecting reference data.
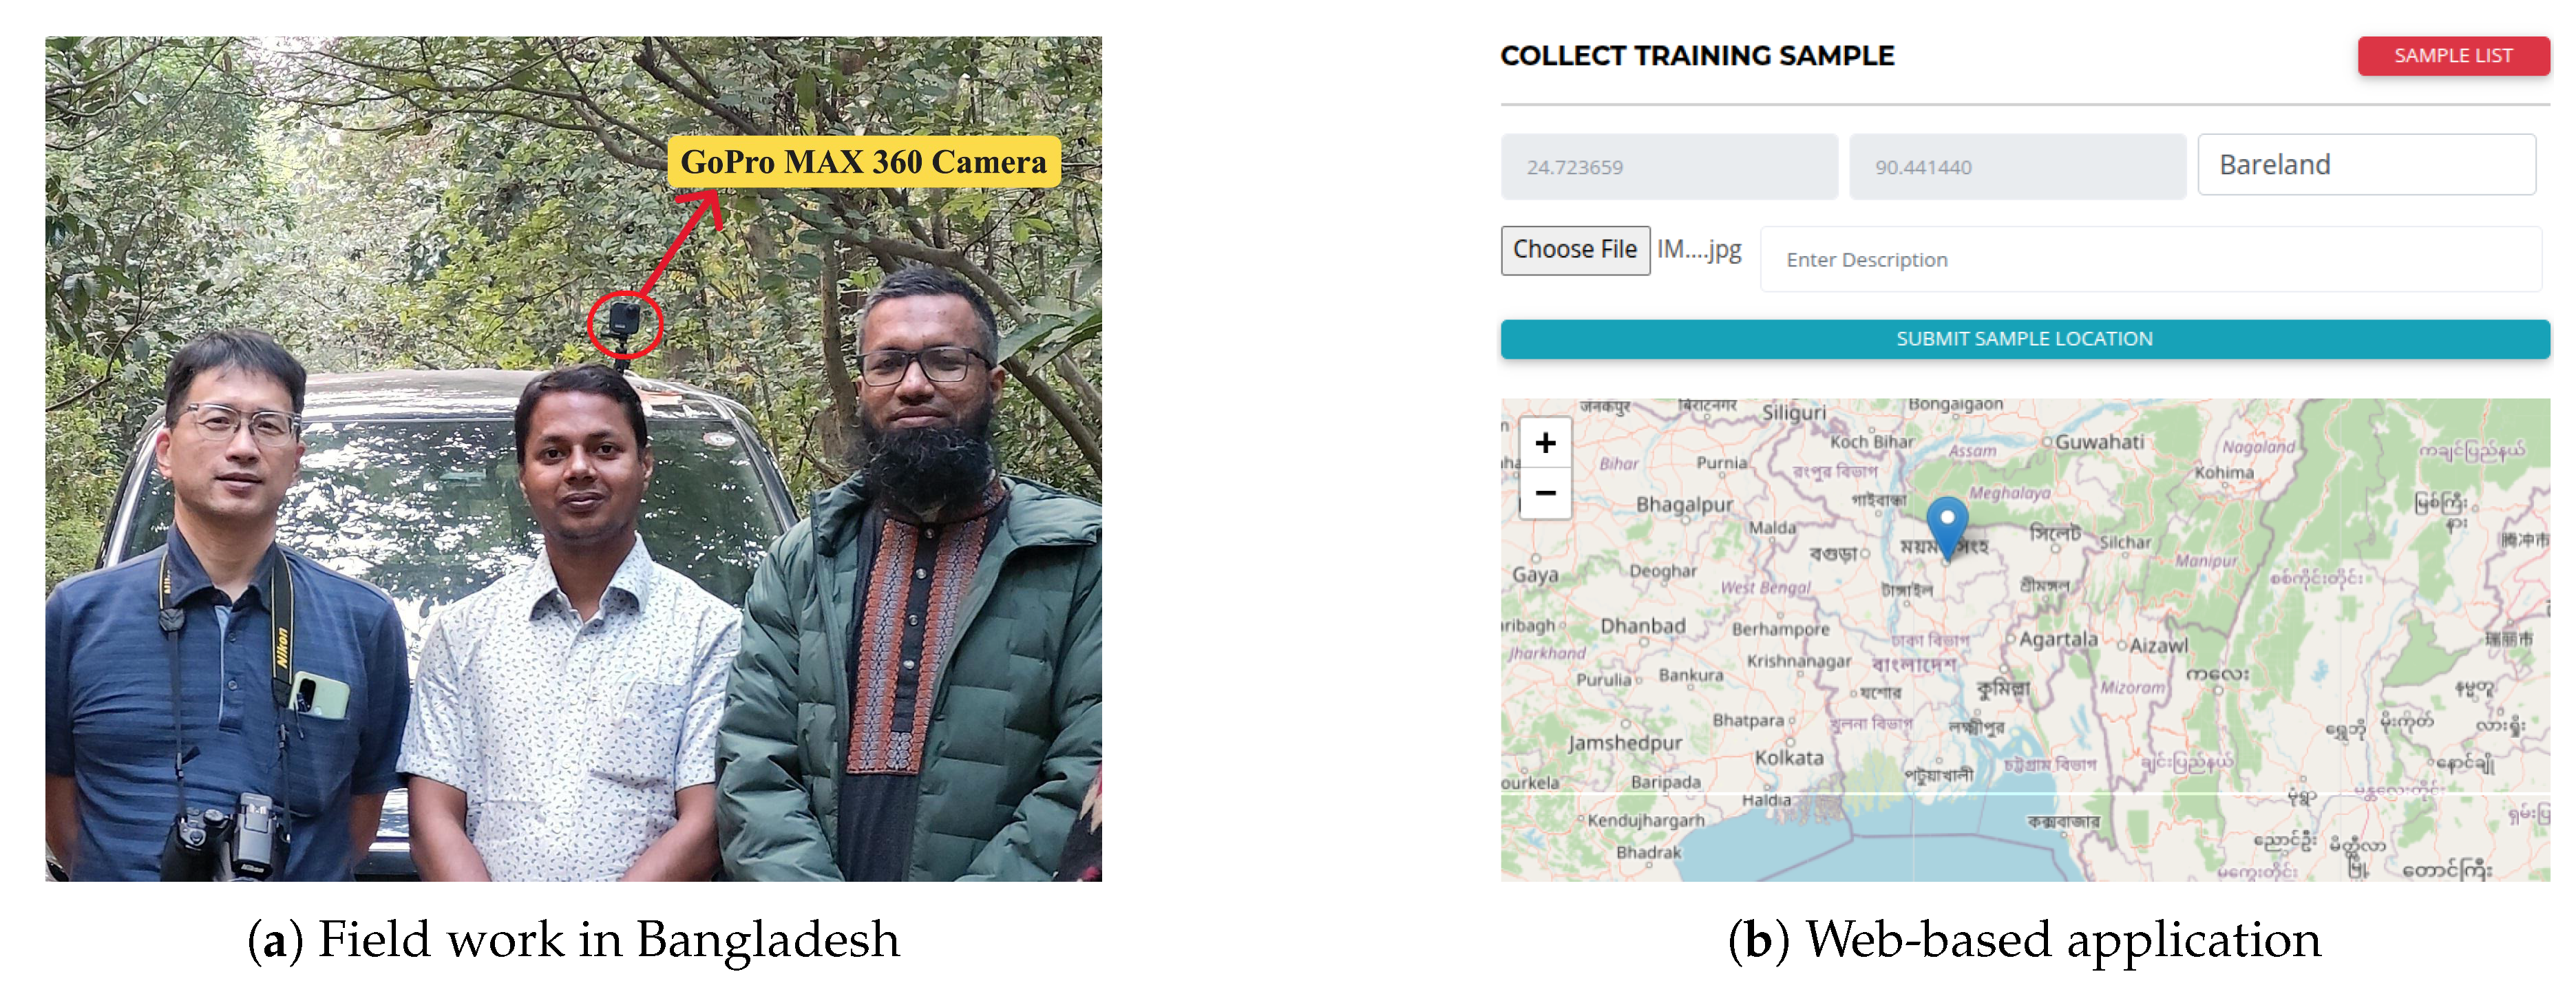
Figure 4.
Example images of diverse LULC categories, accompanied by their respective coordinates, gathered during fieldwork activities.
Figure 4.
Example images of diverse LULC categories, accompanied by their respective coordinates, gathered during fieldwork activities.
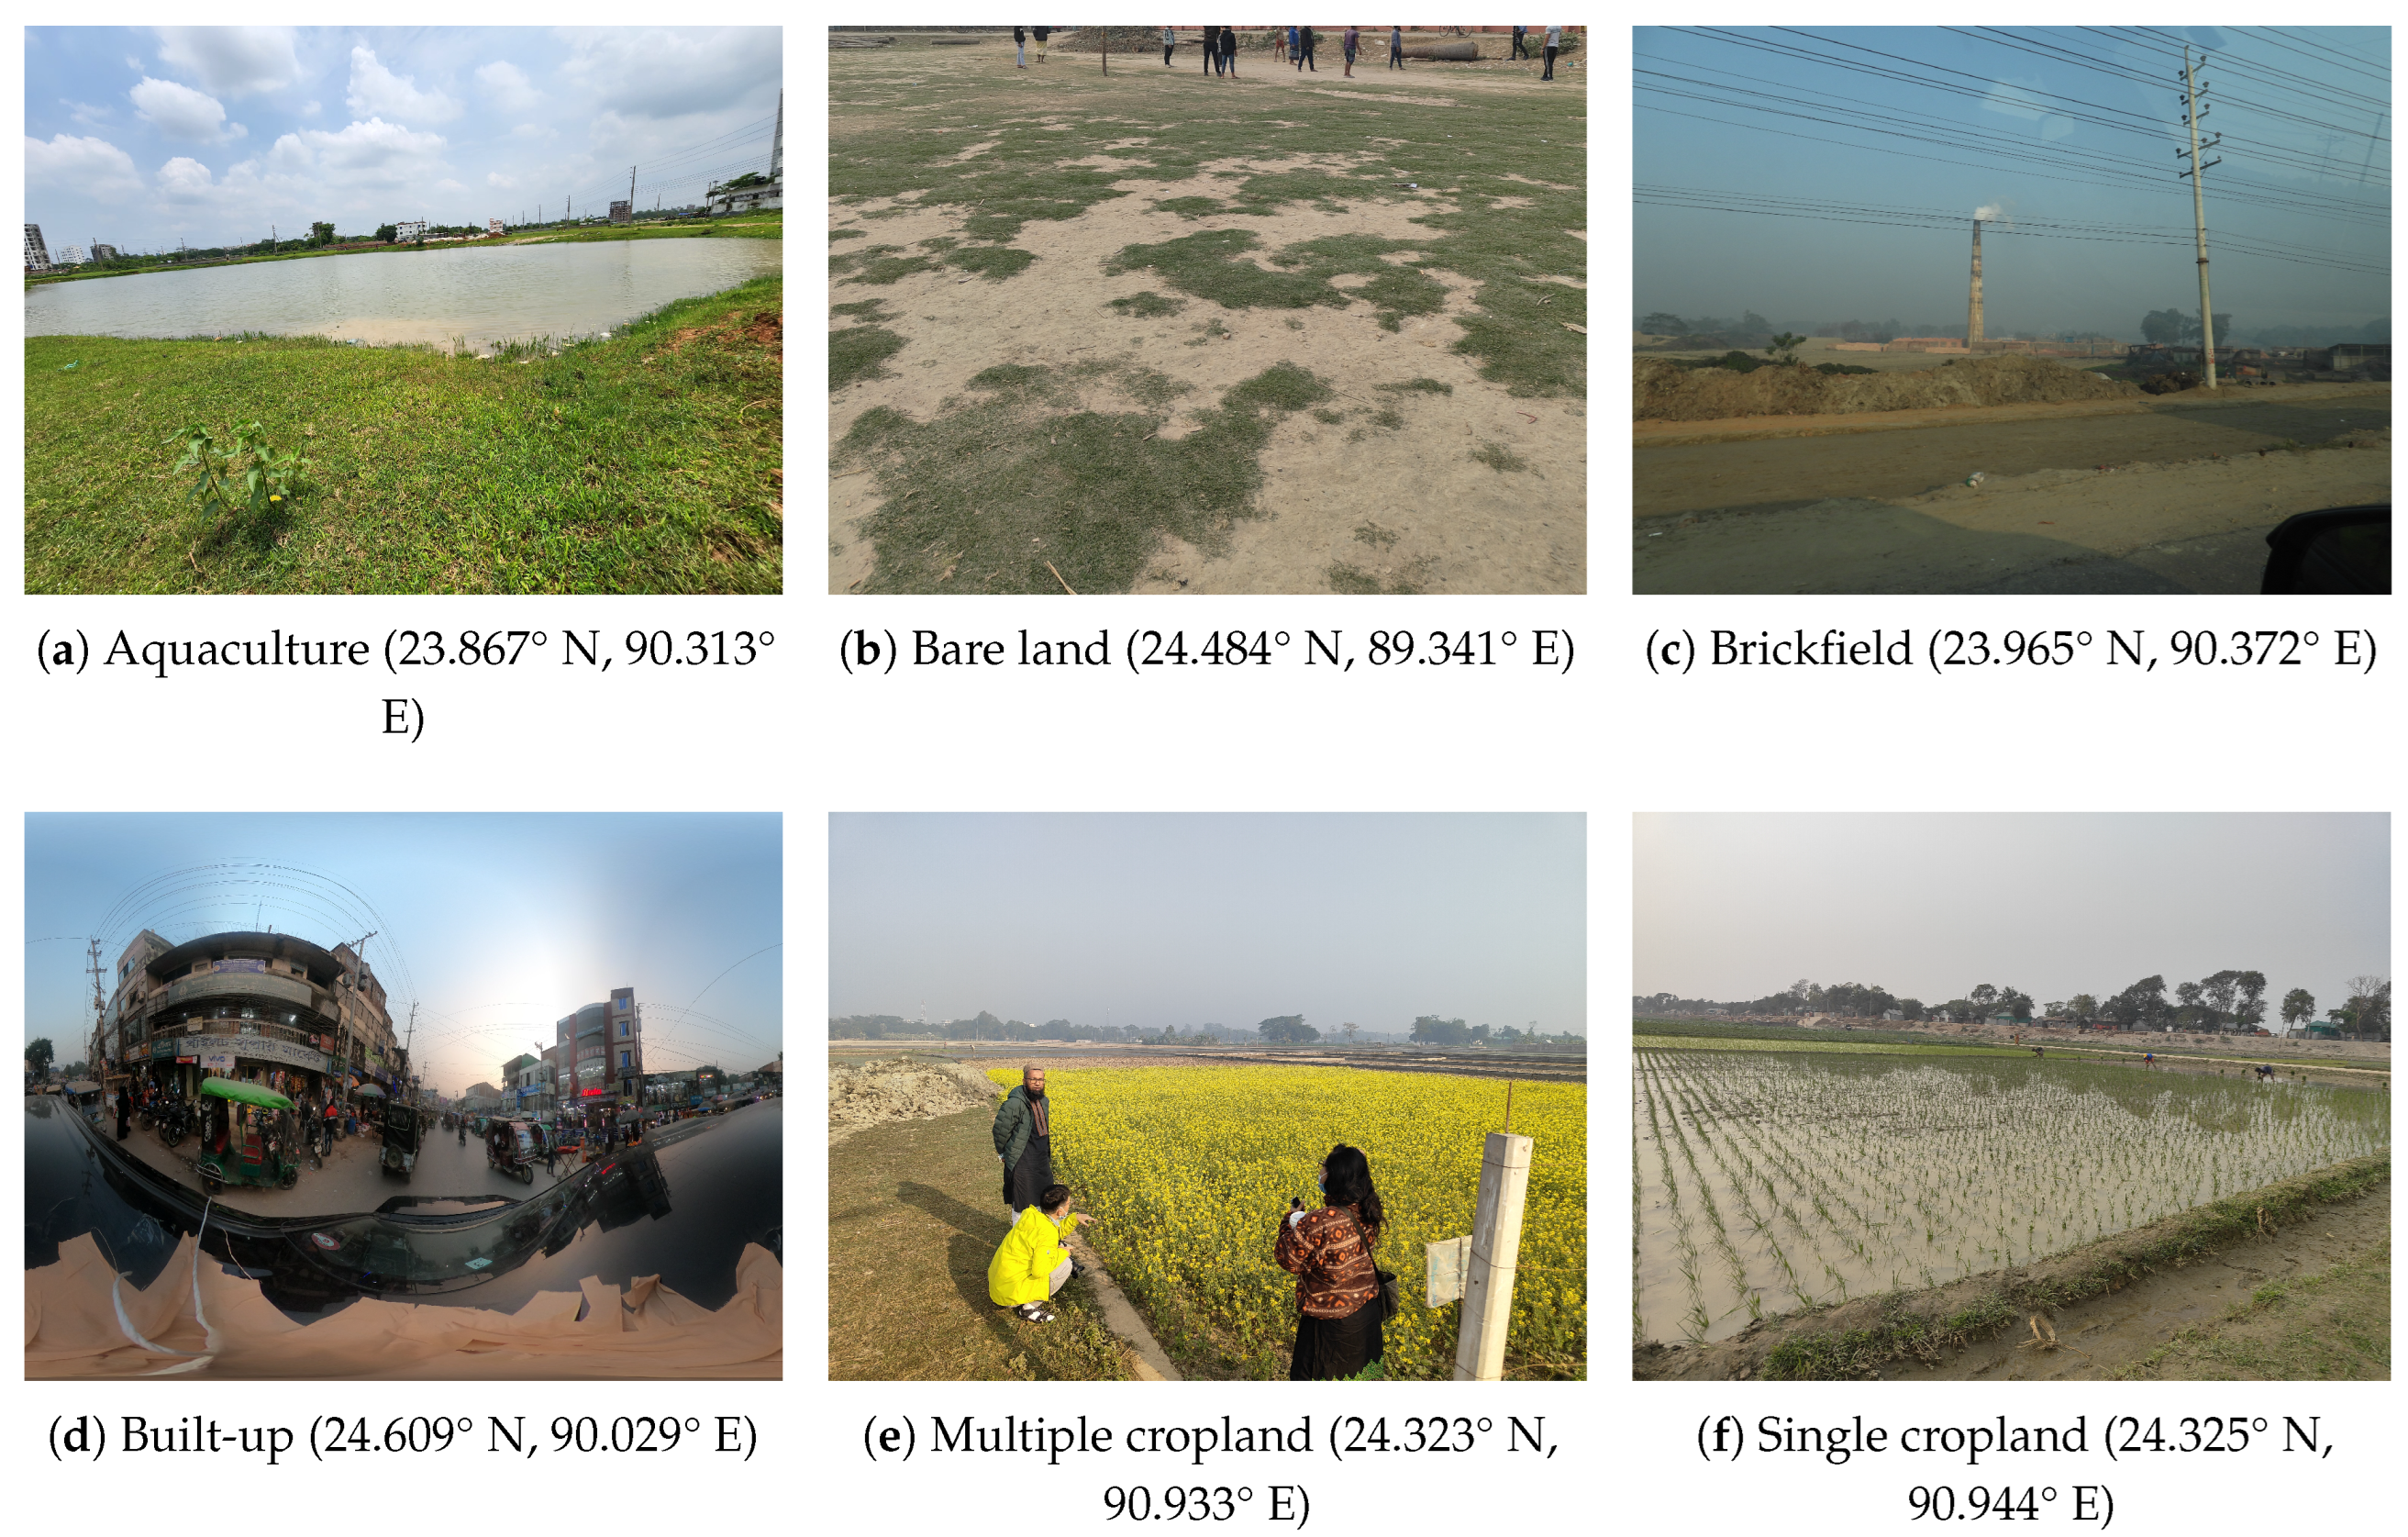
Figure 5.
Workflow of the SACLASS2 classification algorithm, utilizing a modified Convolutional Neural Network (CNN) structure adapted from Hirayama et al. (2022) [30].
Figure 5.
Workflow of the SACLASS2 classification algorithm, utilizing a modified Convolutional Neural Network (CNN) structure adapted from Hirayama et al. (2022) [30].
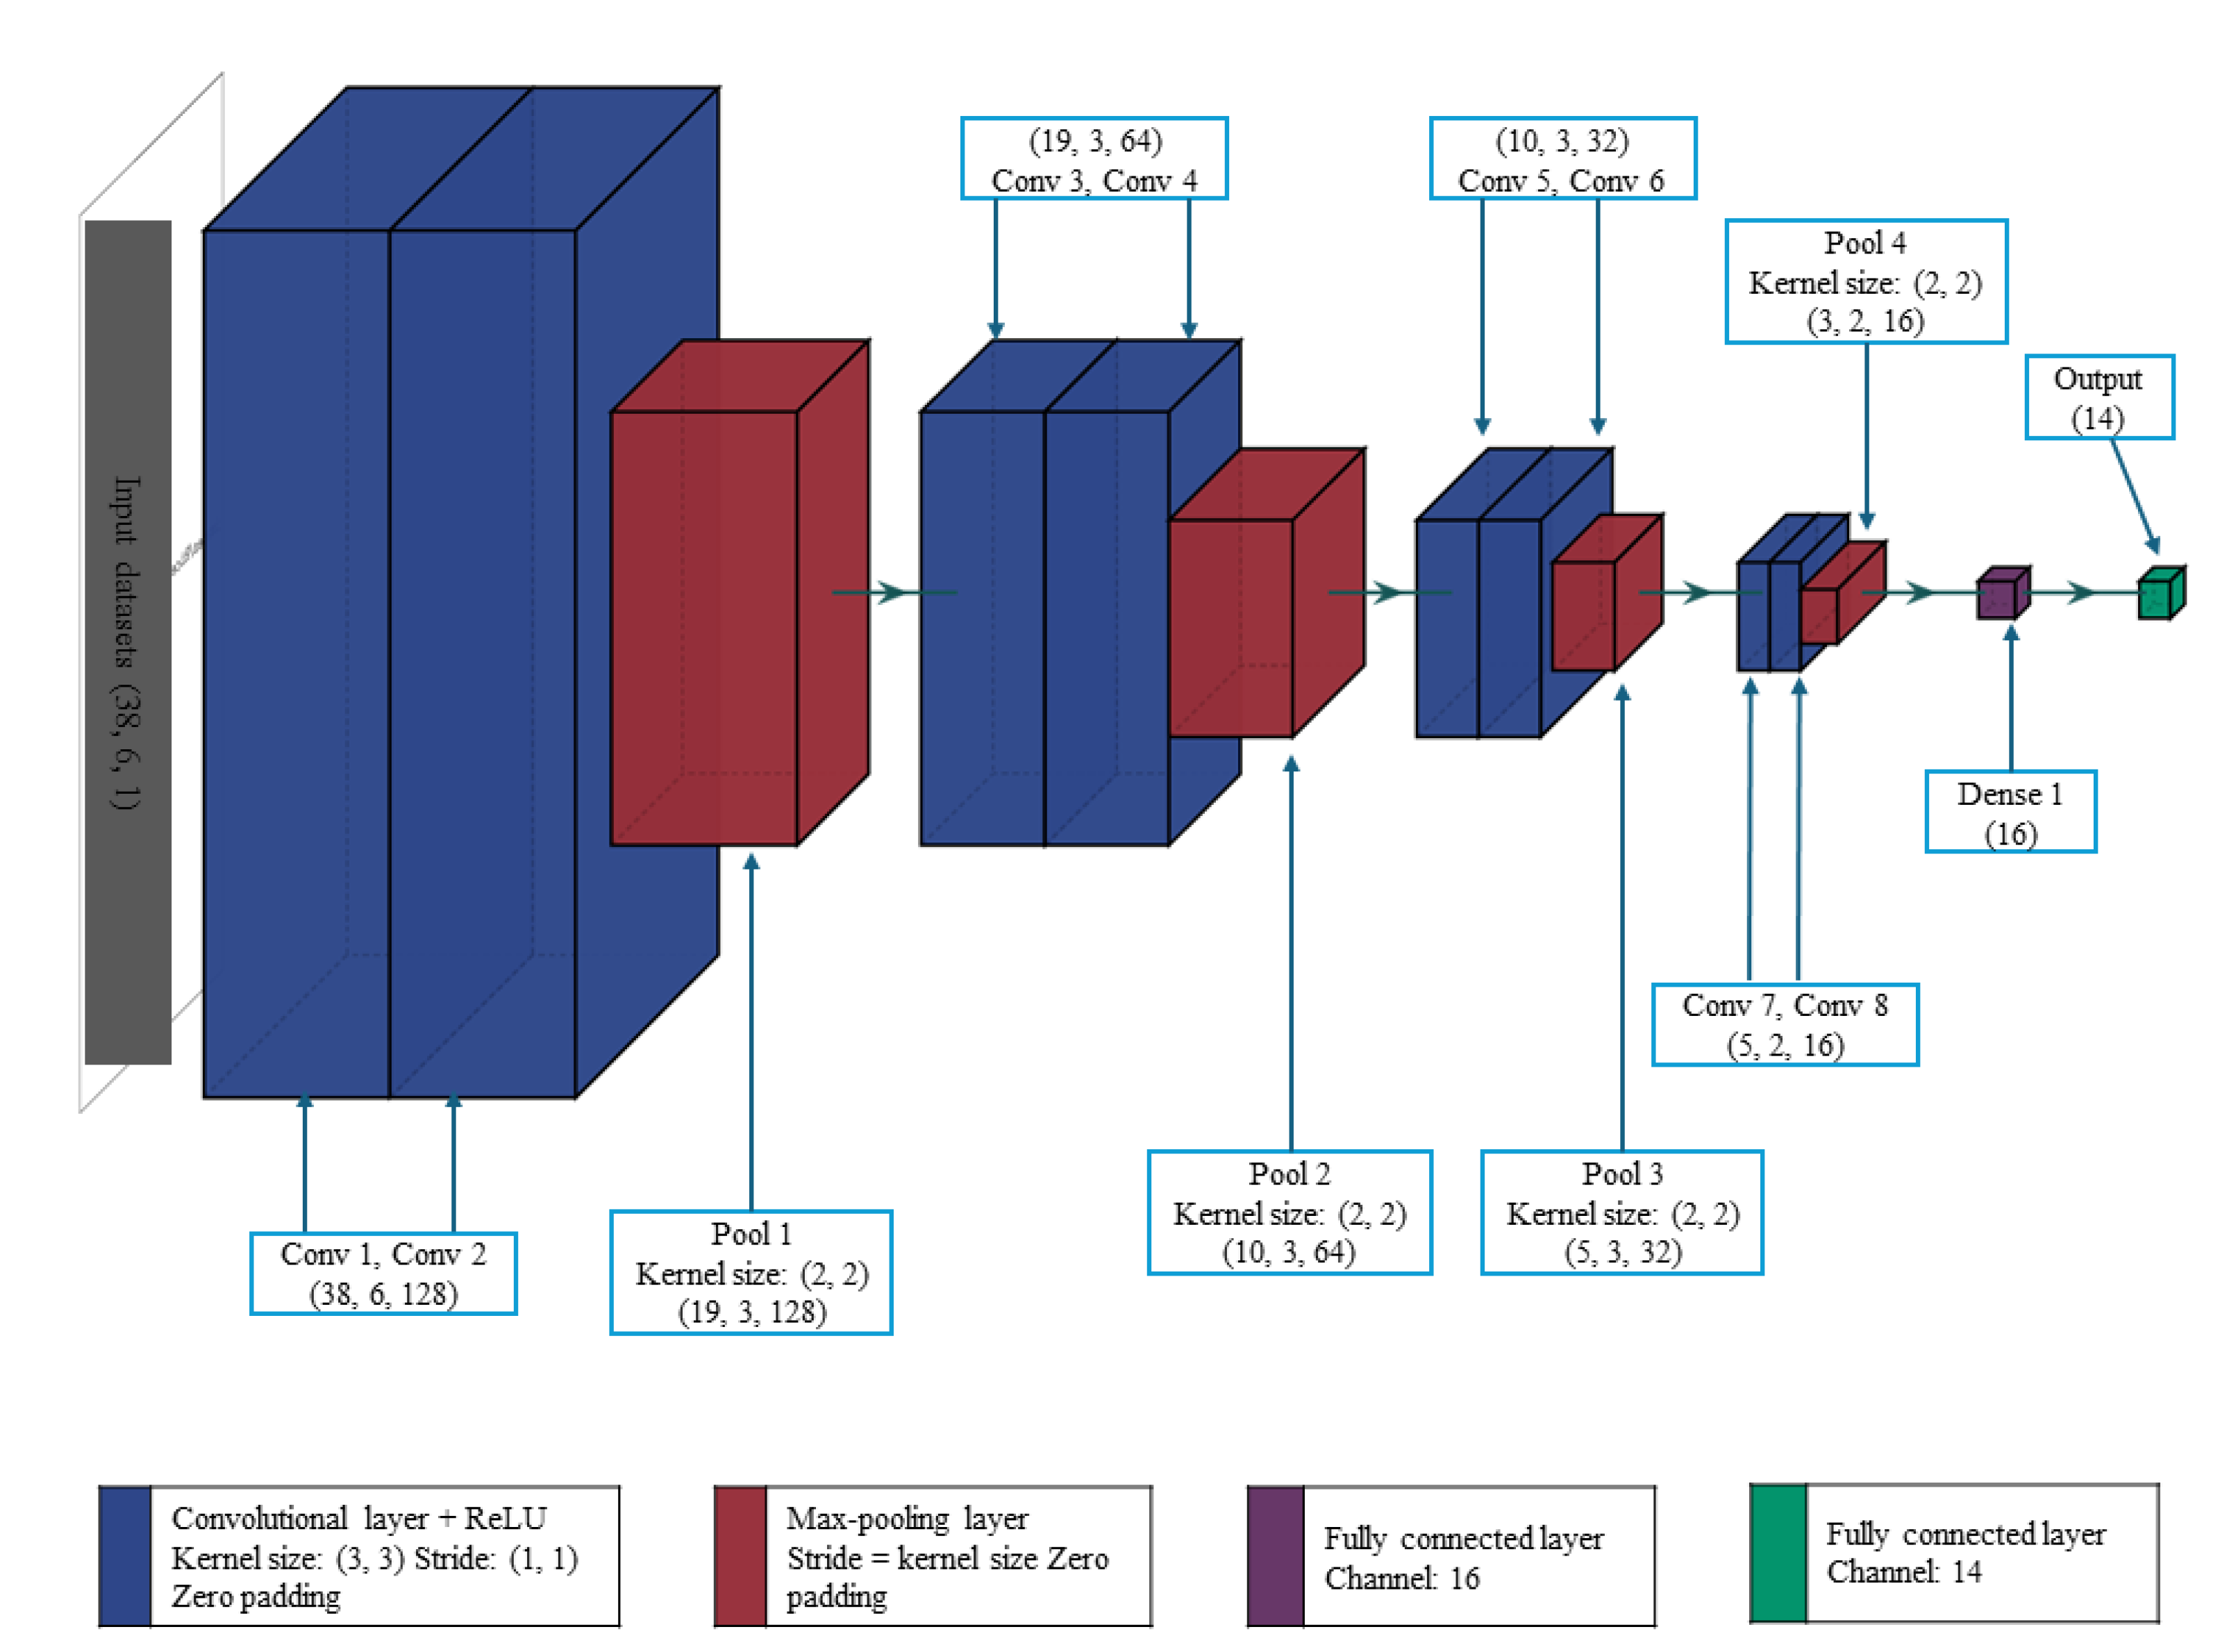
Figure 6.
Comparison of land cover classification results using Sentinel-1 (SAR), Sentinel-2 (optical), and a fused Sentinel-1, PALSAR-2, and Sentinel-2 dataset, evaluated against the reference true-color Sentinel-2 Level-2A imagery.
Figure 6.
Comparison of land cover classification results using Sentinel-1 (SAR), Sentinel-2 (optical), and a fused Sentinel-1, PALSAR-2, and Sentinel-2 dataset, evaluated against the reference true-color Sentinel-2 Level-2A imagery.
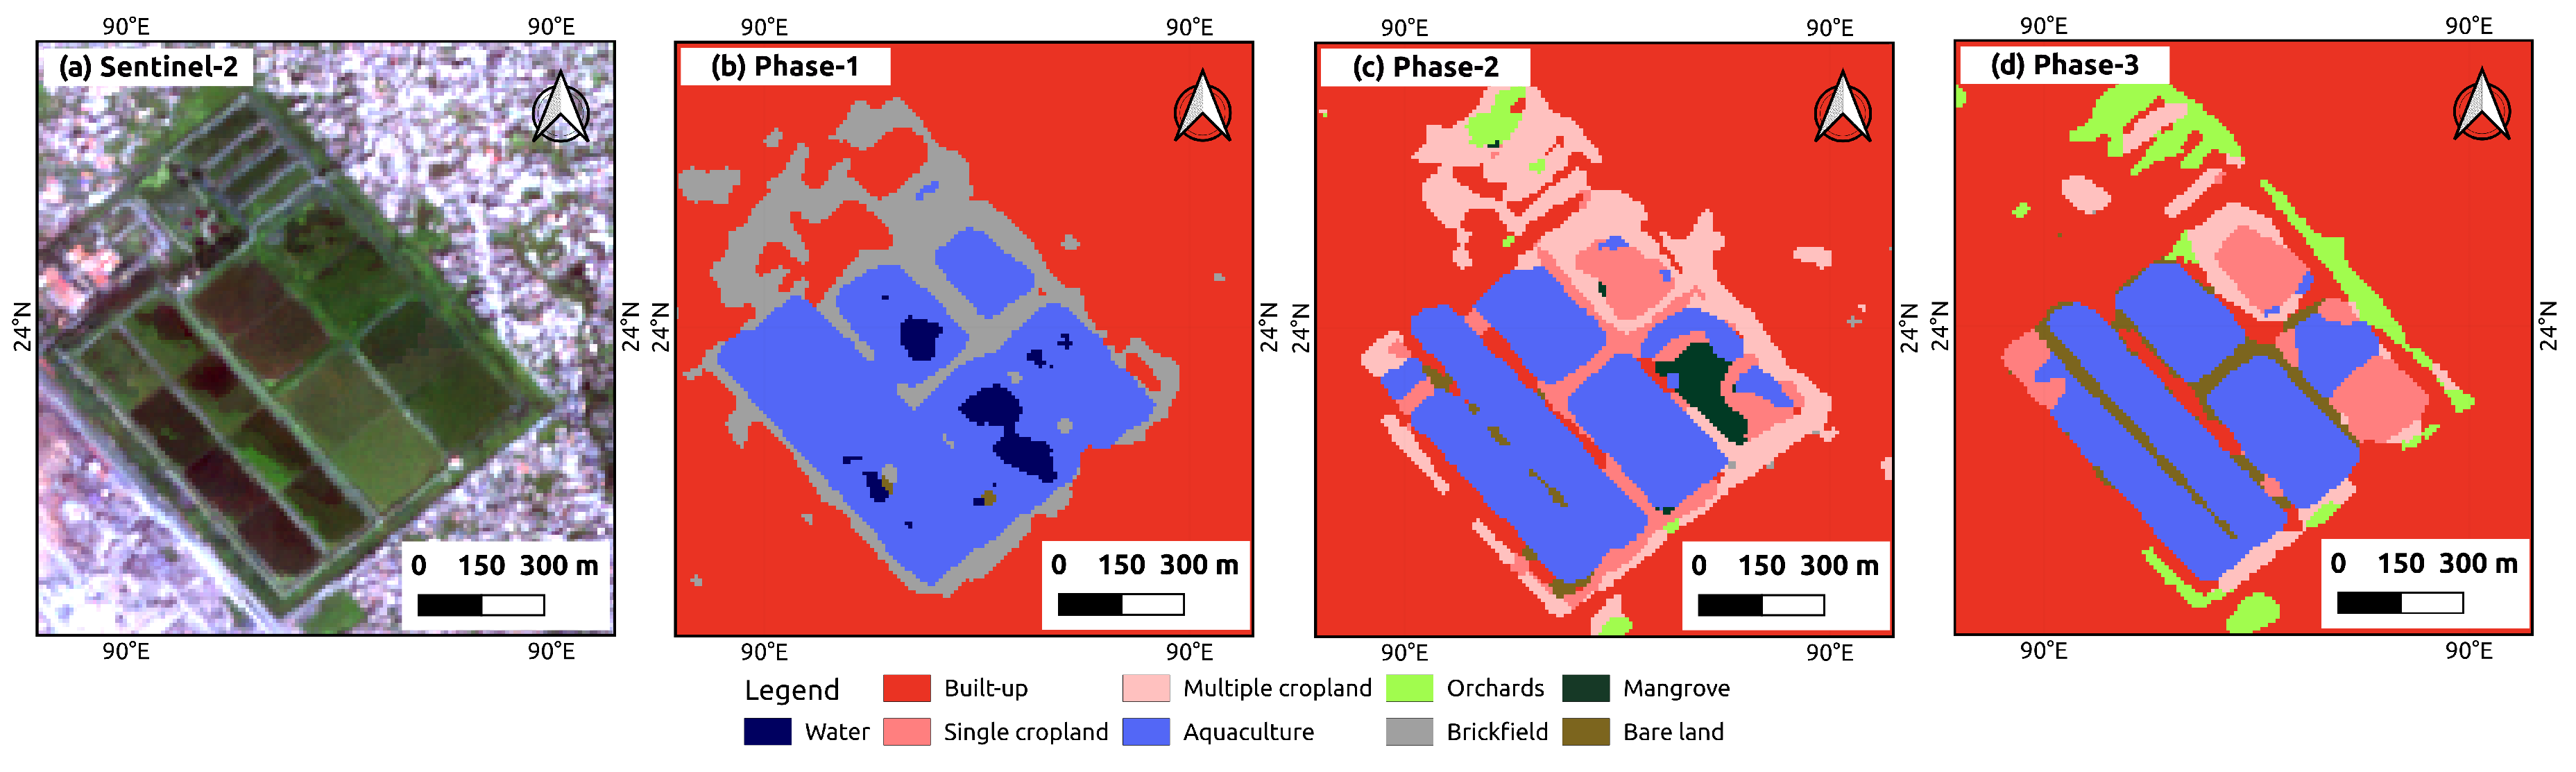
Figure 7.
High - resolution land use land cover (HRLULC) maps of Bangladesh for the years 2020 and 2023.
Figure 7.
High - resolution land use land cover (HRLULC) maps of Bangladesh for the years 2020 and 2023.
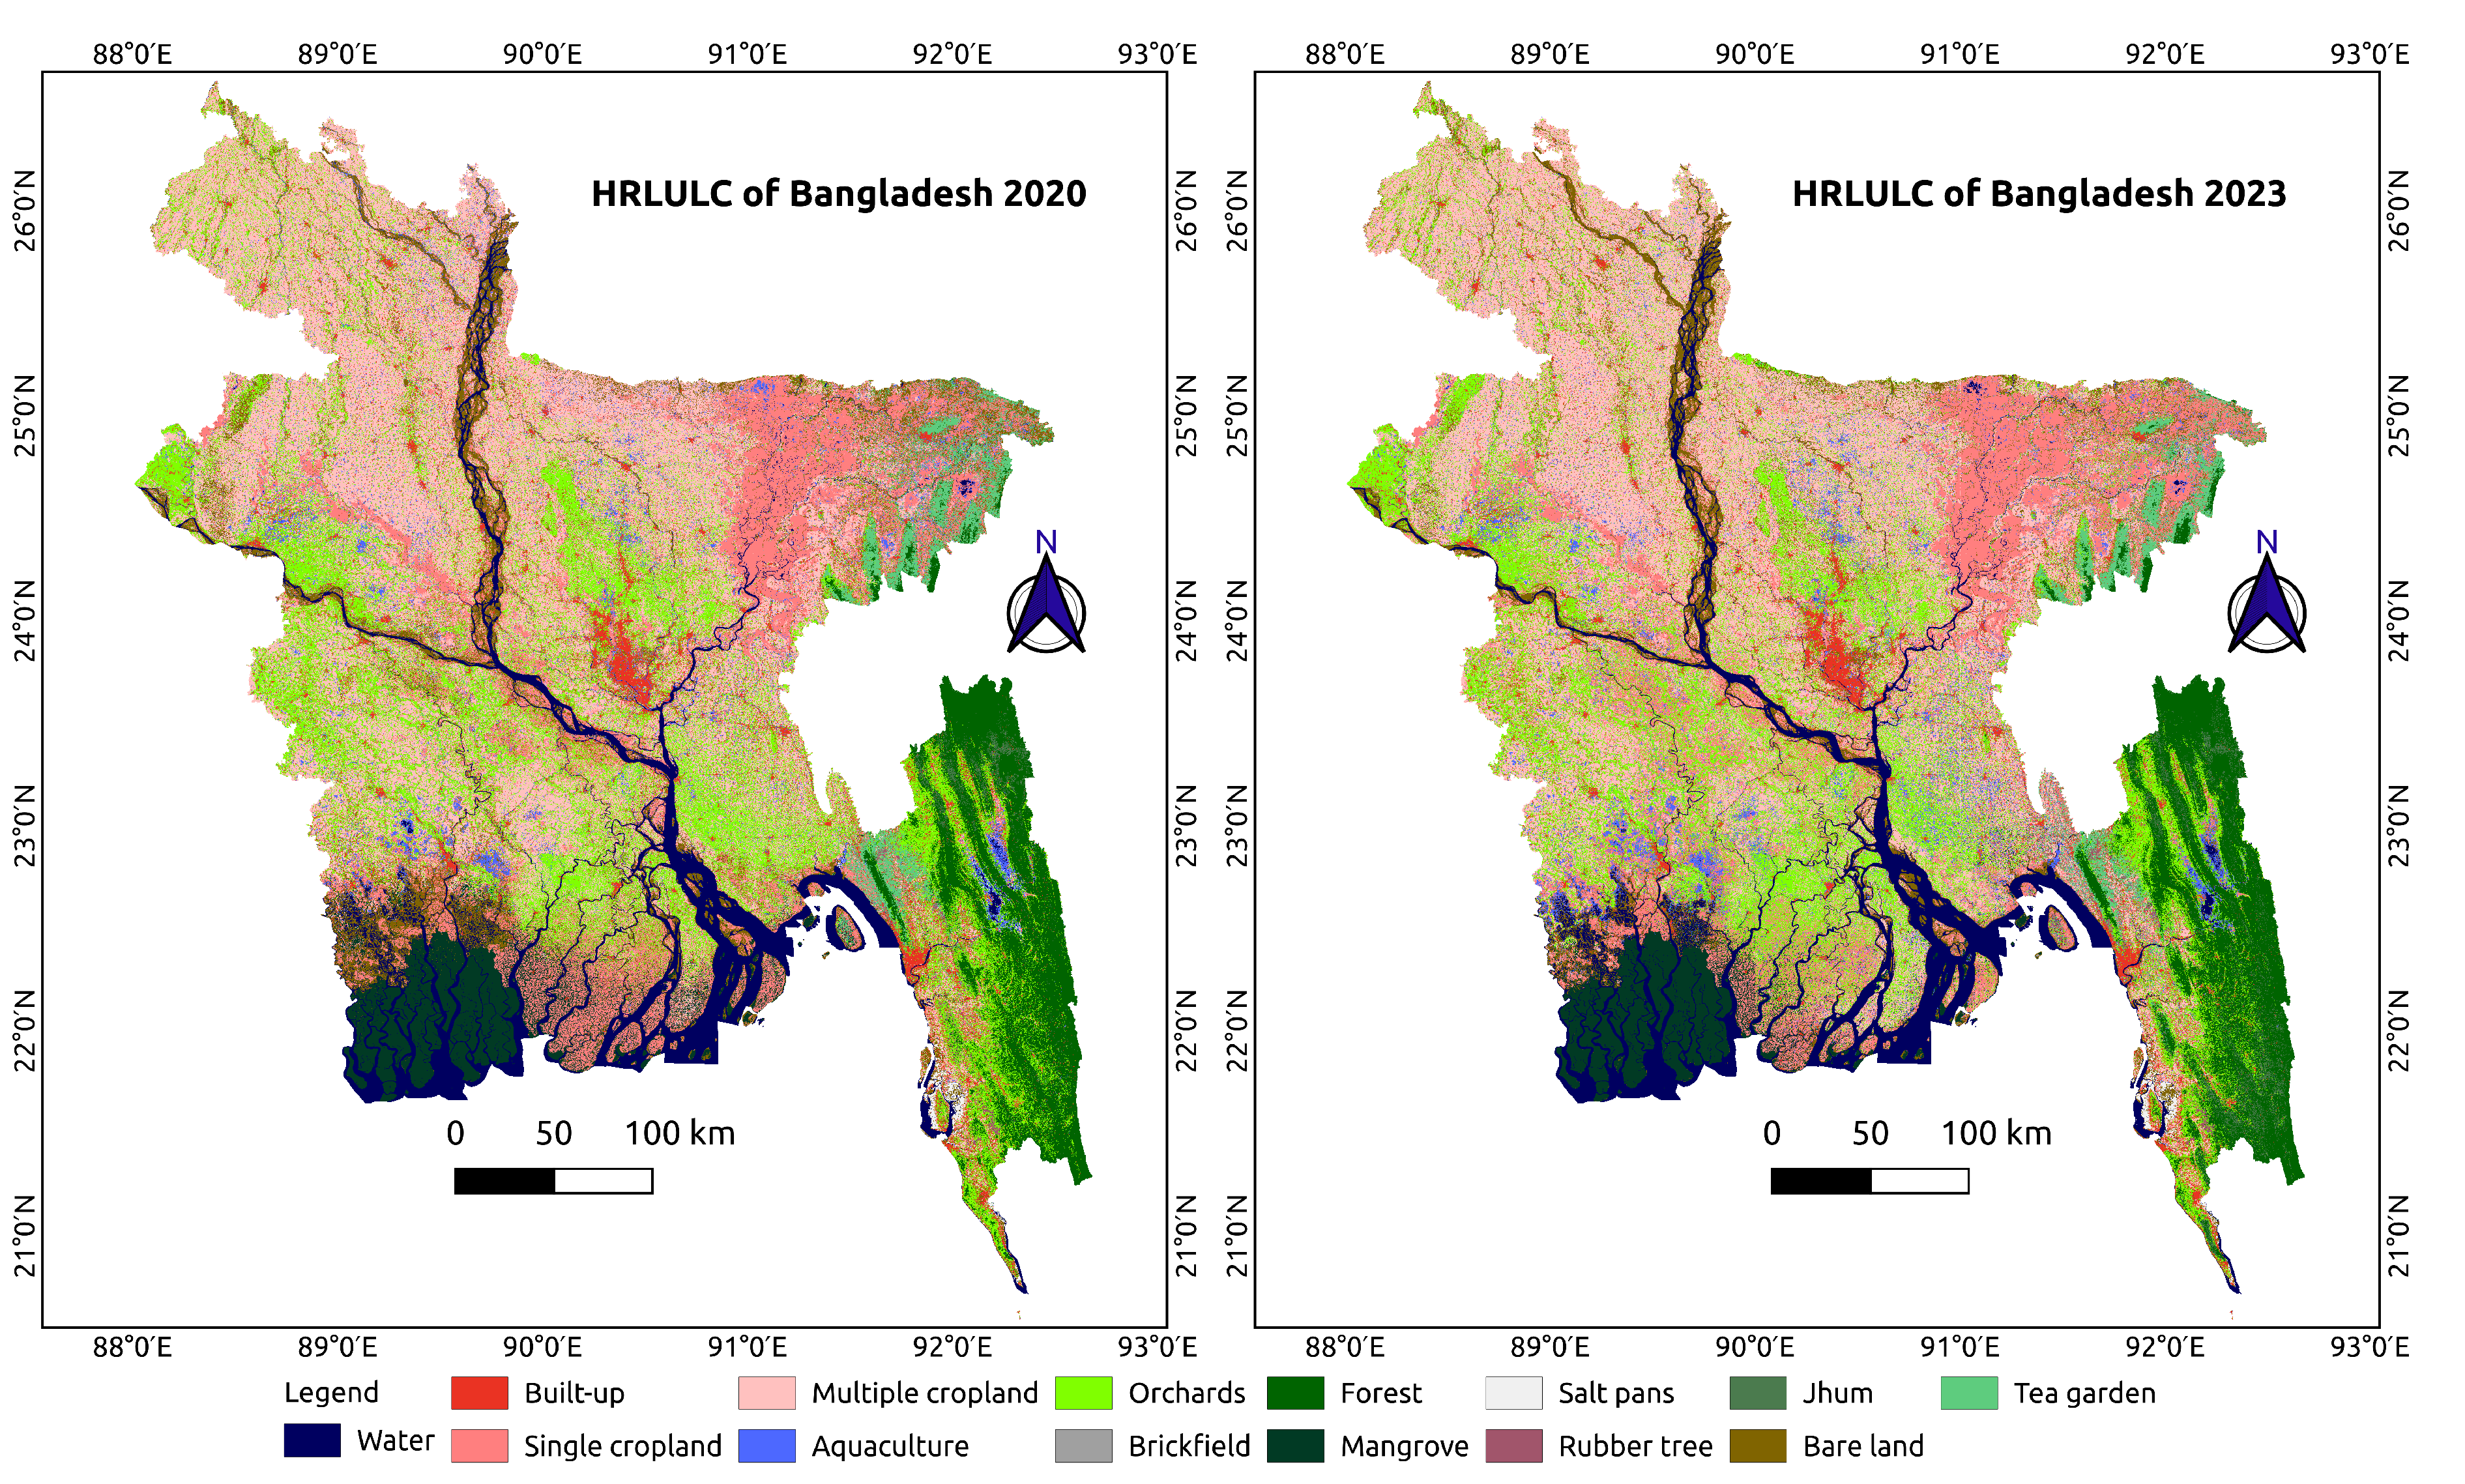
Figure 8.
Distinct identification of brickfields, aquaculture ponds, and salt pans in the HRLULC map of Bangladesh, compared with PlanetScope imagery.
Figure 8.
Distinct identification of brickfields, aquaculture ponds, and salt pans in the HRLULC map of Bangladesh, compared with PlanetScope imagery.
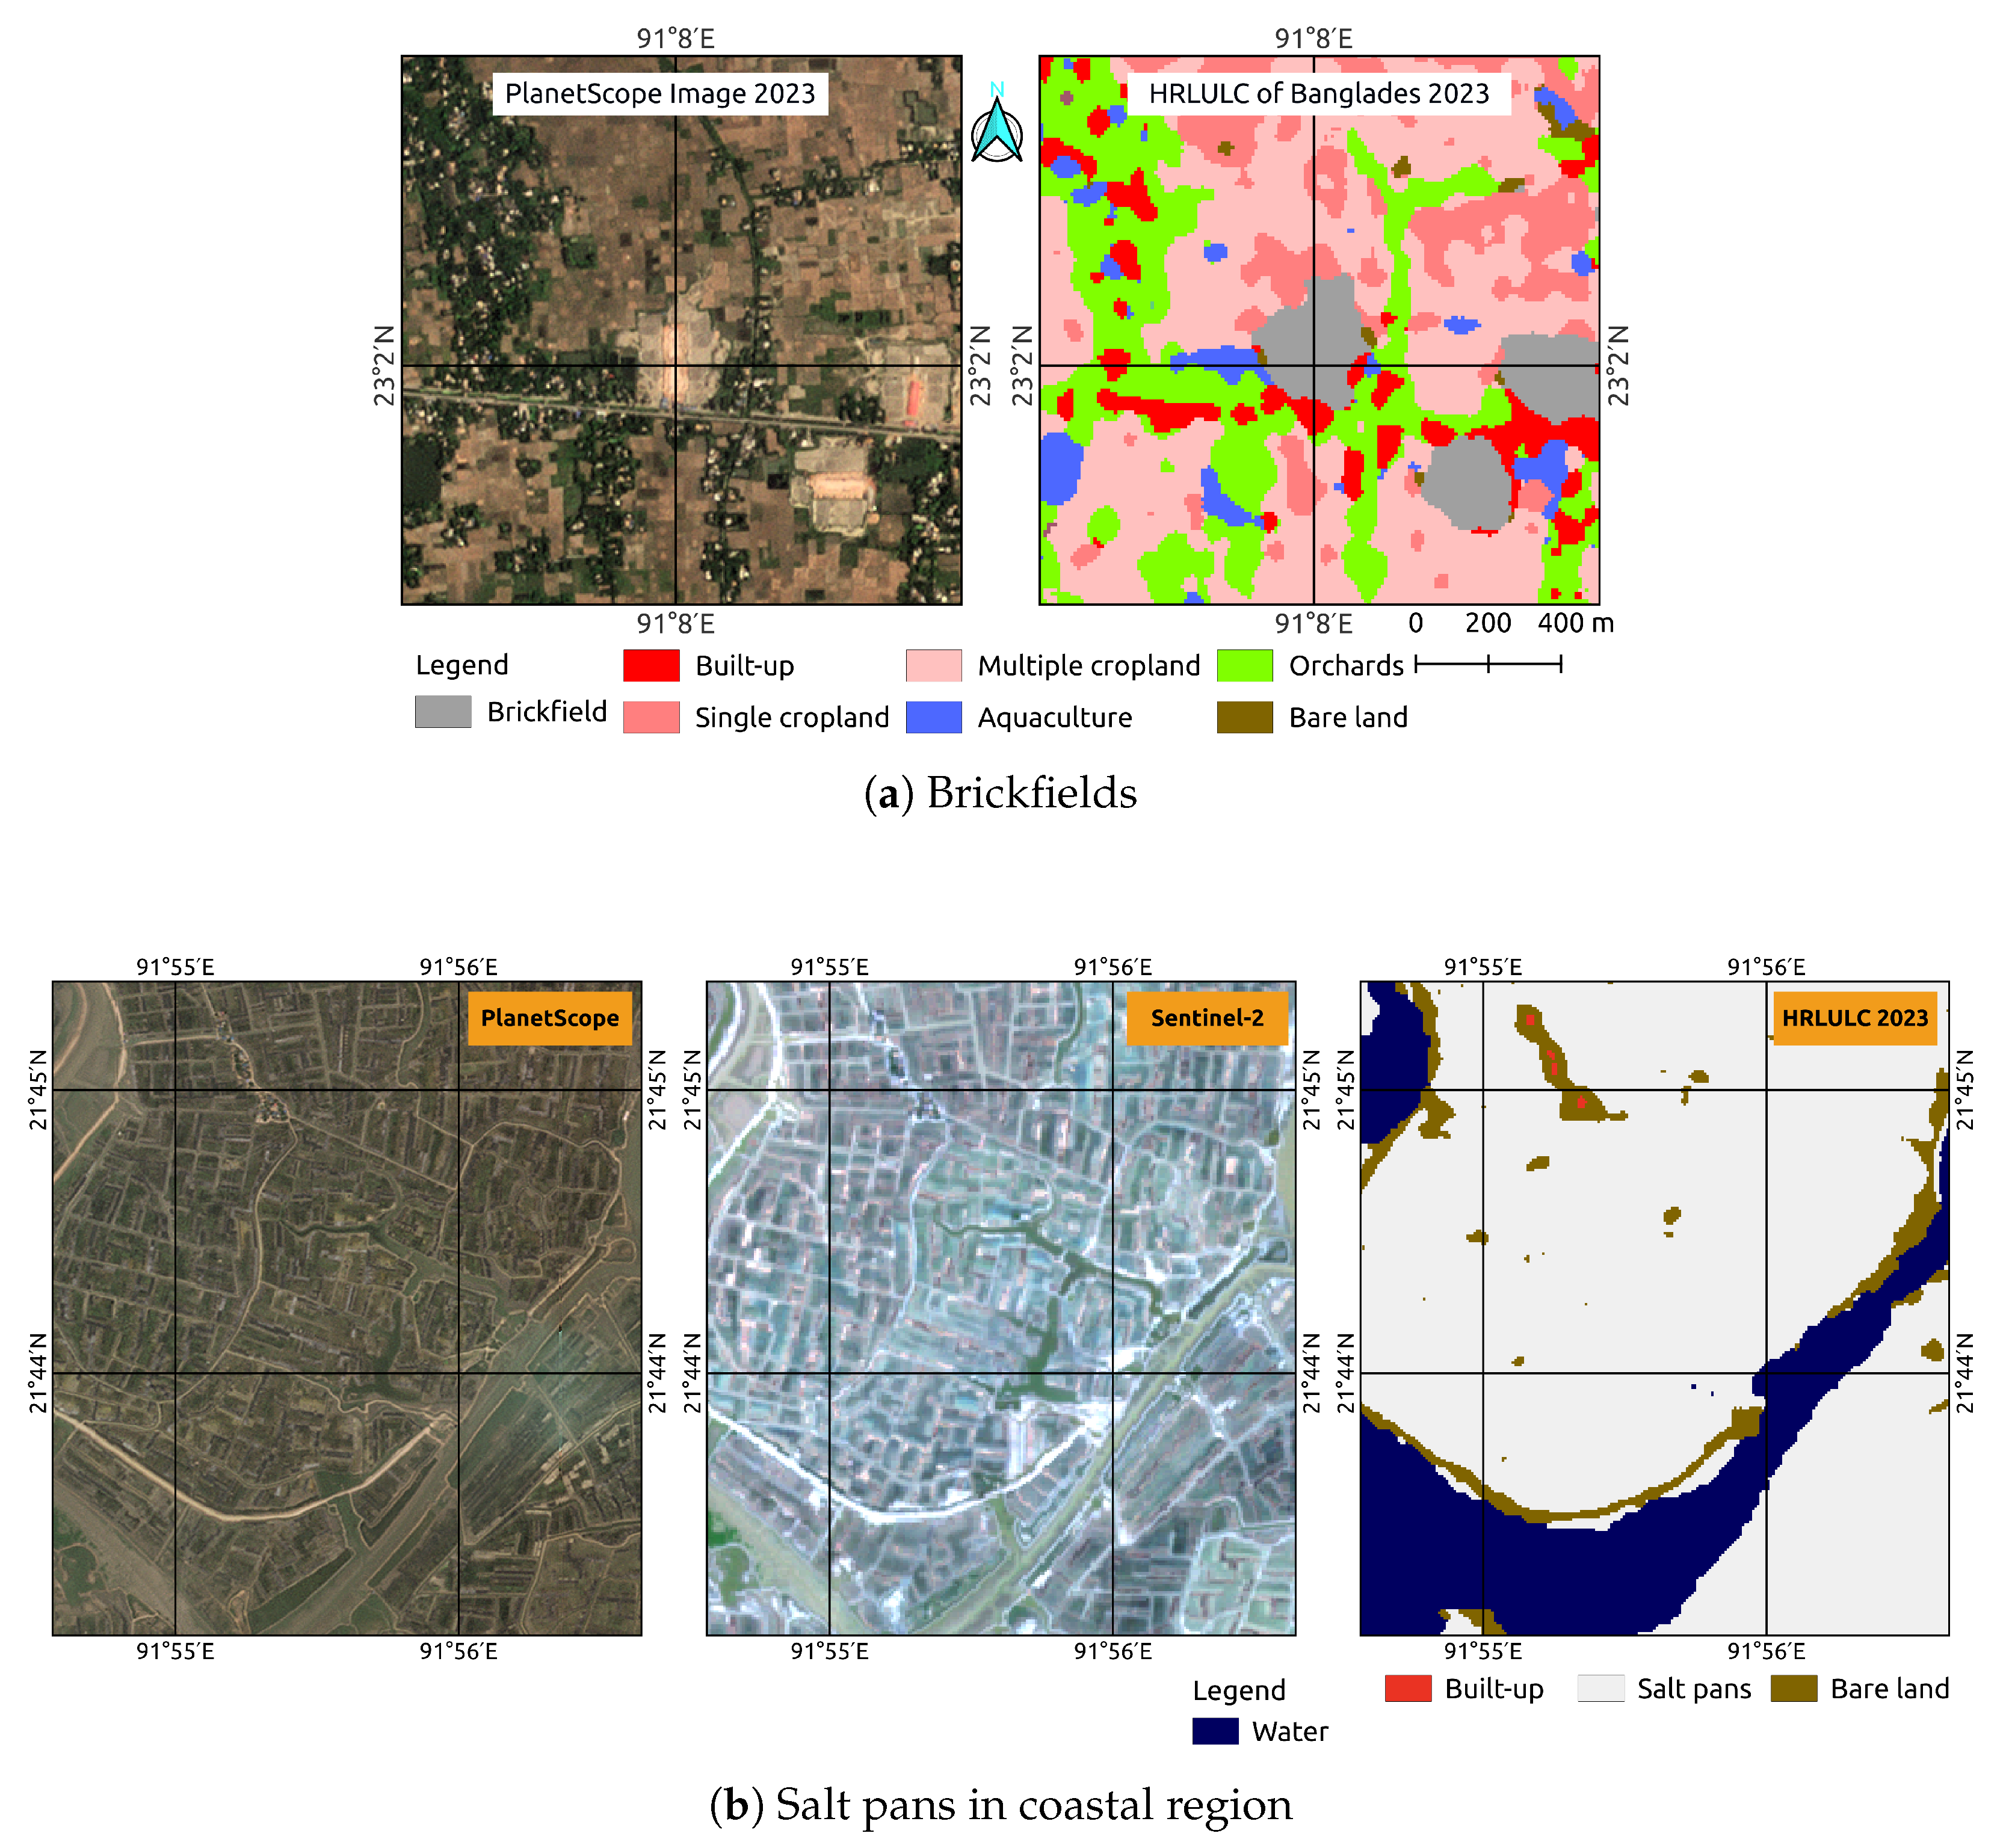
Figure 9.
Comparative visualization of the HRLULC map developed in this study and existing global LULC products across three selected sites. PlanetScope imagery is used as a high-resolution ground reference for visual assessment.
Figure 9.
Comparative visualization of the HRLULC map developed in this study and existing global LULC products across three selected sites. PlanetScope imagery is used as a high-resolution ground reference for visual assessment.
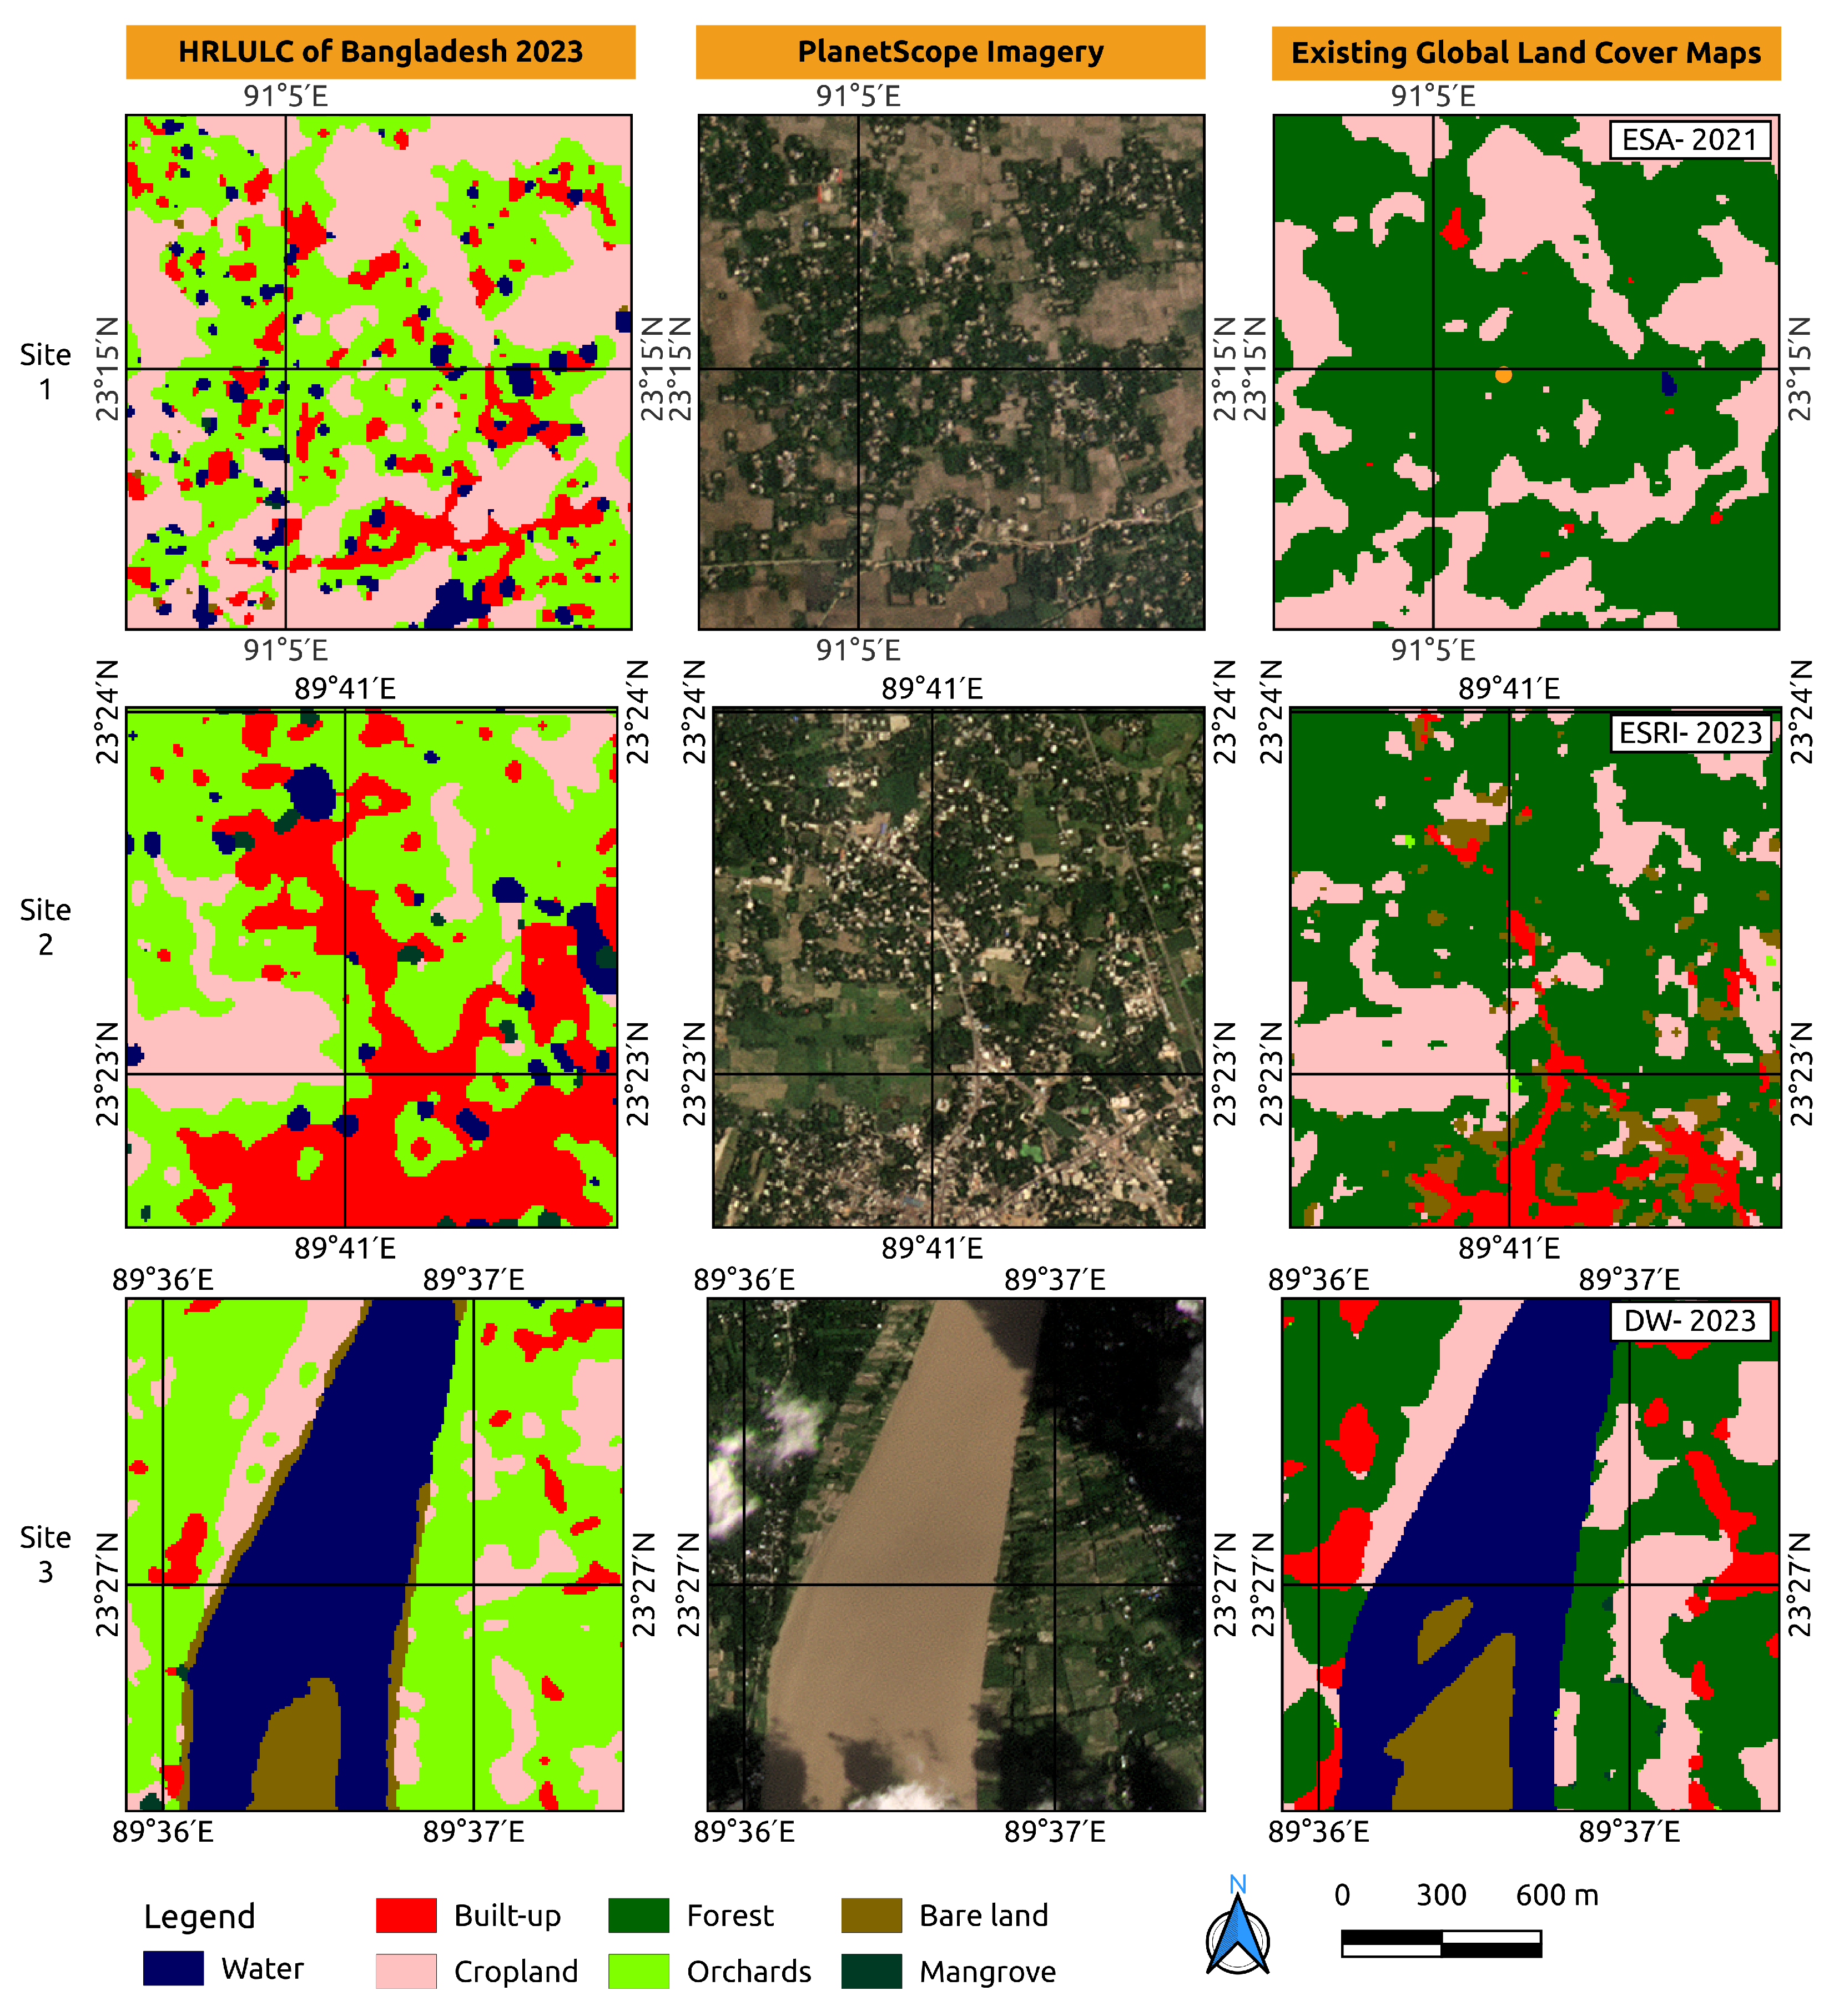
Figure 10.
Pairwise comparison between our HRLULC map and three global land cover datasets (ESA WorldCover, Esri Land Cover, and Dynamic World). Orange indicates matched pixels, while red represents mismatched pixels.
Figure 10.
Pairwise comparison between our HRLULC map and three global land cover datasets (ESA WorldCover, Esri Land Cover, and Dynamic World). Orange indicates matched pixels, while red represents mismatched pixels.
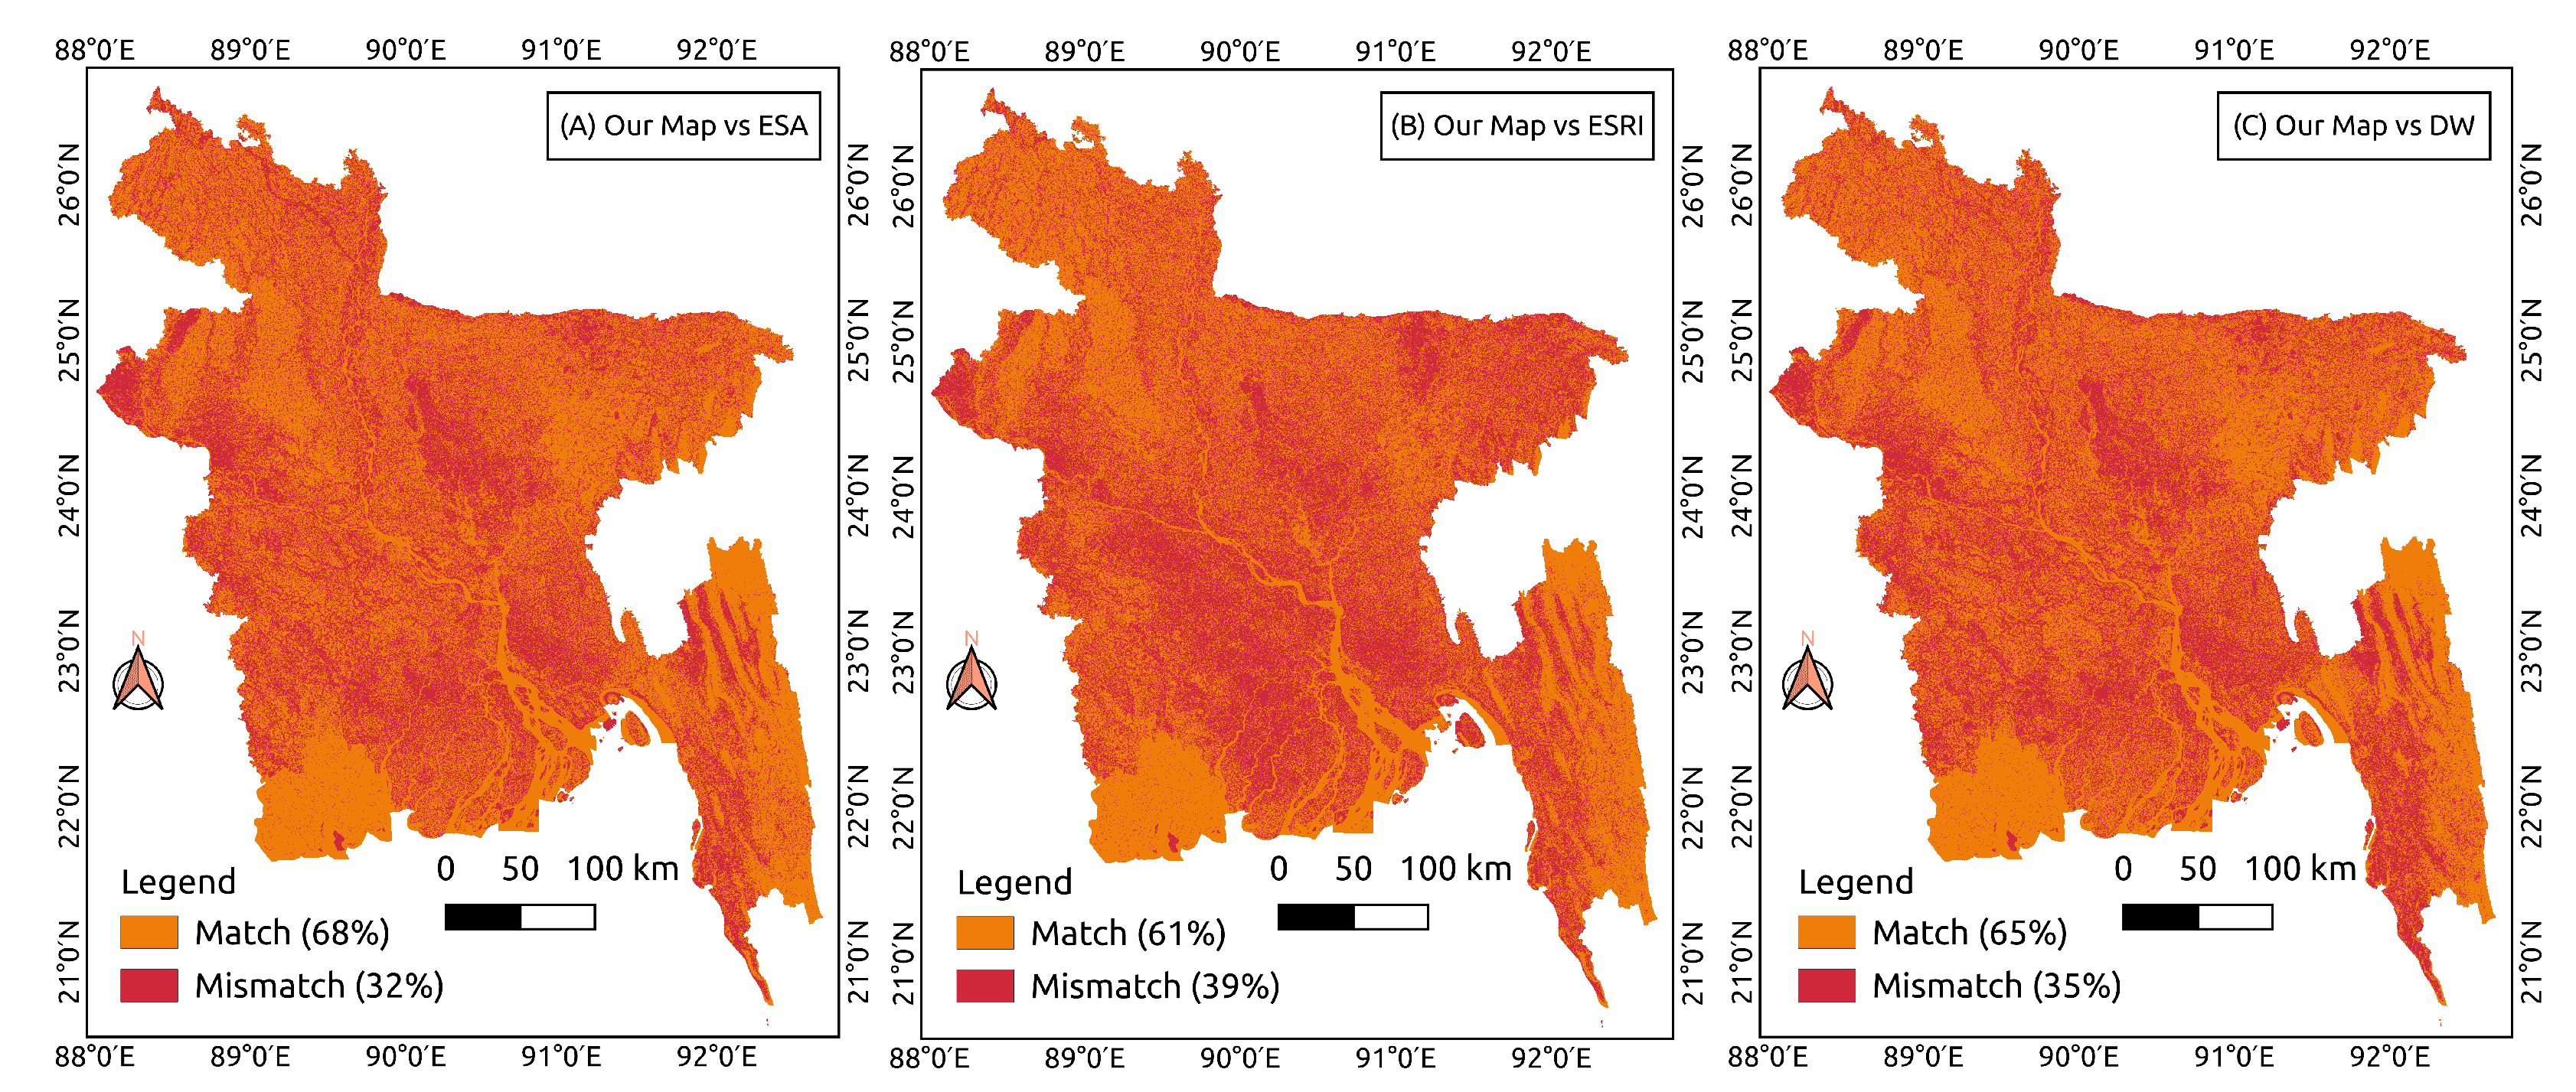
Figure 11.
Percentage of matched pixels by category across pairwise comparisons between the our HRLULC map and global products (ESA, ESRI, DW).
Figure 11.
Percentage of matched pixels by category across pairwise comparisons between the our HRLULC map and global products (ESA, ESRI, DW).
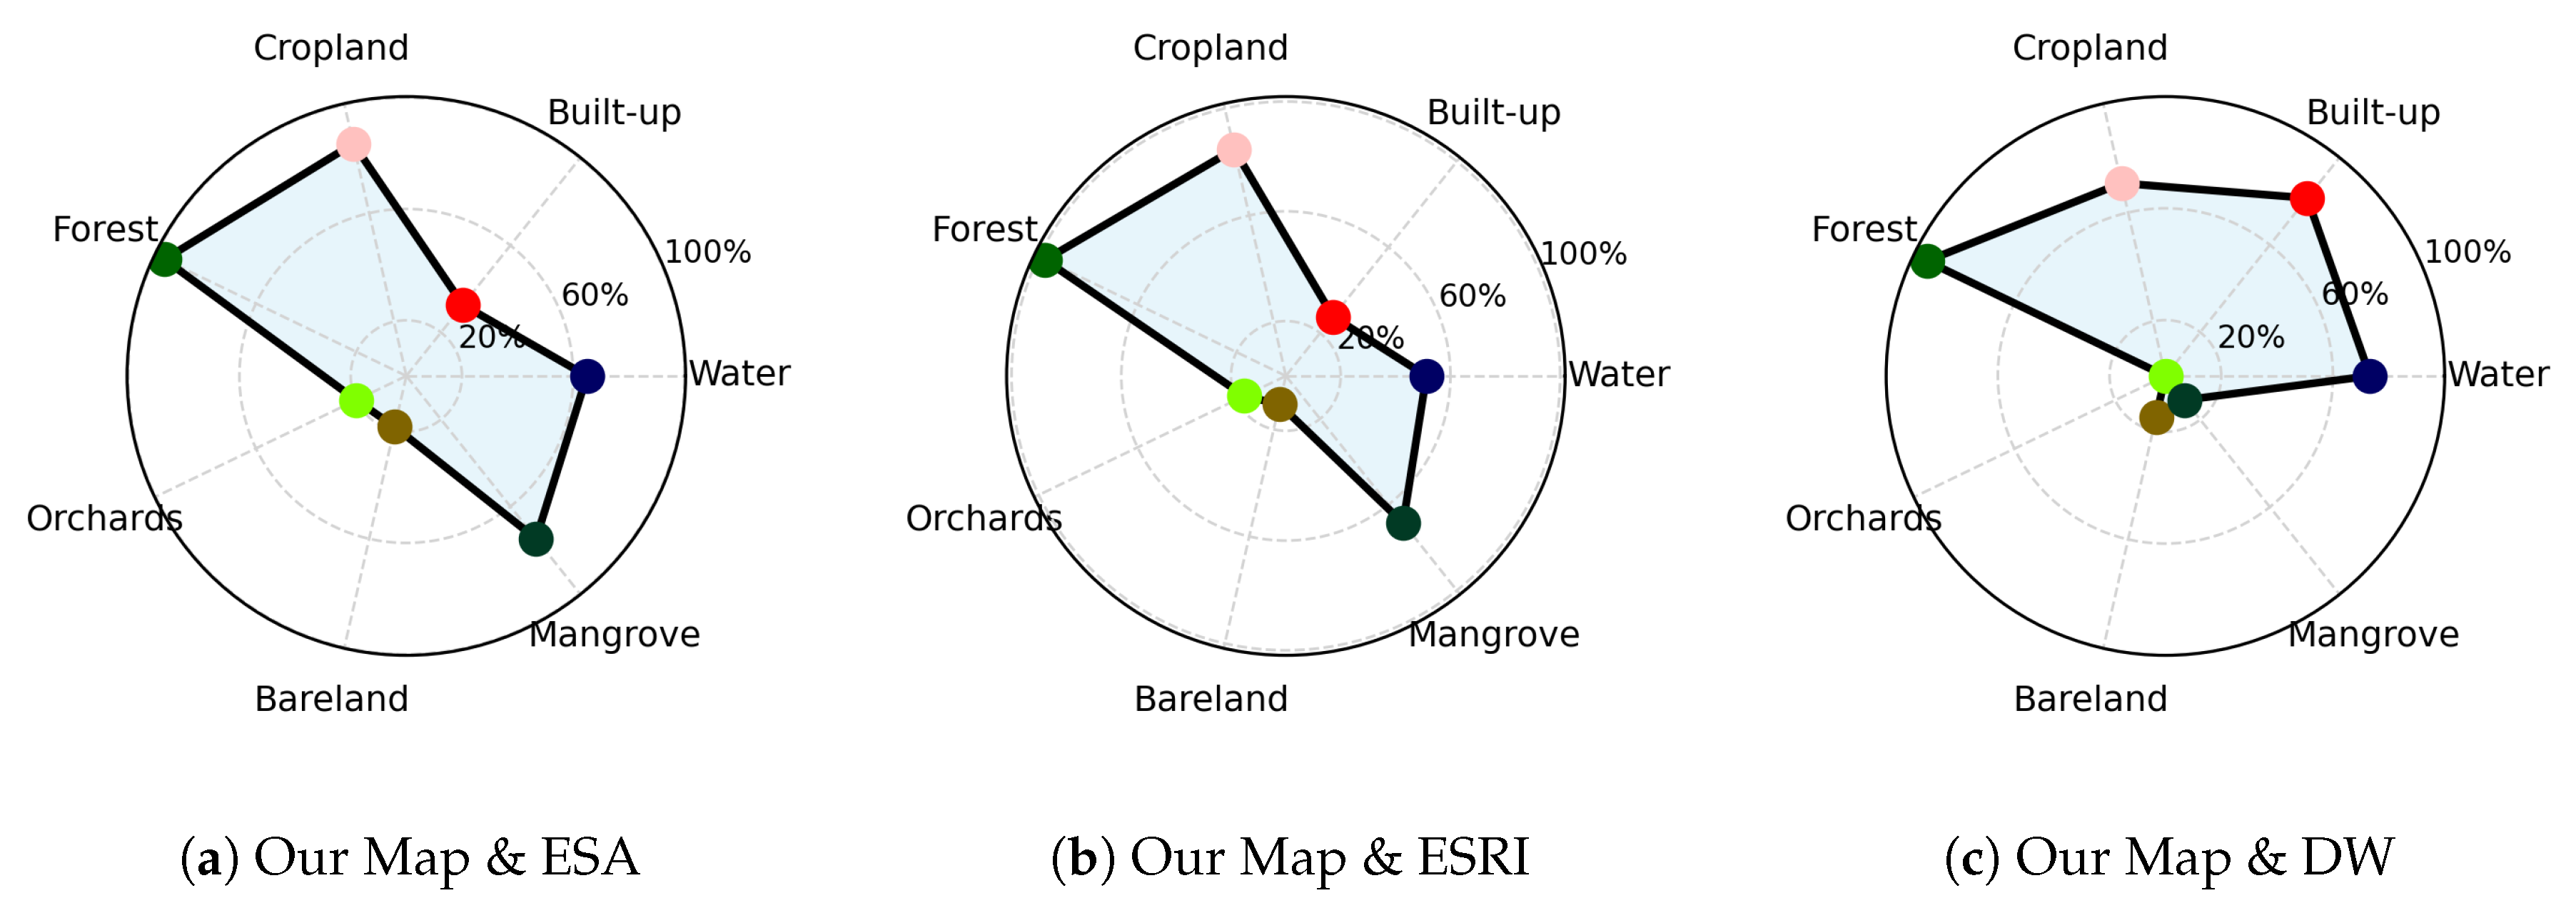
Figure 12.
Percentage change in LULC categories in Bangladesh between 2020 and 2023, including associated uncertainties represented as 95 % confidence intervals.
Figure 12.
Percentage change in LULC categories in Bangladesh between 2020 and 2023, including associated uncertainties represented as 95 % confidence intervals.
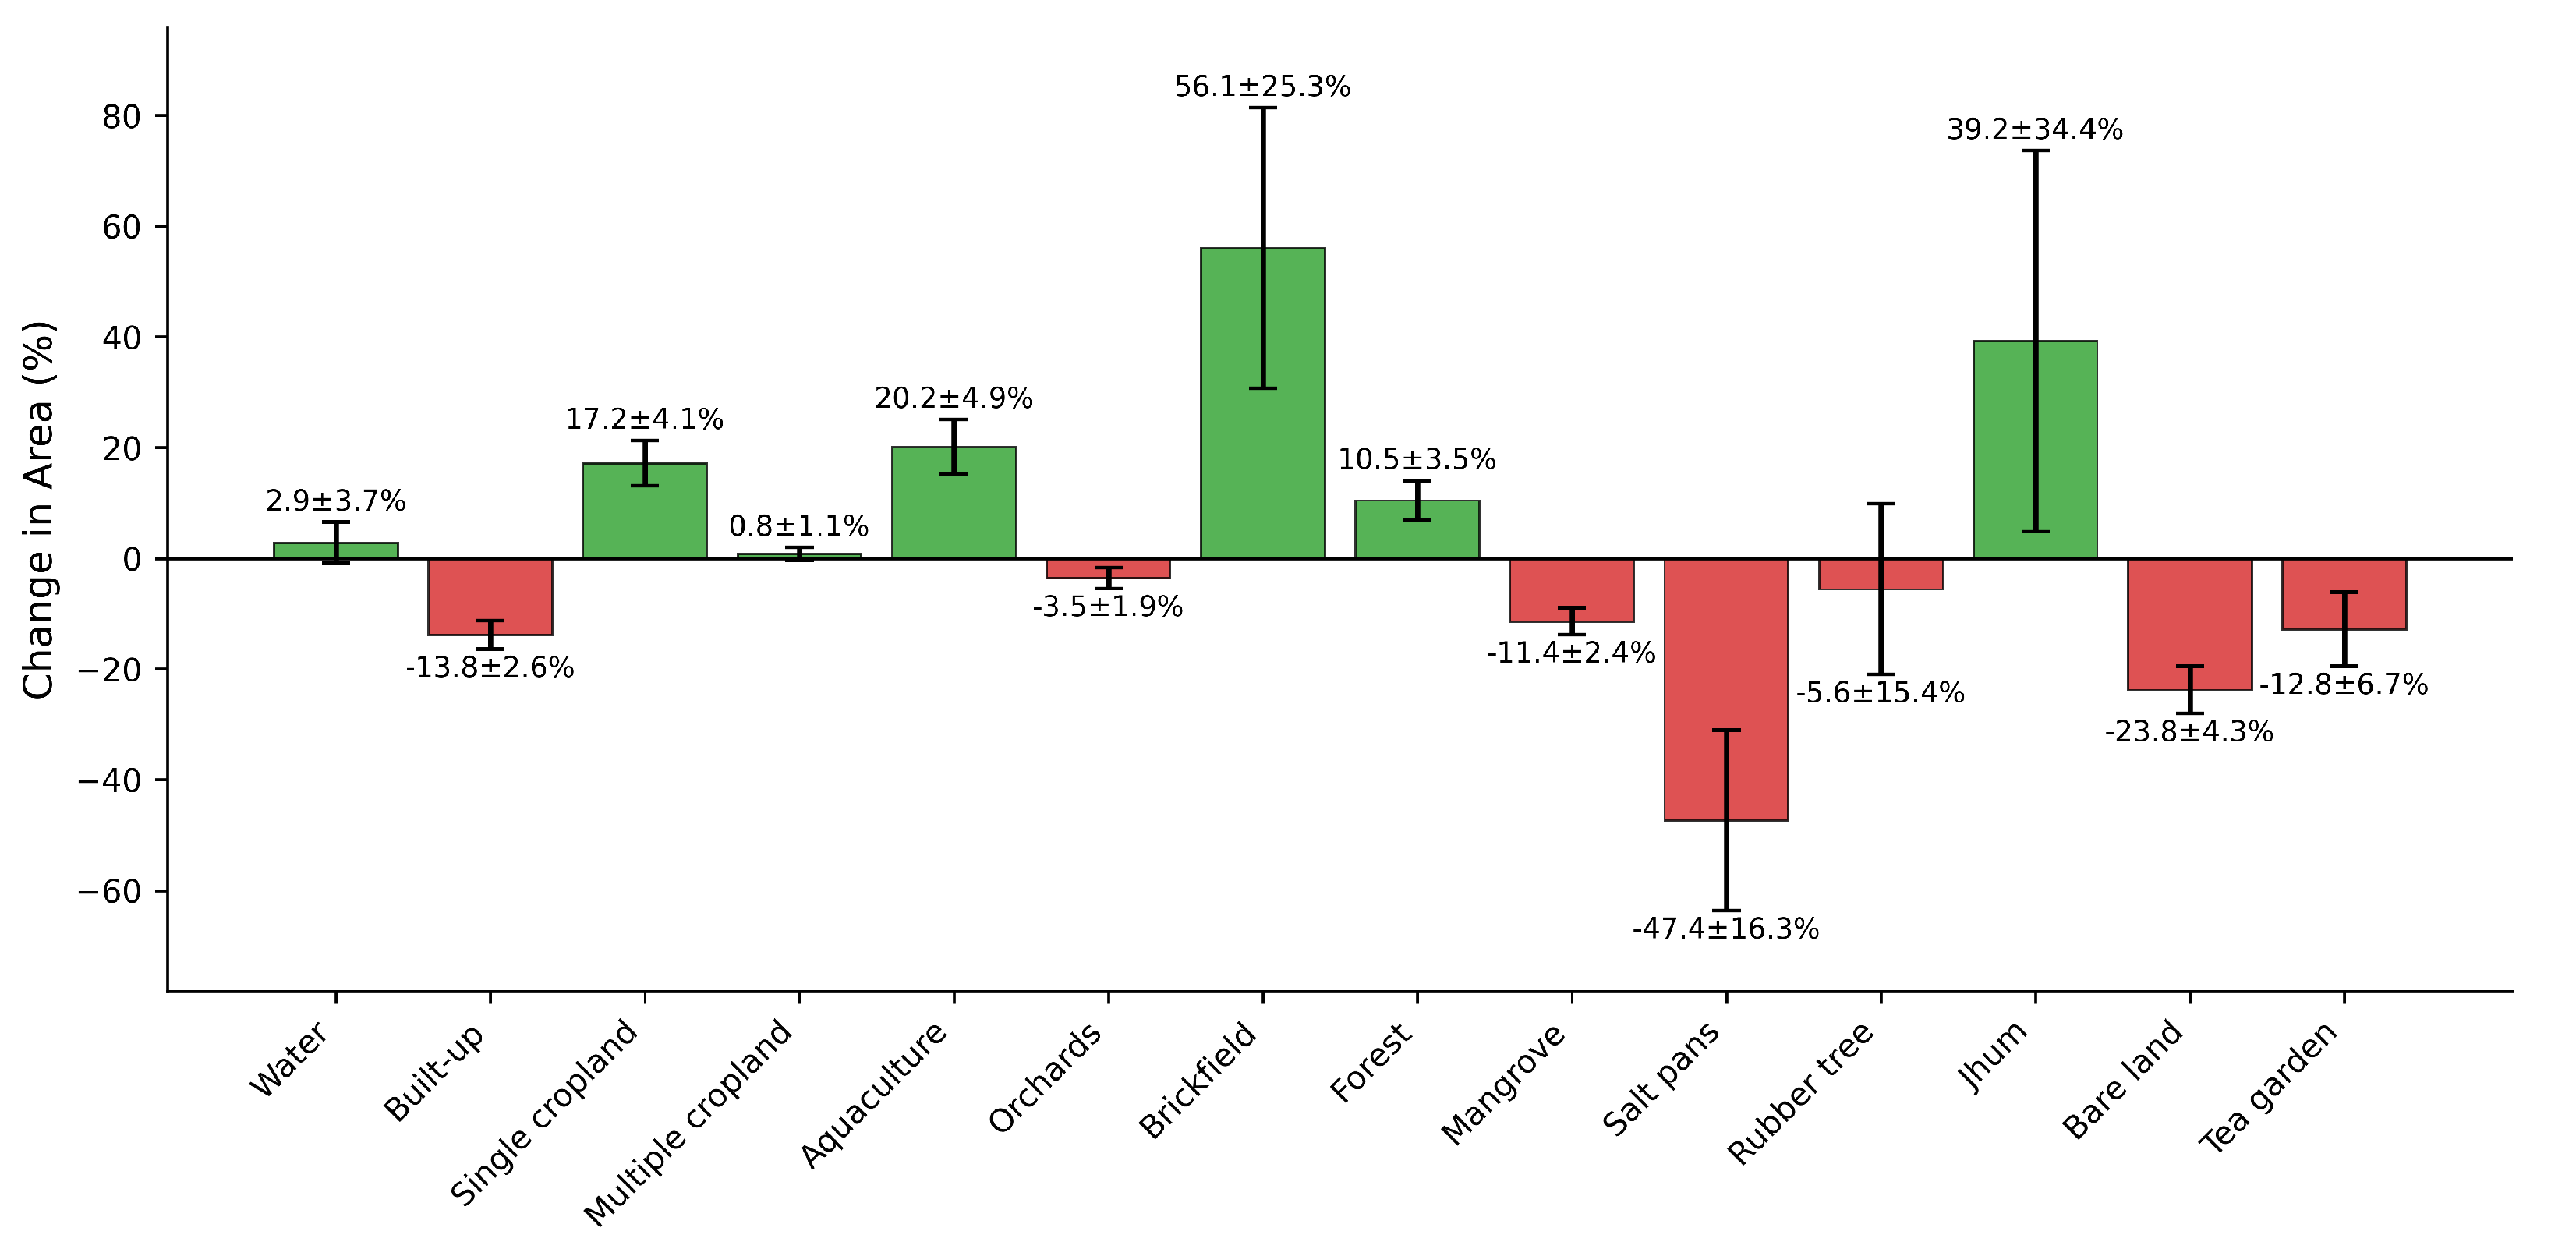
Figure 13.
Spatial distribution of single cropland expansion hotspots in Bangladesh: (a) Khulna Division, primarily representing coastal regions; (b) Sylhet Division, predominantly covering the haor wetland areas.
Figure 13.
Spatial distribution of single cropland expansion hotspots in Bangladesh: (a) Khulna Division, primarily representing coastal regions; (b) Sylhet Division, predominantly covering the haor wetland areas.
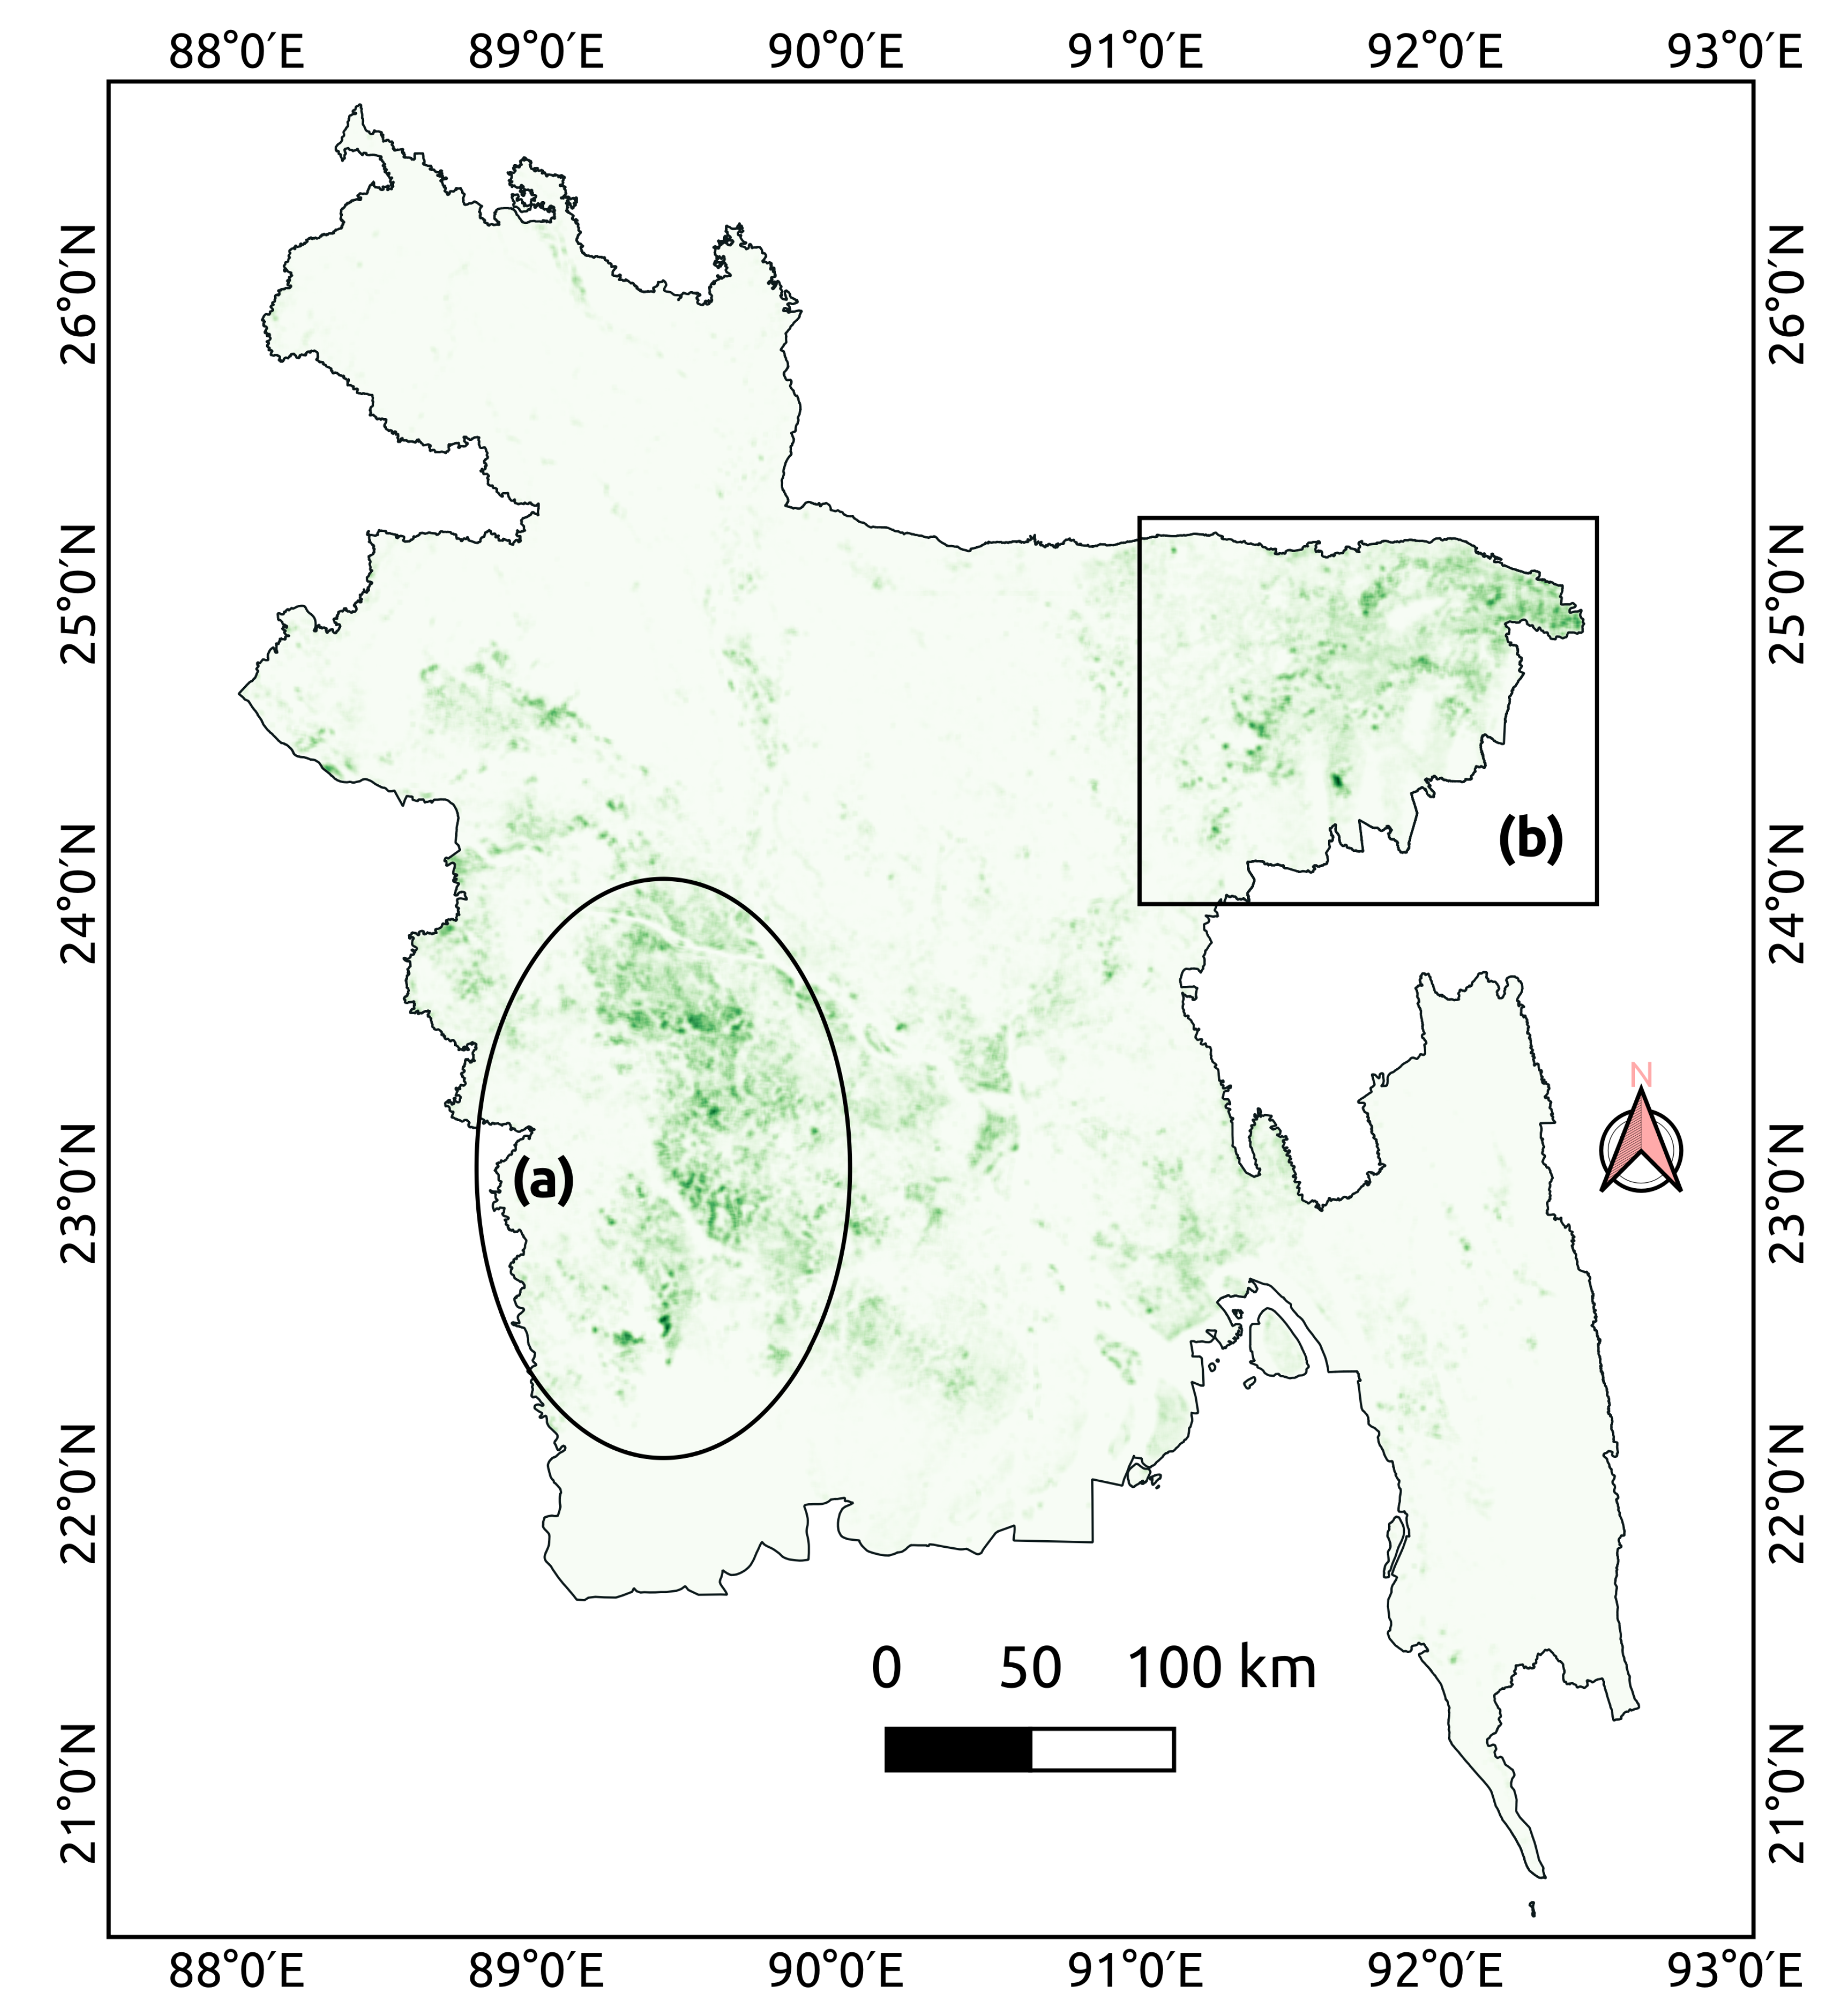
Figure 14.
Spatial distribution of areas where bare land decreased between 2020 and 2023, based on LULC change detection analysis. (b) Purbachal new town development area, (c) Dhaka metropolitan region, (d) Riverine islands (chars) along the Padma River.
Figure 14.
Spatial distribution of areas where bare land decreased between 2020 and 2023, based on LULC change detection analysis. (b) Purbachal new town development area, (c) Dhaka metropolitan region, (d) Riverine islands (chars) along the Padma River.
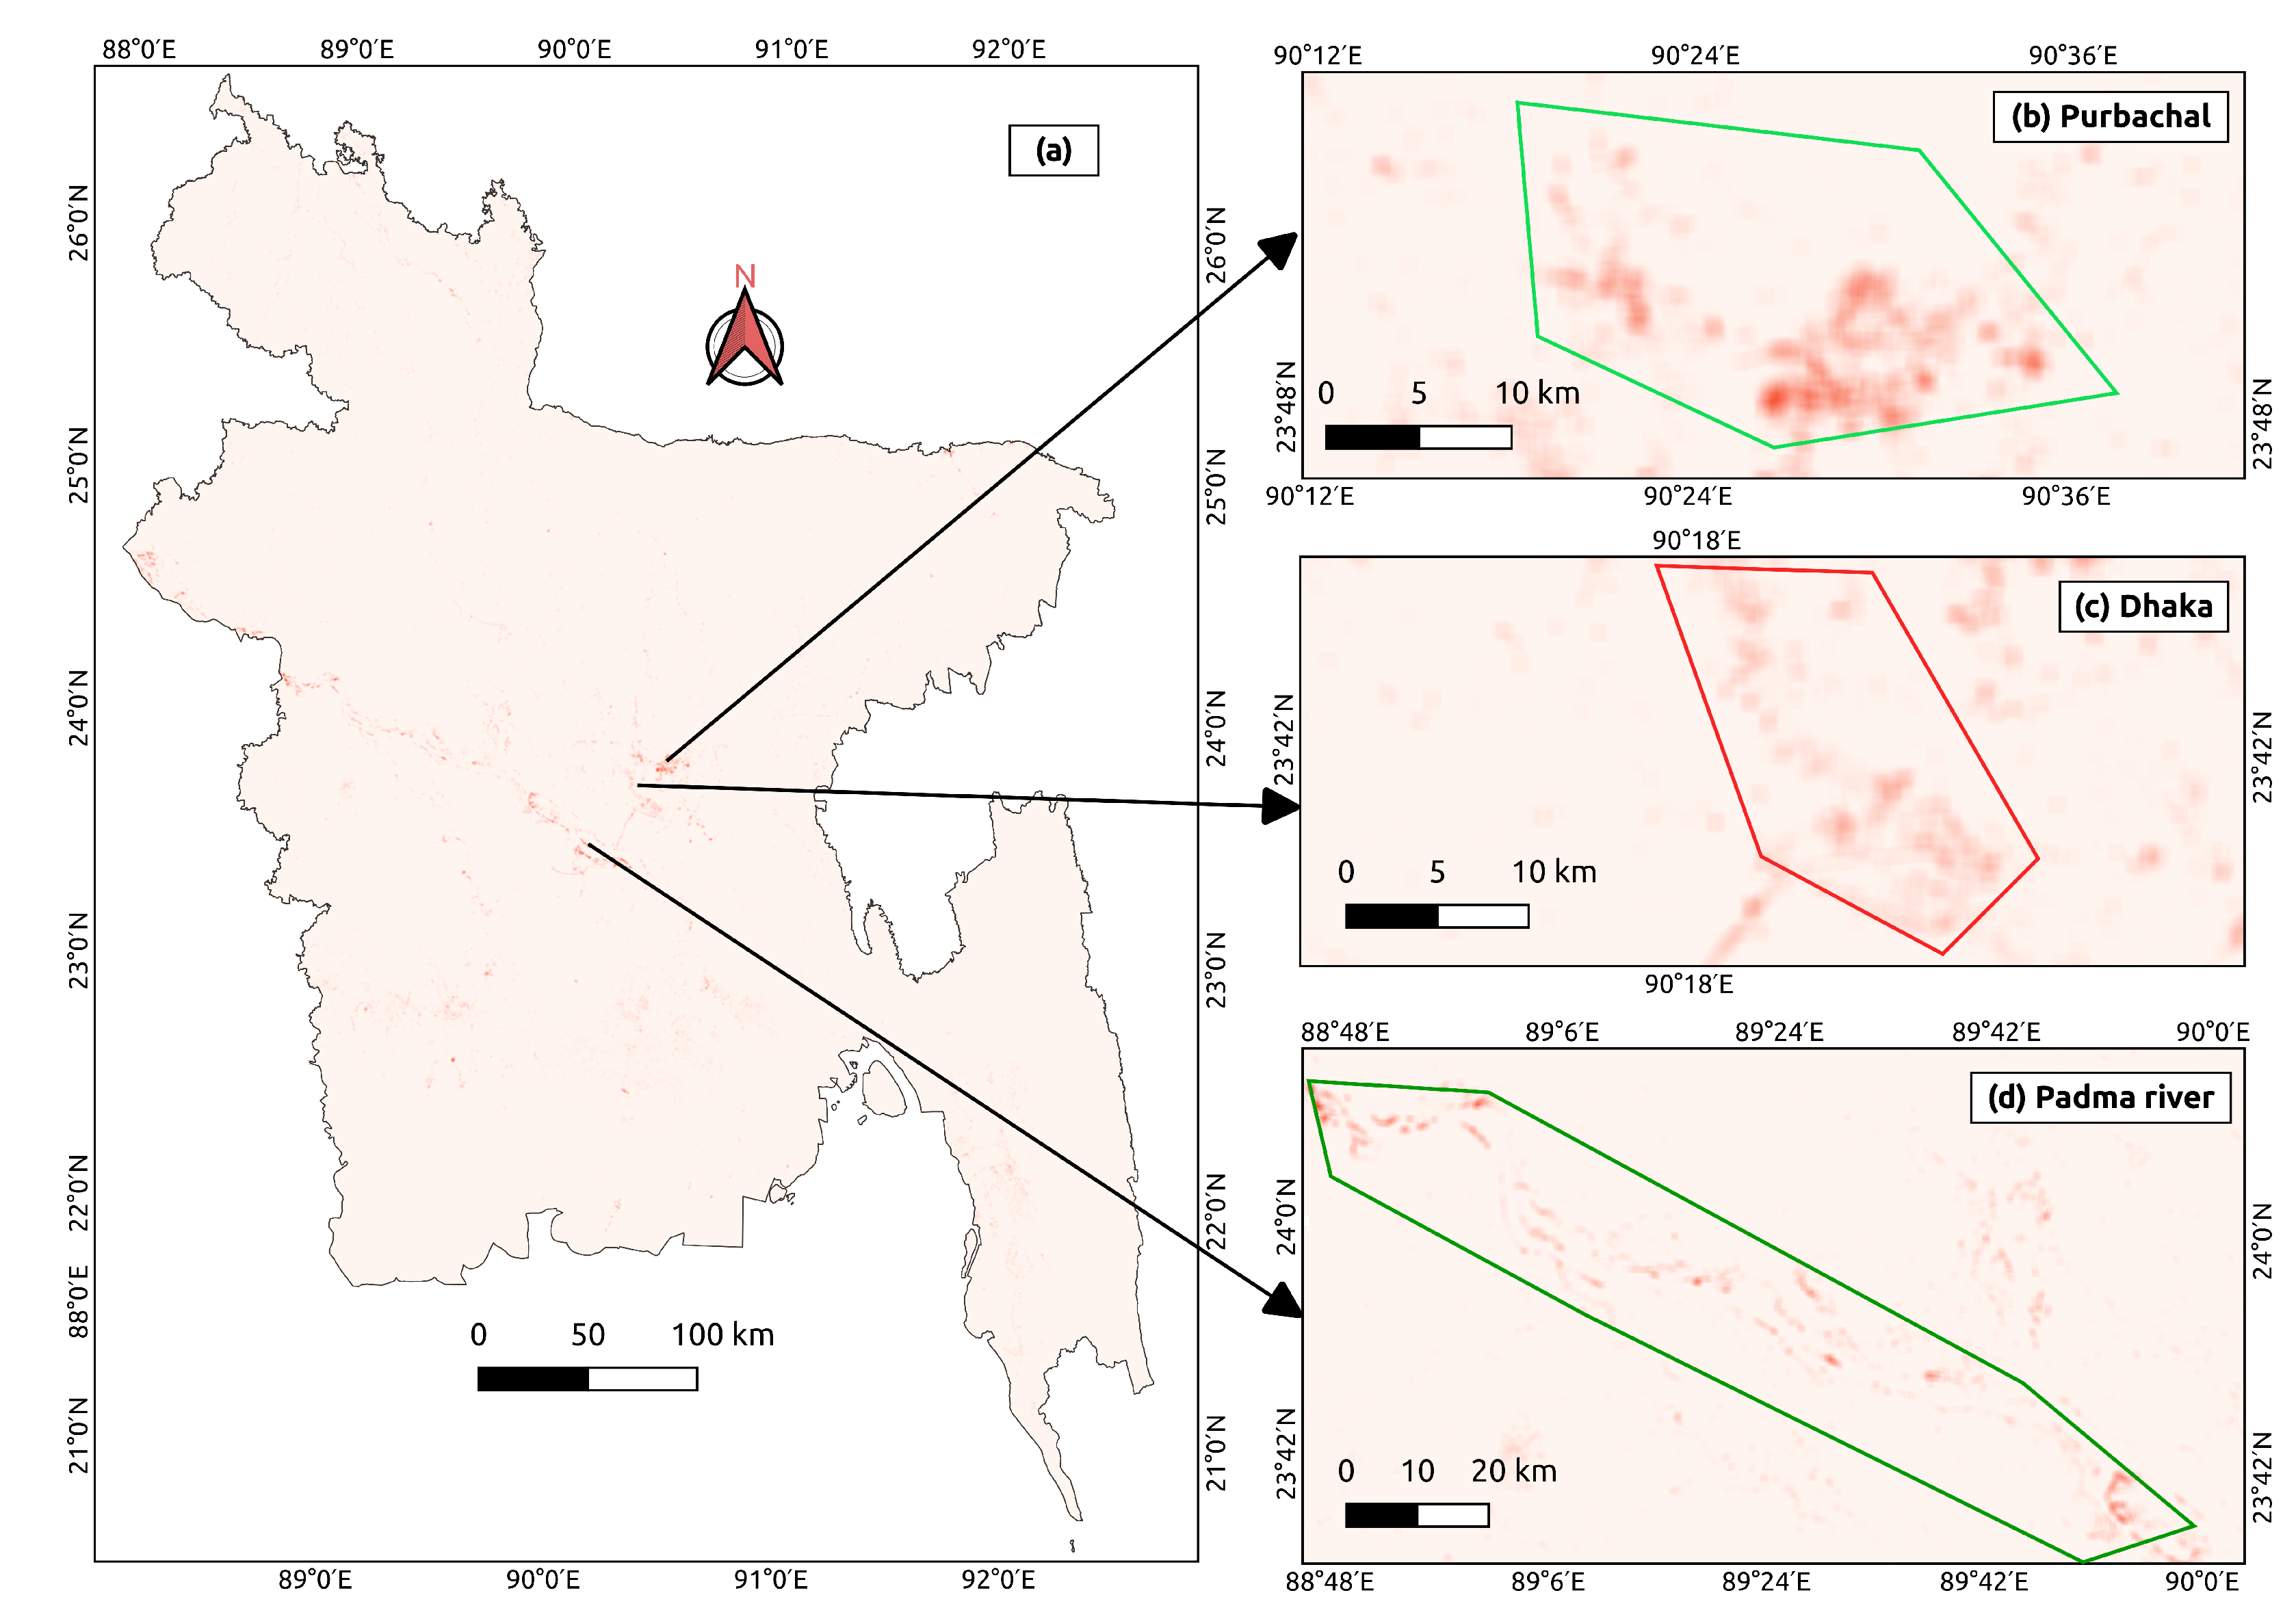
Figure 15.
Spatial distribution of newly established brickfields in 2023, derived from high-resolution LULC classification and change detection analysis.
Figure 15.
Spatial distribution of newly established brickfields in 2023, derived from high-resolution LULC classification and change detection analysis.
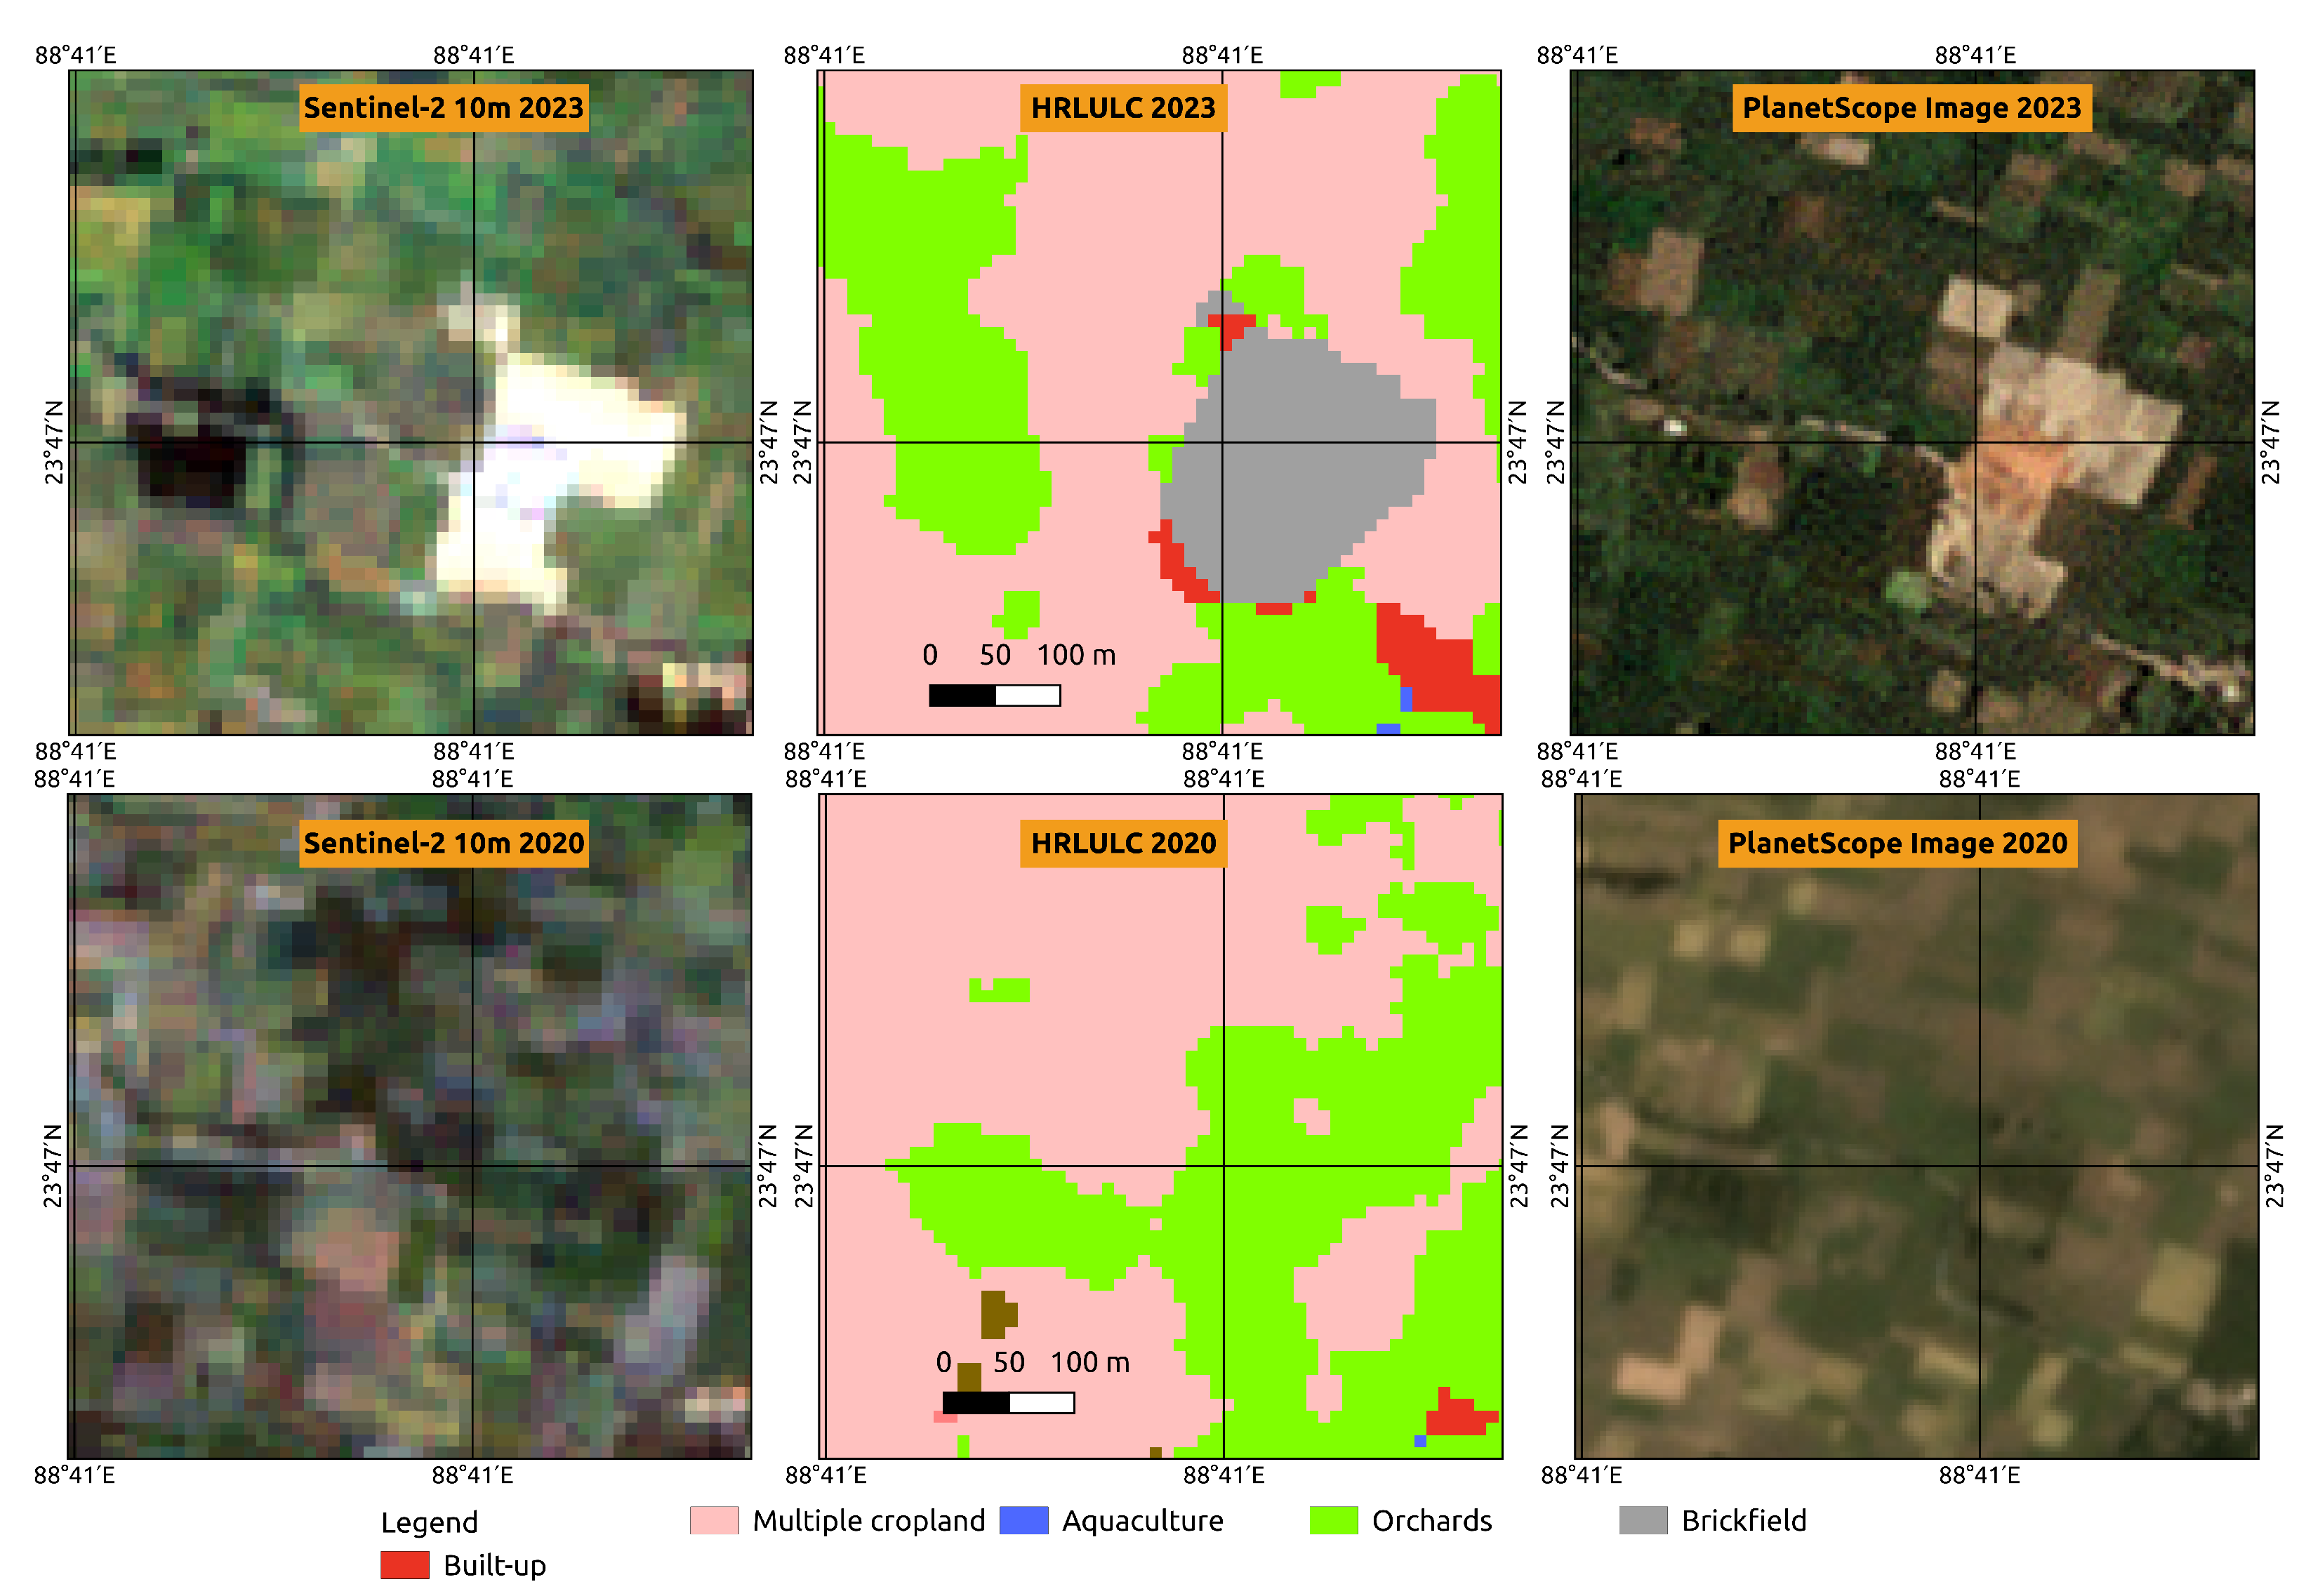
Figure 16.
Changes in LULC across the administrative divisions of Bangladesh between 2020 and 2023. LULC categories are denoted as follows: 1 – Water, 2 – Built-up, 3 – Single cropland, 4 – Multiple cropland, 5 – Aquaculture, 6 – Orchards, 7 – Brickfield, 8 – Forest, 9 – Mangrove, 10 – Salt pans, 11 – Rubber tree, 12 – Jhum, 13 – Bare land, 14 – Tea garden.
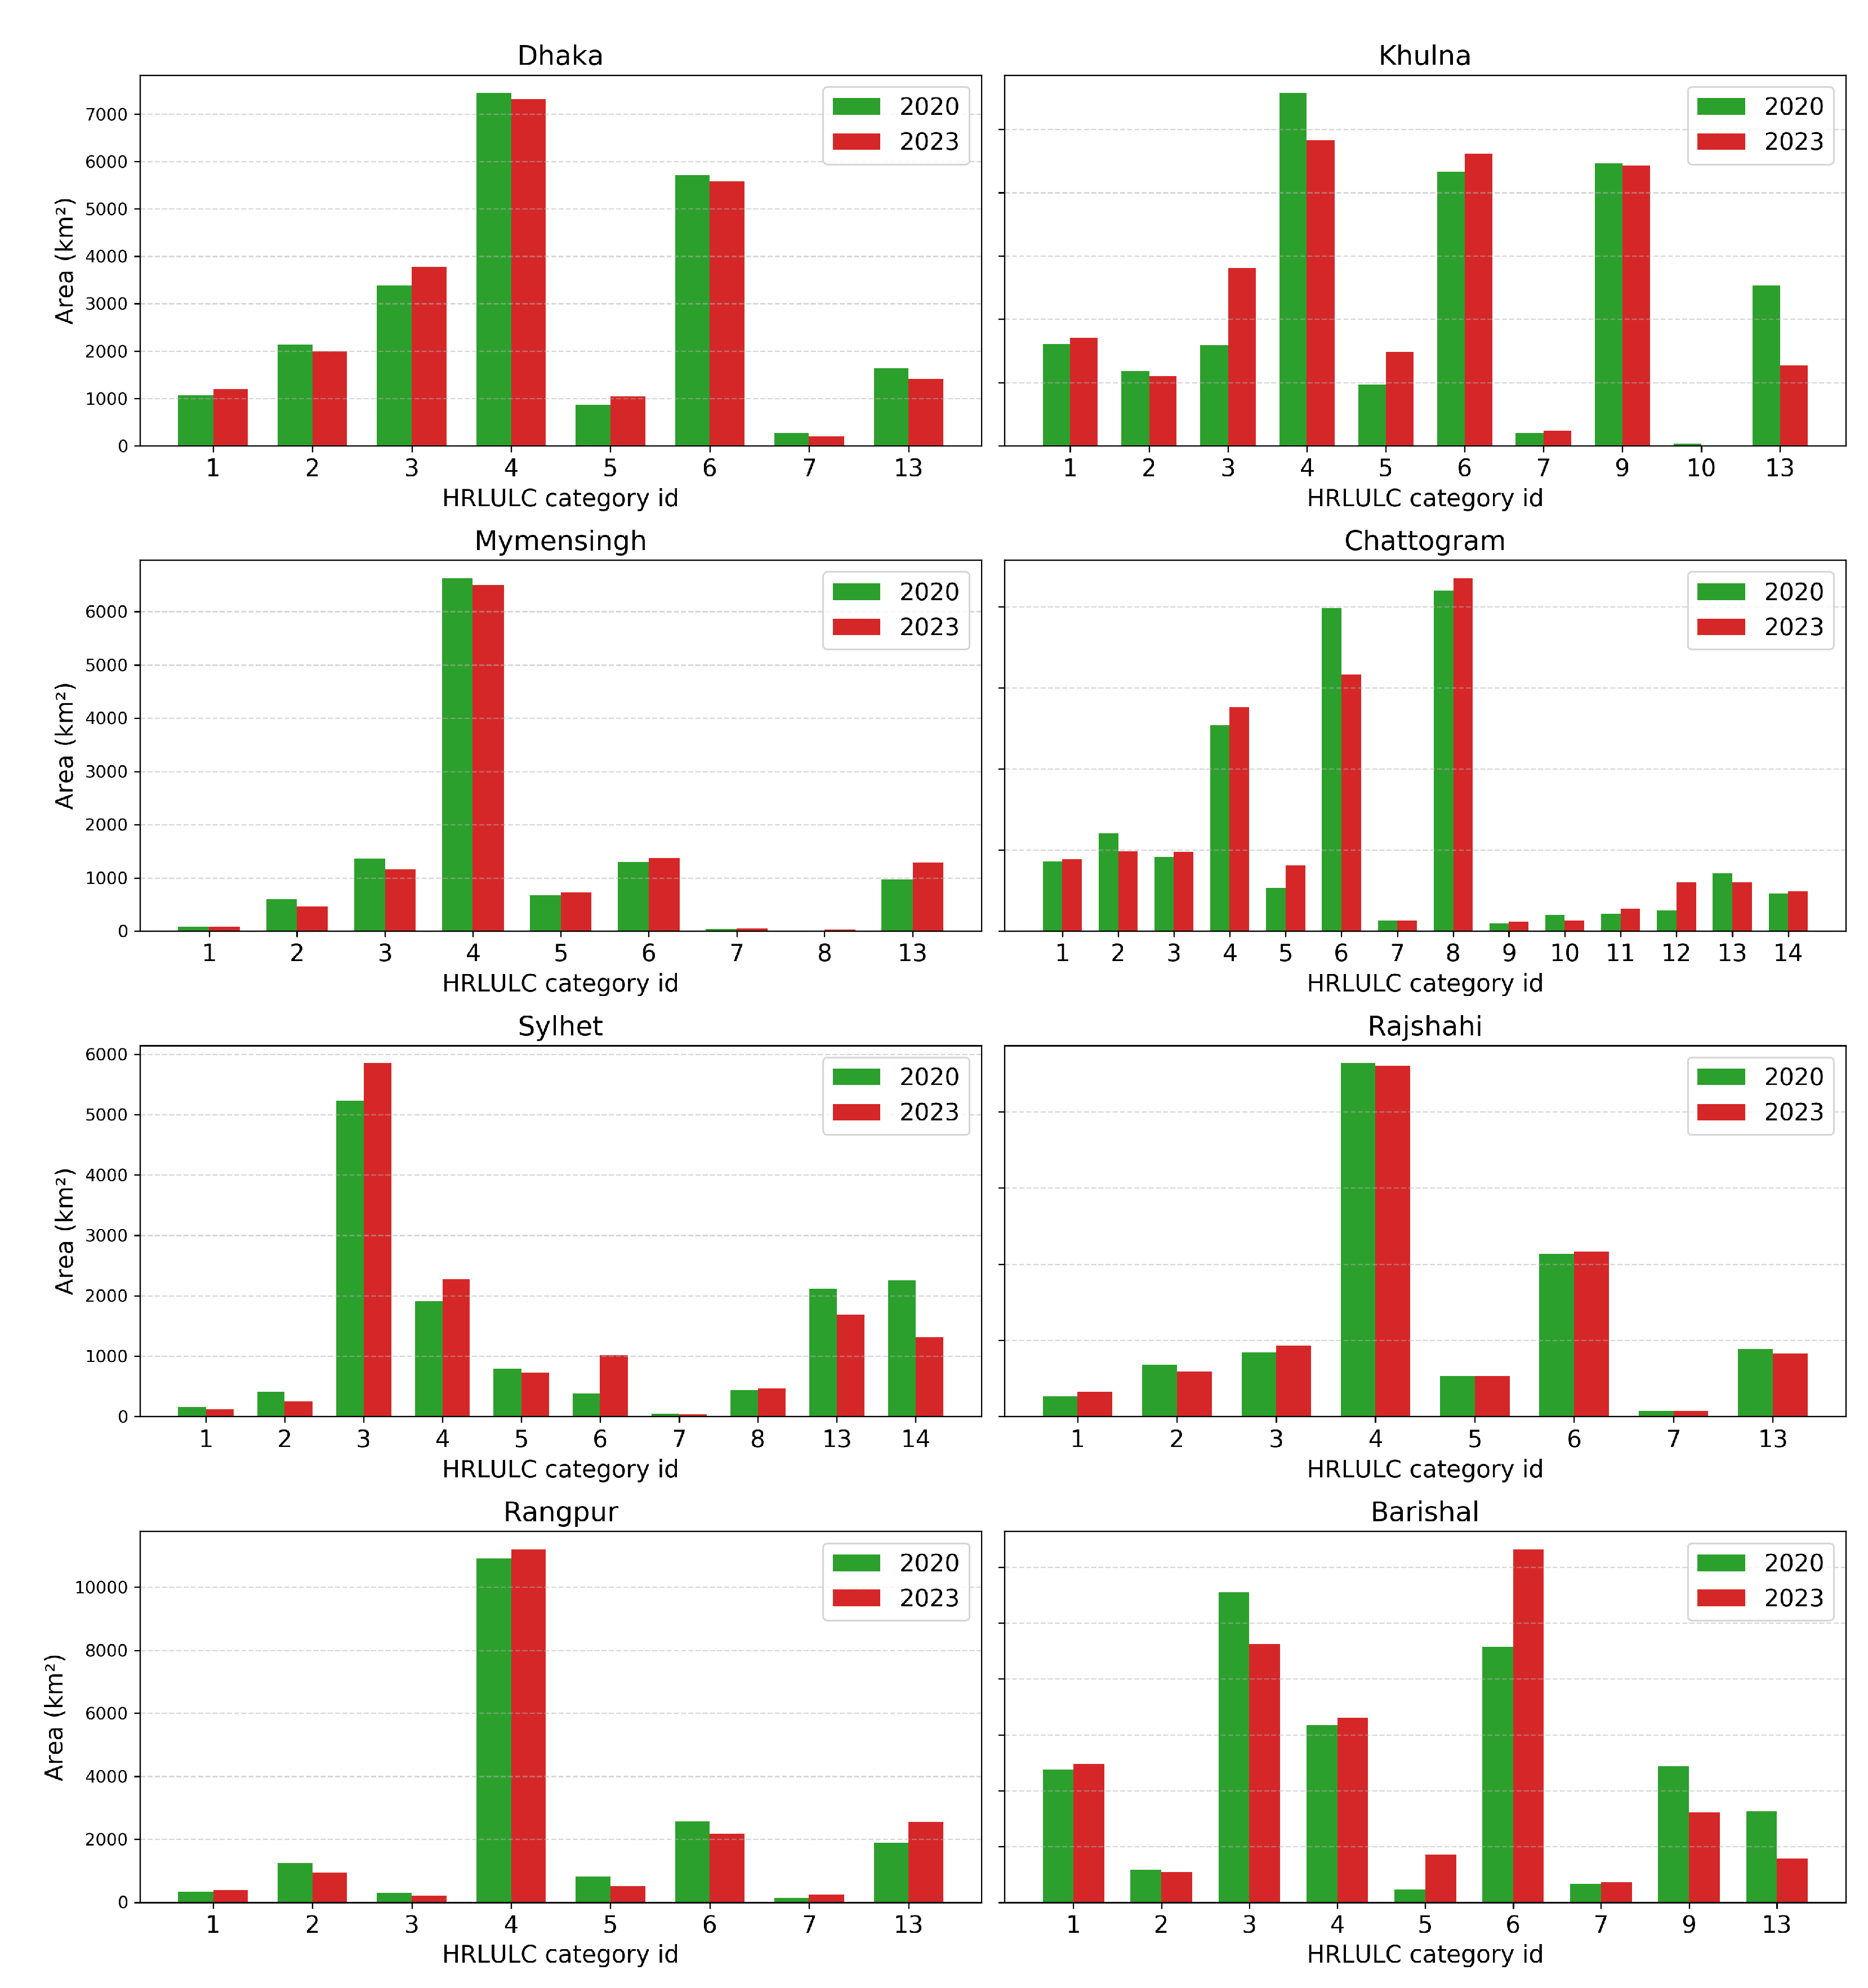
Figure 17.
Sankey diagram showing LULC transitions in Bangladesh between 2020 and 2023, where the width of each link indicates the magnitude of land area changing from one LULC category to another.
Figure 17.
Sankey diagram showing LULC transitions in Bangladesh between 2020 and 2023, where the width of each link indicates the magnitude of land area changing from one LULC category to another.
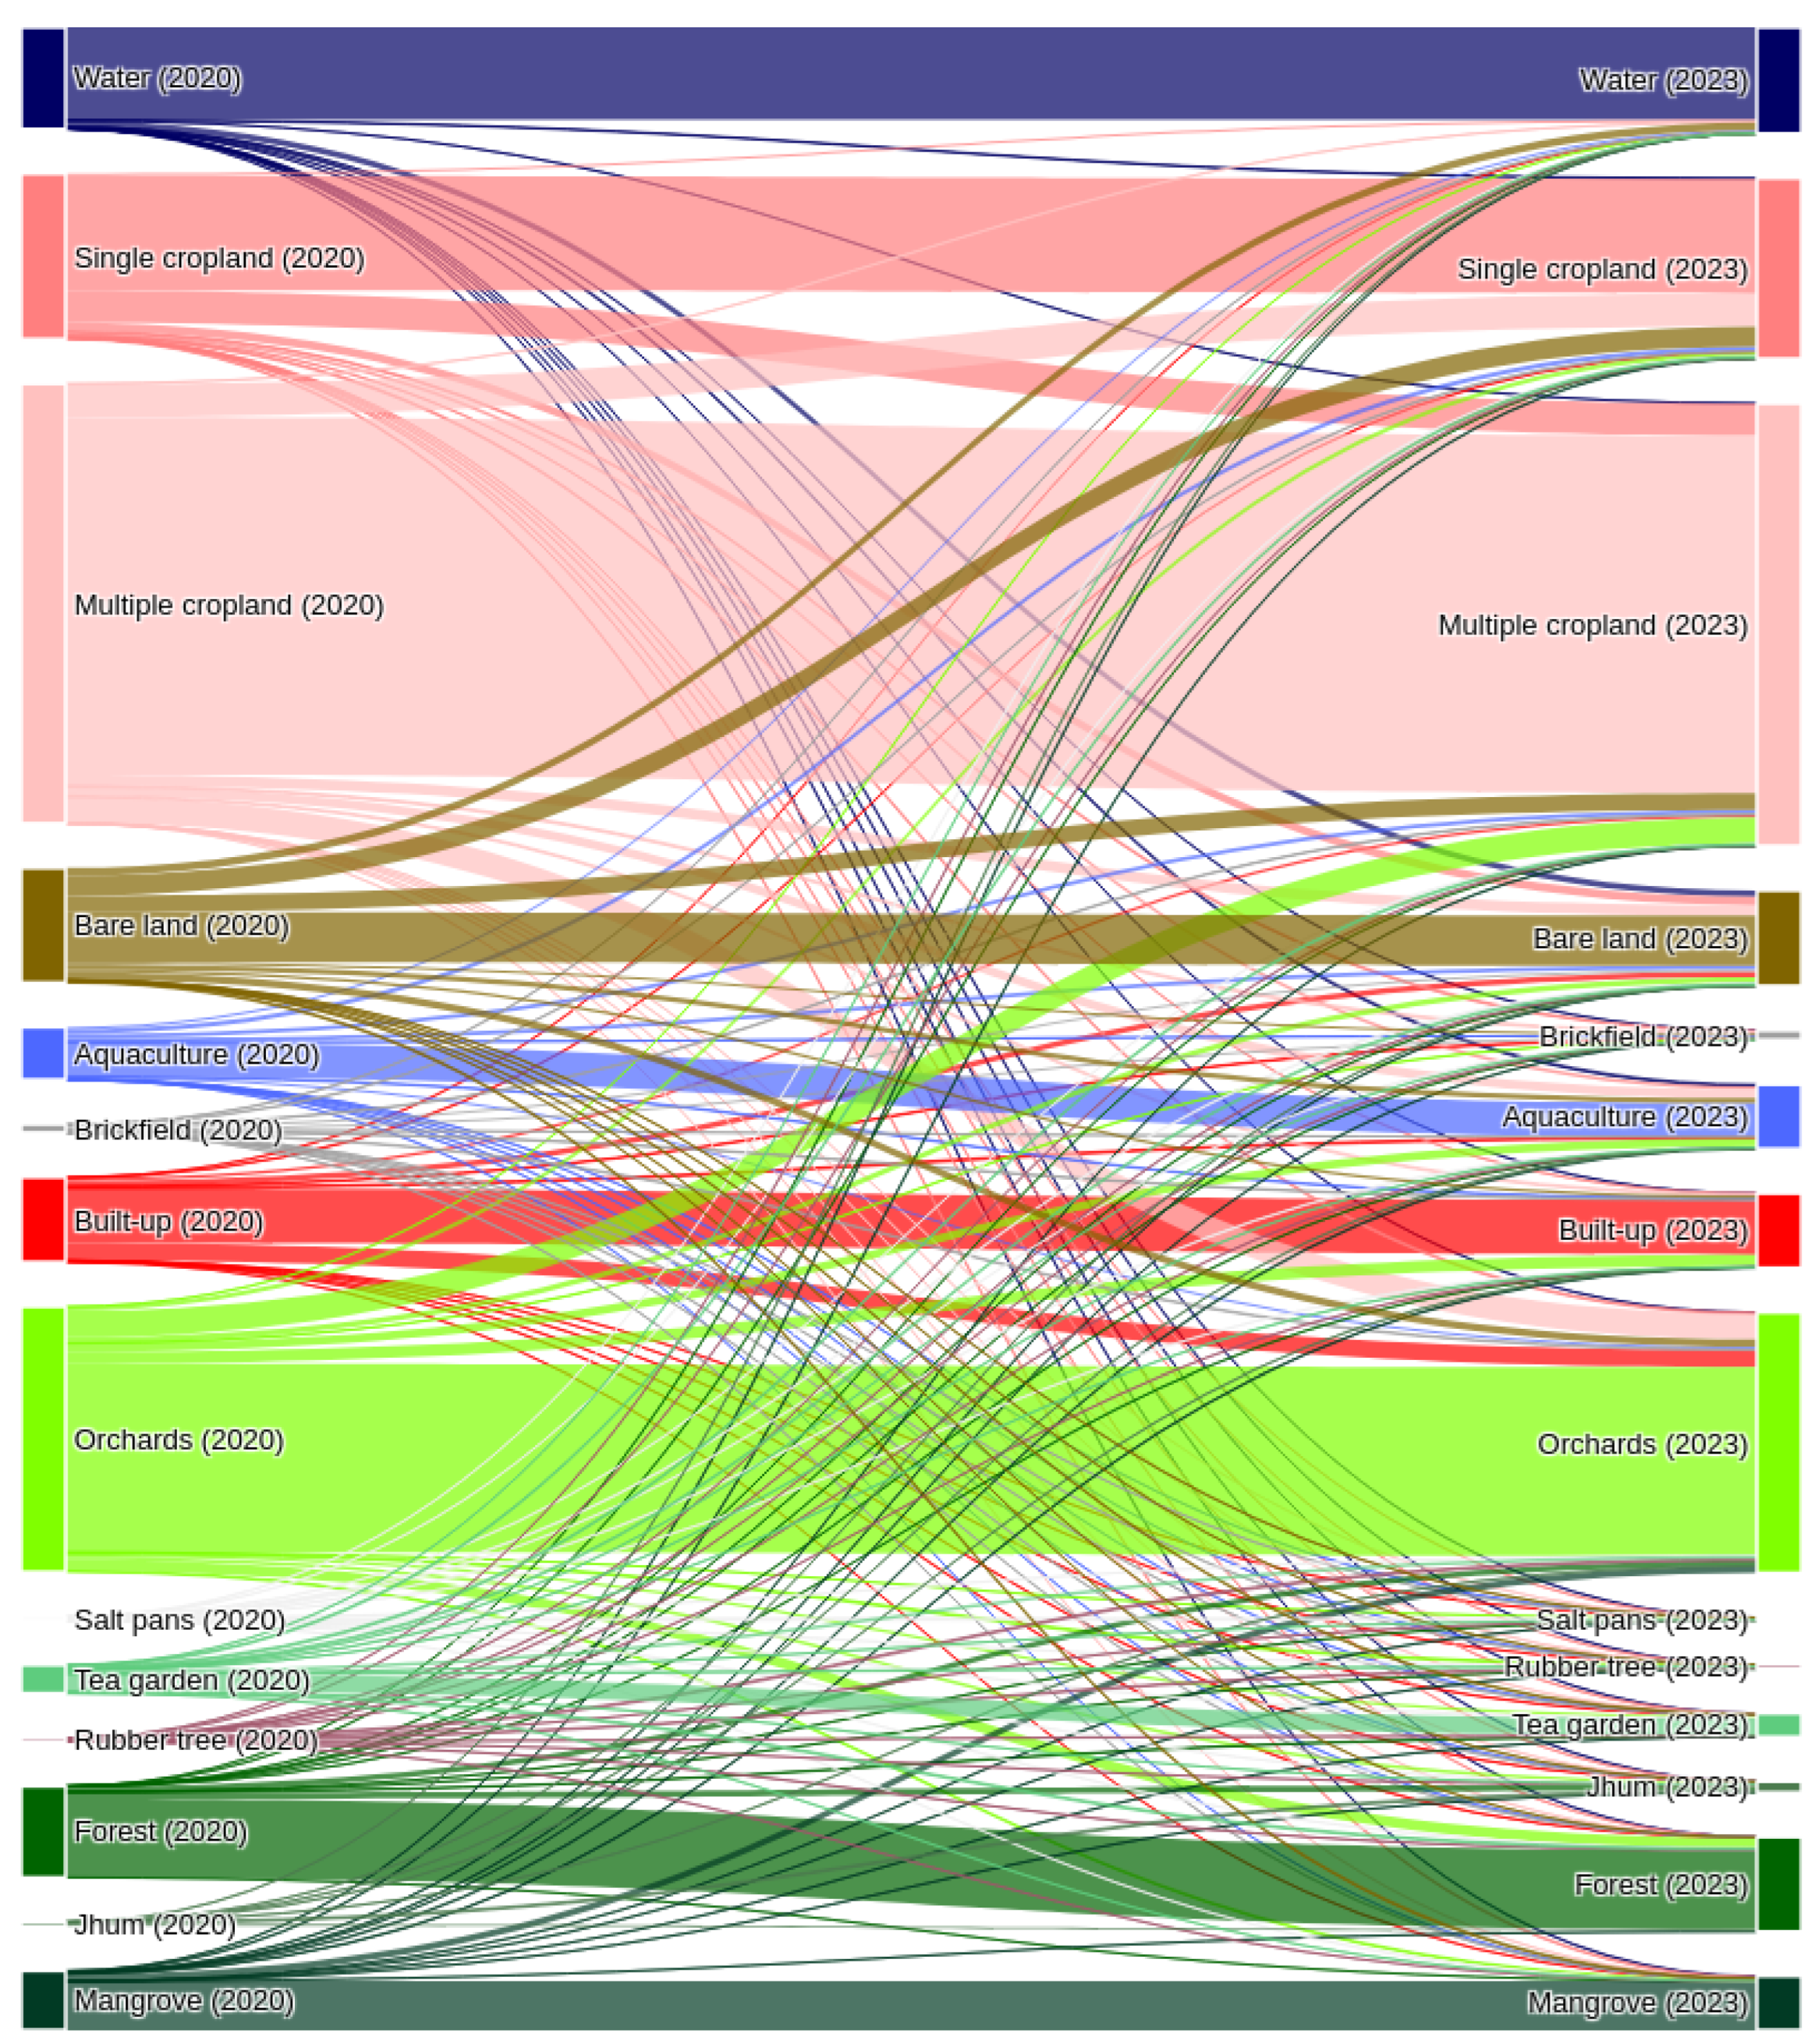

Table 1.
Land use land cover (LULC) category definitions employed in the study, detailing the classifications applied for analysis.
Table 1.
Land use land cover (LULC) category definitions employed in the study, detailing the classifications applied for analysis.
| ID | Color | Category | Definition |
|---|---|---|---|
| 1 | #000064 | Water | Areas covered by open water bodies like rivers, seas, and oceans. |
| 2 | #FF0000 | Built-up | Lands covered by buildings, paved roads, and other man-made infrastructure. |
| 3 | #FF7F7F | Single cropland | Fields where agricultural crops are typically grown once a year. |
| 4 | #FFC1BF | Multiple cropland | Lands used multiple times annually for crop production. |
| 5 | #4D68FF | Aquaculture | Inland ponds used for cultivating aquatic organisms like fish, shrimps, or crabs. |
| 6 | #80FF00 | Orchards | Lands with fruit trees and homestead gardens in rural areas. |
| 7 | #A0A0A0 | Brickfield | Areas where clay is extracted and processed to make bricks. |
| 8 | #006400 | Forest | Lands dominated by woody vegetation, including evergreen and deciduous trees. |
| 9 | #013A24 | Mangrove | Trees and shrubs growing in saline or brackish tidal coastal zones. |
| 10 | #F0F0F0 | Salt pans | Lands which are used for salt production from seawater by solar evaporation. |
| 11 | #A1556B | Rubber tree | Monoculture areas where rubber trees are cultivated for latex production. |
| 12 | #4B7B4E | Jhum | Traditional shifting cultivation involving forest clearing for temporary farming. |
| 13 | #806400 | Bare land | Exposed soil, unpaved road, riverine island, fallow areas and, playgrounds. |
| 14 | #5ECC7E | Tea garden | Areas where tea plant is cultivated, often shaded by large trees. |
Table 2.
Spatial resolution and wavelength information for each spectral band of the Sentinel - 2 Multi-Spectral Instrument (MSI).
Table 2.
Spatial resolution and wavelength information for each spectral band of the Sentinel - 2 Multi-Spectral Instrument (MSI).
| Band | Electromagnetic Region | Center Wavelength [nm] | Spatial Resolution [m] |
|---|---|---|---|
| B2 | Blue | 490 | 10 |
| B3 | Green | 560 | 10 |
| B4 | Red | 665 | 10 |
| B5 | Red Edge 1 | 705 | 20 |
| B6 | Red Edge 2 | 740 | 20 |
| B7 | Red Edge 3 | 783 | 20 |
| B8 | NIR (Near-Infrared) | 833 | 10 |
| B8A | Red Edge 4 | 865 | 20 |
| B11 | SWIR 1 | 1610 | 20 |
| B12 | SWIR 2 | 2190 | 20 |
Table 3.
Bengali seasons alongside their corresponding English names and temporal spans.
| Season No. | Bengali Season | English Season | Season Span |
|---|---|---|---|
| Season-1 | Grisma | Summer | Mid-April to Mid-June |
| Season-2 | Barsa | Rainy | Mid-June to Mid-August |
| Season-3 | Sharat | Autumn | Mid-August to Mid-October |
| Season-4 | Hemanta | Late Autumn | Mid-October to Mid-December |
| Season-5 | Shit | Winter | Mid-December to Mid-February |
| Season-6 | Basanta | Spring | Mid-February to Mid-April |
Table 4.
Indices calculated from different bands of optical and SAR imagery.
| Index | Formula | Reference |
|---|---|---|
| NDVI (Normalized Difference Vegetation Index) | [60] | |
| EVI (Enhanced Vegetation Index) | [61] | |
| GRVI (Green-Red Vegetation Index) | [62] | |
| GSI (Green Soil Index) | [63] | |
| MNDWI (Modified Normalized Difference Water Index) | [64] | |
| BSI (Bare Soil Index) | [65] | |
| NDPI (Normalized Difference Pond Index) | [66] | |
| NDTI (Normalized Difference Tillage Index) | [67] | |
| NDVIre (Red Edge Normalized Difference Vegetation Index) | [68] | |
| RVI (Radar Vegetation Index) | [69] |
Table 5.
Data sources and feature variables employed in the development of HRLULC products for Bangladesh.
Table 5.
Data sources and feature variables employed in the development of HRLULC products for Bangladesh.
| Input Data | Processing Level | Spatial Resolution | Features | Features No. |
|---|---|---|---|---|
| Sentinel-1 | Level 1C | 10 m (SAR) | VH, VV, VH-VV, VH/VV, VH_avg, VV_avg, VH_diss, VV_diss, RVI | 9 |
| Sentinel-2 | Level 2A | 10 & 20 m (Optical) | B2, B3, B4, B5, B6, B7, B8, B8A, B11, B12, NDVI, EVI, GRVI, BSI, NDPI, NDTI, MNDWI, NDVIre, GSI | 19 |
| AW3D30 | Version 2.1 | 30 m | DSM, slope and aspect | 3 |
| PALSAR-2 | Level 2.2 | 25 m (SAR) | HH, HV, LIN | 3 |
| OpenStreetMap | – | – | Distance from road and river | 2 |
| Reference data | – | 10 m | Latitude and longitude | 2 |
Table 6.
Error matrix of sample counts, . Map categories are the rows while the reference categories are the columns.
Table 6.
Error matrix of sample counts, . Map categories are the rows while the reference categories are the columns.
| Class | 1 | 2 | … | q | Total |
|---|---|---|---|---|---|
| 1 | … | ||||
| 2 | … | ||||
| ⋮ | ⋮ | ⋮ | ⋱ | ⋮ | ⋮ |
| q | … | ||||
| Total | … | n |
Table 7.
Error matrix of estimated area proportions, (Equation 6). Map categories are the rows while the reference categories are the columns.
Table 7.
Error matrix of estimated area proportions, (Equation 6). Map categories are the rows while the reference categories are the columns.
| Class | 1 | 2 | … | q | Total |
|---|---|---|---|---|---|
| 1 | … | ||||
| 2 | … | ||||
| ⋮ | ⋮ | ⋮ | ⋱ | ⋮ | ⋮ |
| q | … | ||||
| Total | … | 1 |
Table 8.
Comparison of producer accuracy (PA) and user accuracy (UA) with 95% confidence intervals across different LULC categories for the years 2020 and 2023.
Table 8.
Comparison of producer accuracy (PA) and user accuracy (UA) with 95% confidence intervals across different LULC categories for the years 2020 and 2023.
| LULC Category | 2020 PA (%) ± Error | 2020 UA (%) ± Error | 2023 PA (%) ± Error | 2023 UA (%) ± Error |
|---|---|---|---|---|
| Water | 93.76 ± 1.08 | 94.87 ± 0.97 | 93.03 ± 1.08 | 96.04 ± 0.81 |
| Built-up | 95.21 ± 0.68 | 95.79 ± 0.64 | 92.86 ± 0.81 | 96.25 ± 0.59 |
| Single cropland | 94.96 ± 0.94 | 93.22 ± 1.09 | 95.37 ± 0.86 | 93.76 ± 1.00 |
| Multiple cropland | 98.07 ± 0.35 | 96.65 ± 0.46 | 98.90 ± 0.26 | 98.39 ± 0.32 |
| Aquaculture | 95.41 ± 0.61 | 97.53 ± 0.45 | 98.27 ± 0.36 | 98.27 ± 0.36 |
| Orchards | 96.14 ± 0.53 | 94.89 ± 0.61 | 94.15 ± 0.66 | 94.82 ± 0.62 |
| Brickfield | 95.07 ± 0.58 | 95.70 ± 0.55 | 93.86 ± 0.64 | 91.29 ± 0.76 |
| Forest | 97.15 ± 0.38 | 95.56 ± 0.47 | 97.07 ± 0.37 | 93.93 ± 0.54 |
| Mangrove | 97.52 ± 0.92 | 96.15 ± 1.15 | 97.57 ± 0.92 | 98.94 ± 0.60 |
| Salt pans | 96.74 ± 1.82 | 92.71 ± 2.73 | 96.34 ± 2.09 | 96.34 ± 2.09 |
| Rubber tree | 96.30 ± 1.29 | 96.74 ± 1.21 | 98.88 ± 1.12 | 98.88 ± 1.12 |
| Jhum | 62.44 ± 3.73 | 75.29 ± 3.02 | 50.25 ± 4.23 | 70.92 ± 3.23 |
| Bare land | 85.55 ± 1.09 | 86.38 ± 1.06 | 86.91 ± 0.99 | 86.99 ± 0.98 |
| Tea garden | 94.58 ± 1.24 | 93.45 ± 1.36 | 96.22 ± 1.02 | 95.11 ± 1.16 |
| Average | 92.78 ± 1.37 | 93.21 ± 1.37 | 92.12 ± 1.47 | 93.57 ± 1.26 |
| Overall Accuracy | 94.55% ± 0.41% | 94.32% ± 0.42% | ||
| Kappa Coefficient | 0.939 | 0.936 | ||
Table 9.
Adjusted area and percentage changes in LULC categories in Bangladesh between 2020 and 2023, including associated uncertainties (±) at the 95% confidence interval, calculated following the methodology proposed by Olofsson et al. (2014) [75].
Table 9.
Adjusted area and percentage changes in LULC categories in Bangladesh between 2020 and 2023, including associated uncertainties (±) at the 95% confidence interval, calculated following the methodology proposed by Olofsson et al. (2014) [75].
| LULC Category | 2020 | 2023 | Change over 2020–2023 | |||
|---|---|---|---|---|---|---|
| (km2) | (%) | (km2) | (%) | (km2) | (%) | |
| Water | 10096.6 ± 253.0 | 6.86 ± 0.17 | 10385.4 ± 277.6 | 7.05 ± 0.19 | 288.7 ± 375.6 | 2.86 ± 3.72 |
| Built-up | 8816.6 ± 203.7 | 5.99 ± 0.14 | 7597.2 ± 104.0 | 5.16 ± 0.07 | -1219.4 ± 228.7 | -13.83 ± 2.59 |
| Single cropland | 14827.7 ± 337.9 | 10.07 ± 0.23 | 17383.0 ± 502.6 | 11.81 ± 0.34 | 2555.2 ± 605.7 | 17.23 ± 4.08 |
| Multiple cropland | 45319.9 ± 375.6 | 30.78 ± 0.26 | 45701.5 ± 353.7 | 31.04 ± 0.24 | 381.6 ± 515.9 | 0.84 ± 1.14 |
| Aquaculture | 5732.5 ± 232.6 | 3.89 ± 0.16 | 6888.5 ± 161.5 | 4.68 ± 0.11 | 1156.1 ± 283.2 | 20.17 ± 4.94 |
| Orchards | 26826.5 ± 324.4 | 18.22 ± 0.22 | 25874.3 ± 388.4 | 17.57 ± 0.26 | -952.2 ± 506.0 | -3.55 ± 1.89 |
| Brickfield | 1817.1 ± 223.9 | 1.23 ± 0.15 | 2836.8 ± 402.1 | 1.93 ± 0.27 | 1019.6 ± 460.3 | 56.11 ± 25.33 |
| Forest | 9668.8 ± 199.8 | 6.57 ± 0.14 | 10686.3 ± 273.0 | 7.26 ± 0.19 | 1017.5 ± 338.3 | 10.52 ± 3.50 |
| Mangrove | 6220.5 ± 121.1 | 4.22 ± 0.08 | 5513.6 ± 91.9 | 3.74 ± 0.06 | -706.9 ± 152.0 | -11.36 ± 2.44 |
| Salt pans | 480.8 ± 70.1 | 0.33 ± 0.05 | 253.0 ± 35.2 | 0.17 ± 0.02 | -227.8 ± 78.5 | -47.38 ± 16.32 |
| Rubber tree | 466.1 ± 58.3 | 0.32 ± 0.04 | 440.2 ± 42.1 | 0.30 ± 0.03 | -25.9 ± 72.0 | -5.56 ± 15.44 |
| Jhum | 665.1 ± 150.1 | 0.45 ± 0.10 | 926.1 ± 172.9 | 0.63 ± 0.12 | 261.1 ± 229.0 | 39.25 ± 34.43 |
| Bare land | 13353.3 ± 450.8 | 9.07 ± 0.31 | 10179.6 ± 349.6 | 6.91 ± 0.24 | -3173.8 ± 570.5 | -23.77 ± 4.27 |
| Tea garden | 2950.6 ± 119.0 | 2.00 ± 0.08 | 2571.7 ± 156.7 | 1.75 ± 0.11 | -378.9 ± 196.8 | -12.84 ± 6.67 |
Disclaimer/Publisher’s Note: The statements, opinions and data contained in all publications are solely those of the individual author(s) and contributor(s) and not of MDPI and/or the editor(s). MDPI and/or the editor(s) disclaim responsibility for any injury to people or property resulting from any ideas, methods, instructions or products referred to in the content. |
© 2025 by the authors. Licensee MDPI, Basel, Switzerland. This article is an open access article distributed under the terms and conditions of the Creative Commons Attribution (CC BY) license (http://creativecommons.org/licenses/by/4.0/).
Copyright: This open access article is published under a Creative Commons CC BY 4.0 license, which permit the free download, distribution, and reuse, provided that the author and preprint are cited in any reuse.


