
Submitted:
01 April 2024
Posted:
02 April 2024
You are already at the latest version
Abstract
This paper presents an acoustic emission (AE) detection method for refined oil storage tanks, enabling online detection of corrosion points and microleakage in the tank floor. The method utilizes an explosion-proof acoustic emission instrument to detect the floor of a refined oil storage tank. By calculating the time difference between the defective acoustic signal and the speed of acoustic wave transmission, a mathematical model is constructed to analyze the detected signals. A technical scheme for acoustic emission detection in storage tanks is designed, and the instru-ment is used to carry out acoustic emission testing on the product oil storage tank floor. Based on these test results, location analysis of acoustic emission sources is conducted on the bottom plate of the tank, evaluating its corrosion condition accurately. The consistency between the evaluation and subsequent open tank tests confirms that using acoustic emission technology effectively captures corrosion signals from product oil storage tank bottoms. Consequently, it significantly improves inspection efficiency by avoiding unnecessary tank-opening operations. Combining this method with open tank inspection operations such as the leakage magnetic method, one can fully grasp the status of the refined oil storage tanks.
Keywords:
Acoustic emission technology
; Oil storage tank
; Corrosion
; Detection
1. Introduction
Oil storage tanks are one of the most crucial pieces of petrochemical equipment widely used worldwide, and the most common oil storage tanks are metal ones. However, metal oil storage tanks are characterized by large volume, centralized placement, inflammability, explosiveness, and detection difficulties. It is without any doubt that fire and explosions caused by oil leakage will result in huge losses of life and property, as well as serious environmental pollution [1,2,3]. Storage tank corrosion primarily includes external corrosion and internal corrosion: the former arises from the aging of surface anti-corrosion layers and the corrosive interaction between the tank floor and base layer; the latter encompasses oil and gas-induced corrosion on top of the tank, corrosion within the gas-liquid fluctuation area, and floor-related corrosive processes. Detecting external corrosion is relatively straightforward with elimination measures available accordingly, while directly identifying internal corrosion, particularly in harmful bottom-level corrosion in oil storage tanks faces tough challenges. Routine inspection by opening tanks is considered as a direct and effective approach, but it also shows certain blindness that approximately half of opened oil storage tanks are found to lack obvious defects. Furthermore, it brings about shutdowns, emptying procedures, replacements or cleanings, resulting in substantial economic losses and potential environmental pollution [4,5].
As a superior alternative technology, Acoustic Emission (AE) technology can be used for real-time inspection of tank floor without emptying the tanks. Compared with ordinary storage tanks, refined oil storage tanks meet extremely strict requirements on the explosion-proof performance of AE instruments. However, fewer AE instruments with explosion-proof performance have been reported so far [6,7,8]. In this paper, the working principle of an explosion-proof AE instrument is introduced. Using this AE instrument, 10 oil storage tanks are tested and 4 of them are opened and re-checked. The data were analyzed to derive the location of the acoustic signals of tank floor corrosion and to assess the integrity of the tank floor.
2. Mathematical Model for Acoustic Emission Detection in Tanks
2.1. Principle of Acoustic Emission Detection
Acoustic emission refers to elastic strain waves generated by sudden release of strain energy inside an object [9,10,11,12]. Slight deformation occurs in corroded area on the bottom plate of metal storage tanks under load pressure, leading to cracking in corrosion layers and generation of acoustic emission signals. Additionally, eddy currents owing to leakage from oil tank’s bottom plate also produce acoustic emissions [13,14,15,16,17]. When using AE technology for detecting oil tanks, a predetermined number of piezoelectric ceramic sensors are placed at a uniform angle along with a circumferential direction around a predetermined height (typically 20-40 cm) from the tank’s bottom wall surface to capture signals originating from its bottom plate, as schematically shown in Figure 1. To identify both quantity and location information about these sources on tank’s bottom plate, sensors received signals into dedicated equipment responsible for acquiring such signals.
2.2. Mathematical Modeling of Acoustic Emission Detection
The bottom of an oil tank can be regarded as a two-dimensional circular plate, as shown in Figure 2 [19,20,21,22]. When the stress on the bottom of the oil tank changes, the measured defect site will generate continuous or discontinuous AE signals. The location information of AE signals can be calculated by obtaining the distance and time of that from three or more acoustic emission sensors. Assuming the signal transmitting from the defect position reach the sensor after , and the transmission speed of sound in the tank bottom plate is , the following formula can be obtained:
where is the distance between the sensor and the signal source. When the transmission speed and sound difference are known, the distance between the sensor position information and the acoustic emission signal source can be obtained. If the AE signal received by the sensor is , the corresponding mathematical formula is as follows:
where is the acoustic emission signal source AE, is the attenuation coefficient, and is the time difference between different sensors. Within the corresponding , the relationship between signal source information obtained by multiple sensors is as follows:
Based on the formula (3), it can be obtained that the relationship between different signal sources can be obtained through the delay time, so the peak point of the signal represents the maximum correlation position between different signal sources, and the position information on the plane of the oil tank can be calculated through the signals of at least three groups of acoustic emission sources.
3. Design of acoustic emission detection for tank bottoms
This section may be divided by subheadings. It should provide a concise and precise description of the experimental results, their interpretation, as well as the experimental conclusions that can be drawn.
3.1. Tank Inspection Procedure
The procedures for utilizing an AE instrument to detect oil storage tanks are as follows:
- (1)
- Closing all valves and pressurize the flushing fluid in the oil tank to a static pressure ranging from 60% to 80% below the safe liquid level.
- (2)
- Arranging piezoelectric ceramic sensors at a uniform angle along the outer wall of the oil tank at a distance of about 0.2 meters above the bottom plate.
- (3)
- Conducting a pressure-holding test on the oil tank lasting between one and four hours.
- (4)
- Performing a data processing and analysis on signals captured by the AE instruments to determine both the number of AE sources and the position of the oil tank’s bottom plate. The safety assessment and judgment of the tank are based on its corrosion classification standard.
3.2. Evaluation of Oil Tank Corrosion Classification
Time difference positioning analysis is conducted on acoustic emission sources originating from different areas of interest within a square or circular evaluation area, which should not exceed more than 10% of its diameter. The number of positioning events (E) per hour is calculated after conducting local amplification analysis on all concentrated positioning groups within this evaluation area. Based on time difference positioning results and the criterion AE value(C), each evaluation area’s effective acoustic emission source level is classified accordingly [27,28].

Table 1.
Classification of acoustic emission sources based on time difference location analysis.
| The source level | The number of positioning events E per hour in the evaluation zone | Evaluation of the evaluation area’s corrosion state |
|---|---|---|
| Ⅰ | E≤C | No signs of local corrosion |
| Ⅱ | C<E≤10C | Slight signs of localized corrosion |
| Ⅲ | 10C<E≤100C | Obvious signs of localized corrosion |
| Ⅳ | 100C<E≤1000C | Minor indications of severe localized corrosion |
| Ⅴ | E>1000C | Signs of severe localized corrosion |
4. Experiments of Acoustic Emission Testing Of Tank Bottoms
4.1. The Components of Acoustic Emission Instrument
An explosion-proof acoustic emission instrument used in this experiment is shown in Figure 3. The instrument incorporates an independent signal acquisition channel, signal synchronization channel, high-speed acquisition card, lithium battery pack, signal amplifier, data processing system, and cache system. Its shell is constructed using explosion-proof metal material while being equipped with developed signal processing software.
A megahertz crystal oscillator is equipped on each acoustic emission instrument to provide a high-frequency synchronous clock signal. In the detection process, any acoustic emission instrument is designated as the main equipment, and the synchronous cable connecting the main equipment controls the synchronous sampling clock of other acoustic emission instruments to ensure the synchronization of each acoustic emission instrument when collecting data. In the process of signal acquisition by the system, the AE signal collected by the sensor is amplified by the signal amplification module inside the instrument, then filtered by the signal filtering module to filter the waveform of the corresponding frequency, and finally, the high-speed acquisition module processes the signal data and stores it on the compact flash (CF) card. The logic structure of AE instrument is shown in Figure 4.
4.2. Performance Parameters of Acoustic Emission Instrument
When conducting acoustic emission detection for oil tank bottom plates in level one explosion hazard area of oil storage tank cave depots, it is necessary for the internal electrical components of the AE instrument to meet explosion-proof standards. Additionally, transmission of AE detection data must be sent to a safe location (60-120 m away from the oil tanks). Due to energy loss with cable transmission, it is necessary for traditional multi-channel AE instruments to utilize 9-12 long-distance cables to simultaneously transmit sensor-collected data, resulting in higher system power consumption and weaker acquisition signals. To address this issue, an independent channel acoustic emission detection system was used for this experiment, as shown in Figure 5.
The system employs multiple AE instruments strategically positioned around the oil tank. In addition, a synchronous cable connection synchronizer ensures synchronization of signals collected by all AE instruments. Each AE instrument is equipped with an explosion-proof lithium battery group and a data storage module. AE data can be initially collected and then output to a safe area for postprocessing. Alternatively, the data can be transmitted to signal processing software on a computer in the safe area via long-distance data transmission cables for analysis. This AE instrument detection system used in this experiment effectively addresses issues of long transmission distance and poor signal acquisition encountered with traditional systems, while taking the safety concerns in an explosion-proof oil tank environment into account.
To enhance the explosion-proof performance of the AE instrument, those components such as FRT-FB183S01C explosion-proof lithium battery pack, spark-free multi-core connector, explosion-proof button, explosion-proof detection unit, and three-proof paint circuit board are utilized. Table 2 presents a performance characteristics of the AE instrument.
4.3. On-Site Detection of Tank Bottoms
Acoustic emission detection was conducted on ten vertical arch oil storage tanks located within an oil depot during this experiment, and diesel oil constituted the predominant medium stored in these tanks. The basic information regarding these tanks is provided below:
Table 3.
Basic information of the oil tanks.
| Number | volume (m3) | medium | working temperature (℃) | safe altitude (m) | diameter (m) |
| B1 | 5000 | diesel oil | 3 | 11.5 | 22.725 |
| B2 | 5000 | diesel oil | 10 | 11.5 | 22.725 |
| B4 | 5000 | diesel oil | 11 | 11.5 | 22.725 |
| B5 | 5000 | diesel oil | 11 | 11.5 | 22.725 |
| B7 | 5000 | diesel oil | 10 | 11.5 | 22.725 |
| A8 | 3000 | aviation kerosene | 8 | 9.5 | 19.06 |
| A11 | 3000 | diesel oil | 8 | 9.5 | 19.06 |
| D2 | 10000 | diesel oil | 9 | 12.8 | 30.5 |
| D3 | 10000 | diesel oil | 10 | 12.8 | 30.5 |
| D3 | 10000 | diesel oil | 11 | 12.8 | 30.5 |
Before installing the sensors, surface rust was eliminated from the pre-positioned oil tank wall by sandpaper, coupling agent is evenly applied at the sensor placement location subsequently. Finally, a magnetic adsorption fixture is employed to securely attach the sensor to the oil tank wall. The field works in Figure 6.
Before testing, a piezoelectric ceramic sensor was installed on the tank wall for lead break testing, which examines the attenuation characteristics of the oil tank and determines both the maximum spacing between sensors and their arrangement within the tank. Table 4 presents the lead break test results in B1 tank.
It can be observed that the maximum effective distance of piezoelectric ceramic sensors amounts to 12 m. Considering factors such as acoustic emission instrument quantity and oil tank size, the number of sensors, sensor spacing, and sensor height of B-type tanks is set at 10, 7.14 m, and 0.2 m, respectively, as shown in Figure 7. Similarly, 8 sensors with a spacing of 7.458 m and a height of 0.2 m from the bottom level are set for A-type storage tanks. The D-type storage tanks are equipped with 12 sensors spaced every 7 .985 meters apart, while maintaining a height of 0.3 meters from bottom level.
All AE instruments and channels are respectively connected to establish synchronization before data acquisition, and the computer for signal processing is moved out of the explosion-proof area. The measured noise level is less than 32 dB, thus setting the acquisition threshold voltage at 35 dB with a gain of 40 dB and a sampling frequency of 1MHz, respectively.
At the initiation of the experiment, the B1 oil storage tank was first filled with oil up to a height of 11.2m, which accounted for approximately 97% of its safe capacity level. The entire filling process lasted for 4 hours. Subsequently, a two-hour pressure holding test was conducted while acquiring acoustic emission data after closing both the oil pump and valve. Throughout the test period, there were no changes observed in the liquid level within the oil tank, as depicted in Figure 8.
5. Analysis of Experimental Results of Acoustic Emission
5.1. Acoustic Emission Detection Data of Defects on Tank Floor
After the test, the sensor coordinates are set for acoustic emission source localization and detection. Through the AE signals of 10 sensors acquired in the B1 tank, the location information and activity of the AE source can be calculated and obtained, which is the core of carrying out AE detection. Owing to an extensive amount of full volume signal data, this paper focuses on analyzing selected data from sensor No.1.
Through analyzing the selected data from sensor No.1, parameters such as Average Signal Level (ASL) and Root Mean Square (RMS) voltage can be calculated based on occurrence time, amplitude, change patterns, and frequency characteristics. Measurement of AE amplitude on a logarithmic scale makes it exempt from being influenced by thresholds while being suitable for evaluating continuous acoustic emission activities. After data processing and deletion of invalid data based on the energy threshold determined by the lead break test, the resulting waveform is shown in Figure 9.
AE signal amplitude fluctuates continuously as time changes; different amplitudes and frequencies occur at different corresponding points in the meantime. Among them, point 5 is the point with the largest amplitude of 38.16 and the highest number of times, 17. Therefore, it can be determined that the point location can be used as a valid acoustic signal in channel 1. By coupling and analyzing with two or more valid acoustic signal data from other channels in the system, the location information can be judged based on the previous mathematical model.
Data analysis also reveals AE signals of tanks under static pressure, and tank background noise levels of all measurement channels was monitored. During the testing of tanks B1, B2, and B4, the noise levels varied slightly to 42.363 dB, 42.123 dB, and 41.744 dB, respectively. Thus, translating this into the detection threshold levels for these tanks. The static pressure data of B1, B2 and B4 tanks are shown in Figure 10.
The horizontal axis represents the duration of the waveform: time /us and the vertical axis represents the amplitude: amplitude /dB.
5.2. Analysis of Acoustic Emission Detection Results in Tank Bottoms
According to the obtained acoustic parameters, waveform diagrams of different channels can be obtained. It should be noted that measurement data should be filtered prior to data analysis to reject noisy data, data signals not related to tank floor corrosion and/or leakage. The filtering process is carried out by lead break testing, which ultimately results in a reasonable acoustic signal acquisition threshold. The plane positioning results of acoustic emission source detection are shown in Figure 11.
One can find that AE sources are mainly distributed in the center and right side of the oil tank, showing a spot-like and concentrated distribution. It can be judged that there may be relatively serious flaky corrosion in this area, which is the key location for opening inspection or maintenance of the oil tank. In addition, there is an acoustic emission source signal in the upper left and right below respectively, indicating that there may be spot-like corrosion in this area, or it may be an invalid signal, which needs to be confirmed by other detection methods such as magnetic leakage and ultrasound after opening the tank. The blue block area in the figure shows the degree range of acoustic emission quantity, and the 3D acoustic emission source location results are shown in Figure 12.
According to the acoustic emission source’s coordinates and quantity information imported from the figure, it is concluded that the center (0, 0) coordinates of the tank bottom are the origin in area a. There were 6 effective acoustic emission sources in the coordinates (X:3.95 meters, Y: -0.50 meters, radius: 1.14 meters) in area A, and 7 effective acoustic emission sources in the area B (X: 0.49 meters, Y: -0.23 meters, radius: 1.14 meters). The time difference positioning of the acoustic emission source of the tank bottom plate is analyzed and graded. According to acoustic emission detection and evaluation method, it is concluded that the corrosion level of tank B1 is class II, namely, the oil tank shows slight corrosion.
Similarly, the acoustic emission test was performed on the remaining 9 oil tank bottom plates, according to the above steps, and the test results are shown in Table 5.
5.3. Open Tank Detection
The B1, A8, A11, and D2 oil tanks were selected to open for detection. In oil tank B1 and D2, there were no obvious corrosion spots. Figure 13 depicts the open tank detection of the A8 oil tank. The white area shows obvious corrosion spots, which are indicative of minor local corrosion. The corrosion area is the same as the acoustic emission instrument’s positioning area. Figure 14 depicts the tank opening test of the A11 oil tank. There is a slight shedding phenomenon at the tank’s bottom, which is a sign of local corrosion. All of the oil tanks in the oil depot do not need to be repaired for nearly a year, according to the evaluation standard. Table 6 compares the open tank test results of the four oil tanks to the results of the AE instrument.
It can be found that the AE instrument testing of Tank B1 is evaluated as more severe, while the detection results of the other three oil tanks are consistent. Overall, the open tank test results suggests that the AE instrument detection and evaluation results are conservative. The AE instrument’s positioning of the corrosion area of the tank bottom plate is principally the same as that of the practical corrosion area, indicating that the AE instrument shows good positioning performance for the positioning of the corrosion area in the oil tank. In conclusion, the detection and evaluation of the AE instrument can ensure the safe operation of the oil tank, and can be used as the main basis for the regular maintenance of oil tank.
6. Conclusions
The AE detection technology can quickly detect and locate the corrosion or defect sources at the bottom of the storage tank without emptying or opening the tanks, as well as grading the internal corrosion state and leakage level by the number of detected AE sources. Compared with magnetic leakage, ultrasonic and other can opening detection methods, the AE detection has more superior timeliness and economy.
(1) According to the AE testing experiments and open tank testing experimental results, the AE instrument designed in this paper can be a good response to the corrosion of the tank bottom plate, and locate the acoustic emission source, which can be carried out under the conditions of vertical steel tanks with oil for detection operations, greatly reducing the workload of the traditional open tank detection of corrosion of oil tanks. The AE detection data is basically consistent with the results of open tank detection, which is a strong guide for determining the order of tank opening during tank maintenance.
(2) The bottom plate of the tank is the weakest and most dangerous area of the tank, corrosion and welding defects are the main causes of tank failure. The electronic components used in the AE instrument are all in line with the oil and gas explosion-proof requirements, and can be used to conduct acoustic emission testing of large oil storage tanks under the premise of explosion-proof safety.
(3) When there is a defect in the closed layer between the tank floor and the base, there is a risk that corrosive media will enter the bottom of the tank and cause local corrosion. Therefore, it is necessary to use internal non-destructive testing (when the tank is empty) and acoustic emission (when not empty) for monitoring. At the same time, the integrity of the bottom plate should be evaluated as soon as possible.
Funding
This work was supported by National Natural Science Foundation of China (NSFC52272338); Science and Technology Research Program of Chongqing Municipal Education Commission (KJZD-M202212903); Science and Technology Research Program of Chongqing Municipal Education Commission (KJQN202312908).
References
- Bhuiyan, M.Y.; Lin, B.; Giurgiutiu, V. Acoustic emission sensor effect and waveform evolution during fatigue crack growth in thin metallic plate. J. Intell. Mater. Syst. Struct. 2018, 29, 1275–1284. [Google Scholar] [CrossRef]
- Bi, H.S.; Li, H.Y.; Zhang, W.; Wang, L.; Zhang, Q.L.; Cao, S.Z.; Toku-Gyamerah, I. Evaluation of the acoustic emission monitoring method for stress corrosion cracking on aboveground storage tank floor steel. Int. J. Pressure Vessels Pip. 2020, 179, 7. [Google Scholar] [CrossRef]
- Cichon, A.; Wlodarz, M. OLTC Fault detection Based on Acoustic Emission and Supported by Machine Learning. Energies 2024, 17, 14. [Google Scholar] [CrossRef]
- Eaton, M.J.; Crivelli, D.; Williams, R.; Byrne, C. Monitoring the drilling process of carbon fibre laminates using acoustic emission. Proc. Inst. Mech. Eng. Part B-J. Eng. Manuf. 2023, 237, 1182–1193. [Google Scholar] [CrossRef]
- Fan, L.; Wang, C.B.; Hu, D. Experimental Study on Acoustic Emission Characteristics of Uniaxial Compression of MICP-Filled Sandstone. Materials 2023, 16, 23. [Google Scholar] [CrossRef]
- Forte, G.; Antonelli, M.; Brunazzi, E.; Simmons, M.J.; Stitt, H.; Alberini, F. Flow regime identification in aerated stirred vessel using passive acoustic emission and machine learning. Can. J. Chem. Eng. 2023, 101, 5670–5682. [Google Scholar] [CrossRef]
- Gao, L.; Wang, H.; Zhou, J.N.; Zhou, X.J. Selection of Optimal MotherWavelet for Acoustic Emission Signal Processing of Gas Pipeline Leakage, International Conference of The Efficiency and Performance Engineering Network (TEPEN), Baotou, PEOPLES R CHINA, Aug 18-21; Springer International Publishing Ag: Baotou, PEOPLES R CHINA, 2022; pp. 294–305. [Google Scholar]
- Gordon, R.; Bejger, A. Effect of Temperature Change on Acoustic Emission Signal in IGBT Transistors of Marine Propulsion System Converters. Energies 2022, 15, 4276. [Google Scholar] [CrossRef]
- Hou, J.; Wang, C.; Li, S.L.; Jiang, N.; Xu, B.; Wu, G.M. Study on propagation mechanism and attenuation law of acoustic emission waves for damage of prestressed steel strands. Measurement 2023, 219, 12. [Google Scholar] [CrossRef]
- Huang, C.J.; He, W.; Lu, B.K.; Wang, M.M.; Li, S.H.; Xiao, C.B. Study on Acoustic Emission and Coda Wave Characteristics of Layered Cemented Tailings Backfill under Uniaxial Compression. Minerals 2022, 12, 12. [Google Scholar] [CrossRef]
- Li, G.M.; Zhao, Z.; Li, Y.H.; Li, C.Y.; Lee, C.C. Preprocessing Acoustic Emission Signal of Broken Wires in Bridge Cables. Appl. Sci.-Basel 2022, 12, 24. [Google Scholar] [CrossRef]
- Lima, R.A.A.; Drobiazko, M.; Bernasconi, A.; Carboni, M. On crack tip localisation in quasi-statically loaded, adhesively bonded double cantilever beam specimens by acoustic emission. Theor. Appl. Fract. Mech. 2022, 118, 12. [Google Scholar] [CrossRef]
- Liu, F.; Guo, R.; Lin, X.J.; Zhang, X.F.; Huang, S.F.; Yang, F.; Cheng, X. Influence of Propagation Distance on Characteristic Parameters of Acoustic Emission Signals in Concrete Materials Based on Low-Frequency Sensor. Adv. Civ. Eng. 2022, 2022, 14. [Google Scholar] [CrossRef]
- Lv, J.X.; Zhao, P.H.; Wei, P.; Yuan, H.W.; Xu, H. -252.8 °C Liquid Hydrogen Acoustic Emission Experiment in Simulated Aerospace Fuel Tank. IEEE Trans. Ind. Electron. 2024, 71, 2122–2132. [Google Scholar] [CrossRef]
- Nguyen, T.K.; Ahmad, Z.; Kim, J.M. Leak Localization on Cylinder Tank Bottom Using Acoustic Emission. Sensors 2023, 23, 13. [Google Scholar] [CrossRef]
- Olszewska, A. Using the acoustic emission method for testing aboveground vertical storage tank bottoms. Appl. Acoust. 2022, 188, 13. [Google Scholar] [CrossRef]
- Perveitalov, O.G.; Nosov, V.V.; Schipachev, A.M.; Alekhin, A.I. Thermally Activated Crack Growth and Fracture Toughness Evaluation of Pipeline Steels Using Acoustic Emission. Metals 2023, 13, 27. [Google Scholar] [CrossRef]
- Qu, K.; Zou, B.B.; Chen, J.J.; Guo, Y.G.; Wang, R.T. Experimental Study of a Broadband Parametric Acoustic Array for Sub-Bottom Profiling in Shallow Water. Shock Vib. 2018, 2018, 8. [Google Scholar] [CrossRef]
- Si, K.; Cui, Z.D.; Peng, R.D.; Zhao, L.L. Study on Fatigue Life Prediction and Acoustic Emission Characteristics of Sandstone Based on Mesoscopic Crack Propagation Mechanism. Energies 2022, 15, 17. [Google Scholar] [CrossRef]
- Stepanova, L.N.; Chernova, V.V.; Kabanov, S.I. Analyzing the Processes of Carbon Fiber Sample Failure Using Acoustic Emission and Strain Gaging. Russ. J. Nondestr. Test. 2023, 59, 743–752. [Google Scholar] [CrossRef]
- Wang, C.L.; Cao, C.; Li, C.F.; Chuai, X.S.; Zhao, G.M.; Lu, H. Experimental investigation on synergetic prediction of granite rockburst using rock failure time and acoustic emission energy. J. Cent. South Univ. 2022, 29, 1262–1273. [Google Scholar] [CrossRef]
- Wang, X.R.; Liu, X.D.; He, T.; Xiao, D.H.; Shan, Y.C. Structural damage acoustic emission information enhancement through acoustic black hole mechanism. Measurement 2022, 190, 11. [Google Scholar] [CrossRef]
- Wei, N.S.; Chen, Z.; Xu, Y.D.; Gu, F.S.; Ball, A. The Investigation into the Tribological Impact of Alternative Fuels on Engines Based on Acoustic Emission. Energies 2021, 14, 20. [Google Scholar] [CrossRef]
- Wei, P.; Han, X.; Xia, D.; Liu, T.; Lang, H. Novel Fiber-Optic Ring Acoustic Emission Sensor. Sensors 2018, 18, 215. [Google Scholar] [CrossRef]
- Witos, F.; Olszewska, A. Investigation of Partial Discharges within Power Oil Transformers by Acoustic Emission. Energies 2023, 16, 20. [Google Scholar] [CrossRef]
- Zimroz, P.; Trybala, P.; Wróblewski, A.; Góralczyk, M.; Szrek, J.; Wójcik, A.; Zimroz, R. Application of UAV in Search and Rescue Actions in Underground Mine-A Specific Sound Detection in Noisy Acoustic Signal. Energies 2021, 14, 21. [Google Scholar] [CrossRef]
- JB/T10764 “Non-destructive Testing Acoustic Emission Detection and Evaluation Method for Atmospheric pressure Metal Storage Tanks”.
- Hua, W.; Zhang, W.; Li, J.; Cai, K.; Jiang, Y. Feasibility of Abandoned Ammunition Materials Cold Cutting Experimental Study and Numerical Prediction. Integrated Ferroelectrics 2020, 207, 1–11. [Google Scholar] [CrossRef]
Figure 1.
Acoustic emission principle of an oil tank.
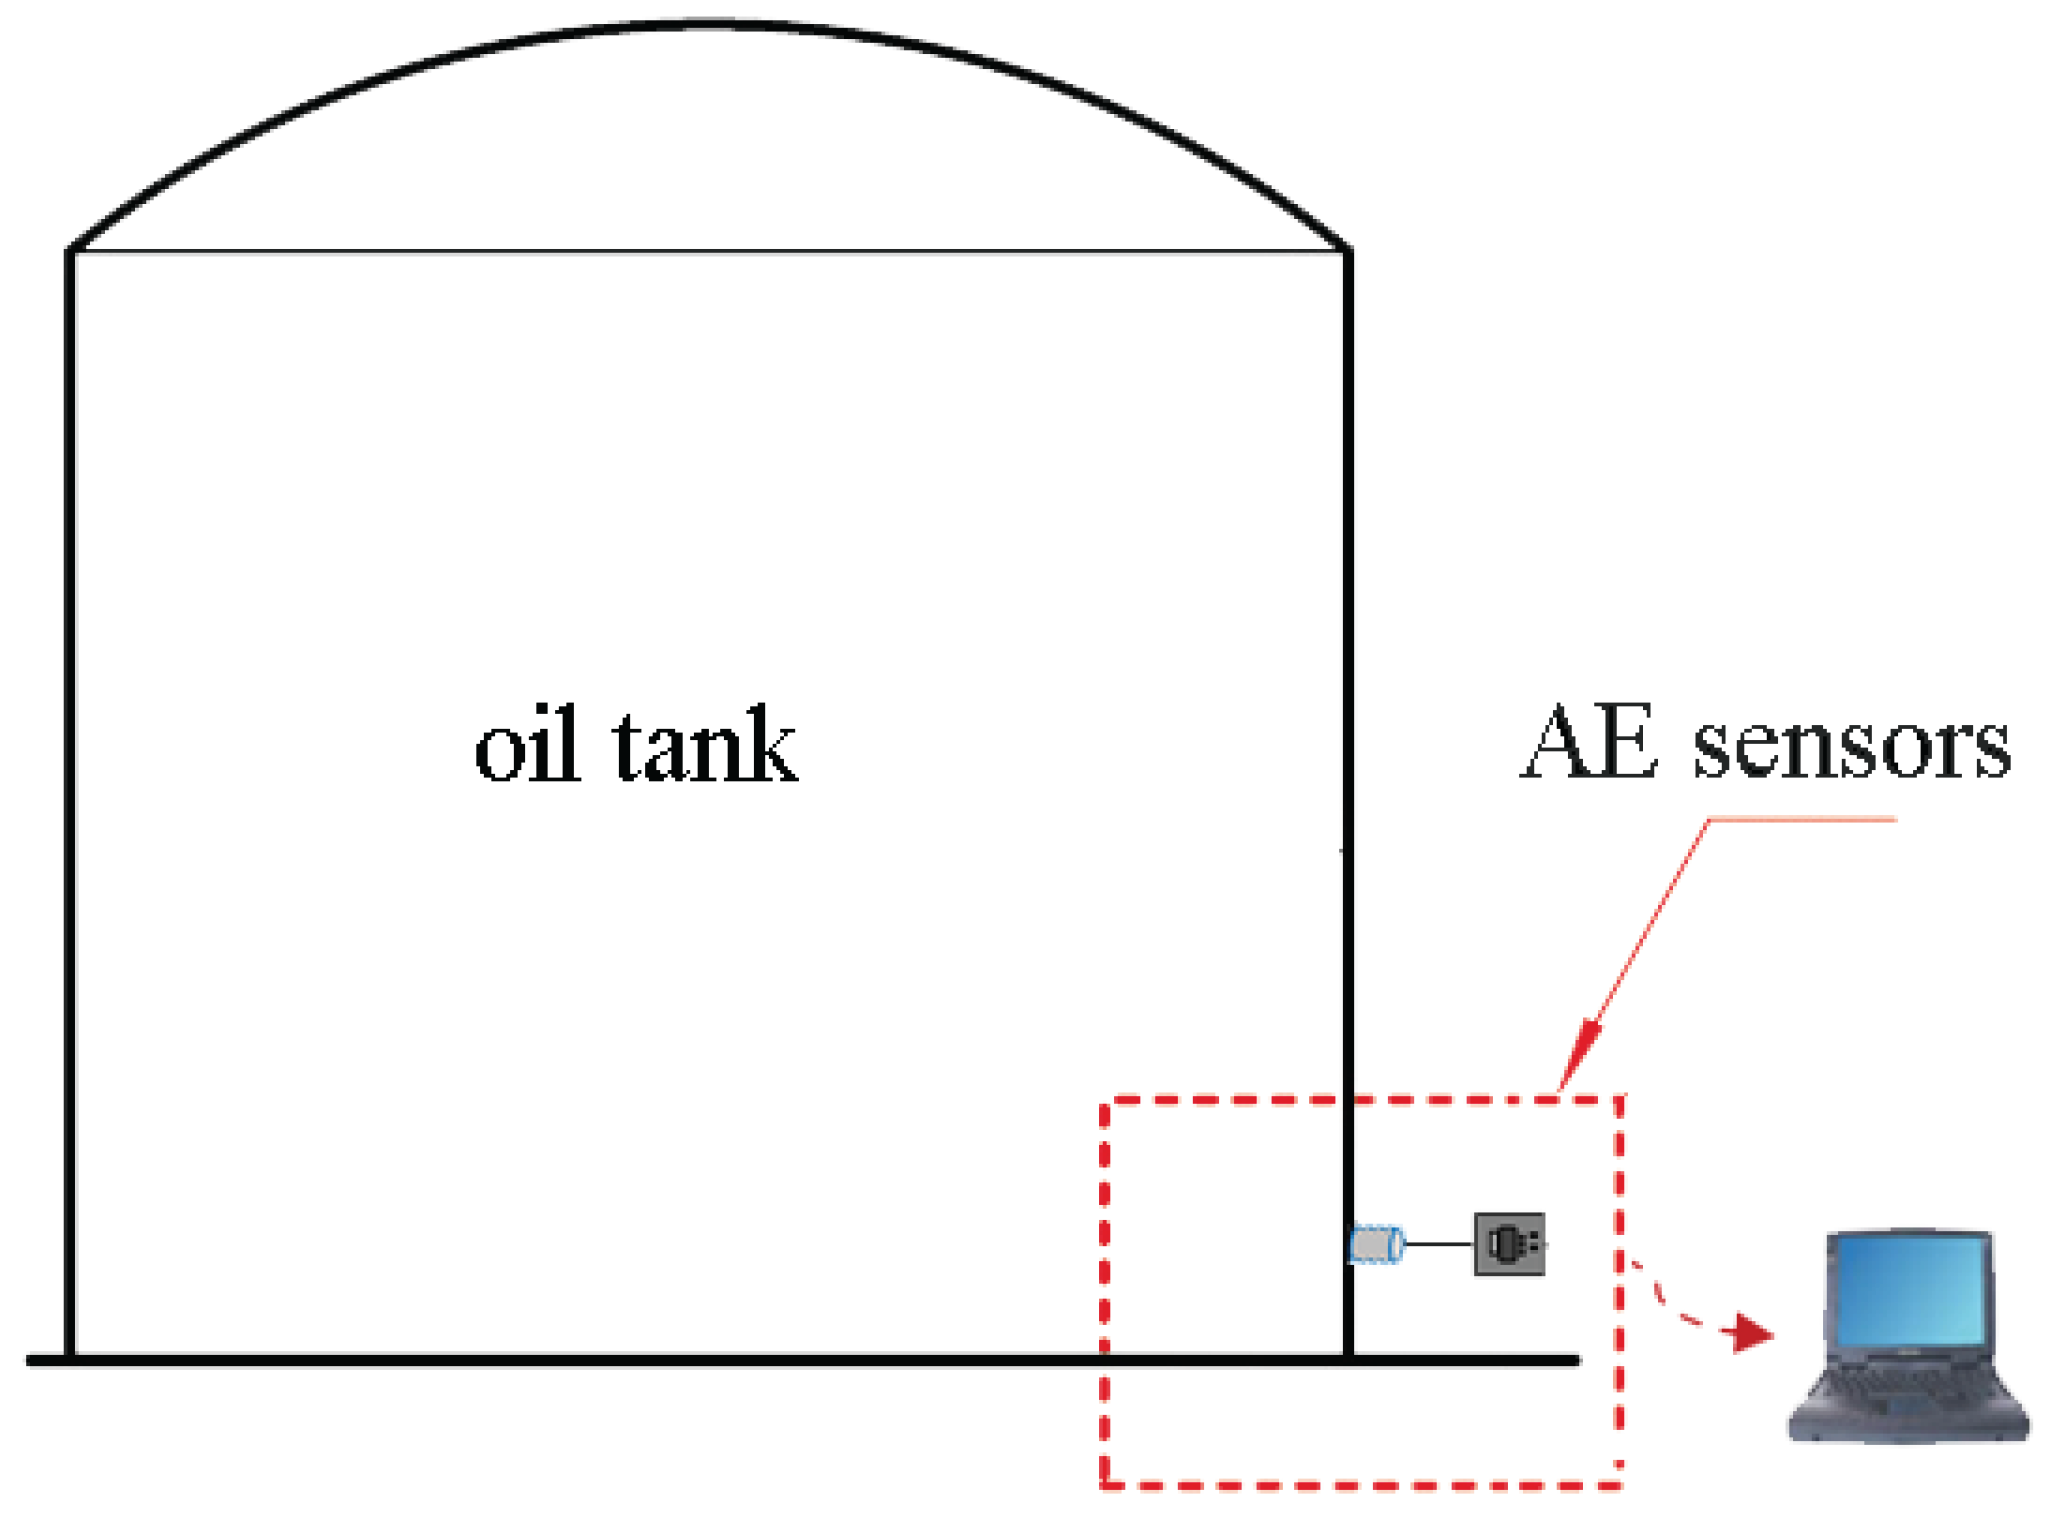
Figure 2.
Schematic diagram of tank bottom plate.
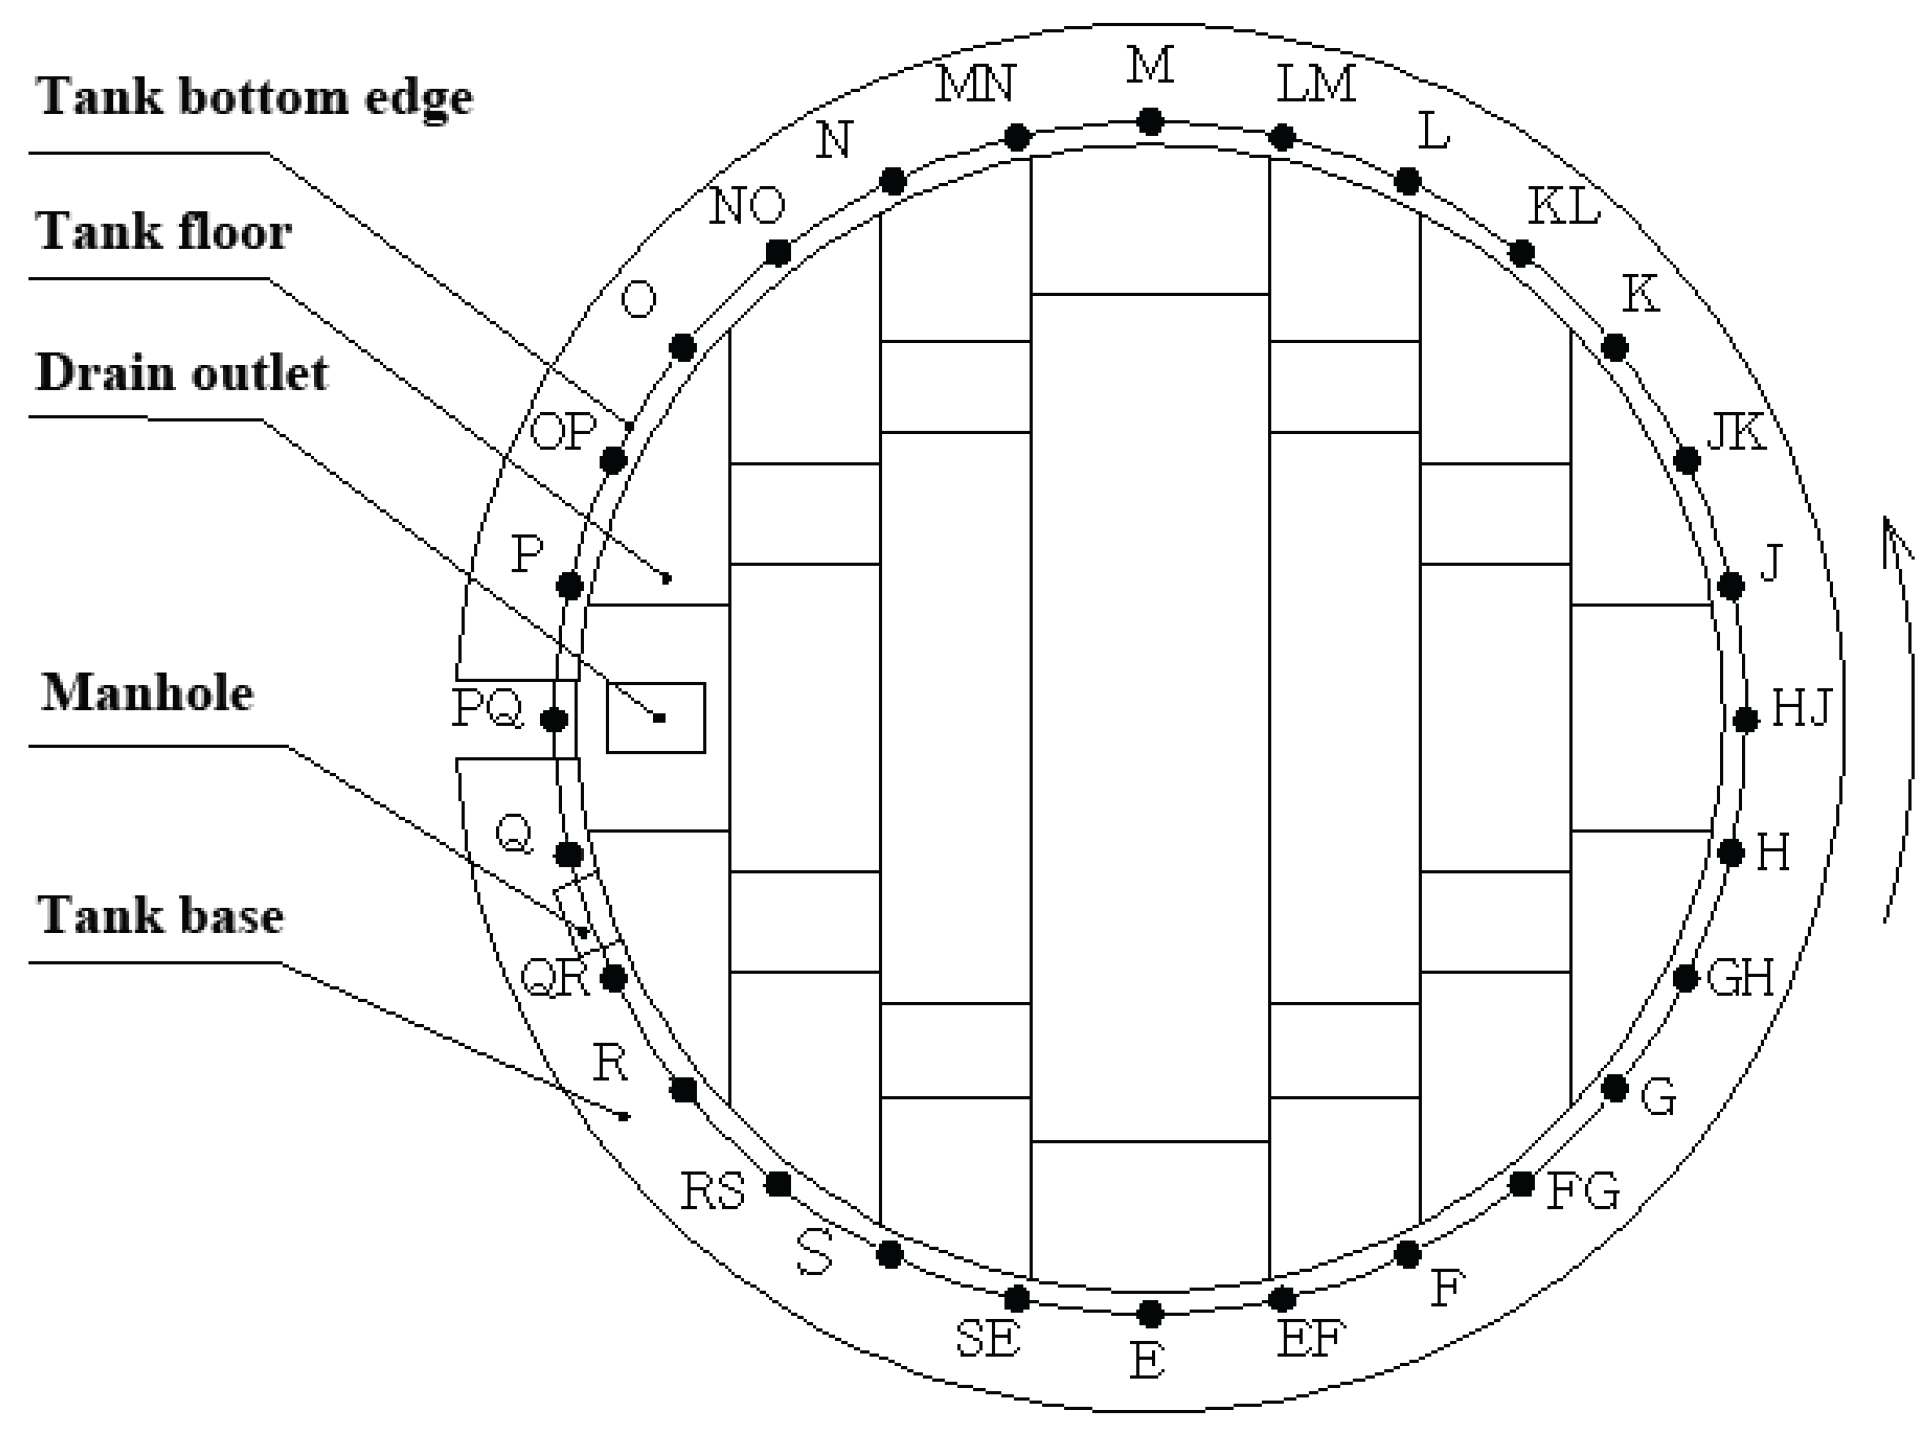
Figure 3.
Explosion-proof acoustic emission instrument.
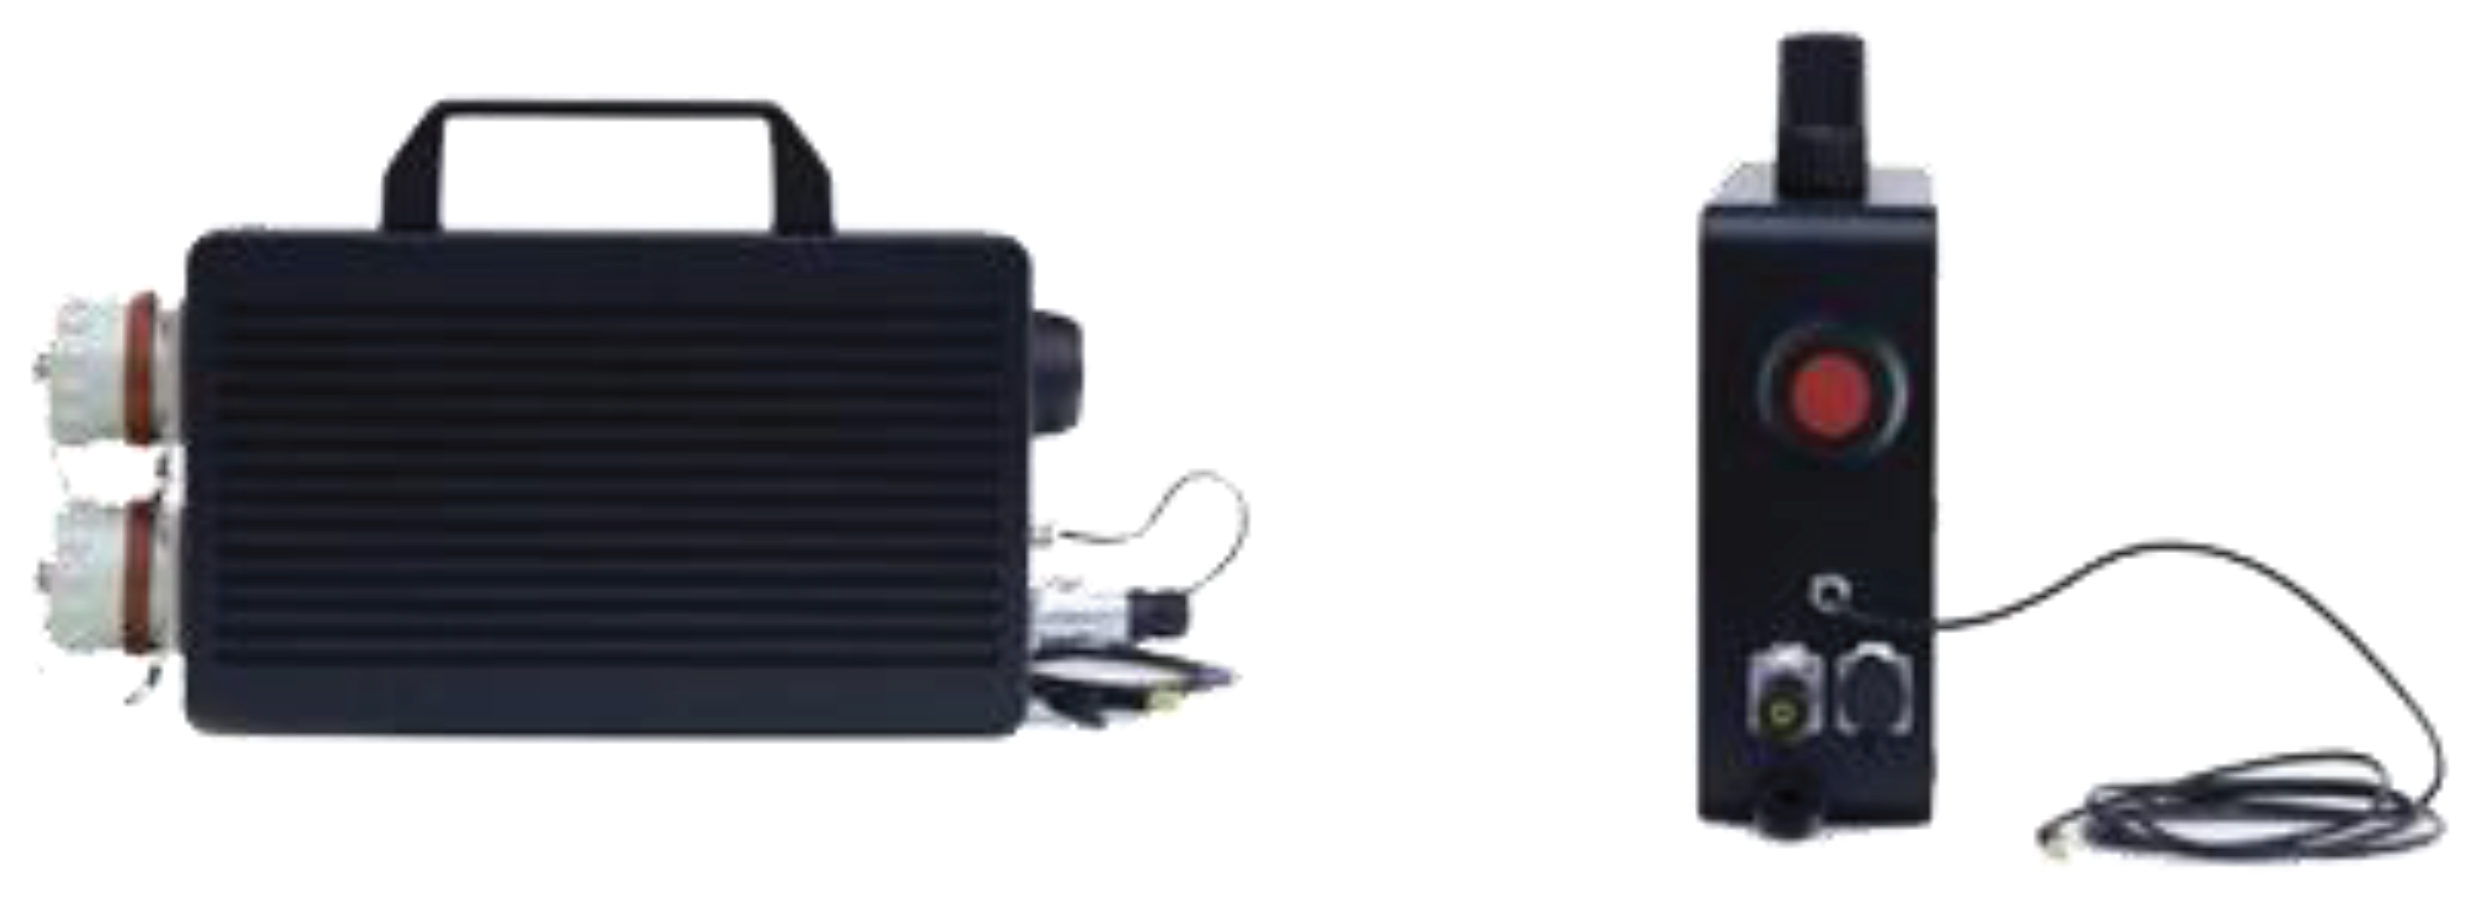
Figure 4.
Logic structure of explosion-proof acoustic emission instrument.
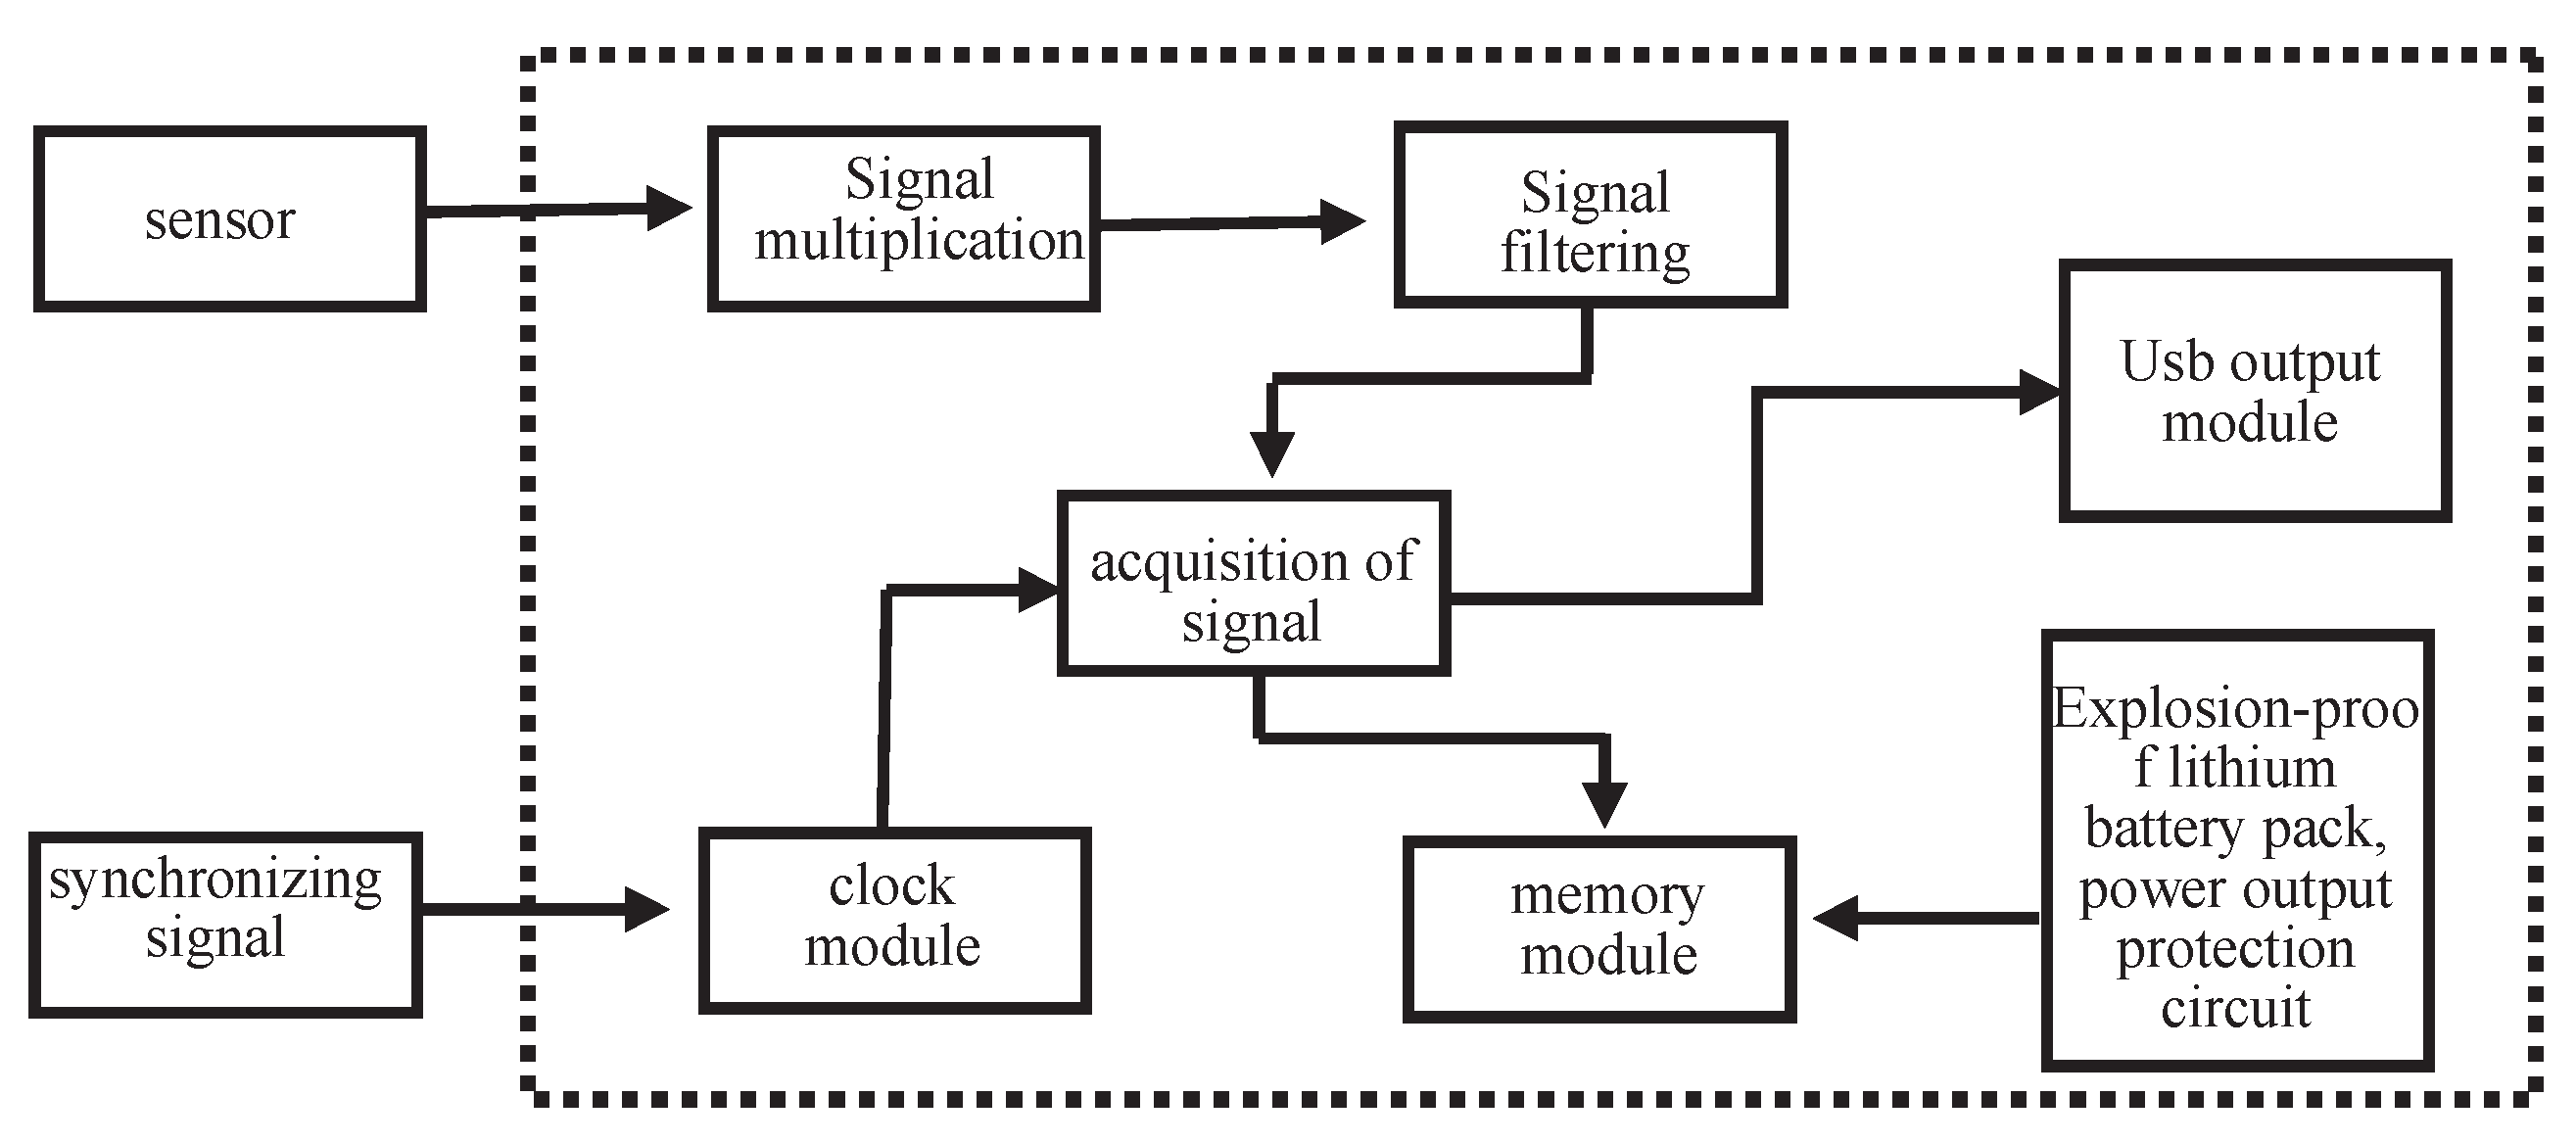
Figure 5.
An independent channel acoustic emission detection system.
Figure 6.
On-site installation diagram for a piezoelectric ceramic sensor.
Figure 7.
Layout plan of sensors in B-type oil tank.
Figure 8.
Liquid level height during test.
Figure 9.
Waveform diagram of acoustic emission sensor.
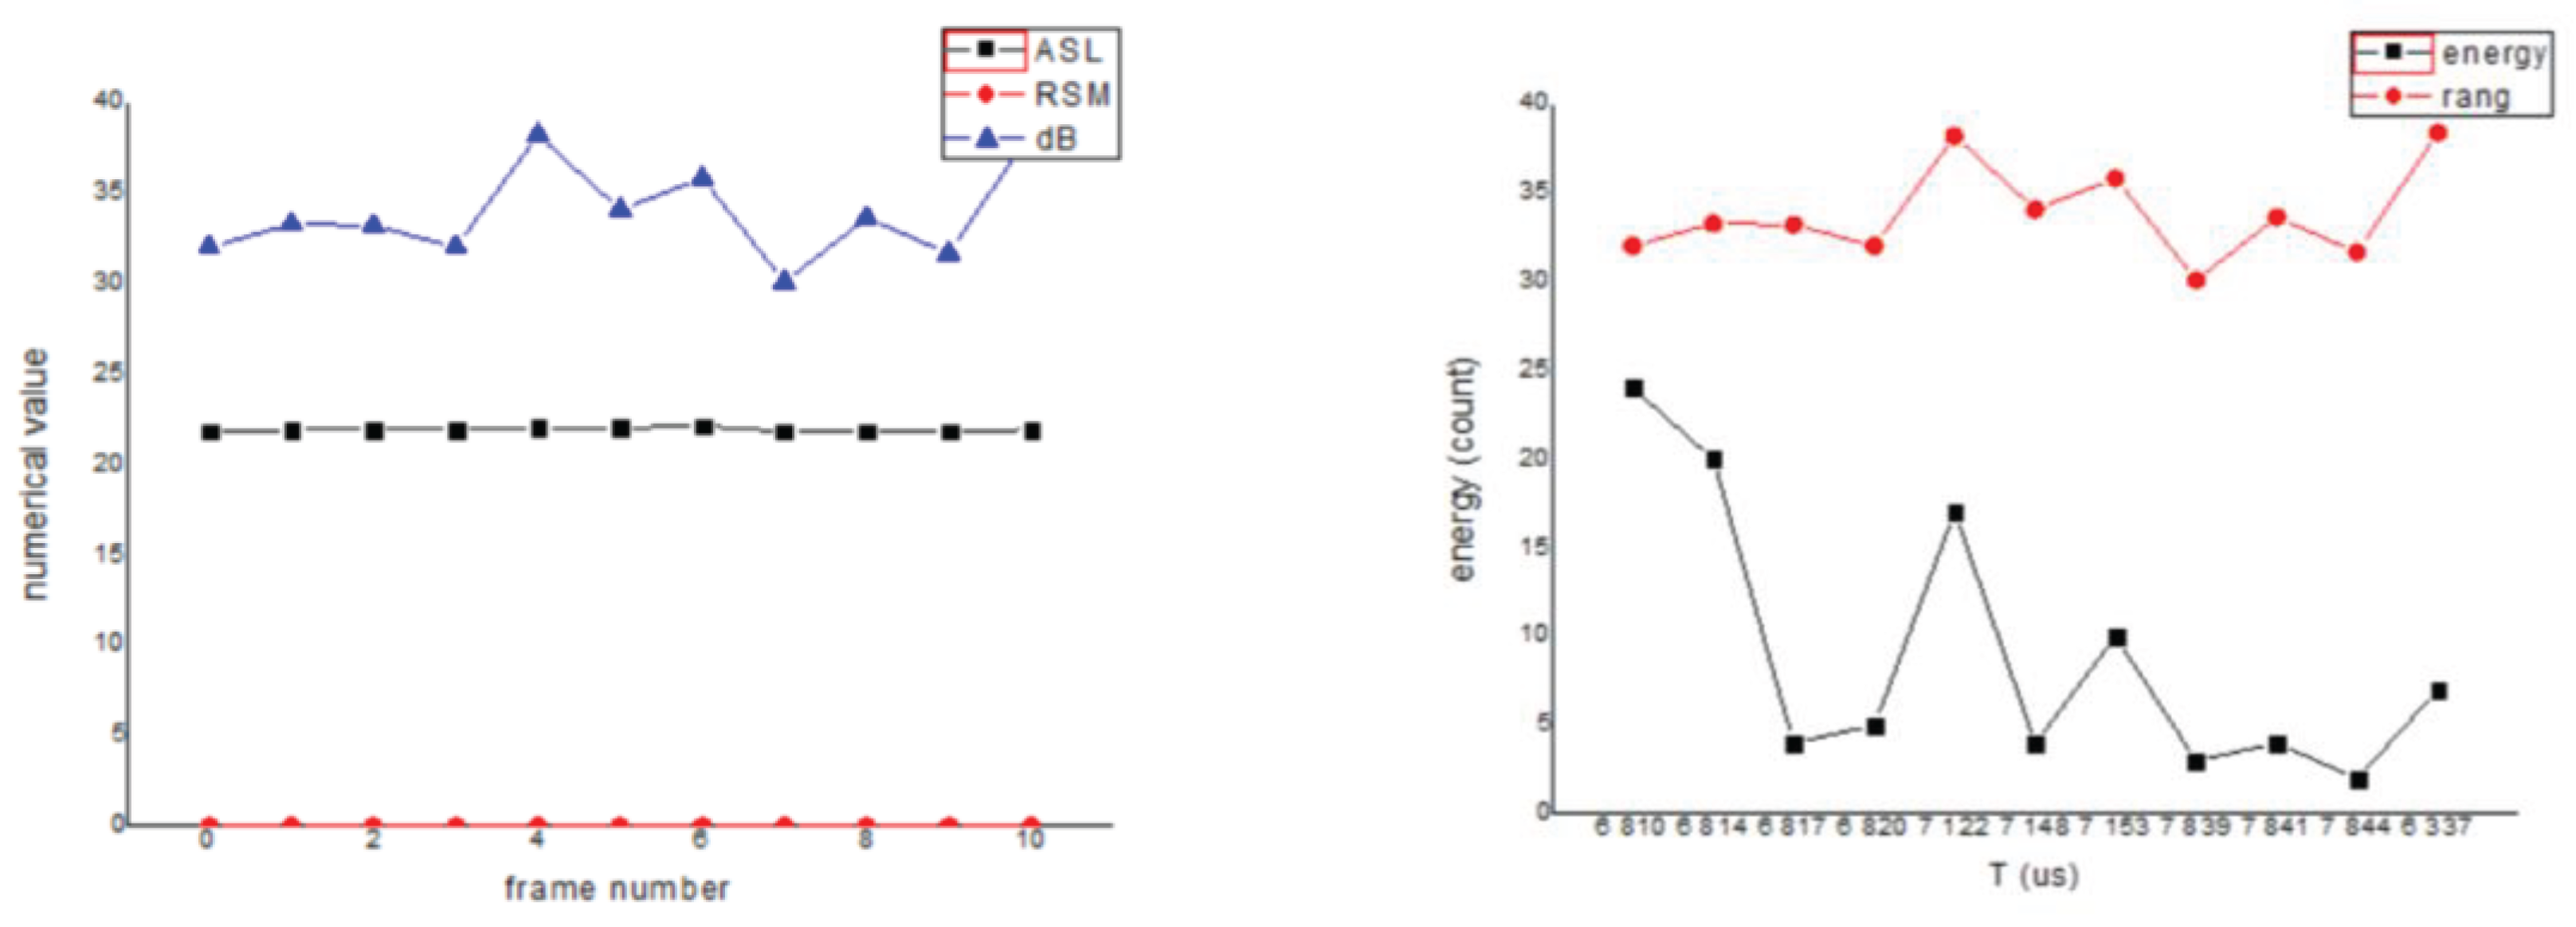
Figure 10.
Acoustic emission static pressure test waveform of storage tank:(a)tank B1;(b)tank B2;(c)tank B4;(d)tank B5.
Figure 10.
Acoustic emission static pressure test waveform of storage tank:(a)tank B1;(b)tank B2;(c)tank B4;(d)tank B5.
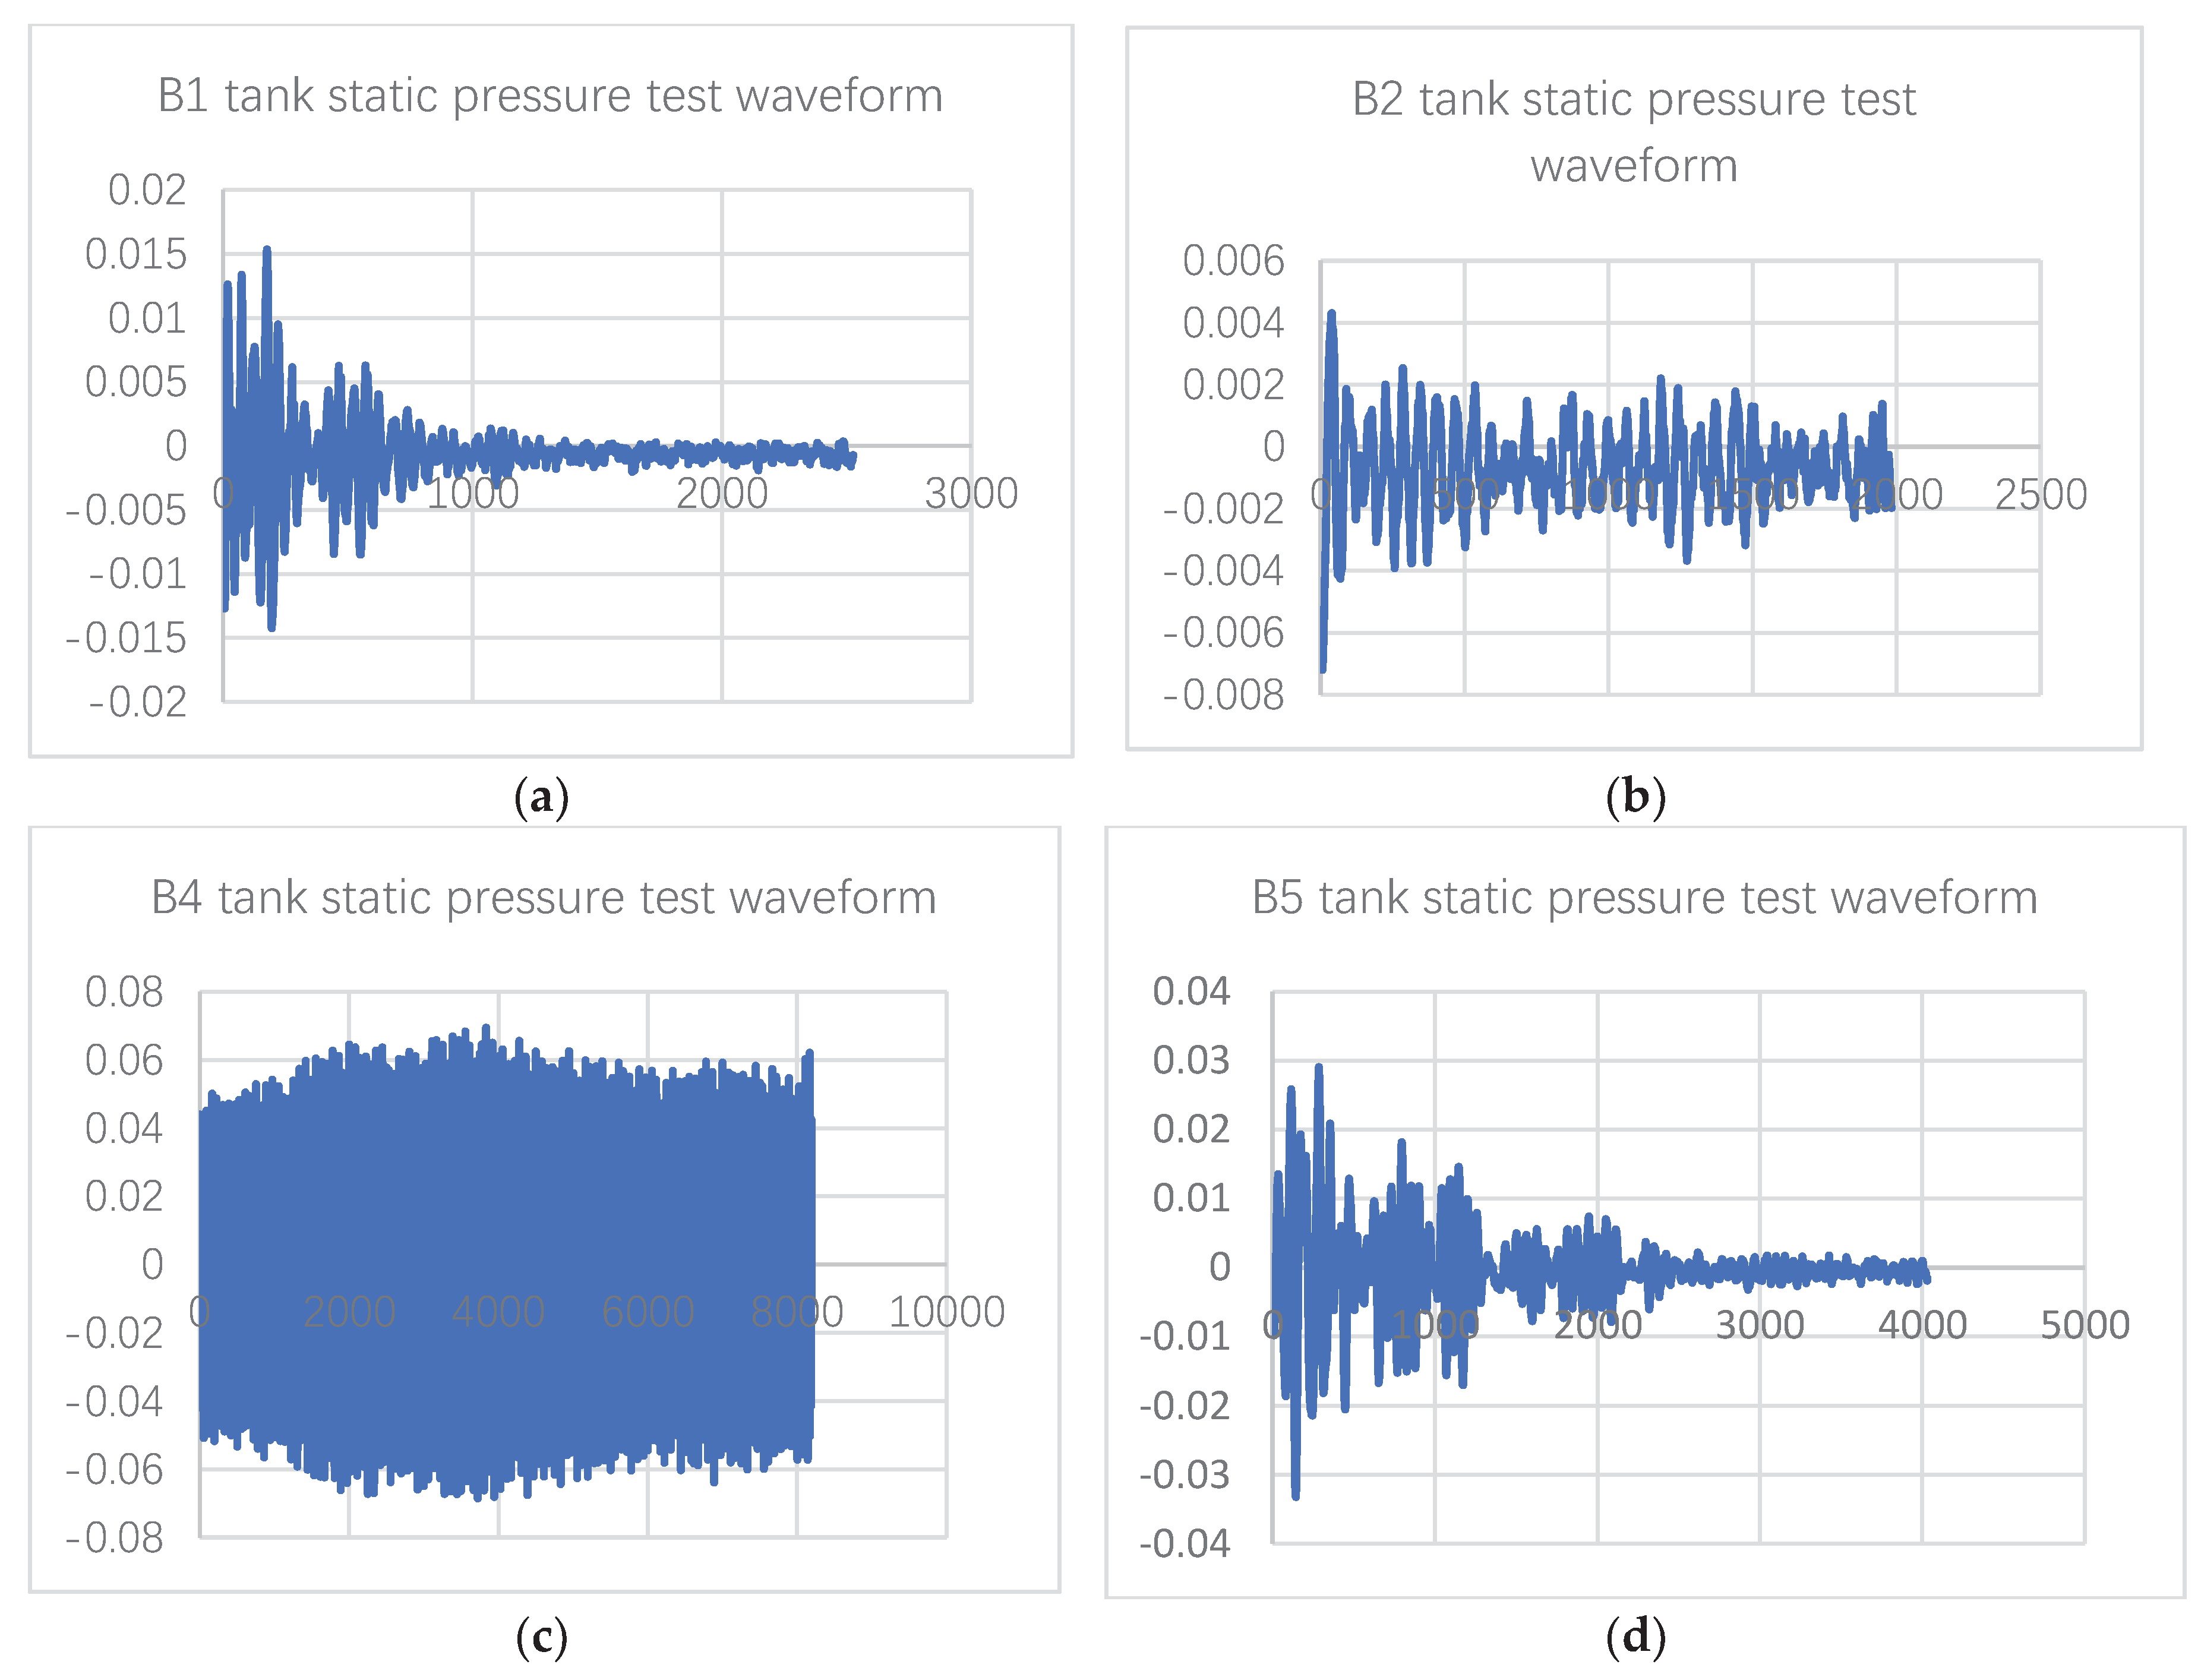
Figure 11.
Two-dimensional static pressure acoustic emission source localization diagram.
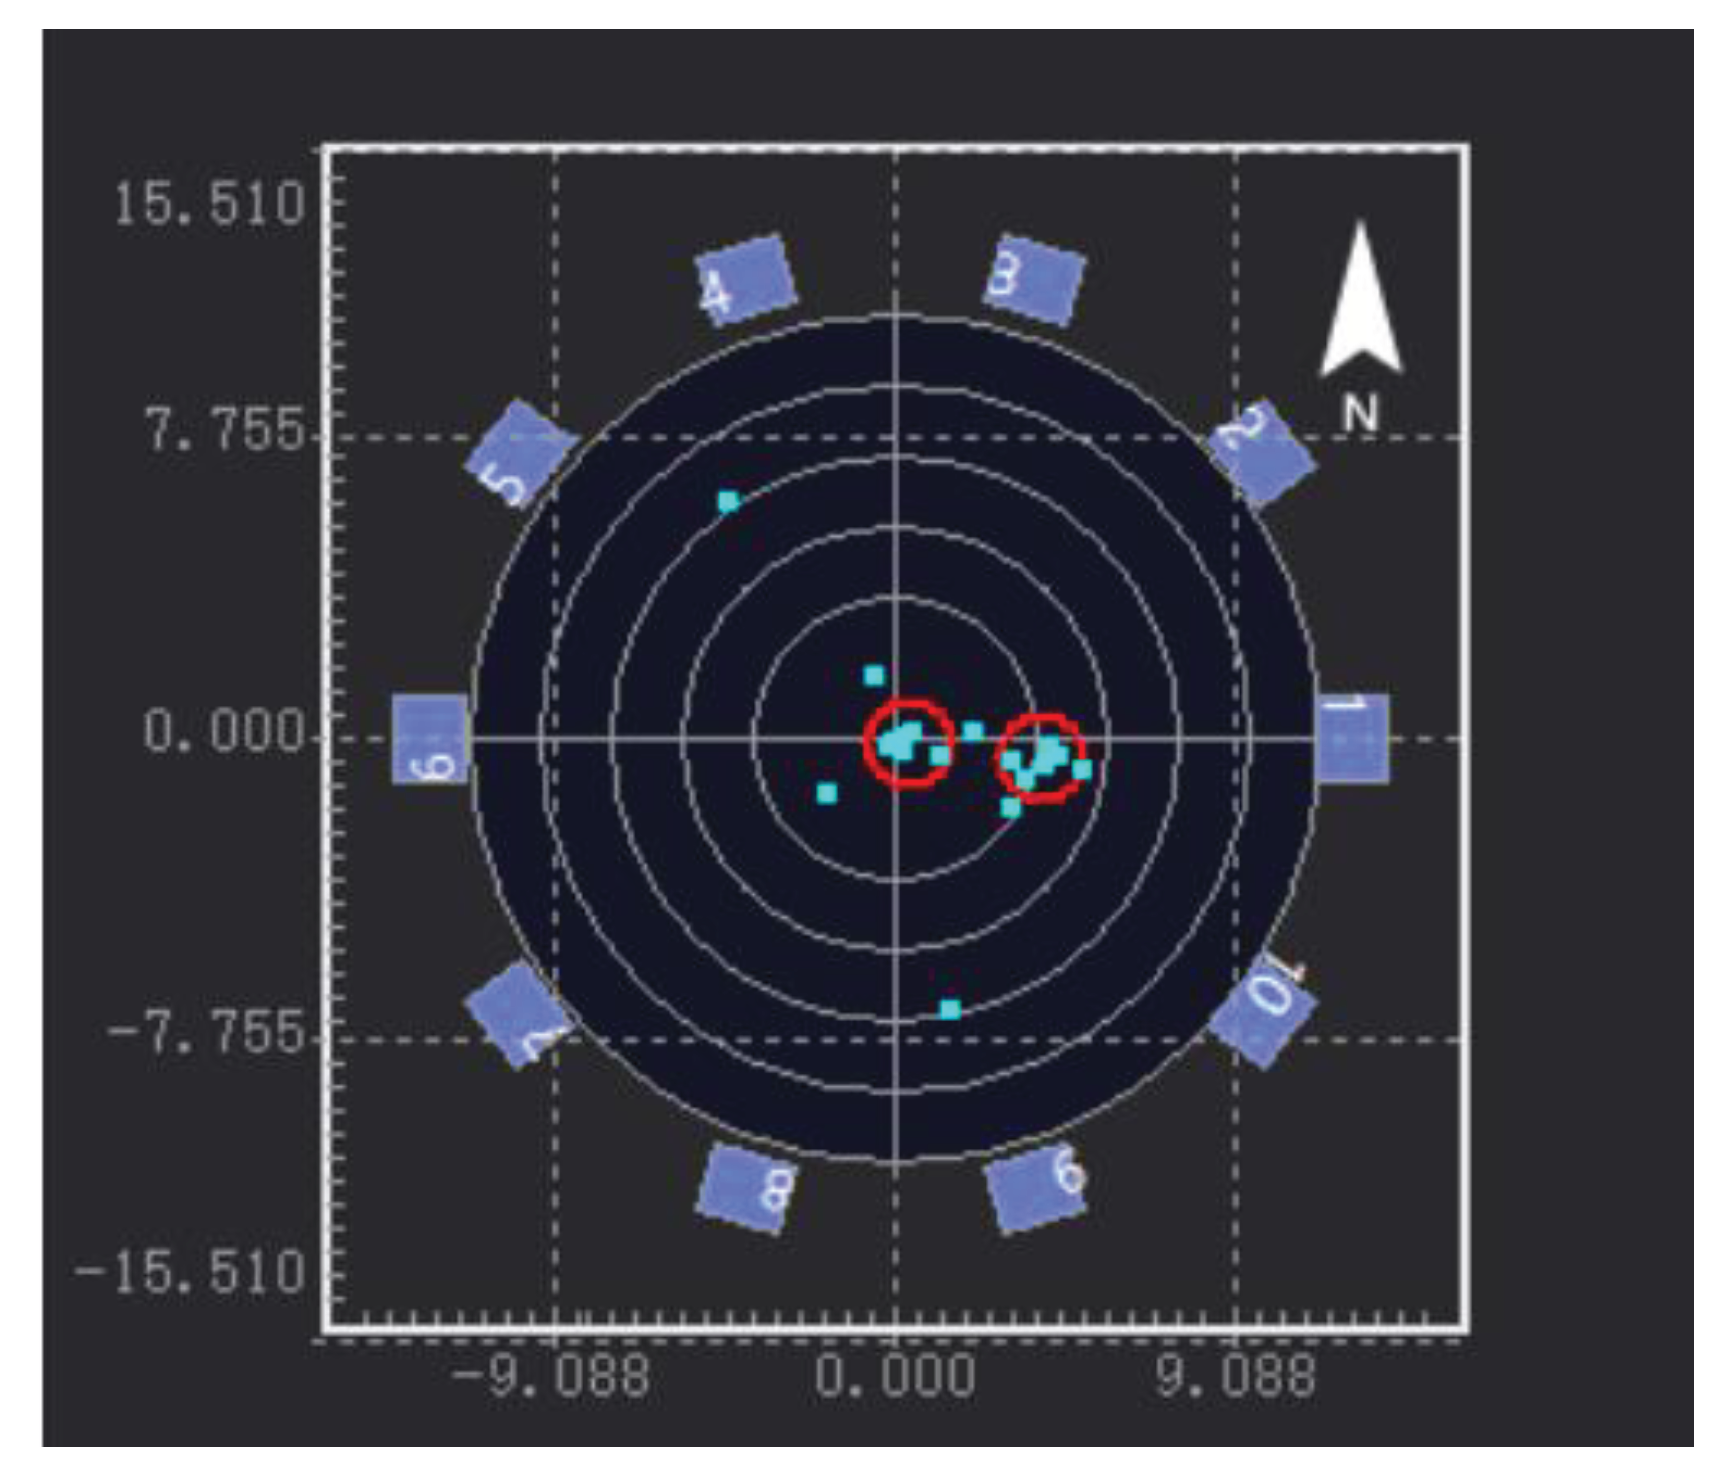
Figure 12.
Three-dimensional static pressure acoustic emission source localization diagram.
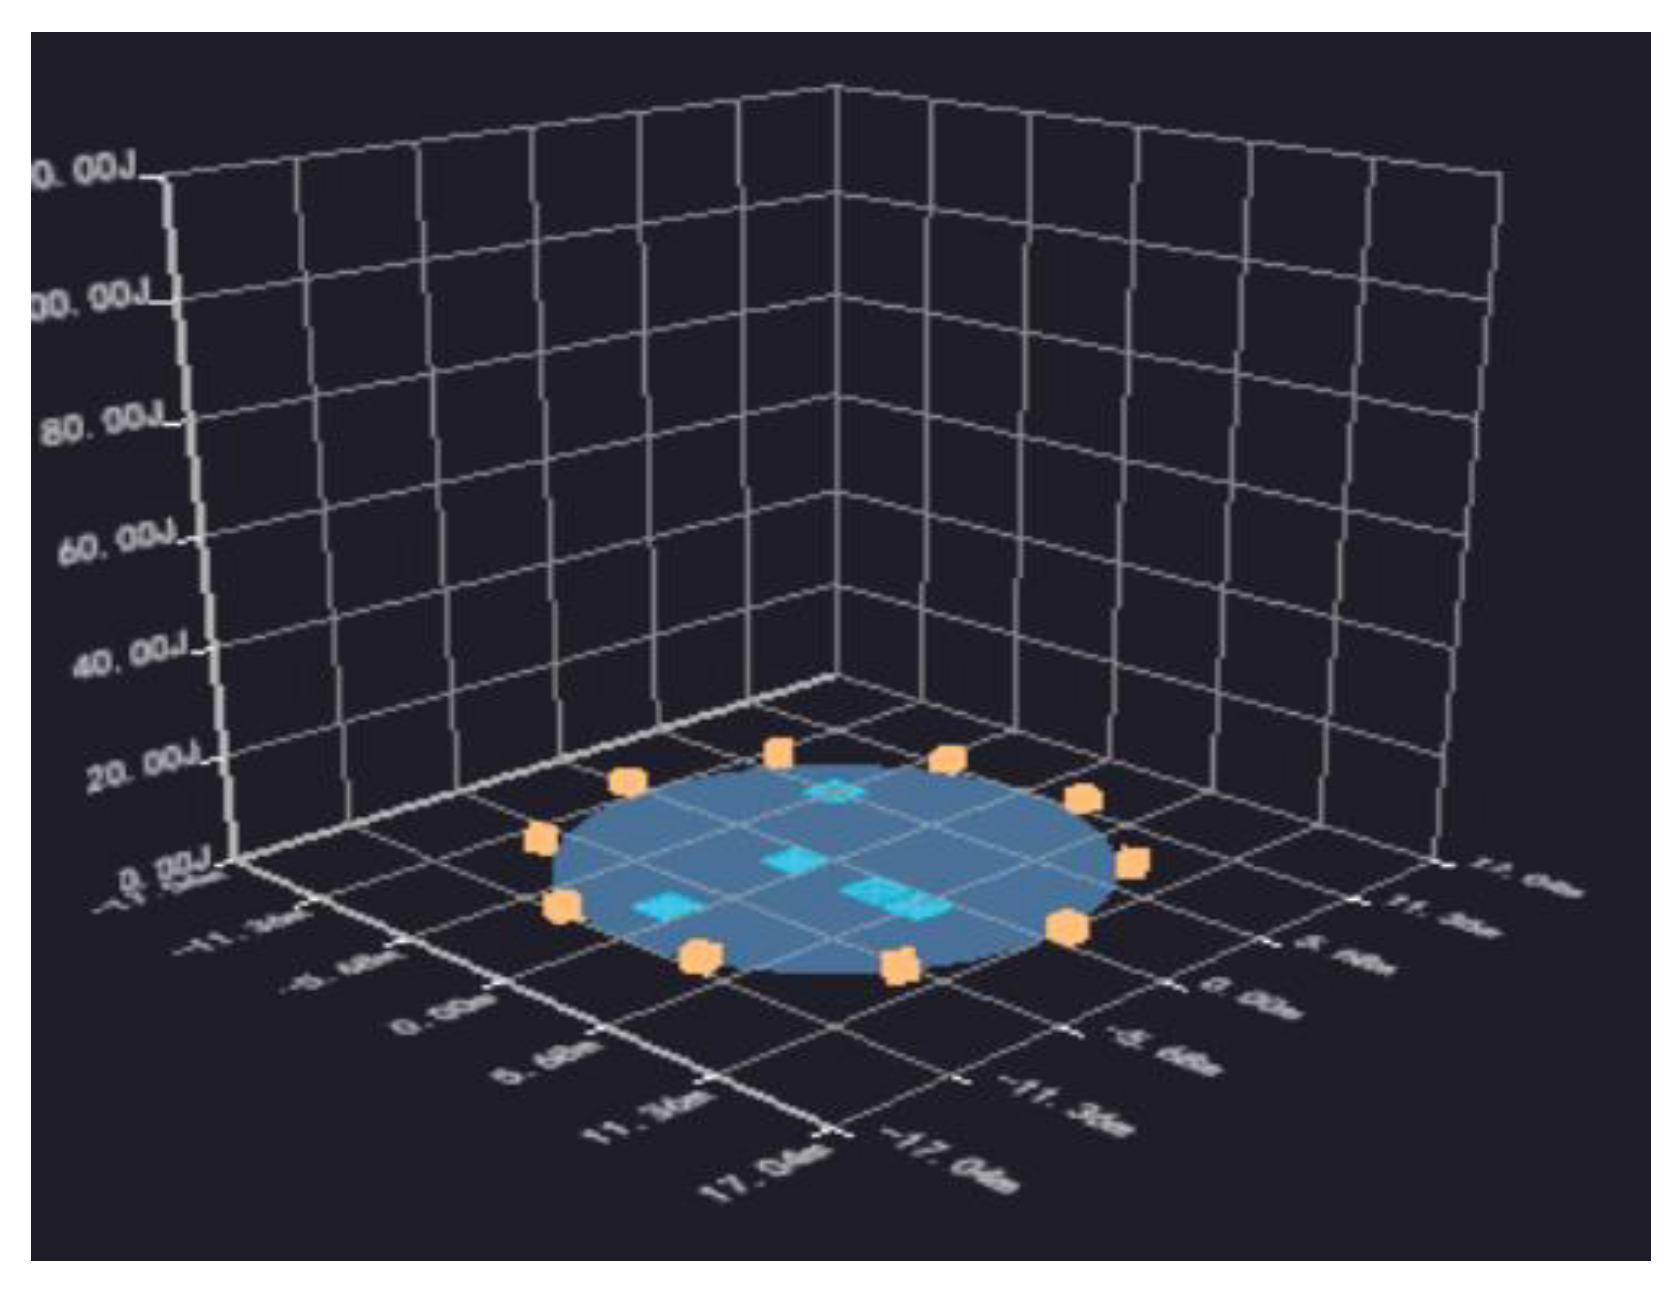
Figure 13.
Open-tank results of Oil tank B1.
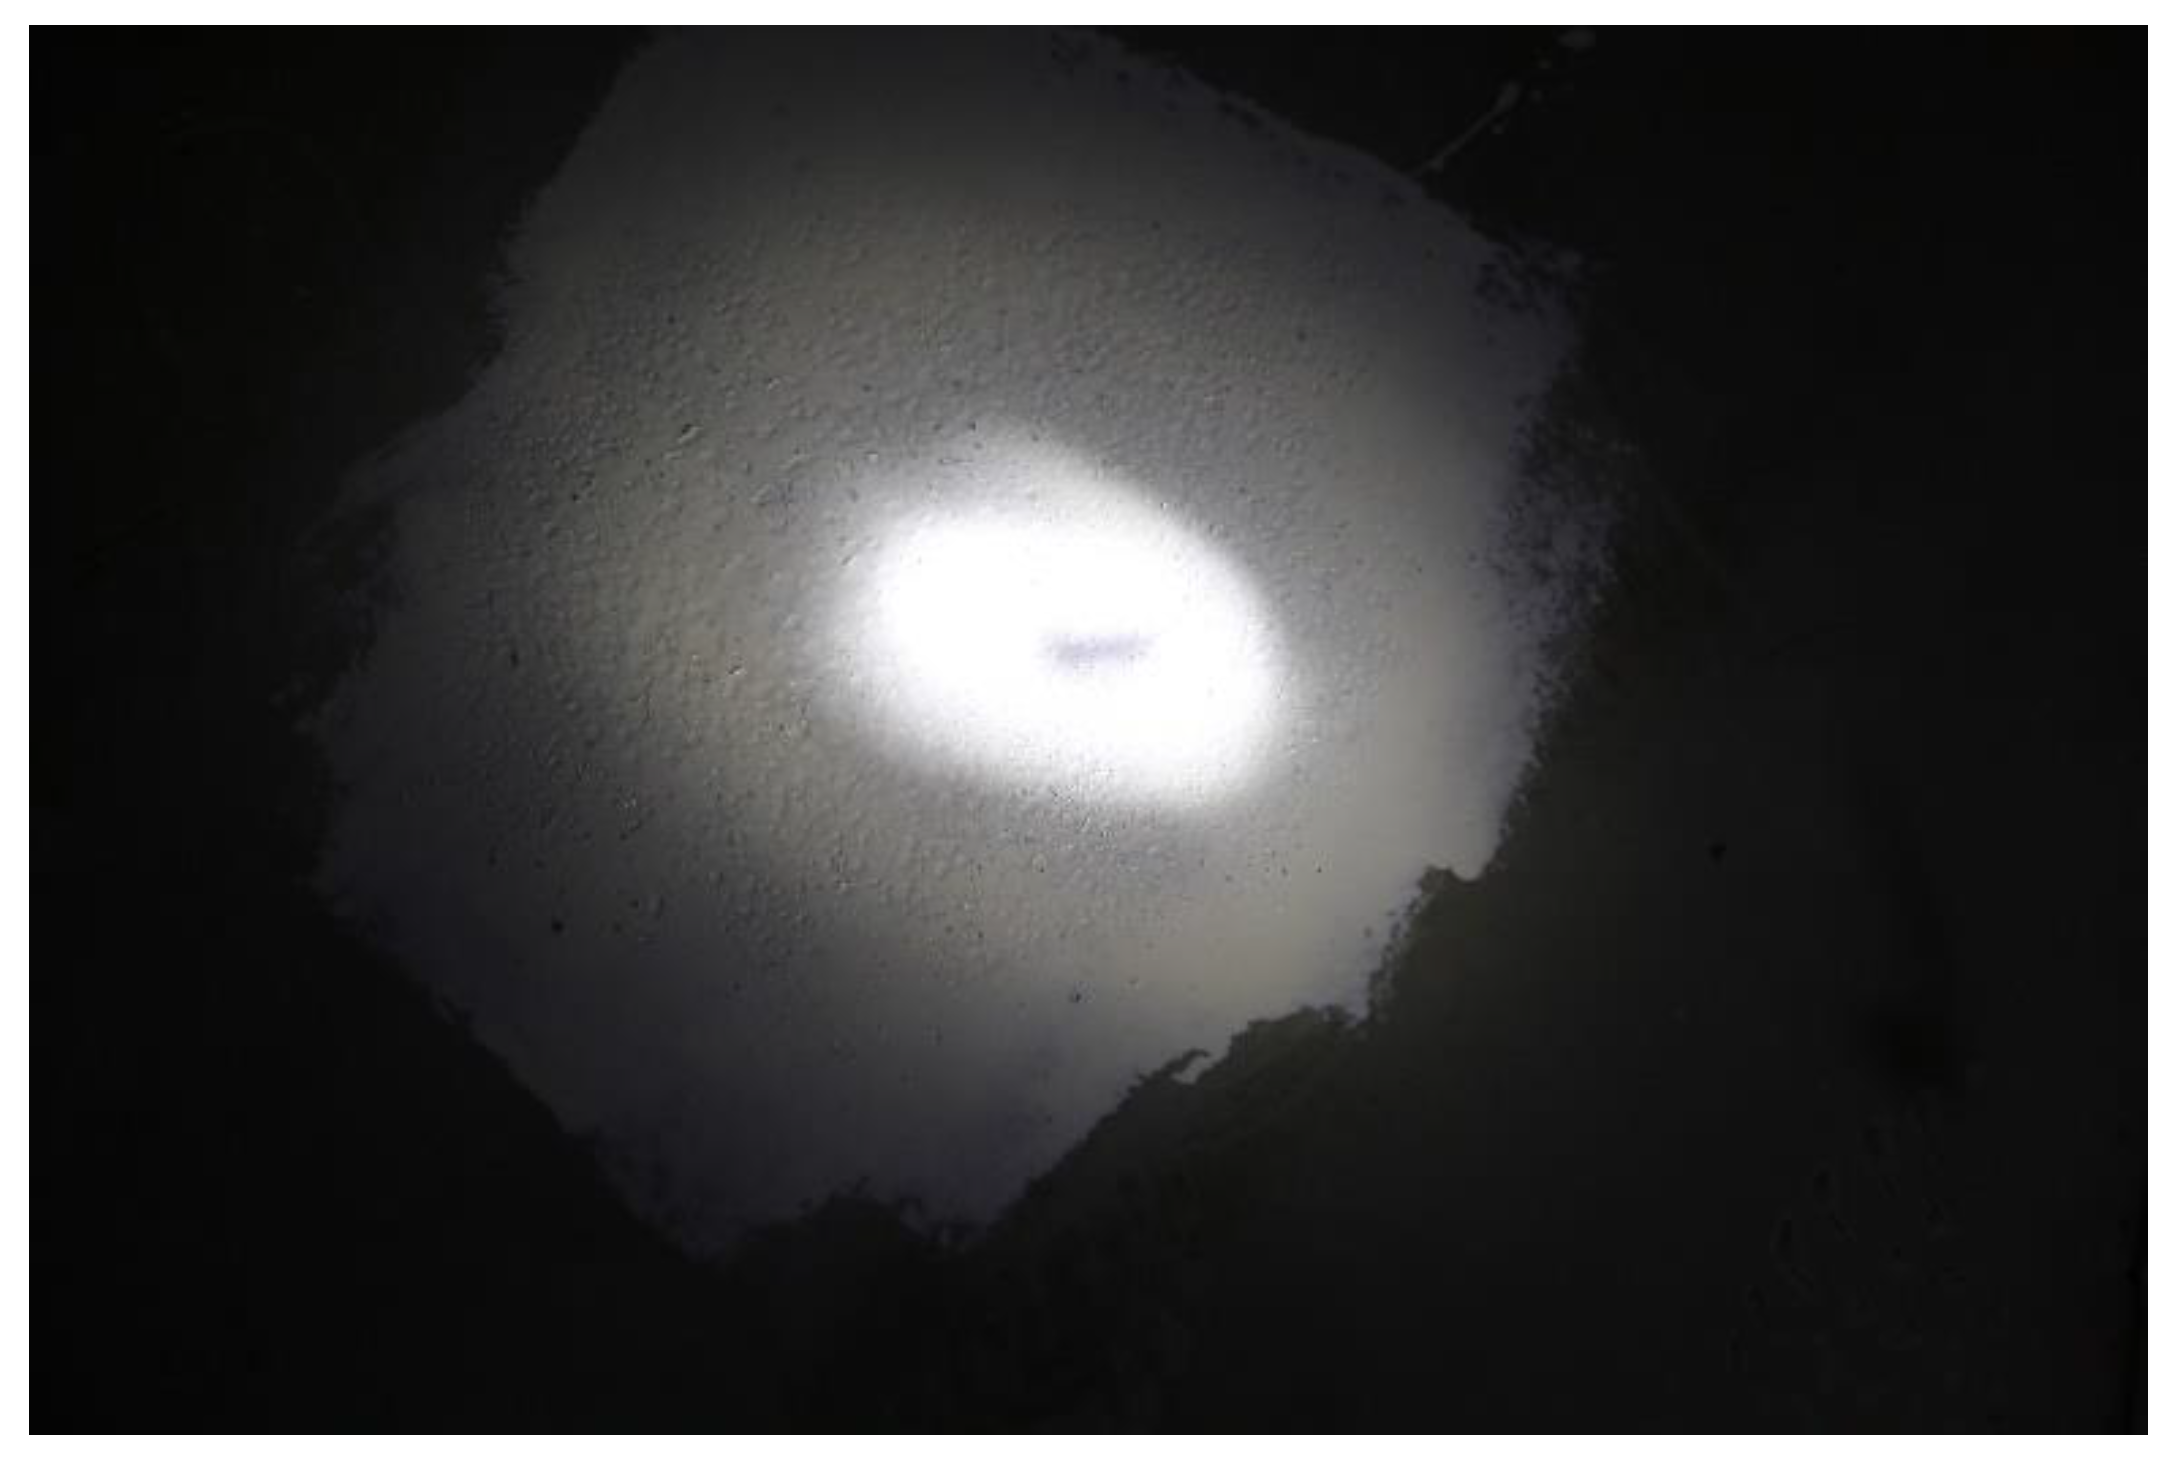
Figure 14.
Open-tank results of Oil tank A8.
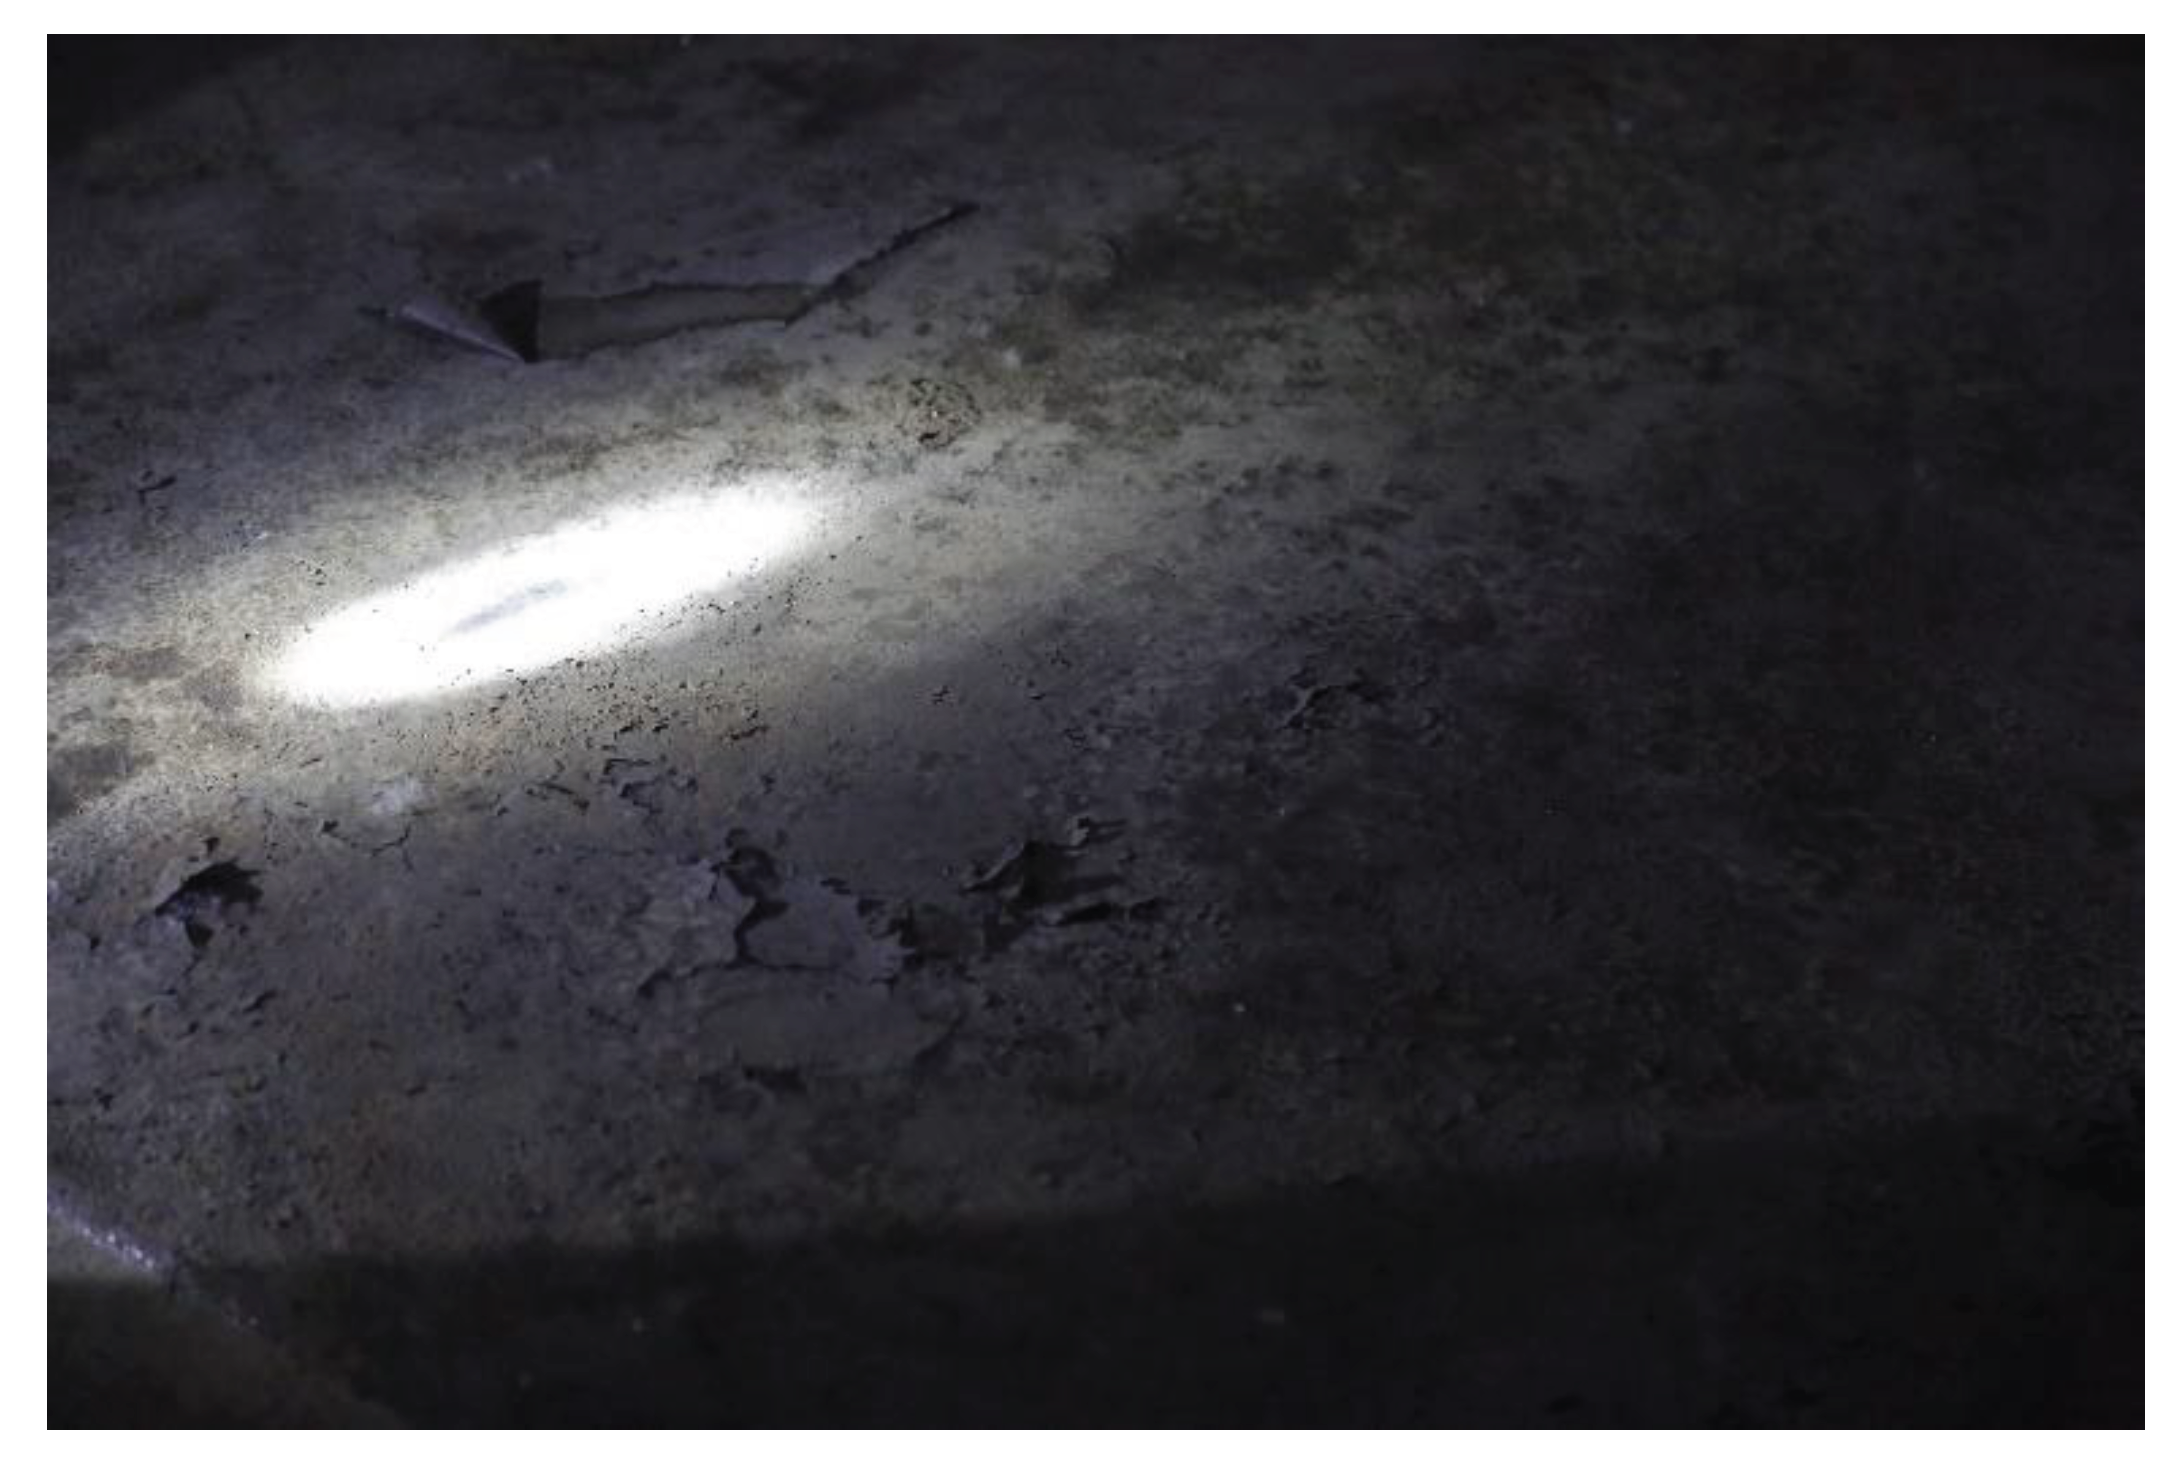
Table 2.
Performance parameters of explosion-proof acoustic emission instrument.
| Type | Parameter |
|---|---|
| Sampling rate | ≥1MHz |
| Number field of channels | 1×15 |
| Test frequency range | 30~60kHz |
| Storage capacity | ≥32GB |
| Communication interface | Network interface /100M |
| Time of continuous work | ≥6h |
| Explosion-proof identification | All certified to meet |
Table 4.
B1 oil tank lead break test data.
| background noise <32dB | Simulated source distance /m | signal amplitude /dB |
| threshold level /35dB | 0.5 | 61 |
| 1 | 57 | |
| 1.5 | 54 | |
| gain /40dB | 2 | 51 |
| 3 | 44 | |
| 4 | 42 | |
| simulated source: Standard broken lead | 6 | 40 |
| 9 | 38 | |
| 12 | 37 | |
| Maximum sensor spacing /m | 12 | |
| Attenuation measurement sensor number | No.1 | |
Table 5.
Results of acoustic emission test on the tank bottom plate of oil tank.
| number | classification | evaluation |
| B1 | Ⅱ | slight signs of localized corrosion |
| B2 | Ⅱ | slight signs of localized corrosion |
| B4 | Ⅱ | slight signs of localized corrosion |
| B5 | Ⅱ | slight signs of localized corrosion |
| B7 | Ⅱ | slight signs of localized corrosion |
| A8 | Ⅱ | slight signs of localized corrosion |
| A11 | Ⅱ | slight signs of localized corrosion |
| D2 | Ⅰ | No signs of local corrosion |
| D3 | Ⅰ | No signs of local corrosion |
| D4 | Ⅰ | No signs of local corrosion |
Table 6.
Comparison between acoustic emission test results and open tank test results of oil tanks.
| number | medium | Acoustic emission test results | Open tank test results | Comparison of corrosion location |
| B1 | diesel oil | II | No obvious corrosion. | — |
| A8 | aviation kerosene | II | Slight corrosion | The corrosion location is the same |
| A11 | diesel oil | II | Slight corrosion | The corrosion location is the same |
| D2 | diesel oil | I | No obvious corrosion. | — |
Disclaimer/Publisher’s Note: The statements, opinions and data contained in all publications are solely those of the individual author(s) and contributor(s) and not of MDPI and/or the editor(s). MDPI and/or the editor(s) disclaim responsibility for any injury to people or property resulting from any ideas, methods, instructions or products referred to in the content. |
© 2024 by the authors. Licensee MDPI, Basel, Switzerland. This article is an open access article distributed under the terms and conditions of the Creative Commons Attribution (CC BY) license (http://creativecommons.org/licenses/by/4.0/).
Copyright: This open access article is published under a Creative Commons CC BY 4.0 license, which permit the free download, distribution, and reuse, provided that the author and preprint are cited in any reuse.


