
Submitted:
19 March 2024
Posted:
21 March 2024
You are already at the latest version
Abstract
The steep decline in the price of wind and solar photovoltaics provides a possibility to decarbonize electricity deeply and affordably. This study uses HOMER Pro energy modeling tool to model an optimized grid-connected renewable energy system for a community in southern Alberta, Canada. The study's goal is to identify the best renewable energy technology combinations that can provide electricity at the lowest levelized cost of energy (LCOE) and has lesser greenhouse gas emission as compared to the electricity produced by traditional fossil fuel. Gleichen, is a small town in southern Alberta and is near to numerous commercial wind and solar projects given the region’s high quality renewable resources. “Tri-brid” systems consisting of wind turbines, solar photovoltaics, and battery energy storage systems (BESS) are considered and compared based on electricity prices, net present cost, and greenhouse gas emissions savings. This tri-brid system is connected to the grid to sell excess electricity generated or buying electricity when there is less or no availability of solar and wind. The tri-brid energy system has an estimated LCOE of 0.0705 CAD/kWh which is competitive with the price of electricity generated by natural gas and coal which is 0.127 CAD/kWh.
Keywords:
Renewable Energy
; Cleaner Electricity
; LCOE
; HOMER Pro
; Alberta
; Canada
1. Introduction
The current global challenge for a more secure and sustainable electricity industry that reduces the effect of fossil fuel power plants on climate change has become a major issue. To address this issue, the International Energy Agency (IEA) has recommended the tripling renewable technologies and the reduction and eventual eradication of carbon-emission-based fuels such as coal, lignite, and oil from the power sector. In the Paris Agreement formed in 2015, signatories pledged to work on climate change mitigation, adaptation, and to form policies which could help in reducing the greenhouse gas (GHG) emissions. Canada is a participant in the Paris Agreement and has pledged to implement strategies to reach its goal of reducing CO2 emission by 40-45% of total CO2 emission by 2030 compared to 2005 levels. Most of Canada’s emission comes from the energy industries [1]. While the contribution of renewable energy technologies (RETs) to the electricity production mix (EPM) has increased, conventional and combined heat and power (CHP) power plants in Alberta still use coal and natural gas to meet about 90% of the region's energy needs, making it the biggest contributor to Canada's Total Carbon Emission (TCE) in electricity generation [2].
Alberta made a commitment in 2015 to gradually eliminate coal-fired power plants and to obtain 30% of the electricity generation from renewable sources by 2030. At the time of approval of the Renewable Energy Program (REP), approximately 10% of Alberta’s electricity generation was from renewable energy sources. According to the Alberta Electricity System Operator (AESO), the electricity derived from coal-based power plants was more than 60% of the total in the year 2016 [3].
Solar power is a renewable energy source that has become increasingly affordable over time, mainly due to the decreasing costs of solar photovoltaic (PV) systems. As a result, solar-generated electricity is now one of the most inexpensive sources of electricity globally. There has been a consistent increase in grid-integrated PV Systems, which must be considered in the context of performance in cold regions in order to meet the electricity requirement of households and industries [4].
According to the Canadian Wind Energy Association [CanWEA], wind energy is the primary source of clean electricity generation in Canada. There were 21,900 megawatts (MW) of added wind power in Canada in 2023, up from 444 MW in 2004.Wind energy is now among the least expensive options for new electricity development without subsidies, which makes wind energy investments more appealing than conventional sources of electricity. According to National Energy Board predictions, between 2017 and 2040, wind energy could account for 27% of all new power production. Western Canada (Alberta, British Columbia, Manitoba, and Saskatchewan) has the highest wind resources in Canada and the investment in wind energy generation has steadily increased. In Alberta, wind energy ranks as the second-most significant new source of electricity, with $1.2 billion in private investment in five new wind energy developments in the last few years (Government of Alberta 2019) [5]. However, permanent magnets used in the synchronous generator of a wind turbine is a rare earth element and the price of it is very unstable, making it a less economically feasible solution [6].
The Siksika Nation, a group of three Indigenous nations in Canada, relies on diesel generators to generate electricity, which has major negative effects on the environment, including global warming, greenhouse gas emissions, air pollution, and water pollution. Climate change will have a significant influence on energy management of this group of Indigenous people of Canada [7,8]. Canada had over 670 megatons of CO2 emissions while per capita emission is 17.5 tons of CO2 year 2021 [9].
Different researchers have recently reported on various outcomes of hybrid renewable energy systems using HOMER Pro software used to evaluate the economic feasibility and viability of a technological project or process. For example, Mamoon Ur Rashid et al. (2022) analyzed a grid-connected hybrid renewable energy system (HRES) for remote area electrification [10]. The result indicated that the planned HRES will help in reducing the usage of conventional resources and support investment in renewable energy. Chong Li et al. (2018) investigated grid-connected systems with three different combinations: grid only, grid/PV system and grid/PV/battery in five different regions of China [11]. It was found that a grid/PV system was more economical and sustainable. Riayatsyah et al. (2022) determined that a hybrid energy system consisting of PV and wind turbines would reduce the cost of energy to CAD 0.0446/kWh from CAD 0.060/kWh [12]. Overall, the proposed hybrid energy system is able to meet 82% of electricity demand. Sarang Kapoor et al. (2021) studied the feasibility of a grid-connected PV system in a remote area of India, which had a low energy price of CAD 0.027/kWh compared to CAD 0.095/kWh and reduced Greenhouse Gas (GHG) emissions [12]. Das et al. (2021) compared two hybrid energy systems and concluded that on-grid systems have the best levelized cost of energy (LCOE) [13].

Table 1.
Previous Studies on Techno-Economic Analysis of Hybrid Energy System in Canada during 2018-2023.
Table 1.
Previous Studies on Techno-Economic Analysis of Hybrid Energy System in Canada during 2018-2023.
| Authors | Location | Contribution | Limitations | Reference |
|---|---|---|---|---|
| Z.Abdin et al. |
Squamish, British Columbia |
Hydrogen has more economic benefits over battery in terms of storage system. | High Levelized Cost of Energy, GHGs emissions not shown in results. |
[14] |
| Michela L. et al. |
Red Lake, Ontario | Alternative for fossil fuel-based electricity. | High NPC due to addition of Hydro in HRES. |
[15] |
| Arabzadeh S.et al. | Winnipeg, Manitoba | Diesel-based wind system with battery storage | Less than 1% of renewable energy fraction for the proposed model. |
[16] |
| Roshani K.et al. | Northern Manitoba |
Diesel-based hybrid energy system. | High LCOE, Payback period & GHGs emissions. |
[17] |
| Tazrin P. et al. |
Trout Lake, Alberta |
Fuel Cell based Pv/Battery /Wind hybrid energy system |
Comparison of current Energy price with derived LCOE not shown. |
[7] |
The study proposes the first tri-brid energy system for an Indigenous community in Southern Alberta.
The objectives of this approach are listed below.
- i
- To meet the electricity and heat demand, techno-economic analysis of grid connected tri-brid energy system consisting of PV, wind turbines and battery energy storage system were simulated for Siksika Nation community, near Gleichen, Alberta, Canada.
- ii
- Four different scenarios which are grid only, PV-grid, Wind turbine-grid and WT-PV-Grid were developed in HOMER and compared for the best combination of hybrid energy system, in accordance with Net Present Values (NPV), LCOE, Capital Expense (CAPEX), Operation Expense (OPEX) and emissions/year.
- iii
- To reduce the current electricity prices by generating renewable electricity.
2. Methodology
HOMER stands for Hybrid Optimization of Multiple Energy Resources. It was developed by the USA’s National Renewable Energy Laboratory (NREL) and now owned by UL Solutions, to develop and examine the sensitivity of each proposed hybrid model system for a particular location based on net present cost (NPC) and levelized cost of electricity (LCOE) [18]. An assessment of technical and economic aspects can be studied on stand-alone and grid-integrated systems. To determine the best feasible energy system combination can be carried out by this software. A modeled load along with different sizing of the components is provided to the software as input data and then HOMER finds the best system design in terms of NPC, LCOE, OPEX and module sizing. The core principles of HOMER are designing cost effective, reliable microgrids that combines renewable energy and conventional sources [10].
2.1. Site Selection and Load Profile
Gleichen is a hamlet located in Wheatland County in southeast Alberta, Canada. It is situated next to the Siksika Nation at the junction of Highway 1 and Highway 547, about 40 kilometers (25 miles) southeast of Strathmore. It is 903 meters above sea level. Details of the site can be seen in Table 2.
Table 2.
Data of the Proposed Location.
| Particulars | Description |
|---|---|
| Project Location | Gleichen, Alberta (Reserve Land) |
| Geographical Coordinates | 50° 52’0’’ N, 113°3’0’’ W |
| Population | 7800 + |
| Daily Average Solar Irradiance Average Solar Irradiance (Summer Solstice) Average Solar Irradiance (Winter Solstice) |
3.57 kWh/m2 5.88 kWh/m2 0.950 kWh/m2 |
| Annual Average Wind Speed | 5.90 m/s at 80m |
| Annual Wind Speed | 2153.5 m/s at 80m |
The potential sites for PV and wind turbines are shown in Figure 6. Approximately 15 acres of land is required for the capacity of this size. The size of the PV plant was determined by using the software “Helioscope”. Legend ‘A’ is the potential PV plant; ‘B’ denotes wind turbine installation site; ‘C’ is the town of Gleichen, and ‘D’ is Highway 547. From C to A, the distance is approximately 10 kilometers and from D to A, the distance is approximately 5 kilometers.
Figure 1.
Potential Site for PV and Wind Turbine Installation.
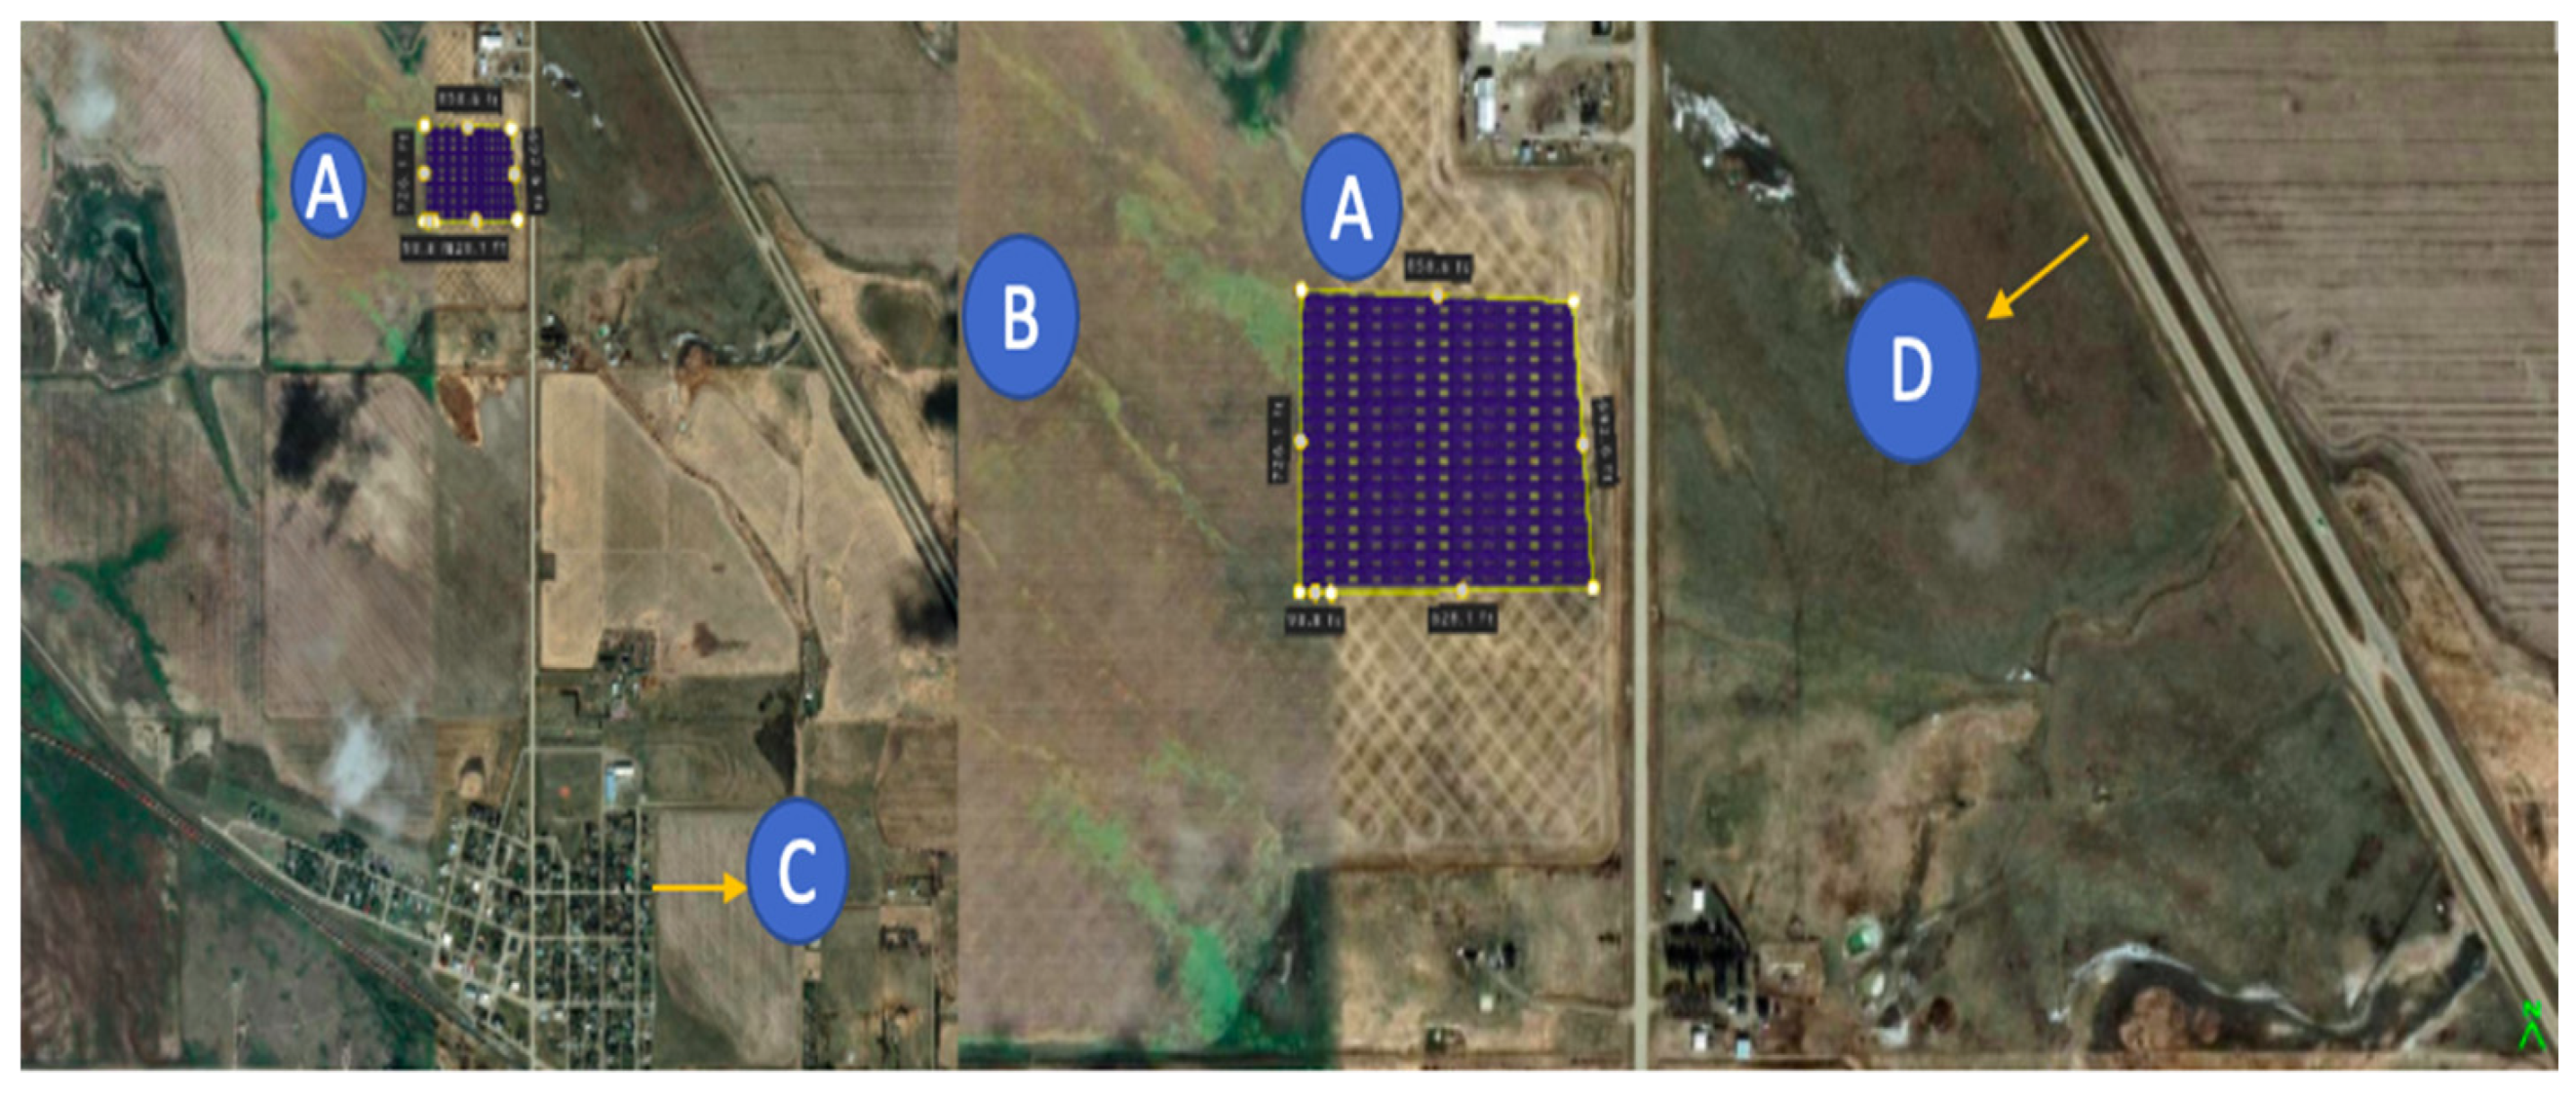
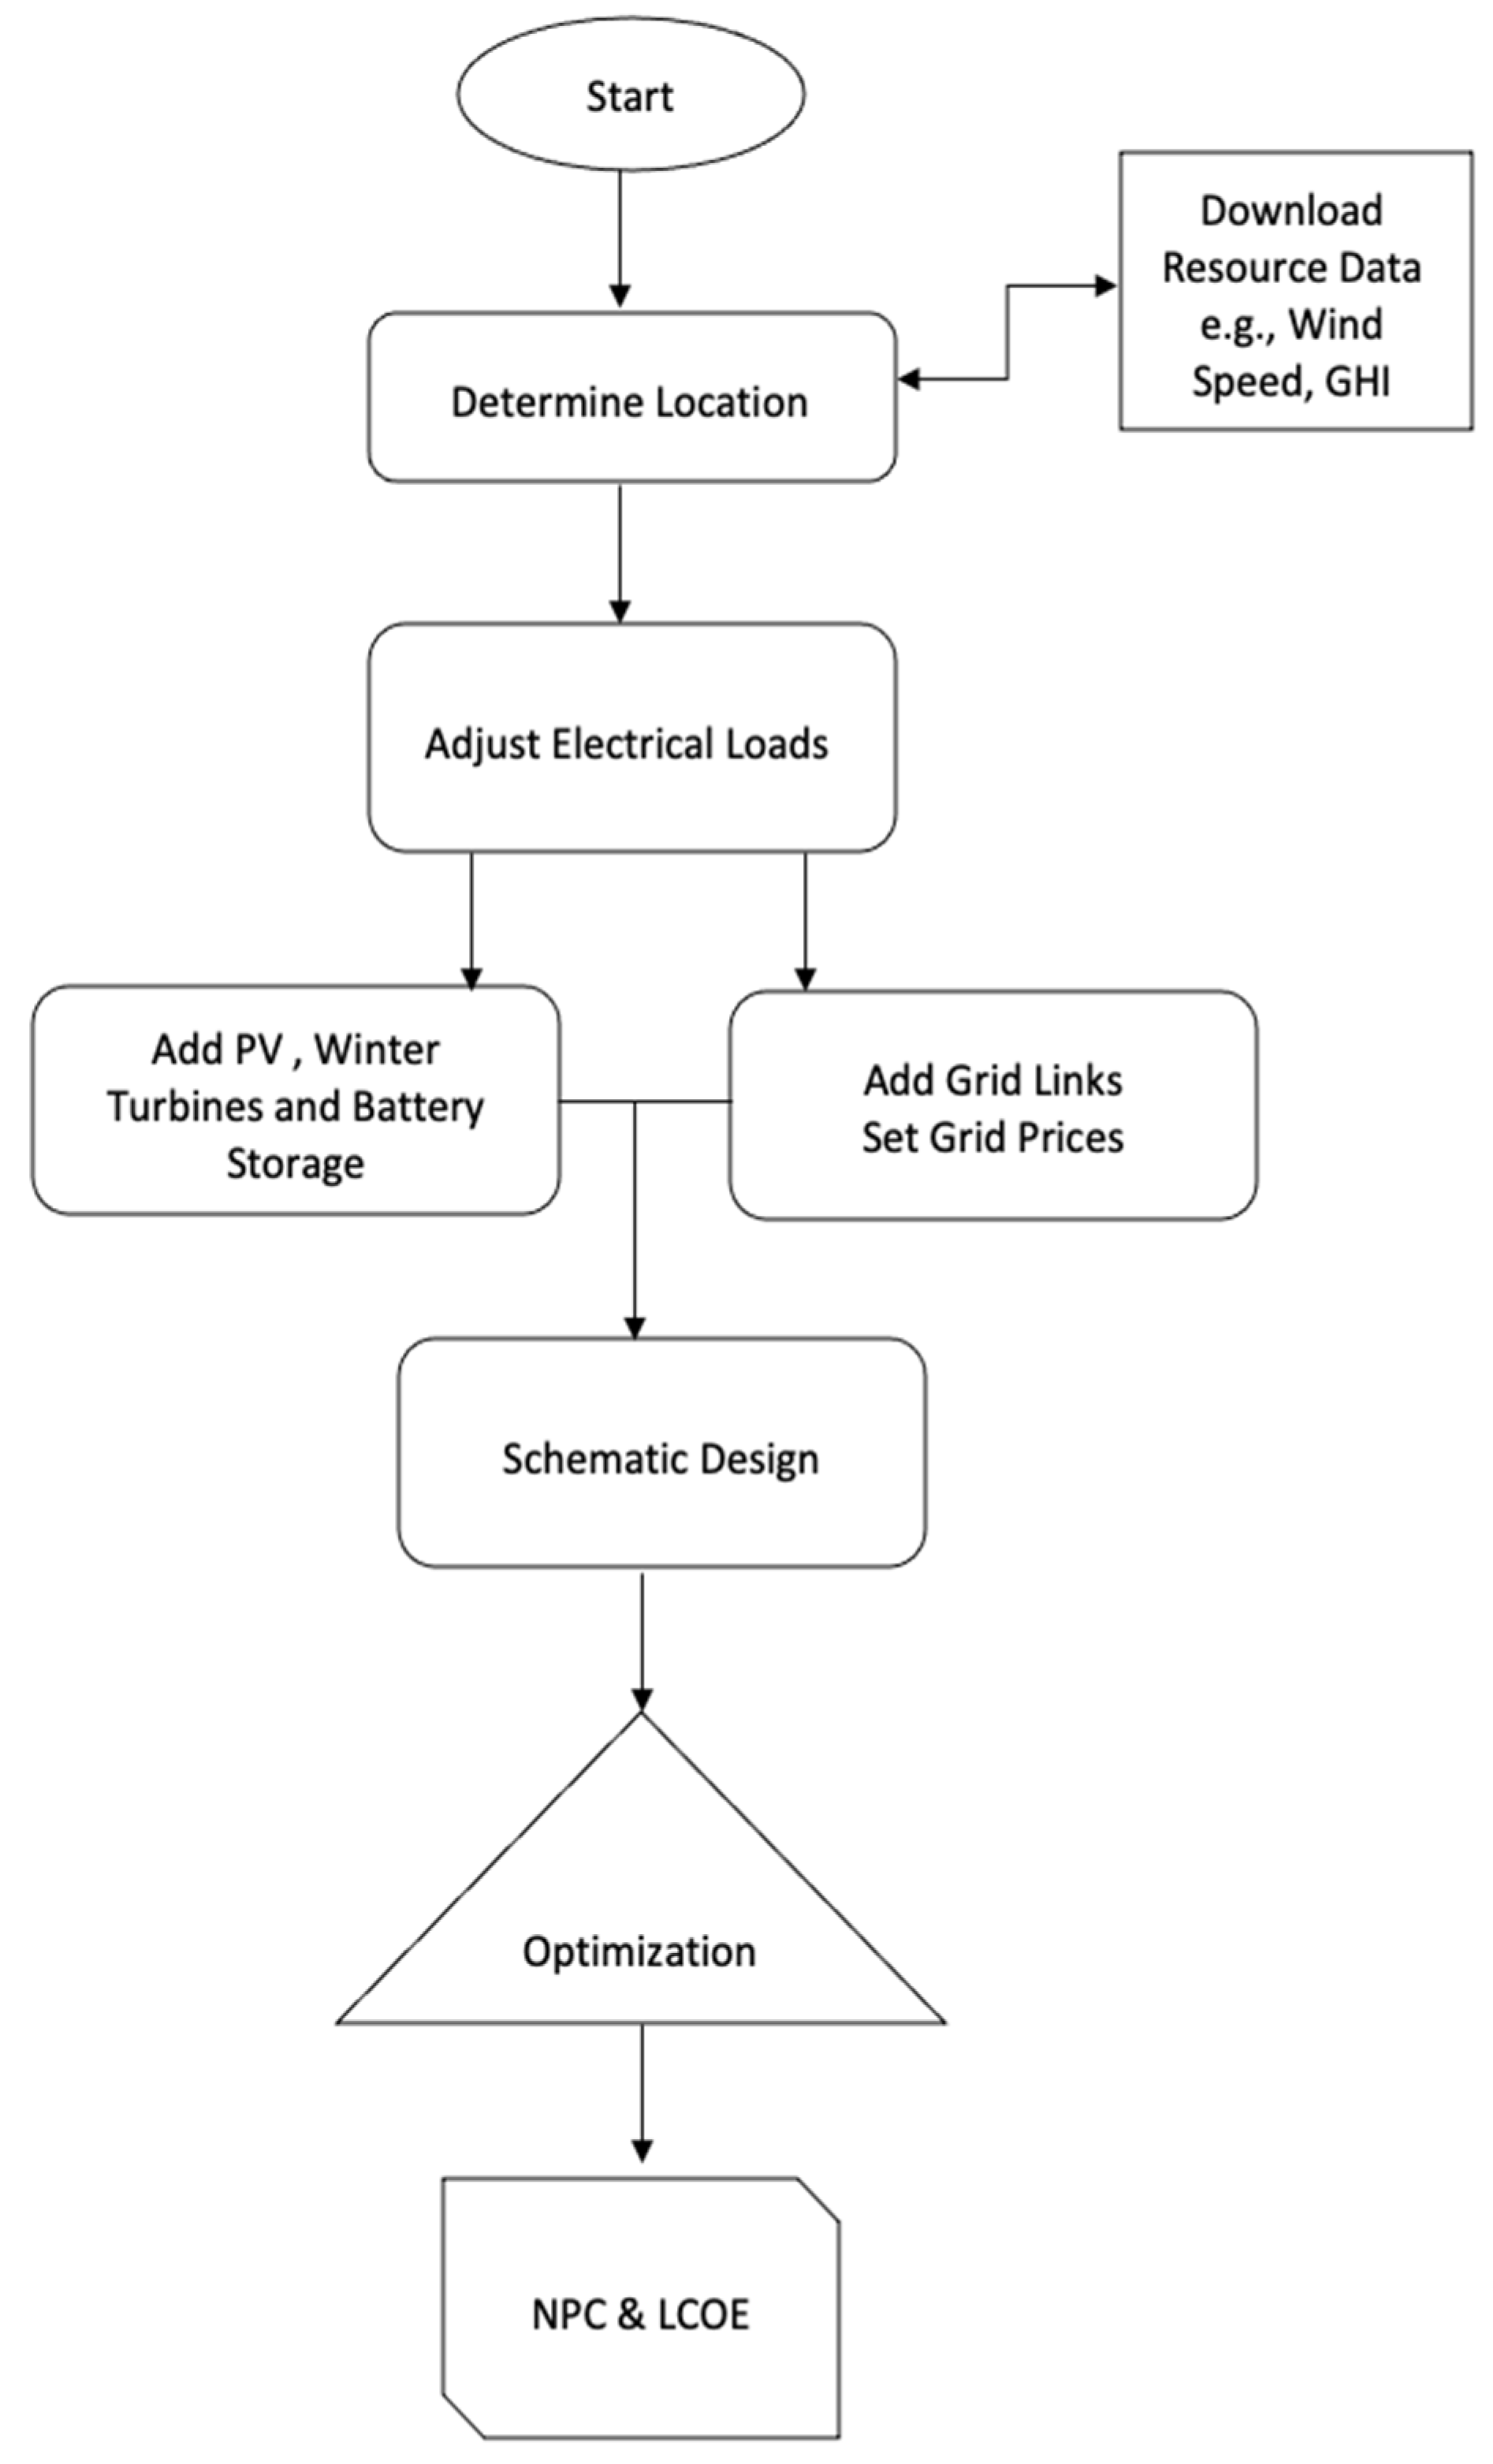
Figure 2.
Homer Pro Simulation Flowchart.
The solar energy potential in Alberta is among the highest in Canada, ranking second in the nation. It is estimated that Alberta has the capacity to produce 1,276 kilowatt-hours per kilowatt of solar PV(fixed axis ) output annually (Energy Hub 2023) [19]. Southern’s Alberta's potential for solar energy is higher than most other world cities such as Mumbai and Cape Town [4].
Figure 3.
Solar Potential Map of Southern Alberta.
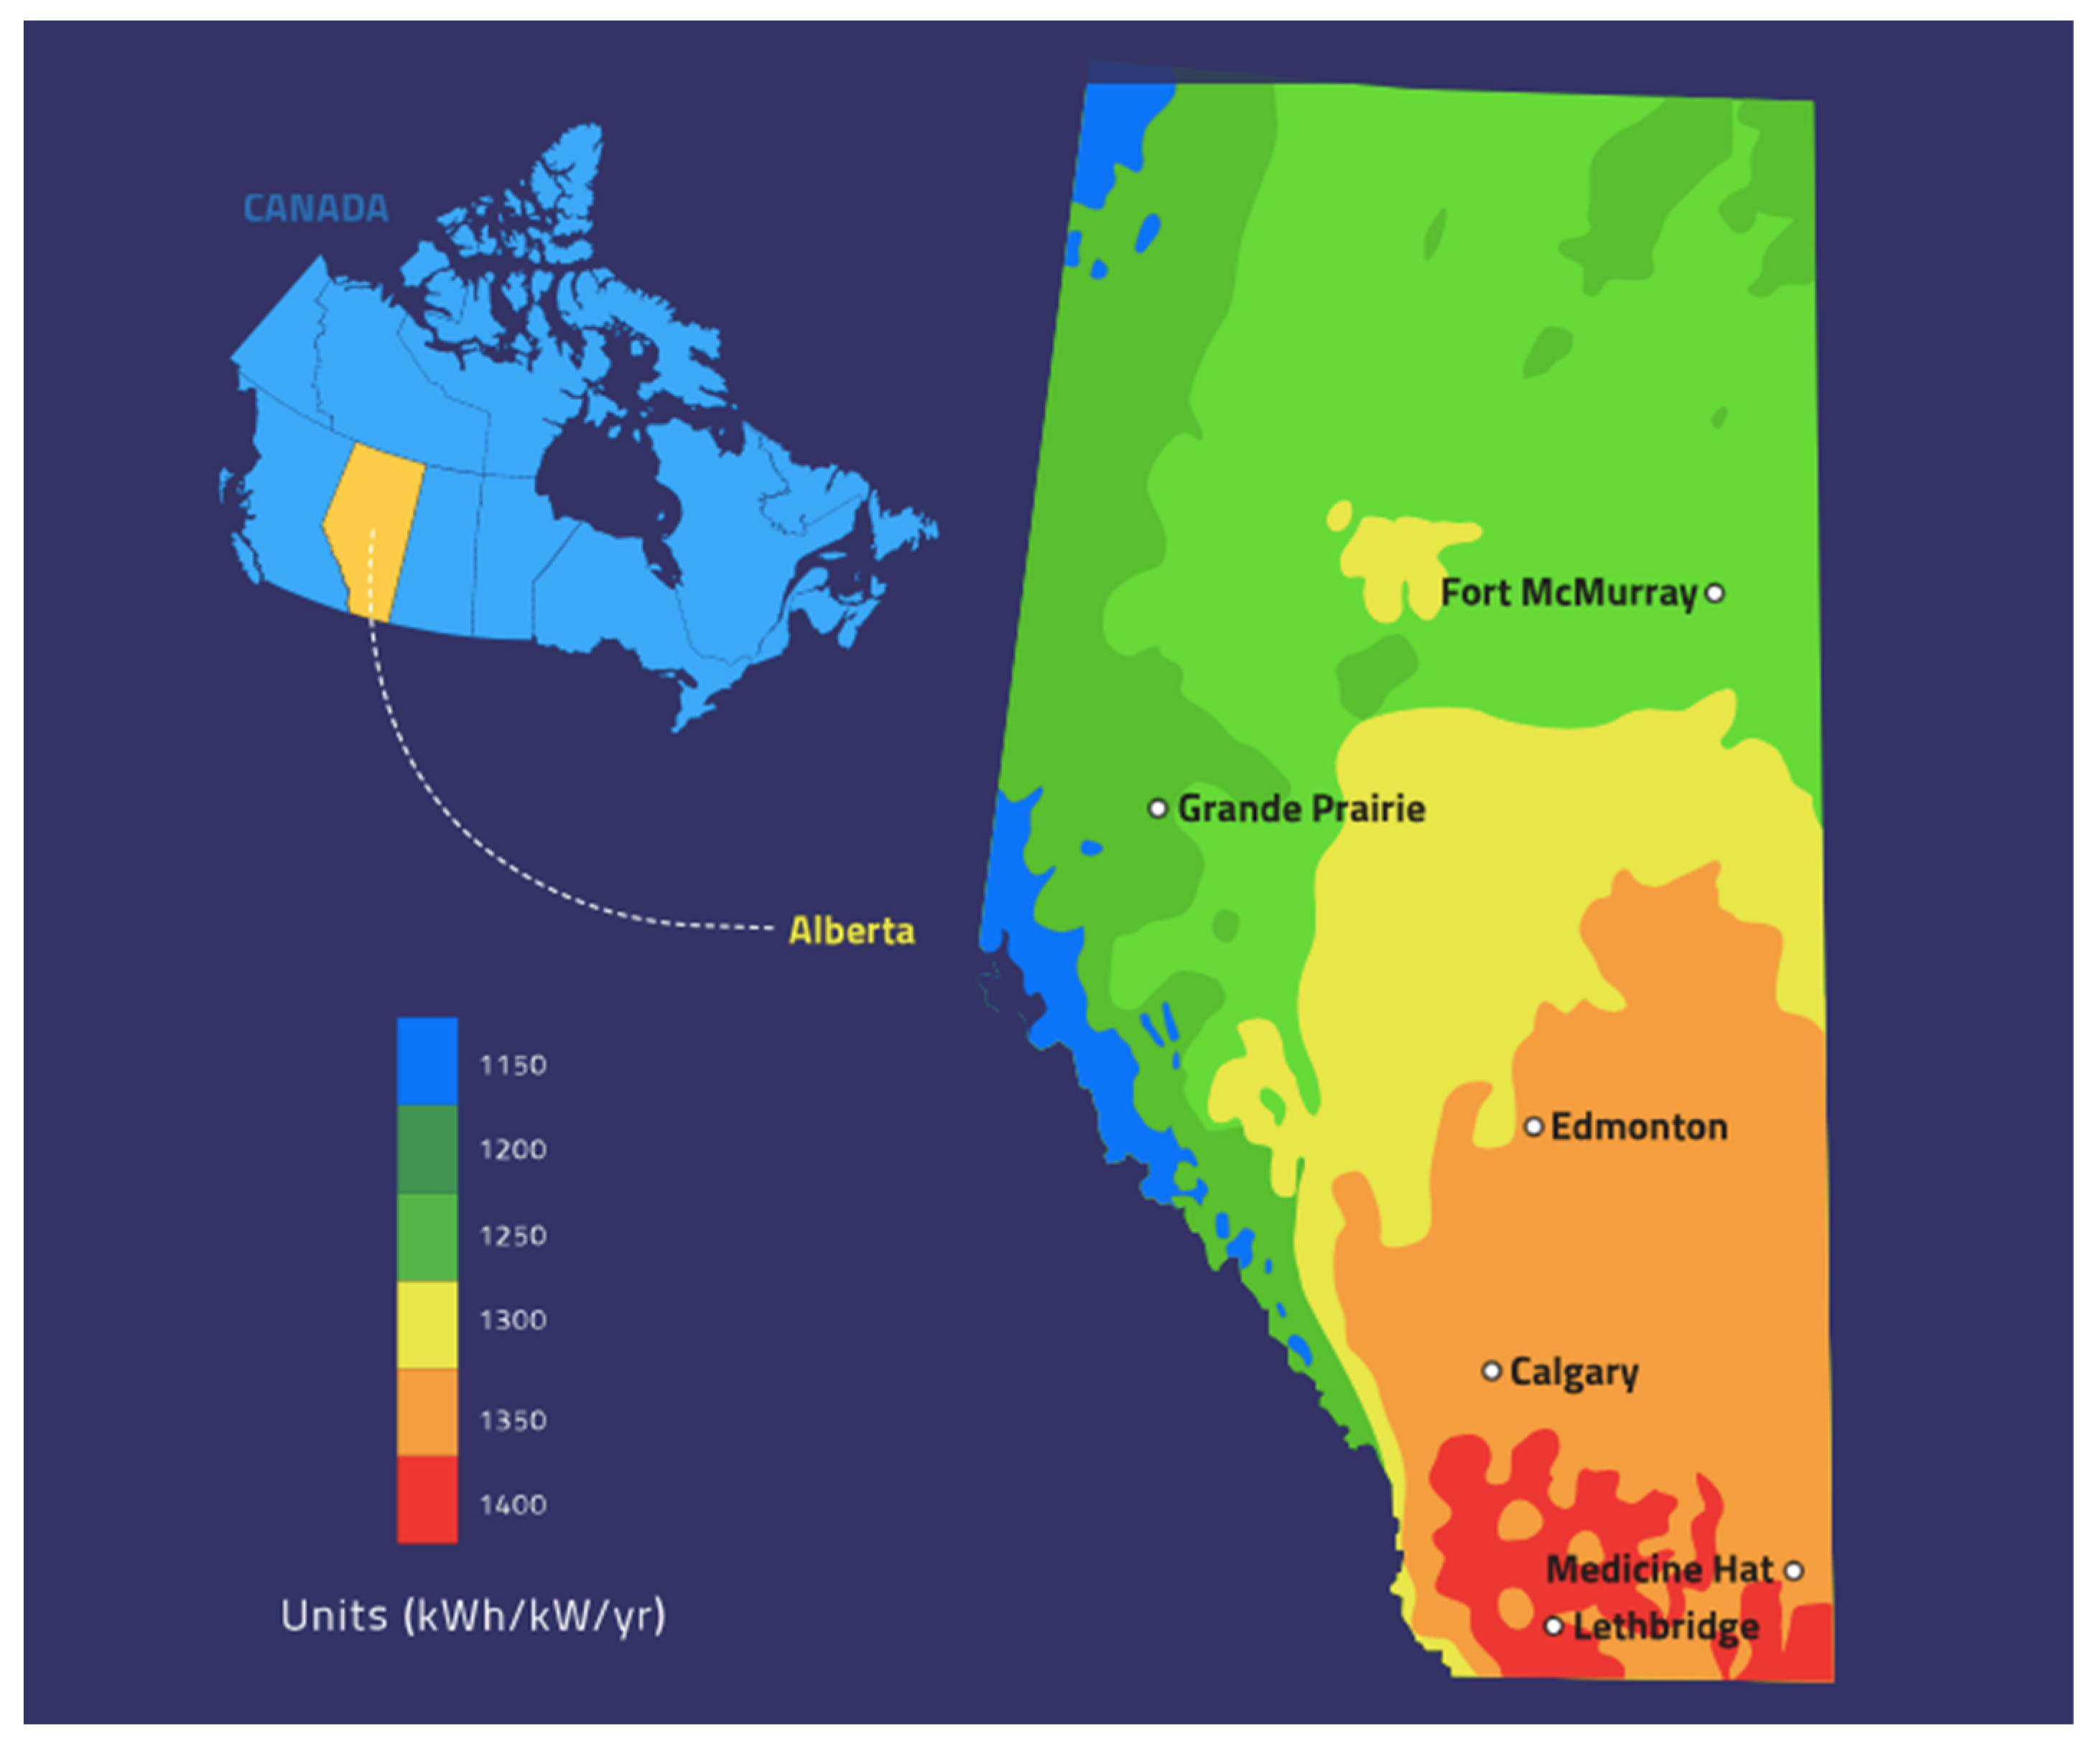
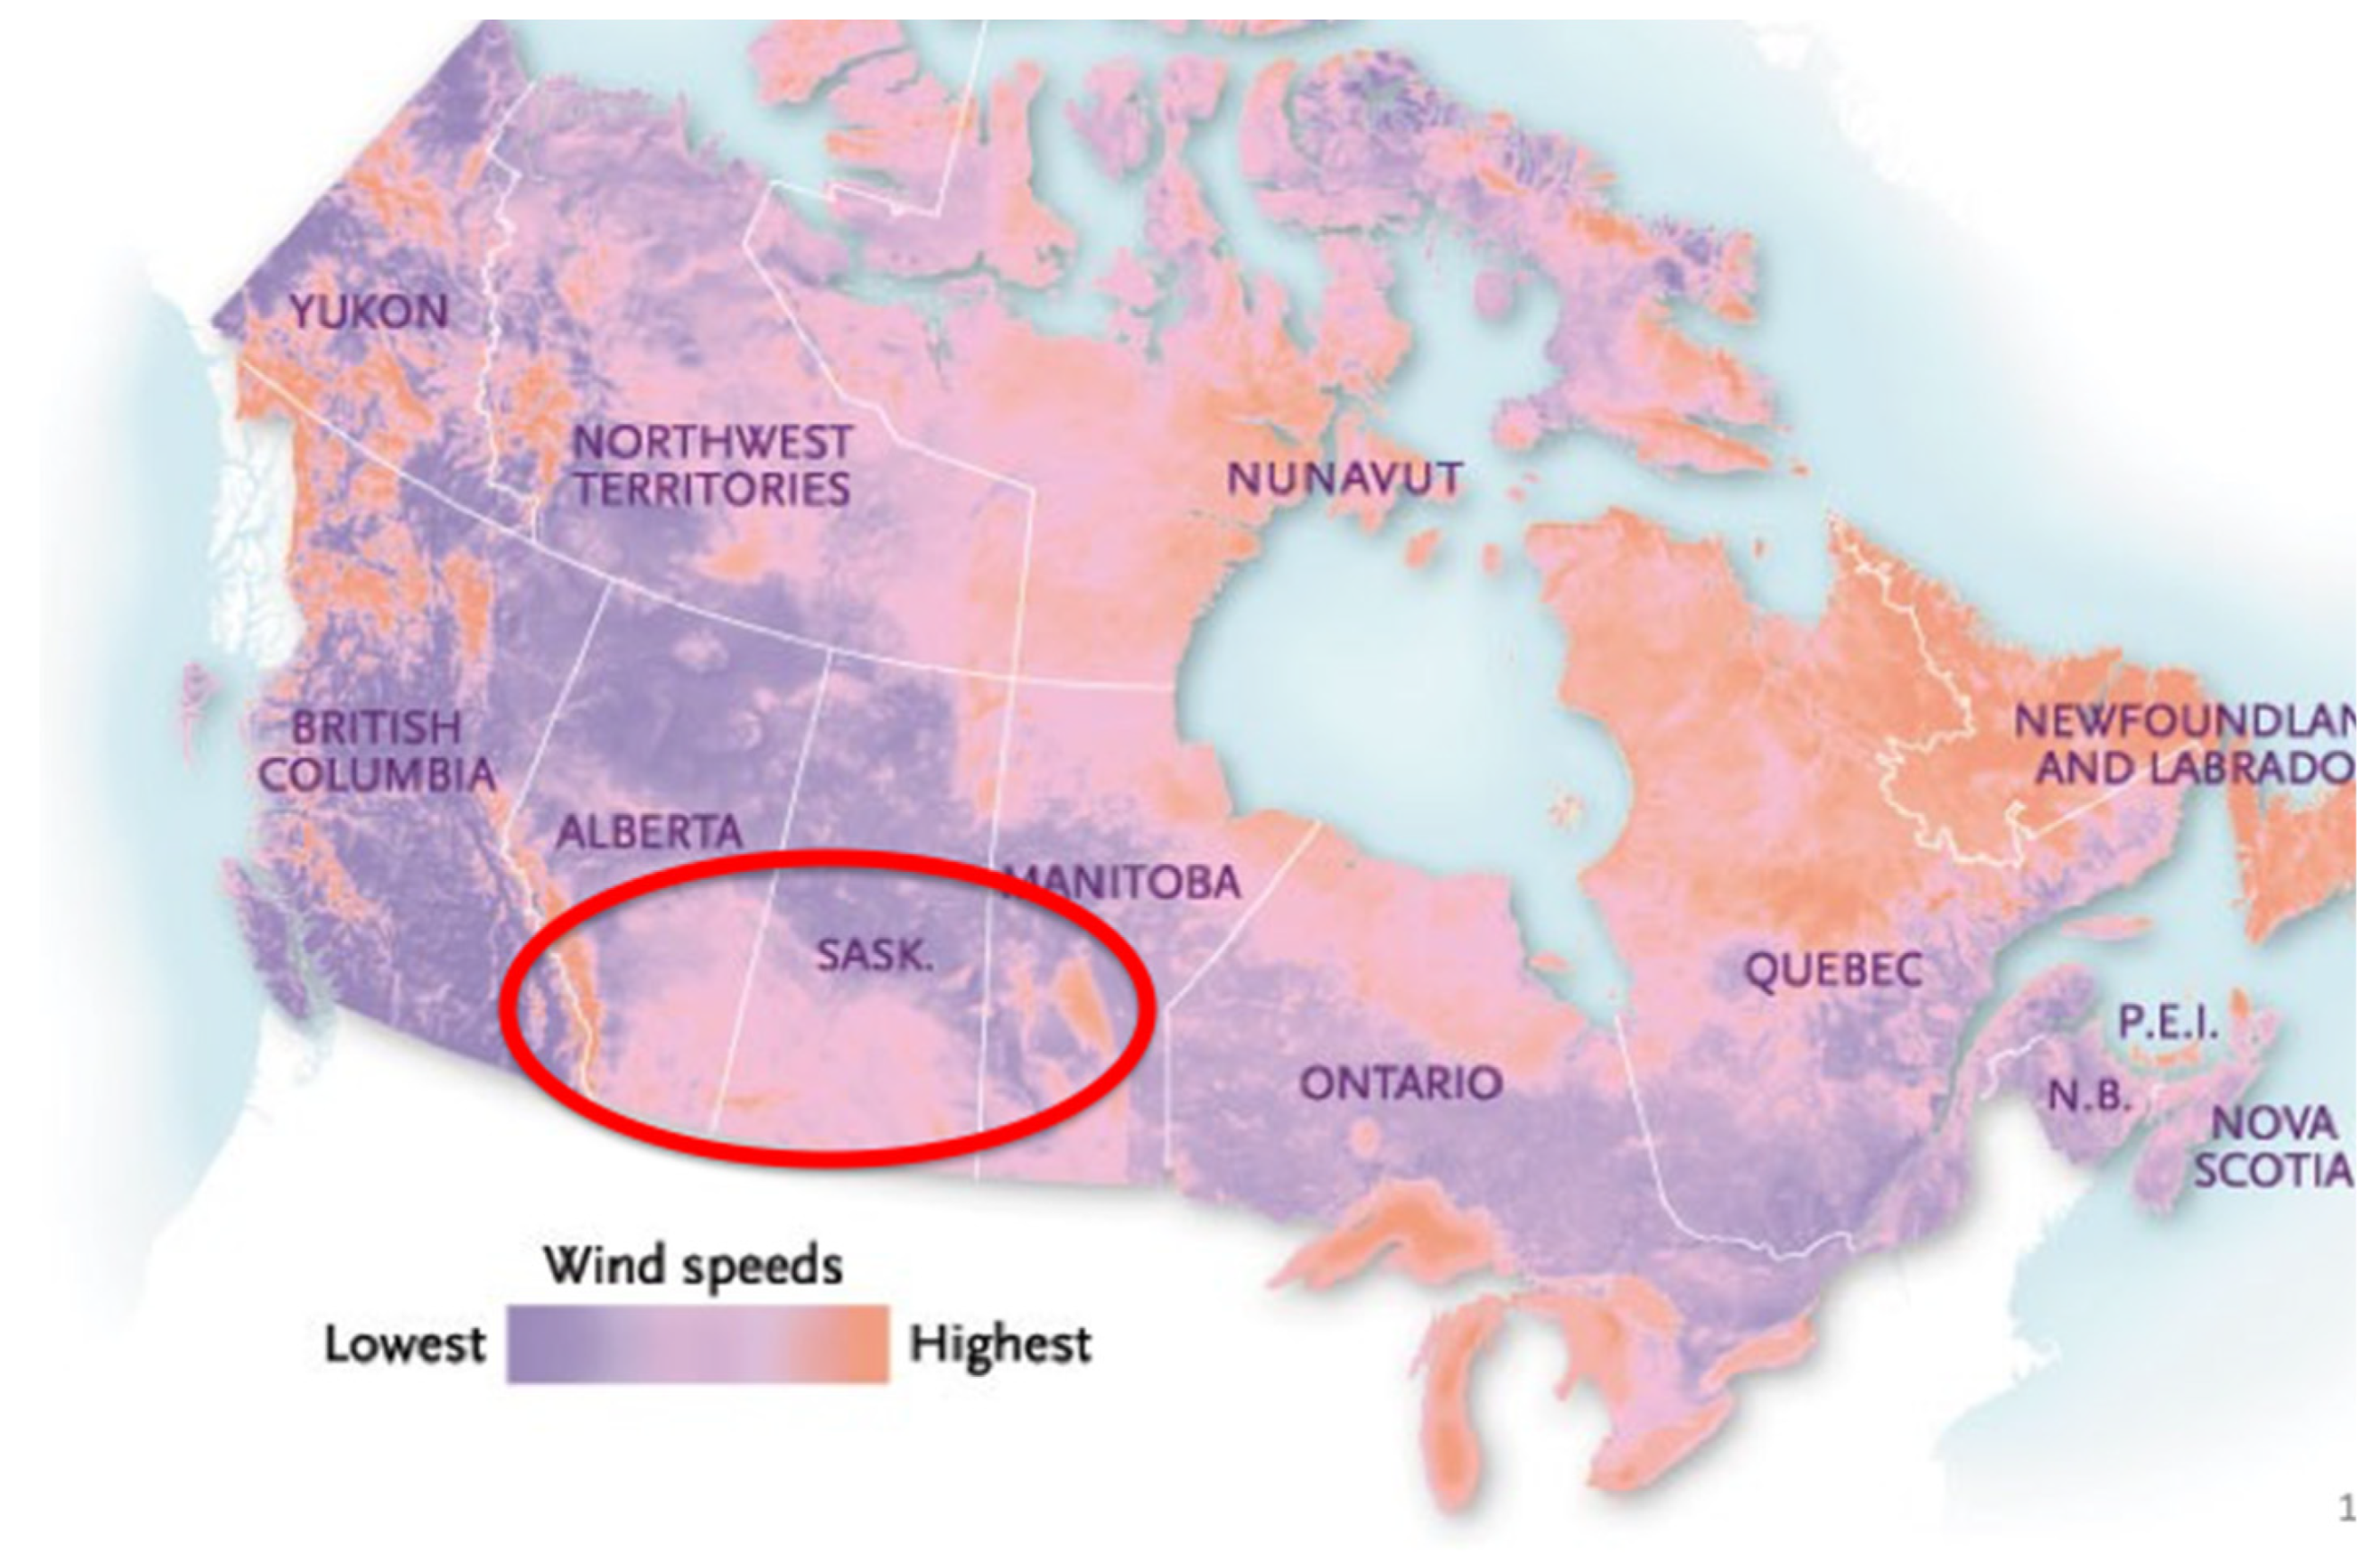
Figure 4.
Wind potential map of Southern Alberta.
2.2. Load Profile
To design the hybrid renewable system, it is crucial to estimate the energy demand of the residential houses. Siksika Nation has a population of approximately 7800 and around 1000 houses [20,21]. On average, a typical house in Canada consumes 37.5 kWh per day [22]. The load profile shown is modeled to meet the energy demands of more than 1000 houses and small-scale industries on Siksika Nation, and in the community beside it, Gleichen, Alberta. The peak load is modeled to be around 5.4 MW and average energy utilized would be 44.8 MWh/day. The load factor of this system is 0.35.The load factor is defined as the average load divided by the peak load in a specific period and ranges from 0-1. A higher load factor indicates a well-designed system.
Table 3.
AC Load parameters of Gleichen, Alberta.
| Metric | Baseline | Scaled |
|---|---|---|
| Average (kWh/day) | 44899 | 44899 |
| Average kW | 1870.83 | 1870.7 |
| Peak (kW/day) | 5412.12 | 5412 |
| Load Factor | 0.35 | 0.35 |
2.3. Wind Speed Data
Southern Alberta is mainly grassland with strong wind throughout the year. Gleichen’s wind speed data were collected from the NASA Prediction of Worldwide Energy Sources [23]. The annual average wind speed was found to be 5.90 m/s at a height of 50 m above the surface of the earth. The latitude and the longitude of the location were used to find the relevant data in the NASA database.
Figure 5.
Monthly Average Wind Speed in Gleichen, Alberta.
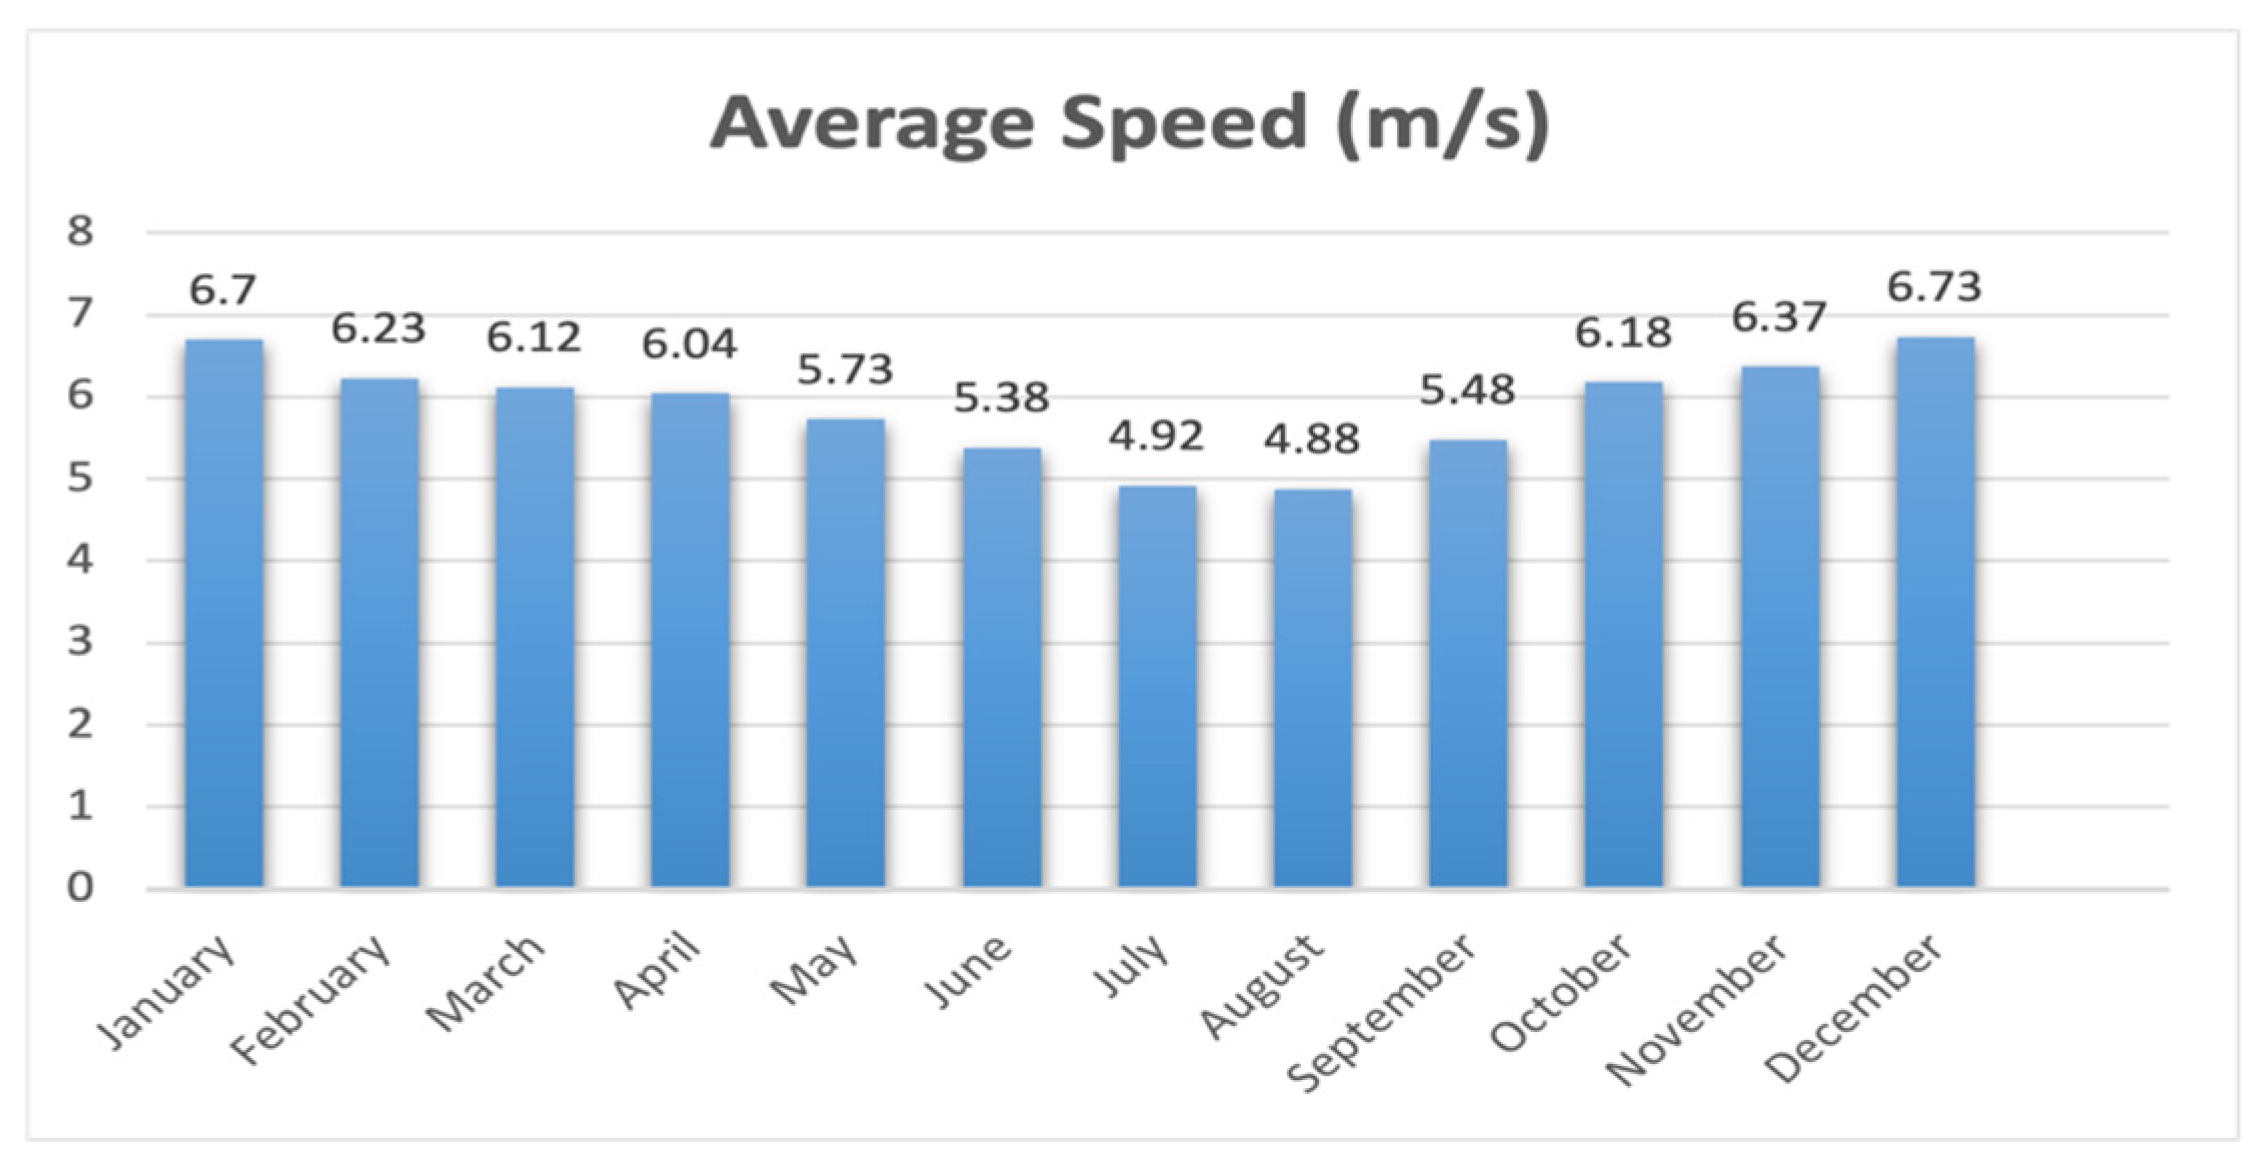
Figure 6.
Monthly Average Solar Global Horizontal Irradiance (GHI) in Gleichen, Alberta.
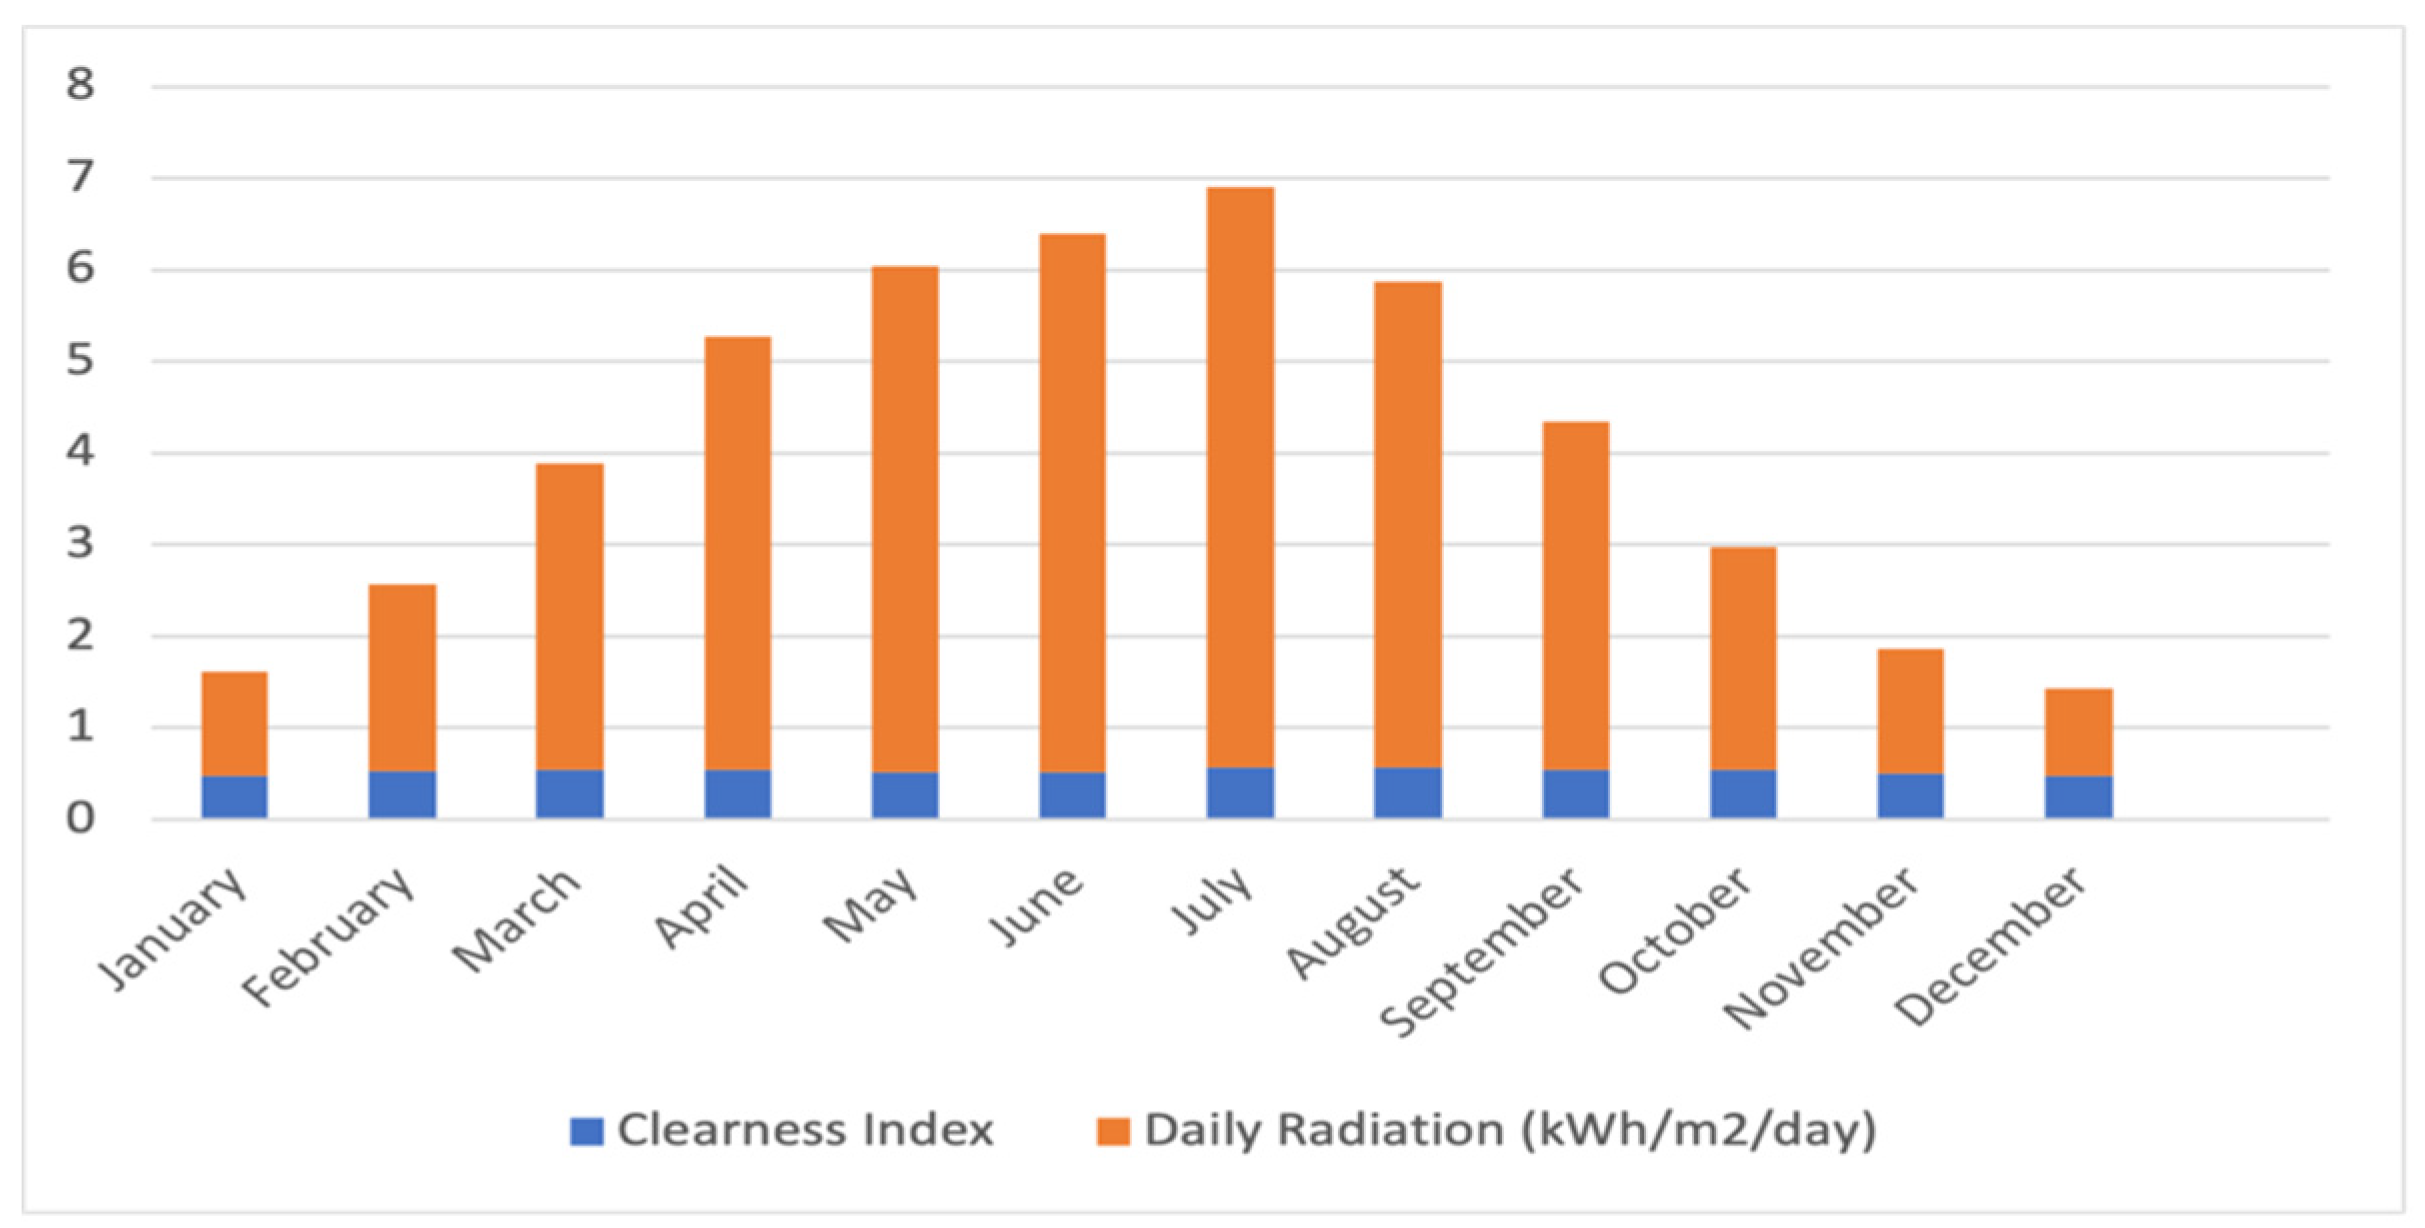
2.4. Solar GHI Data
Typical locations in Alberta have more than 2500 hours of sun yearly, exceeding most other regions in Canada. The daily radiation and clearness index data were obtained from NASA Prediction of Worldwide Energy Sources [23]. The annual average radiation is 3.57 kWh/m2/day. The clearness index is highest in July and lowest in January.
3. Mathematical Modeling
3.1. Solar Photovoltaic System
Osterwald method is the most used equation to show the output power of the PV calculated by the following equation (Osterwald 1986) [24]:
where Ppv is the PV’s generated power, N is the number of solar PV modules, Am is the area of the module in m2g is the generator's efficiency, and Gt is the global radiation on the tilted plane (W/m2).
Ppv = N × Am × m2g× Gt
3.2. Wind Turbine System
The estimation of wind power can be drawn by the following equation:
where P is the power generated by the wind turbine, v is the wind speed, ρ is the density of the air in kg/m3 and A is the cross-sectional area of the wind in m2.
3.3. Performance Factors for Techno-Economic Analysis
In the evaluation of the techno-economic feasibility for a system designed to maximize the use of renewable resources (high renewable fraction), key performance indicators, including economic metrics like LCOE and NPC, along with considerations for GHG emissions, are taken into account to ensure an optimal design.
3.3.1. Net Present Cost
The current total of all the expenditures incurred by the hybrid system during its specified useful life, minus the salvage value over that useful life, is its net present cost. The costs listed in the equation that are included in the net present cost are capital, replacement, operating, and maintenance costs. The costs listed in Eq.1 as capital, replacement, operation, and maintenance cost are also included in the net present cost. The provided system's components NPCs are calculated using the HOMER Pro software where Ccapital denotes the initial investment, Creplaces the cost of replacement, Cmaintain costs upkeep, and Csalvage denotes the cost of salvage [10].
NPC = ∑( Ccapital + Creplace + Cmaint − Csalvage)
3.3.2. Levelized Cost of Energy
The levelized cost of electricity is the average cost per kilowatt-hour of electrical energy produced by a specific system. LCOE is determined by the division of total annualized cost by the sum of LprimeAC and LprimeDC from the equation below in HOMER [10].
LCOE = Total annualized cost / (LprimeAC + LprimeDC)
LprimeAC = Alternating current primary load.
LprimeDC = Direct current main load.
3.3.3. Total Annualized Cost
It is described as the value that will occur annually over the course of the project's expected timeframe and is expected to provide the NPC that was connected to the component cash flow order. Using HOMER Pro software, the capital recovery factor is multiplied after the entire annualized cost has been determined using NPC [10].
3.4. System Strategy
3.4.1. National Grid Configuration
In grid-connected systems, the grid is used as a backup power source or as a means to sell unused power. It also serves to distribute power when the renewable energy source is insufficient, for example when there is no sunlight during nighttime to meet the load demand, and it draws power when there is a surplus. When operating off-grid, the system is supported by battery energy storage. The energy price was taken as an average from different electricity providers in Gleichen, Alberta, which include transmission and distribution charges at $0.127 CAD per kWh and the grid buying price of $0.065 CAD per kWh [25].The grid is capable of providing a maximum peak load of up to 2500 kW to ensure maximum contribution from BESS.
Figure 7.
Schematic Presentation of Grid and AC Load (Base Case).
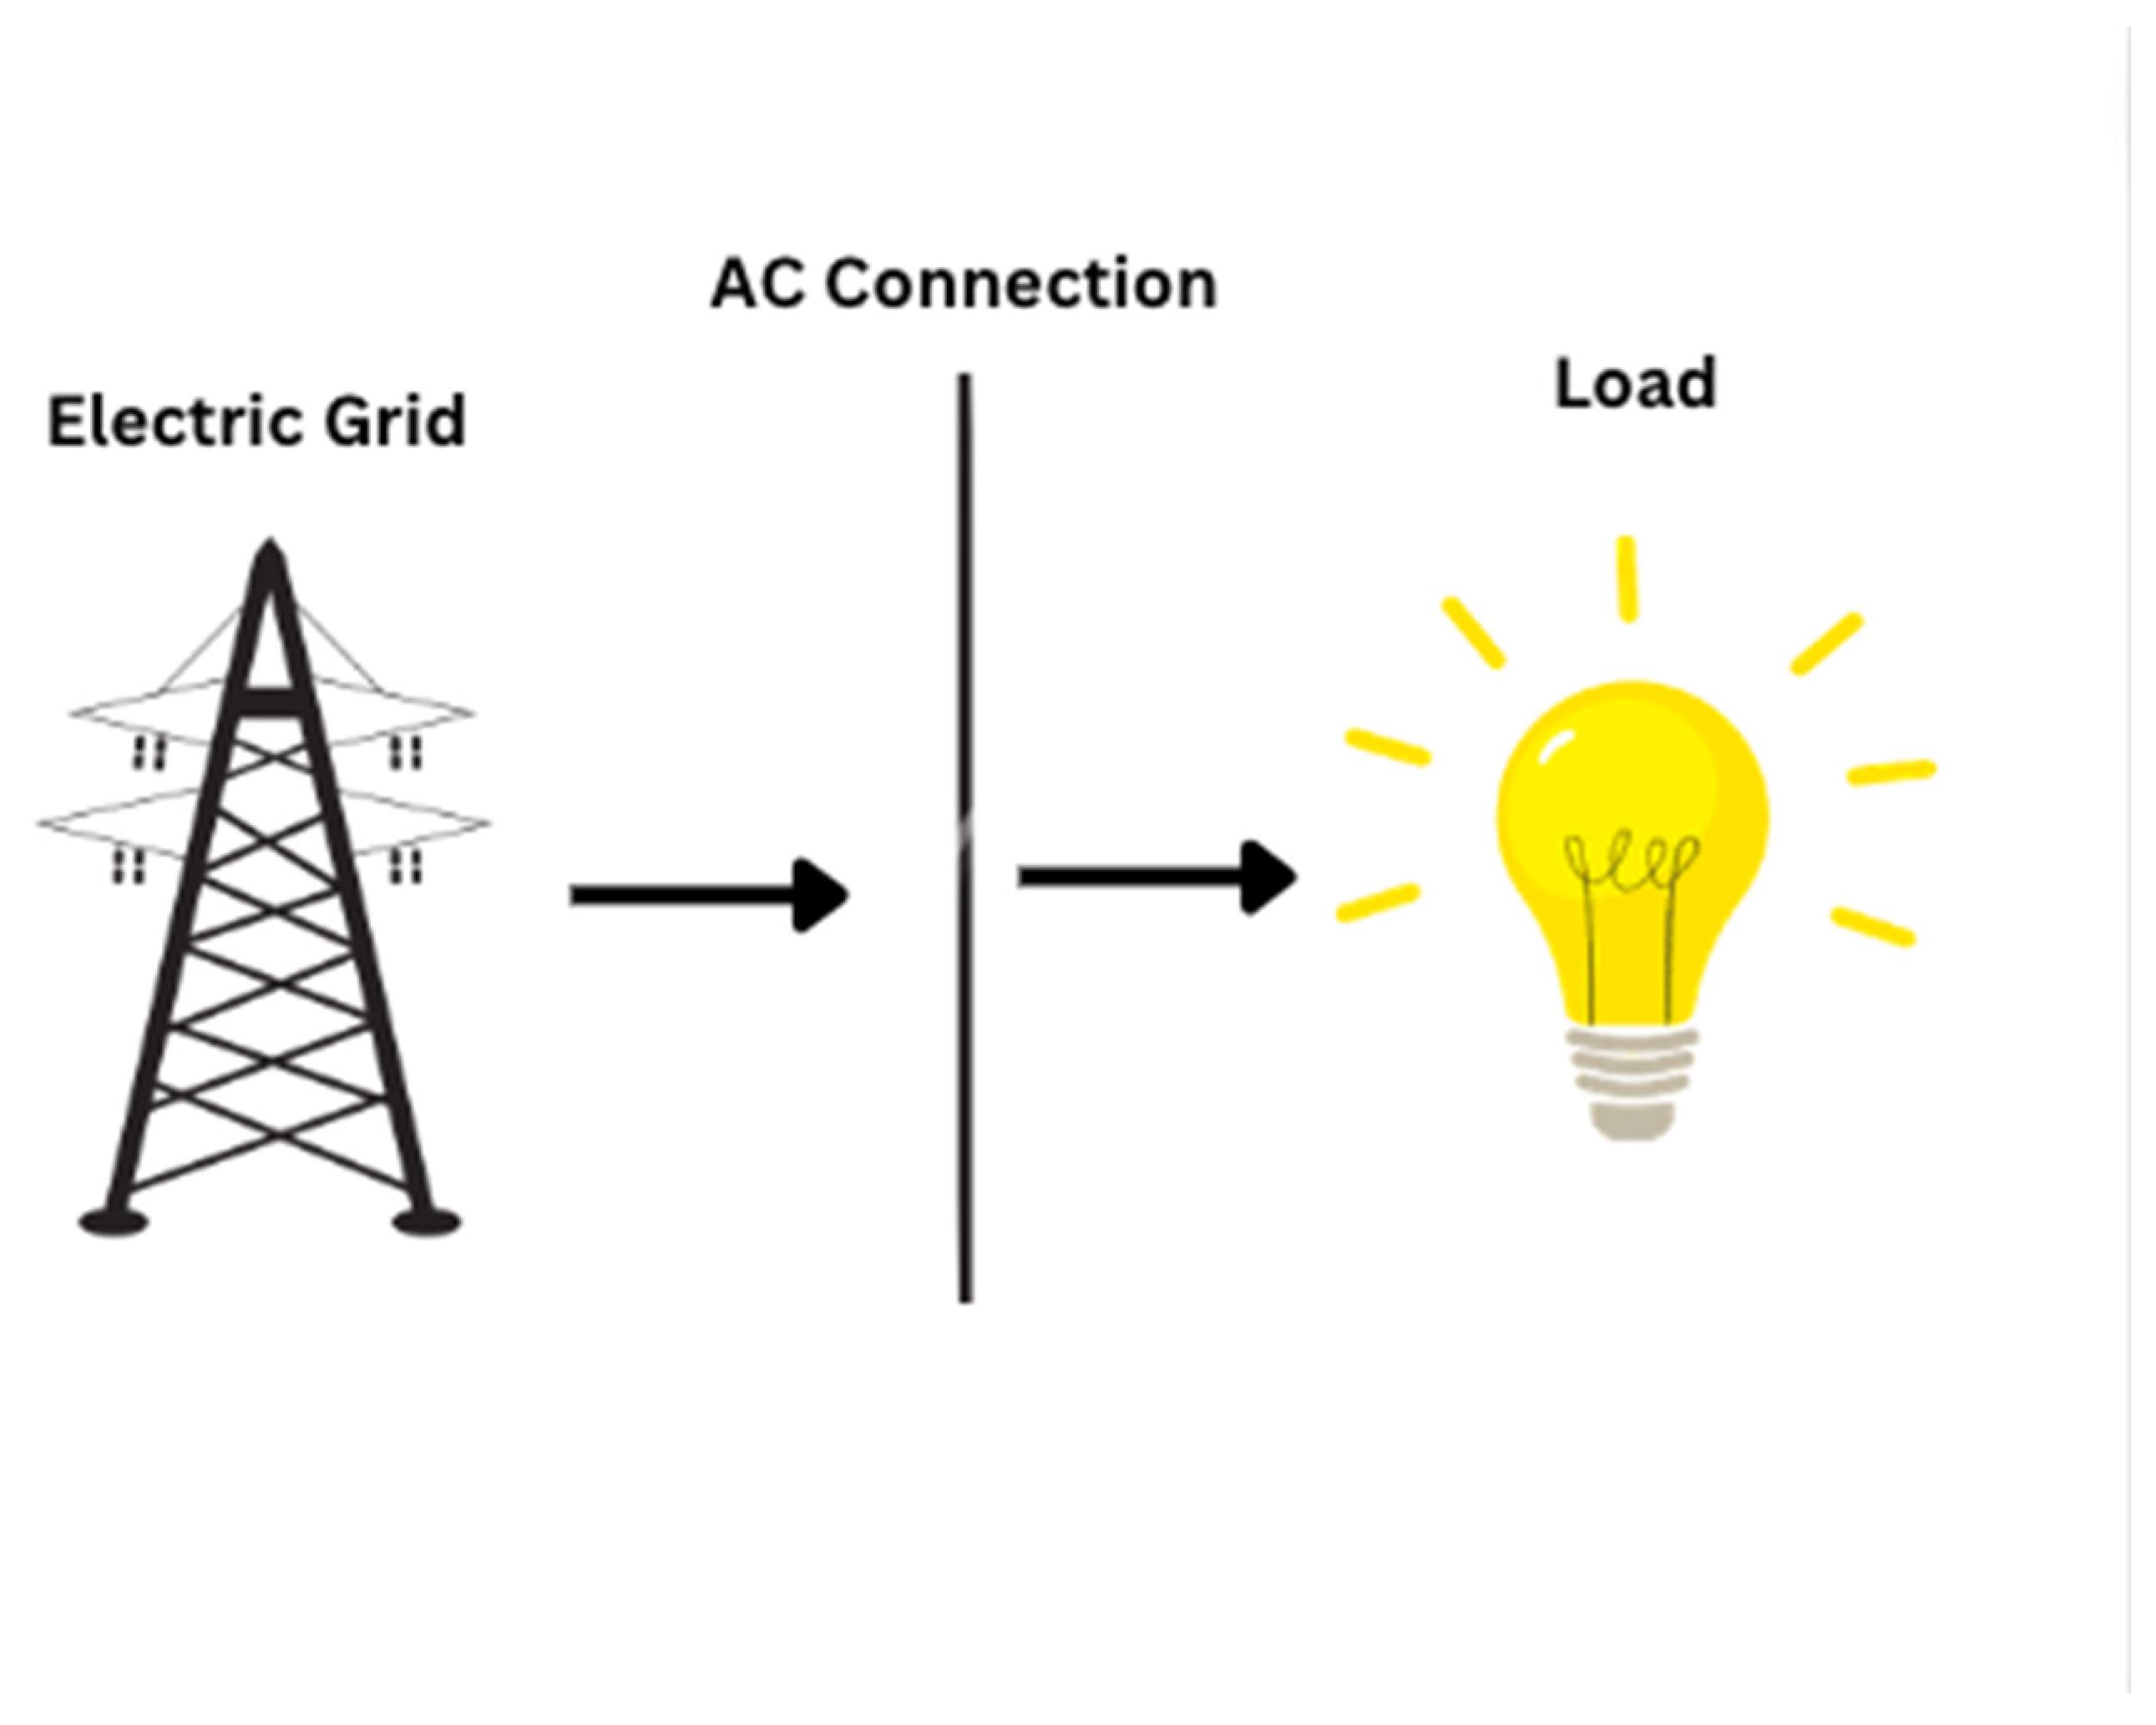
Table 4.
Energy Providers and their rates in Gleichen, Alberta (Energy Rates 2023)[25].
Table 4.
Energy Providers and their rates in Gleichen, Alberta (Energy Rates 2023)[25].
| Serial Number | Energy Providers | Energy Rates ($/kWh) |
|---|---|---|
| 1 | Spotpower | 0.127 |
| 2 | ATCO Energy | 0.123 |
| 3 | ENCOR | 0.127 |
| 4 | Easy Max | 0.127 |
| 5 | Just Energy | 0.144 |
3.4.2. Grid-Tied PV System
In this configuration, the power generation system mainly relies on the PV system to supply clean energy as shown in Figure 8. The HOMER optimized the need for 9500 kW system with 2500 Li-ion batteries. The renewable fraction of the system configuration was 24.1%.
Figure 8.
Schematic Presentation of Grid-Connected PV System.
3.4.3. Grid-Tied WT System
In this configuration, the power generation system mainly relies on the Wind Turbines (WT) system to supply clean energy as shown in Figure 9. HOMER software optimized the need for 6000 kW of WT system with 2500 Li-ion batteries. The renewable fraction of the system configuration was 79.6 %.
Figure 9.
Schematic Presentation of Grid-Connected Wind Turbine System.
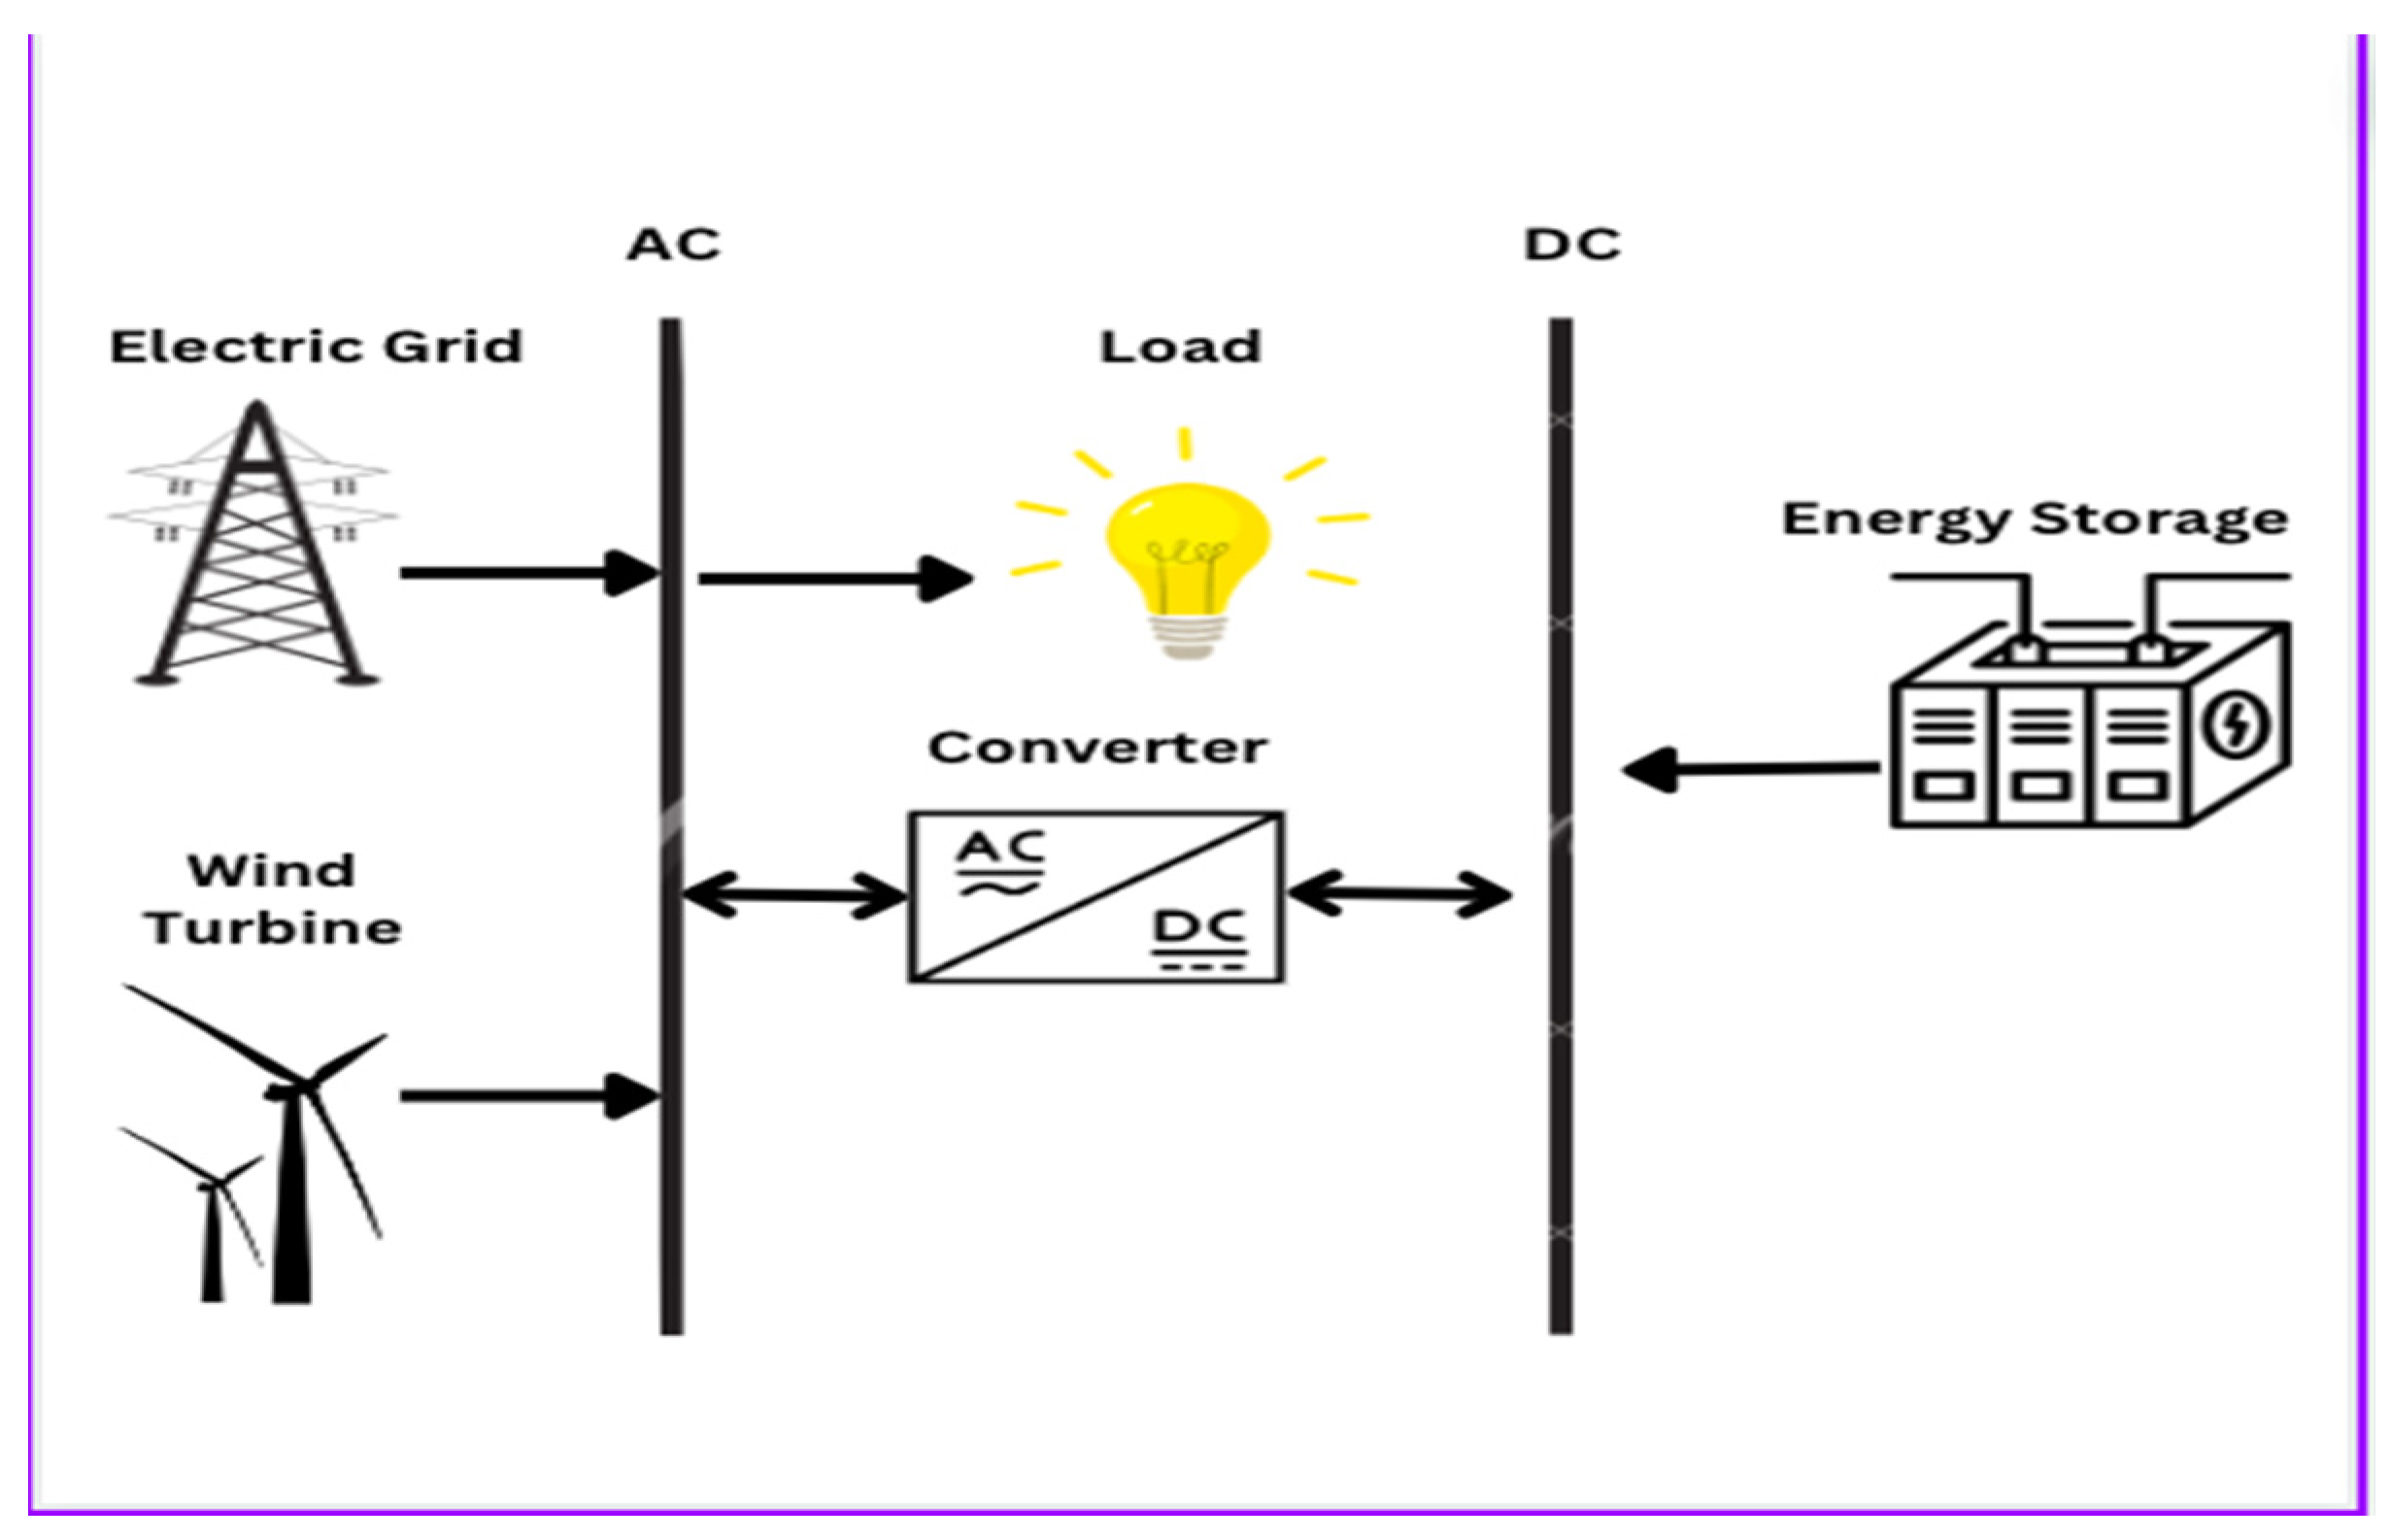
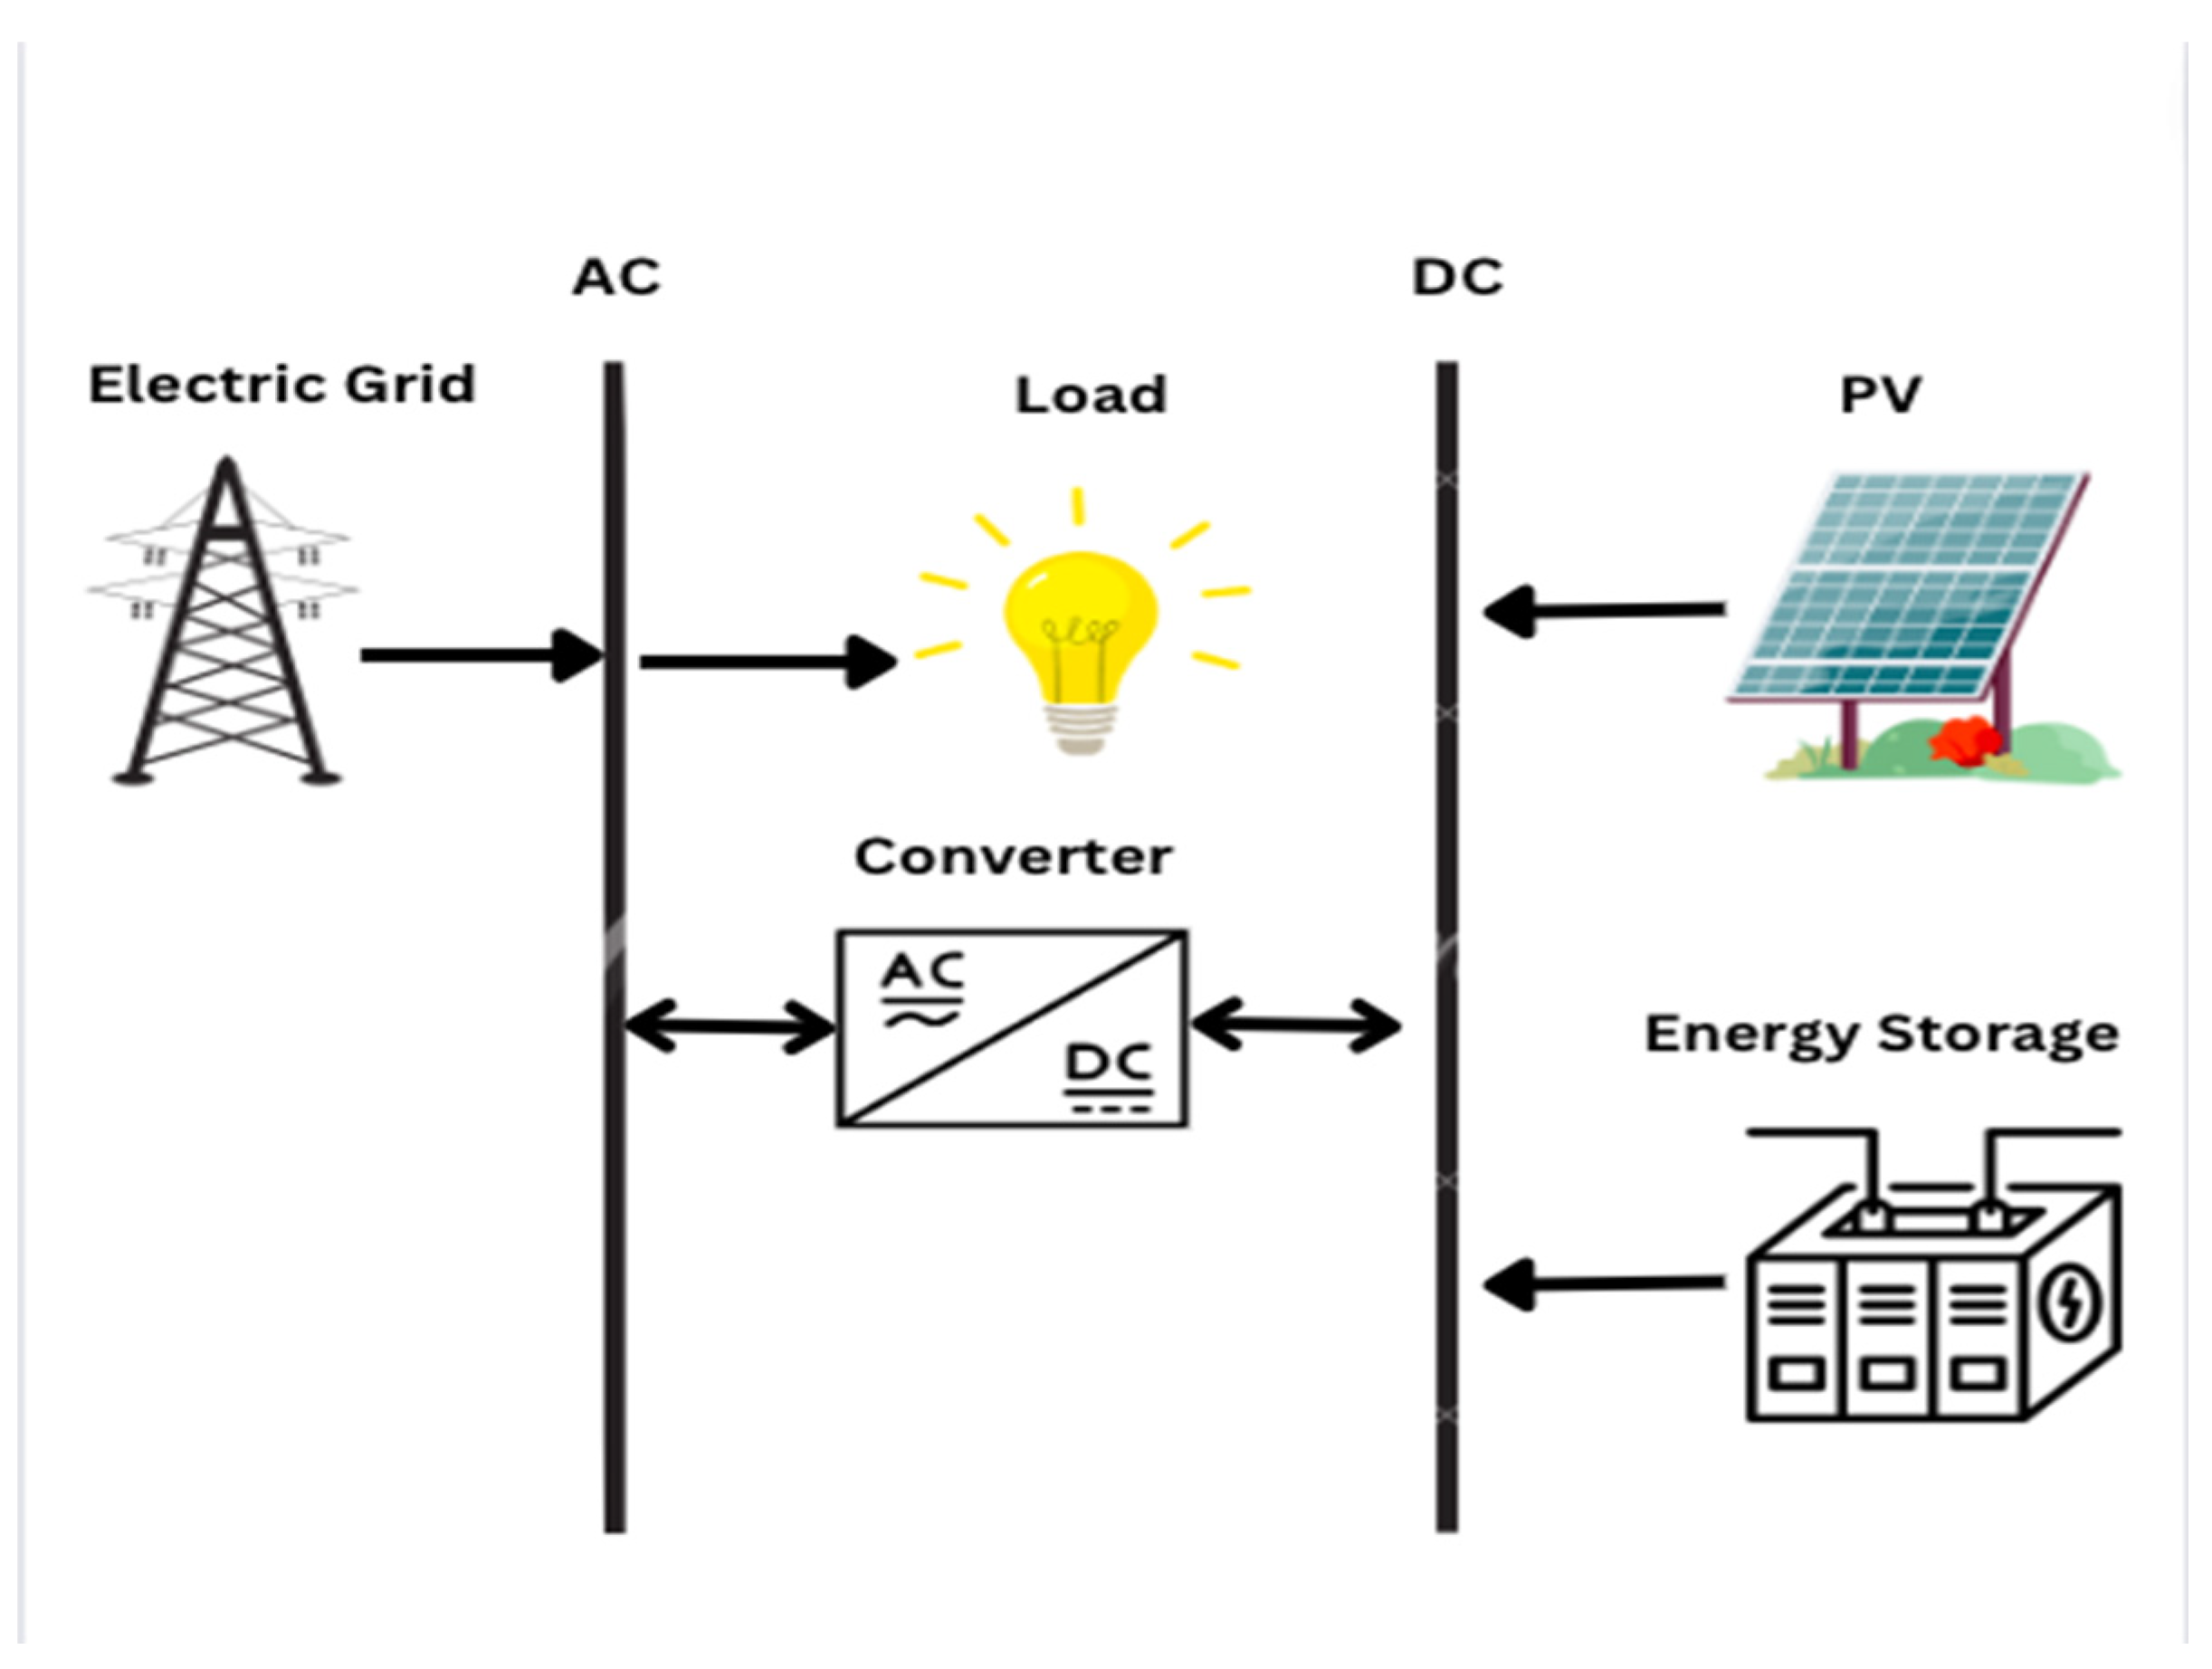
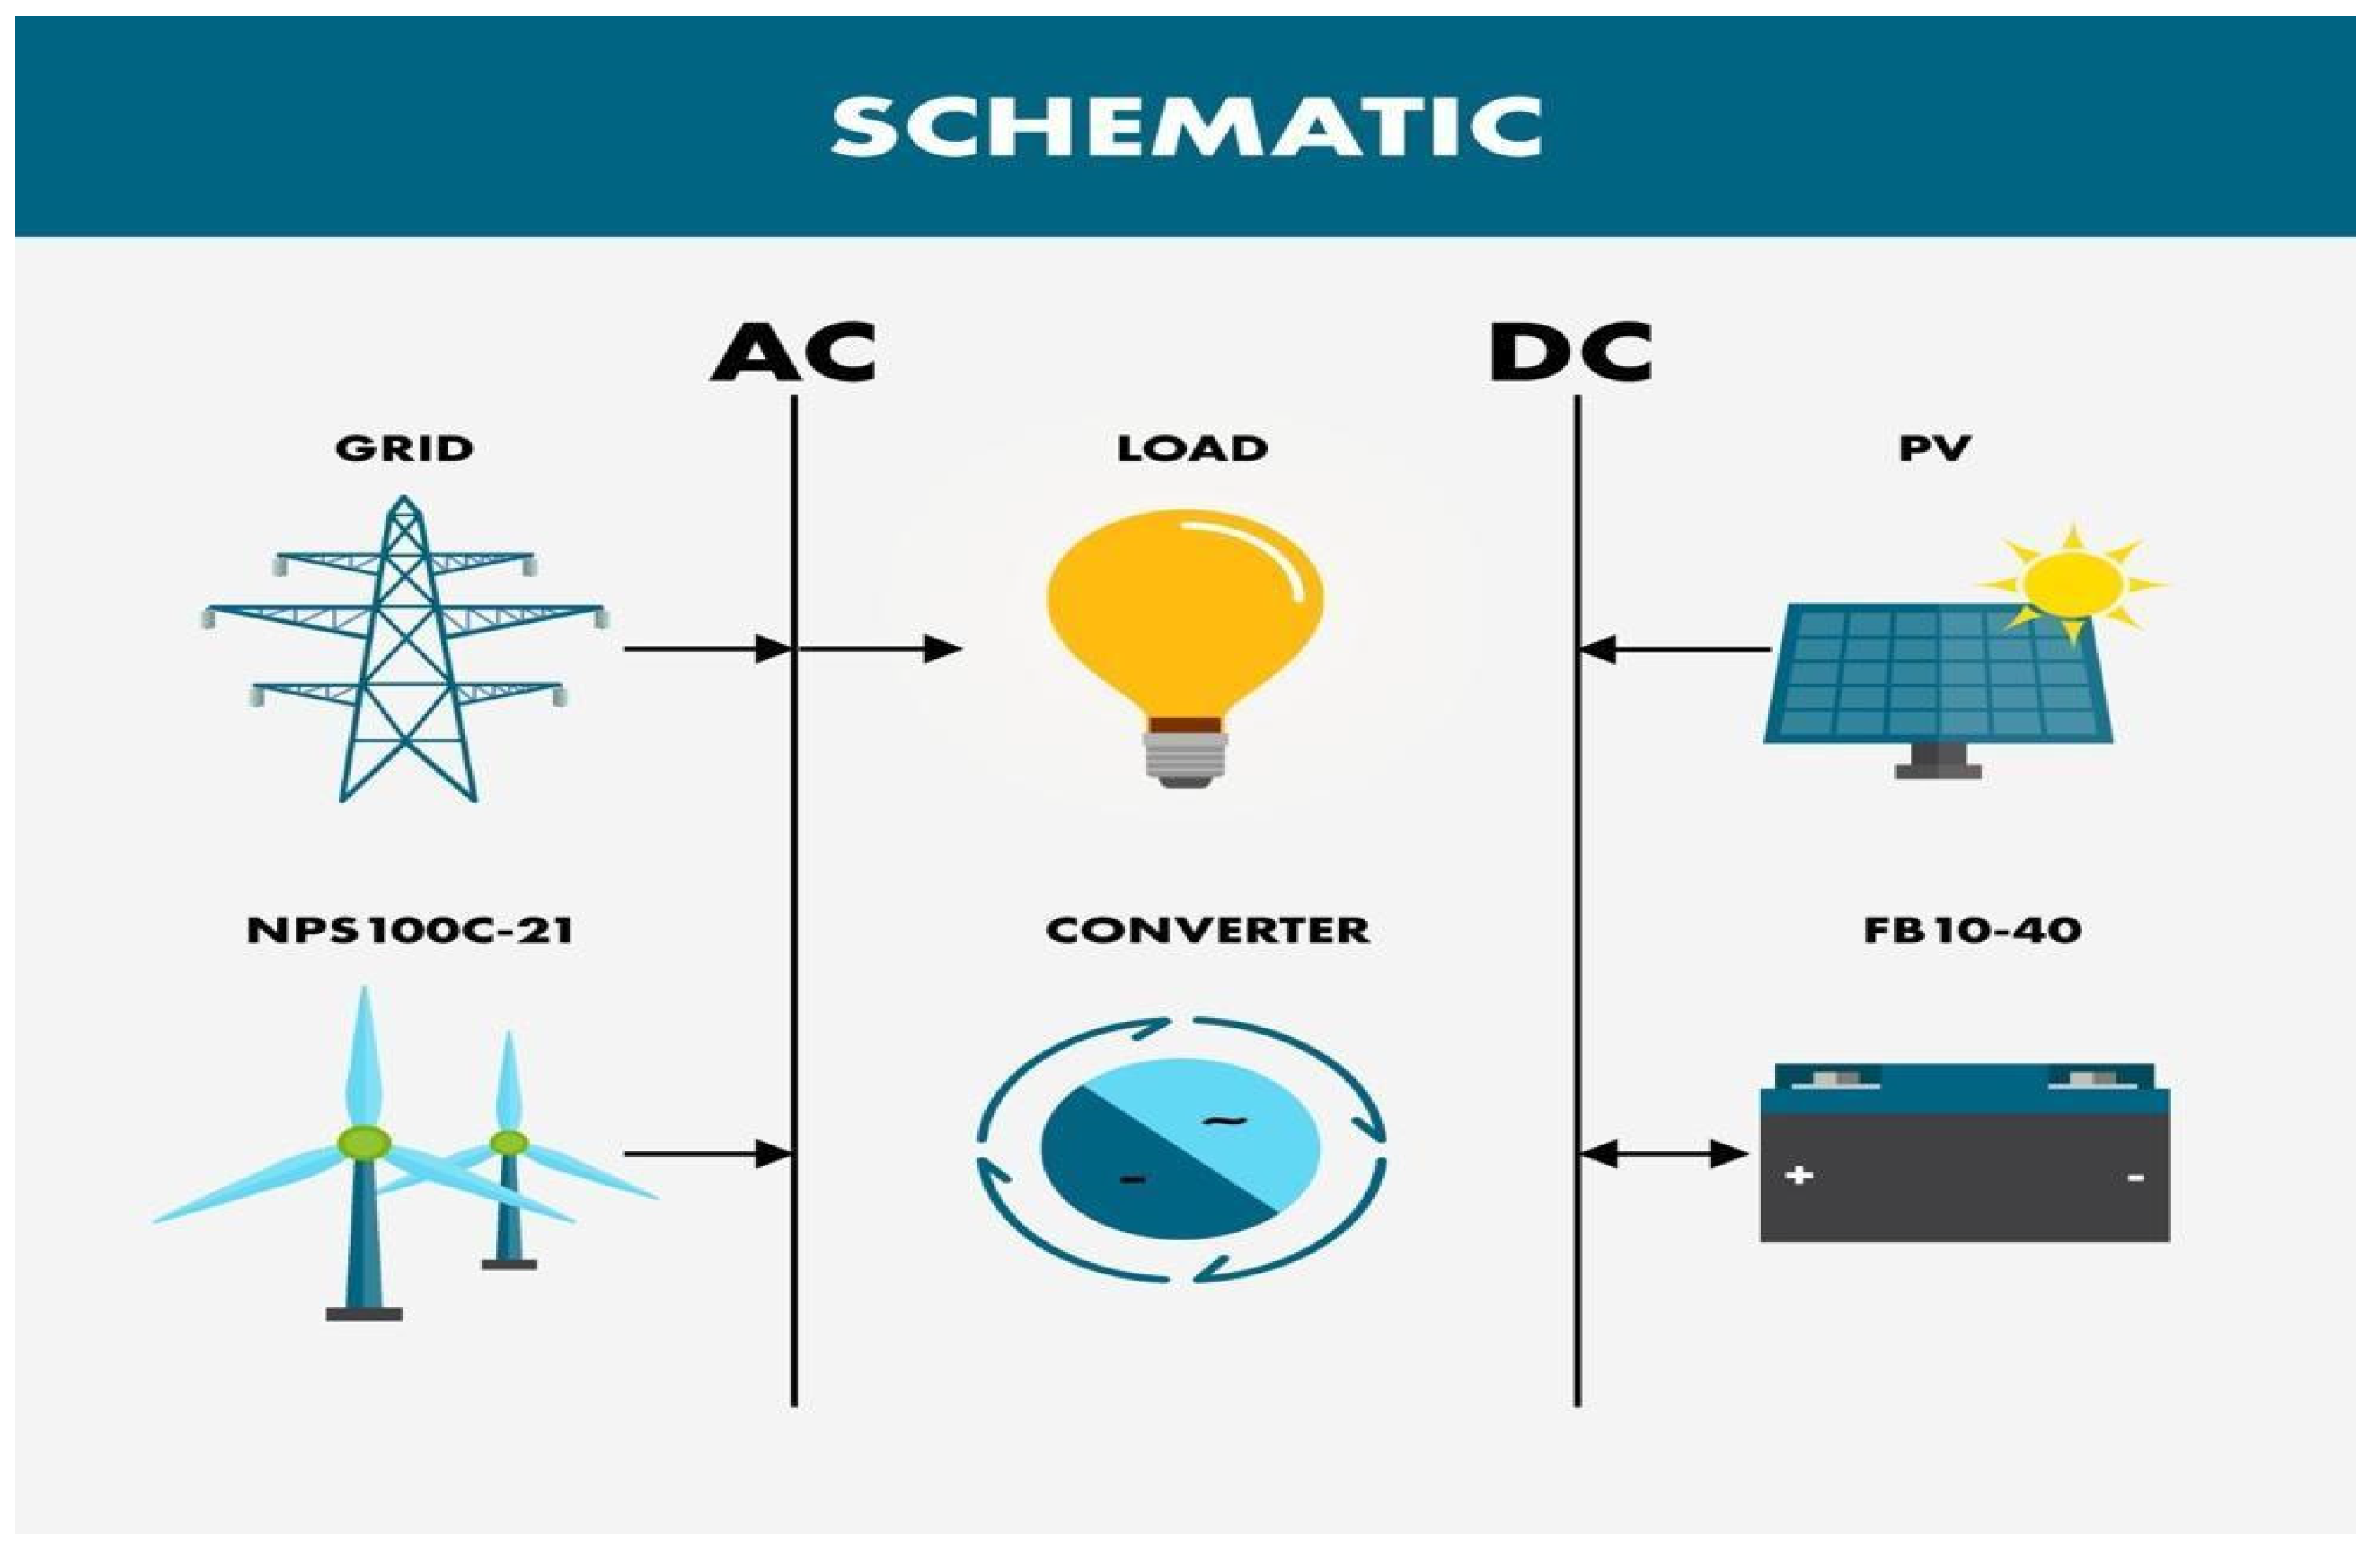
3.4.4. Grid-Tied PV-WT System
In this configuration, power generation system optimization was carried out on a combination of both PV & Wind Turbine systems to supply clean energy as shown in Figure 10. HOMER optimized the need for 6264 kW of PV system and 1500 kW of Wind Turbine System with 2500 Li-ion batteries. The renewable fraction of the system configuration was 80%.
Figure 10.
Schematic Presentation of Grid-Connected PV & Wind Turbine System.
4. Results and Discussion
Techno-Economic Analysis and Comparison of System Configurations
Various renewable-based hybrid configurations are compared with the base configuration (utility grid with battery backup) to evaluate the economic viability, cost-effectiveness and environmental soundness retaining lower initial costs and other system parameters. The economic analysis and GHG emissions considering all system configurations are presented in Table 5.
Table 5.
Simulation results of considered configurations of power systems.
| Parameter | Unit | National Grid | Hybrid (WT- Grid) |
Hybrid (PV-Grid) |
Hybrid (PV-WT- Grid) |
|---|---|---|---|---|---|
| LCOE | CAD/kW | 0.127 | 0.0412 | 0.172 | 0.0705 |
| Net Present Value (NPV) | CAD (Million) | 22.4 | 14.4 | 36.4 | 22.3 |
| Capital Cost | CAD (Million) | 0.430 | 13.4 | 11.4 | 20.1 |
| Replacement Cost | CAD (Million) | 0.182 | 4.4 | 1.7 | 3.7 |
| Maintenance Cost | CAD (Million) | 21.816 | 1.1 | 23.45 | 0.12 |
| Salvage Value | CAD (Million) | 0.034 | 2.2 | 0.11 | 1.7 |
| IRR | % | - | 15 | 9.4 | 8.3 |
| ROI | % | - | 11 | -2.8 | 5.6 |
| Payback Period | Yrs | - | 6.18 | 9.21 | 9.72 |
| ESS Qty. | Battery | 18 | 2500 | 2500 | 2500 |
| System Autonomy | Hr. | 0.922 | 1.07 | 1.07 | 1.07 |
| Renewable Fraction | % | - | 79.6 | 24.1 | 80 |
| Energy Purchased | kWh | - | 5,520,959 | 13,860,187 | 5,030,628 |
| Energy Sold | kWh | - | 10,660,754 | 19,156 | 8,023,980 |
| Total Emissions | kg/yr. | 8,719,564 | 3,511,711 | 8,816,188 | 3,199,882 |
The transformation to renewable energy has become an economic need, rather than only an environmental one. As shown in Table 5, the LCOE of hybrid systems is less than the conventional National Grid system. However, in PV-Grid configuration, LCOE is comparatively higher than others as the renewable penetration in the configuration is quite low, i.e., 24.1% in comparison to 79.6% and 80% of WT-Grid and PV-WT-Grid respectively. In the case of major reliance on the solar installation, initial capital costs would increase exponentially. The distribution of CAPEX and OPEX differs from one system to another. The CAPEX includes capital and replacement costs, while the OPEX includes maintenance and fuel costs. Figure 11 presents the comparison between the system configurations of maintenance, capital, and replacement costs.
Figure 11.
Cost Analysis of different power system configurations.
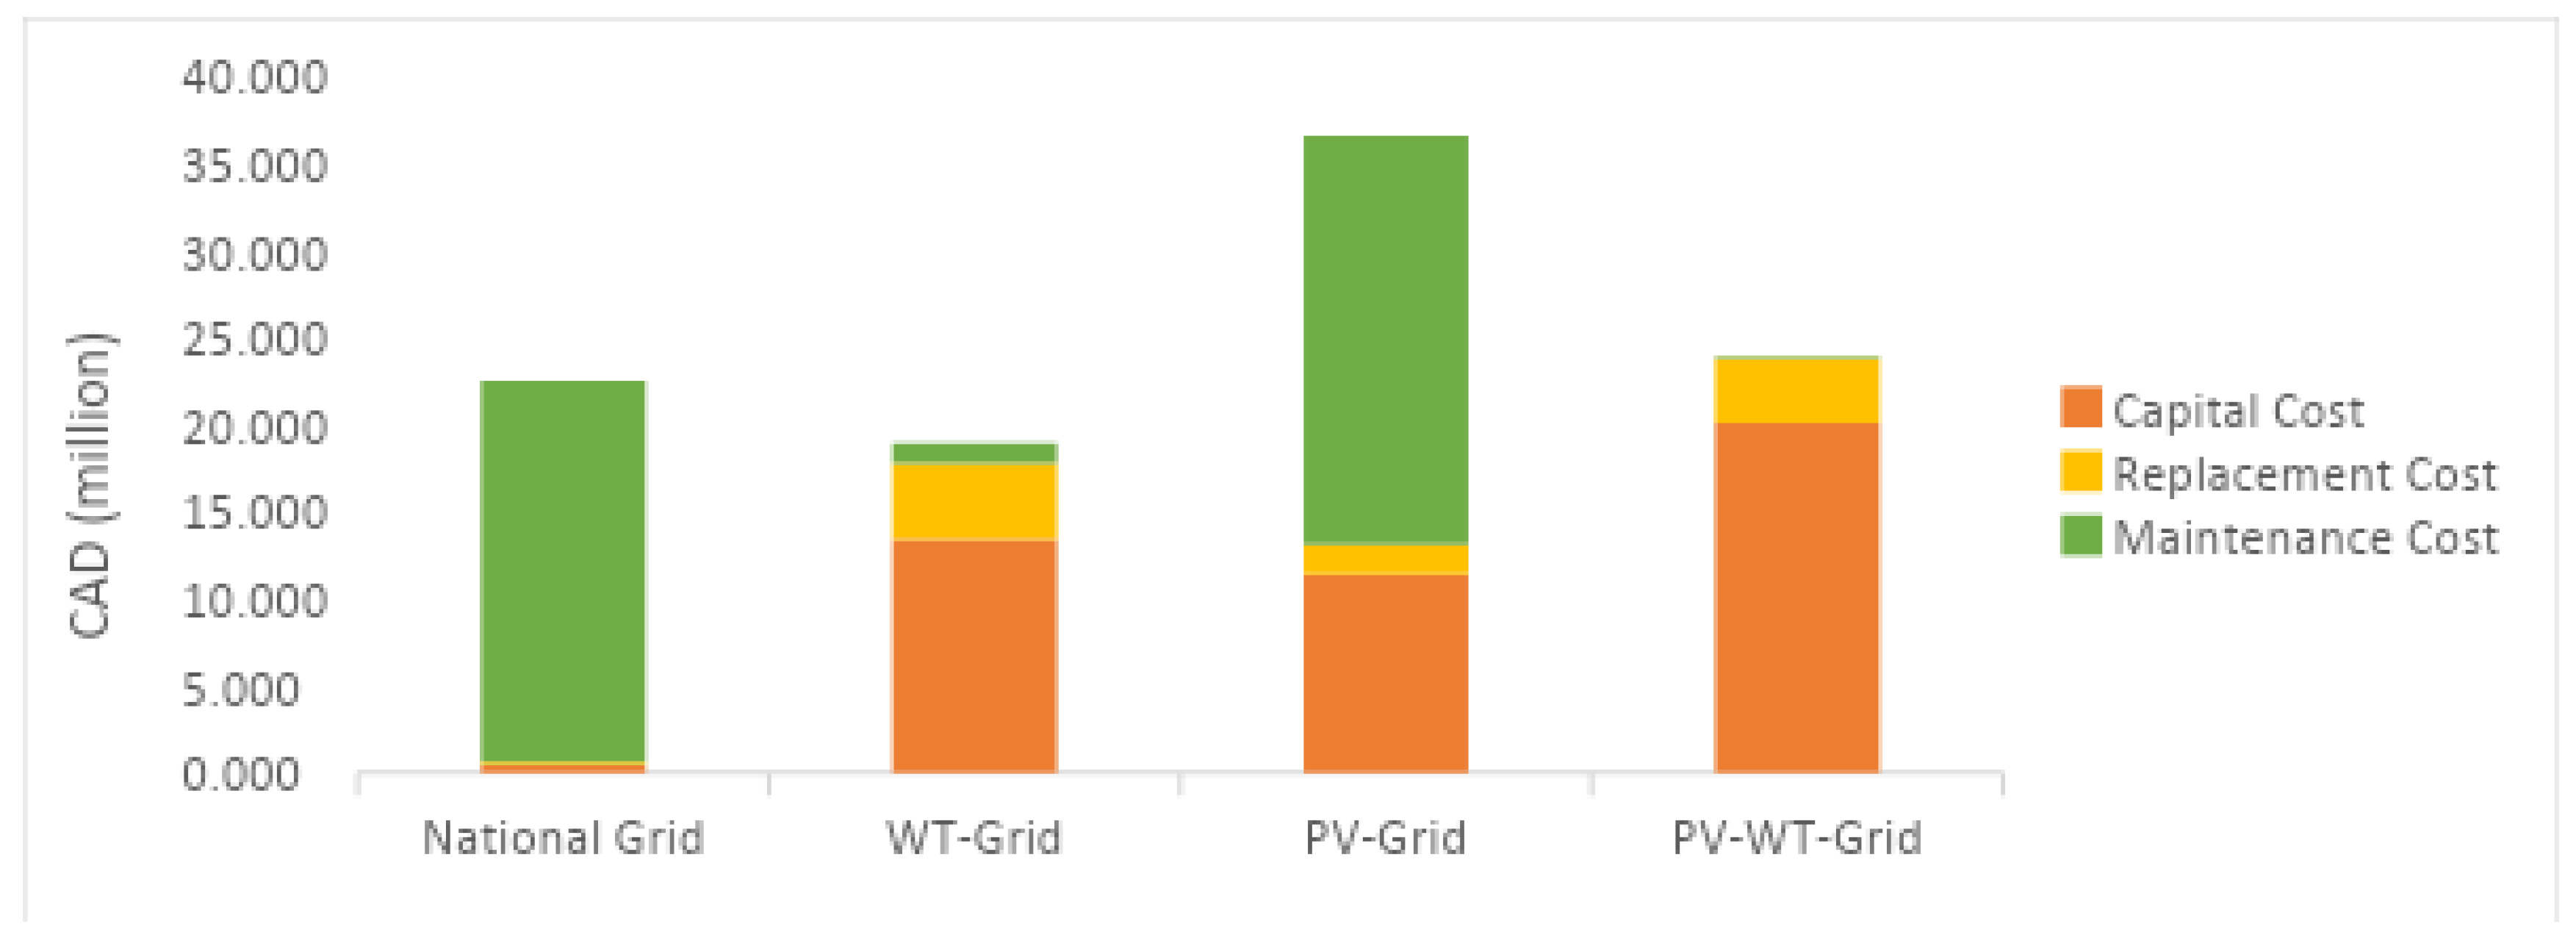
The capital cost includes the cost of equipment such as solar PV panels, wind turbines, converters, and ESS, which usually incurs costs at the beginning of the project lifecycle. Since solar PV panels and wind turbines are not required in the national grid configuration, the capital cost is less than the cost of renewable energy-based systems. In hybrid systems that include renewable energy, the capital cost is mainly dependent on the capacity of the renewable system.
From a Capital Cost (CAPEX) perspective, the national grid utilization might seem attractive compared with hybrid systems. However, it costs much more than OPEX, reducing its value as a power supply option. On the other hand, the systems comprising solar and wind turbine systems are attractive in terms of OPEX, but the high initial costs of renewables result in high CAPEX. Generally, the hybrid system seems the most appropriate option to economically supply the industrial and commercial loads either in stand-alone or grid-integrated mode. Moreover, renewable systems have longer operational life, typically with a payback period that makes the overall renewable sources-based systems more economical. The payback period of the optimized grid-tied PV-WT hybrid system is almost 9.7 years, compared to the grid-tied WT system’s 6.18 years, due to the higher capital costs. Moreover, cash flow for each of the configurations can be seen in Figure 12, Figure 13, Figure 14 and Figure 15.
Figure 12.
Cash flow of National Grid Only system configuration.
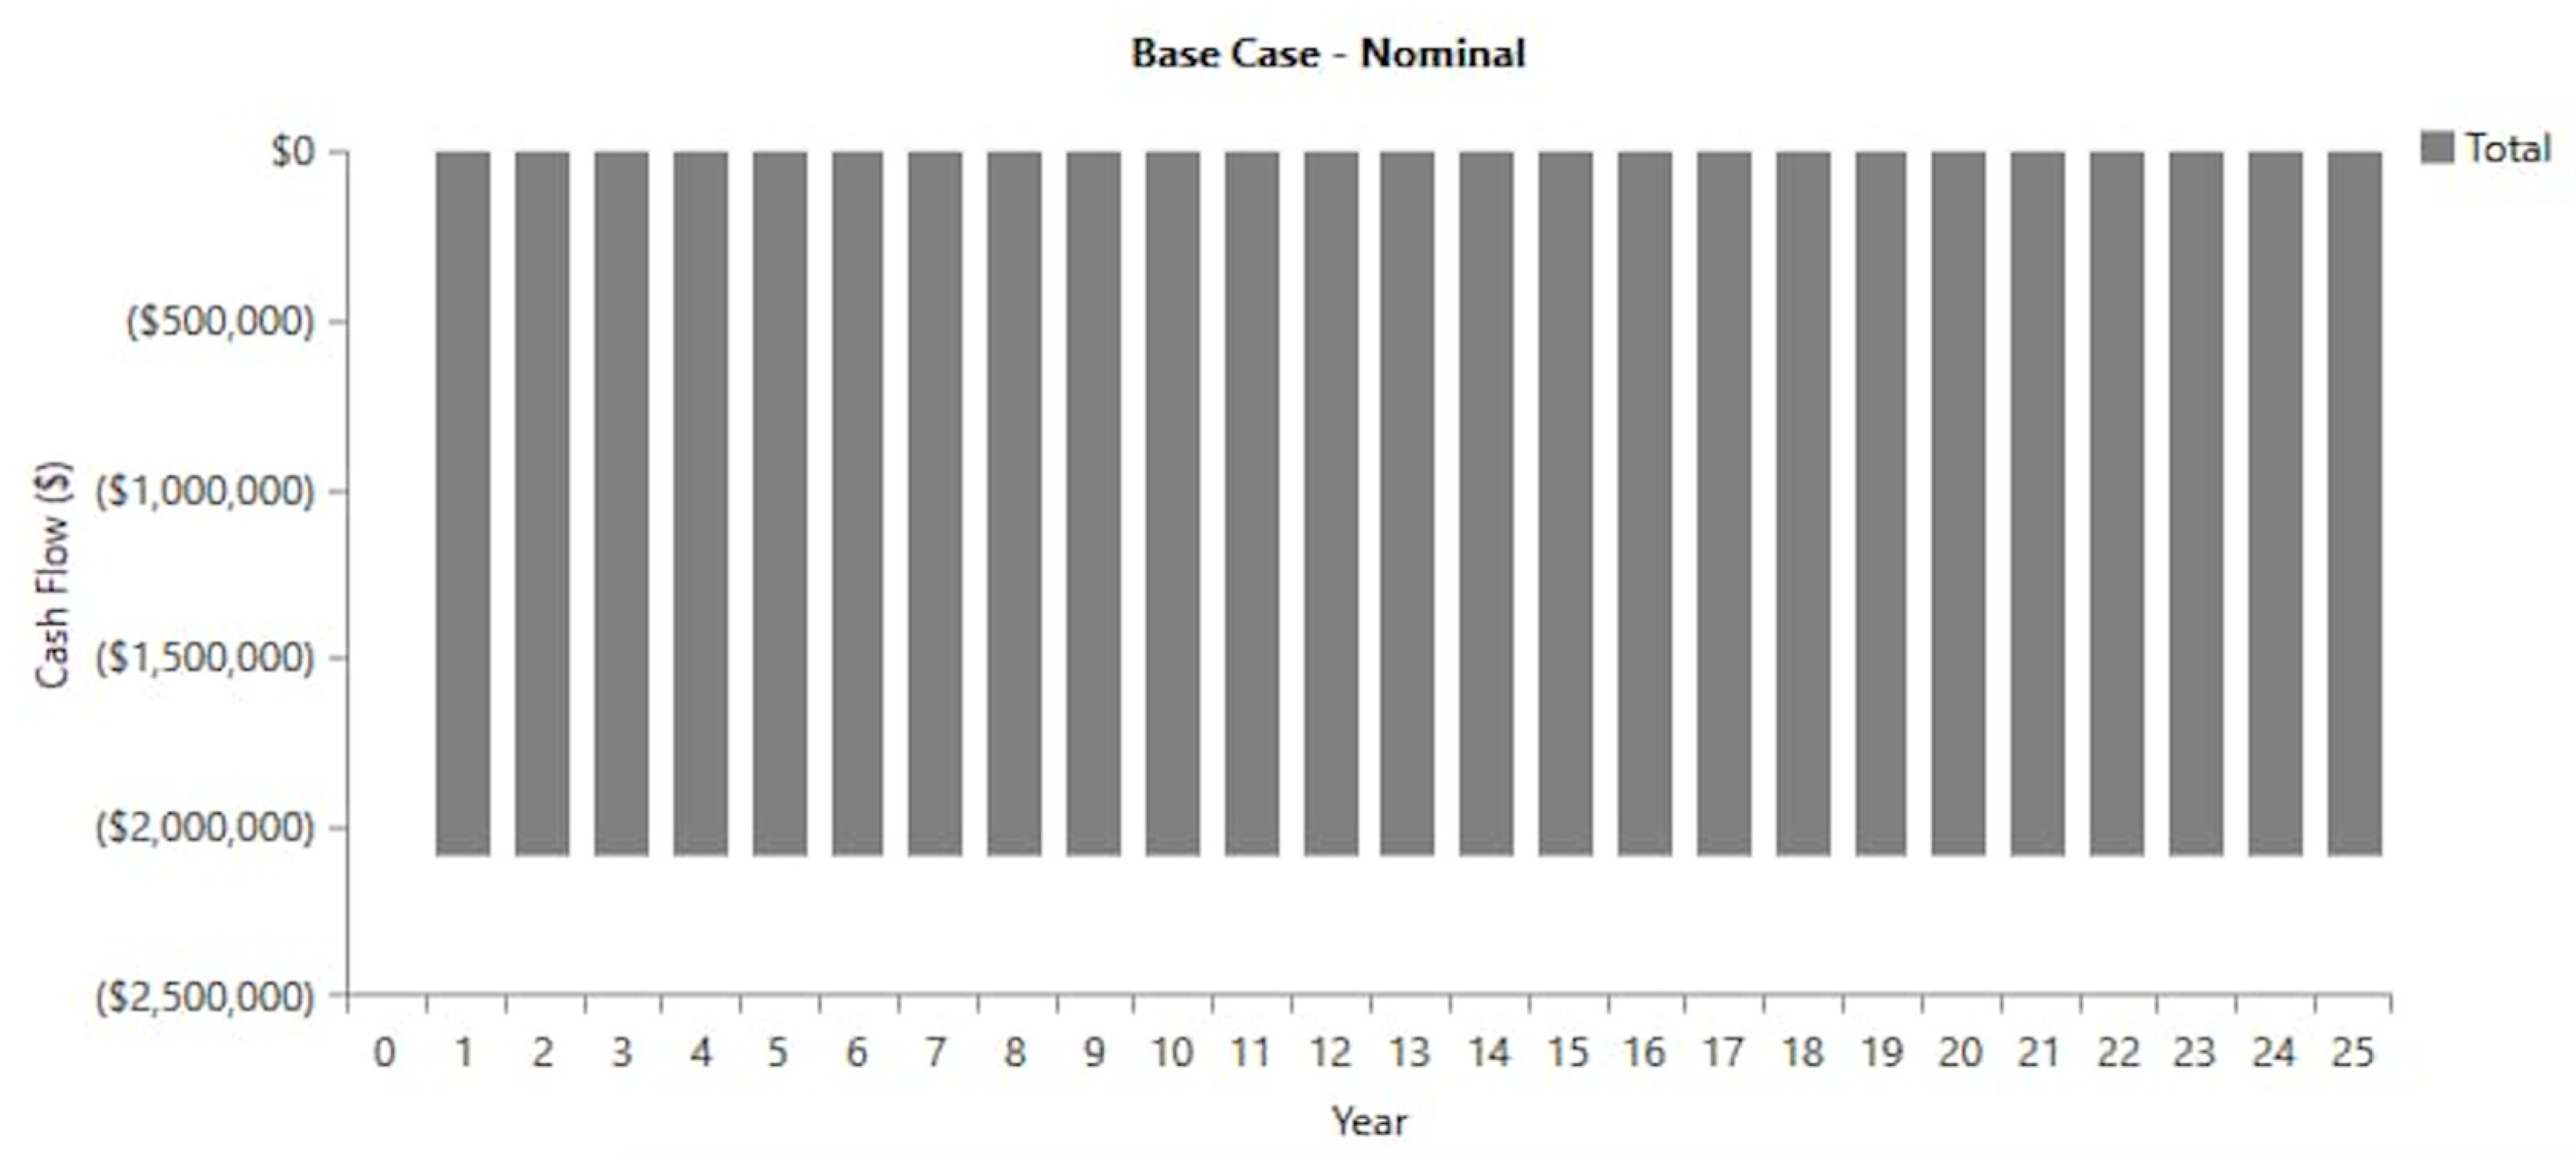
Figure 13.
Cash flow of WT-Grid system configuration.
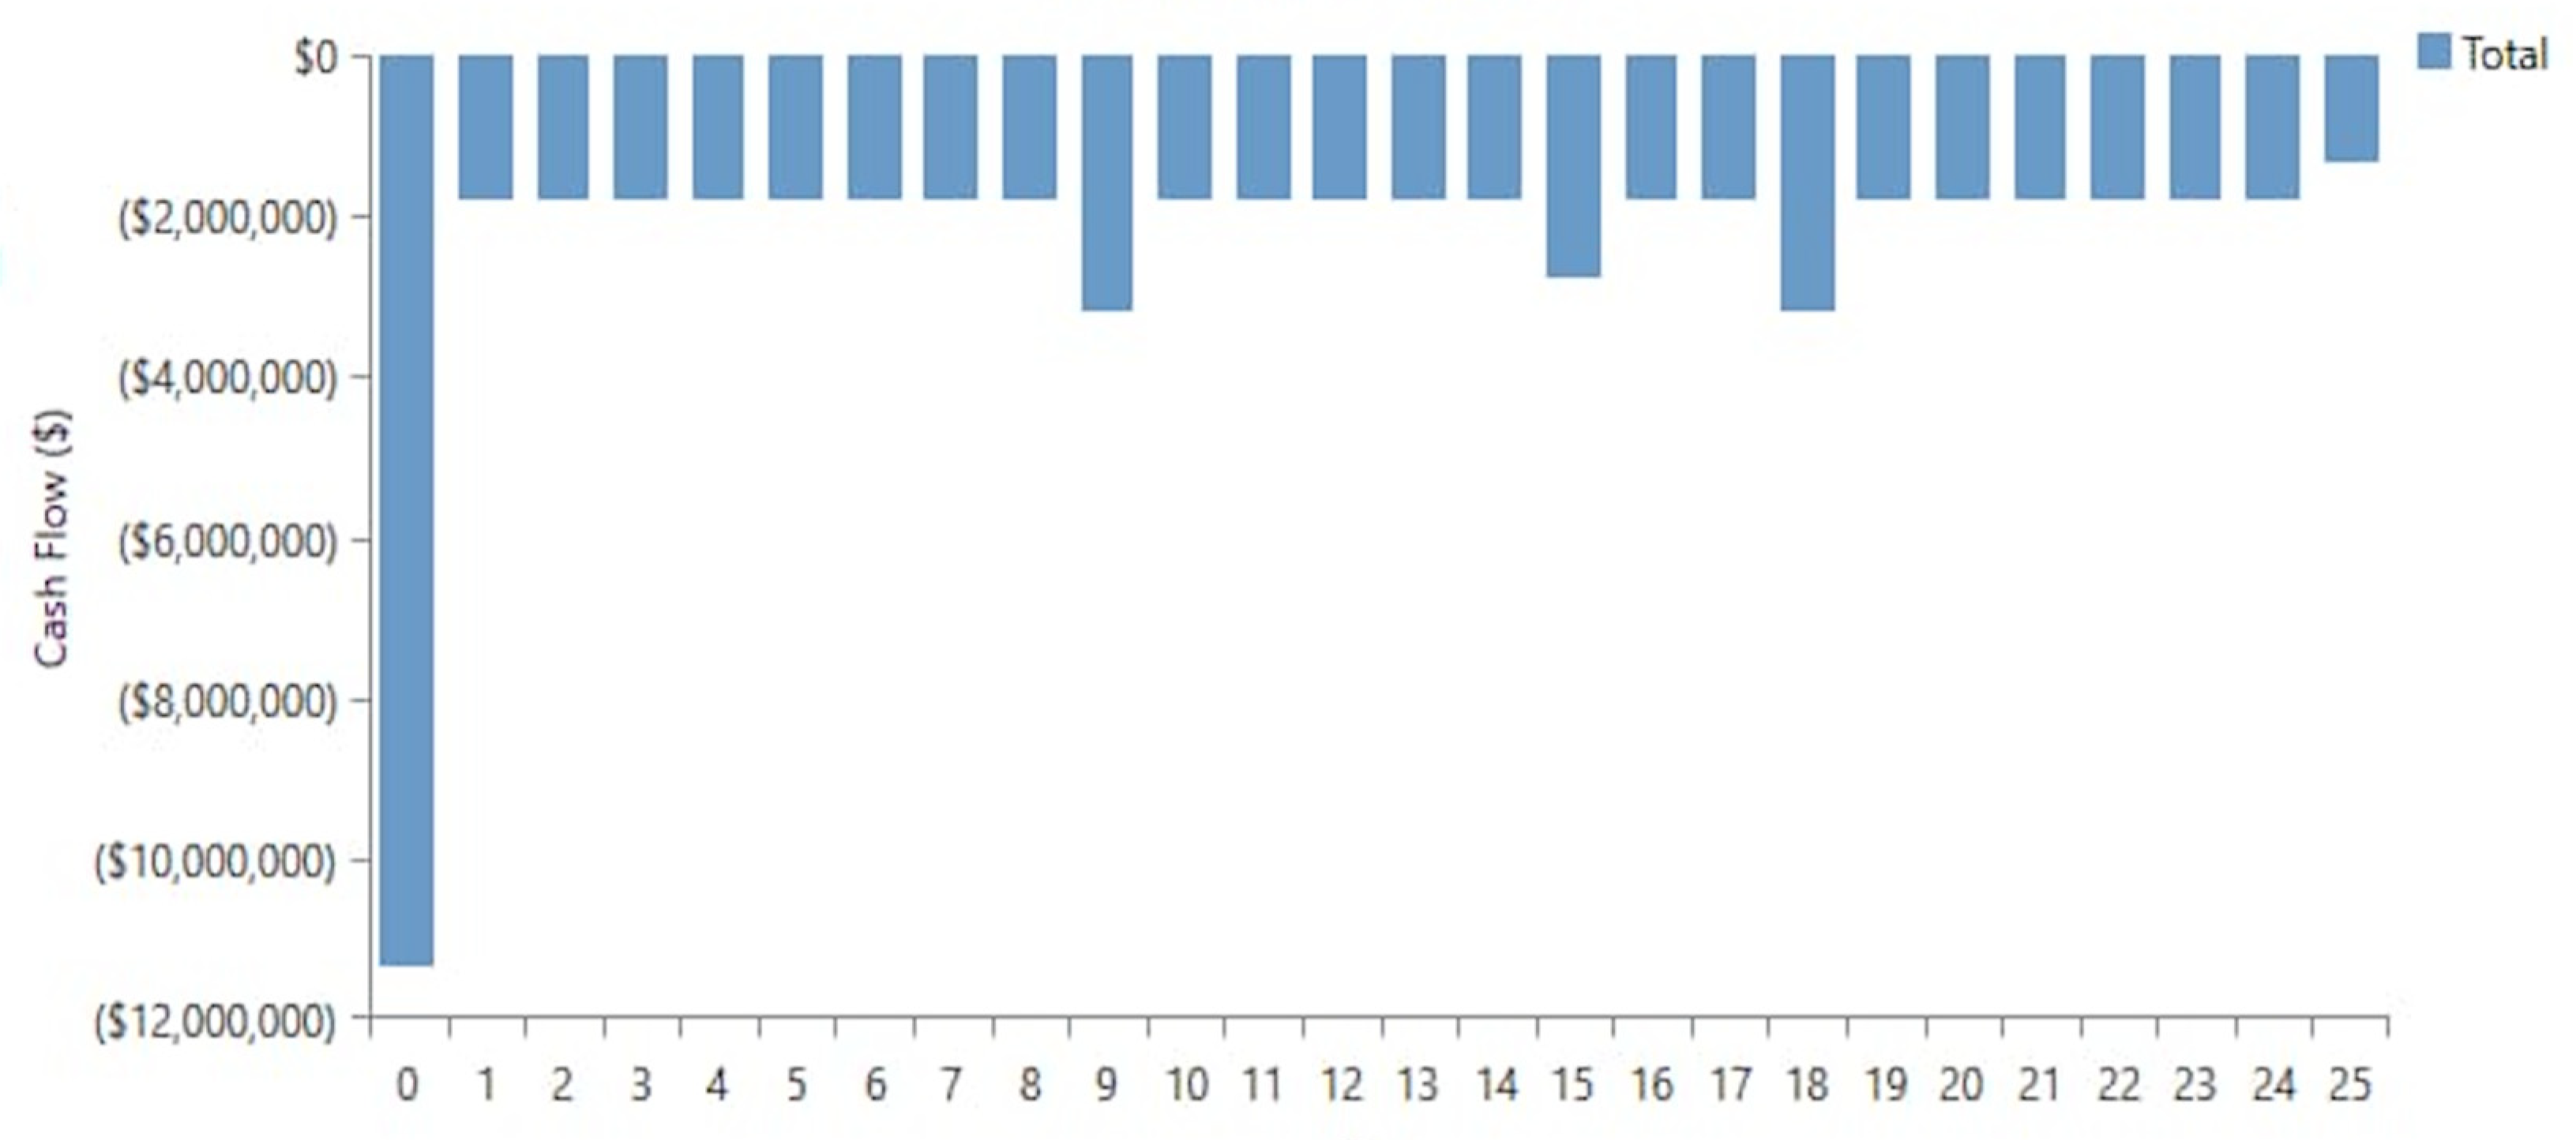
Figure 14.
Cash flow of PV-Grid system configuration.
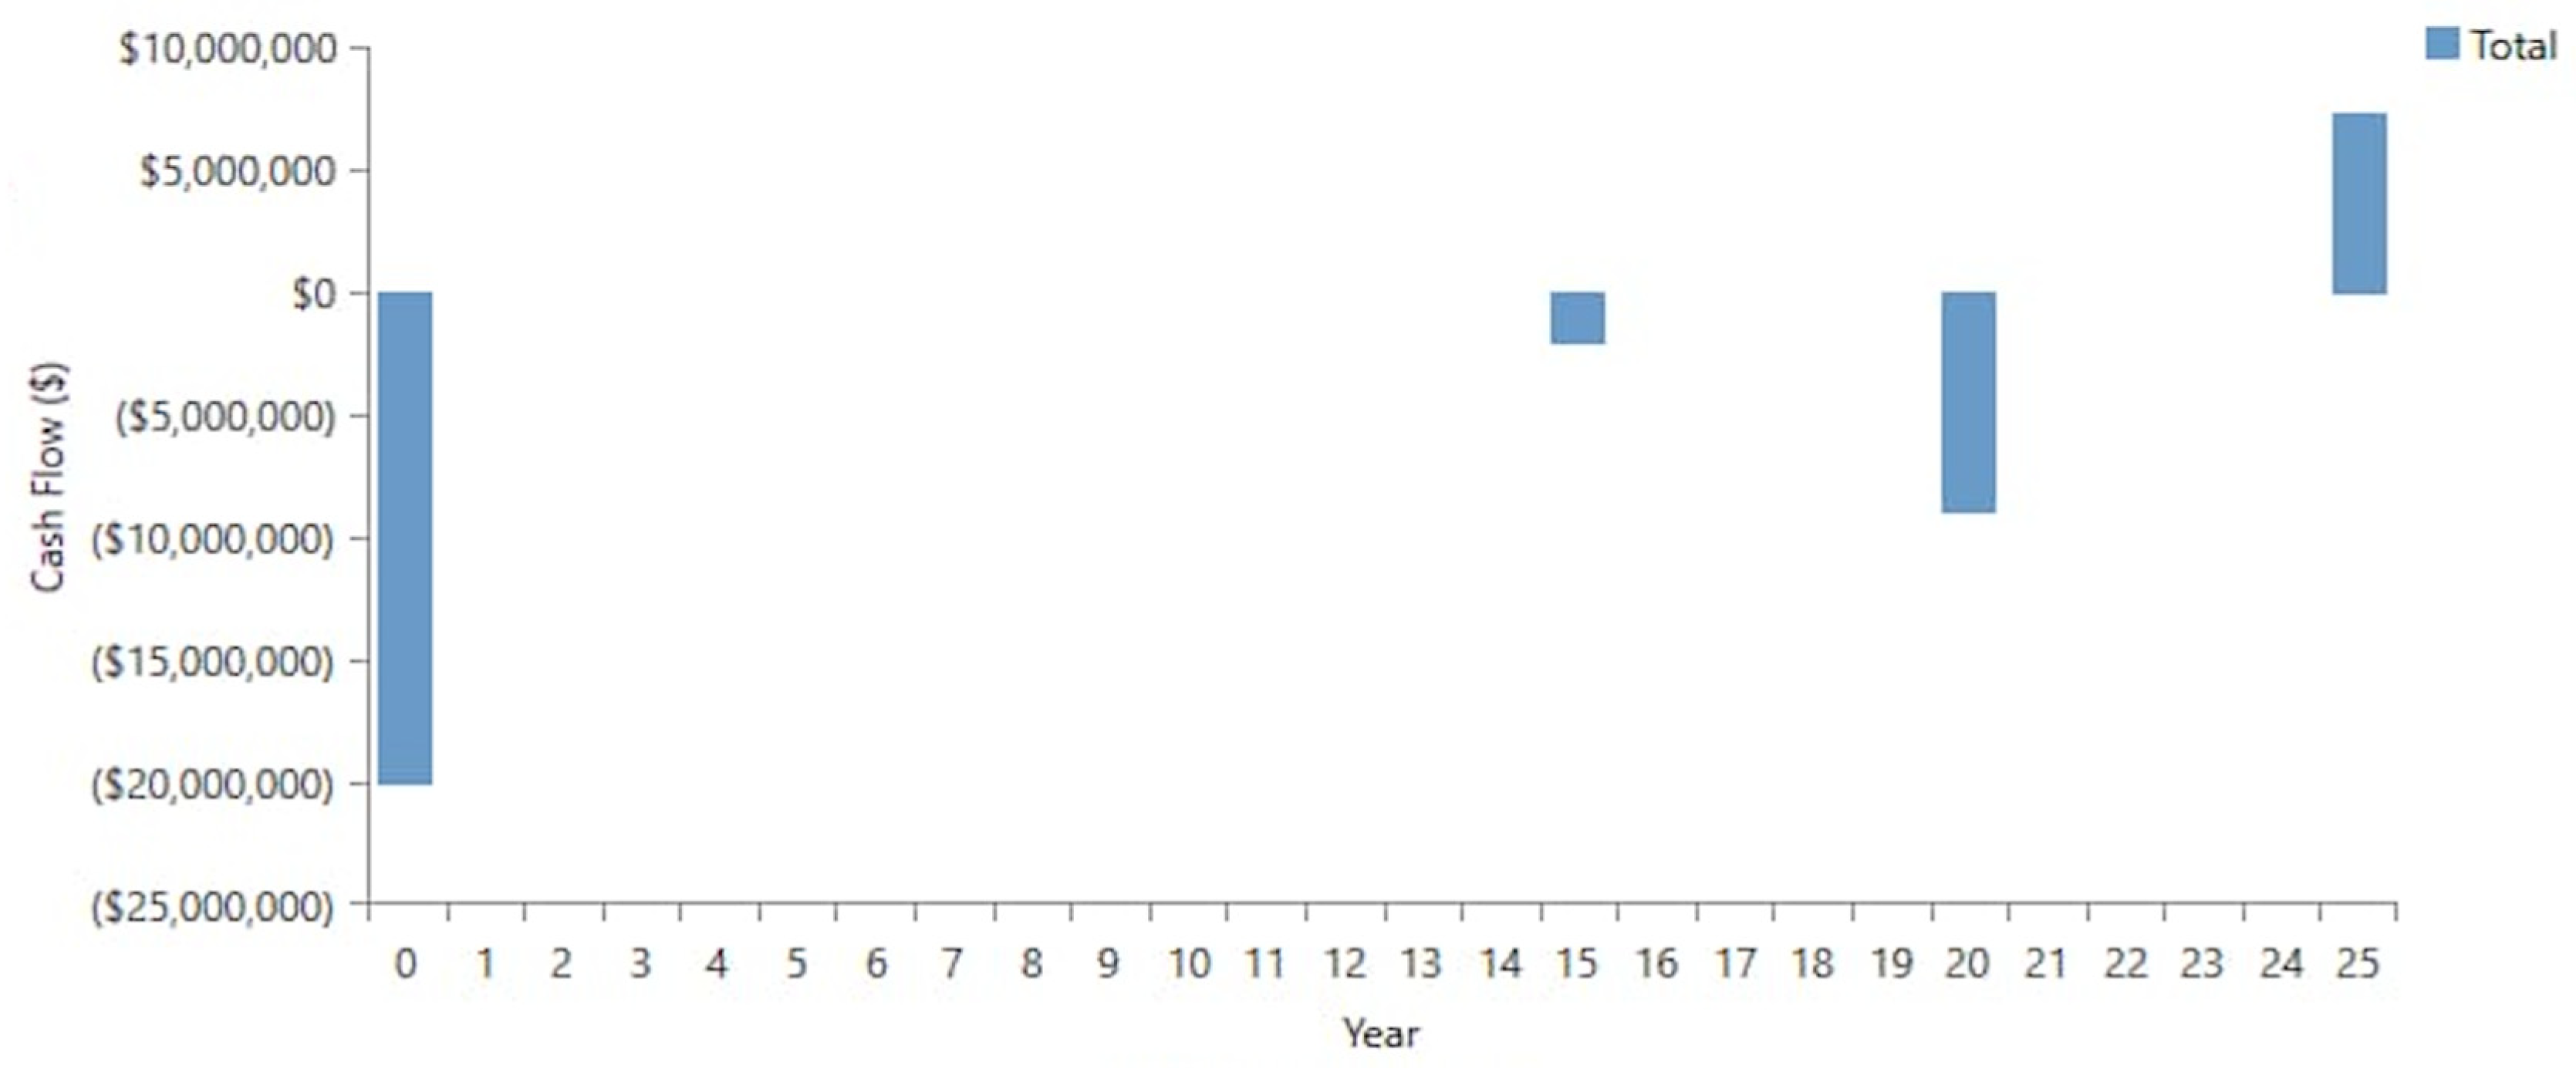
Figure 15.
Cash flow of Grid-tied PV-WT system configuration.
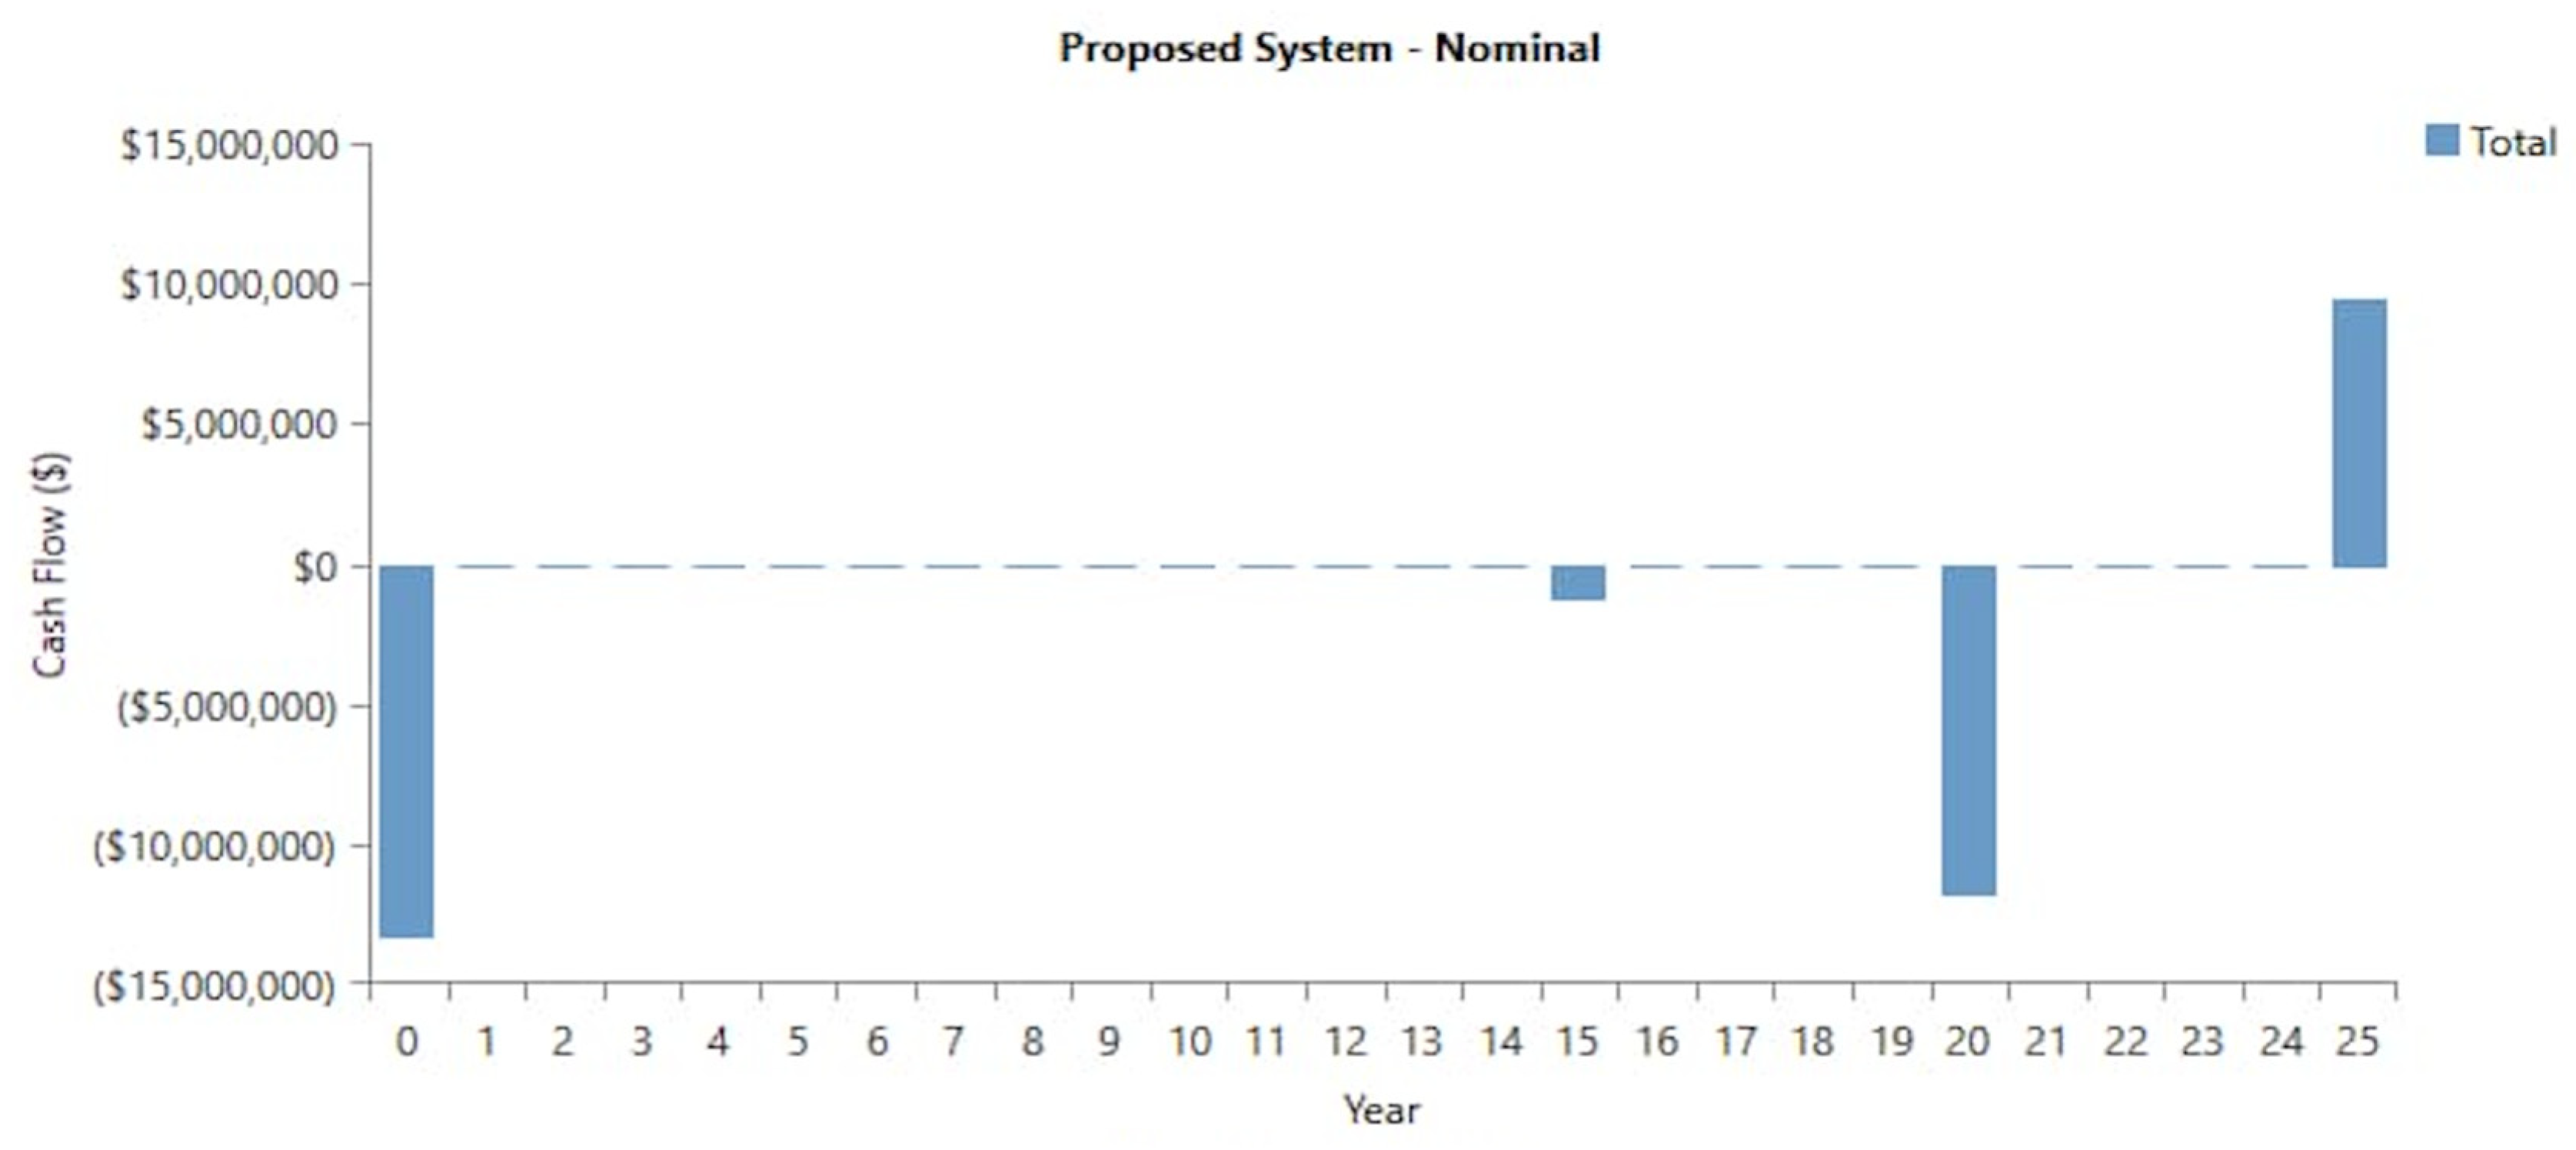
As can be seen in the above figures, cash flow represents the costs associated with the considered power system, in terms of expenses or income. Regarding storage and modulation, the number of batteries utilized for backup systems can be seen in Figure 16.
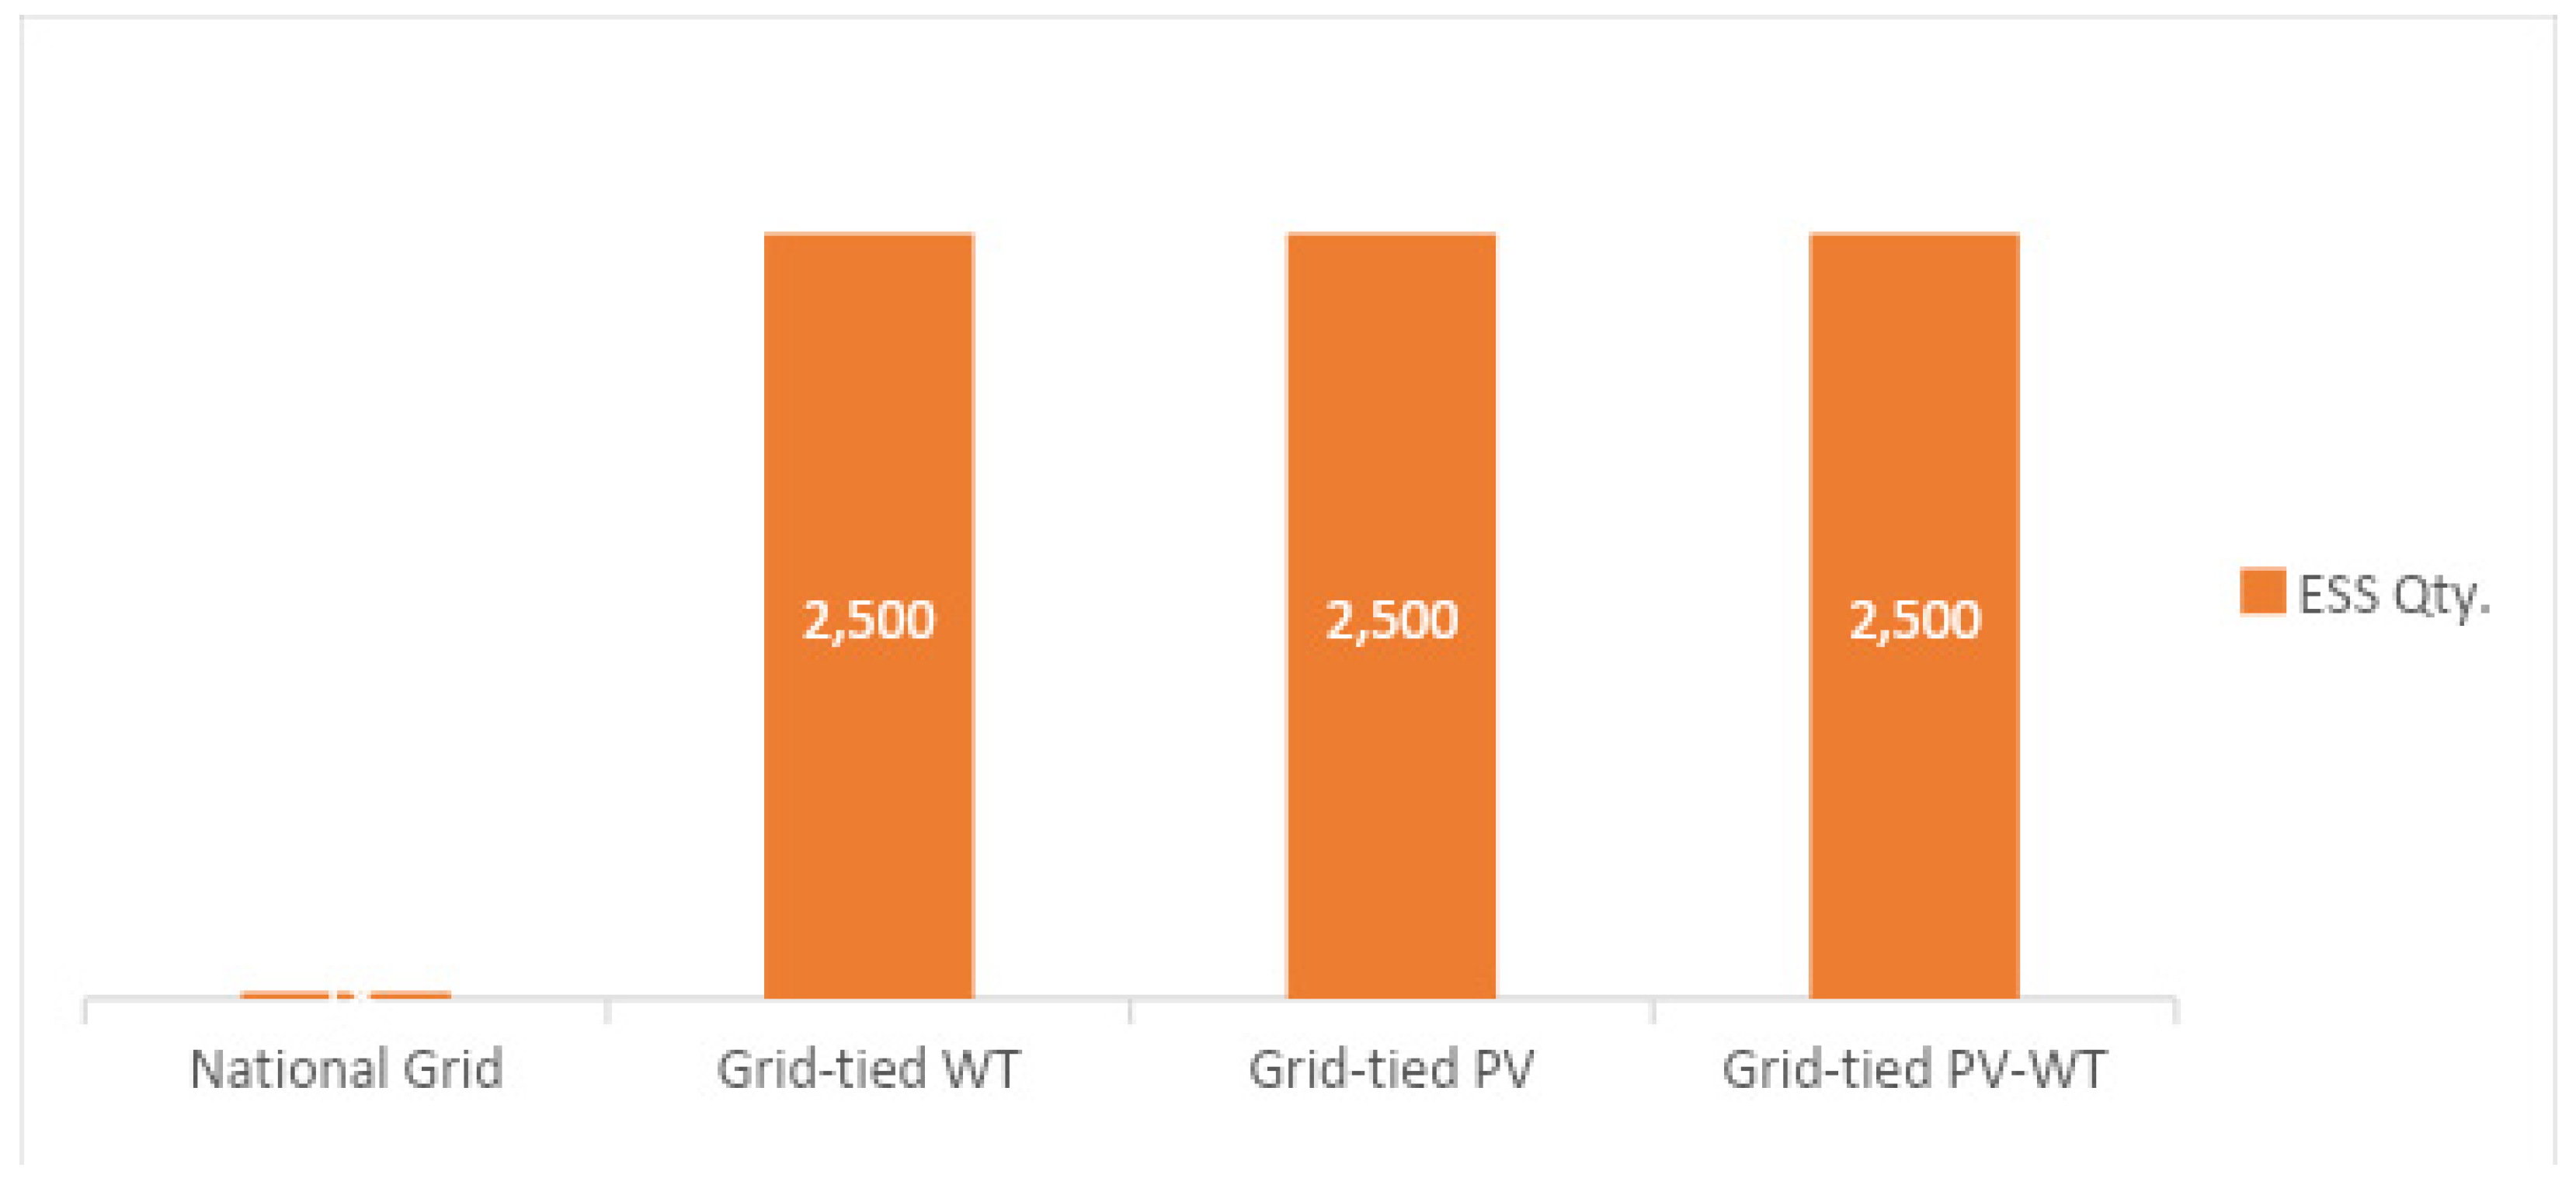
Figure 16.
ESS quantity for different power system configurations.
Regarding the payback period, grid-tied WT-BESS based hybrid power systems showed the shortest payback period of 6.18 years and grid-tied PV-WT hybrid system showed payback of 9.7 years, compared to 9.21 years for grid-tied PV configurations, due to the higher prices of photovoltaic and wind turbine systems that ultimately lead to increases in overall cost and payback period.
It can be seen in Figure 16 that battery backup for the hybrid renewables configuration has been kept constant to consider the technoeconomic analysis in similar situations. Likewise, as shown in Figure 17, the optimized system emits greenhouse gases of up to 3,199,882 kg/Yr, compared to 8,719,564 kg/Yr by National Grid only setup, for the same load capacity. The optimized system showed significant reductions in environmental pollution.
Figure 17.
GHG Emissions for different power system configurations.
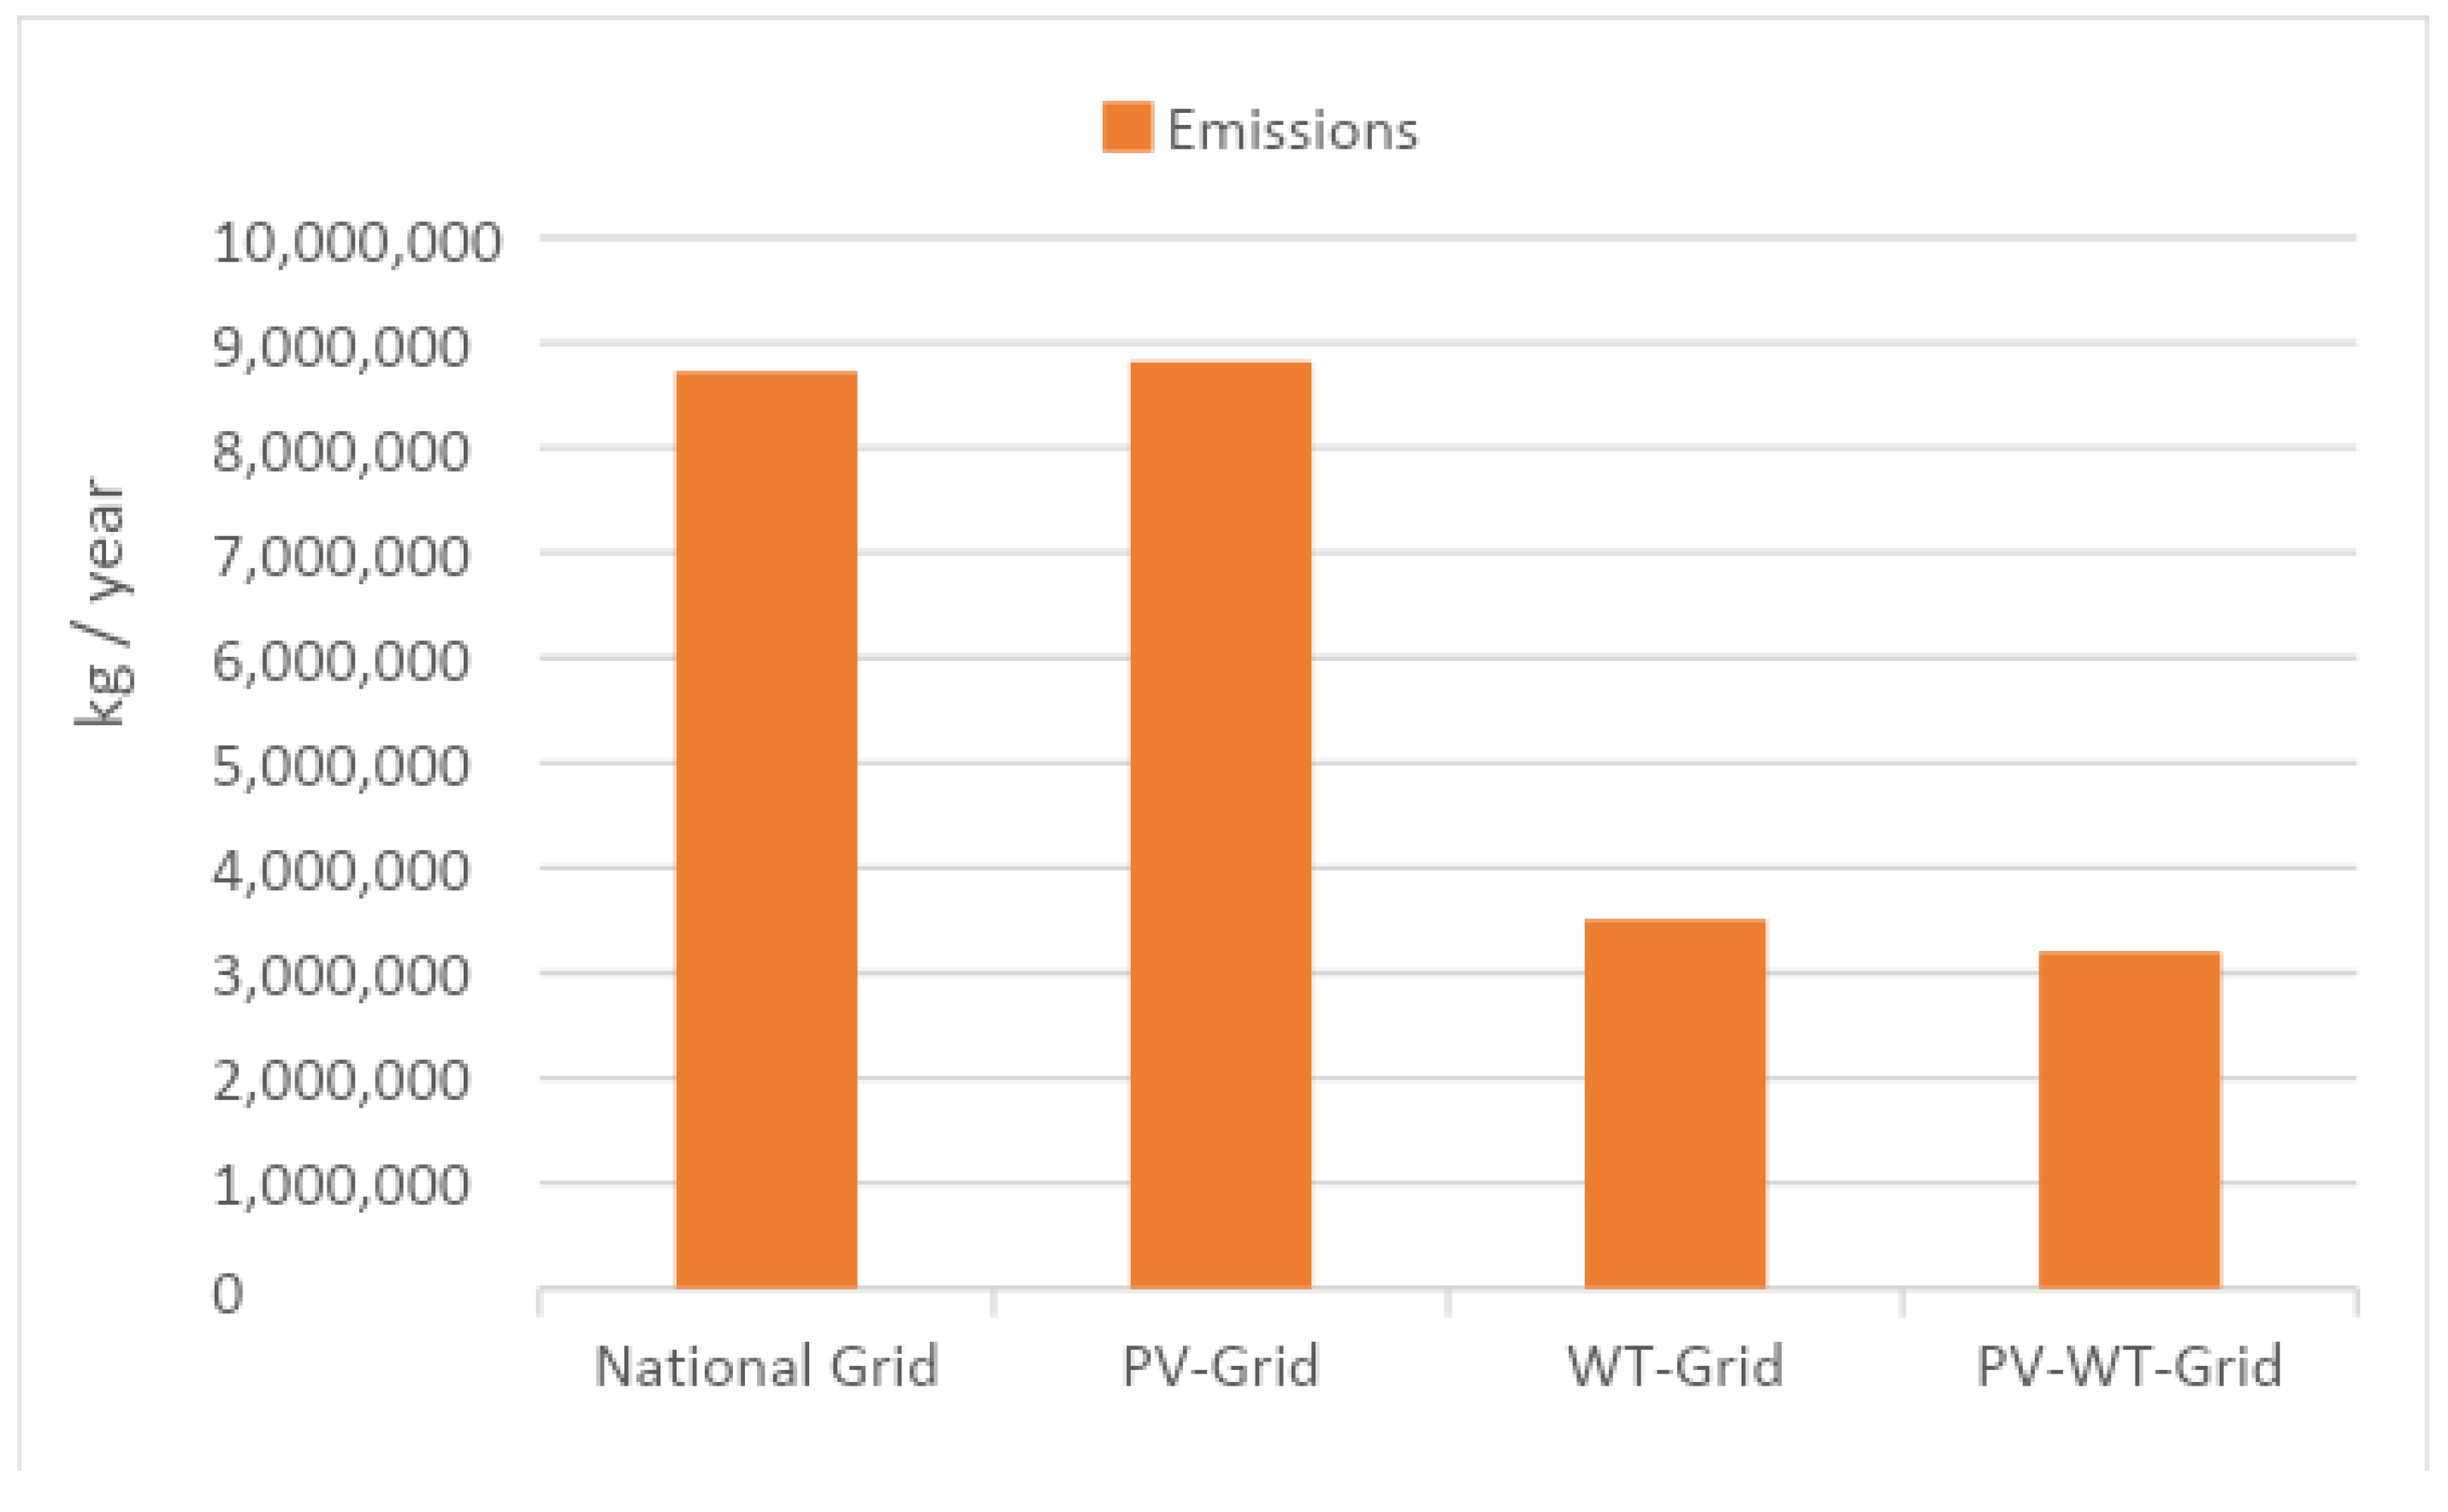
As shown in Table 5, the LCOE ranges from 0.0412 CAD/kWh to 0.127 CAD/kWh from which the proposed optimized hybrid system comprising grid-tied PV-WT configuration exhibits the LCOE of 0.0705. The environmental impact is reduced in the proposed hybrid configuration because the renewable fraction has improved.
The simulation results indicate that the proposed grid-tied PV-WT based hybrid system has the LCOE value of 0.0705 CAD/kWh while having comparatively higher capital investment compared to other combinations of hybrid systems due to the inclusion of renewable sources. Moreover, the renewable fraction of the most optimized hybrid system (PV-WT-Grid) is 80%. The simulated results presented above indicated that the proposed hybrid system configuration for the load, under current economic and emission performance, can be considered as the optimal solution.
5. Conclusions
The proposed study demonstrated that transforming to renewable energy technologies is necessary to gain reliable, clean electricity for residential, commercial or industrial loads, especially in the energy demand associated with industrial and technological expansion. A hybrid grid-connected system consisting of PV-wind-battery is proposed in this research work to compensate for the actual load demand and resulted in approximately 56 % cost reduction of the overall system. The renewable fraction of the hybrid system is almost 80%, indicating that the proposed system is more environmentally friendly while having a very low LCOE of 0.0705 CAD/kWh. Study results showed that intelligent systems must be implemented for energy management to enable the transformation to renewable energy and to develop a green energy sector.
In keeping with the Green Initiative vision across the globe, the conversion of conventional fuel-based power systems over the efficient tri-brid energy system configuration proposed in this study would have substantial benefits. Integration of the tri-brid system with the grid to sell excess energy generation during times and the analysis of revenue generation makes this approach more cost effective and reliable.
Next, various other viable renewable sources could be considered, to increase the reliance on renewables and decrease the overall costs. Furthermore, adaptation of the latest technology for battery backup systems can increase overall efficiency of the system.
Author Contributions
Mohammad Adnan Aftab planned and conducted the main investigation, drafted the manuscript, and prepared the tables and figures. Every author contributed equally in making this study into productive and valuable research work.
Funding Details: This research work was funded by MITACS, Old Sun Community College and the partner organization Siksika’s SRDL Group. The reference number for the grants is IT28955.
Disclosure Statement: The authors report there are no competing interests to declare.
Data Availability Statement
The data in the paper belongs to the funding organization and authors and is not for public use. They can be made available upon request.
References
- Nikzad, R.; Sedigh, G. Greenhouse Gas Emissions and Green Technologies in Canada. Environ. Dev. 2017, 24, 99–108. [CrossRef]
- Hosseini, S.M.; Kanagaraj, N.; Sadeghi, S.; Yousefi, H. Midpoint and Endpoint Impacts of Electricity Generation by Renewable and Nonrenewable Technologies: A Case Study of Alberta, Canada. Renew. Energy 2022, 197, 22–39. [CrossRef]
- Hastings-Simon, S.; Leach, A.; Shaffer, B.; Weis, T. Alberta’s Renewable Electricity Program: Design, Results, and Lessons Learned. Energy Policy 2022, 171, 113266. [CrossRef]
- Jamil, U.; Pearce, J.M. Energy Policy for Agrivoltaics in Alberta Canada. Energies 2023, 16, 53. [CrossRef]
- Martins Godinho, C.; Noble, B.; Poelzer, G.; Hanna, K. Impact Assessment for Renewable Energy Development: Analysis of Impacts and Mitigation Practices for Wind Energy in Western Canada. Impact Assess. Proj. Apprais. 2023, 41, 59–70. [CrossRef]
- Bensalah, A.; Barakat, G.; Amara, Y. Electrical Generators for Large Wind Turbine: Trends and Challenges. Energies 2022, 15, 6700. [CrossRef]
- Priyanka, T.J.; Atre, S.; Billal, M.M.; Arani, M. Techno-Economic Analysis of a Renewable-Based Hybrid Energy System for Utility and Transportation Facilities in a Remote Community of Northern Alberta. Clean. Energy Syst. 2023, 6, 100073. [CrossRef]
- Robertson, B.; Bekker, J.; Buckham, B. Renewable Integration for Remote Communities: Comparative Allowable Cost Analyses for Hydro, Solar and Wave Energy. Appl. Energy 2020, 264, 114677. [CrossRef]
- Canada, E. and C.C. Greenhouse Gas Emissions Available online: https://www.canada.ca/en/environment-climate-change/services/environmental-indicators/greenhouse-gas-emissions.html (accessed on 14 March 2024).
- Ur Rashid, M.; Ullah, I.; Mehran, M.; Baharom, M.N.R.; Khan, F. Techno-Economic Analysis of Grid-Connected Hybrid Renewable Energy System for Remote Areas Electrification Using Homer Pro. J. Electr. Eng. Technol. 2022, 17, 981–997. [CrossRef]
- Li, C.; Zhou, D.; Zheng, Y. Techno-Economic Comparative Study of Grid-Connected PV Power Systems in Five Climate Zones, China. Energy 2018, 165, 1352–1369. [CrossRef]
- Kapoor, S.; Sharma, A.K. Techno-Economic Analysis by Homer-pro Approach of Solar on-Grid System for Fatehpur-Village, India. J. Phys. Conf. Ser. 2021, 2070, 012146. [CrossRef]
- Das, B.K.; Alotaibi, M.A.; Das, P.; Islam, M.S.; Das, S.K.; Hossain, M.A. Feasibility and Techno-Economic Analysis of Stand-Alone and Grid-Connected PV/Wind/Diesel/Batt Hybrid Energy System: A Case Study. Energy Strategy Rev. 2021, 37, 100673. [CrossRef]
- Abdin, Z.; Mérida, W. Hybrid Energy Systems for Off-Grid Power Supply and Hydrogen Production Based on Renewable Energy: A Techno-Economic Analysis. Energy Convers. Manag. 2019, 196, 1068–1079. [CrossRef]
- Longo, M.; Yaïci, W.; Foiadelli, F. Hybrid Renewable Energy System with Storage for Electrification €“ Case Study of Remote Northern Community in Canada. Int. J. Smart Grid - IjSmartGrid 2019, 3, 63–72.
- Performance Analysis of a Photovoltaic/Wind/Diesel Hybrid Power Generation System for Domestic Utilization in Winnipeg, Manitoba, Canada - Arabzadeh Saheli - 2019 - Environmental Progress & Sustainable Energy - Wiley Online Library Available online: https://aiche.onlinelibrary.wiley.com/doi/10.1002/ep.12939 (accessed on 14 March 2024).
- Kaluthanthrige, R.; Rajapakse, A.D.; Lamothe, C.; Mosallat, F. Optimal Sizing and Performance Evaluation of a Hybrid Renewable Energy System for an Off-Grid Power System in Northern Canada. Technol. Econ. Smart Grids Sustain. Energy 2019, 4, 4. [CrossRef]
- How HOMER Calculates Wind Turbine Power Output Available online: https://homerenergy.com/products/pro/docs/3.15/how_homer_calculates_wind_turbine_power_output.html (accessed on 14 March 2024).
- Urban, R. Solar Power Alberta (2023 Guide) Available online: https://www.energyhub.org/alberta/ (accessed on 14 March 2024).
- Siksika Nation Available online: https://siksikanation.com/ (accessed on 14 March 2024).
- Government of Canada, S.C. Census Profile, 2021 Census of Population Available online: https://www12.statcan.gc.ca/census-recensement/2021/dp-pd/prof/index.cfm?Lang=E (accessed on 14 March 2024).
- How Many kWh Does the Average Home Use? Available online: https://ca.renogy.com/blog/how-many-kwh-does-the-average-home-use/ (accessed on 14 March 2024).
- NASA POWER | Prediction Of Worldwide Energy Resources Available online: https://power.larc.nasa.gov/ (accessed on 14 March 2024).
- Osterwald, C.R. Translation of Device Performance Measurements to Reference Conditions. Sol. Cells 1986, 18, 269–279. [CrossRef]
- Select Alberta Electricity Provider Available online: https://energyrates.ca/select-alberta-electricity-provider/ (accessed on 14 March 2024).
Disclaimer/Publisher’s Note: The statements, opinions and data contained in all publications are solely those of the individual author(s) and contributor(s) and not of MDPI and/or the editor(s). MDPI and/or the editor(s) disclaim responsibility for any injury to people or property resulting from any ideas, methods, instructions or products referred to in the content. |
© 2024 by the authors. Licensee MDPI, Basel, Switzerland. This article is an open access article distributed under the terms and conditions of the Creative Commons Attribution (CC BY) license (http://creativecommons.org/licenses/by/4.0/).
Copyright: This open access article is published under a Creative Commons CC BY 4.0 license, which permit the free download, distribution, and reuse, provided that the author and preprint are cited in any reuse.


