
Submitted:
16 March 2024
Posted:
18 March 2024
You are already at the latest version
Abstract
The temperature effect plays an important role for an accurate determination of the polar free energy, polar thermodynamic parameters, and enthalpic and entropic Lewis’s acid base properties of oxides, polymers and composites polymers/oxides. The adsorption of polymers on other solid surfaces is crucial in many industrial applications, coatings, paints, catalysis, colloids and adhesion processes. (1) Background: Inverse gas chromatography at infinite was used for the physico-chemical characterization of solid substrates by determining the thermodynamic parameters of adsorption of model organic solvents on solid surfaces such as polymers, metallic oxides, carbon fibers, pharmaceutical or 3D/4D printing substrates. (2) Methods: A new method based on the London dispersion equation was applied with a new parameter associating the deformation po-larizability and the harmonic mean of the ionization energies of solvent. More accurate values of the dispersive and polar interaction energies of the various organic solvents adsorbed on PMMA in bulk phase and PMMA/silica at different recovery fractions were obtained as well as the Lewis acid-base parameters and the transition temperatures of the different composites. (3) Results: This new methodology gave very interesting results on the behavior of PMMA adsorbed on silica. An important effect of the temperature and the recovery fraction on the various physicochemical and thermodynamic properties was highlighted. The variations of all interaction parameters showed the presence of three transition temperatures for the different PMMA adsorbed on silica with the various coverage rates with a shift of these temperatures for a recovery fraction of 31% (4) Con-clusions: An important variation of the polar enthalpy and entropy of adsorption, the Lewis ac-id-base parameters and the intermolecular separation distance as a function of the temperature and the recovery fraction of PMMA on silica.
Keywords:
London dispersion equation
; recovery fraction
; polar enthalpy and entropy
; Lewis’s acid-base parameters
; transition temperatures
; intermolecular separation distance
1. Introduction
The determination of physicochemical properties of polymers adsorbed on oxides play an important role in various industrial applications and chemical processes, including specific composites such as plastics, paper, and rubber [1]. The surface modification of polymers by adsorption on metallic oxides is crucial in several industrial processes and products [1,2,3,4,5,6,7,8,9,10]. Indeed, the adsorption of polymer on solid surfaces, in a solvent, is very useful for the dispersion or aggregation of concentrated suspensions or slurries. The adsorption process can contribute to the strength of the polymer segment contacts in the areas of adhesives, coatings and polymer composites. For example, the physicochemical and mechanical properties of polymer composites are not only affected by the adhesion strength between polymer and reinforced filler but also by the variations of the temperature.
The behavior of polymer composites strongly depends on the values of the transition temperatures and more particularly on their glass transitions. Polymers have different types of behavior, around the glass temperature (Tg) depending on the temperature in the glass and liquid states. Most physical properties, including, for example, the enthalpy, rheological, and other surface properties change with temperature and time until reaching equilibrium, if polymers are heated below Tg [8,9,10,11,12]. This is directly related to the physical aging or structure relaxation of polymers or devices made of glassy polymers [13,14].
The determination of the physicochemical properties of polymers adsorbed on oxides is required to prevent their behaviors in the contact with other solids, liquids or gas. The composites polymer/metallic oxides are very used for the coatings of paintings or industrial packing. Polymer composites or nanocomposites, such as acrylate polymers or poly methyl methacrylate (PMMA) adsorbed on oxides can be used in many applications such as, artificial muscles, urban furniture, aeronautics, and microelectronics due to their high mechanical properties and high capacitance density [8,15,16,17,18,19,20,21].
Many studies were interested in the determination of the physicochemical properties [22,23,24,25,26,27,28,29,30,31,32,33,34,35,36,37,38,39,40,41,42,43,44,45,46] and the glass transition temperatures [47,48,49,50,51,52,53,54,55,56,57,58] by inverse gas chromatography (IGC) at infinite dilution. This technique was applied to quantify the interactions between polymers, composites or oxides and organic molecules under the of infinite dilution conditions [22,23,24,25,26,27,28,29,30,31,32,33,34,35,36,37,38,39,40,41,42,43,44,45,46,47,48,49,50,51,52,53,54,55,56,57,58]. The Lewis acid–base properties of insulating thermoplastic and thermosetting polymer materials [13,14,47,48,49,50,51,52,53,54,55,56,57,58], and the solubility parameters in appropriate solvents were also determined by IGC technique. Papirer et al. [59] have studied the effect of surface acid–base characteristics of PMMA adsorbed on alumina, whereas, Hamieh et al. [55,56,57,58] have highlighted the presence of three transition temperatures of PMMA in the bulk phase and when adsorbed on silica and alumina.
However, the effect of the temperature change on the polar interactions and the Lewis acid-base properties near the transition temperatures of PMMA adsorbed on silica has never yet studied in literature.
We proposed in this paper to use IGC technique at infinite dilution to study the impact of the variation of the temperature on the London dispersive and polar free interaction energy, and Lewis’s acid-base parameters of PMMA/silica system for different recovery fractions of PMMA adsorbed on silica by applying our new methodology. Indeed, this recent method used the London dispersion equation [44,45] and proposed a new thermodynamic parameter using the deformation polarizability of the probe and the ionization energies of the solid and the solvent following this relation:
By using the parameter , it was possible to obtain accurate values of the free interaction energy between the solid surfaces and the adsorbed organic molecules. The separation between the dispersive and polar interaction energies of PMMA adsorbed on silica at various recovery fractions allowed us to obtain the polar enthalpy and entropy of adsorption and the surface acid-base parameters of the composite PMMA/silica, such as the enthalpic and entropic Lewis’s acid-base constants of the solid substrates.
2. Chromatographic Methods and Materials
The net retention time and volume of n-alkanes and polar molecules adsorbed on PMMA/silica surfaces were experimentally obtained by using the inverse gas chromatography (IGC) at infinite dilution [22,23,24,25,26,27,28,29,30,31,32,33,34,35,36,37,38,39,40,41,42,43,44,45,46,47,48,49,50,51,52,53,54,55,56,57,58,59]. This led to the free energy of adsorption of adsorbed solvents on the solid surface (Equation 1):
Where T is the absolute temperature of the chromatographic column containing the solid material, R the perfect gas constant, and a constant depending on the temperature and reference characteristics referred to the two-dimensional state of adsorbed film.
is equal to the sum of the London dispersion component and the polar component of the free energy adsorption (Equation 2)
The London dispersion free energy can be expressed as:
Where and is the Avogadro’s number, the permittivity of vacuum, S denoting the solid particle and X the solvent molecule separated by a distance , and and are the respective ionization energies of the solid and the solvent . The new chromatographic chosen parameter of interaction between the solid and the solvent is given by
In the case of n-alkanes adsorbed on the solid material, can be given by:
Where is given by:
The straight-line of n-alkanes representing the variations of against allowed us to determine the polar free energy of polar solvents adsorbed on PMMA/silica composites as a function of the temperature by using the following equation:
The polar enthalpy and entropy of organic molecules were then determined from the variations of using the following thermodynamic relations:
The values of and of adsorbed polar solvents were obtained as a function of the temperature and allowed us to quantify the Lewis’s enthalpic acid base constants and , and entropic acid base parameters and with respect of the temperature:
Where AN and DN are respectively the Gutmann electron donor and acceptor numbers of the polar solvents [60]. The used values were those corrected by Riddle and Fowkes [61].
The model organic molecules used as probes to quantify their interactions with the composites PMMA/silica were the following:
- -
- the n-alkanes such as n-pentane, n-hexane, n-heptane, n-octane, and n-nonane
- -
-
the polar molecules, divided into three groups:
- ⮚
- Lewis’s acid solvents such as dichloromethane, chloroform, and carbon tetrachloride
- ⮚
- Basic solvent such as ethyl acetate, diethyl ether, tetrahydrofuran
- ⮚
- Amphoteric such as toluene
PMMA and silica solid particles with different recovery fractions of adsorbed polymer used in this work were the same solid materials previously characterized in other studies by using other models and chromatographic methods [39,55,62]. The previous experimental data of of the various probes adsorbed on PMMA/silica composites obtained from IGC technique at infinite dilution was used to study the effect of the temperature on the various thermodynamic and physicochemical parameters of the adsorption of PMMA on silica at different recovery fractions.
3. Experimental Results
3.1. Polar Surface Interactions between PMMA/Silica and Solvents
The Handbook of Physics and Chemistry [63] allowed giving on Table S1 to S3 (in Supplementary Materials) the respective values of deformation polarizability and parameter of the various molecules adsorbed on PMMA and silica. Using the values given in Tables S1–S3, the polar free surface energy () of the polar probes adsorbed on the different solid composites were determined. Table 1, Table 2, Table 3, Table 4 and Table 5 gave the obtained of () relative to PMMA adsorbed on silica by varying the recovery fraction.
The results in Table 1 showed that the silica particles presented higher polar interaction free energy with the base solvents and lower interaction energy with the acidic solvents. This led to conclude that silica particle surfaces exhibited stronger acidity than the other solid materials (PMMA/silica) and lower basic character. On the contrary, the values in Table 2 relative to PMMA particles showed higher basic character and lower acid interaction energy. With a recovery fraction of 31% of PMMA adsorbed on silica, it was observed that the acidic character of silica decreases while its basicity increases to reach a maximum for 100% of recovery fraction (for one monolayer). The effects of the temperature and the recovery fraction of PMMA adsorbed on silica were shown on Figure 1, Figure 2, Figure 3, Figure 4, Figure 5, Figure 6 and Figure 7 for the various polar solvents used in this study.
The study of the evolution of the polar free interaction energy of the various polar solvents adsorbed on the composites PMMA/silica with respect of the recovery fraction and temperature (Figure 1, Figure 2, Figure 3, Figure 4, Figure 5, Figure 6 and Figure 7) showed a certain decrease of ( until a recovery fraction of 31% followed by an increase of the polar free interaction energy to reach a maximum when the coverage rate reaches 100% (case of monolayer) at all temperatures excepted for some specific temperatures higher than 380K corresponding to transition phenomena in PMMA where a decrease of ( against the coverage rate was observed. The same variations were found for the various adsorbed polar solvents.
The curves of ( of the different solvents plotted in Figures S1–S7 clearly showed the large effect of the temperature on the polar free energy with non linear variations in the case of PMMA in bulk phase and when adsorbed on silica at different recovery fractions. This non-linearity of ( was essentially observed near the transition temperatures of PMMA that were respectively highlighted at 333.15K, 383.15 and 433.15K, whereas, the linearity was shown far from these transition temperatures. However, for all solvents, the linearity ( was assured for silica particles with an excellent linear regression coefficient very close to 1.000. It was also showed in Figures S1–S7 that the variations of ( for the different coverage rates until the monolayer were in general limited between the two curves representative of PMMA in bulk phase and of silica particles with the results of monolayer approaching that of PMMA showing a mask effect exerted by PMMA on silica particles and limiting the role of silica on the interaction between the polar molecules and the solid surfaces.
To determine the polar enthalpy ( and entropy ( of interaction between solvents and composites, relations (8) and (9) were applied on the non-linear variations of ( of adsorbed polar solvents by taking small parabolic portions of the representative curves. The values of ( and ( were given in Tables S4–S8. An important difference in the behavior of the various solid surfaces was shown in Tables S4–S8 strongly depending on the temperature and on the coverage rate. To highlight the important effect of the temperature and the adsorption of PMMA on silica particles, the results were plotted on Figure 8, Figure 9, Figure 10, Figure 11 and Figure 12 giving the curves of the enthalpy ( and entropy (of polar solvents adsorbed on the various solid substrates as a function of the temperature by varying the coverage rate of the adsorption of PMMA on silica. The results in Figure 8 concerning the silica particles were plotted independently from the temperature; indeed, a perfect linearity was observed in the variations of the free polar energy ( of all adsorbed polar molecules and constants values of ( and () were obtained in the case of silica particles (Figure 8, Table S8).
However, the curves obtained with the various polymers PMMA in bulk and/or adsorbed phases plotted in Figure 9, Figure 10, Figure 11 and Figure 12 showed an extreme non-linearity variations of ( and entropy ( versus the temperature.
An intersting and original result was noted by the varaitions of polar enethalpy and entropy given in Figure 9, Figure 10, Figure 11 and Figure 12 showing four minima of the various curves mentioning specific and particular temperatures. In previous papers [], three transition temperatures were observed with PMMA and PMMA/silica at different coverages of PMMA on the silica particles respectively related to beta-relaxation (), glass transition () and other liquid-liquid transition (). A shift of these transition temperatures was observed in the case of the adsorption of PMMA on metallic oxides reaching 20°C when PMMA is adsorbed on silica.
In this work, four temperatures in the case of PMMA were noted: , , and (Figure 10, Table S4). The three previous transition temperatures were then confirmed by this study. However, the presence of a fourth temperature in the case of bulk PMMA deserves more thought.
In the case of composite PMMA/silica with a coverage rate , there are other shifted values of the transition temperatures. The new values are the following , , and (Figure 11, Table S5). It seems that this recovery fraction increases the liquid-liquid transition temperature about 20°C with a decrease of the glass transition about 10°C relatively to PMMA in bulk phase.
3.3. Enthalpic and Entropic Lewis’s Acid-Base Parameters
The variations of the interaction enthalpy (and entropy ( of the various polar molecules adsorbed on the different solid surfaces were given in Tables S4 to S8 and plotted on Figure 8, Figure 9, Figure 10, Figure 11 and Figure 12. These results were used with relations 10 and 11 to determine the variations of the enthalpic acid base parameters and and the entropic acid base parameters and of PMMA and PMMA/silica at different recovery fractions as a function of the temperature. The calculated values of the acid-base parameters functions of the temperature for the different solid surfaces were given in Table 6, Table 7, Table 8 and Table 9. The obtained results showed an important variation of the different acid-base parameters of PMMA and the composites PMMA/silica as a function of the temperature and coverage rate of the system PMMA/silica. The results in Table 6 showed that PMMA exhibited higher basic surface (about 8 to 10 times more basic than acidic) and lower acid character about half of that found with the silica particles (Table 10). However, the acid-base character of PMMA strongly with the increase of the temperature with sudden changes near the transition temperatures with negative values of the acid-base parameters around the transition temperature, certainly due to the variation of chemical group conformations in PMMA. Figures S8 to S11 also showed three to four secondary minima reflecting the presence of transition temperatures in PMMA and PMMA/silica systems. Figures S8 to S15 clearly showed the sudden variations of the acid-base parameters near the transition temperatures and also confirmed these transition phenomena in the different composites PMMA/silica. It was observed that the acidity of PMMA/silica sightly varied when the recovery fraction increases from to , whereas, the basicity globally increases when the recovery fraction increases (Table 6, Table 7, Table 8 and Table 9 and Figures S8–15). However, the results in Table 9 and Figure S11 gave higher acid-base parameters in the case of the monolayer of PMMA on silica relatively to silica particles and bulk PMMA. This special case of specific adsorption will probably create more surface chemical groups increasing the number of acidic and basic groups in Lewis terms at the surface of PMMA/silica that implies an increase of the Lewis acid-base parameters of adsorbed PMMA on silica.
On the contrary, the case of silica gave acid-base parameters independent from the temperature (Table 10) and showed higher acid character than that of the other PMMA/silica surfaces.
3.4. London Dispersive Free Interaction Energies of PMMA/silica
The new method applied in this paper and based on the London dispersive energy of interaction allowed to determine the London dispersive free energies of adsorbed solvents on the composites PMMA/silica at different recovery fractions and temperatures by using the following London dispersion interactions.
The dispersion factor was obtained by applying equation 5 on the n-alkanes adsorbed on the various composite materials. The results were given in Table 11 and Figure 13 and Figure 14 which irrevocably showed the presence of several transition temperatures located at the various maxima (in bold on Table 11) of the dispersion factor.
The values of the transition temperatures are identical to those previously obtained in this work and other studies. The adsorption of PMMA on silica is characterized by transition temperature shift in the case of a recovery fraction . It was shown on Figure 14 that the limit of the dispersion factor was obtained for PMMA in bulk phase (then for a recovery fraction .
The determination of the dispersion factor of the various PMMA/silica allowed giving in Tables S9–S11 the London dispersive energy of adsorption of the various organic solvents on PMMA (bulk phase) and PMMA/silica at different recovery fractions and temperatures. The transition temperatures were also highlighted in Tables S9–S11. Figure 15 gave an example of the variations of the London dispersive energy in the case of adsorption of PMMA on silica with The same previous conclusions concerning the presence of the transition temperatures were observed for a recovery fraction of 31% of PMMA on silica.
3.5. Determination of the Separation Distance between Solid Particles and Solvents
The average separation distance between the adsorbed solvents and the various solid surfaces was calculated by using the experimental results and relations 5 and 6. The variations of as a function of the temperature for the various solid substrates were plotted on Figure 16.
It was observed that the variations of the separation depends on the temperature, the nature of the solid surface and the recovery fraction. increased when the temperature increased. This is conformed with the kinetic theory and the thermal agitation that has the increase effect of the separation distance between particles.
The larger separation was found between silica particles and solvents, while the closest distance was obtained for a recovery fraction of PMMA adsorbed on silica. When comparing the curves of Figure 15 and Figure 16, it was noted that for , the minimum of the dispersive energy corresponds to a maximum of the separation distance. Indeed, the minimum of attractive energy is necessary equivalent to the higher separation distance. Once again, the curves of Figure 16 showed the presence of maxima at the transition temperatures.
4. Conclusions
A new methodology was proposed to study the physicochemical properties of the composites constituted by the adsorption of PMMA on silica particles with various coverage rates between (case of silica) and corresponding to a monolayer. The inverse gas chromatography at infinite dilution was used by applying the London dispersion interaction energy to separate the polar and dispersive energy of adsorbed solvents on the different solid surfaces. A new intrinsic thermodynamic parameter including the deformation polarizability of solvents and the harmonic mean of the ionization energies of solid surface and organic molecules. The determination of the polar interaction energy as a function of the temperature relative to the various composites PMMA/silica let to the values of the polar enthalpy and entropy. It was showed that all polar surface variables depended on the temperature and the coverage rates of PMMA adsorbed on silica particles.
The Lewis enthalpic and entropic acid-base parameters were determined for the various solid surfaces. All acid-base parameters of PMMA and PMMA/silica were found strongly dependent on the temperature. Only those of silica particles did not depend on the temperature. Silica exhibited higher acidic surface (twice more acidic than basic), whereas, the acid-base parameters of PMMA in bulk phase showed higher basic character varying as a function of the temperature (8 times more basic than acid in general). The acidity of the composites PMMA/silica slightly varied versus the temperature relatively to the highest values of Lewis basic parameters. However, the basicity of PMMA/silica increased with the recovery fraction to reach a maximum for a monolayer of adsorption. It seemed that the acidity of PMMA/silica for a monolayer reached the highest value.
The variations of the different thermodynamic and physicochemical parameters showed secondary minima and maxima highlighting the presence of several transition temperature for PMMA in bulk phase and for the systems PMMA/silica with different recovery fractions with a shift of such temperatures in the case of a recovery fraction equal to 31%
This new study also determined the average separation distance between the organic solvents and the various solid surfaces. It was showed that the separation distance is comprised between 4 and . It was observed a slight variation of the intermolecular distance as a function of the temperature and the recovery fraction of PMMA on silica particles.
Supplementary Materials
The following supporting information can be downloaded at the website of this paper posted on Preprints.org, Table S1. Values of deformation polarizability and ionization energy of n-alkanes and polar molecules. Table S2. Values of the harmonic mean of the ionization energies of silica and organic solvents and the parameter for the various organic molecules. Table S3. Values of the harmonic mean of the ionization energies of PMMA and organic solvents and the parameter for the various organic molecules. Figure S1. Variations of the polar free interaction energy of CCl4 adsorbed on PMMA/silica a function of the temperature, at different recovery fractions. Figure S2. Variations of the polar free interaction energy of CH2Cl2 adsorbed on PMMA/silica a function of the temperature, at different recovery fractions. Figure S3. Variations of the polar free interaction energy of CHCl3 adsorbed on PMMA/silica as a function of the temperature, at different recovery fractions. Figure S4. Variations of the polar free interaction energy of diethyl ether adsorbed on PMMA/silica as a function of the temperature, at different recovery fractions. Figure S5. Variations of the polar free interaction energy of THF adsorbed on PMMA/silica as a function of the temperature, at different recovery fractions. Figure S6. Variations of the polar free interaction energy of ethyl acetate adsorbed on PMMA/silica as a function of the temperature, at different recovery fractions. Figure S7. Variations of the polar free interaction energy of toluene adsorbed on PMMA/silica as a function of the temperature, at different recovery fractions. Table S4. Values (in kJ/mol) of polar enthalpy ( and ( of polar solvents adsorbed on PMMA particles at different temperatures. Table S5. Values (in kJ/mol) of polar enthalpy ( and ( of polar solvents adsorbed on PMMA/silica particles at different temperatures for a recovery fraction of 31%. Table S6. Values (in kJ/mol) of polar enthalpy ( and ( of polar solvents adsorbed on PMMA/silica for at different temperatures. Table S7. Values (in kJ/mol) of polar enthalpy ( and ( of polar solvents adsorbed on PMMA/silica for (monolayer) at different temperatures. Table S8. Values (in kJ/mol) of polar enthalpy ( and ( of polar solvents adsorbed on silica particles at different temperatures. Figure S8. Evolutions of the enthalpic acid base parameters , , / and , and the entropic acid base parameters , , / and of PMMA as a function of the temperature. Figure S9. Evolutions of the enthalpic acid base parameters , , / and , and the entropic acid base parameters , , / and of PMMA/silica for as a function of the temperature. Figure S10. Evolutions of the enthalpic acid base parameters , , / and , and the entropic acid base parameters , , / and of PMMA/silica for as a function of the temperature. Figure S11. Evolutions of the enthalpic acid base parameters , , / and , and the entropic acid base parameters , , / and of PMMA/silica for as a function of the temperature. Figure S12. Evolutions of the enthalpic Lewis acid parameter as a function of the recovery fraction and temperature. Figure S13. Evolutions of the enthalpic Lewis basic parameter as a function of the recovery fraction and temperature. Figure S14. Evolutions of the entropic Lewis acidic parameter as a function of the recovery fraction and temperature. Figure S15. Evolutions of the entropic Lewis basic parameter as a function of the recovery fraction and temperature. Table S9. Values (in kJ/mol) of the London free dispersive interaction energy ( of organic solvents adsorbed on PMMA at different temperatures. Table S10. Values (in kJ/mol) of the London free dispersive interaction energy ( of organic solvents adsorbed on PMMA/silica for at different temperatures. Table S11. Values (in kJ/mol) of the London free dispersive interaction energy ( of organic solvents adsorbed on PMMA/silica for at different temperatures. Table S12. Values (in kJ/mol) of the London free dispersive interaction energy ( of organic solvents adsorbed on PMMA/silica for (monolayer) at different temperatures.
Funding
This research did not receive any specific grant.
Data Availability Statement
There is no additional data.
Conflicts of Interest
The author declares no conflict of interest.
References
- Mathur, S.; Moudgil, B.M. Mechanisms of nonionic polymer adsorption on oxide surfaces. Mining, Met. Explor. 1998, 15, 24–28. [Google Scholar] [CrossRef]
- Jimenez, A.M.; Zhao, D.; Misquitta, K.; Jestin, J.; Kumar, S.K. Exchange Lifetimes of the Bound Polymer Layer on Silica Nanoparticles. ACS Macro Lett. 2019, 8, 166–171. [Google Scholar] [CrossRef] [PubMed]
- Cui, W.; You, W.; Sun, Z.; Yu, W. Decoupled polymer dynamics in weakly attractive poly(methyl methacrylate)/silica nanocomposites. Macromolecules 2021, 54, 5484–5497. [Google Scholar] [CrossRef]
- Boucher, V.M.; Cangialosi, D.; Alegría, A.; Colmenero, J. Enthalpy Recovery of PMMA/Silica Nanocomposites. Macromolecules 2010, 43, 7594–7603. [Google Scholar] [CrossRef]
- Priestley, R.D.; Rittigstein, P.; Broadbelt, L.J.; Fukao, K.; Torkelson, J.M. Evidence for the molecular-scale origin of the suppression of physical ageing in confined polymer: fluorescence and dielectric spectroscopy studies of polymer–silica nanocomposites. J. Physics: Condens. Matter 2007, 19. [Google Scholar] [CrossRef]
- González-Benito, J.; González-Gaitano, G. Interfacial Conformations and Molecular Structure of PMMA in PMMA/Silica Nanocomposites. Effect of High-Energy Ball Milling. Macromolecules 2008, 41, 4777–4785. [Google Scholar] [CrossRef]
- Lin, Y.; Liu, L.; Xu, G.; Zhang, D.; Guan, A.; Wu, G. Interfacial interactions and segmental dynamics of poly(vinyl acetate)/silica nanocomposites. J. Phys. Chem. C 2015, 119, 12956–12966. [Google Scholar] [CrossRef]
- Ma, M.; Cui, W.; Guo, Y.; Yu, W. Adsorption-desorption effect on physical aging in PMMA-silica nanocomposites. Polymer 2022, 255. [Google Scholar] [CrossRef]
- Rochat, S.; Polak-Kraśna, K.; Tian, M.; Mays, T.J.; Bowen, C.R.; Burrows, A.D. Assessment of the long-term stability of the polymer of intrinsic microporosity PIM-1 for hydrogen storage applications. Int. J. Hydrogen Energy 2019, 44, 332–337. [Google Scholar] [CrossRef]
- Õige, K.; Avarmaa, T.; Suisalu, A.; Jaaniso, R. Effect of long-term aging on oxygen sensitivity of luminescent Pd-tetraphenylporphyrin/PMMA films. Sensors Actuators B: Chem. 2005, 106, 424–430. [Google Scholar] [CrossRef]
- Gallino, I.; Cangialosi, D.; Evenson, Z.; Schmitt, L.; Hechler, S.; Stolpe, M.; Ruta, B. Hierarchical aging pathways and reversible fragile-to-strong transition upon annealing of a metallic glass former. Acta Mater. 2018, 144, 400–410. [Google Scholar] [CrossRef]
- Mandal, L.; Verma, B.; Patel, P.K. Review on polymer nanocomposite for ballistic & aerospace applications. Mater. Today Proc. 2020, 26, 3161–3166. [Google Scholar] [CrossRef]
- Wypych, A.; Duval, E.; Boiteux, G.; Ulanski, J.; David, L.; Mermet, A. Effect of physical aging on nano- and macroscopic properties of poly(methyl methacrylate) glass. Polymer 2005, 46, 12523–12531. [Google Scholar] [CrossRef]
- Huang, C.-C.; Liu, C.-Y. Peculiar α-β relaxations of Syndiotactic-Poly(methyl methacrylate). Polymer 2021, 225, 123760. [Google Scholar] [CrossRef]
- Liu, B.-E.; Yu, W. On-demand Direct Design of Polymeric Thermal Actuator by Machine Learning Algorithm. Chin. J. Polym. Sci. 2020, 38, 908–914. [Google Scholar] [CrossRef]
- Njuguna, J.; Pielichowski, K. Polymer Nanocomposites for Aerospace Applications: Fabrication. Adv. Eng. Mater. 2004, 6, 193–203. [Google Scholar] [CrossRef]
- Beiner, M.; Schröter, K.; Hempel, E.; Reissig, S.; Donth, E. Multiple Glass Transition and Nanophase Separation in Poly(n-alkyl methacrylate) Homopolymers. Macromolecules 1999, 32, 6278–6282. [Google Scholar] [CrossRef]
- Balasubramanian, K.B.N.; Ramesh, T. Role, effect, and influences of micro and nano-fillers on various properties of polymer matrix composites for microelectronics: A review. Polym. Adv. Technol. 2018, 29, 1568–1585. [Google Scholar] [CrossRef]
- Cheng, S.; Bocharova, V.; Belianinov, A.; Xiong, S.; Kisliuk, A.M.; Somnath, S.; Holt, A.P.; Ovchinnikova, O.S.; Jesse, S.; Martin, H.; et al. Unraveling the Mechanism of Nanoscale Mechanical Reinforcement in Glassy Polymer Nanocomposites. Nano Lett. 2016, 16, 3630–3637. [Google Scholar] [CrossRef]
- Moll, J.; Kumar, S.K. Glass Transitions in Highly Attractive Highly Filled Polymer Nanocomposites. Macromolecules 2012, 45, 1131–1135. [Google Scholar] [CrossRef]
- Napolitano, S. Irreversible adsorption of polymer melts and nanoconfinement effects. Soft Matter 2020, 16, 5348–5365. [Google Scholar] [CrossRef] [PubMed]
- Ryan, H. M.; Douglas J., G. 2008.
- Gamble, J.F.; Davé, R.N.; Kiang, S.; Leane, M.M.; Tobyn, M.; Wang, S.S. Investigating the applicability of inverse gas chromatography to binary powdered systems: An application of surface heterogeneity profiles to understanding preferential probe-surface interactions. Int. J. Pharm. 2013, 445, 39–46. [Google Scholar] [CrossRef]
- Balard, H.; Maafa, D.; Santini, A.; Donnet, J. Study by inverse gas chromatography of the surface properties of milled graphites. J. Chromatogr. A 2008, 1198-1199, 173–180. [Google Scholar] [CrossRef]
- Bogillo, V.I.; Shkilev, V.P.; Voelkel, A. Determination of surface free energy components for heterogeneous solids by means of inverse gas chromatography at finite concentrations. J. Mater. Chem. 1998, 8, 1953–1961. [Google Scholar] [CrossRef]
- Das, S.C. Zhou, Q.; Morton, D.A.V.; Larson, I.; Stewart, P.J. Use of surface energy distributions by I;nverse gas chromatography to understand mechanofusion processing and functionality of lactose coated with magnesium stearate. Eur. J. Pharm. Sci. 2011, 43, 325–333. [Google Scholar] [CrossRef] [PubMed]
- Das, S.C.; Stewart, P.J. Characterising surface energy of pharmaceutical powders by inverse gas chromatography at finite dilution. J. Pharm. Pharmacol. 2012, 64, 1337–1348. [Google Scholar] [CrossRef] [PubMed]
- Papadopoulou, S.K.; Panayiotou, C. Assessment of the thermodynamic properties of poly(2,2,2-trifluoroethyl methacrylate) by inverse gas chromatography. J. Chromatogr. A 2014, 1324, 207–214. [Google Scholar] [CrossRef]
- Flour, C.S.; Papirer, E. Gas-solid chromatography. A method of measuring surface free energy characteristics of short glass fibers. 1. Through adsorption isotherms. Ind. Eng. Chem. Prod. Res. Dev. 1982, 21, 337–341. [Google Scholar] [CrossRef]
- Flour, C.S.; Papirer, E. Gas-solid chromatography: method of measuring surface free energy characteristics of short fibers. 2. Through retention volumes measured near zero surface coverage. Ind. Eng. Chem. Prod. Res. Dev. 1982, 21, 666–669. [Google Scholar] [CrossRef]
- Flour, C.S.; Papirer, E. Gas-solid chromatography: a quick method of estimating surface free energy variations induced by the treatment of short glass fibers. J. Colloid Interface Sci. 1983, 91, 69–75. [Google Scholar] [CrossRef]
- Schultz, J.; Lavielle, L.; Martin, C. The Role of the Interface in Carbon Fibre-Epoxy Composites. J. Adhes. 1987, 23, 45–60. [Google Scholar] [CrossRef]
- Donnet, J.B.; Park, S.J.; Balard, H. Evaluation of specific interactions of solid surfaces by inverse gas chromatography. Chromatographia 1991, 31, 434–440. [Google Scholar] [CrossRef]
- Brendlé, E.; Papirer, E. A new topological index for molecular probes used in inverse gas chromatography for the surface nanorugosity evaluation, 2. Application for the Evaluation of the Solid Surface Specific Interaction Potential. J. Colloid Interface Sci., 1997, 194, 217–2224. [Google Scholar] [CrossRef]
- Brendlé, E.; Papirer, E. A new topological index for molecular probes used in inverse gas chromatography for the surface nanorugosity evaluation, 1. Method of Evaluation. J. Colloid Interface Sci. 1997, 194, 207–216. [Google Scholar] [CrossRef]
- Sawyer, D.T.; Brookman, D.J. Thermodynamically based gas chromatographic retention index for organic molecules using salt-modified aluminas and porous silica beads. Anal. Chem. 1968, 40, 1847–1853. [Google Scholar] [CrossRef]
- Chehimi, M.M.; Pigois-Landureau, E. Determination of acid–base properties of solid materials by inverse gas chromatography at infinite dilution. A novel empirical method based on the dispersive contribution to the heat of vaporization of probes. J. Mater. Chem. 1994, 4, 741–745. [Google Scholar] [CrossRef]
- Hamieh, T. New Methodology to Study the Dispersive Component of the Surface Energy and Acid–Base Properties of Silica Particles by Inverse Gas Chromatography at Infinite Dilution. J. Chromatogr. Sci. 2021, 60, 126–142. [Google Scholar] [CrossRef] [PubMed]
- Hamieh, T.; Schultz, J. New approach to characterise physicochemical properties of solid substrates by inverse gas chromatography at infinite dilution: I. Some new methods to determine the surface areas of some molecules adsorbed on solid surfaces. J. Chromatogr. A 2002, 969, 17–25. [Google Scholar] [CrossRef]
- Voelkel, A. Inverse Gas Chromatography: Characterization of Polymers, Fibers, Modified Silicas, and Surfactants. Crit. Rev. Anal. Chem. 1991, 22, 411–439. [Google Scholar] [CrossRef]
- Hamieh, T.; Ahmad, A.A.; Roques-Carmes, T.; Toufaily, J. New approach to determine the surface and interface thermodynamic properties of H-β-zeolite/rhodium catalysts by inverse gas chromatography at infinite dilution. Sci. Rep. 2020, 10, 1–27. [Google Scholar] [CrossRef]
- Hamieh, T. New Methodology to Study the Dispersive Component of the Surface Energy and Acid–Base Properties of Silica Particles by Inverse Gas Chromatography at Infinite Dilution. J. Chromatogr. Sci. 2021, 60, 126–142. [Google Scholar] [CrossRef]
- Hamieh, T. New Physicochemical Methodology for the Determination of the Surface Thermodynamic Properties of Solid Particles. Appliedchem 2023, 3, 229–255. [Google Scholar] [CrossRef]
- Hamieh, T. New Progress on London Dispersive Energy, Polar Surface Interactions, and Lewis’s Acid–Base Properties of Solid Surfaces. Molecules 2024, 29, 949. [Google Scholar] [CrossRef]
- Hamieh, T. London Dispersive and Lewis Acid-Base Surface Energy of 2D Single-Crystalline and Polycrystalline Covalent Organic Frameworks. Crystals 2024, 14, 148. [Google Scholar] [CrossRef]
- Hamieh, T. Inverse Gas Chromatography to Characterize the Surface Properties of Solid Materials. Chem. Mater. 2024, 36, 2231–2244. [Google Scholar] [CrossRef]
- Voelkel, A.; Strzemiecka, B.; Adamska, K.; Milczewska, K. Inverse gas chromatography as a source of physiochemical data. J. Chromatogr. A 2009, 1216, 1551–1566. [Google Scholar] [CrossRef] [PubMed]
- Dritsas, G.; Karatasos, K.; Panayiotou, C. Investigation of thermodynamic properties of hyperbranched aliphatic polyesters by inverse gas chromatography. J. Chromatogr. A 2009, 1216, 8979–8985. [Google Scholar] [CrossRef] [PubMed]
- Papadopoulou, S.K.; Panayiotou, C. Thermodynamic characterization of poly(1,1,1,3,3,3-hexafluoroisopropyl methacrylate) by inverse gas chromatography. J. Chromatogr. A 2012, 1229, 230–236. [Google Scholar] [CrossRef] [PubMed]
- Gamble, J.F.; Davé, R.N.; Kiang, S.; Leane, M.M.; Tobyn, M.; Wang, S.S. Investigating the applicability of inverse gas chromatography to binary powdered systems: An application of surface heterogeneity profiles to understanding preferential probe-surface interactions. Int. J. Pharm. 2013, 445, 39–46. [Google Scholar] [CrossRef]
- Kołodziejek, J.; Voelkel, A.; Heberger, K. Characterization of Hybrid Materials by Means of Inverse Gas Chromatography and Chemometrics. J. Pharm. Sci. 2013, 102, 1524–1531. [Google Scholar] [CrossRef] [PubMed]
- Lazar, P.; Karlický, F.; Jurečka, P.; Kocman, M.; Otyepková, E.; Šafářová, K.; Otyepka, M. Adsorption of Small Organic Molecules on Graphene. J. Am. Chem. Soc. 2013, 135, 6372–6377. [Google Scholar] [CrossRef]
- Belgacem, M.N.; Czeremuszkin, G.; Sapieha, S.; Gandini, A. Gandini, Surface by XPS characterization and inverse gas of cellulose fibres chromatography. Cellulose 1995, 2, 145–157. [Google Scholar] [CrossRef]
- Papadopoulou, S.; Tsioptsias, C.; Pavlou, A.; Kaderides, K.; Sotiriou, S.; Panayiotou, C. Superhydrophobic surfaces from hydrophobic or hydrophilic polymers via nanophase separation or electrospinning/electrospraying. Colloids Surfaces A: Physicochem. Eng. Asp. 2011, 387, 71–78. [Google Scholar] [CrossRef]
- Hamieh, T.; Rezzaki, M.; Schultz, J. Study of the second order transitions and acid-base properties of polymers adsorbed on oxides, by using inverse gas chromatography at infinite dilution, I and II. J. Colloid Interface Sci. 2001, 233, 339–342. [Google Scholar] [CrossRef]
- Hamieh, T. Study of the Specific Entropy of Poly (α-n-alkyl) Methacrylates Adsorbed on Alumina or Silica by Inverse Gas Chromatography (IGC). Soft Mater. 2011, 9, 15–31. [Google Scholar] [CrossRef]
- Hamieh, T. New Approach for the Determination of Acid Base Properties of Poly(α-n-alkyl) Methacrylates Adsorbed on Silica by Inverse Gas Chromatography (IGC). Chromatographia 2011, 73, 709–719. [Google Scholar] [CrossRef]
- Hamieh, T.; Toufaily, J.; Mouneimné, A.H. Effect of the Tacticity of PMMA Adsorbed on Alumina and Silica on the Specific Entropy Change of Polymer by Inverse GC. Chromatographia 2011, 73, 99–107. [Google Scholar] [CrossRef]
- Papirer, E.; Perrin, J.-M.; Siffert, B.; Philipponneau, G. Surface characteristics of aluminas in relation with polymer adsorption. J. Colloid Interface Sci. 1991, 144, 263–270. [Google Scholar] [CrossRef]
- Gutmann, V. The Donor-acceptor Approach to Molecular Interactions; Plenum: New York, 1978. [Google Scholar]
- Riddle, F.L.; Fowkes, F.M. Spectral shifts in acid-base chemistry. 1. van der Waals contributions to acceptor numbers. J. Am. Chem. Soc. 1990, 112, 3259–3264. [Google Scholar] [CrossRef]
- Hamieh, T.; Rezzaki, M.; Schultz, J. Study of the transition temperatures and acid–base properties of poly (methyl methacrylate) adsorbed on alumina and silica, by using inverse gas chromatography technique. Colloids Surfaces A: Physicochem. Eng. Asp. 2001, 189, 279–291. [Google Scholar] [CrossRef]
- Lide, D.R. (Ed.) CRC Handbook of Chemistry and Physics, Internet Version 2007, 87th ed.; Taylor and Francis: , Boca Raton, FL, 2007. [Google Scholar]
Figure 1.
Evolution of the polar free interaction energy ( (kJ/mol) of CCl4 as a function of the recovery fraction of PMMA adsorbed on silica at different temperatures.
Figure 1.
Evolution of the polar free interaction energy ( (kJ/mol) of CCl4 as a function of the recovery fraction of PMMA adsorbed on silica at different temperatures.
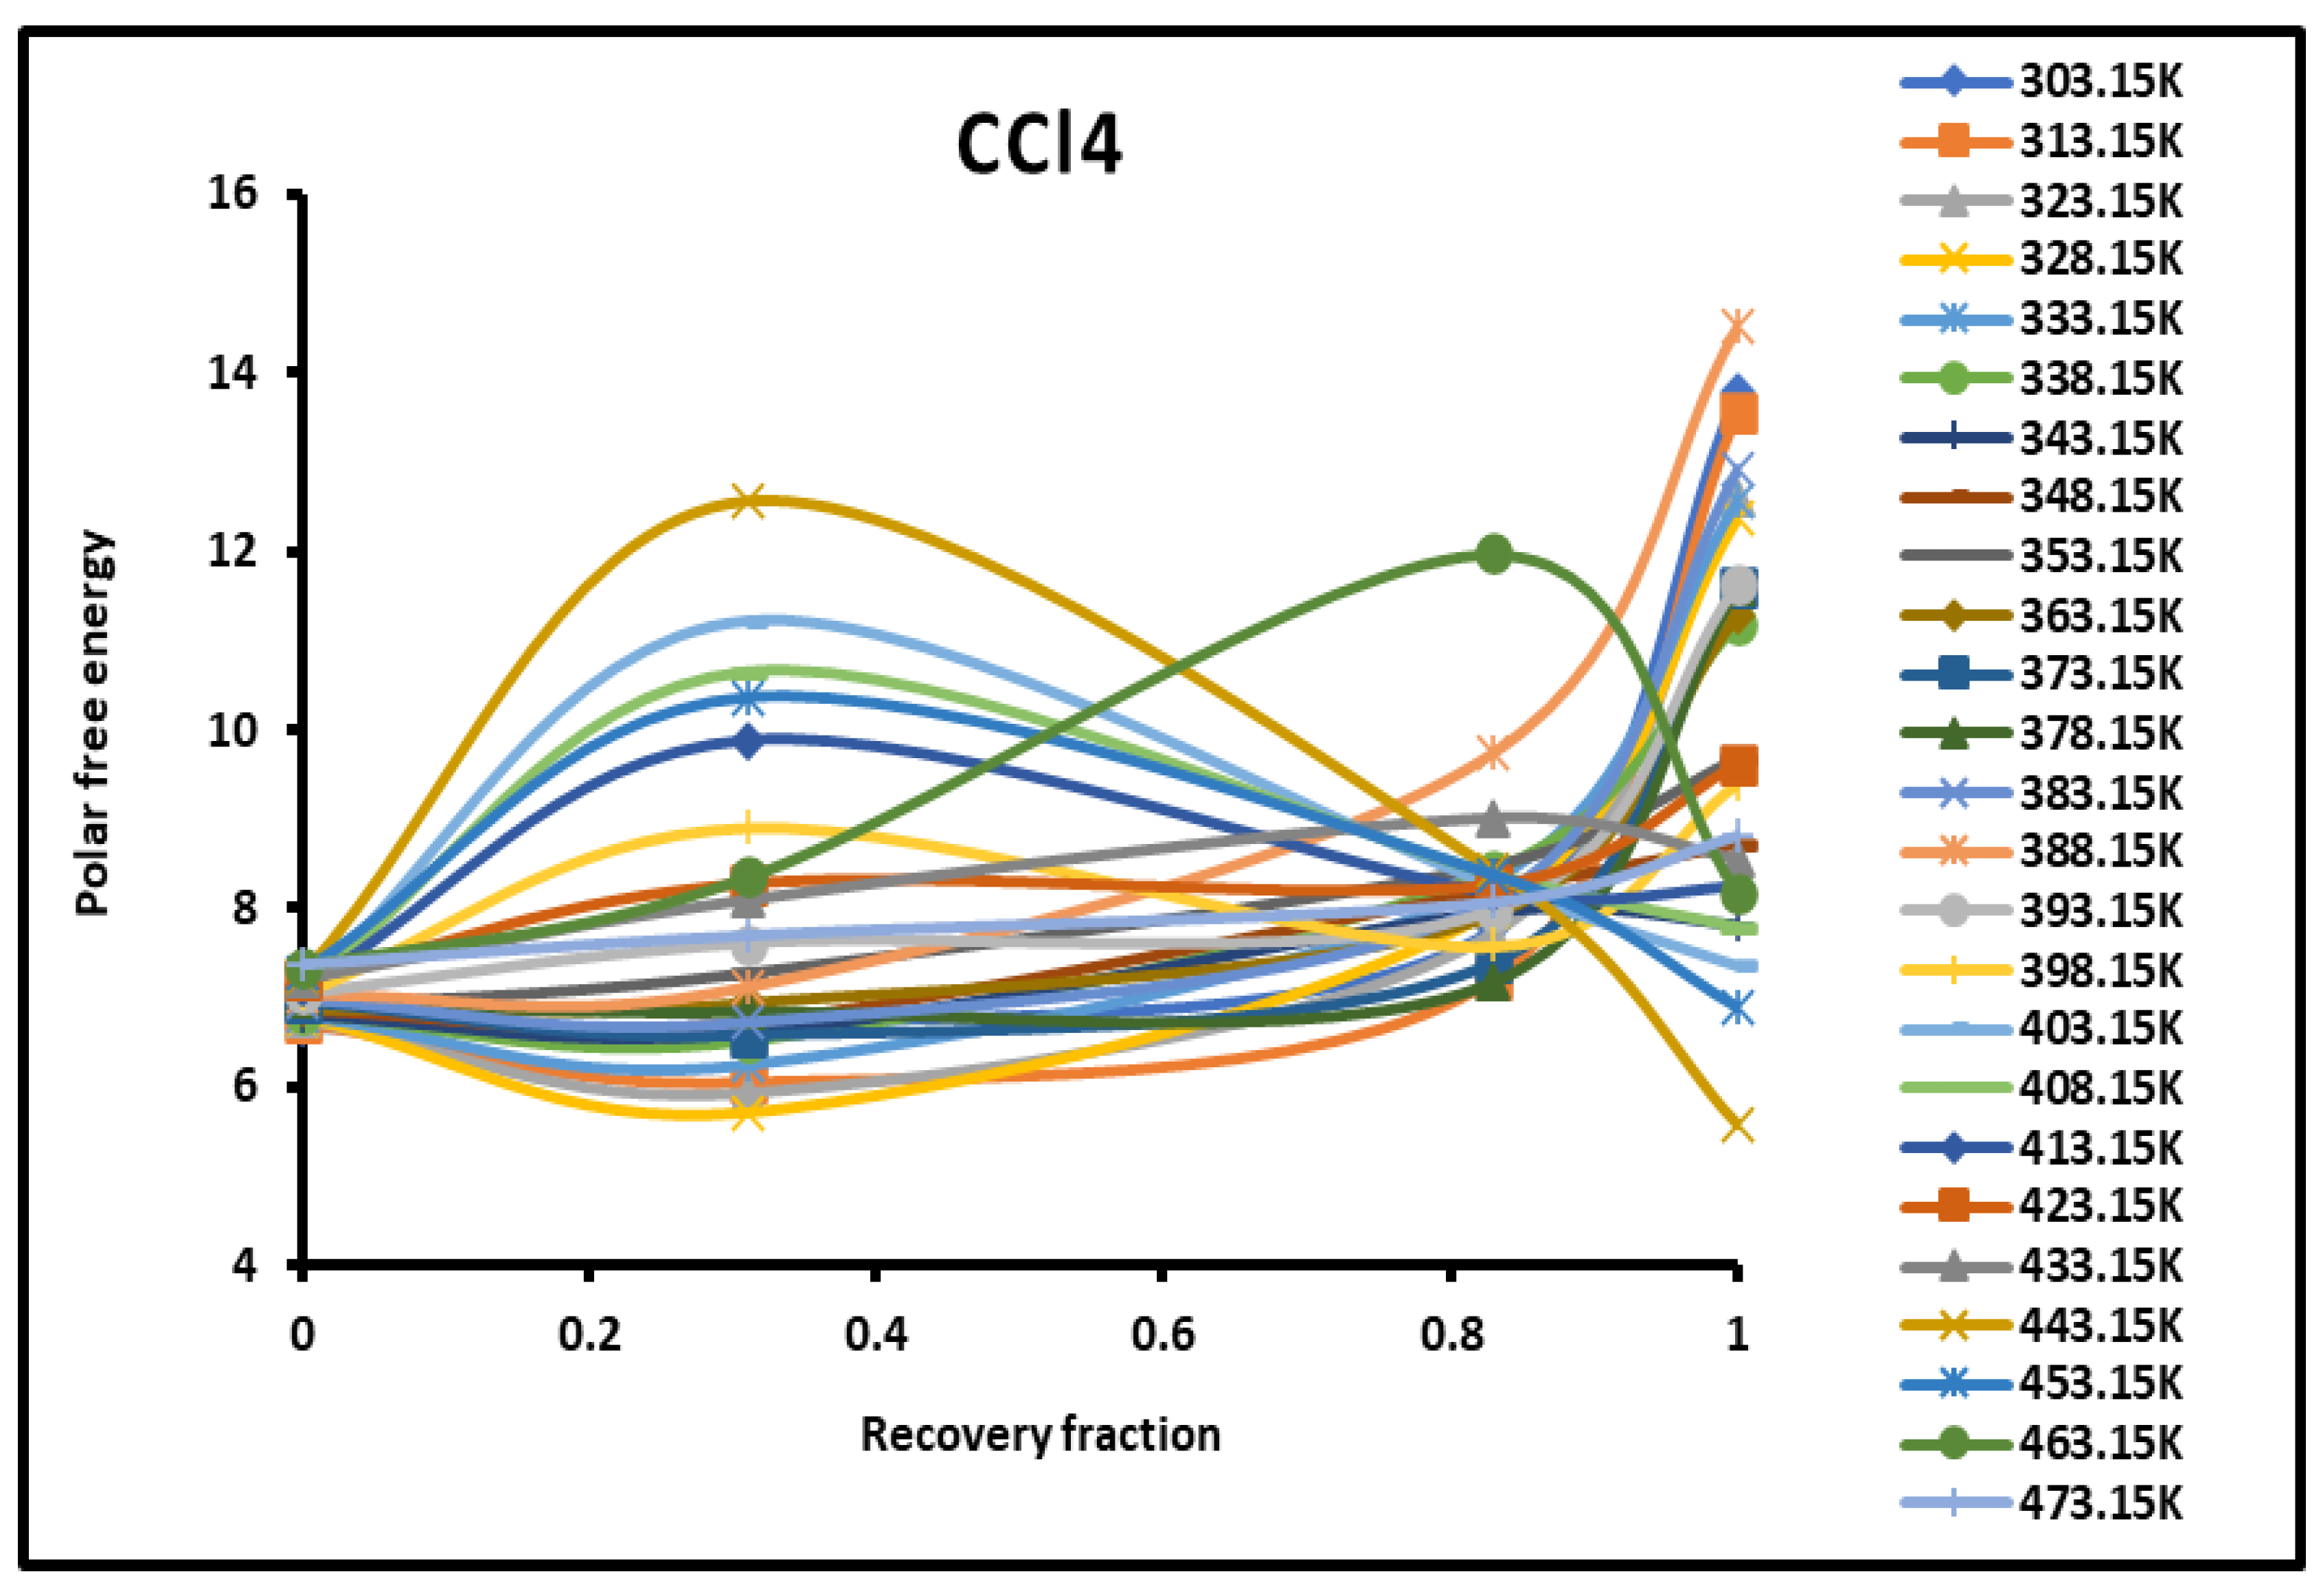
Figure 2.
Evolution of the polar free interaction energy ( (kJ/mol) of CH2Cl2 as a function of the recovery fraction of PMMA adsorbed on silica at different temperatures.
Figure 2.
Evolution of the polar free interaction energy ( (kJ/mol) of CH2Cl2 as a function of the recovery fraction of PMMA adsorbed on silica at different temperatures.
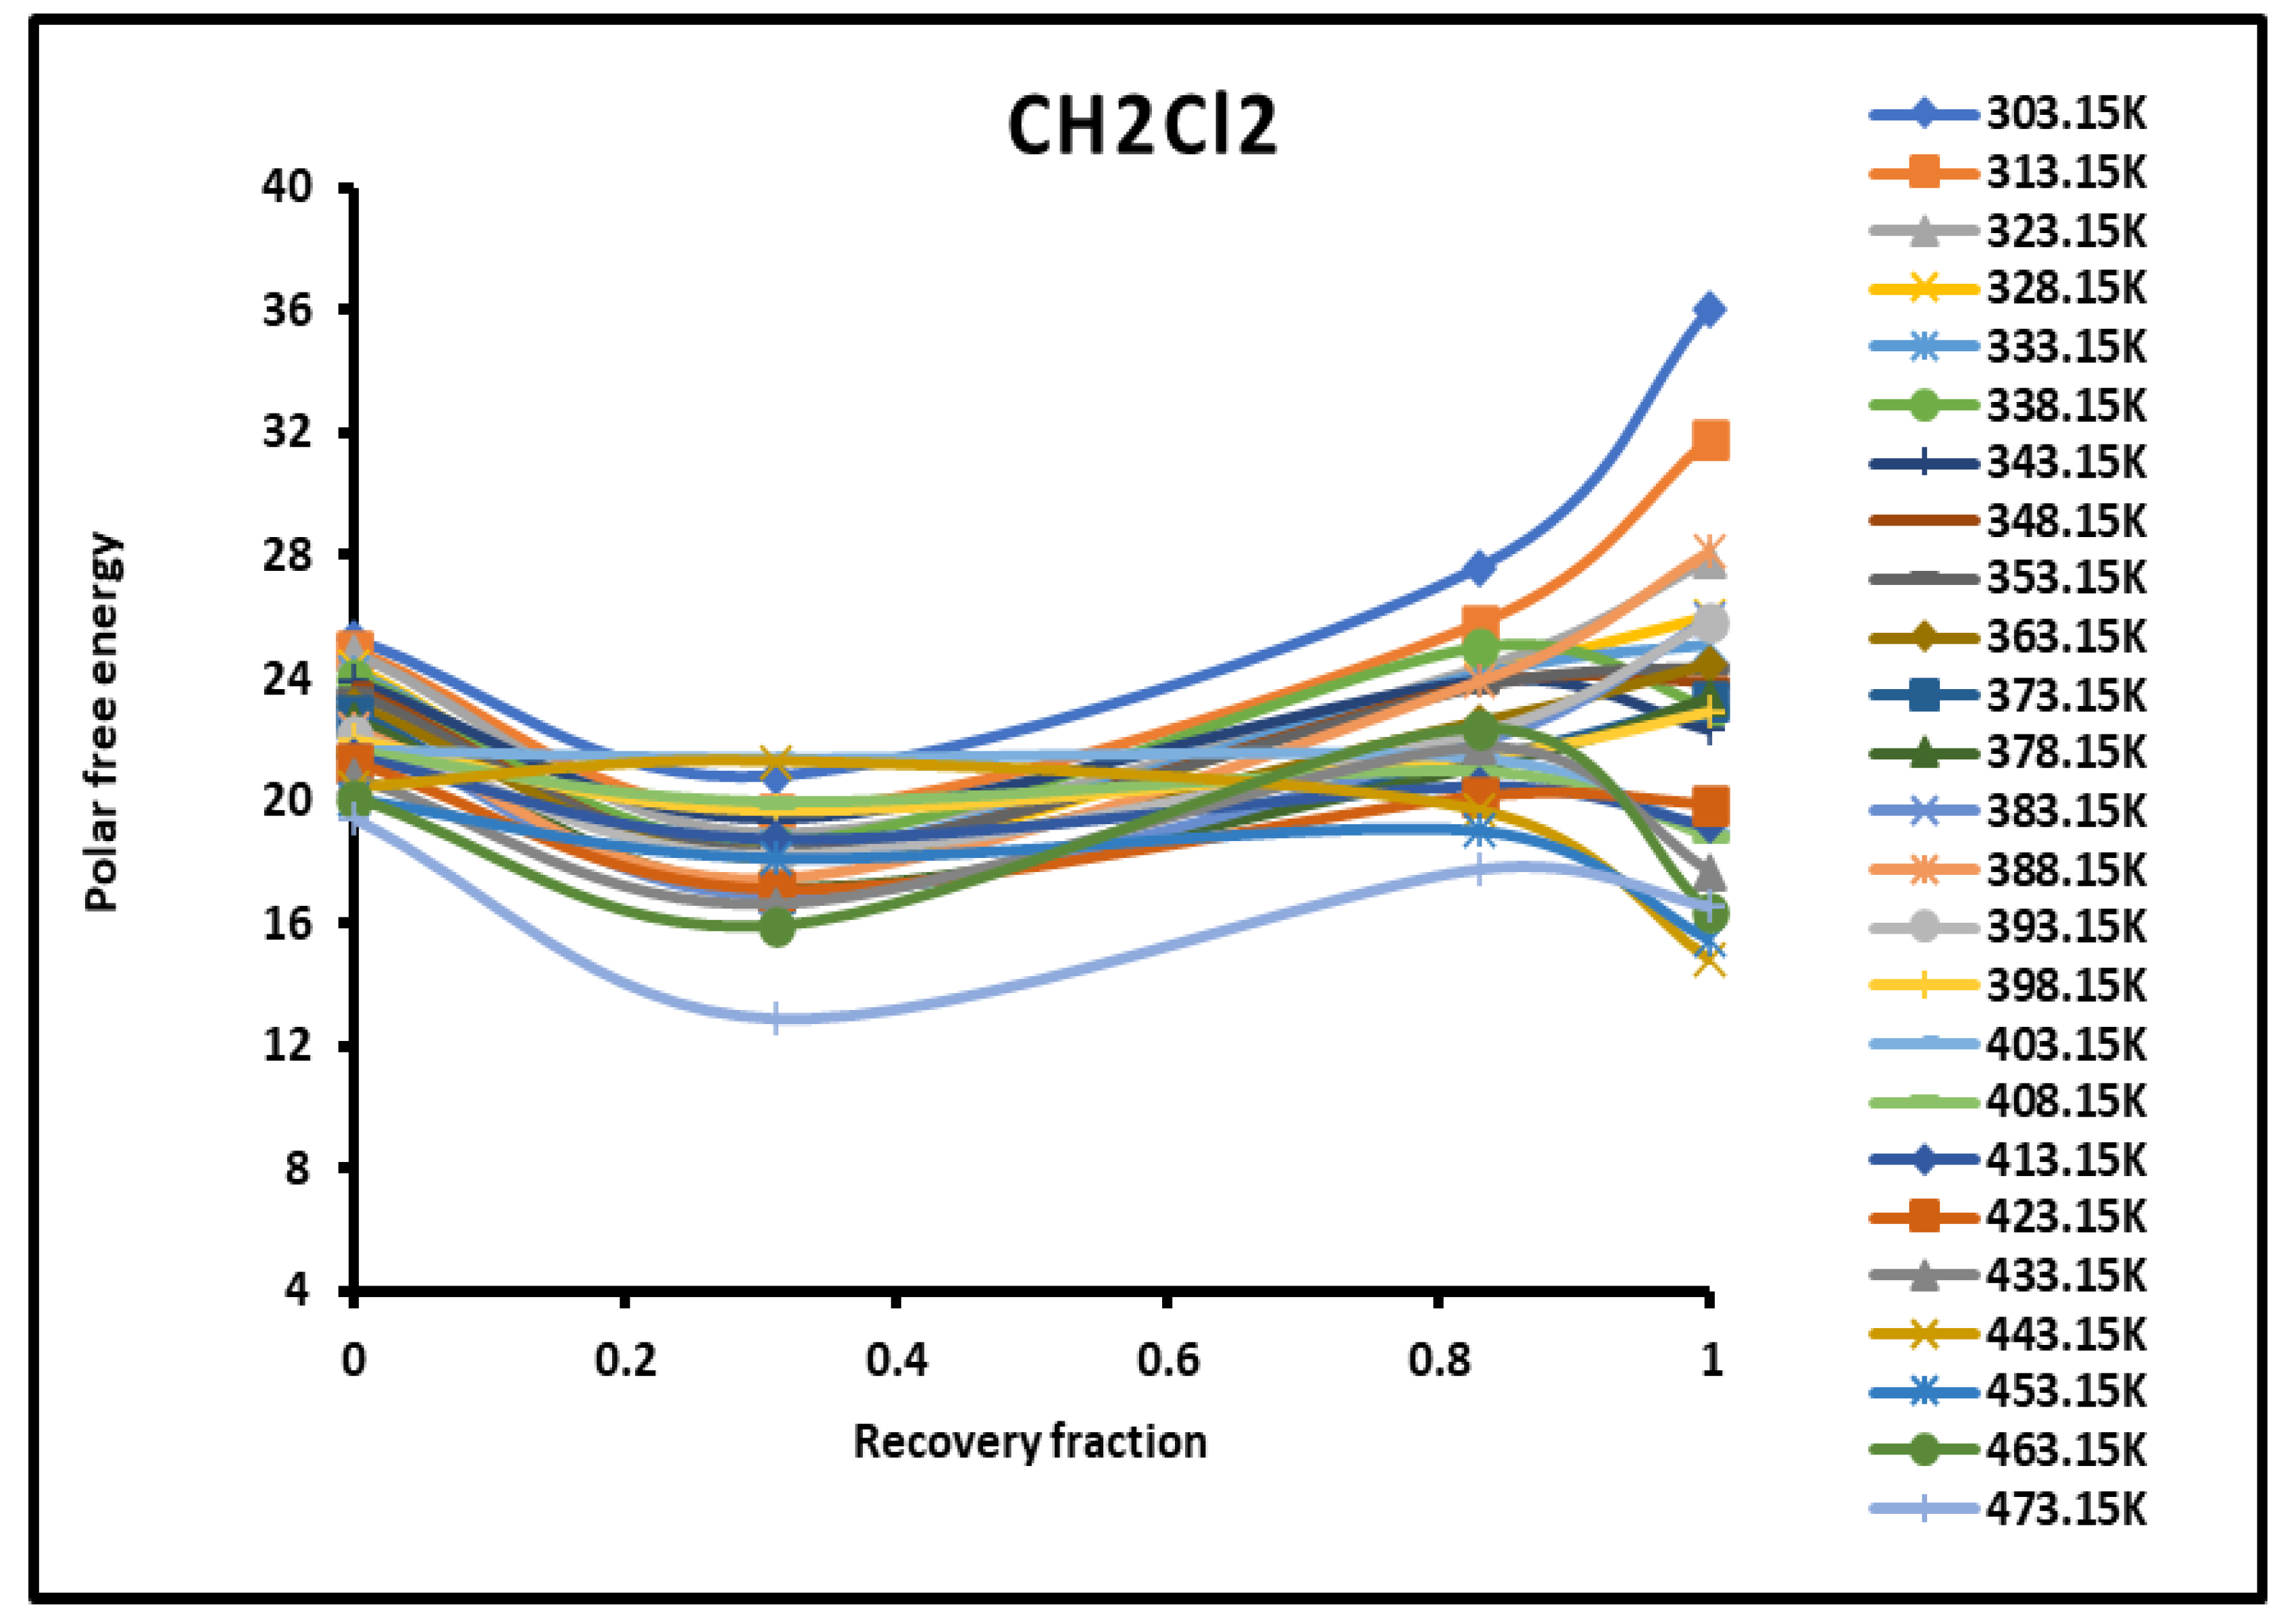
Figure 3.
Evolution of the polar free interaction energy ( (kJ/mol) of CHCl3 as a function of the recovery fraction of PMMA adsorbed on silica at different temperatures.
Figure 3.
Evolution of the polar free interaction energy ( (kJ/mol) of CHCl3 as a function of the recovery fraction of PMMA adsorbed on silica at different temperatures.
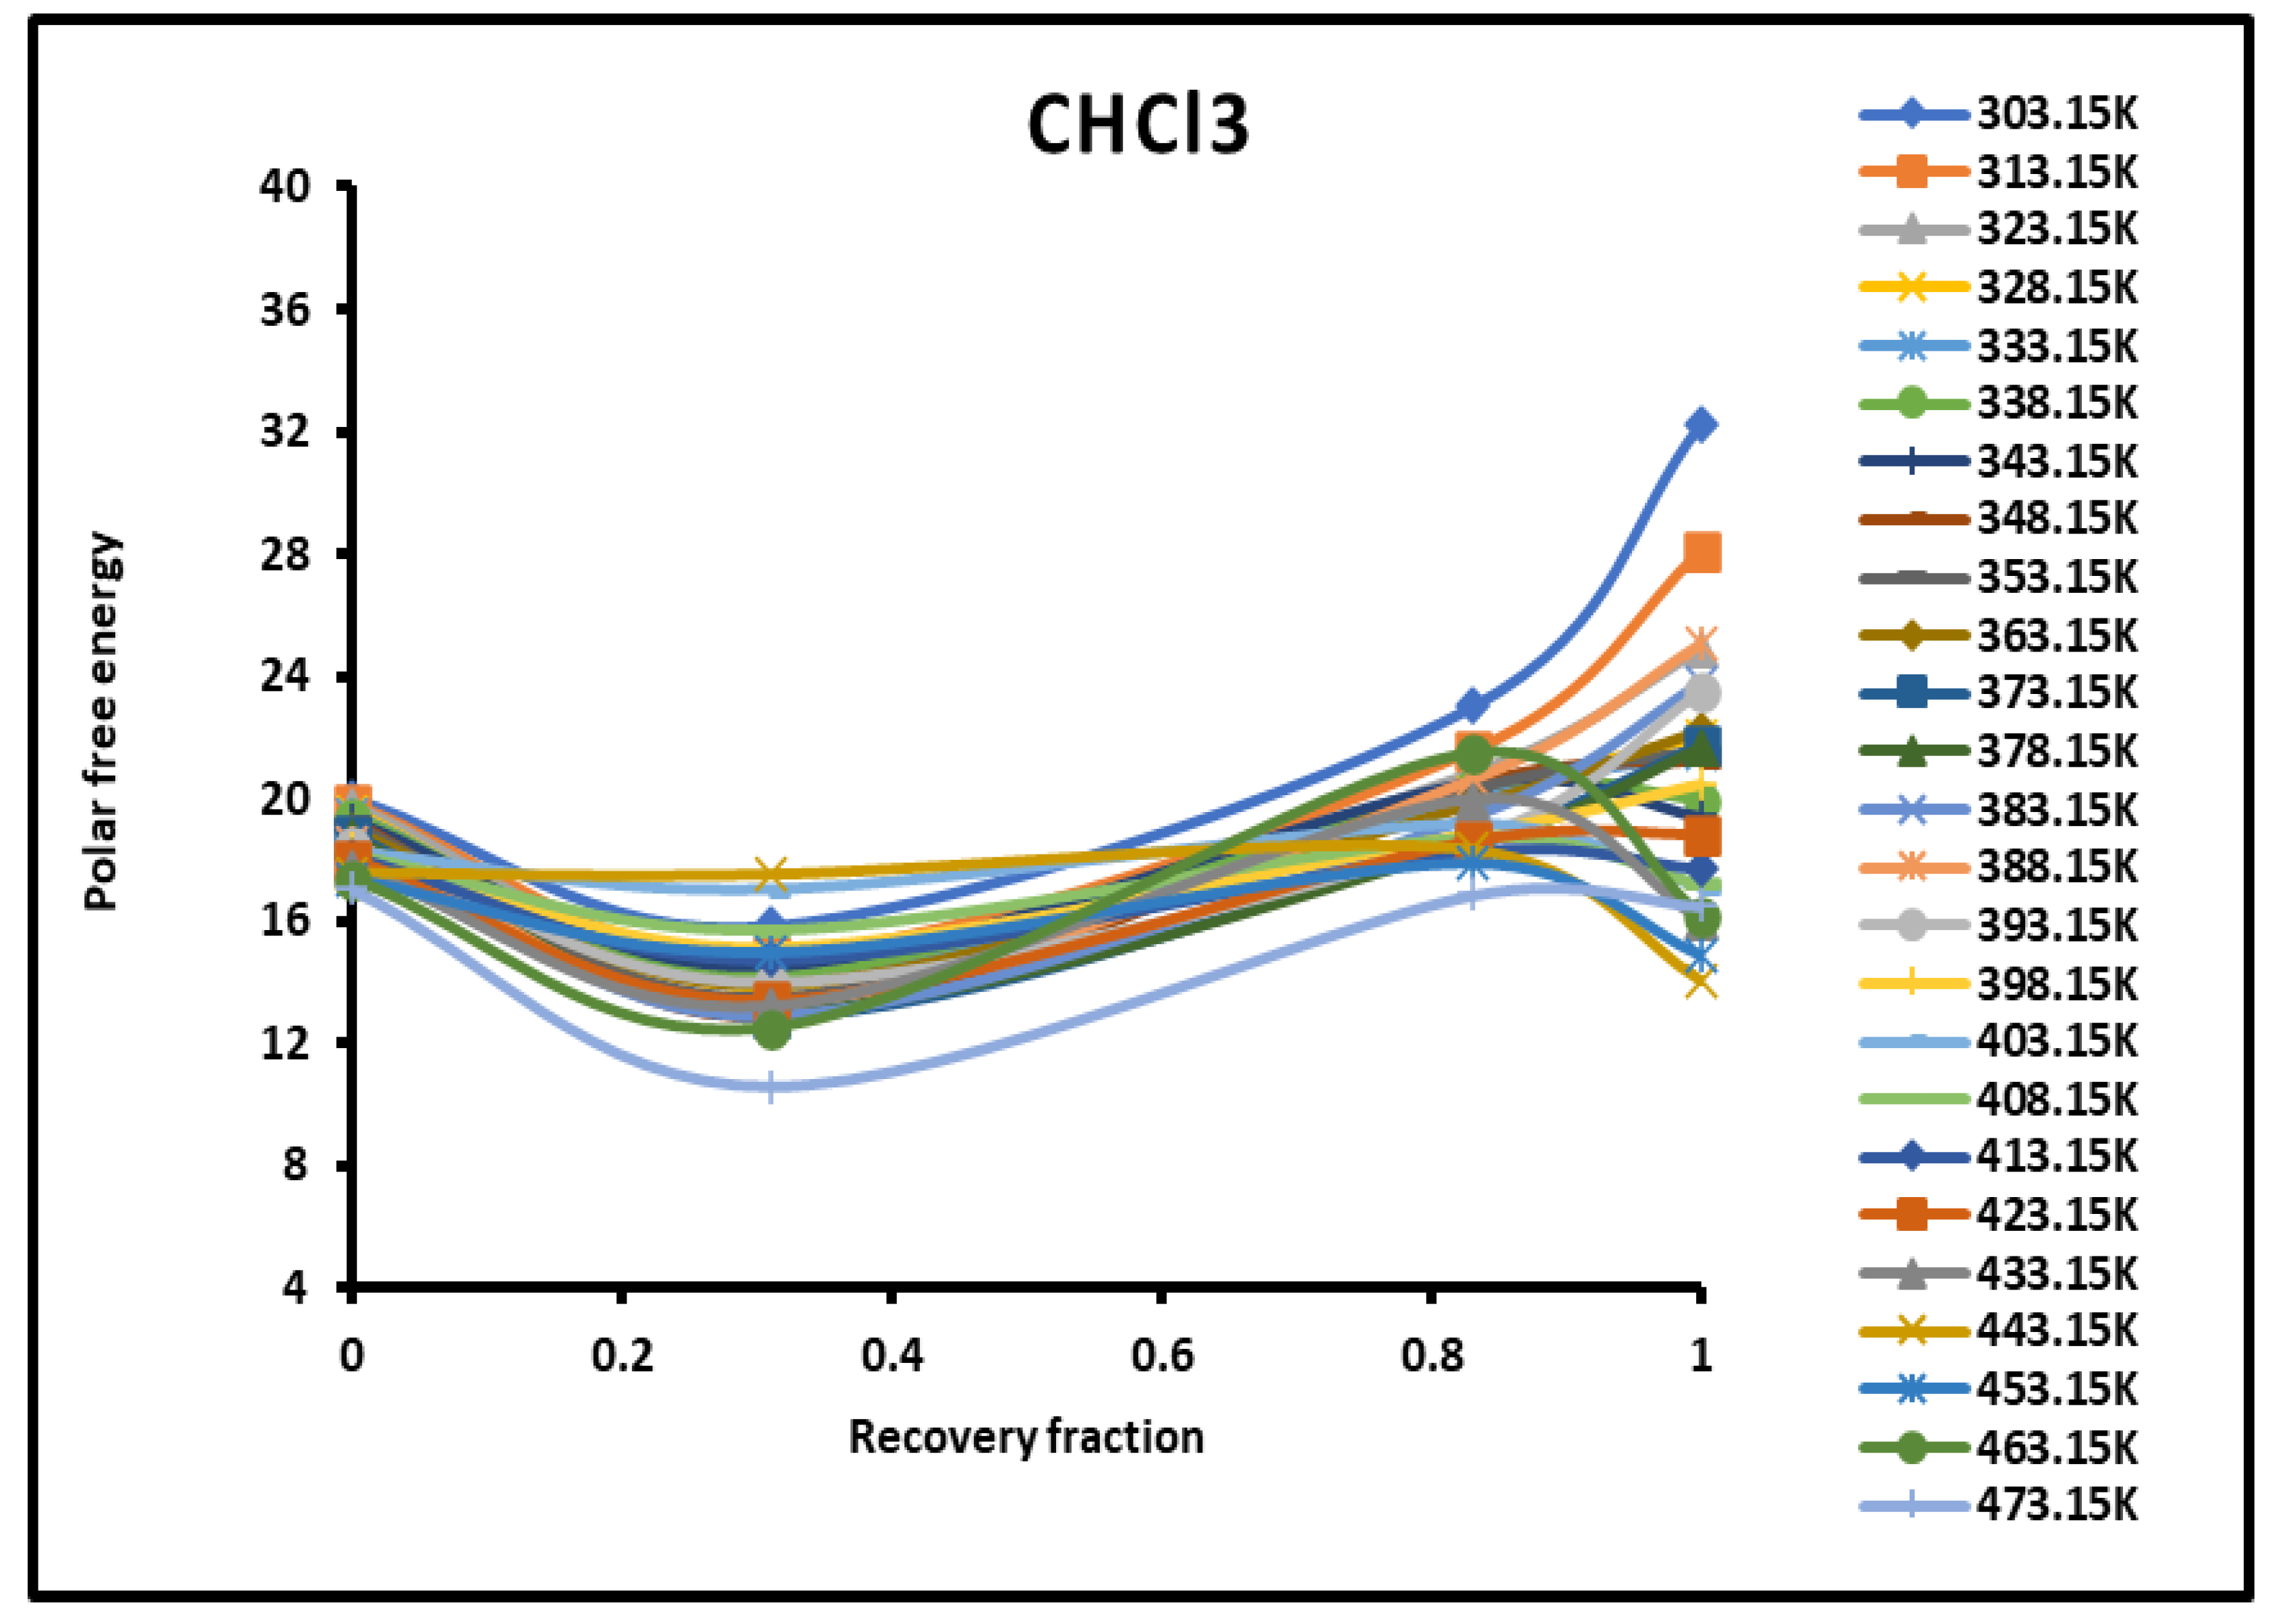
Figure 4.
Evolution of the polar free interaction energy ( (kJ/mol) of diethyl ether as a function of the recovery fraction of PMMA adsorbed on silica at different temperatures.
Figure 4.
Evolution of the polar free interaction energy ( (kJ/mol) of diethyl ether as a function of the recovery fraction of PMMA adsorbed on silica at different temperatures.
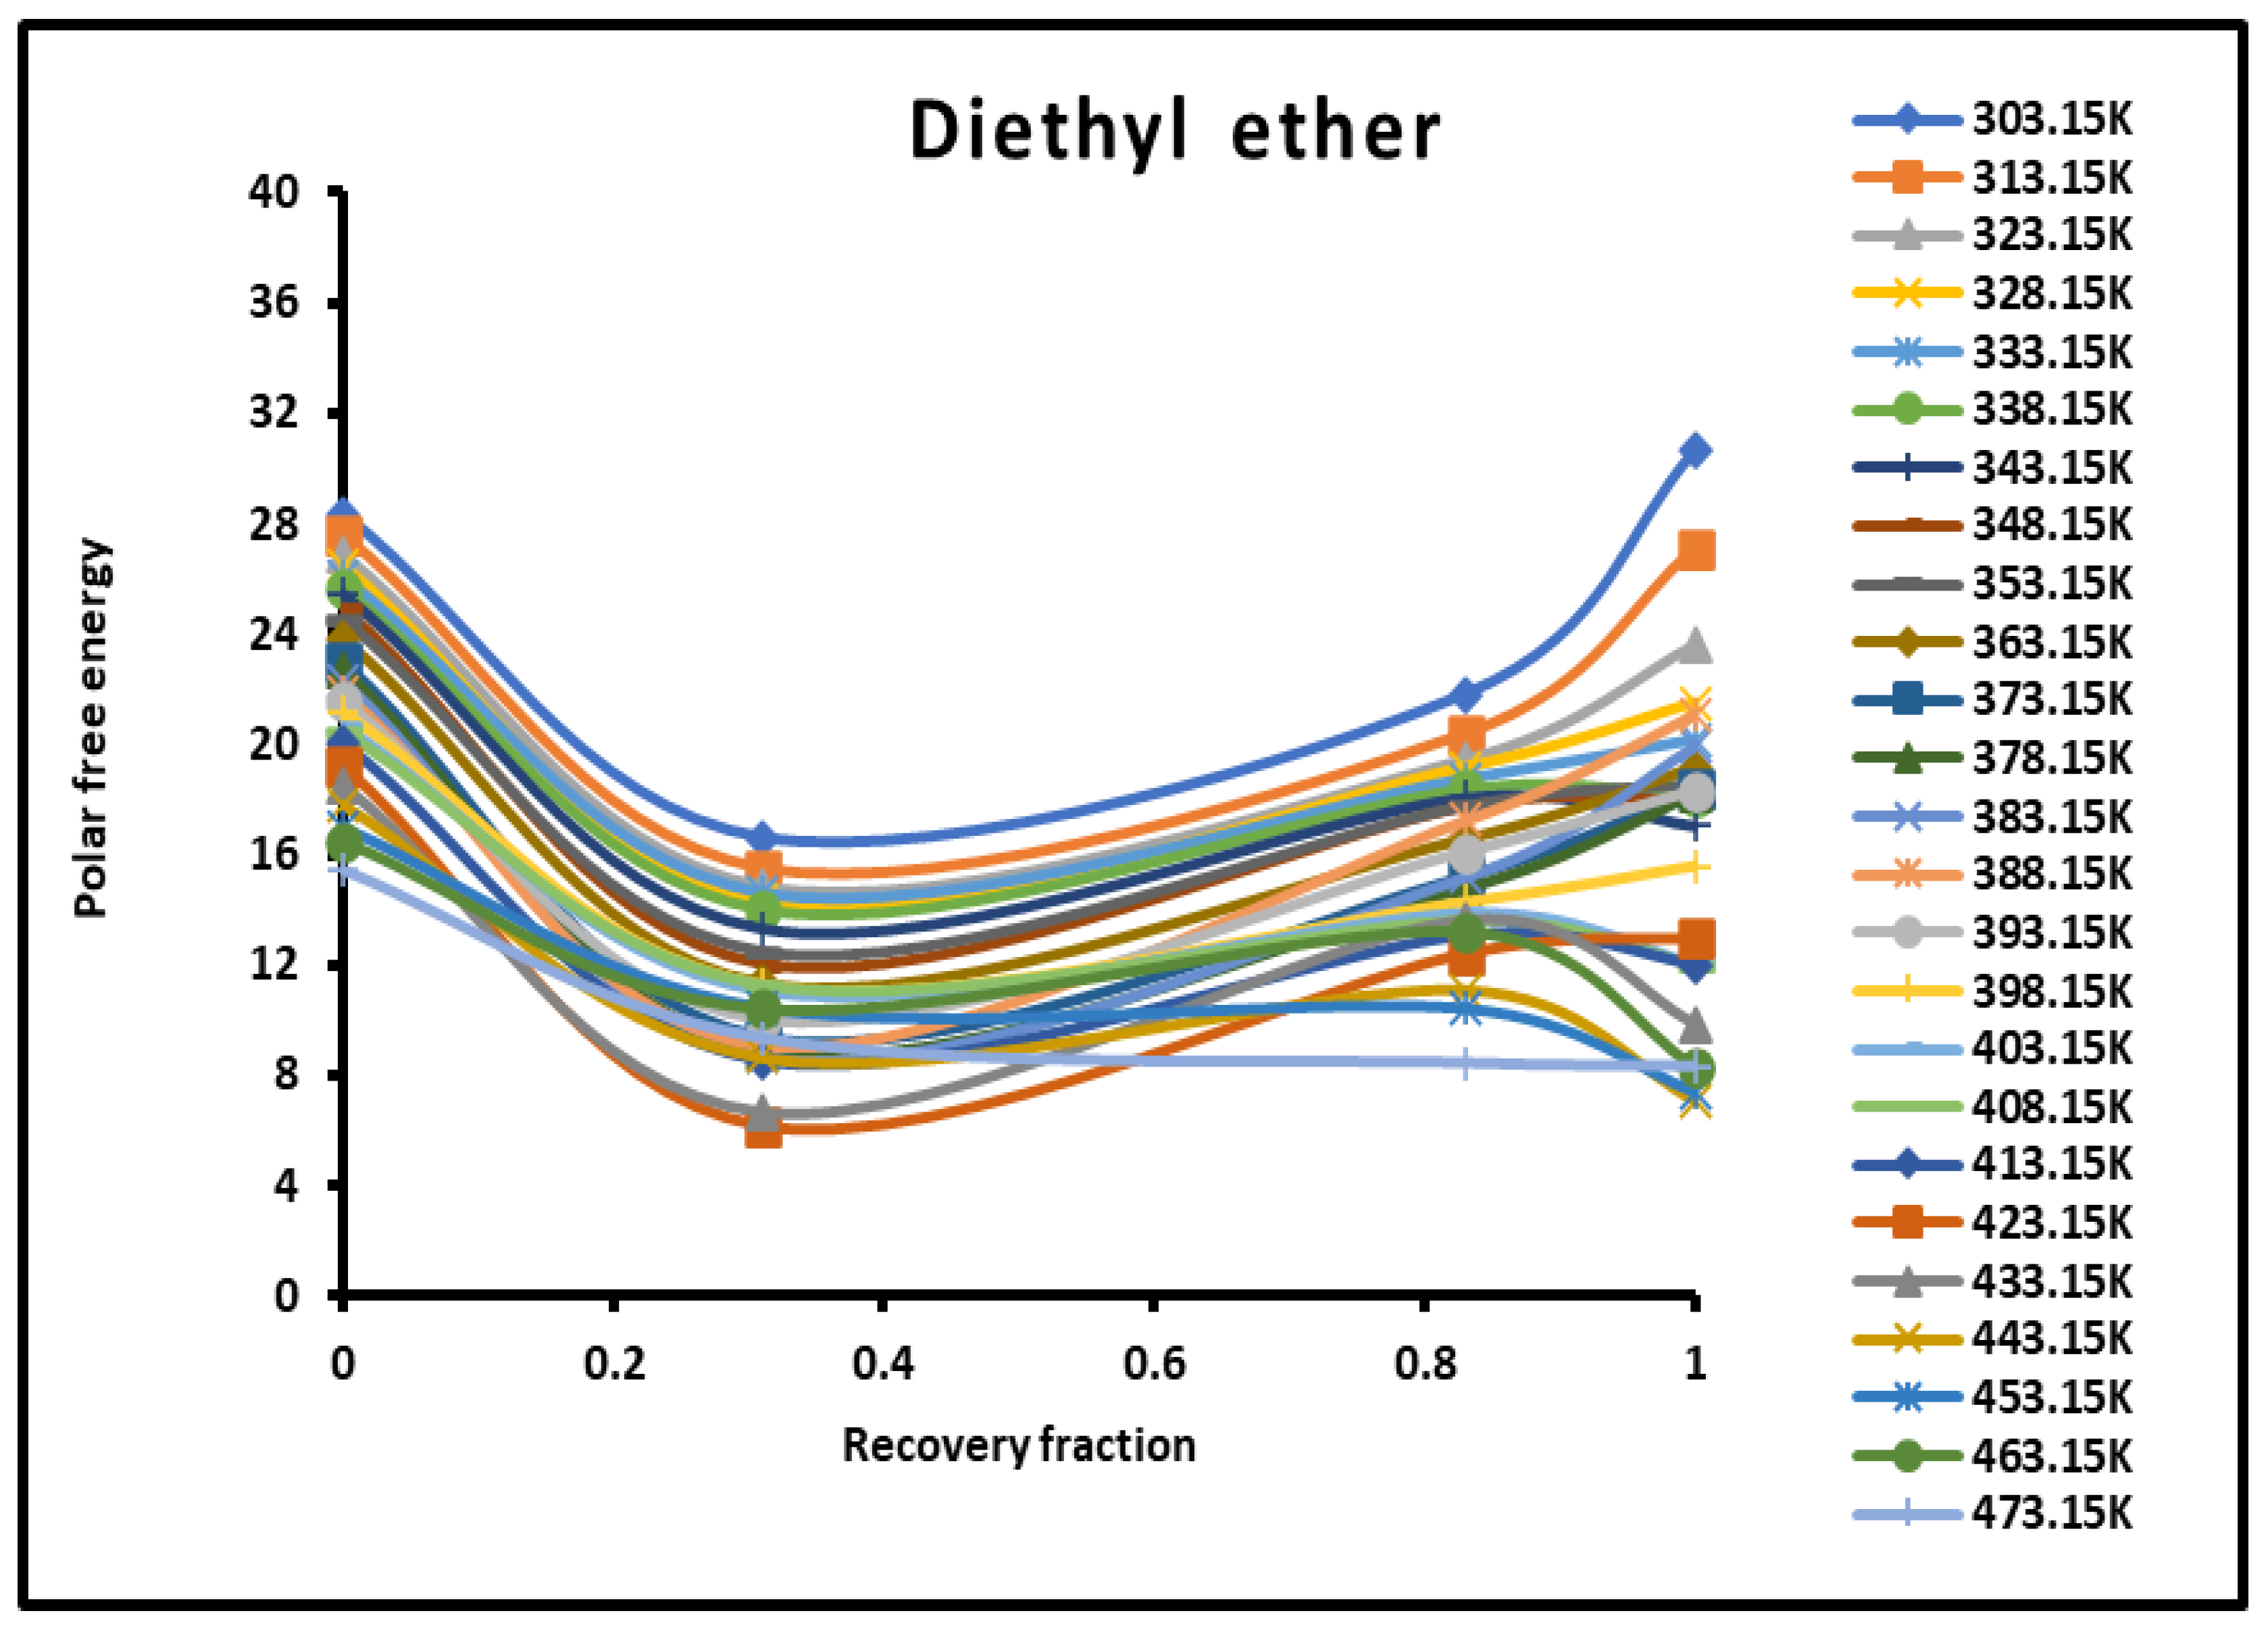
Figure 5.
Evolution of the polar free interaction energy ( (kJ/mol) of tetrahydrofuran (THF) as a function of the recovery fraction of PMMA adsorbed on silica at different temperatures.
Figure 5.
Evolution of the polar free interaction energy ( (kJ/mol) of tetrahydrofuran (THF) as a function of the recovery fraction of PMMA adsorbed on silica at different temperatures.
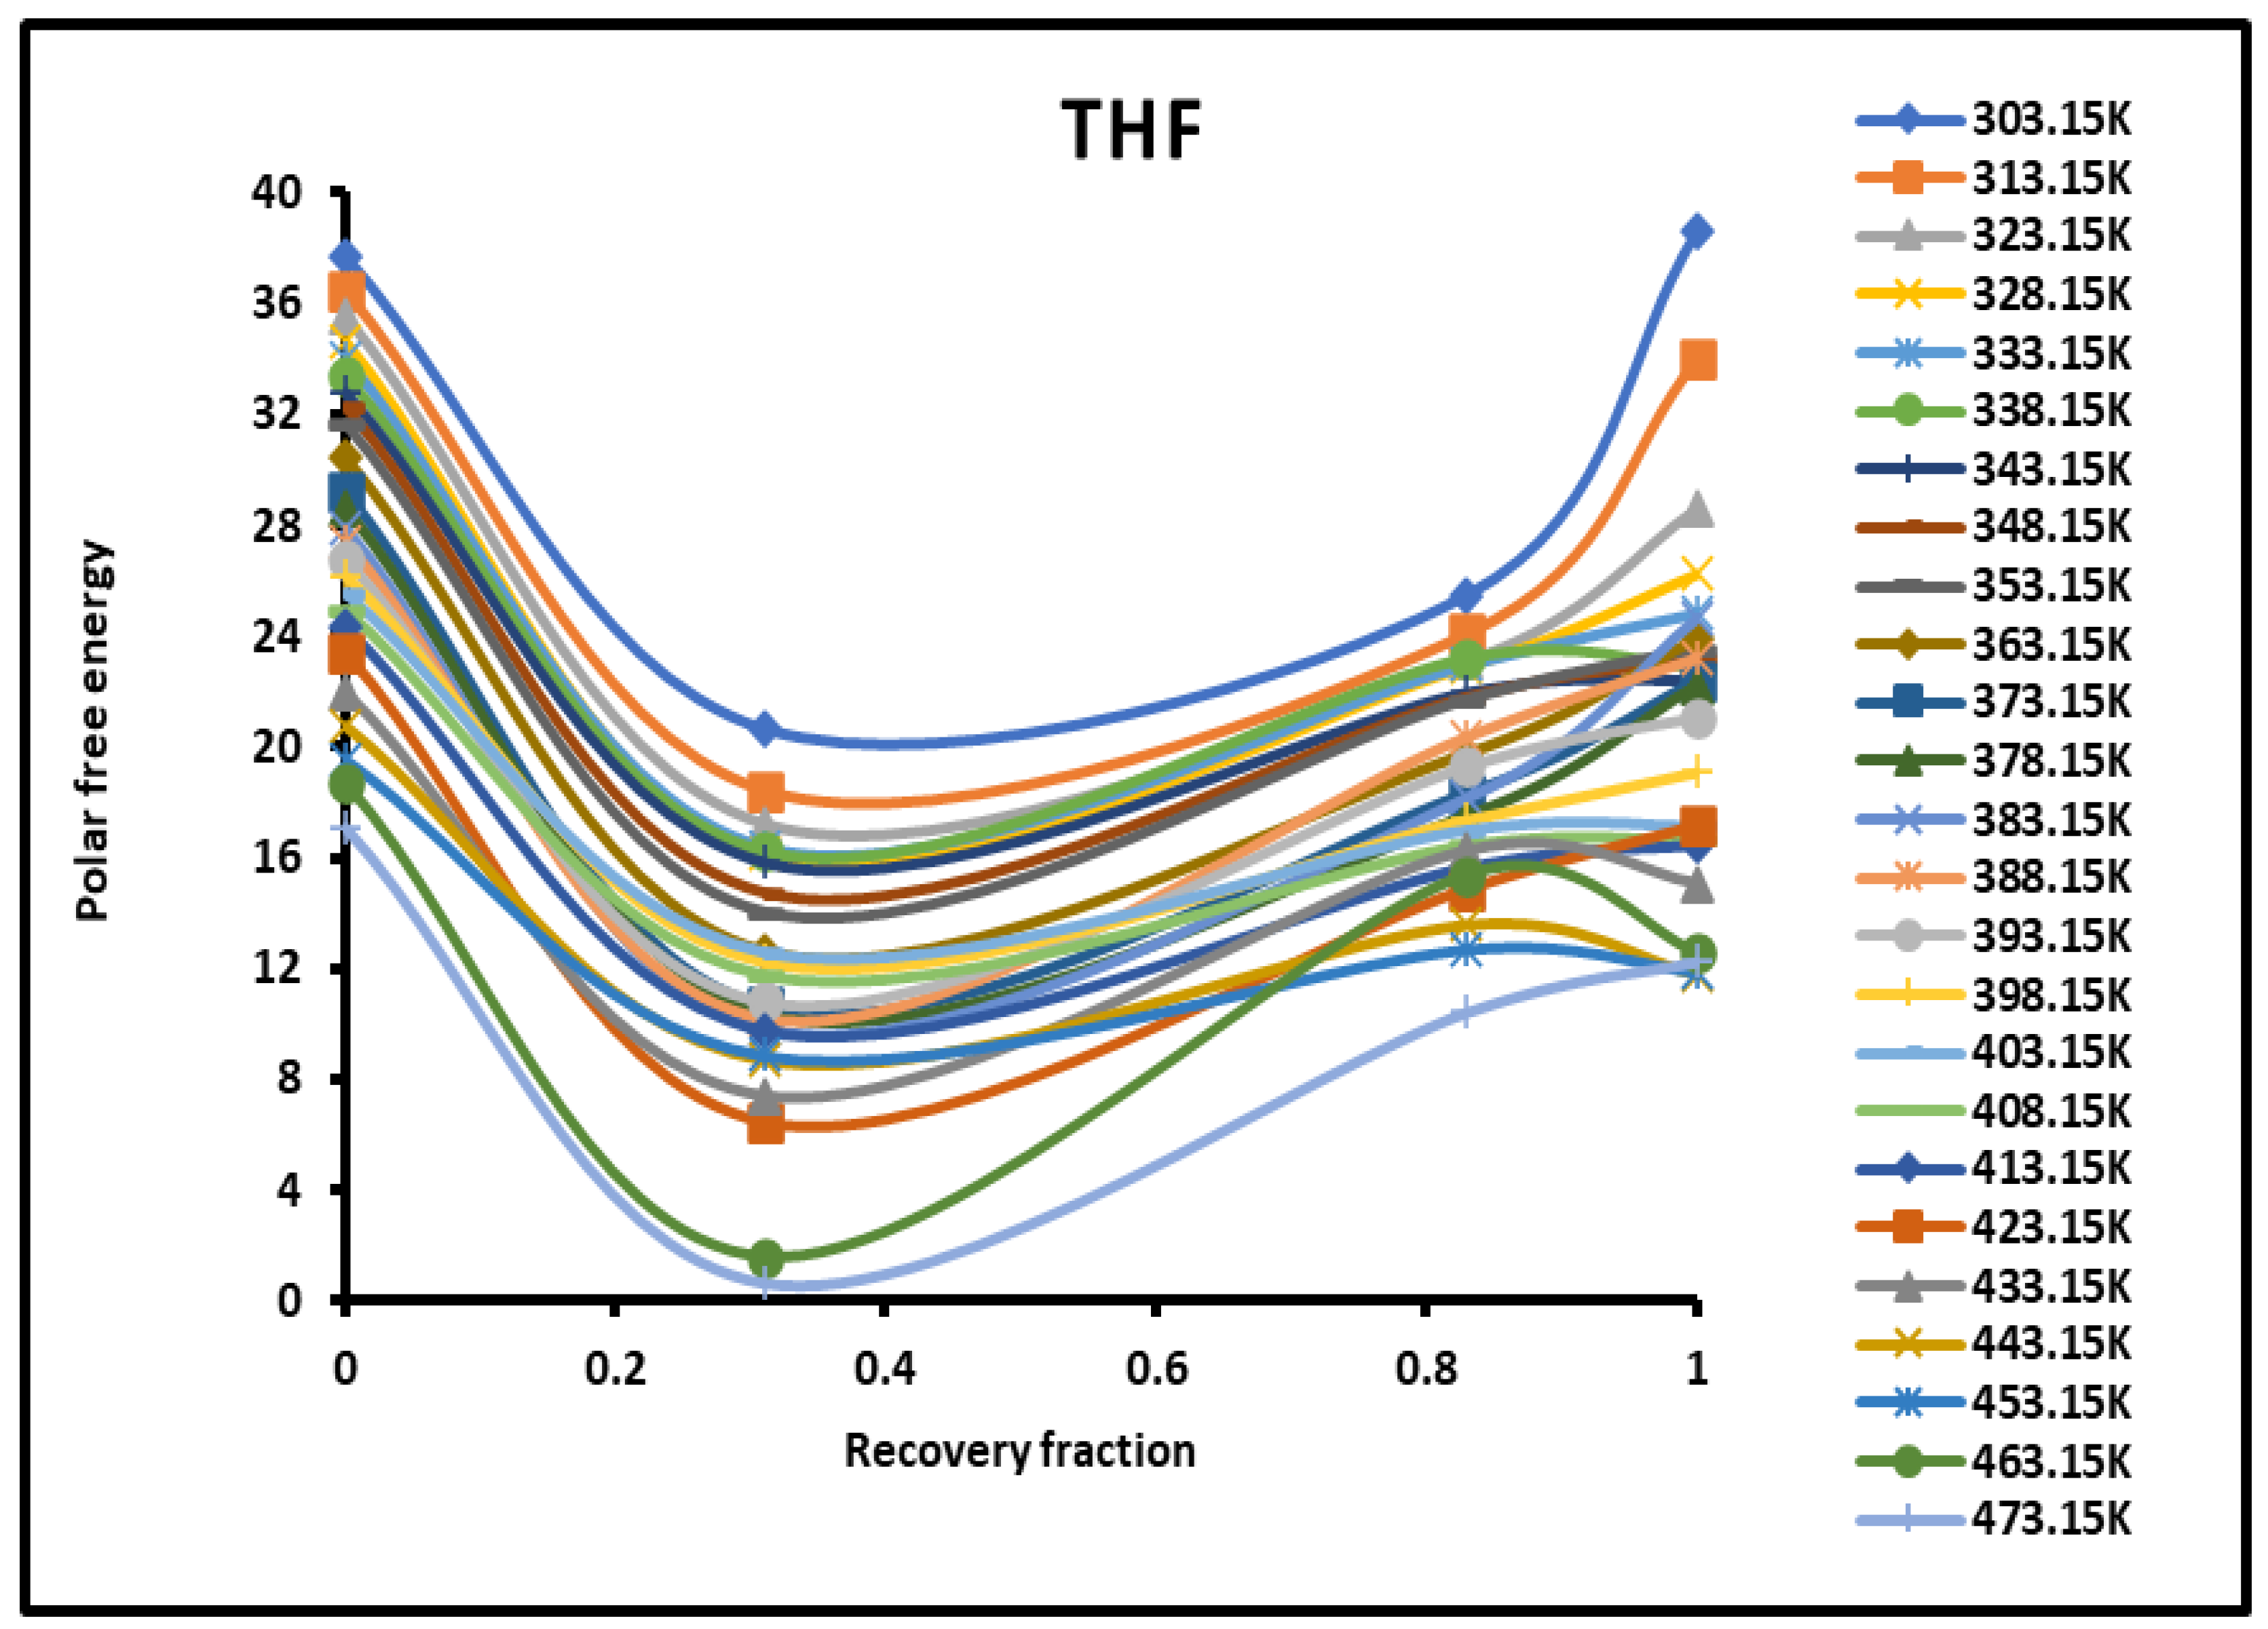
Figure 6.
Evolution of the polar free interaction energy ( (kJ/mol) of ethyl acetate as a function of the recovery fraction of PMMA adsorbed on silica at different temperatures.
Figure 6.
Evolution of the polar free interaction energy ( (kJ/mol) of ethyl acetate as a function of the recovery fraction of PMMA adsorbed on silica at different temperatures.
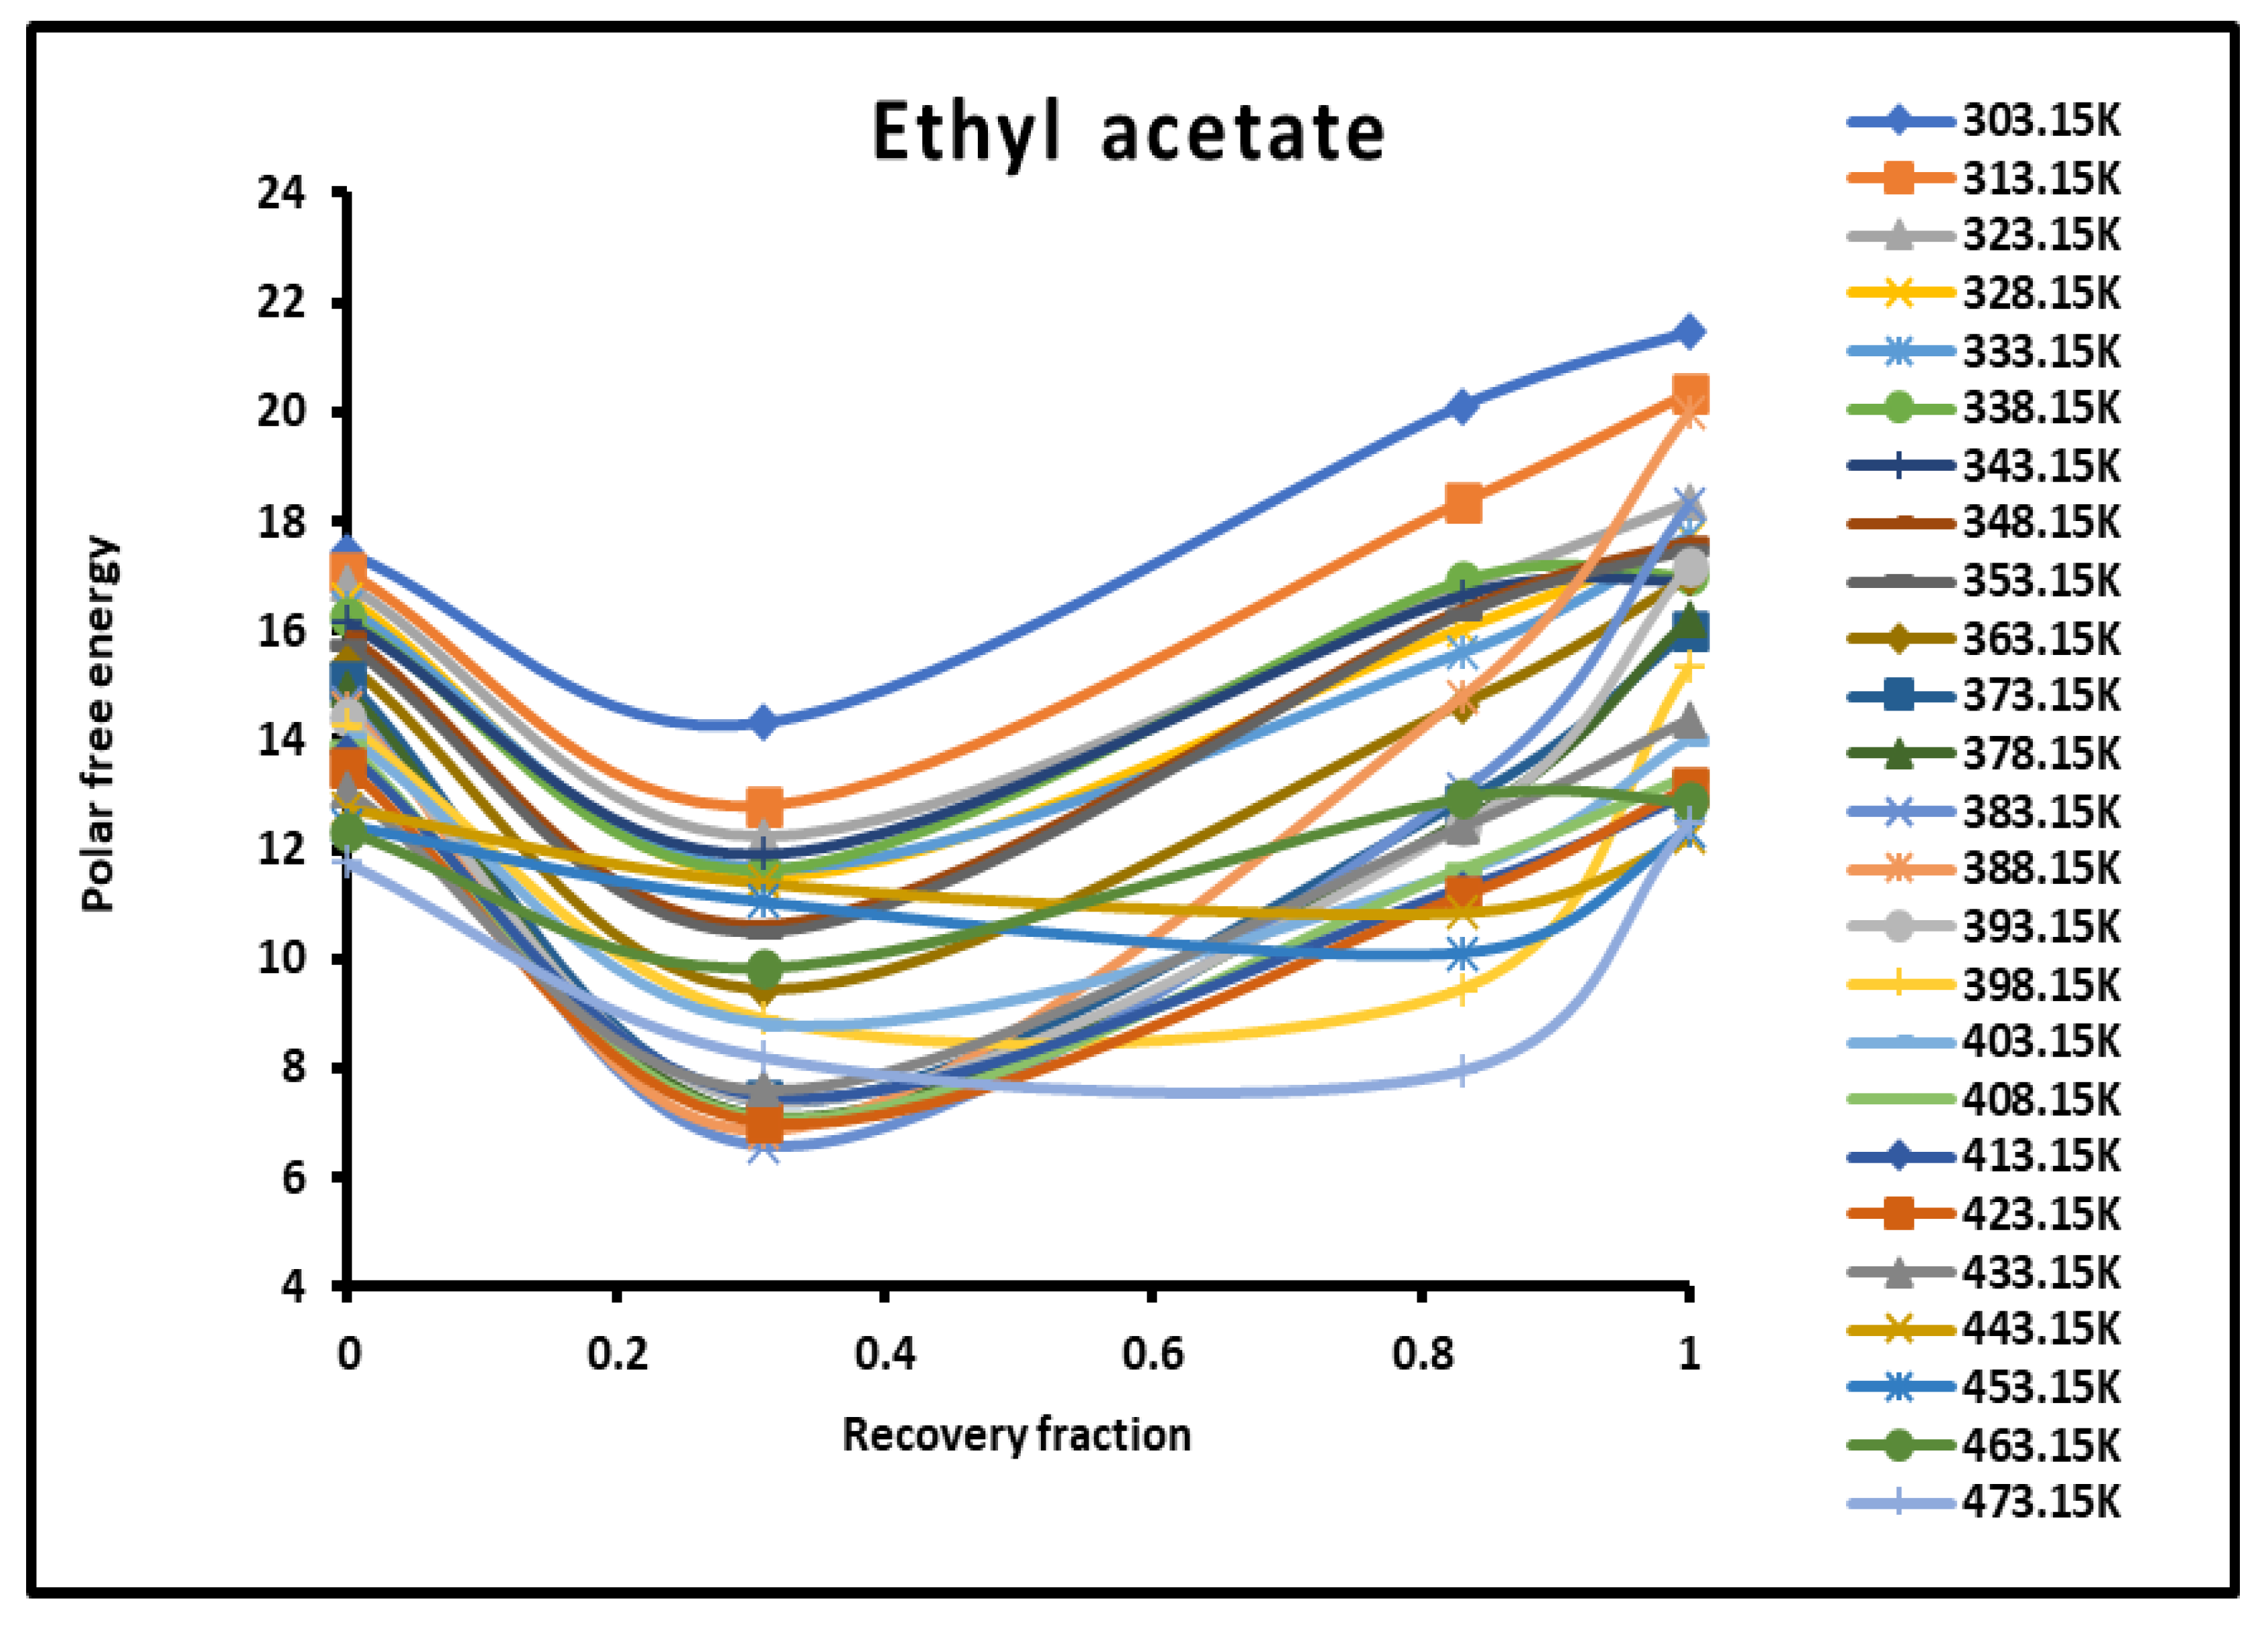
Figure 7.
Evolution of the polar free interaction energy ( (kJ/mol) of ethyl acetate as a function of the recovery fraction of PMMA adsorbed on silica at different temperatures.
Figure 7.
Evolution of the polar free interaction energy ( (kJ/mol) of ethyl acetate as a function of the recovery fraction of PMMA adsorbed on silica at different temperatures.
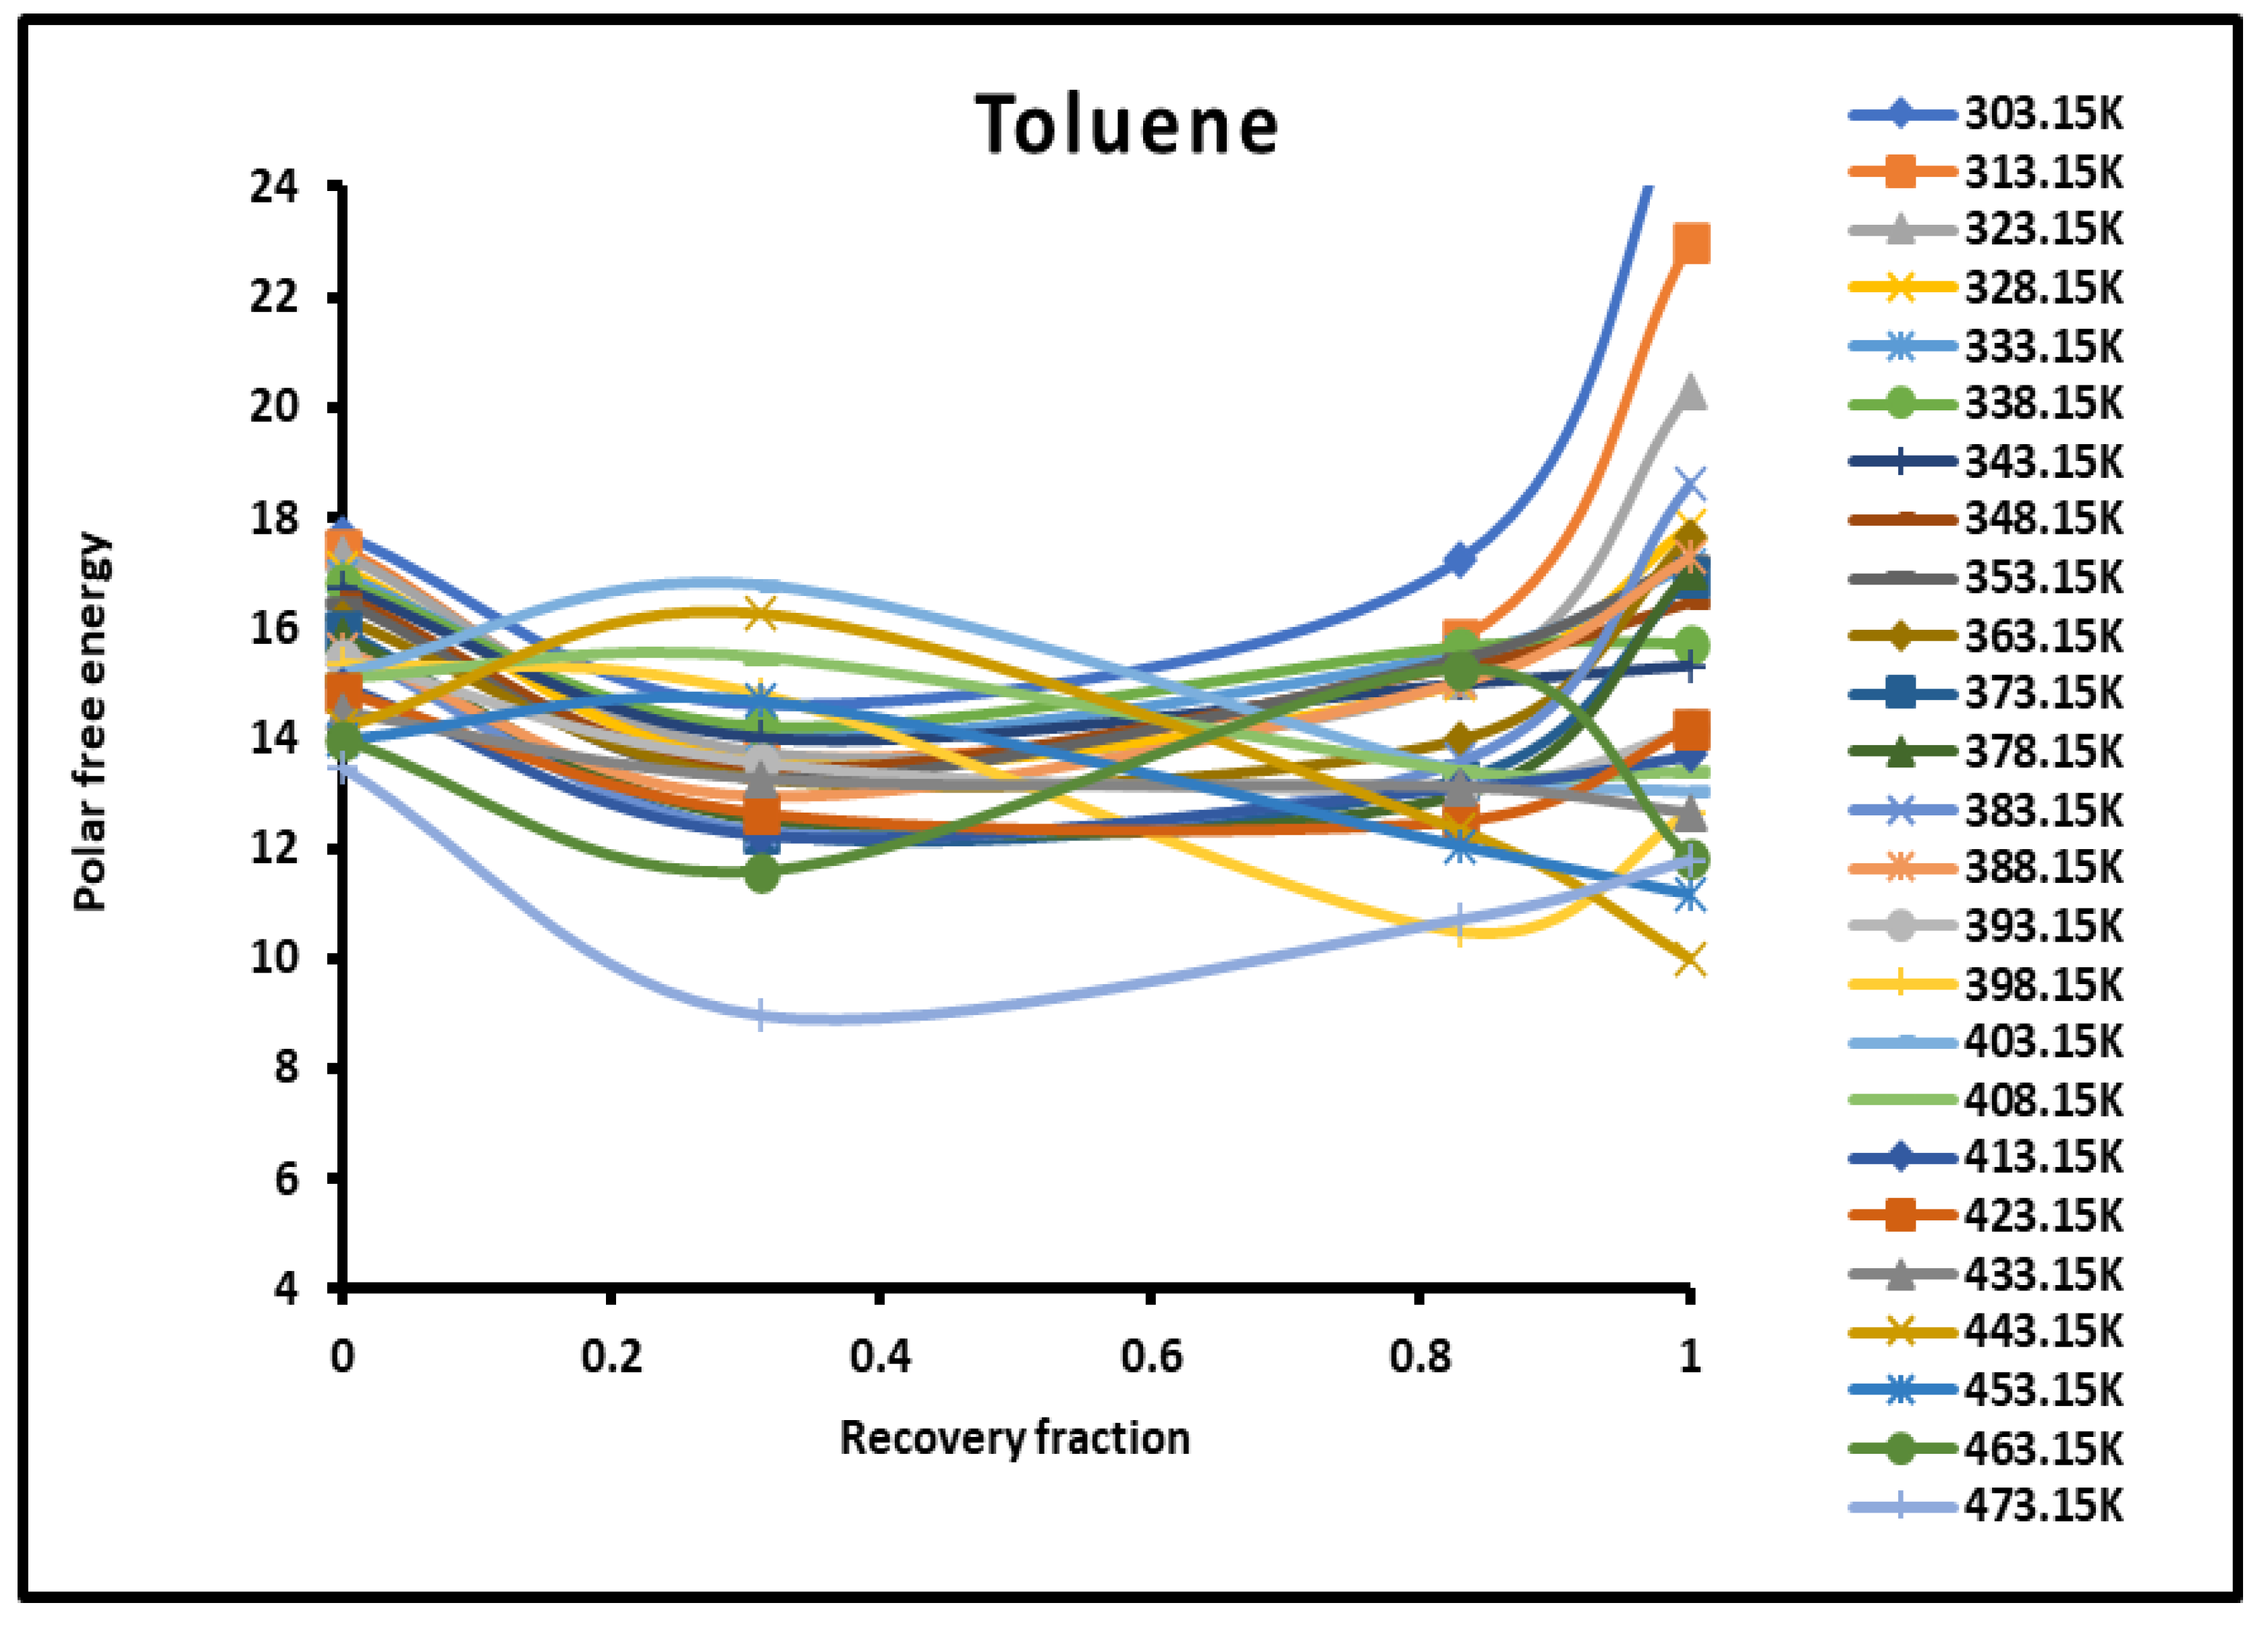
Figure 8.
Values of the interaction enthalpy ( and entropy ( of polar solvents adsorbed on silica independent from the temperature.
Figure 8.
Values of the interaction enthalpy ( and entropy ( of polar solvents adsorbed on silica independent from the temperature.
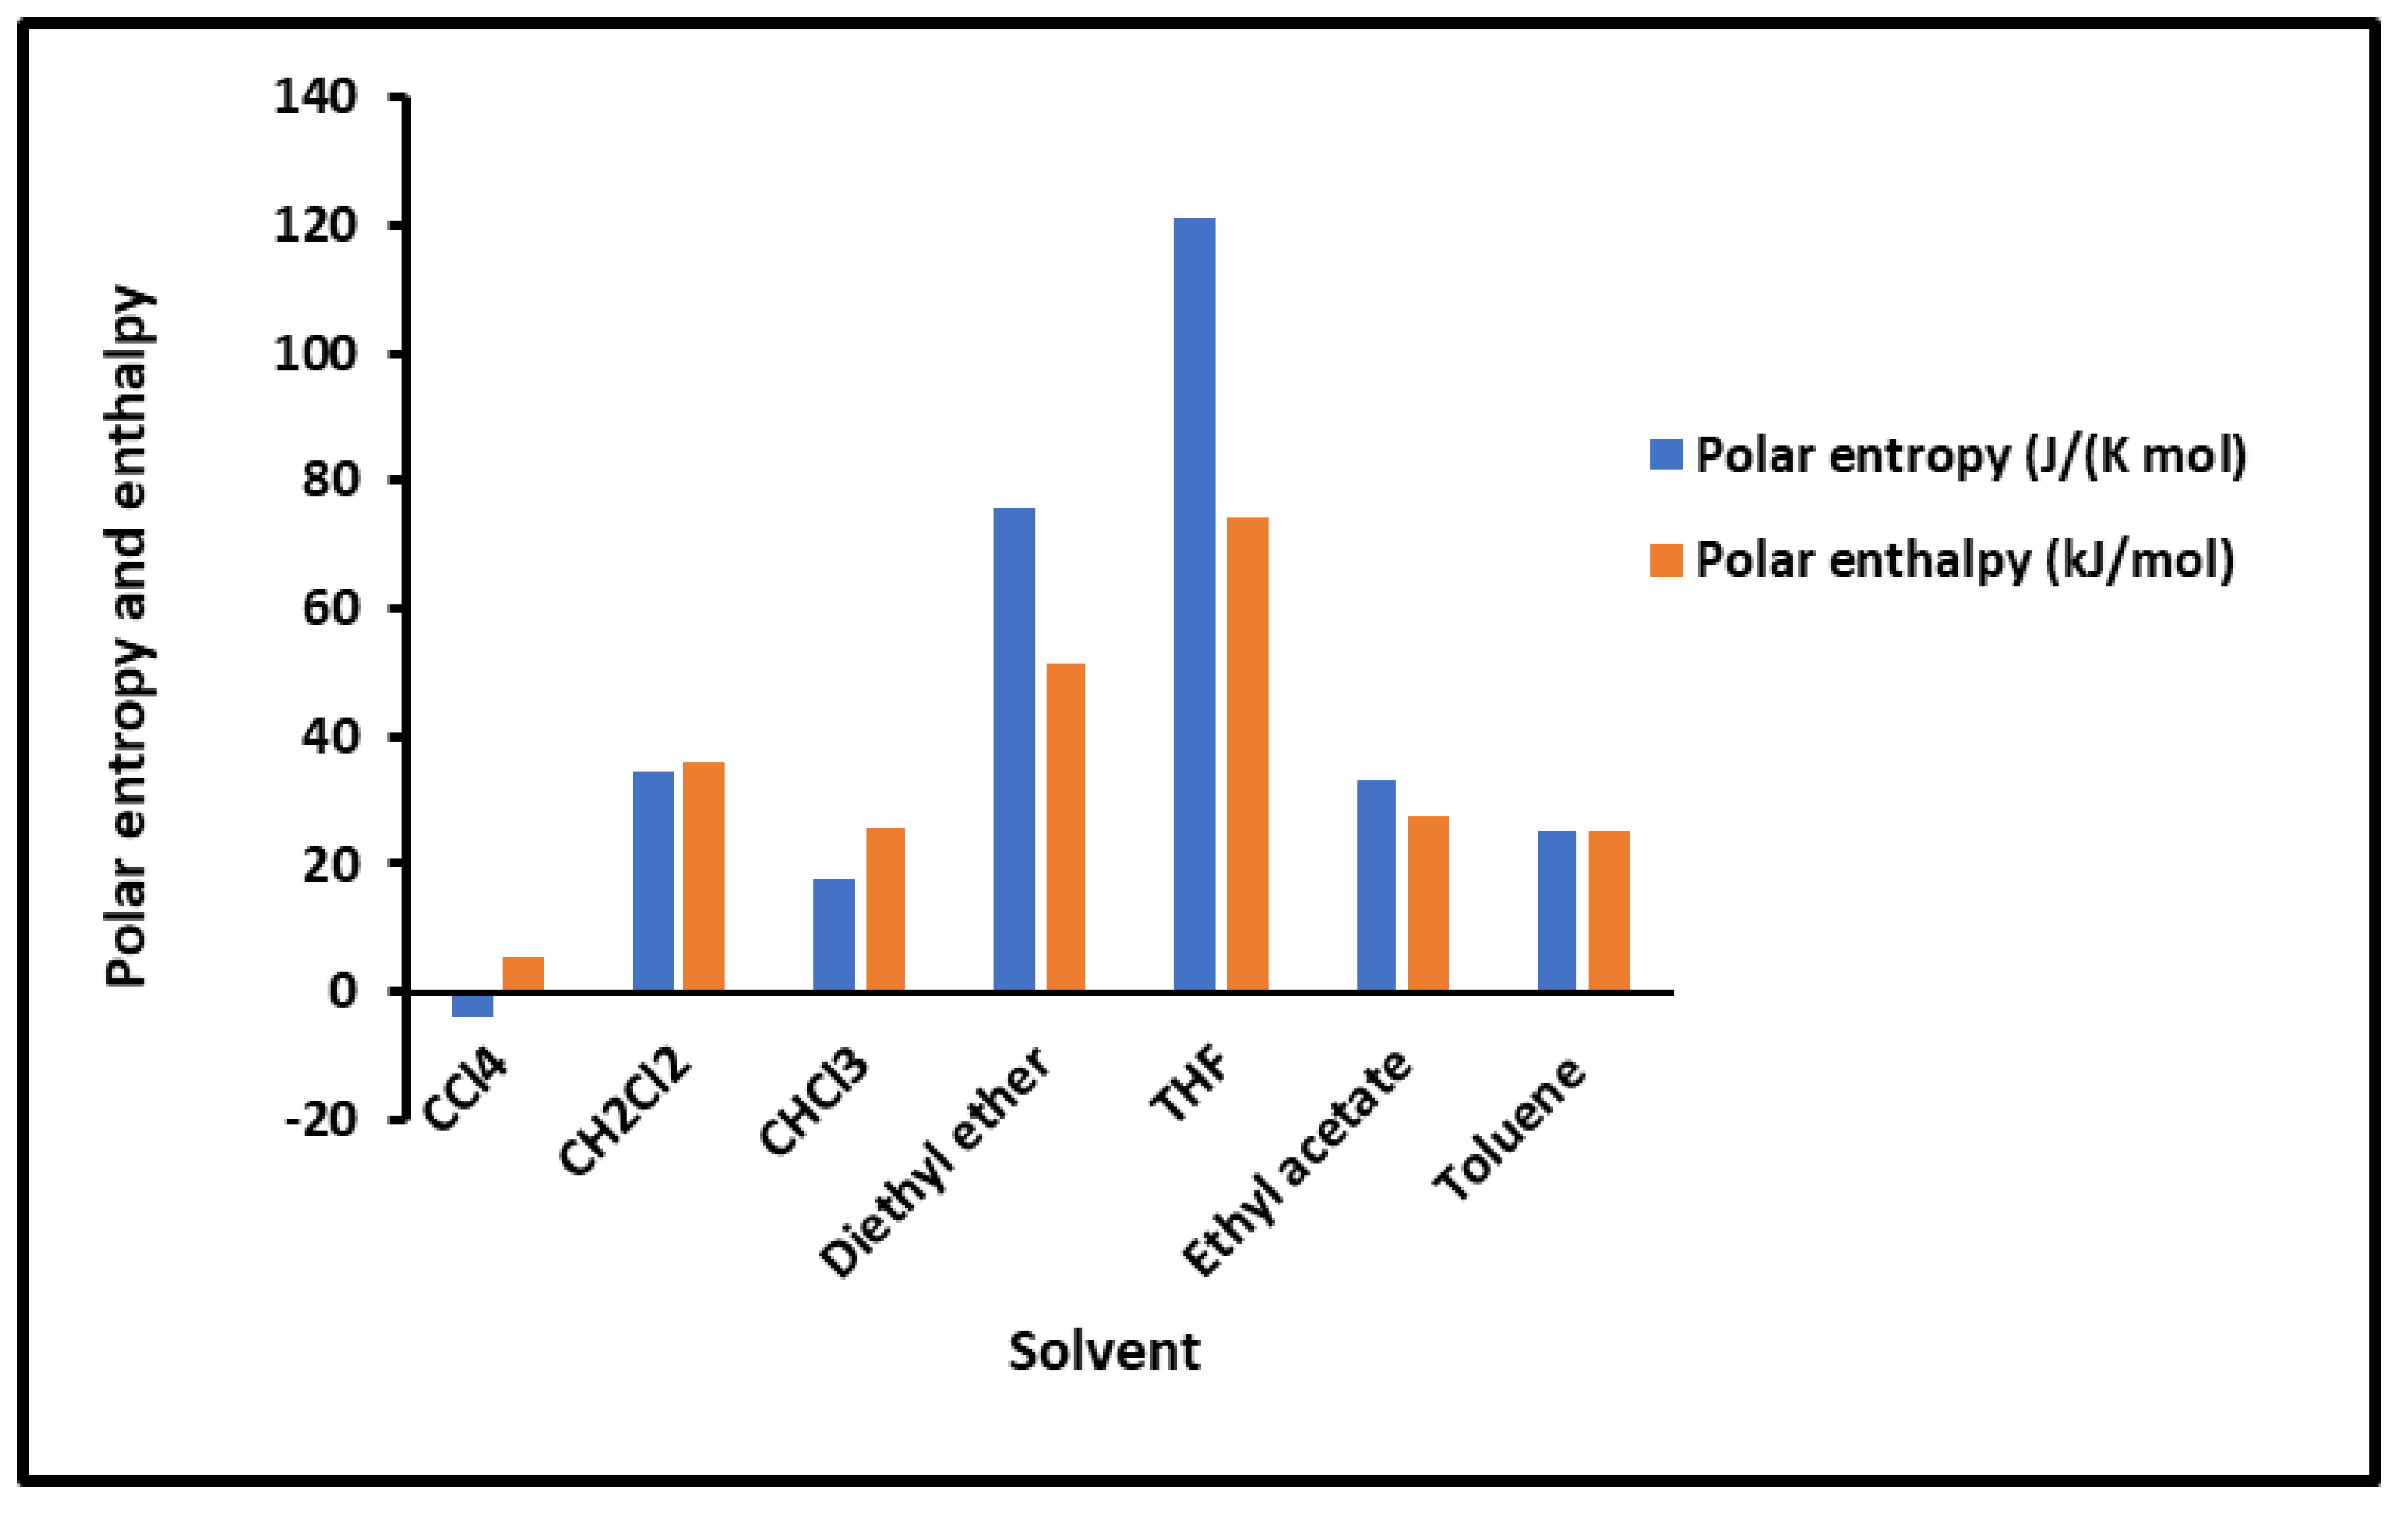
Figure 9.
Variations of the interaction enthalpy ( and entropy ( of polar solvents adsorbed on PMMA as a function of the temperature.
Figure 9.
Variations of the interaction enthalpy ( and entropy ( of polar solvents adsorbed on PMMA as a function of the temperature.
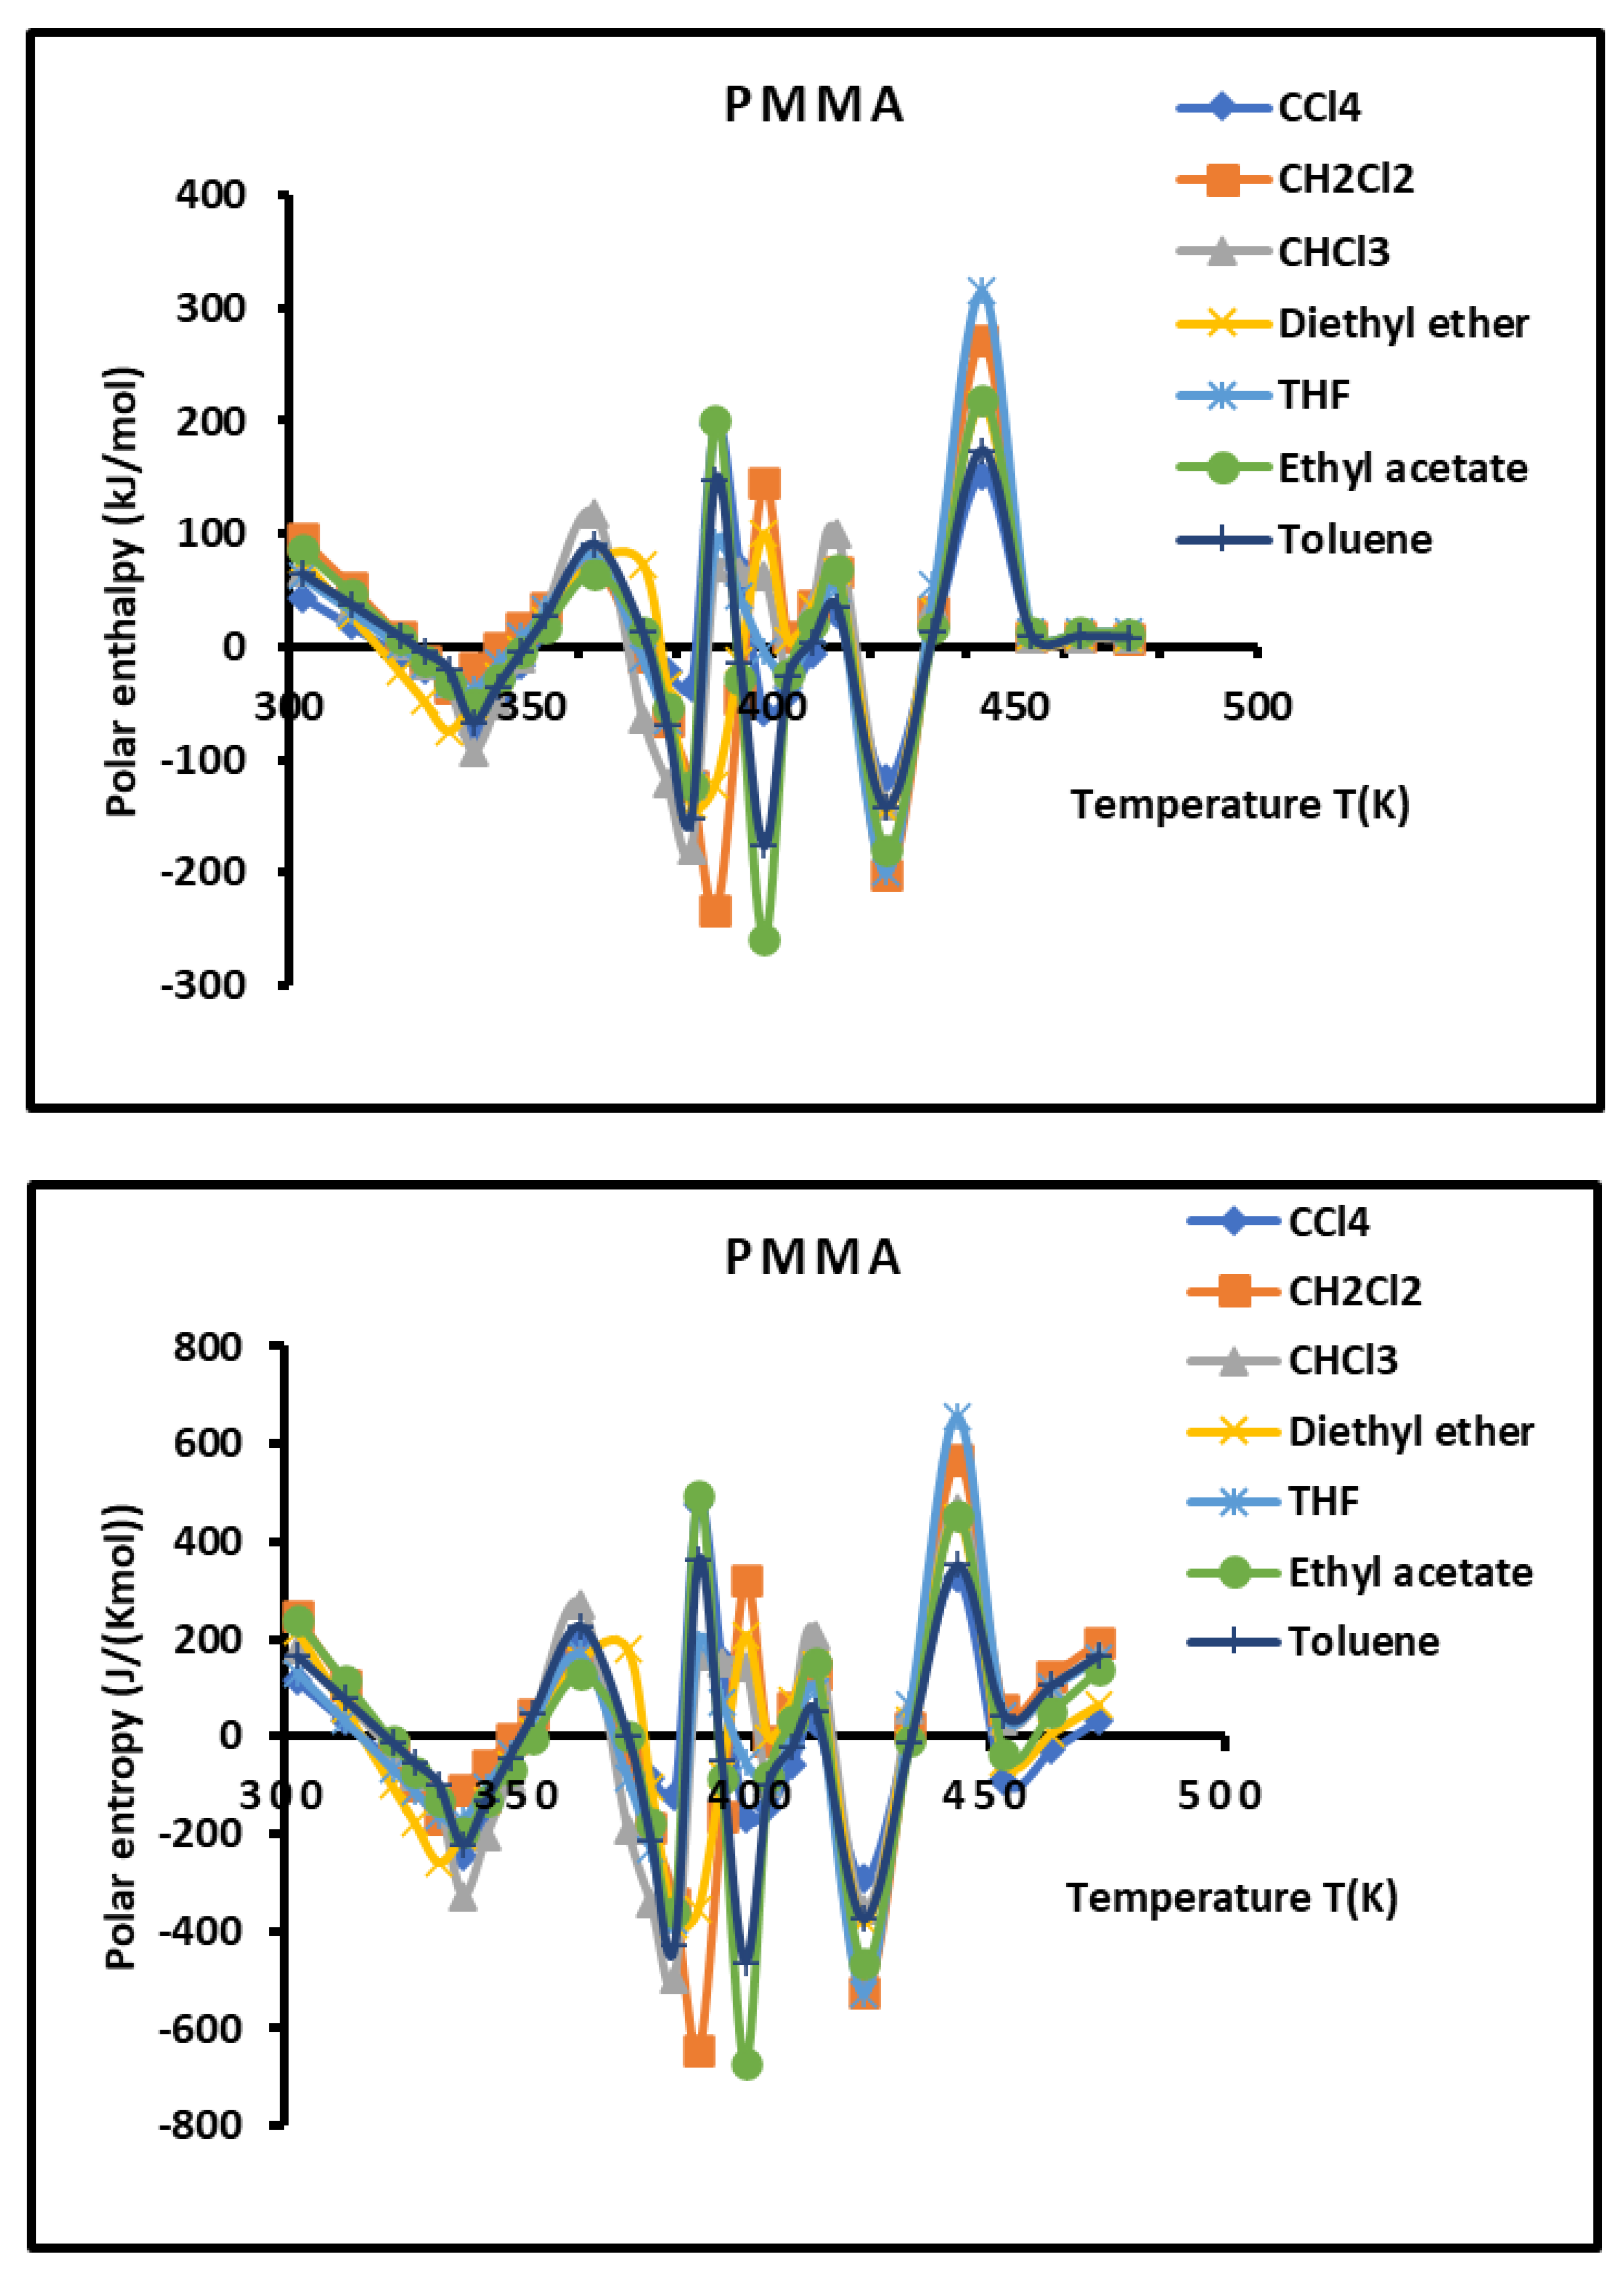
Figure 10.
Variations of the interaction enthalpy ( and entropy ( of polar solvents adsorbed on PMMA/silica for as a function of the temperature.
Figure 10.
Variations of the interaction enthalpy ( and entropy ( of polar solvents adsorbed on PMMA/silica for as a function of the temperature.
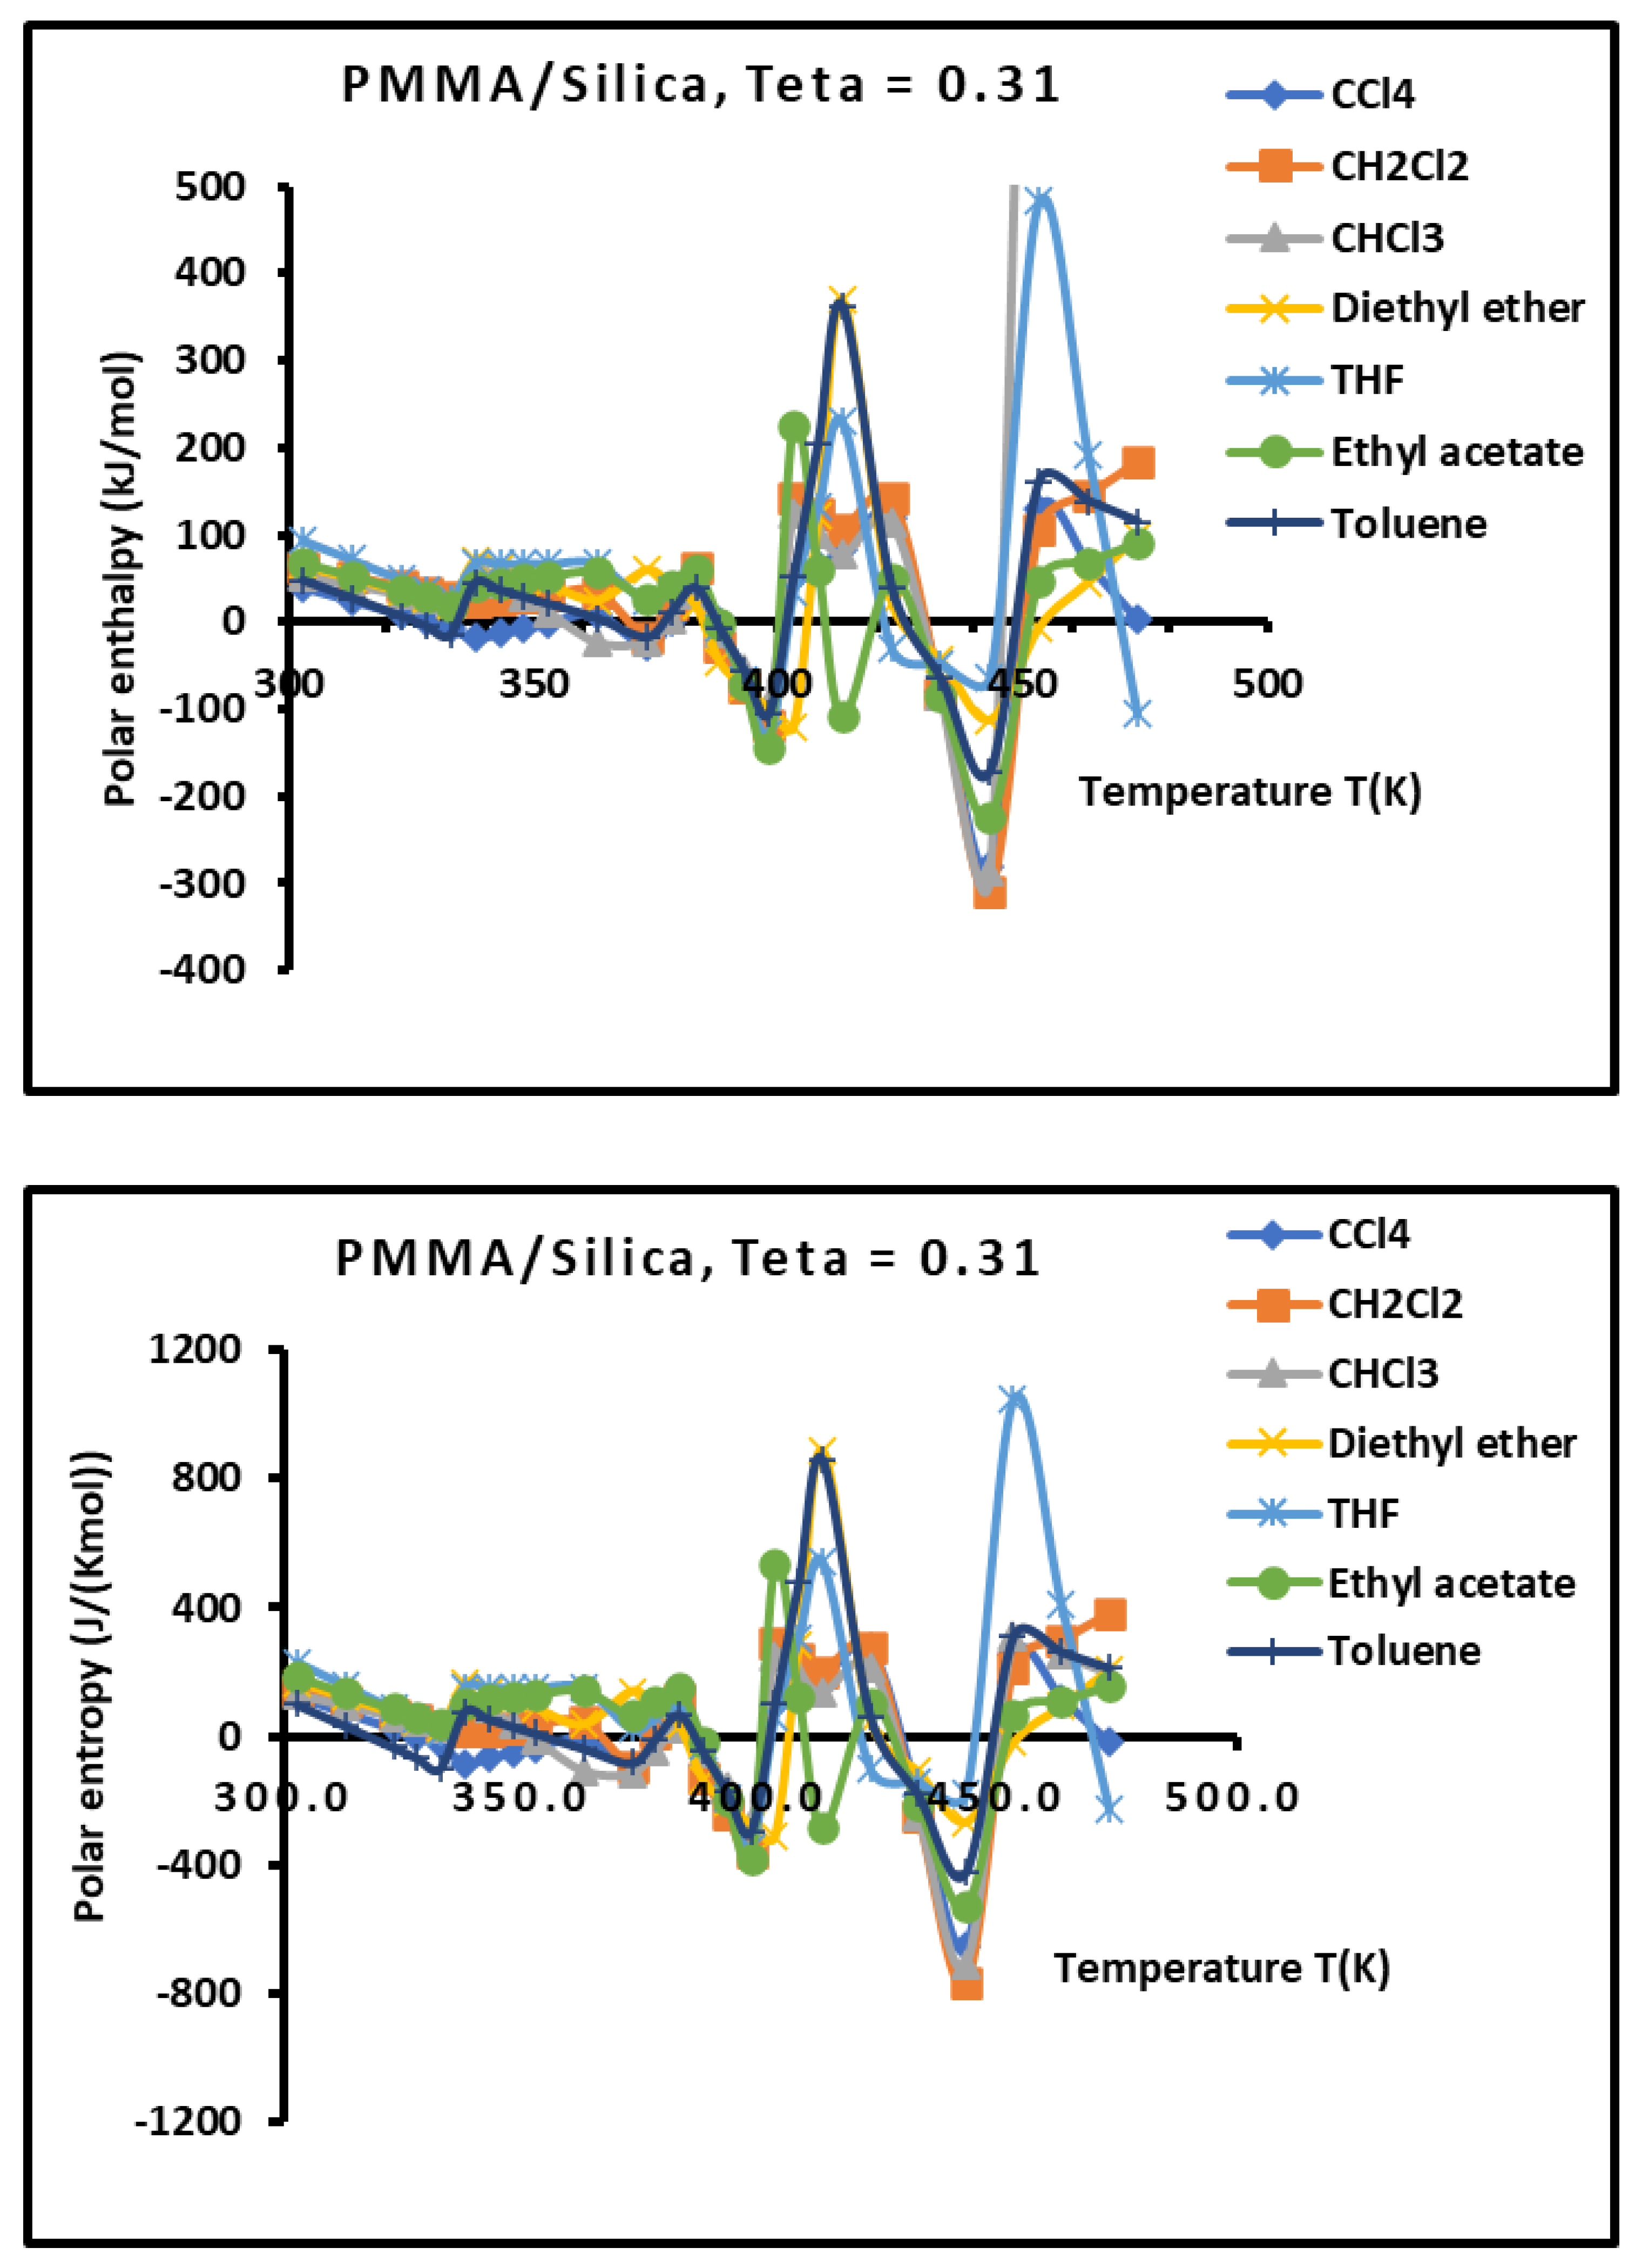
Figure 11.
Variations of the interaction enthalpy ( and entropy ( of polar solvents adsorbed on PMMA/silica for as a function of the temperature.
Figure 11.
Variations of the interaction enthalpy ( and entropy ( of polar solvents adsorbed on PMMA/silica for as a function of the temperature.
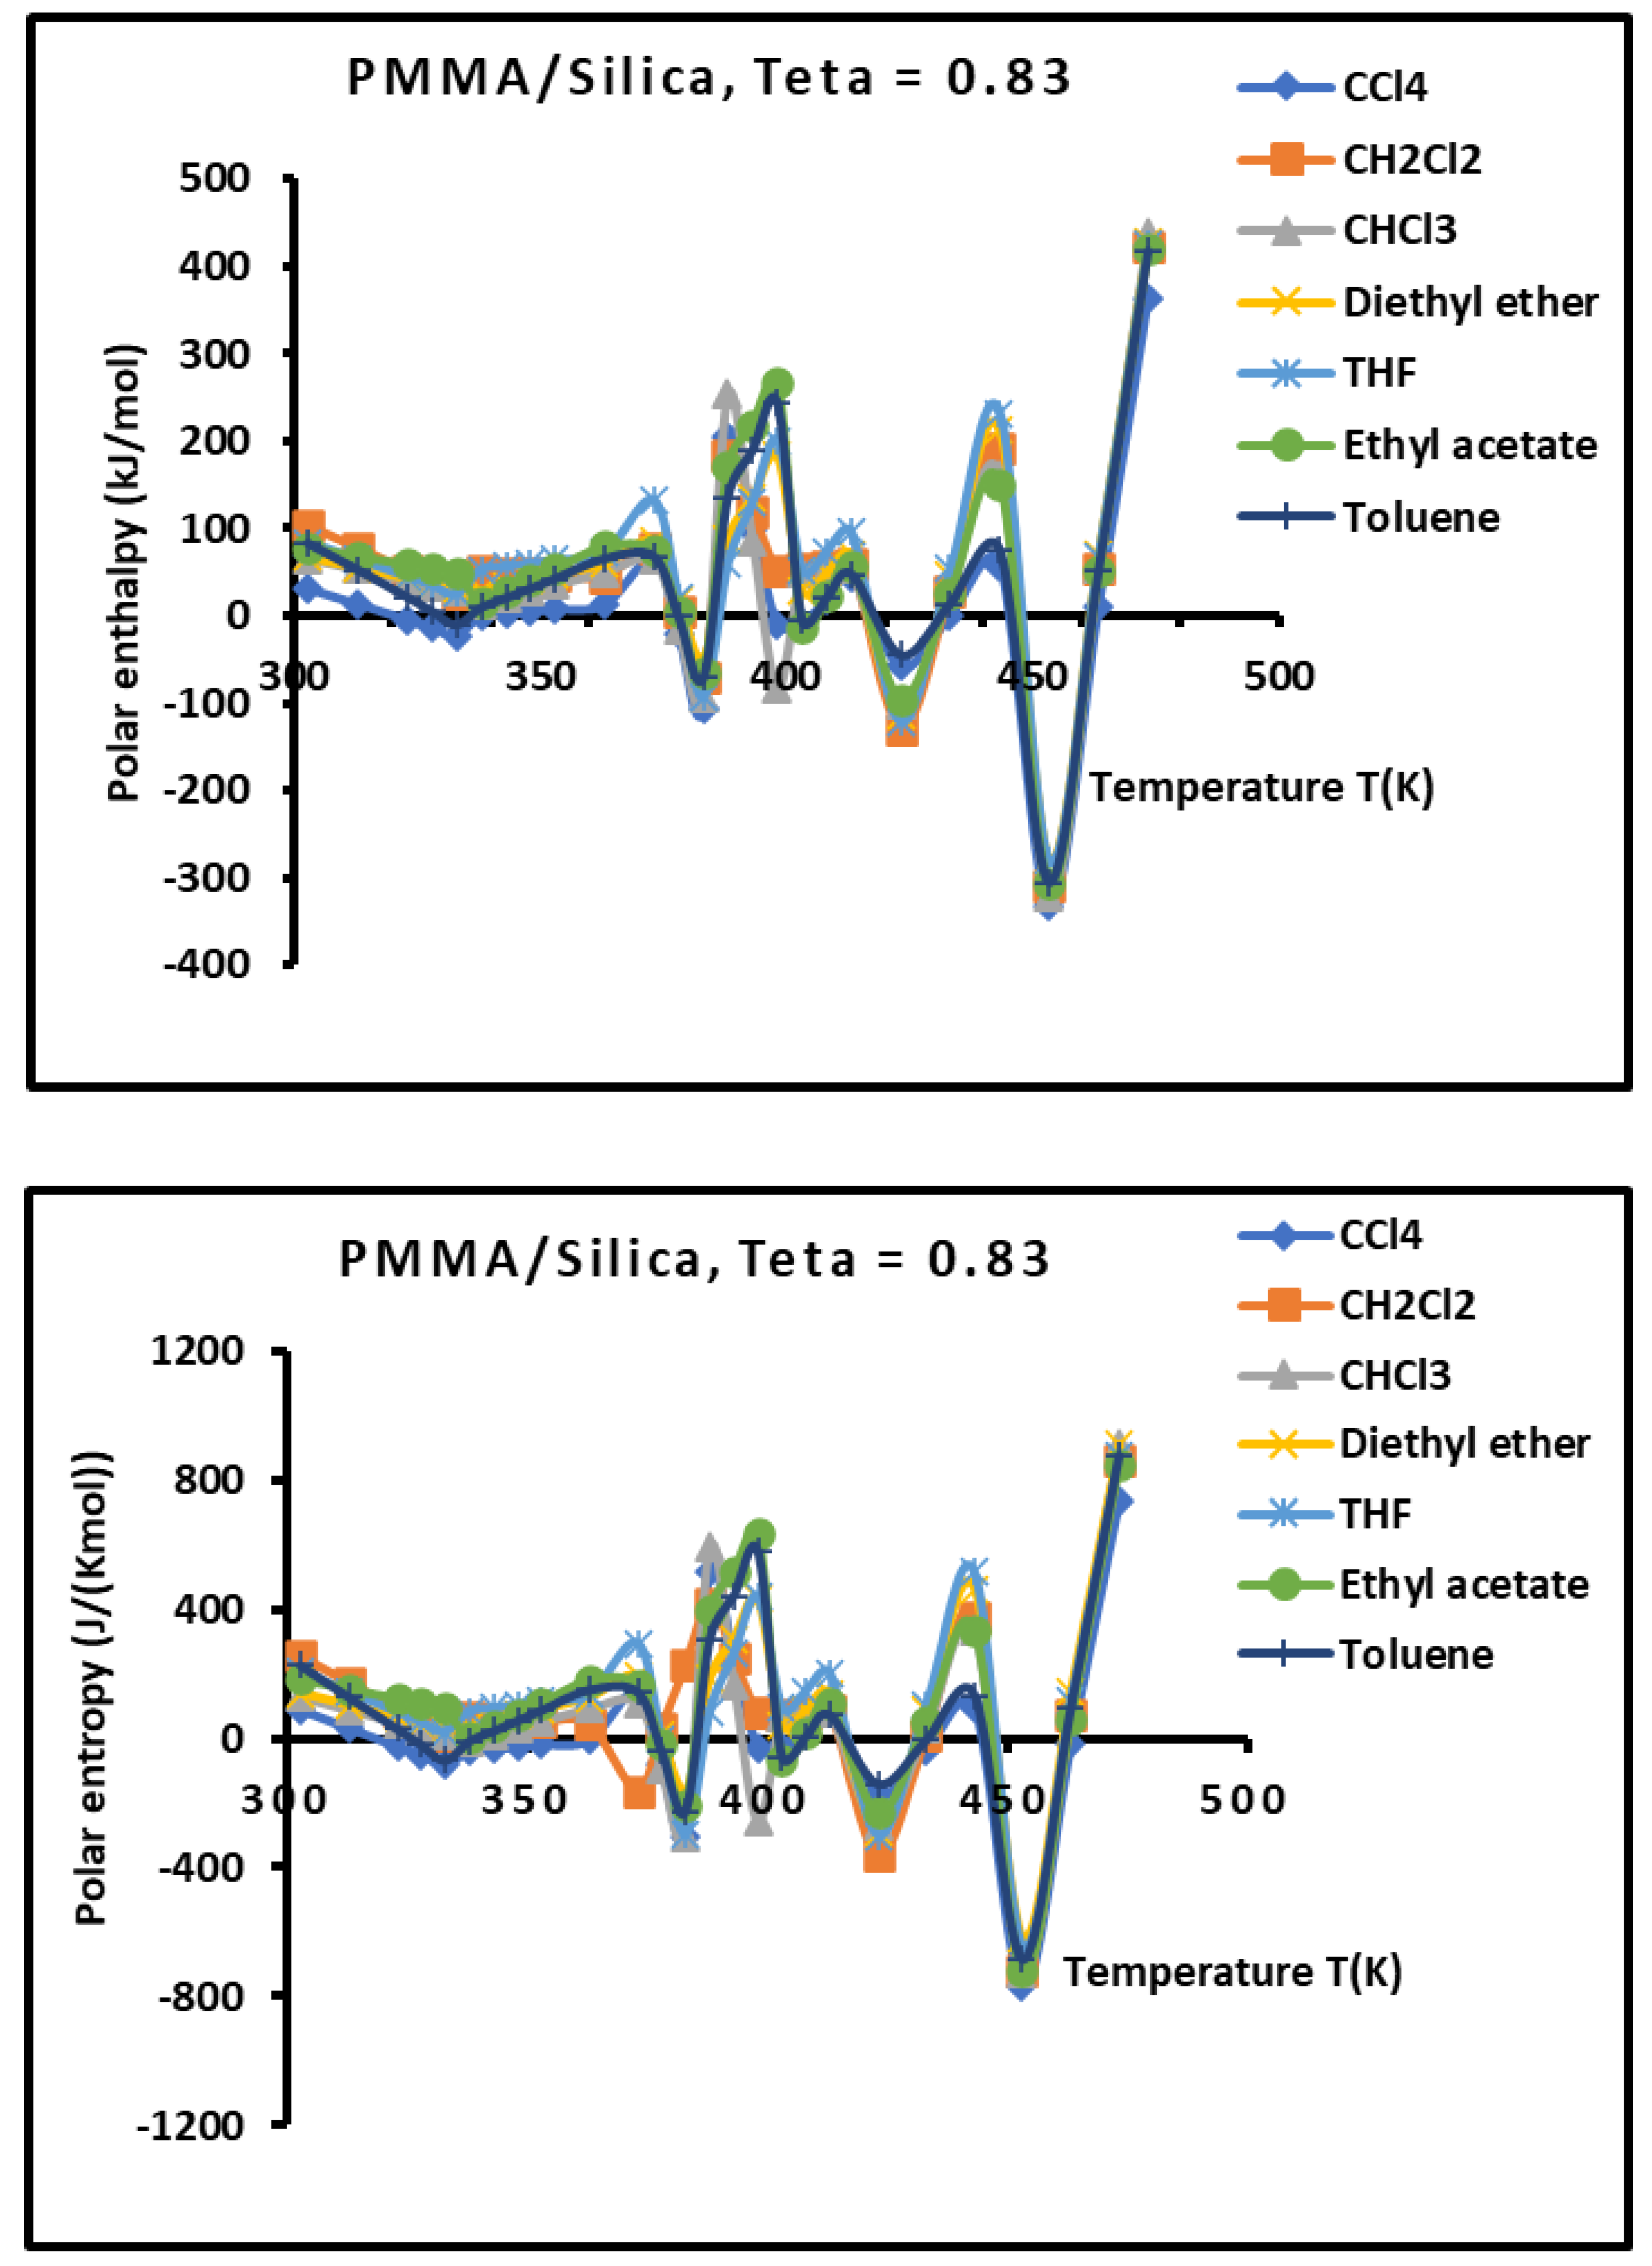
Figure 12.
Variations of the interaction enthalpy ( and entropy ( of polar solvents adsorbed on PMMA/silica for
(monolayer case) as a function of the temperature.
Figure 12.
Variations of the interaction enthalpy ( and entropy ( of polar solvents adsorbed on PMMA/silica for
(monolayer case) as a function of the temperature.
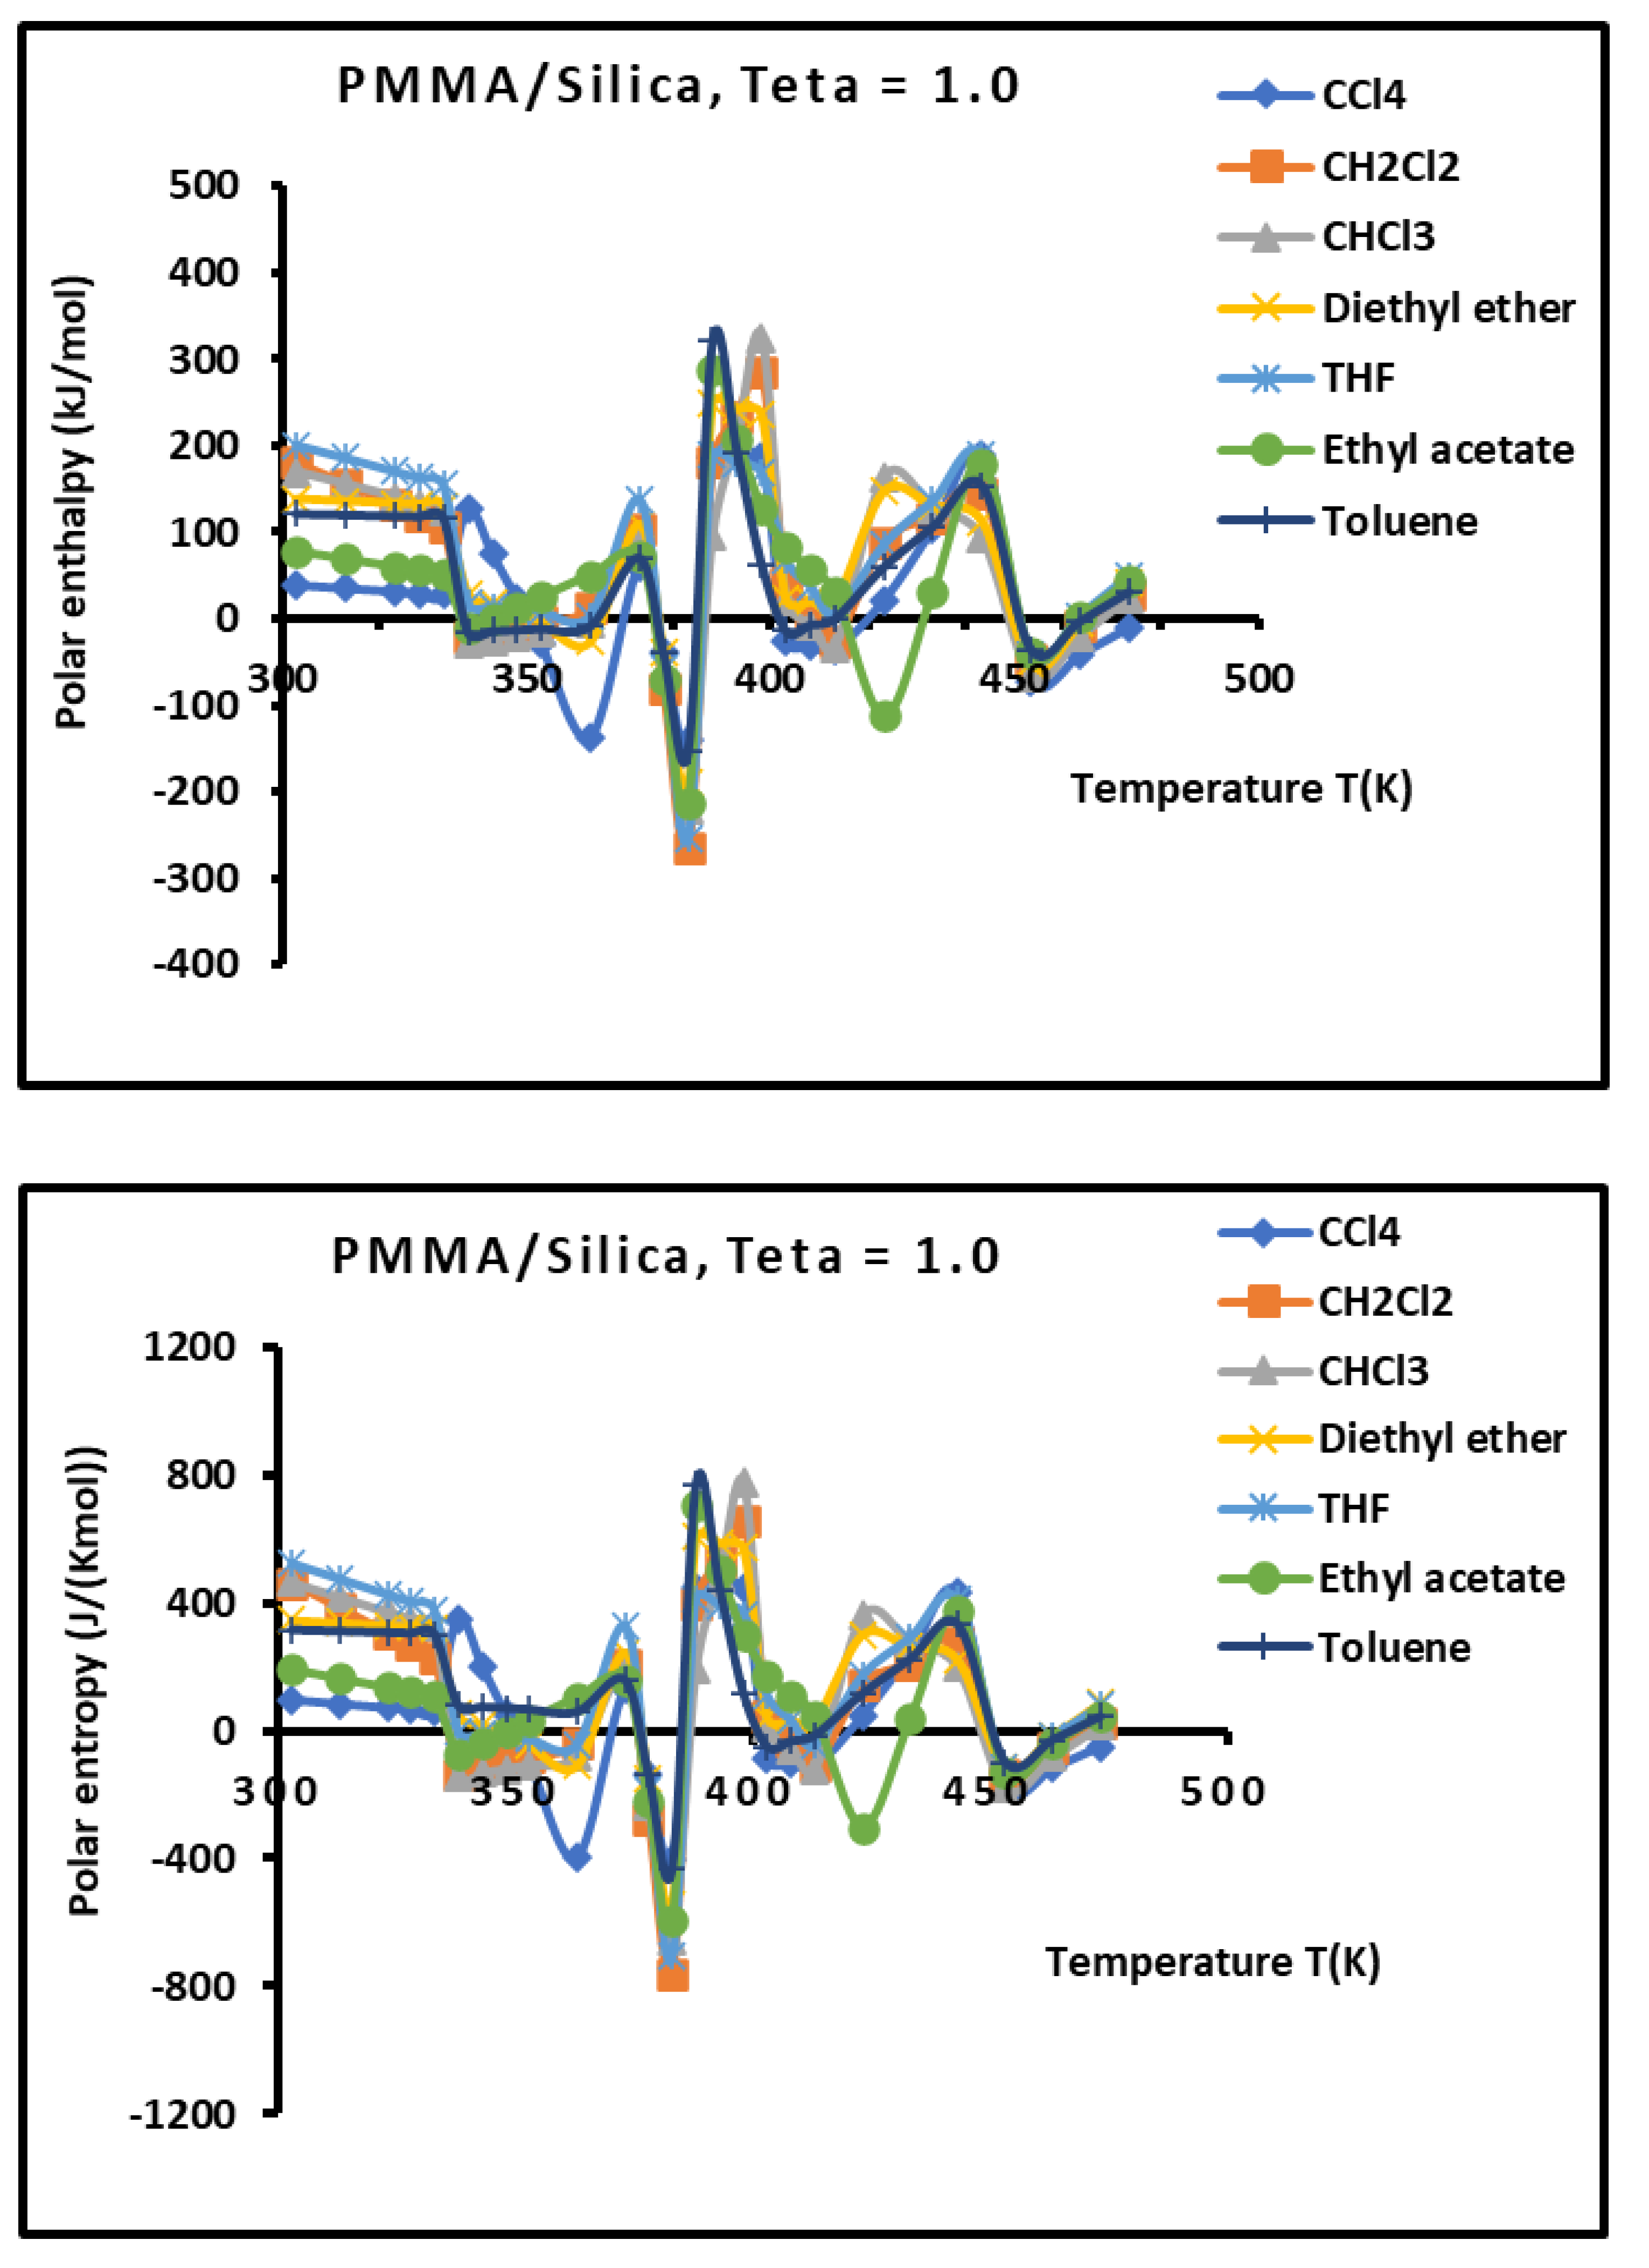
Figure 13.
Variations of the dispersion factor A (SI unit) of PMMA/silica at different recovery fractions as a function of the temperature.
Figure 13.
Variations of the dispersion factor A (SI unit) of PMMA/silica at different recovery fractions as a function of the temperature.
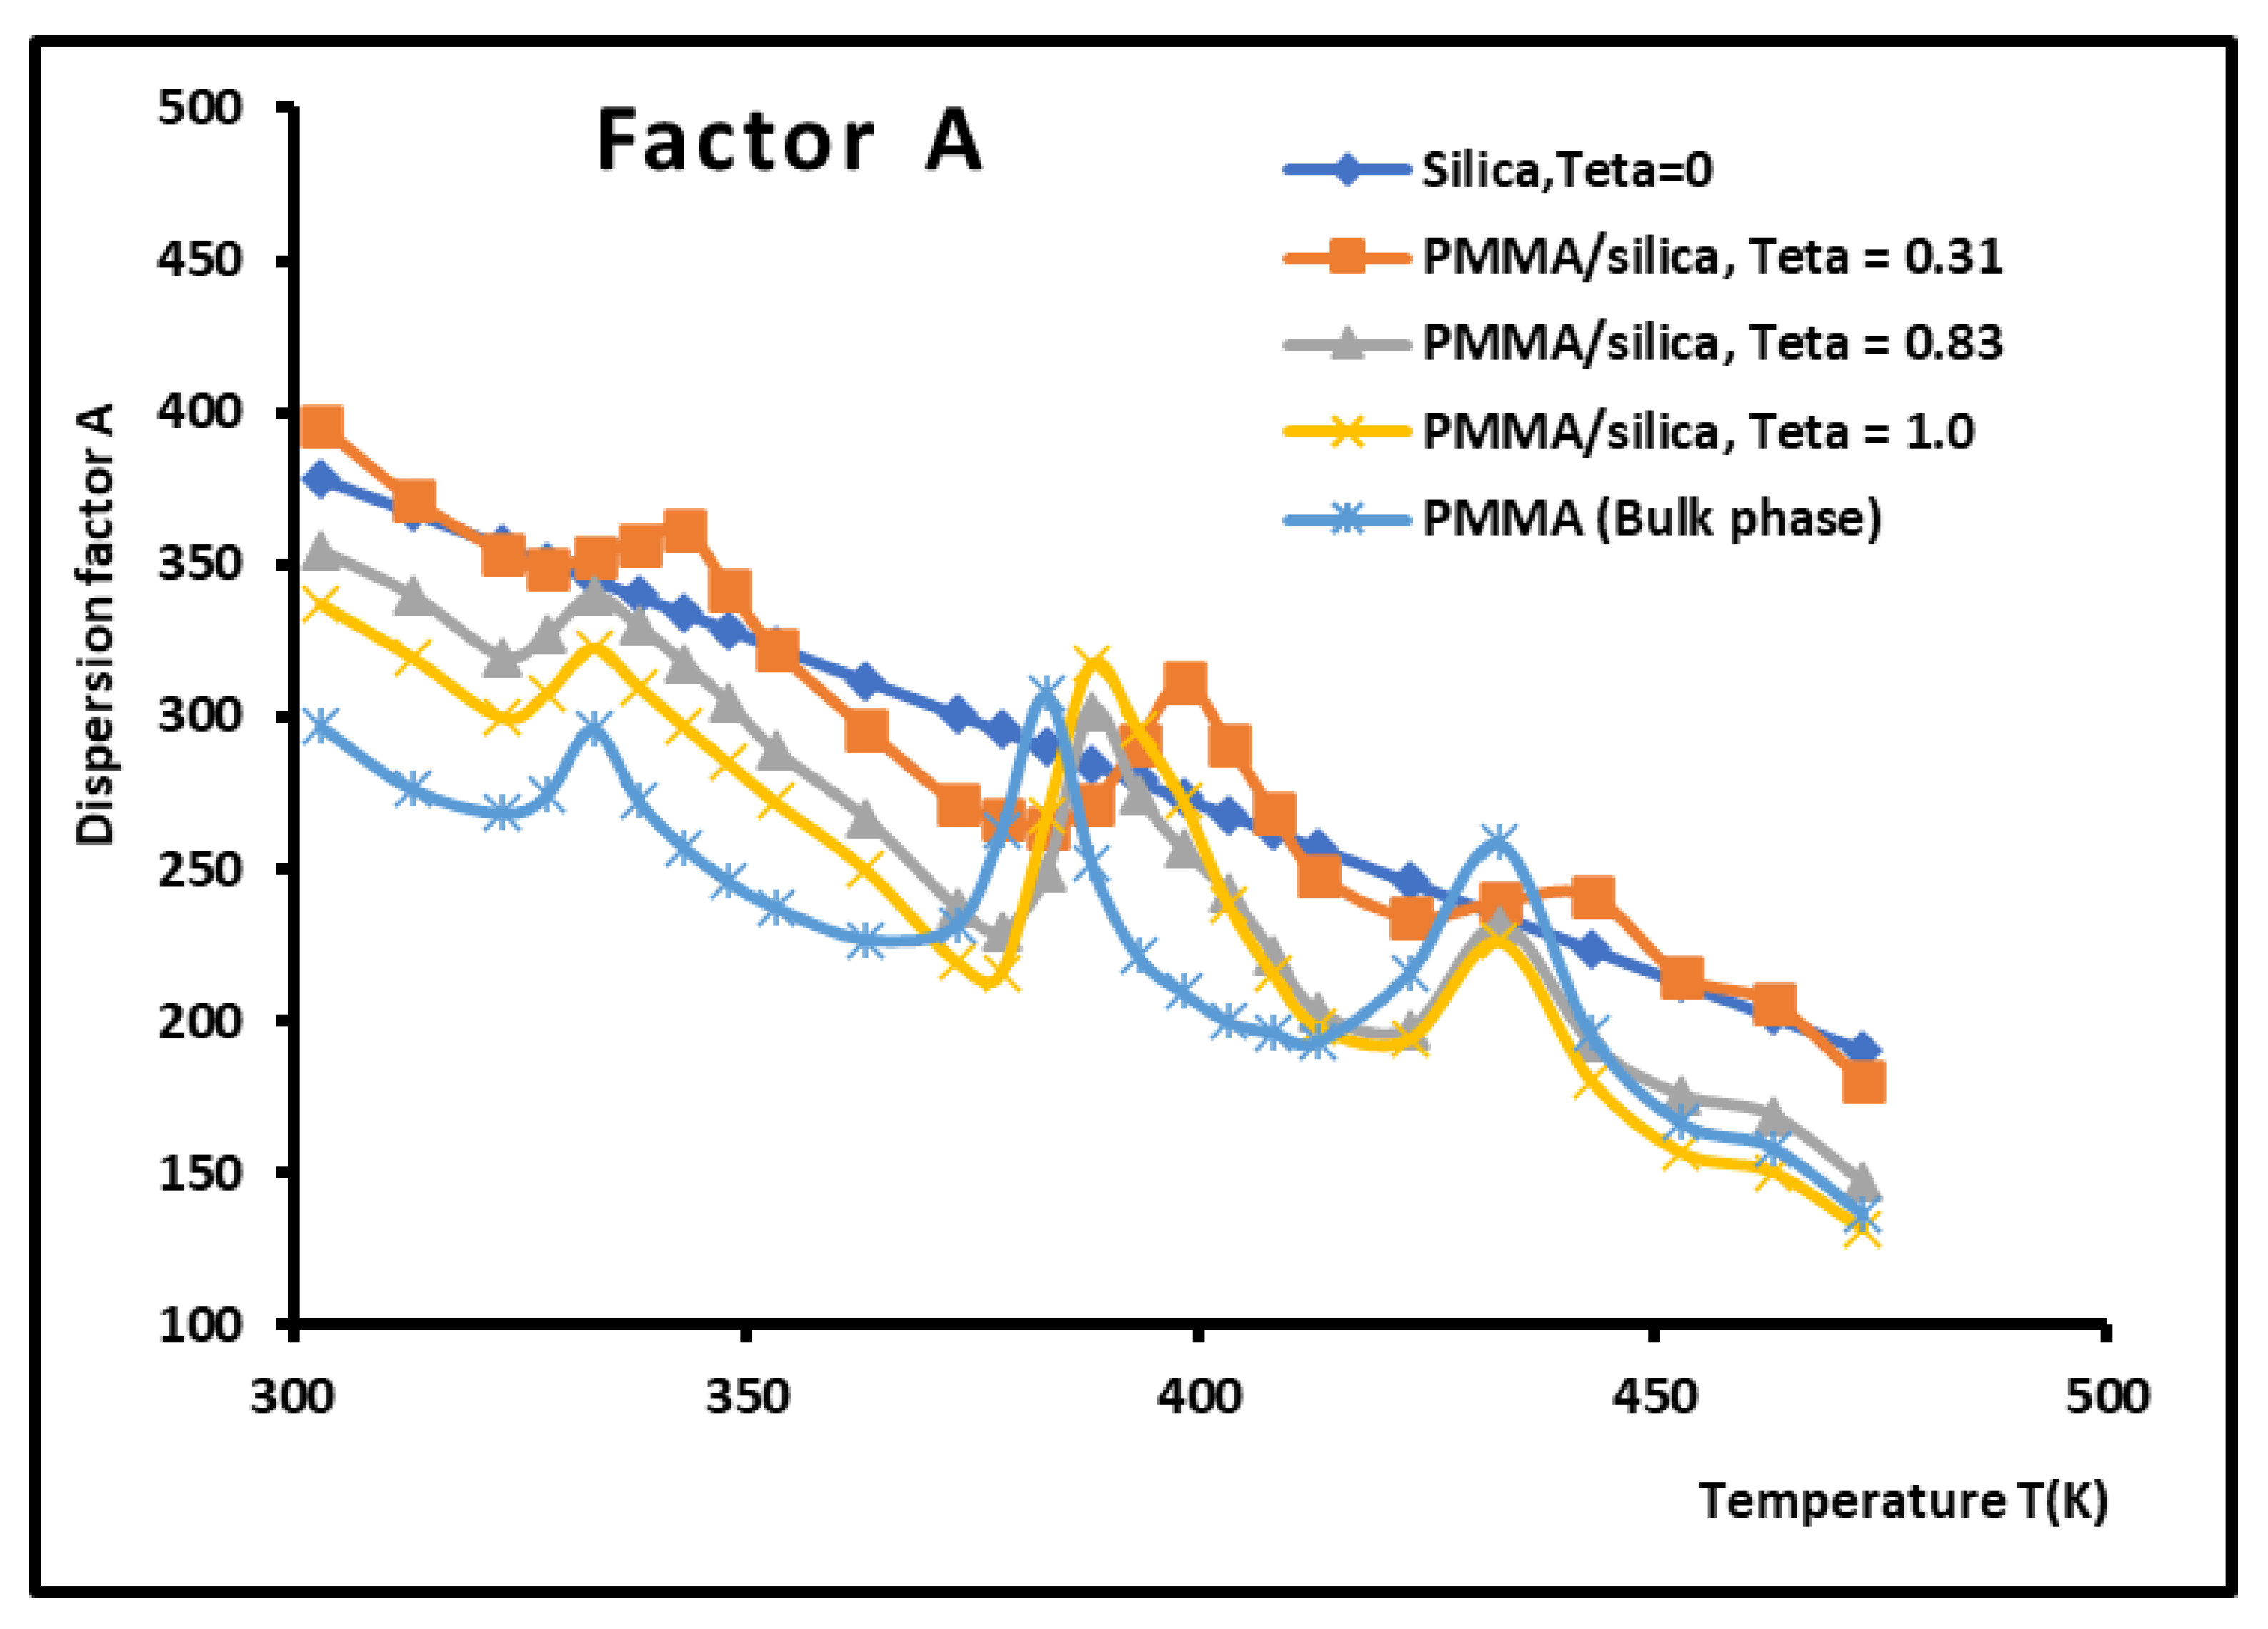
Figure 14.
Variations of the dispersion factor A (SI unit) of different solid surfaces as a function of the recovery fraction for different temperatures.
Figure 14.
Variations of the dispersion factor A (SI unit) of different solid surfaces as a function of the recovery fraction for different temperatures.
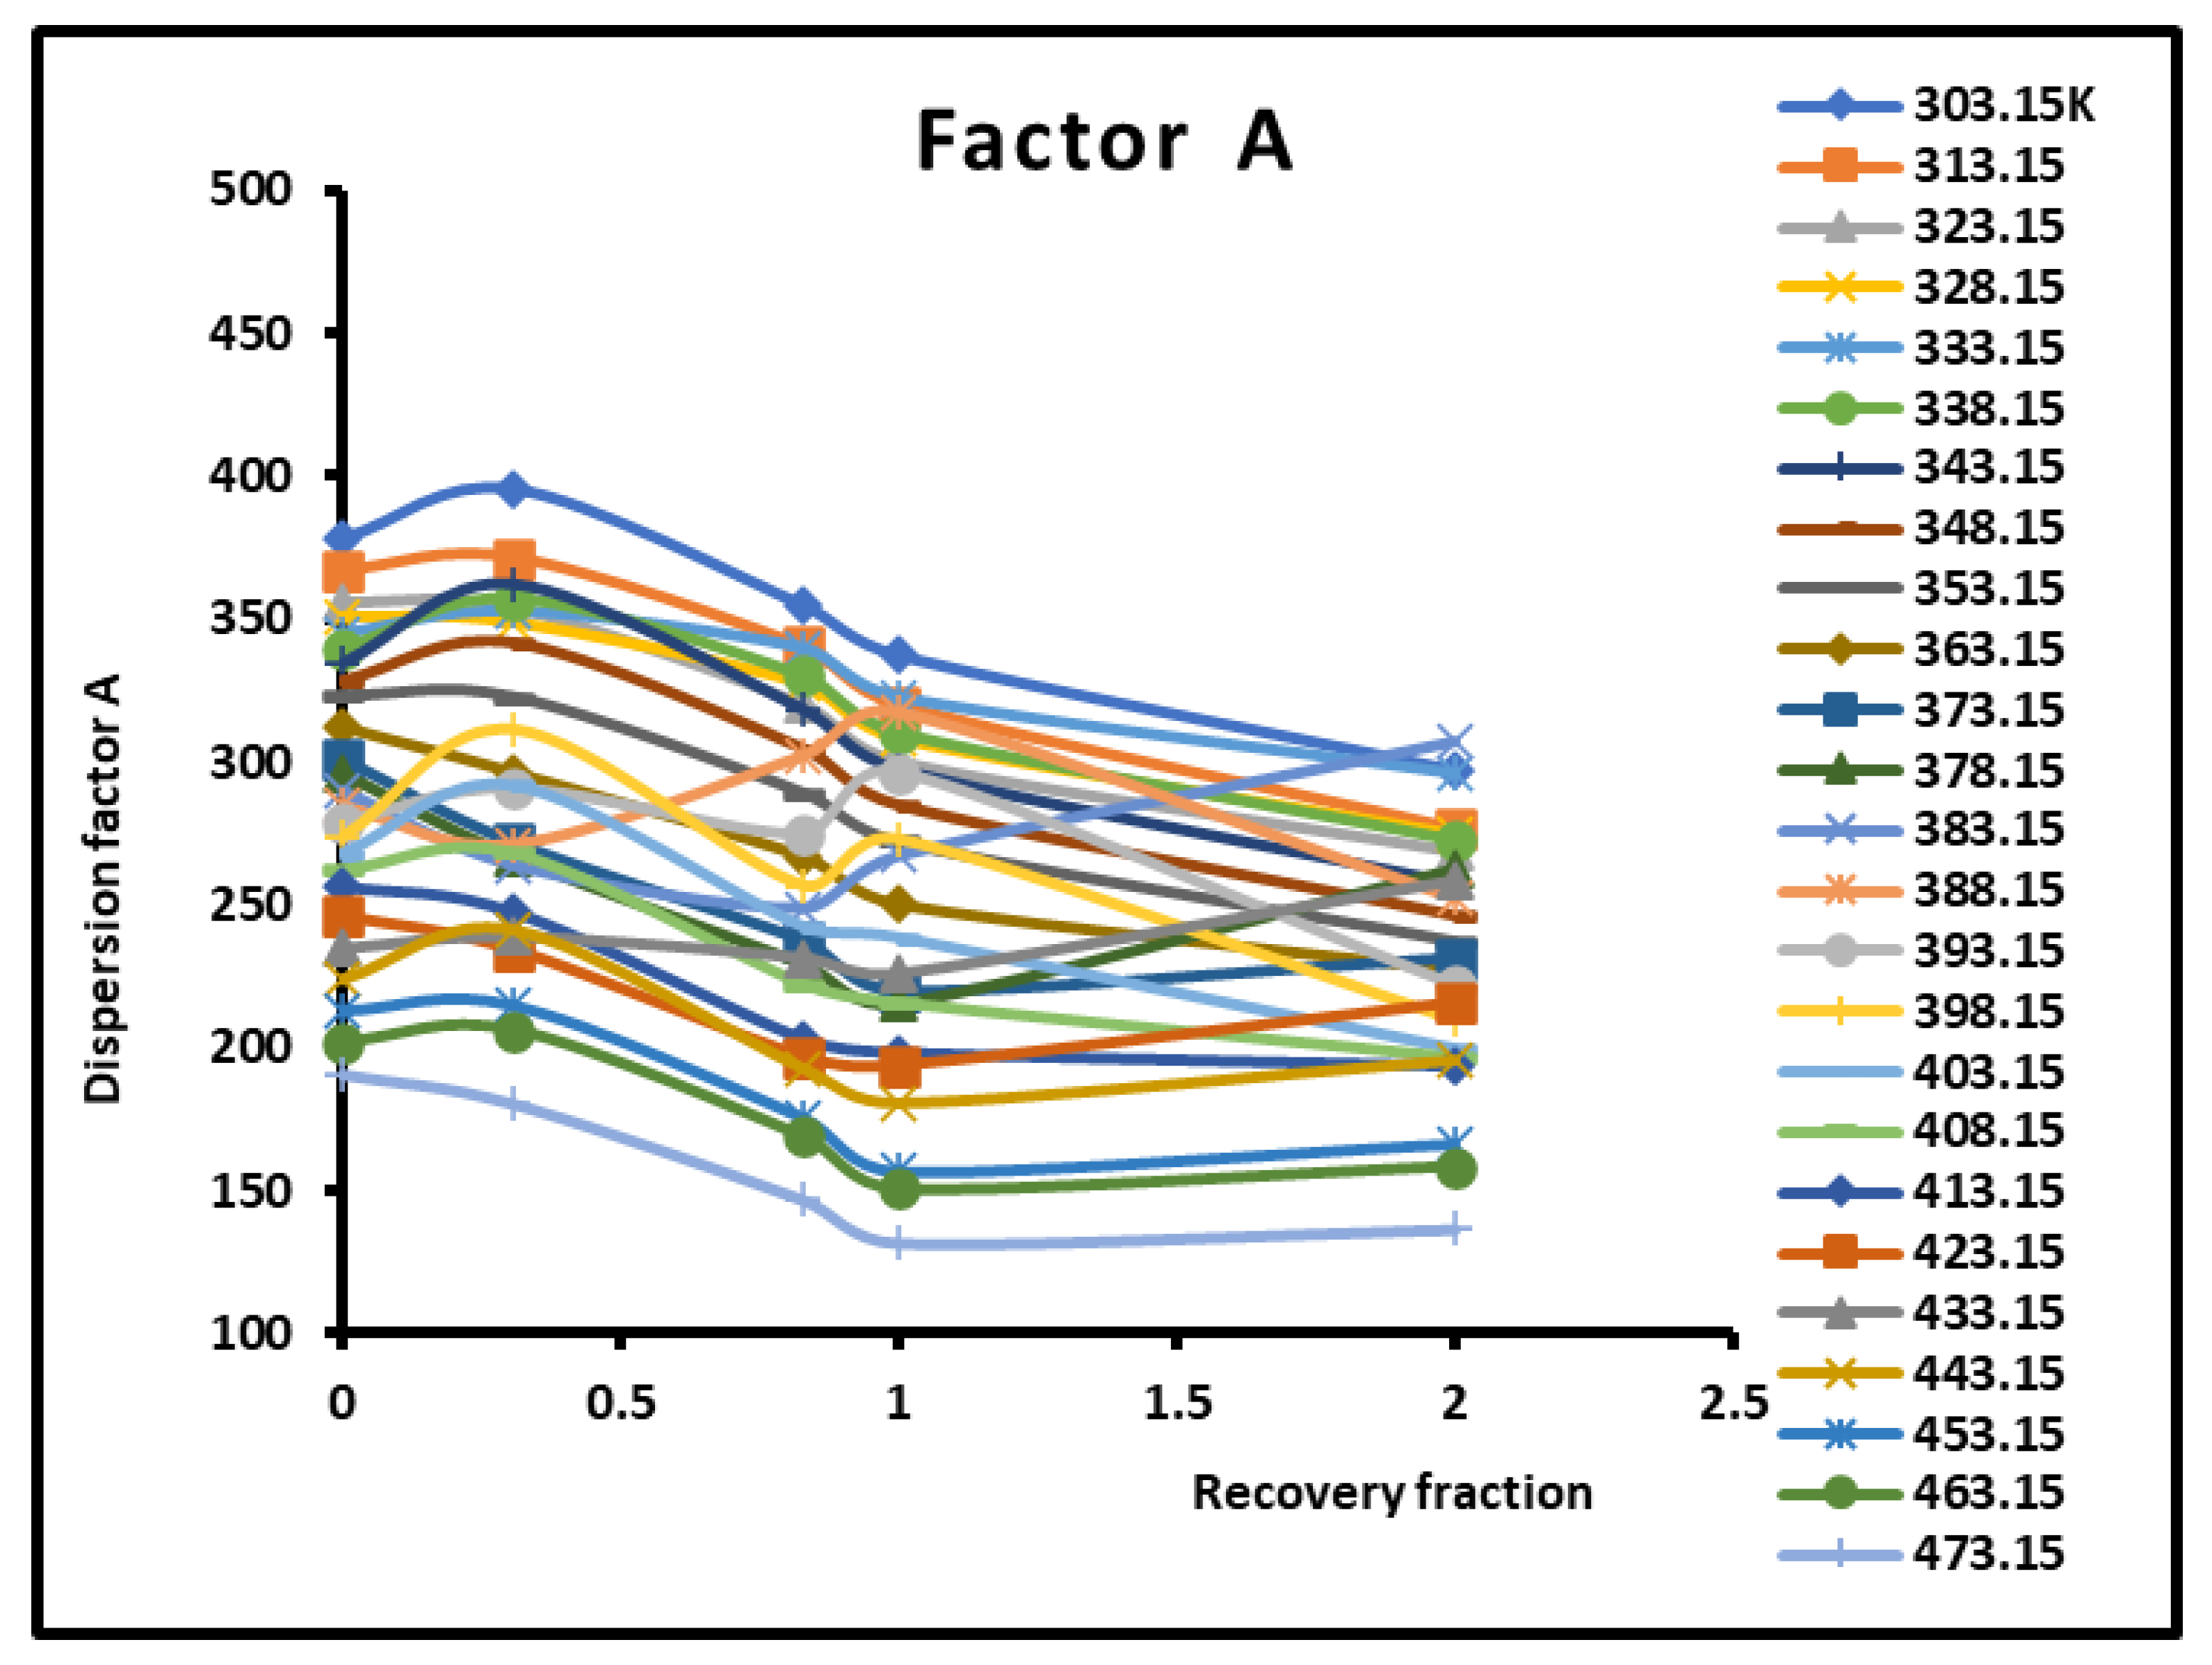
Figure 15.
Evolution of the London free dispersive interaction energy ( of organic solvents adsorbed on PMMA/silica for as a function of the temperature.
Figure 15.
Evolution of the London free dispersive interaction energy ( of organic solvents adsorbed on PMMA/silica for as a function of the temperature.
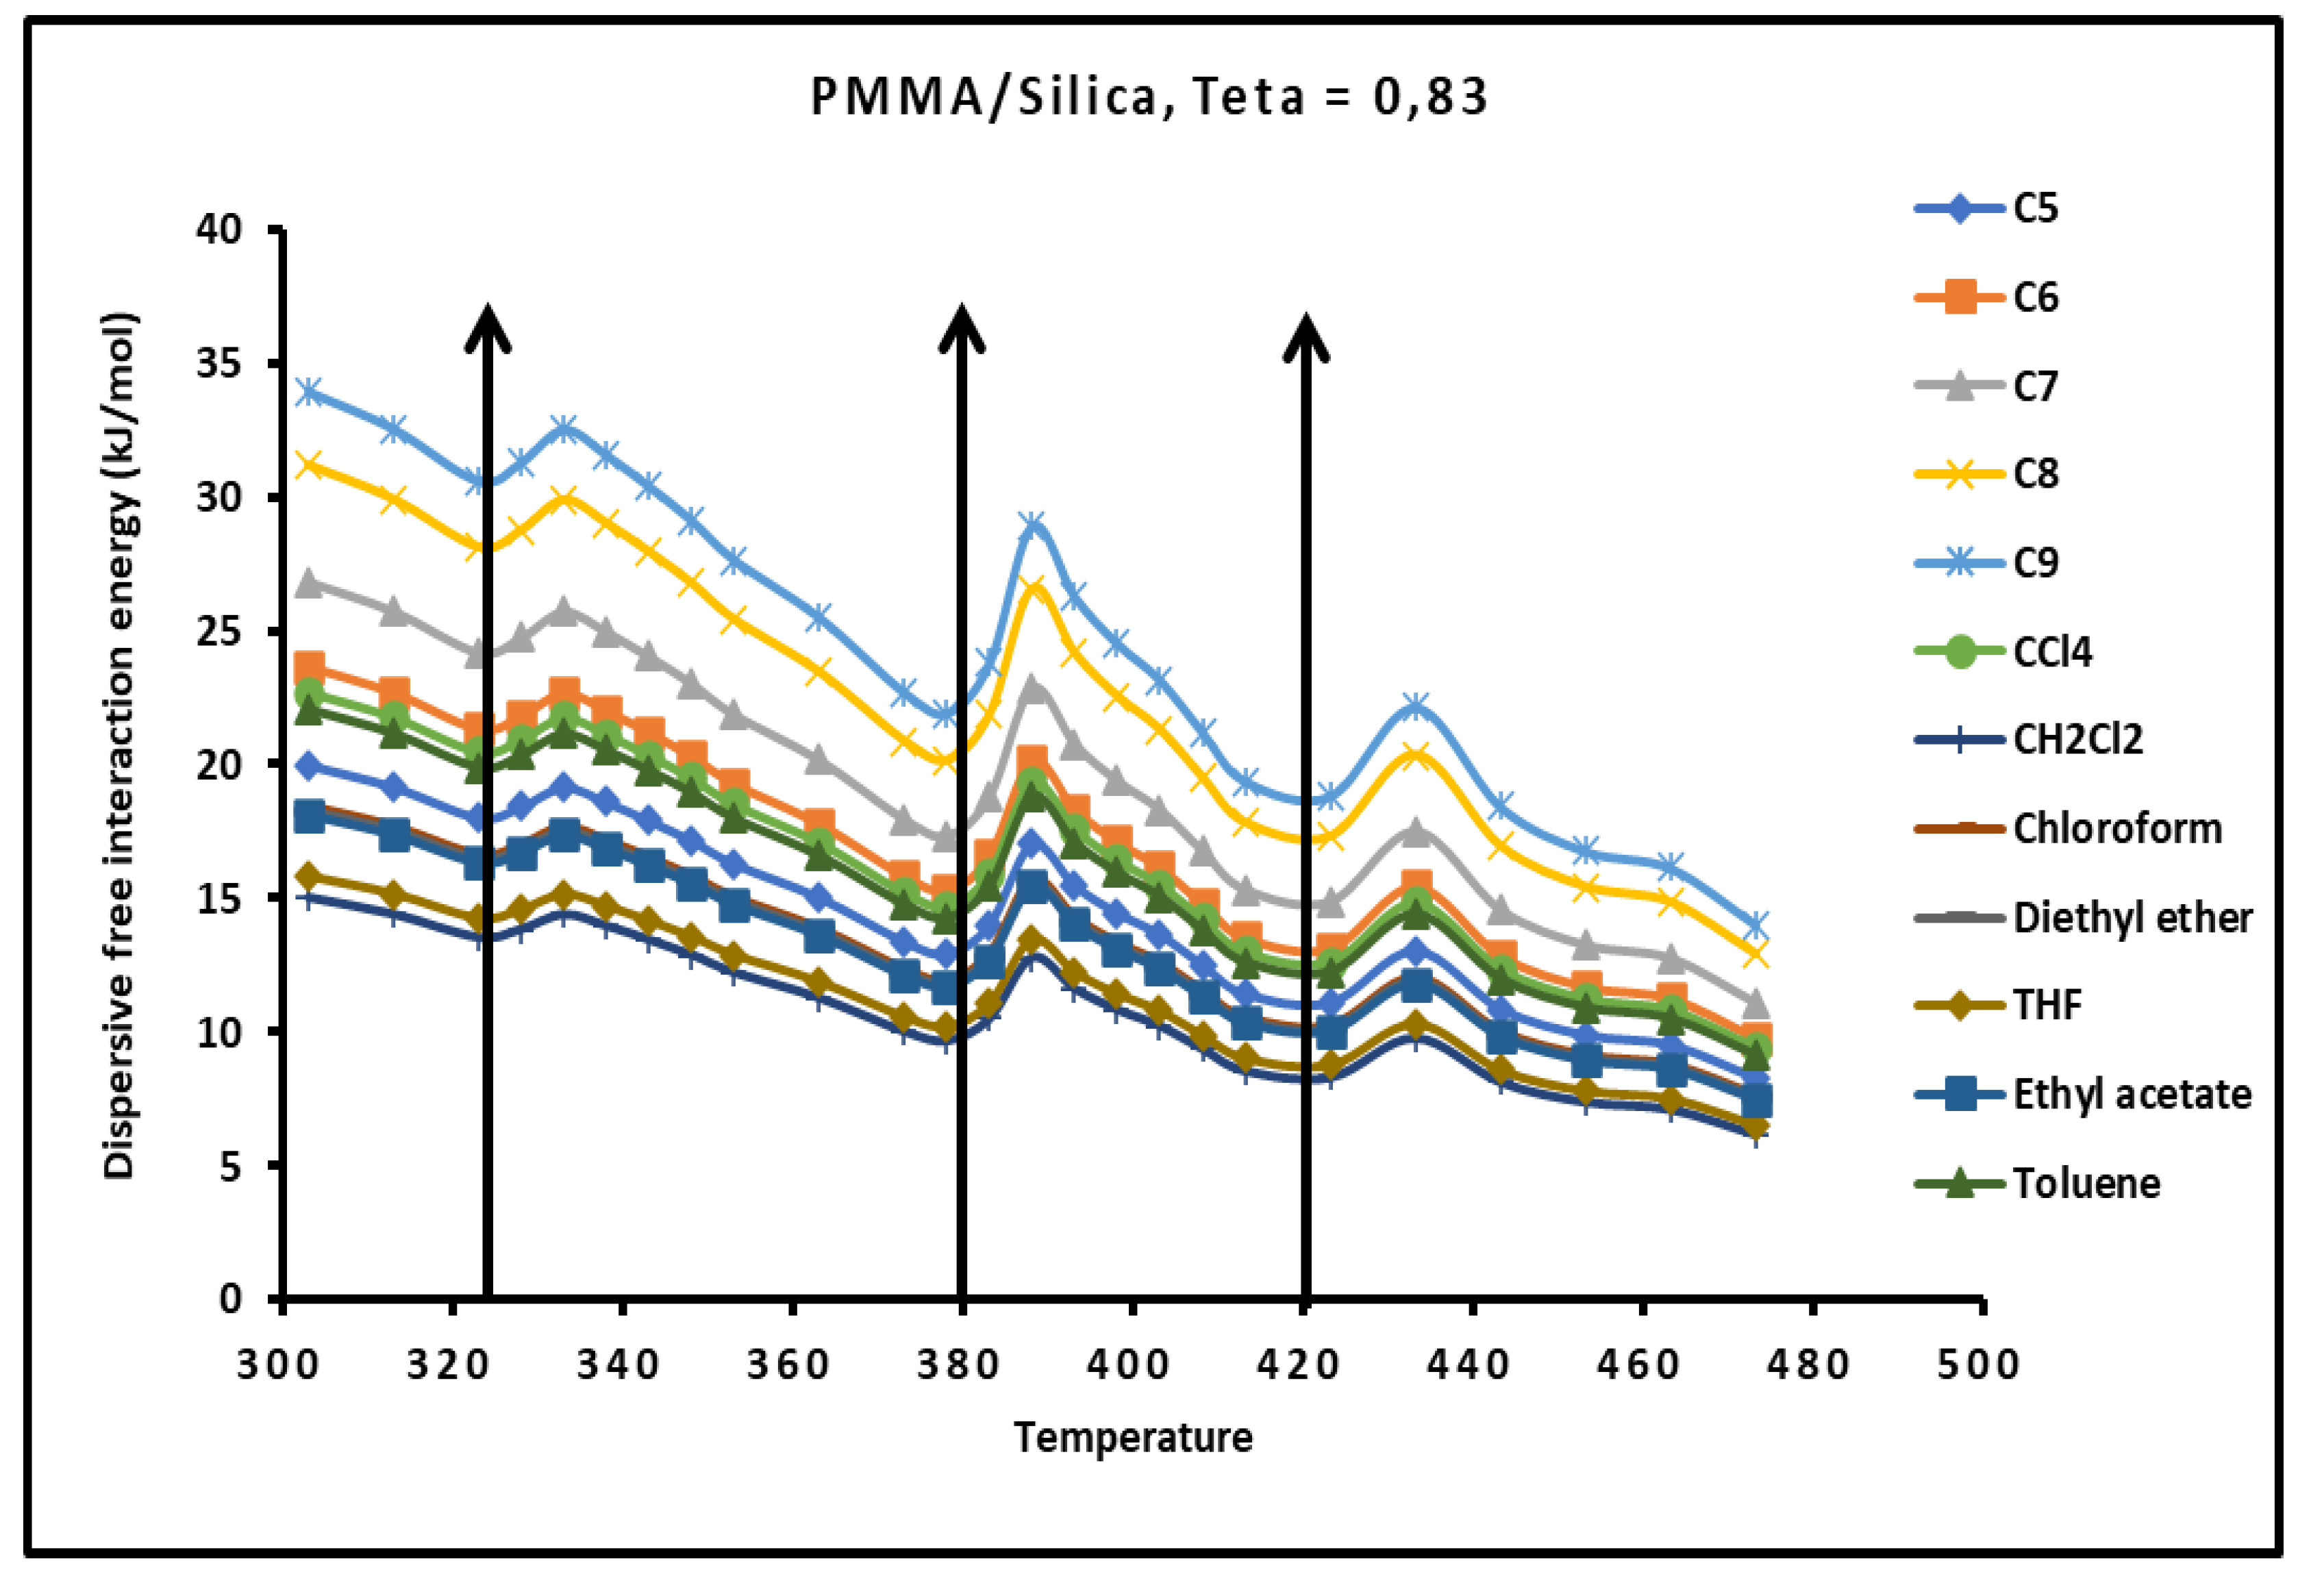
Figure 16.
Variations of the separation distance H as a function of the temperature for the different solid surfaces.
Figure 16.
Variations of the separation distance H as a function of the temperature for the different solid surfaces.
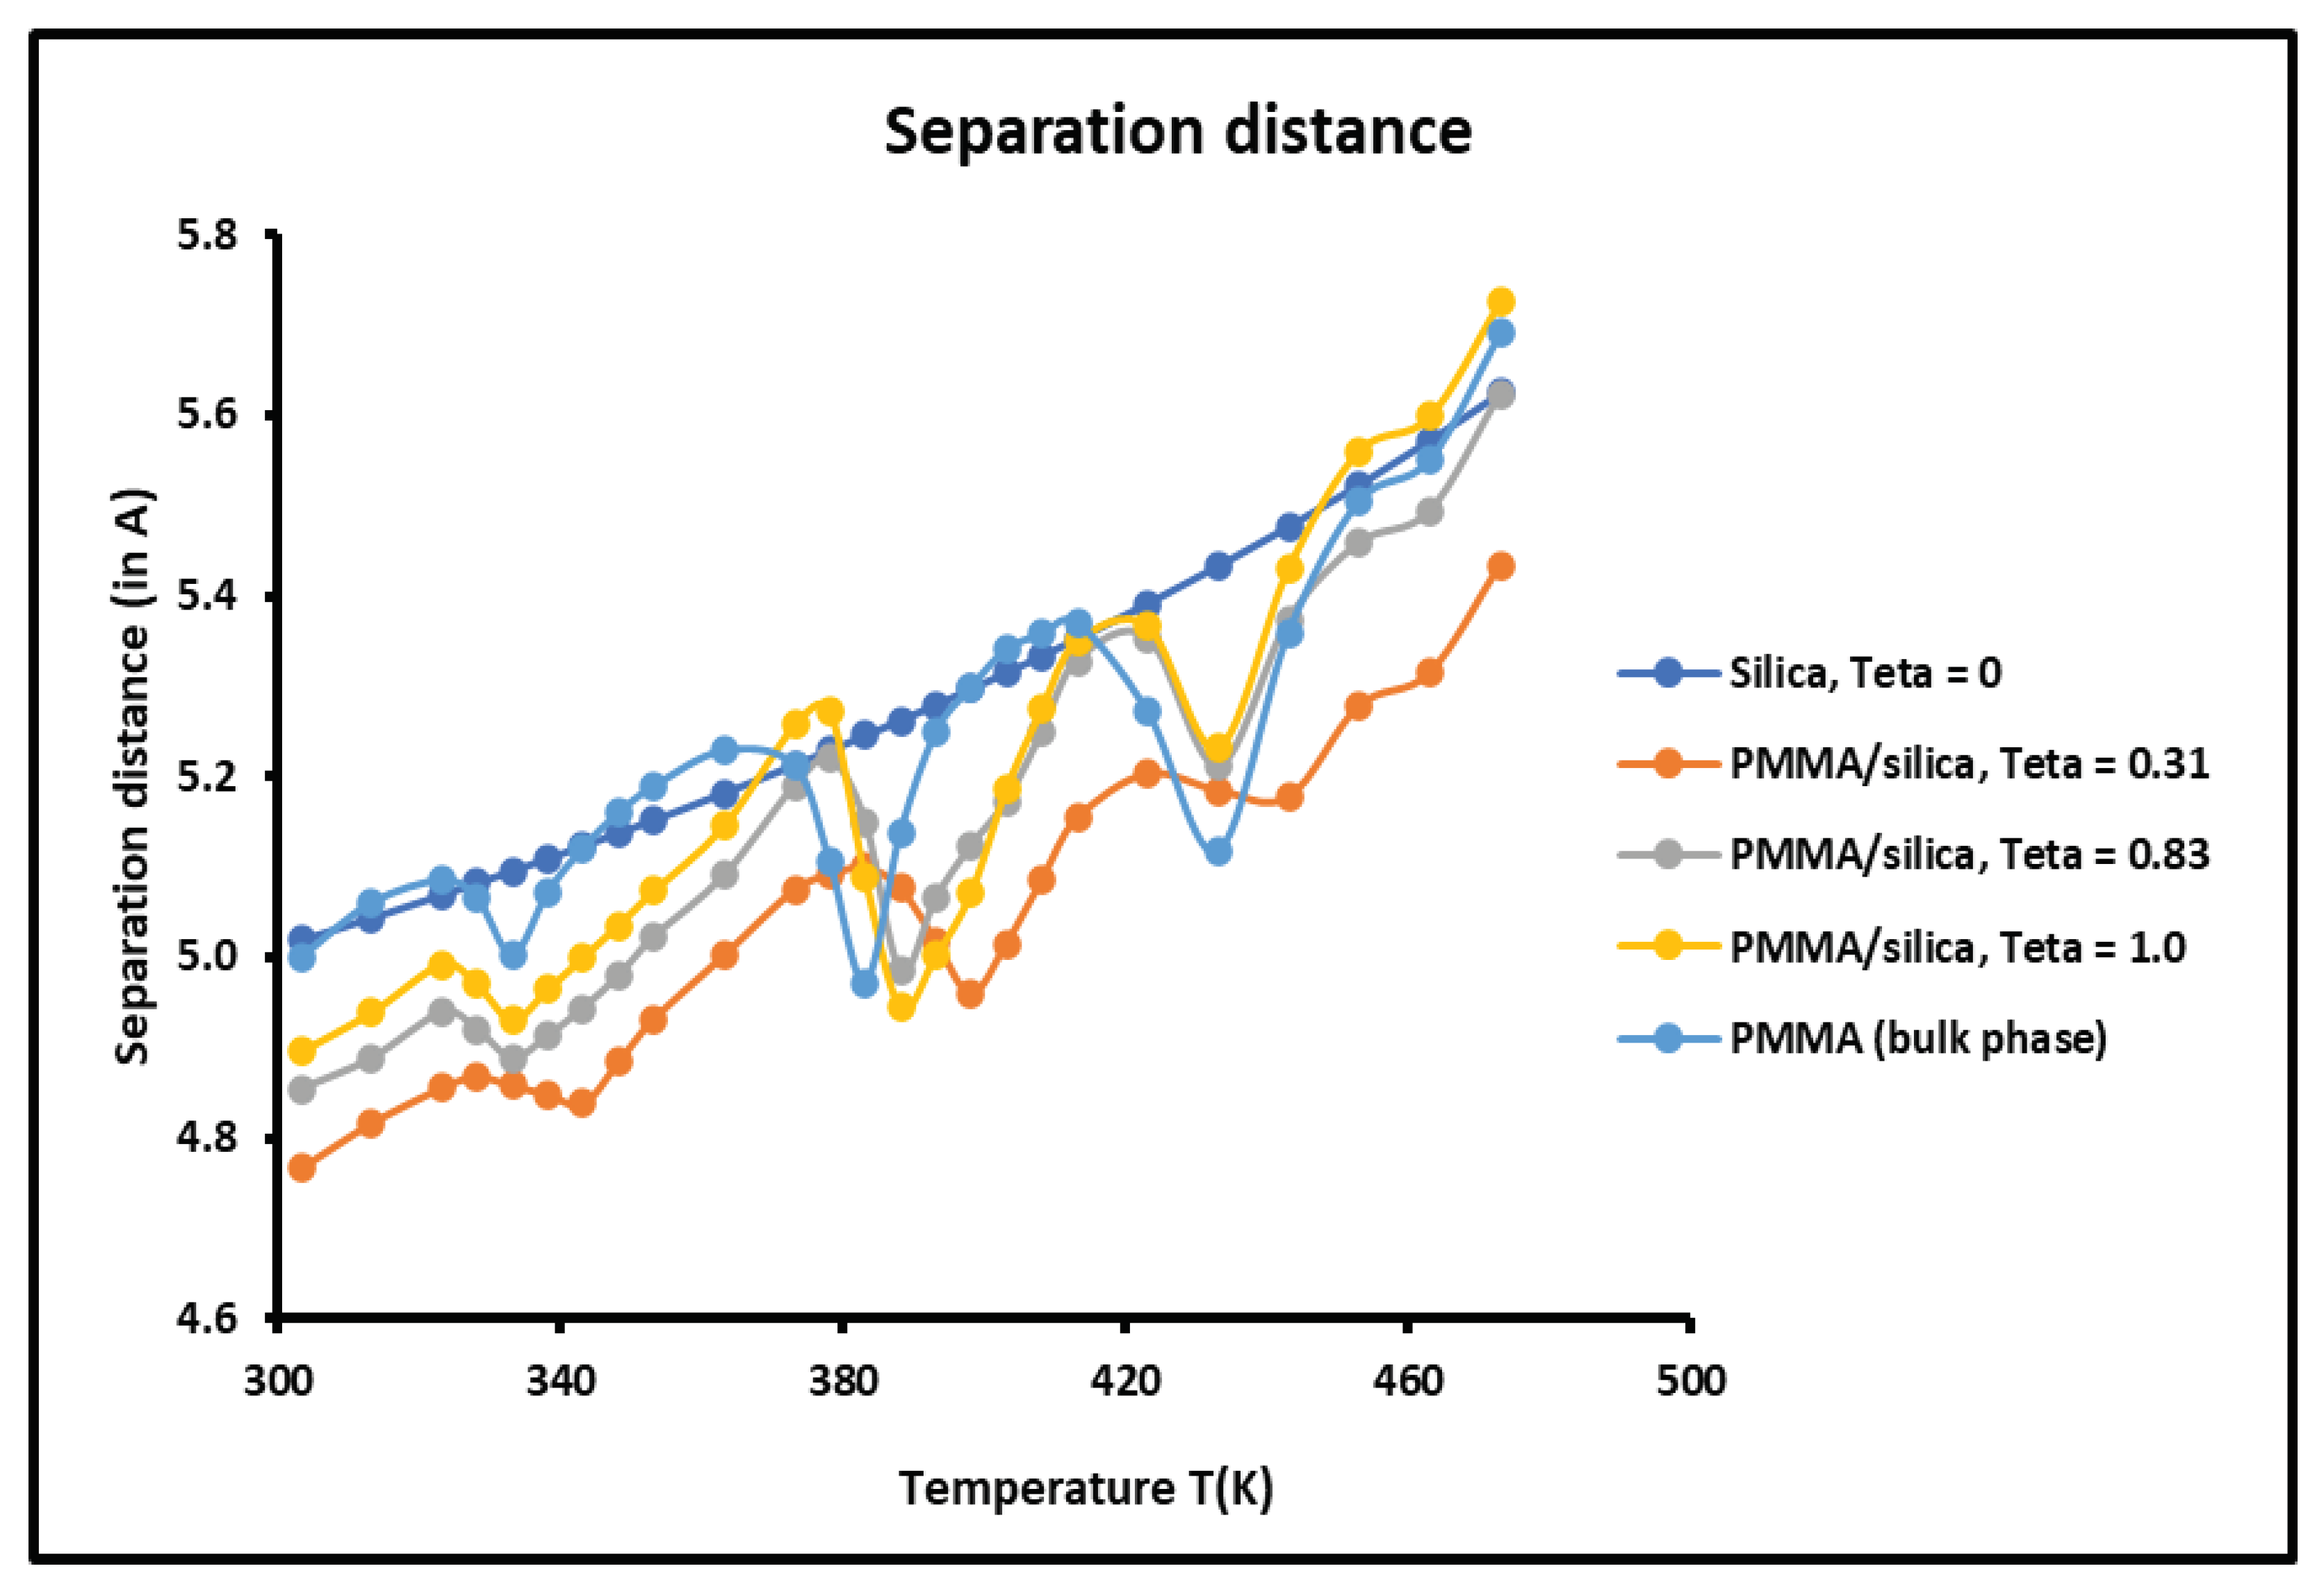

Table 1.
Values of ( kJ/mol) of polar molecules adsorbed on silica particles as a function of the temperature.
Table 1.
Values of ( kJ/mol) of polar molecules adsorbed on silica particles as a function of the temperature.
| Polar free energy of Solvents adsorbed on silica | |||||||
| Temperature T(K) | CCl4 | CH2Cl2 | CHCl3 | Diethyl ether | THF | Ethyl acetate | Toluene |
| 303.15 | 6.674 | 25.241 | 20.030 | 28.337 | 37.697 | 17.422 | 17.701 |
| 313.15 | 6.715 | 24.896 | 19.854 | 27.581 | 36.486 | 17.089 | 17.452 |
| 323.15 | 6.752 | 24.807 | 19.752 | 26.838 | 35.506 | 16.852 | 17.328 |
| 328.15 | 6.777 | 24.379 | 19.590 | 26.447 | 34.669 | 16.590 | 17.078 |
| 333.15 | 6.797 | 24.206 | 19.502 | 26.069 | 34.064 | 16.423 | 16.954 |
| 338.15 | 6.818 | 24.034 | 19.414 | 25.691 | 33.458 | 16.257 | 16.829 |
| 343.15 | 6.809 | 23.876 | 19.303 | 25.462 | 32.786 | 16.149 | 16.722 |
| 348.15 | 6.859 | 23.689 | 19.238 | 24.935 | 32.247 | 15.924 | 16.580 |
| 353.15 | 6.879 | 23.516 | 19.150 | 24.557 | 31.642 | 15.757 | 16.456 |
| 363.15 | 6.884 | 23.102 | 18.927 | 23.805 | 30.437 | 15.394 | 16.170 |
| 373.15 | 6.961 | 22.826 | 18.798 | 23.045 | 29.220 | 15.091 | 15.958 |
| 378.15 | 6.982 | 22.654 | 18.710 | 22.667 | 28.614 | 14.925 | 15.833 |
| 383.15 | 6.969 | 22.285 | 18.547 | 22.315 | 27.908 | 14.704 | 15.598 |
| 388.15 | 7.023 | 22.309 | 18.534 | 21.911 | 27.403 | 14.592 | 15.584 |
| 393.15 | 7.043 | 22.136 | 18.446 | 21.533 | 26.798 | 14.425 | 15.460 |
| 398.15 | 7.064 | 21.964 | 18.358 | 21.155 | 26.192 | 14.259 | 15.335 |
| 403.15 | 7.127 | 21.689 | 18.248 | 20.674 | 25.592 | 14.080 | 15.184 |
| 408.15 | 7.105 | 21.619 | 18.182 | 20.399 | 24.981 | 13.926 | 15.086 |
| 413.15 | 7.125 | 21.446 | 18.094 | 20.021 | 24.376 | 13.759 | 14.962 |
| 423.15 | 7.205 | 21.206 | 18.006 | 19.185 | 23.401 | 13.498 | 14.834 |
| 433.15 | 7.207 | 20.756 | 17.742 | 18.509 | 21.954 | 13.093 | 14.464 |
| 443.15 | 7.248 | 20.411 | 17.566 | 17.753 | 20.743 | 12.760 | 14.215 |
| 453.15 | 7.289 | 20.066 | 17.390 | 16.997 | 19.532 | 12.427 | 13.966 |
| 463.15 | 7.348 | 20.070 | 17.346 | 16.496 | 18.659 | 12.350 | 13.973 |
| 473.15 | 7.371 | 19.376 | 17.038 | 15.485 | 17.110 | 11.761 | 13.468 |
Table 2.
Values of ( kJ/mol) of polar molecules adsorbed on PMMA particles as a function of the temperature.
Table 2.
Values of ( kJ/mol) of polar molecules adsorbed on PMMA particles as a function of the temperature.
| Polar free energy of Solvents adsorbed on PMMA | |||||||
| Temperature T(K) | CCl4 | CH2Cl2 | CHCl3 | Diethyl ether | THF | Ethyl acetate | Toluene |
| 303.15 | 10.765 | 18.520 | 16.079 | 15.039 | 19.851 | 16.029 | 13.204 |
| 313.15 | 10.254 | 16.940 | 14.930 | 13.956 | 18.940 | 14.694 | 12.212 |
| 323.15 | 10.294 | 16.034 | 15.101 | 14.437 | 18.822 | 14.037 | 11.443 |
| 328.15 | 10.808 | 15.902 | 15.552 | 15.362 | 19.155 | 14.498 | 11.677 |
| 333.15 | 11.434 | 17.105 | 16.068 | 16.544 | 19.846 | 15.192 | 12.190 |
| 338.15 | 9.631 | 14.792 | 13.161 | 13.037 | 17.712 | 13.243 | 10.501 |
| 343.15 | 10.629 | 15.055 | 14.098 | 13.685 | 18.247 | 13.912 | 11.245 |
| 348.15 | 11.414 | 15.178 | 15.013 | 14.115 | 18.667 | 14.430 | 11.989 |
| 353.15 | 11.721 | 14.911 | 14.782 | 13.980 | 18.464 | 14.285 | 11.936 |
| 363.15 | 10.816 | 13.717 | 12.961 | 12.873 | 17.352 | 13.499 | 10.680 |
| 373.15 | 10.821 | 12.279 | 9.454 | 11.020 | 16.585 | 12.891 | 10.111 |
| 378.15 | 11.206 | 13.019 | 10.825 | 10.962 | 17.252 | 13.325 | 10.604 |
| 383.15 | 11.772 | 14.521 | 12.968 | 12.321 | 18.652 | 14.659 | 12.181 |
| 388.15 | 12.487 | 10.832 | 12.193 | 10.936 | 16.403 | 11.700 | 9.624 |
| 393.15 | 10.950 | 12.707 | 11.533 | 11.870 | 15.718 | 10.781 | 8.900 |
| 398.15 | 11.029 | 12.170 | 10.930 | 11.397 | 15.638 | 12.783 | 10.237 |
| 403.15 | 11.465 | 11.776 | 10.791 | 11.399 | 15.942 | 13.202 | 10.136 |
| 408.15 | 11.830 | 11.631 | 10.794 | 11.360 | 16.258 | 13.460 | 10.355 |
| 413.15 | 11.758 | 11.135 | 10.040 | 10.942 | 16.106 | 13.146 | 10.197 |
| 423.15 | 11.929 | 11.458 | 10.113 | 11.090 | 17.047 | 13.434 | 10.433 |
| 433.15 | 13.579 | 13.574 | 11.582 | 12.569 | 19.030 | 15.576 | 12.048 |
| 443.15 | 12.136 | 10.220 | 8.929 | 9.901 | 15.065 | 13.114 | 10.016 |
| 453.15 | 12.047 | 9.388 | 7.939 | 9.244 | 14.165 | 12.620 | 9.682 |
| 463.15 | 12.299 | 8.917 | 7.617 | 9.151 | 13.848 | 12.645 | 9.287 |
| 473.15 | 11.924 | 7.776 | 6.642 | 8.470 | 12.938 | 11.811 | 8.280 |
Table 3.
Values of ( kJ/mol) of polar molecules adsorbed on the system PMMA/silica as a function of the temperature for a recovery fraction θ = 0.31.
Table 3.
Values of ( kJ/mol) of polar molecules adsorbed on the system PMMA/silica as a function of the temperature for a recovery fraction θ = 0.31.
| Polar free energy of Solvents adsorbed on PMMA/silica for | |||||||
| Temperature T(K) | CCl4 | CH2Cl2 | CHCl3 | Diethyl ether | THF | Ethyl acetate | Toluene |
| 303.15 | 6.698 | 20.777 | 15.865 | 16.603 | 20.647 | 14.300 | 14.620 |
| 313.15 | 6.055 | 19.604 | 14.885 | 15.493 | 18.449 | 12.803 | 13.694 |
| 323.15 | 5.932 | 18.973 | 14.390 | 14.799 | 17.228 | 12.216 | 13.726 |
| 328.15 | 5.704 | 18.169 | 13.853 | 14.282 | 16.141 | 11.486 | 13.530 |
| 333.15 | 6.253 | 18.442 | 14.047 | 14.603 | 16.362 | 11.672 | 14.064 |
| 338.15 | 6.519 | 18.608 | 14.218 | 13.973 | 16.216 | 11.637 | 14.235 |
| 343.15 | 6.605 | 19.382 | 14.562 | 13.340 | 15.835 | 11.926 | 14.005 |
| 348.15 | 6.730 | 18.336 | 12.890 | 12.001 | 14.743 | 10.618 | 13.470 |
| 353.15 | 7.264 | 18.364 | 13.507 | 12.453 | 14.008 | 10.503 | 13.290 |
| 363.15 | 6.952 | 18.115 | 13.879 | 11.315 | 12.626 | 9.424 | 13.254 |
| 373.15 | 6.584 | 17.019 | 12.869 | 9.437 | 10.630 | 7.416 | 12.282 |
| 378.15 | 6.844 | 17.200 | 13.082 | 8.936 | 10.315 | 7.107 | 12.492 |
| 383.15 | 6.714 | 16.865 | 12.933 | 8.706 | 9.823 | 6.584 | 12.327 |
| 388.15 | 7.111 | 17.412 | 13.320 | 9.047 | 10.139 | 6.829 | 12.940 |
| 393.15 | 7.605 | 18.243 | 13.964 | 9.984 | 10.797 | 7.413 | 13.547 |
| 398.15 | 8.913 | 19.648 | 15.146 | 11.268 | 12.232 | 8.909 | 14.775 |
| 403.15 | 11.229 | 21.423 | 17.010 | 11.072 | 12.576 | 8.802 | 16.772 |
| 408.15 | 10.654 | 19.980 | 15.734 | 11.281 | 11.759 | 7.117 | 15.461 |
| 413.15 | 9.879 | 18.756 | 14.746 | 8.496 | 9.743 | 7.482 | 12.252 |
| 423.15 | 8.281 | 17.133 | 13.433 | 6.152 | 6.444 | 7.003 | 12.634 |
| 433.15 | 8.092 | 16.598 | 13.170 | 6.621 | 7.368 | 7.619 | 13.247 |
| 443.15 | 12.550 | 21.255 | 17.518 | 8.654 | 8.665 | 11.397 | 16.279 |
| 453.15 | 10.367 | 18.117 | 14.996 | 10.447 | 8.862 | 11.040 | 14.673 |
| 463.15 | 8.354 | 15.912 | 12.490 | 10.442 | 1.559 | 9.852 | 11.573 |
| 473.15 | 7.697 | 12.895 | 10.572 | 9.325 | 0.595 | 8.197 | 8.969 |
Table 4.
Values of ( kJ/mol) of polar molecules adsorbed on the system PMMA/silica as a function of the temperature for a recovery fraction .
Table 4.
Values of ( kJ/mol) of polar molecules adsorbed on the system PMMA/silica as a function of the temperature for a recovery fraction .
| Polar free energy of Solvents adsorbed on PMMA/silica for | |||||||
| Temperature T(K) | CCl4 | CH2Cl2 | CHCl3 | Diethyl ether | THF | Ethyl acetate | Toluene |
| 303.15 | 7.773 | 27.605 | 23.019 | 21.816 | 25.479 | 20.114 | 17.258 |
| 313.15 | 7.219 | 25.780 | 21.588 | 20.382 | 24.106 | 18.354 | 15.812 |
| 323.15 | 7.726 | 24.330 | 20.823 | 19.402 | 23.091 | 16.800 | 15.052 |
| 328.15 | 7.983 | 24.125 | 20.151 | 19.158 | 22.906 | 16.021 | 14.985 |
| 333.15 | 8.322 | 24.143 | 20.132 | 18.742 | 22.962 | 15.604 | 15.539 |
| 338.15 | 8.421 | 24.970 | 20.394 | 18.368 | 23.217 | 16.923 | 15.672 |
| 343.15 | 7.970 | 23.919 | 20.547 | 18.073 | 21.957 | 16.634 | 14.982 |
| 348.15 | 8.213 | 23.804 | 20.465 | 17.719 | 21.787 | 16.379 | 15.316 |
| 353.15 | 8.480 | 23.752 | 20.339 | 17.763 | 21.690 | 16.315 | 15.442 |
| 363.15 | 7.946 | 22.566 | 19.802 | 16.558 | 19.764 | 14.651 | 13.973 |
| 373.15 | 7.400 | 21.338 | 18.643 | 15.259 | 18.336 | 12.867 | 13.259 |
| 378.15 | 7.177 | 21.114 | 18.505 | 14.790 | 17.504 | 12.511 | 12.966 |
| 383.15 | 8.088 | 21.872 | 19.412 | 15.216 | 18.162 | 13.086 | 13.592 |
| 388.15 | 9.738 | 23.872 | 20.633 | 17.249 | 20.357 | 14.790 | 15.021 |
| 393.15 | 7.975 | 22.237 | 18.677 | 16.071 | 19.312 | 12.425 | 13.092 |
| 398.15 | 7.579 | 21.453 | 18.849 | 14.284 | 17.365 | 9.449 | 10.478 |
| 403.15 | 8.266 | 21.428 | 19.153 | 13.895 | 17.001 | 11.597 | 13.409 |
| 408.15 | 8.378 | 20.973 | 18.729 | 13.601 | 16.463 | 11.654 | 13.423 |
| 413.15 | 8.176 | 20.481 | 18.274 | 13.057 | 15.661 | 11.281 | 13.111 |
| 423.15 | 8.263 | 20.132 | 18.597 | 12.392 | 14.863 | 11.137 | 12.497 |
| 433.15 | 9.011 | 21.753 | 19.964 | 13.615 | 16.245 | 12.413 | 13.101 |
| 443.15 | 8.413 | 19.670 | 18.315 | 11.083 | 13.556 | 10.859 | 12.321 |
| 453.15 | 8.373 | 19.017 | 17.896 | 10.411 | 12.693 | 10.113 | 12.024 |
| 463.15 | 11.973 | 22.320 | 21.465 | 13.227 | 15.364 | 12.954 | 15.267 |
| 473.15 | 8.067 | 17.745 | 16.842 | 8.413 | 10.414 | 7.945 | 10.717 |
Table 5.
Values of ( kJ/mol) of polar molecules adsorbed on the system PMMA/silica as a function of the temperature for a recovery fraction .
Table 5.
Values of ( kJ/mol) of polar molecules adsorbed on the system PMMA/silica as a function of the temperature for a recovery fraction .
| Polar free energy of Solvents adsorbed on PMMA/silica for | |||||||
| Temperature T(K) | CCl4 | CH2Cl2 | CHCl3 | Diethyl ether | THF | Ethyl acetate | Toluene |
| 303.15 | 13.797 | 36.031 | 32.260 | 30.623 | 38.590 | 21.479 | 26.098 |
| 313.15 | 13.567 | 31.827 | 28.141 | 27.132 | 33.996 | 20.360 | 23.011 |
| 323.15 | 12.594 | 27.832 | 24.874 | 23.581 | 28.575 | 18.376 | 20.293 |
| 328.15 | 12.366 | 26.052 | 22.043 | 21.509 | 26.236 | 17.682 | 17.852 |
| 333.15 | 12.572 | 25.107 | 21.512 | 20.173 | 24.834 | 17.746 | 17.145 |
| 338.15 | 11.175 | 23.004 | 19.957 | 18.075 | 22.883 | 17.019 | 15.721 |
| 343.15 | 7.827 | 22.303 | 19.418 | 17.043 | 22.426 | 16.908 | 15.316 |
| 348.15 | 8.731 | 23.918 | 21.243 | 17.929 | 23.166 | 17.644 | 16.472 |
| 353.15 | 9.682 | 24.387 | 21.614 | 18.557 | 23.527 | 17.500 | 17.214 |
| 363.15 | 11.294 | 24.438 | 22.228 | 19.161 | 23.921 | 16.971 | 17.656 |
| 373.15 | 11.607 | 23.218 | 21.724 | 18.422 | 22.395 | 15.990 | 16.949 |
| 378.15 | 11.599 | 23.350 | 21.692 | 18.202 | 22.230 | 16.213 | 17.043 |
| 383.15 | 12.922 | 25.912 | 23.757 | 19.957 | 24.657 | 18.321 | 18.608 |
| 388.15 | 14.514 | 28.129 | 25.061 | 21.098 | 23.208 | 20.016 | 17.299 |
| 393.15 | 11.630 | 25.838 | 23.488 | 18.299 | 21.089 | 17.162 | 14.154 |
| 398.15 | 9.405 | 22.887 | 20.451 | 15.594 | 19.094 | 15.325 | 12.647 |
| 403.15 | 7.366 | 18.964 | 17.081 | 12.048 | 17.162 | 14.041 | 13.030 |
| 408.15 | 7.781 | 18.878 | 17.221 | 12.010 | 16.629 | 13.365 | 13.403 |
| 413.15 | 8.249 | 19.192 | 17.691 | 12.004 | 16.478 | 13.009 | 13.687 |
| 423.15 | 9.622 | 19.875 | 18.807 | 12.975 | 17.161 | 13.139 | 14.195 |
| 433.15 | 8.548 | 17.697 | 16.005 | 9.842 | 15.043 | 14.366 | 12.628 |
| 443.15 | 5.562 | 14.849 | 14.031 | 7.101 | 11.750 | 12.211 | 9.983 |
| 453.15 | 6.883 | 15.433 | 14.892 | 7.366 | 11.880 | 12.355 | 11.138 |
| 463.15 | 8.179 | 16.389 | 16.175 | 8.339 | 12.549 | 12.883 | 11.825 |
| 473.15 | 8.812 | 16.525 | 16.477 | 8.298 | 12.238 | 12.504 | 11.793 |
Table 6.
Values of the enthalpic acid base parameters , , / and , and the entropic acid base parameters , , / and of PMMA as a function of the temperature.
Table 6.
Values of the enthalpic acid base parameters , , / and , and the entropic acid base parameters , , / and of PMMA as a function of the temperature.
| T(K) | ||||||||
|---|---|---|---|---|---|---|---|---|
| 303.15 | 0.478 | 3.881 | 4.358 | 8.120 | 0.90 | 18.20 | 19.10 | 20.15 |
| 313.15 | 0.317 | 2.523 | 2.840 | 7.953 | 0.56 | 7.52 | 8.08 | 13.40 |
| 323.15 | 0.090 | 0.664 | 0.754 | 7.413 | -0.62 | -3.15 | -3.77 | 5.12 |
| 328.15 | -0.122 | -0.522 | -0.644 | 4.293 | -1.00 | -4.91 | -5.90 | 4.93 |
| 333.15 | -0.153 | -0.636 | -0.789 | 4.160 | -1.38 | -6.06 | -7.44 | 4.41 |
| 338.15 | -0.144 | -0.658 | -0.802 | 4.568 | -0.88 | -7.59 | -8.47 | 8.63 |
| 343.15 | 0.152 | -0.695 | -0.543 | -4.565 | -0.59 | -8.31 | -8.91 | 14.04 |
| 348.15 | 0.170 | -0.529 | -0.358 | -3.103 | -0.16 | -1.87 | -2.03 | 11.61 |
| 353.15 | 0.278 | 1.826 | 2.105 | 6.560 | 0.20 | 2.78 | 2.98 | 14.04 |
| 363.15 | 0.536 | 3.122 | 3.658 | 5.828 | 0.92 | 15.67 | 16.59 | 17.10 |
| 373.15 | 0.433 | 3.955 | 4.388 | 9.135 | 0.90 | 7.40 | 8.30 | 8.24 |
| 378.15 | 0.398 | 3.739 | 4.138 | 9.385 | -1.99 | -8.98 | -10.97 | 4.52 |
| 383.15 | 0.186 | 1.527 | 1.713 | 8.217 | -0.66 | -6.52 | -7.19 | 9.84 |
| 388.15 | 0.521 | 5.841 | 6.362 | 11.213 | 0.91 | 12.80 | 13.71 | 14.05 |
| 393.15 | 0.274 | 1.750 | 2.024 | 6.389 | 0.29 | 2.47 | 2.76 | 8.42 |
| 398.15 | 0.266 | 0.560 | 0.826 | 2.106 | 0.27 | -1.89 | -1.62 | -6.93 |
| 403.15 | 0.220 | -0.630 | -0.410 | -2.864 | -0.45 | -1.32 | -1.77 | 2.92 |
| 408.15 | 0.174 | 0.800 | 0.975 | 4.595 | 0.22 | -0.66 | -0.44 | -2.95 |
| 413.15 | 0.433 | 3.358 | 3.791 | 7.755 | 0.90 | 6.21 | 7.10 | 6.91 |
| 423.15 | 0.488 | 2.131 | 2.619 | 4.366 | -4.56 | -14.72 | -19.27 | 3.23 |
| 433.15 | 0.543 | 0.904 | 1.447 | 1.665 | 0.66 | -0.40 | 0.26 | -0.61 |
| 443.15 | 1.755 | 7.262 | 9.016 | 4.138 | 5.88 | 19.88 | 25.76 | 3.38 |
| 453.15 | 0.111 | 1.044 | 1.155 | 9.419 | 0.60 | -1.83 | -1.22 | -3.04 |
| 463.15 | 0.107 | 1.047 | 1.154 | 9.766 | 1.00 | 1.60 | 2.61 | 1.60 |
| 473.15 | 0.100 | 0.980 | 1.080 | 9.832 | 1.40 | 6.23 | 7.63 | 4.44 |
Table 7.
Values of the enthalpic acid base parameters , , / and , and the entropic acid base parameters , , / and of PMMA/silica for as a function of the temperature.
Table 7.
Values of the enthalpic acid base parameters , , / and , and the entropic acid base parameters , , / and of PMMA/silica for as a function of the temperature.
| T(K) | ||||||||
|---|---|---|---|---|---|---|---|---|
| 303.15 | 0.884 | 3.819 | 4.704 | 4.318 | 2.11 | 10.71 | 12.82 | 5.06 |
| 313.15 | 0.704 | 2.319 | 3.023 | 3.291 | 1.53 | 5.84 | 7.37 | 3.81 |
| 323.15 | 0.519 | 0.770 | 1.288 | 1.484 | 0.95 | 0.97 | 1.91 | 1.02 |
| 328.15 | 0.424 | -0.023 | 0.400 | -0.055 | 0.65 | -0.52 | 0.14 | -0.79 |
| 333.15 | 0.327 | -0.828 | -0.501 | -2.532 | 0.36 | -0.73 | -0.37 | -2.02 |
| 338.15 | 0.789 | 0.508 | 1.298 | 0.644 | 1.97 | -0.94 | 1.03 | -0.48 |
| 343.15 | 0.781 | 0.387 | 1.168 | 0.495 | 1.95 | -1.19 | 0.76 | -0.61 |
| 348.15 | 0.773 | 0.264 | 1.037 | 0.341 | 1.92 | -1.20 | 0.72 | -0.63 |
| 353.15 | 0.764 | 0.139 | 0.903 | 0.181 | 1.90 | -1.34 | 0.56 | -0.71 |
| 363.15 | 0.747 | -0.117 | 0.630 | -0.157 | 1.85 | -1.67 | 0.19 | -0.90 |
| 373.15 | 2.013 | 2.013 | 4.026 | 1.000 | 4.85 | 15.21 | 20.05 | 3.14 |
| 378.15 | 0.425 | 0.594 | 1.020 | 1.397 | 0.84 | -0.56 | 0.28 | -0.67 |
| 383.15 | 0.781 | 0.387 | 1.168 | 0.495 | 1.95 | -0.73 | 1.21 | -0.38 |
| 388.15 | -0.530 | -1.038 | -1.568 | 1.959 | -0.57 | -2.05 | -2.62 | 3.61 |
| 393.15 | -0.717 | -1.493 | -2.210 | 2.083 | -1.54 | -3.12 | -4.66 | 2.03 |
| 398.15 | -0.917 | -2.588 | -3.505 | 2.821 | -2.39 | -3.21 | -5.60 | 1.34 |
| 403.15 | 0.584 | 7.647 | 8.231 | 13.084 | -3.52 | 12.57 | 9.05 | -3.58 |
| 408.15 | 1.006 | 11.211 | 12.216 | 11.149 | 2.39 | 18.37 | 20.76 | 7.67 |
| 413.15 | 2.013 | 14.818 | 16.831 | 7.362 | 4.85 | 21.18 | 26.03 | 4.37 |
| 423.15 | -2.076 | 9.053 | 6.977 | -4.361 | -3.51 | 13.30 | 9.79 | -3.79 |
| 433.15 | -0.729 | -2.522 | -3.250 | 3.460 | -1.26 | -1.61 | -2.87 | 1.27 |
| 443.15 | 0.550 | -1.493 | -0.944 | -2.718 | 0.99 | -1.72 | -0.73 | -1.74 |
| 453.15 | 4.266 | 9.254 | 13.520 | 2.169 | 10.38 | -1.11 | 9.27 | -0.11 |
| 463.15 | 1.213 | 15.550 | 16.763 | 12.821 | 3.76 | 10.71 | 14.47 | 2.84 |
| 473.15 | -1.907 | 14.815 | 12.908 | -7.768 | -2.85 | 10.46 | 7.61 | -3.67 |
Table 8.
Values of the enthalpic acid base , , / and , and the entropic acid base parameters , , / and of PMMA/silica for as a function of the temperature.
Table 8.
Values of the enthalpic acid base , , / and , and the entropic acid base parameters , , / and of PMMA/silica for as a function of the temperature.
| T(K) | ||||||||
|---|---|---|---|---|---|---|---|---|
| 303.15 | 0.736 | 5.459 | 6.195 | 7.421 | 1.73 | 14.24 | 15.97 | 8.23 |
| 313.15 | 0.621 | 3.385 | 4.006 | 5.448 | 1.36 | 7.51 | 8.86 | 5.52 |
| 323.15 | 0.503 | 1.243 | 1.747 | 2.471 | 0.99 | 0.77 | 1.76 | 0.78 |
| 328.15 | 0.443 | 0.147 | 0.590 | 0.333 | 0.80 | -1.40 | -0.60 | -1.74 |
| 333.15 | 0.381 | -0.966 | -0.584 | -2.531 | 0.62 | -1.92 | -1.31 | -3.12 |
| 338.15 | 0.579 | -0.169 | 0.410 | -0.292 | 1.07 | -2.54 | -1.47 | -2.37 |
| 343.15 | 0.605 | 0.520 | 1.125 | 0.860 | 1.15 | -1.89 | -0.74 | -1.64 |
| 348.15 | 0.632 | 1.220 | 1.851 | 1.931 | 1.23 | -0.28 | 0.94 | -0.23 |
| 353.15 | 0.659 | 1.929 | 2.588 | 2.929 | 1.30 | 1.74 | 3.04 | 1.33 |
| 363.15 | 0.714 | 3.379 | 4.093 | 4.732 | 1.46 | 5.79 | 7.24 | 3.97 |
| 373.15 | 0.893 | 3.854 | 4.747 | 4.316 | 1.91 | 0.69 | 2.60 | 0.36 |
| 378.15 | 0.315 | -1.651 | -1.336 | -5.240 | 0.30 | -0.70 | -0.40 | -2.34 |
| 383.15 | 0.605 | 0.520 | 1.125 | 0.860 | 1.15 | 2.31 | 3.46 | 2.01 |
| 388.15 | 0.778 | 22.143 | 22.921 | 28.465 | -2.56 | 13.14 | 10.57 | -5.12 |
| 393.15 | 0.962 | 14.877 | 15.839 | 15.464 | 1.76 | 12.13 | 13.89 | 6.90 |
| 398.15 | 2.200 | 7.518 | 9.718 | 3.417 | 4.89 | 11.61 | 16.50 | 2.38 |
| 403.15 | 0.595 | -1.252 | -0.657 | -2.105 | 1.18 | -2.16 | -0.99 | -1.84 |
| 408.15 | 0.743 | 1.285 | 2.028 | 1.730 | 1.54 | 0.41 | 1.95 | 0.27 |
| 413.15 | 0.893 | 3.854 | 4.747 | 4.316 | 1.91 | 6.66 | 8.57 | 3.50 |
| 423.15 | -1.125 | -1.531 | -2.656 | 1.361 | -1.46 | -2.53 | -3.99 | 1.74 |
| 433.15 | 0.602 | 0.223 | 0.824 | 0.370 | 1.38 | -1.26 | 0.12 | -0.91 |
| 443.15 | 2.369 | 6.543 | 8.912 | 2.762 | 5.41 | 10.87 | 16.28 | 2.01 |
| 453.15 | -1.704 | -4.480 | -6.185 | 2.629 | -2.26 | -4.54 | -6.80 | 2.01 |
| 463.15 | 0.679 | 2.897 | 3.577 | 4.264 | 1.26 | 2.74 | 4.00 | 2.18 |
| 473.15 | 4.310 | 23.213 | 27.523 | 5.386 | 2.06 | 2.73 | 4.80 | 1.33 |
Table 9.
Values of the enthalpic acid base parameters , , / and , and the entropic acid base parameters , , / and of PMMA/silica for as a function of the temperature.
Table 9.
Values of the enthalpic acid base parameters , , / and , and the entropic acid base parameters , , / and of PMMA/silica for as a function of the temperature.
| T(K) | ||||||||
|---|---|---|---|---|---|---|---|---|
| 303.15 | 2.135 | 6.006 | 8.141 | 2.813 | 5.06 | 14.99 | 20.06 | 2.96 |
| 313.15 | 1.805 | 5.719 | 7.524 | 3.169 | 4.61 | 14.06 | 18.67 | 3.05 |
| 323.15 | 1.661 | 5.423 | 7.084 | 3.266 | 4.16 | 13.13 | 17.29 | 3.16 |
| 328.15 | 1.587 | 5.272 | 6.859 | 3.322 | 3.93 | 12.67 | 16.60 | 3.22 |
| 333.15 | 1.512 | 5.118 | 6.630 | 3.385 | 3.70 | 12.20 | 15.90 | 3.30 |
| 338.15 | 2.177 | 6.179 | 8.357 | 2.838 | -2.30 | 15.92 | 13.62 | -6.92 |
| 343.15 | 0.385 | 3.423 | 3.808 | 8.884 | -3.19 | 12.37 | 9.19 | -3.88 |
| 348.15 | 0.452 | 0.627 | 1.078 | 1.388 | -2.59 | 4.01 | 1.42 | -1.55 |
| 353.15 | 0.510 | -1.015 | -0.506 | -1.992 | 0.51 | 4.36 | 4.87 | 8.54 |
| 363.15 | 0.611 | -1.645 | -1.035 | -2.695 | 0.75 | 13.22 | 13.96 | 17.68 |
| 373.15 | 0.385 | -0.996 | -0.611 | -2.585 | 0.45 | 6.65 | 7.10 | 14.73 |
| 378.15 | -0.439 | -0.731 | -1.169 | 1.666 | -2.86 | 11.09 | 8.23 | -3.88 |
| 383.15 | -0.735 | 3.423 | 2.688 | -4.659 | -2.31 | 9.21 | 6.90 | -3.99 |
| 388.15 | 1.235 | 21.076 | 22.312 | 17.060 | 2.59 | 19.86 | 22.46 | 7.66 |
| 393.15 | 1.188 | 18.884 | 20.072 | 15.892 | 2.47 | 21.30 | 23.78 | 8.61 |
| 398.15 | 1.141 | 13.057 | 14.197 | 11.448 | 2.35 | 18.65 | 21.01 | 7.93 |
| 403.15 | 0.887 | -1.004 | -0.117 | -1.132 | 1.64 | -1.93 | -0.29 | -1.17 |
| 408.15 | 0.558 | -0.941 | -0.383 | -1.687 | 0.83 | -1.86 | -1.03 | -2.25 |
| 413.15 | 0.224 | -0.452 | -0.228 | -2.017 | 0.73 | -1.81 | -1.08 | -2.49 |
| 423.15 | 0.786 | 2.985 | 3.771 | 3.798 | 1.57 | 4.81 | 6.38 | 3.08 |
| 433.15 | 1.060 | 9.697 | 10.756 | 9.149 | 2.21 | 13.41 | 15.62 | 6.08 |
| 443.15 | 1.340 | 13.578 | 14.918 | 10.131 | 2.85 | 15.73 | 18.58 | 5.53 |
| 453.15 | -1.978 | 6.298 | 4.320 | -3.184 | -1.53 | -1.92 | -3.46 | 1.26 |
| 463.15 | 0.188 | -0.611 | -0.422 | -3.242 | 0.23 | -0.74 | -0.51 | -3.25 |
| 473.15 | 0.571 | 1.133 | 1.703 | 1.985 | 1.04 | -0.74 | 0.31 | -0.71 |
Table 10.
Values of the enthalpic acid base parameters , , / and , and the entropic acid base parameters , , / and of silica.
Table 10.
Values of the enthalpic acid base parameters , , / and , and the entropic acid base parameters , , / and of silica.
| Solid surface | ||||||||
|---|---|---|---|---|---|---|---|---|
| Silica | 0.807 | 0.412 | 1.219 | 0.510 | 1.39 | -1.32 | 0.07 | -0.95 |
Table 11.
Values of the dispersion factor A of the various PMMA/silica as a function of the temperature. The maxima of A are represented in bold.
Table 11.
Values of the dispersion factor A of the various PMMA/silica as a function of the temperature. The maxima of A are represented in bold.
| T(K) | PMMA | ||||
|---|---|---|---|---|---|
| 303.15 | 378.20 | 395.51 | 354.74 | 337.33 | 297.06 |
| 313.15 | 367.18 | 371.55 | 340.26 | 319.84 | 276.45 |
| 323.15 | 356.15 | 353.99 | 319.89 | 299.94 | 268.35 |
| 328.15 | 350.64 | 348.49 | 327.15 | 308.07 | 274.64 |
| 333.15 | 345.13 | 353.01 | 340 | 322.86 | 296.16 |
| 338.15 | 339.62 | 357.02 | 330.02 | 310.12 | 272.62 |
| 343.15 | 334.11 | 361.76 | 317.89 | 297.17 | 257.28 |
| 348.15 | 328.60 | 341.88 | 304.58 | 284.75 | 245.91 |
| 353.15 | 323.09 | 322.53 | 289.18 | 272.25 | 237.62 |
| 363.15 | 312.07 | 296.06 | 266.8 | 250.08 | 227 |
| 373.15 | 301.04 | 271.64 | 237.43 | 219.87 | 231.39 |
| 378.15 | 295.53 | 266.5 | 229.4 | 215.81 | 262.31 |
| 383.15 | 290.02 | 263.87 | 248.84 | 267.22 | 307.3 |
| 388.15 | 284.51 | 271.09 | 302.26 | 317.52 | 252.09 |
| 393.15 | 279.00 | 290.69 | 274.76 | 296.44 | 221.75 |
| 398.15 | 273.49 | 311.45 | 256.56 | 272.99 | 209.51 |
| 403.15 | 267.98 | 291.54 | 242.31 | 238.62 | 199.78 |
| 408.15 | 262.47 | 268.3 | 222.02 | 215.57 | 196.16 |
| 413.15 | 256.96 | 247.67 | 202.81 | 198.03 | 193.27 |
| 423.15 | 245.93 | 233.94 | 196.97 | 194.06 | 215.82 |
| 433.15 | 234.91 | 238.92 | 231.59 | 226.19 | 258.37 |
| 443.15 | 223.89 | 241.02 | 192.79 | 180.85 | 195.77 |
| 453.15 | 212.87 | 214.66 | 175.48 | 156.95 | 166.58 |
| 463.15 | 201.85 | 206.05 | 168.88 | 150.69 | 158.53 |
| 473.15 | 190.82 | 180.38 | 146.81 | 131.75 | 136.51 |
Disclaimer/Publisher’s Note: The statements, opinions and data contained in all publications are solely those of the individual author(s) and contributor(s) and not of MDPI and/or the editor(s). MDPI and/or the editor(s) disclaim responsibility for any injury to people or property resulting from any ideas, methods, instructions or products referred to in the content. |
© 2024 by the authors. Licensee MDPI, Basel, Switzerland. This article is an open access article distributed under the terms and conditions of the Creative Commons Attribution (CC BY) license (http://creativecommons.org/licenses/by/4.0/).
Copyright: This open access article is published under a Creative Commons CC BY 4.0 license, which permit the free download, distribution, and reuse, provided that the author and preprint are cited in any reuse.


