
Submitted:
04 March 2024
Posted:
05 March 2024
You are already at the latest version
Abstract
A key step in the study of tree pathology is the identification of appropriate method for inoculating pathogens of diseases in branch and trunk. Pathogens of diseases in branch and trunk are commonly inoculated through punching, burning, and toothpick inoculation. However, there is a lack of comparative analysis of the inoculation outcomes of these three methods. In this work, Six‐year‐old P. alba var. pyramidalis were inoculated with V. sordida, using punching, burning, and toothpick techniques, respectively, to investigate the differences in the effectiveness of these inoculation methods. Results reveal that the incidence rate was 93.55% in the toothpick inoculation group, significantly higher than 80.65% in the burning inoculation group (p = 0.007), while punching inoculation exhibited significant pathological responses in the early stages, with spontaneous healing in the later stage. Addi-tionally, toothpick inoculation was more efficient in inducing Valsa canker when inoculating the pathogen at the bottom of the tree, with lower intra‐ and inter‐row spacing (stand density) providing better outcomes than higher intra‐ and inter‐row spacing. The results of this study demonstrate that toothpick inoculation is an optimal option for studying the artificial inoculation of V. sordida in six‐year‐old P. alba var. pyramidalis, providing technical support for research on poplar diseases and offering a theoretical basis for the inoculation of other diseases in branch and trunk.
Keywords:
punching inoculation
; burning inoculation
; toothpick inoculation
; inoculation position
1. Introduction
Plant pathogen inoculation plays a crucial role in plant disease research. Early inoculation experiments aim primarily at determining the pathogenicity of a given pathogen and establishing its role in causing disease. In later stages, such experiments have been widely employed in the research of pathology, such as the infection process, pathogenicity, genetic differentiation, differentiation and genetics of plant resistance to pathogens, and resistance breeding. There is a diverse range of plant pathogens, each requiring specific inoculation methods, with a greater extent of disease being the criterion for choosing the optimal inoculation method [1]. The extent of disease in plant populations can be quantified by the incidence rate, degree of disease severity, and the disease severity index. Particularly, the disease severity index provides a comprehensive assessment of the incidence rate and the degree of disease severity index [2]. Previous research has indicated that the choice of suitable inoculation method, timing, and site has a significant impact on the inoculation outcomes [3,4].
Diseases in branch and trunk have been a research hotspot in tree pathology, and a range of distinctive techniques have been developed for pathogen inoculation during the study process. For instance, Li et al. (2019) inoculated Botryosphaeria dothidea isolate CZA and V. sordida isolate CZC with the branches of Populus beijingensis clones via punching to study the molecular mechanisms of plant responses to pathogen infection [5]. The study results showed significant up-regulation of the majority of disease-resistant genes in poplar. In the study by Bessho et al. (2004), V. ceratosperma was inoculated with isolated mature branches and twigs of apple trees using the burning technique, and branches exhibited higher resistance to the pathogen compared to twigs, suggesting a positive correlation between branch resistance and tree age [6]. By inoculating Dothiorella gregaria (the once used anamorph synonym of B. dothidea) with two-year-old P. simonii Carr × nigra var. italica using intact skin, needles, wounded skin, and burning techniques, Yang et al. (1985) discovered that burning inoculation was associated with a higher incidence of diseases in branch and trunk and faster lesion expansion [7]. Ghimire et al. (2019), using the toothpick and trunk wounding techniques to inoculate Diaporthe spp. with soybeans, noted that the length of lesions induced by toothpick inoculation and disease severity index significantly surpassed those in the trunk wounding inoculation group [8]. Collectively, punching, burning, and toothpick inoculation are common techniques for the inoculation of diseases in branch and trunk. While the results of many studies using one-year-old seedlings or isolated trunks for inoculation may fail to represent the disease resistance of perennial plants.
Populus alba var. pyramidalis is an economically important tree and serves as a model plant in tree biology research [9]. It is widely distributed in the deserts and arid regions of northwest China. P. alba var. pyramidalis have been extensively used for timber production and ecological conservation, exhibiting significant economic value, which are attributed to their characteristics of fast growth, high biomass yield, and remarkable tolerance to stressors such as drought and salt [10,11]. Therefore, P. alba var. pyramidalis was selected as an object of inoculation in our experiment. V. sordida is a significant plant pathogen that can cause Cytospora canker (also known as Valsa canker) involving the branches and trunks of trees. This pathogen is widely distributed in the northern regions of China [12,13], posing a severe threat to poplars. In fast-growing poplar plantations, the incidence of Valsa canker ranges from 20% to 40%, reaching over 90% in some cases [14,15,16], causing substantial economic losses to commercial forestry. Against this background, V. sordida was investigated in this experiment.
Punching and burning techniques are most frequently used in studies on the pathogenicity and inoculation of V. sordida [5,17]. In contrast, the aforementioned toothpick inoculation has not been utilized in inoculation experiments with V. sordida, and there is a lack of systematic comparison of these three inoculation methods for P. alba var. pyramidalis. In this study, punching, burning, and toothpick inoculation were employed to wound six-year-old P. alba var. pyramidalis to compare the inoculation outcomes of these methods by analyzing the incidence of Valsa canker and disease extent caused by V. sordida infection. Additionally, this study also elaborated the effects of intra- and inter-row spacing (stand density), inoculation position, and plant age, factors closely associated with the occurrence and development of diseases, on the inoculation outcomes, aiming to identify the optimal inoculation method and determine the ideal inoculation position as well as intra- and inter-row spacing when using this optimal method. The present study is expected to provide technical support for artificial inoculation research on poplar pathogens and serve as a theoretical basis for the inoculation of other diseases in branch and trunk.
2. Materials and Methods
2.1. Plants and Fungi
The objects of inoculation were nine six-year-old P. alba var. pyramidalis with a diameter at breast height of 18.18 ± 1.13 cm, exhibiting robust growth and free from plant diseases and insect pests, with the intra- and inter-row spacing of 0.8 m × 0.8 m in six plants and 1.6 m × 1.6 m in the remaining trees, respectively. Additionally, 45 two-year-old P. alba var. pyramidalis with a ground diameter of 13.59 ± 1.31 mm, robust growth and absence of diseases and pests, were included as supplementary experimental materials. The six-year-old P. alba var. pyramidalis were cultivated at the experimental site of the Plant Physiology Laboratory, Institute of Ecological Conservation and Restoration, Chinese Academy of Forestry. The two-year-old P. alba var. pyramidalis cuttings were cultivated in plastic pots containing a mixed substrate (peat soil: perlite = 6:1) and grown at the same experimental site. In this study, the V. sordida strain CZC and the B. dothidea strain CZA were used as the primary and the supplementary fungal materials, respectively. After activation, these strains were cultured on potato dextrose agar (PDA) at pH 6.0 and incubated in dark at 28 °C for 7 days.
The six- and two-year-old P. alba var. pyramidalis were cultivated in the same experimental environment, and the fungi were activated from the identical strains. Therefore, the disease resistance of poplars and the pathogenicity of the fungi remained consistent throughout the study.
2.2. Punching, Burning, and Toothpick Inoculation Experiments on Six-Year-Old P. alba var. Pyramidalis
2.2.1. Punching Inoculation
One day before inoculation, the poplar trunk was cleaned with water, and the bark surface was sterilized with 75% alcohol. The trunk was air-dried before the inoculation experiment. The trunk was divided into the top and the bottom, with the upper located 80 cm above the ground and the lower 10 cm above the ground, leaving a 10 cm blank in the middle. Using a sterilized 5-mm puncher, circle-shaped holes were made in the top and the bottom of the trunk with a spacing of approximately 5 cm between holes. Each area had 15 inoculation holes. Three poplars were inoculated in total, including two with intra- and inter-row spacing of 0.8 m × 0.8 m and one with intra- and inter-row spacing of 1.6 m × 1.6 m. After punching, the periderm and phloem were removed for the inoculation of equally sized fungal clumps. The inoculation sites were covered with plastic wrap for moisture retention and prevention of contamination. Simultaneously, holes were made 5 cm beside the inoculation sites of V. sordida to inoculate agar blocks as controls, with the top and the bottom containing 5 holes, respectively. The plastic wrap was removed at 1 week post-inoculation. The lesion development at the inoculation sites was observed at days 10, 20, 30, 40, and 50 post-inoculation. Disease markers were measured to analyze the impact of different inoculation sites as well as intra- and inter-row spacing on the development of V. sordida infection.
2.2.2. Burning Inoculation
Similarly, the inoculation experiment was started after cleaning of poplar trunk with water, sterilization of the bark surface with 75% alcohol, and air-drying of the trunk one day before inoculation. Using a heated 5 mm iron nail, the trunk was scorched until the bark turned brown. After cooling, the trunk was immediately inoculated with V. sordida clumps. Fifteen burnt sites were inoculated on the top and the bottom of the trunk, while additional five agar blocks were inoculated respectively in the top and the bottom as controls. The inoculation sites were covered with plastic wrap for moisture retention. Three poplars were inoculated in total, including two with intra- and inter-row spacing of 0.8 m × 0.8 m and one with intra- and inter-row spacing of 1.6 m × 1.6 m. At 1 week post-inoculation, the plastic wrap was removed. Lesion development at the inoculation sites was observed at days 10, 20, 30, 40, and 50 post-inoculation. Disease markers were measured to analyze the impact of different inoculation sites and intra- and inter-row spacing on the development of V. sordida infection.
2.2.3. Toothpick Inoculation
Similarly, the inoculation experiment was initiated after cleaning of poplar trunk with water, sterilization of the bark surface with 75% alcohol, and air-drying of the trunk one day before inoculation. A total of 15–20 sterilized toothpicks (length: 6.5 cm; diameter: 0.2 cm; Guanghui, Harbin, China) were arranged in parallel on a 9 cm PDA solid plate. CZC was inoculated onto the toothpicks, and the plate was incubated in dark at 25 °C for 7 days until the toothpicks were completely covered by fungal mycelia. Before inoculation, holes were drilled 0.8–1.0 cm vertically into the trunk surface using a 0.15 cm drill bit. Following that, the fungus-inoculated toothpicks were quickly inserted into the holes. Fifteen fungus-inoculated toothpicks were placed in the top and the bottom of the trunk, respectively, while additional five sterile toothpicks were inserted as controls in the top and the bottom, respectively. The inoculation sites were covered with plastic wrap for moisture retention. Three poplars were inoculated in total, including two with intra- and inter-row spacing of 0.8 m × 0.8 m and one with intra- and inter-row spacing of 1.6 m × 1.6 m. At 1 week post-inoculation, the plastic wrap was removed. The lesion development at the inoculation sites was observed at days 10, 20, 30, 40, and 50 post-inoculation. Disease markers were measured to analyze the impact of different inoculation sites and intra- and inter-row spacing on the development of V. sordida infection.
2.3. Burning Inoculation Experiment on Two-Year-Old P. alba var. Pyramidalis
The burning inoculation was employed to inoculate 15 two-year-old P. alba var. pyramidalis with the pathogenic fungi CZA and CZC, each containing 8 inoculation sites, with agar blocks serving as controls. The development of lesions was observed, and disease markers were measured at 50 days post-inoculation. The statistical analysis and data processing for these marker measurements were consistent with those applied in the inoculation experiment on the six-year-old P. alba var. pyramidalis.
2.4. Disease Markers and Statistical Methods
2.4.1. Statistical Analysis and Calculation of Disease Incidence, Disease Severity Index, and Lesion Area at Each Inoculation Site
In the experiment, each P. alba var. pyramidalis with spacings of 0.8 m × 0.8 m and 1.6 m × 1.6 m was inoculated at 30 sites, with 15 sites on both the top and the bottom of the tree. Each inoculation method was applied to three trees, totaling 90 inoculation sites. Disease incidence was calculated at 10, 20, 30, 40, and 50 days post-inoculation. The formula for calculating disease incidence at each inoculation site under each method is as follows (1) [2]. Preliminary results from early inoculation experiments revealed that canker lesions formed by V. sordida on the trunk of P. alba var. pyramidalis showed elliptical or nearly elliptical appearances. Therefore, the size of the lesion area was estimated using the formula for the area of an ellipse as follows (2) [18]. Additionally, due to variations in the necrotic area at control inoculation sites in the punching, burning, and toothpick inoculation experiments (0.60 ± 0.074 cm2, 0.85 ± 0.14 cm2, and 0.31 ± 0.088 cm2, respectively), the relative area of lesion was adopted as a quantity standard, which is calculated as follows (3). The symptoms of lesions were taken into consideration to determine the presence or absence of disease, and the disease severity index was calculated using the formula (4) [2]:
Disease incidence was calculated using Formula (1):
Incidence (P, %) = 100 × Number of wounded inoculation sites / Total inoculation sites
The area of a lesion was calculated using Formula (2):
where “a” represents the length of the lesion; “b” stands for the width of the lesion.
Lesion area (S, cm2) = π × a × b/4
The relative area of each lesion was calculated using Formula (3):
Relative area of lesion (Srelative area) = Lesion area in the treatment group/Area of inoculation sites in the control group
The criteria for disease severity index grading are presented as follows:

Table 1.
Disease Severity Index grading1.
| Grade | Lesion area in the treatment group/Area of inoculation sites in the control group (Srelative area) |
|---|---|
| 0 | No infection in the treatment group (Srelative area ≤ 1.25) |
| 1 | The lesion area in the treatment group is 1.25 to 1.75 times that of the control inoculation sites (1.25 < Srelative area ≤ 1.75) |
| 2 | The lesion area in the treatment group is 1.75 to 2.25 times that of control inoculation sites (1.75 < Srelative area ≤ 2.25) |
| 3 | The lesion area in the treatment group is 2.25 to 2.75 times that of the control inoculation sites (2.25 < Srelative area ≤ 2.75) |
| 4 | The lesion area in the treatment group is over 2.75 times that of the control inoculation sites (Srelative area> 2.75) |
The disease severity index was calculated using Formula (4):
Disease severity index (DI) = 100 × ∑ (Number of lesions at each grade × Specific grade value)/(Total number of inoculation sites × Highest grade value)
2.4.2. Observation and Measurement of Lesion Morphology and Spore Microstructure at Inoculation Sites
At 10, 20, 30, 40, and 50 days post-inoculation, photographs were taken using a Canon 200D camera to document the lesion status and the quantity of pycnidia at each inoculation site. As black pycnidia grew on the lesions during inoculation, part of the structure was carefully collected using an inoculation needle and placed in a rice-paper plant, which was vertically dissected with a scalpel. Subsequently, the pycnidial structure was observed and photographed under an optical microscope (OLYMPUS BX51TRF).
2.4.3. Observation and Statistical Analysis of Wounded Area of Xylem at Inoculation Sites
At 50 days post-inoculation, the rotten layer of the affected bark was removed using a scalpel to expose the xylem (white). Photographs were taken using a camera to observe the transversal section of the lesion. The length of both longitudinal and transversal extensions of each lesion was measured with a ruler. Subsequently, a vertical incision was made perpendicular to the lesion surface, and photographs were taken to observe the longitudinal section of the lesion. The depth of the lesion-induced wound to the xylem was measured using a ruler. As the shape of the wounded xylem resembled an ellipse, the calculation for the wounded area of xylem followed the ellipse area formula [see Formula (2) in Section 1.3.1].
2.5. Data Processing and Statistical Analysis
Chi-square tests were conducted using IBM SPSS Statistics 22. Mean of the relative area of lesions was calculated and subjected to analysis of variance (ANOVA) using, with corresponding graphs plotted. Differences between the treatment group and the control group were assessed using independent sample t-tests, with a significance level set at p < 0.05 and a high significance level at p < 0.01. All data were presented as “mean ± standard deviation (m ± sd)” or standard error of mean (SEM).
3. Results and Analysis
3.1. Comparative Analysis of Symptoms of Lesions at Inoculation Sites Wounded by Punching, Burning, and Toothpick Inoculation Techniques
At 10 days of punching inoculation, watery changes were observed at the sites inoculated with V. sordida, and the surrounding periderm turned brown (Figure 1B). At days 20 to 30 post-inoculation, circle-shaped necrosis exhibiting slow expansion was observed on the periderm, while gradual callus formation was visible in the xylem around the wounded holes (Figure 1C). At 40 days post-inoculation, except for the longitudinal cracks at the center of the wound, the 5 mm inoculation hole was almost entirely filled with callus (Figure 1D). At 50 days post-inoculation, the anatomical structure of the lesions showed the formation of secondary vascular bundles (xylem and phloem), creating a ring of brown necrotic tissue at the inoculation hole, penetrating deep into the original xylem surface. In contrast, signs of necrosis were observed in the controls. Additionally, irregularly distributed brown tissue was visible in the newly formed phloem and xylem, with uneven textures compared to the white, well-organized callus formed in the controls. These results indicate that punching inoculation can induce symptoms of lesions in six-year-old P. alba var. pyramidalis in the early stages of V. sordida inoculation. With the development of disease resistance, the inoculation site is filled with newly formed callus, showing the capability of spontaneous healing, leaving a ring of necrotic peridermal tissue and partially necrotic xylem (Figure 1E).
At 10 days of burning inoculation, watery spots were observed at the inoculation sites, and the bark around the inoculation holes decayed and sank with color changed (Figure 1G). At 20 days post-inoculation, the lesion enlarged with the appearance of longitudinal cracks. At 40 days post-inoculation, the inoculation sites decayed, exhibiting symptoms such as water loss and shrinking, leading to a cracked appearance (Figure 1I). At 50 days post-inoculation, the anatomical structure of the lesions revealed that the pathogen-induced necrosis extended into approximately 1.2 cm in the xylem (Figure 1J).
At 10 days of toothpick inoculation, the periderm at the inoculation sites turned brown, softened, and sank (Figure 1L). At 20 days post-inoculation, the decayed brown area around each inoculation site expanded, and the lesion extended longitudinally. Some lesions even began to produce numerous needle-like black protrusions, which were subsequently identified to be pycnidia of the pathogen (Figure 1M). At 40 days post-inoculation, the inoculation sites showed severe symptoms, with the top and the bottom merging and most inoculation sites releasing rusty liquid (Figure 1N). At 50 days post-inoculation, the anatomical structure of the lesions revealed that the pathogen caused severe damage to the xylem, and the wounded area was much larger than that in the burning inoculation group (Figure 1O).
In short, all three inoculation methods can induce symptoms of lesions in P. alba var. pyramidalis inoculated with V. sordida. However, there are differences in lesion status when comparing the punching inoculation with those of the burning and toothpick inoculation methods. Punching inoculation resulted in early symptoms and spontaneous healing of the inoculation sites, whereas the burning and toothpick techniques both induced persistent and severe symptoms.
3.2. Statistical Analysis of Xylem Wound and Area at Inoculation Sites in the Punching, Burning, and Toothpick Inoculation Groups
The wound of xylem is shown in Figure 2, Figure 3 and Figure 4. Upon transversal sectioning of the lesions in the punching inoculation group, the xylem was minimally wounded. However, during dissection, the phloem and xylem displayed a rough appearance, with hard and coarse texture, distinct from the white, well-organized sections in the control group. Additionally, light brown spots were found on the treated section, indicating the potential presence of fungal hyphae, awaiting suitable conditions for infection (Figure 2 A–C). The dissection at the longitudinal section of the lesions in the punching inoculation group revealed that, compared to the callus and newly formed green tissue on the wound surface of the controls (Figure 2 D), the treatment group exhibited brown streaks extending deep into the xylem (Figure 2 E). The observed callus and green tissue, in addition to symptoms at the inoculation sites in the early stages, indicate that, despite spontaneous healing, the punching technique, to some extent, causes wound to the xylem. The most severe wound of xylem was observed in the toothpick inoculation group (Figure 3). While the burning inoculation group also caused damage to the xylem to some extent at the inoculation sites, the wound was less severe than in the toothpick inoculation group (Figure 4).
Considering the potential impacts of intra- and inter-row spacing as well as inoculation positions on inoculation outcomes, the analysis of the area of wounded xylem (Figure 5 A–B) was presented from the perspective of different inoculation positions (upper vs. bottom) and intra- and inter-row spacing (high vs. low), respectively. In the top of the poplar with high intra- and inter-row spacing [Figure 5A (left)] and the bottom of the poplar with low intra- and inter-row spacing [Figure 5B (right)], there was no significant difference in the area of wounded xylem between the burning and toothpick inoculation groups. In contrast, in the bottom of the poplar with low intra- and inter-row spacing [Figure 5A (right)] and the top of the poplar with high intra- and inter-row spacing [Figure 5B (left)], there was significant difference in the area of wounded xylem between the burning and toothpick inoculation groups, with toothpick inoculation causing significantly larger area of wounded xylem than that of the burning inoculation (p< 0.05).
In short, the toothpick and burning inoculation groups showed consistent patterns in the changes in the area of wounded xylem and symptoms of lesions at the inoculation sites. Toothpick inoculation of V. sordida induced severe damage to the xylem compared to that of burning inoculation.
3.3. Comparative Analysis of Disease Incidence, Disease Severity Index, and Relative Area of Lesion at the Inoculation Sites in the Burning and Toothpick Inoculation Groups
The toothpick and burning inoculation groups showed gradual increase in the incidence of Valsa canker, both surpassing 50% at 20 days post-inoculation. At 50 days post-inoculation, the lesion was observed at almost all inoculation sites (93.55%) in the toothpick inoculation group, and the incidence rate was significantly higher than 80.65% in the burning inoculation group (p = 0.007, n = 93, Figure 6A). The disease severity index exhibited the fastest increase in the toothpick inoculation group during the first 10 days, and the fastest at 20 days of inoculation in the burning inoculation group, respectively (Figure 6B). Changes in relative area of lesion at different time points are shown in Figure 6C. In the toothpick inoculation group, lesions were observed soon after inoculation, with the average lesion area was significantly greater than that in the burning inoculation group at 10 days post-inoculation (p< 0.05). Subsequently, the lesion area at the inoculation sites gradually expanded over time. Between 30 and 40 days post-inoculation, the relative area of lesion in the toothpick inoculation group further expanded, reaching a maximum value of 31.724. In contrast, the lesion area in the burning inoculation group remained stable after 30 days, with little further expansion in the later stages. At 50 days post-inoculation, the mean relative area of lesion was 7.02 ± 0.57 for the toothpick inoculation group and 1.86 ± 0.059 for the burning inoculation group.
To summarize, the disease incidence in the toothpick inoculation group was significantly higher than that in the burning inoculation group. Toothpick inoculation contributed to the fastest expansion of lesions and the largest relative area of lesion compared to the burning technique. On the other hand, the burning inoculation displayed a lower disease severity index, and the relative lesion area was less than one-third of that wounded by toothpick inoculation.
3.4. Effects of Intra- and Inter-Row Spacing as Well as Inoculation Positions on the Outcomes of Toothpick Inoculation
At 10 days post-inoculation, the relative area of lesion in the low intra- and inter-row spacing group was significantly higher than in the high intra- and inter-row spacing group (p = 0.000009). The significant difference in relative area of lesion between the high and low intra- and inter-row spacing groups further expanded from 20 to 50 days post-inoculation (p ≤ 0.0001, Figure 7A). At 10 days post-inoculation, there was no significant difference in the relative area of lesion between the top and the bottom of the wounded poplar. However, between 20 to 50 days post-inoculation, the relative area of lesion in the top was significantly lower than that in the bottom (p< 0.05, Figure 7B).
In short, after toothpick inoculation of V. sordida, the poplars with low intra- and inter-row spacing were more susceptible to lesion compared to those with high intra- and inter-row spacing. Additionally, the bottom of the poplar appeared to be more susceptible to lesion compared to the top. These findings align with the results of the previous analysis on the impact of different stand densities and inoculation positions on the area of wounded xylem.
4. Conclusions and Discussion
4.1. Discussion on the Induction of Lesion by Punching, Burning, and Toothpick Inoculation of V. sordida
This study revealed that after the inoculation of P. alba var. pyramidalis trunk with V. sordida using the punching, burning, and toothpick techniques, Valsa canker symptoms were induced, and notable differences were observed in the induction of lesions between punching inoculation and the latter two inoculation methods. Previous studies have identified punching inoculation as a stable and efficient technique, making it an ideal option for molecular and physiological research [5]. However, in this study, punching inoculation showed less favorable inoculation outcomes. Moreover, increased wound healing and growth were observed after punching inoculation. This discrepancy may be explained by the use of six-year-old P. alba var. Pyramidalis with relatively high disease resistance in the current study. Calluses were found on the surrounding tissue of the lesions in the wounded poplars, preventing further expansion of the lesions. In addition, punching inoculation only wounded the periderm, with almost no impact on the underlying tissues. As a result, no necrotic tissue formed, resulting in limited supply of saprotrophic nutrients to the pathogen [19]. In short, punching inoculation can produce average inoculation outcomes and induce callus formation. Compared to punching, the burning technique exhibited a stronger capability in inducing Valsa canker, with the damage caused by burning expanding from the center of the wound surface towards the surrounding and underlying tissues. This gradual extension from dead tissues to dying tissues, injured tissues, and healthy tissues is favorable for the pathogen. However, burning inoculation also presents certain challenge. To be specific, the duration of heating has a significant impact on lesions, with high risk of producing errors, highlighting the importance of strict control over the duration of heating in burning inoculation [6]. Toothpick inoculation showed the highest disease incidence and disease severity index, reaching around 50% within 10 days after inoculation. In the later stages of the disease, it caused severe wound to the phloem and xylem of P. alba var. pyramidalis. In this context, the remarkable inoculation outcomes may be attributed to the high vitality of the pathogen colonized onto the toothpicks [20]. Additionally, the depth of the wound caused by toothpick inoculation creates a relatively deep saprotrophic environment, facilitating the invasion of V. sordida [19].
In the toothpick inoculation experiment, conspicuous sporulation was observed around the lesions. At 20 days post-inoculation, numerous needle-like black protrusions (pycnidia at a density of 5.08 ± 1.33 per cm2) emerged on the lesions. At 30 days post-inoculation, tangerine gelatinous filamentous structures were extruded from the pores of the pycnidia. At 50 days post-inoculation, these structures gradually turned dark yellow and eventually disappeared (Figure 8A–D). During toothpick inoculation, the black protrusions were carefully collected using an inoculation needle. After longitudinal dissection, observation of the protrusions under a microscope revealed a large number of mature, elongated to sausage-shaped motile conidia within the black protrusions (Figure 8E). This finding suggests that toothpick inoculation can promote the reproduction of pathogenic spores. However, further analysis is needed to confirm whether this efficient induction of spore formation is associated with the physiological characteristics of the pathogen. In future studies, less sporulative pathogens (e.g., B. dothidea) can be considered to validate the results in our study.
4.2. Effects of Different Stand Densities and Inoculation Positions on Inoculation Outcomes
The outcome of plant disease development depends on the interaction of the abiotic environment, host, and pathogen, namely the disease triangle [21]. In the abiotic environment, stand density, an agricultural factor determined by intra- and inter-row spacing, is associated with pathogen invasion into the host [22,23,24,25]. This study found that the intra- and inter-row spacing of P. alba var. pyramidalis can significantly affect the inoculation outcomes of V. sordida. Specifically, the disease severity index of the wounded P. alba var. pyramidalis with low intra- and inter-row spacing was significantly higher than that of the high intra- and inter-row spacing group, and the area of wounded xylem in the low intra- and inter-row spacing group was also significantly greater than that in the high intra- and inter-row spacing group. These results may be attributed to the low-level sunlight exposure and poor ventilation in the low intra- and inter-row spacing environment, and the resulting limited sunlight exposure for understory vegetation, leading to a low species diversity, decreased physiological functions of plants, weakened host resistance, and increased susceptibility to pathogen invasion [26]. Evidence from several studies indicates that shading increases infection by a range of pathogens [27]. Further research is needed to elucidate the relationship of disease development with sunlight exposure, crown density, and humidity.
For tall trees and other large plants, even the same organ may exhibit varying degrees of maturity due to its vertical distribution, leading to different levels of resistance to pathogens. Therefore, it is believed that different inoculation positions can, to some extent, affect the susceptibility to pathogens. In this study, the outcomes of toothpick inoculation varied significantly in different inoculation positions. After toothpick inoculation, the disease severity index of the bottom was markedly higher than that of the top, and the area of wounded xylem in the bottom was also greater than in the top. This may be explained by the uniform diameter of the inoculated trees in both top and the bottom, and the bottom, being closer to the ground, is affected by the understory vegetation or litter cover, thus exhibiting higher susceptibility to the disease compared to the top [28,29].
Additionally, tree age is another key factor in disease development [30,31]. Reportedly, Valsa canker is more likely to occur and poses a greater threat in young poplar forests [32]. Therefore, an additional burning inoculation experiment was conducted using two-year-old P. alba var. pyramidalis, with the discovery of lesions induced by both CZC and CZA. While no sinking of the wound or expansion of the inoculation holes was observed in the control group. Notably, callus formation was visible during the inoculation process (Figure 9A). The treatment groups exhibited longitudinal sinking of lesions and separation of fibrous tissue in the lesions during later stages. The CZC-induced lesion was more severe compared to the CZA-induced condition (Figure 9 B–E). The incidence of the CZC-induced lesion reached 100%, and the disease severity index was 82.81, significantly higher than the incidence of Valsa canker (80.65%) and corresponding disease severity index (35.48) in the six-year-old P. alba var. pyramidalis with burning inoculation (Table 2). Collectively, the development of lesions induced by burning inoculation in two-year-old P. alba var. pyramidalis is faster and more severe than that in six-year-old P. alba var. pyramidalis, possibly due to the weaker resistance of young seedlings. These findings are consistent with previous reports [33,34], suggesting a higher degree of disease severity index in the case of burning inoculation using poplars at a younger age.
4.3. Application of Toothpick Inoculation
Toothpick inoculation is an efficient technique that allows for the rapid expansion of lesions. Analysis can be conducted at 10 days post-inoculation, making it an easy-to-use, convenient method for large-scale inoculation experiments in the study of diseases in branch and trunk. Despite its advantages, there is limited application of toothpick inoculation in trunk disease research. Ghimire et al. (2019) used toothpick inoculation and trunk wounding techniques to inoculate soybeans with Diaporthe spp. hyphae, and found that the length of lesions and the severity of disease induced by toothpick inoculation were significantly higher than those induced by the trunk wounding, which were consistent with the findings of this experiment [8]. Yue et al. (2011) also investigated the resistance of 57 species and varieties (clones) of poplars, and P. alba var. pyramidalis was identified as a species with strong resistance [35]. In the current study, toothpick inoculation yielded the optimal results, indicating applicability to most inoculation experiments using poplars. However, toothpick inoculation, considering the length of toothpicks, is only suitable for inoculating plants with a diameter of at least 2 cm. Additionally, toothpick inoculation can be used for rapid lesion induction in the field. This can facilitate the study of the growth, development, spore production, infection, nutritional metabolism, or pathogenic processes of a pathogen in the natural environment, thereby boosting the advancement of pathological research on diseases in branch and trunk.
Author Contributions
Conceptualization, J.Z.; methodology, J.Z., L.P., and W.S.; software, W.S. and L.P.; validation, W.S., L.P. and Y.F.; formal analysis, W.S., Y.S., and Y.Z.; investigation, W.S., and Y.S.; resources, H.L.; data curation, W.S.; writing-original draft preparation, W.S.; writing-review and editing, W.S., L.P. and J.Z.; visualization, W.S.; supervision, X.S.; project administration, J.Z.; funding acquisition, J.Z. All authors have read and agreed to the published version of the manuscript.
Funding
This research was jointly funded by the Central Public-interest Scientific Institution Basal Research Fund of State Key Laboratory of Tree Genetics and Breeding (grant number CAFYBB2020ZY001-2) and the National Natural Science Foundation of China (grant number 32171776) to Jiaping Zhao.
Institutional Review Board Statement
Not applicable.
Informed Consent Statement
Not applicable.
Data Availability Statement
Not applicable.
Conflicts of Interest
The authors declare no conflict of interest.
References
- Fang, Z.D. Research Methods on Plant Disease; China Agriculture Press: Beijing, China, 1998. [Google Scholar]
- Xu, Z.G. General Plant Pathology; Higher Education Press: Beijing, China, 2009. [Google Scholar]
- Reid, L.M.; Hamilton, R.I.; Mather, D.E. Effect of macroconidial suspension volume and concentration on expression of resistance to Fusarium graminearum in Maize. Plant Dis. 1995, 79, 461–466. [Google Scholar] [CrossRef]
- Ullstrup, A.J. Methods for inoculating corn ears with Gibberella zeae and Diplodia maydis. Plant Dis. 1970, 54, 658–662. [Google Scholar]
- Li, P.; Liu, W.; Zhang, Y.; et al. Fungal canker pathogens trigger carbon starvation by inhibiting carbon metabolism in poplar stems. Sci. Rep. 2019, 9, 10111. [Google Scholar] [CrossRef]
- Bessho, H.; Komori, S.; Soejima, J. Simple excised twig assay of Malus species for determining resistance to Valsa canker. Acta Hortic. 2004, 658, 391–397. [Google Scholar] [CrossRef]
- Yang, C.H. A comparative study on different methods of inoculation of poplar canker. J. Bejing For. Univ. 1985, 2, 76–81. [Google Scholar]
- Ghimire, K.; Petrović, K.; Kontz, B.J.; et al. Inoculation method impacts symptom development associated with Diaporthe aspalathi, D. caulivora, and D. longicolla on soybean (Glycine max). Plant Dis. 2019, 103, 677–684. [Google Scholar] [CrossRef]
- Ma, J.; Wan, D.; Duan, B.; et al. Genome sequence and genetic transformation of a widely distributed and cultivated poplar. Plant Biotechnol. J. 2019, 17, 451–460. [Google Scholar] [CrossRef]
- Zhang, Z.; Kang, X.; Wang, S.; et al. Pollen development and multi-nucleate microspores of Populus bolleana Lauche. For. Stud. China 2008, 10, 107–111. [Google Scholar] [CrossRef]
- Zhang, J.G.; et al. Studies on Populus in Xinjiang; Forestry Publishing House: Beijing, China, 2014. [Google Scholar]
- Kepley, J.B.; Reeves, F.B.; Jacobi, W.R.; et al. Species associated with cyospora canker on Popul. Tremuloides. Mycotaxon 2015, 130, 1124–1131. [Google Scholar] [CrossRef]
- Qu, H.H.; Yang, X.Q.; Jiang, L.Q.; et al. Researches of V. sordida Nits. Heilongjiang Agric. Sci. 2012, 5, 145–149. [Google Scholar]
- Abbasi, K.; Abbasi, S.; Forouhifar, K.B.; et al. Study of genetic diversity in Cytospora chrysosperma isolates obtained from walnut trees in Iran using inter simple sequence repeat (ISSR) markers. Arch. Phytopathol. Plant Prot. 2015, 48, 327–335. [Google Scholar] [CrossRef]
- Shao, Y.H.; Ge, W.H.; Qin, X.B.; et al. Relations of Fungus Quantity in Poplar Saplings to V. sordida Infection. J. Shandong For. Sci. Technol. 2003, 6, 22–23. [Google Scholar]
- Wang, Z.M.; Liu, G.R.; Chen, Y.Q. Cytospora canker of main poplar varieties in Jilin and the management. Plant Prot. 2008, 34, 102–106. [Google Scholar]
- Jiao, L.M.; Liang, T.M.; Ji, C.Y.; et al. Research on pathogenicity of Cytospora chrysosperma (Pers.) Fr. on Poplar and bacteriostasis of Ambrosia artemisiifolia L. Hunan For. Sci. Technol. 2020, 47, 77–81. [Google Scholar]
- Wang, X.L.; Zang, R.; Wang, L.; et al. The occurrence of Valsa malicola on apple trees and its pathogenicity. Sci. Silvae Sin. 2007, 43, 23–26. [Google Scholar]
- Ye, J.R.; He, W. Forest Pathology; China Forestry Publishing House: Beijing, China, 2011. [Google Scholar]
- Balendres, M.A.; De Torres, R.; Dela Cueva, F. Culture storage age and fungal re-isolation from host-tissue influence Colletotrichum spp. virulence to pepper fruits. J. Phytopathol. 2019, 167, 510–515. [Google Scholar] [CrossRef]
- Scholthof, K.B. The disease triangle: Pathogens, the environment and society. Nat. Rev. Microbiol. 2007, 5, 152–156. [Google Scholar] [CrossRef]
- Seiwa, K.; Miwa, Y.; Sahashi, N.; et al. Pathogen attack and spatial patterns of juvenile mortality and growth in a temperate tree, Prunus Grayana. Can. J. For. Res. 2008, 38, 2445–2454. [Google Scholar] [CrossRef]
- Yamazaki, M.; Iwamoto, S.; Seiwa, K. Distance- and density-dependent seedling mortality caused by several diseases in eight tree species co-occurring in a temperate forest. Plant Ecol. 2009, 201, 181–196. [Google Scholar] [CrossRef]
- Bagchi, R.; Swinfield, T.; Gallery, R.E.; et al. Testing the Janzen-Connell mechanism: Pathogens cause overcompensating density dependence in a tropical tree. Ecol. Lett. 2010, 13, 1262–1269. [Google Scholar] [CrossRef]
- Benítez, M.S.; Hersh, M.H.; Vilgalys, R.; et al. Pathogen regulation of plant diversity via effective specialization. Trends Ecol. Evol. 2013, 28, 705–711. [Google Scholar] [CrossRef]
- Ares, A.; Neill, A.R.; Puettmann, K.J. Understory abundance, species diversity and functional attribute response to thinning in coniferous stands. For. Ecol. Manag. 2010, 260, 1104–1113. [Google Scholar] [CrossRef]
- Roberts, M.R.; Paul, N.D. Seduced by the dark side: Integrating molecular and ecological perspectives on the influence of light on plant defence against pests and pathogens. New Phytol. 2006, 170, 677–699. [Google Scholar] [CrossRef]
- Zhang, Q.; Zhou, G.Y.; Dong, W.; et al. Impact of community structure of Dalbergia odorifera plantations on foliage diseases occurrence. Sci. Silvae Sin. 2015, 51, 121–127. [Google Scholar]
- Wang, B.; Tian, C.; Liang, Y. Landscape and stand-scale factors drive the infestation of an endemic fungal pathogen: The role of leaf traits. For. Ecol. Manag. 2022, 514, 120213. [Google Scholar] [CrossRef]
- Patton, R.F. The effect of age upon susceptibility of eastern white pine to infection by Cronartium Rib. Phytopathol 1961, 51, 429–434. [Google Scholar]
- Ma, Y.C. Occurrence regularity and triggering factor of canker of Carya Cathayensis. For. Pest Dis. 2021, 40, 21–25. [Google Scholar]
- Xiang, Y.Y.; Guo, S.G. Study on the Control Index of Dothiorella gregaria Canker of Poplar. For. Res. 1996, 9, 409–412. [Google Scholar]
- Lin, Y.L.; Huang, L.L.; Suolang, L.M.; et al. A rapid laboratory evaluation system for apple ring rot. Acta Phytophylacica Sin. 2011, 38, 37–41. [Google Scholar]
- Yin, Y.X.; Liu, Y.M.; Ma, R.; et al. Laboratory evaluation method of walnut Canker pathogenicity. Chin. Agric. Sci. Bull. 2016, 32, 5. [Google Scholar]
- Yue, C.Y.; Zhang, X.P.; MA, P.P.; et al. Resistance of different poplars in the initial afforestation stages on Cytospora chrysosperma in Xinjiang. J. Northwest For. Univ. 2011, 26, 113–118. [Google Scholar]
Figure 1.
Cross-sectional diagrams of lesion formation after punching, burning, and toothpick inoculation. Note: A–E, punching inoculation of V. sordida; F–J, burning inoculation of V. sordida; K–O, toothpick inoculation of V. sordida. A, F, and K, controls inoculated with water-agar blocks; B–D, G–I, and L–N, development of lesions at 10, 20, and 40 days post-inoculation; E, J, O, cross-sectional diagrams of lesions at 50 days post-inoculation with punching, burning, and toothpick techniques, respectively.
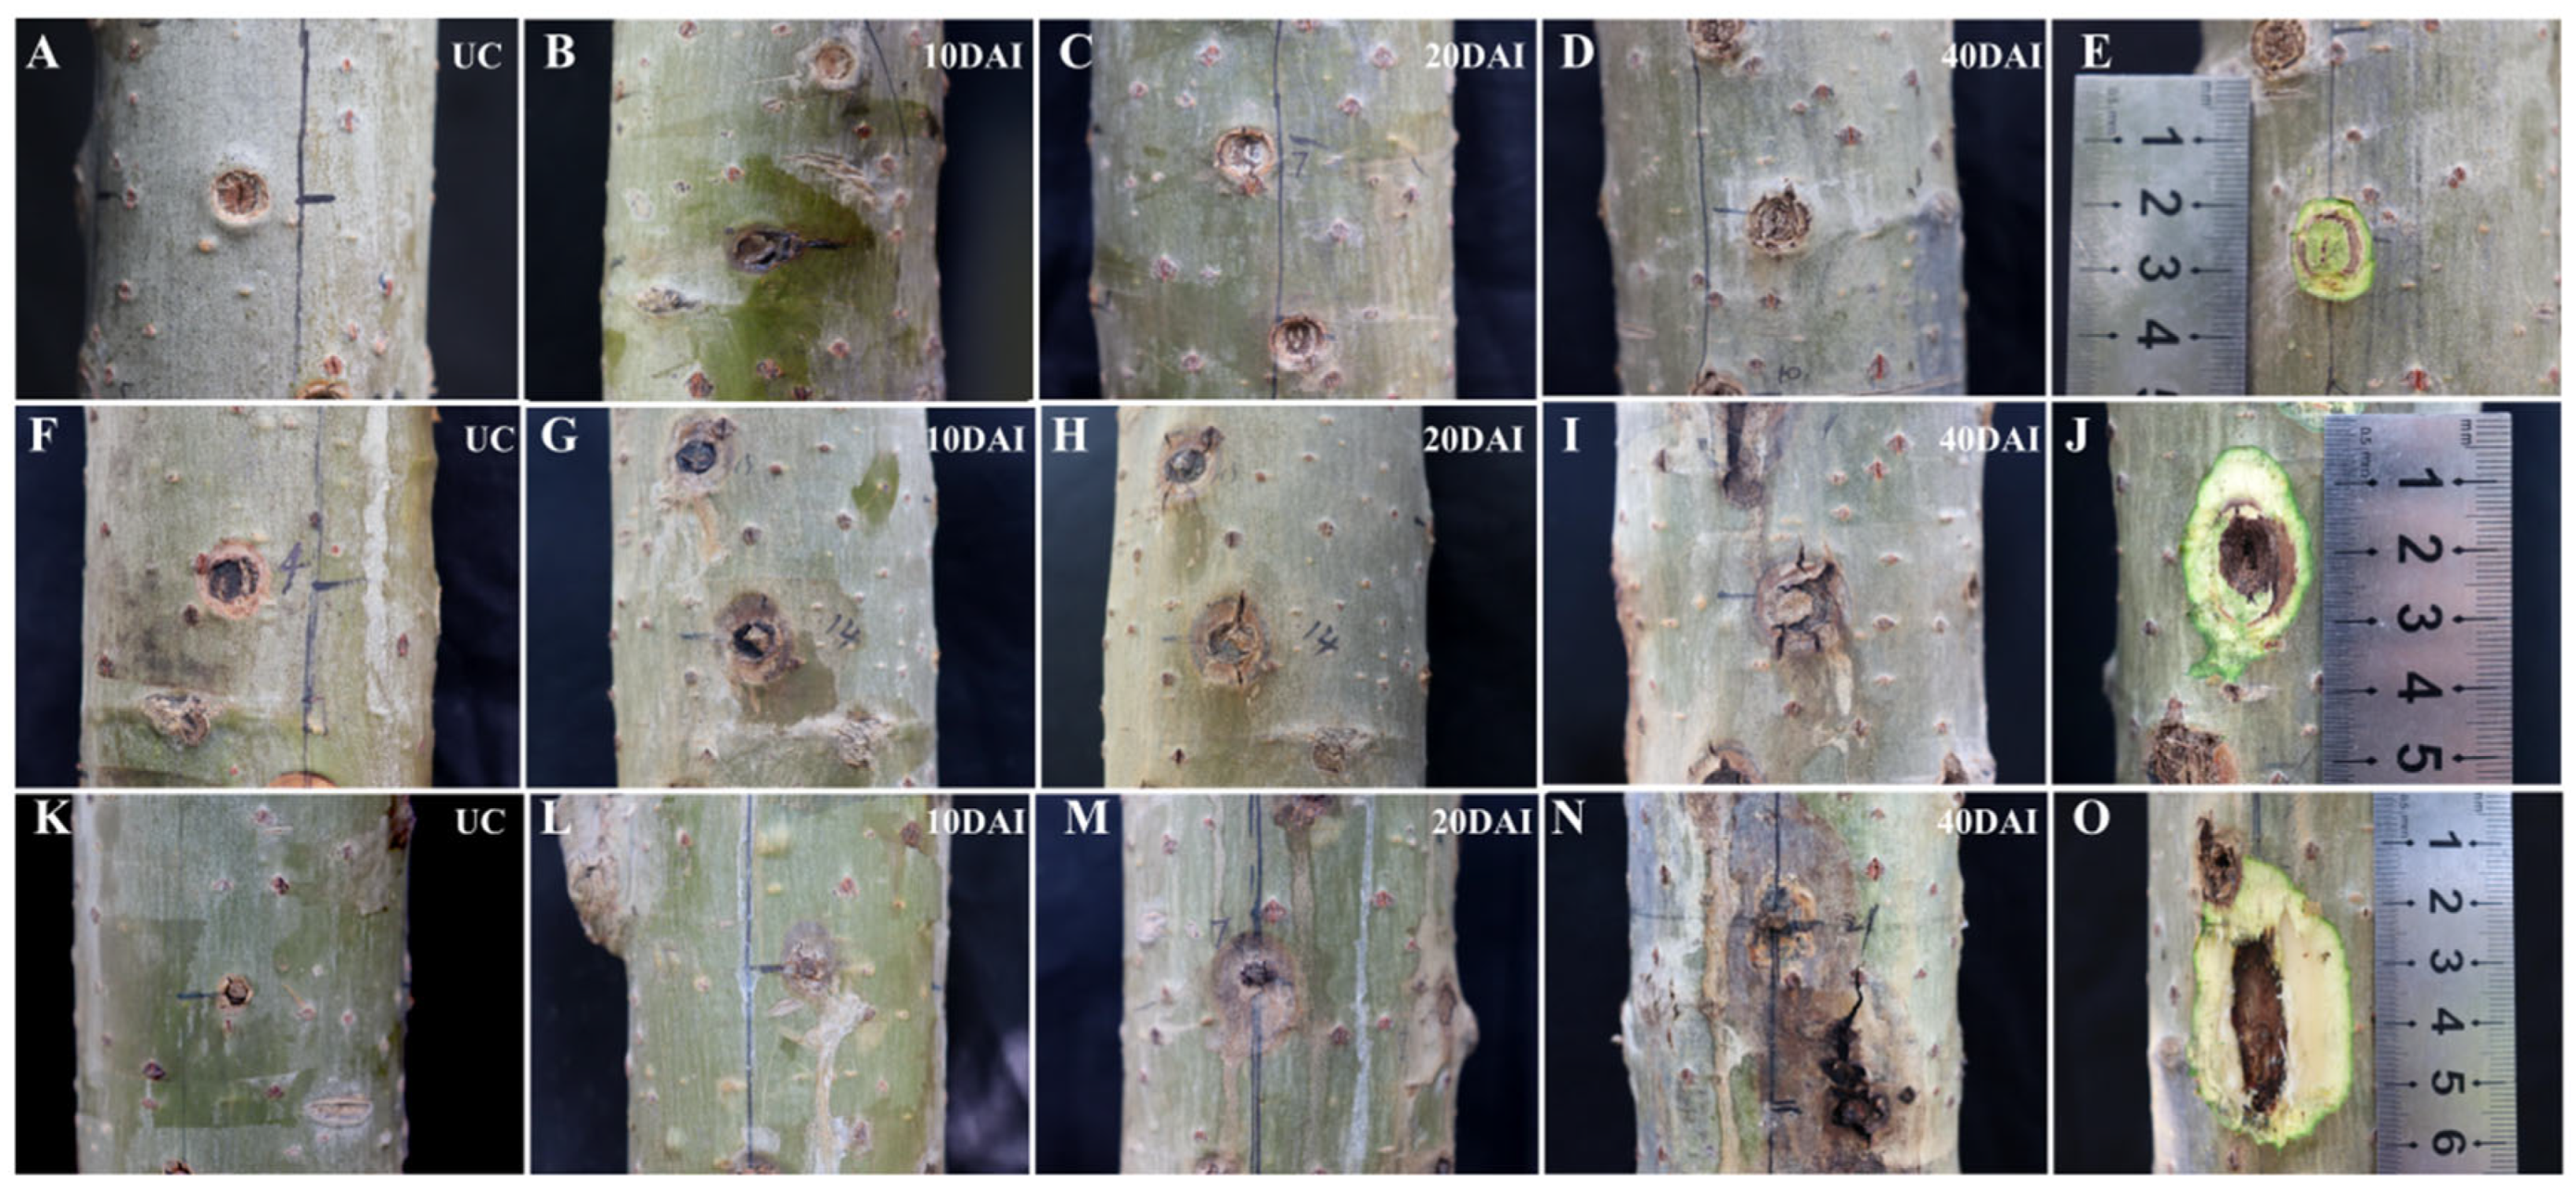
Figure 2.
Cross-sectional diagrams of the inoculation sites after punching inoculation. Note: A, cross-sectional diagram of the inoculation sites in the control group; B and C, transversal cross-sectional diagrams of the lesions in the treatment group; D and E, longitudinal cross-sectional diagrams of the lesions in the treatment group.
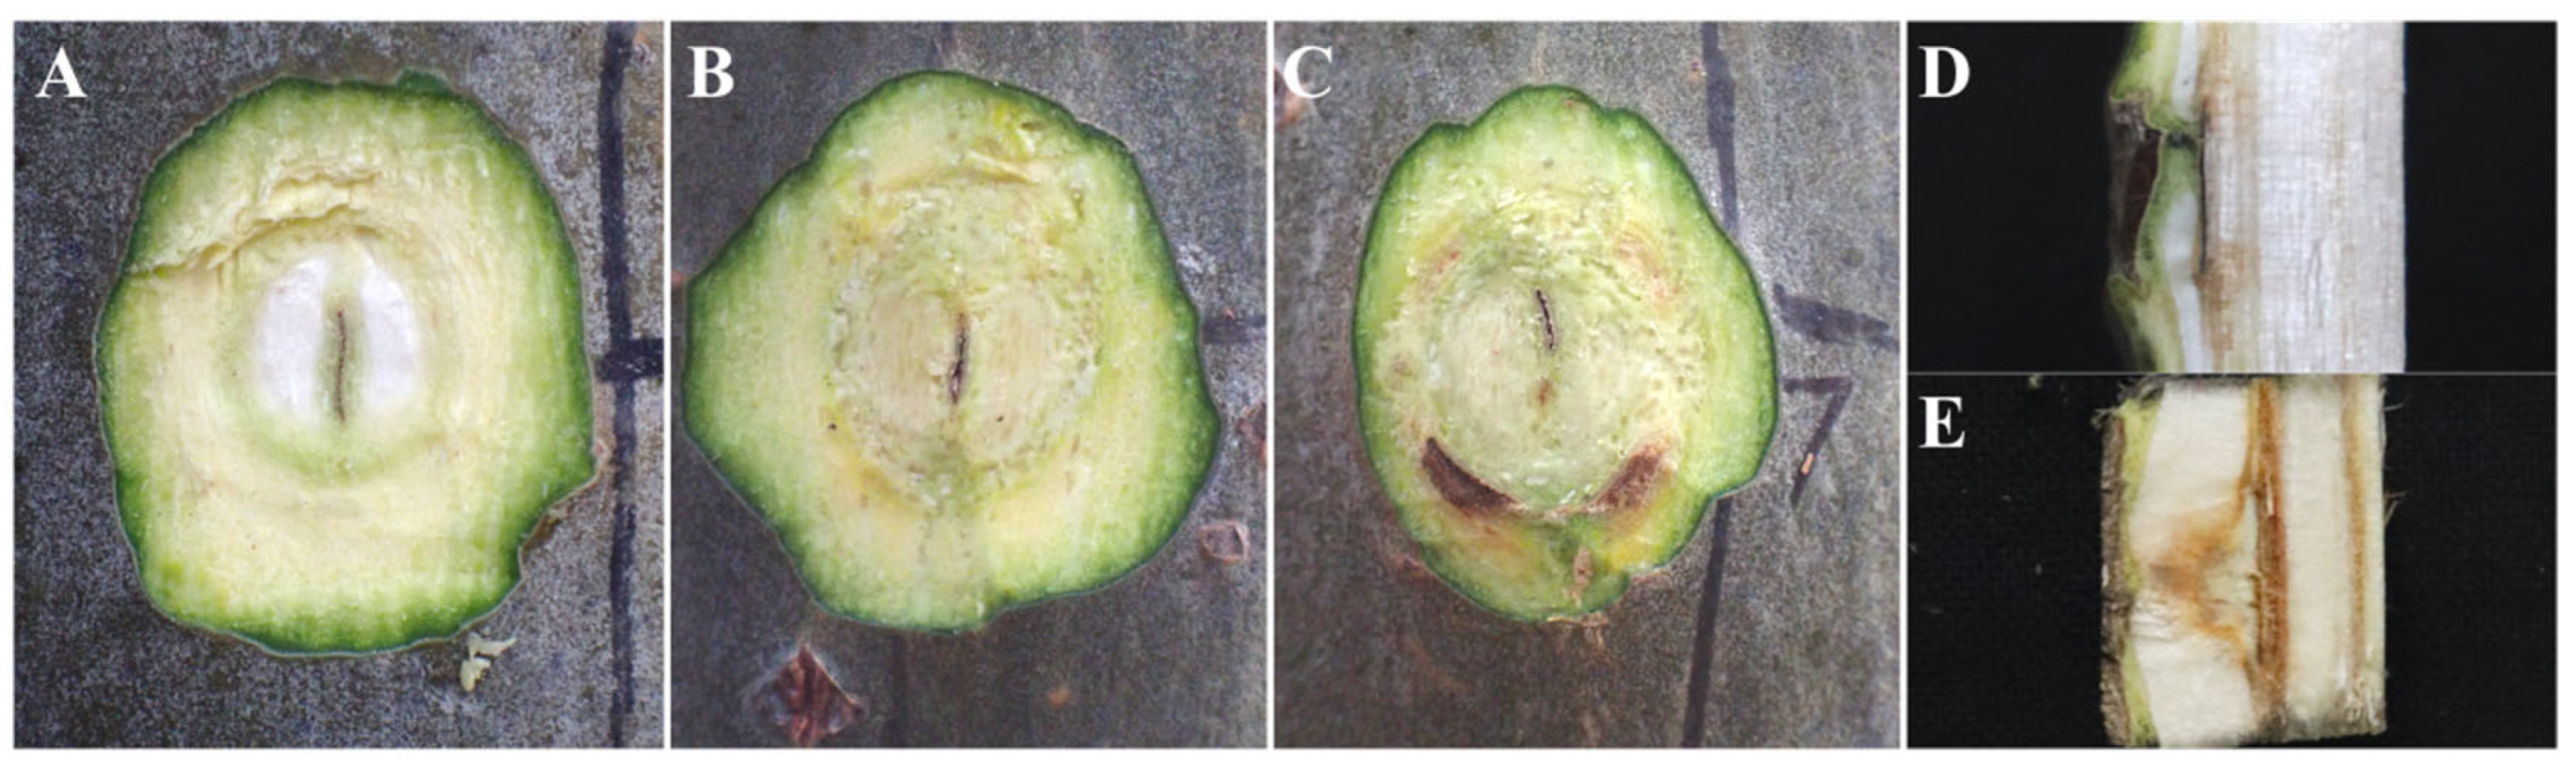
Figure 3.
Cross-sectional diagrams of inoculation sites with toothpick inoculation. Note: A, cross-sectional diagram of the inoculation sites in the control group; B–D, transversal cross-sectional diagrams of the lesions in the treatment group.
Figure 3.
Cross-sectional diagrams of inoculation sites with toothpick inoculation. Note: A, cross-sectional diagram of the inoculation sites in the control group; B–D, transversal cross-sectional diagrams of the lesions in the treatment group.
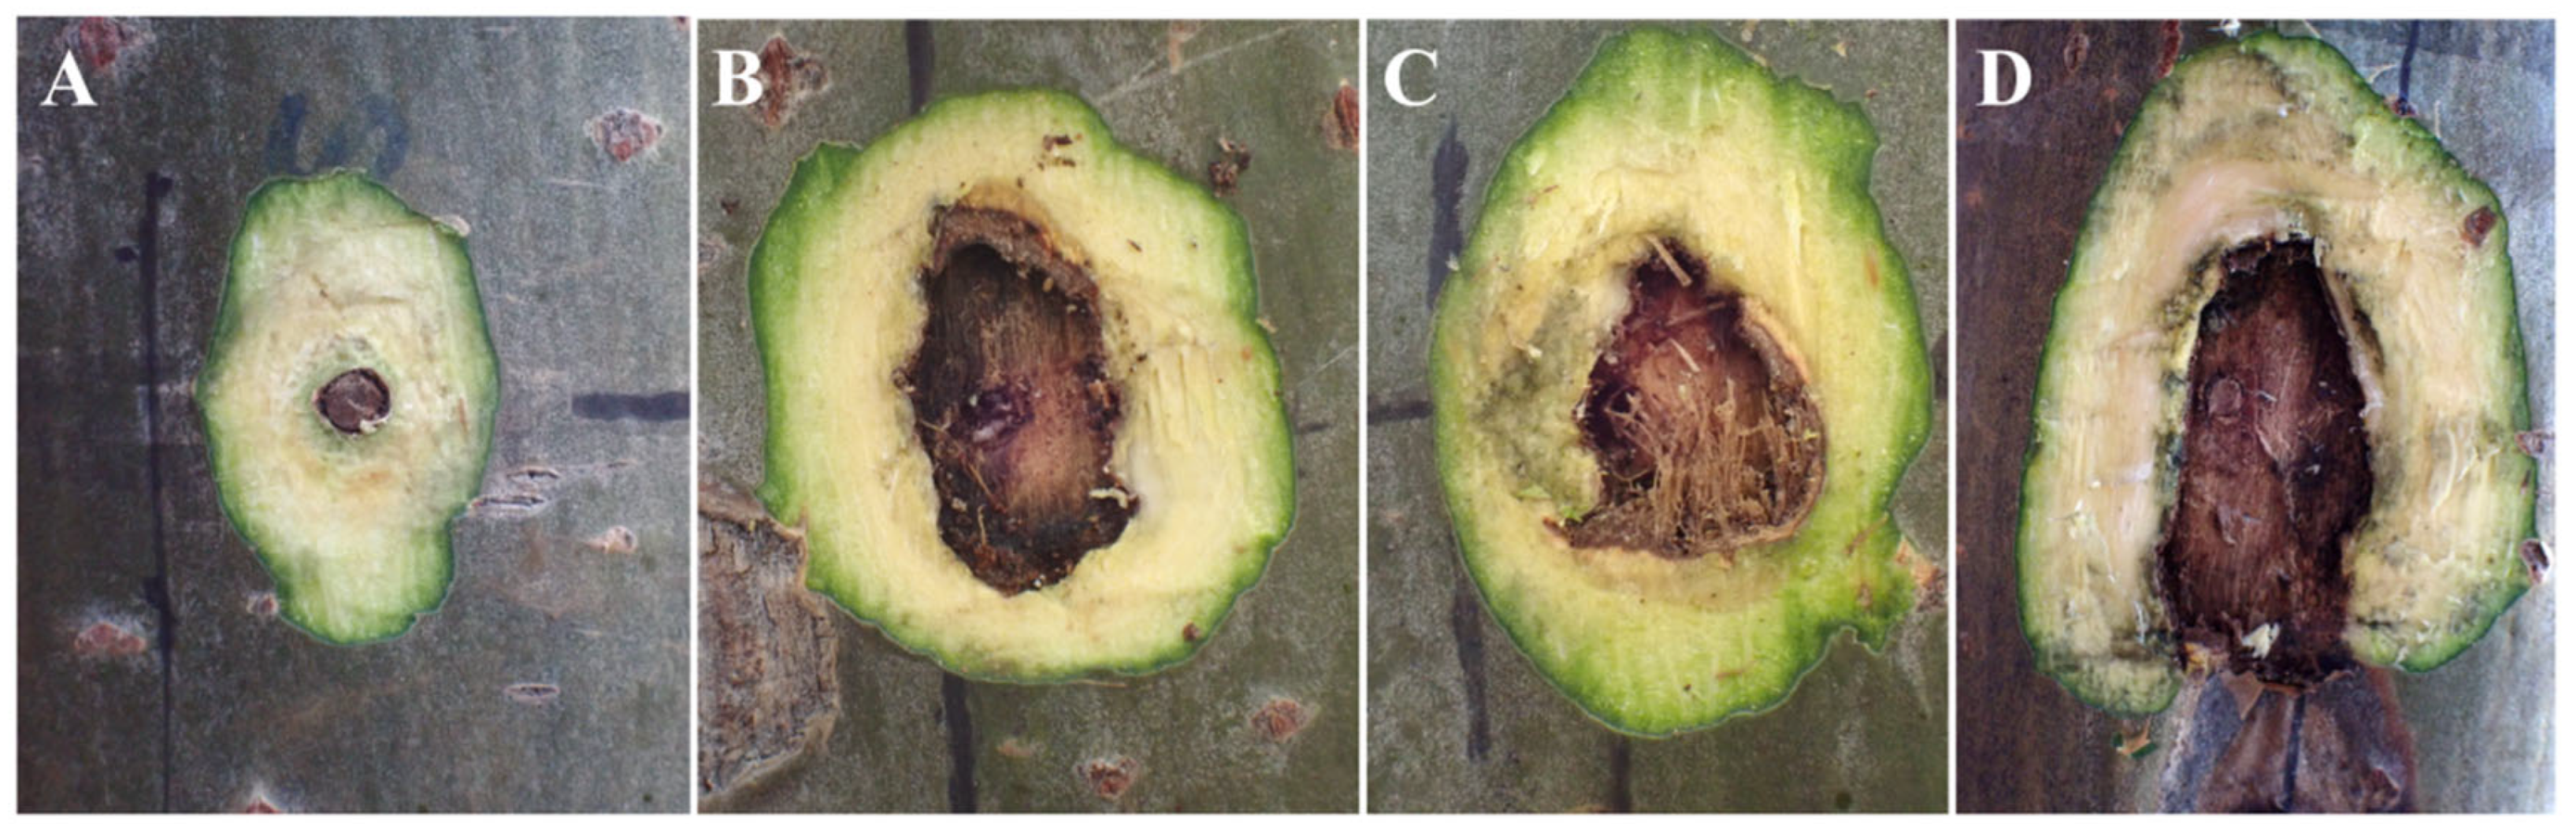
Figure 4.
Cross-sectional diagrams of inoculation sites with burning inoculation. Note: A, cross-sectional diagram of the inoculation sites in the control group; B–D, transversal cross-sectional diagrams of the lesions in the treatment group.
Figure 4.
Cross-sectional diagrams of inoculation sites with burning inoculation. Note: A, cross-sectional diagram of the inoculation sites in the control group; B–D, transversal cross-sectional diagrams of the lesions in the treatment group.
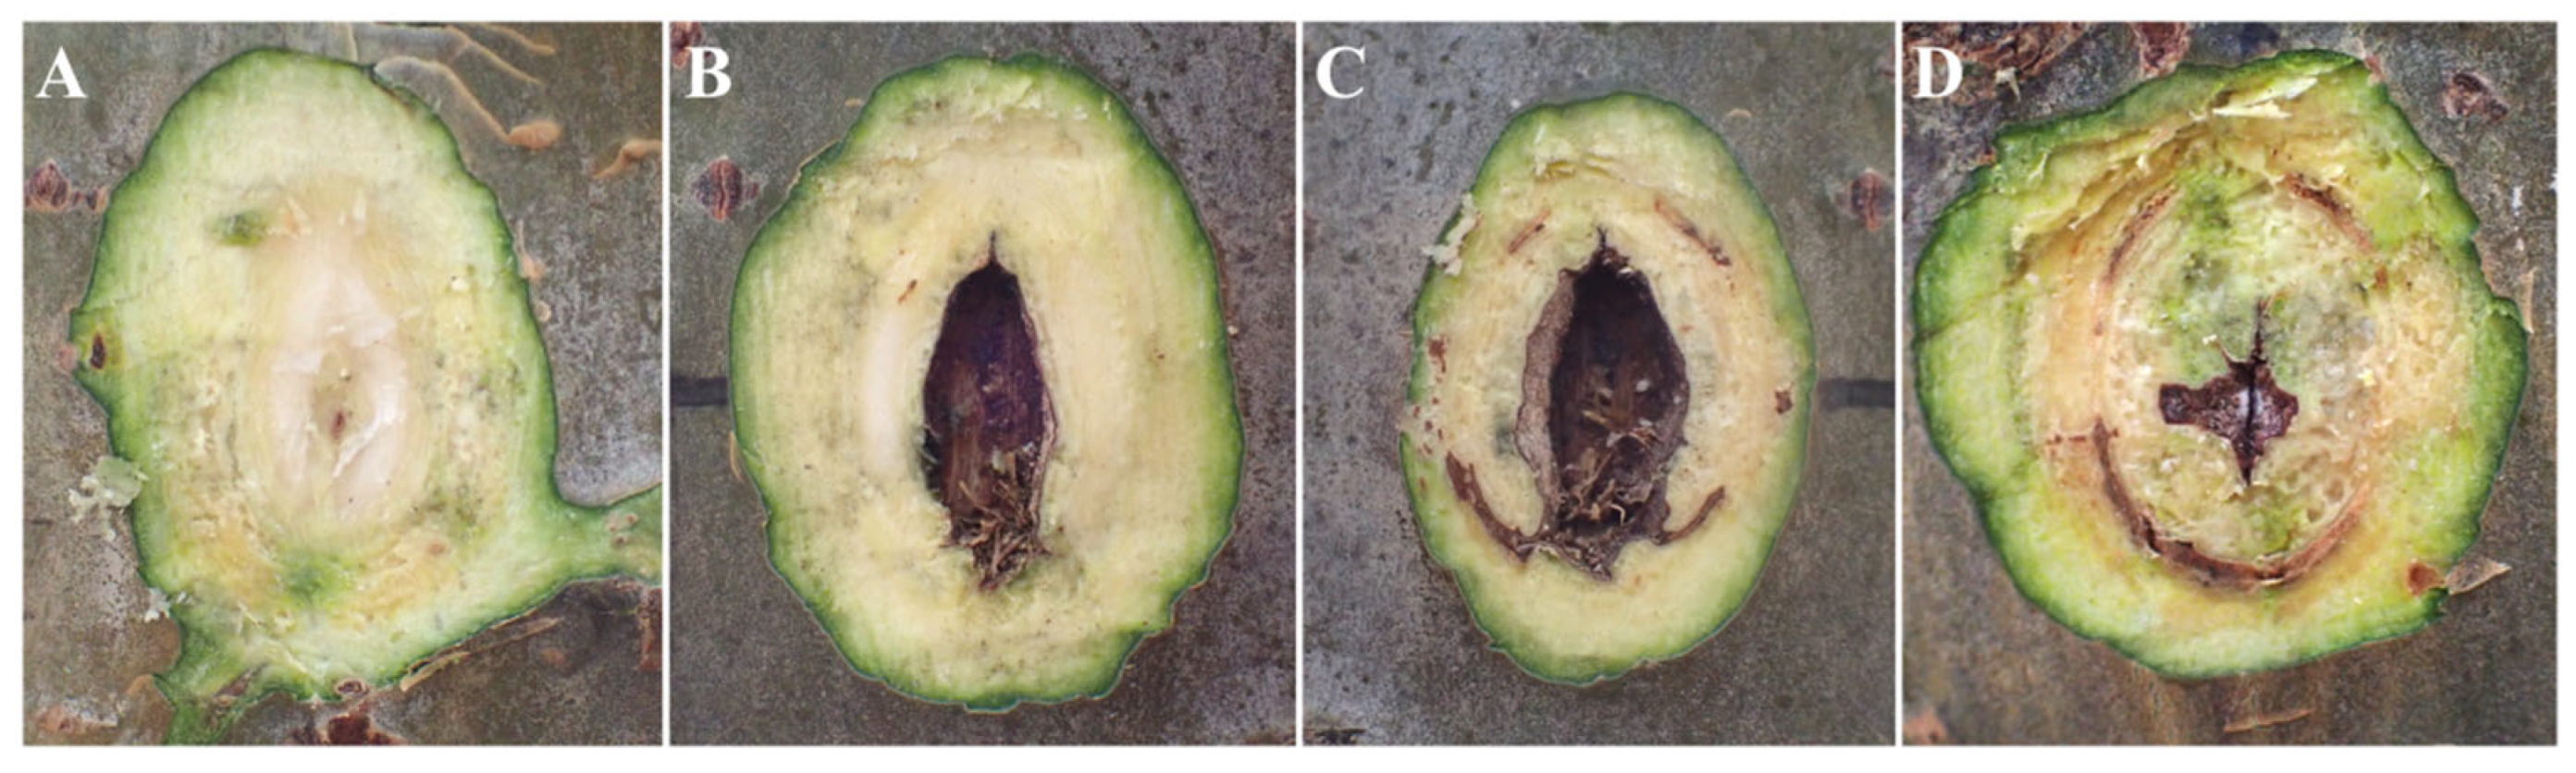
Figure 5.
Area of the wounded xylem at the inoculation sites after toothpick and burning inoculations. Note: A, inoculation on P. alba var. pyramidalis with low intra- and inter-row spacing; top (left), and bottom (right); B, inoculation on P. alba var. pyramidalis with high intra- and inter-row spacing; top (left), and bottom (right).
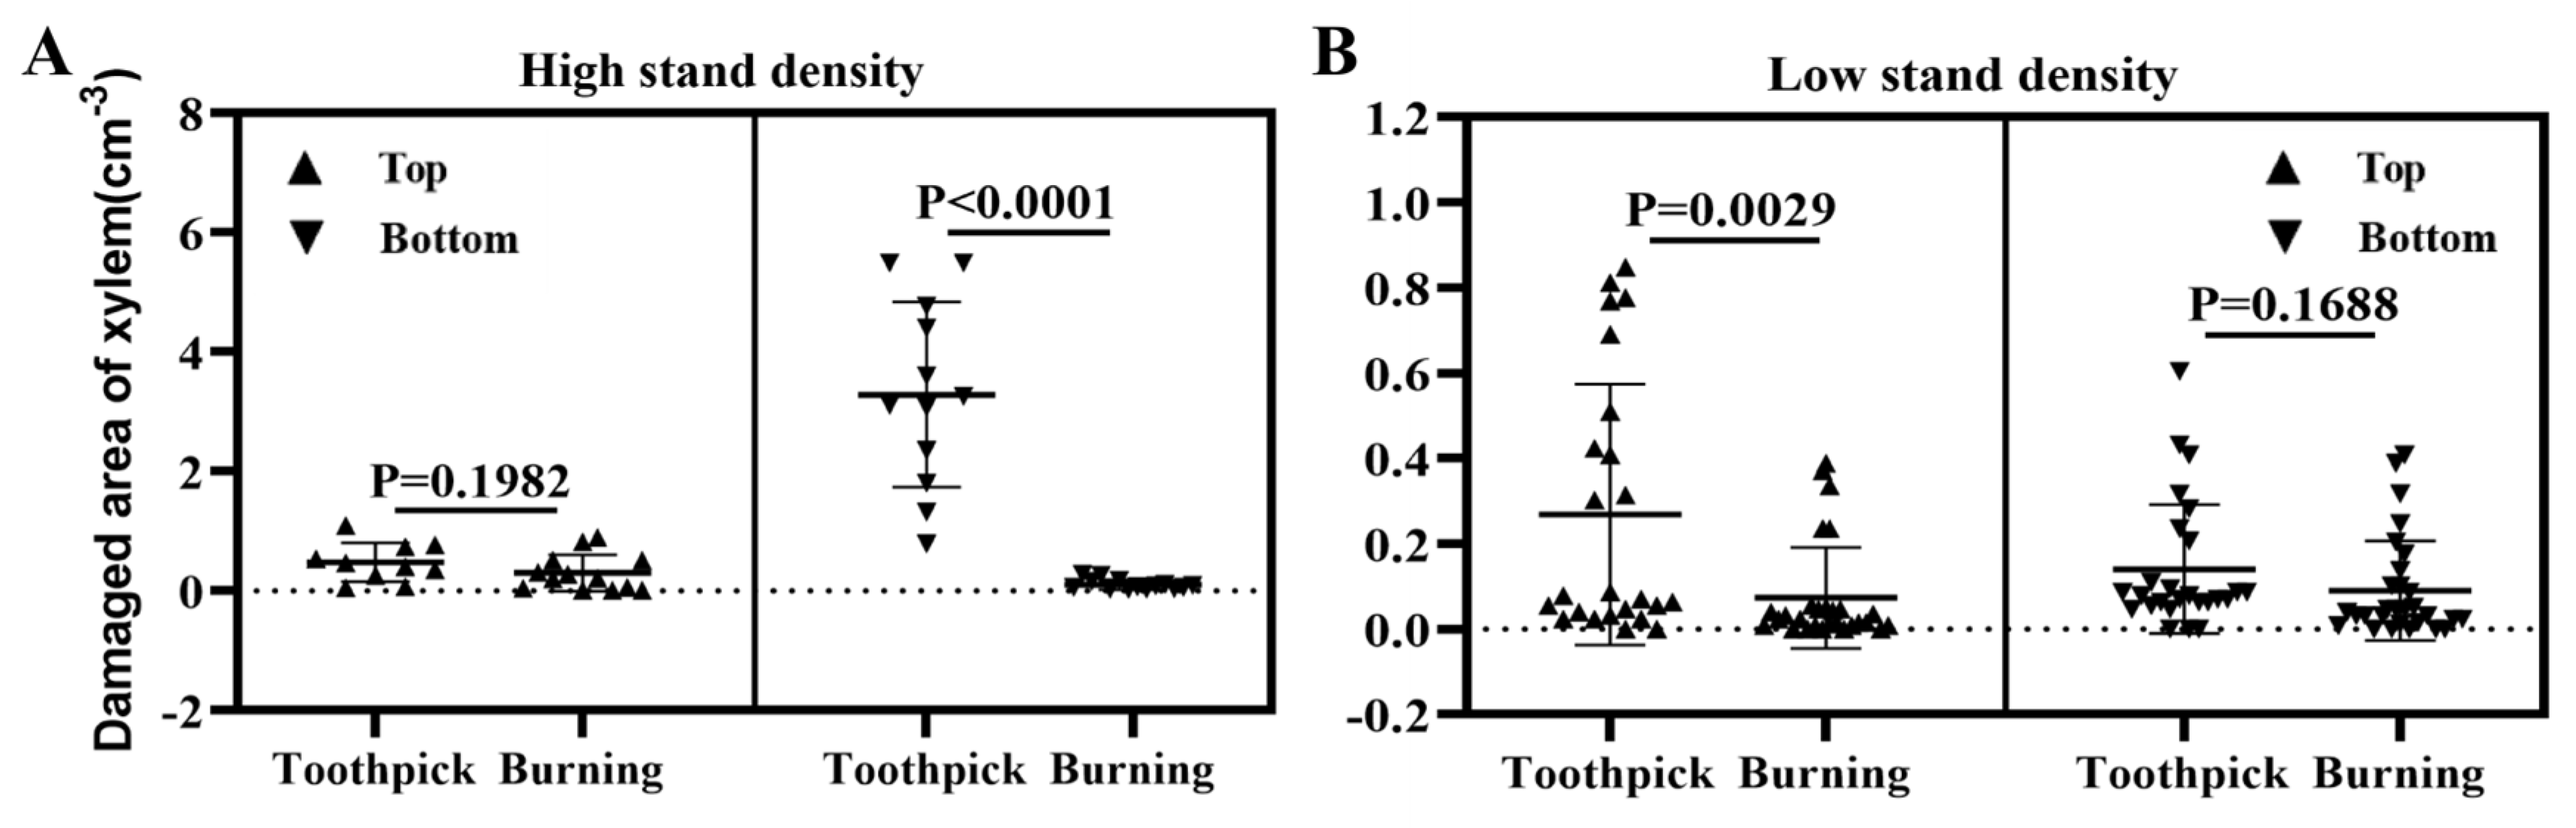
Figure 6.
Changes in disease incidence, disease severity index, and relative area of lesion at the inoculation sites in the burning and toothpick inoculation groups.
Figure 6.
Changes in disease incidence, disease severity index, and relative area of lesion at the inoculation sites in the burning and toothpick inoculation groups.
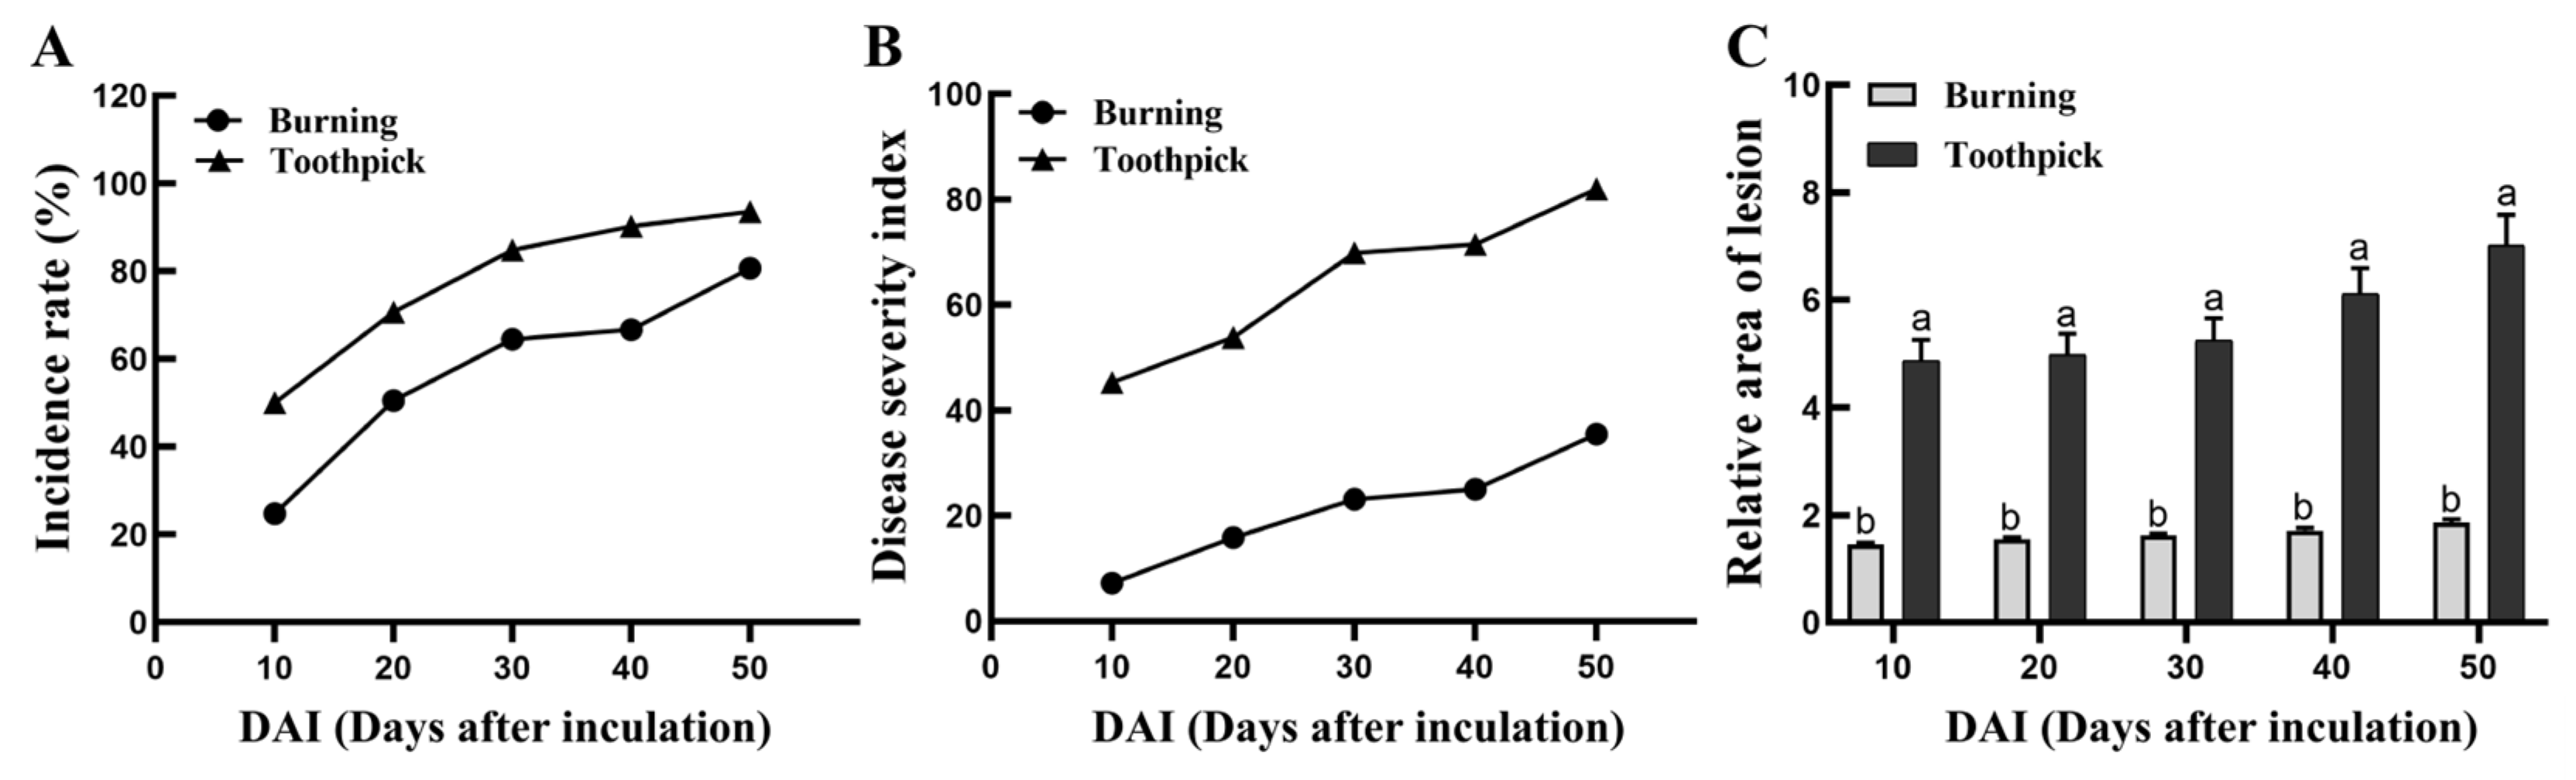
Figure 7.
Summary of relative areas of lesion at different stand densities and inoculation positions.
Figure 7.
Summary of relative areas of lesion at different stand densities and inoculation positions.
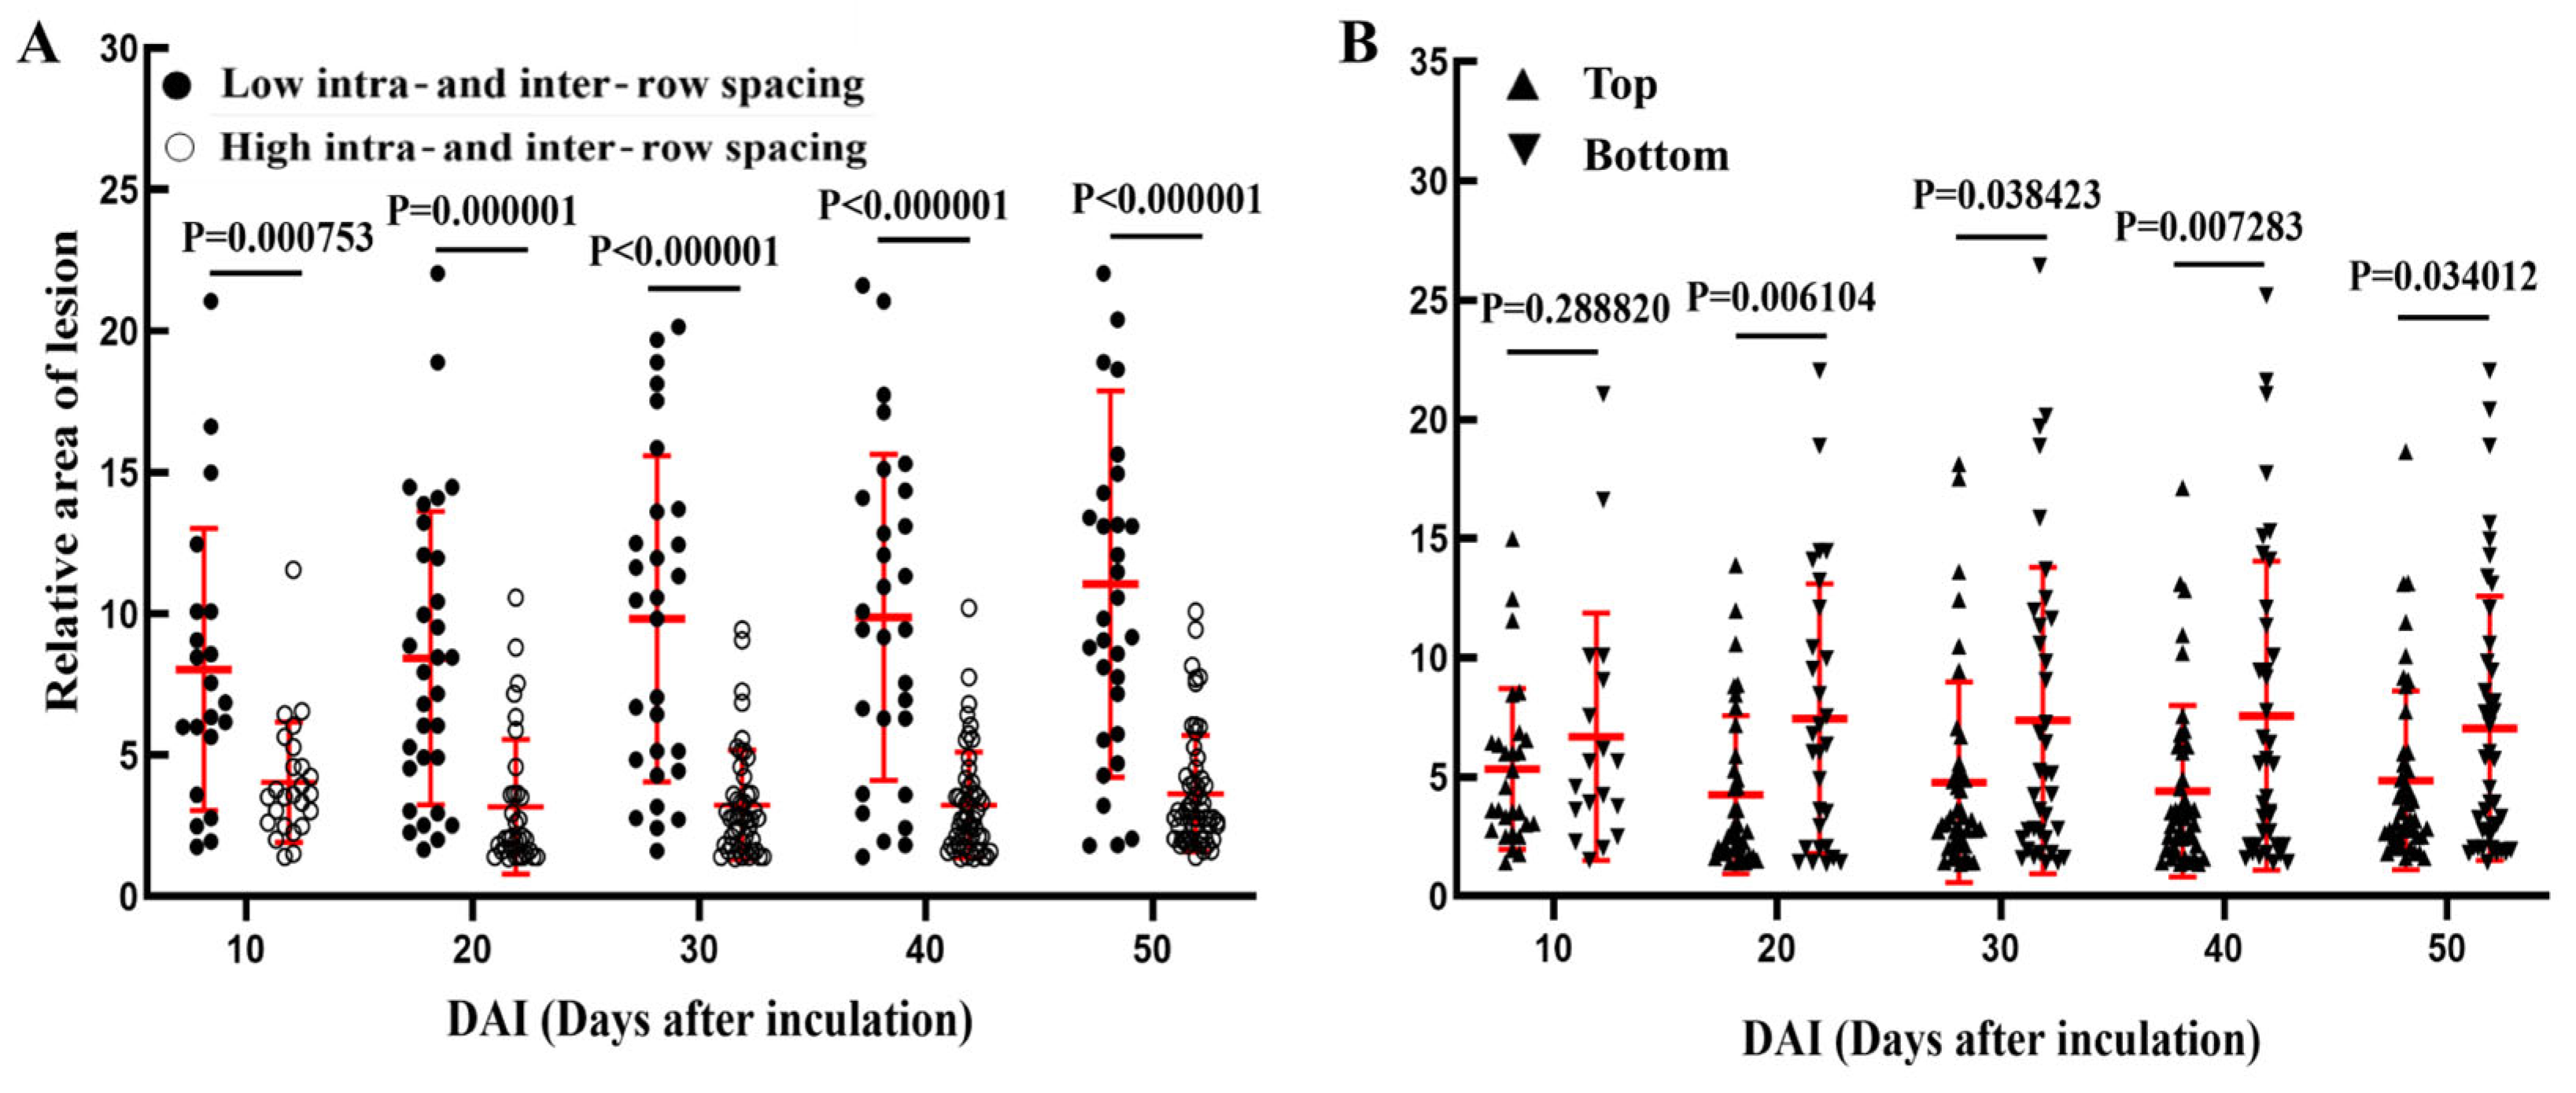
Figure 8.
Process of changes in the production of pycnidia induced by toothpick inoculation. Note: A–D, Production of pycnidia by the lesions; E, conidia under microscopy.
Figure 8.
Process of changes in the production of pycnidia induced by toothpick inoculation. Note: A–D, Production of pycnidia by the lesions; E, conidia under microscopy.
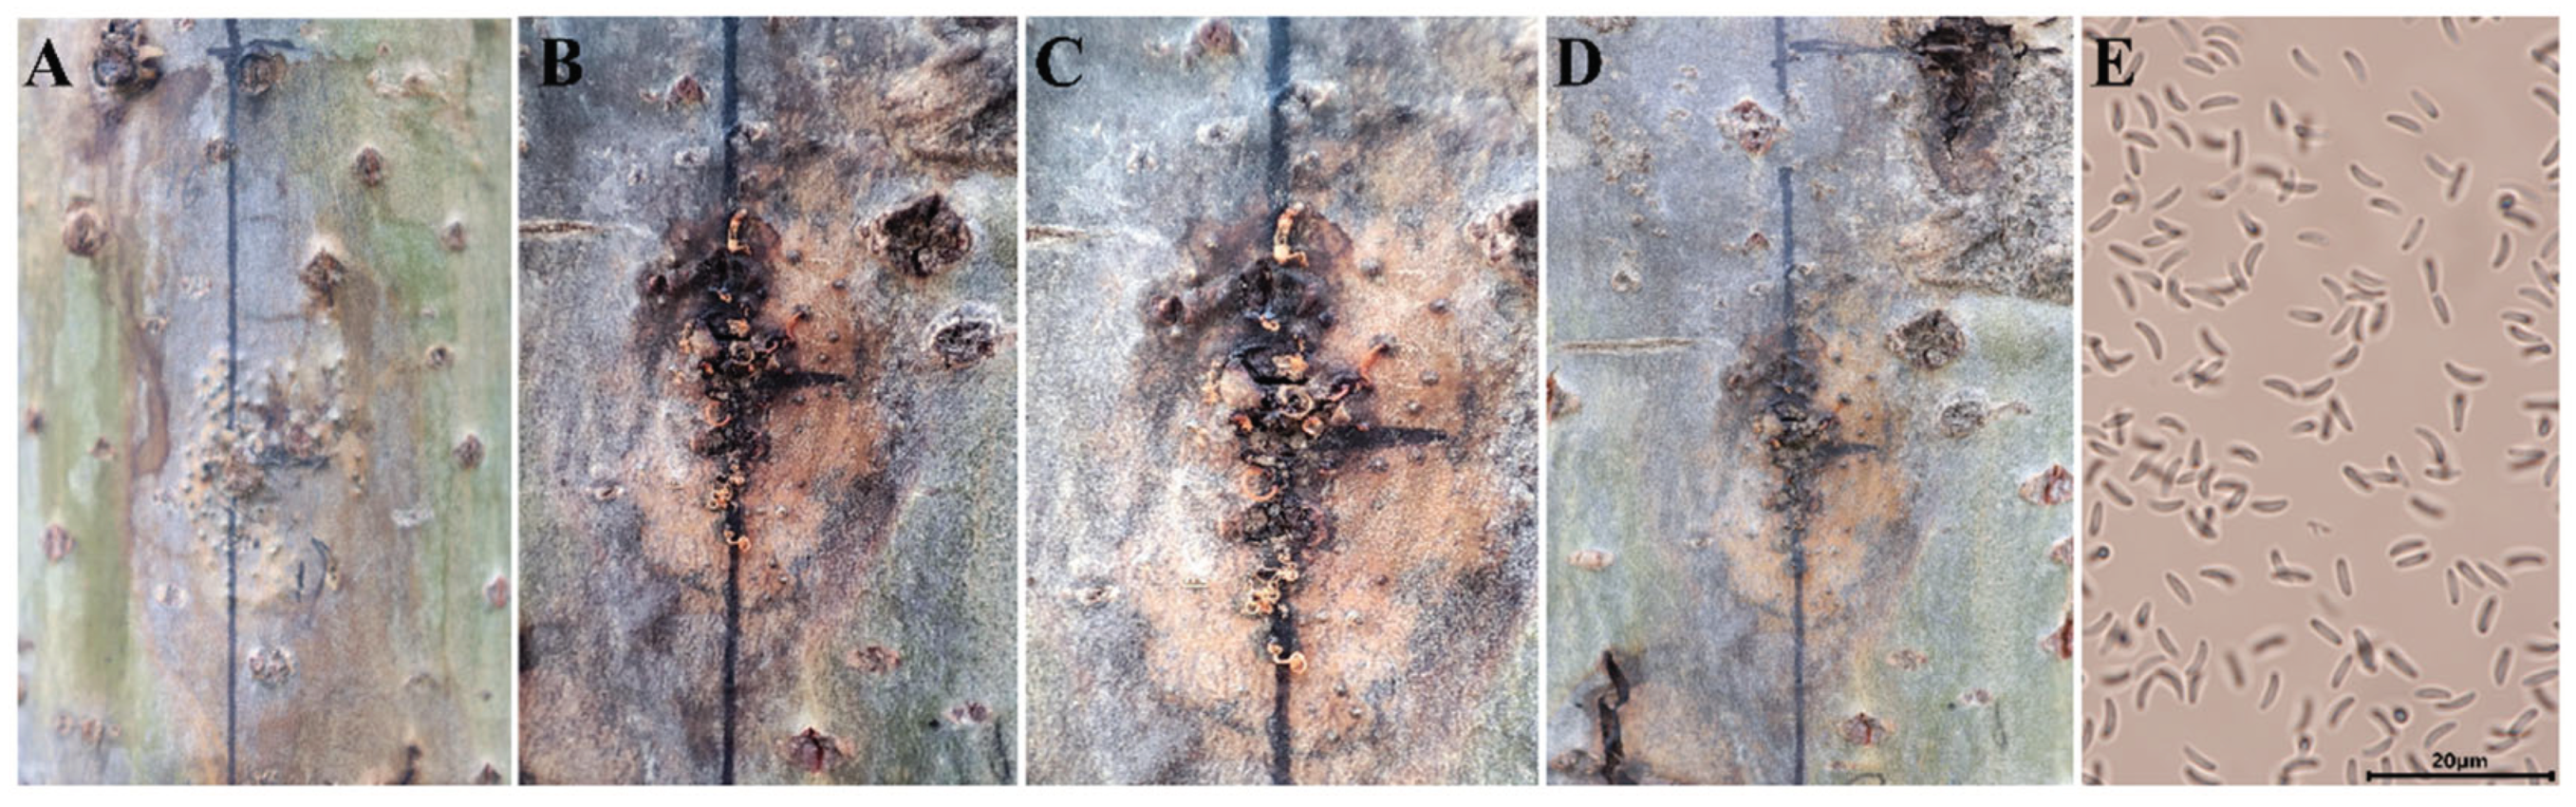
Figure 9.
Changes in the inoculation sites on the trunks of two-year-old P. alba var. pyramidalis after burning inoculation with CZA and CZC. Note: A, inoculation sites in the control group; B and C, inoculation sites in the CZA-treated group; D and E, inoculation sites in the CZC-treated group.
Figure 9.
Changes in the inoculation sites on the trunks of two-year-old P. alba var. pyramidalis after burning inoculation with CZA and CZC. Note: A, inoculation sites in the control group; B and C, inoculation sites in the CZA-treated group; D and E, inoculation sites in the CZC-treated group.
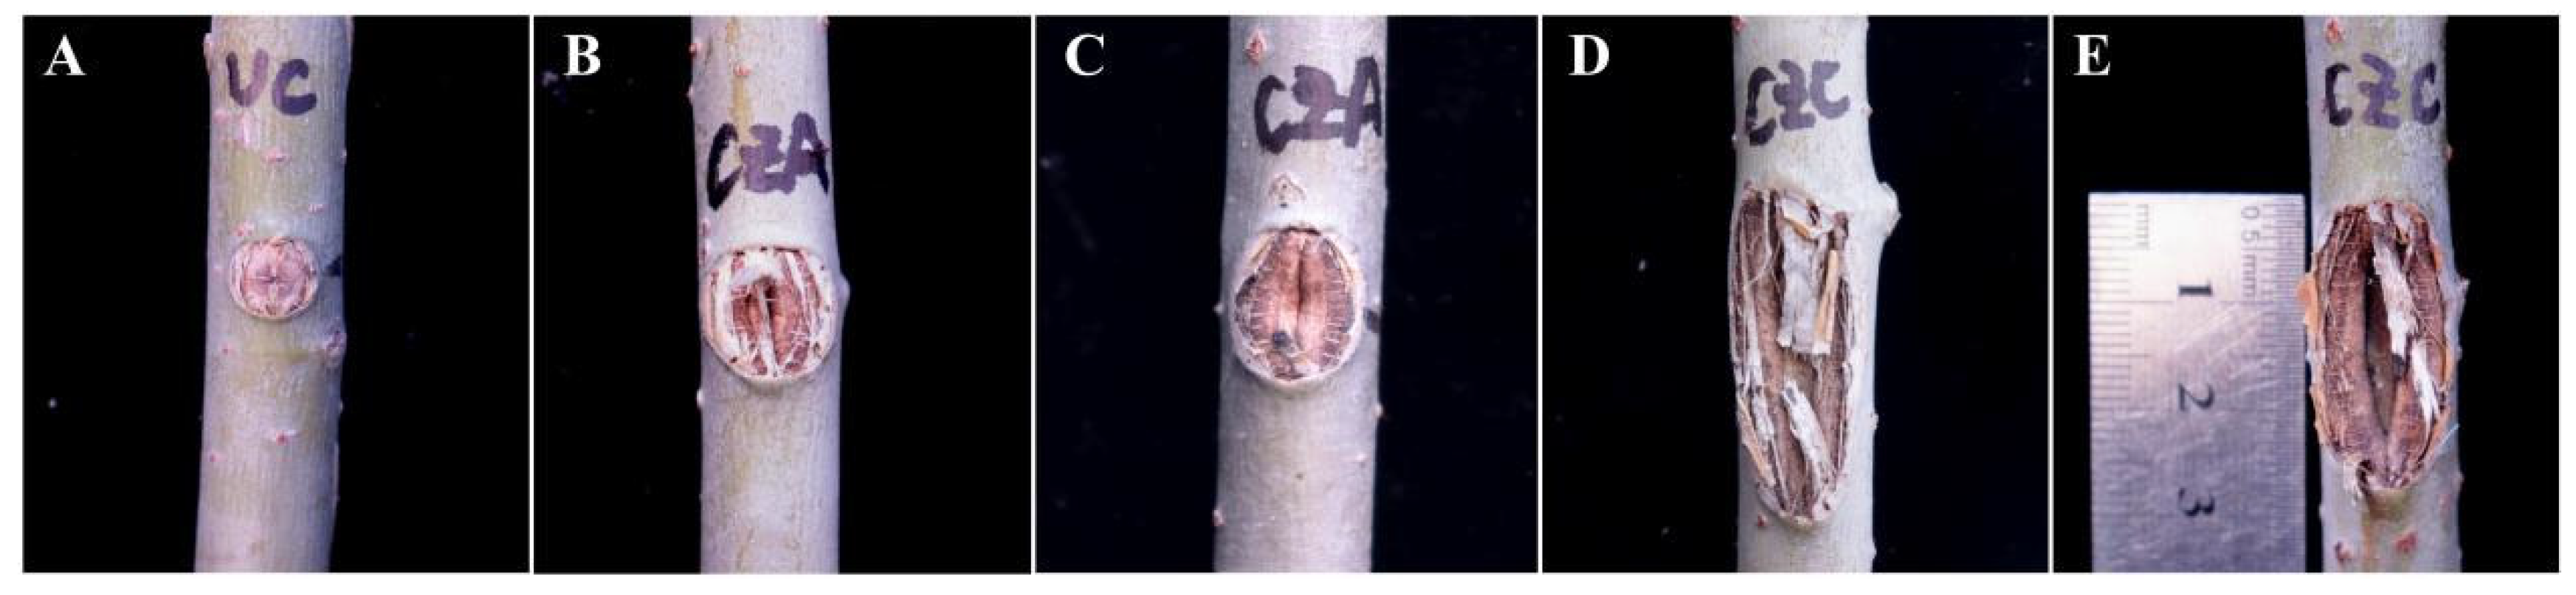
Table 2.
Summary of CZA- and CZC-induced lesions in two-year-old P. alba var. pyramidalis after burning inoculation.
Table 2.
Summary of CZA- and CZC-induced lesions in two-year-old P. alba var. pyramidalis after burning inoculation.
| Treatment | Incidence rate, % | Disease severity index | Relative lesion area | |
|---|---|---|---|---|
| 1 | CZA | 18.75 | 30.08 | 1.65±0.40 |
| 2 | CZC | 100 | 87.50 | 3.58±1.38 **** |
Note: **** p< 0.00001.
Disclaimer/Publisher’s Note: The statements, opinions and data contained in all publications are solely those of the individual author(s) and contributor(s) and not of MDPI and/or the editor(s). MDPI and/or the editor(s) disclaim responsibility for any injury to people or property resulting from any ideas, methods, instructions or products referred to in the content. |
© 2024 by the authors. Licensee MDPI, Basel, Switzerland. This article is an open access article distributed under the terms and conditions of the Creative Commons Attribution (CC BY) license (http://creativecommons.org/licenses/by/4.0/).
Copyright: This open access article is published under a Creative Commons CC BY 4.0 license, which permit the free download, distribution, and reuse, provided that the author and preprint are cited in any reuse.


