Submitted:
30 January 2024
Posted:
31 January 2024
You are already at the latest version
Abstract
Large-scale volumetric fracturing is generally used during shale gas development. The return rate of fracturing fluid is low, and a large amount of slickwater will be retained in the reservoir. The adsorption and desorption of partially hydrolyzed polyacrylamide (HPAM), an additive commonly used in slickwater, on the surface of shale was studied using Longmaxi Shale from the Sichuan Basin. The experimental results showed that the mass ratio of the HPAM solution to shale reached saturation adsorption at 20:1 when the concentration of HPAM solution was 1000 mg/L and 25:1 when the concentration of HPAM solution was 500 mg/L. The mass ratio of the HPAM solution to shale was fixed at 25:1, and the adsorption equilibrium was reached at a HPAM concentration of 1000 mg/L when the aqueous solution temperature was 30°C and 800 mg/L when the aqueous solution temperature was 60°C. The Langmuir adsorption model yielded a better fit than the Freundlich adsorption model. The adsorption equilibrium time at 30°C was at 60 min for a HPAM concentration of 500 mg/L, while for a concentration of 1000 mg/L, it was at 90 min. The adsorption equilibrium time at 60°C was 40 min for a HPAM concentration of 500 mg/L, whereas it was 60 min for a HPAM concentration at 1000 mg/L. The pseudo-second order kinetics model yielded better fits than the pseudo-first order kinetics model. The adsorption of HPAM on shale was strong, and the adsorbed HPAM resembled cobwebs adhering to the shale surface. HPAM on the surface of shale after adsorption could resist the desorption capacity of water. However, when the amount of adsorbed HPAM on shale increased significantly, the amount of residual HPAM on the surface of the shale decreased rapidly during desorption in deionized water. The desorption of HPAM on the shale surface followed a modified desorption model. The higher the concentration of HPAM adsorbed on the shale surface was, the easier it was to desorb, the easier it was to be removed from the shale.
Keywords:
shale
; partially hydrolyzed polyacrylamide
; adsorption
; desorption
; model
1. Introduction
Shale gas, as a kind of unconventional natural gas, is mainly present in shale reservoirs in the form of free and adsorbed gas, which requires the formation of an artificial seam network through volumetric fracturing in order to form high-production gas wells. Slippery water is a large category of common water-based fracturing fluids, which is formed by incorporating additives such as drag-reducing agents, filtration loss-reducing agents, proppants, surfactants, biocides, and clay stabilizers to clean water, with a water content of 96% to 99%. These fluids are therefore also known as clean-water fracturing fluids or drag-reducing water fracturing fluids. Slippery water is a non-Newtonian fluid, showing viscoelasticity and significant drag reduction effects, which can be used in operations with with large displacements, large scales, and high pumping pressures, communicating with natural cracks in the formation to realize the reservoir transformation, and it has the characteristics of easily returning to the drainage, being reusable, not easily forming filter cakes, and causing little damage to the formation. As the most important additives in slick water, drag reduction agents have become a popular research topic in recent fracturing fluids. After the fracturing of slickwater, it is necessary to return to the drainage to avoid causing damage to the shale reservoir, and most of the current research has suggested that the retention of slickwater in the shale reservoir will reduce the permeability of the reservoir, thus altering the effect of fracturing to increase production.
Most slickwater fracking designs use water with friction reducers or low concentrations of linear gels at relatively high injection rates. They typically place large masses of proppant in low-concentration slurries, requiring tremendous volumes of slickwater [1]. The benefits of slickwater treatments include significantly reduced gel damage, lower costs, higher fracture-network complexity (shale-gas reservoirs), potential for improved height containment, and environmental advantages (the ability to recycle/reuse both the load and produced water).
There have been more relevant studies on slippery water. Liu et al. [2] conducted adsorption and desorption isotherms for methane on gas shale from the Longmaxi formation before and after slickwater treatment under different slickwater volume conditions. Hong et al. [3] developed a new friction reducer and tested it in the laboratory and in the field. The new friction reducer was effective and efficient, with the following characteristics. 1) It was compatible and effective in fresh water, KCl solutions, high-salt brine, and produced water. 2) It was compatible with live breakers and other fluid additives during pumping. 3) It minimized the formation damage. 4) It was operation friendly under field conditions.
Javad et al. [4] presented experimental and case studies of various cationic and anionic friction reducers of similar molecular weight in high-brine flow-back conditions of produced water from the Montney reservoir and a Horn River source well. The actual produced water and fingerprint water analyses of the Montney and Horm River shale reservoirs were used as a brine source to evaluate the friction reducers. A dynamic friction loop flow apparatus was used as the main tool to evaluate the rheological properties and the friction reduction contributions of friction reducers in high-concentration brine water. Ahmed F et al. [5] introduced a friction reducer with an enhanced proppant-carrying capacity. The friction reducer performance was evaluated with different experimental measurements and compared with two conventional friction reducers. Viscosity measurements were conducted to investigate the breakability of the new friction reducer with different breakers. The friction-reduction performance was evaluated at different salt concentrations (5 to 20 wt% KCl) and breaker types. The proppant-carrying capacity was examined with static and dynamic settling tests. Finally, coreflood experiments in tight sandstone cores at 150°F were conducted to assess the formation damage.
Polyacrylamide adsorption has been examined in various studies. Based on molecular simulations of polymers and polymer flooding process visualizations, Jianping Xu et al. [6] studied the microscopic seepage mechanism of polymer flooding, enriching the theoretical knowledge of polymer flooding flow. This study involved microscopic level analysis of the nature and mechanism of the polymer flooding process of viscoelastic polymer solutions, considering the interactions between molecules and between the molecules and walls for molecular particle flow in internal pores. Lew et al. [7] provided a study of the adsorption of three types of hydrolyzed polyacrylamide (HPAMs) of different molecular weight (F3330S, 11-13 MDa; F3530 S, 15-17 MDa; F3630S, 18-20 MDa) onto calcium carbonate (CaCO3) particles via spectrophotometry using a Shimadzu UV-2600 spectrometer. Goshtasp et al. [8] studied the role of nanoparticles in the adsorption of water-soluble polymers onto solid surfaces of carbonate and sandstone. The results showed that the lithology, brine concentration, and polymer viscosity are critical parameters influencing the adsorption behavior at a rock interface. Mohan et al. [9] studied the adsorption of HPAM using the QCM-D (Quartz Crystal Microbalance with Dissipation) technique with sensors that were coated with either silica or alumina. Li et al. [10] studied the adsorption behavior and adsorption mechanism between polyacrylamide (PAM) and shale and found that hydrogen bonding was the key force. Xu et al. [11] explored the microscopic adsorption mechanism of shale inhibitors on the surface of montmorillonite. The simulation results showed that CPAM could stably adsorb and occupy the adsorption sites on the surface of montmorillonite.
In this study, the Longmaxi Shale from the Sichuan Basin was selected as the research object. The adsorption characteristics and influencing factors of partially hydrolyzed polyacrylamide(HPAM), a commonly used additive for slickwater, on the surface of shale and the desorption characteristics of HPAM on the surface of shale were determined. The adsorption and desorption processes were characterized and analyzed using relevant models, which will be helpful for the in-depth study of the retention characteristics of slickwater in shale reservoirs.
2. Experimental Details
2.1. Experimental Materials and Equipment
The experimental materials used included partially HPAM with a molecular weight of 16 million and a degree of hydrolysis of 30% (Beijing Top North Science and Technology Development Co. Ltd.), 5 mol/L acetic acid solution, 1.31% sodium hypochlorite, and 5-6 mesh core blocks from the outcrops of the Longmaxi shale in Sichuan Province, which were provided by Chuanqing Drilling Co.
The experimental instruments were as follows: a UV2601 dual-beam scanning ultraviolet-visible spectrophotometer (Beifen Ruili Instrument Co. Ltd.), YC-S30 thermostatic water-bath oscillator (Tianjin Taiste Instruments Co. Ltd.), H4-20K high-speed centrifuge (Hunan Kecheng Instrument Co. Ltd.), SmartLab-9 intelligent rotary-target X-ray diffractometer (Rigaku Instruments Co. Ltd., Japan), and JSM-7800F field-emission scanning electron microscope (NEC Instruments Co. Ltd., Japan).
2.2. Experimental Methods
2.2.1. Method for Determination of Shale Clay Fractions
Three 5-6 mesh outcrop shale blocks of the test shale were taken and ground separately, passed through a 100 mesh sieve, put into vacuum drying oven, and dried at 50°C and 0.090 MPa vacuum for 48 h. The shale was fully ground with agate mortar and analyzed by X-ray diffraction (XRD) to determine the physical composition of the shale.
2.2.2. Determination of HPAM Concentration and Adsorption and Desorption Test Experiments
The concentration of the HPAM solution was determined using the turbidimetric method. A certain volume of polymer detection solution was added to a cuvette, an acetic acid solution was added, and the mixture was gently shaken well. After standing for 1-2 min, sodium hypochlorite solution was added, and the solution was shaken well. When the precipitation reaction was complete, the solution became turbid. It was added to a cuvette, and with a double-beam scanning-type ultraviolet (UV)-visible spectrophotometer at a wavelength of 470 nm, the absorbance was measured. The effective concentration of HPAM in the aqueous solution was determined using distilled water blank as a reference.
In order to test the concentration of the HPAM solution, the shale outcrop core was crushed and ground to 5-6 mesh. Next, 5 g of the sample was weighed, the HPAM solution was placed in 250 mL stoppered triangular vials with the shale core samples at a certain concentration and ratio of liquid to solid, and the vials were corked. HPAM was adsorbed in a constant - temperature water-bath oscillator with a horizontal reciprocating oscillation frequency of 120 times/min, and after adsorption for a certain period of time, the supernatant was taken and centrifuged for 2 min (rotation speed of 2000 r/min), and the intermediate layer was extracted to test the HPAM concentration in the aqueous phase. The amount of HPAM adsorbed on the surface of the shale was obtained based on the concentration of HPAM in the aqueous solution as follows:
where C0 and C are the initial concentration of HPAM and the concentration of the sample after adsorption (mg/L), respectively, V is the volume of HPAM solution added (mL), ω is the mass of shale added (g), and Γ is the amount of HPAM adsorbed (mg/g).
Similarly, to determine the amount of HPAM on the surface of the shale after desorption, the supernatant in the centrifuge tube of the adsorption isotherm experiment was poured out, weighed together with the shale residue, and then added into an aqueous solution. The desorbed liquid was collected after 24 h of shaking, and the desorption process was repeated once. The desorbed liquid was mixed to obtain HPAM, and the concentration was measured. The desorbed amount was calculated as follows:
where Γd is the amount of desorbed HPAM (mg/kg), C1 is the concentration of HPAM at adsorption equilibrium (mg/L), C2 is the concentration of HPAM at the end of desorption (mg/L), V is the total volume of desorption (mL), W2 is the mass of the centrifugal tubes and shale residue (g), W1 is the mass of initial centrifugal tube plus the rock sample (g), and ω is the mass of added shale (g).
2.2.3. Adsorption test of HPAM by Liquid–solid Ratio
The liquid–solid proportional adsorption equilibrium tests were carried out using a thermostatic oscillator shaker with the parameters set at 30°C and 120 r/min. The concentrations of HPAM were 500 and 1000 mg/L. The HPAM solution and 5-6 mesh shale were mixed in 250 mL conical flasks at liquid–solid ratios (the mass ratio of the HPAM solution to shale) of 5:1, 10:1, 15:1, 20:1, 25:1, 30:1, and 35:1. The flasks were corked, put into a constant-temperature shaker, and sampled after 2 h. Samples were taken after 2 h, and the amounts of adsorbed HPAM under different liquid-solid ratios were determined using the experimental method described in Section 2.2.2.
2.2.4. HPAM Adsorption Isotherm Test
The concentrations of HPAM were 100, 200, 500, 800, 1000, 1500, and 2000 mg/L. The mass ratio of the HPAM solution to shale was fixed at 25:1. A conical flask was put into a constant-temperature shaker, and the parameters of the shaker were a temperature of 30°C and rotation speed of 120 r/min. Samples were taken after 2 h, and the amounts of adsorbed HPAM in shale under the different concentration conditions were determined using the experimental method described in Section 2.2.2.
In this paper, the adsorption isotherm parameters and regression equations were determined by fitting the Langmuir and Freundlich isotherm models. The Langmuir isotherm model is an empirical model based on kinetics principles, i.e., at equilibrium, the surface rates of adsorption and desorption are equal and there is zero accumulation. The Langmuir isotherm model expression is given by
where qe is the adsorption equilibrium (mg/g), Ce is the liquid-phase equilibrium concentration (mg/L), qo is the maximum adsorption per unit mass of surfactant (mg/g), and KL is the Langmuir constant (L/mg). The Langmuir isotherm model can be written as
The plot of Ce/qe vs. Ce will produce a line with a slope of 1/qo and an intercept equal to 1/KLqo.
Unlike the Langmuir isotherm, the Freundlich isotherm model can be used for multilayer adsorption on non-uniform sites. This model assumes that the adsorption heat distribution and affinity for non-uniform surfaces are inhomogeneous. The Freundlich isotherm model is
where qe is the amount adsorbed per unit weight of adsorbent at adsorption equilibrium (mg/g), Ce is the liquid-phase equilibrium concentration (mg/L), b is the adsorption capacity (L/mg), and 1/n is the adsorption strength or surface heterogeneity. Adsorption is considered favorable when 0 < 1/n < 1. Unfavorable adsorption occurs when 1/n > 1 and is irreversible when 1/n = 1. The linearized form can be written as
The plot of lnqe versus lnCe produces a straight line with a slope of 1/n and an intercept of lnb.
2.2.5. HPAM Adsorption Kinetics Test
The concentrations of HPAM were 500 and 1000 mg/L. The mass ratio of HPAM solution to shale was fixed at 25:1 in 250 mL conical flasks, which were put into a constant-temperature shaker at a temperature of 30°C and a rotation speed of 120 r/min. Samples were taken at 10, 20, 30, 40, 60, 90, and 120 min, and the amounts adsorbed on the shale were determined at different times using the method described in Section 2.2.2. The samples were taken at 10, 20, 30, 40, 60, 90, and 120 min, and the amounts of adsorbed HPAM on the shale were determined at different times using the method described in Section 2.2.2.
The adsorption kinetics of HPAM were studied by fitting the pseudo-first order (PFO) and pseudo-second order (PSO) kinetics equations and obtaining the adsorption rate constants. For the PFO reaction kinetics, there is a simple linear relationship between the reaction rate and the concentration of one reactant:
where qt is the amount adsorbed at time t (mg/g), qe is the amount adsorbed when equilibrium is reached (mg/g), t is the adsorption time (min), and k1 is the adsorption rate constant (min-1). Equation (2.7) is based on the amount adsorbed in a liquid-solid system and assumes that the rate of change of the uptake of the adsorption with time is proportional to the difference in the saturated concentration and the change in the uptake of solids over time. The degrees of fit of the respective kinetics models were evaluated based on the values of the coefficient of determination R2.
The PSO kinetics equation based on the adsorption equilibrium capacity assumes that the occupancy of adsorption sites is proportional to the square of the number of unoccupied sites and that the adsorbed ion rate is related to the concentration of active centers on the adsorbent surface. The PSO adsorption rate equation is
where qe is the amount adsorbed at adsorption equilibrium (mg/g), qt is the amount adsorbed at adsorption time t (mg/g), and k2 is the PSO kinetics model rate constant (g/(mg·min)).
2.2.6. Microstructural Analysis of Shale Adsorbed HPAM
Shale with adsorbed HPAM in water was frozen using liquid nitrogen and then vacuum sprayed with gold, and the microstructure of the shale after adsorption of HPAM was analyzed using scanning electron microscopy (SEM).
2.2.7. HPAM Desorption Test
The shale outcrop core was crushed and ground to 5-6 mesh. The HPAM concentrations were 500 and 1000 mg/L, and the mass ratio of HPAM solution to shale was fixed at 25:1. The mixed samples were placed in 250 mL triangular vials with stoppers and put into constant-temperature shaker oscillator at a shaking table temperature of 30°C. The constant-temperature water bath oscillator temperature was set at 30°C. The reciprocating oscillation frequency was 120 times/min, so that it was fully adsorbed for 2 h. The adsorption of HPAM saturated shale occurred in 250 mL stoppered triangular vials. Deionized water was added so that the weight ratio of deionized water to the shale core samples gradually increased from 1:1 to 35:1. The flasks were sealed with stoppers in a thermostatic bath oscillator with a horizontal reciprocating oscillation frequency of 120 times/min to allow adsorption to occur. After 2.5 h, the supernatant was centrifuged for 2 min (rotation speed 2000 r/min), and the intermediate layer was extracted to test the concentration of HPAM in the aqueous phase. The concentration of HPAM in the aqueous solution was used to obtain the residual amount of HPAM adsorbed on the surface of the shale.
There have been fewer studies on mathematical models of HPAM desorption. In this study, we used the desorption model proposed by Chen et al. [12] in the study of agrochemistry. The relationship between the residual HPAM concentration on the surface of the shale after desorption and the water–solid ratio can be described by the following equation:
Equation 2.9 can be used to calculate the desorbed amount, but due to the much more complex nature of the desorption experiments, the vast majority of the dynamic features of desorption are not captured by this model. For this reason, a correction to Equation 2.9 is required. Based on the measured results and the adsorption dynamic characteristics, the process can be described by adding a correction term to Equation 2.9, i.e.,
where the parameters ∂ and λ describe the variation trend of C with H. A larger value of λ indicates the faster rate of decline of the dynamic curve, i.e., as the water-solid ratio increases, the HPAM concentration decreases faster. Thus, the larger the value of λ is, the lower the buffering capacity of shale for HPAM desorption is.
3. Experimental and Analysis
3.1. Mineral Composition of Shale Clay
The mineral composition of shale generally includes brittle minerals, clay minerals, and small amounts of self-generated minerals. Brittle minerals can form a large number of natural and induced fractures under the action of external forces, which provides storage space and circulation channels for shale gas. Clay minerals are unstable factors in the transformation of mudstone reservoirs, especially expansive clays, which can easily lead to the blockage of shale-gas-producing fracture channels due to their dissolution and expansion when the content is high. This affects the output of shale gas.
The physical composition of the shale was analyzed using XRD, as shown in Table 3.1. The results showed that the average content of dolomite in the sample of Longmaxi shale from Sichuan Basin was the highest, accounting for 61.93% of the total mineral composition, followed by calcite and quartz, accounting for 12.83% and 9.47% of the total mineral composition, respectively, and then by pyrite and clay minerals, which had the lowest contents of all of the minerals, with average values of 7.00% and 5.07%, respectively. Thus, the tested rock sample was weakly expansive shale. Quartz, plagioclase feldspar, calcite, and dolomite are brittle minerals, whose average contents were as high as 88.16%, which is typical of hard and brittle shale.

Table 3.1.
X-diffraction mineral composition of shale minerals.
| Sapphire | Plagioclase | Calcite | Dolomite | Pyrite | Clay | |
|---|---|---|---|---|---|---|
| 1 | 9.3 | 3.3 | 13.5 | 62.6 | 6.2 | 5.1 |
| 2 | 10.5 | 4.1 | 11.3 | 57.8 | 9.1 | 7.2 |
| 3 | 8.6 | 3.7 | 13.7 | 65.4 | 5.7 | 2.9 |
| Average | 9.47 | 3.7 | 12.83 | 61.93 | 7.00 | 5.07 |
3.2. Effect of Liquid-solid Ratio on Adsorption of HPAM
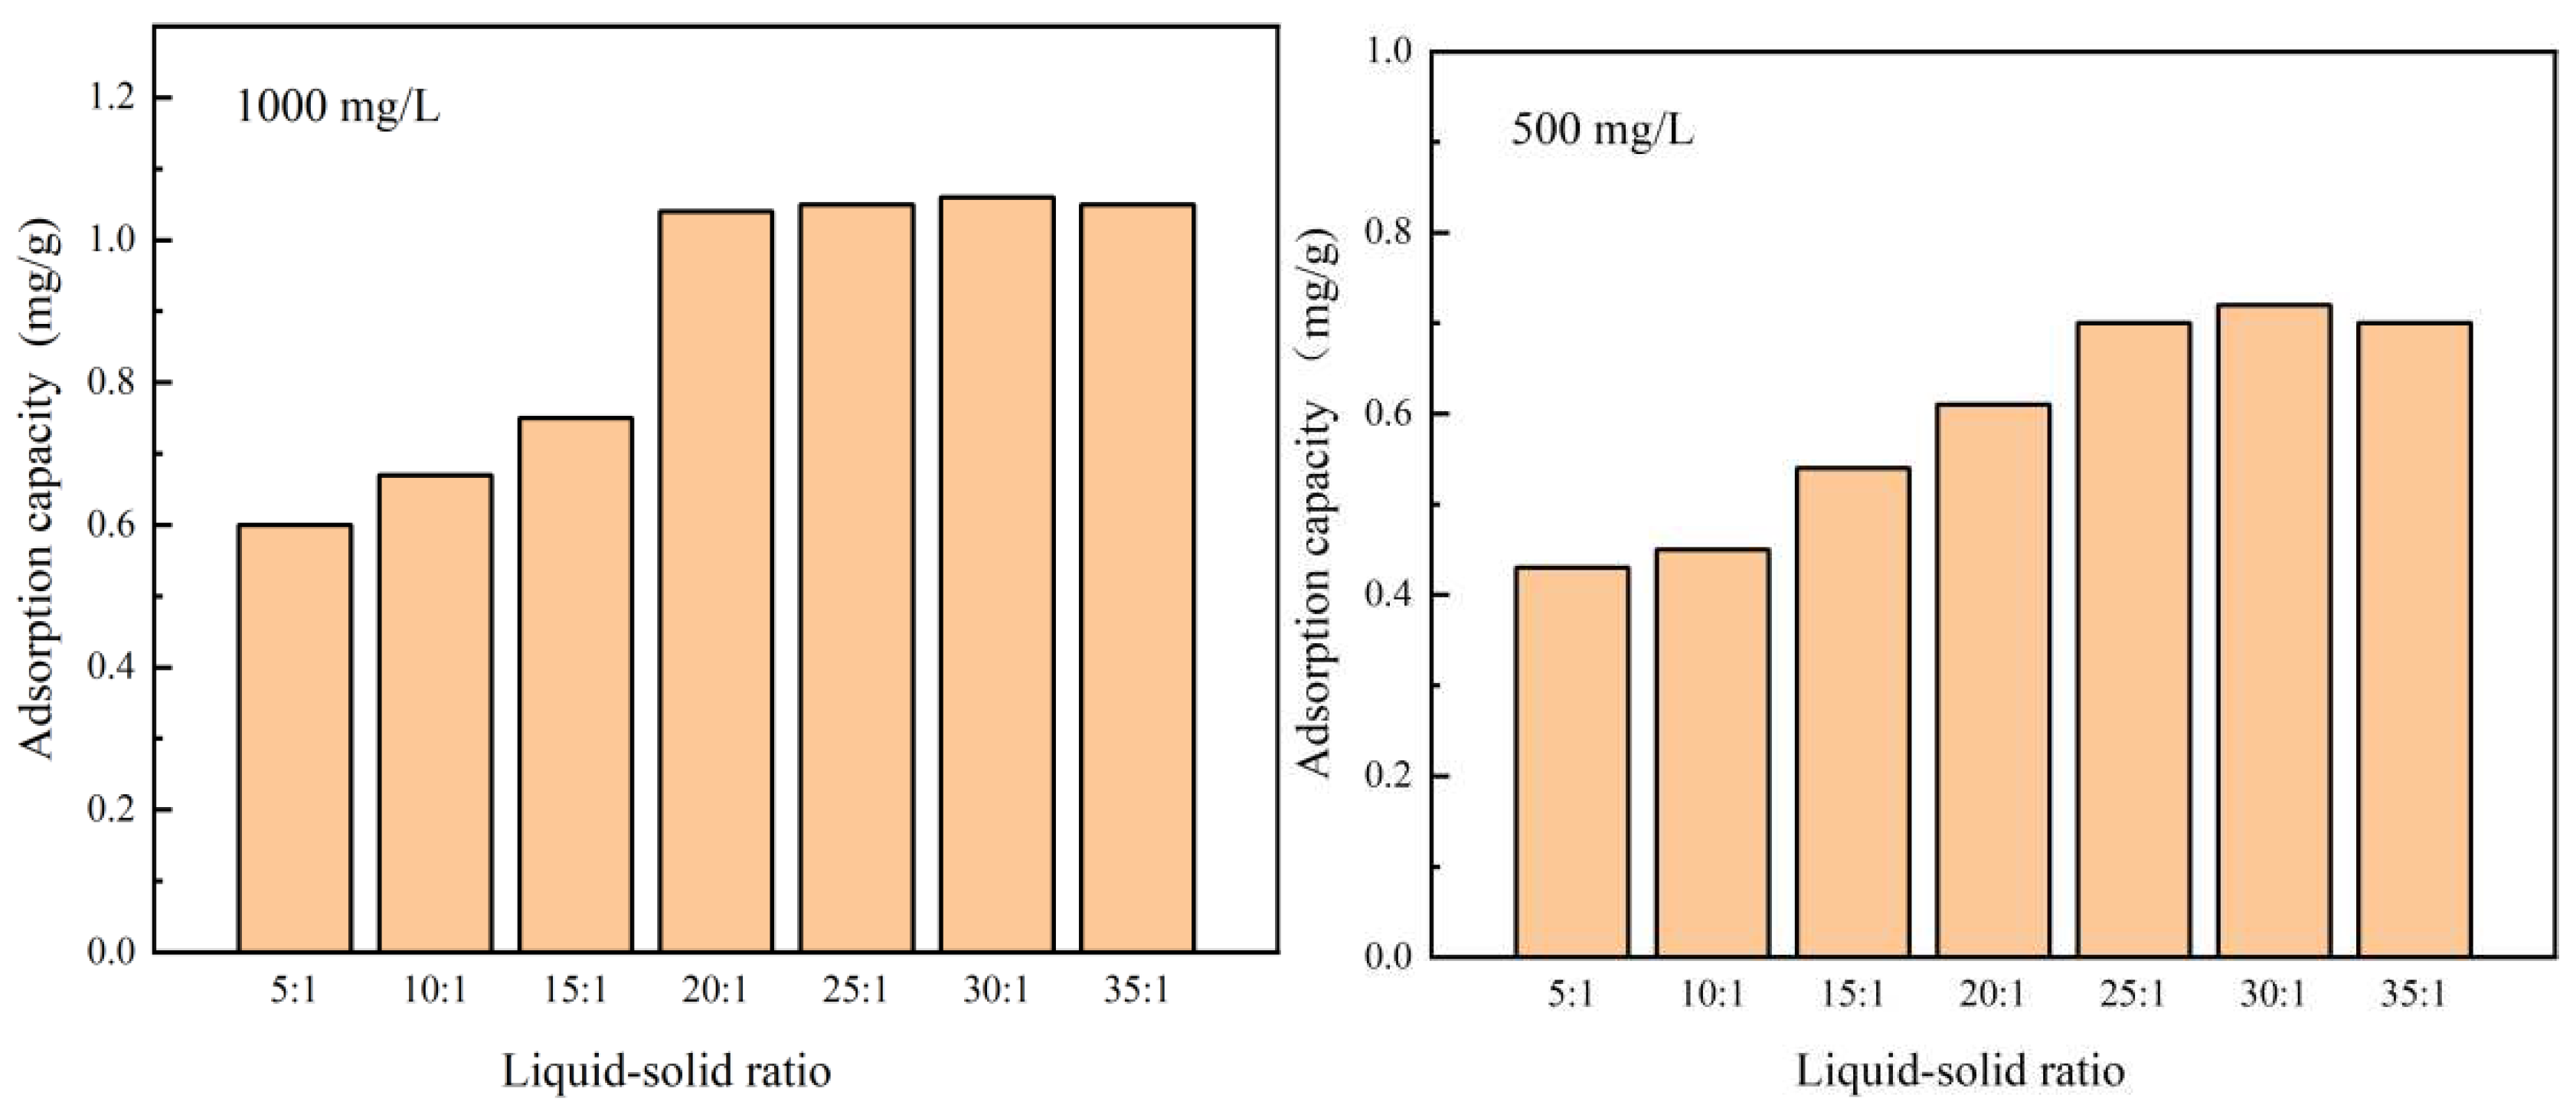
The effect of different liquid-solid ratios on the effect of HPAM adsorption on shale is shown in Figure 3.1. The experimental results showed that the amount of adsorbed HPAM on the surface of shale increased rapidly with the increase in the liquid-solid ratio. When the concentration of the HPAM solution was 1000 mg/L, the liquid-solid ratio was greater than 20:1. The amount of adsorbed HPAM on the shale underwent a small change, which indicated that the liquid-solid ratio for the saturated adsorption of HPAM in shale at this concentration was 20:1. When the concentration of HPAM solution was 500 mg/L, the liquid-solid ratio was greater than 25:1, the amount of adsorbed HPAM on the shale did not change significantly, which indicated that the liquid-solid ratio for the saturated adsorption of HPAM in shale at this concentration was 25:1. The reason for the different adsorption patterns in the test was mainly related to the amount of HPAM in the solution. With the gradual increase in the ratio of the HPAM solution to shale, the influence of the liquid-solid ratio on the amount of shale adsorption gradually became smaller. Because the ratio increased, the amount of HPAM in the aqueous solution increased, and the amount of HPAM adsorbed by the shale increased. When the amount of adsorbed HPAM reached saturation, the adsorbed amount no longer increased. At this time, when the liquid-solid ratio was increased, the amount of HPAM adsorbed on the surface of the shale stabilized.
Figure 3.1.
Effect of liquid-solid ratio on adsorption on shale for different HPAM concentrations.
3.3. HPAM Adsorption Isotherm
The amounts of adsorbed HPAM on shale for different HPAM concentrations are shown in Table 3.2. The experimental results showed that the adsorbed amounts were small when the concentrations of the HPAM solutions were low. The amount of adsorbed HPAM on the shale samples became larger and tended to stabilize with the gradual increase in the HPAM concentration. Adsorption equilibrium was reached when the concentration of HPAM in the aqueous solution was 1000 mg/L at 30°C and 800 mg/L at 60°C. The adsorption isotherms were fitted to the experimental results of HPAM adsorption on shale, and in this paper, the Langmuir and Freundlich models were used for fitting.
Table 3.2.
Adsorption capacities for different HPAM concentrations.
| Adsorption capacity mg/g |
100 mg/L |
200 mg/L |
500 mg/L |
800 mg/L |
1000 mg/L |
1500 mg/L |
2000 mg/L |
|---|---|---|---|---|---|---|---|
| 30°C | 0.23 | 0.44 | 0.71 | 0.95 | 1.05 | 1.06 | 1.05 |
| 60°C | 0.16 | 0.31 | 0.51 | 0.71 | 0.71 | 0.71 | 0.72 |
The Langmuir model was fitted with 1/Ce as the horizontal coordinate and 1/qe as the vertical coordinate, while the Freundlich model was fitted with lnCe as the horizontal coordinate and lnqe as the vertical coordinate. Straight lines were fitted, and the experimental parameters of the two models were obtained. The two adsorption isotherms for the shale adsorption of HPAM are shown in Figure 3.2. The isotherms of the shale adsorption of HPAM were fitted using the Langmuir and Freundlich models, and the parameters of the two models were obtained, as shown in Tables 3.3 and 3.4, respectively.
Figure 3.2.
Fitting of adsorption isotherm equations for HPAM solutions.
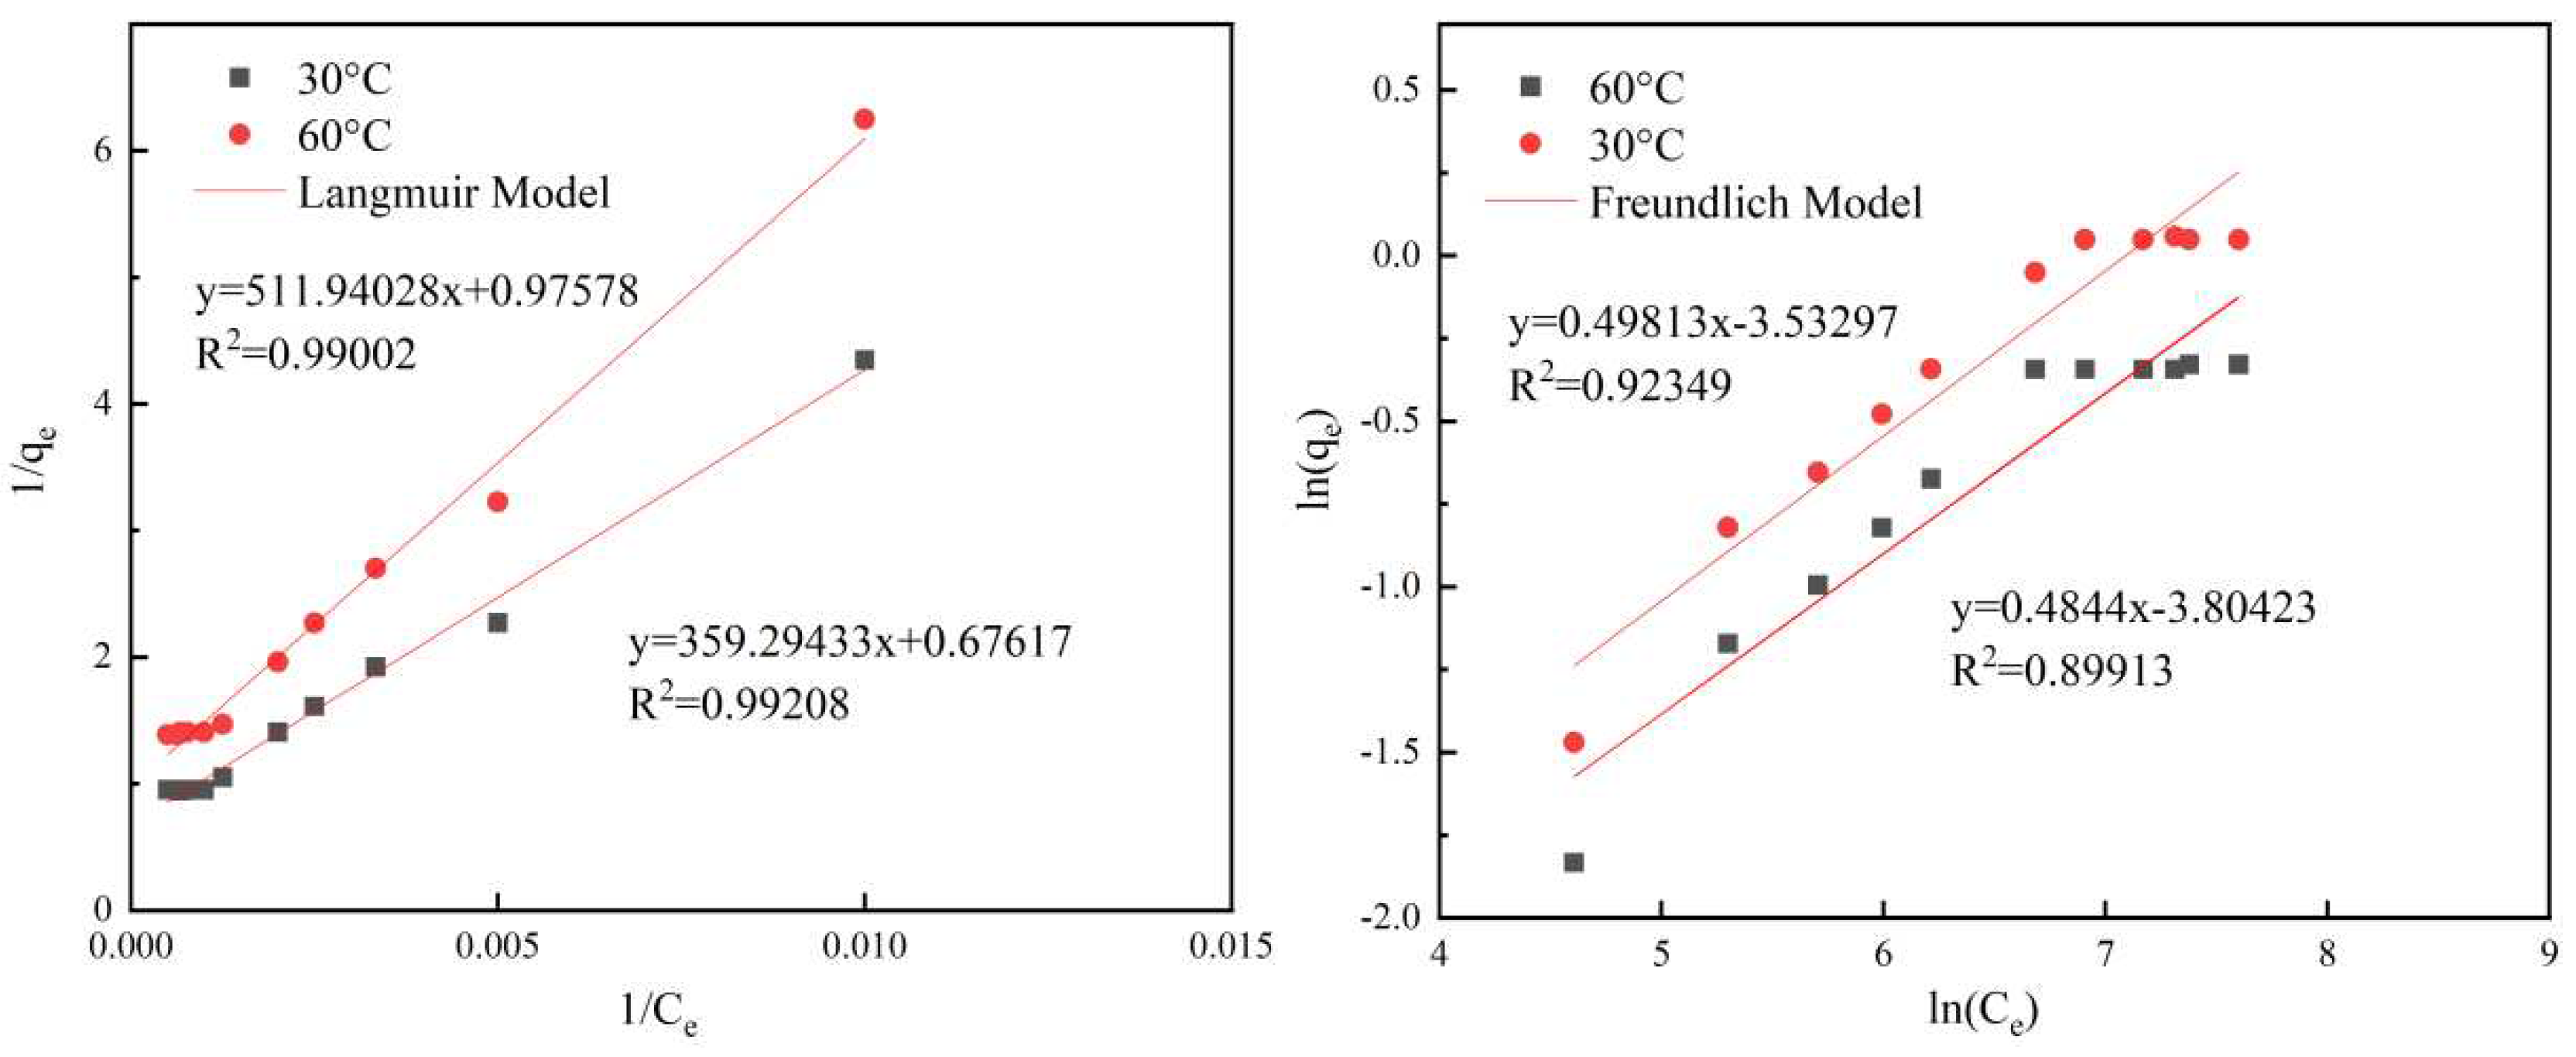
Table 3.3.
Langmuir adsorption isotherm model parameters.
| Parameter | 30°C | 60°C |
|---|---|---|
| KL (L/mg) | 531.36685 | 524.64715 |
| qo (mg/g) | 1.478918 | 1.024821 |
| R2 | 0.99208 | 0.99002 |
| Equation | y = 359.29433x + 0.67617 | y = 511.94028x + 0.97578 |
Table 3.4.
Parameters of the Freundlich adsorption isotherm model.
| Parameter | 30°C | 60°C |
|---|---|---|
| 1/n | 0.49813 | 0.4844 |
| KF | 0.02921 | 0.02227 |
| R2 | 0.92349 | 0.89913 |
| Equation | y = 0.49813x − 3.53297 | y = 0.4844x − 3.80423 |
The results of linear fitting of the Langmuir and Freundlich models using Origin Pro 9.0 are shown in Figure 3.2. The experimental results showed that the Langmuir model equations of the HPAM solution at 30°C and 60°C were well fitted with R2 values of 0.99208 and 0.99002, respectively, and the corresponding R2 values for the Freundlich model equation fit were 0.92349 and 0.89913. It can be seen that the adsorption of HPAM on shale was better captured by the Langmuir adsorption model. This indicated that the adsorption of HPAM on the surface of the shale was relatively uniform, there were no interactions between the adsorbed molecules, and the adsorption was dominated by the characteristics of mono-molecular layer adsorption, resulting in the maximum equilibrium adsorption amount. The maximum amounts of adsorbed HPAM adsorbed on the shale were 1.05 and 0.71 mg/g at 30°C and 60°C, respectively. The amount of adsorbed HPAM on the shale decreased with the increase in the temperature, which indicated that this process was an exothermic process, and high-temperature conditions were not conducive to the adsorption of HPAM on the surface of the shale.
3.4. HPAM Adsorption Kinetics
The equilibrium adsorption amounts of the shale samples at different times and temperatures are shown in Table 3.5, and the experimental results showed that the adsorption amount tended to increase with the increase in the adsorption time. The experimental results showed that the adsorption equilibrium time was 60 min at 30°C for a HPAM concentration of 500 mg/L and 90 min for a HPAM concentration of 1000 mg/L. The adsorption equilibrium time at 60°C was 40 min for the HPAM concentration of 500 mg/L and 60 min for the HPAM concentration of 1000 mg/L. This showed that the adsorption equilibrium time was relatively shorter for the lower HPAM concentration at the same temperature. With the same HPAM concentration, the adsorption equilibrium time was relatively shorter when the temperature was higher.
Table 3.5.
HPAM adsorption capacity.
| Time/min | 10 | 20 | 30 | 40 | 60 | 90 | 120 | |
|---|---|---|---|---|---|---|---|---|
| 30°C | 500 mg/L | 0.2 | 0.34 | 0.43 | 0.5 | 0.67 | 0.7 | 0.71 |
| 1000 mg/L | 0.25 | 0.5 | 0.63 | 0.73 | 0.9 | 1.02 | 1.05 | |
| 60°C | 500 mg/L | 0.14 | 0.24 | 0.31 | 0.48 | 0.50 | 0.50 | 0.51 |
| 1000 mg/L | 0.18 | 0.36 | 0.45 | 0.57 | 0.7 | 0.71 | 0.72 | |
In order to investigate the HPAM adsorption kinetics on shale, the experimental data were fitted with the PFO and PSO kinetics equations, respectively, and the results of the fitting were examined based on the R2 values of the equations obtained from the linearization of each model. The PFO kinetics equation was plotted as ln(qe − qt) versus t, and the PSO kinetics equation was plotted as t/qt versus t. The two adsorption kinetics models for shale adsorption of HPAM are shown in Figure 3.3, and the parameters of the two models are shown in Table 3.6.
Figure 3.3.
Plot of different model fits.
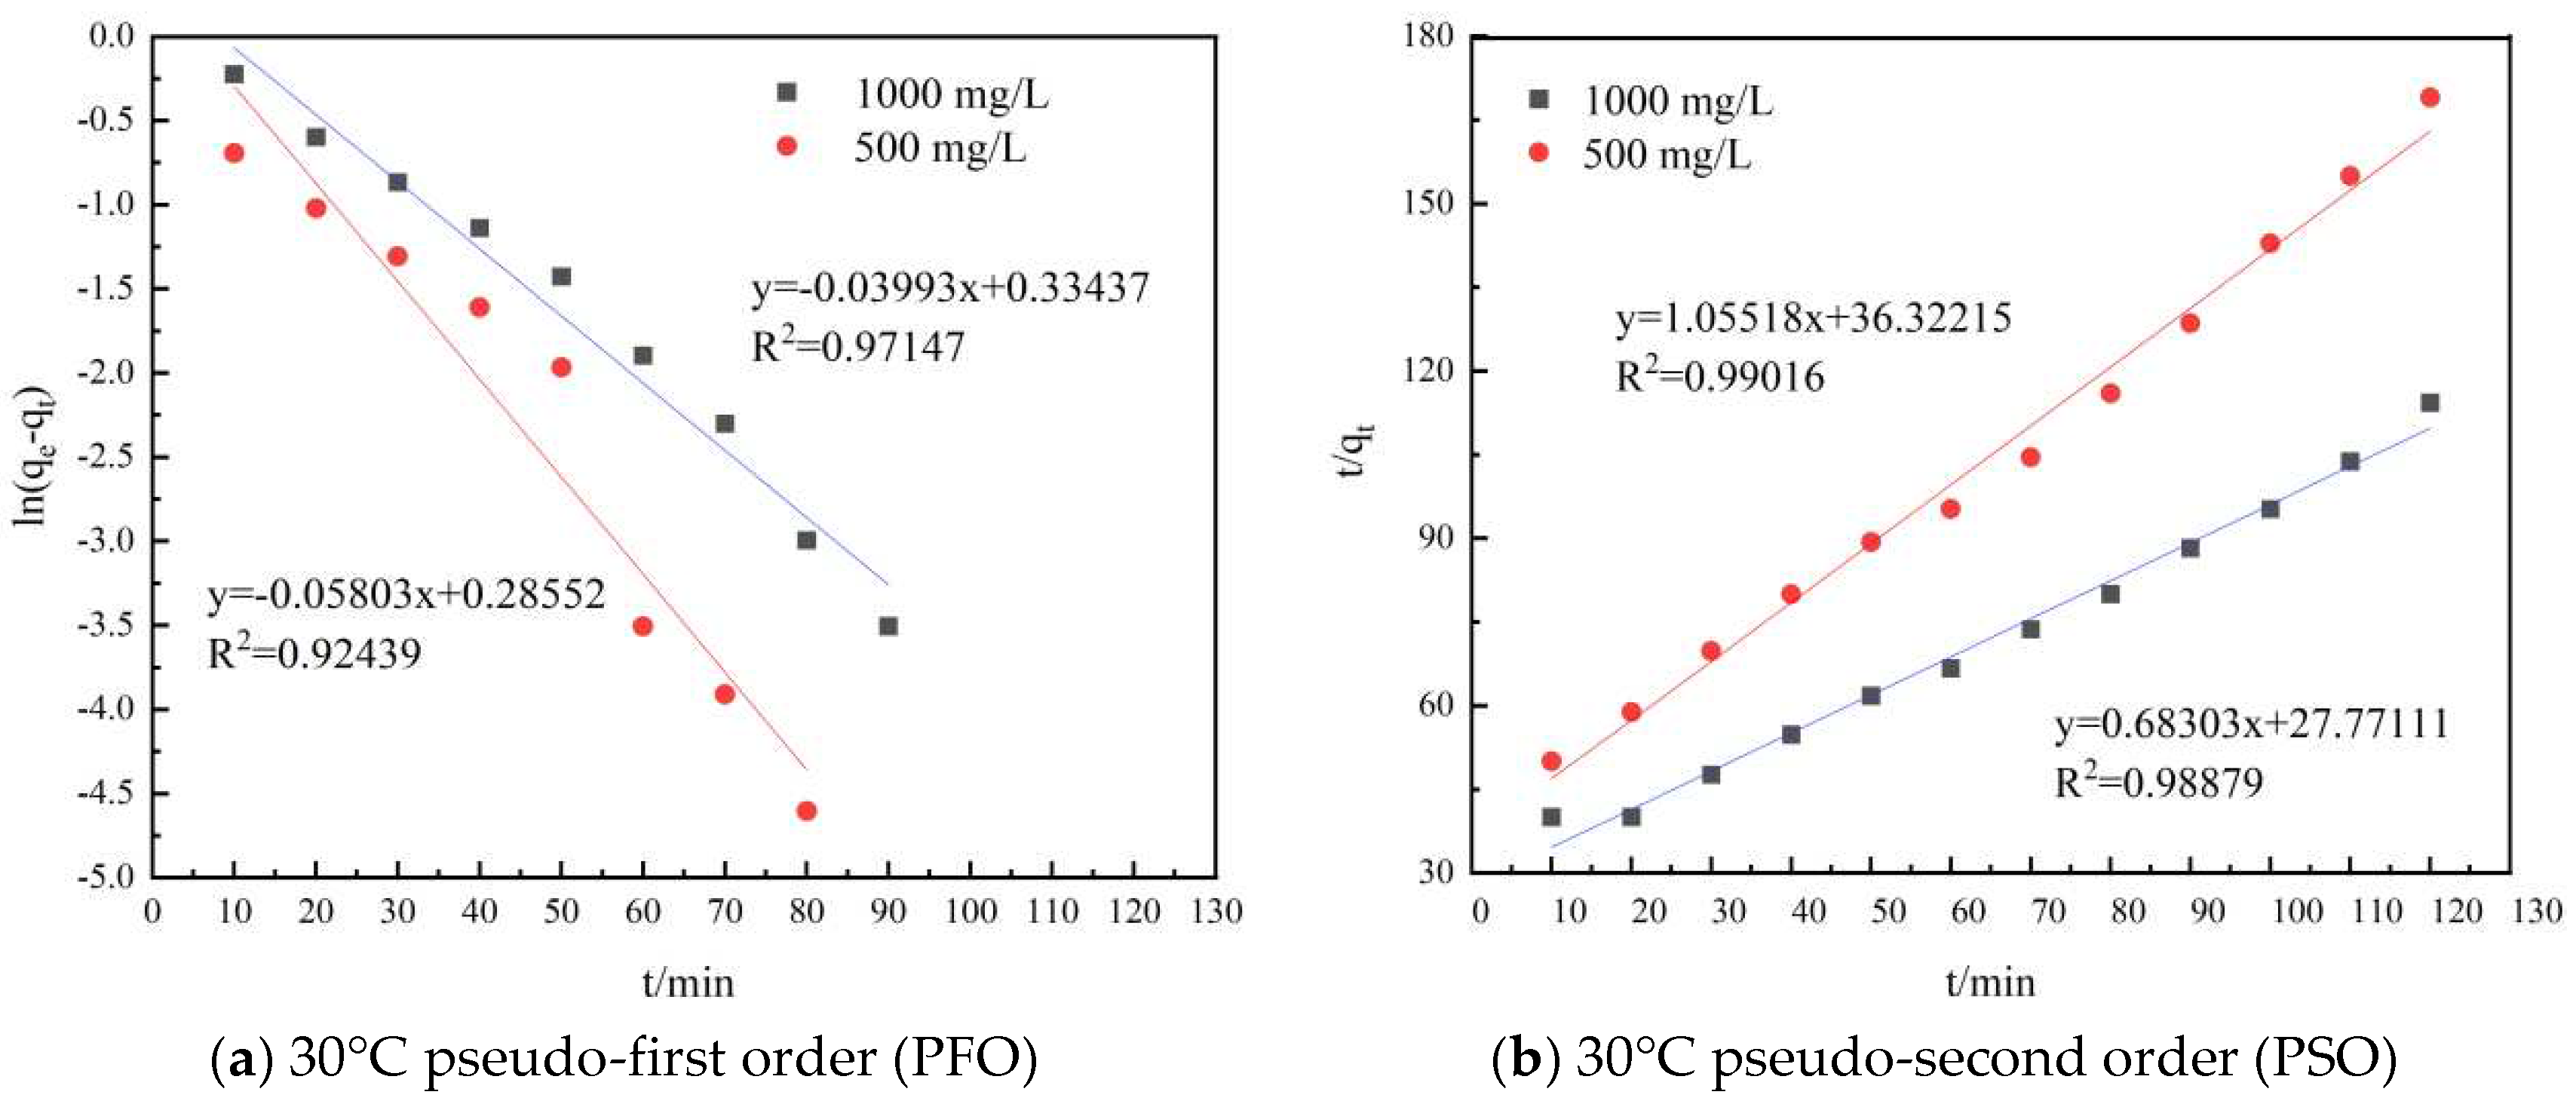
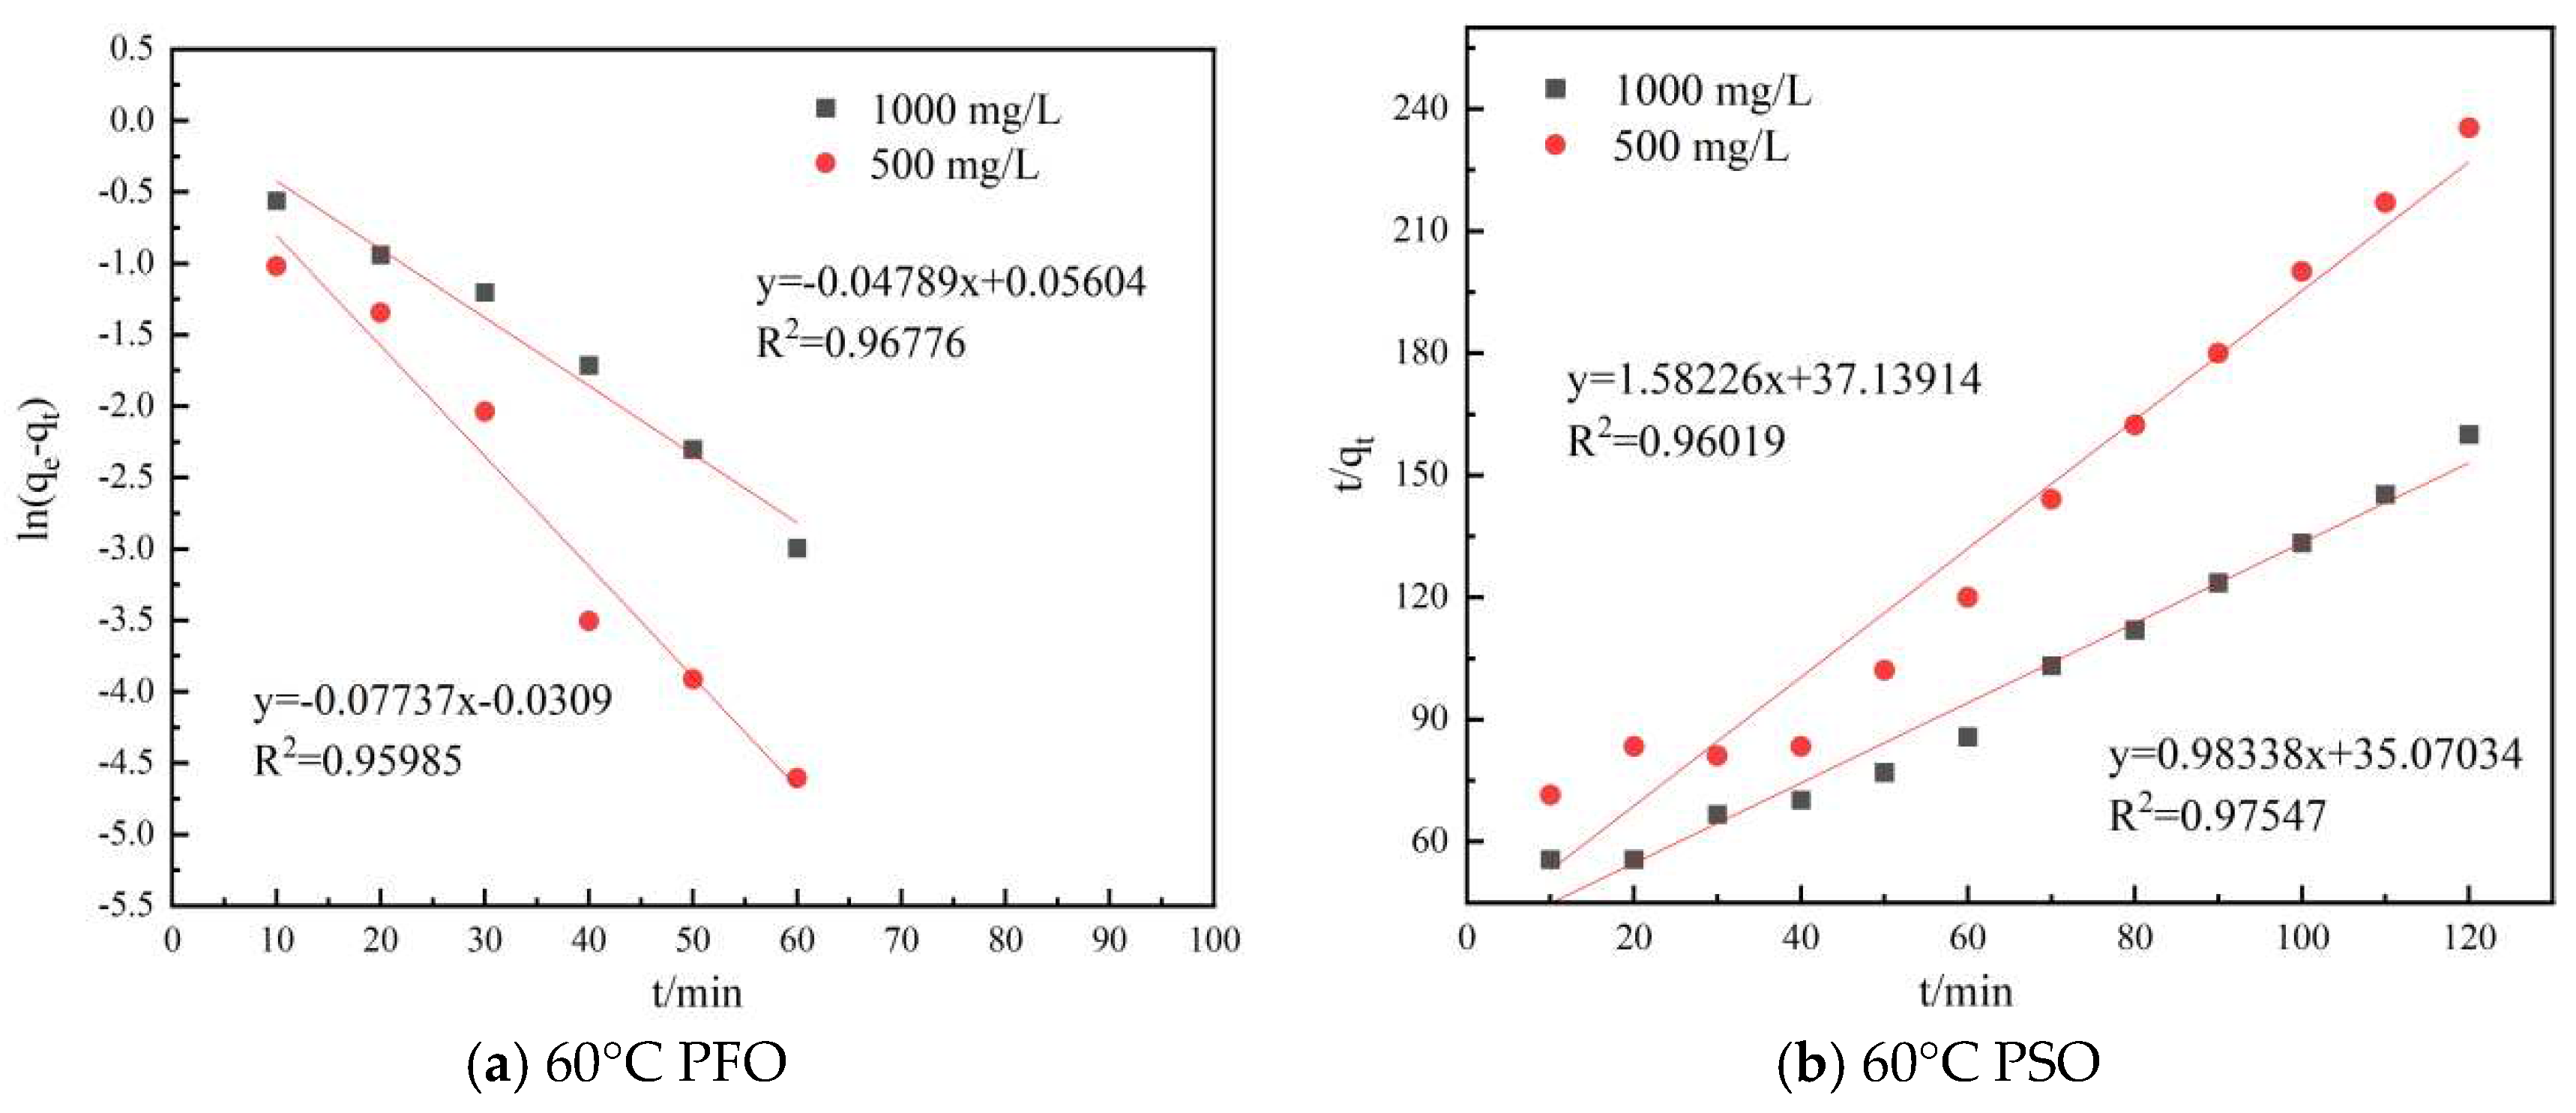
Table 3.6.
Results for different model parameters.
| Temperature(°C) | Model | Concentration (mg/L) | Parameter estimation results | Modelling evaluation | Equation | |
|---|---|---|---|---|---|---|
| Parameter | Estimated value | R2 | ||||
| 30°C | PFO | 500 mg/L | K1 | 0.05808 | 0.92439 | y = −0.05803x + 0.28552 |
| 1000 mg/L | K1 | 0.03993 | 0.97147 | y = −0.03993x + 0.33437 | ||
| PSO | 500 mg/L | K2 | 0.0168 | 0.99016 | y =1.05518x + 36.32215 | |
| 1000 mg/L | K2 | 0.007 | 0.98879 | y = 0.68303x + 27.77111 | ||
| 60°C | PFO | 500 mg/L | K1 | 0.07737 | 0.95985 | y = −0.07737x − 0.0309 |
| 1000 mg/L | K1 | 0.04789 | 0.96776 | y = −0.04789x + 0.05604 | ||
| PSO | 500 mg/L | K2 | 1.58226 | 0.96019 | y = 1.58226x + 37.13914 | |
| 1000 mg/L | K2 | 0.98338 | 0.97547 | y = 0.98338x + 35.07034 | ||
The experimental data were linearly fitted to the PFO and PSO models at different temperatures using Origin Pro 9.0, and the results are shown in Figure 3.3. The fitting results showed that the PFO kinetics equation obtained for the 500 mg/L HPAM test group had R2 values of 0.92439 and 0.95985 at 30°C and 60°C, respectively, and for the 1000 mg/L HPAM test group, the corresponding R2 values were 0.97147 and 0.96776. The R2 values of the PSO equation for the 500 mg/L HPAM test group were 0.99016 and 0.96019 at 30°C and 60°C, respectively, and for the 1000 mg/L HPAM test group, the corresponding R2 values were 0.98879 and 0.97547. The results indicated that the HPAM adsorption kinetics data on the surface of the shale were well fitted with the PSO kinetics model. The PSO kinetics model assumes that the adsorption process is restricted to chemical adsorption. Thus, the fitting indicated that the adsorption of HPAM on the surface of shale was chemical adsorption. HPAM was adsorbed on the surface of shale because of the interactions of HPAM with shale through hydrogen bonding of amide groups and electrostatic forces of carboxylic acid groups.
3.5. Microstructure
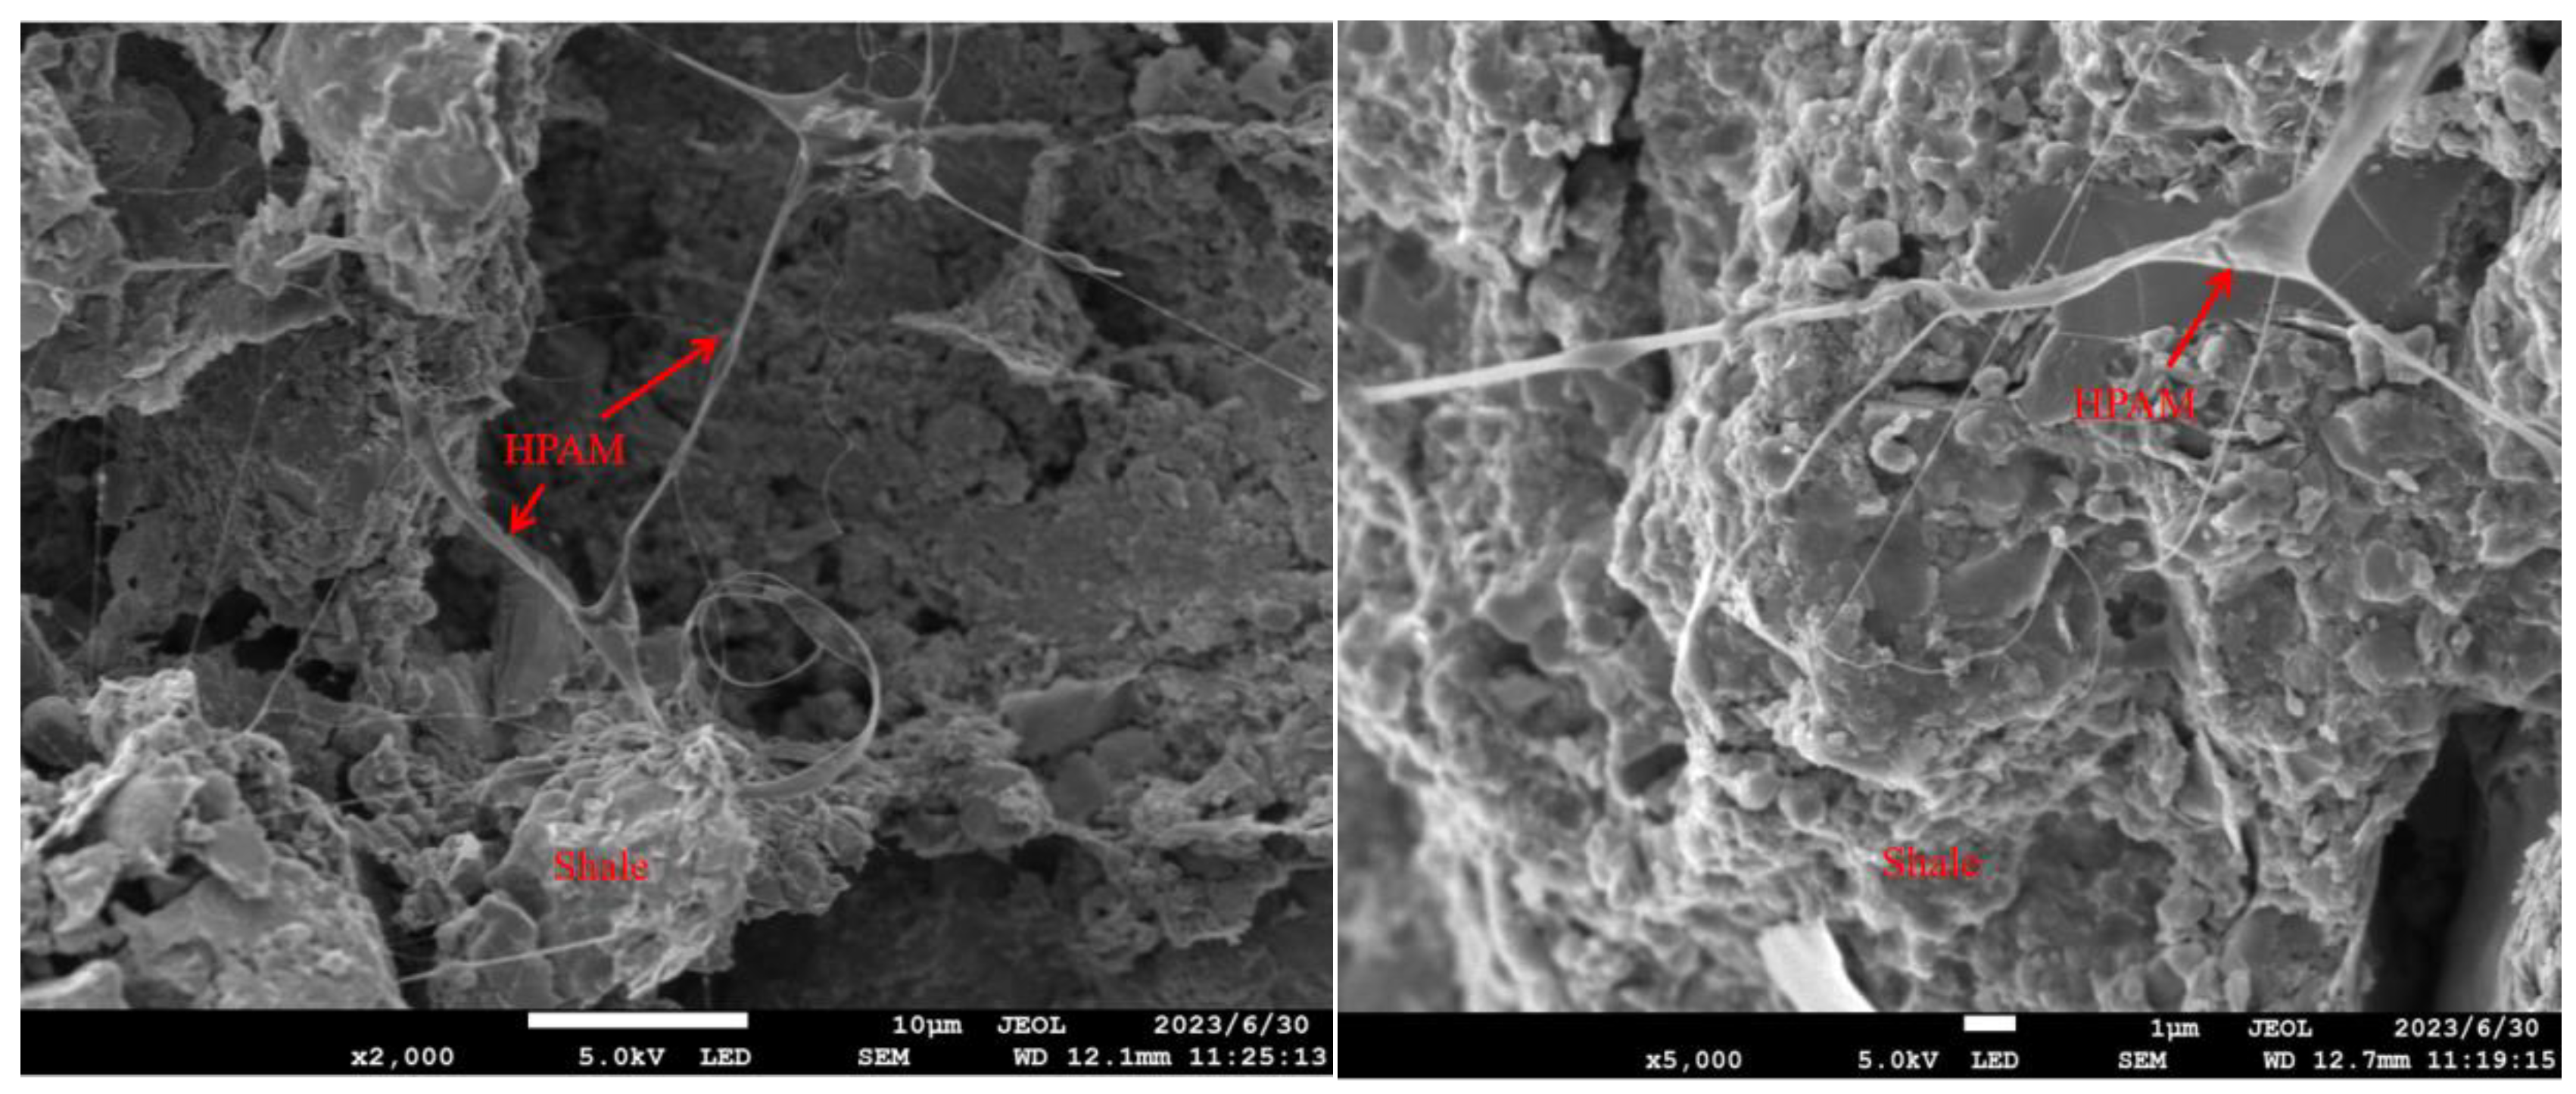
SEM images of HPAM adsorption on the surface of shale are shown in Figure 3.4. The experimental results of the microstructure show that the HPAM in the aqueous solution resembled a spider's web adhering to the surface of the shale. This indicated that the shale had a strong adsorption force with HPAM, and it was able to adsorb some of HPAM in the water on the surface of the shale.
Figure 3.4.
Adsorption state of HPAM on shale surface.
3.6. Desorption Performance
The measured values from the desorption experiments of HPAM on the shale surface are shown in Table 3.7. The experimental results showed that the residual HPAM concentration on the surface of the shale after desorption decreased with the increase in the water-solid ratio, and the water-solid ratio was between 1 and 3. The residual HPAM concentration on the surface of the shale after desorption decreased slowly, which indicated that the HPAM on the surface of the shale had a certain degree of adsorption that could resist the desorption ability of water. As the water-solid ratio continued to increase, the residual HPAM concentration after desorption on the shale surface decreased rapidly, that is, the dynamic change of HPAM desorption on the shale surface was significant, indicating that a large amount of water could weaken the adsorption of HPAM on the shale surface due to forces such as hydrogen bonding and could prompt the desorption of HPAM from the shale surface.
Table 3.7.
Experimental data of desorption changes of shale after adsorption of HPAM.
| Water-solid ratio | Residual HPAM concentration after desorption (μg/g) | |
|---|---|---|
| Desorption of HPAM concentration 1000 mg/L after adsorption on shale rock | Desorption of HPAM concentration 500 mg/L after adsorption on shale rock | |
| 1:1 | 1050.2 | 700.5 |
| 2:1 | 1001.3 | 683.5 |
| 3:1 | 953.3 | 640.2 |
| 5:1 | 875.7 | 581.6 |
| 10:1 | 756.2 | 510.8 |
| 20:1 | 630.1 | 450.7 |
| 25:1 | 579.3 | 430.9 |
| 30:1 | 524.7 | 423.8 |
| 35:1 | 515.2 | 420.3 |
The parameters of the desorption model were calculated using Origin Pro 9.0 software, and the fitted models of the desorption of HPAM from shale for two HPAM concentrations are shown in Figure 3.5. The obtained parameters of the model are shown in Table 3.7. The fitted experimental parameters showed that the fitting accuracy of the experimental data of the desorption changes after shale adsorption at different concentrations of HPAM was high. This indicated that the relationship between the HPAM desorption on the shale surface and the water-solid ratio followed Equation 2.9. The larger the value of λ was, the faster the HPAM desorption curve decreased, i.e., with the increase of the liquid-solid ratio, the concentration of HPAM on the shale surface decreased faster, and the value of λ was related to the desorption ability on the shale surface. The larger the value of λ was, the easier it was to desorb from the shale surface, and the lower the buffer capacity of desorption was. The results showed that the HPAM could be desorbed from the shale surface at both concentrations. The results showed that the λ values for the desorption after HPAM adsorption on the surface of the shale at the two concentrations were significantly different, indicating that at a higher concentration of HPAM, the HPAM was more likely to be desorbed after adsorbing on the surface of the shale, as it was easier it is for the HPAM to detach from the surface.
Figure 3.5.
Fitted curves of dynamic desorption changes in HPAM solutions of different concentrations.
Figure 3.5.
Fitted curves of dynamic desorption changes in HPAM solutions of different concentrations.
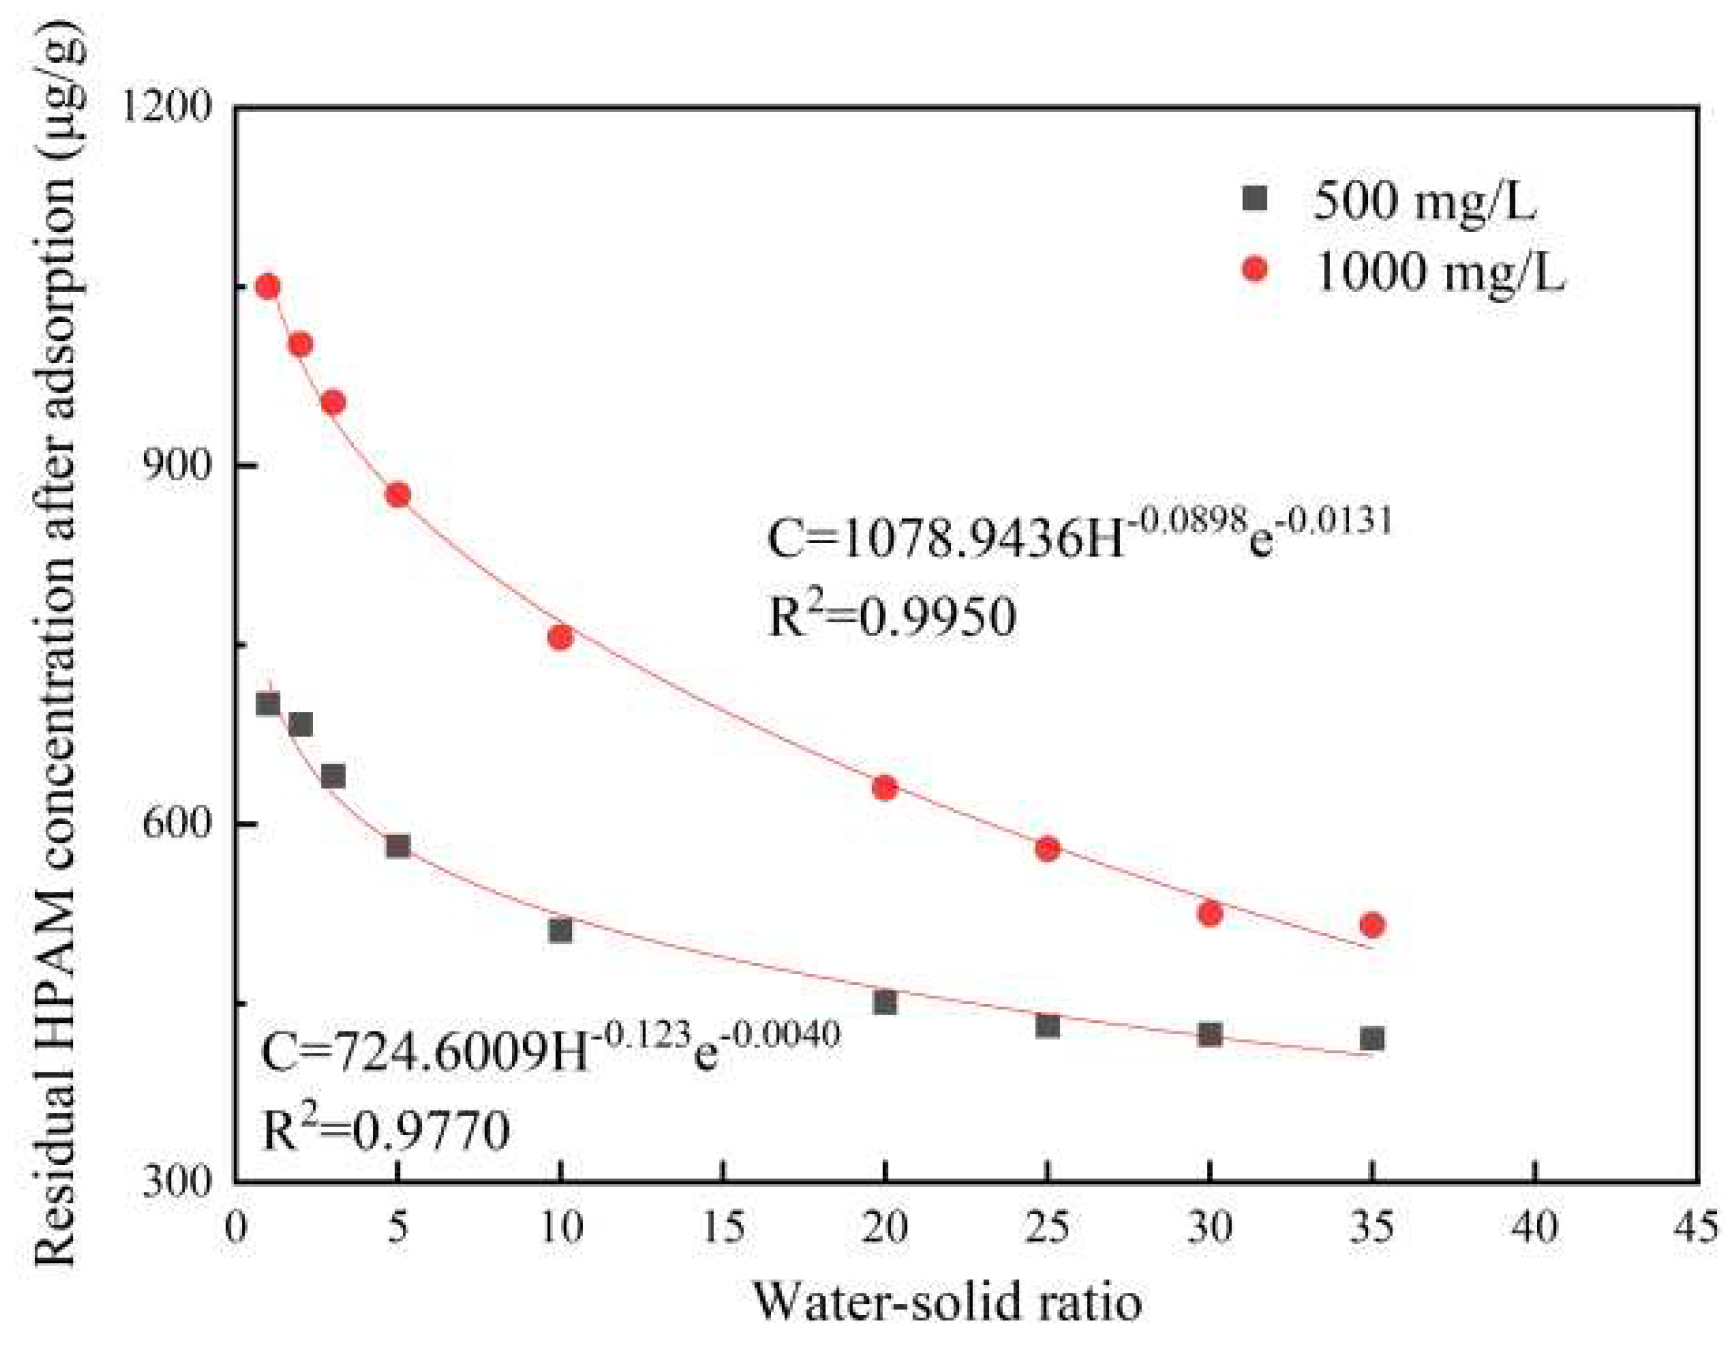
Table 3.7.
Parameters of modeling changes in desorption after HPAM adsorption on shale.
| Desorption after shale adsorption | C1 | ∂ | λ | R2 | equation |
|---|---|---|---|---|---|
| HPAM solution concentration 500 mg/L |
724.6009 | 0.1233 | 0.0040 | 0.9770 | C = 724.6009H−0.1233e−0.0040 |
| HPAM solution concentration 1000 mg/L |
1078.9436 | 0.0898 | 0.0131 | 0.9950 | C = 1078.9436H−0.0898e−0.0131 |
4. Conclusions
1) With the increase in the liquid-solid ratio of the HPAM solution to shale, the amount of adsorbed HPAM on the surface of the shale will increase, and the adsorbed amount will increase to a certain value. The amount of adsorbed HPAM on the surface of shale will reach saturation, and then the adsorbed amount will change by a smaller amount with the increase in the liquid-solid ratio.
2) The adsorption of HPAM on the shale surface followed the Langmuir adsorption model, and the maximum amounts of adsorbed HPAM on the shale were 1.05 and 0.71 mg/g under the two temperature conditions of 30°C and 60°C, respectively.
3) The equilibrium time of HPAM adsorption on the shale surface was relatively shorter when the HPAM concentration was lower under the same temperature conditions, while the equilibrium time was relatively shorter when the HPAM temperature was higher under the same HPAM concentration conditions. The adsorption kinetics were more in line with the pseudo-second order adsorption kinetics model.
4) Shale was able to adsorb some of the HPAM in solution, and the adsorbed HPAM resembled a cobweb adhering to the surface of the shale, which had a strong adsorption capacity.
5) HPAM adsorption on the surface of the shale could resist the desorption effect of water, but a large number of water hydrogen bonds and other forces could weaken the HPAM adsorption on the surface of the shale. This could prompt the HPAM desorption from the surface of the shale. The higher the concentration of HPAM adsorbed on the surface of the shale was, the more prone it was to desorption, and the easier it was to remove HPAM from the shale.
Author Contributions
Conceptualization, J.L., T.L., and T.C.; Investigation, B.P., L.Y., ;Writing—original draft, J.L., T.L., and T.C.;Writing—review and editing, Y.X. ,X.F.
Funding
This research was funded by the Natural Science Foundation of Chongqing (cstc2018jcyjAX0342, cstc2020jcyj-msxmX0573, CSTB2022NSCQ-MSX1362), the Chongqing Education Commission (Grant No. KJQN201901540, KJQN202101533, KJQN202301513) and the Key Laboratory of Ministry of Education of Enhanced Oil and Gas Recovery (Grant No NEPU-EOR-2022-02).
Conflicts of Interest
The authors declare no conflict of interest.
References
- Palisch T T , Vincent M , Handren P J .Slickwater Fracturing: Food for Thought[J].Spe Production & Operations, 2010, 25(03):327-344. [CrossRef]
- Zhonghua L,Baojun B,Yanling W, et al. Experimental Study of Slickwater Volume Effect on Methane Desorption on Longmaxi Shale[J]. Journal of Natural Gas Science and Engineering,2021(prepublish). [CrossRef]
- Sun H , Wood B , Stevens R F,et al.A Nondamaging Friction Reducer for Slickwater Frac Applications[J].Society of Petroleum Engineers,2023. [CrossRef]
- Paktinat J, Oneil B , Tulissi M G .Case Studies: Impact of High Salt Tolerant Friction Reducers on Freshwater Conversation in Canadian Shale Fracturing Treatments[J].Carbon, 2011, 10(2):343. [CrossRef]
- Ibrahim,F.A,Nasr-El-Din, et al. A New Friction-Reducing Agent for Slickwater-Fracturing Treatments[J]. SPE Production & Operations,2018,33(03). [CrossRef]
- Jianping X,Yuanda Y,Zhen F, et al. Molecular dynamics simulation of adsorption and diffusion of partially hydrolyzed polyacrylamide on kaolinite surface[J]. Journal of Molecular Liquids,2022,367(PA). [CrossRef]
- Hau J L,K. O M,A. E M, et al. Adsorption of Hydrolyzed Polyacrylamide onto Calcium Carbonate[J]. Polymers,2022,14(3). [CrossRef]
- Cheraghian G,Nezhad K S S,Kamari M, et al. Adsorption polymer on reservoir rock and role of the nanoparticles, clay and SiO2[J]. International Nano Letters,2014,4(3). [CrossRef]
- Amrutha M,Ashit R,Julius V, et al. Towards enhanced oil recovery: Effects of ionic valency and pH on the adsorption of hydrolyzed polyacrylamide at model surfaces using QCM-D[J]. Applied Surface Science,2021,560. [CrossRef]
- Li Y, Wang S ,Guo J , et al.Reduced adsorption of polyacrylamide-based fracturing fluid on shale rock using urea[J].Energy Science Engineering,2018,6(6). [CrossRef]
- Jiafang X, Xiaohui W ,Jie C , et al.Inhibition mechanism of cationic polyacrylamide on montmorillonite surface hydration: A molecular dynamics simulation study[J].Chemical Physics,2023,567. [CrossRef]
- Chen Zicong, Li Juan, et al. 2007. Crop effects of soil phosphorus desorption model and its characteristic values [J] Ecology and Environmental Sciences, (01): 163-169.
- QiTang W,Zhaoli X,Qingqiang M, et al. Characterization of cadmium desorption in soils and its relationship to plant uptake and cadmium leaching[J]. Plant and Soil,2004,258(1/2). [CrossRef]
Disclaimer/Publisher’s Note: The statements, opinions and data contained in all publications are solely those of the individual author(s) and contributor(s) and not of MDPI and/or the editor(s). MDPI and/or the editor(s) disclaim responsibility for any injury to people or property resulting from any ideas, methods, instructions or products referred to in the content. |
© 2024 by the authors. Licensee MDPI, Basel, Switzerland. This article is an open access article distributed under the terms and conditions of the Creative Commons Attribution (CC BY) license (http://creativecommons.org/licenses/by/4.0/).
Copyright: This open access article is published under a Creative Commons CC BY 4.0 license, which permit the free download, distribution, and reuse, provided that the author and preprint are cited in any reuse.


