Submitted:
26 January 2024
Posted:
29 January 2024
You are already at the latest version
Abstract
High temperature (HT) geothermal wells can provide green power 24h a day 7 days a week. Harsh environmental and operational conditions, long-term durability requirements of such wells require special cementitious composites for well construction. This paper reports a comprehensive assessment of geothermal cement composites in cyclic pressure function laboratory tests, field exposures in an HT geothermal well (300-350oC) as well as a numerical model to complement the experimental results. Performances of calcium-aluminate-cement (CAC)-based composites and calcium free cement were compared against reference Ordinary Portland Cement (OPC)/silica blend. The stability and degradation of the tested materials was characterized by crystalline composition, thermo-gravimetric, and elemental analyses, morphological studies, water-fillable porosity, and mechanical properties measurements. All CAC-based formulations outperformed the reference blend both in the function and exposure tests. The reference OPC/silica lost its mechanical properties during the 9-month well exposure through extensive HT carbonation, while properties of the CAC-based blends improved over that period. The Modified Cam-Clay (MCC) plasticity parameters of several HT cement formulations were extracted from triaxial and Brazilian tests and verified against the experimental results of function cyclic tests. These parameters can be used in well integrity models to predict field-scale behavior of the cement sheath under geothermal well conditions.
Keywords:
high temperature cementitious materials
; cement well exposure tests
; calcium-aluminate well cement
; function cement tests
; well cement CO2 resistance
; finite element modeling of well cement
; calcium-free well cement.
1. Introduction
The casing strings run as part of the well construction might have different purposes, but in general they are most often cemented in place. Primary cementing means placing a cement material into the annulus between casing and borehole. This is done to provide zonal isolation, casing support and protection, support axial load of casing string (and strings to be run later) and the support of the borehole. All to allow drilling deeper but also to prepare the well for the next phase (injection, production etc.). This is a common objective of most types of wells, oil and gas, geothermal or others.
High temperature (HT) geothermal wells may provide green energy available 24/7. Durable and sustainable materials are required for HT well construction and operation. Materials requirements for subterranean wells for Enhanced Geothermal Systems (EGS), that involve geoformation hydraulic stimulation for the efficient heat of Earth recovery are especially stringent. These wells have larger diameters than oil & gas wells and are constructed and operated under the conditions of higher temperatures, chemically aggressive environments, and repeated thermo-mechanical stresses. These wells are expected to have a long service life for a powerplant installation, so long-term materials durability is important.
The power output of geothermal powerplants can be further increased with super-hot and supercritical wells that offer significant economic benefits. The energy production from a single well with the well temperature above 400oC can be 10 times higher than that from a regular geothermal well and 4-5 times higher than from a well in shale gas fields [1,2,3]. However, targeting higher temperatures imposes new challenges on well construction and materials used in such wells. Materials damage and degradation reactions can dramatically accelerate under HT conditions.
Geothermal environments are often very rich in acidic gasses (CO2, H2S) and dissolved solids making them more difficult for cements to survive than oil and gas wells [4]. Decalcification of Ordinary Portland Cement (OPC) with the loss of its mechanical properties and permeability increase upon long-term exposure to acidic fluids has been known for a long time [5]. Extensive research focused on safety of underground CO2 storage and appropriateness of the regulations concerning the length of the storage well plugs [6,7,8]. The general conclusion was that under the conditions of the storage wells kinetics of cement degradation are very slow due to the formation of carbonated cement layer that decreases cement permeability and increases its brittleness. This was confirmed by the natural CO2 producer [9] and with pilot storage wells [10] that proved to operate without issues for extended periods of time. Cement samples well exposure tests also confirmed OPC/silica HT blend to be stable for extended periods of time at temperatures below 200oC [11]. In this study formulations with higher silica content were shown to be preferential for good mechanical performance and lower porosity of cement after up to a year of field exposure. However, all these studies applicable for CO2 storage wells, address conditions that are far from those found in geothermal wells with significantly higher temperatures, more complex brine compositions, and shock conditions that can damage cement and accelerate its chemical degradation through cracks and fissures.
Previous laboratory work demonstrated poor acid-resistance of OPC-based formulations at HT compared against that of calcium-aluminate based cements [12]. To resist commonly high CO2 content of geothermal wells Brookhaven National Laboratory (BNL) developed chemical calcium phosphate cement that can mineralize CO2 into a stable carbonated apatite phase [13]. Calcium phosphate cement was also shown to self-heal under HT geothermal conditions for controlled crack width [14]. To resist thermal shocks common for HT geothermal wells Thermal Shock Resistant Cement (TSRC) was developed and shown to possess outstanding acid resistance and self-healing properties [12,15,16,17]. Preliminary evaluations of these and other cement formulations under supercritical conditions showed persistence or improvement of their properties after up to 30 days at 400oC and 25 MPa [18,19]. Excellent resistance to acid and alkali carbonate environments under simulated geothermal conditions was also demonstrated for various mineral plug materials with similar phase compositions fabricated in thermite reactions [20]. However, for many advanced cementitious blends, their performance under conditions of a real geothermal well over extended periods of time remains to be seen. Laboratory evaluations of most well cements are conducted after their hydrothermal synthesis at HT and high pressure (HP) followed by room-temperature analyses. Reproduction of geothermal well conditions and long-term tests are problematic in laboratory environments. Field exposure of experimental cements in a real deep geothermal well is an attractive alternative to laboratory testing.
Nevertheless, advanced laboratory testing can provide valuable complimentary information on blends performance under well conditions. To assess the isolation provided by cement, pressure testing is most commonly performed after every surface or intermediate-casing cementing job. During the testing the internal casing pressure is increased to exceed the pressure that will be applied during the next drilling phase [21]. Similarly, casing pressure increase takes place in geothermal wells during hot fluids production. Pressure testing can be used in laboratory set ups to compare performance of different cement formulations in a scaled down well configuration [22]. In these tests, development of cracks in the cement sheath between casing and a rock and cement-casing or cement-formation bond failure are monitored by a 3D imaging. Earlier, such function tests were used to show effects of poor casing centering in a borehole and poor mud removal from rock surface on cement strength and failure modes [23,24]. Function pressure tests were also used to evaluate cement performance with different types of rocks where stiff rock surrounding cement sheath resulted in a brittle fracture of the samples, appearing at higher load than for a soft rock, where the cracks grew progressively [23]. Most importantly, function tests have been used to compare different cement formulations, for instance in [25] where a CAC-based formulation failed under higher load than an OPC-based cement after curing at 110oC.
In addition to laboratory testing mimicking well conditions and well exposures, hydro-thermo-mechanical modelling of the near wellbore region has been used to assess well integrity issues [26,27]. Calibration of such models with lab experiments is necessary to extend the results of lab experiments to field conditions [28]. Modified Cam-Clay (MCC) plasticity models have been proposed as suitable for cement behavior [29,30]. Such models can predict strain softening and hardening that is observed in cement and irreversible compaction of cement during casing pressurization.
Among the difficulties of evaluating and modeling behavior of well cement is the fact that cementitious materials are exposed to a wide range of temperatures, and they must have prolonged life. The solidification reactions are initiated above the ground at ambient temperatures and are completed in a well under elevated temperatures. The well temperature varies not only with depth but, in the short run, with time, when the well returns to higher static temperature after the initial cooling with circulating fluids. The short-term cement sheath survival under aggressive environments generally evaluated in laboratory tests does not guarantee long-term integrity.
The present paper discusses performance of various cementitious formulations applicable to HT geothermal and oil and gas wells under a range of temperatures, pressures, and chemical environments experienced by a cement sheath in such wells. The short-term performance of three cement formulations (OPC/silica reference, more ductile, Calcium Aluminate Cement (CAC)/Silica, and more brittle Calcium Phosphate (CAP) composites), is evaluated in pressure function tests at a lower temperature (110oC). Triaxial tests conducted on these formulations are used to extract the MCC model parameters. The parameters are then used to model the function tests to verify the results of the numerical model. The long-term survival of these and other HTHP formulations is evaluated under the HT geothermal well environments in samples exposure tests for 3 and 9 months in a Newberry well in Oregon, US, at temperatures above 300oC. The well-exposed samples are analyzed for the changes in their mechanical properties, porosity, and phase compositions to understand stability and degradation of cements with different chemistries in aggressive hot well environment.
2. Materials and Methods
2.1. Materials
Calcium aluminate cements (CAC), Secar #80-, Secar #71-, Secar #50-, and Class G OPC, were used in this study. All CACs were supplied by Imerys, while Lafarge, North America provided OPC, Class G, well cement. The X-ray powder diffraction (XRD) data showed that the crystalline compounds of #80 CAC were the following three principal phases, calcium monoaluminate (CaO.Al2O3, CA), calcium dialuminate (CaO.2Al2O3, CA2) and corundum (α-Al2O3); #50 CAC had CA as its dominant phase, coexisting with gehlenite [Ca2Al(Al,Si)2O7] and corundum as the secondary components. The Class G consisted of hatrurite (3CaO.SiO2) as a major, and brownmillerite (4CaO.Al2O3.Fe2O3), basanite (CaSO4.1/2H2O) and periclase (MgO) as minor phases for the former cement. Among the cement-forming constituents, SMS (Na2SiO3), alkali-activating powder, of 93% purity, with the particles’ size of 0.23- to 0.85-mm, trade named “MetsoBeads 2048,” was supplied by the PQ Corporation. It had a 50.5/46.6 Na2O/SiO2 weight ratio. Sodium hexa-meta-phosphate (SHMP) [(NaPO3)6, 60-70% P2O5] with 200 mesh granular obtained from Sigma-Aldrich was used as a cement-building component of calcium-phosphate cements. Silica flour was supplied by Cudd Energy Services. The metakaolin (Al4Si2O10), was obtained from Imerys. FAF was supplied by Boral Material Technologies. The XRD analysis of FAF showed that it included three major crystalline phases, quartz (SiO2), mullite (3Al2O3.2SiO2), and hematite (Fe2O3). Aluminum hydroxide, EMPLURA® hydragillite powder with the bulk density of ~ 90 g/100 ml and particle size <150 µm for 90% of the material was obtained from Sigma Aldrich. Zirconium (IV) hydroxide as hydrous zirconium oxide, ZrO2.nH2O (Zr) was also obtained from Sigma Aldrich.
All formulations exposed in Newberry well for 9 months were modified with 5% by weight of dry blend carbon microfibers (CMF, AGM-94) derived from a polyacrylonitrile precursor, supplied by Asbury Graphite Mills, Inc. They were 7-9 microns in diameter and 100-200 microns in length. These fibers are stable at temperatures up to 600oC. They were used to improve mechanical properties of the tested composites.
2.2. Samples Preparation and Exposure Conditions
2.2.1. Cement Formulations and Samples Preparation
Formulations of cement samples evaluated in this work are given in Table 1. The dry blends were prepared by shaking all the dry components for 3 minutes by hand. Water was then added to dry blends at the amount that allowed the slurries to have equal self-leveling. The water content varied between 0.312/0.4 (for CAP#71/Silica/MK without/with CMF respectively) and 0.432/0.481 (for #71/Silica/MK without/with CMF respectively). The slurries were placed into molds (20x40 mm) and left at room temperature for 12 hours. Then samples were demolded and exposed to 85oC environment with relative humidity of 99.9% for another 12 hours. Finally, they were autoclaved at 300oC for 12 more hours in non-stirred Parr Reactor 4622, before the shipment to the wellsite for the exposure. NAS-M1 formulation was prepared in glass tubes (18 x 150 mm) without demolding following the temperature regime for all other samples. After the 1 day of 300oC autoclaving, each tube was cut into 3 cylinders of ~40 mm each, and the solidified cement was removed from the glass.
To prepare samples for function tests dry blends’ components of #80/Silica and CAP#71/Silica were blended in a Dry Powder Mixer Blending Machine V10 from iPharMachine, for 12 hours. The blends were then mixed with water (water-to-blend (W/B) ratio 0.372 and 0.32, respectively) in an Ofite Constant Speed Blender following the API procedure: 15 s at 4000 rpm followed by 30 s at 12000 rpm. To prepare the CSH-60/40 slurry, OPC and 45-microns silica flour were first mixed with a spatula to obtain a homogeneous powder, then mixed with water (W/B=0.44) following the API procedure.
2.2.2. Exposure Tools
Exposure tools were fabricated from stainless steel to host cylindrical samples (Figure 1). They had open slots for samples exposure to the well environment and side plates for centralized placement in the well. Three baskets could be fitted on top of each other and removed together or separately from the well.
The baskets were loaded with samples precured for 1 day at 300oC and deployed in the well on a wireline, then detached from the wireline and left at the bottom of the well. Since in geothermal wells bottom hole cement would experience repeated thermal shock conditions, no special precautions were taken for samples re-equilibrating with the changing environment during their pull up to the surface. The tested formulations also did not include any foam or other lightweight cement that could be sensitive to relatively rapid pressure decrease. The samples recovered after both exposures of 3 and 9 months did not have any visible damage.
2.2.3. Exposure Conditions
According to earlier well service data the bottom hole temperature of the well where the sample baskets were released was ~325oC (communications with AltaRock). The information on the pressure at the bottom of the well was not available, the pressure at the depth of about 1.6 km was nearly 14 MPa. If a constant pressure gradient is assumed between 1.6 and 3.0 km the bottom hole pressure can be estimated to be ~26 MPa.
Geochemical analysis from flow testing of this well by Geologica performed in 2008 showed that a non-condensable gas, identified as being >99% CO2, was coming from a geological source (hydrothermal or magmatic). The total carbonates concentration measured at 2 different locations in well fluids was 296 and 1930 mg/kg. According to that information supercritical CO2 could be expected at the bottom of the well.
2.3. Samples Analyses
2.3.1. Physical, Structural, and Mineralogical Analyses
The percent of water-fillable porosity of the well-exposed samples was determined using the following formula: (Wwet − Wdry)/V × 100, where Wwet is the weight of water-saturated samples and Wdry is the weight of a sample dried for at least 4 days in a vacuum oven at 60 °C until the weight of the sample was constant, V is the volume of the sample [31].
JEOL 7600 F (Pleasanton, CA, USA) scanning electron microscope image analysis coupled with energy dispersive X-ray (EDX) elemental composition measurements on freshly broken surfaces was employed for morphological analyses and phase identifications.
TGA/DTA (heating rate of 20 °C/min in a N2 flow, ~10 mg samples weight, model Q50, TA Instruments, New Castle, DE, USA), and X-ray diffraction measurements (40 kV, 40 mA copper anode X-ray tube, Rigaku Smartlab, Cedar Park, TX, USA) were used for samples characterization. The PDF-4/Minerals 2023 database of International Center for Diffraction Data (ICDD) was used for analyses of XRD patterns.
2.3.2. Mechanical Tests
The uniaxial compressive strength, Young’s modulus, and compressive toughness were determined using Electromechanical Instron System Model 5967 (Norwood, MA, USA). The measurements were done on unconfined dry samples after the water fillable porosity determinations. The instrument had a 30 kN load capacity, and the measurements were performed at a 1.25 cm/min loading rate. The measurements were used to obtain comparative performance of different formulations, without a focus on absolute values. The mechanical properties and percent of water-fillable porosity of the reference samples after the 300oC autoclaving were measured in the same manner. The compressive toughness was computed from the area under the compressive stress-strain curve.
Triaxial tests to determine the deformation and strength properties of the samples were performed using a triaxial cell type MTS Model 815 Rock Mechanics System (Eden Prairie, MN, USA). Drained tests at room temperature on water-saturated samples at 2.5 MPa pore pressure were conducted at various effective confining stresses to establish input for the constitutive model (chapter 2.5.). The test procedure followed largely the suggestions for triaxial testing by ISRM [32]. Sample end surfaces were ground parallel according to ASTM and ISRM standards [33]. Initial full pore fluid saturation was achieved by vacuum saturation. The otherwise occurring impact of varying degree of saturation on mechanical properties is well documented in the literature (e.g. [34]).
An axial strain rate below 1e-6 1/s was applied to ensure no internal pore pressure built-up. All triaxial tests were conducted in the following manner:
- Hydrostatic loading to predefined confinement.
- Triaxial compression in axial strain control to an axial stress of about 50% of expected peak stress.
- Triaxial unloading to initial stress conditions at the same rate.
- Triaxial compression (re-loading) at the same constant rate until reaching constant post-failure plateau.
Strains were measured by clip-on extensometers in axial direction and by a chain extensometer in circumferential direction (Figure 2). The volumetric strain was derived from those two measurements. Axial stress is recorded with an internal load cell, confining and pore pressure with pressure gauges. The mechanical loading platens of the setup contain also ultrasonic transducers to measure compressional and shear wave velocity at the same time. Those results will be presented in a separate paper.
The triaxial compression tests provided access to the following mechanical parameters as a function of stress state (confinement and shear load):
- Deformability (e.g. Young’s modulus, Poisson’s ratio, shear and bulk modulus)
- Strength (e.g. shear and residual strength, cohesion and friction angle)
- Ultrasonic velocity (compressional and shear wave propagating in axial sample direction)
- Permeability (measured in steady-state conditions by applying a differential pore pressure and recording associated fluid flow rate)
- Porosity (derived from volumetric strain changes)
Tensile strength of the materials was determined by the so-called Brazilian test [35]. Samples with length to diameter ratio of 1:2 were placed sideway between special loading jaws until failure. We followed the ISRM recommended method presented by [36]. Tests were performed on dry samples in axial displacement control with a loading rate of about 5-10 N/s depending on stiffness of the material.
2.4. Function Tests
The setup and testing procedure of the function tests have been earlier described in [22] and later used in several studies [23,24,25,37,38]. These cyclic pressure experiments were performed on a small-scale wellbore section of cement sheath between rock and casing. The setup used for functional tests is illustrated in Figure 3.
The carbon-steel casing was 25-cm long, 2mm thick with 60.3 mm external diameter. The rock used in this work was a hollow cylindrical Berea sandstone (length 20 cm, external diameter 15 cm, and internal diameter 76 mm). The unconfined compressive strength of the rock was about 49 MPa and the Young's modulus ~13 GPa. During sample preparation, the water-saturated rock was placed around the casing in an aluminum cell and cement slurry was poured into the 8-mm gap between the casing and the rock. The cement was cured at 110oC for 20 days by placing the cell on a copper plate on a heating platform. A copper rod attached to the copper plate was placed inside the casing to facilitate heating of the sample radially from inside the casing. After cement curing, the copper rod was removed from inside the casing and replaced by the pressure shaft enabling pressure cycling tests of the sample.
Prior to the function tests, the initial condition of the cement sheath was mapped by CT scan of the sample resulting in a 3D visualization. The sample was then pressurized to 15 MPa for 1 min, and a CT scan of the sample was performed during the last 10 s, before the pressure was released. The sample was then re-pressurized to 16 MPa for 1 min, and a CT scan of the sample was performed during the last 10 s, before the pressure again was released. The procedure was continued, with a 1 MPa increase in pressure each step until a complete failure of the sample was observed. A detailed description of the procedure and following analysis can be found in [39].
The obtained 3D image was composed of 220 horizontal slices (about one every mm), the spatial resolution for each slice being between 350 and 400 µm. The 2D images were analyzed using the Avizo software, with an automated Matlab script followed by visual check, to identify the different parts of the sample and obtain the 3D morphology of the cracks.
2.5. Numerical Modeling
We developed a simple numerical model to complement the function tests. The model was developed using Abaqus finite element package. The model mimics the geometry of the function tests, representing the casing, cement sheath, and the sandstone. A plane strain boundary condition is deemed to be most representative for the model (no displacement in the axial direction). The plane strain condition indicates a semi-2D model. Due to the symmetry, only a quarter of the sample is modelled. The model geometry is illustrated in Figure 4. The cement is assumed to be fully cured before the pressurization begins. Therefore, cement’s mechanical properties are assumed to have reached the ultimate hydrated values. The model initializes the setup with a small compressive stress. The pore pressure in the system is set to 101.3 kPa (atmospheric pressure). No initial stress at the inner casing or outer surface of the rock is defined. The contacts between the cement and casing/rock are assumed to be fully bonded initially. During the pressurization, a pressure load is applied to the inside of the casing that gradually increases over time. The displacements and stresses in the cement/rock/casing system are recorded over time. If the cement and the rock material fail, the plastic strains are recorded. The mechanical properties of sandstone are measured as part of the experimental campaign and used in the model. Table 2 presents the input parameters used in the modelling.
The casing elements are assumed to be elastic. The range of stresses in this work makes it unlikely for the steel casing to fail, therefore casing plasticity is ignored. Triaxial experiments are conducted on the Berea sandstone used in the function tests. These tests provide the elastic mechanical properties and the Mohr-Coulomb friction angle and cohesion for the rock. The MCC plasticity model was used to capture the failure behavior of cement [29,40]. Equation 1 presents the yield envelope for the MCC model:
where, q and p are shear and mean effective pressure, respectively; M is the slope of the critical state line; is the tensile strength of the sample; and is the initial size of the compressive yield limit. In addition to the yield envelope, Equation 2 and Equation 3 define the normal consolidation and swelling consolidation lines, respectively.
In Equation 2, ν is the specific volume; p is the mean pressure, and λ is the slope of the normal consolidation line, which represents plastic volumetric compression of the material. In Equation 3, κ is the slope of the swelling line, representing the volumetric behavior of the sample in the elastic regime. The MCC model (Equation 1) was implemented as a Fortran subroutine in Abaqus.
The results of the triaxial tests were used to extract the appropriate parameters for the MCC model. The SciPy library in Python was used to fit the best curve to the experimental data, in order to estimate the yield envelope parameters in Equation 1. Tensile strength was independently measured for most samples using Brazilian tests. In order to estimate λ and κ, isotropic compression tests are required. However, such tests were not part of the testing program. Soustelle and coauthors [41] measured the MCC parameters for class G cement, including isotropic compression tests. They reported a value of 0.02 for λ and 0.0046 for κ for class G cement. κ is inversely proportional to the bulk modulus of the material [42]. Therefore, we estimated κ for the new recipes tested in this work, by the ratio of the bulk modulus between class G cement and the recipes under study. Equation 4 and Equation 5 illustrate the simple scaling scheme used to estimate κ and λ. K is the static bulk modulus of the recipes in this study, measured during triaxial tests.
3. Results
3.1. Unconfined Mechanical Properties and Samples Water-Fillable Porosity
Mechanical properties of samples exposed in the well for 3 and 9 months are given in figures 4 to 6. After the first 3 months of exposure the uniaxial compressive strength of all tested formulations persisted at the acceptable level of more than 7 MPa, varying between 17 MPa (NAS-M1) and 31 MPa (CAP#71/FAF) (Figure 5 left). The strength loss of about 5% was measured for CAP#71/FAF and CAP#50/FAF. Some initial strength loss followed by the strength stabilization has been reported earlier for calcium-phosphate based cements and is not of concern [43]. Surprisingly, calcium-phosphate formulation of #71 cement modified with MK (CAP#71/Silica/MK) increased by 19%. MK is a more reactive pozzolanic component than fly ash F. Its pozzolanic reactions occur even at low temperatures, so if the stabilization of calcium phosphate cement strength involves pozzolanic reactions of FAF, these reactions may happen at earlier curing times with MK resulting in strength increase. The formulation of CAC#71 with silica (#71/Silica) lost the most compressive strength (16%). The strength of other formulations increased in the order: by 13% (CSH-60/40) < 25% (NAS-M1) < 50% (TSRC) < 72% (#80/Silica).
The compressive strength of the 9-month exposed samples of the same formulations modified with CMF are shown in Figure 5 (right) along with the strength of the samples before the exposure after a 1-day 300oC autoclaving. Formulations modification with CMF resulted in higher initial compressive strength of the samples compared against that of the non-modified formulations exposed for 3 months. This was even though higher water content was necessary for the same self-leveling of cements with the fibers.
CSH-60/40 experienced dramatic strength loss of 86% during the 9-month exposure in the well. The strength of the formulation decreased from 35 MPa to 5 MPa. This result was surprising considering the initial strength increase of 13% in CSH-60/40 after the first 3 months of the exposure.
As expected for calcium-phosphate cements, the strength of CAP formulations with #71 and #50 CAC increased after the longer exposure of 9 months. The strength of CAP#50/FAF more than doubled to the final strength of 35MPa, that of CAP#71/FAF increased by 5% to 49 MPa, which was the highest strength among all tested formulations. The strength of CAP#71/Silica/MK dropped by 10% remaining high at 39 MPa. The strength increase of the NAS-M1 was like for the first 3 months but the rest of the cement formulations more than doubled in strength: with 124% increase for #80/Silica, 130% increase for #71/Silica, and 127% increase for TSRC. The respective final strength values were 33, 45, and 33 MPa. Apart from CSH-60/40 the strength of all the formulations was well above the required minimum of 7 MPa. On average the strength of the 9-month exposed samples (excluding CSH-60/40) was nearly 40% higher than those exposed for 3 months.
One of the major concerns for formulations with very high strength is their brittleness that can be especially problematic under the conditions of repeated thermal and mechanical stresses typical for HT geothermal wells. YM, as one of the brittleness characteristics [44], can be used to classify cement failure mode from soft (YM < 0.7 GPa) to moderate (YM: 0.7 GPa - 2 GPa), brittle (YM: 2 GPa - 3.4 GPa) and very brittle (YM > 3.4 GPa) [16]. For the 3-month exposed samples, according to this classification, samples of CAP#71/FAF and CAP#71/Silica/MK fall into the very brittle failure mode range of more than 3.4 GPa, NAS-M1 formulation modulus value was in the range of the soft failure mode, while the rest of the formulations were in the range of the moderate failure mode, generally, desirable under the geothermal well conditions, allowing to avoid both brittle and soft cement failures (Figure 6 left).
Often YM mirrors compressive strength increasing with the strength increase and decreasing when the strength drops. This was the case for all 3-month exposed samples except for CAP#71/FAF formulation that became more brittle despite a 5% decrease of the strength. The YM of a similar formulation with CAC#50, on the other hand, decreased by 16% with the strength decrease of 5% during the exposure.
The YMs of the 9-month exposed samples were in the brittle range for all samples apart from NAS-M1 with 0.9 GPa YM placing it into the moderate failure range, and CSH-60/40 formulation that experienced dramatic strength and YM loss falling into the soft mode failure (Figure 6 right). Modification of the samples with CMF resulted in YM values on average about 20% lower than those of unmodified samples despite 40% higher compressive strength after longer curing under HTHP conditions.
Toughness, which is a combination of strength and ductility, further confirmed this fact (Figure 7). The average toughness of the samples after the 3-month exposure (excluding CSH-60/40) was 0.4 N*mm/mm3 while that of the 9-month exposed samples was 1.1 N*mm/mm3. Comparison of the reference 300oC-cured samples to those exposed for 3 months in a well shows that toughness decreased for all the samples except TSR, NAS-M1, and #80/Silica (for the latter, the toughness persisted through the exposure). On the other hand, toughness of 9-month exposed samples increased after the exposure tests (Figure 7, right). This is likely, at least partially, due to the samples’ modification with CMF. As could be expected, CSH-60/40 formulation lost most of its toughness, experiencing 74% toughness decrease.
The water-fillable porosity of the tested formulations is shown in Figure 8. As cement hydration and pozzolanic reactions continue under HTHP conditions the porosity can be expected to decrease unless samples experience conditions causing their destructive expansion and crack formation. Porosity decreased for all tested formulations both after 3- and 9-month exposures in the well. The average porosity was on the order of 40% for both exposures with CAP#71/FAF samples showing the lowest porosity of 33% and NAS-M1 showing the highest porosity of 51% after the 9-month exposure. Surprisingly, despite dramatic loss of strength CSH-60/40 formulation remained relatively low at 45%.
In general, mechanical properties of the tested formulations were for the most part within the requirements of geothermal well cements. Most used HTHP Portland cement formulation was the only striking exception losing more than 85% of its strength in 9-month exposure tests.
3.2. Mechanical Properties from Tensile and Triaxial Compression Testing
Mechanical properties of samples exposed in the well for 3 months and non-exposed (control) are given in tables 3 and 4. The triaxial tests confirm the findings of the unconfined compressive strength tests where both #80/Silica and TSRC samples gained significantly in strength, while CAP#71/FAF shows some slight strength reduction after 3 months of the downhole exposure (Figure 9). All 3 recipes become more brittle after the exposure, which is manifested in a distinctively more pronounced stress drop when loaded beyond failure and a lesser accumulation of plastic strain at failure. As expected, a clear confining or mean stress dependency of shear stress at failure was observed in all cases and considered in our constitutive model (chapter 2.5). #80/Silica and TSRC and to some degree also CAP#71/FAF show a characteristic plastic behavior with strain hardening at higher confining stresses for non-exposed samples. After 3 months of exposure all materials show strain softening when loaded beyond ultimate stress and the least so for the TSRC material. When loaded beyond ultimate stress, all samples possess a considerable residual strength with the magnitude again dependent on the acting mean stress.
During excessive shear loading the materials show in most cases a continuous reduction in pore space because of elastic and inelastic volumetric strain accumulation. Ultimately, many samples develop shear bands with strain localization where the detected volumetric strains suggest a dilatant behavior (Figure 10 A). However, this is only the case after significant sample deformation. The higher-porosity TSRC samples exhibit typical compaction bands as a results of pore collapse at high confining pressure (Figure 10 B).
Figure 10.
A) Formation of shear bands associated with volumetric strain expansion during triaxial testing for a CAP#71/FAF sample (3 months exposure, Newberry well) at 2.5 MPa effective confinement. B) Typical signs of pore collapse (formation of numerous compaction bands) for a TSRC sample (1 day autoclaving at 300oC) tested at 10 MPa effective confinement.
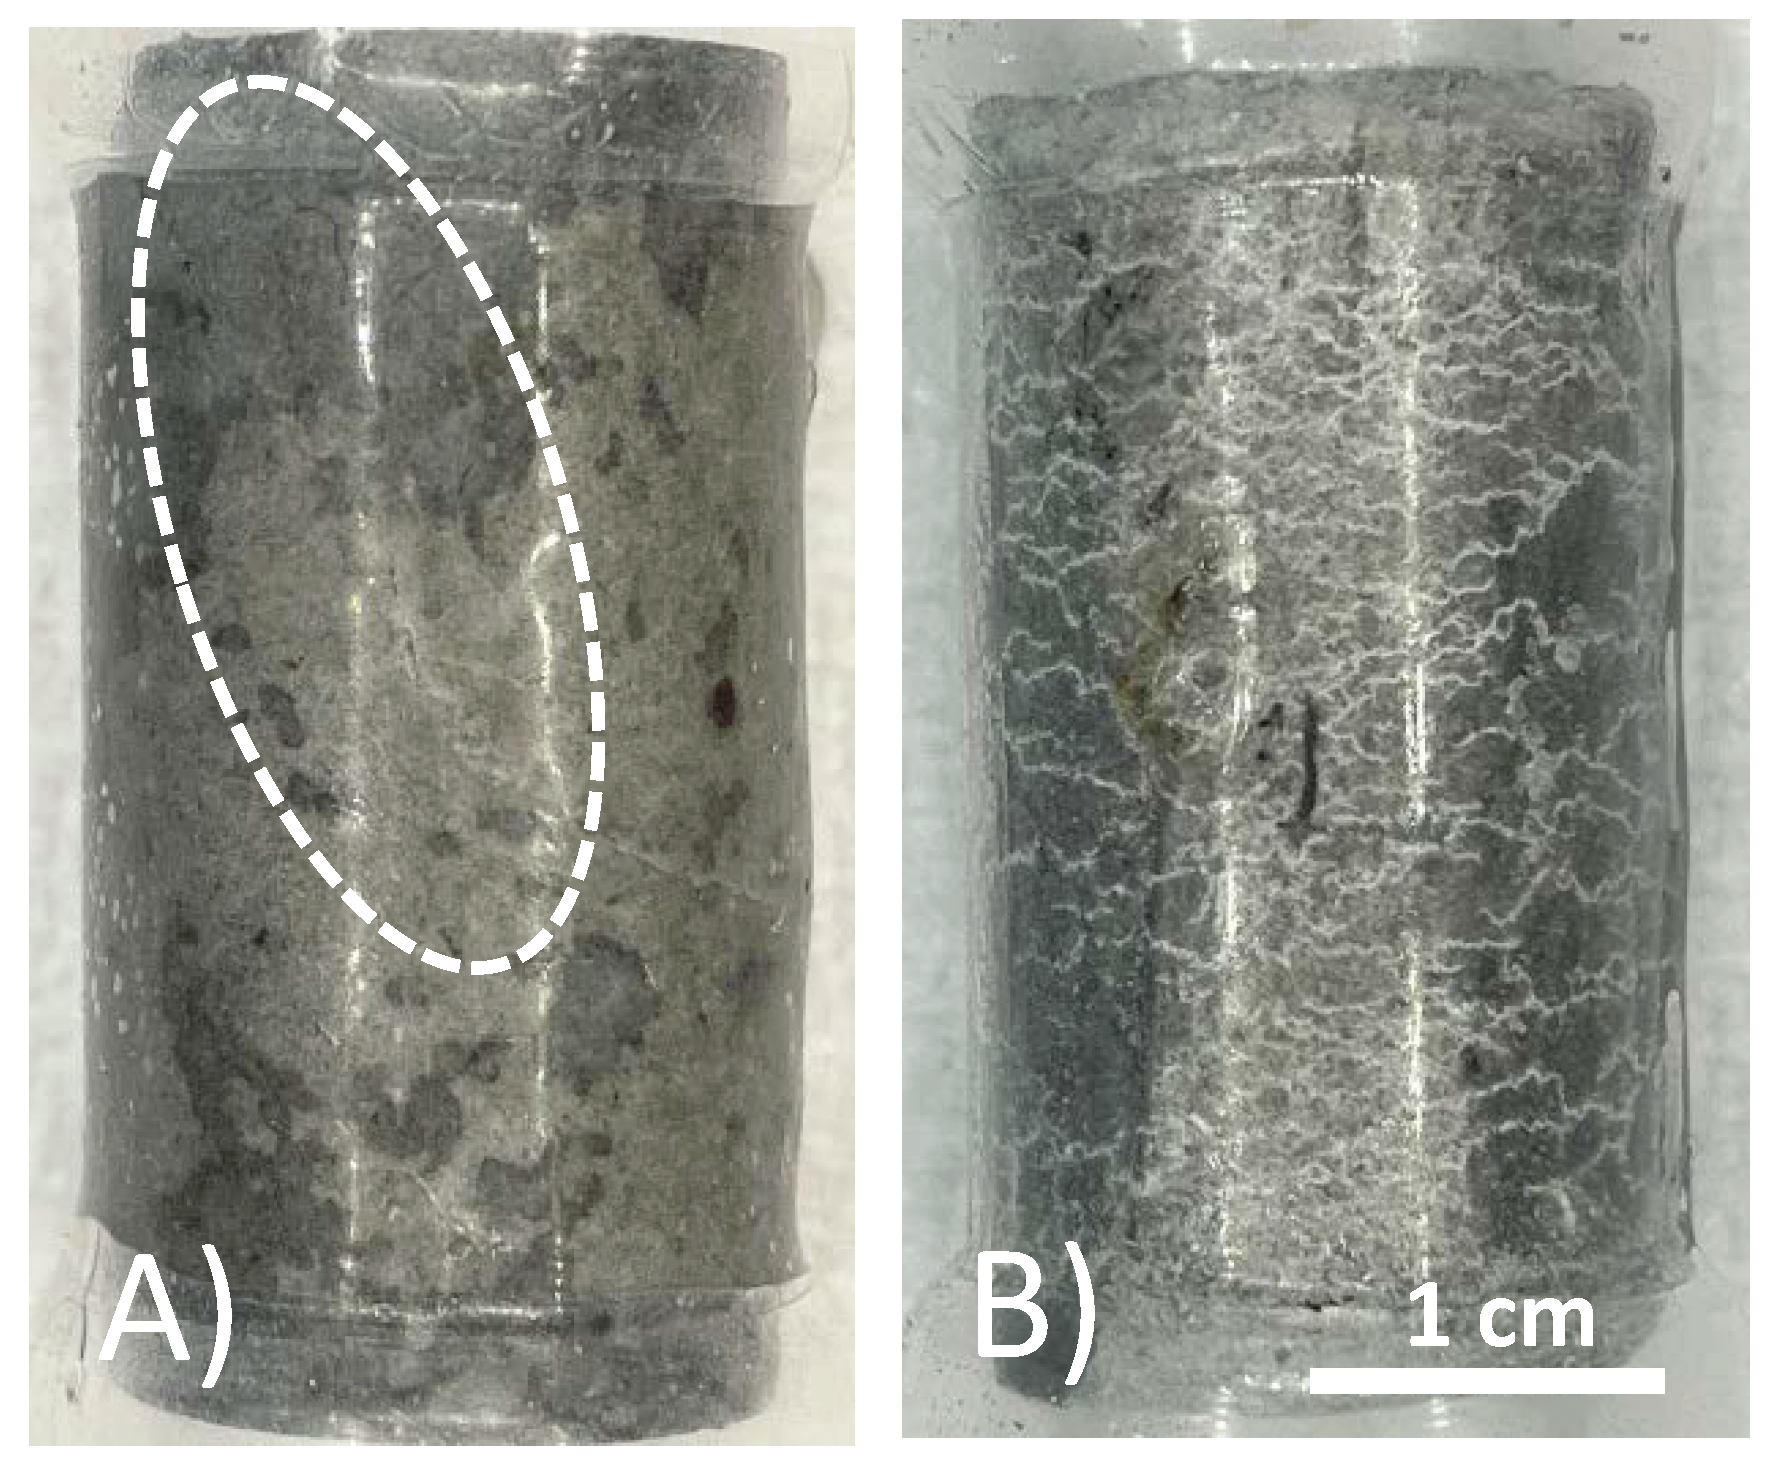

Table 3.
Results from drained triaxial compression testing.
| Formulation |
φ |
σcon |
pp |
σax |
σres |
E |
ν |
|---|---|---|---|---|---|---|---|
| % | MPa | MPa | MPa | MPa | GPa | - | |
| #80/Silica (Newberry) | 0.43 | 5.0 | 2.5 | 46.3 | 26.3 | 14.4 | 0.14 |
| 0.43 | 12.5 | 2.5 | 72.3 | 59.2 | 15.1 | 0.18 | |
| #80/Silica (control) | 0.48 | 5.0 | 2.5 | 26.6 | 24.1 | 5.1 | 0.20 |
| 0.48 | 12.5 | 2.5 | 40.2 | 40.0 | 5.3 | 0.13 | |
| CAP#71/FAF (Newberry) | 0.38 | 5.0 | 2.5 | 83.4 | 50.0 | 19.3 | 0.18 |
| 0.38 | 12.5 | 2.5 | 101.0 | 70.4 | 20.0 | 0.18 | |
| CAP#71/FAF (control) | 0.40 | 5.0 | 2.5 | 85.1 | 39.0 | 17.3 | 0.17 |
| 0.40 | 12.5 | 2.5 | 106.1 | 80.0 | 16.9 | 0.19 | |
| 0.40 | 17.5 | 2.5 | 109.8 | 92.0 | 14.6 | 0.18 | |
| TSRC (Newberry) | 0.48 | 5.0 | 2.5 | 37.6 | 25.1 | 13.9 | 0.14 |
| 0.48 | 5.0 | 2.5 | 40.3 | 25.4 | 13.6 | 0.26 | |
| 0.48 | 12.5 | 2.5 | 51.8 | 50.7 | 14.8 | 0.15 | |
| TSRC (control) | 0.49 | 5.0 | 2.5 | 25.6 | 22.8 | 9.2 | 0.21 |
| 0.49 | 12.5 | 2.5 | 39.9 | 39.9 | 8.1 | 0.15 |
The deformation properties of all samples changed after being exposed for 3 months in the Newberry well. YM (E) increased significantly for #80/Silica (+184%) and TSRC (+63%) and to a lesser extent also for CAP#71/FAF (+21%) which is qualitatively in line with the results from the unconfined compressive strength tests. From the current dataset there is no clear trend towards dependency on mean stress visible. Observed YM’s values do not change much in either direction.
Poisson’s ratio behavior does not show any clear trends. It is not significantly affected by exposure or mean stress for CAP#71/FAF. The limited data collected for TSRC and #80/Silica is unconclusive. In general, the measured values are all within the expected range for cement materials (0.15 – 0.25).
The observed property changes can be explained by alteration of porosity and mineralogical content as already discussed in chapter 3.1.
3.3. Function Tests of Selected Cement Formulations
The function cyclic pressure tests were performed on #80/Silica, CAP#71/Silica, and CSH-60/40. Additional information on function tests of the first two formulations can be found in [38]. The initial scan of the samples showed that they were crack-free. The image analyses of CHS-60/40 and CAP#71/Silica samples revealed some air entrained bubbles as small pores occupying about 0.01% of the sample volume. Figure 11 shows the volume of crack appearing in the cement sheath (left) and the rock (right) during the pressure cycles. In both cases the crack formation occurred at the same pressure, which was higher for #80/Silica formulation than for the other two tested composites (30 and 29 MPa respectively). After the initiation of the crack propagation the total crack volume was larger for #80/Silica formulation. However, the nature of the cracks differed.
CHS-60/40 and CAP#71/Silica showed brittle behavior and underwent instant failure at 29 MPa. #80/Silica, on the other hand, started to crack at 30 MPa, and a full failure was observed at 31 MPa (Figure 12).
The pictures show two different failure behaviors. In CSH-60/40 and CAP#71/Silica, a single crack across the cement sheath and the rock was observed. The crack propagating along the whole sample and through the rock appeared suddenly at 29 MPa. On the other hand, #80/Silica had a more ductile behavior, i.e., two small cracks appeared at 30 MPa and one of them propagated across the rock at 31 MPa.
The crack configurations after the full sample failure are shown in Figure 13. For each test, an example of 2D horizontal slice is shown, where the different parts of the samples are identified: cement, rock, and the cracks. The casing in the center of the picture and the aluminum cell around the rock are not part of this material identification. The uniform red line of the cement sheath failure in the case of CSH-60/40 and CAP#71/Silica indicates continuous crack through the cement. In the case of #80/Silica formulation cement sheath failure was not continuous (the red color mingled with the white spots) suggesting partial survival of the sheath integrity. This could be important for EGS wells that undergo pressure stimulations. The results show that although the crack volume was smaller in the case of more brittle formulations (one continuous crack instead of several cracks), the propagation of the crack can potentially go further along the casing creating passages for aggressive fluids and compromising casing corrosion protection by cement. This was not accounted for in current tests because of the relatively small sample length.
3.4. Numerical Results
3.4.1. Plasticity Parameters
Figure 14 presents the fitted curve to the triaxial and UCS data for the CAP#71/FAF sample. If the loading test (triaxial or UCS) indicates strain softening, i.e. a drop in stress after the peak is reached, then the peak indicates a point on the yield envelope. The residual stress after the peak indicates a point on the critical state line. Strain softening is indicative of the “dry side” of the yield envelope on the left of the critical state line, as is seen in Figure 13. If strain hardening behavior is observed in the experiments, then the yield envelope is reached at the onset of deviation from linear elasticity. Residual stress is reached as axial stress reaches a constant value, indicating the point on the critical state line. Table 4 presents the estimated MCC parameters for the Newberry well and control samples.
The tensile strength values in Table 4 are inferred from Brazilian tests on Newberry and control samples, for all the formulations except the CAP#71/FAF. The TSRC (control) sample shows the closest MCC parameter values to the class G cement as reported by [41]. The TSRC sample exposed to the Newberry well condition shows an expanded yield surface and an increase in the slope of the critical state line (M). Tensile strength also shows a modest increase. This indicates an increase in overall strength and stiffness of the sample due to the exposure. The CAP#71/FAF samples show relatively constant MCC parameters before and after exposure to the well conditions. The size of the yield envelope is significantly larger for the CAP#71/FAF sample compared to class G cement (approximately 100 MPa compared to 23 MPa). The #80/Silica (control) sample indicates a slight increase in strength compared to class G cement, however exposure to well conditions marks a significant increase in strength and stiffness. The size of the yield envelope increases from 28 to 58 MPa, while M increases from 1.3 to 1.6. The tensile strength increases significantly from 3.45 to 5.13 MPa. These results indicate that the present cement formulations may show different mechanical behavior depending on their age and temperature condition. Well integrity models should take this into account in order to improve modelling predictions. If short term behavior of the cement is of interest, the mechanical parameters of the control samples are likely more representative. However, if long term behavior of cement is being modelled, the Newberry sample results should be used in numerical models.
3.4.2. Function-Test Model
The results of the numerical model replicating the function tests are presented in this section. The model is run for six recipes as presented in Table 4, along with class G cement with MCC parameters reported by [41]. The numerical model tracks the evolution of plastic strains in the cement elements as the casing is pressurized. Figure 15 demonstrates the average value of the volumetric plastic strain versus casing pressure. The general trend of the results shows no initial plastic strain in the cement. At a certain casing pressure, plastic strains start accumulating. This is equivalent to the onset of cracking in the function tests. The positive value indicates dilation or an increase in the sample volume, indicative of cracking. The numerical results also show failure in the sandstone which is observed in the experimental observations as well.
The reference class G cement shows initial signs of cracking at a casing pressure of 18 MPa. The #80/Silica (control) sample shows initial signs of failure at 31 MPa. This is similar to the experimental observation. #80/Silica (Newberry) sample starts cracking at the same casing pressure of 31 MPa. This is despite the fact that exposure to high temperature conditions and aging increases the strength of this recipe. The increase in strength comes with an increase in stiffness which can be detrimental as it leads to higher levels of stress in the cement. In this case, the increase in stiffness compensates for the improvement in strength. The final results show more brittle cracking in the exposed sample indicated by a slightly higher level of plastic volumetric strain.
The CAP#71/FAF (control) has the largest yield envelope of the three formulations in Table 4. However, it also has the highest Young's modulus. Therefore, the casing pressure increase can lead to high stresses in the cement sheath. CAP#71/FAF (control) shows initial signs of cracking at 31 MPa. In contrast, CAP#71/FAF (Newberry) starts cracking at 23 MPa. The reason for earlier failure of CAP#71/FAF (Newberry) is the higher stiffness compared to the control sample (19 versus 16 GPa). Once CAP#71/FAF (Newberry) sample fails, the rate of increase in plastic strain is the highest of all samples, indicating a high level of brittleness.
The TSRC (control) formulation cracks at a pressure of 29 MPa. TSRC (Newberry) shows a similar behavior and starts cracking at 29 MPa casing pressure. However, the rate of plastic strain accumulation is higher for the Newberry sample, similar to the #80/Silica formulation. Overall, all the formulations considered here performed better than class G cement and accumulated less plastic strain and initiated cracking at a higher casing pressure. Exposure to the Newberry well conditions improved the strength of the formulations. However, it also increased the stiffness (Young’s Modulus) of the formulations which may lead to a more brittle behavior and therefore higher levels of crack volume after failure.
3.4. Phase Compositions and Morphologies of Selected Formulations
To understand changes in mechanical properties of the exposed formulations and to predict their further stability and degradation under the well conditions the work on phase identification and morphological studies was performed for the designs of interest. Changes in the Portland cement-based formulation, CSH-60/40, that caused dramatic loss of mechanical properties without increasing sample’s porosity were of considerable interest.
3.4.1. CSH-60/40
Figure 16 shows XRD patterns of the reference CSH-60/40 sample and those exposed in the well for 3 or 9 months.
For the CSH-60/40 formulation, the main crystalline phases of hydrated cement after one-day autoclaving at 300 oC were predictably tobermorite and xonotlite. Xonotlite should be the dominant crystalline phase at this temperature, with the tobermorite temperature stability being below 200 oC [45]. Nevertheless, tobermorite was clearly present in the reference sample, although, the intensity of xonotlite peaks was higher than for tobermorite ones. Further conversion of tobermorite to xonotlite after longer HT exposure was expected. This conversion is accompanied by microstructural changes with the growth of xonotlite needle crystals resulting in slightly decreased strength and increased porosity. However, mechanical property analyses of this cement after the 3-month exposure revealed decreased samples porosity and increased strength. This unusual behavior can be understood with the results of the composition analyses.
For the field samples xonotlite peaks were nearly absent from the XRD patterns. The patterns were dominated by the peaks of calcium carbonate and non-reacted silica. For the most part crystalline calcium-silicate phases converted to calcium carbonate. Only small xonotlite shoulders were still visible in the pattern of the 3-month exposed sample (e.g., 2Ɵ ~28.8), but they completely disappeared from the patterns of the 9-month exposed samples. The only other crystalline phase detected by XRD was silica. The intensity of silica peaks decreased suggesting that it, at least partially, participated in the tobermorite → xonotlite conversion before the sample was carbonated. The initial cement carbonation resulted in increased sample strength and decreased porosity due to the matrix densification with calcium carbonate.
However, after the longer 9-month exposure calcium removal from calcium-silicate hydrates through carbonation resulted in dramatic strength decrease. In the excess of carbon dioxide and water vapors calcium carbonate converted into the soluble calcium bicarbonate, which can migrate out of cement matrix leaving amorphous silica gel behind.
Strong sample carbonation was confirmed by the TGA/DTG tests (Figure 17). The only large decomposition event for both 3- and 9-month exposed samples is carbonate’s decomposition. The mass loss corresponding to this step is 21% and 28% after the 3- and 9-month exposures respectively. Small decline of the weight curve associated with the cement hydrates was still visible after the 3 months in the well, while no weight loss associated with the cement hydrates was detected after the 9-month exposure. Assuming the decarbonation weight loss was only due to the calcium carbonate decomposition and knowing the initial weight percent of CaO in the class G cement (73%), the mass loss of 21% for 60/40 cement/silica formulation means that 54% of the original calcium in class G cement was in the form of carbonate after the 3 months of exposure. The 28% CO2 loss during the decarbonation step of the OPC/silica formulation with 5% CMF corresponds to 83% of the calcium in the original formulation being carbonated. Considering that calcium carbonate was likely partially converted into the soluble calcium bicarbonate which could migrate from the samples, even higher conversion of the original calcium in the exposed samples is likely.
Figure 18 shows morphologies of the 3- and 9-month exposed samples and Table 5 gives the results of elemental composition measurements in representative locations.
The SEM images of the 3-month exposed sample show large calcium carbonate crystals (location 1) formed in an otherwise mostly amorphous cement matrix and smaller calcium carbonate crystals of different sizes (location 2) embedded into the matrix throughout the sample. In agreement with the XRD data xonotlite needle-like crystals were not detected. Although well-formed, the large calcium carbonate crystals did not compromise mechanical properties of the 3-month exposed samples. However, their precipitation did not prevent further sample carbonation blocking CO2 and water penetration into the sample. The large crystals in the images of the 9-month exposed samples belonged to non-reacted crystalline silica (location 4). Calcium carbonate crystals were not observed, the morphological features of the matrix became smaller, the structure of the matrix had a porous aspect that would be favorable for continuous carbonation of the sample. The elemental composition in other tested locations corresponded to the calcium bicarbonate present along with silica gel (locations 3 and 5).
Table 5.
Elemental composition in selected representative locations of CSH-60/40 samples exposed in Newberry well for 3 or 9 months (the locations of the analyses are shown in Figure 18).
Table 5.
Elemental composition in selected representative locations of CSH-60/40 samples exposed in Newberry well for 3 or 9 months (the locations of the analyses are shown in Figure 18).
| Element | Location | Weight percent (% error) | Identified phase | Location | Weight percent (% error) | Identified phase |
|---|---|---|---|---|---|---|
| 3-month exposure | ||||||
| C | 1 | 12.93 (0.45) | Calcium Carbonate, (CaCO3) | 2 | 12.08 (0.52) | Calcium Carbonate, (CaCO3) |
| O | 49.91 (1.20) | 50.30 (0.90) | ||||
| Si | 1.01 (0.10) | 4.17 (0.14) | ||||
| Ca | 35.07 (0.53) | 31.11 (0.55) | ||||
| Fe | 1.08 (0.29) | 1.88 (0.31) | ||||
| 9-month exposure | ||||||
| C | 3 | 9.65 (1.60) | Calcium bicarbonate (CaHCO3) | 4 | 8.93 (2.38) | Silica (SiO2) |
| O | 35.07 (0.91) | 32.18 (1.03) | ||||
| Al | 1.83 (0.14) | - | ||||
| Si | 28.98 (0.63) | 54.45 (1.52) | ||||
| Ca | 19.28 (0.45) | 2.63 (0.17) | ||||
| Fe | 4.60 (0.30) | 1.33 (0.27) | ||||
| C | 5 | 11.94 (3.59) | Calcium bicarbonate (CaHCO3) | |||
| O | 26.00 (2.00) | |||||
| Al | 2.44 (0.38) | |||||
| Si | 24.43 (1.32) | |||||
| Ca | 16.69 (0.99) | |||||
| Fe | 18.50 (1.34) | |||||
In summary, for CSH-60/40 formulation the results of all the analyses agreed. This formulation underwent sever carbonation in the well resulting in its loss of mechanical properties. Its water-fillable porosity nevertheless persisted with calcium carbonates forming matrix with relatively low permeability.
3.4.2. Calcium Phosphate Cement with Different CAC Grades (CAP#71/FAF, CAP#50/FAF).
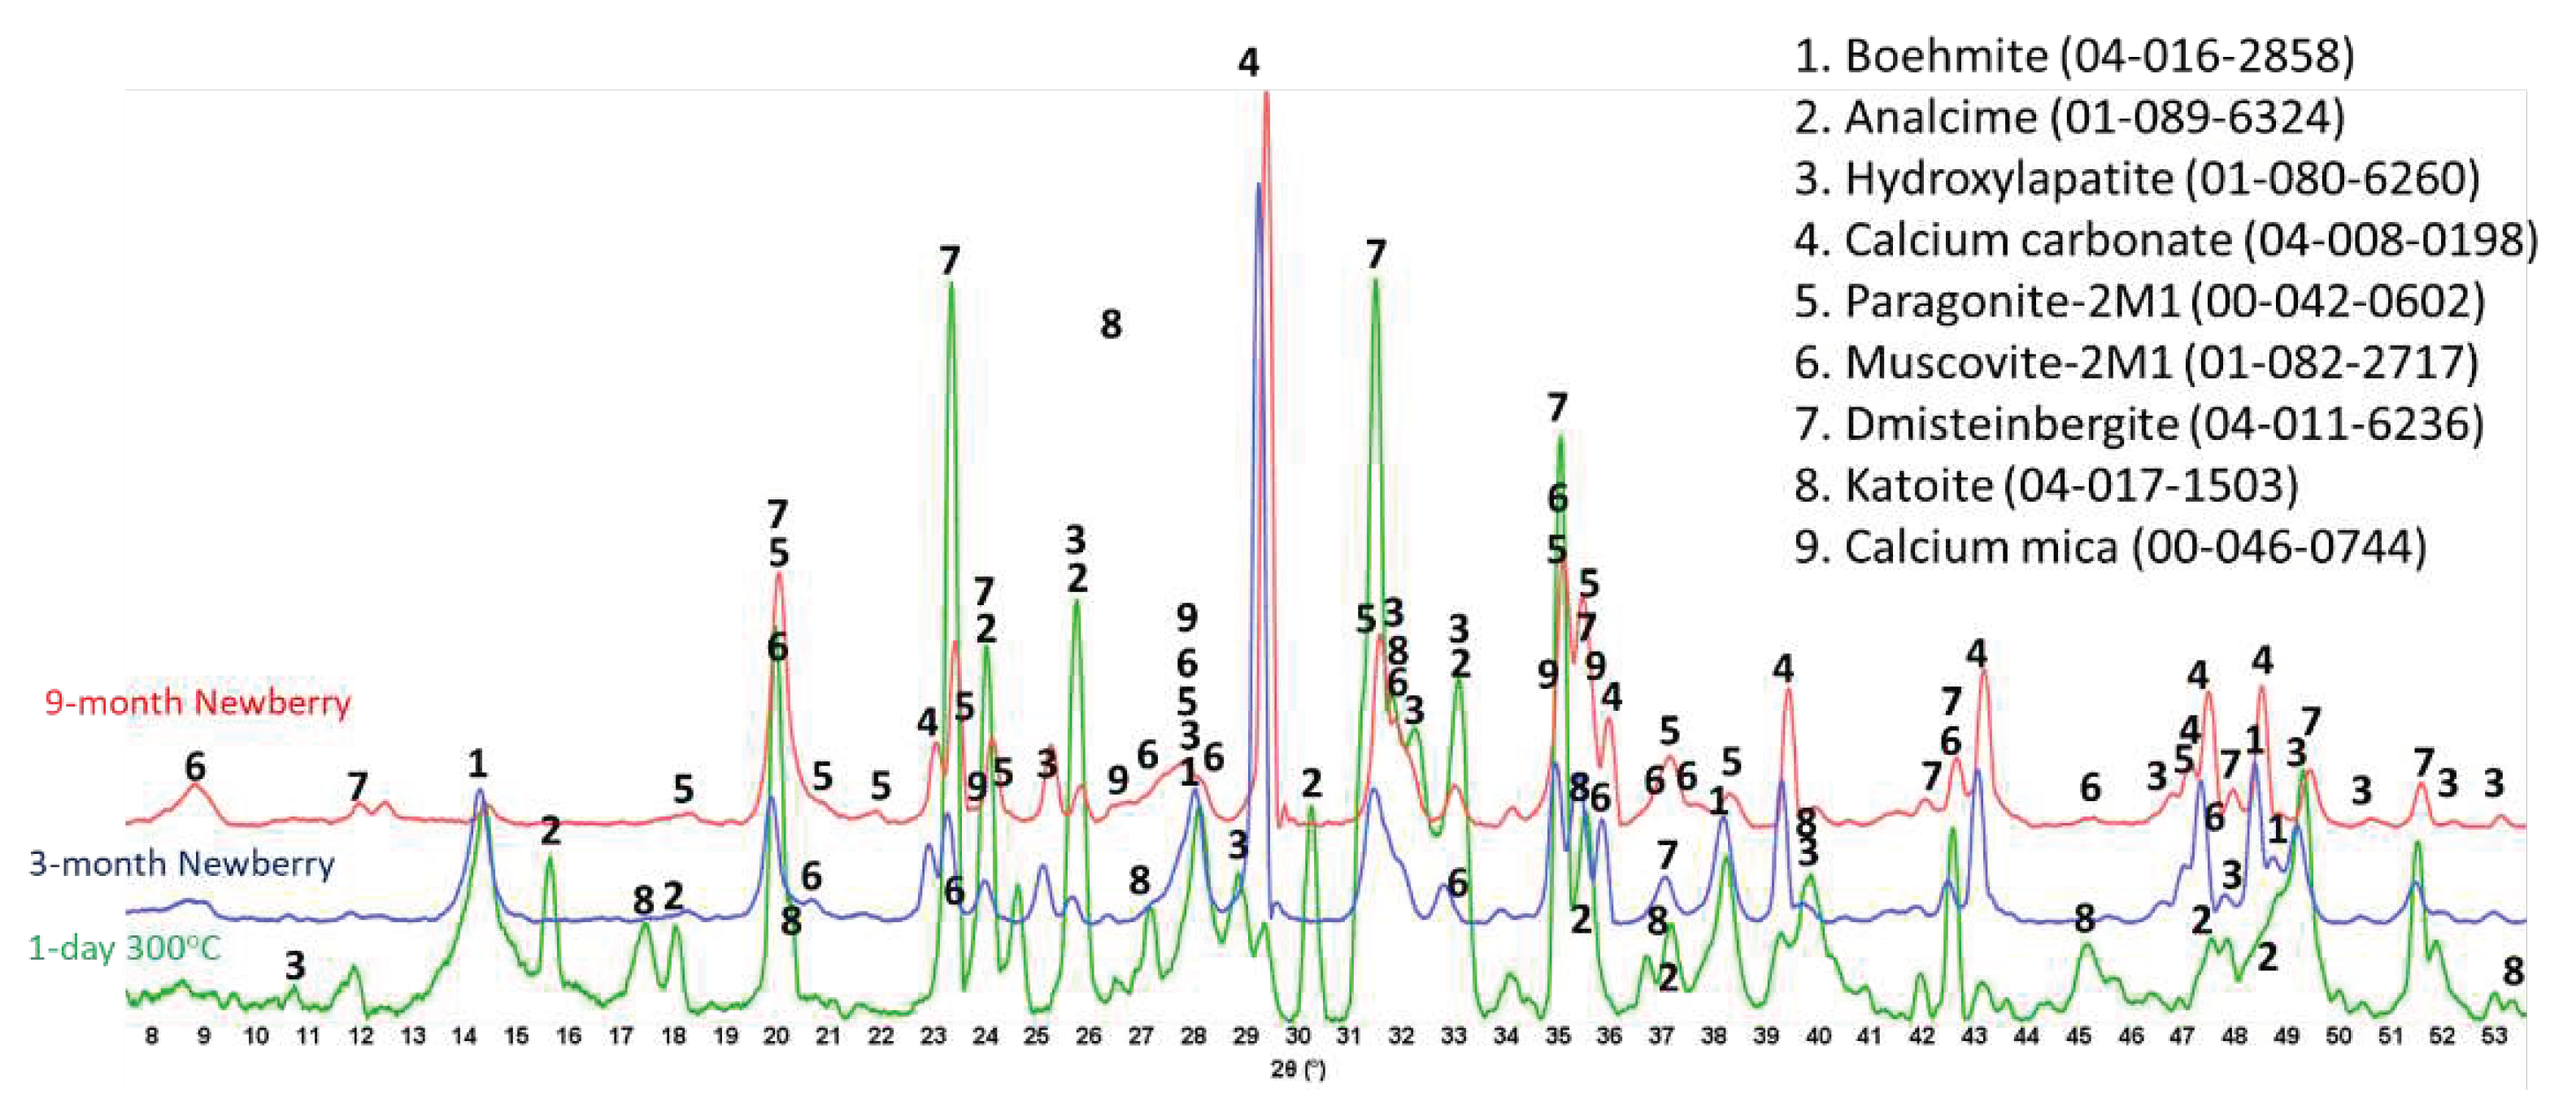
Calcium phosphate cement formulations were specifically developed to withstand CO2-reach HT environments of geothermal wells [13,46]. The CO2-resistance of this cement comes from CO2 mineralization with formation of a stable carbonated apatite and cancrinite phases [47]. The two formulations of CAP cement with FAF were made with CAC#71 and with CAC#50. CAC#71 has higher aluminum content (55.8 wt.% Al2O3) and lower Ca content (44.0 wt.% CaO) than CAC#50 (45.1% and 49.7% respectively). Figure 19 and Figure 20 show XRD patterns of these formulations for the reference samples and samples exposed in the well for 3 or 9 months.
The reference patterns include expected phases of boehmite (aluminum oxide hydroxide), hydroxylapatite and analcime, high-temperature stable zeolite, along with the feldspar mineral dmisteinbergite (CaAl2Si2O8), an isomorph of anorthite. In the formulation with CAC#50 that is richer in calcium, crystallization of katoite takes place (Ca3Al3.5O4.5(OH)7.5). This phase is absent in CAP#71/FAF with more aluminum-rich CAC#71.
Samples exposure in the well resulted in disappearance of analcime peaks in both formulations and disappearance of katoite peaks in CAP#50/FAF. The intensity of boehmite peaks strongly dropped in CAP#50/FAF with lower aluminum content but remained strong in CAP#71/FAF. The intensity of dmisteinbergite peaks decreased in both formulations. The new peaks of mica-type minerals appeared in the patterns. These were identified as belonging to paragonite, margarite, muscovite, and Ca-mica minerals. Calcium carbonate peaks were present in the patterns of both formulations.
The peaks of hydroxylapatite were clearly present in the patterns of both formulations. However, expected carbonated phases of cancrinite and carbonated apatite were not found. If for carbonated apatite the phase identification is somewhat problematic due to the strong patterns overlap with the apatite phase peaks and low crystallinity of the newly formed carbonated apatite phase during CAP cement carbonation, the phase of cancrinite could be identified if it would have formed in the samples.
Figure 19.
XRD patterns of the reference CAP#71/FAF sample (after 1 day autoclaving at 300 oC) and samples exposed in Newberry well for 3 or 9 months.
Figure 19.
XRD patterns of the reference CAP#71/FAF sample (after 1 day autoclaving at 300 oC) and samples exposed in Newberry well for 3 or 9 months.
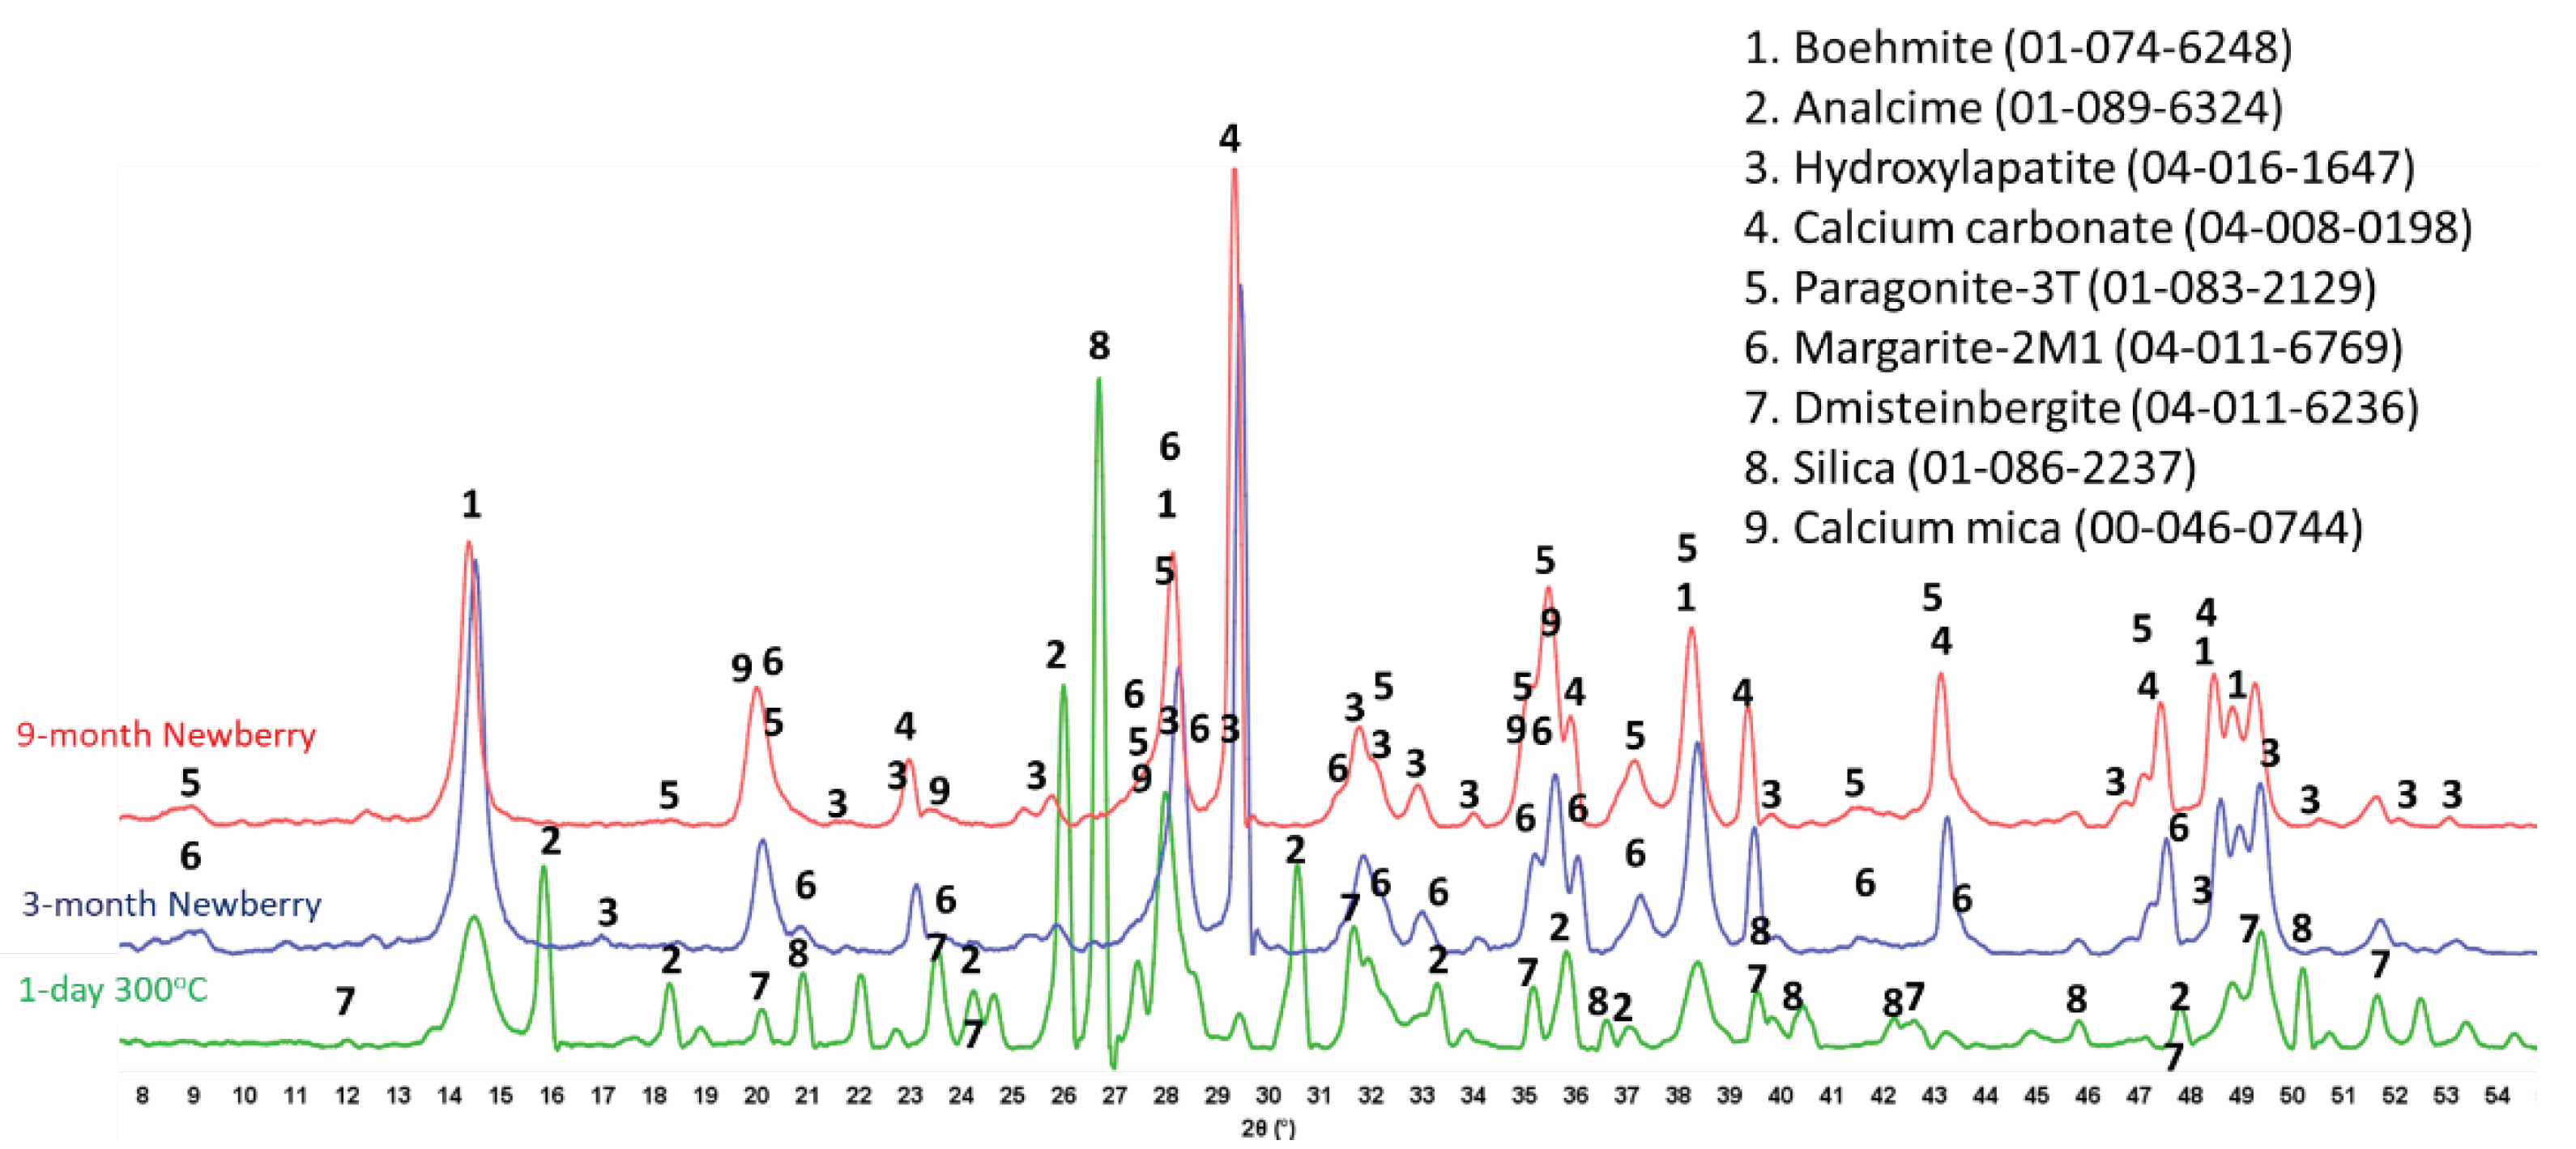
Figure 20.
XRD patterns of the reference CAP#50/FAF sample (after 1 day autoclaving at 300 oC) and samples exposed in Newberry well for 3 or 9 months.
Figure 20.
XRD patterns of the reference CAP#50/FAF sample (after 1 day autoclaving at 300 oC) and samples exposed in Newberry well for 3 or 9 months.
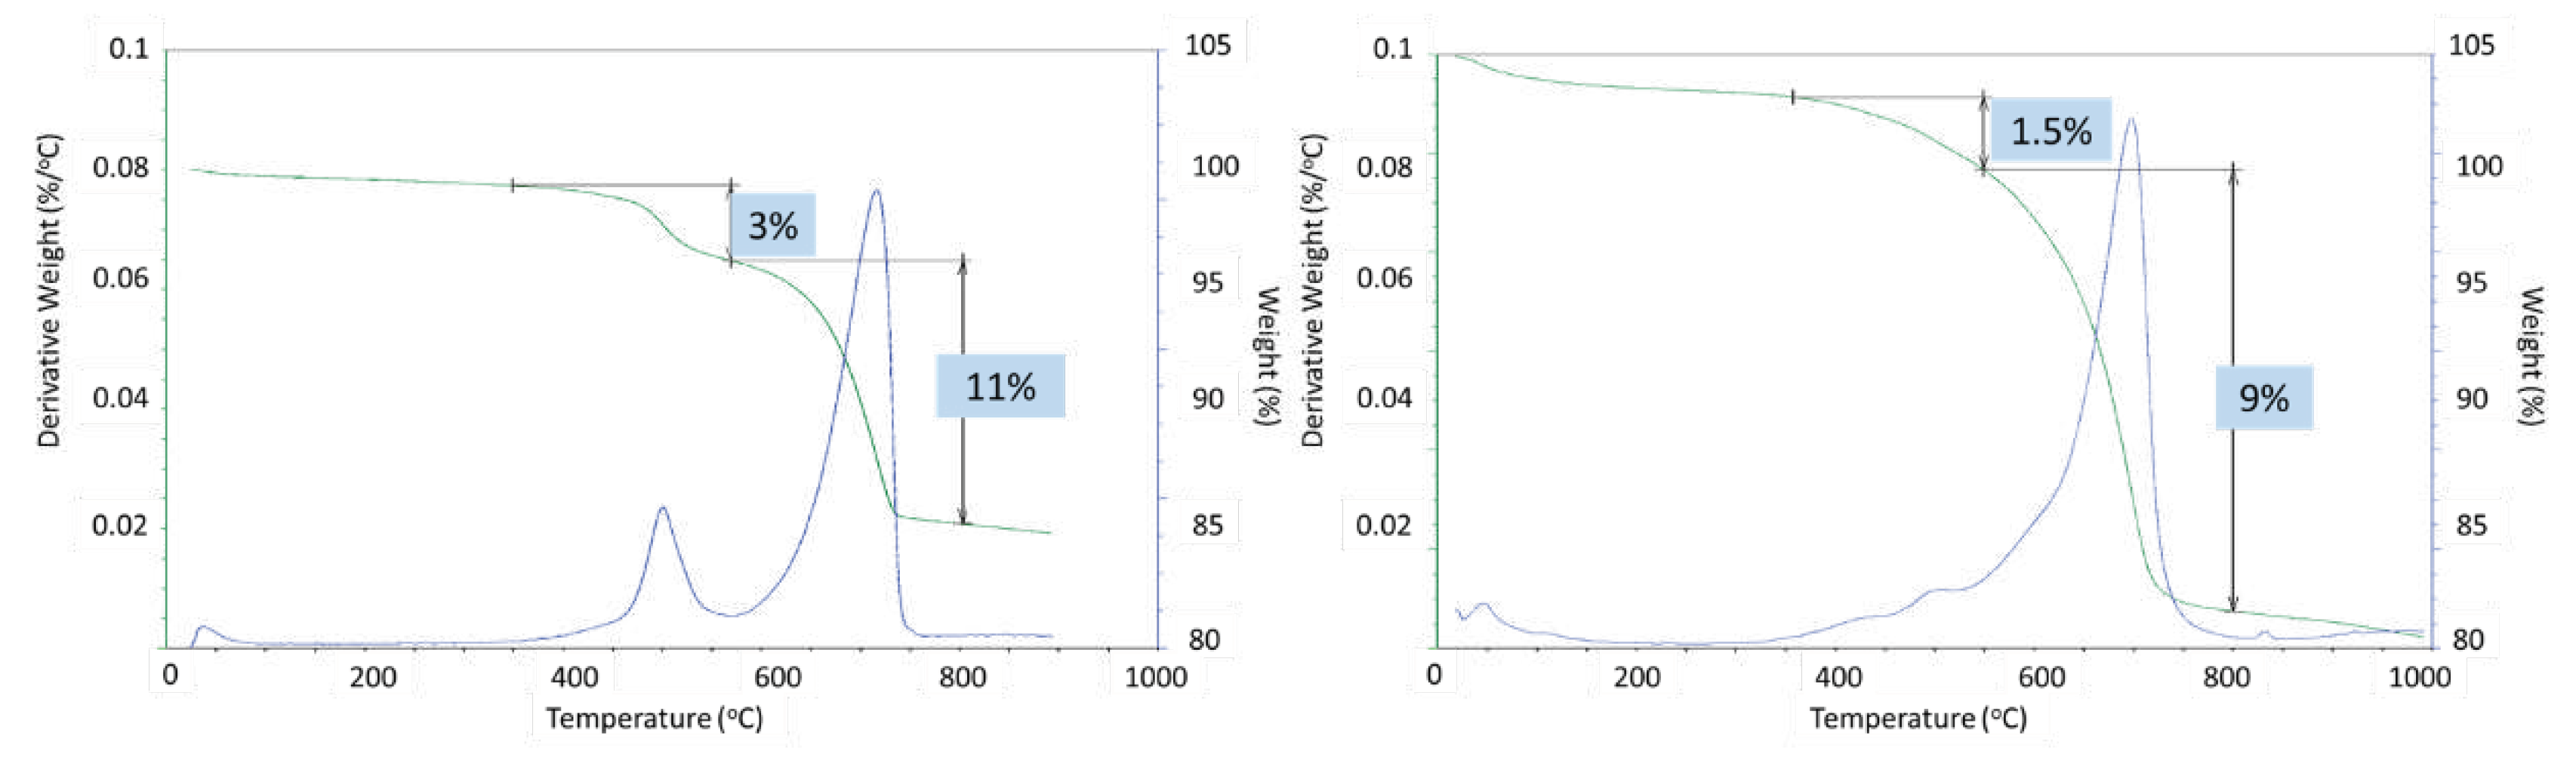
Partial carbonation of the samples was confirmed with TGA/DTG and EDX analyses (Figure 21). The two major weight loss events in thermogravimetric experiments of CAP cement formulations were decomposition of boehmite between 400 and 550 oC and decarbonation of the samples above 600 oC [48]. The weight loss associated with boehmite dehydroxylation was 5% and 4% after 3 and 9 months of well exposure for CAP#71/FAF and 3 and 1.5% for CAP#50/FAF respectively (Figure 22). This result agreed with the strongly decreased peaks intensities of boehmite in 9-month exposed CAP#50/FAF samples. The extent of carbonation for CAP#71/FAF formulation did not change between 3 and 9-month exposures persisting at 8%.
For CAP#50/FAF the decarbonation peak was slightly smaller after the 9 months in the well (9% vs. 11% after the 3-month exposure). The decrease in carbonates concentration during the longer exposures could be attributed to the continues carbonation and removal of soluble carbonates from the sample. However, it is likely that samples did not undergo any significant additional carbonation as in the case of CSH-60/40 formulation since the percent of decarbonation did not increase.
Figure 21.
TGA/DTG curves of the CAP#71/FAF samples exposed in Newberry well for 3 months (left) or 9 months (right).
Figure 21.
TGA/DTG curves of the CAP#71/FAF samples exposed in Newberry well for 3 months (left) or 9 months (right).
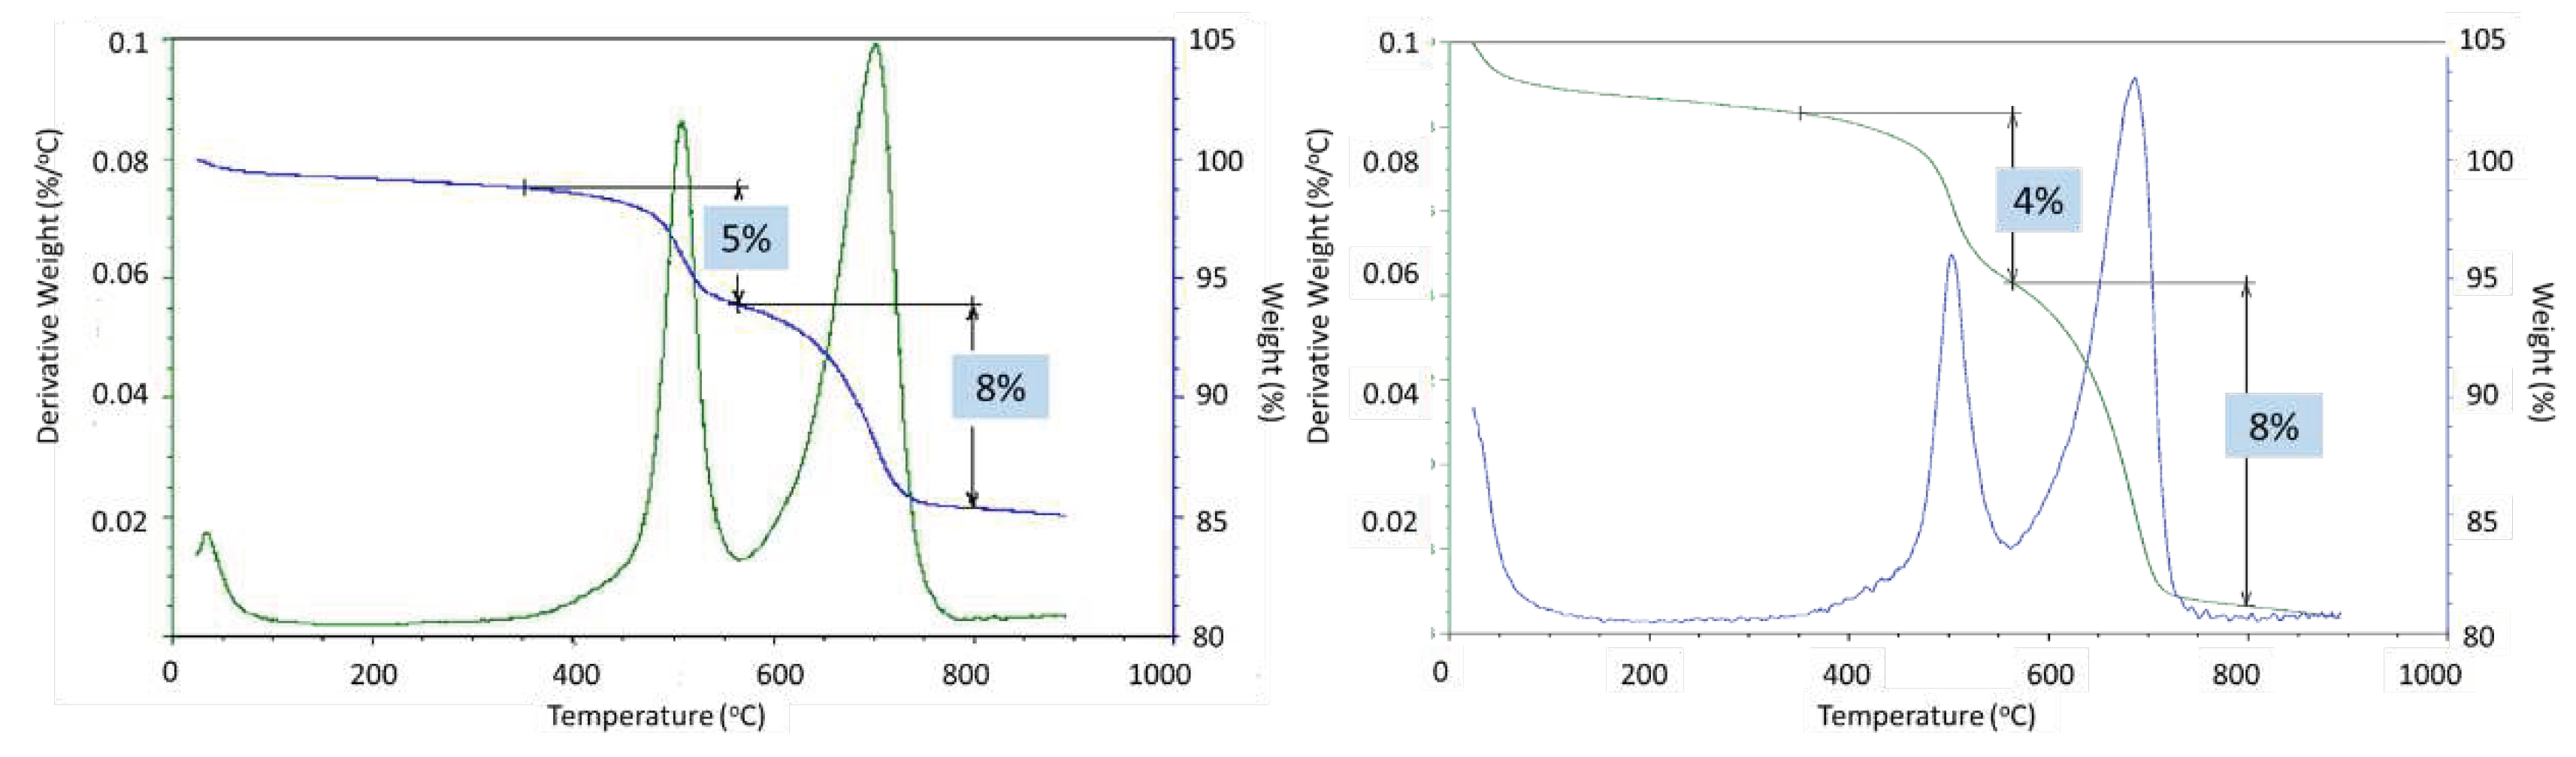
Figure 22.
TGA/DTG curves of the CAP#50/FAF samples exposed in Newberry well for 3 months (left) or 9 months (right).
Figure 22.
TGA/DTG curves of the CAP#50/FAF samples exposed in Newberry well for 3 months (left) or 9 months (right).
The results of morphological analyses are shown in Figure 22 and Figure 23 and the EDX compositions along with the phases identified in selected locations are shown in Table 6 and Table 7.
In agreement with the XRD and TGA/DTG data CAP#71/FAF formulation had some inclusions of calcium carbonate crystals after the 3-month exposure (location 1). The matrix also still contained non-reacted FAF particles (top right photomicrograph, Figure 23) and clearly identifiable dmisteinbergite crystals (location 2). After the 9-month exposure the larger crystalline features similar to dmisteinbergite and more compact embedded into the dense matrix had compositions related to mica-type minerals, margarite, with its typical morphology of a mass with thin laminae, and calcium mica (locations 3 and 4).
Figure 23.
Photomicrographs of CAP#71/FAF samples exposed in Newberry well for 3 months (top) or 9 months (bottom).
Figure 23.
Photomicrographs of CAP#71/FAF samples exposed in Newberry well for 3 months (top) or 9 months (bottom).
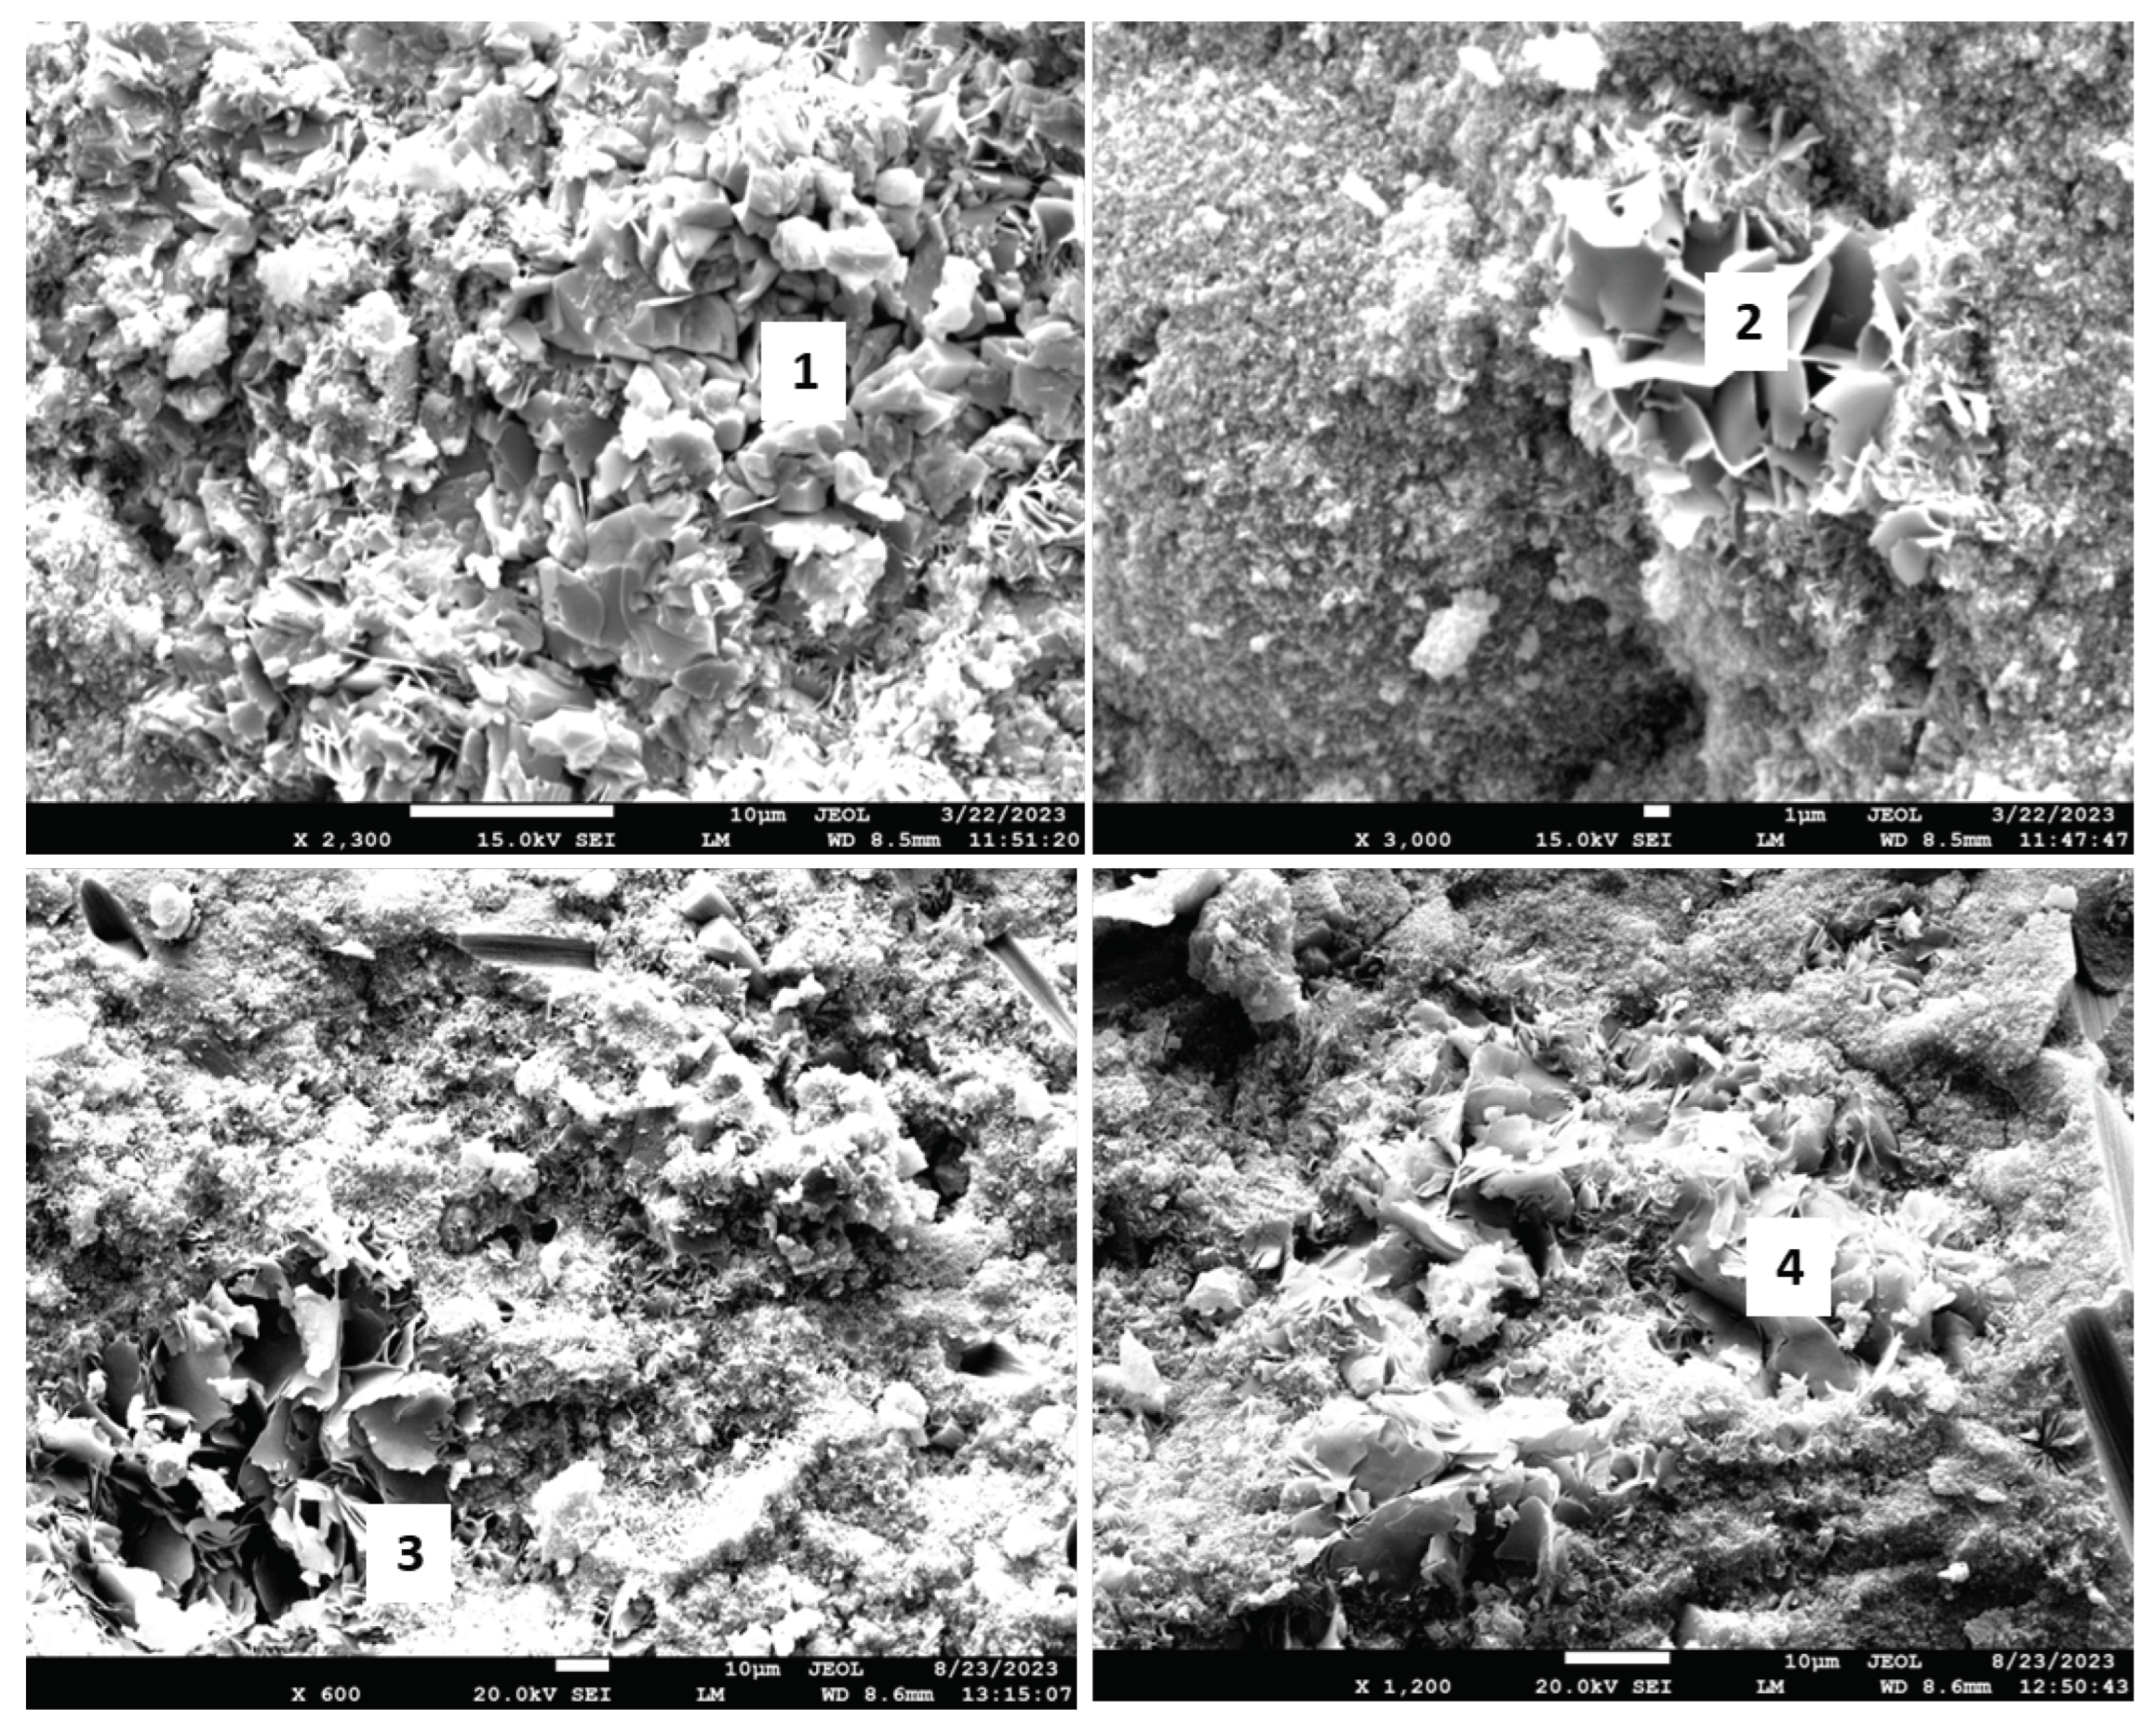
Table 6.
Elemental composition in selected representative locations of CAP#71/FAF samples exposed in Newberry well for 3 or 9 months (the locations of the analyses are shown in Figure 23).
Table 6.
Elemental composition in selected representative locations of CAP#71/FAF samples exposed in Newberry well for 3 or 9 months (the locations of the analyses are shown in Figure 23).
| Element | Location | Weight percent (% error) | Identified phase | Location | Weight percent (% error) | Identified phase |
|---|---|---|---|---|---|---|
| 3-month exposure | ||||||
| C | 1 | 11.7 (0.45) | Calcium Carbonate, (CaCO3) | 2 | - | Dmisteinbergite (CaAl2Si2O8) |
| O | 48.30 (1.2) | 43.02 (0.90) | ||||
| Si | - | 16.66 (0.40) | ||||
| Ca | 38.01 (0.57) | 9.24 (0.43) | ||||
| Al | 1.26 (0.11) | 18.99 (0.40) | ||||
| Fe | - | 12.09 (0.93) | ||||
| 9-month exposure | ||||||
| O | 3 | 30.05 (0.66) | Calcium mica (Al3Ca0.5Si3O11) or Margarite ((Na0.2Ca0.8Al3.9Si2.1)11(OH)) | 4 | 36.14 (0.53) | Margarite ((Na0.2Ca0.8Al3.9Si2.1)11(OH)) |
| Na | 1.22 (0.20) | 2.01 (0.18) | ||||
| Al | 27.85 (0.38) | 27.26 (0.31) | ||||
| Si | 26.16 (0.40) | 25.69 (0.33) | ||||
| K | 4.52 (0.20) | 2.82 (0.15) | ||||
| Ca | 7.64 (0.24) | 4.69 (0.17) | ||||
| Fe | 2.11 (0.35) | 1.39 (0.23) | ||||
The photomicrographs of CAP#50/FAF samples are given in Figure 24, and Table 7 shows EDX elemental analyses at specified locations and possible corresponding phases. The 3-month well-exposed sample matrix was very dense, rich in aluminum and silica, with the presence of phosphorus, calcium and some iron. Carbon detection indicated partial matrix carbonation; however, large calcium carbonate crystals were not found in the sample. Non-reacted particles of FAF were still visible (photograph, top right) embedded into the matrix. EDX analyses showed that phosphorus phases made part of small crystals of less than 1 micron or were incorporated into the amorphous matrix. After the 9-month exposure dense matrix was formed with tiny crystals of calcium mica (locations 3 and 4). The photomicrograph also shows intact carbon fibers that withstood a 9-month exposure in the bulk cement without any visible damage.
Figure 24.
Photomicrographs of CAP#50/FAF samples exposed in Newberry well for 3 months (top) or 9 months (bottom).
Figure 24.
Photomicrographs of CAP#50/FAF samples exposed in Newberry well for 3 months (top) or 9 months (bottom).
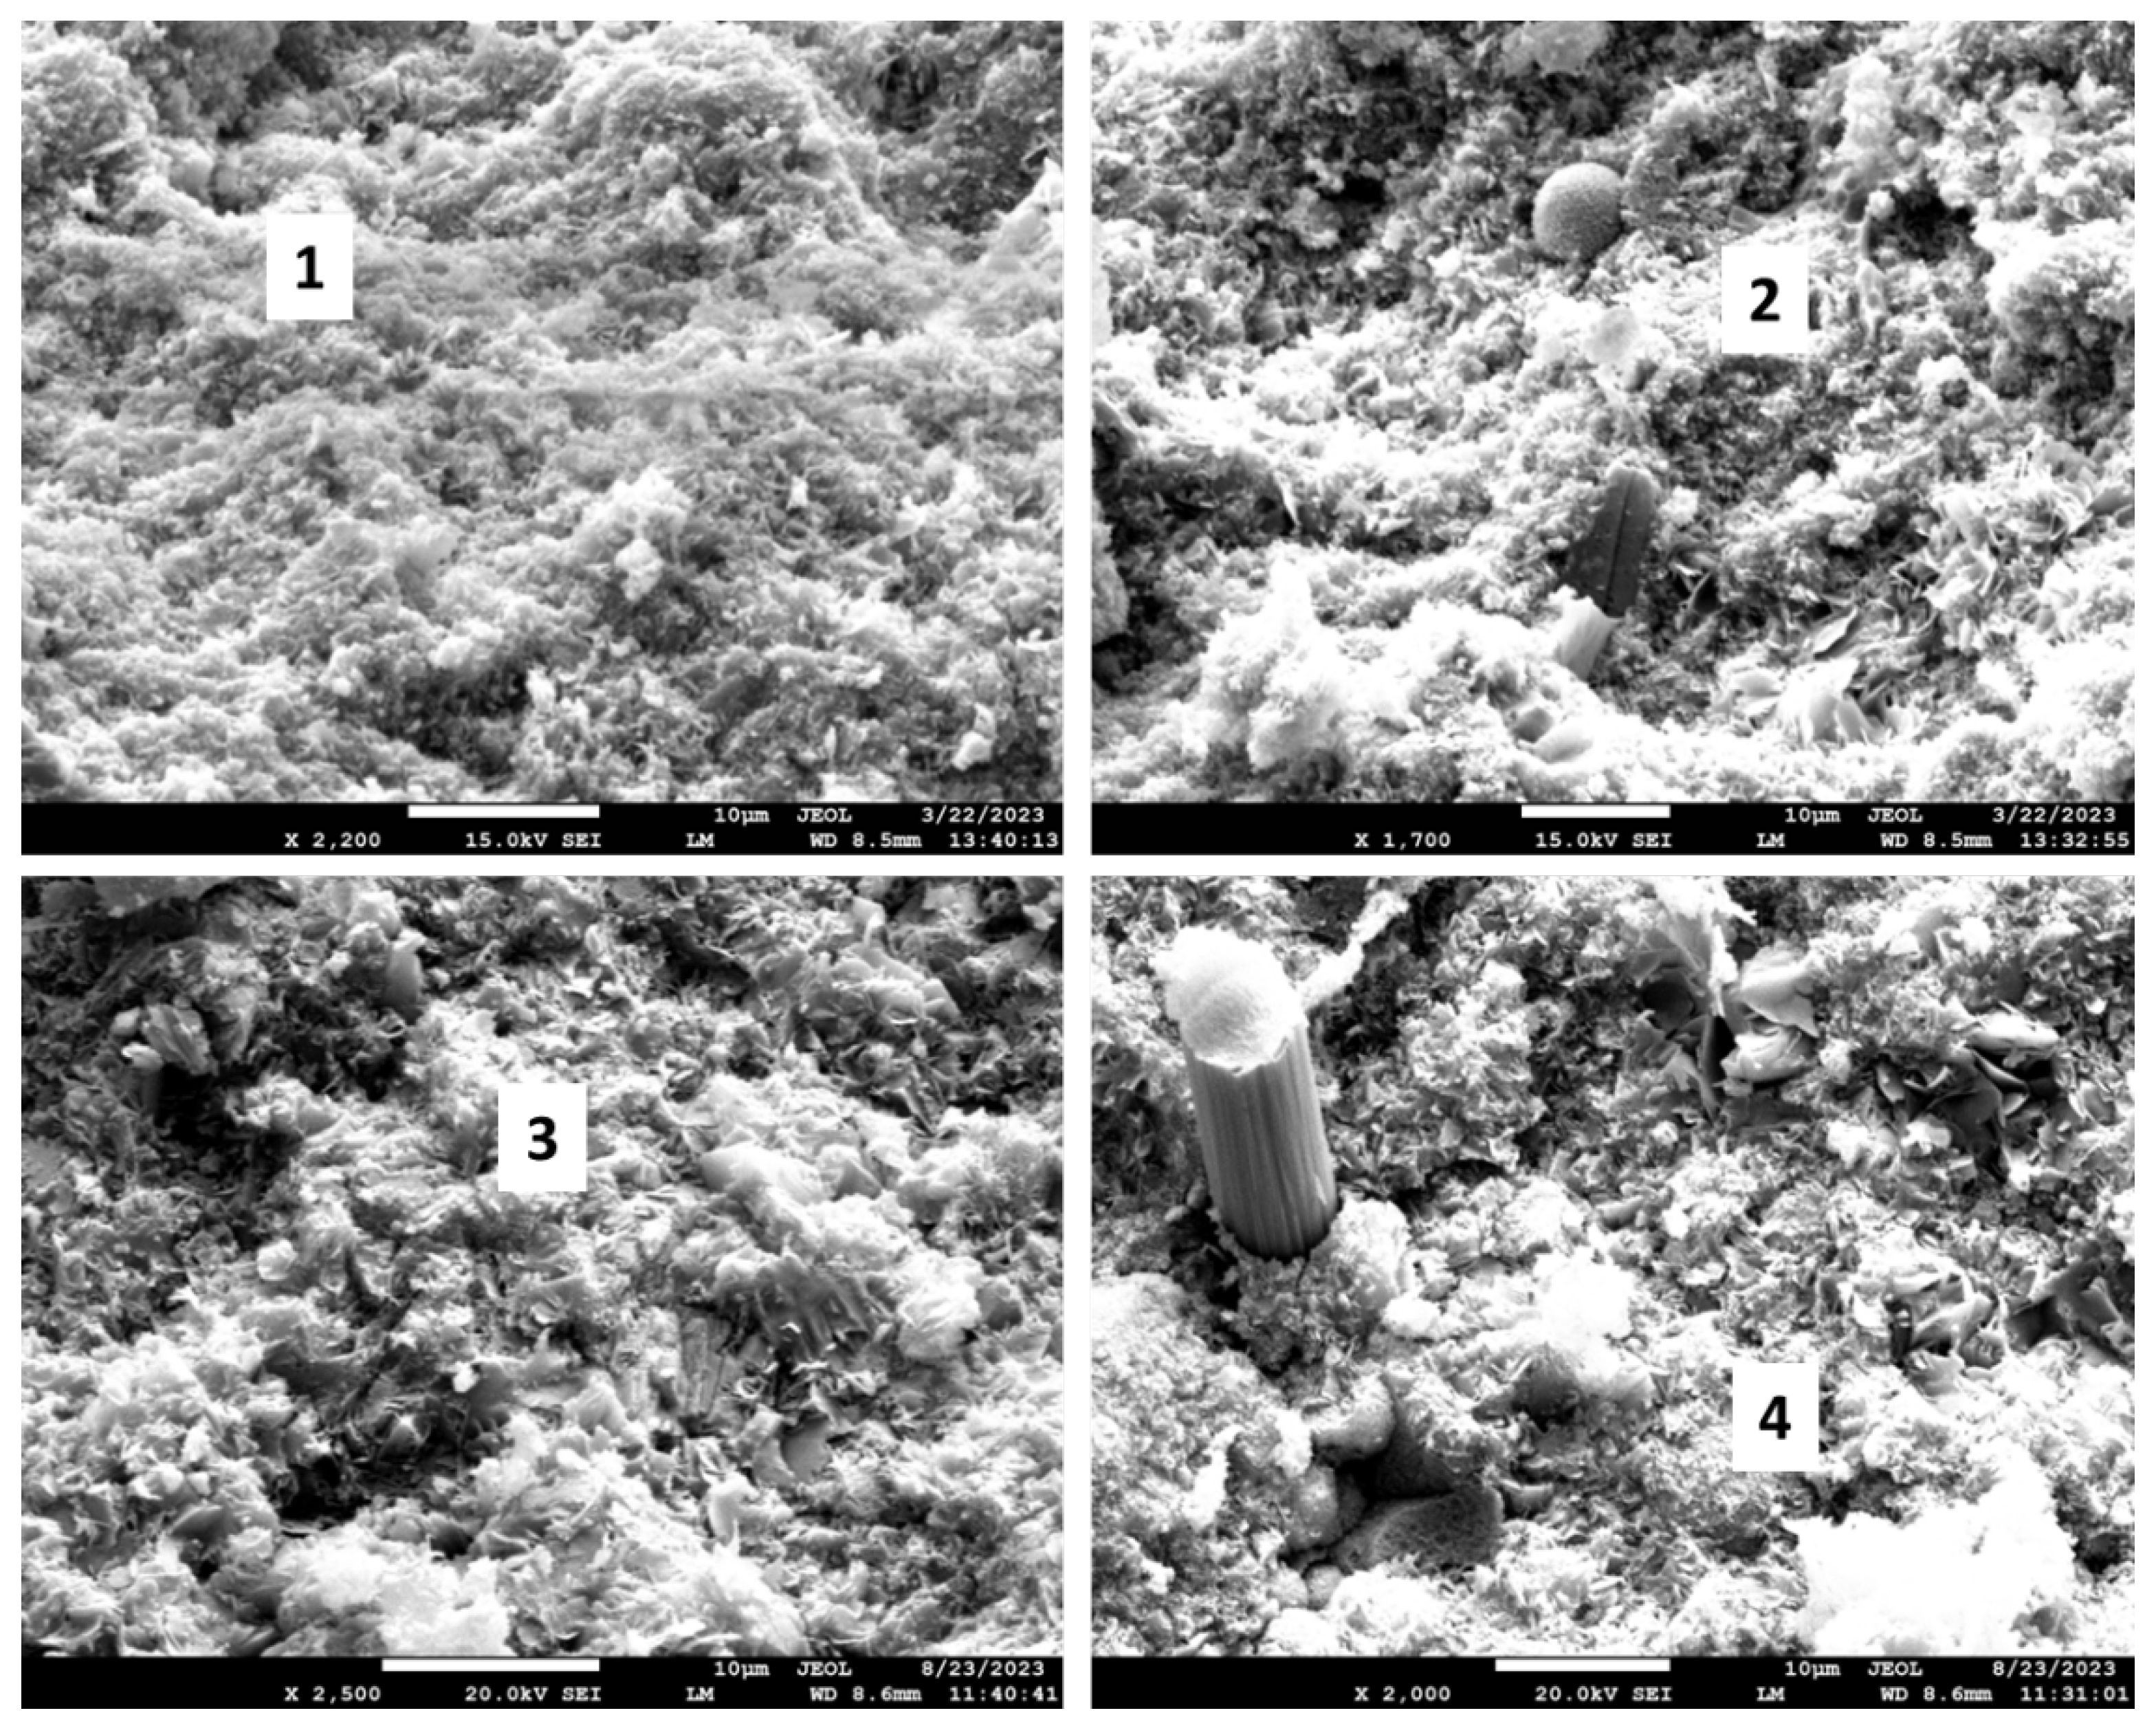
Table 7.
Elemental composition in selected representative locations of CAP#50/FAF samples exposed in Newberry well for 3 or 9 months (the locations of the analyses are shown in Figure 24).
Table 7.
Elemental composition in selected representative locations of CAP#50/FAF samples exposed in Newberry well for 3 or 9 months (the locations of the analyses are shown in Figure 24).
| Element | Location | Weight percent (% error) | Identified phase | Location | Weight percent (% error) | Identified phase |
|---|---|---|---|---|---|---|
| 3-month exposure | ||||||
| C | 1 | 10.91 (0.65) | Multiple, amorphous matrix | 2 | - | Hydroxylapatite, aluminum-silicate matrix |
| O | 56.90 (0.90) | 45.68 (0.80) | ||||
| Na | 0.89 (0.10) | 0.77 (0.16) | ||||
| Al | 14.81 (0.32) | 23.53 (0.24) | ||||
| Si | 9.57 (0.23) | 12.12 (0.21) | ||||
| P | 0.93 (0.09) | 4.13 (0.17) | ||||
| Ca | 4.75 (0.16) | 12.39 (0.24) | ||||
| Fe | 1.24 (0.20) | 1.38 (0.32) | ||||
| 9-month exposure | ||||||
| O | 3 | 38.34 (0.74) | Calcium-aluminum-silicate matrix | 4 | 30.05 (0.59) | Margarite ((Na0.2Ca0.8Al3.9Si2.1)11(OH)) |
| Na | 1.31 (0.22) | 1.19 (0.20) | ||||
| Al | 19.26 (0.32) | 23.89 (0.32) | ||||
| Si | 19.28 (0.35) | 23.46 (0.34) | ||||
| K | 2.64 (0.15) | 2.78 (0.15) | ||||
| Ca | 15.92 (0.30) | 4.15 (0.16) | ||||
In summary, CAP cement formulations underwent only partial carbonation during the well exposure tests. The crystalline composition of these samples persisted through the exposure with the major crystalline phases of dmisteinbergite, paragonite, and hydroxylapatite remaining in the samples after the 9-month exposure. The extent of the carbonation was higher for more Ca-rich CAP#50/FAF formulation than for CAP#71/FAF one with lower calcium content. Persistent crystalline compositions, dense matrix with limited carbonation provided improved mechanical properties and very low water-fillable porosity of these formulations.
3.4.3. TSRC
Like CAP cement, TSRC developed to withstand high thermal shocks typical for HT geothermal wells, was also expected to mineralize CO2 into stable cancrinite phase [47]. This blend is based on CAC#80 with the lowest calcium (24.7 wt.%) and highest aluminum (75.2 wt.%) contents. This Al-rich composition combined with the FAF provides high thermal shock resistance of the blend.
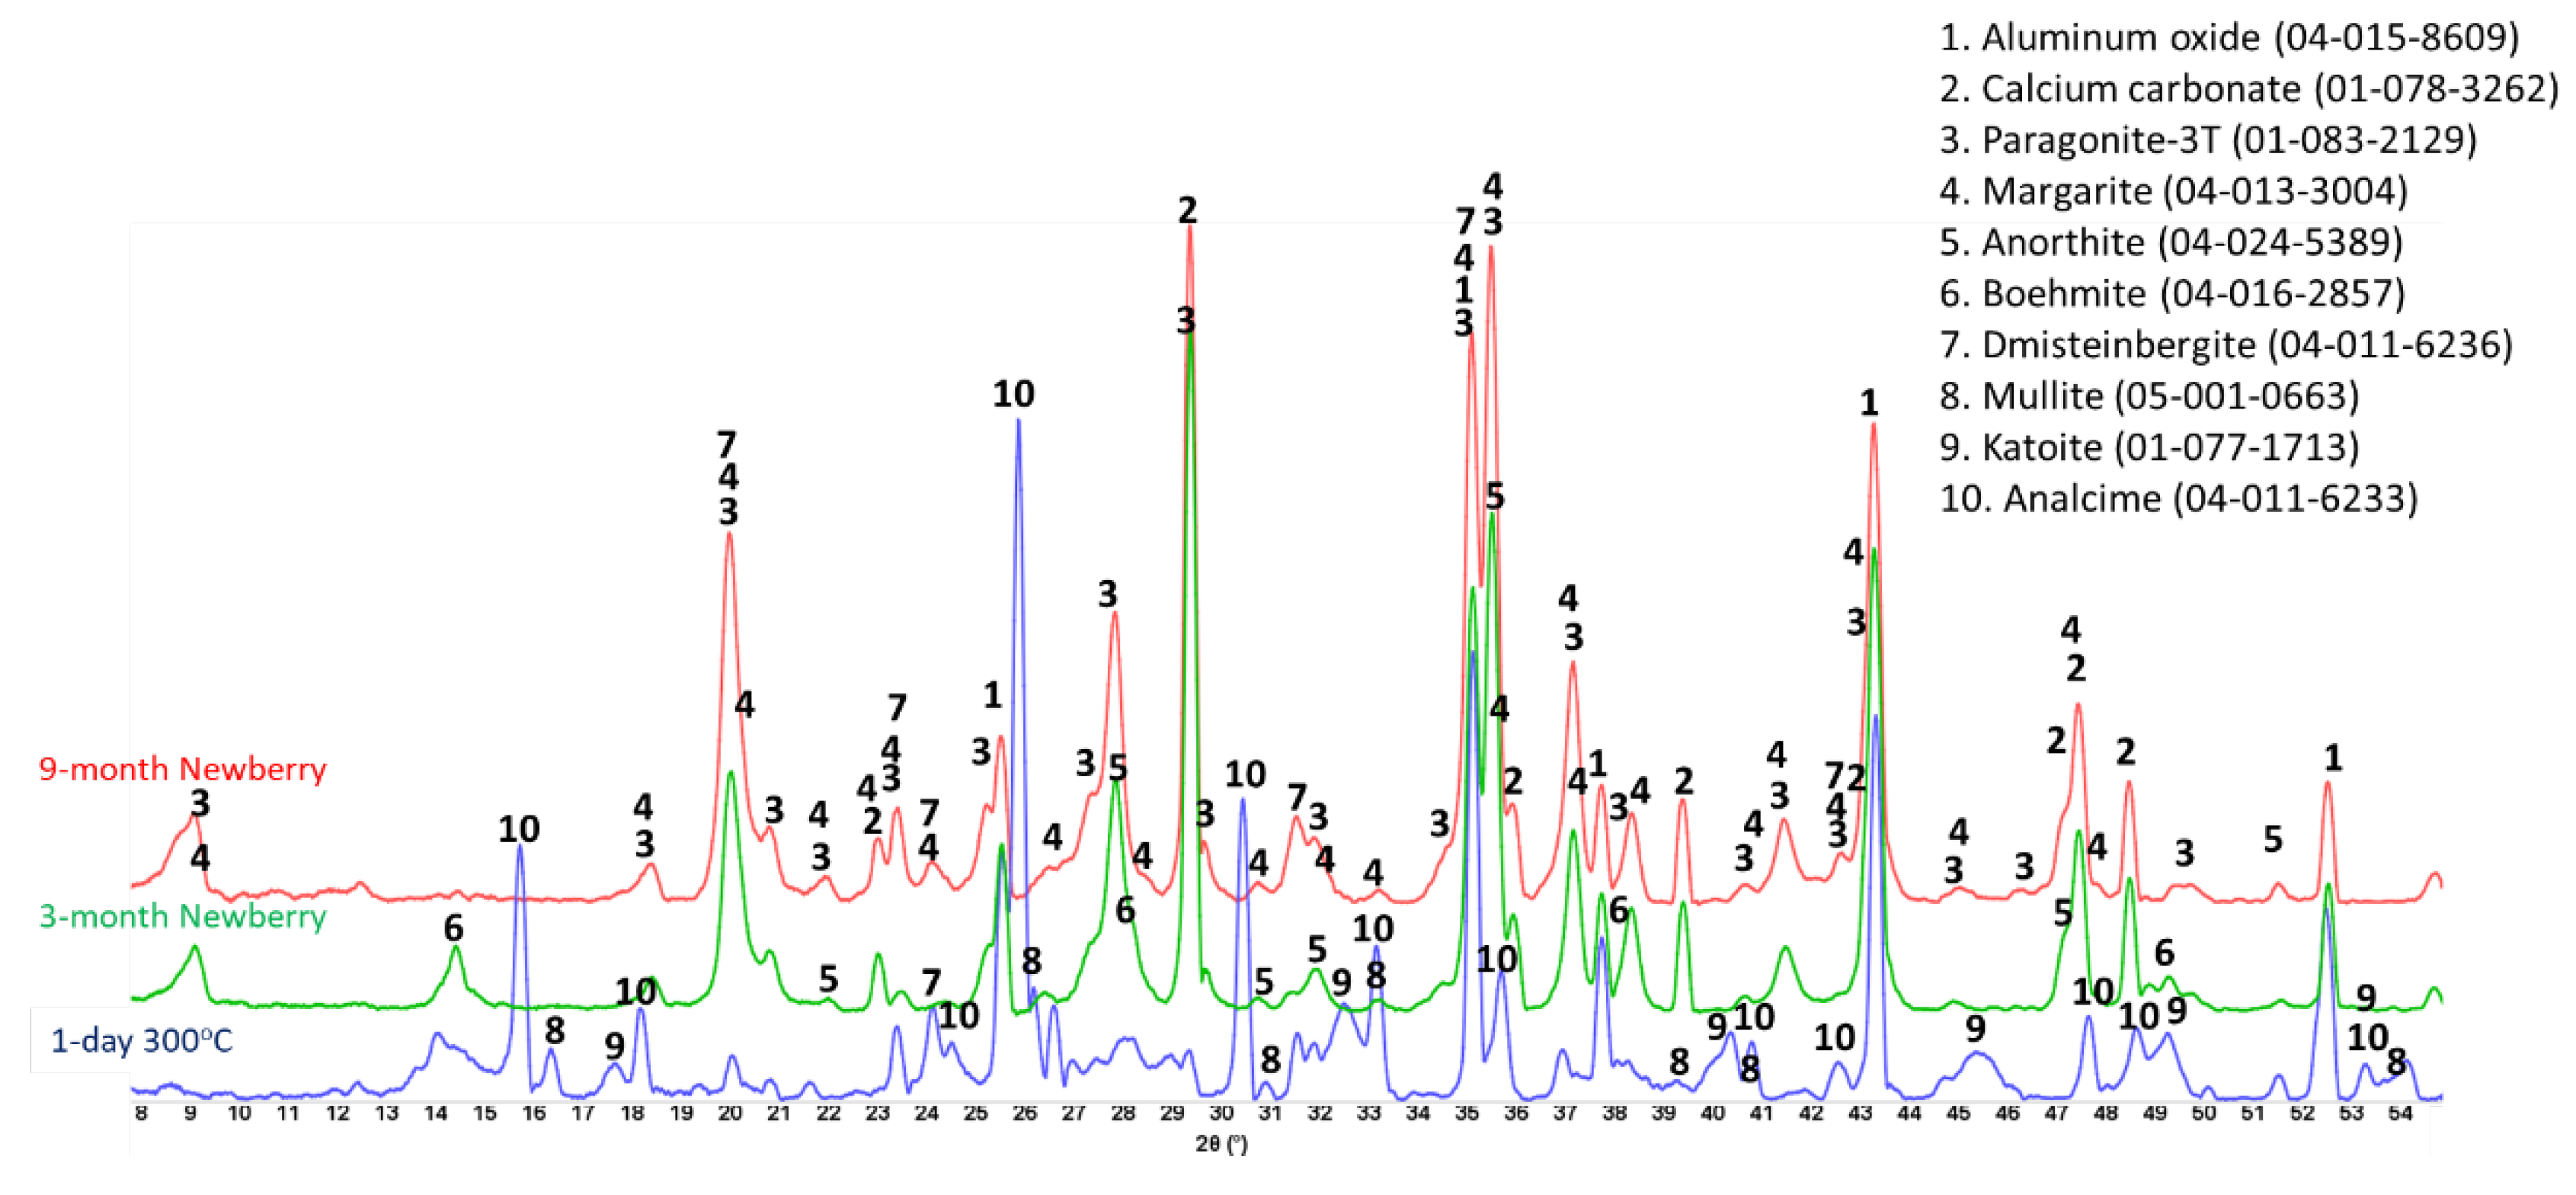
Figure 25 gives XRD patterns of the TSRC reference samples and samples exposed in the well for 3 or 9 months. The reference sample crystalline composition was very similar to that of CAP/FAF formulations except for the phosphorus-containing phases that were absent in TSRC and presence of corundum (aluminum oxide) crystals from CAC#80 in TSRC formulation. The major crystalline phases include dmisteinbergite and its isomorph anorthite, analcime, katoite, boehmite, and non-reacted mullite from FAF. After the 3-month well exposure analcime, katoite, and mullite peaks disappeared, while new peaks of paragonite, margarite, and calcium carbonate showed up in the pattern, while peaks of boehmite persisted. After the 9-month exposure boehmite peaks also vanished from the sample pattern while the peaks of paragonite, margarite, and calcium carbonate persisted. Although the patterns of dmisteinbergite overlap with other phases identified in the exposed samples, its peaks at 2θ of 24.08 and 31.5 were clearly identifiable in the exposed samples. Persistence of crystalline phases implies their stability over the exposure time under the well conditions, which is further supported by the similarity of the patterns of the 3- and 9-month exposed samples.
Figure 25.
XRD patterns of the reference TSRC sample (after 1 day autoclaving at 300 oC) and samples exposed in Newberry well for 3 or 9 months.
Figure 25.
XRD patterns of the reference TSRC sample (after 1 day autoclaving at 300 oC) and samples exposed in Newberry well for 3 or 9 months.
The TGA/DTG analyses confirmed partial carbonation of the sample (Figure 26). In agreement with the XRD data the two main weight loss events were from the dehydroxylation of boehmite (1% weight loss in the 3-month exposed sample and 0.4% weight loss in the 9-month exposed sample) and decarbonation of the samples (8 and 7% respectively). These data confirmed disappearance of boehmite after longer well exposure and persistence carbonation that unlike for CSH-60/40 formulation did not increase after longer exposure. The slight decrease in decarbonation weight loss could be attributed to partial dissolution of the carbonates.
Figure 26.
TGA/DTG curves of the TSRC samples exposed in Newberry well for 3 months (left) or 9 months (right).
Figure 26.
TGA/DTG curves of the TSRC samples exposed in Newberry well for 3 months (left) or 9 months (right).
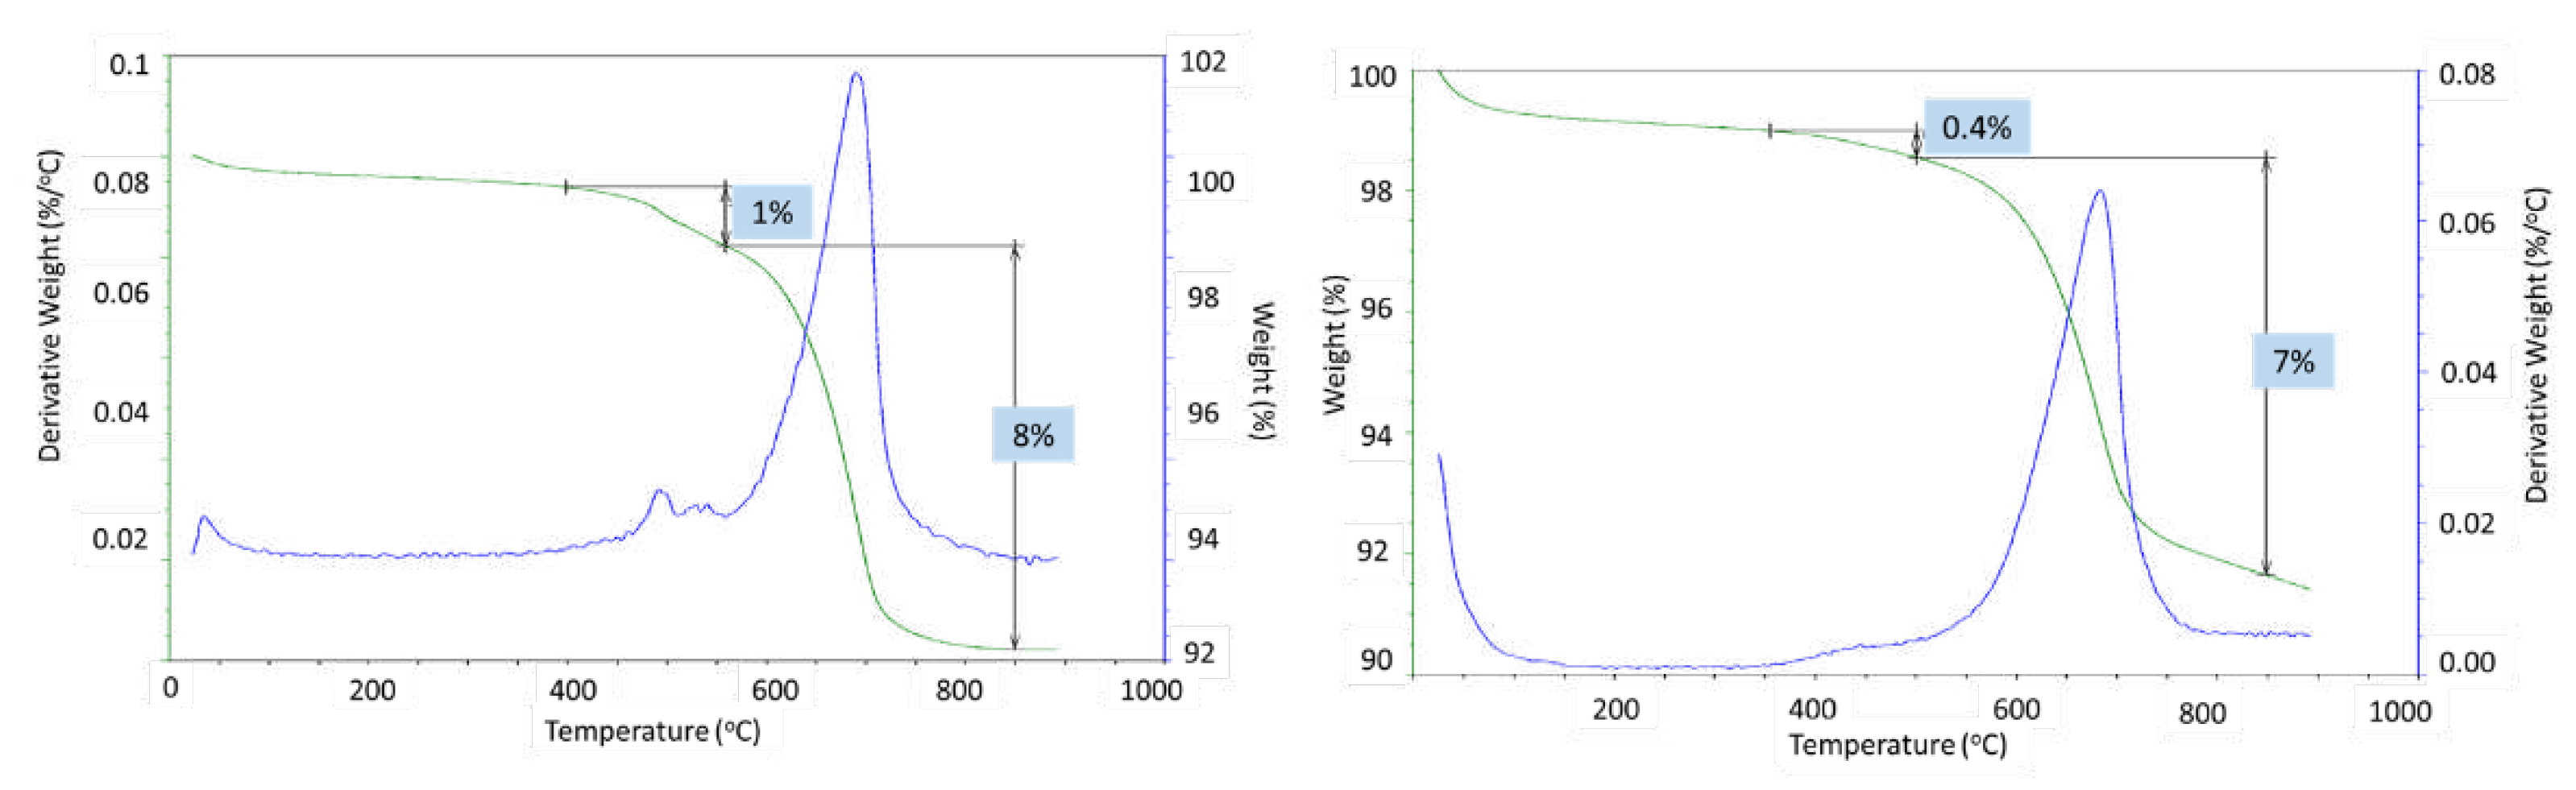
Figure 27 shows microstructures of the exposed samples and Table 8 gives their elemental compositions in selected locations along with the suggested phases. The morphological study of the 3-month exposed samples showed non-reacted FAF particles (top left photomicrograph) remaining in the samples. Pozzolanic reactions of these particles provide self-healing properties of the cement, so their presence in the cement matrix suggests that cement still possessed self-healing properties after the 3-month exposure. In agreement with the XRD data these samples contained boehmite plates (location 1) and margarite crystals embedded into the dense matrix (location 2). The 9-month exposed samples showed feldspar minerals anorthite (location 3) and dmisteinbergite (location 4). The cubic crystal surrounded by dmisteinbergite plates is calcium carbonate. The possible pathway for such close co-existence of these crystalline structures is transformation of dmisteinbergite into calcium carbonate during the longer exposure. As in CAP#50/FAF samples there was no visible damage to carbon fibers from the exposure of TSRC despite their 2-3 orders of magnitude higher pore water pH than that of CAP#50/FAF.
In summary, TSRC formulation, designed to withstand HT thermal shocks of geothermal wells was also stable under the conditions of the Newberry well. Its crystalline composition persisted, and carbonation was limited, which resulted in improved mechanical properties and decreased water-fillable porosity. Moreover, persistence of FAF in the composition of the blend suggests that it kept its self-healing properties for months under very high temperatures.
Figure 27.
Photomicrographs of TSRC samples exposed in Newberry well for 3 months (top) or 9 months (bottom).
Figure 27.
Photomicrographs of TSRC samples exposed in Newberry well for 3 months (top) or 9 months (bottom).

Table 8.
Elemental composition in selected representative locations of TSRC samples exposed in Newberry well for 3 or 9 months (the locations of the analyses are shown in Figure 27).
Table 8.
Elemental composition in selected representative locations of TSRC samples exposed in Newberry well for 3 or 9 months (the locations of the analyses are shown in Figure 27).
| Element | Location | Weight percent (% error) | Identified phase | Location | Weight percent (% error) | Identified phase |
|---|---|---|---|---|---|---|
| 3-month exposure | ||||||
| O | 1 | 47.68 (0.52) | Boehmite (AlOOH) | 2 | 48.08 (0.85) | Margarite (CaAl4Si2O10(OH)2) |
| Al | 47.73 (0.41) | 31.71 (0.28) | ||||
| Si | 4.59 (0.31) | 15.95 (0.24) | ||||
| Ca | - | 4.26 (0.21) | ||||
| 9-month exposure | ||||||
| O | 3 | 28.64 (0.75) | Anorthite, potassium bearing (like (Ca, Na) (Si, Al)4O8) | 4 | 38.99 (0.62) | Dmisteinbergite (CaAl2Si2O8) |
| Na | 1.61 (0.18) | |||||
| Al | 25.62 (0.39) | 19.23 (0.28) | ||||
| Si | 30.11 (0.46) | 14.56 (0.27) | ||||
| K | 6.96 (0.25) | 1.37 (0.13) | ||||
| Ca | 6.81 (0.26) | 23.16 (0.33) | ||||
| Fe | 1.86 (0.39) | 1.08 (0.26) | ||||
3.4.4.#80/. Silica
This simple two-component blend showed significant improvement of its mechanical properties (especially toughness) and decreased water-fillable porosity during the exposure tests. Refractive CAC#80 is well-suited for the HT geothermal conditions [17]. The XRD patterns of the reference sample (1-day 300 oC) and samples exposed to 3 and 9 months well conditions are shown in Figure 28.
Figure 28.
XRD patterns of the reference #80/Silica sample (after 1 day autoclaving at 300 oC) and samples exposed in Newberry well for 3 or 9 months.
Figure 28.
XRD patterns of the reference #80/Silica sample (after 1 day autoclaving at 300 oC) and samples exposed in Newberry well for 3 or 9 months.
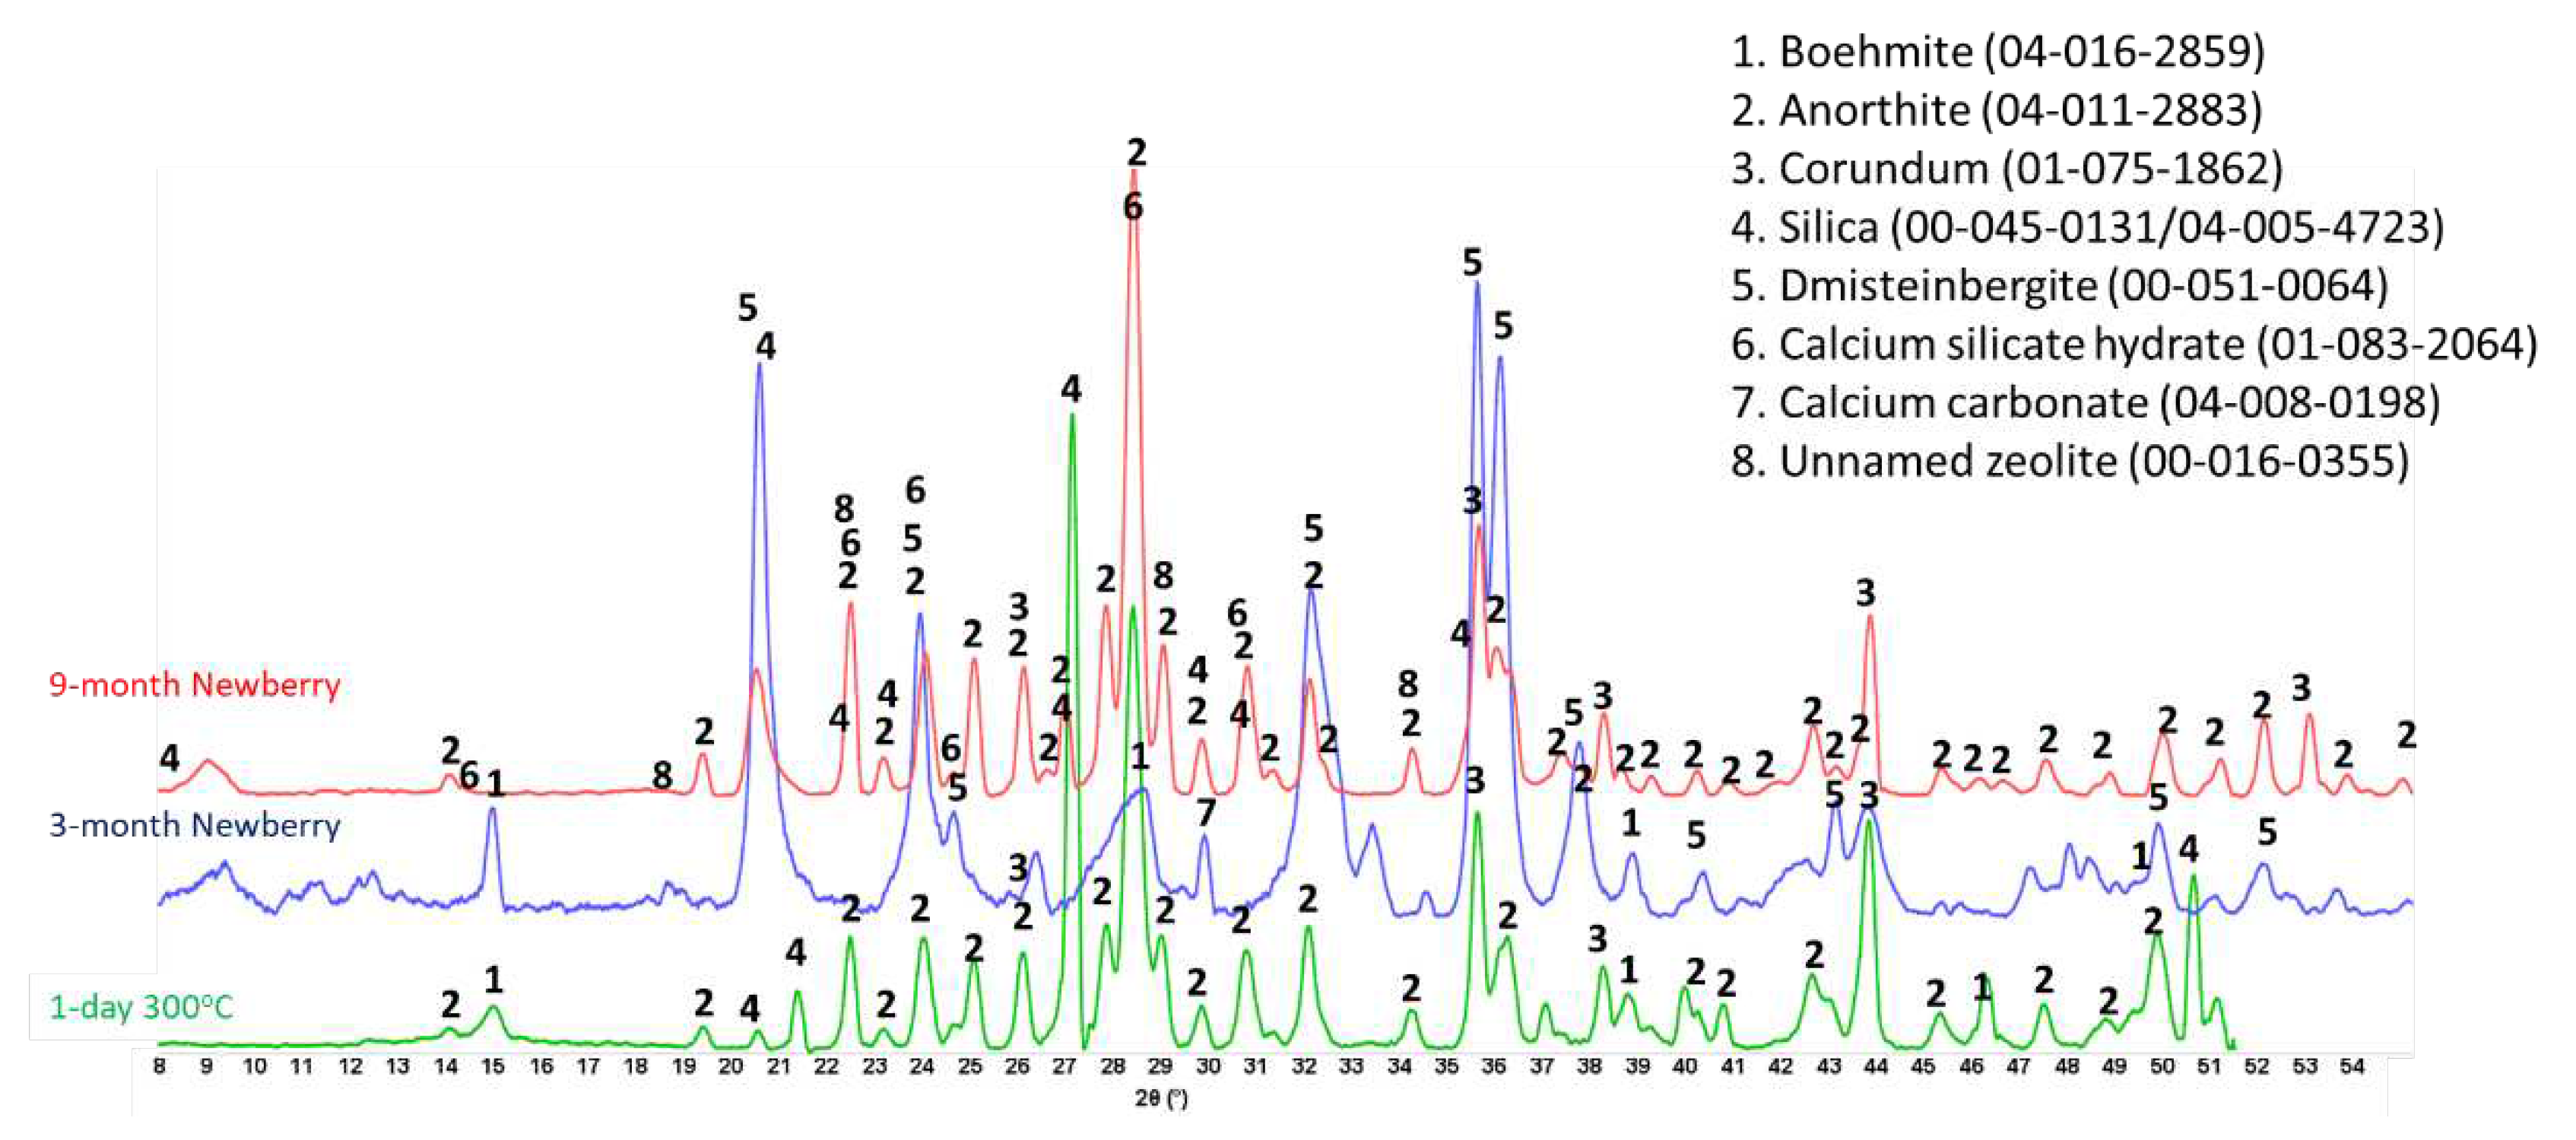
The pattern of the reference sample included CAC#80 hydration product boehmite, CAC#80 and silica reaction product, anorthite, and non-reacted phases corundum from CAC#80 and silica. Exposure of the sample to the Newberry well conditions resulted in formation of anorthite isomorph dmisteinbergite after the 3-month exposure and calcium silicate hydrate (Ca6.43(Si2O7)2(H2O)2), as well as unnamed zeolite (K2.84Ca1.43Al5.7Si10.3O32*10.6H2O) after the 9-month exposure. Since the intensity of anorthite peaks was similar after 3 and 9 months, while that of dmisteinbergite decreased after the 9-month exposure, it is reasonable to think that dmisteinbergite isomorph underwent partial conversion into albite, while anorthite persisted. In the unnamed zeolite cation of calcium is replaced by potassium. The original formulations did not contain any alkaline activators, that means that potassium ions came from the well fluids. A small peak of calcium carbonate appeared in the field exposed samples. The TGA/DTG tests showed that decarbonation accounted for less than 2% of mass loss after 3 months of the well exposure and less than 1.5% mass loss after 9 months of the exposure (data not shown).
The morphological study of the samples confirmed XRD results (Figure 29, Table 9). Dmisteinbergite (location 1) and boehmite (location 2) were detected in the 3-month exposed sample. Partial degradation of the boehmite crystals with formation of a fluffy amorphous phase around them is visible in the photomicrograph (location 2). The 9-month exposed samples showed sites with typical anorthite morphology and elemental composition (location 3) and the elemental composition of the unnamed zeolite around the crystals with dmisteinbergite morphology (location 4). Boehmite crystals were not detected in the 9-month exposed samples in agreement with the XRD results. The morphological features of these samples were small. As for other formulations intact carbon fibers were visible in the 9-month exposed sample.
Figure 29.
Photomicrographs of #80/Silica samples exposed in Newberry well for 3 months (top) or 9 months (bottom).
Figure 29.
Photomicrographs of #80/Silica samples exposed in Newberry well for 3 months (top) or 9 months (bottom).

Table 9.
Elemental composition in selected representative locations of #80/Silica samples exposed in Newberry well for 3 or 9 months (the locations of the analyses are shown in Figure 29).
Table 9.
Elemental composition in selected representative locations of #80/Silica samples exposed in Newberry well for 3 or 9 months (the locations of the analyses are shown in Figure 29).
| Element | Location | Weight percent (% error) | Identified phase | Location | Weight percent (% error) | Identified phase |
|---|---|---|---|---|---|---|
| 3-month exposure | ||||||
| O | 1 | 46.84 (0.9) | Dmisteinbergite (CaAl2Si2O8) | 2 | 43.98 (0.05) | Boehmite (AlOOH) |
| Al | 22.02 (0.52) | 40.21 (0.35) | ||||
| Si | 20.03 (0.59) | 2.63 (0.25) | ||||
| Ca | 11.11 (0.59) | 10.34 (0.29) | ||||
| 9-month exposure | ||||||
| O | 3 | 29.48 (1.02) | Anorthite, potassium bearing (like (Ca, Na) (Si, Al)4O8) | 4 | 31.11 (1.17) | Unnamed zeolite (K2.84Ca1.43Al5.7Si10.3O32 10.6H2O) |
| Na | 1.17 (0.29) | 1.33 (0.33) | ||||
| Al | 23.82 (0.49) | 21.30 (0.54) | ||||
| Si | 25.54 (0.56) | 23.68 (0.62) | ||||
| K | 4.30 (0.31) | 10.48 (0.45) | ||||
| Ca | 15.68 (0.46) | 12.10 (0.52) | ||||
In summary, #80/Silica formulation showed good resistance to the conditions of the HT geothermal well. The feldspar minerals formed during the blend hydration partially converted into the alkali plagioclase series member albite and an unnamed zeolite with the alkaline ions coming from the well environment. Carbonation of the blend was minimal.
4. Discussion
Exposure of various cementitious blends in a deep HT geothermal well for up to 9 months allowed evaluation of their performance under the field conditions that would be very difficult to reproduce in laboratory tests. Although the samples were originally cured hydrothermally in laboratory environments (1-day 300 oC) the general tendencies in the behavior of different blends can be deduced from the results of the exposure tests. Among the tested formulations only CSH-60/40 was calcium-silicate blend of OPC and silica. The rest included CAC, and NAS-M1 was calcium free. The well environment was rich in CO2, that at well temperatures and pressure (300-350 oC and 26 MPa respectively) was in its supercritical state. It’s likely that other geological fluids/gases were also present in the well.
Even though all tested blends underwent phase transitions under the well conditions over the long exposure times, all of them except the CSH-60/40 maintained, and often improved, their mechanical properties and decreased water-fillable porosity after the 9-month exposure. Although persisting, mechanical properties of NAS-M1 sample remained lower than for other Al-rich formulations, while the porosity was higher. Optimization of this formulation will require further efforts.
The dramatic loss of CHS-60/40 mechanical properties (86% strength loss) after the 9-month exposure coincided with the blend severe carbonation (83% of the original calcium was carbonated based on the results of TGFA analyses). If the initial blend carbonation with precipitation of calcium carbonate in the pores after the 3-month exposure resulted in improved strength (13% increase) and decreased porosity (24% decrease), further carbonation compromised samples’ performance through formation of soluble calcium bicarbonate and amorphous silica gel according to the following reactions:
CO2 + H2O =H+ + HCO3-
C-S-H phase + H+ + HCO3- = CaCO3 + amorphous gel
CaCO3 + CO2 + H2O = Ca(HCO3)2
OPC/silica decomposition due to carbonation in less than 9 months strikingly disagrees with multiple other works cited in the introduction on Portland cement carbonation rates. This is likely due to the severity of the well environment, where HT supercritical CO2 reactions with the cement were dramatically accelerated. It should also be mentioned that samples were relatively small in volume (12.6 cm3) facilitating their carbonation. Nevertheless, long-term stability of OPC-based cements under such conditions could hardly be expected even for larger cement volumes.
Formulations based on CAC all experienced partial carbonation through calcium reaction with formation of calcium carbonate. These formulations did not form any calcium-silicate hydrates after the initial 1-day 300 oC curing. They all formed plagioclase minerals anorthite and dmisteinbergite. HT carbonation of anorthite/dmisteinbergite can be summarized in the following reaction [49,50]:
CaAl2Si2O8 + CO2 + 2H2O = CaCO3 + Al2Si2O5(OH)
The reaction proceeds in solution after the dissolution of carbon dioxide and anorthite [51]:
CO2 + H2O =H+ + HCO3-
CaAl2Si2O8 + 16H+ = Caaq2+ + 2Alaq3+ + 2SiO2aq + 8H2O
Boehmite precipitates first after the anorthite/dmisteinbergite dissolution due to its very low solubility:
Alaq3+ + 2H2O = AlO(OH)s + 3H+
The precipitated boehmite may be very fine-grained and porous, it may also contain silica in its composition as contamination from anorthite [51,52]. Such modified boehmite covers plagioclase grains, slowing its further dissolution. The next phase that precipitates out of solution is calcium carbonate that has higher solubility than boehmite. Finally, kaolinite precipitates in the reaction between aluminum and silica.
However, in the case of the well exposed samples, formulations included sodium-based activators. This allowed formation of mica-type minerals (paragonite, margarite, muscovite) rather than kaolinite. Moreover, alkaline ions were likely found in the well environments, since even the formulation of #80/Silica that did not have any activator had potassium in its composition (in the unnamed zeolite).
Anorthite/dmisteinbergite phases persisted in all the tested CAC-based formulations possibly with the partial carbonation causing fine grained modified boehmite precipitation around these crystals. This nanoscale fine-grained boehmite likely was not detected by the XRD measurements. Such amorphous phase was visible in #80/Silica sample around partially decomposed boehmite crystals after the 3-month exposure. The originally formed boehmite, on the other hand, disappeared in all the formulations except CAP#71/FAF. It isn’t clear why one of the CAC-based formulations preserved crystalline boehmite after the 9-month exposure but not the others.
Based on the TGA analysis the amount of calcium carbonate formed in each blend depended on its calcium content. For the CAC-based formulations it decreased in the order: CAP#50/FAF > CAP#71/FAF=TSRC > #80/Silica. The calcium carbonate content of these blends slightly decreased over time (9-month vs. 3-months data). This was likely due to the dissolution of some of the calcium carbonate through continuous carbonation and formation of calcium bicarbonate. The decrease in calcium carbonate was 18% for CAP#50/FAF, 15% for #80/Silica, and 12% for TSRC. CAP#71/FAF decarbonation weight loss did not change. Most importantly, unlike in the case of CSH-60/40, CAC-containing formulations still preserved stable crystalline phases, such as mica-type and plagioclase minerals after the partial carbonation of the matrix. These phases included minerals from the mica family and the end member of the plagioclase series, albite. Moreover, carbonation of calcium-plagioclase minerals (anorthite and dmisteinbergite) was only partial over the experimental period. These allowed preservation of the mechanical and physical properties of the CAC-based formulations. Carbon fibers tested as part of cement compositions in the well for 9 months preserved their physical integrity contributing to the samples’ strength and toughness.
Performance of the function cyclic pressure tests allowed comparison of cement formulations in laboratory experiments. Although intended for high temperatures, CAC-based formulations tested in function tests after the 110 oC curing were observed to be comparable to or outperforming OPC/Silica blend cured under the same condition. The failure mechanism of the cement sheath and rock fracture depended on the brittleness of the cement formulation with more brittle formulations failing at once with a single crack, and more ductile failing over a range of pressure developing multiple fractures.
Although the function tests do not directly apply to the field conditions, the corresponding modeling results confirm that the MCC model and the measured parameters can likely be extended to the field conditions. Staged finite element models can be used to estimate the performance of such formulations under realistic conditions [53]. The benefit of the MCC parameter is that it can predict both dilatative and compressive volumetric response of the cement as it fails. Dilatative failure as shown in the function tests likely leads to permeability generation. However, compressive volumetric response causes a reduction in the volume of cement and no crack development. Therefore, it is important to distinguish the post-failure response of the cement sheath to assess the consequences in terms of well leakage. The MCC parameters reported in this work provide the necessary values to conduct such an assessment for a variety of cement formulations.
The modelling results of the function tests indicate an overall increase in brittleness of the Newberry exposed cement formulations. The long-term exposure to critical temperatures increase the strength and stiffness (Young’s modulus). The increase in stiffness leads to higher stress concentrations. This causes relatively earlier damage initiation and more crack volume development, under the conditions of the function tests. Therefore, it is plausible that the current formulations can gradually become more brittle and prone to cracking under in-situ conditions in high temperature geothermal wells.
It should be noted that all materials analyses were done at room temperature after the exposure to the HTHP conditions. In the future work in-situ materials characterization and measurements of their mechanical properties under well conditions would be beneficial.
5. Conclusions
Performance of various cementitious composites under the conditions relevant for geothermal wells was evaluated in function cyclic pressure tests, HT geothermal well exposure tests and compared against that of OPC/silica blend. The tested formulations included calcium-aluminate cement (different grades) blends with silica or fly ash F. Some of the blends included alkali (SMS in TSRC) or chemical activator (SHMP in CAP cement blends). Additionally, blends reinforcement with CMF was tested in 9-month field exposure tests.
The results of all the tests and cement modeling at temperatures ranging from 120oC to above 300oC showed that CAC-based blends outperform the reference OPC/silica one. Interestingly, the findings of the short-term (3-month) and long-term (9-month) exposures to the Newberry well conditions differed in an important way. The short-term exposure increased the shear and tensile strength of most of the tested formulations, including control OPC/silica one. Calcium phosphate cement formulations, however, experienced slight reduction in shear and no change in tensile strength. This loss was recovered after the 9-month exposure. On the other hand, the 9-month exposure led to a very substantial loss of strength, stiffness, and toughness for the OPC/silica blend. This happened because of the fast degradation of calcium-silicate-hydrates through carbonation resulting in compromised mechanical properties. Extent of partial carbonation of CAC-based blends depended on their calcium content. The carbonation in these blends took place through removal of calcium from plagioclase end-series member anorthite (dmisteinbergite) and formation of the end family member albite and mica family minerals margarite, muscovite, and paragonite. These mineral phases allowed persistence or improvement of mechanical properties of the samples during their well exposure. Carbon microfibers persisted in cementitious composites through the 9-month exposure without any visible degradation, improving their strength and toughness.
The Modified Cam-Clay plasticity parameters of several HT cement formulations were extracted from triaxial and Brazilian tests and verified against the experimental results of function cyclic tests. These parameters can be used in well integrity models to predict field-scale behavior of the cement sheath under geothermal well conditions. Overall, all the considered formulations performed better than OPC, accumulating less plastic strain and initiating cracking at a higher casing pressure. Exposure to the Newberry well conditions improved the strength of the formulations. However, it also increased stiffness for all formulations already after the 3-months exposure, which may lead to a more brittle behavior and therefore higher levels of crack volume after the failure.
Author Contributions
“Conceptualization, T. Pyatina, T. Sugama, A. Moghadam, M. Naumann, R. Skorpa; methodology, T. Pyatina, T. Sugama, A. Moghadam, M. Naumann, R. Skorpa, V. Soustelle; modeling, A. Moghadam; validation, all authors; formal analysis, all authors; resources, all authors; writing—original draft preparation, all authors; writing—review and editing, all authors; funding acquisition, T. Pyatina, R. Skorpa, A. Moghadam, M. Naumann. All authors have read and agreed to the published version of the manuscript.”.
Funding
“This research was funded by the Geothermica project “Sustainable Geothermal Well. Cements for Challenging Thermo-Mechanical Conditions (TEST-CEM)”, number 2003184001. The project has been subsidized through the Cofund GEOTHERMICA by DoE (the USA), RVO NL (The Netherlands), and the Research Council of Norway.”
Conflicts of Interest
“The authors declare no conflict of interest.” “The funders had no role in the design of the study; in the collection, analyses, or interpretation of data; in the writing of the manuscript; or in the decision to publish the results”.
Abbreviations.
BNL – Brookhaven National Laboratory, CAC—calcium aluminate cement, CAP cement – calcium phosphate cement, CMF – carbon microfibers, CSH – calcium silicate-hydrate or OPC-based cement, EGS – enhanced Geothermal Systems, FAF—fly ash, type F, HT – high temperature, HP – high pressure, MCC – modified Cam-Clay, NAS – sodium aluminum-silicate cement, OPC – ordinary Portland cement, SHMP – sodium hexametaphosphate, SMS—sodium metasilicate, TSRC—thermal shock-resistant cement, #50 – CAC#50, #71 – CAC#71, #80 – CAC#80
Symbols
| Young’s modulus | |
| Bulk modulus | |
| Slope of critical state line (MCC model) | |
| Mean effective stress | |
| Initial size of compressive yield limit (MCC model) | |
| Pore pressure | |
| Tensile strength | |
| Shear (deviatoric) stress | |
| Slope of swelling line (MCC model) | |
| Slope of normal consolidation line (MCC model) | |
| Poisson’s ratio | |
| Axial stress (at failure) | |
| Confining pressure | |
| Residual (post-failure) strength | |
| Porosity | |
| ν | Specific volume |
References
- Bonneville, A.; Cladouhos, T.; Petty, S.; Schults, A.; Sorlie, C. Toward Super Hot EGS: The Newberry Deep Drilling Project. In Proceedings of the GRC Transactions; 2018; Volume 42. [Google Scholar]
- Garrison, G.; Uddenberg, M.; Petty, S.; Watz, J.; Hill, L.B. Resource Potential of SuperHot Rock. In Proceedings of the GRC Transactions; 2020; Volume 44. [Google Scholar]
- Reinsch, T.; Dobson, P.; Asanuma, H.; Huenges, E.; Poletto, F.; Sanjuan, B. Utilizing supercritical geothermal systems: a review of past ventures and ongoing research activities. Geotherm. Energy 2017, 5, 16. [Google Scholar] [CrossRef]
- Nelson, E.B.; Barlet-Gouedard, V. Thermal Cements. In Well Cementing; Nelson, E.B., Guillot, D., Eds.; Schlumberger: Sugar Land, 2006; pp. 319–341. [Google Scholar]
- Biczok, I. Concrete Corrosion-Concrete Protection; Chemical Publishing Co., Inc.: New York City, New York, USA, 1967. [Google Scholar]
- Van Der Kuip, M.; Benedictus, T.; Wildgust, N.; Aiken, T. High-level integrity assessment of abandoned wells. Energy Procedia 2011, 4, 5320–5326. [Google Scholar] [CrossRef]
- Sminchak, J.; Moody, M.; Theodos, A.; Larsen, G.; Gupta, N. Investigation of Wellbore Integrity Factors in Historical Oil and gas Wells for CO2 Geosequestration in the Midwestern U.S. Energy Procedia 2014, 63, 5787–5797. [Google Scholar] [CrossRef]
- Sminchak, J.; Zeller, E.; Bhattacharya, I. Analysis of unusual scale build-up in a CO2injection well for a pilot-scale CO2storage demonstration project. Greenh. Gases: Sci. Technol. 2014, 4, 357–366. [Google Scholar] [CrossRef]
- Crow, W.; Brian Williams, D.; William Carey, J.; Celia, M.; Gasda, S. Wellbore Integrity Analysis of a Natural CO2 Producer. In Proceedings of the Energy Procedia; February 2009; Vol. 1, pp. 3561–3569. [CrossRef]
- Garnier, A.; Saint-Marc, J.; Laudet, J.-B.; Rodot, F.; Urbanczyk, C.; Bois, A.-P. Carbon Capture and Storage. The Lacq Pilot Project and Injection Period 2006-2013. Well Integrity. 2014. [Google Scholar]
- Gallus, J.; Watters, L.; Pyle, D. Performance of Oilwell Cementing Compositions in Geothermal Wells. Soc. Pet. Eng. J. 1979, 19, 233–241. [Google Scholar] [CrossRef]
- Pyatina, T.; Sugama, T.; Jauffret, G.; Glasser, F.P.; Kondekar, V.G.; Jaiswal, O.R.; Gupta, L.M.; Gandhi, P.R.; Dai, Y.; Tan, Y.; et al. Acid resistance of calcium aluminate cement–fly ash F blends. Adv. Cem. Res. 2016, 28, 433–457. [Google Scholar] [CrossRef]
- Sugama, T.; Carciello, N.R.; Nayberg, T.M.; Brothers, L. Mullite Microspher-Filled Lightweight Calcium Phosphate Cement Slurries for Geothermal Wells: Setting and Properties. Cem Concr Res 1995, 25, 1305–1310. [Google Scholar] [CrossRef]
- Sugama, T.; Pyatina, T. Self-healing, re-adhering, and carbon-steel corrosion mitigating properties of fly ash-containing calcium aluminum phosphate cement composite at 300 °C hydrothermal temperature. Cem. Concr. Compos. 2019, 99, 1–16. [Google Scholar] [CrossRef]
- Sugama, T.; Pyatina, T. Self-Healing, Re-Adhering, and Corrosion-Mitigating Inorganic Cement Composites for Geothermal Wells at 270-300degC. BNL-2019-IR 2019.
- Pyatina, T.; Sugama, T. Cements with supplementary cementitious materials for high-temperature geothermal wells. Geothermics 2020, 86, 101840. [Google Scholar] [CrossRef]
- Sugama, T.; Pyatina, T. Alkali-Activated Cement Composites for High Temperature Geothermal Wells; Scientific Research Books, 2018. ISBN 978-1-61896-414-4.
- Sugama, T.; Pyatina, T. Cement Formulations for Super-Critical Geothermal Wells. In Proceedings of the 47th Workshop on Geothermal Reservoir Engineering; Stanford, California, USA, February 7 2022. [Google Scholar]
- Pyatina, T.; Sugama, T. Cements for Supercritical Geothermal Wells at 400oC. In Proceedings of the Geothermal Rising Proceedings; Reno, NV; 2023; pp. 447–466. [Google Scholar]
- Lowry, B.; Louden, A.; Jerman, R.; Pyatina, T. Corrosion-Resistant Plug Materials for Geothermal Well Fluid Control. Materials 2022, 15, 6703. [Google Scholar] [CrossRef]
- Allouche, M.; Guillot, D.; Hayman, A.J.; Butsch, R.J.; Morris, C.W. Cement Job Evaluation. In Well Cementing; Nelson, E.B., Guillot, D., Eds.; Sugar Land, TX, 2006; pp. 549–612. [Google Scholar]
- Skorpa, R.; Øia, T.; Taghipour, A.; Vrålstad, T. Laboratory Set-up for Determination of Cement Sheath Integrity during Pressure Cycling. In Proceedings of the 37th International Conference on Ocean, Offshore and Arctic Engineering, paper OMAE2018-78696; Madrid, June 2018. [CrossRef]
- Skorpa, R.; Werner, B.; Vralstad, T. Effect of Rock on Cement Sheath Integrity. Shale vs. Sandstone. In Proceedings of the 38th International Conference of Ocean, Offshore and Arctic Engineering, Paper OMAE2019-96738; Glasgow, Scotland, June 2019. [CrossRef]
- Skorpa, R.; Werner, B.; Vralstad, T. Effect of Mud on Cement Sheath Integrity. In Proceedings of the SPE Norway One Day Seminar, SPE-195625-MS, Bergen, Norway; 2019. [CrossRef]
- Vrålstad, T.; Skorpa, R.; Opedal, N.; Todorovic, J.; Agofack, N.; Hoang, N.-H. Cement Sheath Integrity During High Temperature Geothermal Well Operation. In Proceedings of the ASME 2021 40th International Conference on Ocean, Offshore and Arctic Engineering, Paper OMAE2021-65116; Virtual, June 2021. [CrossRef]
- Zhang, W.; Eckert, A. Micro-annulus generation under downhole conditions: Insights from three-dimensional staged finite element analysis of cement hardening and wellbore operations. J. Rock Mech. Geotech. Eng. 2020, 12, 1185–1200. [Google Scholar] [CrossRef]
- Gray, K.E.; Podnos, E.; Becker, E. Finite-Element Studies of Near-Wellbore Region During Cementing Operations: Part I. SPE Drill. Complet. 2009, 24, 127–136. [Google Scholar] [CrossRef]
- Moghadam, A.; Corina, A.N. Modelling Stress Evolution in Cement Plugs during Hydration. In Proceedings of the ARMA US Rock Mechanics/Geomechanics Symposium, ARMA-2022-0966; June 26 2022. [CrossRef]
- Thiercelin, M.; Baumgarte, C.; Guillot, D. A Soil Mechanics Approach To Predict Cement Sheath Behavior. In Proceedings of the SPE/ISRM Rock Mechanics in Petroleum Engineering; Trondheim, Norway, 1998. [CrossRef]
- Bois, A.-P.; Garnier, A.; Galdiolo, G.; Laudet, J.-B. Use of a Mechanistic Model To Forecast Cement-Sheath Integrity for CO2 Storage. In Proceedings of the SPE International Conference on CO2 Capture, Storage, and Utilization, New Orleans, LA, USA, 10–12 November 2010. [Google Scholar] [CrossRef]
- Sugama, T.; Pyatina, T. Hydrophobic, Thermal Shock-and-Corrosion-Resistant XSBR Latex-Modified Lightweight Class G Cement Composites in Geothermal Well Energy Storage Systems. Materials 2023, 16, 5792. [Google Scholar] [CrossRef] [PubMed]
- Kovari, K.; Tisa, A.; Einstein, H.H.; Franklin, J.A. Suggested Methods for Determining the Strength of Rock Materials in Triaxial Compression: Revised Version. Int. J. Rock Mech. Min. Sci. & Geomech. Abstr. 1983, 20, 283–290. [Google Scholar]
- Brown, E.T. Rock Characterization, Testing and Monitoring: ISRM Suggested Methods; Pergamon Press: Oxford, 1981. [Google Scholar]
- Papamichos, E.; Brignoli, M.; Santarelli, F.J. An Experimental and Theoretical Study of a Partially Saturated Collapsible Rock. Mech. Cohesive-Frictional Mater. 1997, 2, 251–278. [Google Scholar] [CrossRef]
- Carneiro, F. A New Method to Determine the Tensile Strength of Concrete. In Proceedings of the 5th Meeting of the Brazilian Association for Technical Rules; Vol. Section 3d. 1943. [Google Scholar]
- Bieniawski, Z.T.; Hawkes, I. Suggested Methods for Determining Tensile Strength of Rock Materials. Int J Rock Mech Min Sci. 1978, 15, 99–103. [Google Scholar]
- Vrålstad, T.; Skorpa, R.; Werner, B. Experimental Studies on Cement Sheath Integrity During Pressure Cycling. In Proceedings of the SPE/IADC Drilling Conference and Exhibition, paper SPE/IADC-194171-MS; the Hague, The Netherlands, March 2019. [CrossRef]
- Skorpa, R.; Feneuil, B.; Sugama, T.; Pyatina, T. Cementitious Composites for Supercritical Geothermal Well Applications. In Proceedings of the ASME 2023 42nd International Conference on Ocean, Offshore and Arctic Engineering. Paper MAE2023-107301; 2023. [CrossRef]
- Vrålstad, T.; Skorpa, R. Digital Cement Integrity: A Methodology for 3D Visualization of Cracks and Microannuli in Well Cement. Sustainability 2020, 12, 4128. [Google Scholar] [CrossRef]
- Bybee, K. Use of a Mechanistic Model To Forecast Cement-Sheath Integrity for CO2 Storage. J. Pet. Technol. 2011, 63, 97–98. [Google Scholar] [CrossRef]
- Soustelle, V.; Moghadam, A.; Corina, A.N. Modified Cam-Clay Model Parameters for Well-Cement. In Proceedings of the SPE EuropEC - Europe Energy Conference; Vienna, Austria, 2023. [CrossRef]
- Borja, R.I.; Lee, S.R. Cam-Clay plasticity, Part 1: Implicit integration of elasto-plastic constitutive relations. Comput. Methods Appl. Mech. Eng. 1990, 78, 49–72. [Google Scholar] [CrossRef]
- Sugama, T.; Weber, L.; Brothers, L. Sodium-polyphosphate-modified fly ash/calcium aluminate blend cement: durability in wet, harsh geothermal environments. Mater. Lett. 2000, 44, 45–53. [Google Scholar] [CrossRef]
- Lei, W.; Liu, X.; Ding, Y.; Xiong, J.; Liang, L. The investigation on shale mechanical characteristics and brittleness evaluation. Sci. Rep. 2023, 13, 1–13. [Google Scholar] [CrossRef] [PubMed]
- Taylor, H.F.W. Cement Chemistry; 2nd ed.; Thomas Telford Publishing: London, 1997.
- Weber, E.; Emerson, E.; Harris, K.; Brothers, L. The Application of a New Corrosion Resistant Cement in Geothermal Wells. Geothermal Resource Council Transactions 1998, 22, 25–30. [Google Scholar]
- Pyatina, T.; Sugama, T. Cements for High-Temperature Geothermal Wells. In Cement based materials; London, UK, 2018; pp. 221–235.
- Foldvari, M. Handbook of Thermogravimetric System of Minerals and Its Use in Geological Practice 2011.
- Fischer, S.; Zemke, K.; Liebscher, A.; Wandrey, M. Petrophysical and petrochemical effects of long-term CO2 -exposure experiments on brine-saturated reservoir sandstone. Energy Procedia 2011, 4, 4487–4494. [Google Scholar] [CrossRef]
- Oelkers, E.H.; Gislason, S.R.; Matter, J. Mineral Carbonation of CO2. Elements 2008, 4, 333–337. [Google Scholar] [CrossRef]
- Munz, I.; Brandvoll, .; Haug, T.; Iden, K.; Smeets, R.; Kihle, J.; Johansen, H. Mechanisms and rates of plagioclase carbonation reactions. Geochim. et Cosmochim. Acta 2012, 77, 27–51. [CrossRef]
- Murakami, T.; Kogure, T.; Kadohara, H.; Ohnuki, T. Formation of Secondary Minerals and Its Effect on Anorthite Dissolution; 1998; Vol. 83; [CrossRef]
- Moghadam, A.; Loizzo, M. Cement Integrity Assessment Using a Hydration-Coupled Thermo-Mechanical Model. . In Proceedings of the SPE Offshore Europe Conference & Exhibition 2023; Auberdeen, UK, 2023. [CrossRef]
Figure 1.
Photographs of samples exposure tools (baskets) with cylindrical cement samples inside. .
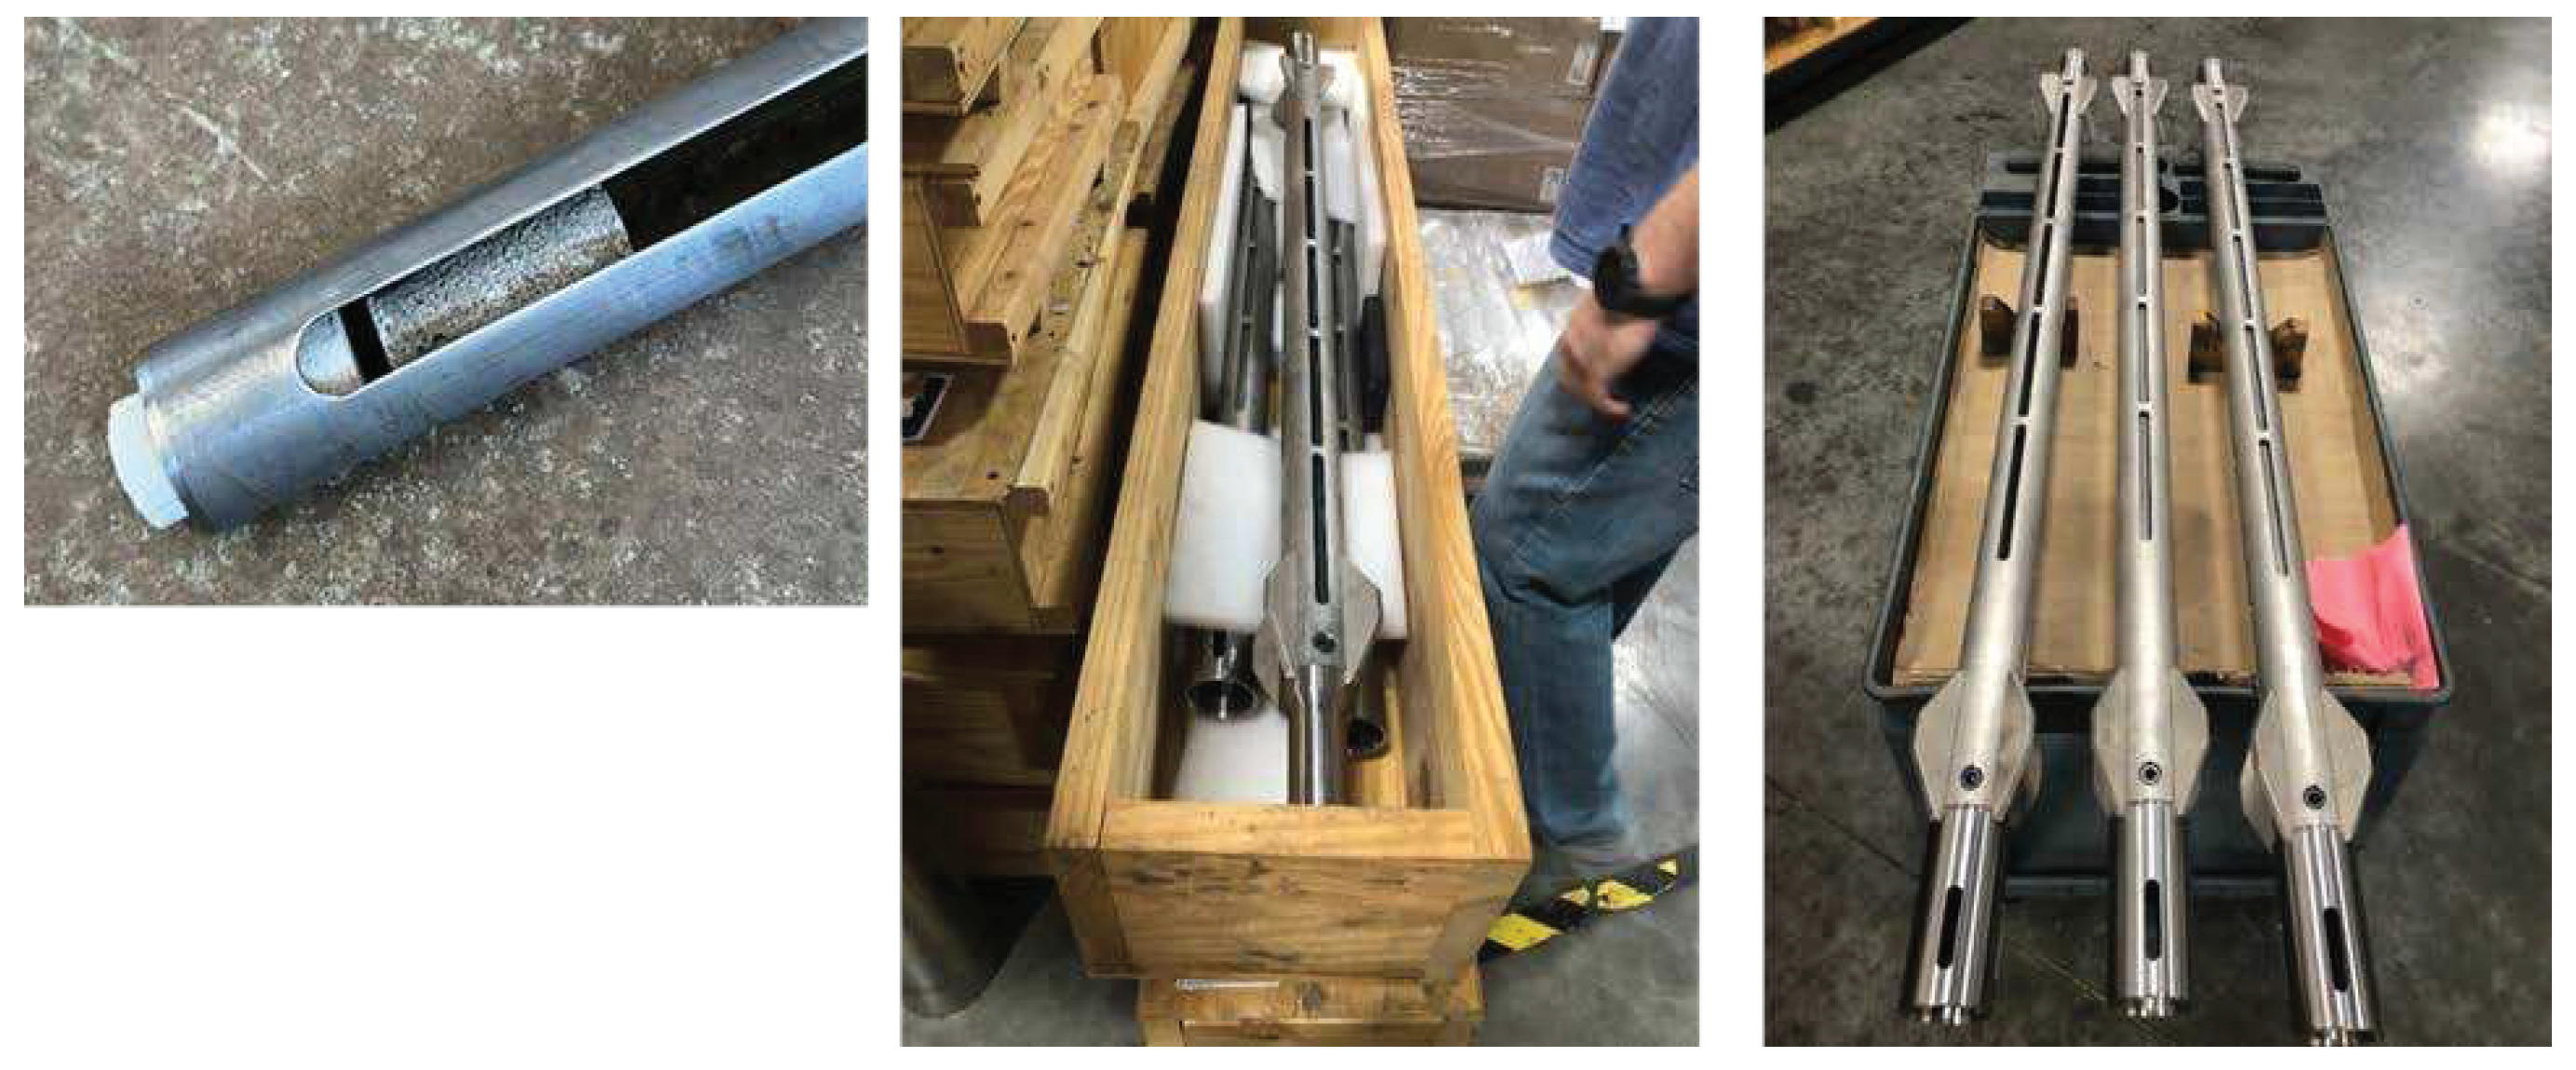
Figure 2.
A setup for triaxial testing of cement specimens.
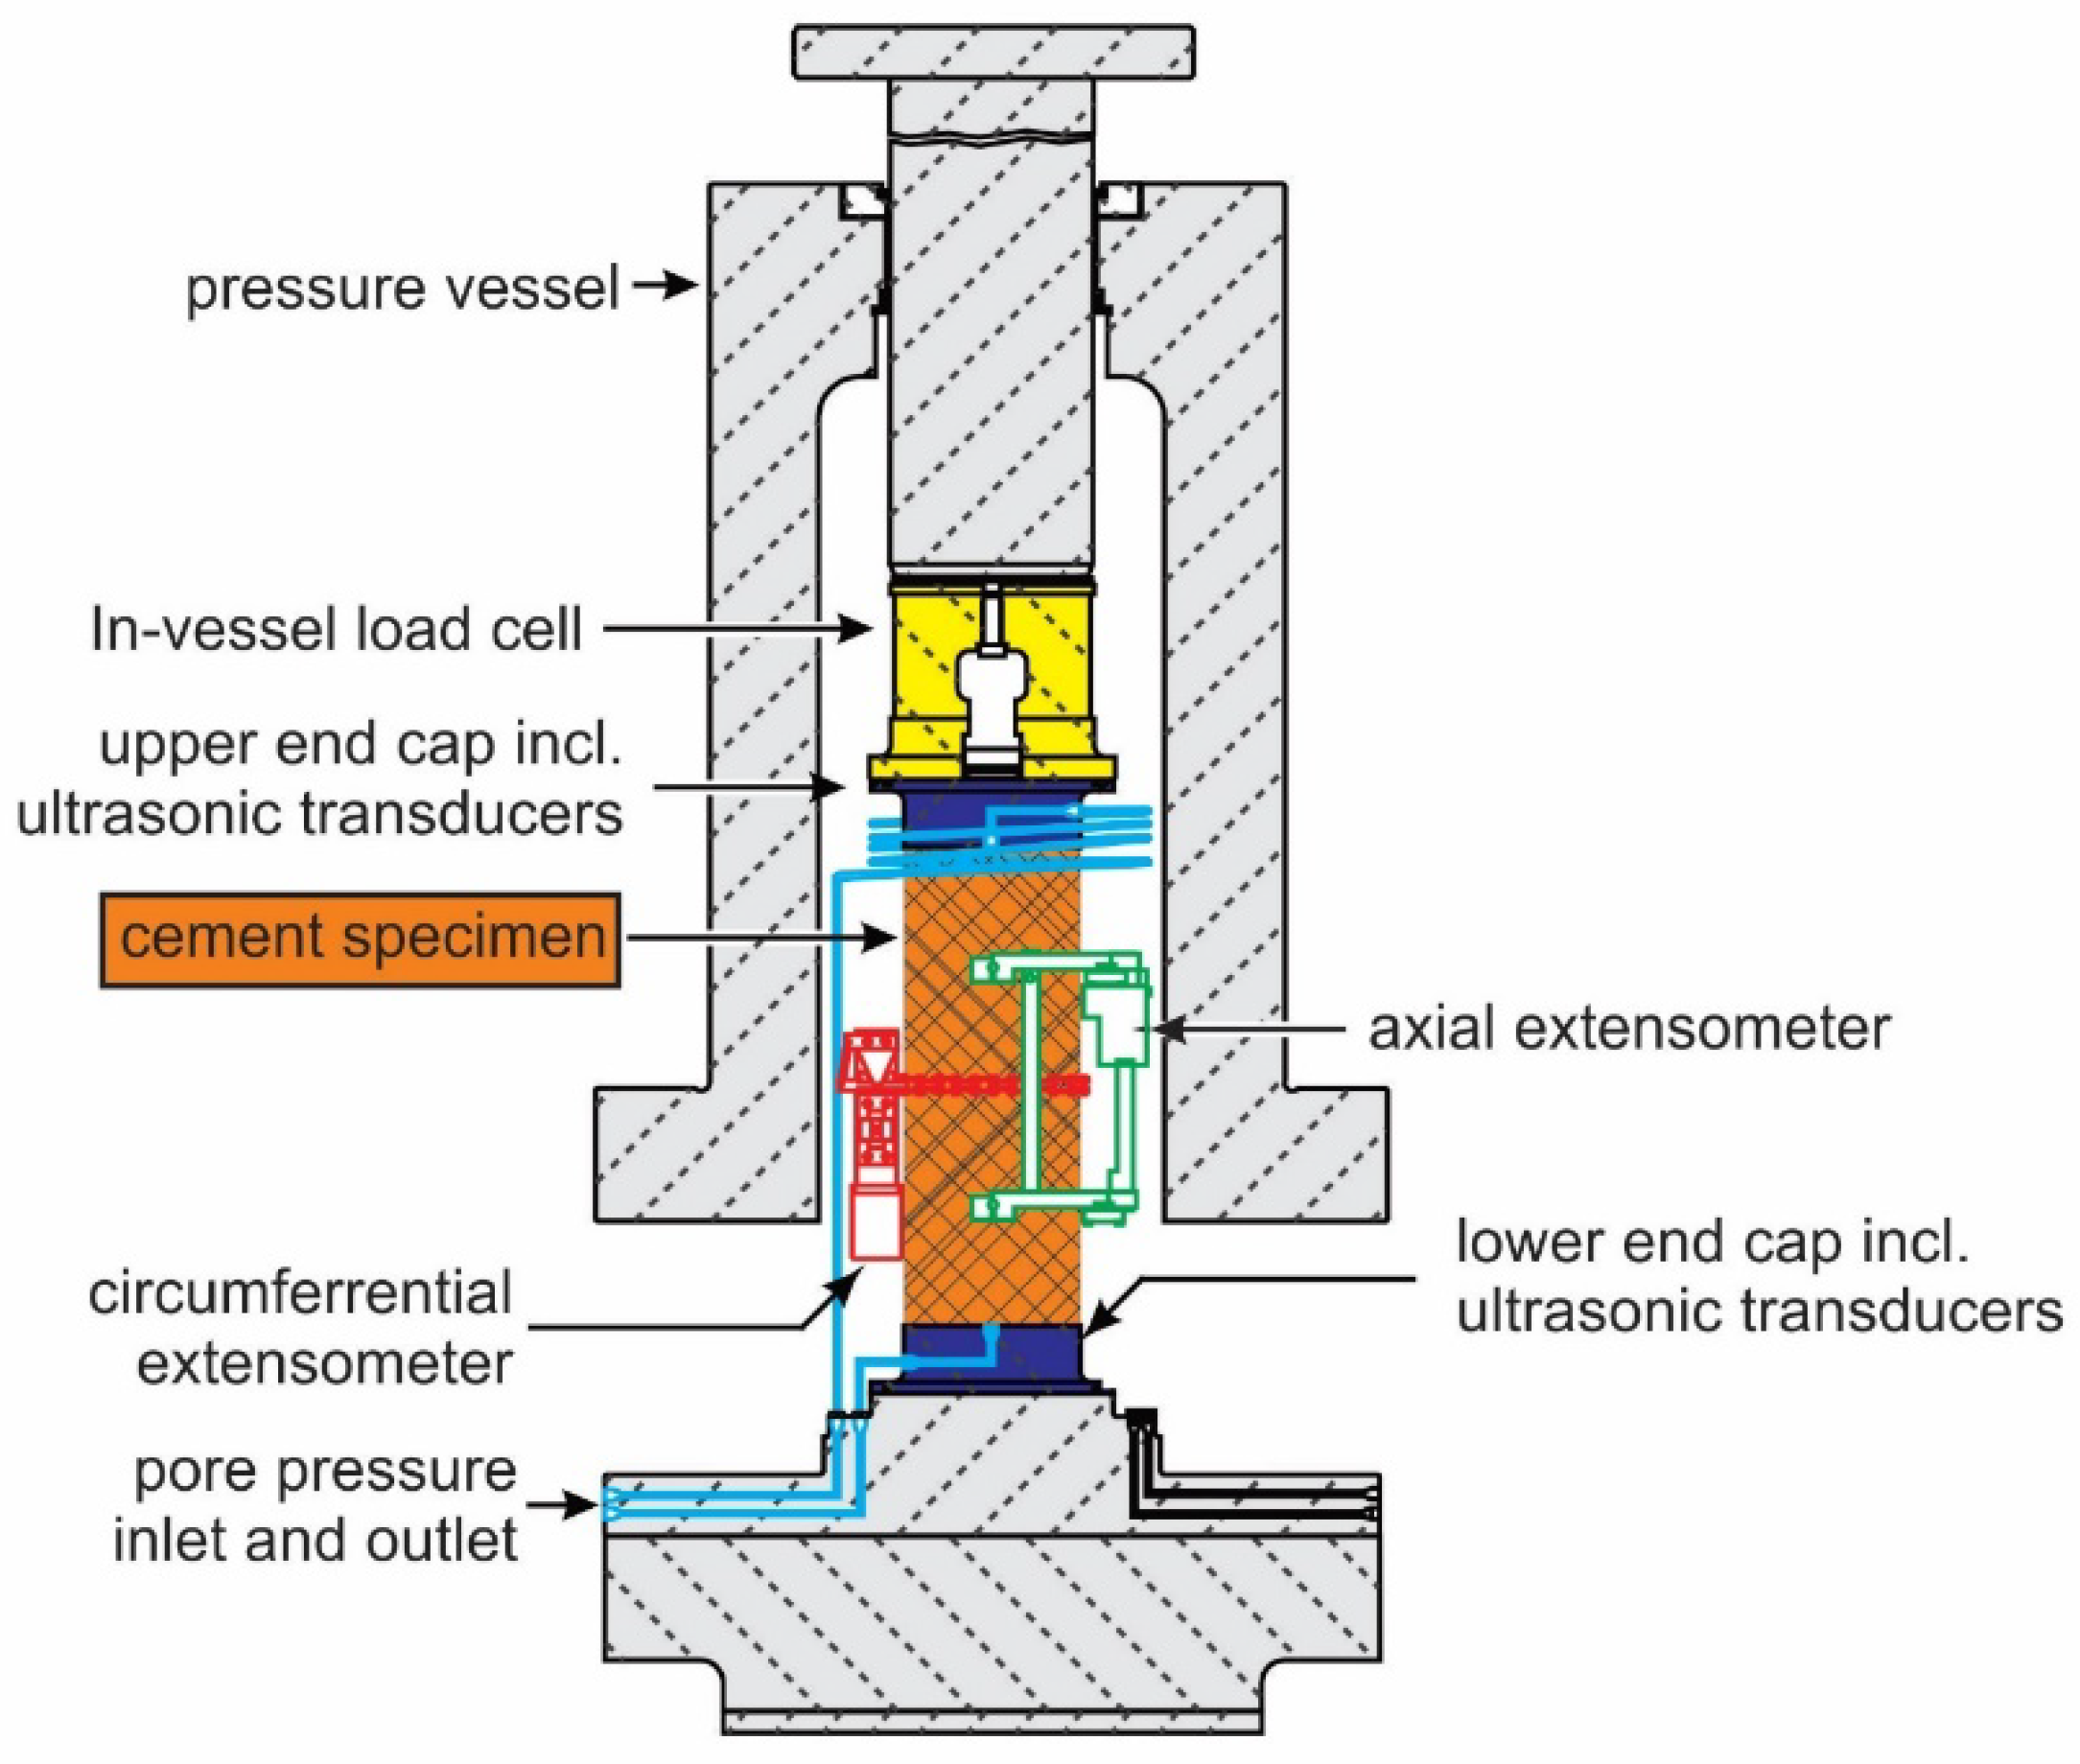
Figure 3.
Schematic illustration of a small-scale wellbore cell used to perform function tests (left) and a 2D illustration of a sample with Cement sheath in the annuli between rock and casing.
Figure 3.
Schematic illustration of a small-scale wellbore cell used to perform function tests (left) and a 2D illustration of a sample with Cement sheath in the annuli between rock and casing.
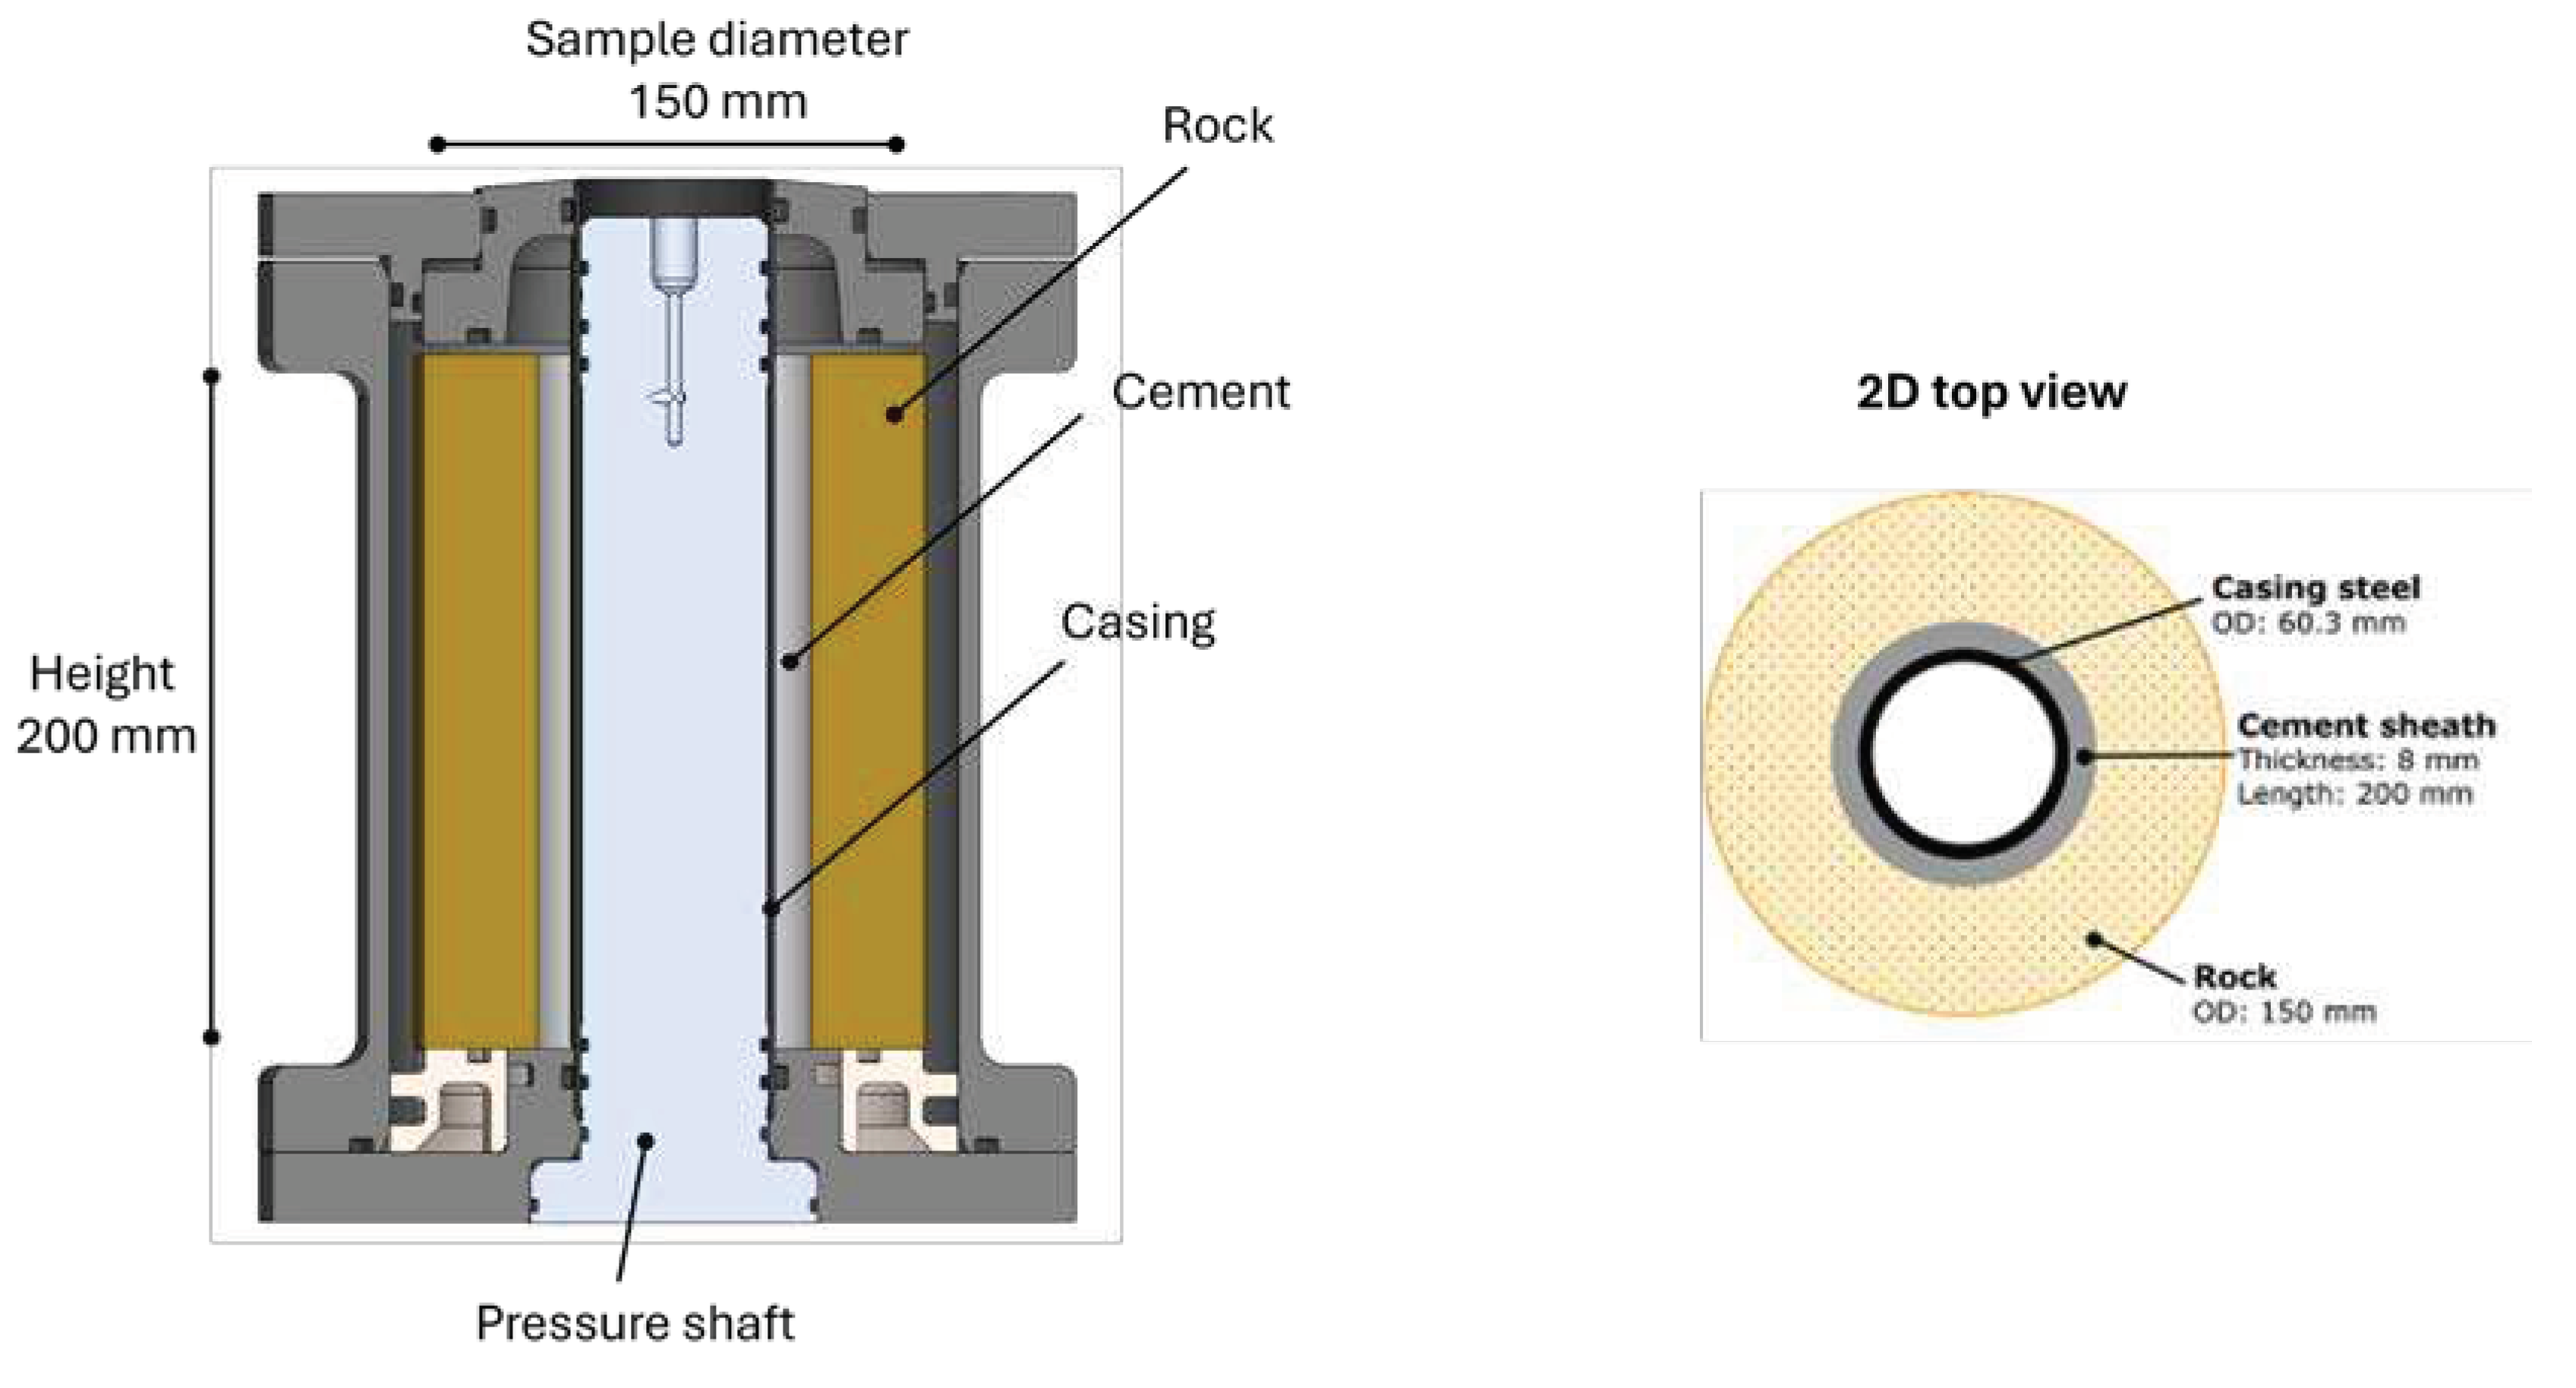
Figure 4.
Geometry of the numerical model, representing a semi-2D slice of the sample used in the function tests. .
Figure 4.
Geometry of the numerical model, representing a semi-2D slice of the sample used in the function tests. .
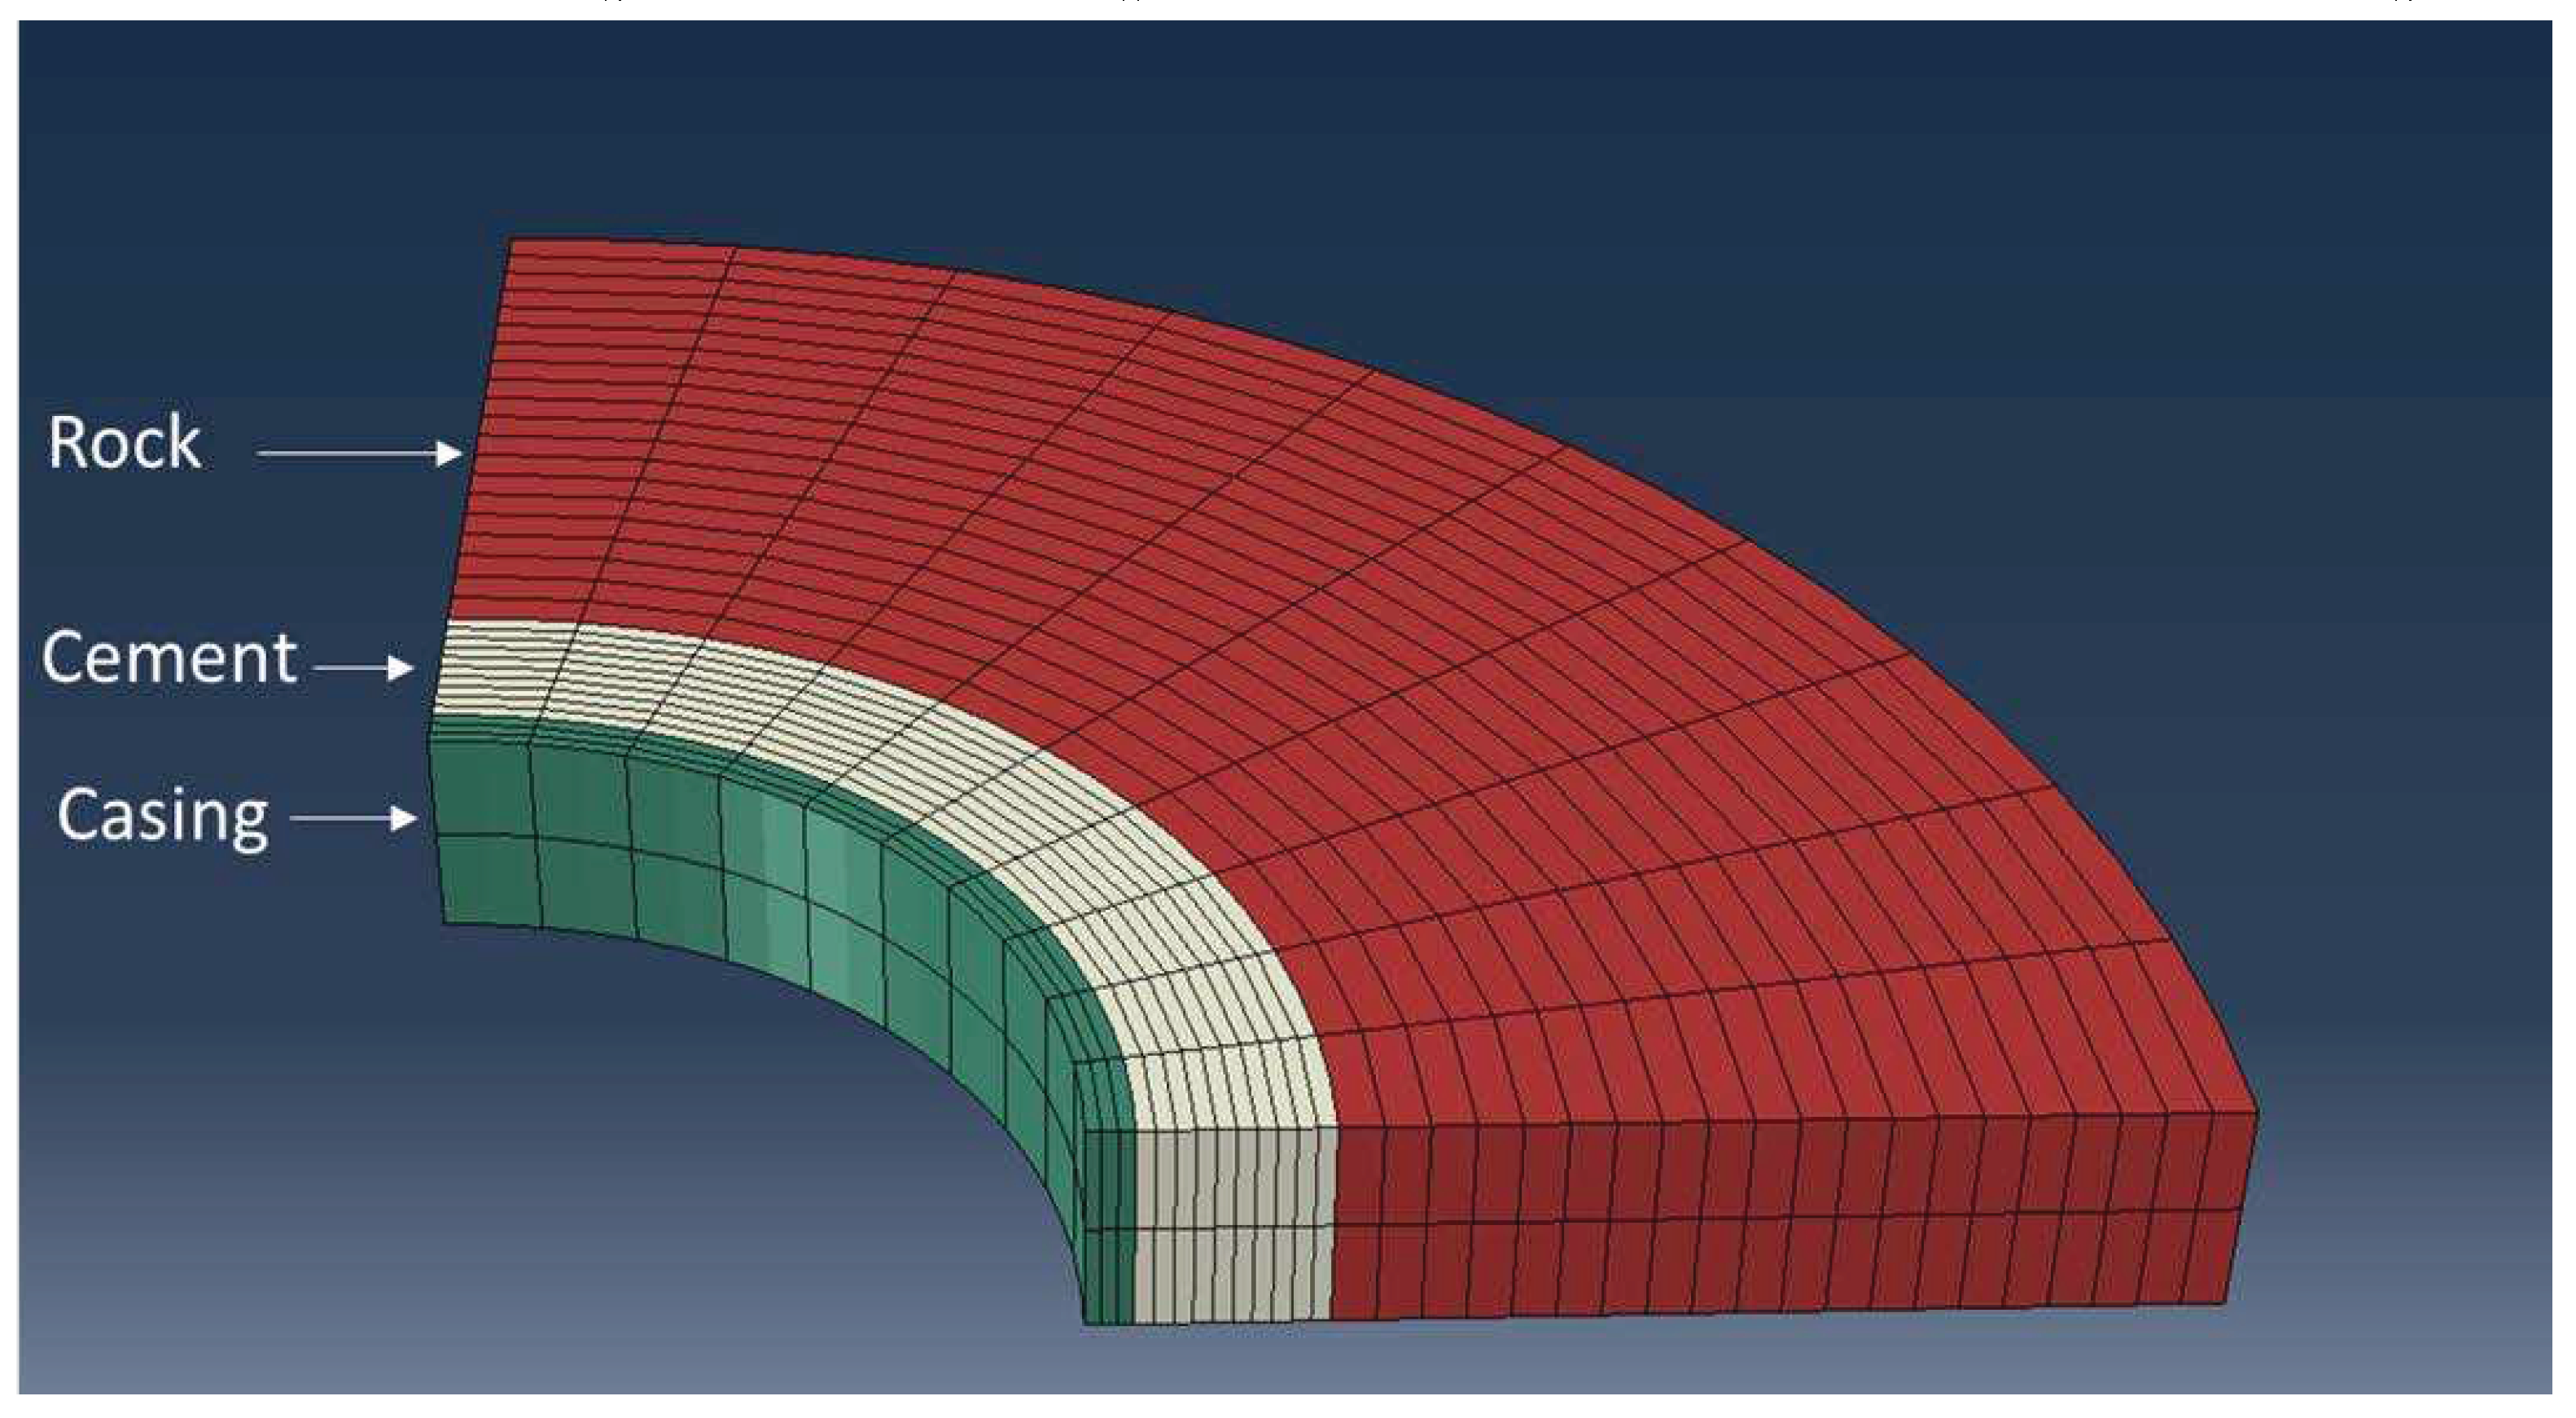
Figure 5.
Compressive strength of reference samples (after 1 day autoclaving at 300oC) and samples exposed in Newberry well for 3 months (left) or 9 months (right).
Figure 5.
Compressive strength of reference samples (after 1 day autoclaving at 300oC) and samples exposed in Newberry well for 3 months (left) or 9 months (right).
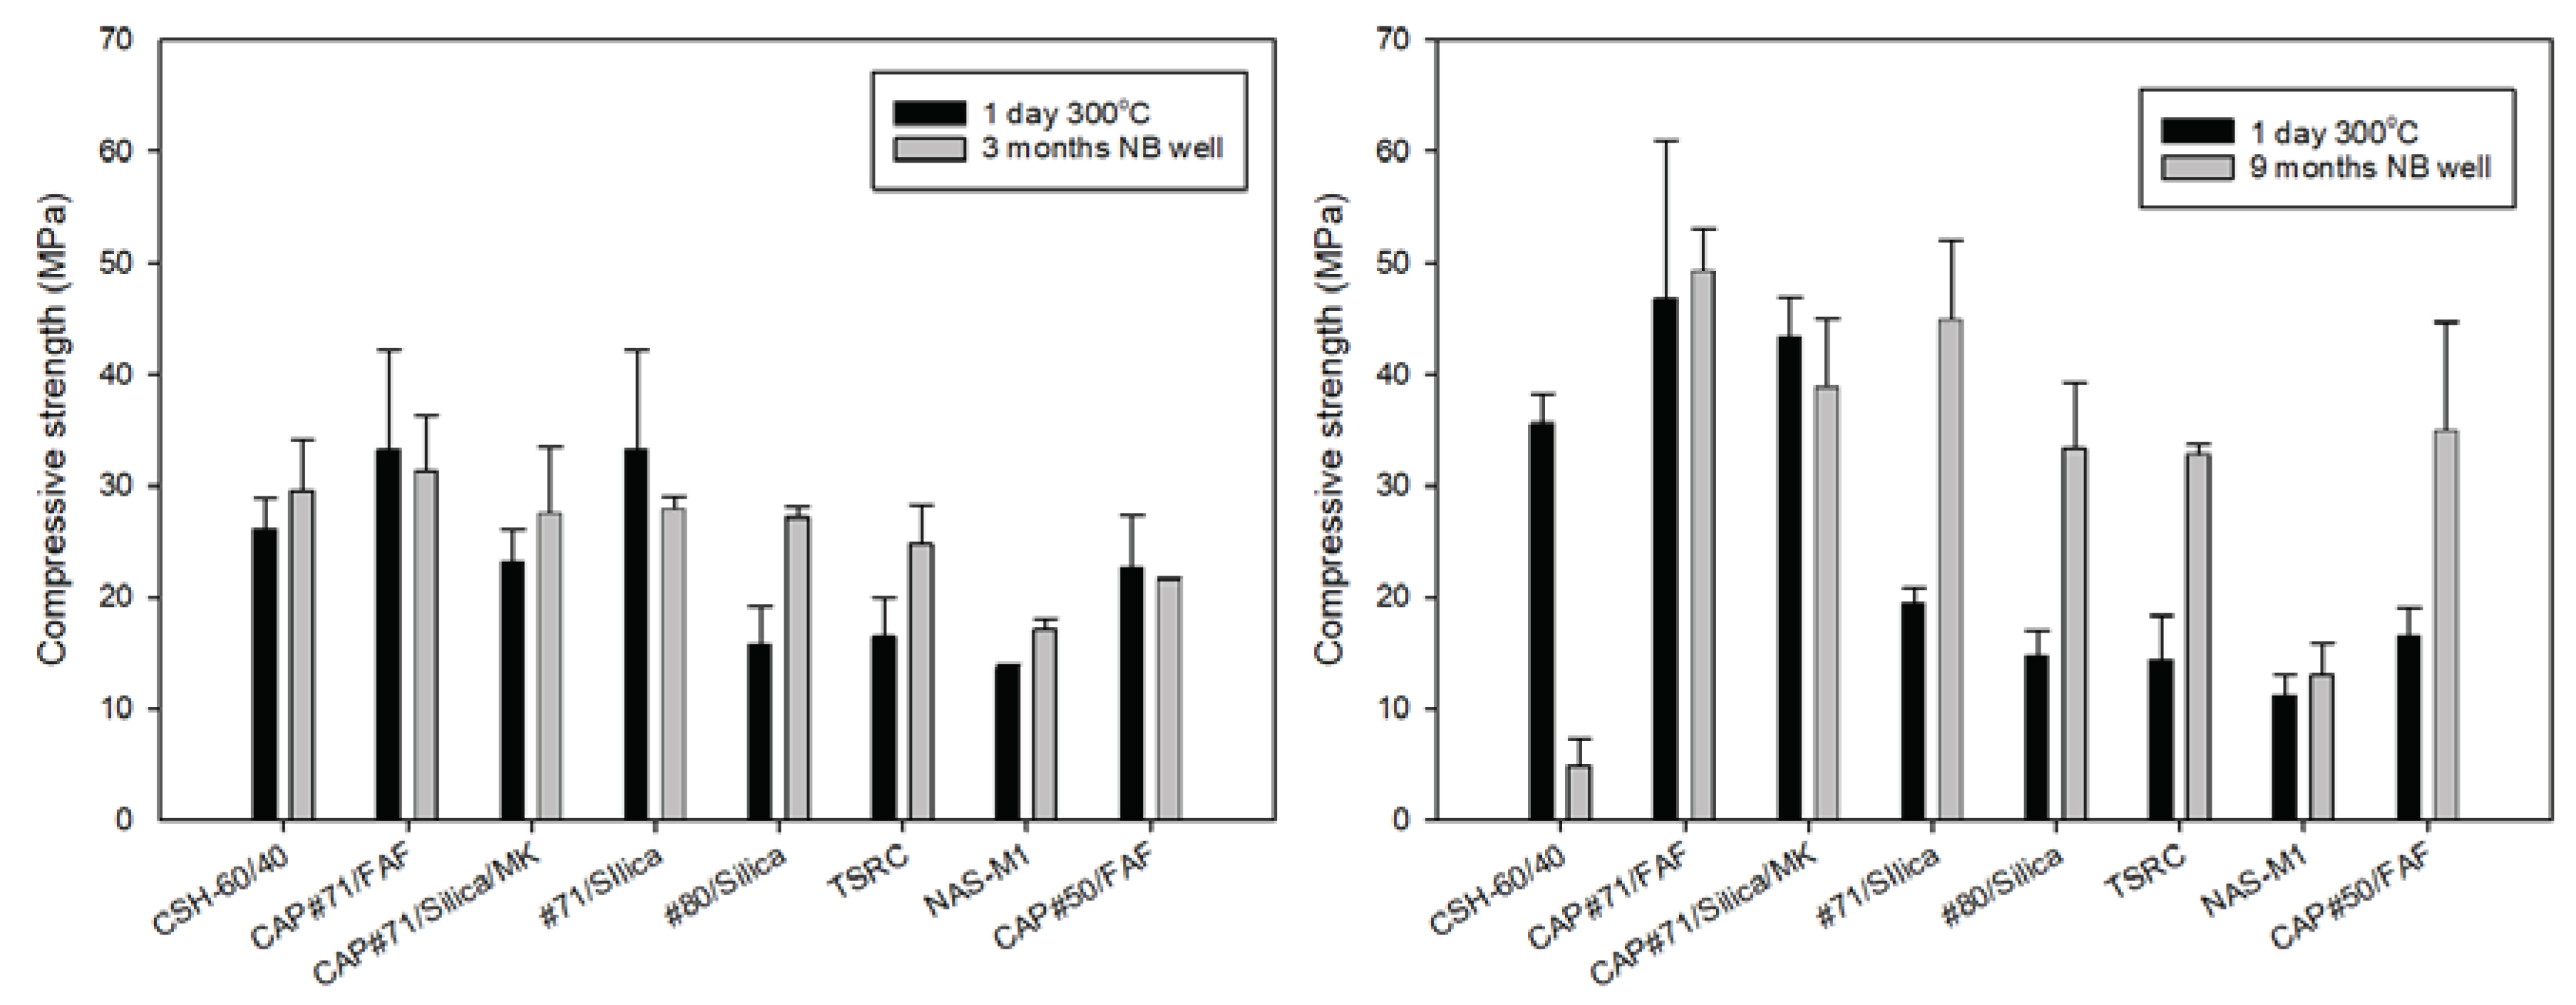
Figure 6.
Young’s modulus of reference samples (after 1 day autoclaving at 300oC) and samples exposed in Newberry well for 3 months (left) or 9 months (right).
Figure 6.
Young’s modulus of reference samples (after 1 day autoclaving at 300oC) and samples exposed in Newberry well for 3 months (left) or 9 months (right).
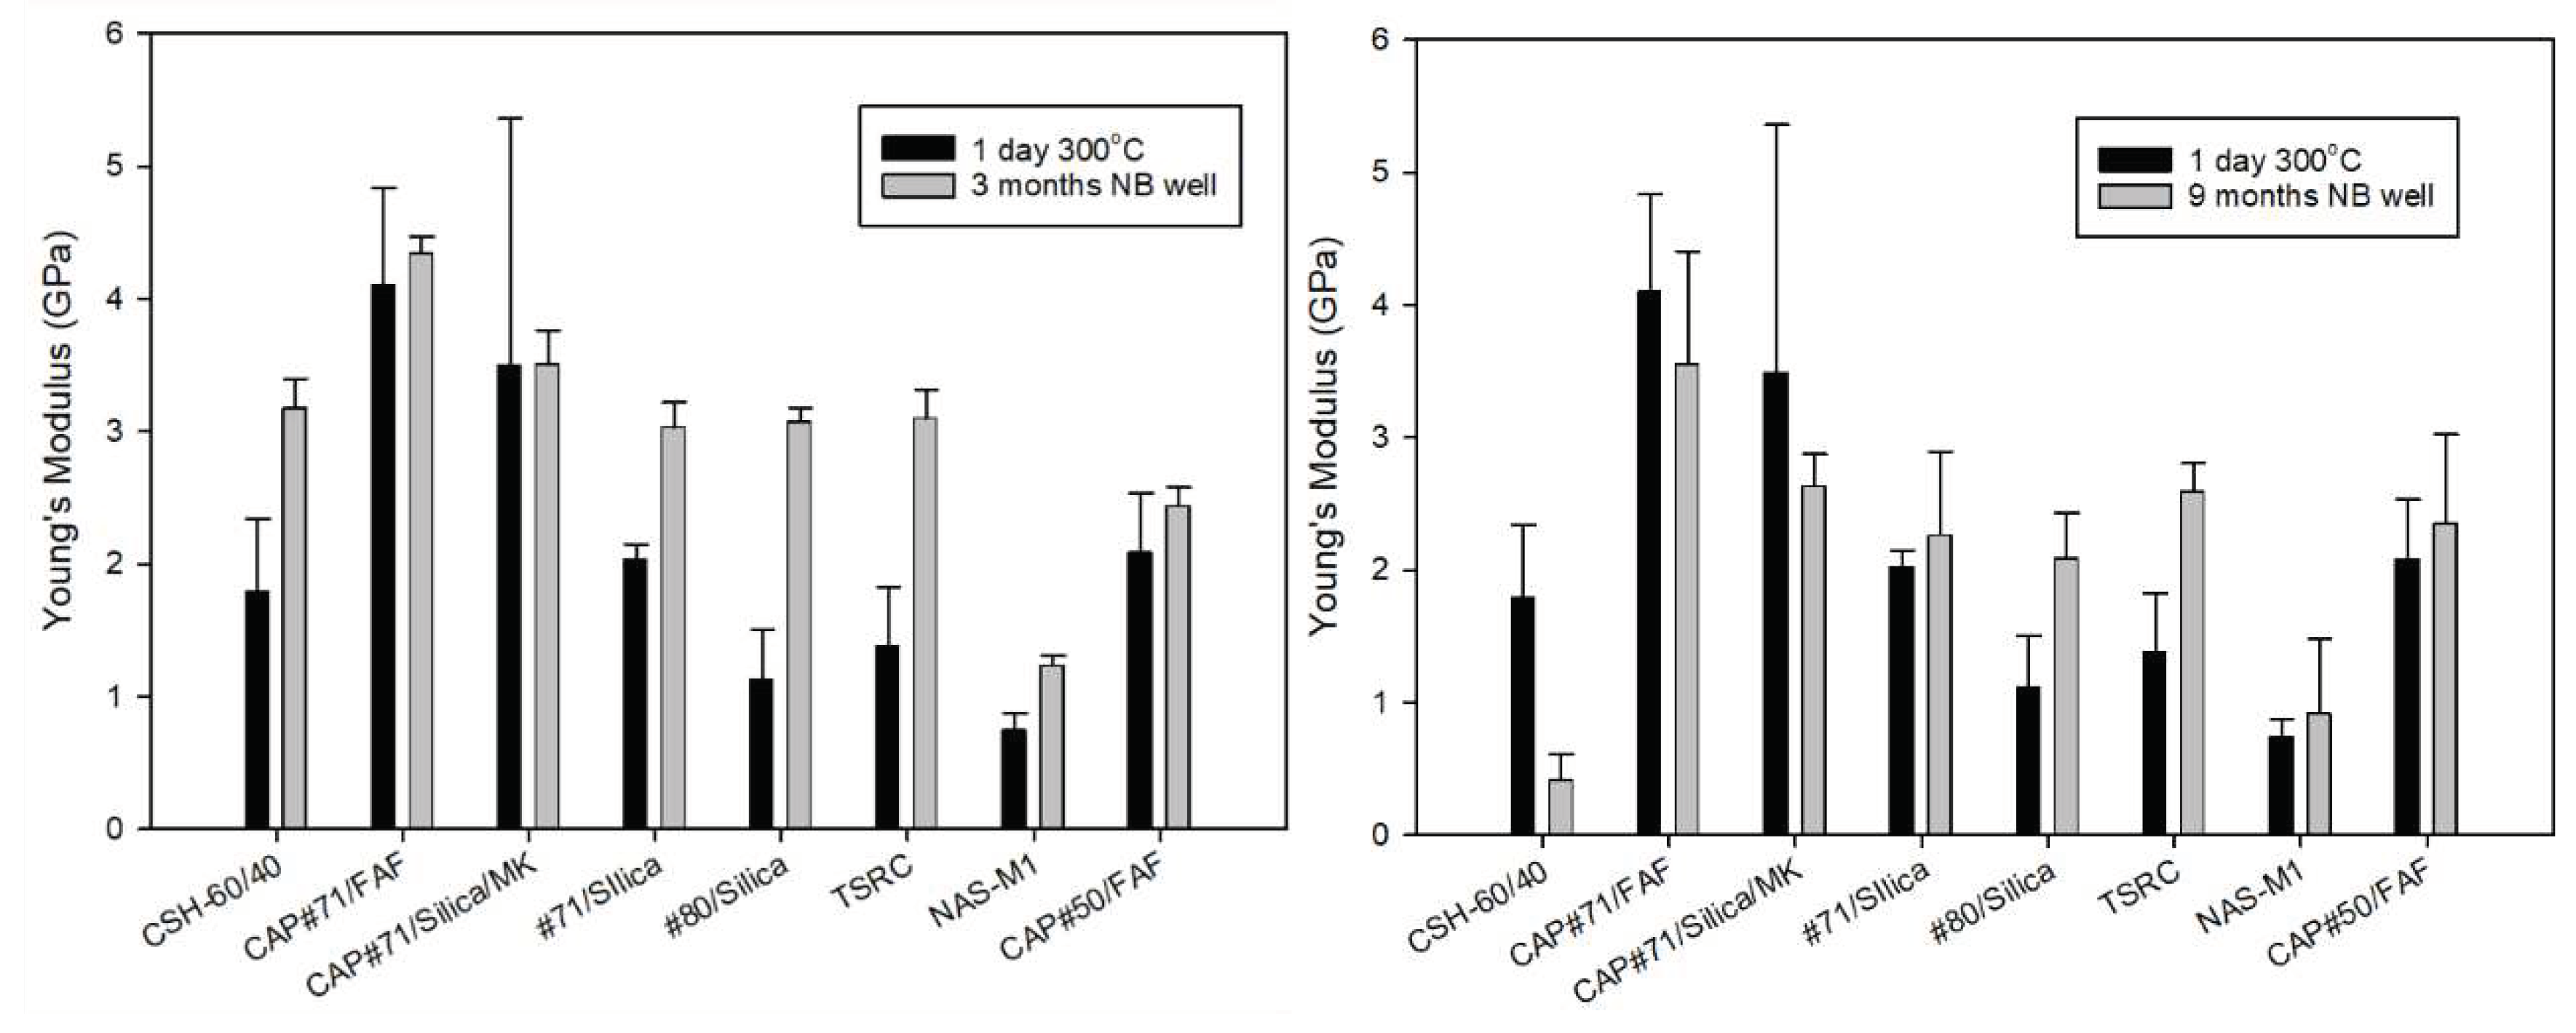
Figure 7.
Toughness of reference samples (after 1 day autoclaving at 300oC) and samples exposed in Newberry well for 3 months (left) or 9 months (right).
Figure 7.
Toughness of reference samples (after 1 day autoclaving at 300oC) and samples exposed in Newberry well for 3 months (left) or 9 months (right).
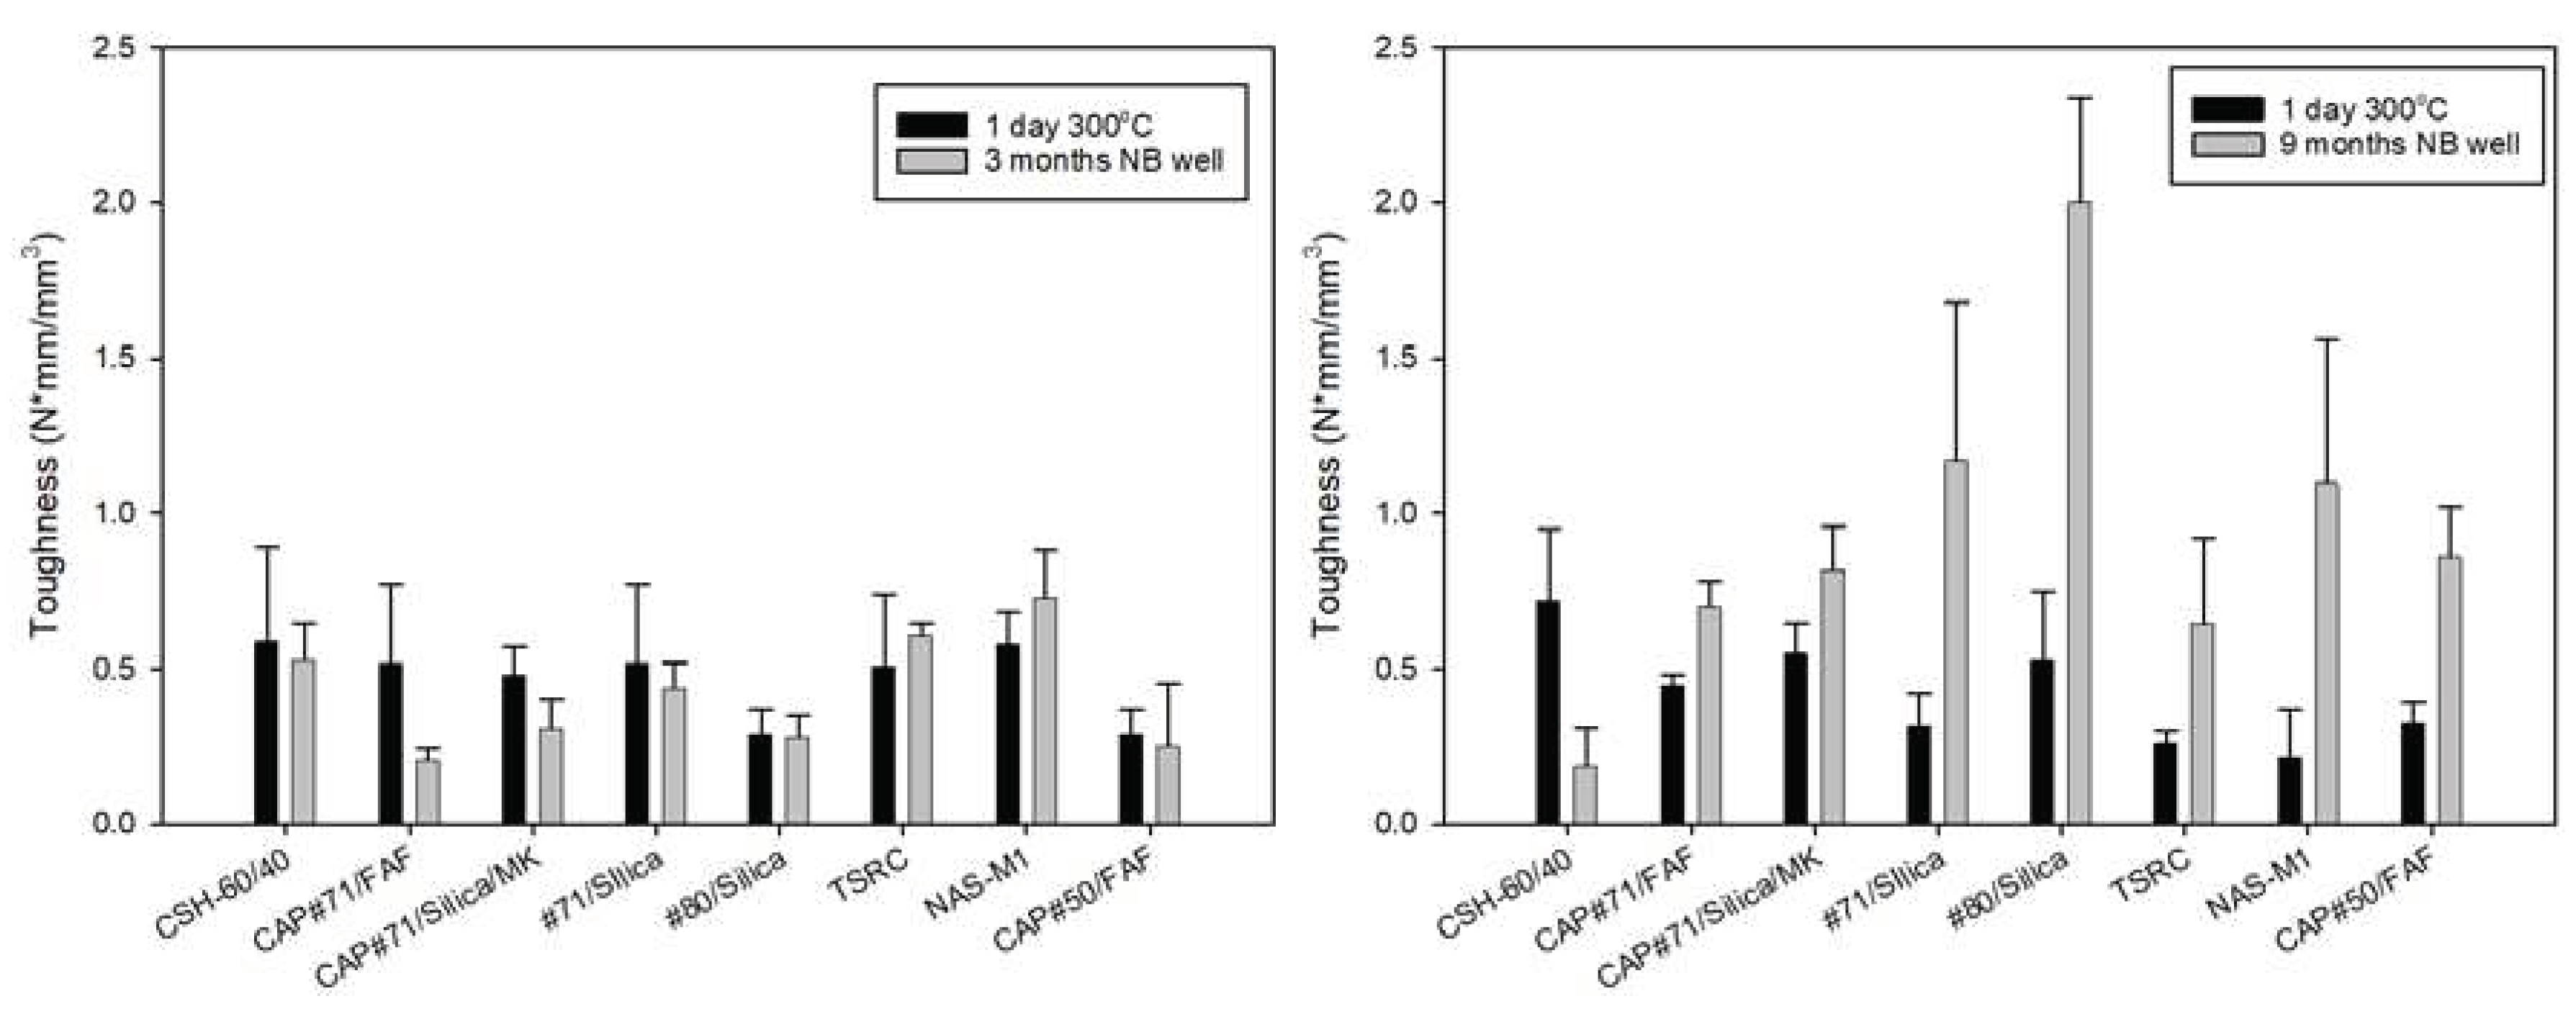
Figure 8.
Water-fillable porosity of reference samples (after 1 day autoclaving at 300oC) and samples exposed in Newberry well for 3 months (left) or 9 months (right).
Figure 8.
Water-fillable porosity of reference samples (after 1 day autoclaving at 300oC) and samples exposed in Newberry well for 3 months (left) or 9 months (right).
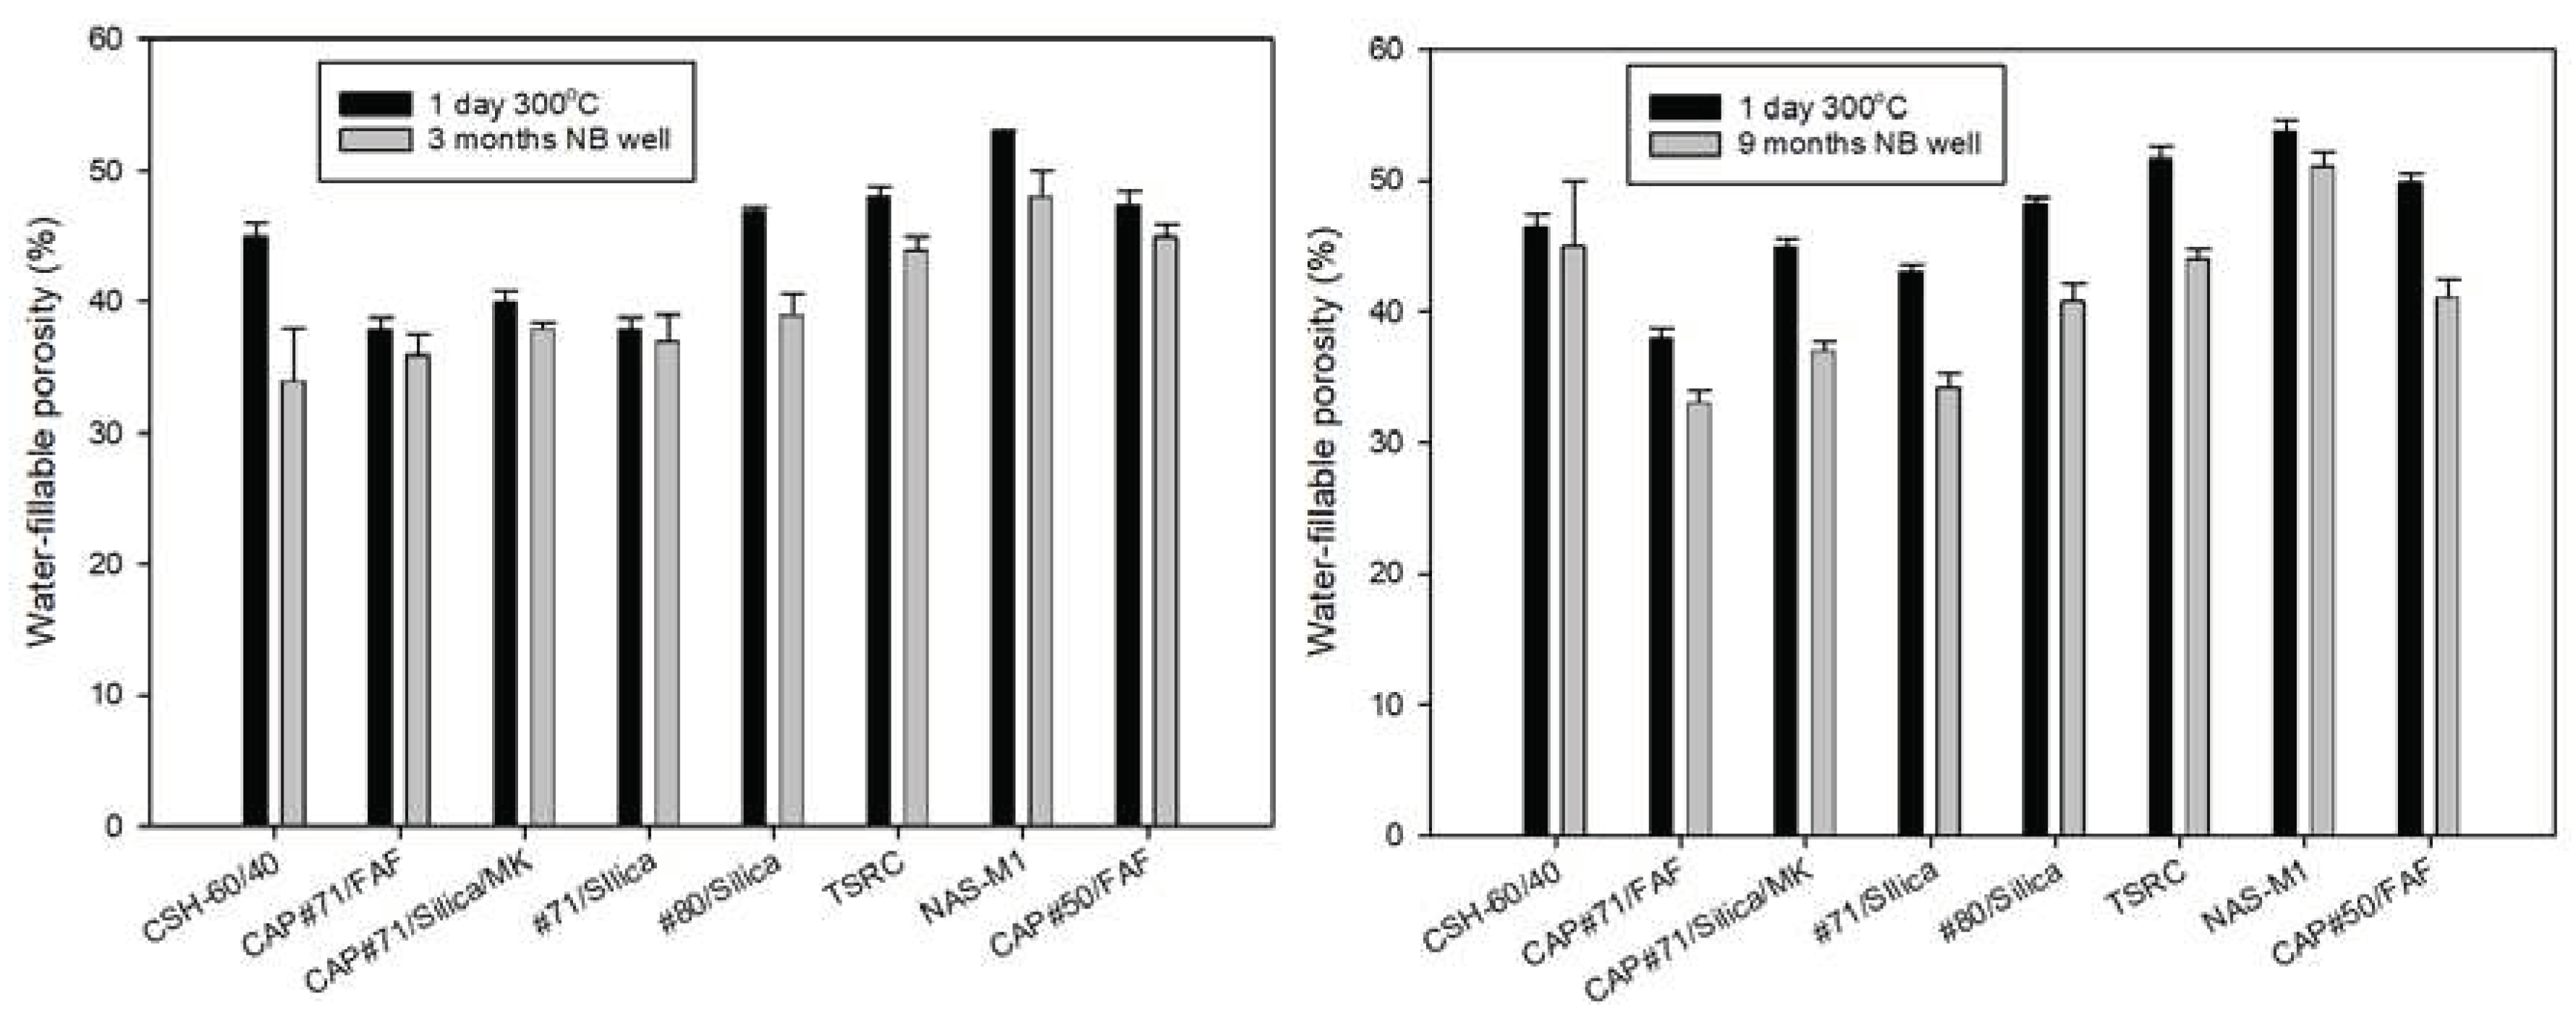
Figure 9.
Stress-strain plots from triaxial testing for three different materials. Solid lines correspond to exposed samples (3 months, Newberry well), dashed lines are the non-exposed control samples (1 day autoclaving at 300oC).
Figure 9.
Stress-strain plots from triaxial testing for three different materials. Solid lines correspond to exposed samples (3 months, Newberry well), dashed lines are the non-exposed control samples (1 day autoclaving at 300oC).
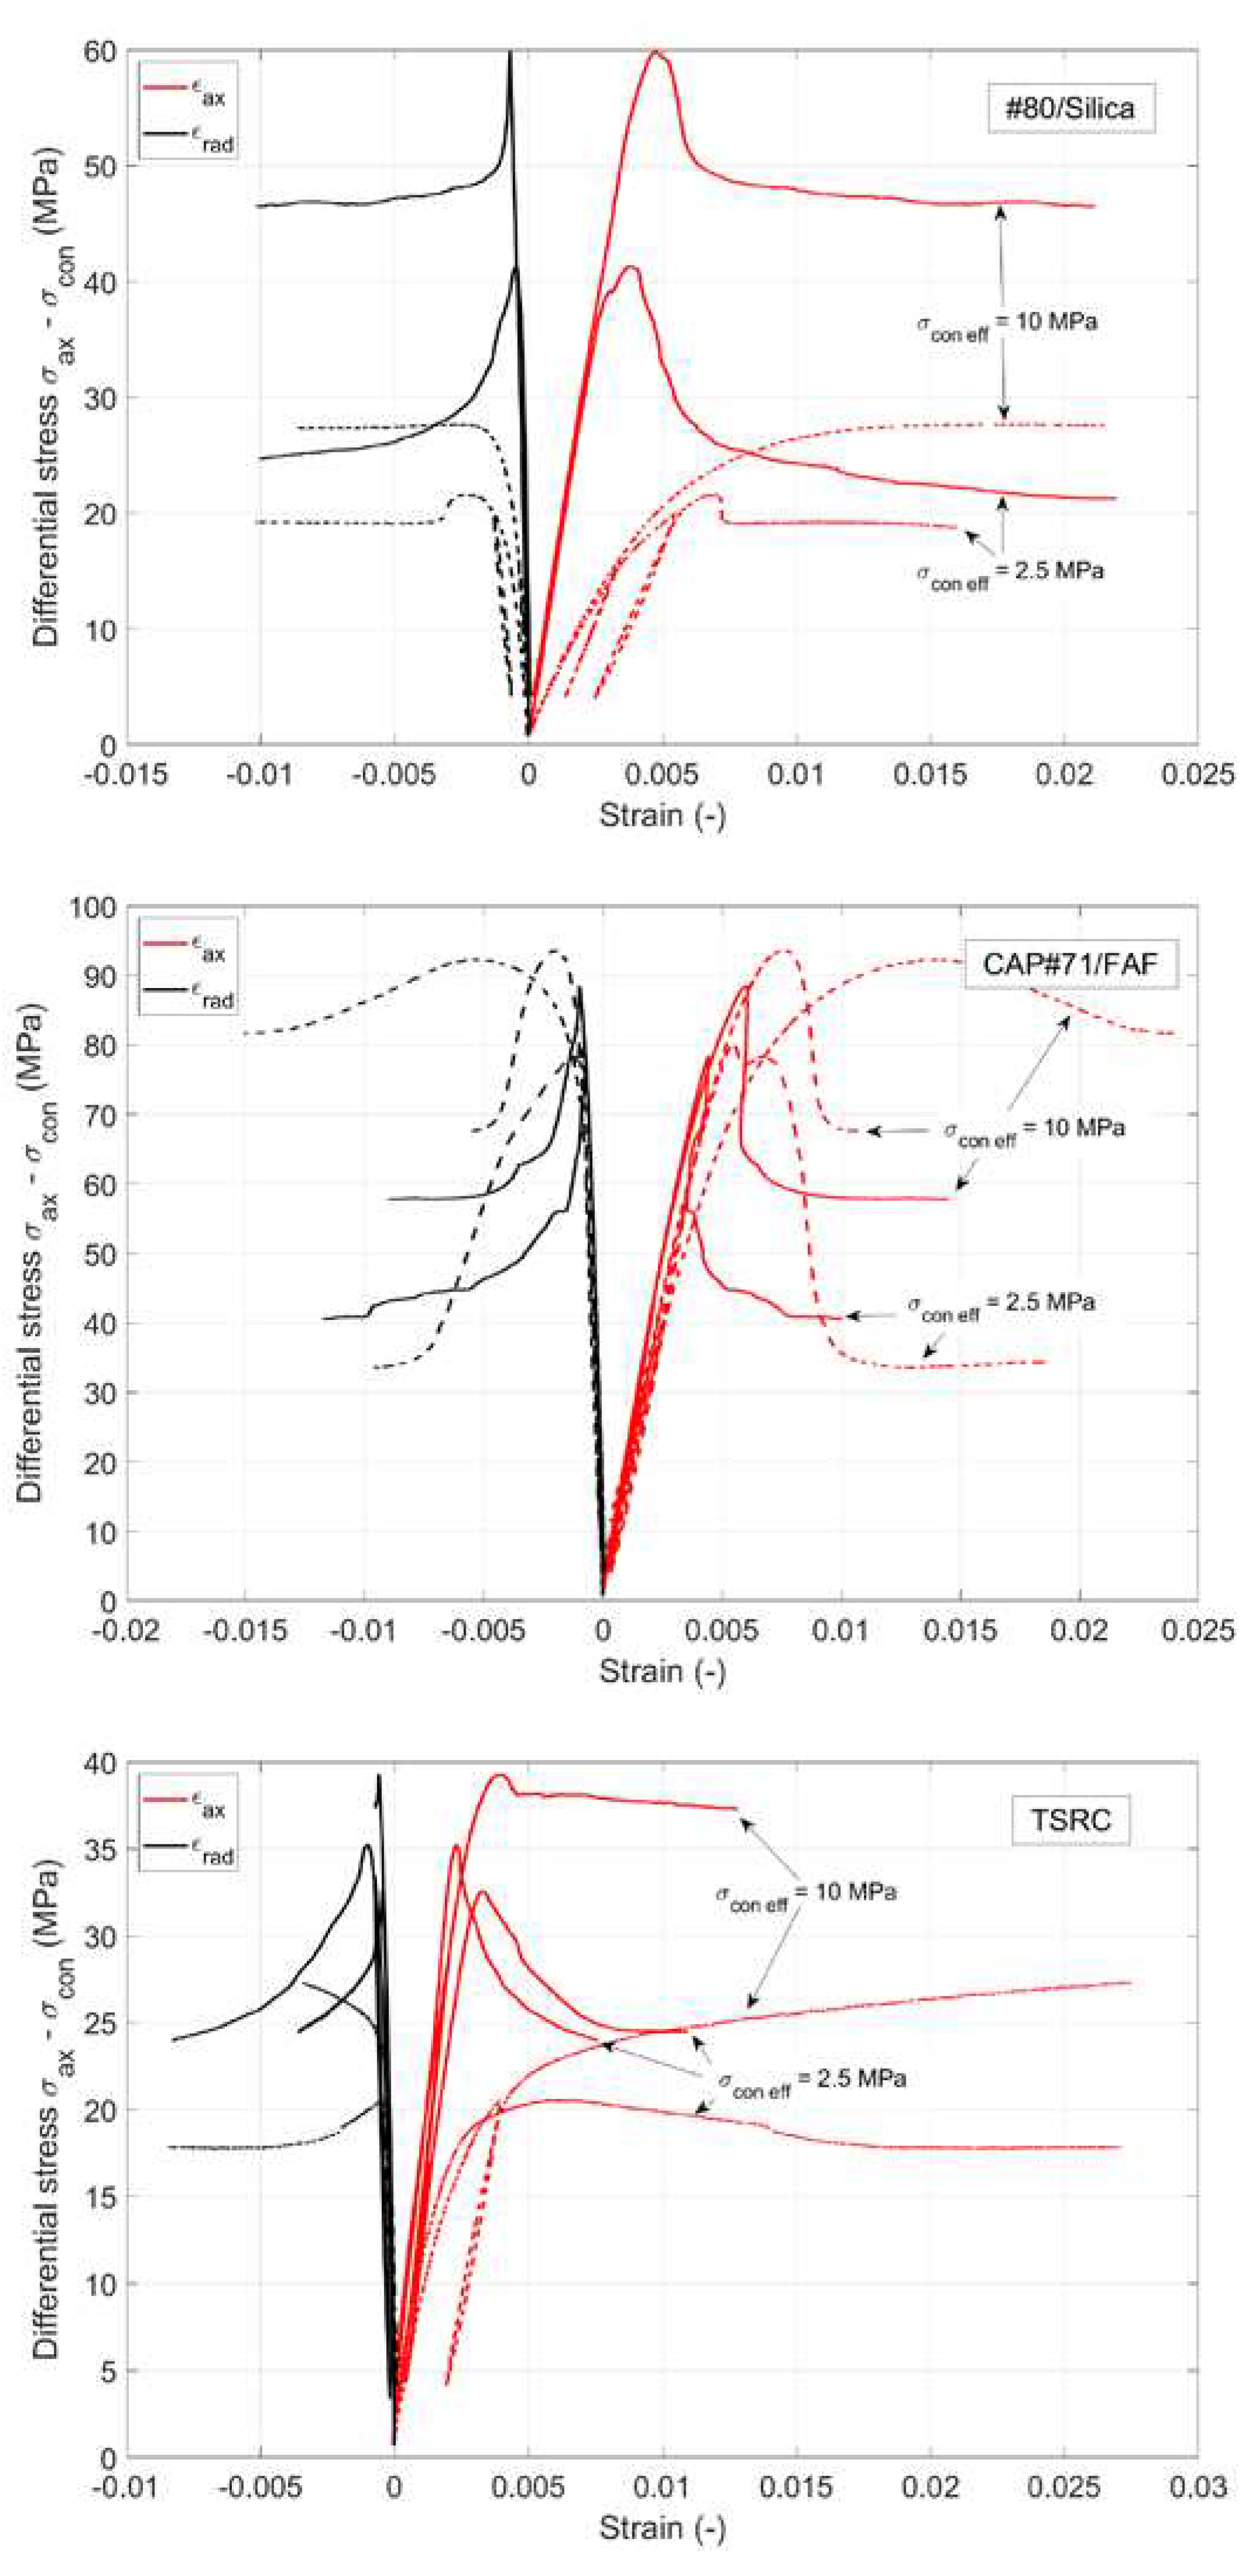
Figure 11.
Crack growth in cement and rock during the function tests for A) cement sheath and B) surrounding rock.
Figure 11.
Crack growth in cement and rock during the function tests for A) cement sheath and B) surrounding rock.
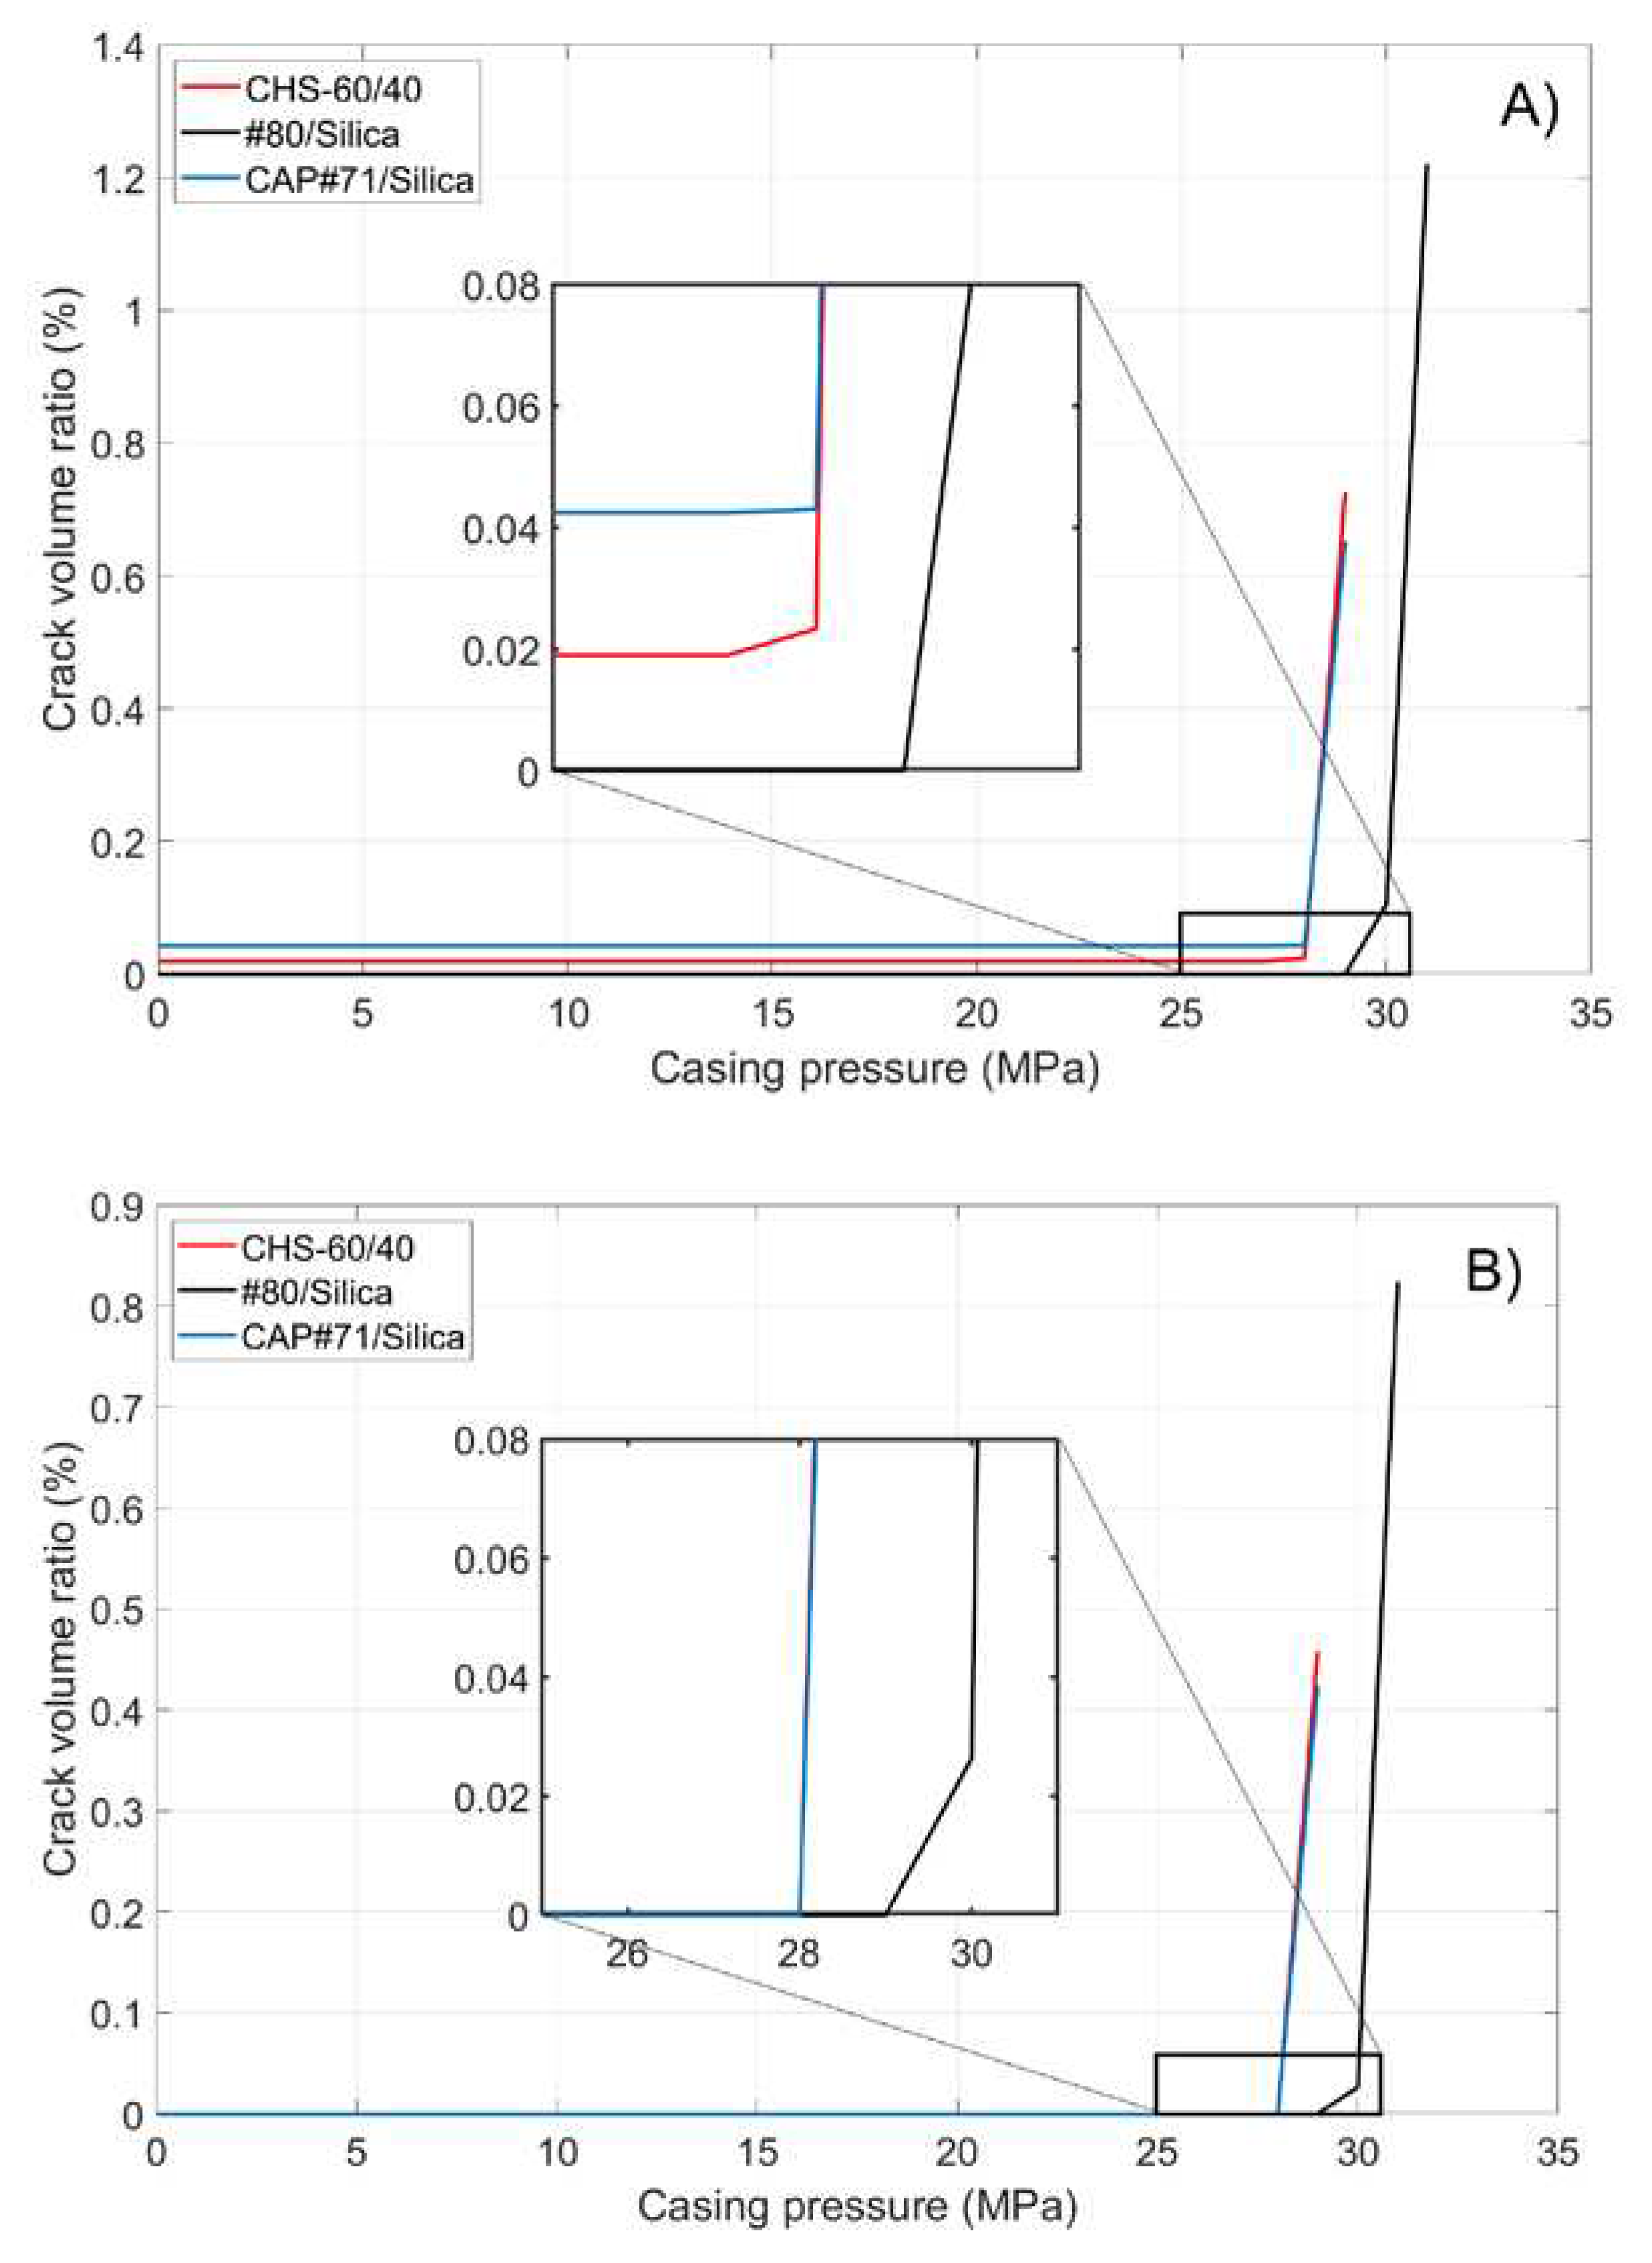
Figure 12.
2D segmented images illustrating the brittle behavior of CAP#71/Silica and CSH-60/40. Material identification on the 2D picture: Cement (dark green), Rock (light green), Cement crack (red) and Rock crack (blue).
Figure 12.
2D segmented images illustrating the brittle behavior of CAP#71/Silica and CSH-60/40. Material identification on the 2D picture: Cement (dark green), Rock (light green), Cement crack (red) and Rock crack (blue).

Figure 13.
Illustration of the crack morphologies after sample failure for the reference sample CSH-60/40 and the calcium aluminate-based cements #80/Silica and CAP#71/Silica.
Figure 13.
Illustration of the crack morphologies after sample failure for the reference sample CSH-60/40 and the calcium aluminate-based cements #80/Silica and CAP#71/Silica.
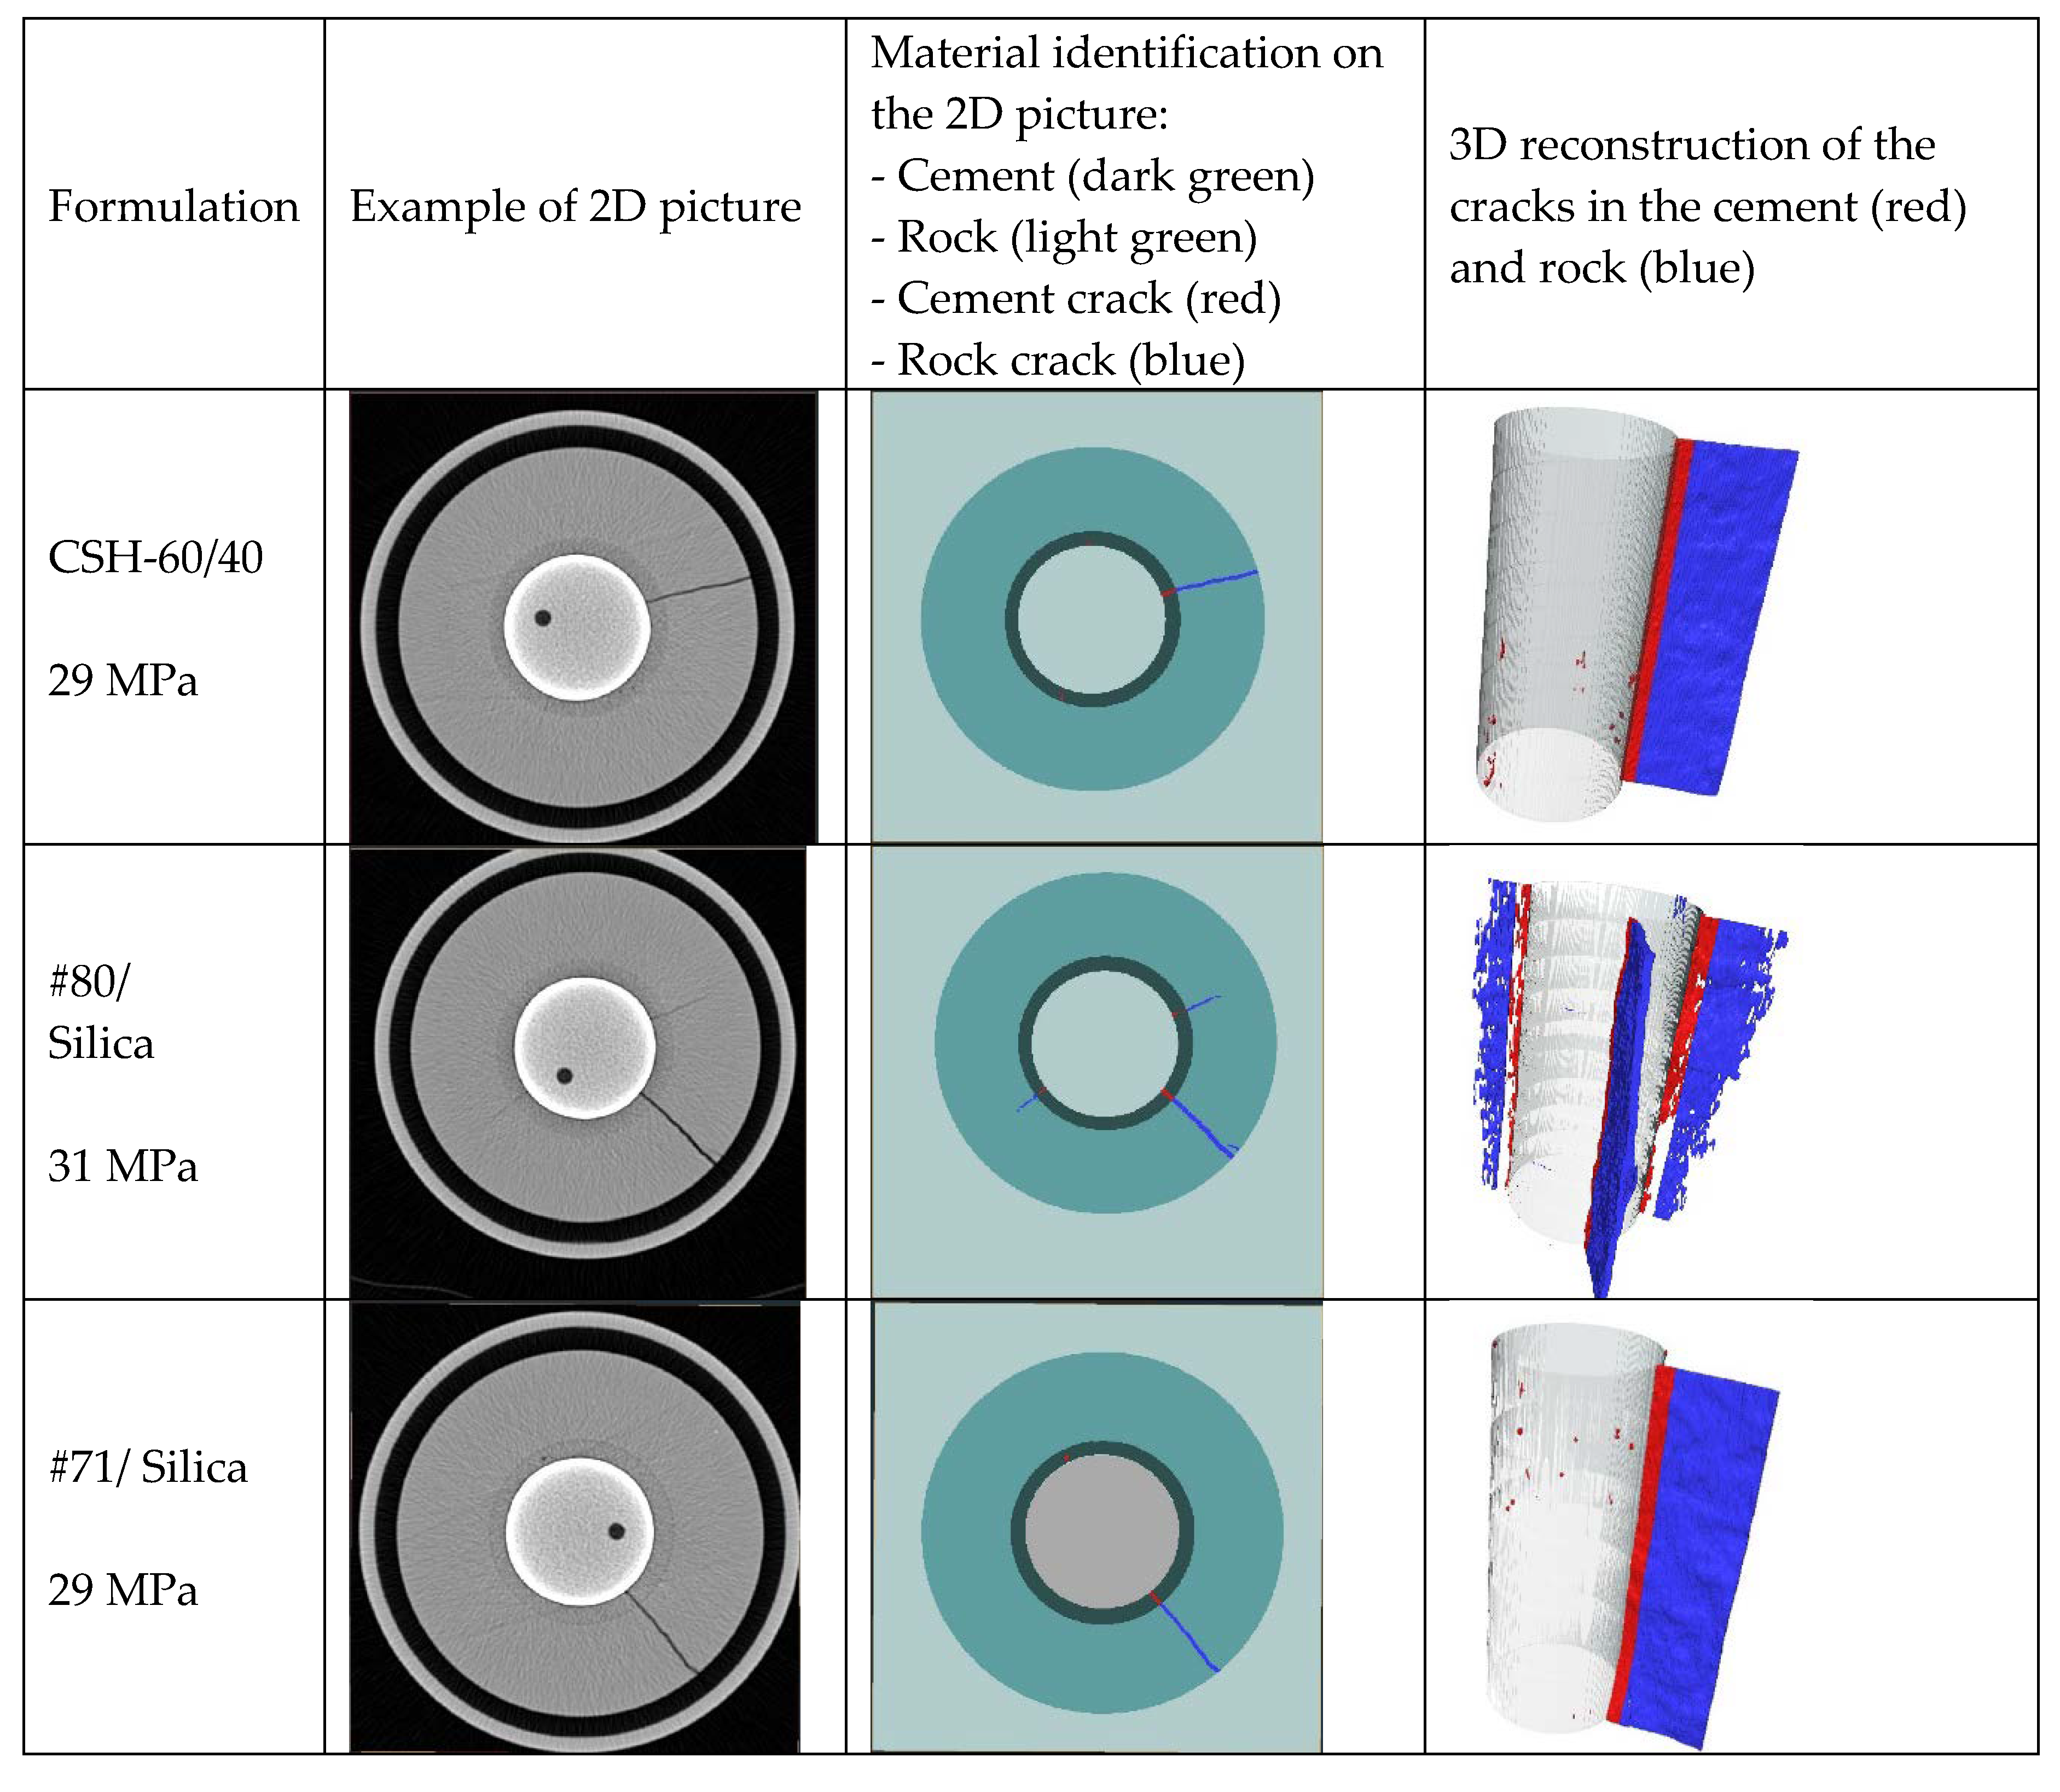
Figure 14.
MCC model yield envelope and critical state line according to the lab experiments.
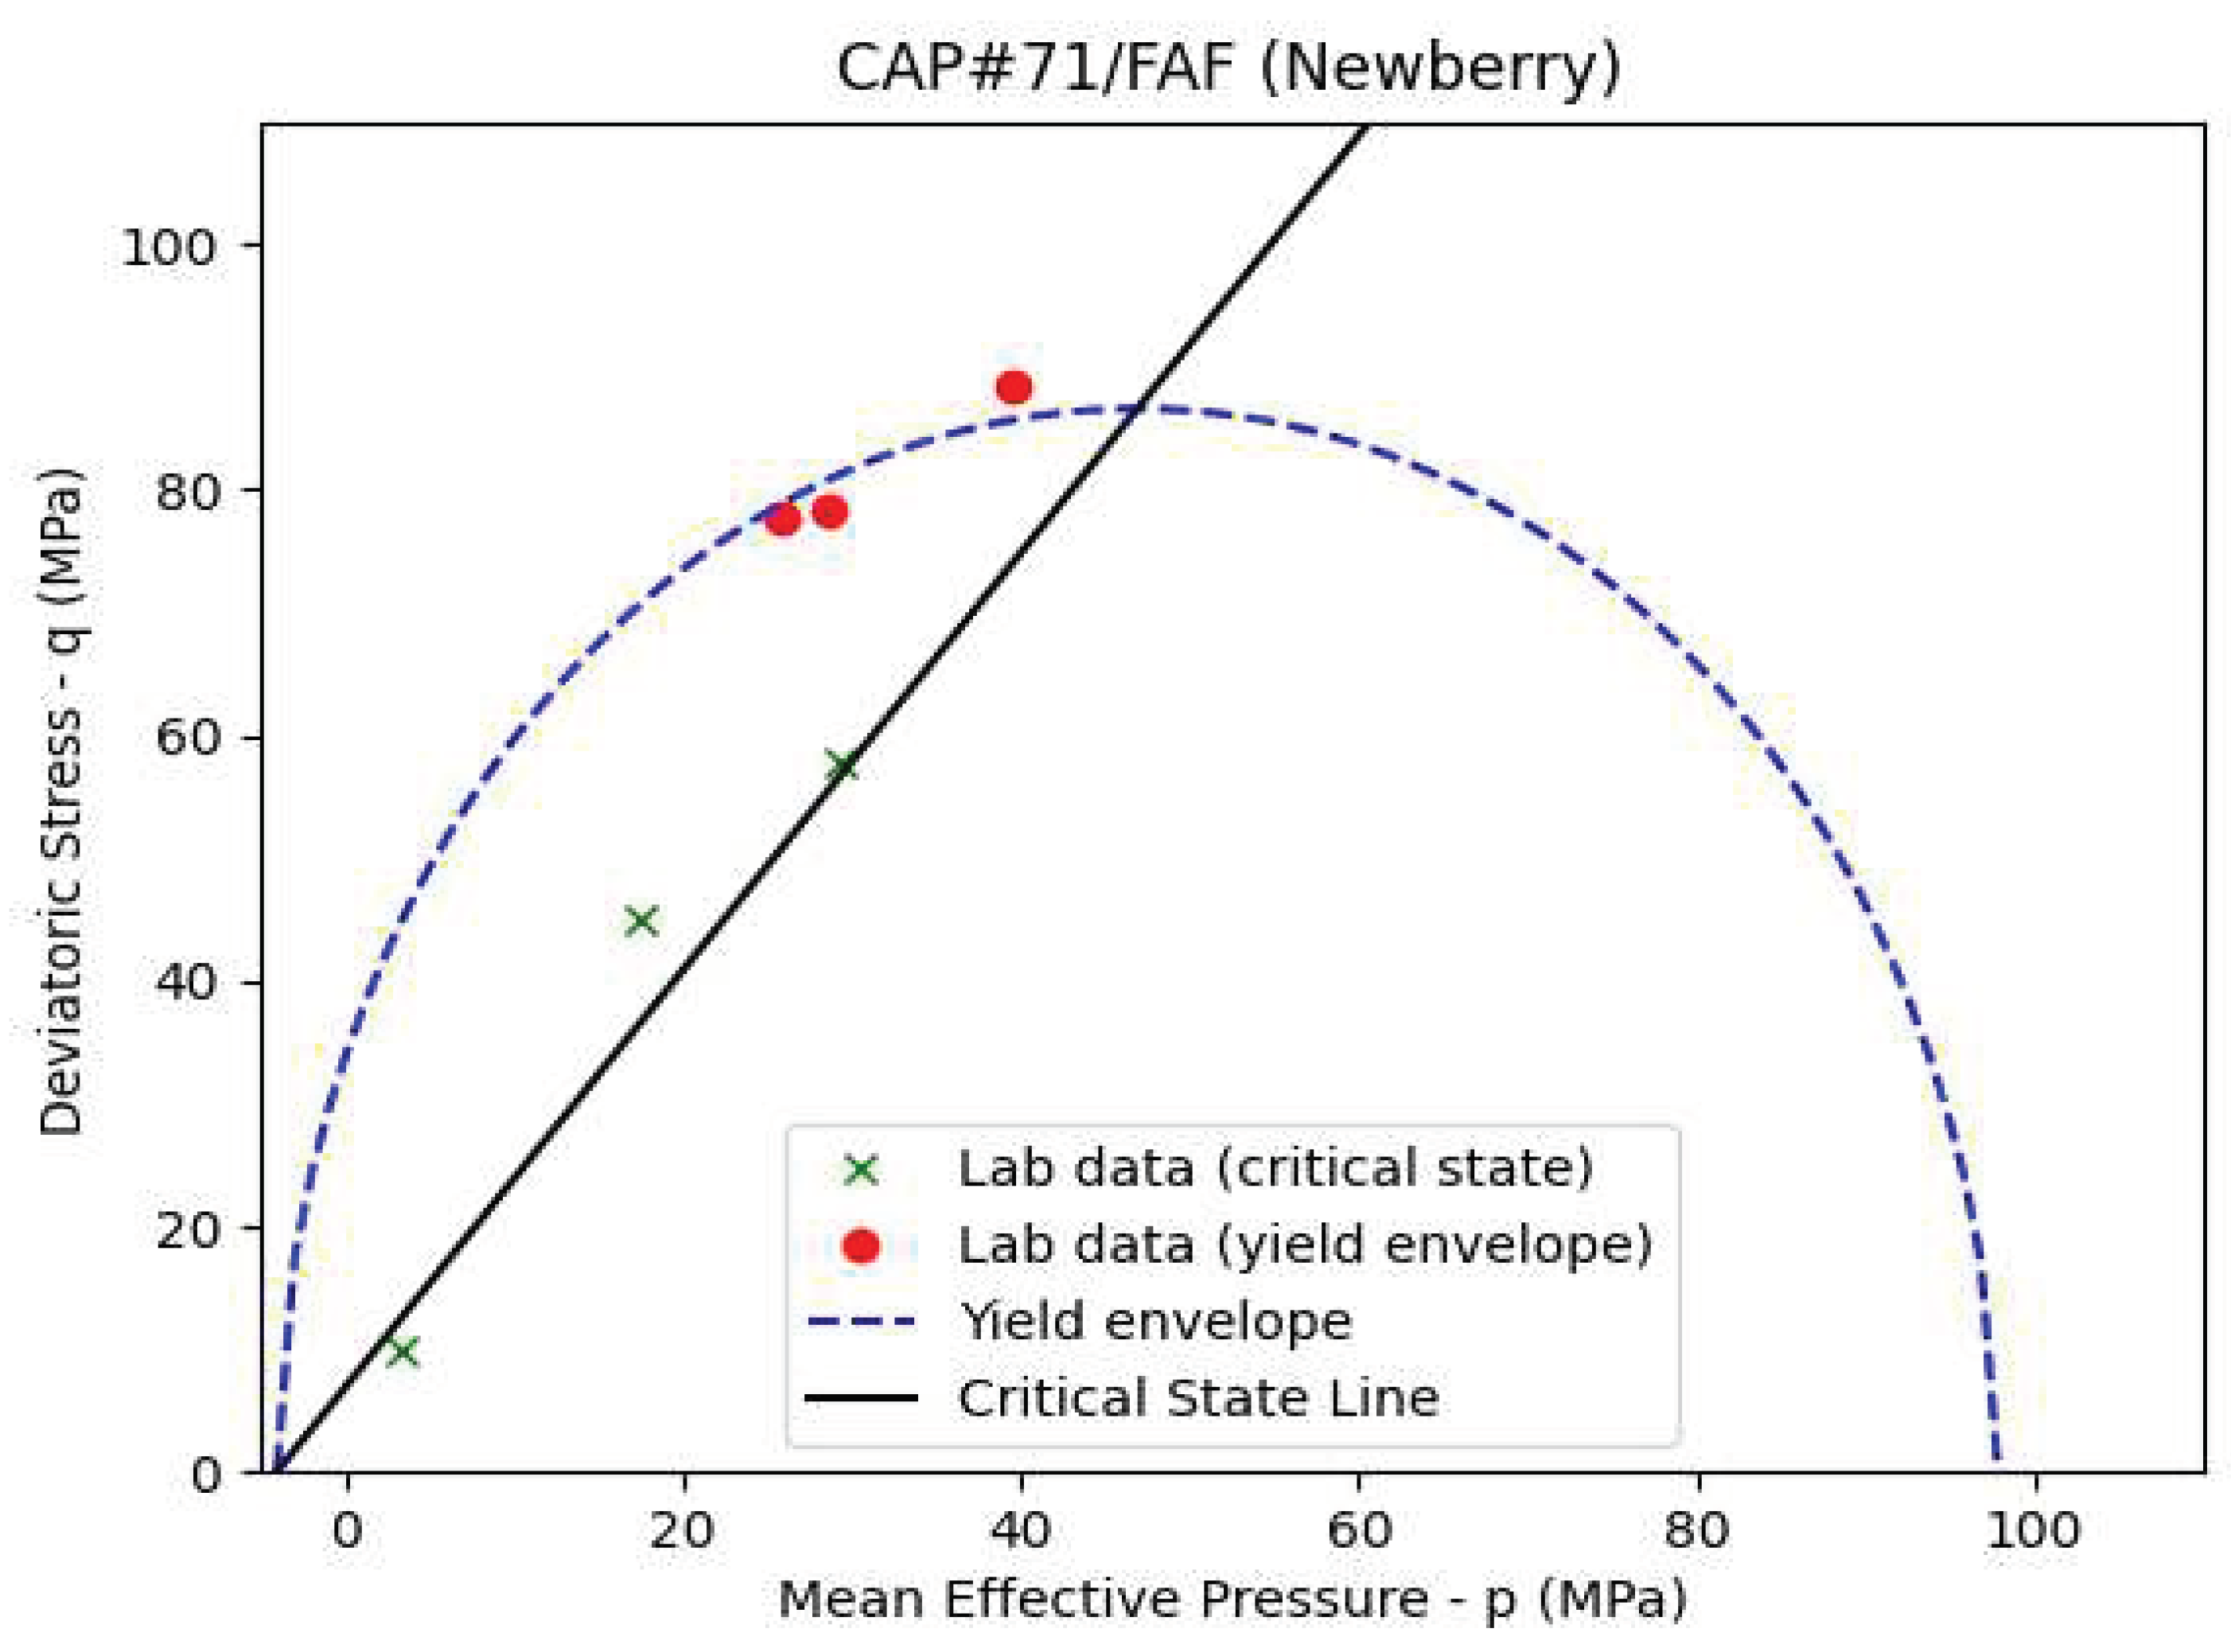
Figure 15.
Average plastic volumetric strain of the cement elements in the numerical model versus casing pressure.
Figure 15.
Average plastic volumetric strain of the cement elements in the numerical model versus casing pressure.
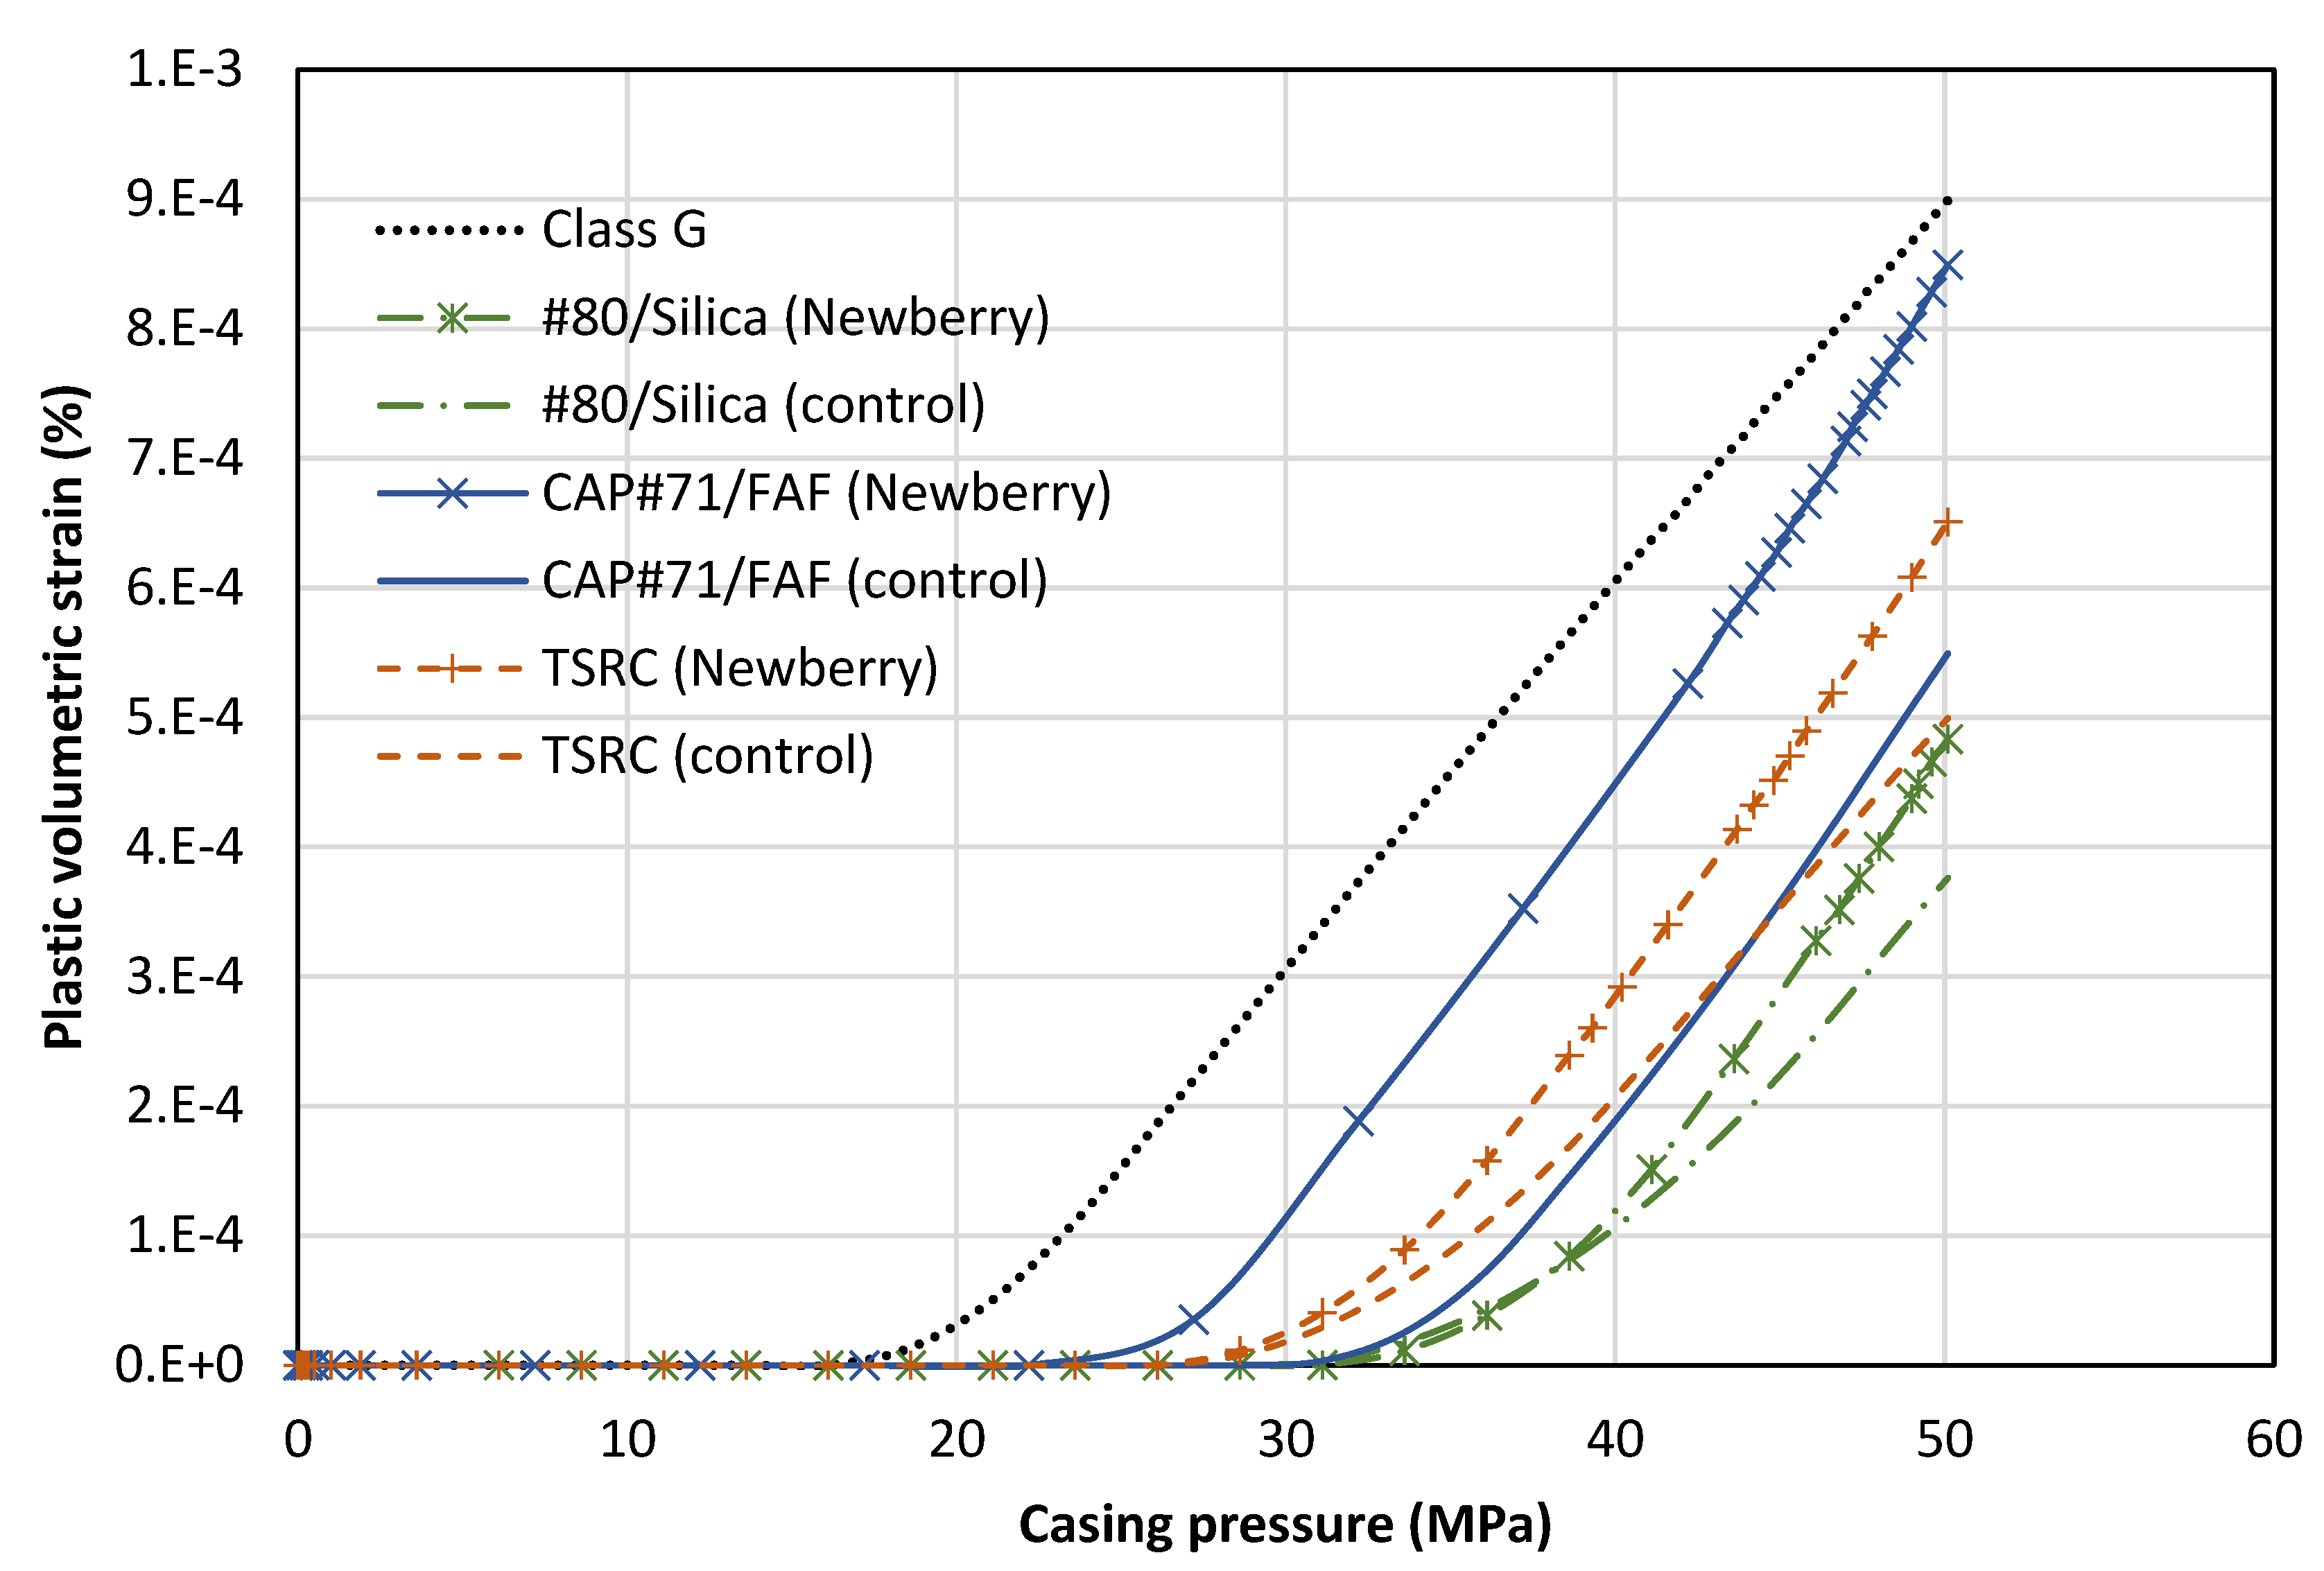
Figure 16.
XRD patterns of the reference CSH-60/40 sample (after 1 day autoclaving at 300 oC) and samples exposed in Newberry well for 3 or 9 months.
Figure 16.
XRD patterns of the reference CSH-60/40 sample (after 1 day autoclaving at 300 oC) and samples exposed in Newberry well for 3 or 9 months.
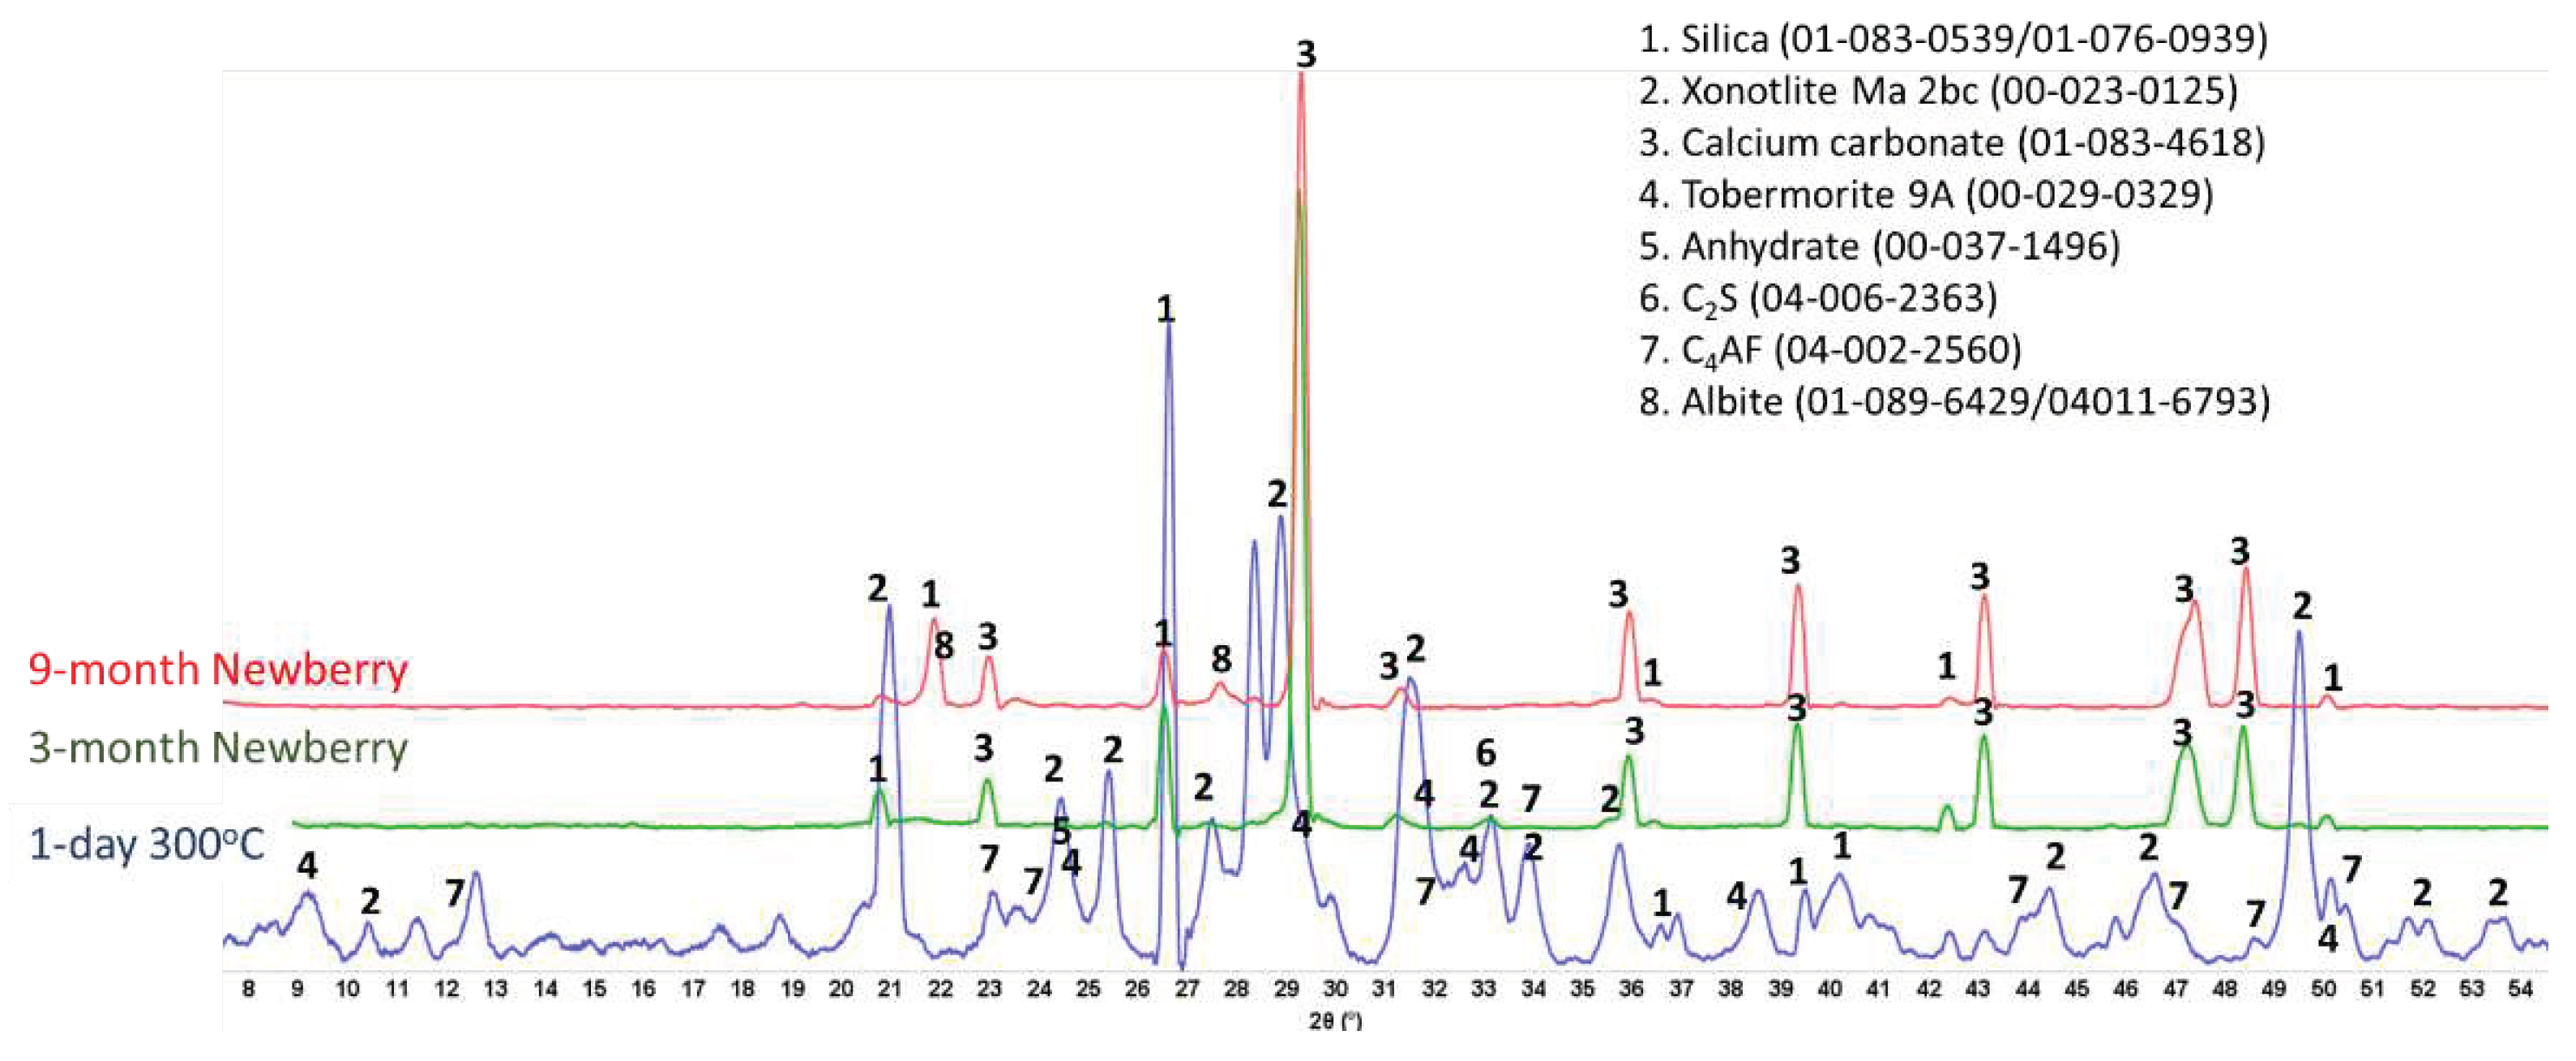
Figure 17.
TGA/DTG curves of the CSH-60/40 samples exposed in Newberry well for 3 months (left) or 9 months (right).
Figure 17.
TGA/DTG curves of the CSH-60/40 samples exposed in Newberry well for 3 months (left) or 9 months (right).
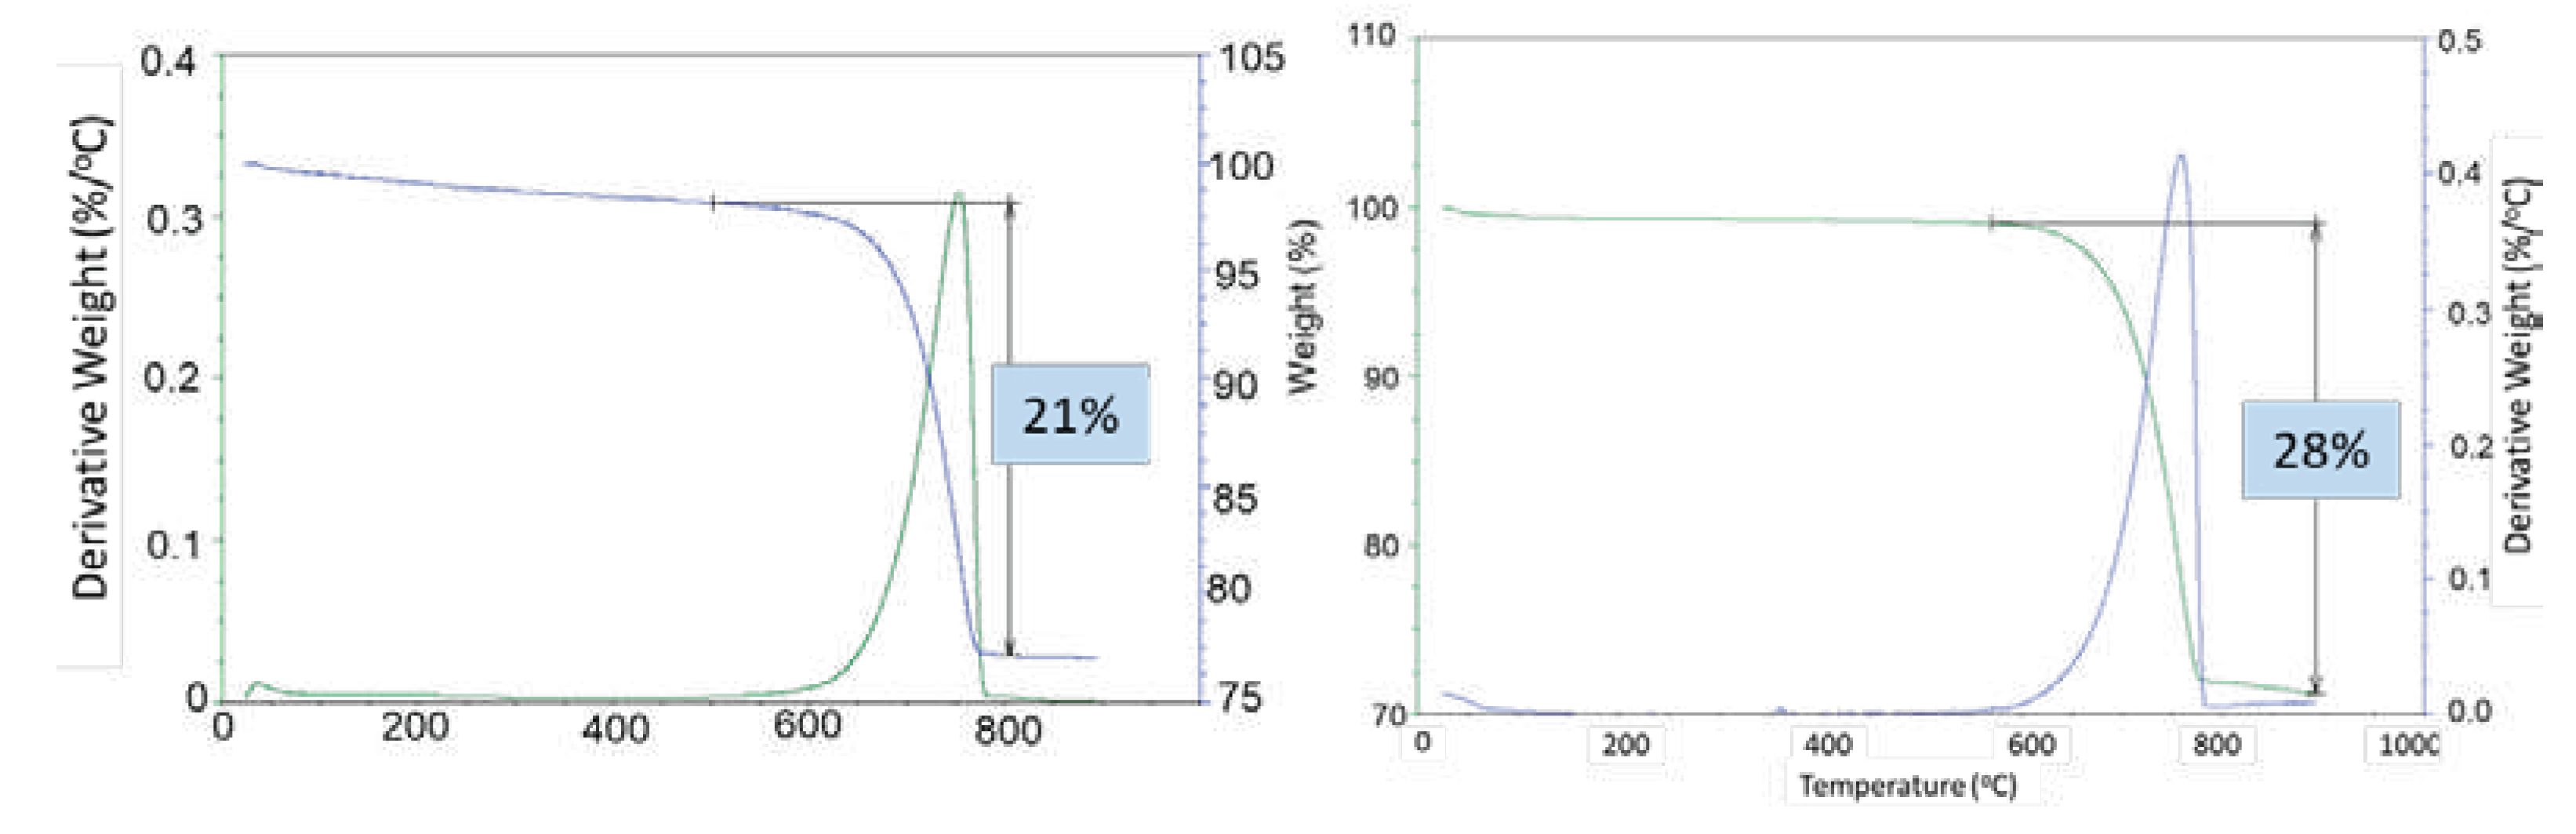
Figure 18.
Photomicrographs of CSH-60/40 samples exposed in Newberry well for 3 months (top) or 9 months (bottom).
Figure 18.
Photomicrographs of CSH-60/40 samples exposed in Newberry well for 3 months (top) or 9 months (bottom).
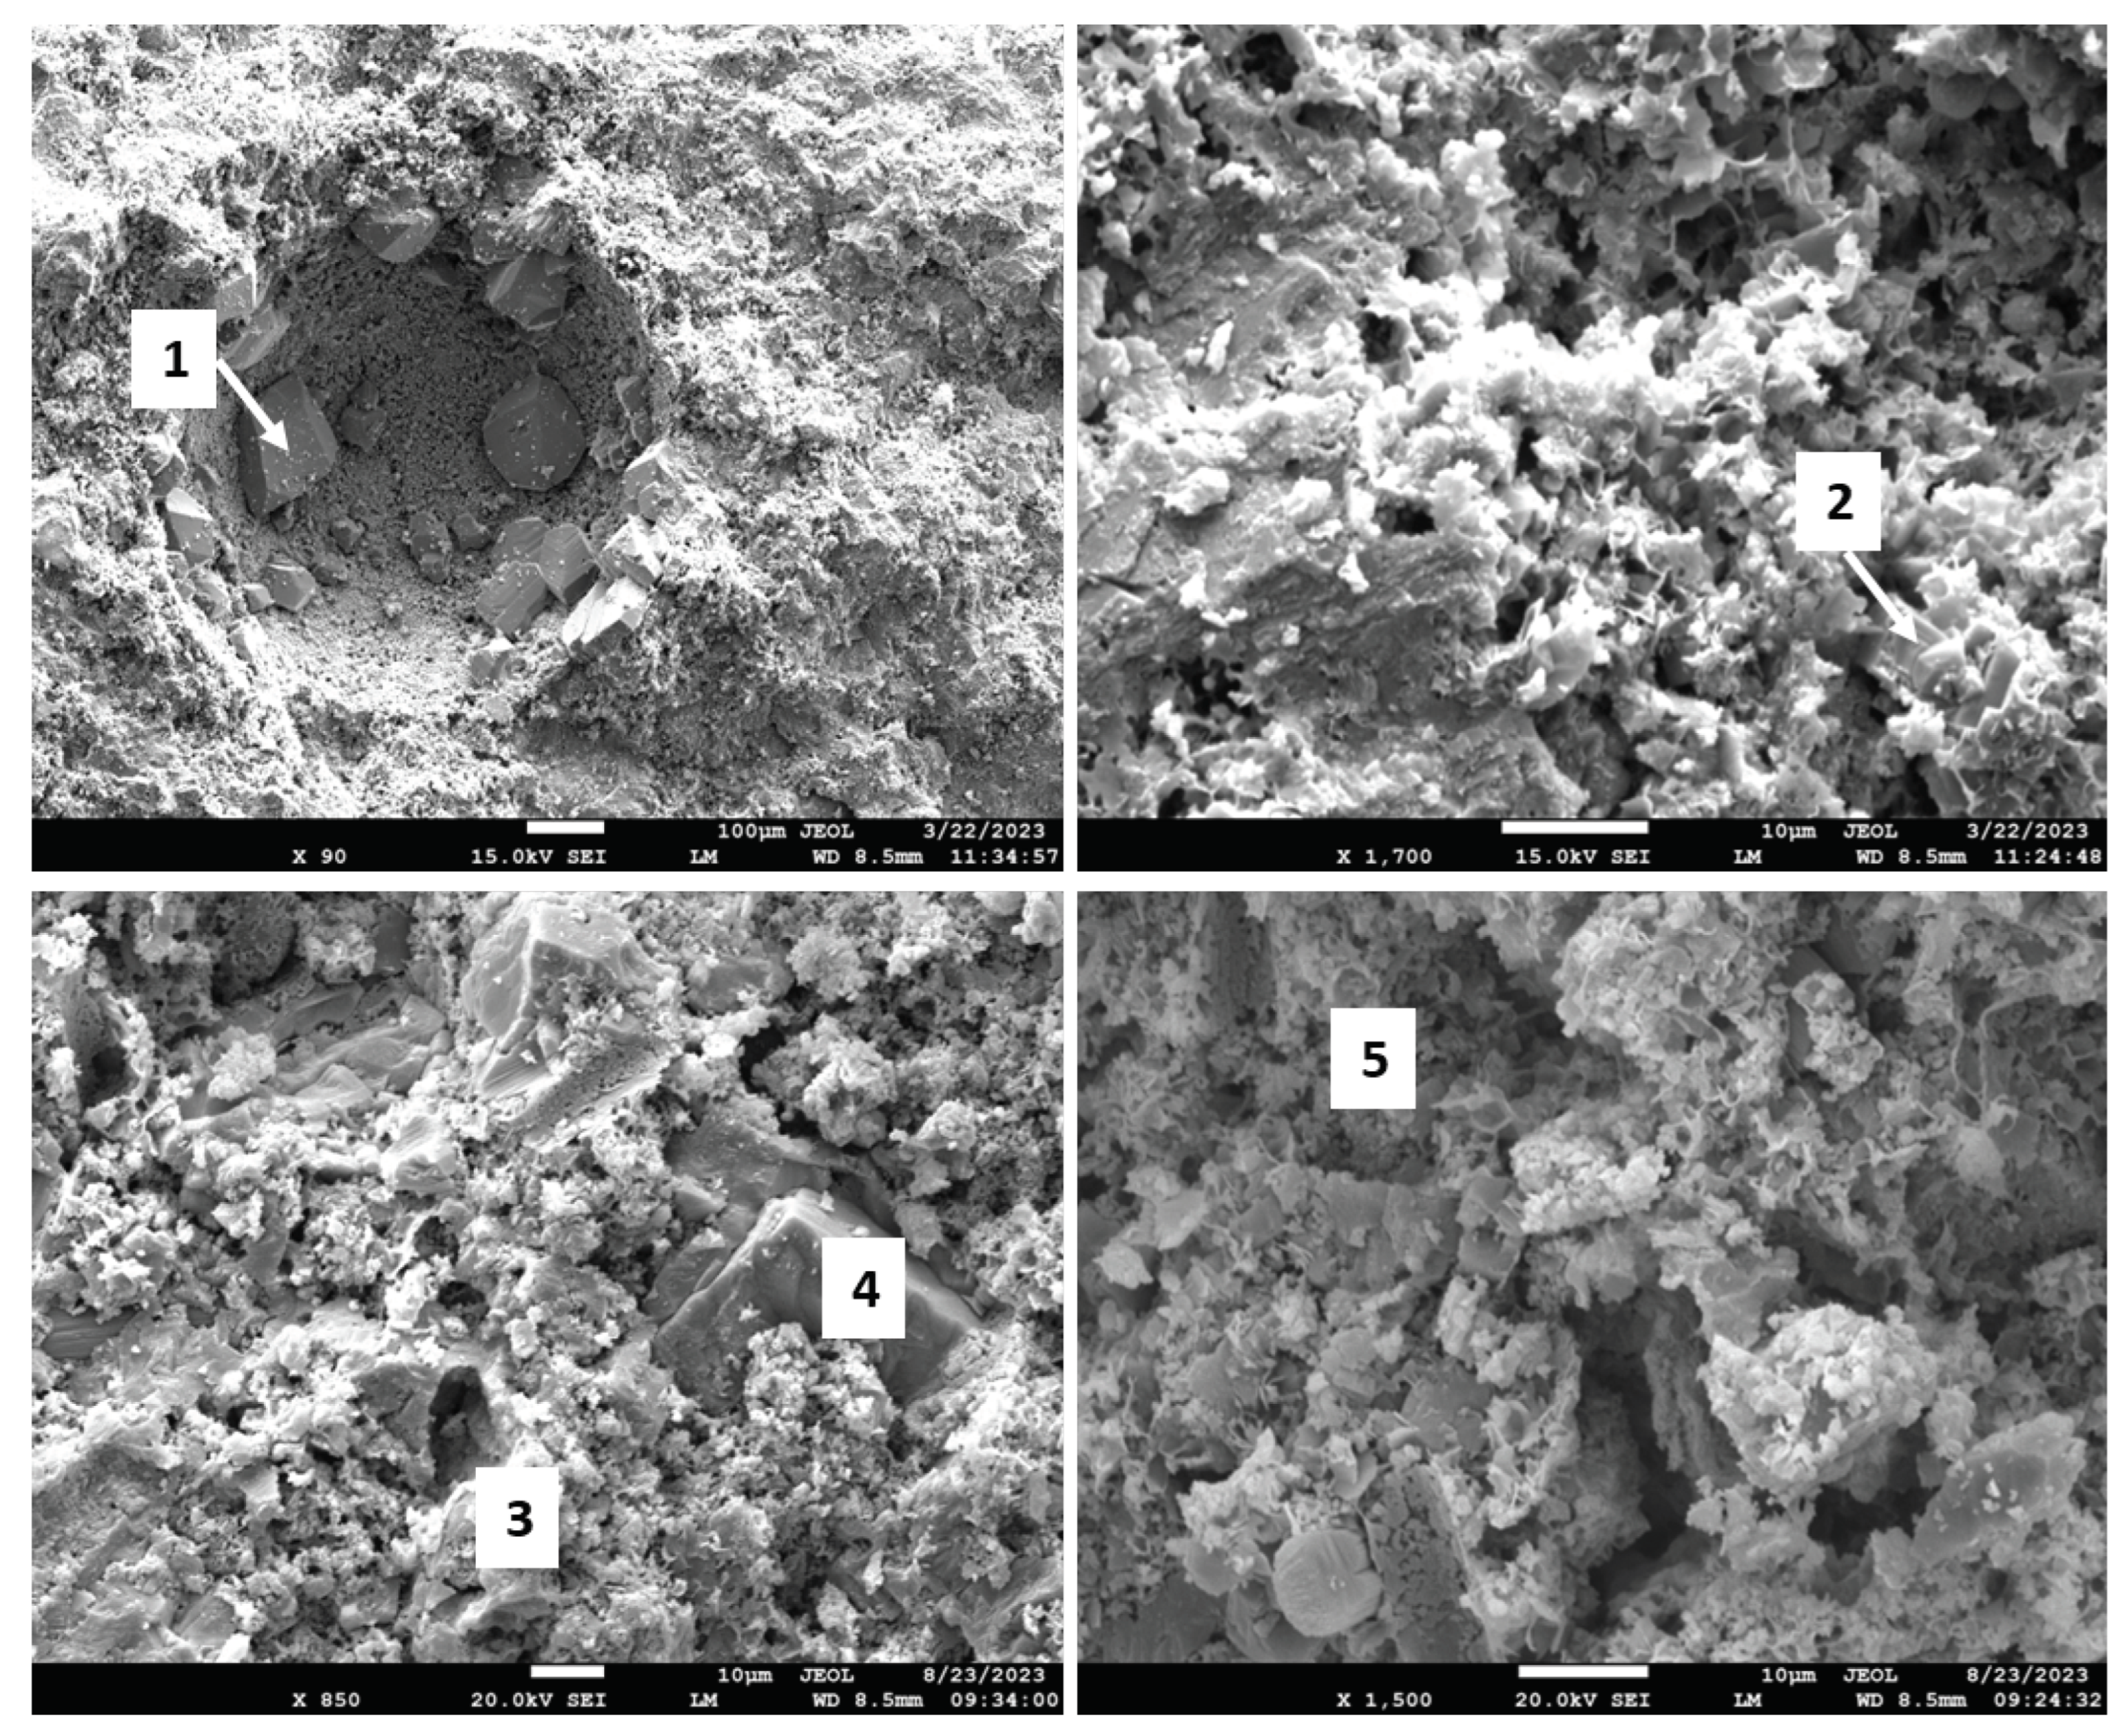
Table 1.
Cement formulations evaluated in this work. .
| Formulation | Composition (wt. %, activator % by weight of cement blend) |
|---|---|
| CSH-60/40 | OPC/SiO2 (60/40) |
| TSRC | CAC#80/FAF/SMS (60/40, SMS at 6%) |
| CAP#71/FAF | CAC#71/FAF/SHMP (70/30, SHMP at 6%) |
| CAP#71/Silica | CAC#71/ SiO2/SHMP (70/30, SHMP at 6%) |
| CAP#71/Silica/MK | CAC#71/FAF/MK/SHMP (60/30/10, SHMP at 6%) |
| CAP#50/FAF | CAC#50/FAF/SHMP (70/30, SHMP at 6%) |
| #71/Silica | CAC#71/SiO2 (60/40) |
| #80/Silica | CAC#80/SiO2 (60/40) |
| NAS-M1 | Gibbsite/SiO2/SMS (60/40, SMS and Zr at 5% each) |
Table 2.
Summary of input parameters used in the numerical model. .
| Parameter | Unit | Casing | Cement | Rock |
|---|---|---|---|---|
| Inner diameter | m | 0.0563 | 0.0603 | 0.0763 |
| Outer diameter | m | 0.603 | 0.0763 | 0.15 |
| Cement bond strength | MPa | 0.5 | - | 3 |
| Young’s modulus | GPa | 210 | Varies by formulation | 13.5 |
| Poisson ratio | - | 0.3 | Varies by formulation | 0.3 |
| Mohr coulomb friction | deg | - | - | 35 |
| Mohr coulomb cohesion | MPa | - | - | 13.3 |
Table 4.
Modified Cam-Clay parameters obtained for three formulations.
| Formulation | |||||
|---|---|---|---|---|---|
| MPa | MPa | - | - | - | |
| #80/Silica (Newberry) | 58.74 | 5.13 | 1.6 | 0.0154 | 0.0035 |
| #80/Silica (control) | 28.56 | 3.45 | 1.3 | 0.0435 | 0.01002 |
| CAP#71/FAF (Newberry) | 97.85 | 4 | 1.7 | 0.0109 | 0.0025 |
| CAP#71/FAF (control) | 102.84 | 4 | 1.7 | 0.0131 | 0.003 |
| TSRC (Newberry) | 40.88 | 4.91 | 1.5 | 0.0149 | 0.0034 |
| TSRC (control) | 25.51 | 4.08 | 1.3 | 0.0248 | 0.0057 |
Disclaimer/Publisher’s Note: The statements, opinions and data contained in all publications are solely those of the individual author(s) and contributor(s) and not of MDPI and/or the editor(s). MDPI and/or the editor(s) disclaim responsibility for any injury to people or property resulting from any ideas, methods, instructions or products referred to in the content. |
© 2024 by the authors. Licensee MDPI, Basel, Switzerland. This article is an open access article distributed under the terms and conditions of the Creative Commons Attribution (CC BY) license (http://creativecommons.org/licenses/by/4.0/).
Copyright: This open access article is published under a Creative Commons CC BY 4.0 license, which permit the free download, distribution, and reuse, provided that the author and preprint are cited in any reuse.


