

Submitted:
06 January 2024
Posted:
08 January 2024
You are already at the latest version
Abstract
The determination of the specific surface free energy, specific properties and Lewis’s acid base of solid materials is of capital importance in many industrial processes such as adhesion, coatings, two dimensional films and adsorption phenomena. (1) Background: The physicochemical properties of many solid particles were characterized during the last forty years by using the retention time of injected well-known molecules into chromatographic column containing the solid substrates to be characterized. The obtained net retention time of the solvents adsorbed on the solid allowing the determination of the net retention volume directly correlated to the specific surface variables, dispersive, polar and acid-base properties. (2) Methods: Many chromatographic methods were used to quantify the values of the different specific surface variables of the solids. However, one found a large deviation between the different results. In this paper, one proposed a new method that quantify the specific free energy of adsorption as well as the Lewis’s acid-base constants of many solid surfaces. (3) Results: The new applied method allowed us to obtain the specific enthalpy and entropy of adsorption of polar model organic molecules on several solid substrates such as silica, alumina, MgO, ZnO, Zn, TiO2 and carbon fibers. (4) Conclusions: our new method based on the separation between the dispersive and polar free surface energy allowed to better characterize the solid materials.
Keywords:
London dispersive energy
; polar energy of adsorption
; polar enthalpy and entropy of adsorption
; enthalpic and entropic Lewis’s acid base parameters
; separation distance between particles
; acid-base surface energy.
1. Introduction
Dispersion and polar interactions are the two important types of interactions between particles. The determination of these interactions is very used in the different domains of colloidal science, surface physics, adsorption, adhesion, adsorption, surface and interface. The dispersive interactions were studied and well-developed by Van der Waals. The corresponding forces, called Van der Waals forces, results from the temporary fluctuations in the charge distribution of the atoms or molecules; whereas, the polar forces or interactions include Coulomb interactions between permanent dipoles and between permanent and induced dipoles. The total interaction energy is the sum of the dispersive and polar interaction energies. The separation of these two types of energy is crucial to understand the behavior of molecules and therefore to predict the various surface physicochemical properties of materials and nanomaterials.
Since 1982, many scientists proposed several methods to separate the dispersive (or London) and polar (or specific) interactions between a solid substrate and a polar molecule. The first attempt for the separation of the two above contributions was proposed by Saint-Flour and Papirer [1-3] when studying untreated and silane-treated glass fibers by using inverse gas chromatography (IGC) and choosing a series of polar and non-polar adsorbates to quantify the dispersive and polar free energies. The authors adopted the concept of the vapor pressure of the adsorbates to determine the specific free energy of adsorption of polar molecules on glass fibers as a function of the absolute temperature T by plotting the variations of versus the logarithm of the vapor pressure of probe, where is the net retention volume and R the ideal gas constant. Saint-Flour and Papirer [3] determined the specific enthalpy and entropy of polar molecules adsorbed on the glass fibers and deduced their Lewis acid-base constants. Later, Schultz et al. [4] tried to separate the two dispersive and specific interactions of carbon fibers by using the concept of the dispersive component of the surface energy of the organic liquids by drawing of as a function of of n-alkanes and polar molecules adsorbed on the solid, where a is the surface area of adsorbed molecule and the Avogadro’s number. This method allowed to obtain the specific free energy and the dispersive component of the surface energy of carbon fibers. In 1991, Donnet et al. [5]. used the deformation polarizability of solvents and obtained the specific free energy of polar solvents adsorbed on natural graphite powders by representing the variations of as a function of , where is the electronic frequency of the probe and h the Planck’s constant. With the difficulties and issues encountered with the previous methods, Brendlé and Papirer [6,7] used the topological index , derived from the well-known Wiener index to obtain more accurate results. Other methods were also used in literature such as that the boiling point [8] and the standard enthalpy of vaporization [9]. In all the above methods, one obtained an excellent linearity of of n-alkanes as a function of the chosen intrinsic thermodynamic parameter (, , , or ). The specific free potential of polar molecule is then directly obtained by the distance the point representing the polar molecule to its hypothetic point located on the n-alkane straight-line. The specific enthalpy and entropy of adsorbed polar solvents as well as the Lewis acid base constants can easily deduced by thermodynamic considerations. The serious problem encountered in these different chromatographic methods that the obtained
One proved in several previous studies the non-validity of the method used by Schultz et al. due to the variations of the surface area a and of solvents as a function of the temperature [10-14]. The values of the surface area of organic molecules versus the temperature obtained on a certain solid material [10-14], cannot be always transferred to another solid, because of the different behaviors existing between the various solid surfaces and the adsorbed moleules.
The used chromatographic methods, even if they satisfied linear relations for n-alkanes adsorbed on solid surfaces, cannot be necessarily considered as accurate if they are not theoretically well-founded. One proved in previous paper [11,12] that the linearity of of n-alkanes is satisfied for more than twenty intrinsic thermodynamic parameters and one concluded on the necessity to find new methods that are theoretically valid. Given the disparity of the results obtained from the application of the various methods, one privileged, in this paper, the method based on the equation of the London dispersive interaction [15] between the solvents and the solid materials. By using the London equation (15], one proposed in this study to determine the dispersive free energy , the specific free energy , the Lewis acid-base constants and the polar acidic and basic surface energy of several solid materials such as silica (SiO2), alumina (Al2O3), magnesium oxide (MgO), zinc oxide (ZnO), Monogal-Zn, titanium dioxide (TiO2) and carbon fibers.
2. Methods and models
Inverse gas chromatography (IGC) technique [16-24] was used in this study to characterize the surface properties of the above solid surfaces. IGC allowed us to obtain the net retention time and therefore the net retention volume of the various solvents adsorbed on the different solid materials. This allowed to obtain the free energy of adsorption of the adsorbed molecules by using the following fundamental equation of IGC:
where is a constant depending o the temperature ad the parameters of interaction between the solid and the solvent.
The total free energy of adsorption is composed by the two dispersive and polar contributions of the total interaction energy:
The free dispersive energy between two non-identical materials was given by London [15]:
where and are the respective deformation polarizabilities of molecules 1 and 2 separated by a distance , and
the ionization energies of molecules 1 and 2, and their characteristic electronic frequencies and the permittivity of vacuum.
By denoting S the solid molecule 1 and X the probe molecule 2 and combining the previous equations (1-3), one obtained equation (4):
The thermodynamic parameter chosen as new indicator variable in this original contribution is given by relation (5):
Indeed, the London dispersion interactions strongly depend on the deformation polarizability of the organic molecules and on the ionization energies of the solid and the solvents, because the approximation is not always valid and it depends on the product of the ionization energies . To avoid any source of errors on the determination of the London dispersive and polar energies, one privileged to use the true values of the ionization energies and not the approximation of the geometric mean.
Now, by drawing the variations of of n-alkanes adsorbed on the solid material as a function of at a fixed temperature T, one obtained the linear equation given by (6):
where is the slope of the n-alkanes straight line given by (7):
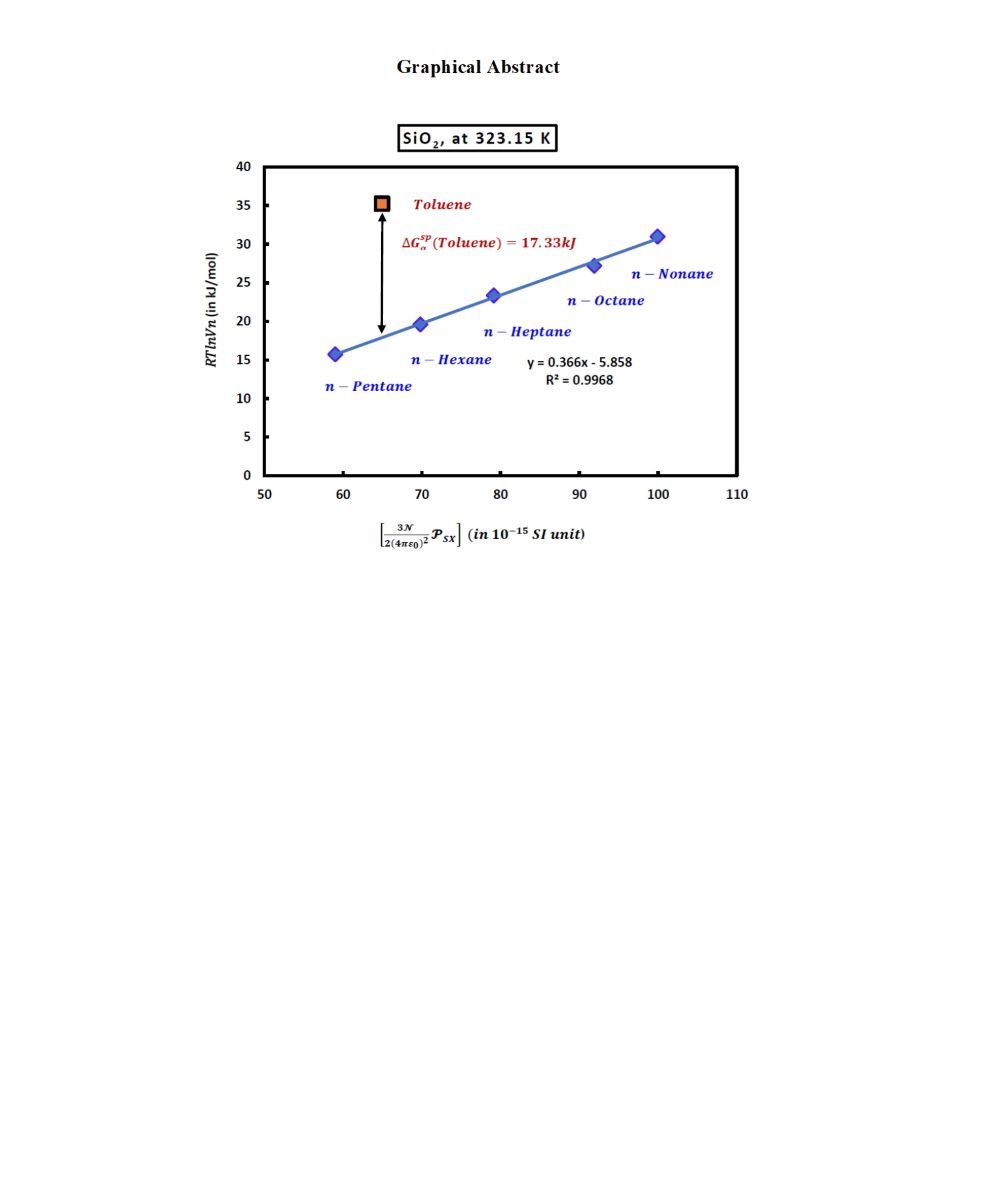
In the case of adsorbed polar organic molecule such as toulene, the distance between its representative point given by and the straight-line of n-alkanes shown on Figure 1, allowed to obtain the polar free energy (London dispersion interaction).
The numerical value of the London dispersion interaction of toluene (in kJ/mol) adsorbed on silica particles is given by the following equation
Experimental results gave at 323.15K:
And one obtained at this temperature the value of the specific free energy of toluene from (8):
By varying the temperature, the calculations allowed to determine the variations of of polar probes as a function of the temperature and obtain the specific enthalpy and entropy of the various polar probes adsorbed on the solid surfaces from equation (11):
And then to deduce the Lewis’s acid base constants KA and KD by equation (12):
where AN and DN are respectively the electron donor and acceptor numbers of the polar molecule. These numbers were calculated by Gutmann [25] and corrected by Fowkes [26].
By using the representation and equation (13):
The slope of the straight-line gave the acidic constant , whereas, the basic constant is obtained by the ordinate at origin of the straight-line given by equation (13).
However, in many cases, one proved that equation (13) is not verified and one previously proposed another relation taking into account the amphoteric effect of the solid material [27].
where is the coupling constant representing the amphoteric character of material.
Equation (14) can be written as:
By considering a polar molecule symbolized by and putting:
One can write the general equation (17) representing any polar molecule in interaction with solid surfaces:
where , and are experimentally well-known, whereas, , and are the unkown quantities of the problem (17).
For n polar molecules (), the solution of the linear system (17) can be obtained by the least squares method by finding the vector that minimizes the sum of the squares of the residuals.
In this case, The system of equations (17) will be transformed to a linear system represented by the following equations:
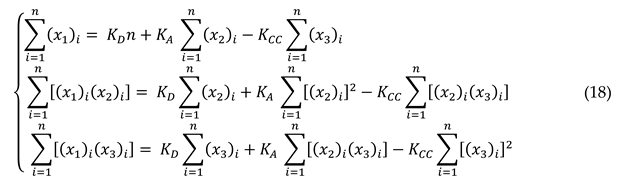
Equations (18) can be represented by the following matrix system
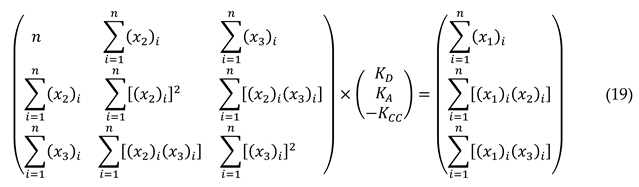
Symbolized by the matrix equation:
The matrix equation is inversible because the matrix is symmetric and then there is a unique solution given by the formal equation (21):
Our method was used in all solid materials that did not satisfy the classic equation (13).
In this study, one also determined the Lewis entropic acidic and basic parameters to obtain the Lewis entropic acid base character of the solid materials. The equations (22) and (23) were given by analogy that of the Lewis enthalpic acid-base constants and :
or
3. Materials and solvents
One used in this paper several solid materials such as silica (SiO2), alumina (Al2O3), magnesium oxide (MgO), zinc oxide (ZnO), Monogal-Zn, titanium dioxide (TiO2) and carbon fibers that were characterized in previous papers [10-14] with other chromatographic methods and molecular models. The organic solvents such as n-alkanes and polar molecules were those previously used in other studies. The donor and acceptor numbers of electron used in this paper were those calculated and corrected by by Riddle and Fowkes [26]. The chromatographic measurements were obtained from a Focus GC Chromatograph equipped with a flame ionization detector of high sensitivity. All experimental methods on this technique were previously explained in details in previous papers [10-14].
4. Results
4.1. New approach for the calculation of the deformation polarizability and the indicator parameter
Our new approach previously presented allowed us to obtain all necessary parameters of organic solvents and solid substrates by using their values taken from the Handbook of Physics and Chemistry [28]. The obtained results are presented below on Table 1, Table 2, Table 3, Table 4, Table 5, Table 6, Table 7 and Table 8.
The new values of the various parameters given in Table 1, Table 2, Table 3, Table 4, Table 5, Table 6, Table 7 and Table 8 were used in our new method to give the new values of London dispersive and polar energies of the various solid materials.
In this new approach, one gave more precise values of the parameters of molecules such as the deformation polarizability and the harmonic mean of the ionization energies of solids and organic solvents in contrary of those proposed by Donnet et al. [5] that only took the characteristic electronic frequencies of the probes independently of those of the solid. Indeed, Table 2 to 8 clearly showed that the harmonic mean of the ionization energies of the solvents varied as a function of the used solid material.
To show the difference between our values and those of Donnet et al. [5], one presented on Table 9 the values of the deformation polarizability of some polar molecules and two n-alkanes.
Table 9 showed that the values relative to some solvents such as n-decane, dichloromethane and methanol and those of solid particles are not given by Donnet et al. The relative error reaches 10% that can have negative effect on the determination of the specific free energy.
Now, if one adds the error committed by Donnet et al. [5] when neglecting the variations of the harmonic mean of ionization energies for the various polar molecules that vary from 20% to 70%. Indeed, this parameter varies from a solid surface to another solid material. The variation in the value of of organic molecules between two solids can reach 70% in certain cases such as ZnO and TiO2 (Table 4 and Table 7).
4.2. London dispersive surface energy of solid particles by using thermal model
The thermal model [10-14] was used to determine the London dispersive surface energy of the various solid materials used in this study. This model took into consideration the effect of the temperature on the surface area of organic molecules. The obtained results are presented on Table 10 at several temperatures.
Table 10 showed that the various solid surfaces can be classified with increasing order of their London dispersive surface energy as following:
Oxidized carbon fibers < Untreated carbon fibers < MgO < ZnO < Al2O3 < Monogal-Zn < SiO2
The highest London dispersive surface energy was obtained by the silica particles. One also observed that the dispersive surface energy of the two carbon fibers are very close, and silica and monogal surfaces exhibited close values of . Furthermore, the linearity of was assured for all materials with an excellent linear regression coefficients approaching 1.000 (Figure 2).
4.3. Polar surface interactions between solid materials and organic molecules
By using our new method and new findings presented in section 3, one determined the values of the polar free surface energy () of the various polar solvents adsorbed on the various solid particles as a function of the temperature T. The results were given on Table 11.
Table 11 clearly showed the amphoteric behavior of the various solid surfaces with different acid-base interactions depending on the number of the surface group sites present on the solid particles. Table 11 led to classify the polar solvents, for each solid surface in increasing order of the polar free surface energy of interaction.
In the case of silica particles, one obtained the following order:
Ethyl Acetate < CCl4 < Acetone < Nitromethane< Toluene < CHCl3 < CH2Cl2 < Diethyl ether < THF
Proving a strong interaction with the acidic organic molecules and lower for the basic solvents and therefore concluding to more basic behavior.
In this case of MgO, the obtained order was:
CH2Cl2 < CHCl3< Ethyl acetate < Diethyl ether < Acetone < Tetrahydrofuran
That showed a behvior rather amphoteric.
For ZnO, one also observed a strong amphoteric character:
Benzene < CHCl3 < CH2Cl2 < Ethyl acetate < Diethyl ether < Tetrahydrofuran
The amphoteric character was proved for monogal-Zn particles:
CH2Cl2 < Ethyl acetate < CHCl3< Diethyl ether < Acetone < Tetrahydrofuran
For alumina, one obtained the following order:
CCl4 < CH2Cl2 < Ethyl acetate < Diethyl ether < CHCl3 < Toluene < Tetrahydrofuran
In case of TiO2:
CH2Cl2 < CHCl3< Ethyl acetate < Acetonitrile < Benzene < Acetone < THF < nitromethane
For untreated carbon fibers:
CCl4 < Diethyl ether < CH2Cl2 < Benzene < Ethyl acetate < Tetrahydrofuran
and the oxidized carbon fibers presented an amphoteric character:
CCl4 < Diethyl ether < Benzene < CH2Cl2 < CHCl3 < Benzene < Ethyl acetate < THF< Acetone
In order to compare the behavior of the various solids as a function of the different polar solvents, one plotted on Figures 3 the variations of () of the various polar molecules as a function of the temperature.
The results on Figures 3 showed different behaviors of the various solid surfaces in interaction with the polar molecules. One gave the classification of these solid materials in increasing order of their polar free energies with the different polar solvents:
- o with CCl4: alumina < untreated carbon fibers < oxidized carbon fibers < silica
- o with CH2Cl2, Monogal-Zn < ZnO < TiO2 < MgO < untreated carbon fibers < alumina < oxidized carbon fibers < silica
- o with CHCl3, ZnO < MgO < oxidized carbon fibers < untreated carbon fibers < Monogal-Zn < silica < alumina
- o with diethyl ether, untreated carbon fibers < oxidized carbon fibers < ZnO < MgO < Monogal-Zn < alumina < silica
- o with tetrahydrofuran, TiO2 < untreated carbon fibers < ZnO < oxidized carbon fibers < MgO < Monogal-Zn < silica < alumina
- o with ethyl acetate, TiO2 < ZnO < silica < MgO < untreated carbon fibers < alumina < monogal-Zn < oxidized carbon fibers
- o with acetone, TiO2 < silica < untreated carbon fibers < MgO < oxidized carbon fibers
These results proved that alumina, silica and oxidized carbon fibers exhibited stronger interactions with the acidic and basic molecules then showing their higher amphoteric character than the other solid substrates.
4.4. Lewis’s ethalpic and entropic acid base parameters
By using the results of given on Table 11 and Figures 3, one determined from equation (11), the different values of the polar enthalpy ( and entropy ( of adsorption of the various polar molecules on the solid surfaces. The results were presented on Table 12.
Table 12 also showed a difference in the behavior of the various solid surfaces in interaction with acidic, basic and amphoteric polar solvents. In order to qunatify the acid-base constants of the solid materials, one used equations (13) and (23). The obtained values of Lewis enthalpic acid base constants and and Lewis entropic acid base constants and of the different solid particles were presented on Table 13. The comparison of the acid-base behavior of the different solid materials allowed to classify them in decreasing order of acidity and basicity.
For the acidity, one obtained the following classification:
Silica > alumina > Monogal-Zn > TiO2 > ZnO > oxidized carbon fibers > untreated carbon fibers > MgO
Whereas, the comparison between their basicity led to give the following order:
Oxidized carbon fibers > alumina > untreated carbon fibers > ZnO > Monogal-Zn > Silica > MgO > TiO2
By comparing the various solids in decreasing order of their ratio /, on found the following classification:
Oxidized carbon fibers > untreated carbon fibers > MgO > ZnO > TiO2 > alumina > Monogal-Zn > Silica
The last classification seems to be very interesting, because the oxidization of carbon fibers will increase the polar surface groups and therefore their basicity, in contrary to the behavior of silica that exhibits higher acidity than the other solid surfaces.
However, when we observed the linear regression coeffcients given on Table 13, one found that the liearity of equations (13) and (23) are not satisfied for most of the solid surfaces. In such case, a correction has to be executed. To do that, one used equation (17) and resolved the linear system with three unkown numbers. The solution was perofrmed for all solids except for titanium dioxide that presented an excellent linear regression coefficient. The more results were given on Table 14.
Table 14 gave the corrected values of the acid-base constants with an additional constant called coupling constant reflecting the amphoteric character of materials.
One obsrved that the classification of acidity of different solid materials was conserved after correction, however it was changed for the basicity. One found the following classification of solid surfaces in decreasing basicity:
Oxidized carbon fibers > silica > monogal-Zn > untreated carbon fibers > alumina > ZnO > TiO2 > MgO
It was proved that the oxidized carbon fibers exhibited the strongest basicity, whereas, silica had the highest acidity. It was also showed the MgO presented more neutral surface with small basic tendency.
4.5. Consequences of the application of the new method
The first scientific result of the application of the new parameter relative to the interaction between solids and organic molecule was the separation between the London dispersive energy and the polar free energy of the adsorption of polar organic molecules and solid surfaces. It is the first time that we were able to calculate exactly the two contributions of the free surface energy of interaction. Equation (6) was perfectly applied for all solids and solvents with an excellent linear regression coefficient approaching 1.000 and the determination of the slope of the straight line given by equation (6) in the case of n-alkanes adsorbed on solid surfaces conducted to calcule the London dipersive energy of interaction not only for n-alkanes, but also for polar organic solvents by using the following relation
With this new approach, one characterized all studied solids by giving on Tables S1 to S16, the two London dispersive and polar free energies of interaction between solids and organic molecules. This also allowed to obtain the total free surface energy of adsorption without calculating the surface specific area of the considered solid materials.
The second consequence was to clearly verify the insufficiency of the approach proposed by Donnet et al. [5]. Indeed, if we applied their method on silica particles, one obtained the values of () of polar solvents adsorbed on silica surfaces. These results compared to our new findings were presented on Table 15.
The results on Table 15 clearly showed a large difference between the values obtained by the two above methods. The calculation of the ratios , and given on Table 16 showed a surestimation of the values of obtained by Donnet et al. method varying from 1.3 to 7.7 times the values obtained by our new method. Whereas, in the calculation of the specific entropy and enthalpy, Table 16 showed ratios varying from 3.1 to 23.7 strongly depending on the adsorbed polar molecule. However, one globaly found a ratio approaching 2 for most of polar molecules.
These large variations of the values obtained by applying Donnet et al. method is certainly due to the fact that this method omitted the variation of the harmonic mean of the ionization energies of the solid and the adsorbed polar solvent given by relation (25).
Donnet et al. used the concept or . The variations of is not identical to those of of the interaction solid-polar molecule as it was shown by Table 17.
It was observed on Table 17 that the harmonic mean strongly depend on the interaction between the solid and the polar solvent and cannot be considered as constant for all studied materials as was supposed by the method proposed by Donnet et al.
The third consequence of our new approach was the determination of the average separation distance H between the solid particle and the organic moolecule as a function of the temperature when the deformation polarizability of the solid is known. By using equation (7) and the experimental results, one gave on Table 18 the values of the average separation distance H at different temperatures for the various solid substrates.
Table 18 showed that the average separation distance H is comprised between 4.45 Å and 5.56 Å for the various solid particles. A slight increasing effect of the temperature on the separation distance was observed in all studied solid substrates. Furthermore, one observed that the separation distance between a solid and an organic molecule is an intrinsic parameter of the solid. Table 18 allowed to classify the various solid materials in increasing order of the separation distance for all temperatures:
Untreated carbon fibers Oxidized carbon fibers > ZnO > alumina > Monogal-Zn > Silica > MgO > TiO2
This classification is very close to that obtained with the basicity of solid materials. It seems that when the basicity or the ratio / decreases, the separation distance slightly increases to reach a maximum value with TiO2 equal to 5.50 Å.
The fourth consequence of this new method was to be able to give with more accuracy the values of the acid-base surface energy of the various solid materials. Indeed, by applying Van Oss et al. relation [29] that gave the specific enthalpy of adsorption as a function of the Lewis acid surface energy of the solid surface and the solvent ; and the corresponding Lewis base surface energy ( for the surface and for the solvent) by equation (26)
By choosing two monopolar solvents such as ethyl acetate (EA) and dichloromethane characterized by:
The Lewis’s acid and base surface energies of a solid surface and can be obtained from relations (26) and (27):
The experimental values of free specific energy of ethyl acetate and dichloromethane given in Table 19, one determined the values of the specific acid and base surface energy contributions , as well as the acid-base surface energy given by relation (29):
By using the values given on tables 10 and 19, and relation (29), one presented on Table 20 the Lewis’s acid and base surface energies of solid particles , , and the total surface energy of the various solid materials. The total surface energy of the solid surfaces was obtained by using relation (30):
The values of the dispersive surface energy of the different solid materials were taken from table 10.
The values of the different acid-base surface energies of the various solid substrates given on Table 20 showed that the oxidized carbon fibers and the silica particles gave the highest values of , and followed by alumina particles and monogal-Zn surfaces, whereas, the oxidized carbon fibers and alumina surfaces gave larger values of again confirming the highest acid-base properties of these materials. The determination of the ratio of the solid materials showed that this ratio varies from 12% for ZnO particles to reach 70% for the oxidized carbon fibers and about 50% for silica and alumina surfaces. This clearly proved the strong contribution of acid-base surface energy relative to the corresponding London dispersive energy.
5. Conclusions
A new method of separation of London dispersive and polar surface energy was proposed by using the inverse gas chromatography technique (IGC) at infinite dilution. The parameter of polarizability of organic molecules adsorbed on eight different solid materials was used to propose a new parameter taking into account all terms involved in the expression of London dispersive energy of interaction. The originality of this new method concerned the full determination and use of a new intrinsic thermodynamic parameter reflecting the London dispersive energy of interaction between solid materials and organicmolecules. One calculated the parameter for different materials and organic molecules. Experimental results obtained by IGC allowed to determine the average separation distance solid-organic solvents at different temperatures. The dispersive free energy and the polar energy of n-alkanes and polar probes were determined by this method. The thermal model was used to quantify the London dispersive surface energy of the various solid materials at different temperatures and allowed to determine the different components , and of acid-base surface energies of solid particles as well as their total surface energy . Results showed the highest acid-base surface energy was obtained by the oxidized carbon fibers followed by silica particles and alumina surfaces.
The determination of the polar interaction energy of the different polar molecules adsorbed on the solid materials allowed to obtain the polar enthalpy and entropy of interaction and therefore the enthalpic and entropic Lewis’s acid-base constants. The results showed that all studied solid surfaces exhibited amphoteric behavior with stronger Lewis’s basicity. The oxidized and untreated carbon fibers, ZnO and silica particles showed an important basic force, whereas, silica, alumina, monogal-Zn presented the highest Lewis’s acidity.
The application of the classic equation (12) allowing the determination of the acid-base constants showed poor linear regression coefficients. It was corrected by using Hamieh model that added a coupling constant reflecting the amphoteric character of solid materials.
It was proved that the method proposed by Donnet et al. neglected the values of harmonic mean of ionization energies of solids and solvents and this conducted to a surestimation of the specific or polar free energy of interaction reaching in several cases 5 times the corrected value. By taking into account the different values of harmonic mean and the deformation polarizability of n-alkanes and polar organic molecules, one obtained more accurate values of the London dispersive energy, the polar energy, the acid-base constants and the acid-base surface energies of the various solids in interaction with several polar molecules.
Supplementary Materials
The following supporting information can be downloaded at: www.mdpi.com/xxx/s1, Table S1. Values (in kJ/mol) of London dispersive energy () of n-alkanes and polar solvents adsorbed on silica particles at different temperatures. Table S2. Values (in kJ/mol) of London dispersive energy () of polar solvents adsorbed on silica particles at different temperatures. Table S3. Values (in kJ/mol) of London dispersive energy () of n-alkanes and polar solvents adsorbed on MgO particles at different temperatures. Table S4. Values (in kJ/mol) of London dispersive energy () of polar solvents adsorbed on MgO particles at different temperatures. Table S5. Values (in kJ/mol) of London dispersive energy () of n-alkanes and polar solvents adsorbed on ZnO particles at different temperatures. Table S6. Values (in kJ/mol) of London dispersive energy () of polar solvents adsorbed on ZnO particles at different temperatures. Table S7. Values (in kJ/mol) of London dispersive energy () of n-alkanes and polar solvents adsorbed on monogal-Zn particles at different temperatures. Table S8. Values (in kJ/mol) of London dispersive energy () of polar solvents adsorbed on monogal-Zn particles at different temperatures. Table S9. Values (in kJ/mol) of London dispersive energy () of n-alkanes and polar solvents adsorbed on alumina particles at different temperatures. Table S10. Values (in kJ/mol) of London dispersive energy () of polar solvents adsorbed on alumina particles at different temperatures. Table S11. Values (in kJ/mol) of London dispersive energy () of n-alkanes and polar solvents adsorbed on TiO2 particles at different temperatures. Table S12. Values (in kJ/mol) of London dispersive energy () of polar solvents adsorbed on TiO2 particles at different temperatures. Table S13. Values (in kJ/mol) of London dispersive energy () of n-alkanes and polar solvents adsorbed on untreated carbon fibers particles at different temperatures. Table S14. Values (in kJ/mol) of London dispersive energy () of polar solvents adsorbed on untreated carbon fibers particles at different temperatures. Table S15. Values (in kJ/mol) of London dispersive energy () of n-alkanes and polar solvents adsorbed on oxidized carbon fibers at different temperatures. Table S16. Values (in kJ/mol) of London dispersive energy () of polar solvents adsorbed on oxidized carbon fibers at different temperatures.
Conflicts of Interest
“The author declares no conflict of interest.”
References
- C. Saint-Flour, E. C. Saint-Flour, E. Papirer, Gas-solid chromatography. A method of measuring surface free energy characteristics of short carbon fibers. 1. Through adsorption isotherms, Ind. Eng. Chem. Prod. Res. Dev. 21 (1982) 337-341, . [CrossRef]
- C. Saint-Flour, E. C. Saint-Flour, E. Papirer, Gas-solid chromatography: method of measuring surface free energy characteristics of short fibers. 2. Through retention volumes measured near zero surface coverage, Ind. Eng. Chem. Prod. Res. Dev. 21 (1982) 666-669. [CrossRef]
- C. Saint-Flour and E. Papirer, “Gas-solid chromatography: a quick method of estimating surface free energy variations induced by the treatment of short glass fibers.” Journal of Colloid and Interface Science 91 (1983): 69-75.
- J. Schultz, L. J. Schultz, L. Lavielle, C. Martin, The role of the interface in carbon fibre-epoxy composites. J. Adhes. 23 (1987) 45–60.
- J.-B. Donnet, S. J.-B. Donnet, S. Park, H. Balard, Evaluation of specific interactions of solid surfaces by inverse gas chromatography, Chromatographia, 31 (1991) 434–440.
- E. Brendlé, E. E. Brendlé, E. Papirer, A new topological index for molecular probes used in inverse gas chromatography for the surface nanorugosity evaluation, 2. Application for the Evaluation of the Solid Surface Specific Interaction Potential, J. Colloid Interface Sci., 194 (1997) 217–2224.
- E. Brendlé, E. E. Brendlé, E. Papirer, A new topological index for molecular probes used in inverse gas chromatography for the surface nanorugosity evaluation, 1. Method of Evaluation, J. Colloid Interface Sci., 194 (1997) 207–216.
- D. T. Sawyer, D.J. Brookman. Thermodynamically based gas chromatographic retention index for organic molecules using salt-modified aluminas and porous silica beads, Anal. Chem. 1968, 40, 1847–1850. [CrossRef]
- M.M. Chehimi, E. M.M. Chehimi, E. Pigois-Landureau, Determination of acid–base properties of solid materials by inverse gas chromatography at infinite dilution. A novel empirical method based on the dispersive contribution to the heat of vaporization of probes, J. Mater. Chem., 4 (1994) 741–745.
- T Hamieh, Study of the temperature effect on the surface area of model organic molecules, the dispersive surface energy and the surface properties of solids by inverse gas chromatography, J. Chromatogr. A, 1627 (2020) 461372.
- T Hamieh, AA Ahmad, T Roques-Carmes, J Toufaily, New approach to determine the surface and interface thermodynamic properties of H-β-zeolite/rhodium catalysts by inverse gas chromatography at infinite dilution, Scientific Reports, 10 (1) (2020) 1-27.
- T Hamieh, New methodology to study the dispersive component of the surface energy and acid–base properties of silica particles by inverse gas chromatography at infinite dilution, Journal of Chromatographic Science 60 (2) (2022) 126-142. [CrossRef]
- T. Hamieh, New Physicochemical Methodology for the Determination of the Surface Thermodynamic Properties of Solid Particles. AppliedChem 2023, 3(2), 229–255. [Google Scholar] [CrossRef]
- Hamieh, T.; Schultz, J. Study of the adsorption of n-alkanes on polyethylene surface - State equations, molecule areas and covered surface fraction. Comptes Rendus de l'Académie des Sciences, Série II, 1996; 323 (4), 281-289. [Google Scholar]
- F. London, The general theory of molecular forces, Trans. Faraday. Soc. 33; (1937), pp. 8-26.
- Conder, J.R.; Locke, D.C.; Purnell, J.H. Concurrent solution and adsorption phenomena in chromatography. I. J. Phys. Chem. 1969, 73, 700–8. [Google Scholar] [CrossRef]
- Conder, J.R.; Purnell, J.H. Gas chromatography at finite concentrations. Part 2.—A generalized retention theory. Trans Faraday Soc. 1968; 64, 3100–11. [Google Scholar]
- Conder, J.R.; Purnell, J.H. Gas chromatography at finite concentrations. Part 3.—Theory of frontal and elution techniques of thermodynamic measurement. Trans Faraday Soc. 1969, 65, 824-38. [CrossRef]
- Conder, J.R.; Purnell, J.H. Gas chromatography at finite concentrations. Part 4.—Experimental evaluation ofmethods for thermodynamic study of solutions. Trans Faraday Soc. 1969, 65, 839-48. [CrossRef]
- Conder, J.R.; Purnell, J.H. Gas chromatography at finite concentrations. Part 1.—Effect of gas imperfection on calculation of the activity coefficient in solution from experimental data. Trans Faraday Soc. 1968, 64, 1505-12. [CrossRef]
- Vidal, A.; Papirer, E.; Jiao, W.M.; Donnet, J.B. Modification of silica surfaces by grafting of alkyl chains. I-Characterization of silica surfaces by inverse gas–solid chromatography at zero surface coverage. Chromatographia, 1968, 64, 1505-12. [CrossRef]
- Papirer, E.; Balard, H.; Vidal, A. Inverse gas chromatography: a valuable method for the surface characterization of fillers for polymers (glass fibres and silicas). Eur Polym J. 1988, 24, 783–90. [Google Scholar] [CrossRef]
- Voelkel, A. Inverse gas chromatography: characterization of polymers, fibers, modified silicas, and surfactants. Crit Rev Anal Chem. 1991, 22, 411–39. [Google Scholar] [CrossRef]
- Guillet, J. E.; Romansky, M.; Price, G.J.; Van der Mark, R. Studies of polymer structure and interactions by automated inverse gas chromatography. Inverse gas chromatography. 1989, Washington, DC: Characterization of Polymers and Other Materials, American Chemical Society 20–32. Eng. Asp. 1968, 64, 1505-12.
- V. Gutmann, The Donor-acceptor Approach to Molecular Interactions, Plenum. New York, 1978.
- Riddle, F. L.; Fowkes, F. M. Spectral shifts in acid-base chemistry. Van der Waals contributions to acceptor numbers, Spectral shifts in acid-base chemistry. 1. van der Waals contributions to acceptor numbers. 1990, J. Am. Chem. Soc., 112 (9), 3259-3264. Chem. [CrossRef]
- T. Hamieh, M. T. Hamieh, M. Rageul-Lescouet, M. Nardin, H. Haidara et J. Schultz, Study of acid-base interactions between some metallic oxides and model organic molecules", Colloids and Surfaces A: Physicochemical and Engineering Aspects, 125, 1997, 155-161.
- David, R. Lide, ed., CRC Handbook of Chemistry and Physics, Internet Version 2007, (87th Edition), http:/www.hbcpnetbase.com, Taylor and Francis, Boca Raton, FL, 2007.
- C.J. Van Oss, R.J. C.J. Van Oss, R.J. Good, M.K. Chaudhury, Additive and nonadditive surface tension components and the interpretation of contact angles, Langmuir, 1988, 4 (4) 884, http:// dx.doi.org/10.1021/la00082a018.
Figure 1.
Variations of of n-alkanes and toluene adsorbed on the silica particles as a function of at T=323.15K.
Figure 1.
Variations of of n-alkanes and toluene adsorbed on the silica particles as a function of at T=323.15K.
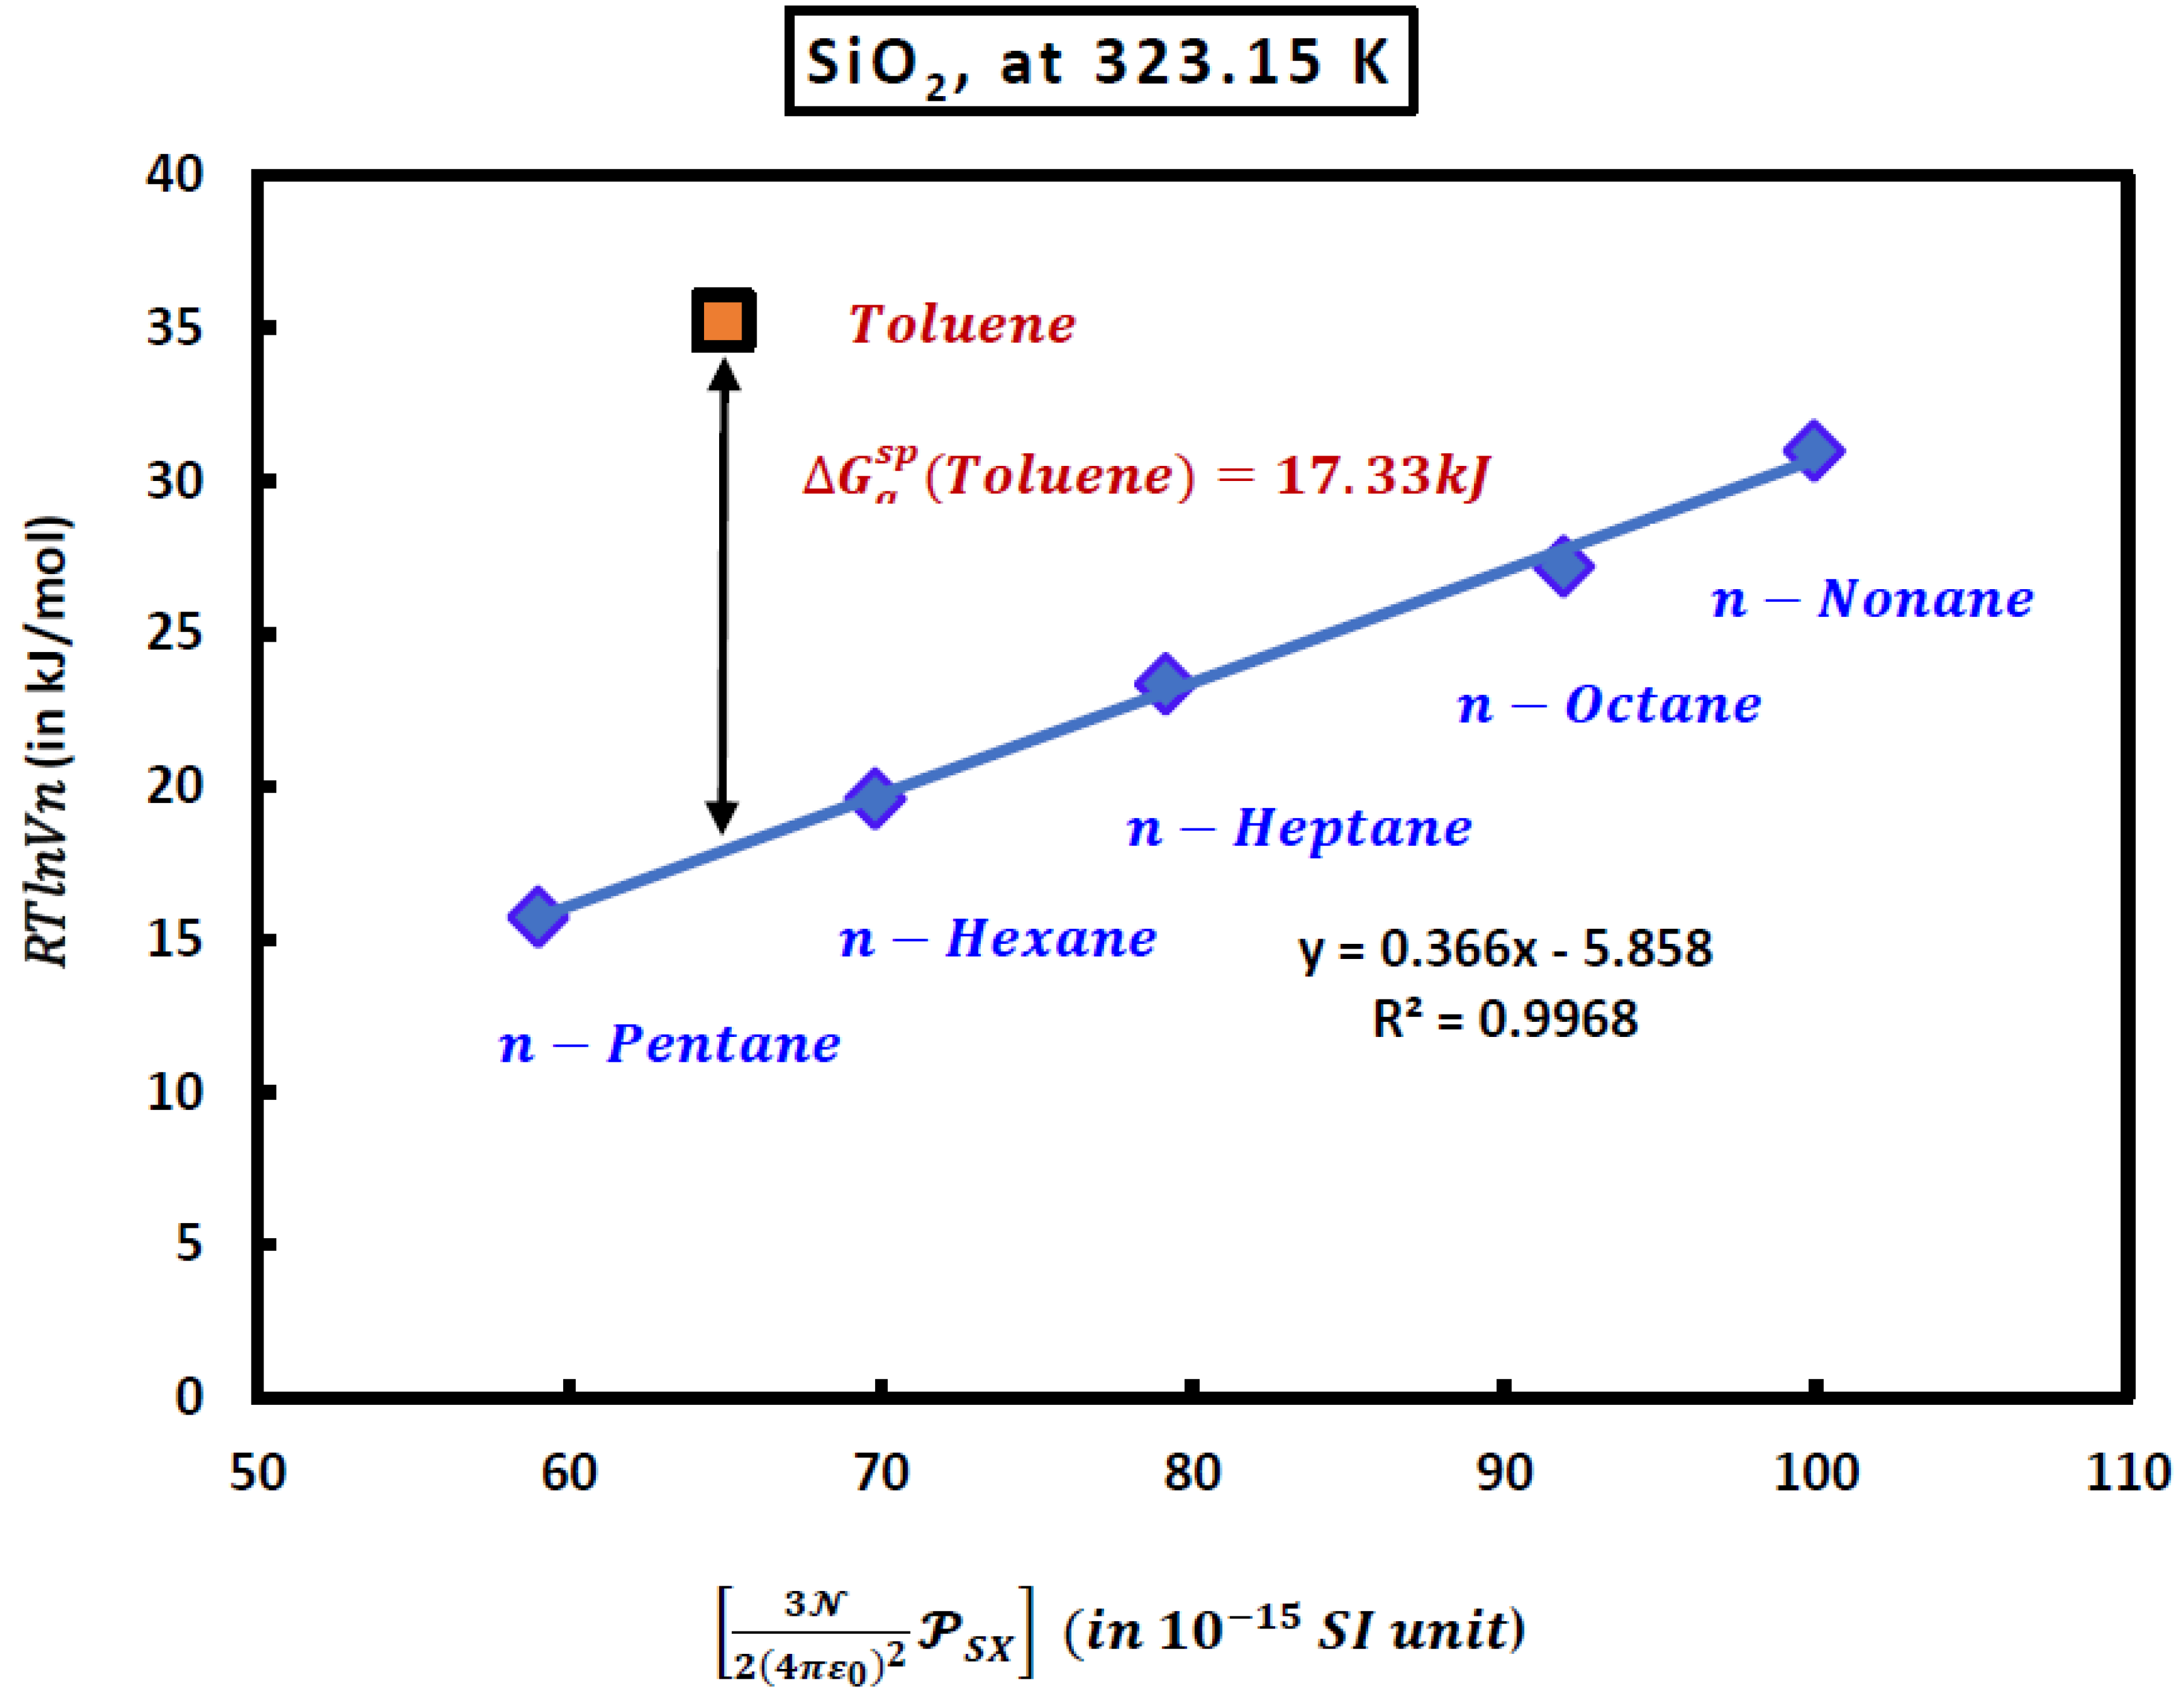
Figure 2.
Dispersive component of the surface energy of solid materials as a function of the temperature T (K).
Figure 2.
Dispersive component of the surface energy of solid materials as a function of the temperature T (K).
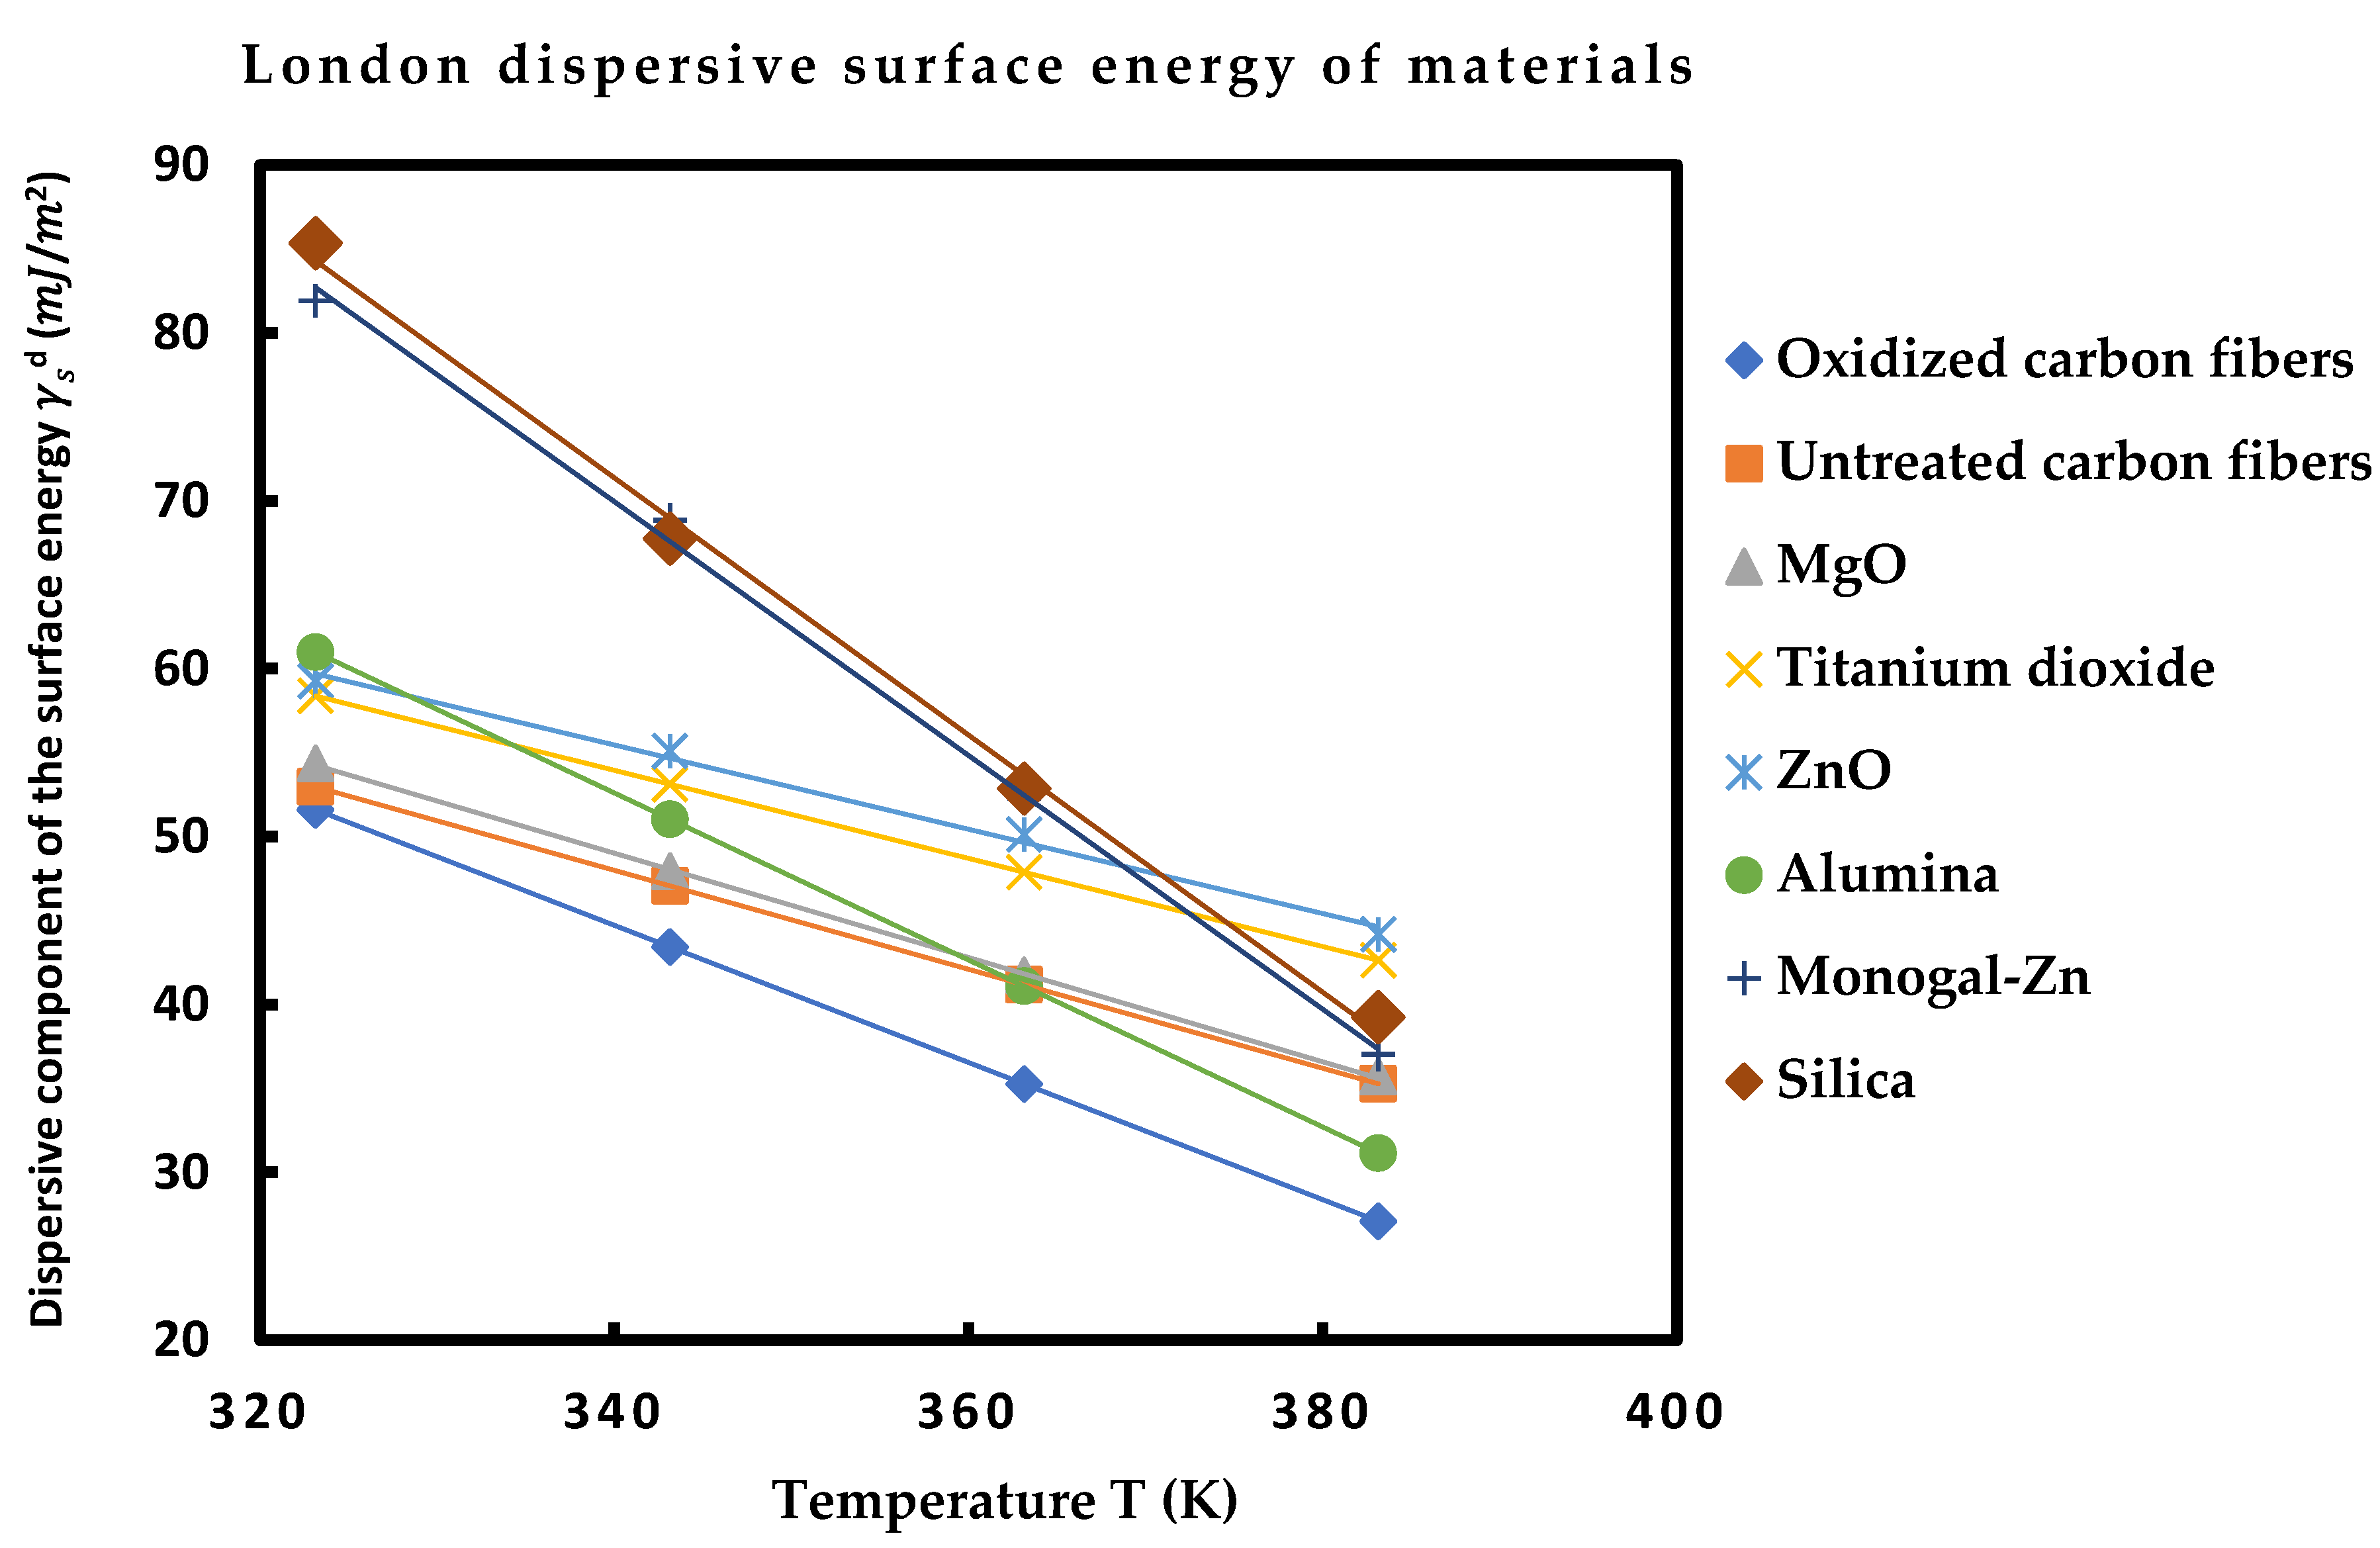
Figure 3.
Evolution of the specific free surface energy () of the various solid materials in interactions with the different polar molecules Such as CCl4 (a), CH2Cl2 (b), CHCl3 (c), diethyl ether (d), tetrahydrofuran (e), ethyl acetate (f), and acetone (g) as function of the temperature.
Figure 3.
Evolution of the specific free surface energy () of the various solid materials in interactions with the different polar molecules Such as CCl4 (a), CH2Cl2 (b), CHCl3 (c), diethyl ether (d), tetrahydrofuran (e), ethyl acetate (f), and acetone (g) as function of the temperature.
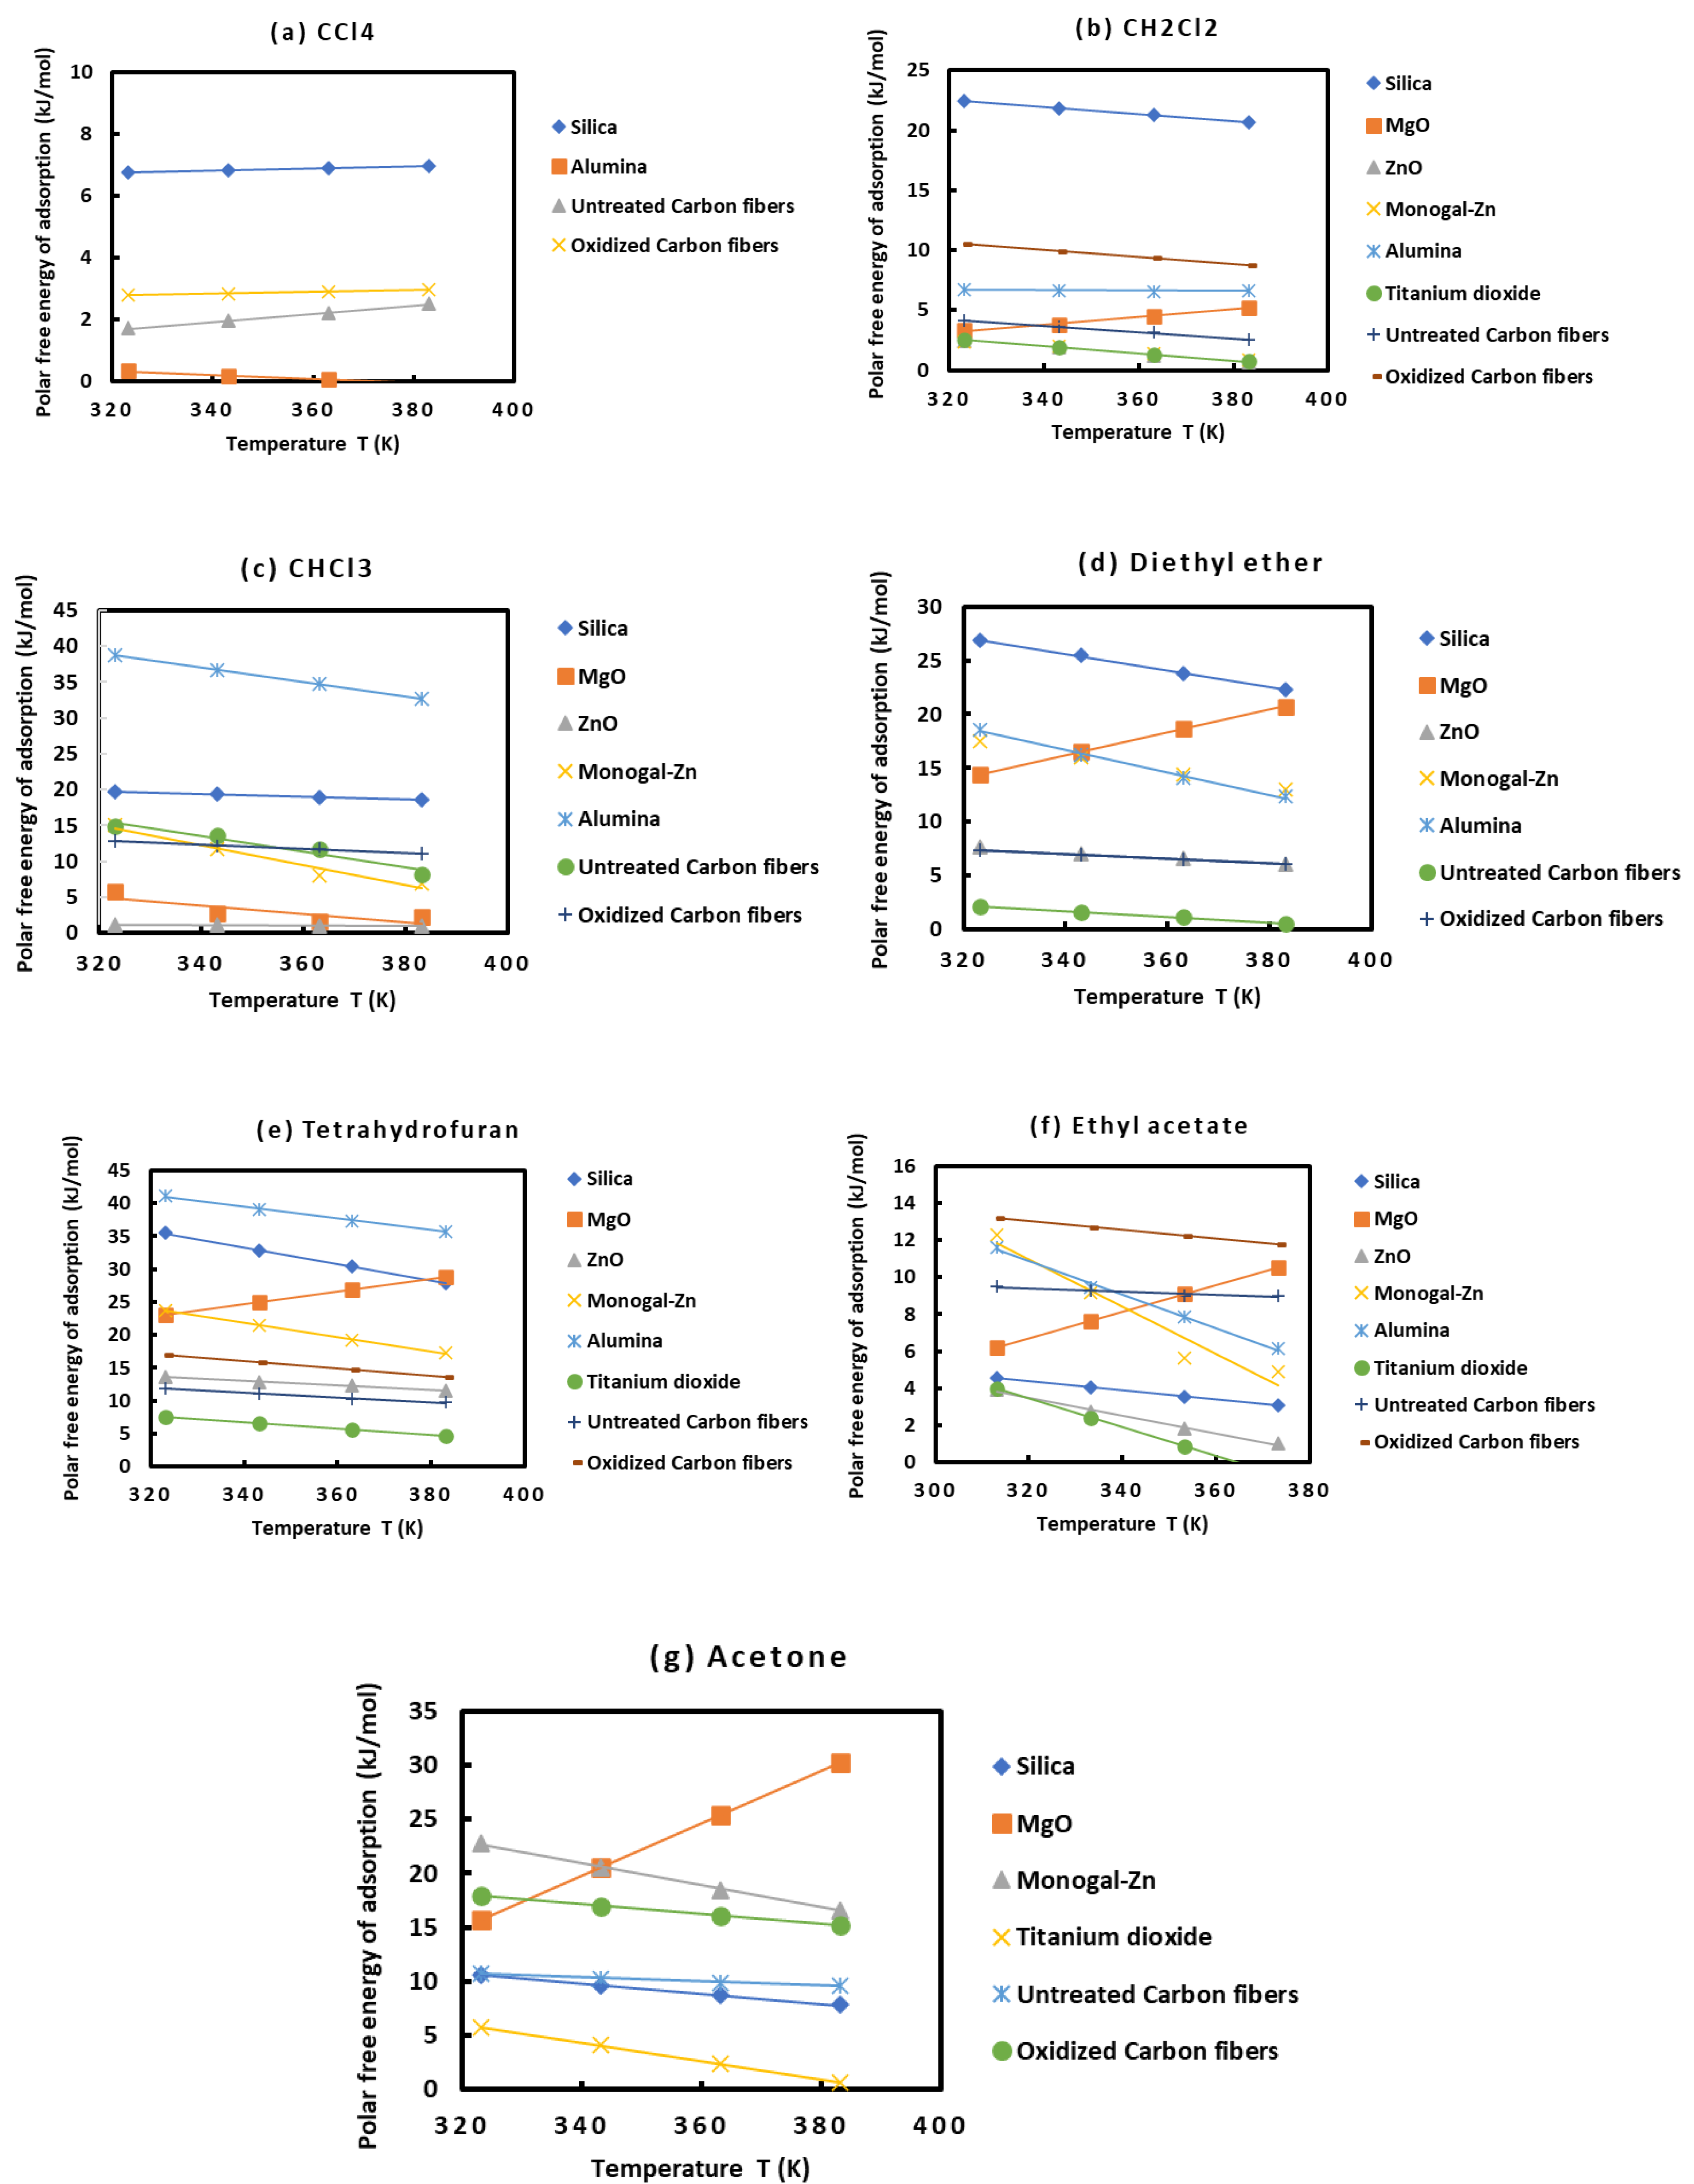

Table 1.
Values of deformation polarizability (in 10-30 m3) and (in 10-40 C m2/V) and ionization energy (in eV) of the various organic molecules and solid materials.
Table 1.
Values of deformation polarizability (in 10-30 m3) and (in 10-40 C m2/V) and ionization energy (in eV) of the various organic molecules and solid materials.
| Molecule | (eV) |
(in 10-30 m3) |
(in 10-40 C m2/V) |
|---|---|---|---|
| n-pentane | 10.28 | 9.99 | 11.12 |
| n-hexane | 10.13 | 11.90 | 13.24 |
| n-heptane | 9.93 | 13.61 | 15.14 |
| n-octane | 9.80 | 15.90 | 17.69 |
| n-nonane | 9.71 | 17.36 | 19.32 |
| n-decane | 9.65 | 19.10 | 21.25 |
| CCl4 | 11.47 | 10.85 | 12.07 |
| Nitromethane | 11.08 | 7.37 | 8.20 |
| CH2Cl2 | 11.32 | 7.21 | 8.02 |
| CHCl3 | 11.37 | 8.87 | 9.86 |
| Diethyl ether | 9.51 | 9.47 | 10.54 |
| Tetrahydrofuran | 9.38 | 8.22 | 9.15 |
| Ethyl acetate | 10.01 | 9.16 | 10.19 |
| Acetone | 9.70 | 6.37 | 7.09 |
| Acetonitrile | 12.20 | 4.44 | 4.94 |
| Toluene | 8.83 | 11.80 | 13.13 |
| Benzene | 9.24 | 10.35 | 11.52 |
| Methanol | 10.85 | 3.28 | 3.65 |
| SiO2 | 8.15 | 5.42 | 6.04 |
| MgO | 7.65 | 5.47 | 6.09 |
| ZnO | 4.35 | 5.27 | 5.86 |
| Zn | 9.39 | 5.82 | 6.47 |
| Al2O3 | 5.99 | 5.36 | 5.96 |
| TiO2 | 9.50 | 7.12 | 7.92 |
| Carbon | 11.26 | 1.76 | 1.96 |
Table 2.
Values of the harmonic mean of the ionization energies of SiO2 particles and organic solvents (in 10-19 J) and the parameter (in 10-15 SI unit) for the various organic molecules.
Table 2.
Values of the harmonic mean of the ionization energies of SiO2 particles and organic solvents (in 10-19 J) and the parameter (in 10-15 SI unit) for the various organic molecules.
| Molecule |
(in 10-19J) |
(in 10-15 SI) |
|---|---|---|
| n-pentane | 7.274 | 58.992 |
| n-hexane | 7.226 | 69.814 |
| n-heptane | 7.162 | 79.135 |
| n-octane | 7.119 | 91.901 |
| n-nonane | 7.089 | 99.919 |
| n-decane | 7.069 | 109.623 |
| CCl4 | 7.623 | 67.151 |
| Nitromethane | 7.513 | 44.956 |
| CH2Cl2 | 7.582 | 44.379 |
| CHCl3 | 7.596 | 54.666 |
| Diethyl ether | 7.022 | 53.988 |
| Tetrahydrofuran | 6.977 | 46.564 |
| Ethyl acetate | 7.188 | 53.453 |
| Acetone | 7.087 | 36.652 |
| Acetonitrile | 7.818 | 28.180 |
| Toluene | 6.780 | 64.955 |
| Benzene | 6.930 | 58.231 |
| Methanol | 7.447 | 19.829 |
Table 3.
Values of the harmonic mean of the ionization energies of MgO particles and organic solvents (in 10-19 J) and the parameter (in 10-15 SI unit) for the various organic molecules.
Table 3.
Values of the harmonic mean of the ionization energies of MgO particles and organic solvents (in 10-19 J) and the parameter (in 10-15 SI unit) for the various organic molecules.
| Molecule |
(in 10-19J) |
(in 10-15 SI) |
|---|---|---|
| n-pentane | 7.018 | 56.917 |
| n-hexane | 6.974 | 67.374 |
| n-heptane | 6.914 | 76.393 |
| n-octane | 6.874 | 88.735 |
| n-nonane | 6.846 | 96.490 |
| n-decane | 6.828 | 105.872 |
| CCl4 | 7.343 | 64.680 |
| Nitromethane | 7.241 | 43.325 |
| CH2Cl2 | 7.304 | 42.754 |
| CHCl3 | 7.317 | 52.662 |
| Diethyl ether | 6.783 | 52.153 |
| Tetrahydrofuran | 6.742 | 44.991 |
| Ethyl acetate | 6.938 | 51.595 |
| Acetone | 6.844 | 35.395 |
| Acetonitrile | 7.523 | 27.117 |
| Toluene | 6.557 | 62.820 |
| Benzene | 6.697 | 56.277 |
| Methanol | 7.179 | 19.116 |
Table 4.
Values of the harmonic mean of the ionization energies of ZnO particles and organic solvents (in 10-19 J) and the parameter (in 10-15 SI unit) for the various organic molecules.
Table 4.
Values of the harmonic mean of the ionization energies of ZnO particles and organic solvents (in 10-19 J) and the parameter (in 10-15 SI unit) for the various organic molecules.
| Molecule |
(in 10-19J) |
(in 10-15 SI) |
|---|---|---|
| n-pentane | 4.891 | 39.665 |
| n-hexane | 4.869 | 47.041 |
| n-heptane | 4.840 | 53.478 |
| n-octane | 4.820 | 62.224 |
| n-nonane | 4.807 | 67.745 |
| n-decane | 4.797 | 74.392 |
| CCl4 | 5.046 | 44.451 |
| Nitromethane | 4.998 | 29.904 |
| CH2Cl2 | 5.028 | 29.431 |
| CHCl3 | 5.034 | 36.231 |
| Diethyl ether | 4.776 | 36.716 |
| Tetrahydrofuran | 4.755 | 31.732 |
| Ethyl acetate | 4.852 | 36.080 |
| Acetone | 4.806 | 24.852 |
| Acetonitrile | 5.131 | 18.494 |
| Toluene | 4.662 | 44.666 |
| Benzene | 4.733 | 39.769 |
| Methanol | 4.968 | 13.230 |
Table 5.
Values of the harmonic mean of the ionization energies of Monogal-Zn and organic solvents (in 10-19 J) and the parameter (in 10-15 SI unit) for the various organic molecules.
Table 5.
Values of the harmonic mean of the ionization energies of Monogal-Zn and organic solvents (in 10-19 J) and the parameter (in 10-15 SI unit) for the various organic molecules.
| Molecule |
(in 10-19J) |
(in 10-15 SI) |
|---|---|---|
| n-pentane | 7.852 | 63.683 |
| n-hexane | 7.797 | 75.326 |
| n-heptane | 7.722 | 85.324 |
| n-octane | 7.672 | 99.042 |
| n-nonane | 7.638 | 107.648 |
| n-decane | 7.615 | 118.076 |
| CCl4 | 8.261 | 72.769 |
| Nitromethane | 8.132 | 48.658 |
| CH2Cl2 | 8.212 | 48.070 |
| CHCl3 | 8.228 | 59.222 |
| Diethyl ether | 7.560 | 58.122 |
| Tetrahydrofuran | 7.508 | 50.105 |
| Ethyl acetate | 7.752 | 57.650 |
| Acetone | 7.635 | 39.486 |
| Acetonitrile | 8.490 | 30.603 |
| Toluene | 7.280 | 69.743 |
| Benzene | 7.453 | 62.627 |
| Methanol | 8.054 | 21.447 |
Table 6.
Values of the harmonic mean of the ionization energies of and organic solvents (in 10-19 J) and the parameter (in 10-15 SI unit) for the various organic molecules.
Table 6.
Values of the harmonic mean of the ionization energies of and organic solvents (in 10-19 J) and the parameter (in 10-15 SI unit) for the various organic molecules.
| Molecule |
(in 10-19J) |
(in 10-15 SI) |
|---|---|---|
| n-pentane | 6.056 | 49.114 |
| n-hexane | 6.023 | 58.186 |
| n-heptane | 5.978 | 66.053 |
| n-octane | 5.948 | 76.784 |
| n-nonane | 5.927 | 83.541 |
| n-decane | 5.913 | 91.697 |
| CCl4 | 6.296 | 55.460 |
| Nitromethane | 6.221 | 37.222 |
| CH2Cl2 | 6.268 | 36.687 |
| CHCl3 | 6.277 | 45.177 |
| Diethyl ether | 5.880 | 45.209 |
| Tetrahydrofuran | 5.849 | 39.033 |
| Ethyl acetate | 5.996 | 44.590 |
| Acetone | 5.926 | 30.646 |
| Acetonitrile | 6.428 | 23.171 |
| Toluene | 5.710 | 54.699 |
| Benzene | 5.816 | 48.867 |
| Methanol | 6.175 | 16.443 |
Table 7.
Values of the harmonic mean of the ionization energies of (in 10-15 SI unit) for the various organic molecules.
Table 7.
Values of the harmonic mean of the ionization energies of (in 10-15 SI unit) for the various organic molecules.
| Molecule |
(in 10-19J) |
(in 10-15 SI) |
|---|---|---|
| n-pentane | 7.900 | 64.071 |
| n-hexane | 7.844 | 75.781 |
| n-heptane | 7.768 | 85.834 |
| n-octane | 7.718 | 99.631 |
| n-nonane | 7.683 | 108.285 |
| n-decane | 7.660 | 118.773 |
| CCl4 | 8.314 | 73.236 |
| Nitromethane | 8.183 | 48.965 |
| CH2Cl2 | 8.264 | 48.376 |
| CHCl3 | 8.281 | 59.600 |
| Diethyl ether | 7.604 | 58.462 |
| Tetrahydrofuran | 7.552 | 50.396 |
| Ethyl acetate | 7.799 | 57.996 |
| Acetone | 7.680 | 39.719 |
| Acetonitrile | 8.546 | 30.804 |
| Toluene | 7.321 | 70.137 |
| Benzene | 7.496 | 62.988 |
| Methanol | 8.104 | 21.581 |
Table 8.
Values of the harmonic mean of the ionization energies of carbon fibers and organic solvents (in 10-19 J) and the parameter (in 10-15 SI unit) for the various organic molecules.
Table 8.
Values of the harmonic mean of the ionization energies of carbon fibers and organic solvents (in 10-19 J) and the parameter (in 10-15 SI unit) for the various organic molecules.
| Molecule |
(in 10-19J) |
(in 10-15 SI) |
|---|---|---|
| n-pentane | 8.598 | 69.736 |
| n-hexane | 8.532 | 82.430 |
| n-heptane | 8.443 | 93.286 |
| n-octane | 8.384 | 108.220 |
| n-nonane | 8.342 | 117.574 |
| n-decane | 8.314 | 128.928 |
| CCl4 | 9.091 | 80.082 |
| Nitromethane | 8.935 | 53.465 |
| CH2Cl2 | 9.032 | 52.869 |
| CHCl3 | 9.052 | 65.147 |
| Diethyl ether | 8.249 | 63.421 |
| Tetrahydrofuran | 8.188 | 54.640 |
| Ethyl acetate | 8.479 | 63.053 |
| Acetone | 8.339 | 43.125 |
| Acetonitrile | 9.369 | 33.772 |
| Toluene | 7.917 | 75.847 |
| Benzene | 8.122 | 68.249 |
| Methanol | 8.841 | 23.543 |
Table 9.
Values of deformation polarizability (in 10-40 C m2/V) compared to those proposed by Donnet et al. of the various organic molecules, with the calculated relative error.
Table 9.
Values of deformation polarizability (in 10-40 C m2/V) compared to those proposed by Donnet et al. of the various organic molecules, with the calculated relative error.
| Molecule |
(in 10-40 C m2/V) (Donnet values) |
(in 10-40 C m2/V) (Our values) |
Relative error (in %) |
|---|---|---|---|
| n-nonane | 19.75 | 19.32 | 2.2 |
| n-decane | - | 21.25 | - |
| CCl4 | 11.68 | 12.07 | 3.2 |
| CH2Cl2 | - | 8.02 | - |
| CHCl3 | 10.57 | 9.86 | 7.2 |
| Diethyl ether | 9.71 | 10.54 | 8.0 |
| Tetrahydrofuran | 8.77 | 9.15 | 4.2 |
| Ethyl acetate | 10.79 | 10.19 | 5.9 |
| Acetone | 7.12 | 7.09 | 0.4 |
| Acetonitrile | 5.43 | 4.94 | 10.0 |
| Toluene | 13.68 | 13.13 | 4.2 |
| Benzene | 11.95 | 11.52 | 3.7 |
| Methanol | - | 3.65 | - |
| SiO2 | - | 6.04 | - |
| MgO | - | 6.09 | - |
| ZnO | - | 5.86 | - |
| Zn | - | 6.47 | - |
| Al2O3 | - | 5.96 | - |
| TiO2 | - | 7.92 | - |
| Carbon | - | 1.96 | - |
Table 10.
Values of the London dispersive surface energy (in mJ/m2) of the various solid materials
| Temperature T(K) | 323.15 | 343.15 | 363.15 | 383.15 | Equation of |
| Oxidized carbon fibers | 51.59 | 43.42 | 35.25 | 27.08 | = -0.408 T + 183.6 |
| Untreated carbon fibers | 52.96 | 47.06 | 41.16 | 35.27 | = -0.295 T + 148.2 |
| MgO | 54.35 | 47.92 | 41.71 | 35.71 | = -0.311 T + 154.6 |
| MgO | 58.37 | 53.12 | 47.87 | 42.62 | = -0.262 T + 143.2 |
| ZnO | 59.25 | 55.07 | 50.12 | 44.16 | = -0.251 T + 140.8 |
| Al2O3 | 60.98 | 51.03 | 41.08 | 31.13 | = -0.497 T + 221.7 |
| Monogal-Zn | 81.90 | 68.84 | 52.26 | 37.03 | = -0.756 T + 327.0 |
| SiO2 | 85.34 | 67.75 | 52.86 | 39.23 | = -0.766 T + 331.8 |
Table 11.
Values of () (in kJ/mol) of the various polar molecules adsorbed on the different used solid materials
Table 11.
Values of () (in kJ/mol) of the various polar molecules adsorbed on the different used solid materials
| Silica | ||||
|---|---|---|---|---|
| T(K) | 323.15 | 343.15 | 363.15 | 383.15 |
| CCl4 | 6.752 | 6.810 | 6.881 | 6.968 |
| Nitromethane | 13.573 | 12.367 | 11.273 | 10.191 |
| CH2Cl2 | 22.490 | 21.846 | 21.269 | 20.716 |
| CHCl3 | 19.752 | 19.304 | 18.925 | 18.546 |
| Diethyl ether | 26.838 | 25.462 | 23.802 | 22.314 |
| THF | 35.506 | 32.787 | 30.435 | 27.908 |
| Ethyl Acetate | 4.566 | 4.015 | 3.530 | 3.079 |
| Acetone | 10.612 | 9.608 | 8.703 | 7.816 |
| Acetonitrile | 16.734 | 15.304 | 14.016 | 12.738 |
| Toluene | 17.330 | 16.724 | 16.168 | 15.598 |
| Benzene | 5.640 | 5.170 | 4.745 | 4.328 |
| MgO | ||||
| T(K) | 323.1500 | 343.1500 | 363.1500 | 383.15 |
| CH2Cl2 | 3.3120 | 3.7860 | 4.5320 | 5.211 |
| CHCl3 | 5.833 | 2.693 | 1.560 | 2.176 |
| Diethyl ether | 14.415 | 16.559 | 18.671 | 20.721 |
| THF | 23.053 | 25.004 | 26.928 | 28.797 |
| Acetone | 15.723 | 20.520 | 25.354 | 30.243 |
| Ethyl acetate | 6.224 | 7.620 | 9.112 | 10.523 |
| ZnO | ||||
| T(K) | 323.15 | 343.15 | 363.15 | 383.15 |
| CH2Cl2 | 2.4490 | 1.9151 | 1.2231 | 0.6320 |
| CHCl3 | 1.1506 | 1.0611 | 0.9988 | 0.9325 |
| Diethyl ether | 7.7211 | 7.0452 | 6.5940 | 6.0373 |
| THF | 13.5961 | 12.9006 | 12.2948 | 11.5175 |
| Ethyl acetate | 3.9554 | 2.7149 | 1.8004 | 1.0420 |
| Benzene | 0.8696 | 0.6900 | 0.5367 | 0.3535 |
| Monogal-Zn | ||||
| T(K) | 323.15 | 343.15 | 363.15 | 383.15 |
| CH2Cl2 | 2.354 | 1.965 | 1.426 | 0.854 |
| CHCl3 | 15.001 | 11.698 | 7.938 | 6.927 |
| Diethyl ether | 17.481 | 15.950 | 14.408 | 12.982 |
| THF | 23.786 | 21.503 | 19.298 | 17.285 |
| Acetone | 22.779 | 20.603 | 18.500 | 16.582 |
| Ethyl acetate | 12.287 | 9.154 | 5.642 | 4.895 |
| Alumina | ||||
| T(K) | 323.15 | 343.15 | 363.15 | 383.15 |
| CCl4 | 0.334 | 0.163 | 0.084 | - |
| CH2Cl2 | 6.751 | 6.654 | 6.575 | 6.648 |
| CHCl3 | 38.808 | 36.648 | 34.670 | 32.613 |
| Ether | 18.559 | 16.226 | 14.028 | 12.322 |
| THF | 41.085 | 39.144 | 37.268 | 35.790 |
| Ethyl acetate | 11.624 | 9.452 | 7.875 | 6.125 |
| Toluene | 40.532 | 38.377 | 36.371 | 34.878 |
| TiO2 | ||||
| T(K) | 313.15 | 333.15 | 353.15 | 373.15 |
| CH2Cl2 | 2.546 | 1.924 | 1.254 | 0.723 |
| CHCl3 | 3.146 | 2.019 | 0.893 | - |
| THF | 7.620 | 6.620 | 5.620 | 4.620 |
| Ethyl Acetate | 3.979 | 2.417 | 0.857 | - |
| Acetone | 5.776 | 4.068 | 2.362 | 0.651 |
| Benzene | 5.564 | 4.199 | 2.834 | 1.463 |
| Nitromethane | 10.394 | 9.024 | 7.657 | 6.283 |
| Acetonitrile | 4.615 | 2.524 | 0.433 | -1.661 |
| Untreated Carbon fibers | ||||
| T(K) | 323.15 | 343.15 | 363.15 | 383.15 |
| CCl4 | 1.723 | 1.956 | 2.203 | 2.518 |
| CH2Cl2 | 4.096 | 3.645 | 3.129 | 2.548 |
| CHCl3 | 14.829 | 13.537 | 11.761 | 8.193 |
| Ether | 2.112 | 1.633 | 1.131 | 0.546 |
| THF | 11.852 | 11.079 | 10.310 | 9.748 |
| C6H6 | 8.577 | 8.315 | 8.055 | 8.011 |
| Ethyl acetate | 9.500 | 9.251 | 9.019 | 8.975 |
| Acetone | 10.723 | 10.282 | 9.865 | 9.647 |
| Oxidized Carbon fibers | ||||
| T(K) | 323.15 | 343.15 | 363.15 | 383.15 |
| CCl4 | 2.785 | 2.843 | 2.911 | 2.974 |
| CH2Cl2 | 10.546 | 9.952 | 9.379 | 8.800 |
| CHCl3 | 12.788 | 12.228 | 11.685 | 11.134 |
| Ether | 7.399 | 6.965 | 6.548 | 6.124 |
| THF | 17.020 | 15.878 | 14.753 | 13.623 |
| C6H6 | 10.429 | 9.943 | 9.473 | 8.995 |
| Ethyl acetate | 13.212 | 12.718 | 12.242 | 11.758 |
| Acetone | 17.928 | 16.999 | 16.094 | 15.183 |
Table 12.
Values of polar enthalpy () and entropy () of the various polar solvents adsorbed on the various solid surfaces by using our new method.
Table 12.
Values of polar enthalpy () and entropy () of the various polar solvents adsorbed on the various solid surfaces by using our new method.
| Silica | ||
|---|---|---|
| Polar solvent | () | () |
| CCl4 | -4.6 | 5.2514 |
| Nitromethane | 52.8 | 30.543 |
| CH2Cl2 | 27.7 | 31.377 |
| CHCl3 | 18.8 | 25.788 |
| Diethyl ether | 77.4 | 51.914 |
| THF | 123.5 | 75.304 |
| Ethyl acetate | 23 | 11.944 |
| Acetone | 43.6 | 24.624 |
| Acetonitrile | 62.2 | 36.719 |
| Toluene | 27.1 | 26.027 |
| Benzene | 20.4 | 12.173 |
| MgO | ||
| CH2Cl2 | 32.2 | 7.1665 |
| CHCl3 | -60.5 | -24.435 |
| Diethyl ether | 105.1 | 19.543 |
| Ethyl acetate | 71.9 | 17.038 |
| THF | 95.8 | 7.8791 |
| Acetone | 242 | 62.489 |
| Acetonitrile | 81.6 | 2.0138 |
| Toluene | -13.8 | 15.211 |
| ZnO | ||
| CH2Cl2 | 20.9 | 8.9949 |
| CHCl3 | -11.4 | 1.0743 |
| Diethyl ether | 18.5 | 18.218 |
| THF | 23.8 | 26.647 |
| Ethyl acetate | 38.2 | 17.176 |
| Benzene | -1.0 | 6.7082 |
| Monogal | ||
| CH2Cl2 | 25.2 | 10.547 |
| CHCl3 | 139.9 | 59.803 |
| Diethyl ether | 75.2 | 41.760 |
| THF | 108.5 | 58.796 |
| Ethyl acetate | 44.2 | 21.674 |
| Acetone | 103.5 | 56.155 |
| Acetonitrile | 110.8 | 54.921 |
| Toluene | 99.9 | 54.474 |
| Alumina | ||
| CCl4 | 6.2 | 2.314 |
| CH2Cl2 | 1.9 | 7.3421 |
| CHCl3 | 102.8 | 71.989 |
| Diethyl ether | 104.6 | 52.207 |
| THF | 88.8 | 69.683 |
| Ethyl acetate | 90.4 | 40.683 |
| Toluene | 94.9 | 71.036 |
| Titanium dioxide | ||
| CH2Cl2 | 30.7 | 12.146 |
| CHCl3 | 56.4 | 20.818 |
| THF | 10.0 | 23.277 |
| Ethyl Acetate | 78.1 | 28.448 |
| Acetone | 85.4 | 32.518 |
| Benzene | 68.3 | 26.965 |
| Nitromethane | 68.5 | 31.846 |
| Acetonitrile | 104.6 | 37.370 |
| Untreated carbon fibers | ||
| CCl4 | -13.2 | -2.4181 |
| CH2Cl2 | 25.8 | 12.209 |
| CHCl3 | 108.4 | 49.284 |
| Benzene | 9.8 | 11.602 |
| Diethyl ether | 26 | 10.275 |
| THF | 35.4 | 22.895 |
| Ethyl acetate | 9 | 12.289 |
| Acetone | 18.2 | 16.380 |
| Oxidized carbon fibers | ||
| CCl4 | 3.2 | 1.7876 |
| CH2Cl2 | 29.1 | 19.639 |
| CHCl3 | 27.5 | 21.406 |
| Benzene | 23.9 | 17.897 |
| Diethyl ether | 21.2 | 14.038 |
| THF | 56.6 | 34.733 |
| Ethyl acetate | 24.2 | 20.782 |
| Acetone | 45.7 | 32.230 |
Table 13.
Values of the enthalpic acid base constants and (unitless) and the entropic acid base constants and (unitless) of the various solid surfaces and the corresponding acid base ratios.
Table 13.
Values of the enthalpic acid base constants and (unitless) and the entropic acid base constants and (unitless) of the various solid surfaces and the corresponding acid base ratios.
| Solid surfaces | ||||||||
|---|---|---|---|---|---|---|---|---|
| Silica | 0.73 | 1.45 | 2.0 | 0.6509 | 1.23 | 1.45 | 1.2 | 0.651 |
| MgO | 0.08 | 1.13 | 14.0 | 0.1722 | 1.16 | 0.57 | 0.5 | 0.8126 |
| ZnO | 0.22 | 1.63 | 7.4 | 0.422 | 0.29 | 0.08 | 0.3 | 0.8761 |
| Monogal-Zn | 0.59 | 1.49 | 2.5 | 0.7296 | 1.07 | 3.08 | 2.9 | 0.7295 |
| Alumina | 0.71 | 2.21 | 3.1 | 0.7301 | 0.92 | 4.21 | 4.6 | 0.7739 |
| Titanium dioxide | 0.25 | 0.87 | 3.5 | 0.9874 | 0.86 | 1.80 | 2.1 | 0.9804 |
| Untreated Carbon fibers | 0.13 | 2.19 | 16.8 | 0.0799 | 0.30 | 1.56 | 5.2 | 0.3195 |
| Oxidized Carbon fibers | 0.20 | 3.41 | 17.4 | 0.0779 | 0.37 | 4.32 | 11.6 | 0.141 |
Table 14.
Corrected values of Lewis’s acid-base constants , and of the various solid surfaces and the corresponding acid base ratios.
Table 14.
Corrected values of Lewis’s acid-base constants , and of the various solid surfaces and the corresponding acid base ratios.
| Solid surfaces | ||||
|---|---|---|---|---|
| Silica | 1.105 | 3.572 | 0.186 | 3.23 |
| MgO | 0.005 | 0.336 | -0.045 | 71.66 |
| ZnO | 0.401 | 2.418 | 0.089 | 6.03 |
| Monogal-Zn | 0.782 | 3.477 | 0.113 | 4.45 |
| Alumina | 0.988 | 3.291 | 0.136 | 3.33 |
| Untreated Carbon fibers | 0.359 | 3.339 | 0.110 | 9.29 |
| Oxidized Carbon fibers | 0.529 | 5.085 | 0.161 | 9.61 |
Table 15.
Values of (), () and () of polar molecules adsorbed on silica surfaces by comparing Donnet et al.’s method and our new method .
Table 15.
Values of (), () and () of polar molecules adsorbed on silica surfaces by comparing Donnet et al.’s method and our new method .
| Results by using Donnet et al.’s method | |||||||
|---|---|---|---|---|---|---|---|
| T(K) | 323.15 | 343.15 | 363.15 | 383.15 | 403.15 | () | () |
| CCl4 | 34.616 | 31.401 | 28.904 | 26.818 | 24.489 | 124.2 | 74.643 |
| Nitromethane | 34.014 | 30.151 | 27.038 | 24.328 | 21.424 | 155 | 83.687 |
| CH2Cl2 | 53.122 | 48.974 | 45.622 | 42.692 | 39.626 | 166.4 | 106.43 |
| CHCl3 | 48.598 | 44.795 | 41.775 | 39.150 | 36.312 | 151.1 | 96.995 |
| Diethyl ether | 53.703 | 49.136 | 44.982 | 41.394 | 37.319 | 202.5 | 118.86 |
| THF | 57.922 | 52.382 | 47.865 | 43.564 | 39.053 | 232.8 | 132.69 |
| Ethyl Acetate | 33.315 | 29.418 | 26.298 | 23.608 | 20.724 | 155 | 82.944 |
| Acetone | 25.935 | 22.701 | 20.154 | 18.016 | 15.527 | 127.5 | 66.771 |
| Acetonitrile | 25.145 | 22.059 | 19.641 | 17.621 | 15.228 | 121.4 | 64.011 |
| Toluene | 55.833 | 51.069 | 47.157 | 43.631 | 40.161 | 193.9 | 117.99 |
| Benzene | 38.564 | 34.399 | 31.032 | 28.069 | 25.006 | 167.2 | 92.143 |
| Results by using our new method | |||||||
| T(K) | 323.15 | 343.15 | 363.15 | 383.15 | 403.15 | () | () |
| CCl4 | 6.752 | 6.810 | 6.881 | 6.968 | 7.129 | 5.2514 | 6.752 |
| Nitromethane | 13.573 | 12.367 | 11.273 | 10.191 | 9.378 | 30.543 | 13.573 |
| CH2Cl2 | 22.490 | 21.846 | 21.269 | 20.716 | 20.287 | 31.377 | 22.490 |
| CHCl3 | 19.752 | 19.304 | 18.925 | 18.546 | 18.250 | 25.788 | 19.752 |
| Diethyl ether | 26.838 | 25.462 | 23.802 | 22.314 | 20.676 | 51.914 | 26.838 |
| THF | 35.506 | 32.787 | 30.435 | 27.908 | 25.593 | 75.304 | 35.506 |
| Ethyl Acetate | 4.566 | 4.015 | 3.530 | 3.079 | 2.732 | 11.944 | 4.566 |
| Acetone | 10.612 | 9.608 | 8.703 | 7.816 | 7.144 | 24.624 | 10.612 |
| Acetonitrile | 16.734 | 15.304 | 14.016 | 12.738 | 11.793 | 36.719 | 16.734 |
| Toluene | 17.330 | 16.724 | 16.168 | 15.598 | 15.187 | 26.027 | 17.330 |
| Benzene | 5.640 | 5.170 | 4.745 | 4.328 | 4.026 | 12.173 | 5.640 |
Table 16.
Values of the ratios at different temperatures, and and of the various polar organic molecules
Table 16.
Values of the ratios at different temperatures, and and of the various polar organic molecules
| T(K) | 323.15 | 343.15 | 363.15 | 383.15 | 403.15 | () | () |
| CCl4 | 5.1 | 4.6 | 4.2 | 3.8 | 3.4 | 23.7 | 11.1 |
| Nitromethane | 2.5 | 2.4 | 2.4 | 2.4 | 2.3 | 5.1 | 6.2 |
| CH2Cl2 | 2.4 | 2.2 | 2.1 | 2.1 | 2.0 | 5.3 | 4.7 |
| CHCl3 | 2.5 | 2.3 | 2.2 | 2.1 | 2.0 | 5.9 | 4.9 |
| Diethyl ether | 2.0 | 1.9 | 1.9 | 1.9 | 1.8 | 3.9 | 4.4 |
| THF | 1.6 | 1.6 | 1.6 | 1.6 | 1.5 | 3.1 | 3.7 |
| Ethyl Acetate | 7.3 | 7.3 | 7.5 | 7.7 | 7.6 | 13.0 | 18.2 |
| Acetone | 2.4 | 2.4 | 2.3 | 2.3 | 2.2 | 5.2 | 6.3 |
| Acetonitrile | 1.5 | 1.4 | 1.4 | 1.4 | 1.3 | 3.3 | 3.8 |
| Toluene | 3.2 | 3.1 | 2.9 | 2.8 | 2.6 | 7.4 | 6.8 |
| Benzene | 6.8 | 6.7 | 6.5 | 6.5 | 6.2 | 13.7 | 16.3 |
Table 17.
Harmonic mean (in 10-19J) values of the ionization energies of the various materials and the adsorbed polar solvents found in our new approach, and values of (in 10-10J1/2) used by Donnet et al. method.
Table 17.
Harmonic mean (in 10-19J) values of the ionization energies of the various materials and the adsorbed polar solvents found in our new approach, and values of (in 10-10J1/2) used by Donnet et al. method.
| Molecule |
(in 10-19J) |
(in 10-19J) |
(in 10-19J) |
(in 10-19J) |
(in 10-19J) |
(in 10-19J) |
(in 10-19J) |
(in 10-10J1/2) |
|---|---|---|---|---|---|---|---|---|
| n-pentane | 7.27 | 7.02 | 4.89 | 7.85 | 6.06 | 7.90 | 8.60 | 12.83 |
| n-hexane | 7.23 | 6.97 | 4.87 | 7.80 | 6.02 | 7.84 | 8.53 | 12.73 |
| n-heptane | 7.16 | 6.91 | 4.84 | 7.72 | 5.98 | 7.77 | 8.44 | 12.61 |
| n-octane | 7.12 | 6.87 | 4.82 | 7.67 | 5.95 | 7.72 | 8.38 | 12.52 |
| n-nonane | 7.09 | 6.85 | 4.81 | 7.64 | 5.93 | 7.68 | 8.34 | 12.46 |
| n-decane | 7.07 | 6.83 | 4.80 | 7.62 | 5.91 | 7.66 | 8.31 | 12.43 |
| CCl4 | 7.62 | 7.34 | 5.05 | 8.26 | 6.30 | 8.31 | 9.09 | 13.55 |
| Nitromethane | 7.51 | 7.24 | 5.00 | 8.13 | 6.22 | 8.18 | 8.94 | 13.32 |
| CH2Cl2 | 7.58 | 7.30 | 5.03 | 8.21 | 6.27 | 8.26 | 9.03 | 13.46 |
| CHCl3 | 7.60 | 7.32 | 5.03 | 8.23 | 6.28 | 8.28 | 9.05 | 13.49 |
| Diethyl ether | 7.02 | 6.78 | 4.78 | 7.56 | 5.88 | 7.60 | 8.25 | 12.34 |
| Tetrahydrofuran | 6.98 | 6.74 | 4.76 | 7.51 | 5.85 | 7.55 | 8.19 | 12.25 |
| Ethyl acetate | 7.19 | 6.94 | 4.85 | 7.75 | 6.00 | 7.80 | 8.48 | 12.66 |
| Acetone | 7.09 | 6.84 | 4.81 | 7.64 | 5.93 | 7.68 | 8.34 | 12.46 |
| Acetonitrile | 7.82 | 7.52 | 5.13 | 8.49 | 6.43 | 8.55 | 8.60 | 13.97 |
| Toluene | 6.78 | 6.56 | 4.66 | 7.28 | 5.71 | 7.32 | 8.53 | 11.89 |
| Benzene | 6.93 | 7.02 | 4.73 | 7.45 | 5.82 | 7.50 | 8.44 | 12.16 |
| Methanol | 7.45 | 6.97 | 4.97 | 8.05 | 6.18 | 8.10 | 8.38 | 13.18 |
Table 18.
Values of the average separation distance H (in Å) btween the various solid substrates and the organic molecules at different temperatures.
Table 18.
Values of the average separation distance H (in Å) btween the various solid substrates and the organic molecules at different temperatures.
| T(K) | 323.15 | 343.15 | 363.15 | 383.15 |
| SiO2 | 5.05 | 5.12 | 5.19 | 5.27 |
| MgO | 5.23 | 5.27 | 5.31 | 5.35 |
| ZnO | 4.87 | 4.88 | 4.89 | 4.90 |
| Monogal | 5.18 | 5.24 | 5.33 | 5.44 |
| Al2O3 | 5.03 | 5.08 | 5.13 | 5.16 |
| TiO2 | 5.51 | 5.53 | 5.54 | 5.56 |
| Untreated carbon fibers | 4.45 | 4.48 | 4.50 | 4.52 |
| Oxidized carbon fibers | 4.49 | 4.54 | 4.59 | 4.64 |
Table 19.
Values of () of the dichloromethane and the ethyl acetate adsorbed on the different solid materials at various temperatures.
Table 19.
Values of () of the dichloromethane and the ethyl acetate adsorbed on the different solid materials at various temperatures.
| () of dichloromethane | ||||
| T(K) | 323.15 | 343.15 | 363.15 | 383.15 |
| SiO2 | 22.49 | 21.846 | 21.269 | 20.716 |
| MgO | 3.312 | 3.786 | 4.532 | 5.211 |
| ZnO | 2.449 | 1.9151 | 1.2231 | 0.632 |
| Monogal | 2.354 | 1.965 | 1.426 | 0.854 |
| Al2O3 | 6.751 | 6.654 | 6.575 | 6.648 |
| TiO2 | 2.546 | 1.924 | 1.254 | 0.723 |
| Untreated carbon fibers | 4.096 | 3.645 | 3.129 | 2.548 |
| Oxidized carbon fibers | 10.546 | 9.952 | 9.379 | 8.8 |
| () of ethyl acetate | ||||
| T(K) | 323.15 | 343.15 | 363.15 | 383.15 |
| SiO2 | 4.566 | 4.015 | 3.53 | 3.079 |
| MgO | 6.224 | 7.62 | 9.112 | 10.523 |
| ZnO | 3.9554 | 2.7149 | 1.8004 | 1.042 |
| Monogal | 12.287 | 9.154 | 5.642 | 4.895 |
| Al2O3 | 11.624 | 9.452 | 7.875 | 6.125 |
| TiO2 | 3.979 | 2.417 | 0.857 | - |
| Untreated carbon fibers | 9.500 | 9.251 | 9.019 | 8.975 |
| Oxidized carbon fibers | 13.212 | 12.718 | 12.242 | 11.758 |
Table 20.
Values of the specific acid and base surface energy contributions , , and (in mJ/m2) of the different solid surfaces.
Table 20.
Values of the specific acid and base surface energy contributions , , and (in mJ/m2) of the different solid surfaces.
| Values of (in mJ/m2) | ||||
| T(K) | 323.15 | 343.15 | 363.15 | 383.15 |
| SiO2 | 8.11 | 6.15 | 4.66 | 3.47 |
| MgO | 15.07 | 22.14 | 31.03 | 40.57 |
| ZnO | 6.08 | 2.81 | 1.21 | 0.40 |
| Monogal | 58.72 | 31.95 | 11.90 | 8.78 |
| Al2O3 | 52.55 | 34.06 | 23.18 | 13.75 |
| TiO2 | 6.16 | 2.23 | 0.27 | 0.03 |
| Untreated carbon fibers | 33.54 | 31.08 | 28.63 | 26.18 |
| Oxidized carbon fibers | 64.04 | 57.33 | 50.62 | 43.91 |
| Values of (in mJ/m2) | ||||
| T(K) | 323.15 | 343.15 | 363.15 | 383.15 |
| SiO2 | 275.18 | 254.53 | 236.49 | 219.94 |
| MgO | 5.97 | 7.64 | 10.74 | 13.92 |
| ZnO | 3.26 | 1.96 | 0.78 | 0.20 |
| Monogal | 3.01 | 2.06 | 1.06 | 0.37 |
| Al2O3 | 24.80 | 23.61 | 22.60 | 22.65 |
| TiO2 | 3.53 | 1.97 | 0.82 | 0.27 |
| Untreated carbon fibers | 8.01 | 5.99 | 3.98 | 1.96 |
| Oxidized carbon fibers | 55.89 | 48.21 | 40.53 | 32.85 |
| Values of (in mJ/m2) | ||||
| T(K) | 323.15 | 343.15 | 363.15 | 383.15 |
| SiO2 | 94.46 | 79.11 | 66.37 | 55.27 |
| MgO | 18.96 | 26.02 | 36.51 | 47.52 |
| ZnO | 8.91 | 4.69 | 1.95 | 0.57 |
| Monogal | 26.61 | 16.22 | 7.11 | 3.62 |
| Al2O3 | 65.95 | 56.00 | 46.05 | 36.11 |
| TiO2 | 9.32 | 4.19 | 0.95 | 0.17 |
| Untreated carbon fibers | 32.75 | 27.04 | 21.32 | 15.61 |
| Oxidized carbon fibers | 119.64 | 105.11 | 90.58 | 76.04 |
| Values of (in mJ/m2) | ||||
| T(K) | 323.15 | 343.15 | 363.15 | 383.15 |
| SiO2 | 179.80 | 146.86 | 119.23 | 94.50 |
| MgO | 76.31 | 77.15 | 81.42 | 86.23 |
| ZnO | 71.12 | 61.88 | 54.11 | 47.71 |
| Monogal | 116.87 | 91.36 | 67.14 | 48.53 |
| Al2O3 | 128.31 | 106.07 | 86.64 | 67.71 |
| TiO2 | 70.06 | 60.18 | 51.74 | 45.15 |
| Untreated carbon fibers | 85.71 | 74.10 | 62.49 | 50.87 |
| Oxidized carbon fibers | 171.23 | 148.53 | 125.83 | 103.13 |
Disclaimer/Publisher’s Note: The statements, opinions and data contained in all publications are solely those of the individual author(s) and contributor(s) and not of MDPI and/or the editor(s). MDPI and/or the editor(s) disclaim responsibility for any injury to people or property resulting from any ideas, methods, instructions or products referred to in the content. |
© 2024 by the authors. Licensee MDPI, Basel, Switzerland. This article is an open access article distributed under the terms and conditions of the Creative Commons Attribution (CC BY) license (http://creativecommons.org/licenses/by/4.0/).
Copyright: This open access article is published under a Creative Commons CC BY 4.0 license, which permit the free download, distribution, and reuse, provided that the author and preprint are cited in any reuse.


