
Submitted:
18 January 2024
Posted:
22 January 2024
You are already at the latest version
Abstract
This paper is devoted to an accurate determination of the London dispersive and polar free energy of adsorption, the two Lewis acid γs+ and base γs- components of polar surface energy γsAB of 2D single-crystalline and polycrystalline covalent organic frameworks such as TAPPy-TPA-COFs. Inverse gas chromatography (IGC) at infinite dilution was used to quantify the different surface parameters of the different materials. From IGC measurements, one determined the net retention time of the adsorption of n-alkanes and several polar solvents on single-crystalline and polycrystalline covalent organic frameworks. The free surface Gibbs energy of adsorption was obtained for the various organic molecules at different temperatures from their net retention volume values. The separation between the London dispersive energy and the polar energy of adsorbed molecules was carried out by using a new thermodynamic parameter PSX chosen as new indicator variable and taken into account the deformation polarizability and the harmonic mean of the ionization energies of solvents and solid materials, derived from London dispersion equation. The obtained results are very promising for the accurate determination of the surface thermodynamic parameters of adsorption of organic solvents on solid surfaces.
Keywords:
deformation polarizability
; ionization energy
; London dispersive free energy
; polar energy of adsorption
; Lewis’s acid-base components of surface energy
; molecular separation distance
1. Introduction
Covalent organic frameworks (COFs), discovered by Yaghi et al. [1] in 2005 are very interesting crystalline organic porous materials exhibiting very important surface properties concerning their large specific surface area, porosity [2]. Many research works on COFs and their synthesis were developed, due to their aptitude to be used as excellent materials in various applications such as catalysis [3,4,5,6,7], Rechargeable Batteries [8,9,10], separation processes [11], light-emitting materials [12], biomedicine, biosensors and bioelectronics [13,14].
Some promising covalent organic frameworks, such as two-dimensional 2D-COFs composed of 2D-layered polymers, exhibited excellent thermal conductivity [15] and heterogeneous catalytic activity [16]. Two-dimensional imine-based covalent organic framework, single-crystalline and polycrystalline TAPPy-TPA-COF synthetized from 4,4′,4″,4‴-(pyrene-1,3,6,8-tetrayl) tetraaniline (TAPPy) and terephthalaldehyde (TPA), were recently studied by several authors [17,18,19,20,21,22]. The physicochemical properties of 2D-COFs were studied by inverse gas chromatography at infinite dilution by Natraj et al. [18] and Yusuf et al. [19].
One proposed, in this paper, to determine the London dispersive, polar free energy, the two Lewis acid and base components of polar surface energy of 2D single-crystalline and polycrystalline covalent organic frameworks such as TAPPy-TPA-COFs. The used technique was the inverse gas chromatography (IGC) at infinite dilution [23,24,25,26,27,28,29,30,31,32,33,34,35,36,37,38,39,40,41] based on the experimental determination of the net retention time and volume of several organic molecules adsorbed on the solid materials. The fundamental thermodynamic equation of IGC allowing to obtain the free energy of adsorption of any organic solvents on a solid surface was given in infinite dilution by the following equation:
In the case of non-polar solvents such as n-alkanes, the only free energy of adsorption is that of the London dispersion component given by:
For polar organic molecules, one has to add the specific free energy of adsorption:
Many methods and models were proposed in literature [23,24,25,26,27,28,29,30,31,32,33,34] to determine of polar solvents adsorbed on solid materials and the London dispersive surface energy of the studied materials. The values of and obtained by the various chromatographic methods are very different and strongly depend on the used molecular model and IGC methods. In previous papers, one showed that the surface area of organic molecules not only depends on the chosen molecular surface areas of molecules but also on the temperature [32,33,34,35,36,37] and this affects the different surface thermodynamic parameters. On the other hand, even if we previously proposed the expressions of the surface area of organic molecules and corrected the calculation of of solids, the expressions of these surface areas cannot be always transferred to any other solid.
In a recent paper [42], one proposed a new method based on that of the London dispersion expression [43] by using a new thermodynamic parameter dependent both on the deformation polarizability of the probe and on the ionization energies of the solid and the solvent :
This method using the equation of the London dispersion interaction [43] was used to better quantify the different Lewis acid-base contributions of the surface energy single-crystalline and poly-crystalline TAPPy-TPA-COFs as well as their polar surface energy.
2. IGC Method and materials
The chromatographic measurements obtained in other studies [18,19,44] led to determine the free energy of adsorption or of the adsorbed molecules on the solid substrates as a function of the temperature. The proposed method is that using the deformation polarizability of the adsorbed molecule and the harmonic mean of the ionization energies, given by relation (5):
By choosing as thermodynamic parameter and taking the adsorption of n-alkanes on the solid material, one can write the following equation (6):
The variations of as a function of gave a straight-line called “n-alkanes straight-line”
In the case of polar molecule X, one deduced the specific or polar free energy of interaction between the adsorbed molecule and the solid surface from equation (8) at a temperature T:
The determination of versus the temperature and obtain led to obtain the specific enthalpy and entropy of polar solvents, and therefore the Lewis’s acid base constants KA and KD by using equation (9):
Several organic solvents were used in this study: the n-alkanes composed by n-pentane, n-hexane, n-heptane and n-octane whereas the polar probes were the following: Lewis’s acid such as dichloromethane, basic such as ethyl acetate, diethyl ether, tetrahydrofuran and amphoteric such as acetonitrile. The experimental conditions of IGC technique were identical to those given in previous published papers [32,33,34,35].
3. Experimental results
3.1. Polar surface interactions between solid materials and organic molecules
On Table 1, one gave the different values of and of the various organic solvents and their ionization energy obtained from the Handbook of Physics and Chemistry [47].
The values of the harmonic mean of ionization energies and parameter were presented on Table 2.
By using the values presented on Table 1 and Table 2, one obtained the values of the polar free surface energy () of the polar solvents adsorbed on single-crystalline and poly-crystalline TAPPy-TPA-COFs as a function of the temperature T. On gave the obtained results on Table 3.
The values given on Table 3 showed that the polycrystalline TAPPy-TPA-COFs exhibited higher acid-base interactions than single-crystalline TAPPy-TPA-COFs for all polar solvents with an increasing amphoteric character.
Now, the polar surface energy of interaction reflecting the polarity of the adsorbate X was directly calculated from the values of () given on Table 3 by using the values of the surface areas of polar molecules as a function of the temperature given by Hamieh thermal model [32,33,34,35,36,37]. The obtained results for the two COFs were presented on Table 4.
Table 4 showed that the polar surface energy of interaction of polar molecules adsorbed on polycrystalline TAPPy-TPA-COFs is about 1.5 times greater than that of single-crystalline TAPPy-TPA-COFs for the different molecules and at any temperature. A decrease of of the various polar solvents was observed when the temperature increases. The values on Table 4 proved that the largest polar surface interaction was obtained with acetonitrile followed by tetrahydrofuran and ethyl acetate. This is certainly due to the presence of π-electron-rich triple bond that could enhance π−π interactions between acetonitrile and the two COFs and free pairs of electrons in tetrahydrofuran and ethyl acetate molecules.
3.2. Lewis’s acid and base surface energies of COFs
The Van Oss’s relation was used to determine the Lewis acid and base surface energies of the two COFs. Van Oss et al. proposed [48] the following equation:
where and are the respective acid-base contributions of the Lewis base surface energy of the solvent adsorbed on COFs.
The two monopolar solvents used were ethyl acetate (EA) and dichloromethane (CH2Cl2) respectively characterized by and . This led to the determination of the Lewis’s acid and base surface energies of the COFs by using relations (11):
The values of and as a function of the temperature are given by Table 3, whereas, the surface area and are taken from reference []. Furthermore, the total acid-base surface energy of the two COFs was obtained from relation (12).
Relations (11) and (12) allowed to determine the values of , and of single-crystalline and polycrystalline TAPPy-TPA-COFs. The results were given on Table 5.
Table 5 showed that the highest values of the polar acid and base surface energies were obtained for polycrystalline TAPPy-TPA-COF, whereas, those of single-crystalline TAPPy-TPA-COF are very weak proving the non-polar character of this material. This result confirmed that obtained when determining the specific free energy of adsorption on the two COFs and their polar surface energy of interaction . One also observed that total acid-base surface energy of polycrystalline TAPPy-TPA-COF is 5 times larger than that of single-crystalline TAPPy-TPA-COF with more accentuated value of the basic surface energy . However, one found approximately identical values for the acid surface energy of materials. It was observed a decrease of the different acid-base components of COFs when the temperature increases.
By using our thermal model, one determined the values of the dispersive component of the surface energy of the two COF materials as a function of the temperature. These values were given on Table 6. The values of from Table 5 allowed to obtain the total surface energy also called Lifshitz – Van der Waals (LW) surface energy of single-crystalline and polycrystalline TAPPy-TPA-COFs by using relation (13).
The results of Table 6 showed that the polycrystalline TAPPy-TPA-COF surface exhibited higher dispersive, polar and total surface energies about 1.5 times greater than those of the single-crystalline TAPPy-TPA-COF material.
3.3. Lewis’s acid-base parameters
The values of of the various polar molecules given on Table 3 as a function of the temperature allowed to obtain their polar or specific enthalpy ( and entropy ( of adsorption on the two COFs. Table 7 gave the obtained results.
The previous results concerning the polarity of the two studied COFs were here confirmed by the values on Table 7 of the polar enthalpy of adsorption of the polar solvents. One observed that all values of ( of adsorption on the polycrystalline TAPPy-TPA-COF were greater than the single-crystalline TAPPy-TPA-COF.
In order to better understand the Lewis acid-base behavior of the two COF surfaces, one determined the acid-base parameters following equation (9) and results on Table 7. On Figure 1, one plotted the variations as a function of of polar molecules adsorbed on the two COFs. The straight-line obtained exhibited two different slopes showing a difference between the Lewis acid-base constants of the studied materials and especially larger acidic constant for polycrystalline surface. The obtained results were given on Table 8.
Table 8 clearly showed the Lewis amphoteric character of the single and polycrystalline COFs with a greater Lewis basicity for the single-crystalline TAPPy-TPA-COF surface and greater Lewis acidity for the polycrystalline TAPPy-TPA-COF surface. It was also observed that and that the polycrystalline COF surface was more acidic than the single-crystalline COF surface, whereas, their basicity was comparable. The same results were confirmed by the Lewis entropic acid-base parameters.
The obtained results of the Lewis acid-base constants of the two COFs one again confirmed those obtained for the polar enthalpy and acid-base surface energies of the single and polycrystalline surfaces.
3.4. Consequences and discussion of the new results on COF surfaces
3.4.1. London dipersiveand polar energies of interaction
The new proposed parameter allowed a net separation between the London dispersion energy and the polar free energy of the adsorption of polar organic molecules and COF surfaces. The new method quatified the London dipersive energy of interaction for both n-alkanes by suing relation (14)
By applying relation (14), one obtained both the London dispersive and polar free energies of all solvents. The results of London dispersion interactions were presented on Table 9.
Table 9 also showed the higher values of the London dispersion inetractions of the polycrystalline TAPPy-TPA-COF than those obtained with the single-crystalline e TAPPy-TPA-COF for all used organic molecules and all temperatures. The results of Table 9 allowed to obtain the London dispersive enthalpy and entropy of interaction for the two COFs. The obtained values were given on Table 10.
One observed that the values of all dispersive and polar parameters of polycrystalline TAPPy-TPA-COF surface were greater than that of single-crystalline TAPPy-TPA-COF surface.
The results on Table 10 allowed to draw on Figure 2 the variations of London dispersion enthalpie ( as a function of London dispersion entropy ( for the two COFs and the variations corresponding to polar or specific variables of adsorption. A perfect linearity (with R2= 1) was observed. The obtained straight lines werere given below.
In the case of single-crystalline TAPPy-TPA-COF (SC) one obtained equation (15), whereas equation (16) was given for polycrystalline TAPPy-TPA-COF (PC) and
On also drew on Figure 1 the evolution the specific enthalpy as a function of the specific entropy and obtained the following equations:
These results conducted us to propose in both cases of dispersion and polar enthalpies and entropies the general equations (19) and (20) relative to the respective dispersion and polar cases:
By combining the two dispersion and polar effects, one obtained the following relations:
Table 10 and Figure 2 led to give the results of Table 11 these four characteristics for the two COFS.
These new findings deserve more reflection and deepening. One observed that the dispersion temperature is less than the polar temperature for the two COFs. However, the dispersion temperature is greater in the case of single-crystalline COF. The same result was obtained with the polar temperature. One gave on Table 11 the values of the intrinsic temperature and free energy of the materials. One found that that and showing that the higher intrinsic temperature was obtained by the single-crystalline COF with a difference between the two temperatures equal to 67.4K. These values will be probably related to the melting point or decomposition temperature of materials.
3.4.2. Comparison with the values obtained by using Donnet et al. method [27]
In order to comapre between our results and those obtained when using Donnet et al. method [27], one gave on Table 12 the values of specific free energy of polar solvents adsorbed on single-crystalline and polycrystalline surfaces.
The comparison between our results and those obtained by using Donnet et al. method [27] (Table 3 and Table 12) showed very large difference due to the insufficiency of the approach proposed by Donnet et al. [27] that neglected the role of the harmonic mean of the ionization energies of organic molecules and solid surface. One observed that the results on Table 12 clearly showed a large difference between the values obtained by the reaches for some polar molecules 1.7. Furthermore, a negative value of the specific free energy of dichloromethane was obtained by Donnet et al. method. This negative value of () cannot be acceptable for polar molecule. This resulted from the large approximation used by Donnet et al. two above methods. The same observations was showed for the ratios and that varied from 0.6 to 0.8 with also negative values when using Donnet method. These results led to acid-base parameters from Donnet al. method completely different from our new approach. Negative values were also obtained for the Lewis baisc constant by using Donnet al. method [27] showing the non-validity of Donnet et al. approach in this case.
3.4.3. Approximative evaluation of the separation distance H between particles
By using the new proposed method, we were able to determine the average separation distance H between the solid particle and the organic moolecule as a function of the temperature. Our results were given on Table 13.
One observed that the average separation distance H weakly varied as a function of the temperature and it is approximately the same for the two COF materials with a distance H comprised between 6.2 and 6.4 Å.
Furthermore, the total potential energy of interaction between a solid particle and an organic molecule, separated by a distance , is equal to the sum of the repulsive and Van der Waals attractive energies with their respective interaction constants and :
The expressions of and are respectively given by:
And be then written by the Lennard-Jones equation:
The total potential energy of interaction is cancelled for equal to:
Whereas, reaches its minimum energy for a minimal distance H given by:
One obtained relation (28):
This allowed to present the obtained results on Table 14.
Table 14 showed a sleight variation of and the ratio when the temperature varies. One observed a weak decrease of these parameters in the case of polycrystalline surface.
4. Conclusions
The London dispersive and polar surface thermodynamic parameters of single-crystalline and polycrystalline TAPPy-TPA-COFs were determined by inverse gas chromatography technique (IGC) at infinite dilution. One proposed a new method for the separation of London dispersive and polar surface energies. A new intrinsic thermodynamic parameter associating the deformation polarizability of molecules to the harmonic mean of the ionization energies of solid surface and organic molecules. From the measurements of the net retention volume of the adsorbed solvents on COF surfaces, the use of the new parameter and by varying the temperature, one obtained the polar interaction energy of the different polar molecules adsorbed on the crystalline and polycrystalline surfaces. This allowed to determine the different components , , of acid-base surface energies of solid surfaces and their total surface energy .
One showed that all polar or specific surface parameters of the crystalline COF surface were higher than those obtained with the single-crystalline surface. One observed an excellent linearity of versus of polar molecules adsorbed on crystalline and polycrystalline surfaces allowing the accurate determination of Lewis’s acid-base constants. The acidity of the polycrystalline surface was proved to be 1.5 times higher than that of the single-crystalline surface.
This new method allowed to determine the dispersive and specific enthalpy and entropy of adsorption, in both cases of single-crystalline (SC) and polycrystalline (PC) and proved that:
(
Two new characteritics of solid substrate and are respectively representing the interaction temperature and free intreaction energy of the solid. One found that that and showing that the higher intrinsic temperature was obtained by the single-crystalline COF with a difference between the two temperatures equal to 67.4K. These values will be probably related to the melting point or decomposition temperature of materials. This result has to be confirmed with other solid surfaces in future studies.
The comparison of our results with those obtained by Donnet method showed very large difference in the calculations of the specific or polar surface interactions. This resulted from the fact that Donnet method neglected the effect of the harmonic mean of the ionization energies on the different surface thermodynamic parameters.
These new results also allowed to determine an average value of the separation distance between the COF surfaces and the orgnaic molecules.
Funding
This research did not receive any specific grant.
Data Availability Statement
There is no additional data.
Conflicts of Interest
The author declares no conflict of interest.
References
- Côté, A. P.; Benin, A. I.; Ockwig, N. W.; O’Keeffe, M.; Matzger, A. J.; Yaghi, O. M. Porous, Crystalline, Covalent Organic Frameworks. Science 2005, 310(5751), 1166–1170. [Google Scholar] [CrossRef] [PubMed]
- Yongqiang Shi, Jinglun Yang, Feng Gao, Qichun Zhang, Covalent Organic Frameworks: Recent Progress in Biomedical Applications, ACS Nano 2023, 17, 3, 1879–1905. [CrossRef]
- Ding, S.-Y.; Gao, J.; Wang, Q.; Zhang, Y.; Song, W.-G.; Su, C.-Y.; Wang, W. Construction of Covalent Organic Framework for Catalysis: Pd/COF-LZU1 in Suzuki-Miyaura Coupling Reaction. J. Am. Chem. Soc. 2011, 133(49), 19816–19822. [Google Scholar] [CrossRef]
- . Sharma, R. K.; Yadav, P.; Yadav, M.; Gupta, R.; Rana, P.; Srivastava, A.; Zbořil, R.; Varma, R. S.; Antonietti, M.; Gawande, M. B. Recent development of covalent organic frameworks (COFs): synthesis and catalytic (organic-electro-photo) applications. Mater. Horizons 2020, 7(2), 411–454. [Google Scholar] [CrossRef]
- Wang, X.; Han, X.; Zhang, J.; Wu, X.; Liu, Y.; Cui, Y. Homochiral 2D Porous Covalent Organic Frameworks for Heterogeneous Asymmetric Catalysis. J. Am. Chem. Soc. 2016, 138(38), 12332–12335. [Google Scholar] [CrossRef] [PubMed]
- Fortea-Pérez, F. R.; Mon, M.; Ferrando-Soria, J.; Boronat, M.; Leyva-Pérez, A.; Corma, A.; Herrera, J. M.; Osadchii, D.; Gascon, J.; Armentano, D.; Pardo, E. The MOF-driven synthesis of supported palladium clusters with catalytic activity for carbene-mediated chemistry. Nat. Mater. 2017, 16(7), 760–766. [Google Scholar] [CrossRef] [PubMed]
- Tu, W.; Xu, Y.; Yin, S.; Xu, R. Rational Design of Catalytic Centers in Crystalline Frameworks. Adv. Mater. 2018, 30(33), 1707582. [Google Scholar] [CrossRef] [PubMed]
- Sun, T.; Xie, J.; Guo, W.; Li, D.-S.; Zhang, Q. Covalent-Organic Frameworks: Advanced Organic Electrode Materials for Rechargeable Batteries. Adv. Energy Mater. 2020, 10, 1904199. [Google Scholar] [CrossRef]
- Tong, Y.; Sun, Z.; Wang, J.; Huang, W.; Zhang, Q. Covalent organic framework containing dual redox centers as an efficient anode in Li-ion batteries. SmartMat 2022, 3(4), 685–694. [Google Scholar] [CrossRef]
- Zhong, L.; Fang, Z.; Shu, C.; Mo, C.; Chen, X.; Yu, D. Redox Donor-Acceptor Conjugated Microporous Polymers as Ultralong-Lived Organic Anodes for Rechargeable Air Batteries. Angew. Chem., Int. Ed. 2021, 60, 10164–10171. [Google Scholar] [CrossRef] [PubMed]
- Wang, Z.; Zhang, S.; Chen, Y.; Zhang, Z.; Ma, S. Covalent organic frameworks for separation applications. Chem. Soc. Rev. 2020, 49(3), 708–735. [Google Scholar] [CrossRef]
- Xu, S.; Zhang, Q. Recent progress in covalent organic frameworks as light-emitting materials. Mater. Today Energy 2021, 20, 100635. [Google Scholar] [CrossRef]
- Guo, B.; Huang, Z.; Shi, Q.; Middha, E.; Xu, S.; Li, L.; Wu, M.; Jiang, J.; Hu, Q.; Fu, Z.; Liu, B. Organic Small Molecule Based Photothermal Agents with Molecular Rotors for Malignant Breast Cancer Therapy. Adv. Funct. Mater. 2020, 30(5), 1907093. [Google Scholar] [CrossRef]
- Zhao, F.; Liu, H.; Mathe, S. D. R.; Dong, A.; Zhang, J. Covalent Organic Frameworks: From Materials Design to Biomedical Application. Nanomaterials 2018, 8(1), 15. [Google Scholar] [CrossRef] [PubMed]
- Giri, A.; Hopkins, P. E. Heat Transfer Mechanisms and Tunable Thermal Conductivity Anisotropy in Two-Dimensional Covalent Organic Frameworks with Adsorbed Gases. Nano Lett. 2021, 21, 6188–6193. [Google Scholar] [CrossRef]
- Guo, J.; Jiang, D. Covalent Organic Frameworks for Heterogeneous Catalysis: Principle, Current Status, and Challenges. ACS Cent. Sci. 2020, 6, 869–879. [Google Scholar] [CrossRef] [PubMed]
- X. Fu, Z. Lu, H. Yang, X. Yin, L. Xiao, L. Hou, Imine-based covalent organic framework as photocatalyst for visible-light-induced atom transfer radical polymerization, Journal of Polymer Science, 2021, Volume59, Issue18, 15 September 2021, Pages 2036-2044. [CrossRef]
- Natraj, A.; Ji, W.; Xin, J.; Castano, I.; Burke, D. W.; Evans, A. M.; Strauss, M. J.; Ateia, M.; Hamachi, L. S.; Gianneschi, N. C.; ALOthman, Z. A.; Sun, J.; Yusuf, K.; Dichtel, W. R. Single-Crystalline Imine-Linked Two-Dimensional Covalent Organic Frameworks Separate Benzene and Cyclohexane Efficiently. J. Am. Chem. Soc. 2022, 144, 19813–19824. [Google Scholar] [CrossRef] [PubMed]
- Yusuf, K.; Natraj, A.; Li, K.; Ateia, M.; Al Othman, Z.A.; Dichtel, W.R. Inverse Gas Chromatography Demonstrates the Crystallinity-Dependent Physicochemical Properties of Two-Dimensional Covalent Organic Framework Stationary Phases, Chemistry of Materials. 35, 2023; 35, 4, 1691–1701. [Google Scholar] [CrossRef]
- Vardhan, H.; Rummer, G.; Deng, A.; Ma, S. Large-Scale Synthesis of Covalent Organic Frameworks: Challenges and Opportunities. Membranes 2023, 13, 696. [Google Scholar] [CrossRef] [PubMed]
- Matsumoto, M., Dasari, R. R., Ji, W., Feriante, C. H., Parker, T. C., Marder, S. R., & Dichtel, W. R. (2017). Rapid, low temperature formation of imine-linked covalent organic frameworks catalyzed by metal triflates. Journal of the American Chemical Society, 139(14), 4999-5002. [CrossRef]
- de la Peña Ruigómez, A., Rodríguez-San-Miguel, D., Stylianou, K. C., Cavallini, M., Gentili, D., Liscio, F., ... & Zamora, F. (2015). Direct on-surface patterning of a crystalline laminar covalent organic framework synthesized at room temperature. Chemistry–A European Journal, 21(30), 10666-10670. [CrossRef]
- C. Saint-Flour, E. Papirer, Gas-solid chromatography. A method of measuring surface free energy characteristics of short carbon fibers. 1. Through adsorption isotherms, Ind. Eng. Chem. Prod. Res. Dev., 21 (1982) 337-341. [CrossRef]
- C. Saint-Flour, E. Papirer, Gas-solid chromatography: method of measuring surface free energy characteristics of short fibers. 2. Through retention volumes measured near zero surface coverage, Ind. Eng. Chem. Prod. Res. Dev., 21 (1982) 666-669. [CrossRef]
- C. Saint-Flour and E. Papirer, “Gas-solid chromatography: a quick method of estimating surface free energy variations induced by the treatment of short glass fibers.” Journal of Colloid and Interface Science 91 (1983): 69-75. [CrossRef]
- J. Schultz, L. Lavielle, C. Martin, The role of the interface in carbon fibre-epoxy composites. J. Adhes., 23 (1987) 45–60. [CrossRef]
- J.-B. Donnet, S. Park, H. Balard, Evaluation of specific interactions of solid surfaces by inverse gas chromatography, Chromatographia, 31 (1991) 434–440. [CrossRef]
- E. Brendlé, E. Papirer, A new topological index for molecular probes used in inverse gas chromatography for the surface nanorugosity evaluation, 2. Application for the Evaluation of the Solid Surface Specific Interaction Potential, J. Colloid Interface Sci., 194 (1997) 217–2224. [CrossRef]
- E. Brendlé, E. Papirer, A new topological index for molecular probes used in inverse gas chromatography for the surface nanorugosity evaluation, 1. Method of Evaluation, J. Colloid Interface Sci., 194 (1997) 207–216. [CrossRef]
- D. T. Sawyer, D.J. Brookman. Thermodynamically based gas chromatographic retention index for organic molecules using salt-modified aluminas and porous silica beads, Anal. Chem. 1968, 40, 1847–1850. [CrossRef]
- M.M. Chehimi, E. Pigois-Landureau, Determination of acid–base properties of solid materials by inverse gas chromatography at infinite dilution. A novel empirical method based on the dispersive contribution to the heat of vaporization of probes, J. Mater. Chem., 4 (1994) 741–745.
- T Hamieh, Study of the temperature effect on the surface area of model organic molecules, the dispersive surface energy and the surface properties of solids by inverse gas chromatography, J. Chromatogr. A, 1627 (2020) 461372. [CrossRef]
- T Hamieh, AA Ahmad, T Roques-Carmes, J Toufaily, New approach to determine the surface and interface thermodynamic properties of H-β-zeolite/rhodium catalysts by inverse gas chromatography at infinite dilution, Scientific Reports, 10 (1) (2020) 1-27. [CrossRef]
- T Hamieh, New methodology to study the dispersive component of the surface energy and acid–base properties of silica particles by inverse gas chromatography at infinite dilution, Journal of Chromatographic Science 60 (2) (2022) 126-142. [CrossRef]
- T. Hamieh, New Physicochemical Methodology for the Determination of the Surface Thermodynamic Properties of Solid Particles. AppliedChem 2023, 3(2), 229-255. [CrossRef]
- Hamieh, T.; Schultz, J. New approach to characterise physicochemical properties of solid substrates by inverse gas chromatography at infinite dilution. Some new methods to determine the surface areas of some molecules adsorbed on solid surfaces. J. Chromatogr. A 2002, 969, 17–47. [Google Scholar] [CrossRef]
- Hamieh, T.; Schultz J. Study of the adsorption of n-alkanes on polyethylene surface - State equations, molecule areas and covered surface fraction, Comptes Rendus de l’Académie des Sciences, Série IIb 1996, 323 (4), 281-289.
- Conder, J.R.; Locke, D.C.; Purnell, J.H. Concurrent solution and adsorption phenomena in chromatography. I. J. Phys. Chem. 1969, 73, 700-8. [CrossRef]
- Conder, J.R.; Purnell, J.H. Gas chromatography at finite concentrations. Part 2.—A generalized retention theory. Trans Faraday Soc. 1968, 64, 3100–11.
- Conder, J.R.; Purnell, J.H. Gas chromatography at finite concentrations. Part 3.—Theory of frontal and elution techniques of thermodynamic measurement. Trans Faraday Soc. 1969, 65, 824-38. [CrossRef]
- Voelkel, A. Inverse gas chromatography: characterization of polymers, fibers, modified silicas, and surfactants. Crit Rev Anal Chem. 1991, 22, 411–39. [Google Scholar] [CrossRef]
- Hamieh, T. New Progress on London Dispersive Energy, Polar Surface Interactions and Lewis’s Acid-Base Properties of Solid Surfaces. Preprints 2024, 2024010638. [Google Scholar] [CrossRef]
- F. London, The general theory of molecular forces, Trans. Faraday. Soc.,33, (1937), pp. 8-26. [CrossRef]
- Hamieh, T. New methods and Protocols to characterize the surface properties of solid materials, submitted to Chemistry of Materials, 2023.
- V. Gutmann, The Donor-acceptor Approach to Molecular Interactions, Plenum. New York, 1978.
- Riddle, F. L.; Fowkes, F. M. Spectral shifts in acid-base chemistry. Van der Waals contributions to acceptor numbers, Spectral shifts in acid-base chemistry. 1. van der Waals contributions to acceptor numbers. 1990, J. Am. Chem. Soc., 112 (9), 3259-3264. [CrossRef]
- David R. Lide, ed., CRC Handbook of Chemistry and Physics, Internet Version 2007, (87th Edition), <http:/www.hbcpnetbase.com>, Taylor and Francis, Boca Raton, FL, 2007.
- C.J. Van Oss, R.J. Good, M.K. Chaudhury, Additive and nonadditive surface tension components and the interpretation of contact angles, Langmuir, 1988, 4 (4) 884. [CrossRef]
Figure 1.
Variations of as a function of of polar molecules adsorbed on crystalline and polycrystalline surfaces.
Figure 1.
Variations of as a function of of polar molecules adsorbed on crystalline and polycrystalline surfaces.
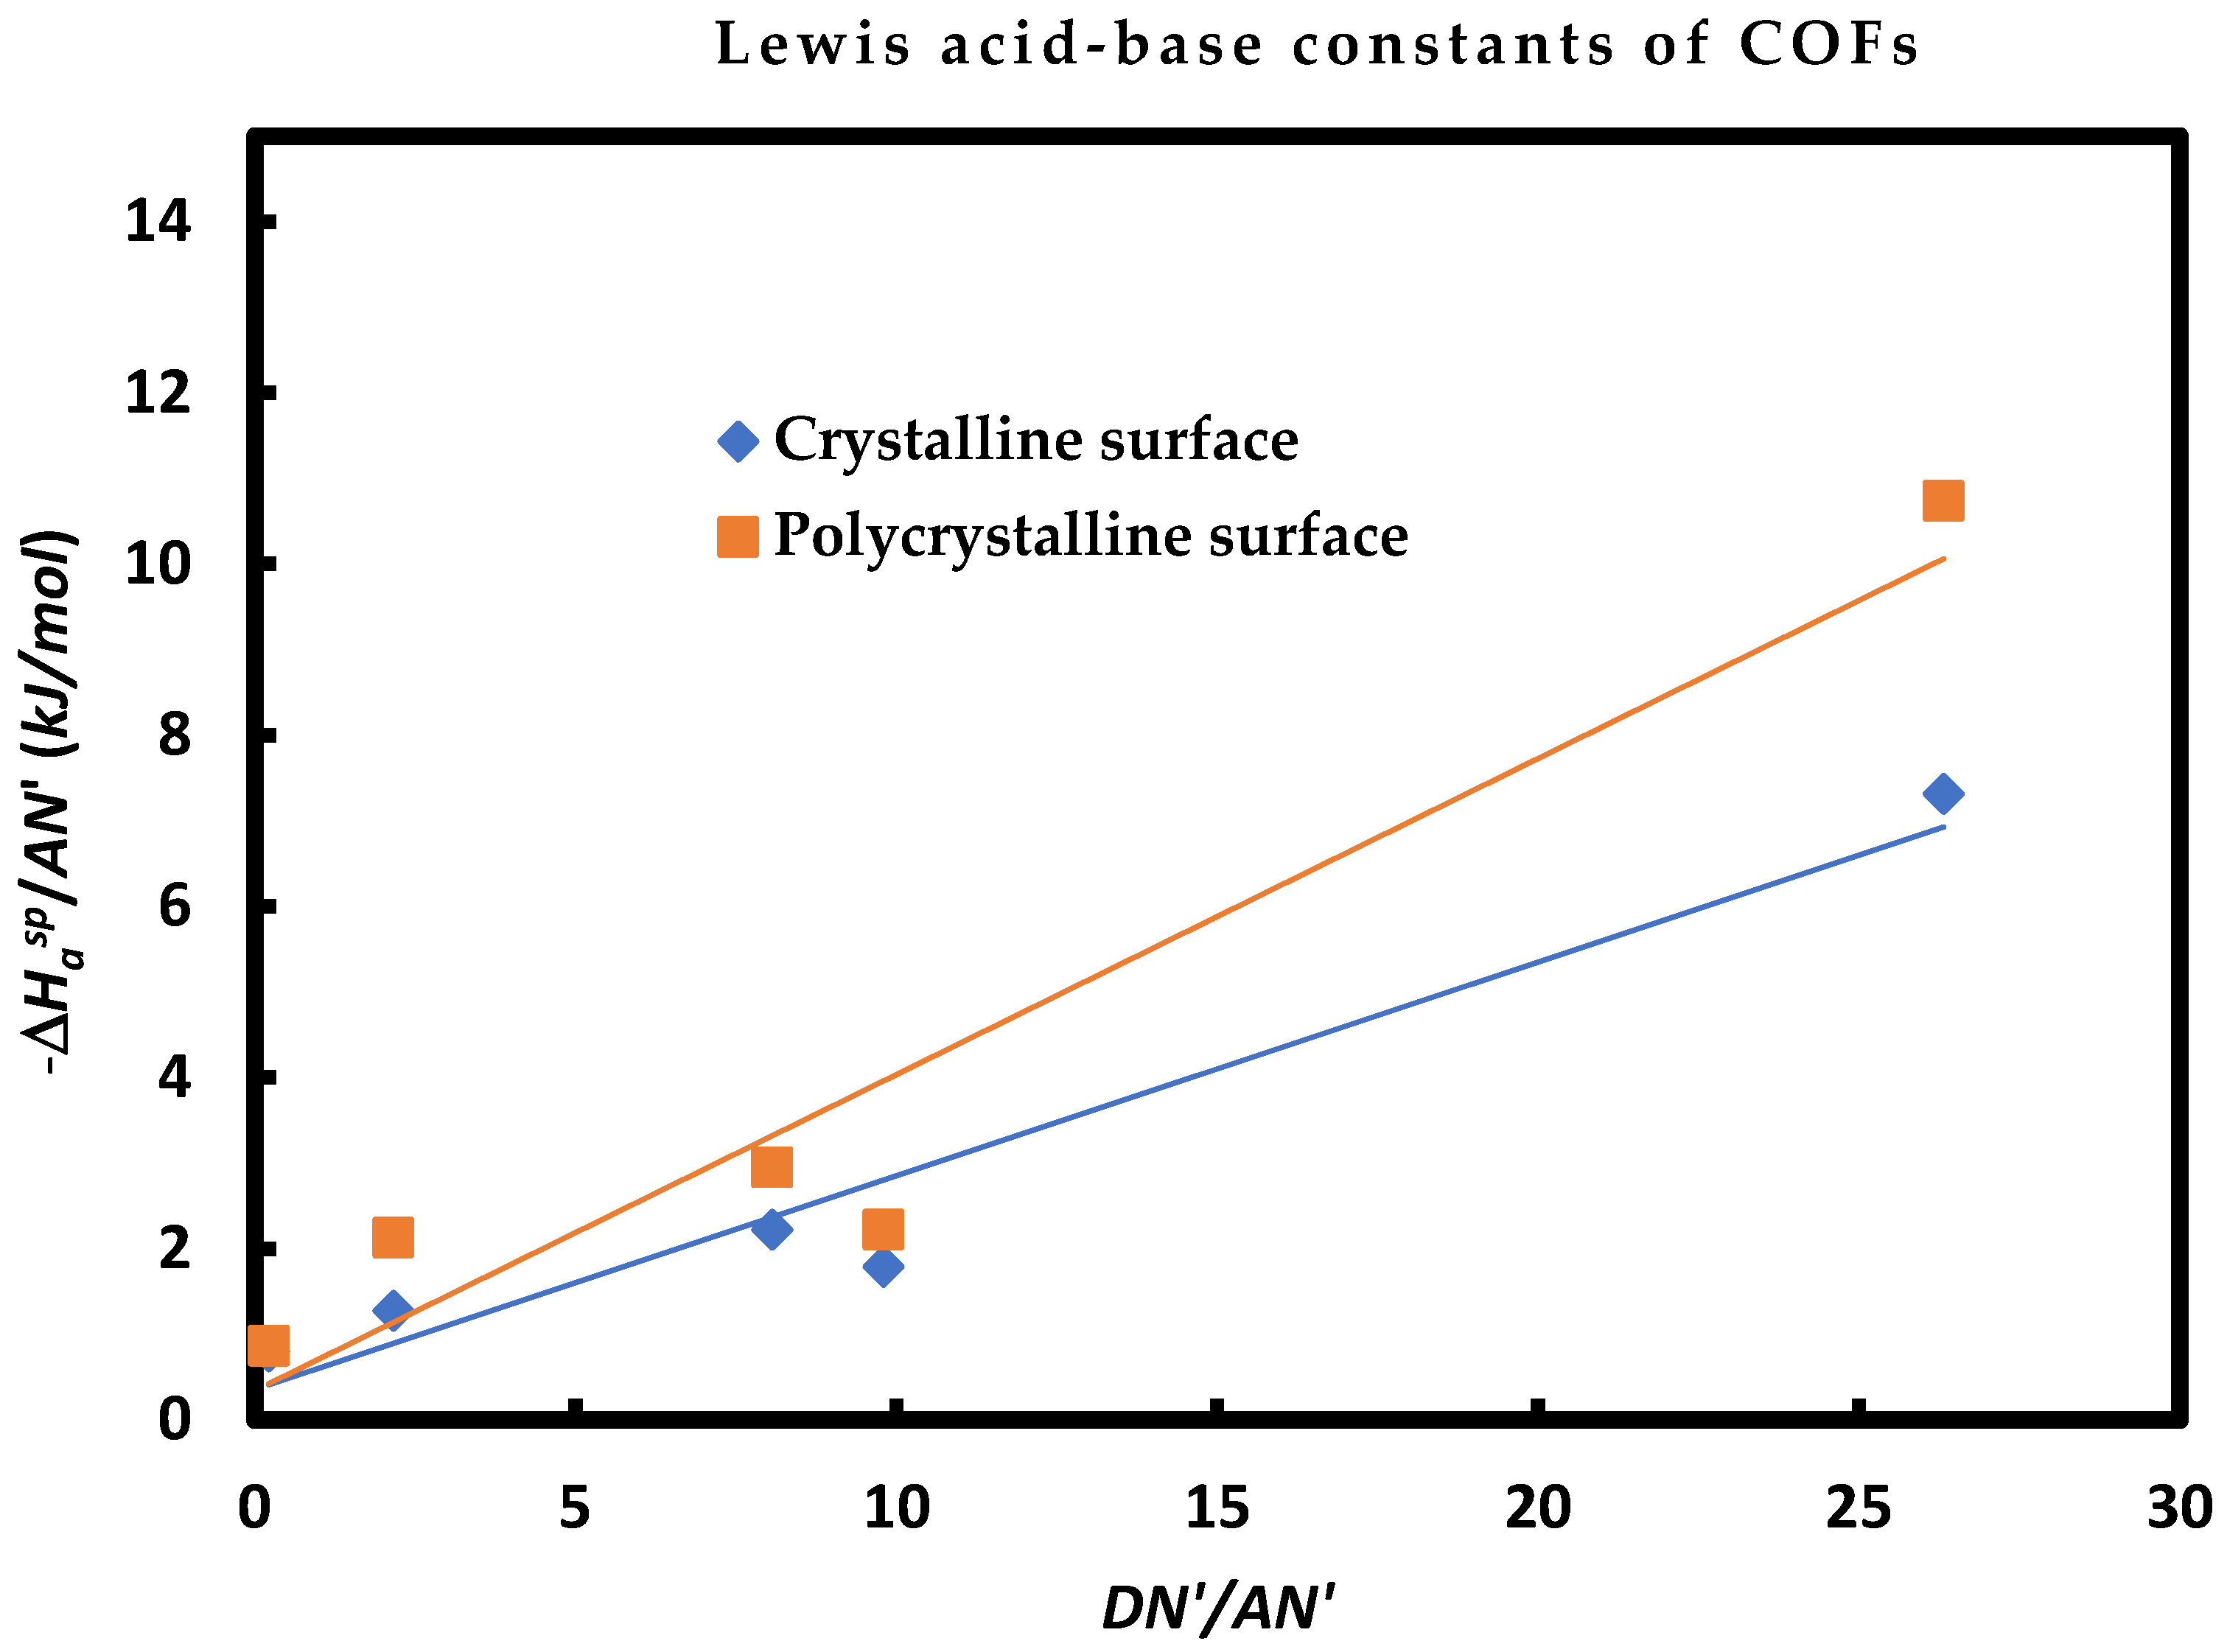
Figure 2.
Variations of London dispersion enthalpie () as a function of London dispersion entropy () for the two COFs and the variations corresponding to polar or specific variables () and () of adsorption.
Figure 2.
Variations of London dispersion enthalpie () as a function of London dispersion entropy () for the two COFs and the variations corresponding to polar or specific variables () and () of adsorption.
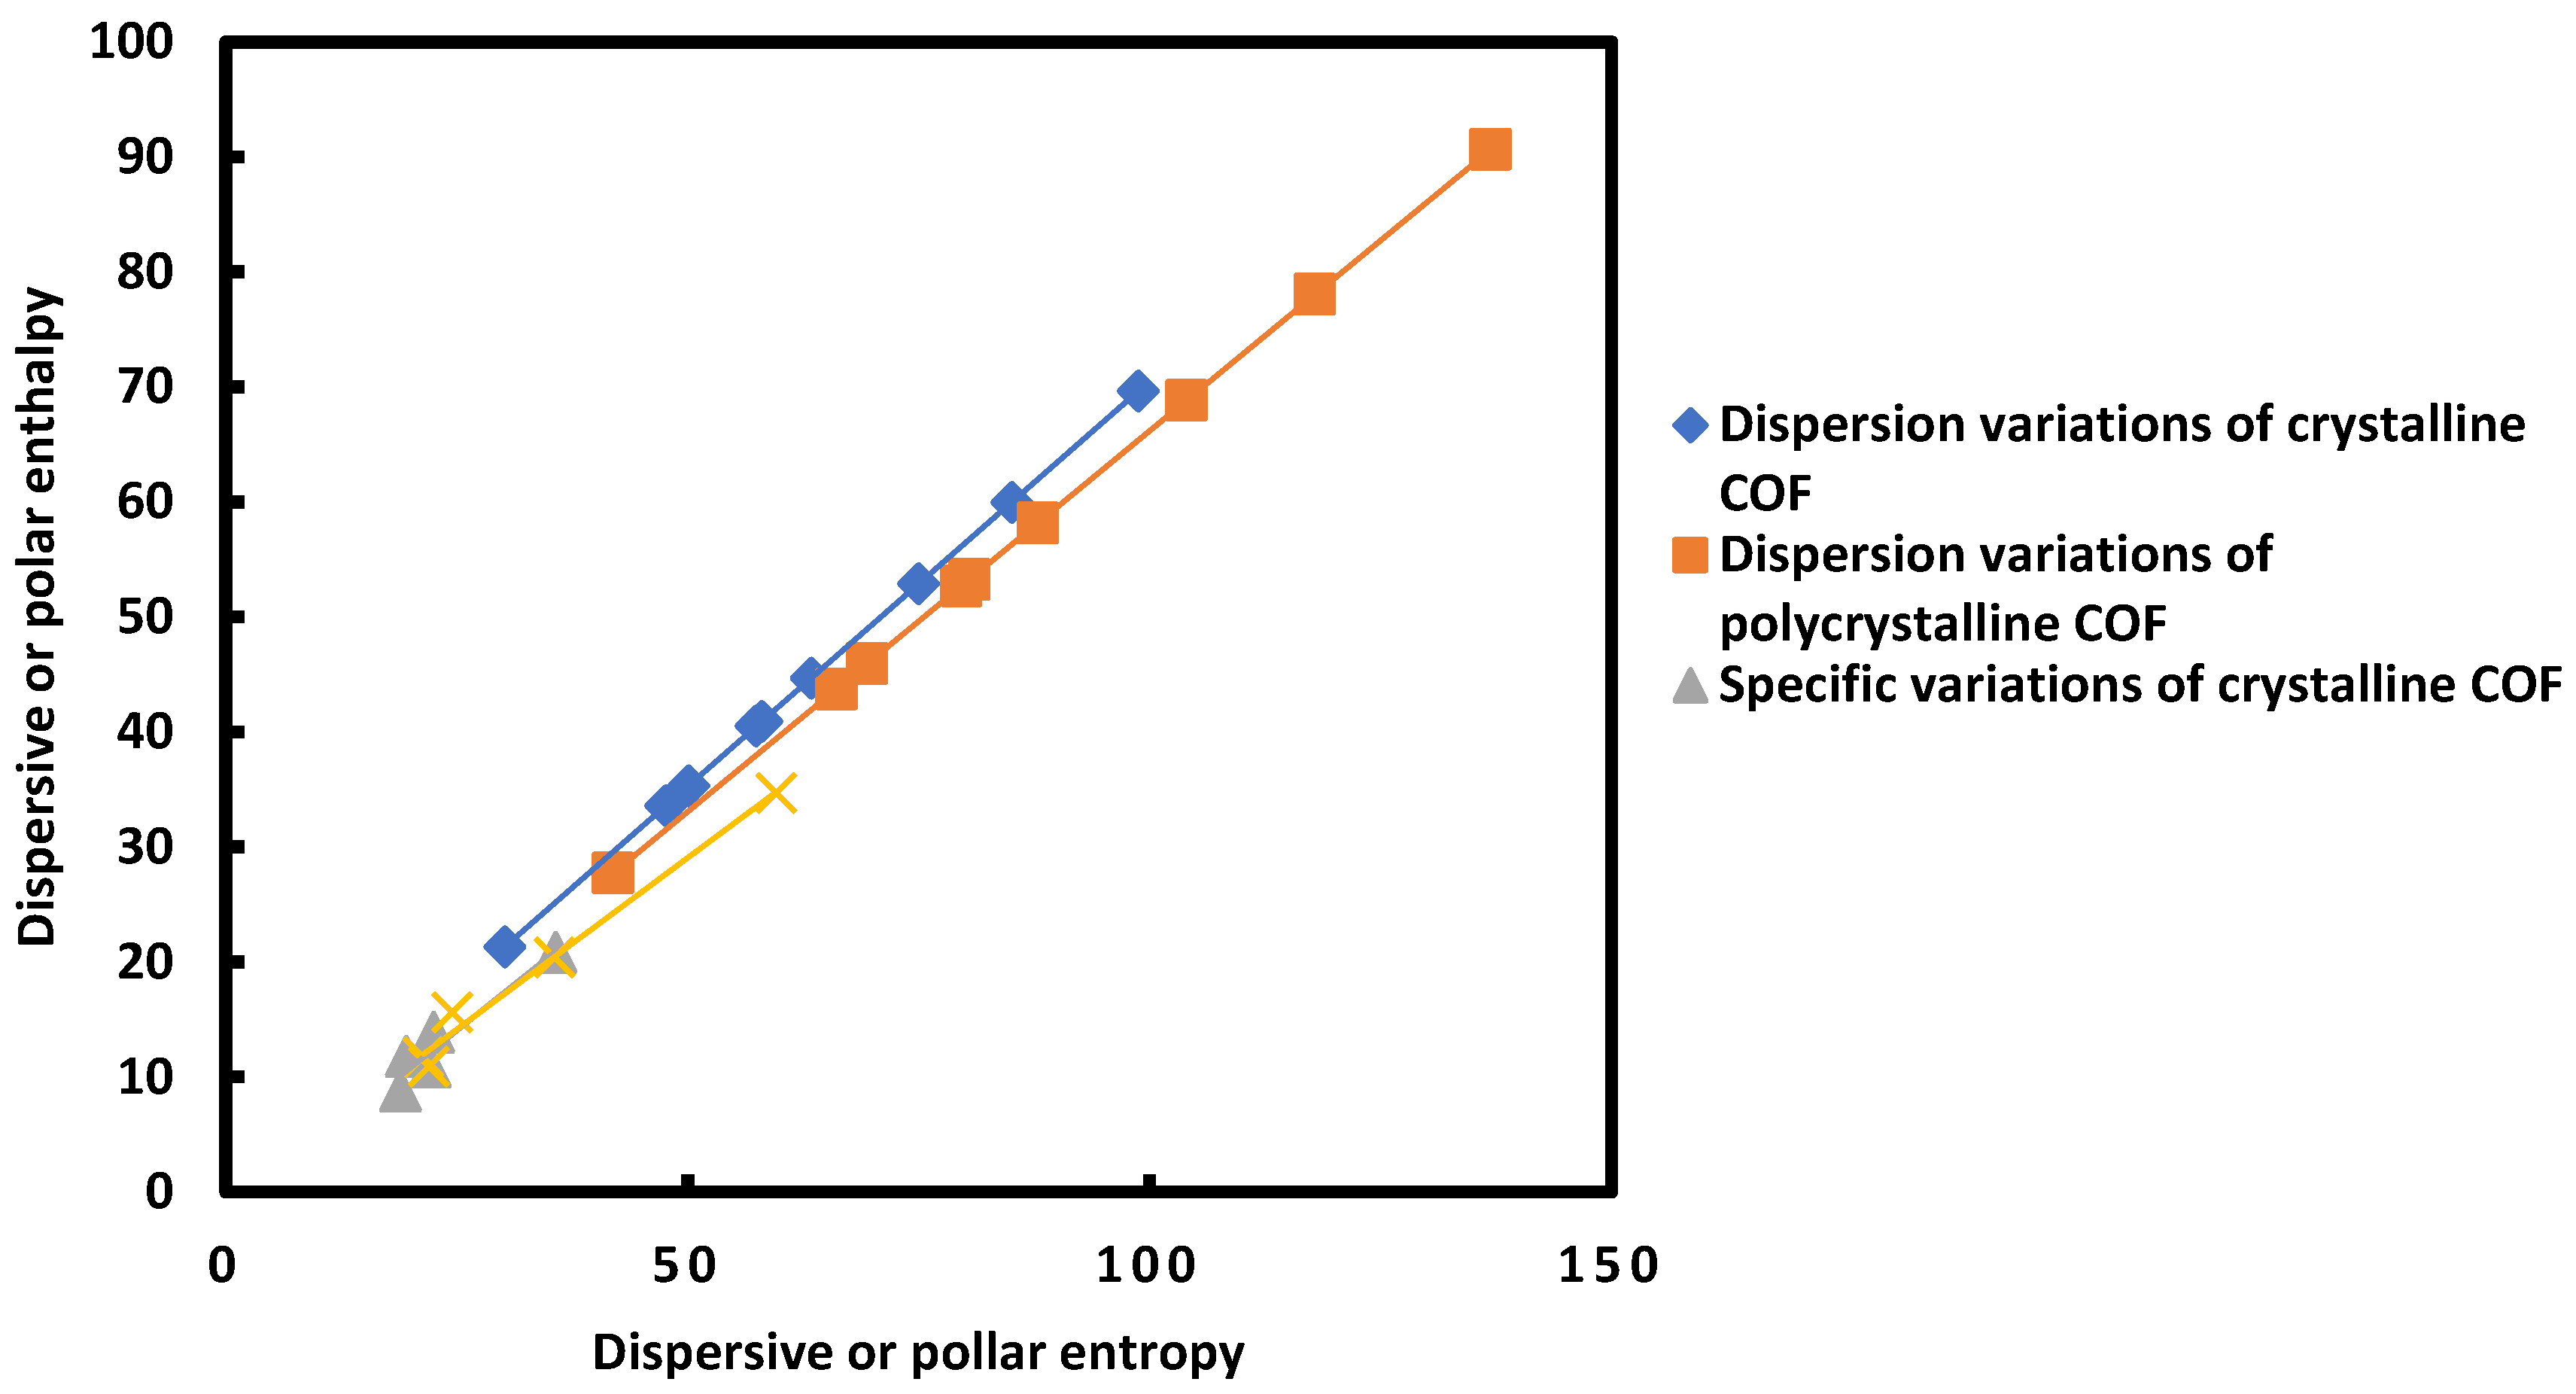

Table 1.
Values of deformation polarizability (in 10-30 m3) and (in 10-40 C m2/V) and ionization energy (in eV) of the various molecules.
Table 1.
Values of deformation polarizability (in 10-30 m3) and (in 10-40 C m2/V) and ionization energy (in eV) of the various molecules.
| Molecule |
(eV) |
(in 10-30 m3) |
(in 10-40 C m2/V) |
|---|---|---|---|
| n-pentane | 10.28 | 9.99 | 11.12 |
| n-hexane | 10.13 | 11.90 | 13.24 |
| n-heptane | 9.93 | 13.61 | 15.14 |
| n-octane | 9.80 | 15.90 | 17.69 |
| CH2Cl2 | 11.32 | 7.21 | 8.02 |
| Diethyl ether | 9.51 | 9.47 | 10.54 |
| Tetrahydrofuran | 9.38 | 8.22 | 9.15 |
| Ethyl acetate | 10.01 | 9.16 | 10.19 |
| Acetonitrile | 12.20 | 4.44 | 4.94 |
| TAPPy-TPA-COF | 7.88 | 22.38 | 24.9 |
Table 2.
Values of the harmonic mean of the ionization energies of TAPPy-TPA-COFs and organic solvents (in 10-19 J) and the parameter (in 10-15 SI unit) for the various organic molecules.
Table 2.
Values of the harmonic mean of the ionization energies of TAPPy-TPA-COFs and organic solvents (in 10-19 J) and the parameter (in 10-15 SI unit) for the various organic molecules.
| Molecule |
(in 10-19J) |
(in 10-15 SI) |
|---|---|---|
| n-pentane | 7.137 | 57.886 |
| n-hexane | 7.092 | 68.513 |
| n-heptane | 7.030 | 77.674 |
| n-octane | 6.989 | 90.213 |
| CH2Cl2 | 7.433 | 43.512 |
| Diethyl ether | 6.895 | 53.010 |
| Tetrahydrofuran | 6.852 | 45.726 |
| Ethyl acetate | 7.055 | 52.462 |
| Acetonitrile | 7.660 | 27.613 |
Table 3.
Values of () (in kJ/mol) of polar molecules adsorbed on single-crystalline and polycrystalline TAPPy-TPA-COFs.
Table 3.
Values of () (in kJ/mol) of polar molecules adsorbed on single-crystalline and polycrystalline TAPPy-TPA-COFs.
| Single-crystalline TAPPy-TPA-COFs | ||||
|---|---|---|---|---|
| T(K) | 393.15 | 403.15 | 413.15 | 423.15 |
| CH2Cl2 | 2.161 | 2.036 | 1.719 | 1.691 |
| Diethyl ether | 1.343 | 1.229 | 0.966 | 1.043 |
| THF | 5.031 | 4.879 | 4.565 | 4.385 |
| Ethyl Acetate | 4.149 | 3.925 | 3.683 | 3.580 |
| Acetonitrile | 6.794 | 6.364 | 6.069 | 5.702 |
| Polycrystalline TAPPy-TPA-COFs | ||||
| T(K) | 393.15 | 403.15 | 413.15 | 423.15 |
| CH2Cl2 | 3.317 | 3.019 | 3.382 | 2.998 |
| Diethyl ether | 2.245 | 2.049 | 1.805 | 2.024 |
| THF | 6.463 | 5.978 | 6.302 | 5.824 |
| Ethyl Acetate | 6.058 | 5.685 | 5.788 | 5.443 |
| Acetonitrile | 11.426 | 10.550 | 10.899 | 9.892 |
Table 4.
Values of polar surface energy of interaction (in mJ/m2) of polar molecules adsorbed on single-crystalline and polycrystalline TAPPy-TPA-COFs.
Table 4.
Values of polar surface energy of interaction (in mJ/m2) of polar molecules adsorbed on single-crystalline and polycrystalline TAPPy-TPA-COFs.
| Single-crystalline TAPPy-TPA-COFs | ||||
| T(K) | 393.15 | 403.15 | 413.15 | 423.15 |
| CH2Cl2 | 8.1 | 7.5 | 6.2 | 6.0 |
| Diethyl ether | 4.0 | 3.6 | 2.8 | 3.0 |
| THF | 21.0 | 20.3 | 18.9 | 18.1 |
| Ethyl Acetate | 13.8 | 13.0 | 12.1 | 11.7 |
| Acetonitrile | 20.7 | 19.2 | 18.1 | 16.8 |
| Polycrystalline TAPPy-TPA-COFs | ||||
| T(K) | 393.15 | 403.15 | 413.15 | 423.15 |
| CH2Cl2 | 12.5 | 11.1 | 12.3 | 10.7 |
| Diethyl ether | 6.7 | 6.0 | 5.2 | 5.8 |
| THF | 27.0 | 24.9 | 26.1 | 24.0 |
| Ethyl Acetate | 20.2 | 18.8 | 19.0 | 17.7 |
| Acetonitrile | 34.7 | 31.8 | 32.5 | 29.2 |
Table 5.
Values of the polar acid and base surface energies , and (in mJ/m2) of single-crystalline and polycrystalline TAPPy-TPA-COFs.
Table 5.
Values of the polar acid and base surface energies , and (in mJ/m2) of single-crystalline and polycrystalline TAPPy-TPA-COFs.
| In mJ/m2 | Single-crystalline TAPPy-TPA-COF | Polycrystalline TAPPy-TPA-COF | ||||
| T(K) | ||||||
| 393.15 | 2.54 | 2.07 | 4.59 | 7.46 | 4.42 | 11.48 |
| 403.15 | 2.21 | 1.82 | 4.01 | 6.37 | 3.81 | 9.85 |
| 413.15 | 1.55 | 1.57 | 3.11 | 5.33 | 3.50 | 8.63 |
| 423.15 | 1.46 | 1.45 | 2.92 | 4.38 | 3.19 | 7.47 |
Table 6.
Values of the dispersive and total surface energies (in mJ/m2) of single-crystalline and polycrystalline TAPPy-TPA-COFs.
Table 6.
Values of the dispersive and total surface energies (in mJ/m2) of single-crystalline and polycrystalline TAPPy-TPA-COFs.
| In mJ/m2 | Single-crystalline TAPPy-TPA-COF | Polycrystalline TAPPy-TPA-COF | ||
| T(K) | ||||
| 393.15 | 66.23 | 70.82 | 93.80 | 105.28 |
| 403.15 | 56.47 | 60.48 | 78.18 | 88.03 |
| 413.15 | 47.47 | 50.59 | 69.38 | 78.01 |
| 423.15 | 38.84 | 41.75 | 52.03 | 59.50 |
Table 7.
Values of () and () of adsorption on the single-crystalline and polycrystalline TAPPy-TPA-COFs.
Table 7.
Values of () and () of adsorption on the single-crystalline and polycrystalline TAPPy-TPA-COFs.
| Single-crystalline TAPPy-TPA-COF | ||
|---|---|---|
| Polar solvent | ) | ) |
| CH2Cl2 | 22.1 | 10.868 |
| Diethyl ether | 18.9 | 8.7816 |
| THF | 22.5 | 13.906 |
| Ethyl acetate | 19.5 | 11.792 |
| Acetonitrile | 35.7 | 20.819 |
| Polycrystalline TAPPy-TPA-COF | ||
| Polar solvent | ) | ) |
| CH2Cl2 | 21.4 | 11.756 |
| Diethyl ether | 22 | 10.899 |
| THF | 35.6 | 20.404 |
| Ethyl acetate | 24.5 | 15.652 |
| Acetonitrile | 59.6 | 34.712 |
Table 8.
Values of the enthalpic acid base constants and and the entropic acid base constants and of the single-crystalline and polycrystalline TAPPy-TPA-COFs with their corresponding acid base ratios and linear regression coefficients.
Table 8.
Values of the enthalpic acid base constants and and the entropic acid base constants and of the single-crystalline and polycrystalline TAPPy-TPA-COFs with their corresponding acid base ratios and linear regression coefficients.
| COF surfaces | ||||||||
|---|---|---|---|---|---|---|---|---|
| Single-crystalline COF | 0.149 | 0.213 | 1.430 | 0.947 | 0.236 | 0.570 | 2.413 | 0.9724 |
| Polycrystalline COF | 0.221 | 0.205 | 0.930 | 0.924 | 0.386 | 0.358 | 0.928 | 0.9361 |
Table 9.
Values of London dispersion interactions () of organic molecules adsorbed on single-crystalline and polycrystalline TAPPy-TPA-COFs.
Table 9.
Values of London dispersion interactions () of organic molecules adsorbed on single-crystalline and polycrystalline TAPPy-TPA-COFs.
| Single-crystalline TAPPy-TPA-COF | ||||
|---|---|---|---|---|
| T(K) | 393.15 | 403.15 | 413.15 | 423.15 |
| n-pentane | 19.861 | 19.073 | 18.431 | 17.962 |
| n-hexane | 23.507 | 22.575 | 21.815 | 21.260 |
| n-heptane | 26.650 | 25.593 | 24.731 | 24.102 |
| n-octane | 30.952 | 29.725 | 28.724 | 27.993 |
| CH2Cl2 | 14.929 | 14.337 | 13.854 | 13.502 |
| Diethyl ether | 18.188 | 17.467 | 16.878 | 16.449 |
| Tetrahydrofuran | 15.689 | 15.067 | 14.559 | 14.189 |
| Ethyl acetate | 18.000 | 17.286 | 16.704 | 16.279 |
| Acetonitrile | 9.474 | 9.098 | 8.792 | 8.568 |
| Polycrystalline TAPPy-TPA-COF | ||||
| T(K) | 393.15 | 403.15 | 413.15 | 423.15 |
| n-pentane | 23.664 | 22.471 | 22.298 | 20.793 |
| n-hexane | 28.008 | 26.597 | 26.391 | 24.610 |
| n-heptane | 31.753 | 30.153 | 29.920 | 27.900 |
| n-octane | 36.879 | 35.021 | 34.750 | 32.405 |
| CH2Cl2 | 17.788 | 16.891 | 16.761 | 15.630 |
| Diethyl ether | 21.671 | 20.579 | 20.420 | 19.041 |
| Tetrahydrofuran | 18.693 | 17.751 | 17.614 | 16.425 |
| Ethyl acetate | 21.447 | 20.366 | 20.209 | 18.845 |
| Acetonitrile | 11.288 | 10.719 | 10.636 | 9.918 |
Table 10.
Values of Values of London dispersion entropy () and enthalpy() of organic molecules adsorbed on single-crystalline and polycrystalline TAPPy-TPA-COF surfaces.
Table 10.
Values of Values of London dispersion entropy () and enthalpy() of organic molecules adsorbed on single-crystalline and polycrystalline TAPPy-TPA-COF surfaces.
| COF surfaces | Single-crystalline TAPPy-TPA-COF | Polycrystalline TAPPy-TPA-COF | ||
|---|---|---|---|---|
| Dispersion parameters | () | () | ) | ) |
| n-pentane | 63.4 | 44.702 | 87.9 | 58.171 |
| n-hexane | 75 | 52.909 | 104 | 68.85 |
| n-heptane | 85.1 | 59.983 | 117.9 | 78.056 |
| n-octane | 98.8 | 69.667 | 136.9 | 90.657 |
| CH2Cl2 | 47.6 | 33.602 | 66.1 | 43.726 |
| Diethyl ether | 58 | 40.937 | 80.5 | 53.271 |
| Tetrahydrofuran | 50.1 | 35.312 | 69.4 | 45.951 |
| Ethyl acetate | 57.4 | 40.514 | 79.6 | 52.721 |
| Acetonitrile | 30.2 | 21.324 | 41.9 | 27.749 |
Table 11.
Values of the new characteristics of single-crystalline and polycrystalline TAPPy-TPA-COF surfaces. These values were directly deduced from relations (15) to (22).
Table 11.
Values of the new characteristics of single-crystalline and polycrystalline TAPPy-TPA-COF surfaces. These values were directly deduced from relations (15) to (22).
| COF surfaces | Single-crystalline TAPPy-TPA-COF | Polycrystalline TAPPy-TPA-COF |
|---|---|---|
| (K) | 704.6 | 662.2 |
| (K) | 643.6 | 597.8 |
| (J/mol) | -50.1 | 20.1 |
| (J/mol) | 2046 | 817 |
| (K) | 755.3 | 687.9 |
| 3694 | 2788 |
Table 12.
Values of () (in kJ/mol), () and () of polar molecules adsorbed on single-crystalline and polycrystalline TAPPy-TPA-COFs by using Donnet et al. method [27].
Table 12.
Values of () (in kJ/mol), () and () of polar molecules adsorbed on single-crystalline and polycrystalline TAPPy-TPA-COFs by using Donnet et al. method [27].
| Single-crystalline surface | ||||||
|---|---|---|---|---|---|---|
| T(K) | 393.15 | 403.15 | 413.15 | 423.15 | () | () |
| CH2Cl2 | -6.994 | -6.753 | -6.774 | -6.586 | -12 | -11.684 |
| Diethyl ether | 2.422 | 2.268 | 1.970 | 2.023 | 14.9 | 8.2649 |
| THF | 5.271 | 5.114 | 4.791 | 4.607 | 23.1 | 14.385 |
| Ethyl Acetate | 3.047 | 2.871 | 2.663 | 2.587 | 15.9 | 9.2637 |
| Acetonitrile | 7.794 | 7.329 | 7.001 | 6.613 | 38.7 | 22.982 |
| Polycrystalline surface | ||||||
| T(K) | 393.15 | 403.15 | 413.15 | 423.15 | () | () |
| CH2Cl2 | -7.589 | -7.334 | -6.894 | -6.584 | -34.6 | -21.202 |
| Diethyl ether | 3.527 | 3.272 | 3.016 | 3.154 | 13.7 | 8.8457 |
| THF | 6.744 | 6.251 | 6.571 | 6.076 | 16.9 | 13.286 |
| Ethyl Acetate | 4.743 | 4.441 | 4.551 | 4.291 | 12.5 | 9.5951 |
| Acetonitrile | 12.608 | 11.680 | 12.019 | 10.938 | 46.7 | 30.864 |
Table 13.
Values of the average separation distance H (in Å) btween the two solid substrates and the organic molecules at different temperatures.
Table 13.
Values of the average separation distance H (in Å) btween the two solid substrates and the organic molecules at different temperatures.
| T(K) | 393.15 | 403.15 | 413.15 | 423.15 |
| Crystalline surface | 6.34 | 6.39 | 6.42 | 6.45 |
| Polycrystalline surface | 6.16 | 6.22 | 6.22 | 6.30 |
Table 14.
Values of and the ratio at different temperatures.
| TAPPy-TPA-COFS | Crystalline surface | Polycrystalline surface | ||
| T(K) | ||||
| 393.15 | 5.65 | 1.335 | 5.49 | 1.328 |
| 403.15 | 5.69 | 1.336 | 5.54 | 1.330 |
| 413.15 | 5.72 | 1.337 | 5.54 | 1.330 |
| 423.15 | 5.75 | 1.338 | 5.61 | 1.333 |
| Average values | 5.70 | 1.34 | 5.55 | 1.33 |
Disclaimer/Publisher’s Note: The statements, opinions and data contained in all publications are solely those of the individual author(s) and contributor(s) and not of MDPI and/or the editor(s). MDPI and/or the editor(s) disclaim responsibility for any injury to people or property resulting from any ideas, methods, instructions or products referred to in the content. |
© 2024 by the authors. Licensee MDPI, Basel, Switzerland. This article is an open access article distributed under the terms and conditions of the Creative Commons Attribution (CC BY) license (http://creativecommons.org/licenses/by/4.0/).
Copyright: This open access article is published under a Creative Commons CC BY 4.0 license, which permit the free download, distribution, and reuse, provided that the author and preprint are cited in any reuse.


