
Submitted:
18 April 2023
Posted:
19 April 2023
You are already at the latest version
Abstract
The study of the surface thermodynamic properties of solid materials is primordial for the determination of the dispersive surface energy, polar enthalpy of adsorption and Lewis’s acid base properties of solid particles. Inverse gas chromatography technique (IGC) at infinite dilution is the best surface technique for the determination of the surface physicochemical properties of materials. (1) Background: This paper was devoted to study the surface properties of solid materials such as alumina particles by using IGC technique. (2) Methods: Different methods and molecular models such as spherical, cylindrical, van der Waals, Redlich-Kwong, Kiselev and geometric models, were used to determine the London dispersive surface energy of solid surfaces. Hamieh model was also used and highlighted the thermal effect on the surface area of solvents. (3) Results: The variations of the dispersive surface energy and the free energy of adsorption were determined for alumina particles as a function of the temperature as well as their Lewis’s acid base constants. Alumina surfaces were proved to exhibit a strong Lewis amphoteric character three time more basic than acidic (4) Conclusions: The new methodology based on Hamieh model gave the more accurate results of the physicochemical properties of the particle surfaces.
Keywords:
Dispersive surface energy
; free energy of adsorption
; enthalpy and entropy of adsoption
; Lewis’s acid base parameters
; Hamieh thermal model
; work of adhesion.
1. Introduction
In most industrial processes, such as, adhesion, adsorption, polymer synthesis, dispersion, food manufacturing, pharmaceutical drugs, biomedicine, clays, composites, materials and nanomaterials, it is necessary to determine the physicochemical, surfaces and interfaces properties of solid materials. One of the most famous techniques that give information on the surface properties of materials and nanomaterials is inverse gas chromatography (IGC). This technique had a large success to determine the surface physicochemical properties of materials such as the dispersive surface energy, the specific free energy of adsorption and the Lewis-acid base parameters. Using IGC technique allowed the observation of the interactions between oxides, polymers or polymers adsorbed on oxides and organic solvent systems [1]. It was proved that this technique is very precise, sensitive, and more competitive to study the heterogeneous surfaces of solid surfaces, their physicochemical properties [2], and to determine dispersive surface energy of powdered materials [3,4]. This attractive technique was used since 1970 to quantify the specific interactions and the surface properties and glass transition of polymers, copolymers, their blends, polymer films [5,6,7,8,9,10,11,12,13,14,15,16,17,18]. It was also used to determine the surface energy, the physicochemical properties and the Lewis’s acid base of metals and metal oxides, minerals, clay minerals [19,20,21,22,23,24,25,26,27,28,29,30,31], silicas and porous materials [32,33,34,35,36,37,38,39], nanomaterials [40,41,42,43,44,45,46], pharmaceuticals and food products [47,48,49,50,51,52,53,54], and other materials [55,56,57,58,59,60,61,62,63,64,65,66,67,68].
In this paper we developed a new methodology for the determination of the physicochemical, dispersive and polar properties of alumina particles by using IGC technique at infinite dilution. We used all classical IGC methods and proposed to apply the new Hamieh’s thermal model [69] that was proved to be more accurate than the other models to determine the specific free enthalpy and enthalpy of adsorption and the acid-base constants of the different materials. Eight molecular models of organic molecules were also used to calculate the dispersive component of the surface energy of solid particles.
2. Methods and Models
2.1. Classical methods
Many methods were proposed in literature and used during the last fifty years. At the beginning, Sawyer and Brookman [70] found in 1968 an excellent linearity of the logarithm of the net retention volume of an adsorbed solvent on a solid, as a function of the boiling point of n-alkanes . The separation method of the dispersive (or London) and polar (or specific) interactions between a solid substrate and a polar molecule was proposed by Saint-Flour and Papirer [12,13]. These authors used the representation of versus the logarithm of the vapor pressure of probes:
where R is the ideal gas constant, T the absolute temperature and and constants depending on the interface solid-solvent. The distance relating the representative point of of a polar molecule to its hypothetic point located on the n-alkane straight-line determined the specific free energy of adsorption . The variation of versus the temperature led to the specific enthalpy and entropy of polar molecule adsorbed and therefore to the Lewis acid-base parameters. Five other IGC methods were proposed, to characterize the solid surfaces, a similar linearity to separate the two dispersive and polar components of the specific interactions. Two similar methods were used to determine the dispersive component of the surface energy of the solid. These methods are given below:
1. Dorris and Gray [71] first determined of solid materials by using Fowkes relation [72] and correlating the work of adhesion to the free energy of adsorption by the following relation:
where a is the surface area of adsorbed molecule, the dispersive component of the liquid solvent and the Avogadro’s number.
Dorris and Gray introduced the increment of two consecutive n-alkanes and :
By supposing the surface area of methylene group, , independent from the temperature and the surface energy of –CH2- equal to:
Dorris and Gray [71] then deduced the value of by the equation (3):
2. The method proposed by Schultz et al. [73] using Fowkes relation [72] similarly gave the free energy of adsorption as a function of the geometric mean of the respective dispersive components of the surface energy of the liquid solvent and the solid :
where a is the surface area of probes supposed constant for all temperatures and C and D two constants depending on the used materials and the temperature. The variations of versus of n-alkanes and polar molecules gave both the and of the solid.
In previous studies, one determined the dispersive component of many solid materials by using the various molecular areas of Kiselev, Van der Waals (VDW), Redlich-Kwong (R-K), Kiselev, geometric, cylindrical or spherical models [74,75,76,77,78,79].
3. The method deduced from the works of Sawyer and Brookman [70] used:
where A and B are two constants. This method gave the specific free energy and the acid base properties.
4. The method of the deformation polarizability proposed by Donnet et al. [80]. They proposed the following relation:
where is the electronic frequency of the probe, h the Planck’s constant and E and F constants of interaction.
5. Chehimi et al. [59] used the standard enthalpy of vaporization (supposed constant) of n-alkanes and polar molecules:
where I and J are two constants. This method is similar to Saint-Flour and Papirer method using and that of Sawyer and Brookman using .
6. The method of Brendlé and Papirer [2] used the concept of the topological index that is a parameter considering the topology and the local electronic density in the polar probe structure. They gave the following relation:
where M and N are two adsorption constants.
In all previous cases, the determination of of polar solvents versus the temperature will allow to deduce the specific enthalpy and entropy of polar probes adsorbed on the solid surfaces by using equation (1):
Knowing of polar solvents, the two respective acid base constants KA and KD of solids can be determined by Papirer following relation [12,13]:
That can be also written as:
where AN and DN respectively represent the electron donor and acceptor numbers of the polar molecule given by Gutmann [62] and corrected by Fowkes, and are the respective acid and base constant.
2.2. New methodology
2.2.1. Molecular models
The surface areas of solvents used in literature are those proposed by Kiselev and supposed constant for all temperatures. Hamieh et al [79] proposed six new molecular models that allowed the calculation of the surface areas of organic molecules: spherical (Sph.), geometric (Geom.), cylindric (Cyl.), Redlich-Kwong (R-K) and van der Waals (VDW) models compared to Kiselev results given in Table 1.
All these molecular models were used for the determination of the dispersive surface energy and Lewis’s acid base parameters of sold particles.
2.2.2. Hamieh’s thermal model
In a recent study, Hamieh [69] proved the dependency of the surface areas of molecules on the temperature. He gave the following relation of the surface area of n-alkanes as a function of the temperature:
By showing the failure of Dorris-Gray method that was largely used to determine of solids. This method considered the surface area of methylene group equal to 6 Å2 and constant for any used temperature. Hamieh [69] proved the non-validity of Dorris-Gray method and gave the following expression of (in Å2) as a function of the temperature T (in K):
Hamieh also gave the surface areas of polar molecules against the temperature by defining three new surface parameters: a first maximum temperature characteristics of the interaction between the polar solvents and the PTFE fibers, a second maximum temperature , an intrinsic characteristics of the dispersive surface tension of the polar molecules and a third geometric parameter proper to the molecule X itself. The general expression of the surface area of polar molecules was given below:
The large effect of the temperature on surface areas of molecules was here highlighted.
On the other hand, we highlighted an important effect of the temperature on the standard enthalpy of vaporization of organic molecules supposed constant by Chehimi et al. [59] and therefore proposed the following relation that can be used to determine the specific contribution of the Gibbs free energy of adsrption of poalr molecules on alumina particles:
where and are two constants of interaction.
2.2.3. The new Lewis’s acid base parameters
In several cases, the Gutmann method cannot be applied because the linearity of equation 11 is not satisfied for many solid substrates. This classical relationship was corrected and a new equation was proposed by Hamieh et al. [77,81] by adding a third parameter K reflecting the amphoteric character of the oxide or polymer according to:
By dividing by AN, we obtain:
or:
X1 = KD + KA X2 - K X3
With:
and K = K(KA,KD)
X1, X2 and X3 are known for every polar molecule, whereas KD, KA and K are the unknown parameters. The problem given by equation (16) is represented by a linear system for N solvents and admits a unique solution for N ≥ 3 giving the three unkown constants numbers: KD, KA and K.
On the other hand, in previous study Hamieh [83] proposed new entropic acidic and basic parameters to determine the entropic acid base character of the solid surfaces by writing:
or
3. Materials and solvents
The different solid particles used in this study are furnished by Aldrich. Classical organic probes, characterized by their donor and acceptor numbers, were used in this study. Corrected acceptor number AN′ = AN-ANd, given by Riddle and Fowkes [82], who subtracted the contribution of Van der Waals interactions (or dispersion forces). This acceptor number was normalized by Hamieh et al. [77,81] proposed to use dimensionless donor number DN′ and dimensionless acceptor number AN′. All probes (Aldrich) were highly pure grade (i.e., 99%). The probes used were n-alkanes (pentane, hexane, heptane, octane, and nonane); amphoteric solvents: acetonitrile, acetone; basic solvents: ethyl acetate, tetrahydrofuran (THF) and acidic solvent: chloroform and nitromethane.
On Table 2 gives, we gave the donor and acceptor numbers of polar probes used in this study.Chromatographic injections were made using Hamilton microsyringes. Measurements were carried out with a Focus GC Chromatograph equipped with a flame ionization detector of high sensitivity. The IGC measurements were performed on a commercial Focus GC gas chromatograph equipped with a flame ionization detector. Dried nitrogen was the carrier gas. The gas flow rate was set at 25 mL/min. The injector and detector temperatures were maintained at 400 K during the experiments.
Chromatographic injections were made using Hamilton microsyringes. Measurements were carried out with a Focus GC Chromatograph equipped with a flame ionization detector of high sensitivity. The IGC measurements were performed on a commercial Focus GC gas chromatograph equipped with a flame ionization detector. Dried nitrogen was the carrier gas. The gas flow rate was set at 25 mL/min. The injector and detector temperatures were maintained at 400 K during the experiments.
To achieve infinite dilution, 0.1 L of each probe vapor was injected with 1 L Hamilton syringes, in order to approach linear condition gas chromatography. The column temperatures were 300 K to 460 K, varied in 20 ºC steps. Each probe injection was repeated three times, and the average retention time, tR, was used for the calculation. The standard deviation was less than 1% in all measurements. All columns used in this study were prepared using a stainless-steel column with a 2 mm inner diameter and with an approximate length of 20 cm.
3. Results
3.1. Determination of the Gibbs free energy of adsorption
The results of the IGC technique at infinite dilution gave the net retention volume Vn of n-alkanes and polar molecules adosrbed on alumina at various temperatures in the interval [323.15K, 463.15K]. This allowed to obtain the Gibbs free energy of adsorption by using the following fundamental thermodynamic relation of IGC:
and is given by:
where s is the specific surface area of alumina and m the mass of the solid particles introduced in the coumn. Whereas, and are respectively given by the Kemball and Rideal reference state [21] at ºC by:
The obtained results are presented in Table 3.
Table 3 clearly showed that the standard free energy of adsorption decreases for every probe when the tempertaure increases (Figure 1) and decreasing at the same time the adsorption of molecules. One also observed that the values of the free energy of adsorption of polar solvents are greater than that of n-alkanes showing the strong polar interaction between alumina and polar molecules and proving the important Lewis’s acid base character of the solid surfaces.
From Table 3 and Figure 1, one deduced the values of the standard enthalpy and entropy of adsorption for all orgnaic molecules as shown in Table 4.
The polar molecules on Table 4 can be classified in decreasing order of standard entalpy of adsorption:
Diethyl ether > CH2Cl2 > THF > CHCl3 > Toluene > CCl4
(26)
Inequalities (21) showed that the alumina material exhibits an amphoteric character because the stronger adsorption is obtained with the amphoteric molecule such as diethyl ether.
In order to quantify the Lewis acid base properties, one used relation (10) by using the values of of polar molecules. A linear relation was obtained giving
and the values of the Lewis enthalpic acid base constants are respectively and , whereas, those relative to the entropic constants are and . These can be written in unitless as:
, , and . The respective ratios of enthalpic and entropic base on acid constants are therefore given by:
These results confirmed that the alumina surfaces have an amphoteric behavior with stronger Lewis’s base character 2.74 times greater than the acidic character. In this case, we proved that the Lewis and Bronsted concepts are very close showing the amphoteric behavior in both aqueous medium and solid surfaces.
3.2. London dispersive surface energy of alumina particles
In this section, we calculated the London dispersive component of alumina particles by using relations (3), (4), (12) and (13) and applying the various models of Van der Waals (VDW), Redlich-Kwong (R-K), Kiselev, geometric, cylindrical or spherical models [75,76,77,78,79], Dorris-Gray [69] and thermal model [71]. On Table 5, we gave the values of the London dispersive surface energy of alumina particles as a function of the temperature for the various methods and models.
The results on Table 5 and Figure 2 showed the linear decrease of when the temperature increases for all applied models and methods.
Three groups can be distinguished between the above models and methods:
1. The group constituted by Kiselev, cylindrical, VDW, geometric and Doris-Gray models taking into account the geometric form of n-alkanes and they presented very close values of and the surface of methylene group (Figure 3).
2. The second group concerns the models relative to thermal model, Redlich-Kwong equation and the global average results that concluded to the more accurate values of of alumina surfaces (Figure 3).
3. The third group is relative to spherical model and Gray-Hamieh model [69]. The obtained values of are higher than the true value, certainly because of the non-accurate values of the surface area of n-alkanes for these models (Figure 3).
The different equations giving of alumina particles as a function of the temperature for the various molecular models of n-alkanes were presented on Table 6 with the values of the dispersive surface entropy , the extrapolated values and the maximum of temperature allowed by by the chosen molecular model. Was defined by the following relation:
Table 6 showed the large difference between the values of dispersive surface entropy of the different molecular models compared to that given by Hamieh thermal model ) and the highest value obtained by the spherical model. The important result obtained here is the average value of with comparable values to the various models excepted for the case of Dorris -Gray.
3.2. Surface thermodynamic of alumina particles
3.2.1. The Gibbs specific free energy of adsorption
The variations of the Gibbs specific free energy () of the various polar solvents adsorbed on silica particle surface as a function of the temperature T were given on Table S1 (Supporting Information) for the various models such as Kiselev, Van der Waals, Redlich-Kwong, geometric, spherical and thermal models and IGC methods such as Boiling point, vapor pressure, deformation polarizability, enthalpy of vaporization, , and Topological index methods.
The values presented on Table S1 proved that there is no universal method that can give accurate results excepted the thermal model that took into account the temperature effect on the surface area of molecules. We observed on Table S1 the large difference in results obtained with the different models and methods that can reach 100% of the results given by the thermal model. We showed on Figure 4 the disparity in obtained results with different polar molecules adsorbed on alumina surfaces. The linear variations of plotted on Figure 4 and Table 7 giving the corresponding equations clearly proved that the slope and the ordinate at origin strongly depend on the chosen model or used method and for every polar molecule.
3.2.2. Lewis’s acid base parameters
From the equations on Tables 7, we deduced the values of ( and ( relative to the adsorption of CCl4, CH2Cl2, CHCl3, diethyl ether, THF and toluene on alumina particles by using the various molecular models and methods. The results were presented on Table 8 and Table 9.
The calculations of the average, standard deviation and error percentage committed on the values of the specific enthalpy of adsorption on alumina reflect the dispersion of results obtained by the models and methods compared to the thermal model. One conluded here that the error with CCl4 is 51.86% followed by toluene (21.96%), CH2Cl2 (20.47%), CHCl3 (13.91%), THF (8.18%) and diethyl ether (5.01%). The results on Table 8 showed that the IGC methods that match better the thermal models are the following: boiling point, vapor pressure and enthalpy of vaporization; followed by the other molecular models such as cylindrical and Kiselev models.
For the specific entrop of adsorption (Table 9), the error percentage reaches 77.02 with CCl4, 31.97 with CH2Cl2 followed by THF (12.98%), CHCl3 (12.46%), THF (8.18%) and diethyl ether (5.01%). The closer methods to the thermal models are identical to those obtained with the specific enthalpy of adsorption proving the effect of the temperature on the surface area of organic molecules.
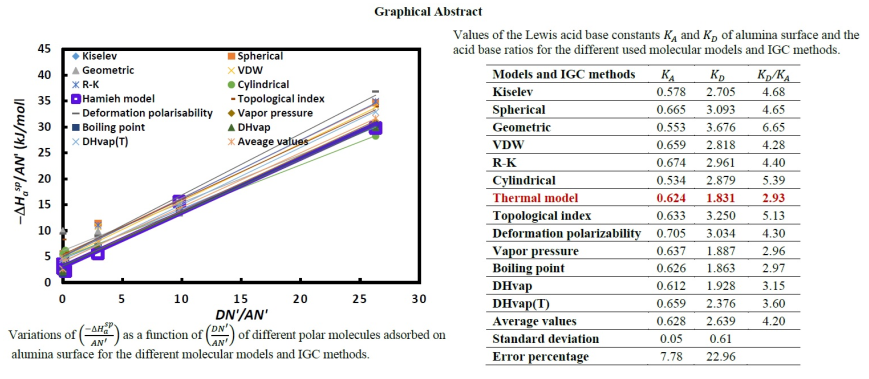
The acid base parameters of alumina were obtained from Table 8 and Table 9 and allowed to plot Figure 5 and Figure 6 representing the respective variations of and as a function of . The excellent linearity obtained with the different models gave on Table 10 the values of Lewis enthalpic acid base constants and and Lewis entropic acid base constants and of alumina surface. The values of the acid base parameters obtained the thermal model are the following:
These results proved the amphoteric character of alumina surfaces with stronger Lewis’s basicity about three times more important than the Lewis’s acidity of alumina. The same tendency was observed with the entropic acid base parameters.
Table 10 showed that the best models or methods that gave results comparable to those obtained by the thermal model are the following: boiling point, vapor pressure and enthalpy of vaporization methods proving the important effect of the temperature on the surface areas adsorbed on alumina particles.
4. Discussion
Since 1982, scientists were interested to the determination of physicochemical properties of materials by using inverse gas chromatography at infinite dilution. Saint-Flour and Papirer [12,13] have first tried to separate the two dispersive and polar contributions of the Gibbs free energy of adsorption of polar solvents on solid substrates by using the notion of vapor pressure of organic molecules. Schultz et al [73], Donnet et al. [80], Brendlé and Papirer [2] and other scientists [10,14,20,23,33,36,59] were also interested to the determination of specific and dispersive properties of materials. There was no universal method or model to be used in IGC at infinite dilution for an accurate characterization of solid particles. Even Dorris-Gray relation [71] cannot give a precise value of the dispersive component of the solid surface of solid materials. Hamieh et al. [35,77,78,81 have nevertheless succeeded in carrying out a very precise determination of the second-order temperatures (such as the glass transition) of polymers such as poly (methyl methacrylate) or pol (a-n-alkyl) methacrylate in bulk phase or in adsorbed state. The serious difficulty faced by researchers during 40 years was the problem of the diversity of methods and models used to determine the surface properties of a solid material such as the dispersive free surface energy, the specific free energy and the Lewis’s acid-base constants without obtaining the same results. Indeed, we proved in several previous studies that the various models and methods of IGC technique did not give the same results. On the contrary, the methods used gave results completely different from each other. The error percentage sometimes exceeds 100% from one method to another. Our previous works highlighted the important effect of the temperature on the surface area of organic solvents. We failed the methods proposed by Dorris-Gray [71] and Schultz et al. [73] that supposed a constant value of the surface area of organic molecules and we proposed various relations of the surface area of probes depending on the temperature and corrected the values of the dispersive surface energy and polar properties of materials. Our new methodology was applied to the alumina particles and determined with an excellent accuracy the surface physicochemical properties of alumina. The thermal model [69] has to be applied in the future for a good characterization of solid surfaces.
On the other hand, we observed similar results between the thermal model [69] and those given by equations (27) and (28) by using the values of the standard enthalpy () and entropy ( of adsorption of polar molecules on alumina surfaces. The last way can resolve some difficulties related to the choose of the best model for more accurate results of the surface thermodynamic properties of materials.
5. Conclusions
The surface thermodynamic properties such as the London dispersive component of the surface energy, the Gibbs free energy of adsorption, the specific interactions and the Lewis’s acid base parameters of alumina particles were determined by using the inverse gas chromatography technique at infinite dilution an applying 15 molecular models and chromatographic methods.
The determination of the London dispersive surface energy of alumina by using the various molecular models showed that Dorris-Gray formula [71] and Schultz et al. method [73] cannot be used for an accurate determination of of solid alumina. We corrected the calculation of by using the new thermal model that took into account the change of the surface areas of organic molecules as a function of the temperature. The following relation was therefore obtained:
with a dispersive surface entropy equal to and the maximum of temperature, characteristic of alumina, equal to .
The specific Gibbs free energy was obtained by the different molecular models and methods. All methods were proved to be inaccurate except that of the thermal model. However, the methods based on the effect of the temperature on the thermodynamic parameters such as the vapor pressure, the boiling point temperature and the standard enthalpy of vaporization gave results closer to those obtained by Hamieh thermal model [69]. We gave below the variations of the Specific Gibbs free energy of polar molecules adsorbed on alumina surfaces as a function of the temperature with the values of the specific enthalpy and entropy of adsorption.
| Polar molecule | (kJ/mol) | ||
| CCl4 | = -0.021 T + 12.489 | 12.489 | 21 |
| CH2Cl2 | = -0.135 T + 83.700 | 83.700 | 135 |
| CHCl3 | = -0.136 T + 65.871 | 65.871 | 136 |
| Diethyl ether | = -0.088 T + 68.367 | 68.367 | 88 |
| THF | = -0.071 T + 53.71 | 53.71 | 71 |
| Toluene | = -0.041 T + 21.91 | 21.91 | 41 |
These results clearly showed the strong Lewis basicity of alumina proved by the strong interactions between the more acidic solvent (CH2Cl2) with = 83.700 kJ/mol and also an important amphoteric character.
The use of the thermal model led to the following Lewis acid base parameters:
Thus, showing that the alumina surface is about three times more basic than acidic. The same tendency was observed with the entropic acid base parameters. Comparable values of the acid base parameters of alumina were obtained by using the methods of vapor pressure, boiling point or the standard enthalpy of vaporization.
The new methodology proposed in this study will therefore allow to obtain an accurate determination of the London dispersive surface energy, the Gibbs free energy, the specific enthalpy and entropy of adsorption of polar molecules on the solid surfaces as well as the Lewis acid base parameters of solid substrates.
Supplementary Materials
The following supporting information can be downloaded at the website of this paper posted on Preprints.org. Table S1: Values (in kJ/mol) of the specific free energy () of the various polar solvents adsorbed on alumina particles surface for different temperatures by using the various molecular models and IGC methods.
Conflicts of Interest
“The authors declare no conflict of interest.”
References
- Pyda, M.; Guiochon, G. Surface properties of silica-based adsorbents measured by inverse gas–solid chromatography at finite concentration. Langmuir 1997, 13, 1020–1025. [Google Scholar] [CrossRef]
- Brendlé, E.; Papirer, E. A New Topological Index for Molecular Probes Used in Inverse Gas Chromatography for the Surface Nanorugosity Evaluation. J. Colloid Interface Sci. 1997, 194, 207–216. [Google Scholar] [CrossRef] [PubMed]
- Thielmann, F.; Baumgarten, E. Characterization of Microporous Aluminas by Inverse Gas Chromatography. J. Colloid Interface Sci. 2000, 229, 418–422. [Google Scholar] [CrossRef] [PubMed]
- Onjia, A.E.; Milonjić, S.K.; Todorović, M.; Loos-Neskovic, C.; Fedoroff, M.; Jones, D.J. An Inverse Gas Chromatography Study of the Adsorption of Organics on Nickel- and Copper-Hexacyanoferrates at Zero Surface Coverage. J. Colloid Interface Sci. 2002, 251, 10–17. [Google Scholar] [CrossRef]
- Conder, J.R.; Locke, D.C.; Purnell, J.H. Concurrent solution and adsorption phenomena in chromatography. I. J. Phys. Chem. 1969, 73, 700–708. [Google Scholar] [CrossRef]
- Conder, J.R.; Purnell, J.H. Gas chromatography at finite concentrations. Part 2.—A generalized retention theory. Trans Faraday Soc. 1968, 64, 3100–11. [Google Scholar] [CrossRef]
- Conder, J.R.; Purnell, J.H. Gas chromatography at finite concentrations. Part 3.—Theory of frontal and elution techniques of thermodynamic measurement. Trans. Faraday Soc. 1969, 65, 824–838. [Google Scholar] [CrossRef]
- Conder, J.R.; Purnell, J.H. Gas chromatography at finite concentrations. Part 4.—Experimental evaluation of methods for thermodynamic study of solutions. Trans. Faraday Soc. 1969, 65, 839–848. [Google Scholar] [CrossRef]
- Conder, J.R.; Purnell, J.H. Gas chromatography at finite concentrations. Part 1.—Effect of gas imperfection on calculation of the activity coefficient in solution from experimental data. Trans. Faraday Soc. 1968, 64, 1505–1512. [Google Scholar] [CrossRef]
- Papirer, E.; Balard, H.; Rahmani, Y.; Legrand, A.P.; Facchini, L.; Hommel, H. Characterization by inverse gas chromatography of the surface properties of silicas modified by poly(ethylene glycols) and their models (oligomers, diols). Chromatographia 1987, 23, 639–647. [Google Scholar] [CrossRef]
- Vidal, A.; Papirer, E.; Jiao, W.M.; Donnet, J.B. Modification of silica surfaces by grafting of alkyl chains. I — Characterization of silica surfaces by inverse gas-solid chromatography at zero surface coverage. Chromatographia 1987, 23, 121–128. [Google Scholar] [CrossRef]
- Flour, C.S.; Papirer, E. Gas-solid chromatography. A method of measuring surface free energy characteristics of short glass fibers. 1. Through adsorption isotherms. Ind. Eng. Chem. Prod. Res. Dev. 1982, 21, 337–341. [Google Scholar] [CrossRef]
- Flour, C.S.; Papirer, E. Gas-solid chromatography: method of measuring surface free energy characteristics of short fibers. 2. Through retention volumes measured near zero surface coverage. Ind. Eng. Chem. Prod. Res. Dev. 1982, 21, 666–669. [Google Scholar] [CrossRef]
- Papirer, E.; Balard, H.; Vidal, A. Inverse gas chromatography: A valuable method for the surface characterization of fillers for polymers (glass fibres and silicas). Eur. Polym. J. 1988, 24, 783–790. [Google Scholar] [CrossRef]
- Voelkel, A. Inverse Gas Chromatography: Characterization of Polymers, Fibers, Modified Silicas, and Surfactants. Crit. Rev. Anal. Chem. 1991, 22, 411–439. [Google Scholar] [CrossRef]
- Schuster, R.H.; Graeter, H.; Cantow, H.J. Thermodynamic studies on polystyrene-solvent systems by gas chromatography. Macromolecules 1984, 17, 619–625. [Google Scholar] [CrossRef]
- Öner, M.; Dinçer, S. Thermophysical properties of polymer-probe pairs by gas chromatography. Polymer 1987, 28, 279–282. [Google Scholar] [CrossRef]
- Guillet, J. E.; Romansky, M.; Price, G.J.; Van der Mark, R. Studies of polymer structure and interactions by automated inverse gas chromatography. Inverse gas chromatography. 1989, Washington, DC: Characterization of Polymers and Other Materials, American Chemical Society 20–32. Eng. Asp. 2002, 206, 547–554. [Google Scholar]
- Katsanos, N.A.; Gavril, D.; Kapolos, J.; Karaiskakis, G. Surface energy of solid catalysts measured by inverse gas chromatography. J. Colloid Interface Sci. 2003, 270, 455–461. [Google Scholar] [CrossRef]
- Balard, H.; Brendlé, E.; Papirer, E. Determination of the acid–base properties of solid surfaces using inverse gas chromatography: advantages and limitations. In: Mittal, K.L., Editor. Acid–Base Interactions, Relevance to Adhesion Science and Technology. Vol. 2: CRC Press; 2000. p. 299–316.
- Kemball, C.; Rideal, E.K. The adsorption of vapours on mercury. I. Non-polar substances. Proc. R. Soc. London. Ser. A. Math. Phys. Sci. 1946, 187, 53–73. [Google Scholar] [CrossRef]
- Onjia, A.E.; Milonjić, S.K.; Todorović, M.; Loos-Neskovic, C.; Fedoroff, M.; Jones, D.J. An Inverse Gas Chromatography Study of the Adsorption of Organics on Nickel- and Copper-Hexacyanoferrates at Zero Surface Coverage. J. Colloid Interface Sci. 2002, 251, 10–17. [Google Scholar] [CrossRef] [PubMed]
- Donnet, J.-B.; Ridaoui, H.; Balard, H.; Barthel, H.; Gottschalk-Gaudig, T. Evolution of the surface polar character of pyrogenic silicas, with their grafting ratios by dimethylchlorosilane, studied by microcalorimetry. J. Colloid Interface Sci. 2008, 325, 101–106. [Google Scholar] [CrossRef] [PubMed]
- Papirer, E.; Brendlé, E.; Balard, H.; Dentzer, J. Variation of the surface properties of nickel oxide upon heat treatment evidenced by temperature programmed desorption and inverse gas chromatography studies. J. Mater. Sci. 2000, 35, 3573–3577. [Google Scholar] [CrossRef]
- Rodriguez, M.; Rubio, J.; Rubio, F.; Liso, M.; Oteo, J. Application of inverse gas chromatography to the study of the surface properties of slates. Clays Clay Miner. 1997, 45, 670–680. [Google Scholar] [CrossRef]
- Przybyszewska, M.; Krzywania, A.; Zaborski, M.; Szynkowska, M.I. Surface properties of zinc oxide nanoparticles studied by inverse gas chromatography. J. Chromatogr. A 2009, 1216, 5284–5291. [Google Scholar] [CrossRef]
- Ali, S.; Heng, J.; Nikolaev, A.; Waters, K. Introducing inverse gas chromatography as a method of determining the surface heterogeneity of minerals for flotation. Powder Technol. 2013, 249, 373–377. [Google Scholar] [CrossRef]
- Shi, X.; Bertóti, I.; Pukánszky, B.; Rosa, R.; Lazzeri, A. Structure and surface coverage of water-based stearate coatings on calcium carbonate nanoparticles. J. Colloid Interface Sci. 2011, 362, 67–73. [Google Scholar] [CrossRef] [PubMed]
- Mohammadi-Jam, S.; Burnett, D.; Waters, K. Surface energy of minerals – Applications to flotation. Miner. Eng. 2014, 66-68, 112–118. [Google Scholar] [CrossRef]
- Daoui, H.; Boutoumi, H.; Bouhamidi, Y.; Boucherit, A.; Zouikri, M. Characterization of an Algerian diatomite by inverse gas chromatography: Specific and non-specific contribution and Lewis acid–base parameters. Int. J. Polym. Anal. Charact. 2018, 23, 463–473. [Google Scholar] [CrossRef]
- Shui, M.; Reng, Y.; Pu, B.; Li, J. Variation of surface characteristics of silica-coated calcium carbonate. J. Colloid Interface Sci. 2004, 273, 205–210. [Google Scholar] [CrossRef]
- Rückriem, M.; Inayat, A.; Enke, D.; Gläser, R.; Einicke, W.-D.; Rockmann, R. Inverse gas chromatography for determining the dispersive surface energy of porous silica. Colloids Surfaces A: Physicochem. Eng. Asp. 2010, 357, 21–26. [Google Scholar] [CrossRef]
- Donnet, J.-B.; Balard, H.; Nedjari, N.; Hamdi, B.; Barthel, H.; Gottschalk-Gaudig, T. Influence of specific surface area of pyrogenic silicas on their heat of immersion in water and on their surface properties assessed using inverse gas chromatography. J. Colloid Interface Sci. 2008, 328, 15–19. [Google Scholar] [CrossRef] [PubMed]
- Bandosz, T.J.; Putyera, K.; Jagiełło, J.; Schwarz, J.A. Application of inverse gas chromatography to the study of the surface properties of modified layered minerals. Microporous Mater. 1993, 1, 73–79. [Google Scholar] [CrossRef]
- Hamieh, T.; Rezzaki, M.; Grohens, Y.; Schultz, J. Glass transition of adsorbed stereoregular PMMA by inverse gas chromatography at infinite dilution, J. Chim. Phys., 1998, 95, 1964–1990. [Google Scholar] [CrossRef]
- Boudriche, L.; Chamayou, A.; Calvet, R.; Hamdi, B.; Balard, H. Influence of different dry milling processes on the properties of an attapulgite clay, contribution of inverse gas chromatography. Powder Technol. 2014, 254, 352–363. [Google Scholar] [CrossRef]
- Bauer, F.; Meyer, R.; Czihal, S.; Bertmer, M.; Decker, U.; Naumov, S.; Uhlig, H.; Steinhart, M.; Enke, D. Functionalization of porous siliceous materials, Part 2: Surface characterization by inverse gas chromatography. J. Chromatogr. A 2019, 1603, 297–310. [Google Scholar] [CrossRef]
- Yao, Z.; Wu, D.; Heng, J.Y.; Lanceros-Méndez, S.; Hadjittofis, E.; Su, W.; Tang, J.; Zhao, H.; Wu, W. Comparative study of surface properties determination of colored pearl-oyster-shell-derived filler using inverse gas chromatography method and contact angle measurements. Int. J. Adhes. Adhes. 2017, 78, 55–59. [Google Scholar] [CrossRef]
- Rueckriem, M.; Hahn, T.; Enke, D. Inverse gas chromatographic studies on porous glass, Opt. Appl. 2012, 42, 295–306. [Google Scholar]
- Batko, K.; Voelkel, A. Inverse gas chromatography as a tool for investigation of nanomaterials. J. Colloid Interface Sci. 2007, 315, 768–771. [Google Scholar] [CrossRef]
- Zhang, X.; Yang, D.; Xu, P.; Wang, C.; Du, Q. Characterizing the surface properties of carbon nanotubes by inverse gas chromatography. J. Mater. Sci. 2007, 42, 7069–7075. [Google Scholar] [CrossRef]
- Demertzis, P.G.; Riganakos, K.A.; Kontominas, M.G. Water sorption isotherms of crystalline raffinose by inverse gas chromatography. Int. J. Food Sci. Technol. 1989, 24, 629–636. [Google Scholar] [CrossRef]
- Helen, H.J.; Gilbert, S.G. Moisture Sorption of Dry Bakery Products by Inverse Gas Chromatography. J. Food Sci. 2006, 50, 454–458. [Google Scholar] [CrossRef]
- Menzel, R.; Bismarck, A.; Shaffer, M.S. Deconvolution of the structural and chemical surface properties of carbon nanotubes by inverse gas chromatography. Carbon 2012, 50, 3416–3421. [Google Scholar] [CrossRef]
- Menzel, R.; Lee, A.; Bismarck, A.; Shaffer, M.S.P. Inverse Gas Chromatography of As-Received and Modified Carbon Nanotubes. Langmuir 2009, 25, 8340–8348. [Google Scholar] [CrossRef] [PubMed]
- Shih, Y.-H.; Li, M.-S. Adsorption of selected volatile organic vapors on multiwall carbon nanotubes. J. Hazard. Mater. 2008, 154, 21–28. [Google Scholar] [CrossRef] [PubMed]
- Gamble, J.F.; Davé, R.N.; Kiang, S.; Leane, M.M.; Tobyn, M.; Wang, S.S. Investigating the applicability of inverse gas chromatography to binary powdered systems: An application of surface heterogeneity profiles to understanding preferential probe-surface interactions. Int. J. Pharm. 2013, 445, 39–46. [Google Scholar] [CrossRef]
- Jones, M.D.; Young, P.; Traini, D. The use of inverse gas chromatography for the study of lactose and pharmaceutical materials used in dry powder inhalers. Adv. Drug Deliv. Rev. 2012, 64, 285–293. [Google Scholar] [CrossRef]
- Grimsey, I.M.; Feeley, J.C.; York, P. Analysis of the surface energy of pharmaceutical powders by inverse gas chromatography. J. Pharm. Sci. 2002, 91, 571–583. [Google Scholar] [CrossRef]
- Guo, Y.; Shalaev, E.; Smith, S. Solid-state analysis and amorphous dispersions in assessing the physical stability of pharmaceutical formulations, Trends Anal. Chem., 2013, 49, 137–144. [Google Scholar]
- Chamarthy, S.P. The different roles of surface and bulk effects on the functionality of pharmaceutical materials, Thesis, 2007, Purdue University, West Lafayette, Indiana. Available online: https://www.proquest.com/docview/304841067.
- Zhang, D.; Flory, J.H.; Panmai, S.; Batra, U.; Kaufman, M.J. Wettability of pharmaceutical solids: its measurement and influence on wet granulation. Colloids Surfaces A: Physicochem. Eng. Asp. 2002, 206, 547–554. [Google Scholar] [CrossRef]
- Das, S.C.; Stewart, P.J. Characterising surface energy of pharmaceutical powders by inverse gas chromatography at finite dilution. J. Pharm. Pharmacol. 2012, 64, 1337–1348. [Google Scholar] [CrossRef] [PubMed]
- Telko, M.J.; Hickey, A.J. Critical Assessment of Inverse Gas Chromatography as Means of Assessing Surface Free Energy and Acid–Base Interaction of Pharmaceutical Powders. J. Pharm. Sci. 2007, 96, 2647–2654. [Google Scholar] [CrossRef] [PubMed]
- Autie-Pérez, M.; Infantes-Molina, A.; Cecilia, J.A.; Labadie-Suarez, J.M.; Fernández-Echevarría, H.; Santamaría-González, J.; Rodríguez-Castellón, E. LIGHT N-PARAFFINS SEPARATION BY INVERSE GAS CHROMATOGRAPHY WITH CUBAN VOLCANIC GLASS. Braz. J. Chem. Eng. 2019, 36, 531–539. [Google Scholar] [CrossRef]
- Contreras-Larios, J.L.; Infantes-Molina, A.; Negrete-Melo, L.A.; Labadie-Suárez, J.M.; Yee-Madeira, H.T.; Autie-Pérez, M.A.; Rodríguez-Castellón, E. Separation of N–C5H12–C9H20 Paraffins Using Boehmite by Inverse Gas Chromatography. Appl. Sci. 2019, 9, 1810. [Google Scholar] [CrossRef]
- Conder, J.R.; Young, C.L. Physical measurements by gas chromatography. 1979, Eds: Wiley J and Sons, New York.
- Donnet, J.-B.; Qin, R.-Y. Empirical estimation of surface energies of polymers and their temperature dependence. J. Colloid Interface Sci. 1992, 154, 434–443. [Google Scholar] [CrossRef]
- Chehimi, M.M.; Pigois-Landureau, E. Determination of acid–base properties of solid materials by inverse gas chromatography at infinite dilution. A novel empirical method based on the dispersive contribution to the heat of vaporization of probes, J. Mater. Chem. 1994, 4, 741–745. [Google Scholar]
- Shi, B. Problem in the molecular area of polar probe molecules used in inverse gas chromatography. J. Chromatogr. A 2019, 1601, 385–387. [Google Scholar] [CrossRef]
- Sun, C.; Berg, J.C. The effective surface energy of heterogeneous solids measured by inverse gas chromatography at infinite dilution. J. Colloid Interface Sci. 2003, 260, 443–448. [Google Scholar] [CrossRef]
- Gutmann, V. The Donor-Acceptor Approach to Molecular Interactions; Springer Science and Business Media LLC: Dordrecht, GX, Netherlands, 1978; ISBN 9781461588252. [Google Scholar]
- Papirer, E.; Brendlé, E.; Balard, H.; Ozil, F. IGC determination of surface properties of fullerenes: comparison with other carbon materials. Carbon 1999, 37, 1265–1274. [Google Scholar] [CrossRef]
- Hamieh, T.; Fadlallah, M.-B.; Schultz, J. New approach to characterise physicochemical properties of solid substrates by inverse gas chromatography at infinite dilution. III. Determination of the acid-base properties of some solid substrates (polymers, oxides and carbon fibres): a new model. J. Chromatogr. A. 2002, 969, 37–47. [Google Scholar] [CrossRef]
- Hoss, D.J.; Knepper, R.; Hotchkiss, P.J.; Tappan, A.S.; Boudouris, B.W.; Beaudoin, S.P. An evaluation of complementary approaches to elucidate fundamental interfacial phenomena driving adhesion of energetic materials. J. Colloid Interface Sci. 2016, 473, 28–33. [Google Scholar] [CrossRef] [PubMed]
- Sun, C.; Berg, J.C. The effective surface energy of heterogeneous solids measured by inverse gas chromatography at infinite dilution. J. Colloid Interface Sci. 2003, 260, 443–448. [Google Scholar] [CrossRef] [PubMed]
- Margariti, S.; Bassiotis, I.; Roubani-Kalantzopoulou, F. Physicochemical characterization of interfaces. J. Colloid Interface Sci. 2004, 274, 413–420. [Google Scholar] [CrossRef] [PubMed]
- Fekete, E.; Móczó, J.; Pukánszky, B. Determination of the surface characteristics of particulate fillers by inverse gas chromatography at infinite dilution: a critical approach. J. Colloid Interface Sci. 2003, 269, 143–152. [Google Scholar] [CrossRef] [PubMed]
- Hamieh, T. Study of the temperature effect on the surface area of model organic molecules, the dispersive surface energy and the surface properties of solids by inverse gas chromatography. J. Chromatogr. A 2020, 1627, 461372. [Google Scholar] [CrossRef] [PubMed]
- Sawyer, D.T.; Brookman, D.J. Thermodynamically based gas chromatographic retention index for organic molecules using salt-modified aluminas and porous silica beads. Anal. Chem. 1968, 40, 1847–1853. [Google Scholar] [CrossRef]
- Dorris, G.M.; Gray, D.G. Adsorption of normal-alkanes at zero surface coverage on cellulose paper and wood fibers. Journal of Colloid and Interface Science. 1980, 77, 353–362. [Google Scholar] [CrossRef]
- Fowkes, F.M. in: Surface and interfacial aspects of biomedical polymers, 1985, Vol. I, pp. 337-372, Ed: Andrade, J. D., Plenum Press, New York.
- Schultz, J.; Lavielle, L.; Martin, C. The Role of the Interface in Carbon Fibre-Epoxy Composites. J. Adhes. 1987, 23, 45–60. [Google Scholar] [CrossRef]
- Hamieh, T.; Schultz, J. Étude par chromatographie gazeuse inverse de l’influence de la température sur l’aire de molécules adsorbées. J. de Chim. Phys. et de Physico-Chimie Biol. 1996, 93, 1292–1331. [Google Scholar] [CrossRef]
- Hamieh, T.; Schultz, J. Study of the adsorption of n-alkanes on polyethylene surface - State equations, molecule areas and covered surface fraction, Comptes Rendus de l’Académie des Sciences. Série IIb 1996, 323, 281–289. [Google Scholar]
- Hamieh, T.; Schultz, J. A new method of calculation of polar molecule area adsorbed on MgO and ZnO by inverse gas chromatography, Comptes Rendus de l’Académie des Sciences. Série IIb 1996, 322, 627–633. [Google Scholar]
- Hamieh, T.; Rezzaki, M.; Schultz, J. Study of the Second Order Transitions and Acid–Base Properties of Polymers Adsorbed on Oxides by Using Inverse Gas Chromatography at Infinite Dilution. J. Colloid Interface Sci. 2001, 233, 339–342. [Google Scholar] [CrossRef] [PubMed]
- Hamieh, T.; Rezzaki, M.; Schultz, J. Study of the transition temperatures and acid-base properties of poly (methyl methacrylate) adsorbed on alumina and silica, by using inverse gas chromatography technique. Colloids and Surfaces A: Physicochemical and Engineering Aspects 2001, 189, 279–291. [Google Scholar] [CrossRef]
- Hamieh, T.; Schultz, J. New approach to characterise physicochemical properties of solid substrates by inverse gas chromatography at infinite dilution. Journal of Chromatography A 2002, 969, 17–47. [Google Scholar] [CrossRef] [PubMed]
- Donnet, J.B.; Park, S.J.; Balard, H. Evaluation of specific interactions of solid surfaces by inverse gas chromatography. Chromatographia 1991, 31, 434–440. [Google Scholar] [CrossRef]
- Hamieh, T.; Rezzaki, M.; Schultz, J. Study of the Second Order Transitions and Acid–Base Properties of Polymers Adsorbed on Oxides by Using Inverse Gas Chromatography at Infinite Dilution: II. Experimental Results. J. Colloid Interface Sci. 2001, 233, 343–347. [Google Scholar] [CrossRef]
- Riddle, F.L.; Fowkes, F.M. Spectral shifts in acid-base chemistry. 1. van der Waals contributions to acceptor numbers. J. Am. Chem. Soc. 1990, 112, 3259–3264. [Google Scholar] [CrossRef]
- Hamieh, T. New Methodology to Study the Dispersive Component of the Surface Energy and Acid–Base Properties of Silica Particles by Inverse Gas Chromatography at Infinite Dilution. J. Chromatogr. Sci. 2021, 60, 126–142. [Google Scholar] [CrossRef]
Figure 1.
Variations of the surface free energy ( of the solvents adsorbed on alumina particles as a function of the temperature T (K).
Figure 1.
Variations of the surface free energy ( of the solvents adsorbed on alumina particles as a function of the temperature T (K).
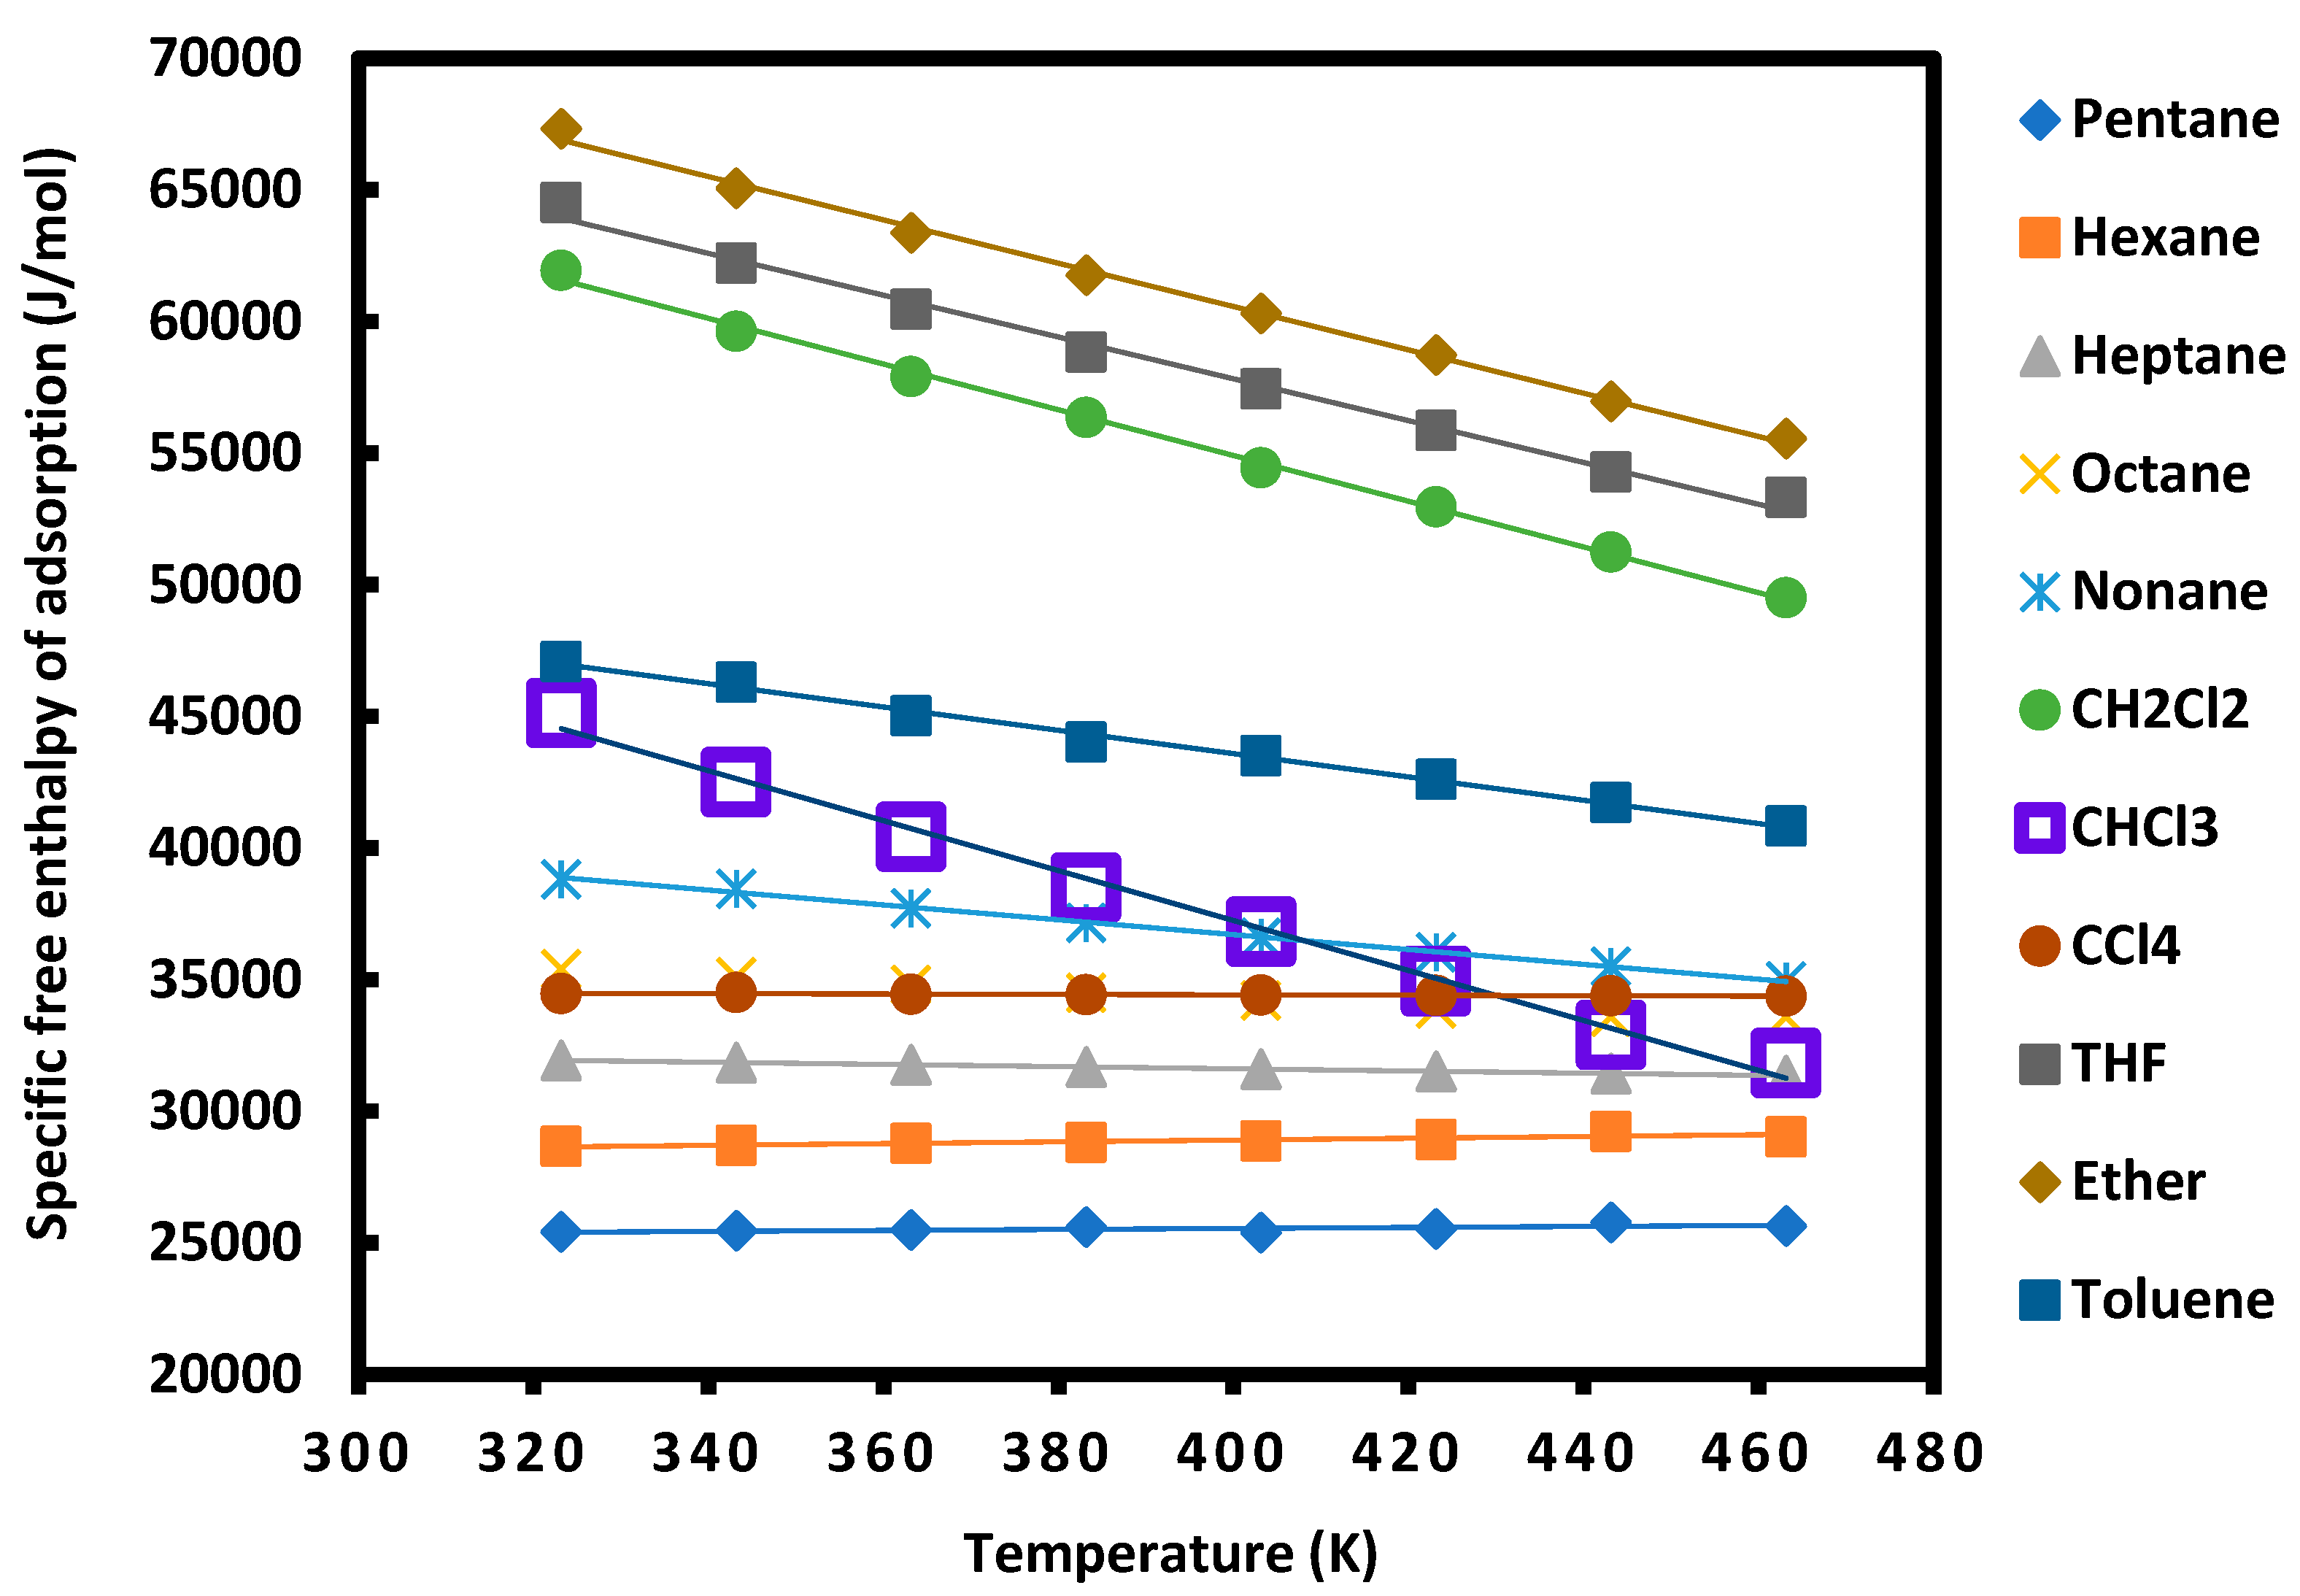
Figure 2.
Dispersive component of the surface energy of alumina particles as a function of the temperature T (K) using different methods and models.
Figure 2.
Dispersive component of the surface energy of alumina particles as a function of the temperature T (K) using different methods and models.
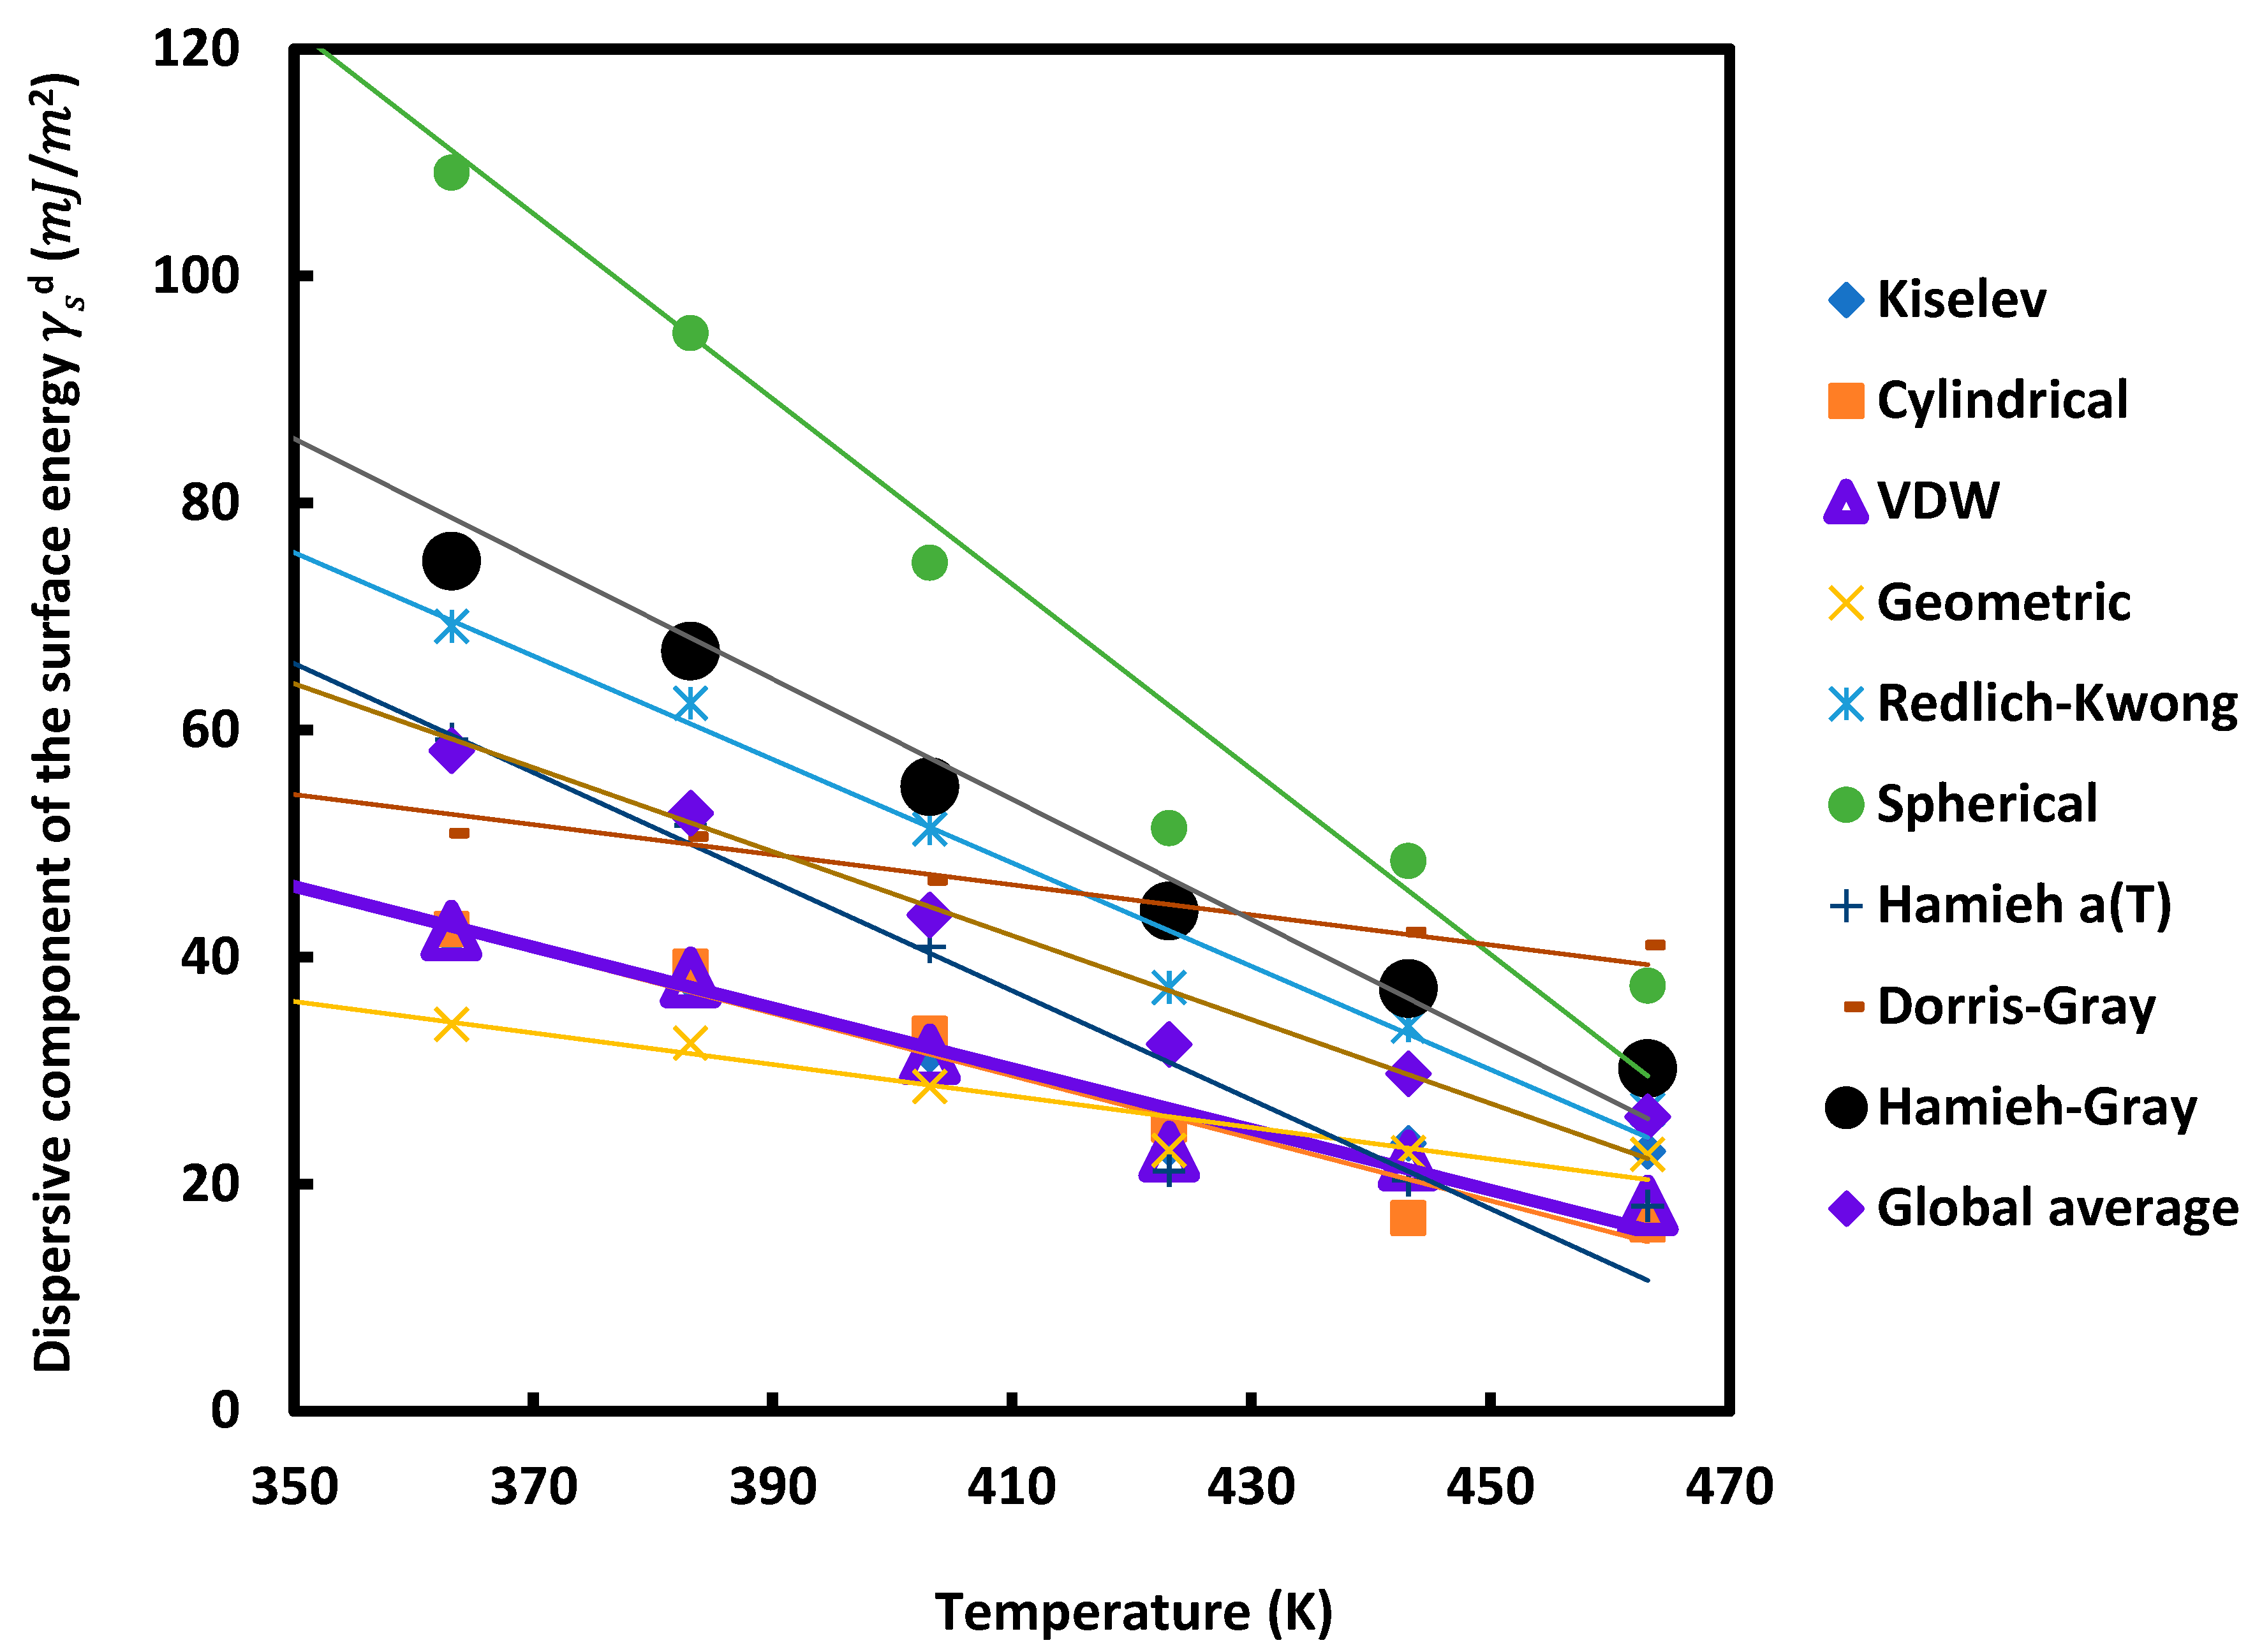
Figure 3.
Dispersive surface energy of alumina particles following the various methods and models for eight temperatures.
Figure 3.
Dispersive surface energy of alumina particles following the various methods and models for eight temperatures.
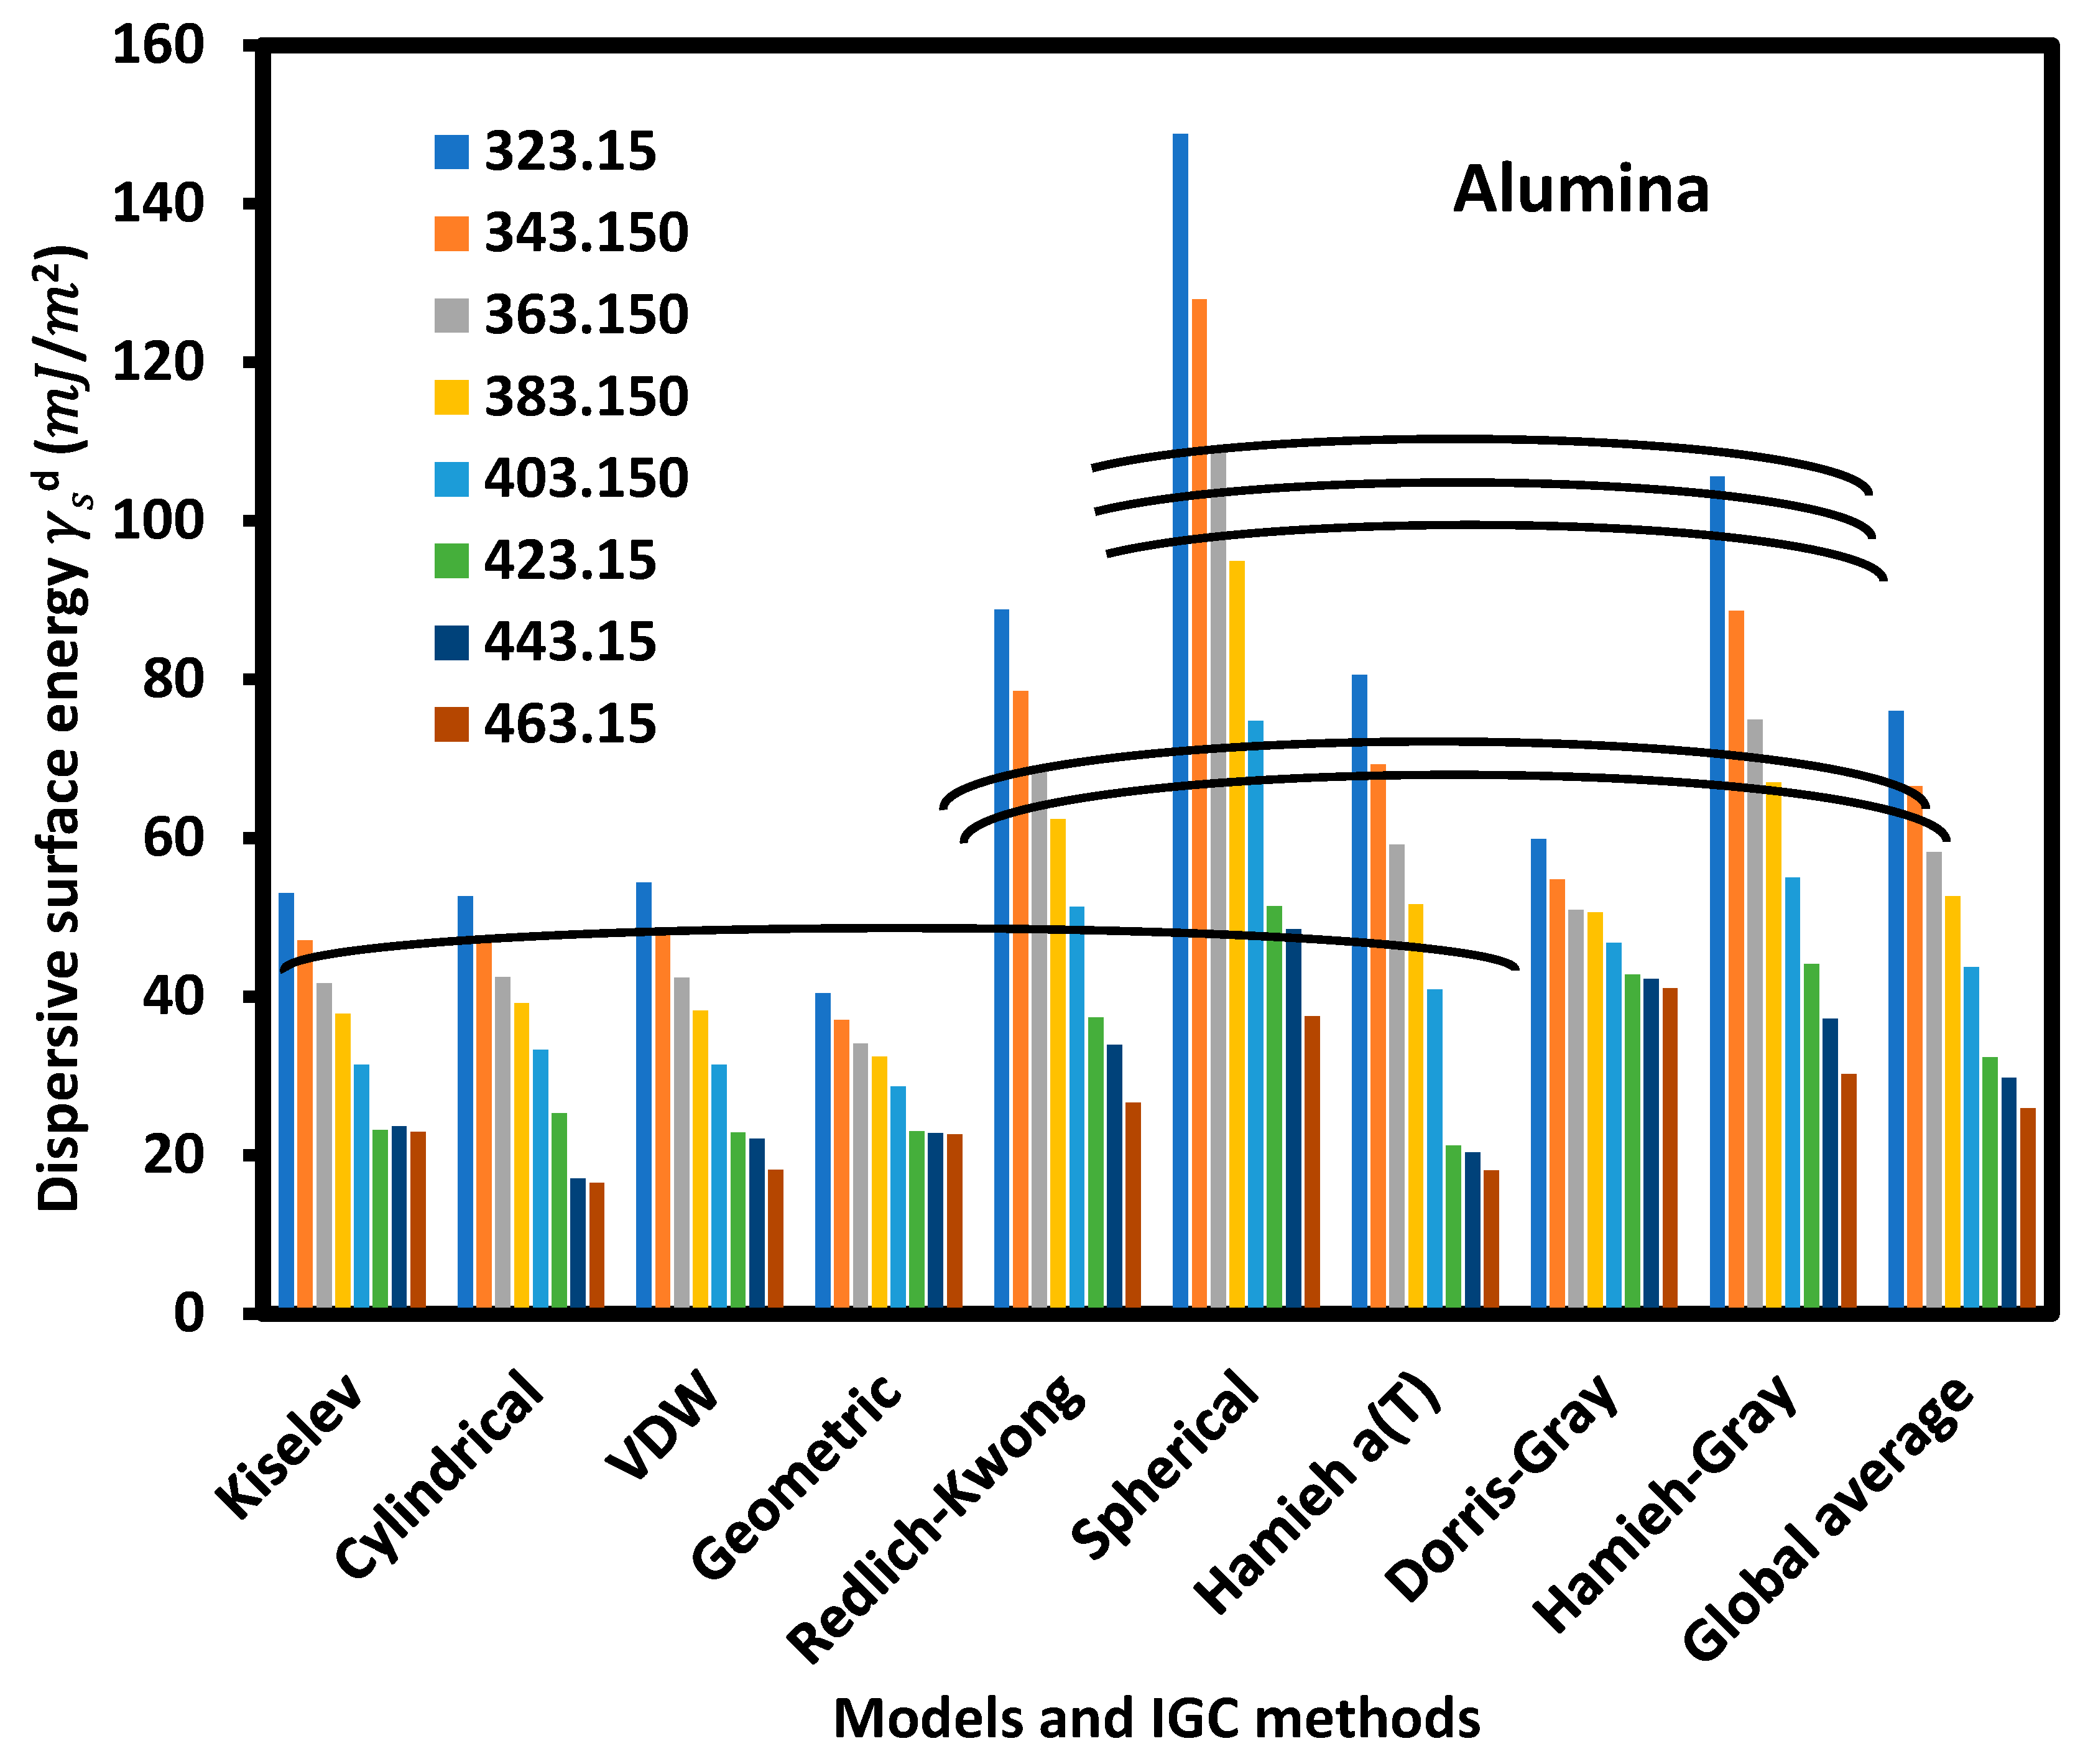
Figure 4.
Variations of as a function of the temperature for the various polar molecules adsorbed on alumina surface by using the different IGC models and methods.
Figure 4.
Variations of as a function of the temperature for the various polar molecules adsorbed on alumina surface by using the different IGC models and methods.
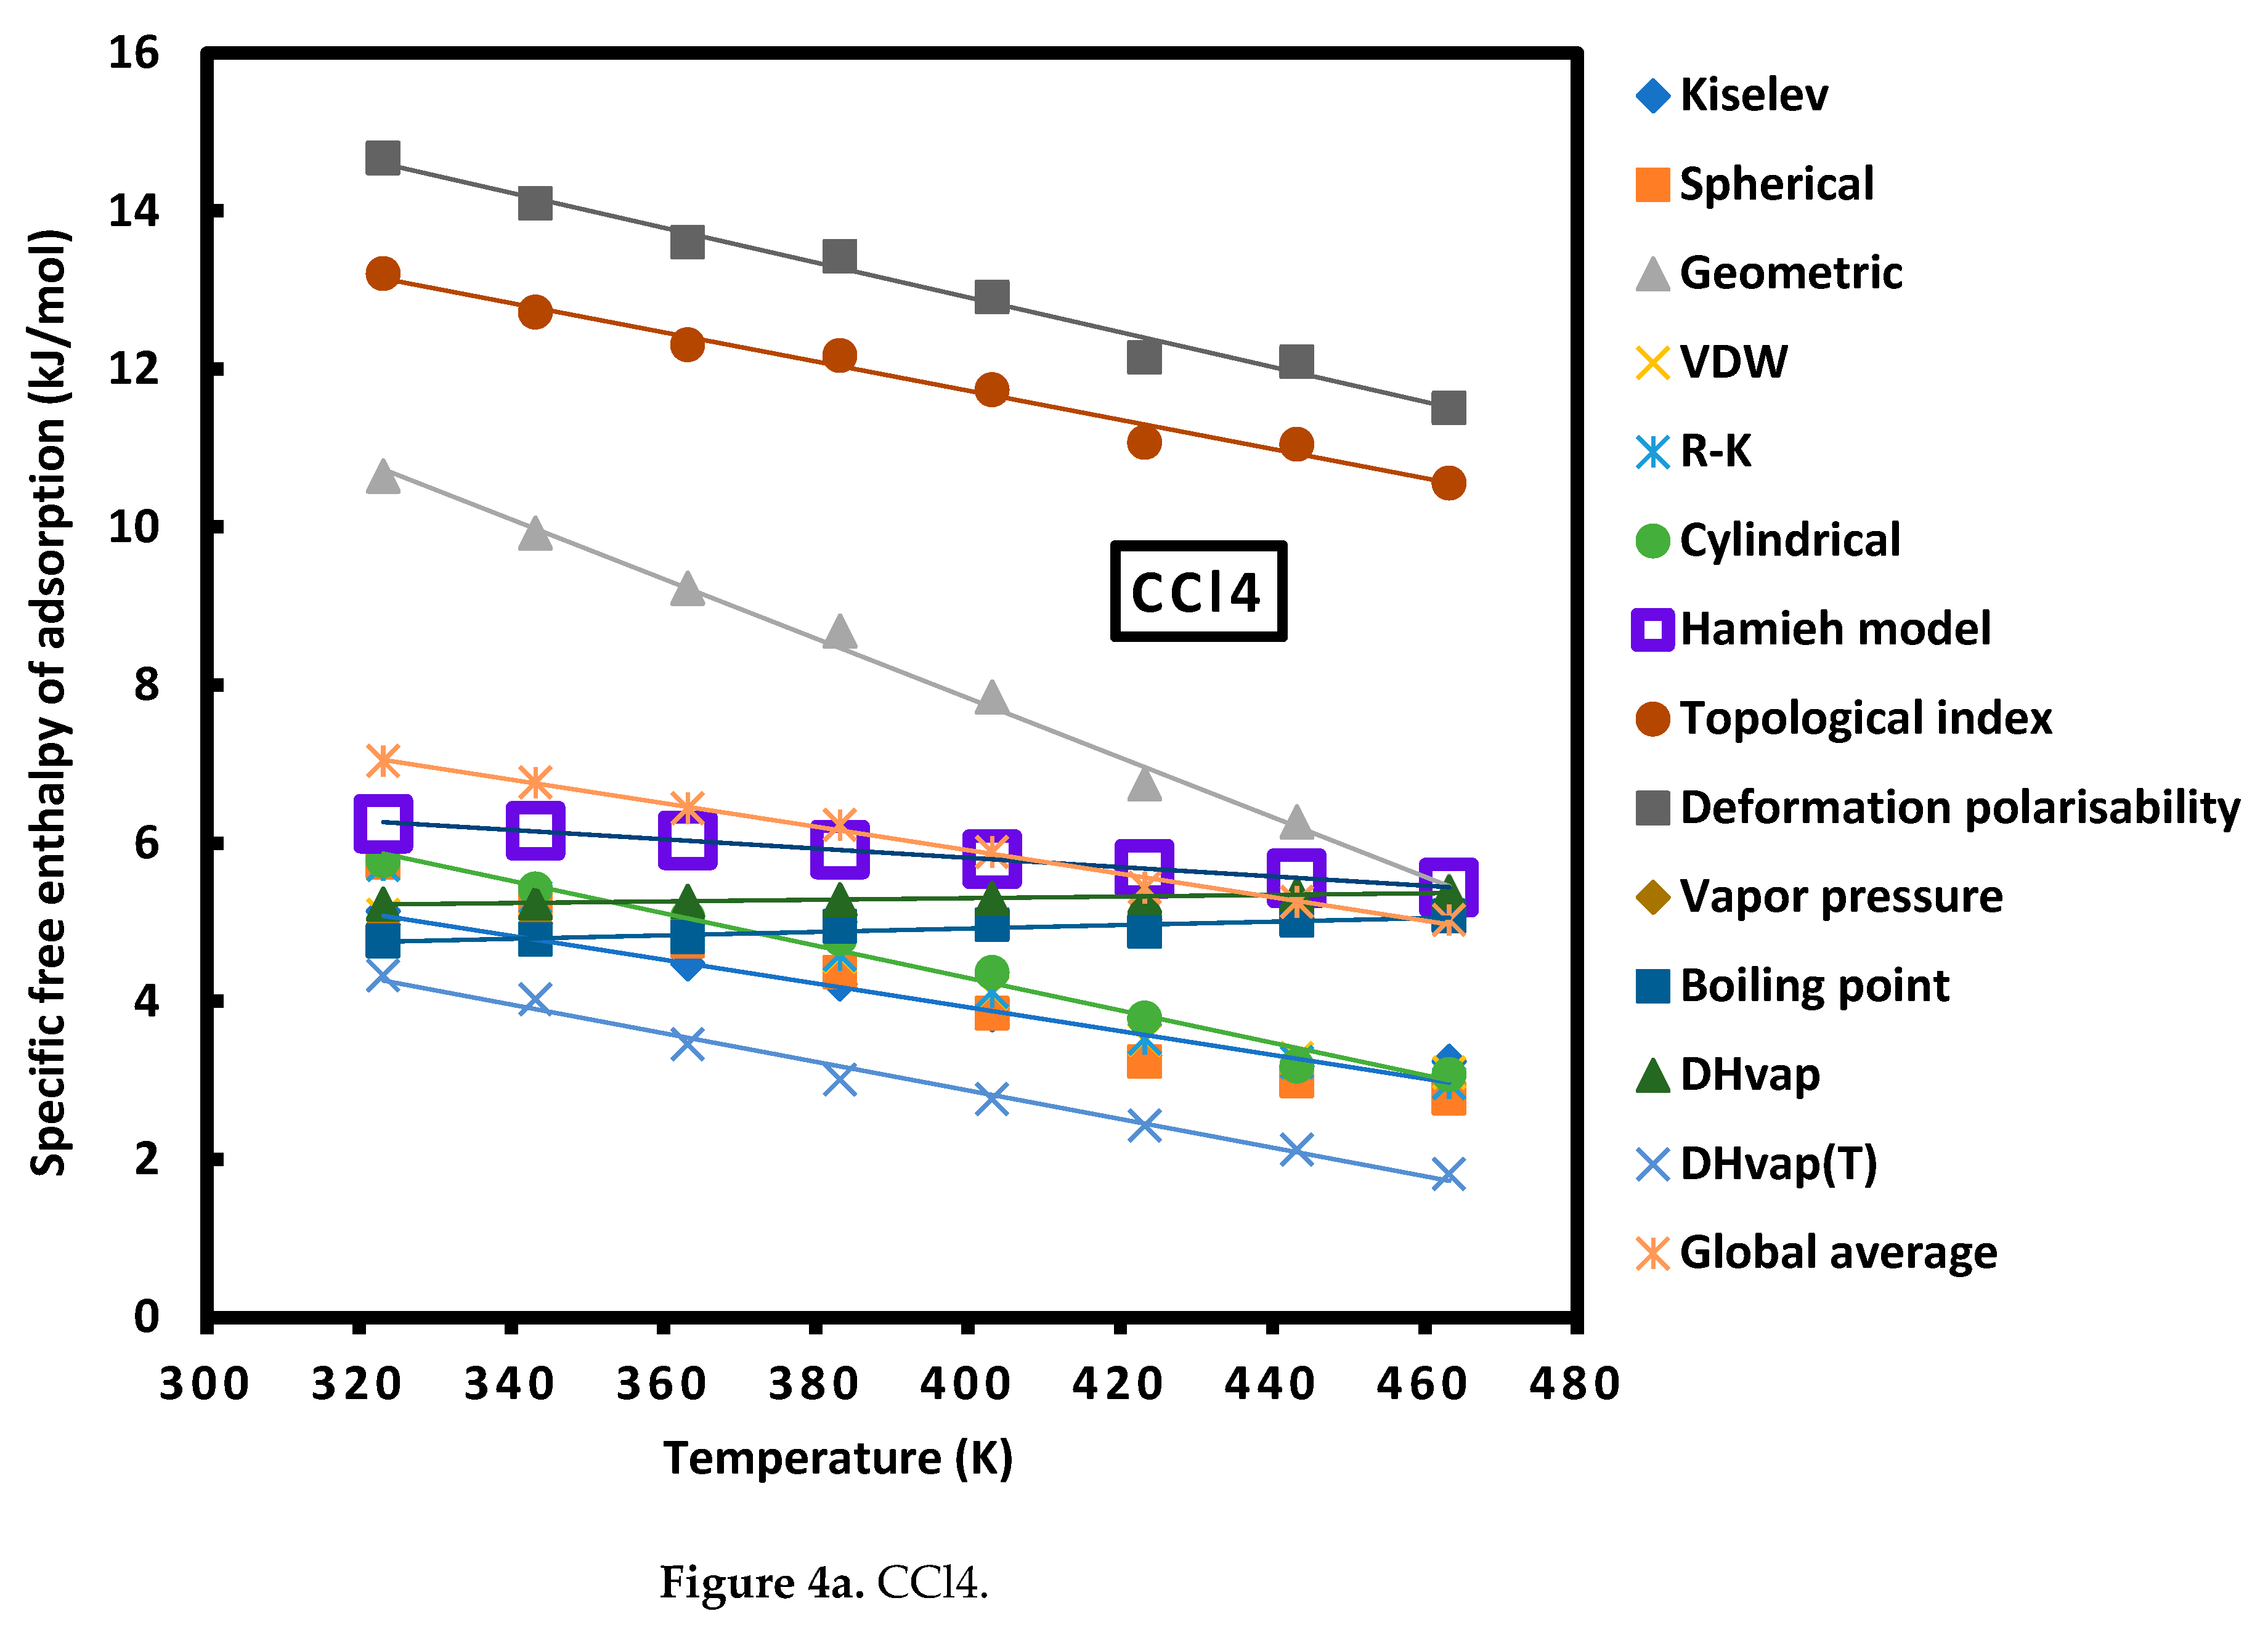
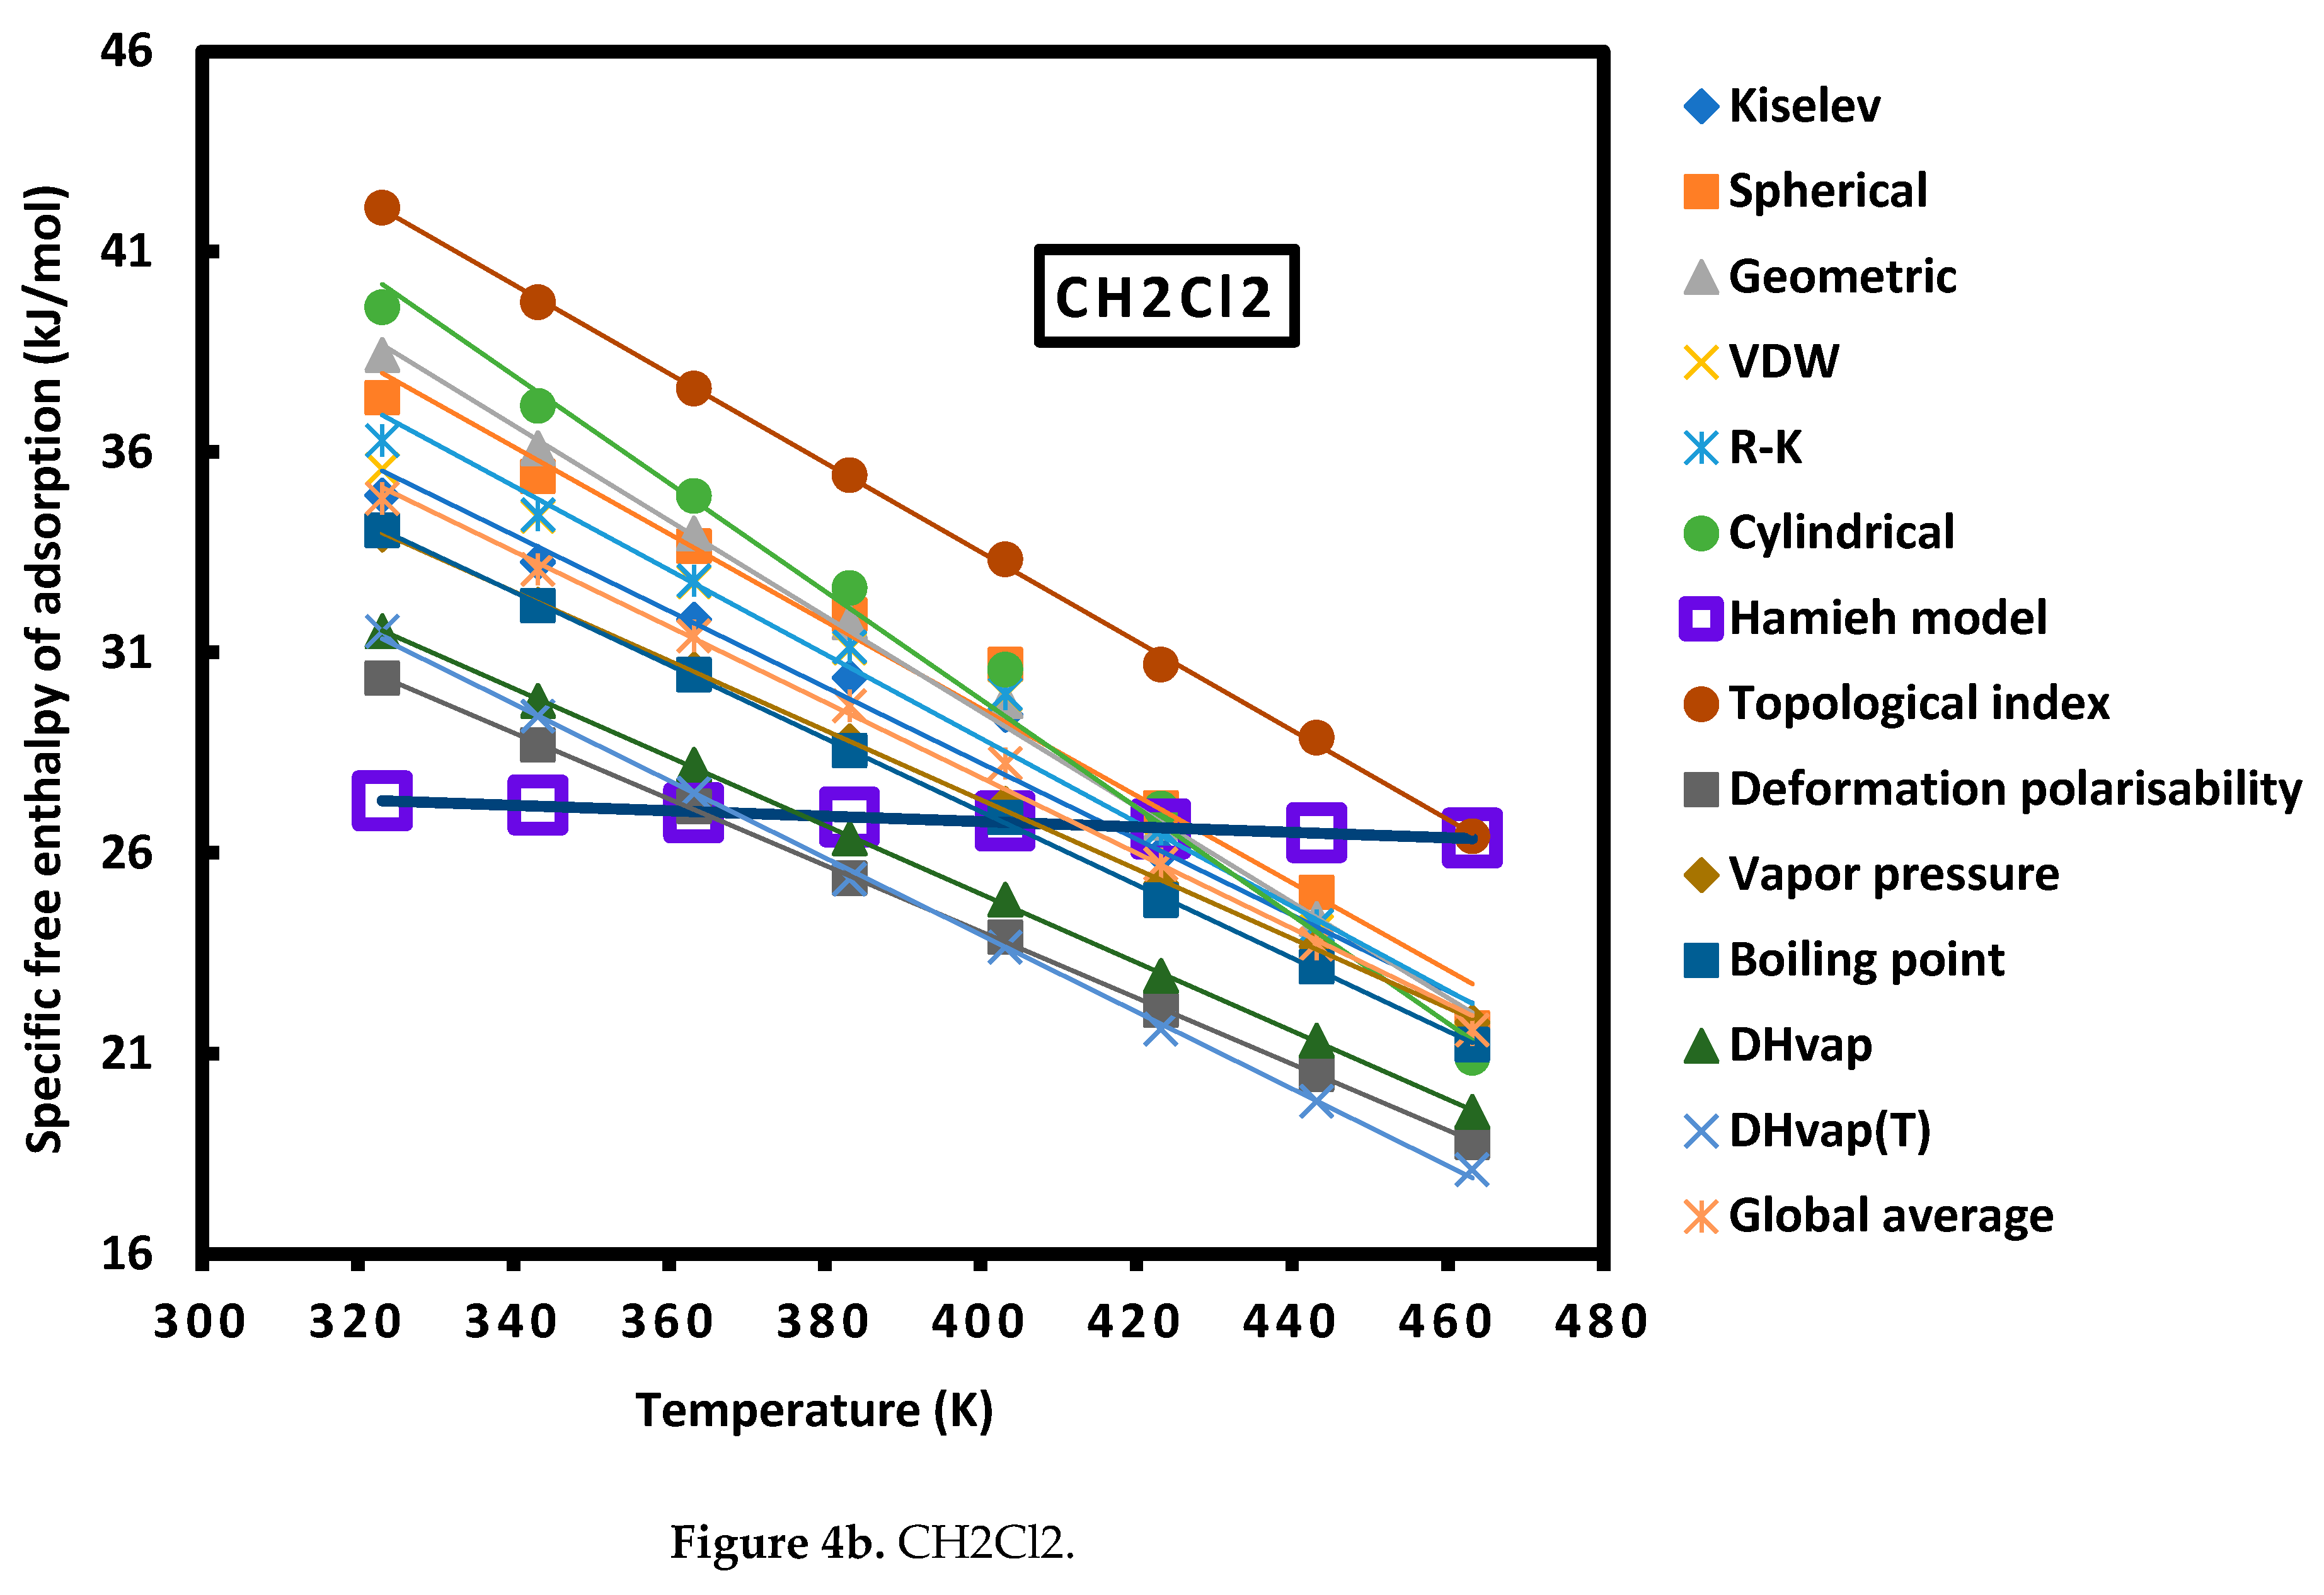
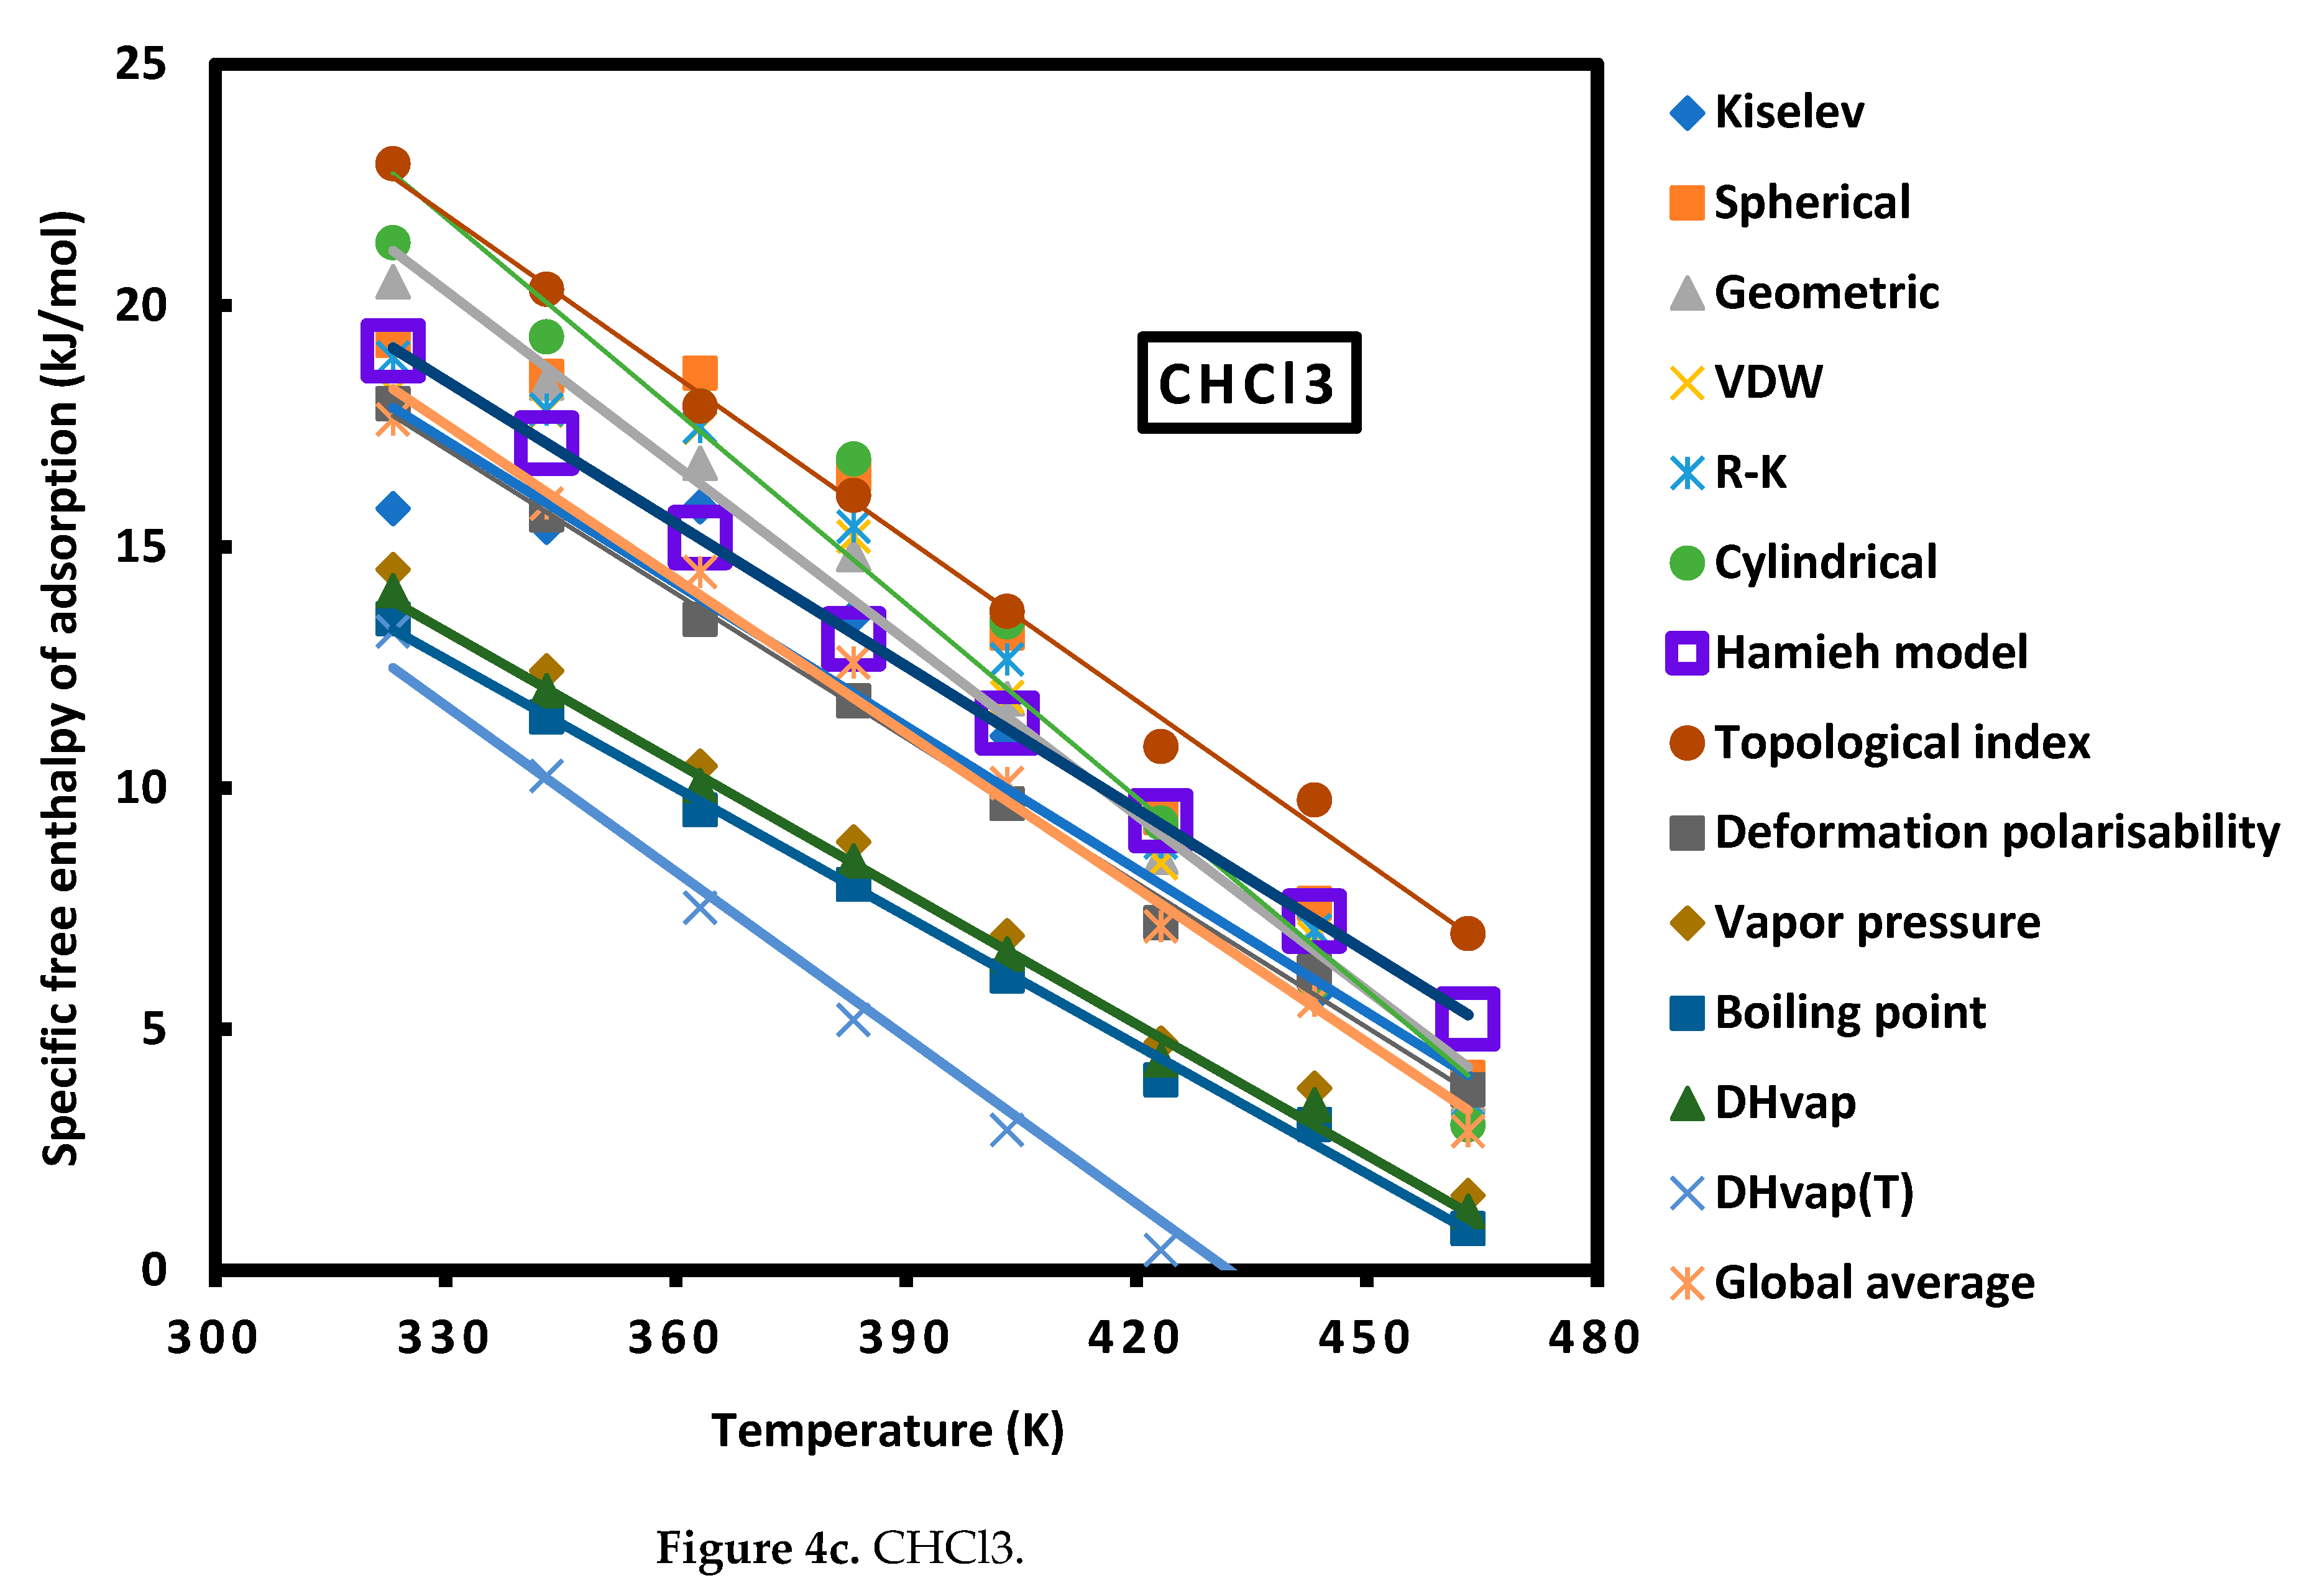
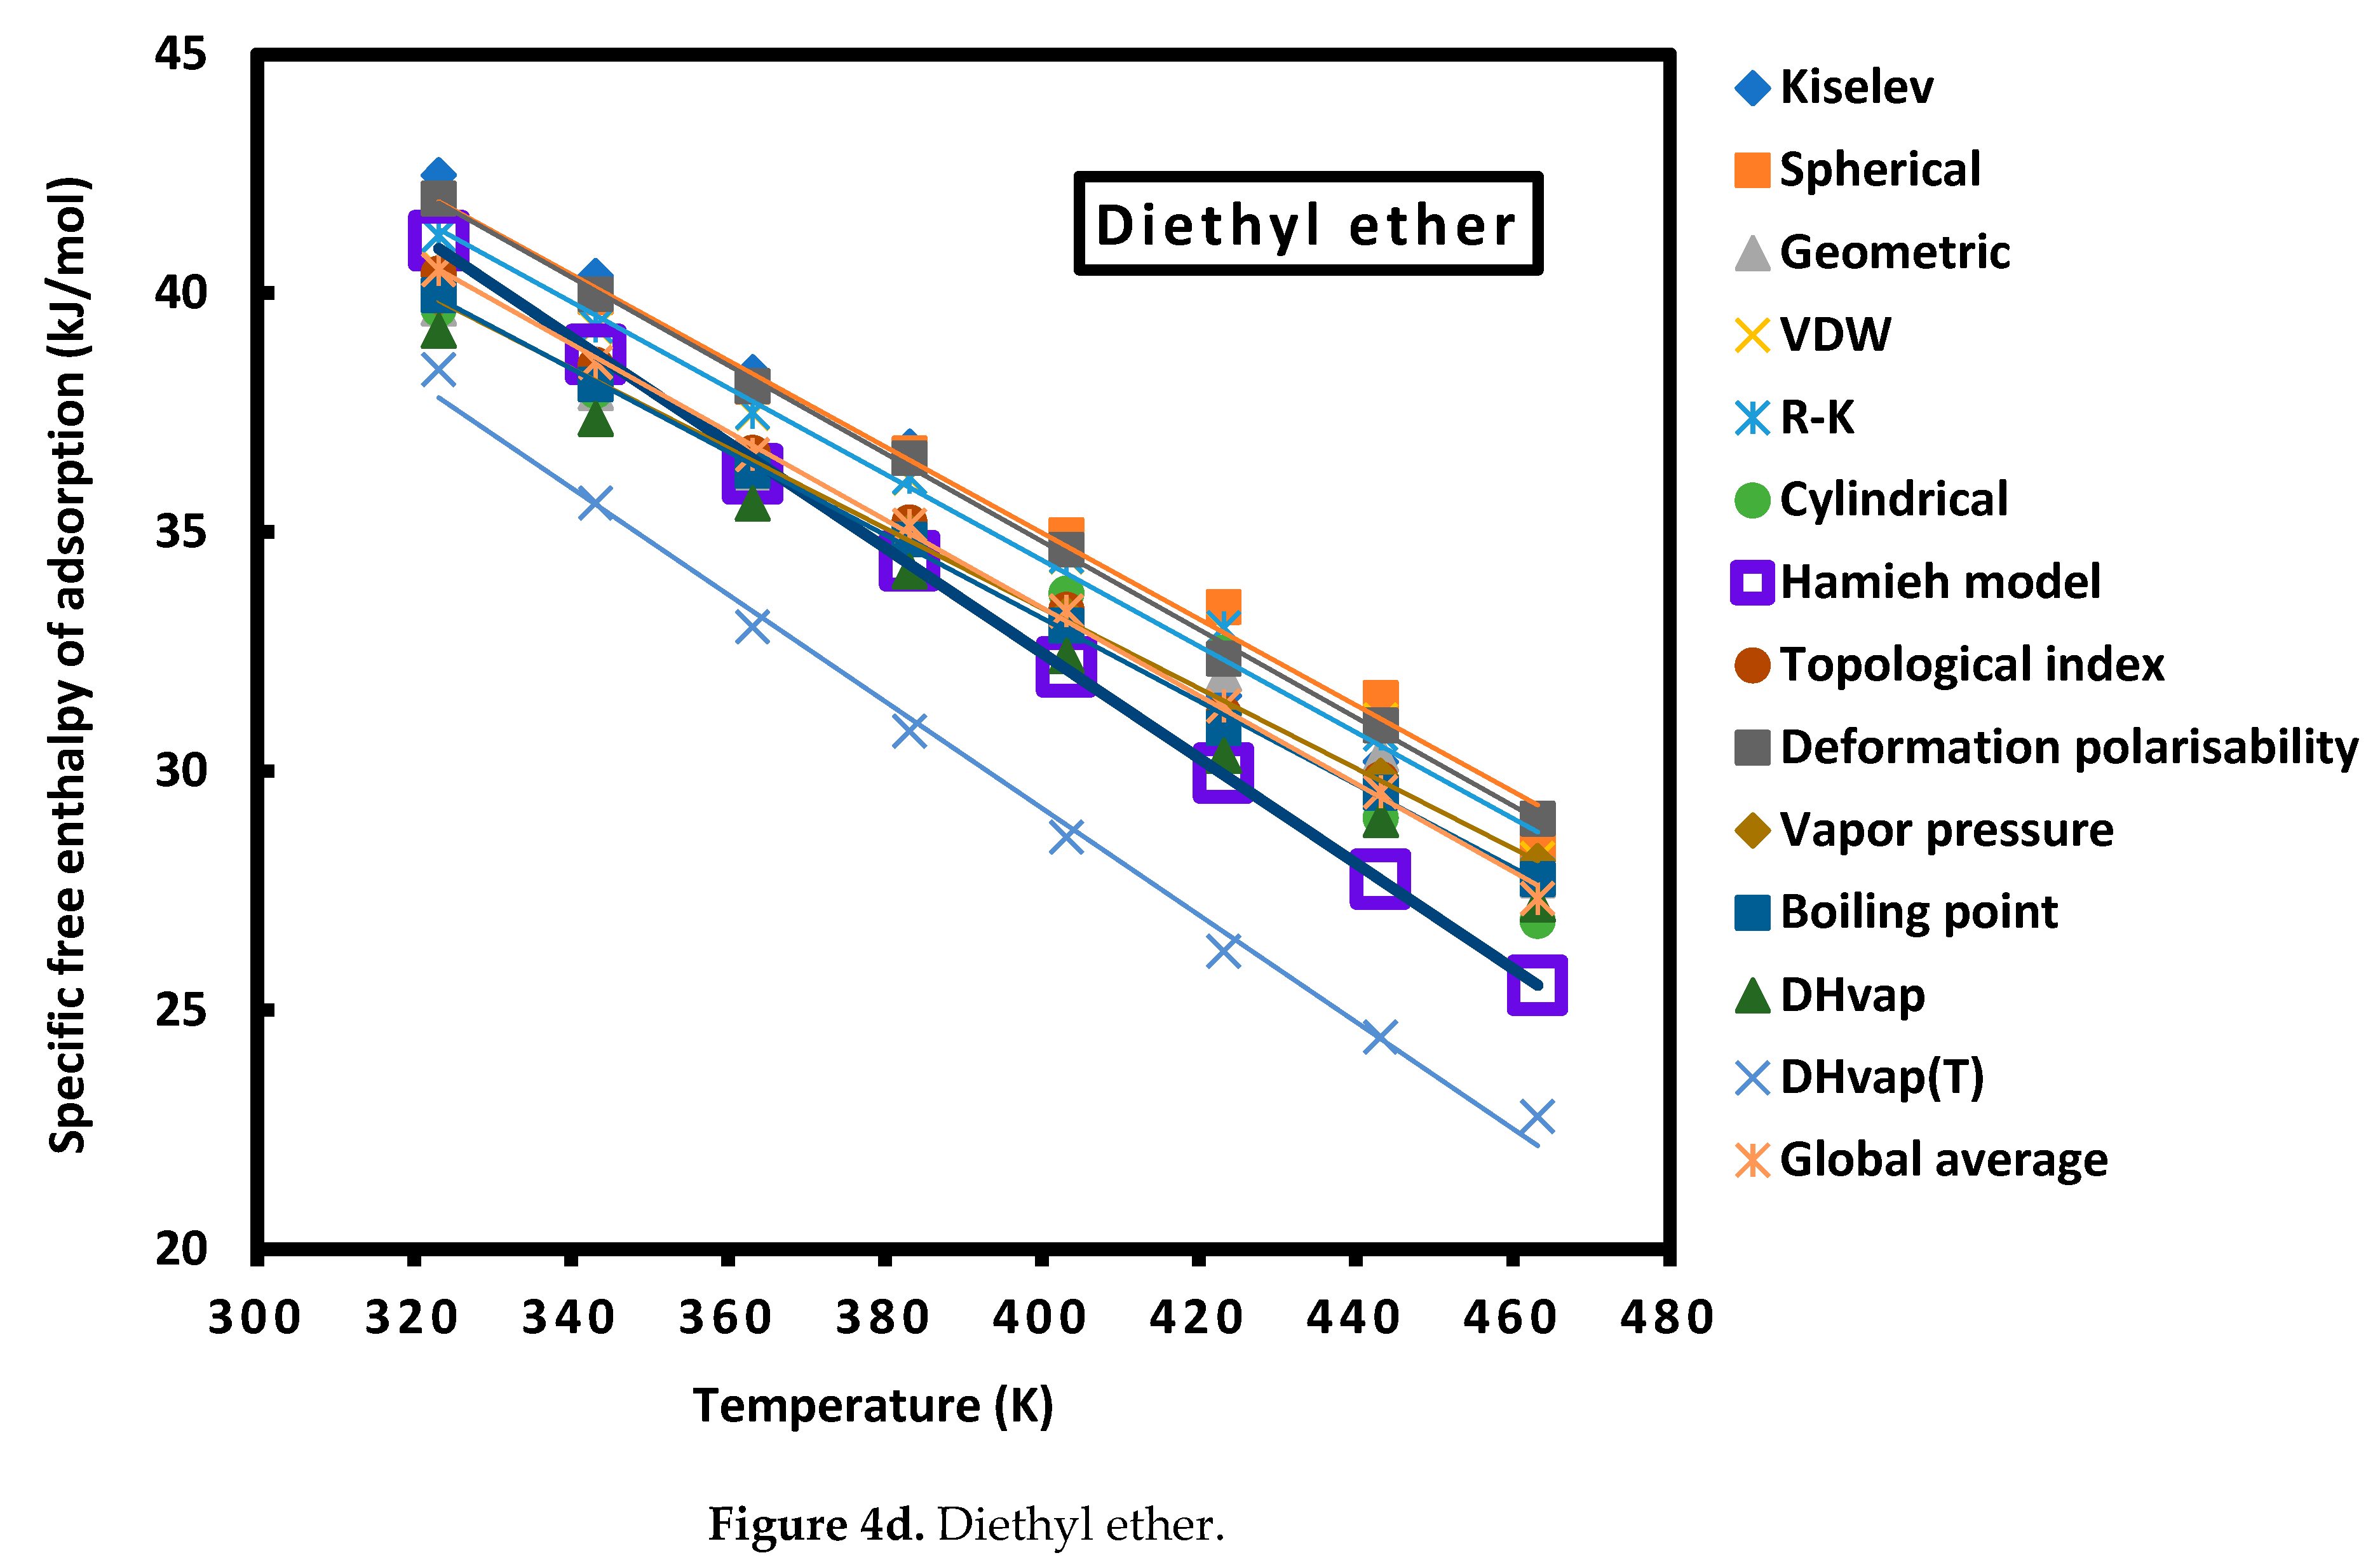
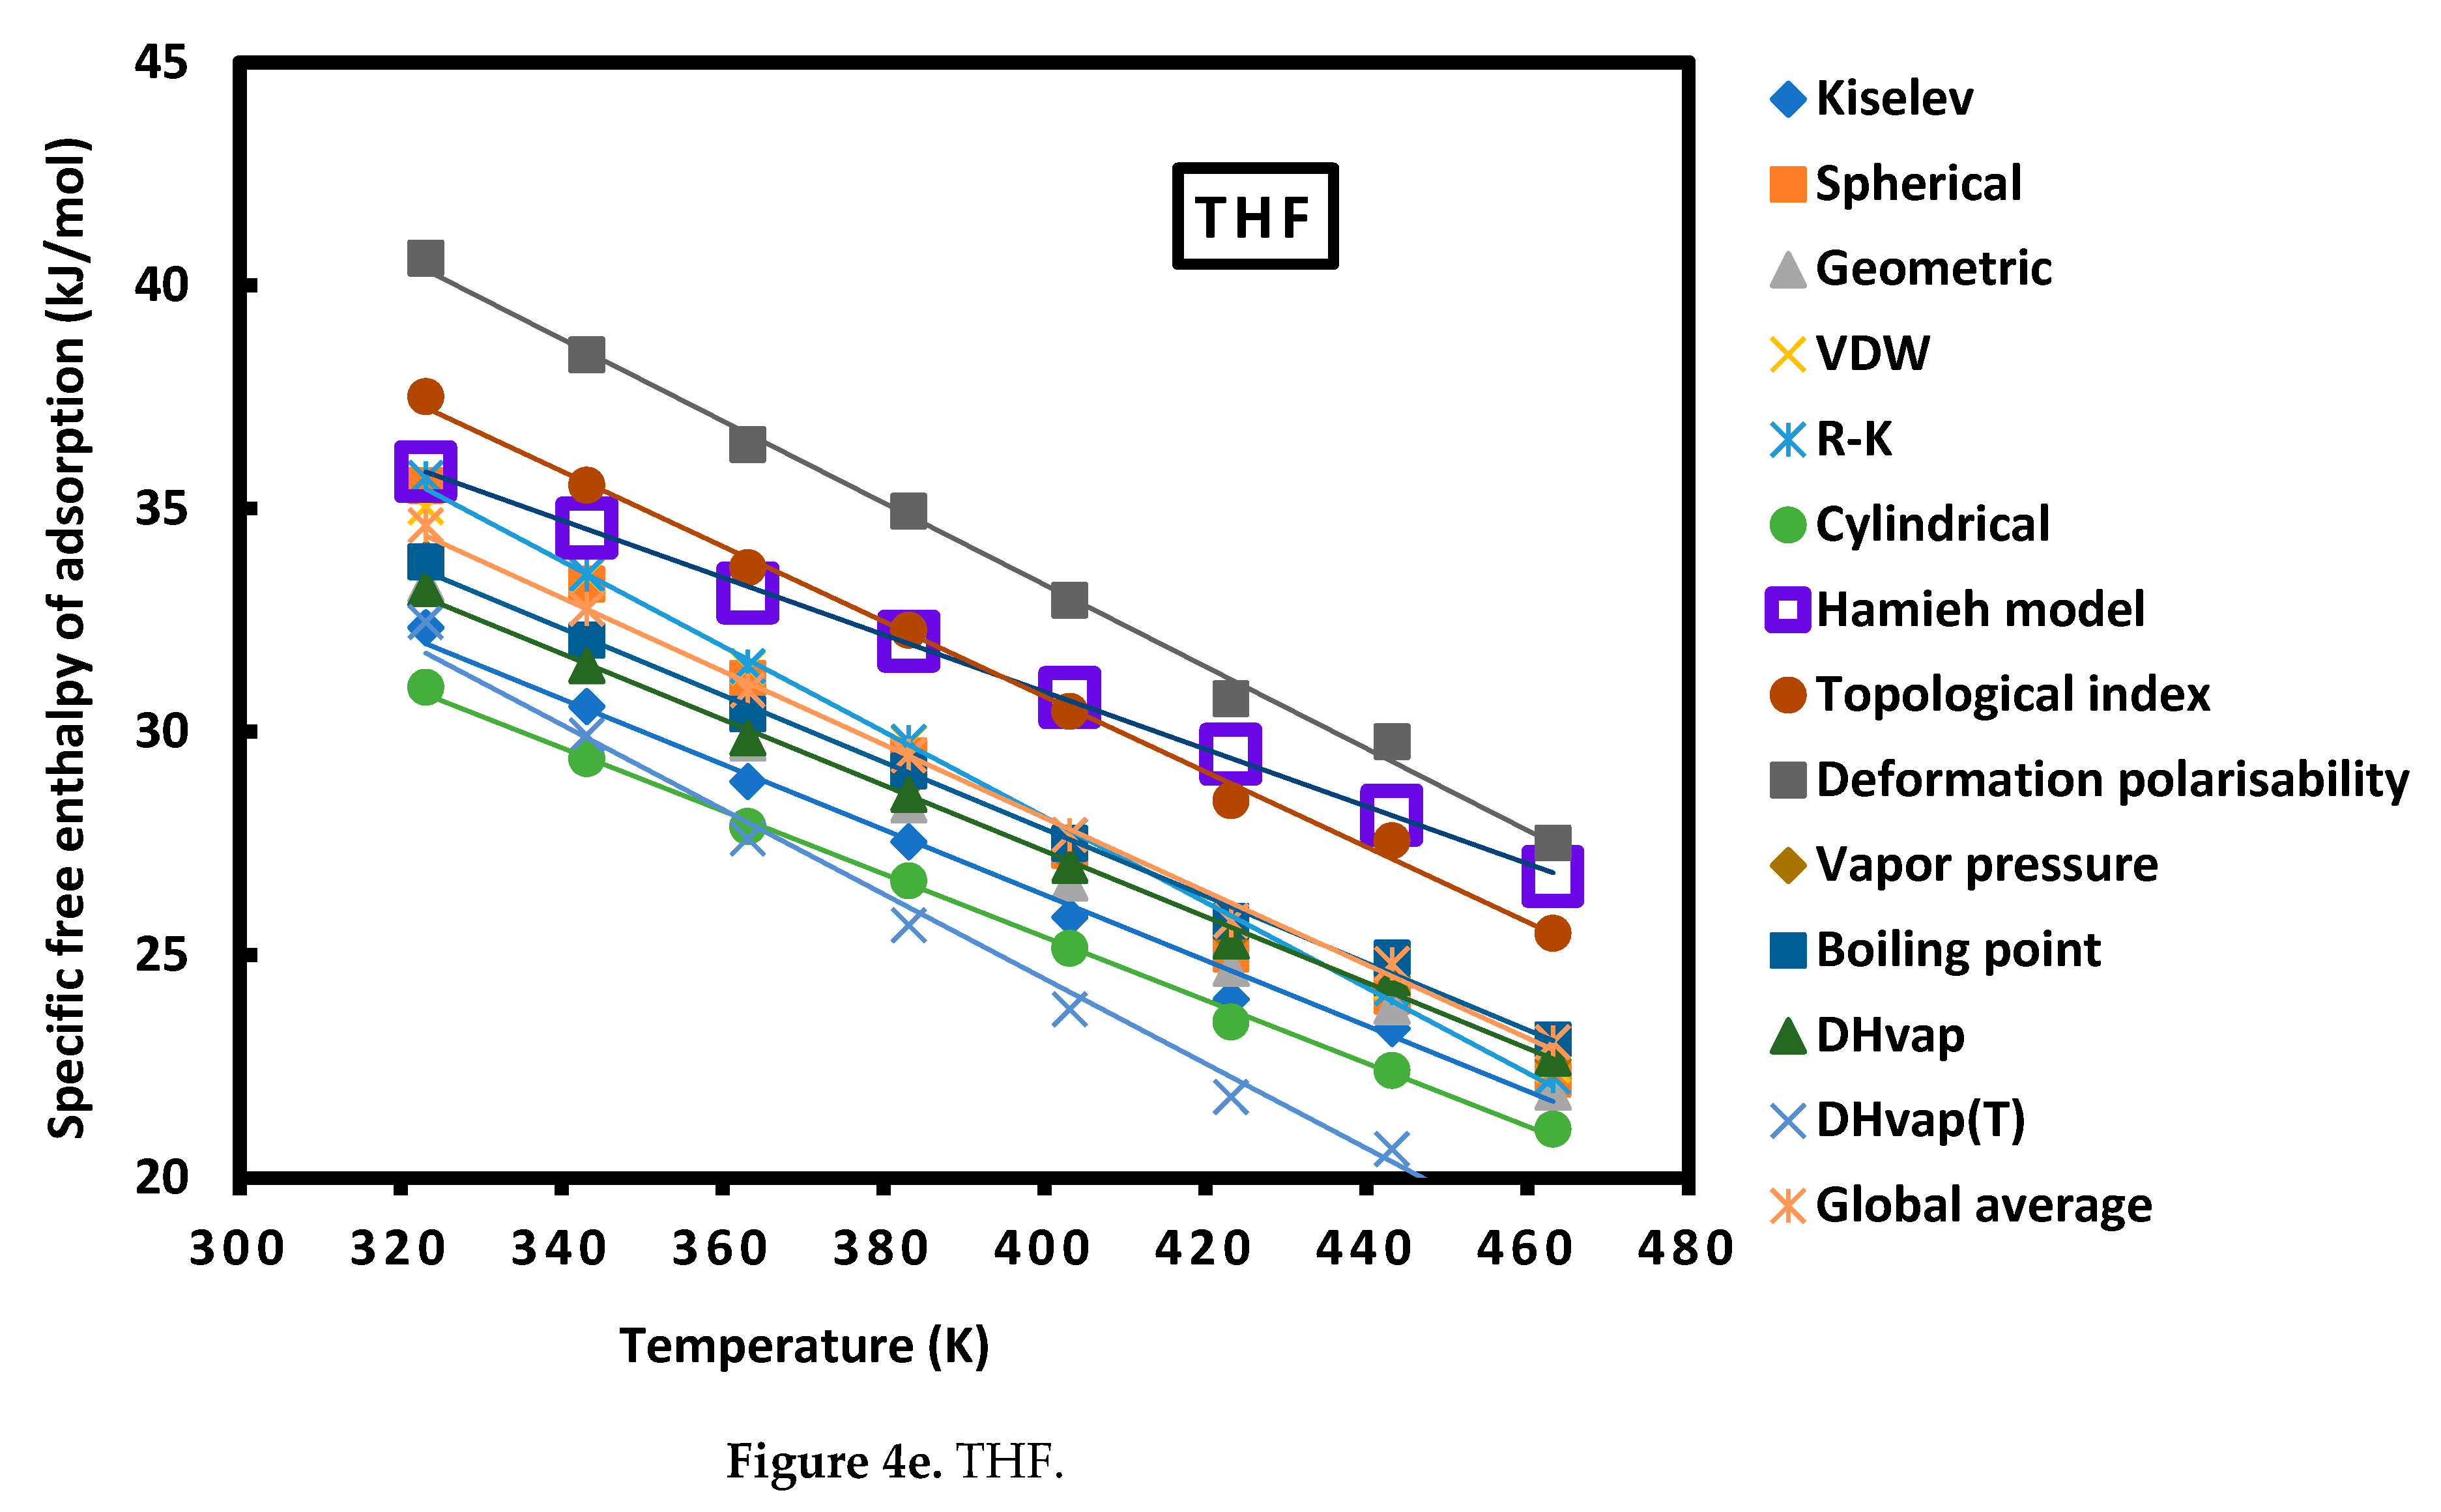
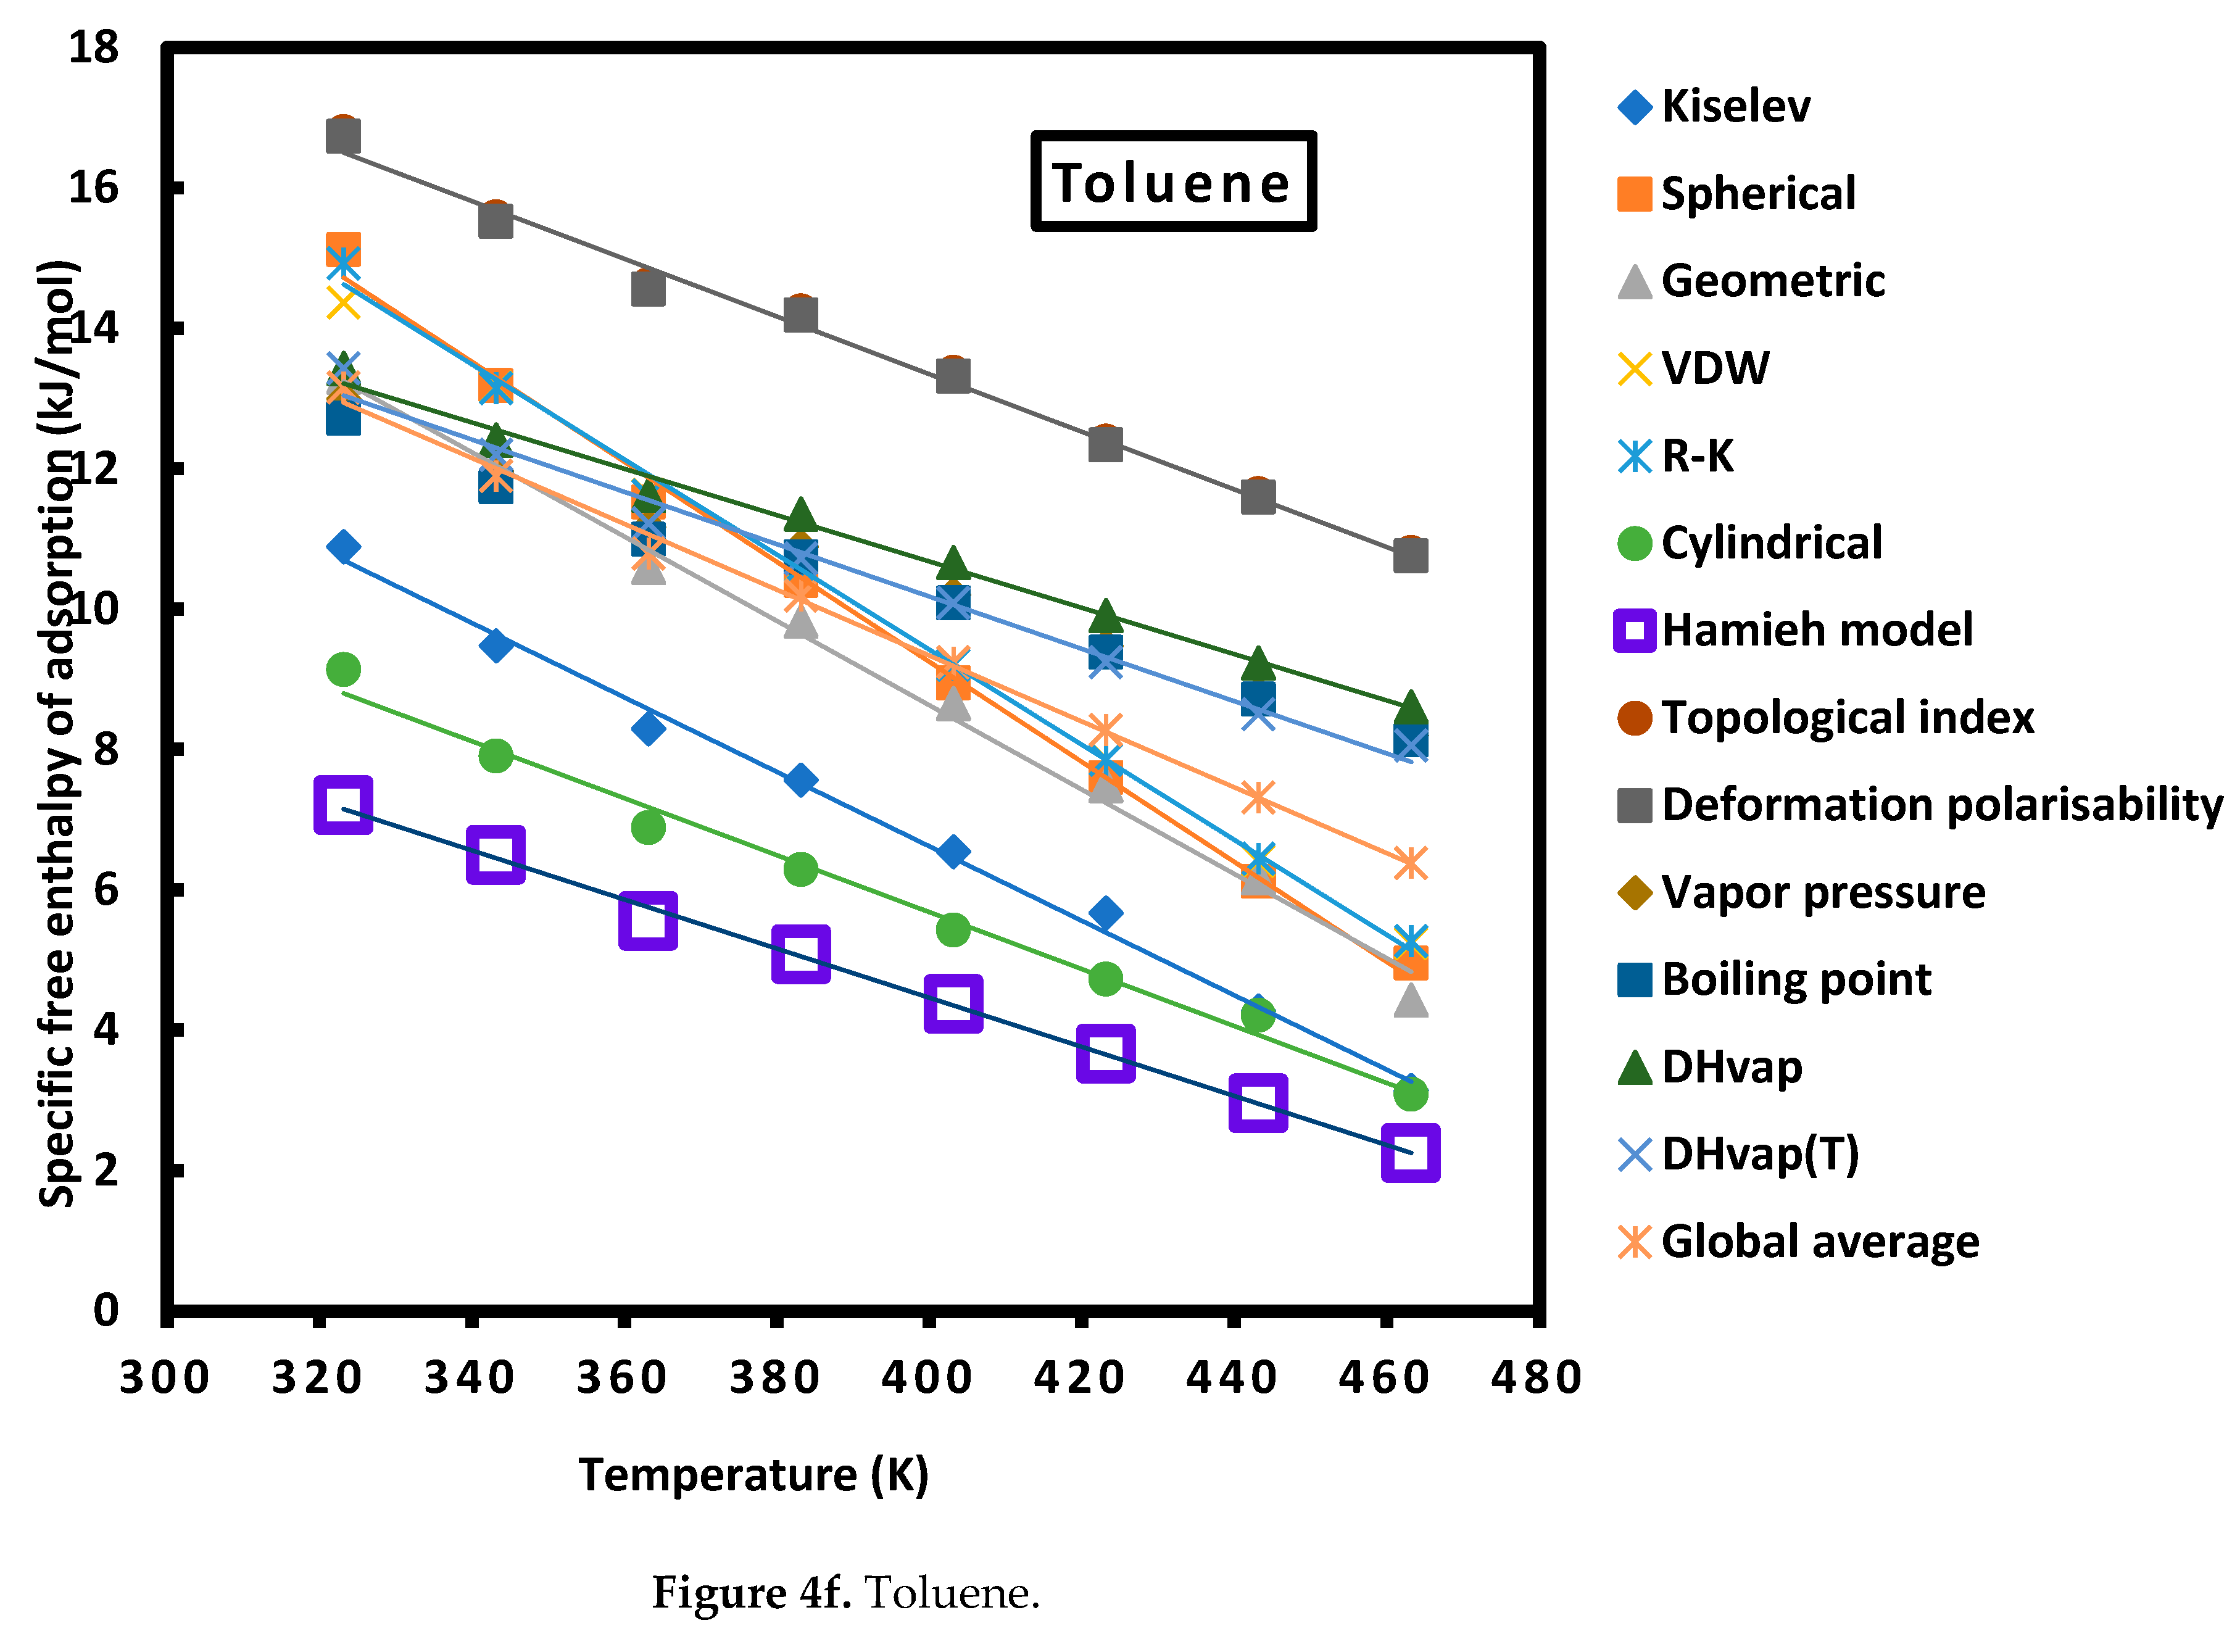
Figure 5.
Variations of as a function of of different polar molecules adsorbed on alumina surface for different molecular models and IGC methods.
Figure 5.
Variations of as a function of of different polar molecules adsorbed on alumina surface for different molecular models and IGC methods.
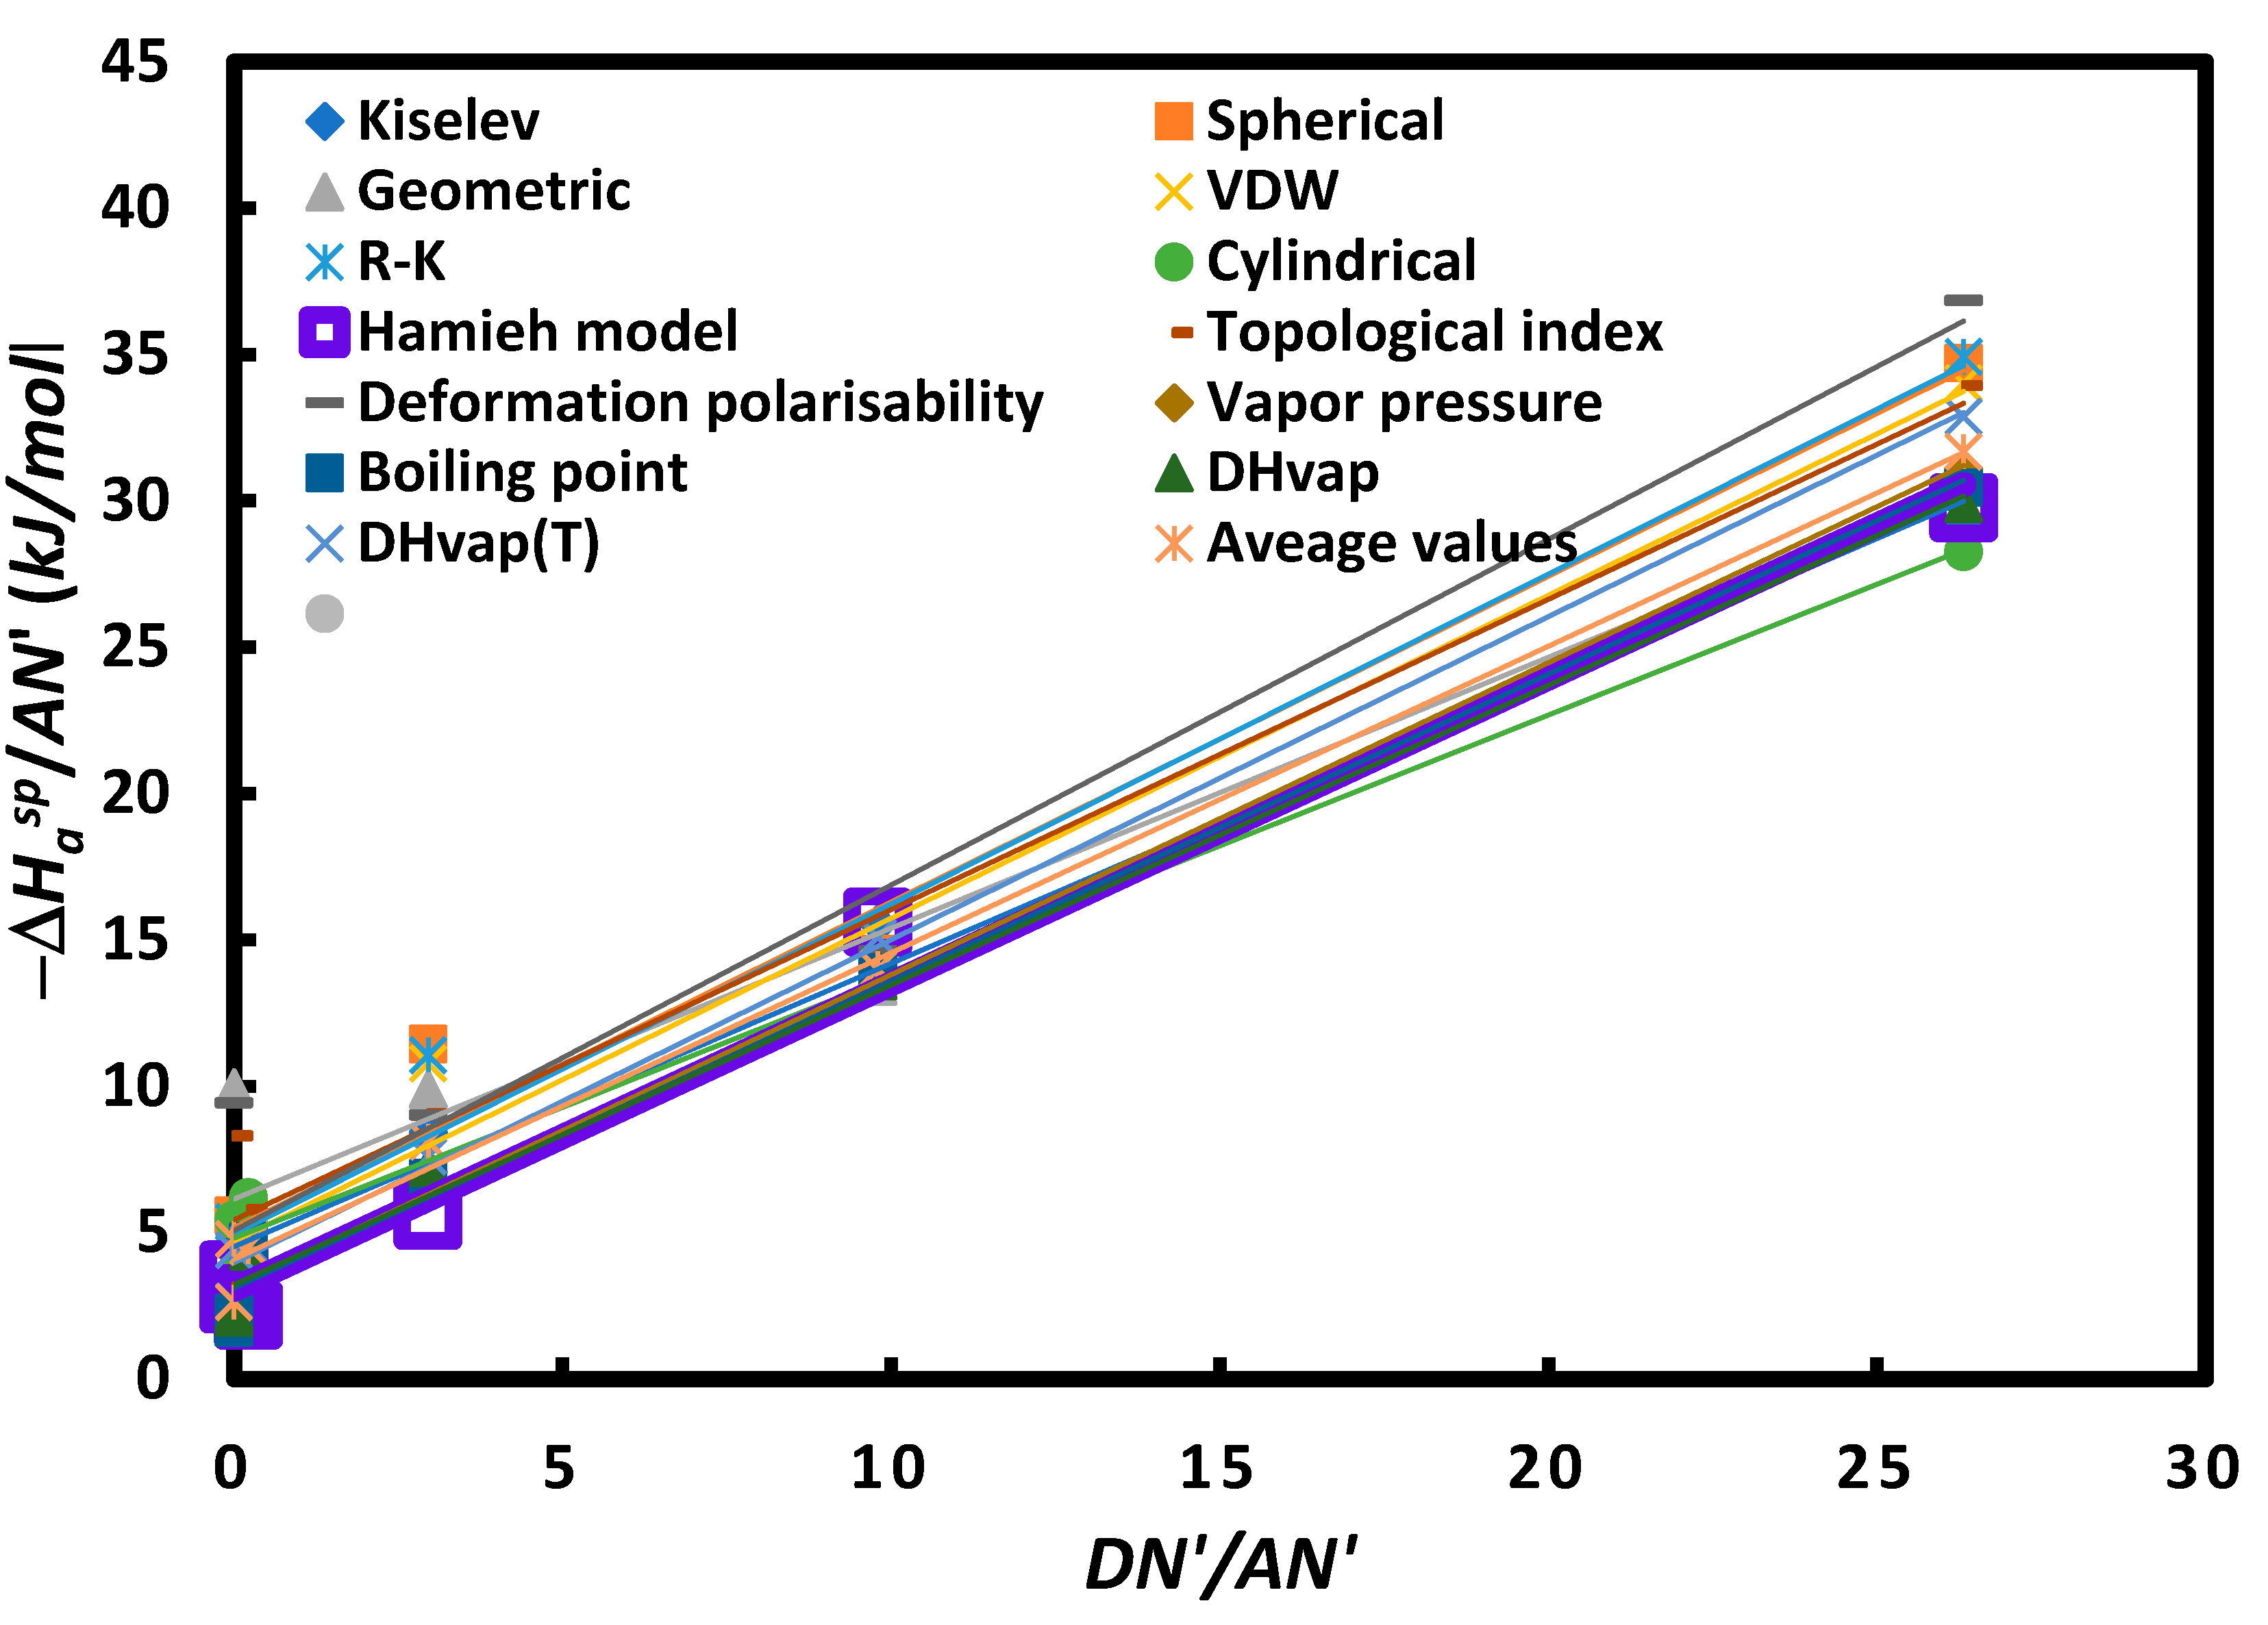
Figure 6.
Variations of as a function of of different polar molecules adsorbed on alumina particles for different molecular models and IGC methods.
Figure 6.
Variations of as a function of of different polar molecules adsorbed on alumina particles for different molecular models and IGC methods.
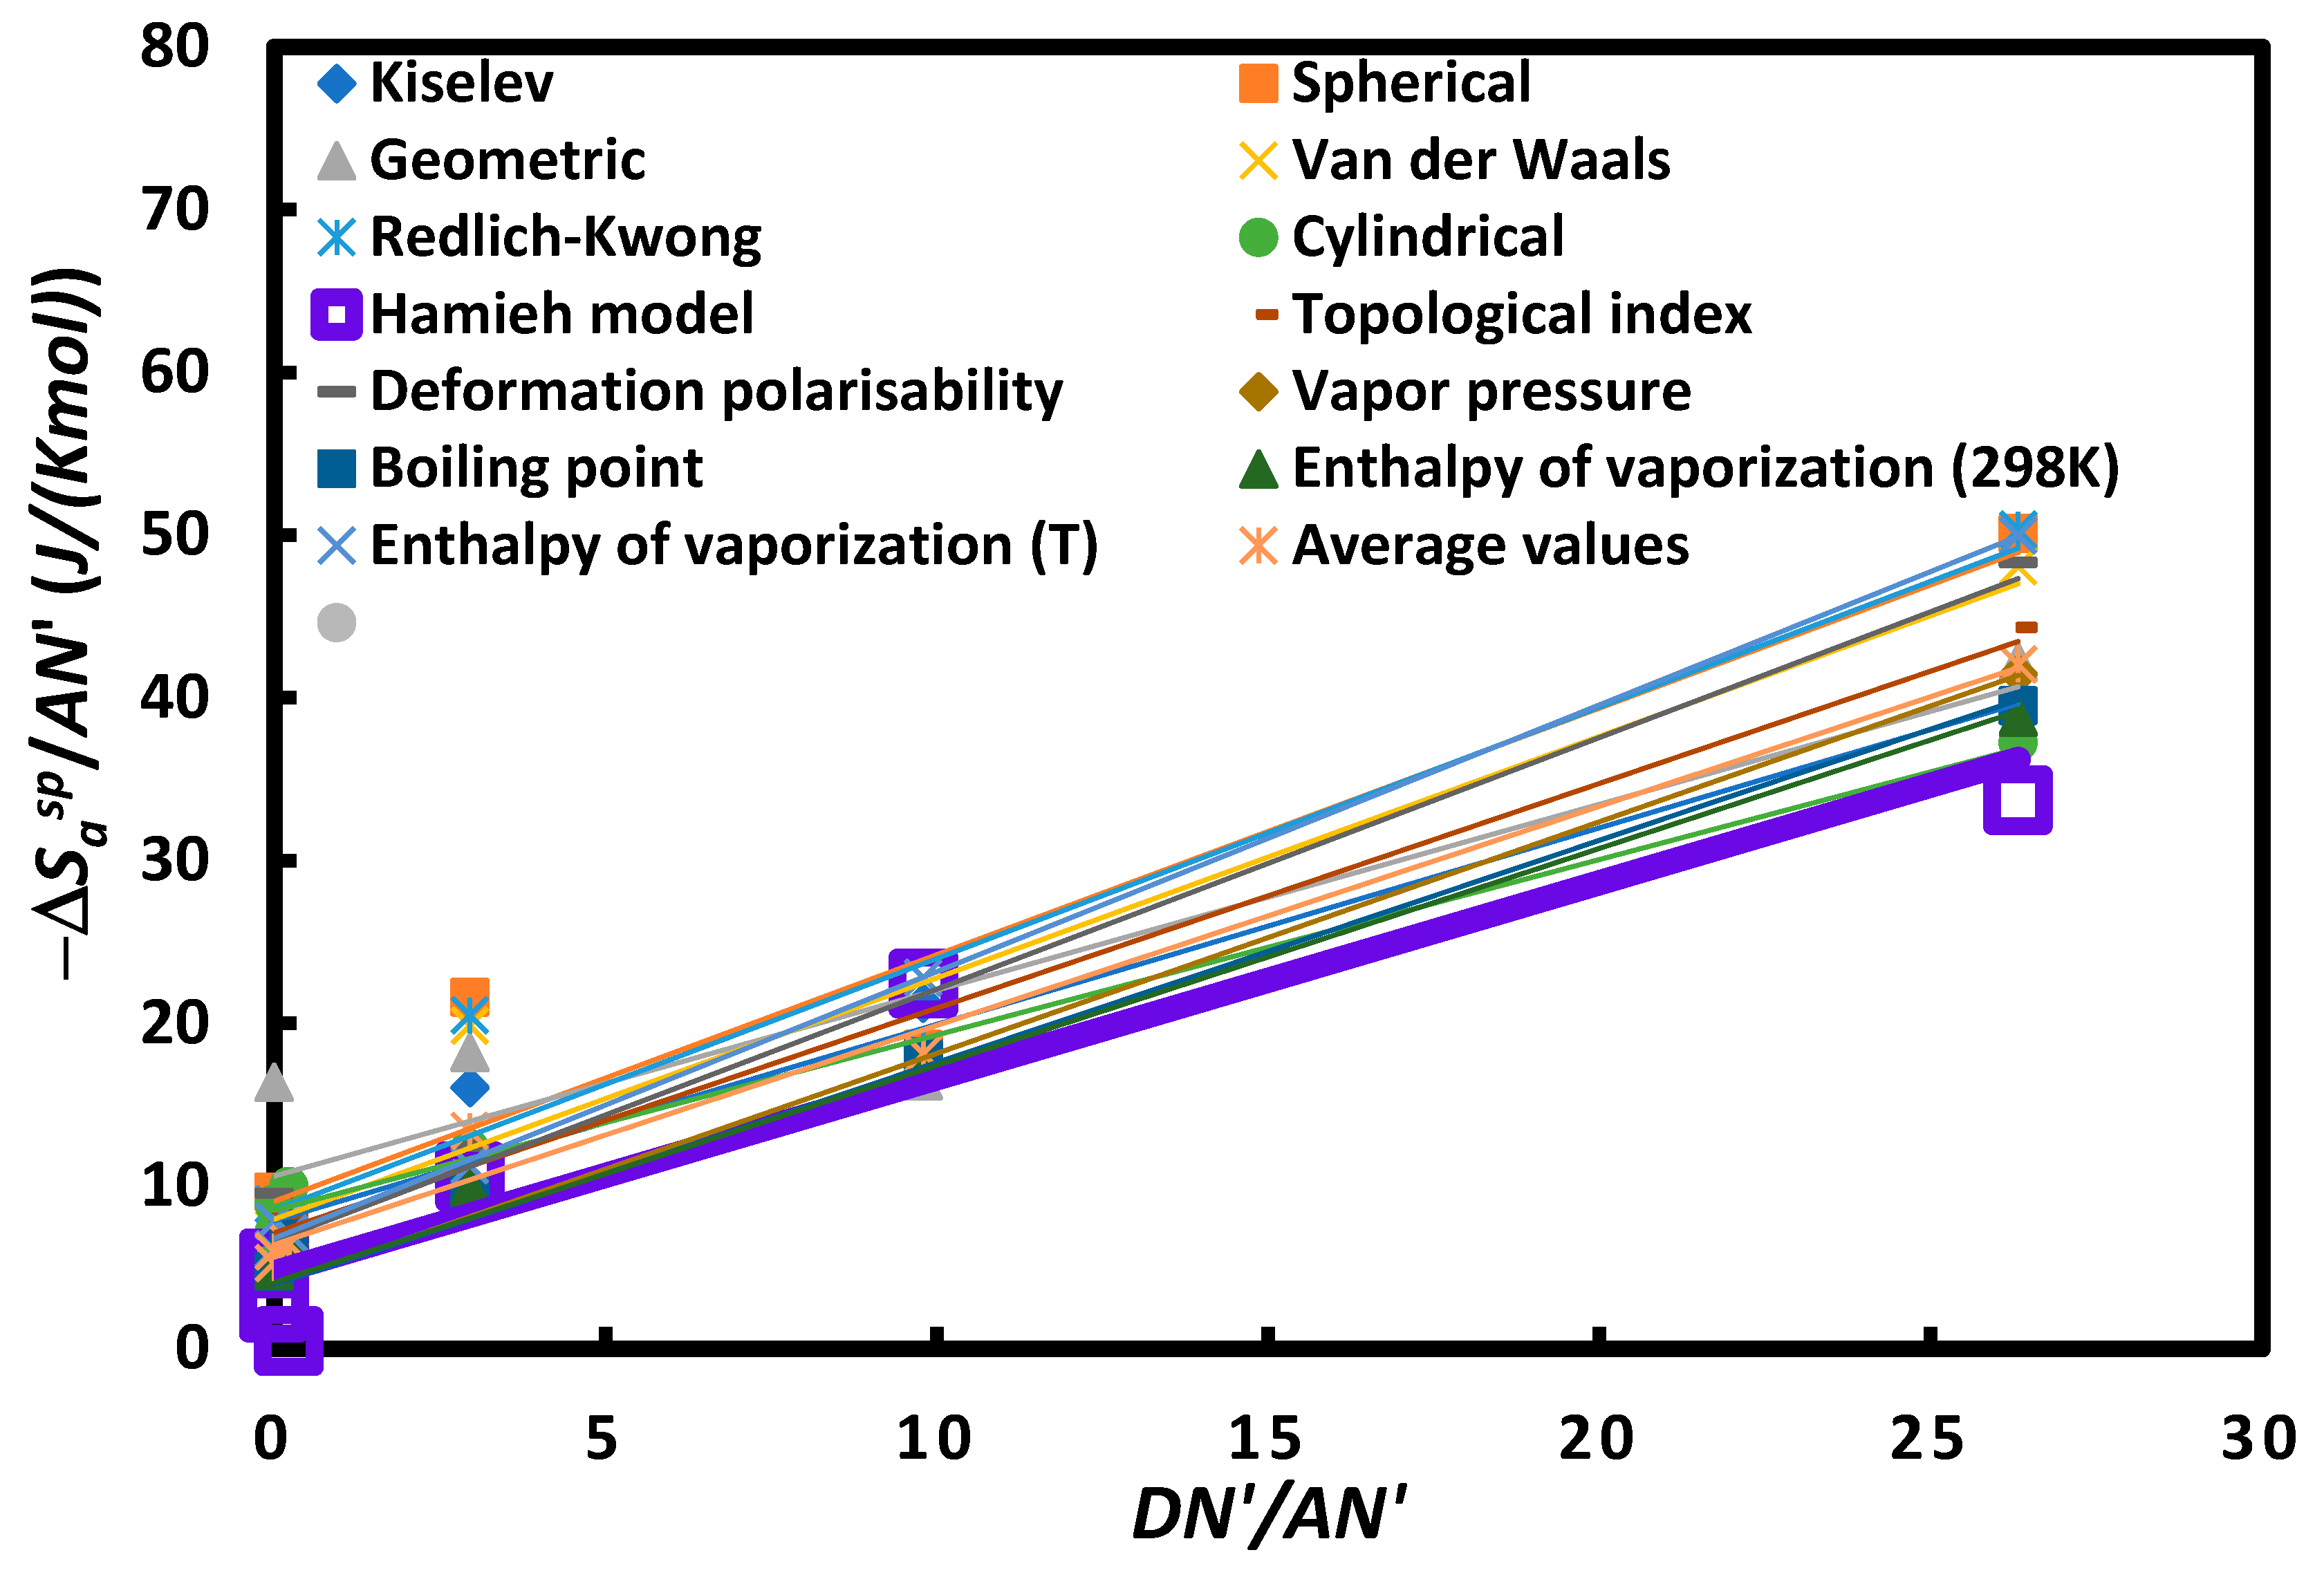

Table 1.
Surface areas of n-alkanes (in Å2) using the various molecular models.
| Cn | Sph. | Geom. | R-K | Cyl. | Kiselev | VDW |
|---|---|---|---|---|---|---|
| C5 | 36.4 | 32.9 | 36.8 | 39.3 | 45 | 47 |
| C6 | 39.6 | 40.7 | 41.3 | 45.5 | 51.5 | 52.7 |
| C7 | 42.7 | 48.5 | 46.4 | 51.8 | 57 | 59.2 |
| C8 | 45.7 | 56.2 | 50.8 | 58.1 | 63 | 64.9 |
| C9 | 48.7 | 64 | 54.5 | 64.4 | 69 | 69.6 |
| C10 | 51.7 | 71.8 | 58.2 | 70.7 | 75 | 74.4 |
Table 2.
Normalized donor and acceptor numbers of polar molecules.
| Probes | DN’ | AN’ | DN’/AN’ | Acid base force |
| CCl4 | 0 | 2.3 | 0 | acid |
| CHCl3 | 0 | 18.7 | 0 | Stronger acidity |
| CH2Cl2 | 3 | 13.5 | 0.2 | weaker amphoteric |
| Toluene | 9.75 | 3.3 | 3.0 | Amphoteric |
| Diethyl ether | 48 | 4.9 | 9.8 | Amphoteric |
| THF | 50 | 1.9 | 26.3 | Stronger Basicity |
Table 3.
Variations of the Gibbs free energy () of adsorption of the various polar solvents on alumina particles as a function of the temperature.
Table 3.
Variations of the Gibbs free energy () of adsorption of the various polar solvents on alumina particles as a function of the temperature.
| T(K) | 303.15 | 323.15 | 343.15 | 363.15 | 383.15 | 403.15 | 423.15 | 443.15 | 463.15 |
|---|---|---|---|---|---|---|---|---|---|
| Pentane | 25430 | 25461 | 25493 | 25609 | 25397 | 25538 | 25784 | 25651 | 25682 |
| Hexane | 28674 | 28716 | 28776 | 28827 | 28878 | 28929 | 29241 | 29032 | 29349 |
| Heptane | 31940 | 31857 | 31774 | 31692 | 31609 | 31527 | 31444 | 31361 | 31123 |
| Octane | 35420 | 35117 | 34813 | 34510 | 34207 | 33904 | 33601 | 33604 | 32995 |
| Nonane | 38821 | 38467 | 37716 | 37163 | 36611 | 36058 | 35506 | 34953 | 34401 |
| CH2Cl2 | 61952 | 59637 | 57919 | 56367 | 54442 | 52966 | 51248 | 49509 | 47769 |
| CHCl3 | 45147 | 42524 | 40448 | 38512 | 36838 | 34950 | 32911 | 31850 | 29664 |
| CCl4 | 34479 | 34514 | 34449 | 34435 | 34420 | 34405 | 34391 | 34376 | 34361 |
| THF | 64519 | 62228 | 60464 | 58838 | 57449 | 55865 | 54281 | 53324 | 51507 |
| Ether | 67319 | 65062 | 63377 | 61763 | 60317 | 58729 | 56976 | 55555 | 53967 |
| Toluene | 47084 | 46302 | 45020 | 44028 | 43511 | 42617 | 41724 | 40831 | 39937 |
Table 4.
Values of standard entalpy () and entropy () of adsorption of the various organic molecules adsorbed on alumina surfaces.
Table 4.
Values of standard entalpy () and entropy () of adsorption of the various organic molecules adsorbed on alumina surfaces.
| Probes | R² | |||
|---|---|---|---|---|
| Pentane | 26284 | 2.2 | = -2.2T + 26284 | 0.9967 |
| Hexane | 30423 | 4.5 | = -4.5T + 30423 | 0.9967 |
| Heptane | 33192 | 4.1 | = -4.1T + 33192 | 1.0000 |
| Octane | 40094 | 15.4 | = -15.4T + 40094 | 0.9989 |
| Nonane | 47409 | 28.1 | = -28.1T + 47409 | 0.9985 |
| CCl4 | 34696 | 0.7 | = -0.7T + 34696 | 0.9991 |
| CHCl3 | 72931 | 93.8 | = -93.8T + 72931 | 0.9949 |
| CH2Cl2 | 87807 | 86.6 | = -86.6T + 87807 | 0.9985 |
| Toluene | 60493 | 44.4 | = -44.4T + 60493 | 0.9978 |
| THF | 86959 | 76.8 | = -76.8T + 86959 | 0.9970 |
| Ether | 91555 | 81.5 | = -81.5T + 91555 | 0.9976 |
Table 5.
Values of the dispersive component of the surface energy of alumina particles as a function of the temperature.
Table 5.
Values of the dispersive component of the surface energy of alumina particles as a function of the temperature.
| (alumina) | ||||||||
| T (K) | 323.15 | 343.15 | 363.15 | 383.15 | 403.15 | 423.15 | 443.15 | 463.15 |
| Kiselev | 53.0 | 47.1 | 41.7 | 37.8 | 31.4 | 23.2 | 23.6 | 22.9 |
| Cylindrical | 52.6 | 47.3 | 42.4 | 39.2 | 33.2 | 25.2 | 17.0 | 16.4 |
| VDW | 54.4 | 48.1 | 42.3 | 38.2 | 31.4 | 22.9 | 22.1 | 18.1 |
| Geometric | 40.4 | 37.0 | 34.1 | 32.4 | 28.6 | 23.0 | 22.8 | 22.6 |
| Redlich-Kwong | 88.8 | 78.5 | 69.1 | 62.3 | 51.3 | 37.3 | 33.9 | 26.6 |
| Spherical | 148.8 | 127.9 | 109.1 | 95.0 | 74.7 | 51.4 | 48.5 | 37.5 |
| Hamieh a(T) | 80.6 | 69.3 | 59.2 | 51.6 | 40.9 | 21.2 | 20.4 | 18.1 |
| Dorris-Gray | 59.8 | 54.8 | 50.9 | 50.6 | 46.8 | 42.8 | 42.2 | 41.1 |
| Hamieh-Gray | 105.6 | 88.7 | 74.9 | 67.0 | 55.0 | 44.1 | 37.2 | 30.2 |
| Global average | 76.0 | 66.5 | 58.2 | 52.7 | 43.7 | 32.3 | 29.7 | 25.9 |
Table 6.
Equations of alumina particles for various molecular models of n-alkanes, the dispersive surface entropy , the extrapolated values and the maximum of temperature .
Table 6.
Equations of alumina particles for various molecular models of n-alkanes, the dispersive surface entropy , the extrapolated values and the maximum of temperature .
| Molecular model | (mJ/m2) | (mJ m-2 K-1) | (mJ/m2) | |
|---|---|---|---|---|
| Kiselev | = -0.232T + 126.4 | -0.232 | 126.4 | 544.36 |
| Cylindrical | = -0.275T + 142.3 | -0.275 | 142.3 | 517.41 |
| VDW | = -0.2674T + 139.8 | -0.267 | 139.8 | 522.89 |
| Geometric | = -0.138T + 84.6 | -0.139 | 84.6 | 610.58 |
| Redlich-Kwong | = -0.455T + 235.1 | -0.456 | 235.1 | 516.05 |
| Spherical | = -0.815T + 407.2 | -0.815 | 407.2 | 499.39 |
| Hamieh model | = 0.480T + 233.9 | -0.480 | 233.9 | 487.21 |
| Dorris-Gray | = -0.132T + 100.7 | -0.133 | 100.7 | 760.08 |
| Hamieh-Gray | = -0.500T + 271.0 | -0.530 | 271.0 | 511.78 |
| Global average | = -0.370T + 141.2 | -0.370 | 193.4 | 523.42 |
Table 7.
The linear equations of (kJ/mol) of polar solvents adsorbed on alumina particles as a function of the temperature T (K) for all models and methods.
Table 7.
The linear equations of (kJ/mol) of polar solvents adsorbed on alumina particles as a function of the temperature T (K) for all models and methods.
| Model or method | Polar solvent | Equation(kJ/mol) |
| Kiselev | CCl4 | = -0.015 T + 9.951 |
| CHCl3 | = -0.0950 T + 66.196 | |
| CH2Cl2 | = -0.099 T + 49.816 | |
| Diethyl ether | = -0.104 T + 76.237 | |
| THF | = -0.073 T + 55.663 | |
| Toluene | = -0.053 T + 27.836 | |
| Spherical | CCl4 | = -0.022 T + 12.846 |
| CHCl3 | = -0.109 T + 73.138 | |
| CH2Cl2 | = -0.115 T + 58.418 | |
| Diethyl ether | D= -0.090 T + 71.08 | |
| THF | = -0.095 T + 65.952 | |
| Toluene | = -0.071 T + 37.748 | |
| Geometric | CCl4 | = -0.038 T + 22.904 |
| CHCl3 | = -0.119 T + 77.161 | |
| CH2Cl2 | = -0.121 T + 60.18 | |
| Diethyl ether | = -0.081 T + 65.801 | |
| THF | = -0.080 T + 59.029 | |
| Toluene | = -0.060 T + 32.654 | |
| Vand der Waals (VDW) | CCl4 | = -0.017 T + 10.919 |
| CHCl3 | = -0.101 T + 69.275 | |
| CH2Cl2 | = -0.111 T + 56.128 | |
| Diethyl ether | = -0.085 T + 68.404 | |
| THF | = -0.091 T + 64.627 | |
| Toluene | = -0.066 T + 35.609 | |
| Redlich-Kwong (R-K) | CCl4 | = -0.021 T + 12.349 |
| CHCl3 | = -0.105 T + 70.824 | |
| CH2Cl2 | = -0.113 T + 57.257 | |
| Diethyl ether | = -0.090 T + 70.46 | |
| THF | = -0.096 T + 66.356 | |
| Toluene | = -0.068 T + 36.511 | |
| Cylindrical | CCl4 | = -0.021 T + 12.489 |
| CHCl3 | = -0.135 T + 83.700 | |
| CH2Cl2 | = -0.136 T + 65.871 | |
| Diethyl ether | = -0.088 T + 68.367 | |
| THF | = -0.071 T + 53.71 | |
| Toluene | = -0.041 T + 21.91 | |
| Hamieh model | CCl4 | = -0.006 T + 8.164 |
| CH2Cl2 | = -0.007 T + 29.475 | |
| CHCl3 | = -0.099 T + 51.024 | |
| Diethyl ether | = -0.110 T + 76.509 | |
| THF | = -0.064 T + 56.551 | |
| Toluene | = -0.035 T + 18.456 | |
| Topological index | CCl4 | = -0.019 T + 19.115 |
| CH2Cl2 | = -0.111 T + 77.995 | |
| CHCl3 | = -0.112 T + 58.858 | |
| Diethyl ether | = -0.088 T + 68.894 | |
| THF | = -0.084 T + 64.482 | |
| Toluene | = -0.041 T + 29.895 | |
| Deformation polarizability | CCl4 | = -0.022 T + 21.723 |
| CH2Cl2 | = -0.083 T + 57.101 | |
| CHCl3 | = -0.100 T + 50.004 | |
| Diethyl ether | = -0.0922 T + 71.692 | |
| THF | = -0.092 T + 70.019 | |
| Toluene | = -0.041 T + 29.774 | |
| Vapor pressure | CCl4 | = 0.001 T + 4.7609 |
| CH2Cl2 | = -0.087 T + 61.958 | |
| CHCl3 | = -0.091 T + 43.784 | |
| Diethyl ether | = -0.084 T + 66.903 | |
| THF | = -0.079 T + 59.071 | |
| Toluene | = -0.033 T + 23.369 | |
| Boiling point | CCl4 | = 0.002 T + 4.0546 |
| CH2Cl2 | = -0.091 T + 63.571 | |
| CHCl3 | = -0.089 T + 42.024 | |
| Diethyl ether | = -0.087 T + 68.002 | |
| THF | = -0.075 T + 57.849 | |
| Toluene | = -0.031 T + 22.645 | |
| Enthalpy of vaporization DHvap(298K) | CCl4 | = 0.001 T + 4.8875 |
| CH2Cl2 | = -0.086 T + 59.17 | |
| CHCl3 | = -0.091 T + 43.106 | |
| Diethyl ether | = -0.086 T + 66.757 | |
| THF | = -0.074 T + 56.843 | |
| Toluene | = -0.033 T + 23.885 | |
| Thermic enthalpy of vaporization DHvap(T) | CCl4 | = -0.018 T + 10.116 |
| CH2Cl2 | = -0.096 T + 62.393 | |
| CHCl3 | = -0.115 T + 49.546 | |
| Diethyl ether | = -0.112 T + 73.958 | |
| THF | = -0.095 T + 62.454 | |
| Toluene | = -0.037 T + 25.095 |
Table 8.
Values of the specific enthalpy () of the various polar solvents adsorbed on alumina by using the various molecular models, Hamieh model, topological index, deformation polarizability and vapor pressure methods compared to global average with the standard deviation and the error percentage.
| Probes | CCl4 | CHCl3 | CH2Cl2 | Diethyl ether | THF | Toluene |
|---|---|---|---|---|---|---|
| Kiselev | 9.95 | 49.82 | 66.20 | 76.24 | 55.66 | 27.84 |
| Spherical | 12.85 | 58.42 | 73.14 | 71.08 | 65.95 | 37.75 |
| Geometric | 22.90 | 60.18 | 77.16 | 65.80 | 59.03 | 32.65 |
| VDW | 10.92 | 56.13 | 69.28 | 68.40 | 64.63 | 35.61 |
| R-K | 12.35 | 57.26 | 70.82 | 70.46 | 66.36 | 36.51 |
| Cylindrical | 12.49 | 65.87 | 83.70 | 68.37 | 53.71 | 21.91 |
| Hamieh model | 8.16 | 51.02 | 29.48 | 76.51 | 56.55 | 18.46 |
| Topological index | 19.12 | 58.86 | 78.00 | 68.89 | 64.48 | 29.90 |
| Deformation polarizability | 21.72 | 50.00 | 57.10 | 71.69 | 70.02 | 29.77 |
| Vapor pressure | 4.76 | 43.78 | 61.96 | 66.90 | 59.07 | 23.37 |
| Boiling point | 4.05 | 42.02 | 63.57 | 68.00 | 57.85 | 22.65 |
| DHvap(298K) | 4.89 | 43.11 | 59.17 | 66.76 | 56.84 | 23.89 |
| DHvap(T) | 10.12 | 49.55 | 62.39 | 73.96 | 62.45 | 25.10 |
| Average values | 11.87 | 52.77 | 65.54 | 70.24 | 60.97 | 28.11 |
| Standard deviation | 6.16 | 7.34 | 13.41 | 3.52 | 4.99 | 6.17 |
| Error percentage | 51.86 | 13.91 | 20.47 | 5.01 | 8.18 | 21.96 |
Table 9.
Values of the specific entropy () of the various polar solvents adsorbed on alumina by using the various molecular models, Hamieh model, topological index, deformation polarizability and vapor pressure methods compared to global average with the standard deviation and the error percentage.
Table 9.
Values of the specific entropy () of the various polar solvents adsorbed on alumina by using the various molecular models, Hamieh model, topological index, deformation polarizability and vapor pressure methods compared to global average with the standard deviation and the error percentage.
| Probes | CCl4 | CHCl3 | CH2Cl2 | Diethyl ether | THF | Toluene |
|---|---|---|---|---|---|---|
| Kiselev | 15.1 | 98.8 | 94.9 | 104.1 | 73.3 | 53 |
| Spherical | 22.2 | 114.5 | 108.8 | 90.2 | 95.2 | 71.3 |
| Geometric | 37.7 | 120.8 | 119.1 | 80.8 | 80.2 | 60.1 |
| VDW | 17 | 111.1 | 101.1 | 84.9 | 91.4 | 65.6 |
| R-K | 20.5 | 113.3 | 104.9 | 90.1 | 95.7 | 67.7 |
| Cylindrical | 20.5 | 133.5 | 134.7 | 87.7 | 70.8 | 40.6 |
| Hamieh model | 5.9 | 98.7 | 6.7 | 110.1 | 64.1 | 35 |
| Topological index | 18.5 | 112 | 111.2 | 88.4 | 84.2 | 41.2 |
| Deformation polarizability | 22 | 99.9 | 82.7 | 92.2 | 91.8 | 41.1 |
| Vapor pressure | -0.6 | 91.2 | 86.6 | 83.7 | 78.8 | 32.8 |
| Boiling point | -2.2 | 88.9 | 91.3 | 87 | 75.1 | 31.4 |
| DHvap(298K) | -1 | 90.5 | 85.5 | 85.5 | 73.8 | 33 |
| DHvap(T) | 18.1 | 114.7 | 96.1 | 111.8 | 95 | 37.3 |
| Average values | 14.9 | 106.8 | 94.1 | 92.0 | 82.3 | 46.9 |
| Standard deviation | 11.48 | 13.31 | 30.08 | 10.07 | 10.68 | 14.61 |
| Error percentage | 77.02 | 12.46 | 31.97 | 10.94 | 12.98 | 31.15 |
Table 10.
Values of the enthalpic acid base constants and (unitless) and the entropic acid base constants and (unitless) of alumina surface and the acid base ratios for the different used molecular models and IGC methods.
Table 10.
Values of the enthalpic acid base constants and (unitless) and the entropic acid base constants and (unitless) of alumina surface and the acid base ratios for the different used molecular models and IGC methods.
| Models and IGC methods | / | 103. | 103. | / | ||
| Kiselev | 0.578 | 2.705 | 4.68 | 0.72 | 4.71 | 6.5 |
| Spherical | 0.665 | 3.093 | 4.65 | 0.91 | 5.42 | 6.0 |
| Geometric | 0.553 | 3.676 | 6.65 | 0.68 | 6.34 | 9.3 |
| VDW | 0.659 | 2.818 | 4.28 | 0.89 | 4.76 | 5.4 |
| R-K | 0.674 | 2.961 | 4.40 | 0.92 | 5.11 | 5.5 |
| Cylindrical | 0.534 | 2.879 | 5.39 | 0.64 | 5.09 | 7.9 |
| Hamieh model | 0.624 | 1.831 | 2.93 | 0.72 | 2.79 | 3.9 |
| Topological index | 0.633 | 3.250 | 5.13 | 0.82 | 4.27 | 5.2 |
| Deformation polarizability | 0.705 | 3.034 | 4.30 | 0.92 | 3.97 | 4.3 |
| Vapor pressure | 0.637 | 1.887 | 2.96 | 0.85 | 2.35 | 2.8 |
| Boiling point | 0.626 | 1.863 | 2.97 | 0.82 | 2.36 | 2.9 |
| DHvap | 0.612 | 1.928 | 3.15 | 0.80 | 2.46 | 3.1 |
| DHvap(T) | 0.659 | 2.376 | 3.60 | 0.98 | 4.07 | 4.2 |
| Average values | 0.628 | 2.639 | 4.20 | 0.82 | 4.13 | 5.0 |
| Standard deviation | 0.05 | 0.61 | 0.10 | 1.29 | ||
| Error percentage | 7.78 | 22.96 | 12.79 | 31.34 |
Disclaimer/Publisher’s Note: The statements, opinions and data contained in all publications are solely those of the individual author(s) and contributor(s) and not of MDPI and/or the editor(s). MDPI and/or the editor(s) disclaim responsibility for any injury to people or property resulting from any ideas, methods, instructions or products referred to in the content. |
© 2023 by the author. Licensee MDPI, Basel, Switzerland. This article is an open access article distributed under the terms and conditions of the Creative Commons Attribution (CC BY) license (https://creativecommons.org/licenses/by/4.0/).
Copyright: This open access article is published under a Creative Commons CC BY 4.0 license, which permit the free download, distribution, and reuse, provided that the author and preprint are cited in any reuse.


