
Submitted:
17 November 2024
Posted:
18 November 2024
You are already at the latest version
Abstract
A new methodology on the determination of the surface properties of solid surfaces was recently proposed. Our new approach consisted in the accurate quantification of the London dispersive surface energy of materials using the two-dimensional inverse gas chromatography technique at infinite dilution. the notion of the net retention volume of adsorbed molecules The Hamieh thermal model proving the temperature effect on the surface area of organic molecules adsorbed on H--zeolite / rhodium catalysts at different rhodium percentages, was used to determine the accurate values of the London dispersive surface energy of solid surfaces at different temperatures. Whereas, the new method allowing a precise evaluation of dispersive adhesion work, dispersive surface enthalpy and entropy of adsorption of n-alkanes adsorbed on the catalysts. In this paper, the London dispersive surface energy and adhesion work of H--zeolite supported rhodium catalysts using the free energy of adsorbed molecules obtained from the two-dimensional inverse gas chromatography technique at infinite dilution. It was proved that the London dispersive surface energy depended on the temperature and the rhodium coefficient while the dispersive adhesion work of n-alkanes adsorbed on H--zeolite/rhodium catalysts was function of the temperature, rhodium percentage, and the carbon atom number of n-alkanes.
Keywords:
Hamieh thermal model
; London dispersive surface energy
; catalyst
; adhesion work
; dispersive surface enthalpy and entropy of adhesion
1. Introduction
Two-dimensional (2D) inverse gas chromatography (IGC) technique at infinite dilution [1,2,3,4,5,6,7,8,9,10,11,12,13,14,15,16,17,18,19,20,21,22,23,24,25,26,27,28,29] was widely used for the surface characterization of solid materials such as oxides, metals, polymers, fibers, biomaterials and nanomaterials, ceramics, catalysts, and pharmaceutical and food products. The chromatographic measurements led to the net retention volume of the organic solvents adsorbed on the solid surfaces. This thermodynamic parameter allowed obtaining the dispersive free energy , the London dispersive surface energy , the polar enthalpy and entropy of adsorption, and the Lewis acid-base properties of materials.
The surface physicochemical properties of solid materials or nanomaterials were studied by several scientists using the inverse gas chromatography at infinite dilution [1,2,3,4,5,6,7,8,9,10,11,12,13,14,15,16,17,18,19,20,21,22,23,24,25,26,27,28,29]. The determination of these surface properties is of vital interest in many industrial processes such as catalysis, adhesion, chemical engineering, colloidal dispersions, and other industrial applications. Different chromatographic methods [21,22,23,24,25,26] and molecular models [27,30,31,32] were applied in the literature to determine the surface energetic properties of solid particles. The experimental determination of the net retention volume was utilized for the calculation of the dispersive and polar free energies of organic solvents adsorbed on solid materials using the following thermodynamic equation:
where R is the perfect gas constant, the absolute temperature, and a constant parameter depending on and the interaction between the solid materials and the organic molecules.
The first method used to calculate the London dispersive surface energy of materials was based on Dorris and Gray [33] and the well-known relationship of Fowkes [34] relating the dispersive work of adhesion to the free dispersive energy of adsorption by Equation 2:
Where is Avogadro’s number, the surface area of adsorbed solvent, and and are respectively the dispersive components of the liquid solvent and the solid.
Dorris and Gray were the first who determined the dispersive component of the surface energy of a solid by defining the increment of methylene group:
Where and represents the general formula of two consecutive n-alkanes.
The dispersive surface energy of a the solid can be therefore determined by the equation (4):
Where is the surface area of methylene group taken equal to 6 Å2 with a surface energy given by Equation 5:
Where is a constant depending on the temperature. A straight line is obtained and its slope is equal to .
In a previous paper [35], we criticized the above methods and proposed a new thermal model proving the temperature effect of the surface area and the London dispersive surface energy of the organic solvents . The use of the Hamieh thermal model [35,36] led to more accurate values of the London dispersive surface energy of solid surfaces.
Furthermore, different other methods were applied in the literature to determine the polar variables of adsorption and the Lewis acid-base parameters of solids. All these methods used the linear properties of the thermodynamic parameters of the organic solvents. A general linear equation relative to the adsorption of n-alkanes on solid surfaces was previously proposed:
where represents a surface chromatographic parameter, and and are two constants relative to the adsorption of n-alkanes on the solid surfaces experimentally determined at each temperature from the slope and the ordinate at the origin of the n-alkanes straight line thus leading to the polar free energy, enthalpy, and entropy of adsorption. The reference parameter can be taken from the following variables: the boiling point of the solvent proposed by Sawyer and Brookman [20], the vapor pressure of the solvent, used by Saint-Flour and Papirer [21,22], the London dispersive surface energy of the solvent considered by Schultz et al. [37], the deformation polarizability of the organic molecule suggested by Donnet et al. [23], the topological index determined by Brendlé and Papirer [24,25], and the Hamieh thermal model using the temperature effect on the surface area and the London dispersive surface energy of organic molecules [35,36].
The dispersive adhesion work of n-alkanes on H-β-zeolite / rhodium catalysts as a function of temperature given by Equation 8:
was never studied in the literature.
In this paper, we applied our new thermal model to determine the effect of temperature on the London dispersive surface energy and dispersive adhesion work of H-β-zeolite and the rhodium impregnated in H-β-zeolite at different rhodium percentages.
2. Materials and Methods
2.1. Materials and Solvents
The rhodium with different percentages supported by H-β-zeolites were previously synthetized in a previous paper [32] using the method developed by Navio et al. [38] and Zhang et al. [39]. Whereas, the organic solvents utilized for chromatographic measurements obtained from Aldrich (Paris, France) were of highly purity grade (i.e., 99%). The chosen solvents were n-alkanes such as pentane, hexane, heptane, octane, and nonane, amphoteric solvents such as methanol, acetone, trichloroethylene, tetrachloroethylene, basic solvents such as diethyl ether and benzene (weak base), acidic solvents such as chloroform and cyclohexane (weak acid). Corrected donor and acceptor electron numbers of the used polar probes [26,40] were previously normalized [26,41].
2.2. Experimental
The chromatographic measurements were carried out on a commercial Focus GC gas chromatograph (from Sigma-Aldrich, St. Quentin Fallavier, France) equipped with a flame ionization detector. Dried nitrogen was the carrier gas. The gas flow rate was set at 20 mL/min. The injector and detector temperatures were maintained at 450 K during the experiments [42]. To achieve infinite dilution, 0.1 μL of each probe vapor was injected with 1 μL Hamilton syringes. All chromatographic columns were prepared using a stainless-steel column with a 2 mm inner diameter and with an approximate length of 20 cm. Each column was packed with 1 g of solid particles with a size not exceeding 250 μm. The temperature of columns varied from 300 K to 430 K. Each probe injection was repeated three times, and the average retention time, tR, was used for the calculation. The standard deviation was less than 1% in all measurements.
2.3. Retention Volume
The most important experimental parameter derived from chromatographic measurements was the net retention volume was obtained from Equation 9:
where is the retention time of the adsorbed solvent, the zero-retention reference time measured with a non-adsorbing probe such as methane, the corrected flow rate and a correction factor taking into account the gas compression [42]. The factors and were respectively given by the following relations
and
where is the measured flow rate, the column temperature, the room temperature, the gas viscosity, the atmospheric pressure, and the pressure variation.
2.4. London Dispersive Surface Energy of Catalysts Using the Hamieh Thermal Model
Various molecular models were previously used for the determination of the London dispersive surface energy and polar free energy of sold particles at different temperatures. It was showed that the values of strongly depend on the chosen molecular model and the difference between the values varied and sometimes reached four times from a molecular model to another. In fact, the surface area of organic solvents depends on the temperature, while the molecular models give constant values of the surface area. This will lead to wrong values of the surface thermodynamic properties of materials. The correction of the above properties can be made by applying the Hamieh thermal model [35}. Indeed, in a recent study, we proved the temperature effect on the surface areas of molecules and proposed the following relation of the surface area of n-alkanes as a function of the temperature:
We also showed the surface area of methylene group depends on the temperature and showed the following Equation:
Another expression of the surface area of a polar molecule X was given as a function of temperature:
Where , , and are constant characteristics of the polar molecules [35].
The London dispersive surface energy of the different catalysts was therefore obtained using Relation 12 given as a function of temperature:
Plotting as a function of of n-alkanes adsorbed on zeolite material for example, we obtained a straight line giving a slope equal to and therefore the value of for the different temperatures (Figure 1).
3. Results
3.1. Determination of of n-Alkanes Adsorbed on H−β−Zeolite/Rhodium Catalysts
The chromatographic measurements led to the values of of n-alkanes adsorbed on H-β-zeolite/rhodium at different percentages of rhodium (from 0 to 2%) at different temperatures (varying 300 K to 430 K). The experimental results were given in Table S1. The variations of of n-alkanes adsorbed on H-β-zeolite/rhodium were represented in Figure 2 as a function of temperature for various rhodium percentages. The results showed linear variations for the different n-alkanes. It was observed in Figure 2 an important effect of the rhodium percentage on the free energy of adsorption. The largest values of was obtained with H-β-zeolite. The free energy of adsorption decreased when the temperature increased.
The representation of of adsorbed n-alkanes as a function of the rhodium percentage plotted in Figure 3 showed a brutal decrease from H-β-zeolite to H-β-zeolite/rhodium highlighting a maximum of at a rhodium percentage equal to 0.75% and for different temperatures.
3.2. London Dispersive Surface Energy of H−β-Zeolite/Rhodium Catalysts
The London dispersive surface energy of H-β-zeolite/rhodium catalysts was determined for different percentages of rhodium and various temperatures using Equation 14 and applying the Hamieh thermal model taking into account the temperature effect on the surface area of n-alkanes. The values of of H-β-zeolite/rhodium catalysts were given in Table S2 for different temperatures and rhodium percentages using the straight-line method and Hamieh thermal model. The variations of were plotted in Figure 4 as a function of temperature at different rhodium percentages. A decrease in the values of was observed (Figure 4) versus the temperature and for various rhodium percentages. The variations of were represented by a second-degree equation with an excellent regression coefficient (R2 = 0.9993) as follows:
where the coefficients , , and are constants depending on the solid materials.
Table S2 and Figure 4 allowed giving in Table 2 the different equations of of the various catalysts. An interesting result was deduced from Table 2. Indeed, the same value of the coefficient was obtained for all H-β-zeolite/rhodium catalysts whatever the rhodium percentage, .
It can be concluded from equations in Table 2 that the coefficients , , and are function of the different derivatives of as follows:
The variations of the coefficients and were represented in Figure 5 as a function of the rhodium percentage in the zeolite catalyst. Let us consider the rhodium percentage. The curves of coefficients and shown in Figure 5 had parabolic variations for with a minimum of for and a maximum of for the same rhodium percentage both followed by a pallier.
These equations led to conclude that the London dispersive surface energy of H-β-zeolite/rhodium catalysts can be written as a function of two variables as follows:
Where and are given by Equations 18 and 19 in the interval . We observed that is constant independent from the rhodium percentage for . These results were perfectly confirmed by the variations of plotted in Figure 6 as a function of for different values of temperature. A maximum of was also confirmed at .
We plotted the variations of H-β-zeolite/rhodium catalysts in Figure 7 as a function of the specific surface area S using the values in Table 1. The maximum of was obtained for corresponding to a rhodium percentage equal to . A minimum of was obtained at corresponding to . Whereas, the London dispersive surface energy became constant for certainly due to the effect of the rhodium percentage of the surface energy of the catalyst.
3.2. Dispersive Adhesion Work of n-Alkanes on H−β-Zeolite/Rhodium Catalysts
By applying Equation 8, the various dispersive adhesion works of the different n-alkanes on H−β-zeolite/rhodium catalysts were determined as a function of temperature. The results were given in Table S3. The corresponding curves of the variations of of the different n-alkanes were plotted in Figure 8. The results showed that the dispersive adhesion work increases when the carbon atom number of n-alkanes increases, while a decrease of was observed when the temperature increases (Figure 8). This result is a direct consequence of the decrease of the London dispersive surface energies of the solid surface and the organic solvents when the temperature decreases.
Furthermore, the curves plotted in Figure 8 showed linear variations of versus the temperature. The equations of of the different n-alkanes adsorbed on H-β-zeolite/rhodium catalysts were given in Table 3 as a function of temperature at different rhodium percentages. The excellent linearity of showed that the dispersive adhesion work can be represented by the general following:
where and are respectively the dispersive surface enthalpy and entropy of adhesion given in Table 3 for the different n-alkanes adsorbed on H-β-zeolite/rhodium catalysts.
The results in Table 3 led to the variations of the dispersive surface enthalpy (mJ m-2) and entropy (mJ m-2 K-1) of n-alkanes adsorbed on H-β-zeolite/rhodium catalysts as a function of the rhodium percentage, plotted in Figure 9.
The dispersive surface parameters and given in Figure 9 strongly depended on the rhodium percentage . Two zones were distinguished for the above surface variables. The first one was characterized by parabolic variations in the interval [; ] with a maximum obtained at . While a constant pallier for the curves of and was observed after . The results in Table 3 and Figure 9 showing parabolic variations allowed giving the different second-degree equations of and .
From Table 4, we can deduce the general equation and of n-alkanes adsorbed on H-β-zeolite/rhodium catalysts:
where , , , and are coefficients depending on the carbon atom number present in the general formula of n-alkanes.
The coefficients , , , and obtained using Table 4 and the equations 22 and 23 were given in Table 5 as a function of the carbon atom number .
The results in Table 5 led to conclude that dispersive surface enthalpy and entropy of n-alkanes are function of the rhodium percentage and the carbon atom number of n-alkanes and can be therefore written as and . The dispersive adhesion work of n-alkanes adsorbed on H-β-zeolite/rhodium catalysts can be given by Equation 24:
The dispersive adhesion work is then function of the temperature, rhodium percentage, and the carbon atom number. This new and original result proved for the first time that the adhesion work is function of three surface variables .
5. Conclusions
The 2D- inverse gas chromatography technique at infinite dilution was used to determine the dispersive surface properties of H-β-zeolite/rhodium catalysts at different rhodium percentages by varying the temperature. The chromatographic measurements led to the values of the net retention volume of adsorption of n-alkanes on the solid surfaces and therefore to the dispersive free energy of adsorption. The use of our new thermal model taking into account the temperature effect on the surface area of n-alkanes allowed to determine the accurate values of the London dispersive surface energy as a function of temperature. The results showed parabolic variations of as a function of the temperature and the rhodium coefficient . A similar variation of as a function of the specific surface area of solid catalysts was also observed. The dispersive adhesion work, surface enthalpy, and surface entropy of n-alkanes adsorbed on H-β-zeolite/rhodium catalysts were determined. The results showed linear variations of the adhesion work as a function of temperature for fixed rhodium percentage and n-alkane, and parabolic variations as a function of the rhodium percentage and the carbon atom number of n-alkanes. When the rhodium percentage and the carbon atom number varied, it was showed that the dispersive adhesion work was function of temperature, rhodium percentage, and carbon atom number.
Supplementary Materials
The following supporting information can be downloaded at the website of this paper posted on Preprints.org, Table S1. Values of (kJ/mol) of n-alkanes adsorbed on H-β-zeolite/rhodium composites as a function of the temperature for different rhodium percentages (%Rh = 0; 0.25; 0.50; 0.75; 1.00; 1.25; 1.50; 1.75; 2.00). Table S2. Values of the London dispersive surface energy of H-β-zeolite/rhodium composites as a function of temperature and rhodium percentage using the straight-line method and Hamieh thermal model. Table S3. Variation of H-β-zeolite/rhodium composites as a function of temperature and rhodium percentages.
Funding
This research did not receive any specific grant.
Data Availability Statement
There is no additional data.
Conflicts of Interest
The author declares no conflict of interest.
References
- Voelkel, A.; Strzemiecka, B.; Adamska, K.; Milczewska, K. Inverse gas chromatography as a source of physiochemical data. J. Chromatogr. A 2009, 1216, 1551. [Google Scholar] [CrossRef]
- Papadopoulou, S.K.; Panayiotou, C. Thermodynamic characterization of poly(1,1,1,3,3,3-hexafluoroisopropyl methacrylate) by inverse gas chromatography. J. Chromatogr. A 2012, 1229, 230. [Google Scholar] [CrossRef]
- Coimbra, P.; Coelho, M. S.N.; Gamelas, J. A.F. Surface characterization of polysaccharide scaffolds by inverse gas chromatography regarding application in tissue engineering. Surface and Interface Analysis 2019, 51 (11), 1070–1077. [Google Scholar] [CrossRef]
- Kołodziejek, J.; Voelkel, A.; Heberger, K. Characterization of hybrid materials by means of inverse gas chromatography and chemometrics. J. Pharm. Sci. 2013, 102, 1524. [Google Scholar] [CrossRef]
- Belgacem, M.N.; Czeremuszkin, G.; Sapieha, S.; Gandini, A. Surface by XPS characterization and inverse gas of cellulose fibres chromatography. Cellulose 1995, 2, 145–157. [Google Scholar] [CrossRef]
- Donnet, J.B.; Custodéro, E.; Wang, T.K.; Hennebert, G. Energy site distribution of carbon black surfaces by inverse gas chromatography at finite concentration conditions. Carbon 2002, 40, 163–167. [Google Scholar] [CrossRef]
- Balard, H.; Maafa, D.; Santini, A.; Donnet, J.B. Study by inverse gas chromatography of the surface properties of milled graphites. J. Chromatogr. A 2008, 1198–1199, 173–180. [Google Scholar] [CrossRef]
- Bogillo, V.I.; Shkilev, V.P.; Voelkel, A. Determination of surface free energy components for heterogeneous solids by means of inverse gas chromatography at finite concentrations. J. Mater. Chem. 1998, 8, 1953–1961. [Google Scholar] [CrossRef]
- Das, S.C.; Zhou, Q.; Morton, D.A.V.; Larson, I.; Stewart, P.J. Use of surface energy distributions by inverse gas chromatography to understand mechanofusion processing and functionality of lactose coated with magnesium stearate. Eur. J. Pharm. Sci. 2011, 43, 325–333. [Google Scholar] [CrossRef]
- Das, S.C.; Stewart, P.J. Characterising surface energy of pharmaceutical powders by inverse gas chromatography at finite dilution. J. Pharm. Pharmacol. 2012, 64, 1337–1348. [Google Scholar] [CrossRef]
- Bai, W.; Pakdel, E.; Li, Q.; Wang, J.; Tang, W.; Tang, B.; Wang, X. Inverse gas chromatography (IGC) for studying the cellulosic materials surface characteristics: a mini review. Cellulose 2023, 30, 3379–3396. [Google Scholar] [CrossRef]
- Dong, S.; Brendlé, M.; Donnet, J.B. Study of solid surface polarity by inverse gas chromatography at infinite dilution. Chromatographia 1989, 28, 469–472. [Google Scholar] [CrossRef]
- Gamble, J.F.; Leane, M.; Olusanmi, D.; Tobyn, M.; Supuk, E.; Khoo, J.; Naderi, M. Surface energy analysis as a tool to probe the surface energy characteristics of micronized materials—A comparison with inverse gas chromatography. Int. J. Pharm. 2012, 422, 238–244. [Google Scholar] [CrossRef]
- Newell, H.E.; Buckton, G.; Butler, D.A.; Thielmann, F.; Williams, D.R. The use of inverse gas chromatography to measure the surface energy of crystalline, amorphous, and recently milled lactose. Pharm. Res. 2001, 18, 662–666. [Google Scholar] [CrossRef]
- Newell, H.E.; Buckton, G. Inverse gas chromatography: Investigating whether the technique preferentially probes high energy sites for mixtures of crystalline and amorphous lactose. Pharm. Res. 2004, 21, 1440–1444. [Google Scholar] [CrossRef]
- Kołodziejek, J.; Głowka, E.; Hyla, K.; Voelkel, A.; Lulek, J.; Milczewska, K. Relationship between surface properties determined by inverse gas chromatography and ibuprofen release from hybrid materials based on fumed silica. Int. J. Pharm. 2013, 441, 441–448. [Google Scholar] [CrossRef]
- Calvet, R.; Del Confetto, S.; Balard, H.; Brendlé, E.; Donnet, J.B. Study of the interaction polybutadiene/fillers using inverse gas chromatography. J. Chromatogr. A 2012, 1253, 164–170. [Google Scholar] [CrossRef]
- Hamieh, T. Temperature Dependence of the Polar and Lewis Acid–Base Properties of Poly Methyl Methacrylate Adsorbed on Silica via Inverse Gas Chromatography. Molecules 2024, 29, 1688. [Google Scholar] [CrossRef]
- Basivi, P.K.; Hamieh, T.; Kakani, V.; Pasupuleti, V.R.; Sasikala, G.; Heo, S.M.; Pasupuleti, K.S.; Kim, M.-D.; Munagapati, V.S.; Kumar, N.S.; Wen, J.-H.; Kim, C.W. Exploring advanced materials: Harnessing the synergy of inverse gas chromatography and artificial vision intelligence, TrAC Trends in Analytical Chemistry, 2024, 173, 117655, . [CrossRef]
- Sawyer, D.T.; Brookman, D.J. Thermodynamically based gas chromatographic retention index for organic molecules using salt-modified aluminas and porous silica beads. Anal. Chem. 1968, 40, 1847–1850. [Google Scholar] [CrossRef]
- Saint-Flour, C.; Papirer, E. Gas-solid chromatography. A method of measuring surface free energy characteristics of short carbon fibers. 1. Through adsorption isotherms. Ind. Eng. Chem. Prod. Res. Dev. 1982, 21, 337–341. [Google Scholar] [CrossRef]
- Saint-Flour, C.; Papirer, E. Gas-solid chromatography: Method of measuring surface free energy characteristics of short fibers. 2. Through retention volumes measured near zero surface coverage. Ind. Eng. Chem. Prod. Res. Dev. 1982, 21, 666–669. [Google Scholar] [CrossRef]
- Donnet, J.B.; Park, S.J.; Balard, H. Evaluation of specific interactions of solid surfaces by inverse gas chromatography. Chromatographia 1991, 31, 434–440. [Google Scholar] [CrossRef]
- Brendlé, E.; Papirer, E. A new topological index for molecular probes used in inverse gas chromatography for the surface nanorugosity evaluation, 2. Application for the Evaluation of the Solid Surface Specific Interaction Potential. J. Colloid Interface Sci. 1997, 194, 217–224. [Google Scholar] [CrossRef]
- Brendlé, E.; Papirer, E. A new topological index for molecular probes used in inverse gas chromatography for the surface nanorugosity evaluation, 1. Method of Evaluation. J. Colloid Interface Sci. 1997, 194, 207–216. [Google Scholar] [CrossRef]
- Hamieh, T.; Schultz, J. New approach to characterise physicochemical properties of solid substrates by inverse gas chromatography at infinite dilution. I. II. And III. J. Chromatogr. A 2002, 969, 17–47. [Google Scholar] [CrossRef]
- Hamieh, T. The Effect of Temperature on the Surface Energetic Properties of Carbon Fibers Using Inverse Gas Chromatography. Crystals 2024, 14, 28. [Google Scholar] [CrossRef]
- Hamieh, T. New Progress on London Dispersive Energy, Polar Surface Interactions, and Lewis’s Acid–Base Properties of Solid Surfaces. Molecules 2024, 29, 949. [Google Scholar] [CrossRef]
- Hamieh, T. London Dispersive and Lewis Acid-Base Surface Energy of 2D Single-Crystalline and Polycrystalline Covalent Organic Frameworks. Crystals 2024, 14, 148. [Google Scholar] [CrossRef]
- Hamieh, T. Inverse Gas Chromatography to Characterize the Surface Properties of Solid Materials. Chem. Mater. 2024, 36, 5–2231. [Google Scholar] [CrossRef]
- Hamieh, T. Some Irregularities in the Evaluation of Surface Parameters of Solid Materials by Inverse Gas Chromatography. Langmuir 2023, 39, 17059–17070. [Google Scholar] [CrossRef]
- Hamieh, T.; Ahmad, A.A.; Roques-Carmes, T.; Toufaily, J. New approach to determine the surface and interface thermodynamic properties of H-β-zeolite/rhodium catalysts by inverse gas chromatography at infinite dilution. Sci. Rep. 2020, 10, 20894. [Google Scholar] [CrossRef] [PubMed]
- G.M. Dorris, D.G. Gray, Adsorption of n-alkanes at zero surface coverage on cellulose paper and wood fibers, J. Colloid Interface Sci., 77 (1980) 353–362. [CrossRef]
- F.M. Fowkes, in: Surface and interfacial aspects of biomedical polymers, Vol. I, pp. 337-372, Ed: J. D. Andrade, Plenum Press, New York (1985).
- Hamieh, T. Study of the temperature effect on the surface area of model organic molecules, the dispersive surface energy and the surface properties of solids by inverse gas chromatography. J. Chromatogr. A 2020, 1627, 461372. [Google Scholar] [CrossRef]
- Hamieh, T. New methodology to study the dispersive component of the surface energy and acid–base properties of silica particles by inverse gas chromatography at infinite dilution. J. Chromatogr. Sci. 2022, 60, 126–142. [Google Scholar] [CrossRef]
- Schultz, J.; Lavielle, L.; Martin, C. The role of the interface in carbon fibre-epoxy composites. J. Adhes. 1987, 23, 45–60. [Google Scholar] [CrossRef]
- Navio, J.A.; Colon, G.; Litter, M.I.; Bianco, G.N. J. Mol. Catal. A: Chem. 1996, 106 (3), 267–276.
- Zhang, X.; Qian, L.; Xu, P.; He, H.; Du, Q. Study of H-βzeolite supported Rh catalyst by inverse gas chromatography, Chemical Engineering Journal, 2008, 137, 579–586. [CrossRef]
- Gutmann, V. The Donor-Acceptor Approach to Molecular Interactions; Plenum: New York, NY, USA, 1978. [Google Scholar]
- Hamieh, T.; Rageul-Lescouet, M.; Nardin, M.; Haidara, H.; Schultz, J. Study of acid-base interactions between some metallic oxides and model organic molecules. Colloids and Surfaces A: Phys. and Eng. Aspects 1997, 125, 155–161. [Google Scholar] [CrossRef]
- Conder, J.R.; Young, C.L. Physical measurements by gas chromatography. Eds: Wiley J and Sons, New York, 1979.
Figure 1.
Curves of as a function of of n-alkanes (from n-pentane to n-nonane) adsorbed on zeolite material at different temperatures.
Figure 1.
Curves of as a function of of n-alkanes (from n-pentane to n-nonane) adsorbed on zeolite material at different temperatures.
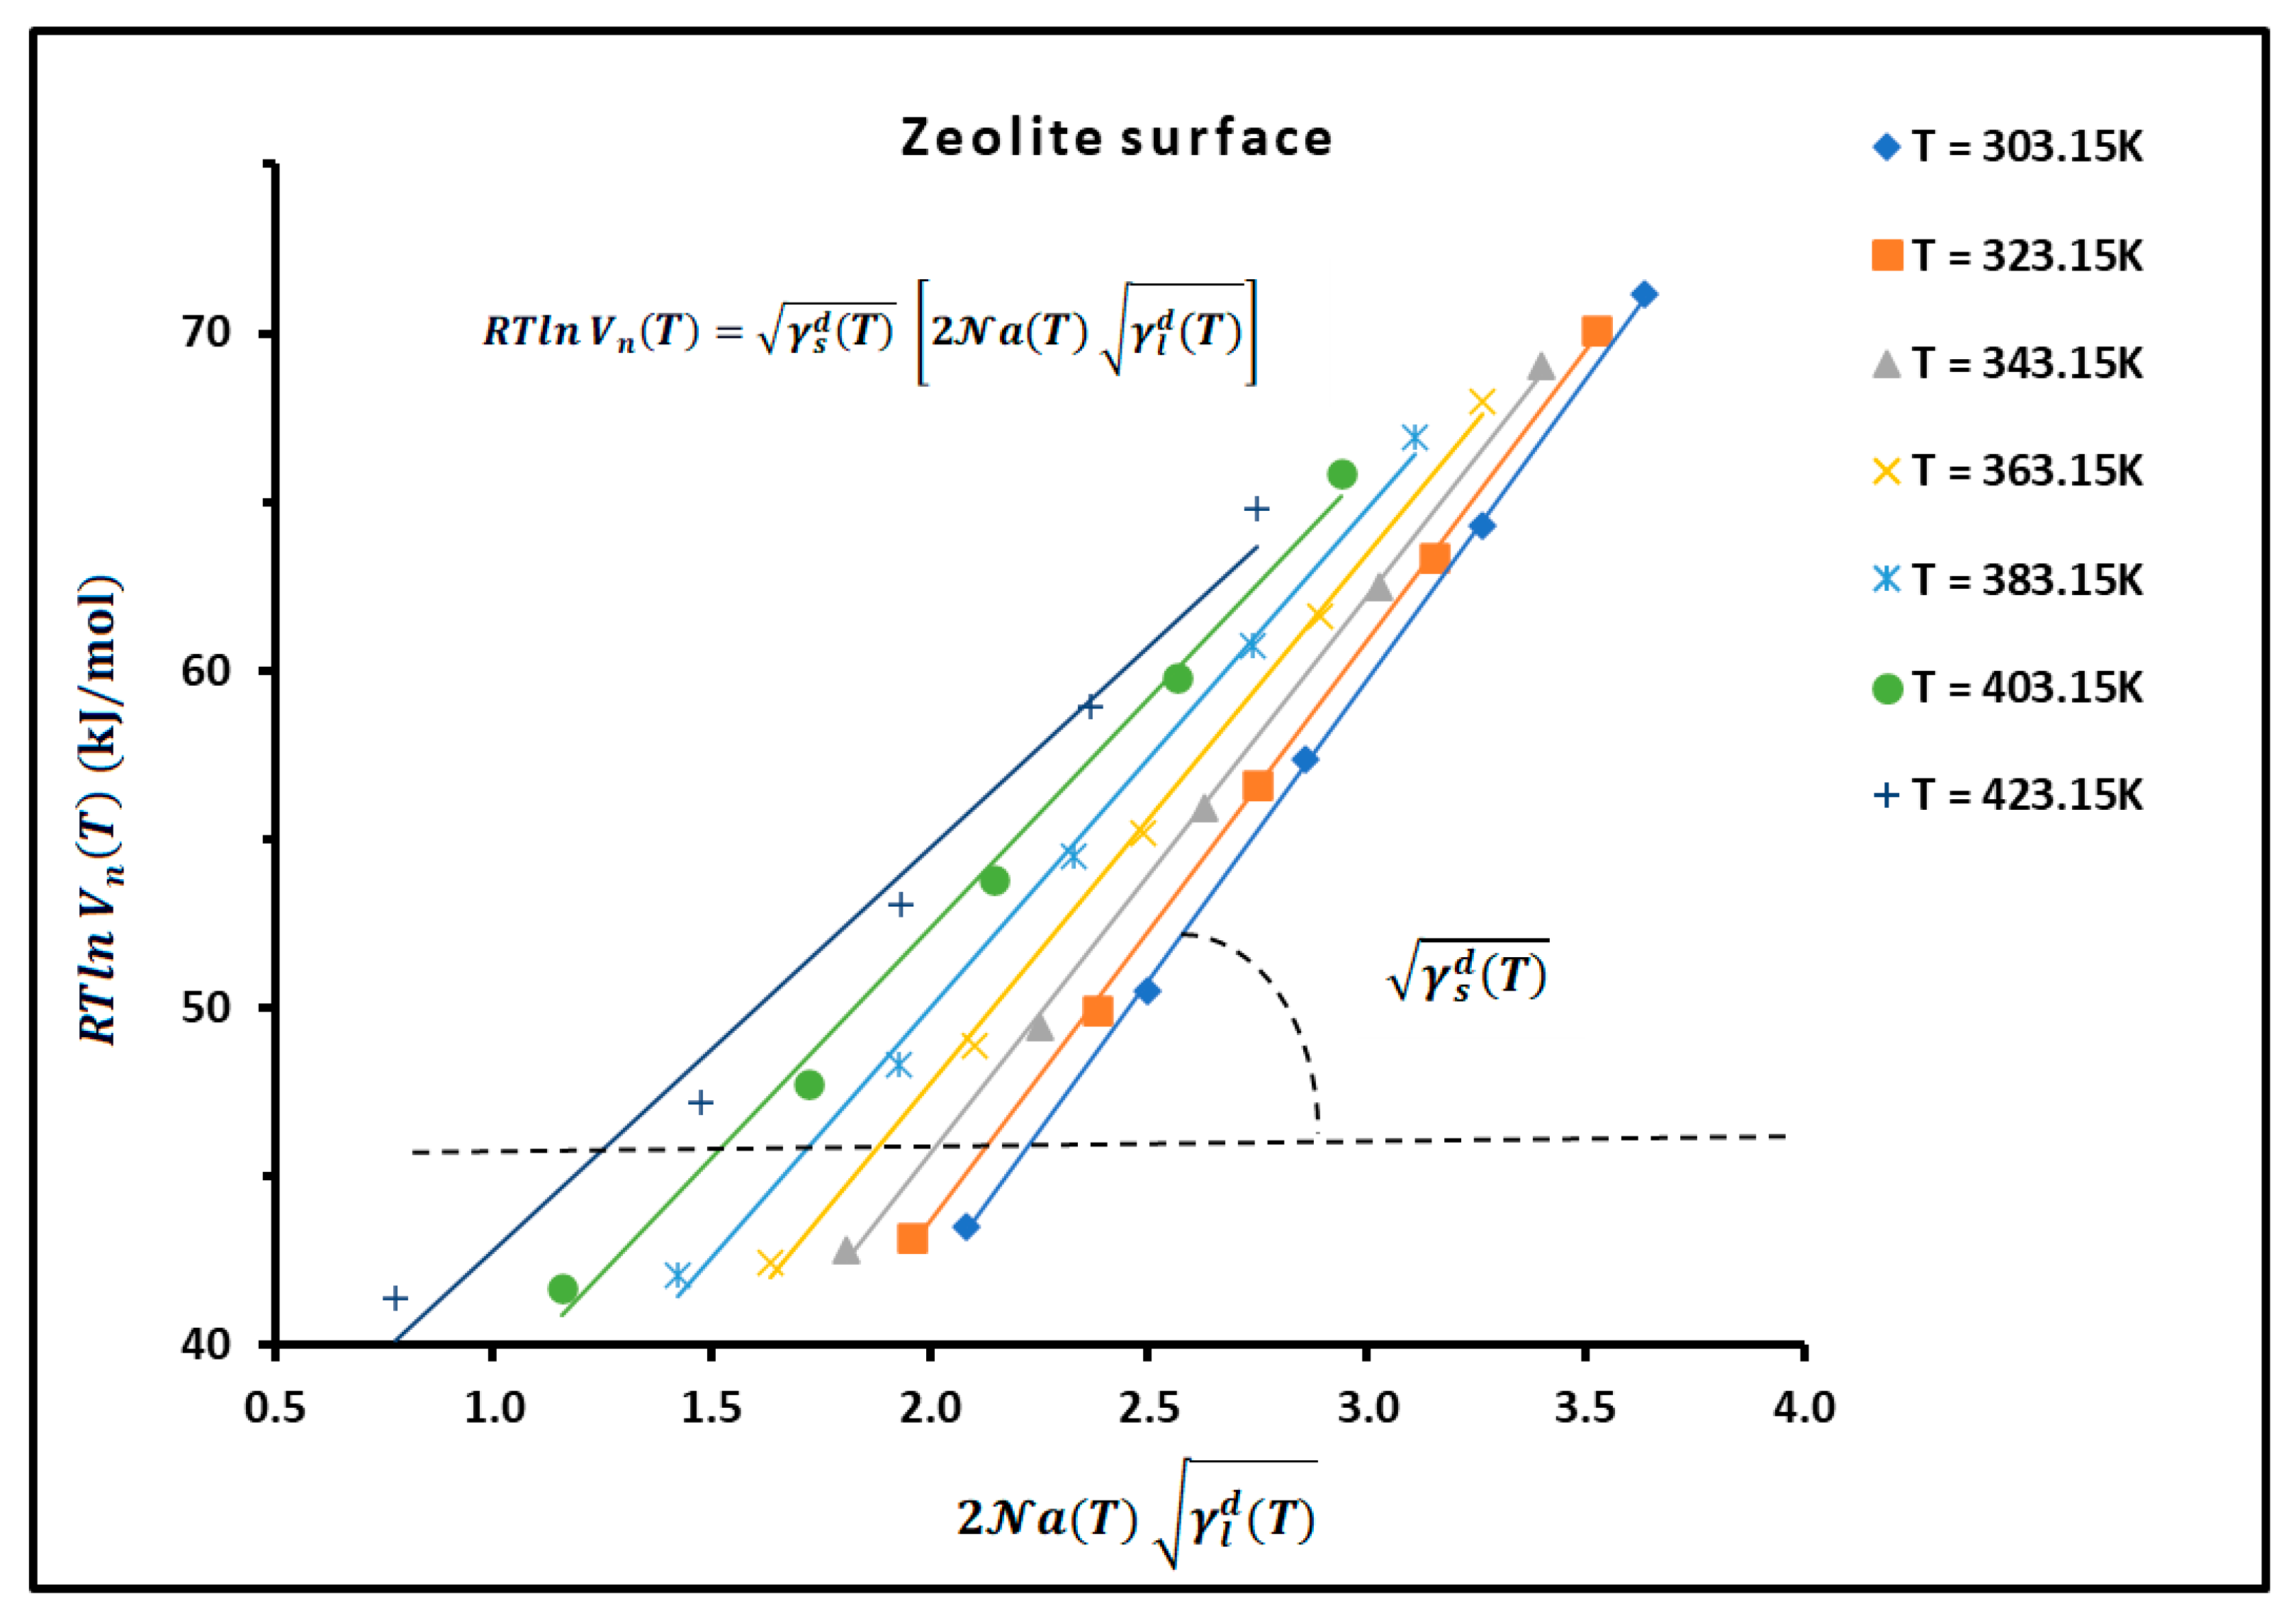
Figure 2.
Variations of of n-alkanes of H-β-zeolite as a function of temperature for different rhodium percentages: (a) 0% Rh, (b) 0. 5% Rh, (c) 1.0% Rh, and (d) 2.0 %Rh.
Figure 2.
Variations of of n-alkanes of H-β-zeolite as a function of temperature for different rhodium percentages: (a) 0% Rh, (b) 0. 5% Rh, (c) 1.0% Rh, and (d) 2.0 %Rh.
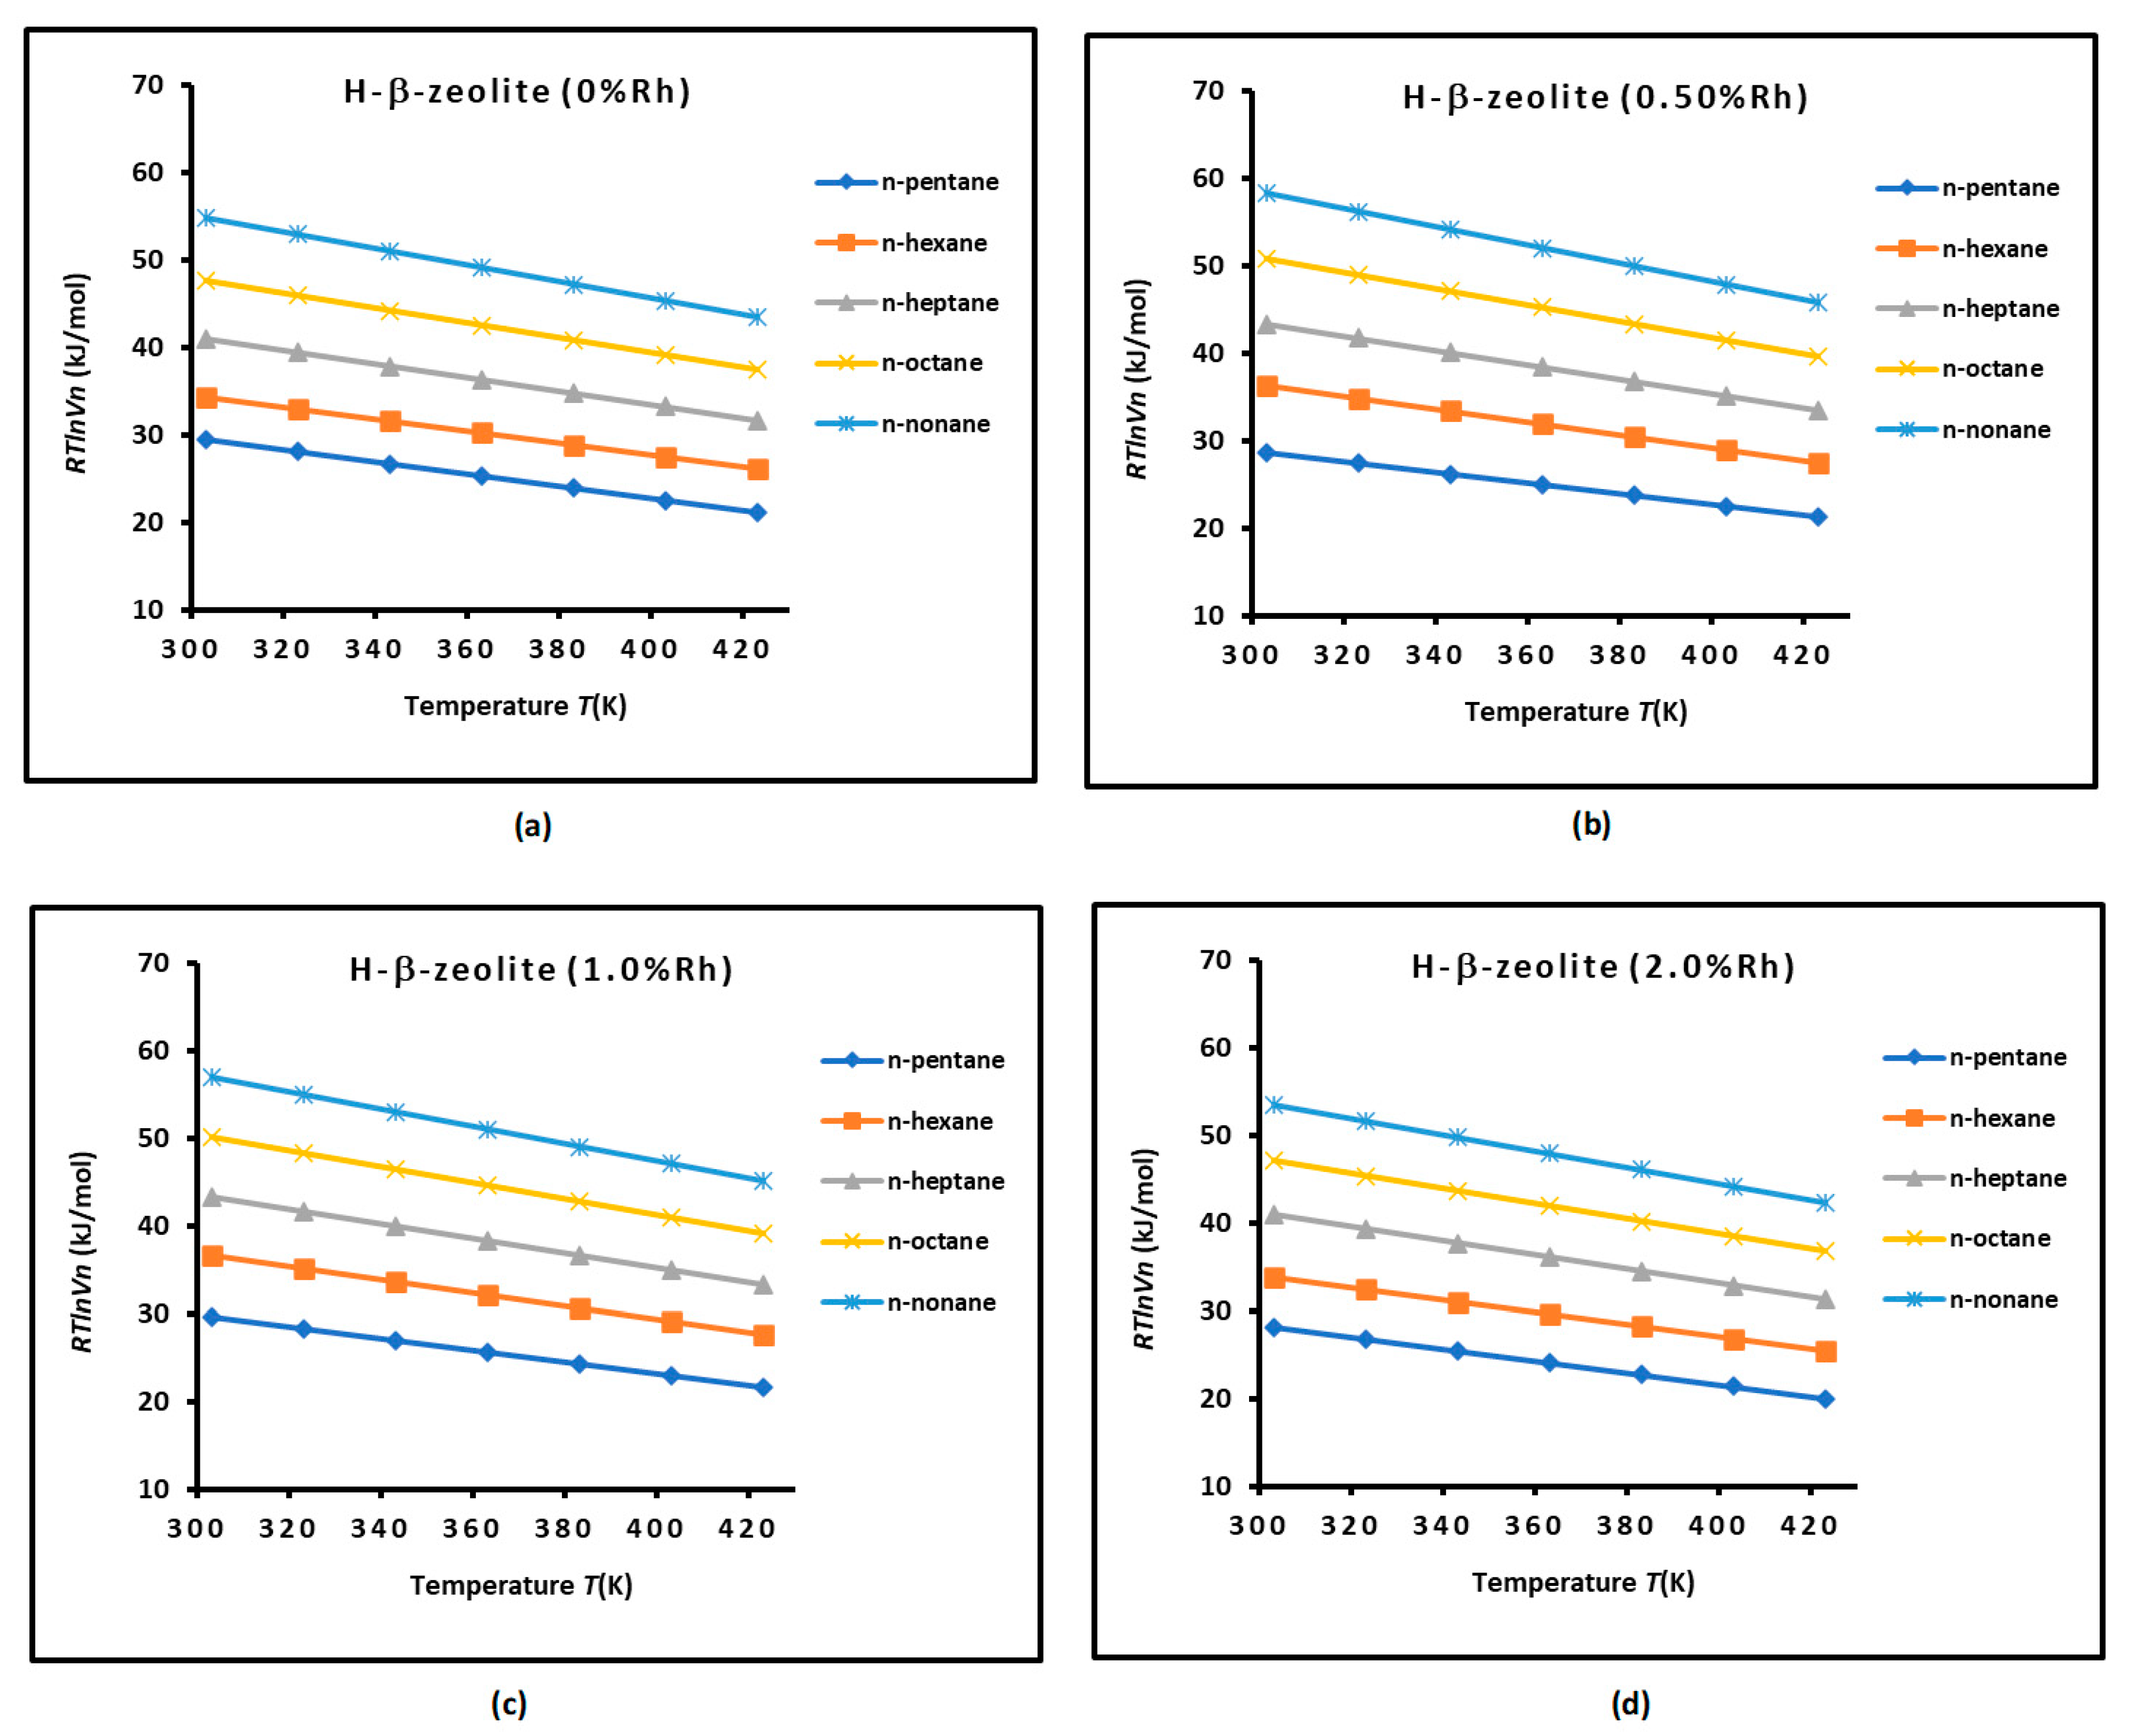
Figure 3.
Variations of of n-alkanes adsorbed on H-β-zeolite at 303.15K as a function of rhodium percentages (%Rh).
Figure 3.
Variations of of n-alkanes adsorbed on H-β-zeolite at 303.15K as a function of rhodium percentages (%Rh).
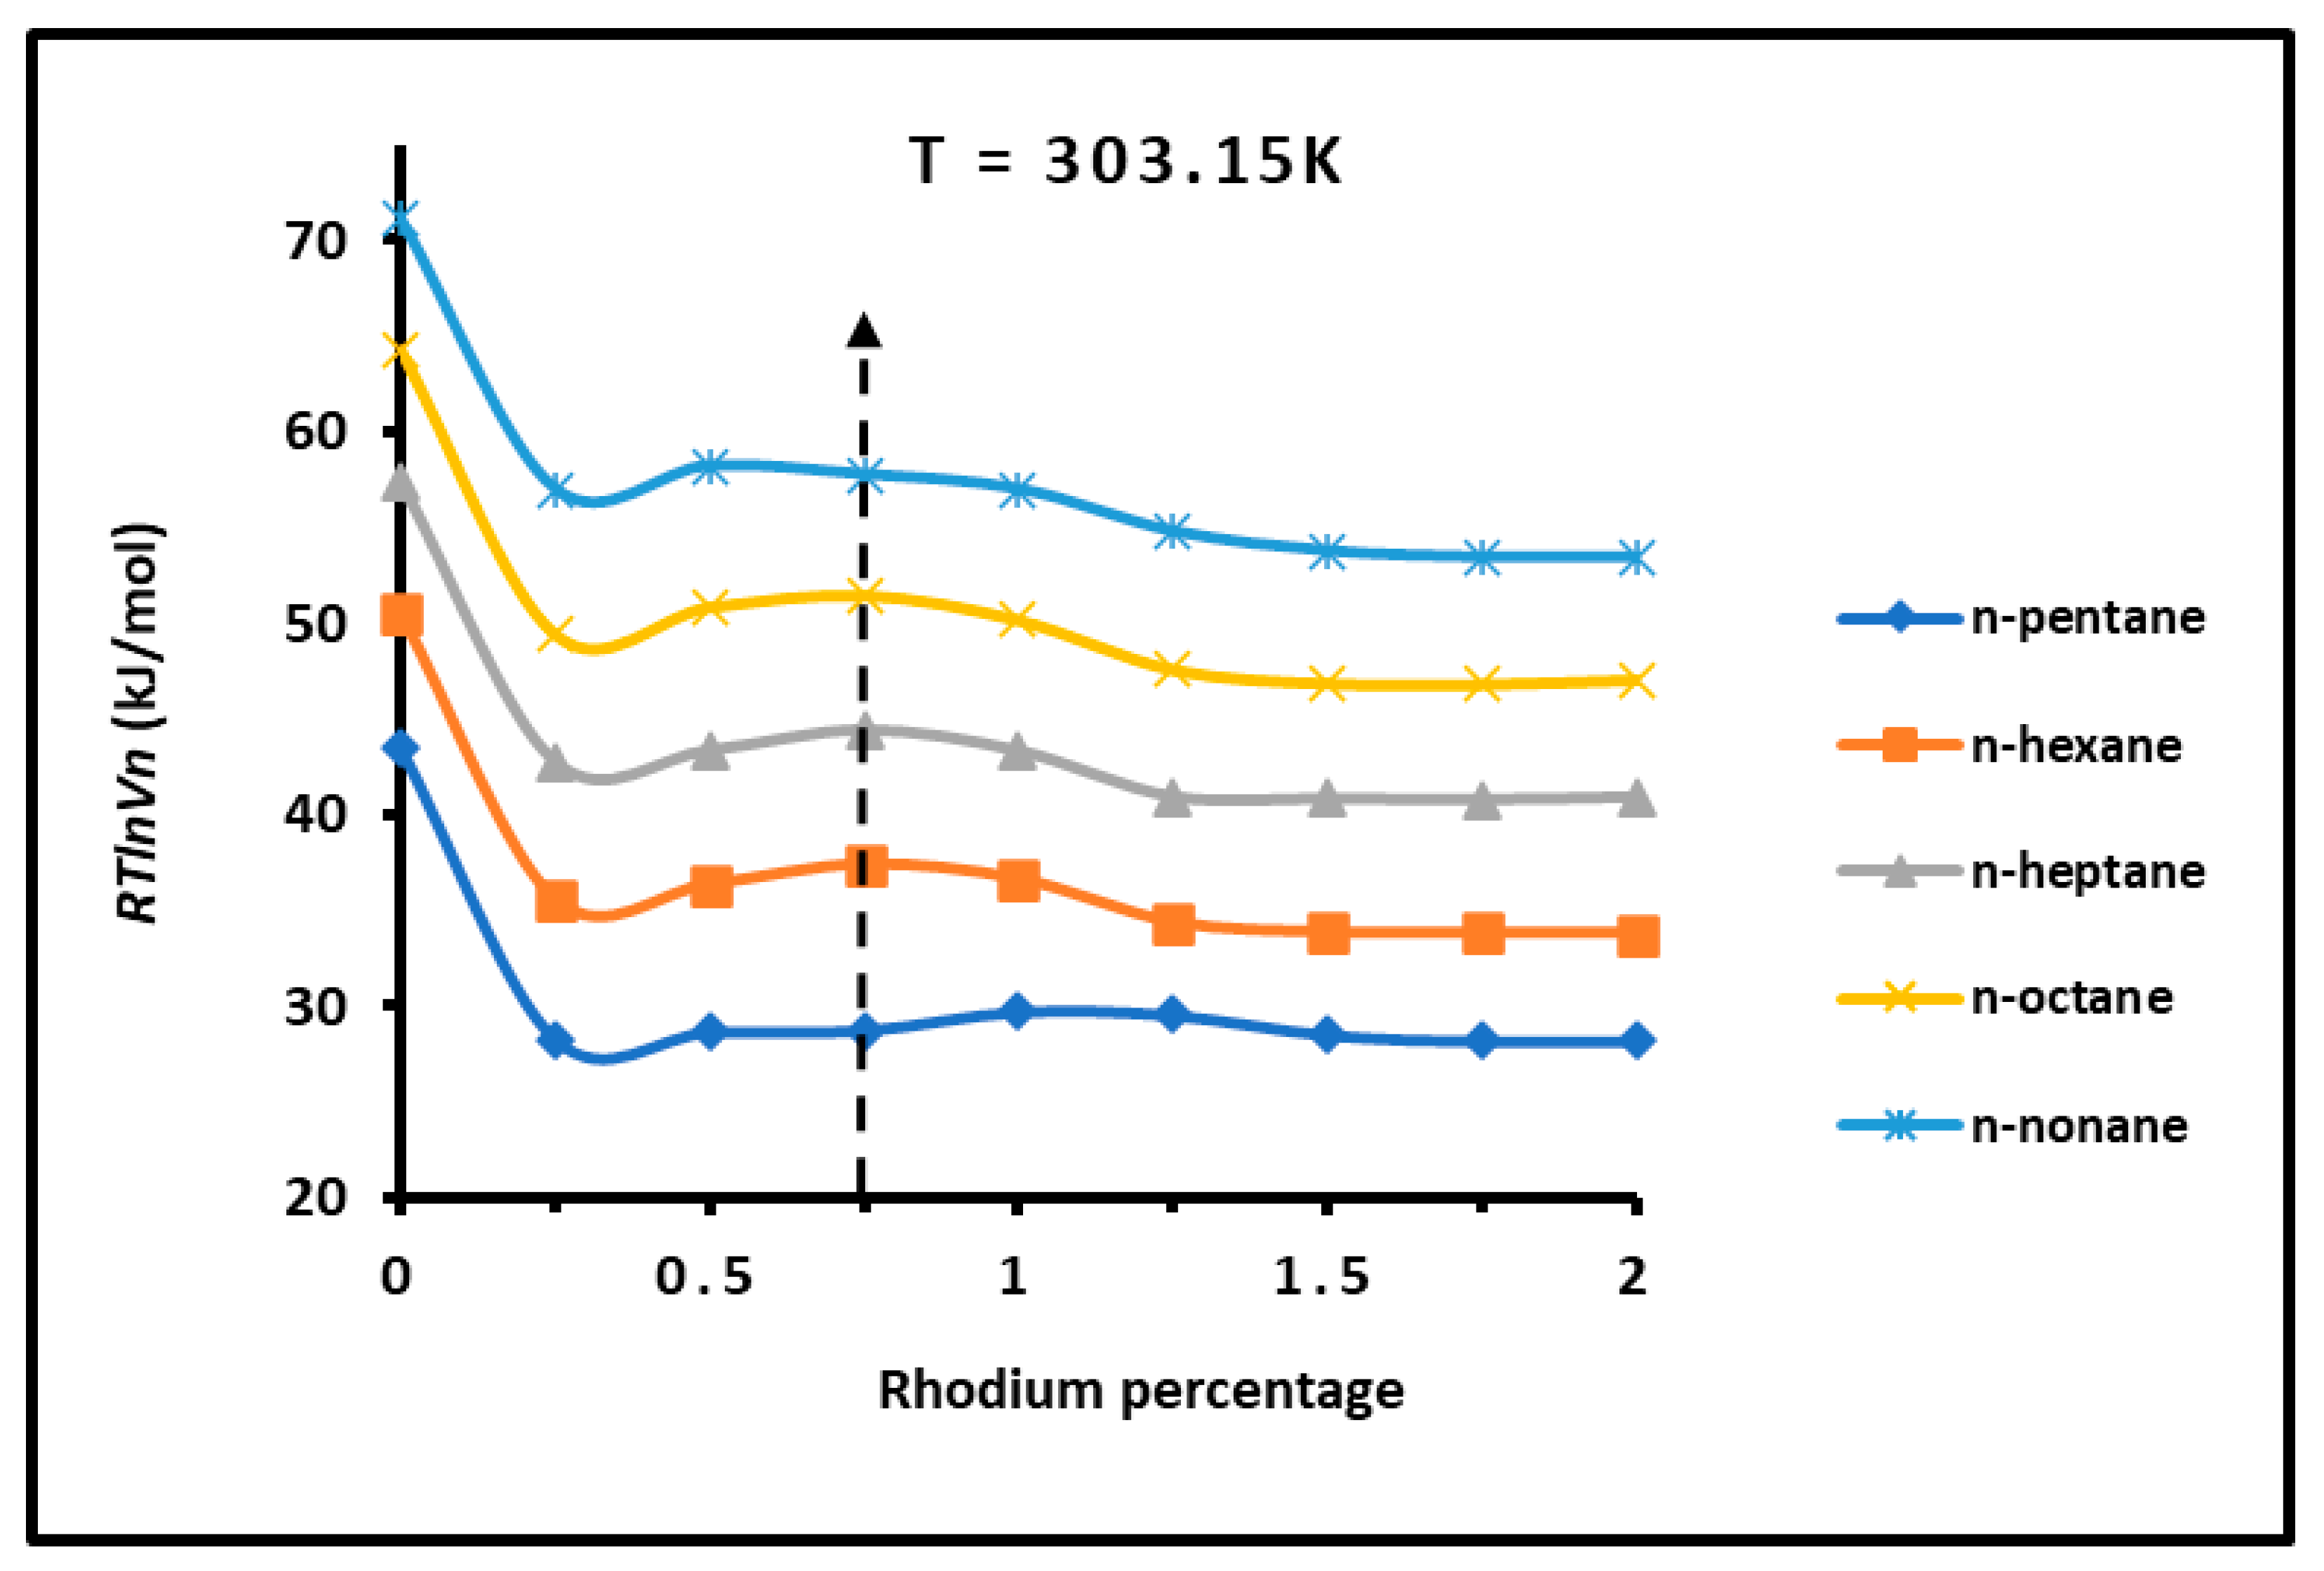
Figure 4.
Variations of the London dispersive surface energy of H-β-zeolite/rhodium catalysts as a function of temperature at different rhodium percentages.
Figure 4.
Variations of the London dispersive surface energy of H-β-zeolite/rhodium catalysts as a function of temperature at different rhodium percentages.
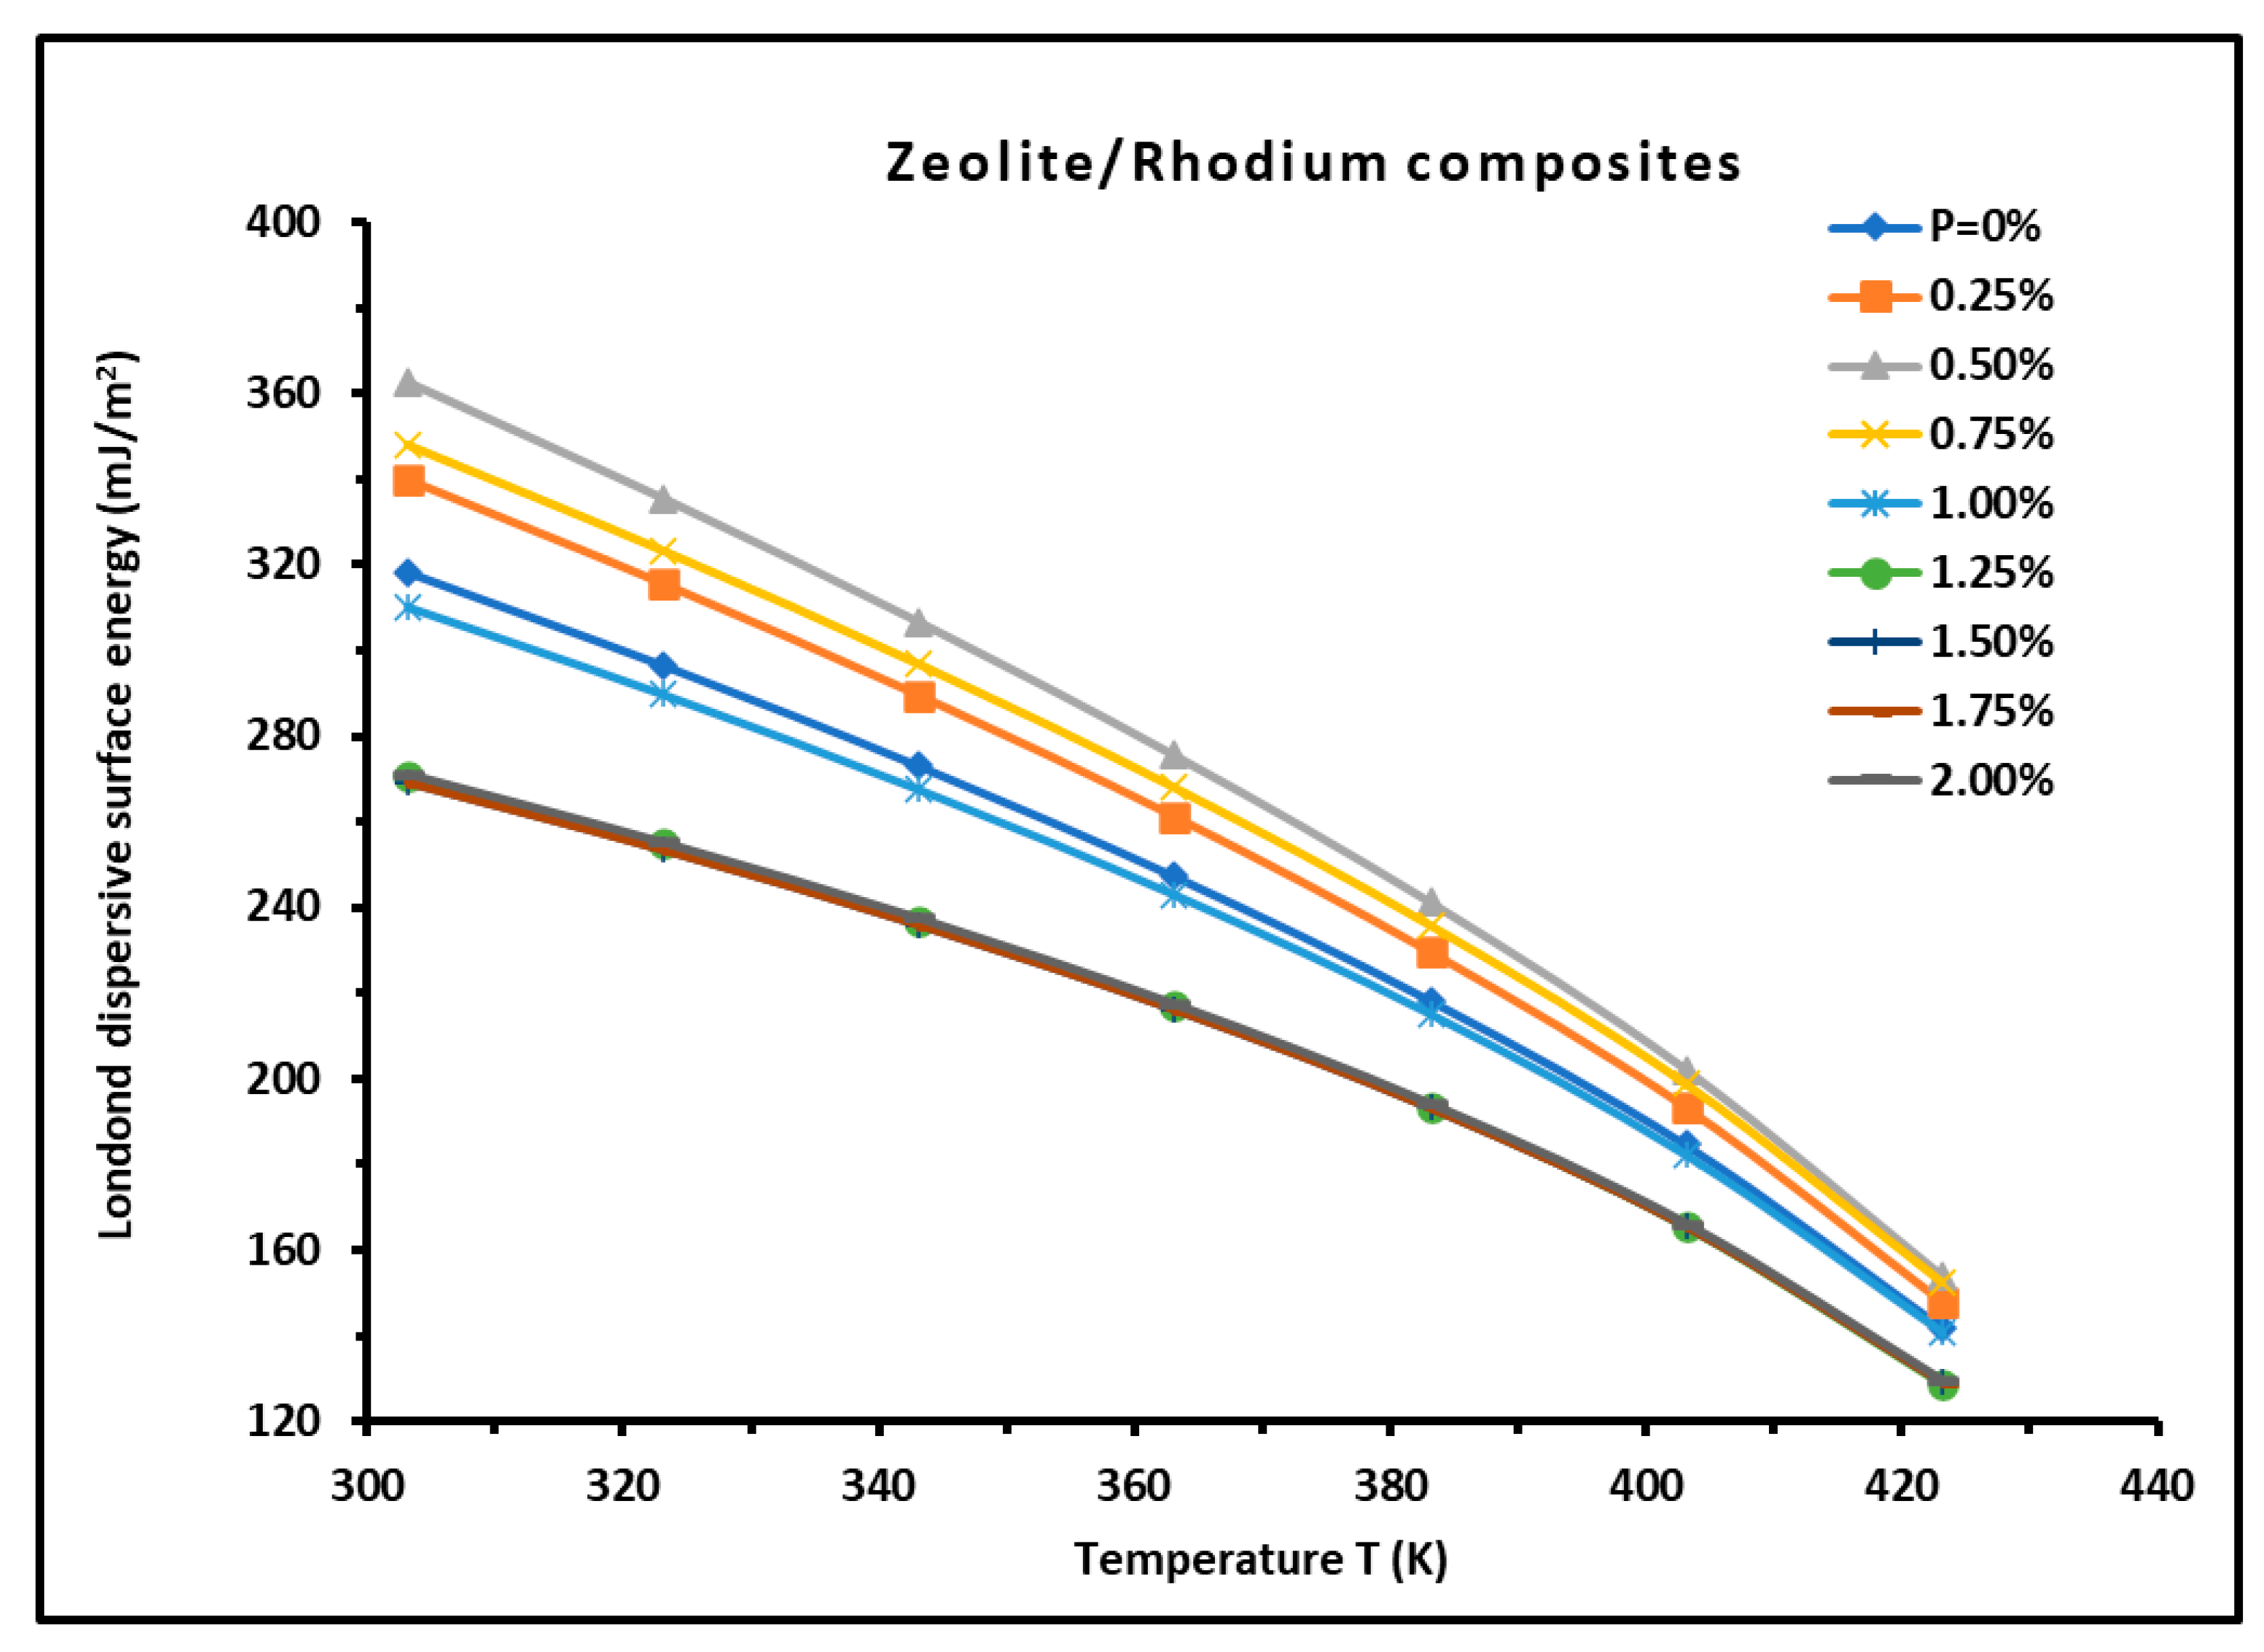
Figure 5.
Variations of the coefficients (a) and (b) in the general equation of of H-β-zeolite/rhodium catalysts as a function of the rhodium percentage.
Figure 5.
Variations of the coefficients (a) and (b) in the general equation of of H-β-zeolite/rhodium catalysts as a function of the rhodium percentage.
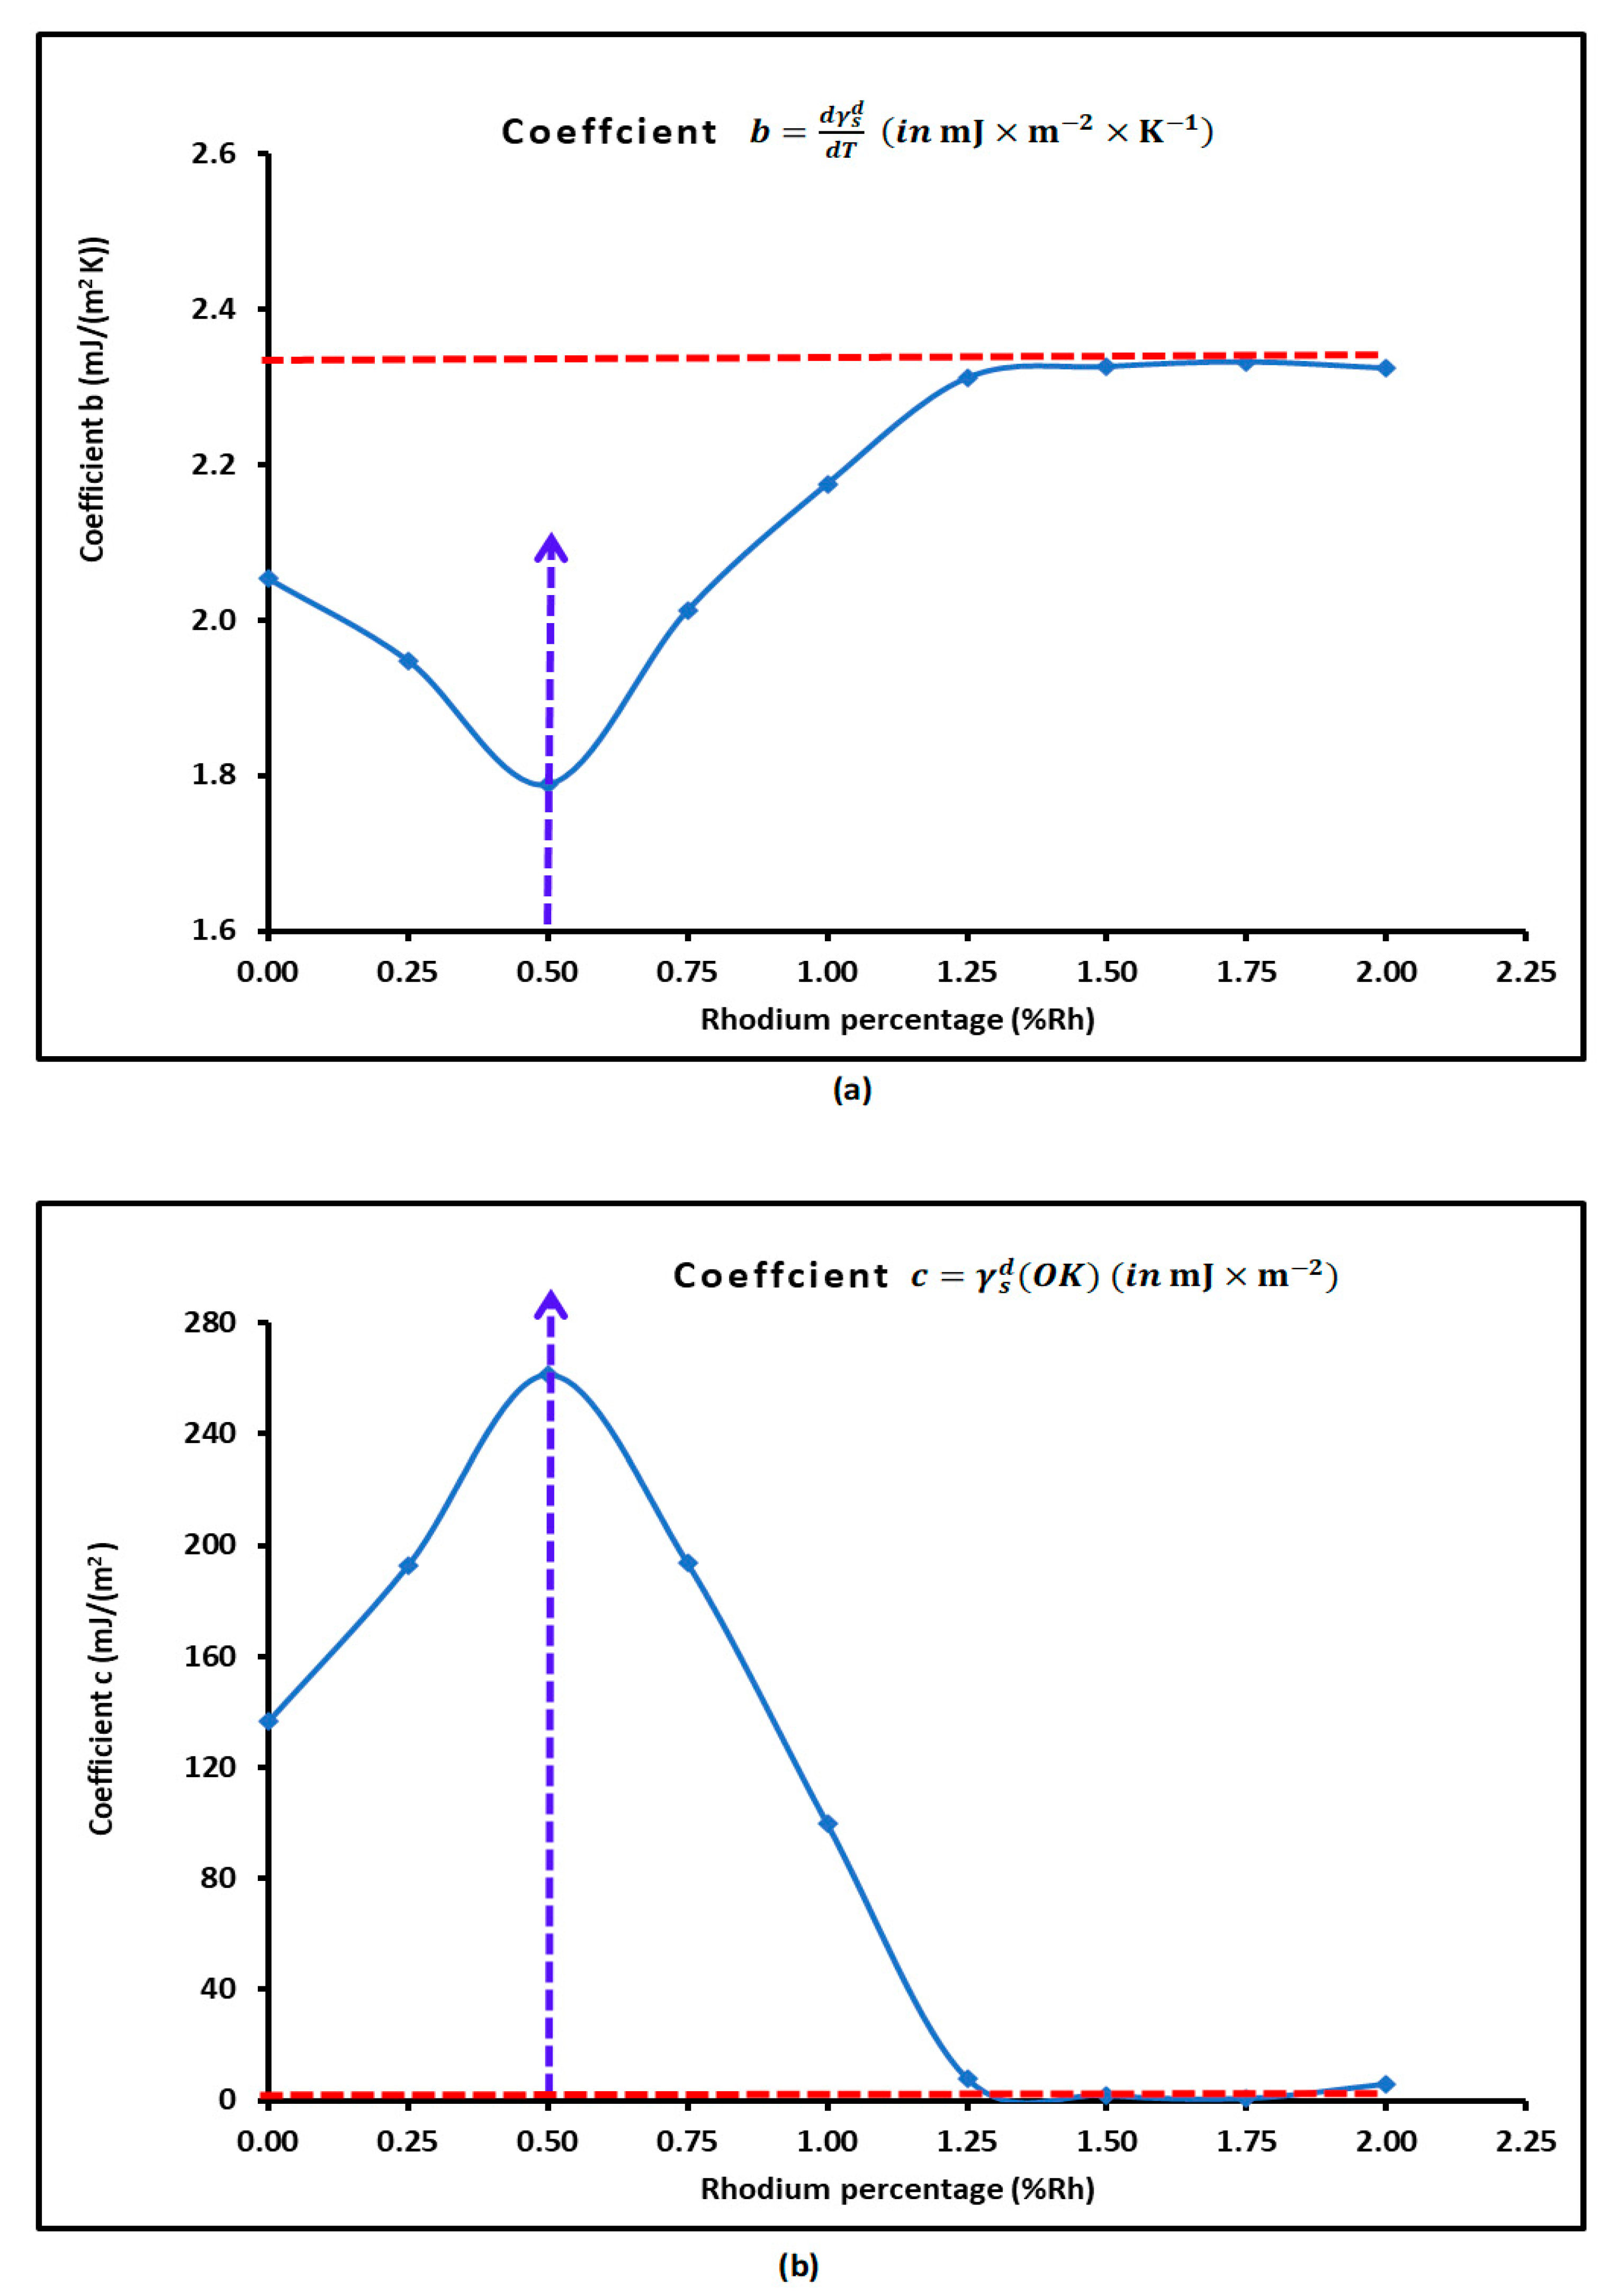
Figure 6.
Variations of of H-β-zeolite/rhodium catalysts as a function of the rhodium percentage for the various temperatures.
Figure 6.
Variations of of H-β-zeolite/rhodium catalysts as a function of the rhodium percentage for the various temperatures.
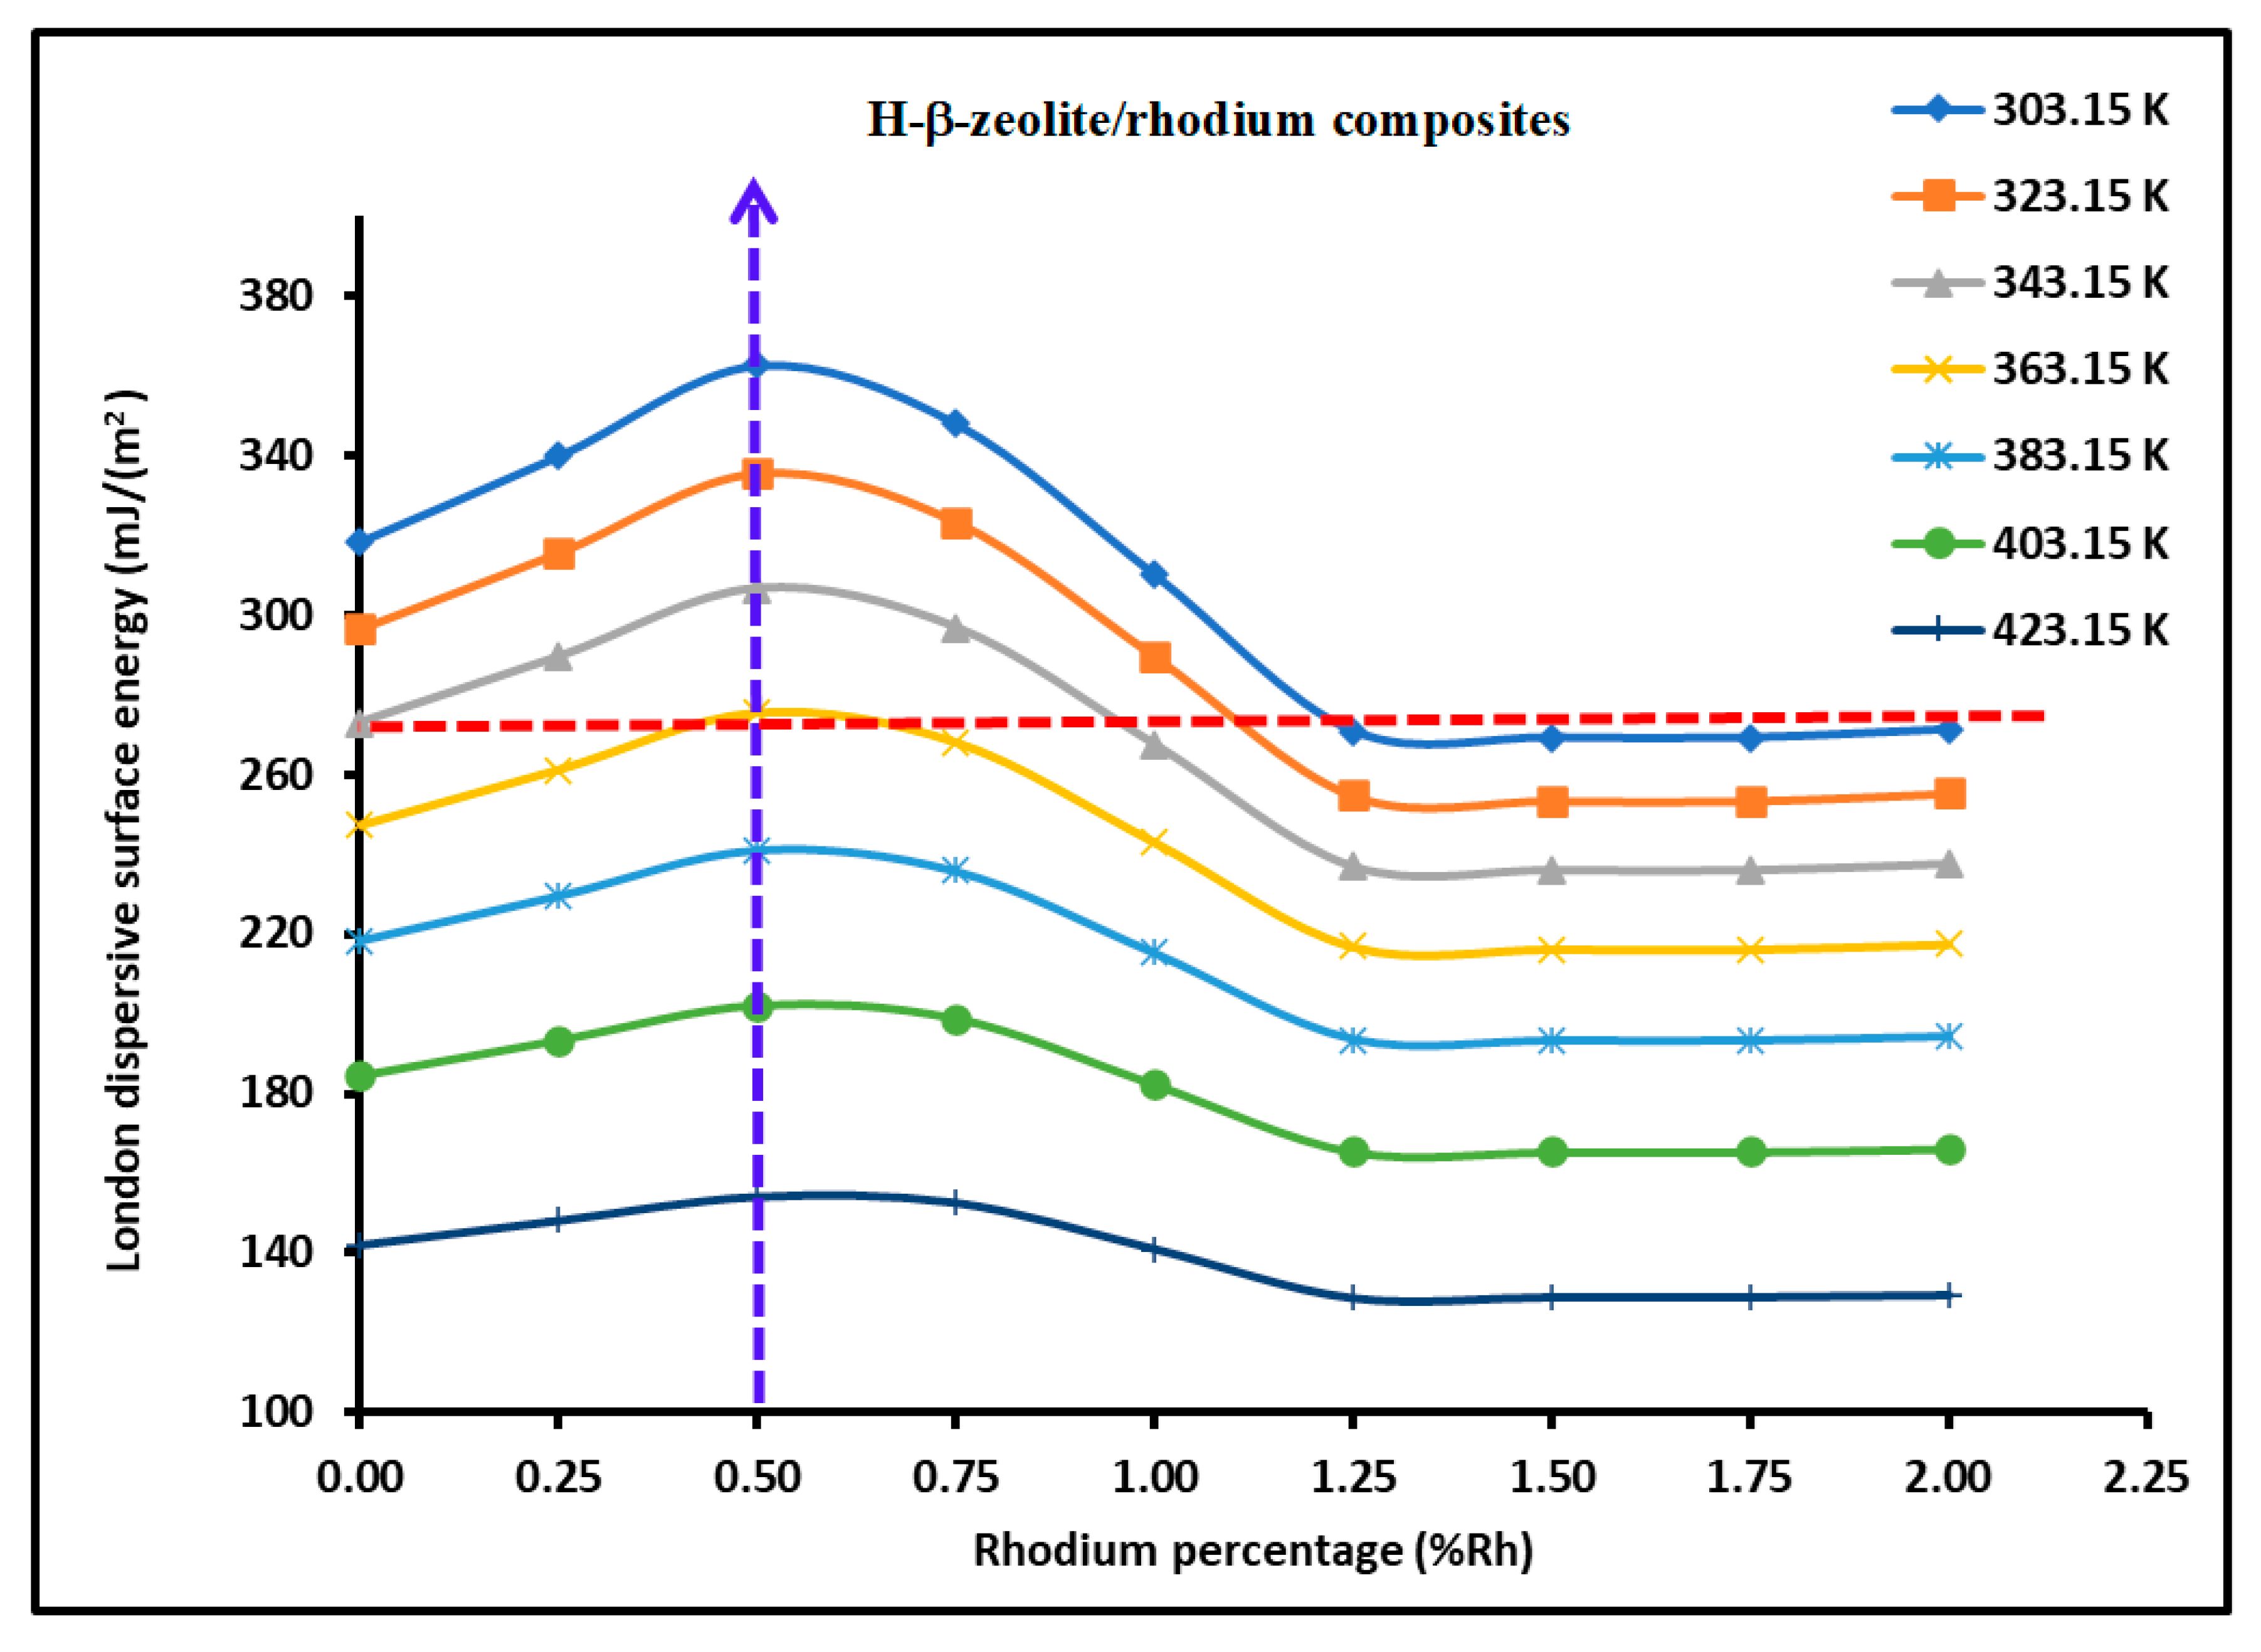
Figure 7.
Variations of of H-β-zeolite/rhodium catalysts as a function of the specific surface area for different temperatures.
Figure 7.
Variations of of H-β-zeolite/rhodium catalysts as a function of the specific surface area for different temperatures.
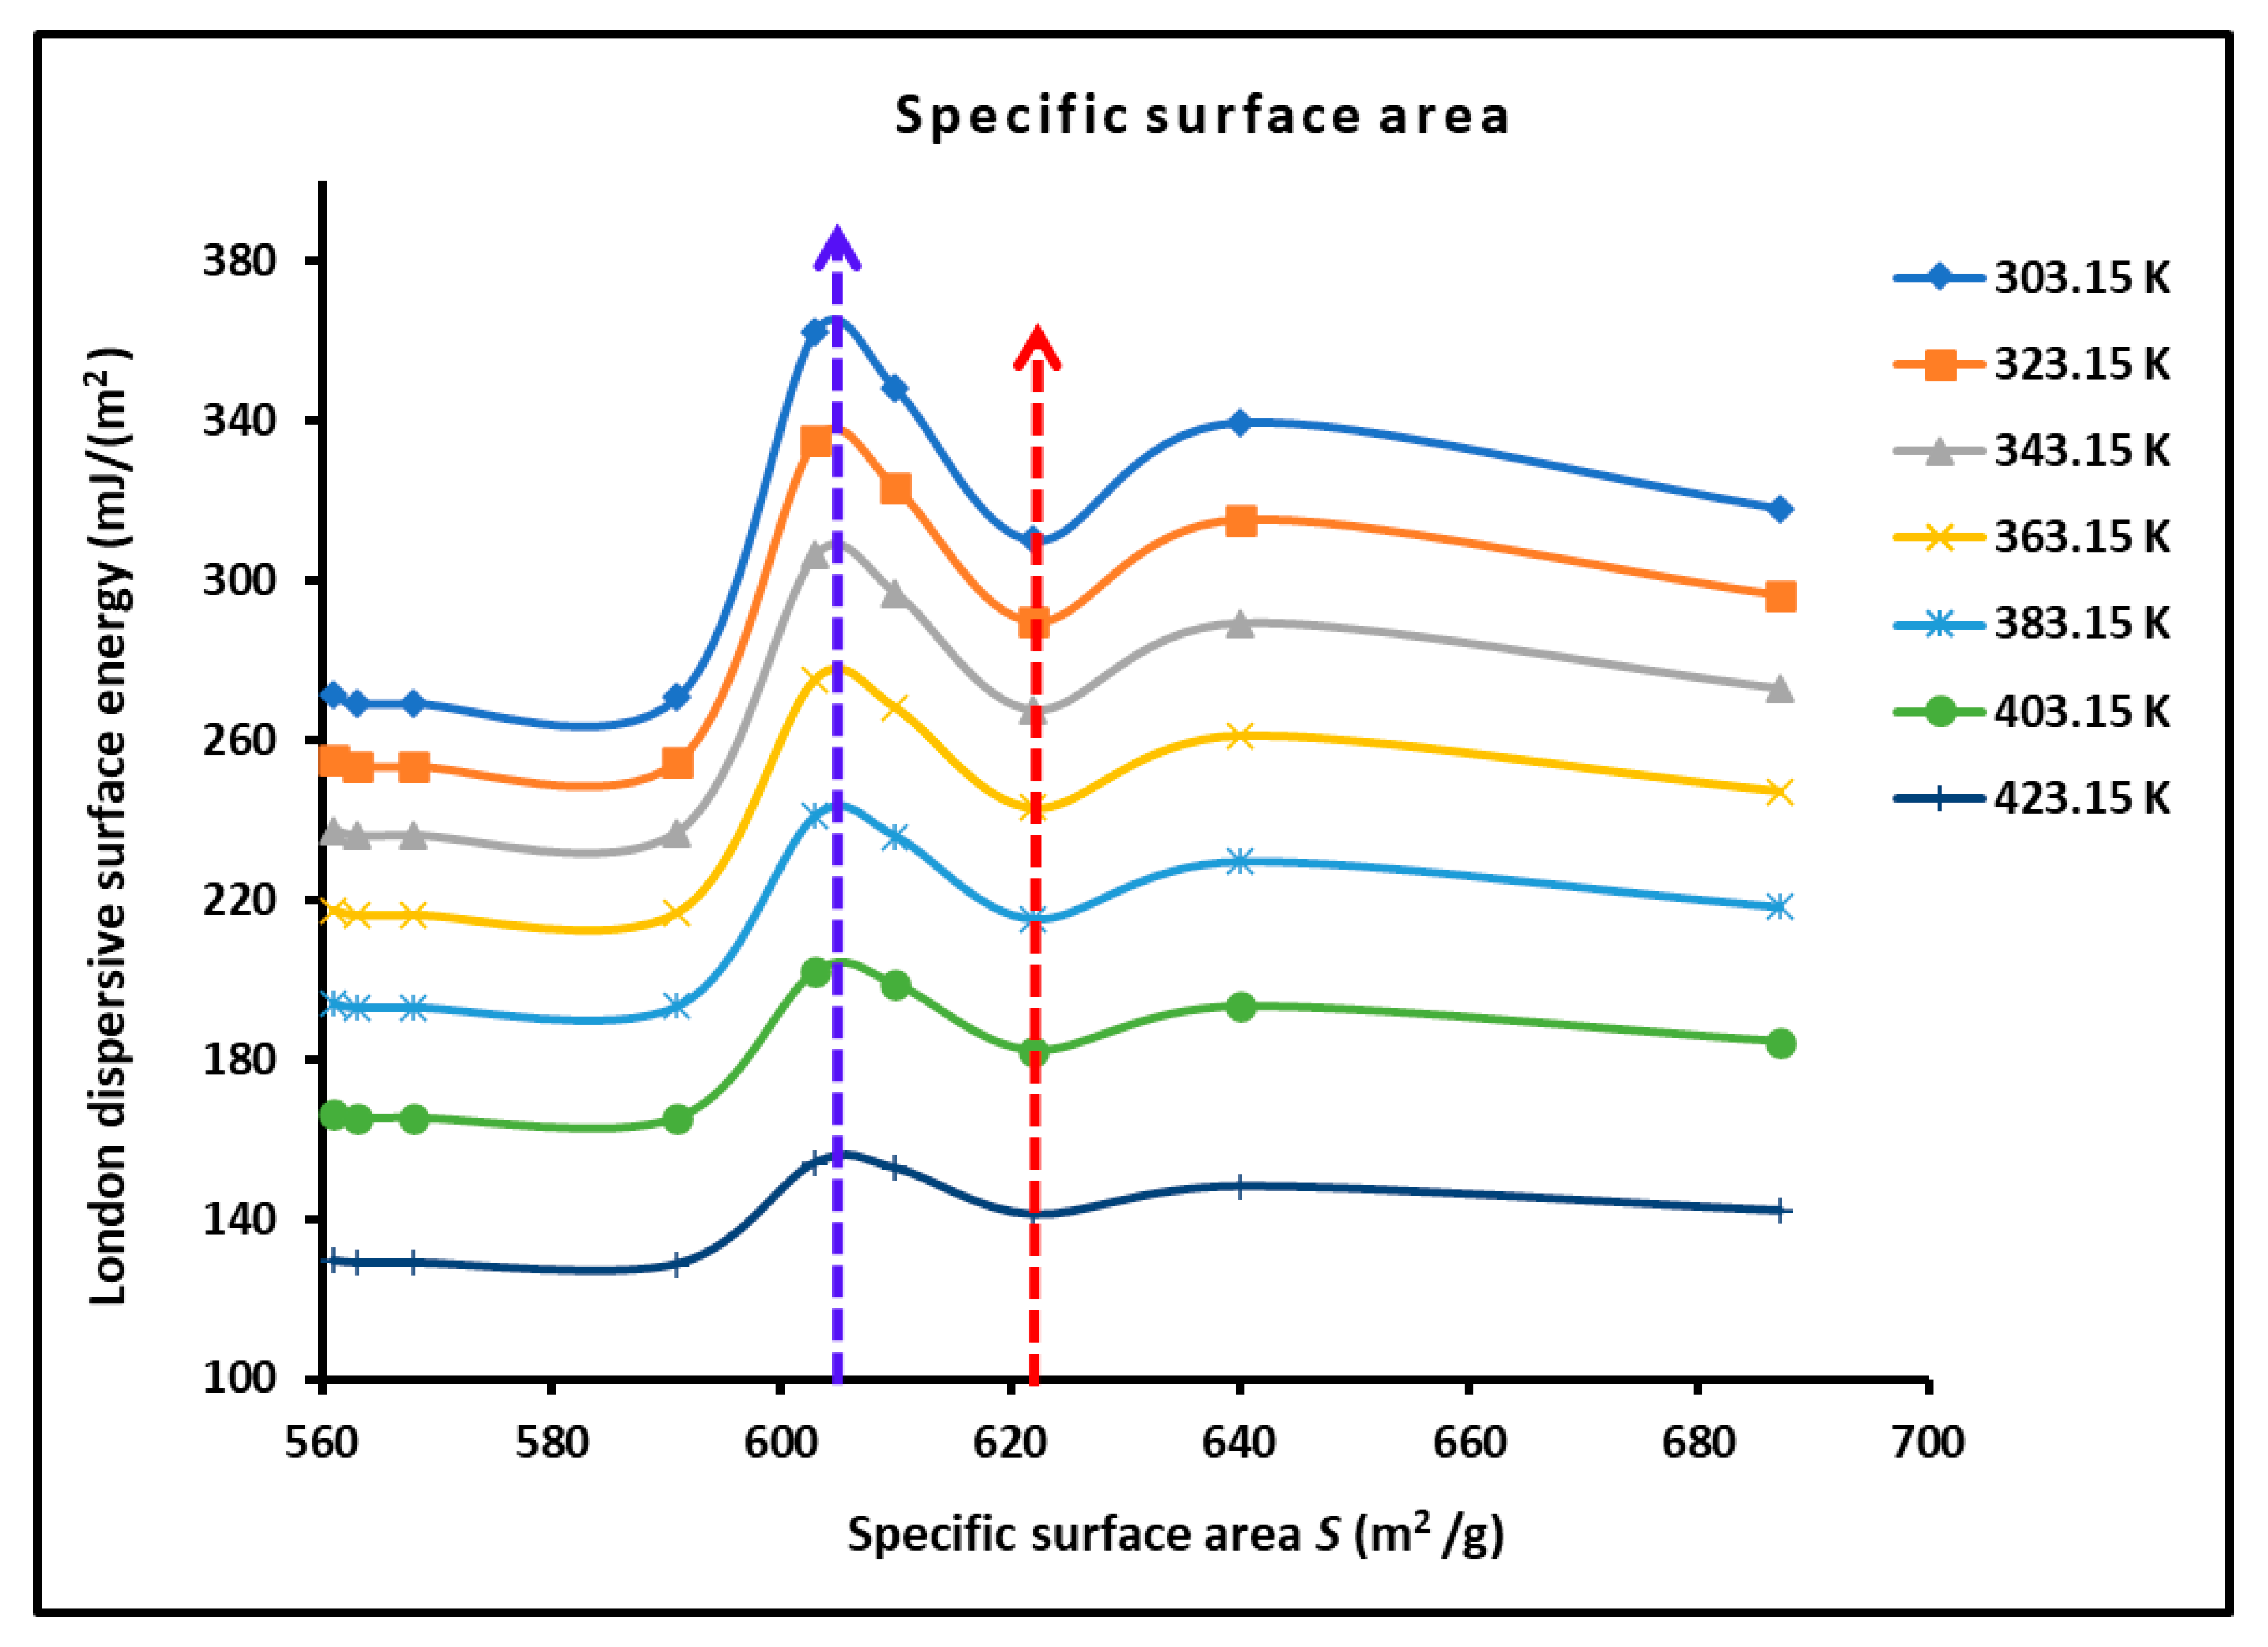
Figure 8.
Variations of of the different n-alkanes adsorbed on H-β-zeolite/rhodium catalysts plotted as a function of temperature at different rhodium percentages. (a): n-pentane, (b): n-hexane, (c): n-heptane, (d): n-octane, and (e): n-nonane.
Figure 8.
Variations of of the different n-alkanes adsorbed on H-β-zeolite/rhodium catalysts plotted as a function of temperature at different rhodium percentages. (a): n-pentane, (b): n-hexane, (c): n-heptane, (d): n-octane, and (e): n-nonane.
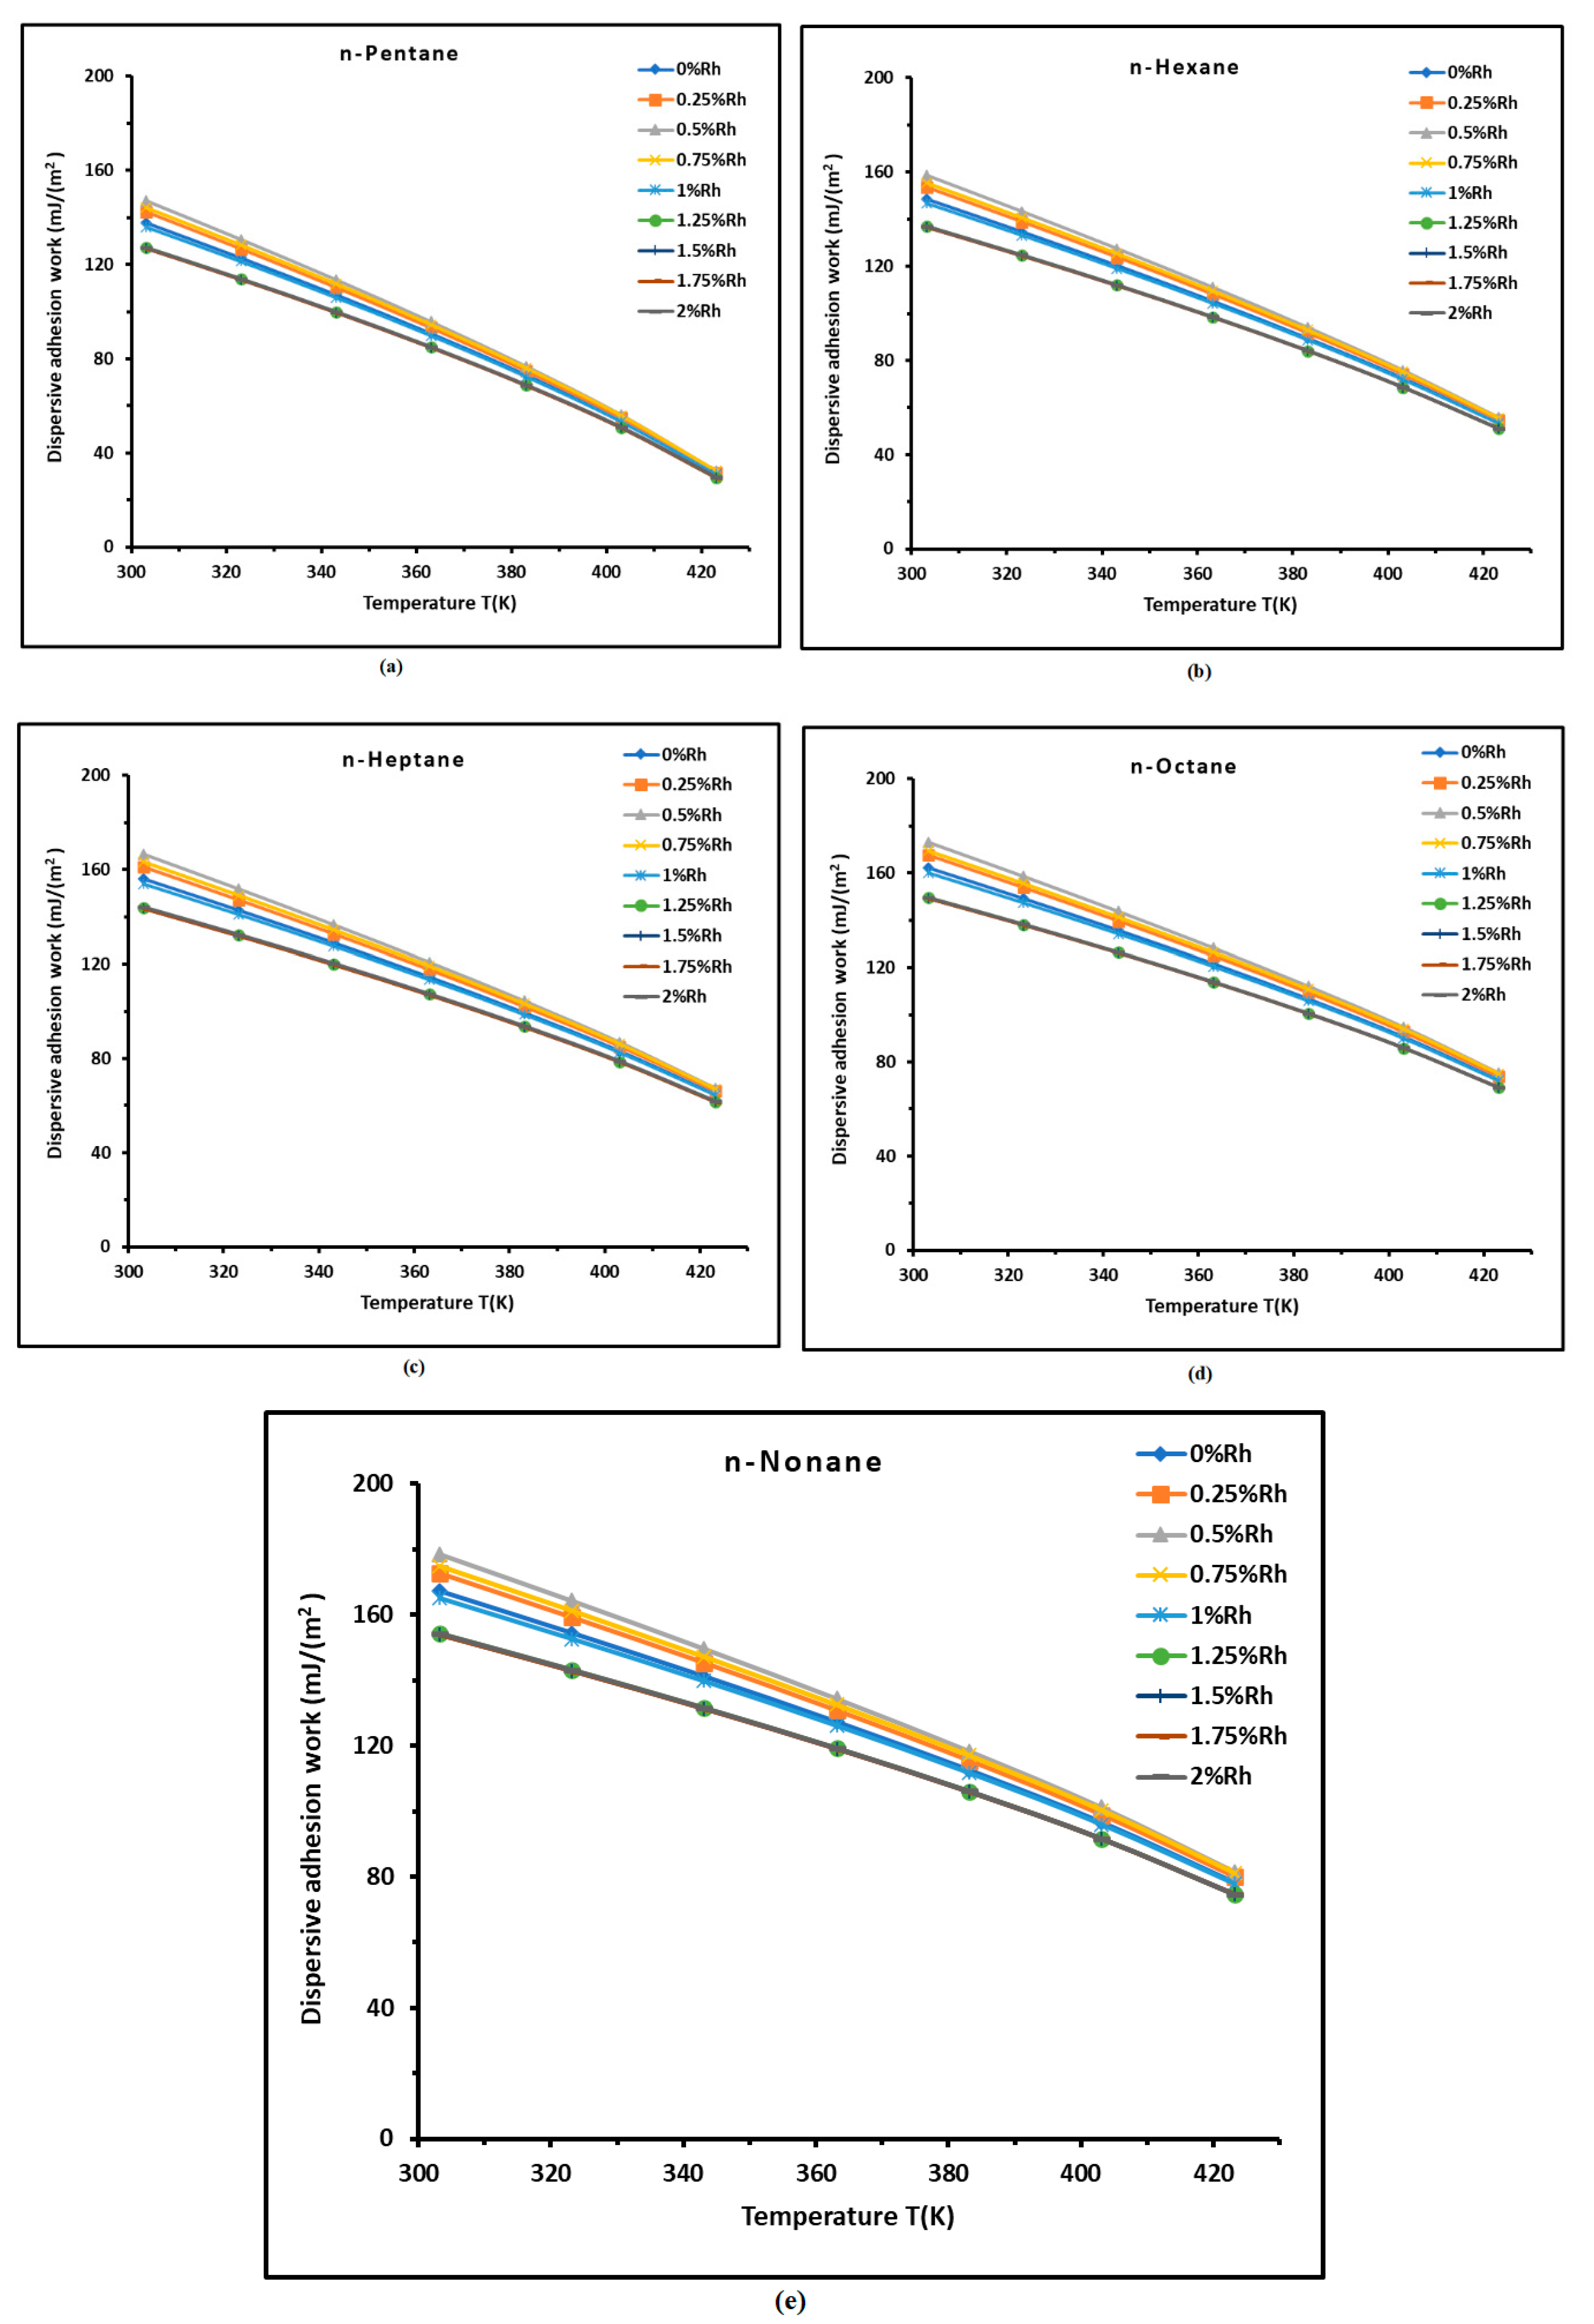
Figure 9.
Variations of the dispersive surface enthalpy
(mJ m-2) (a) and (mJ m-2 K-1) (b) of n-alkanes adsorbed on H-β-zeolite/rhodium catalysts as a function of the rhodium percentage.
Figure 9.
Variations of the dispersive surface enthalpy
(mJ m-2) (a) and (mJ m-2 K-1) (b) of n-alkanes adsorbed on H-β-zeolite/rhodium catalysts as a function of the rhodium percentage.
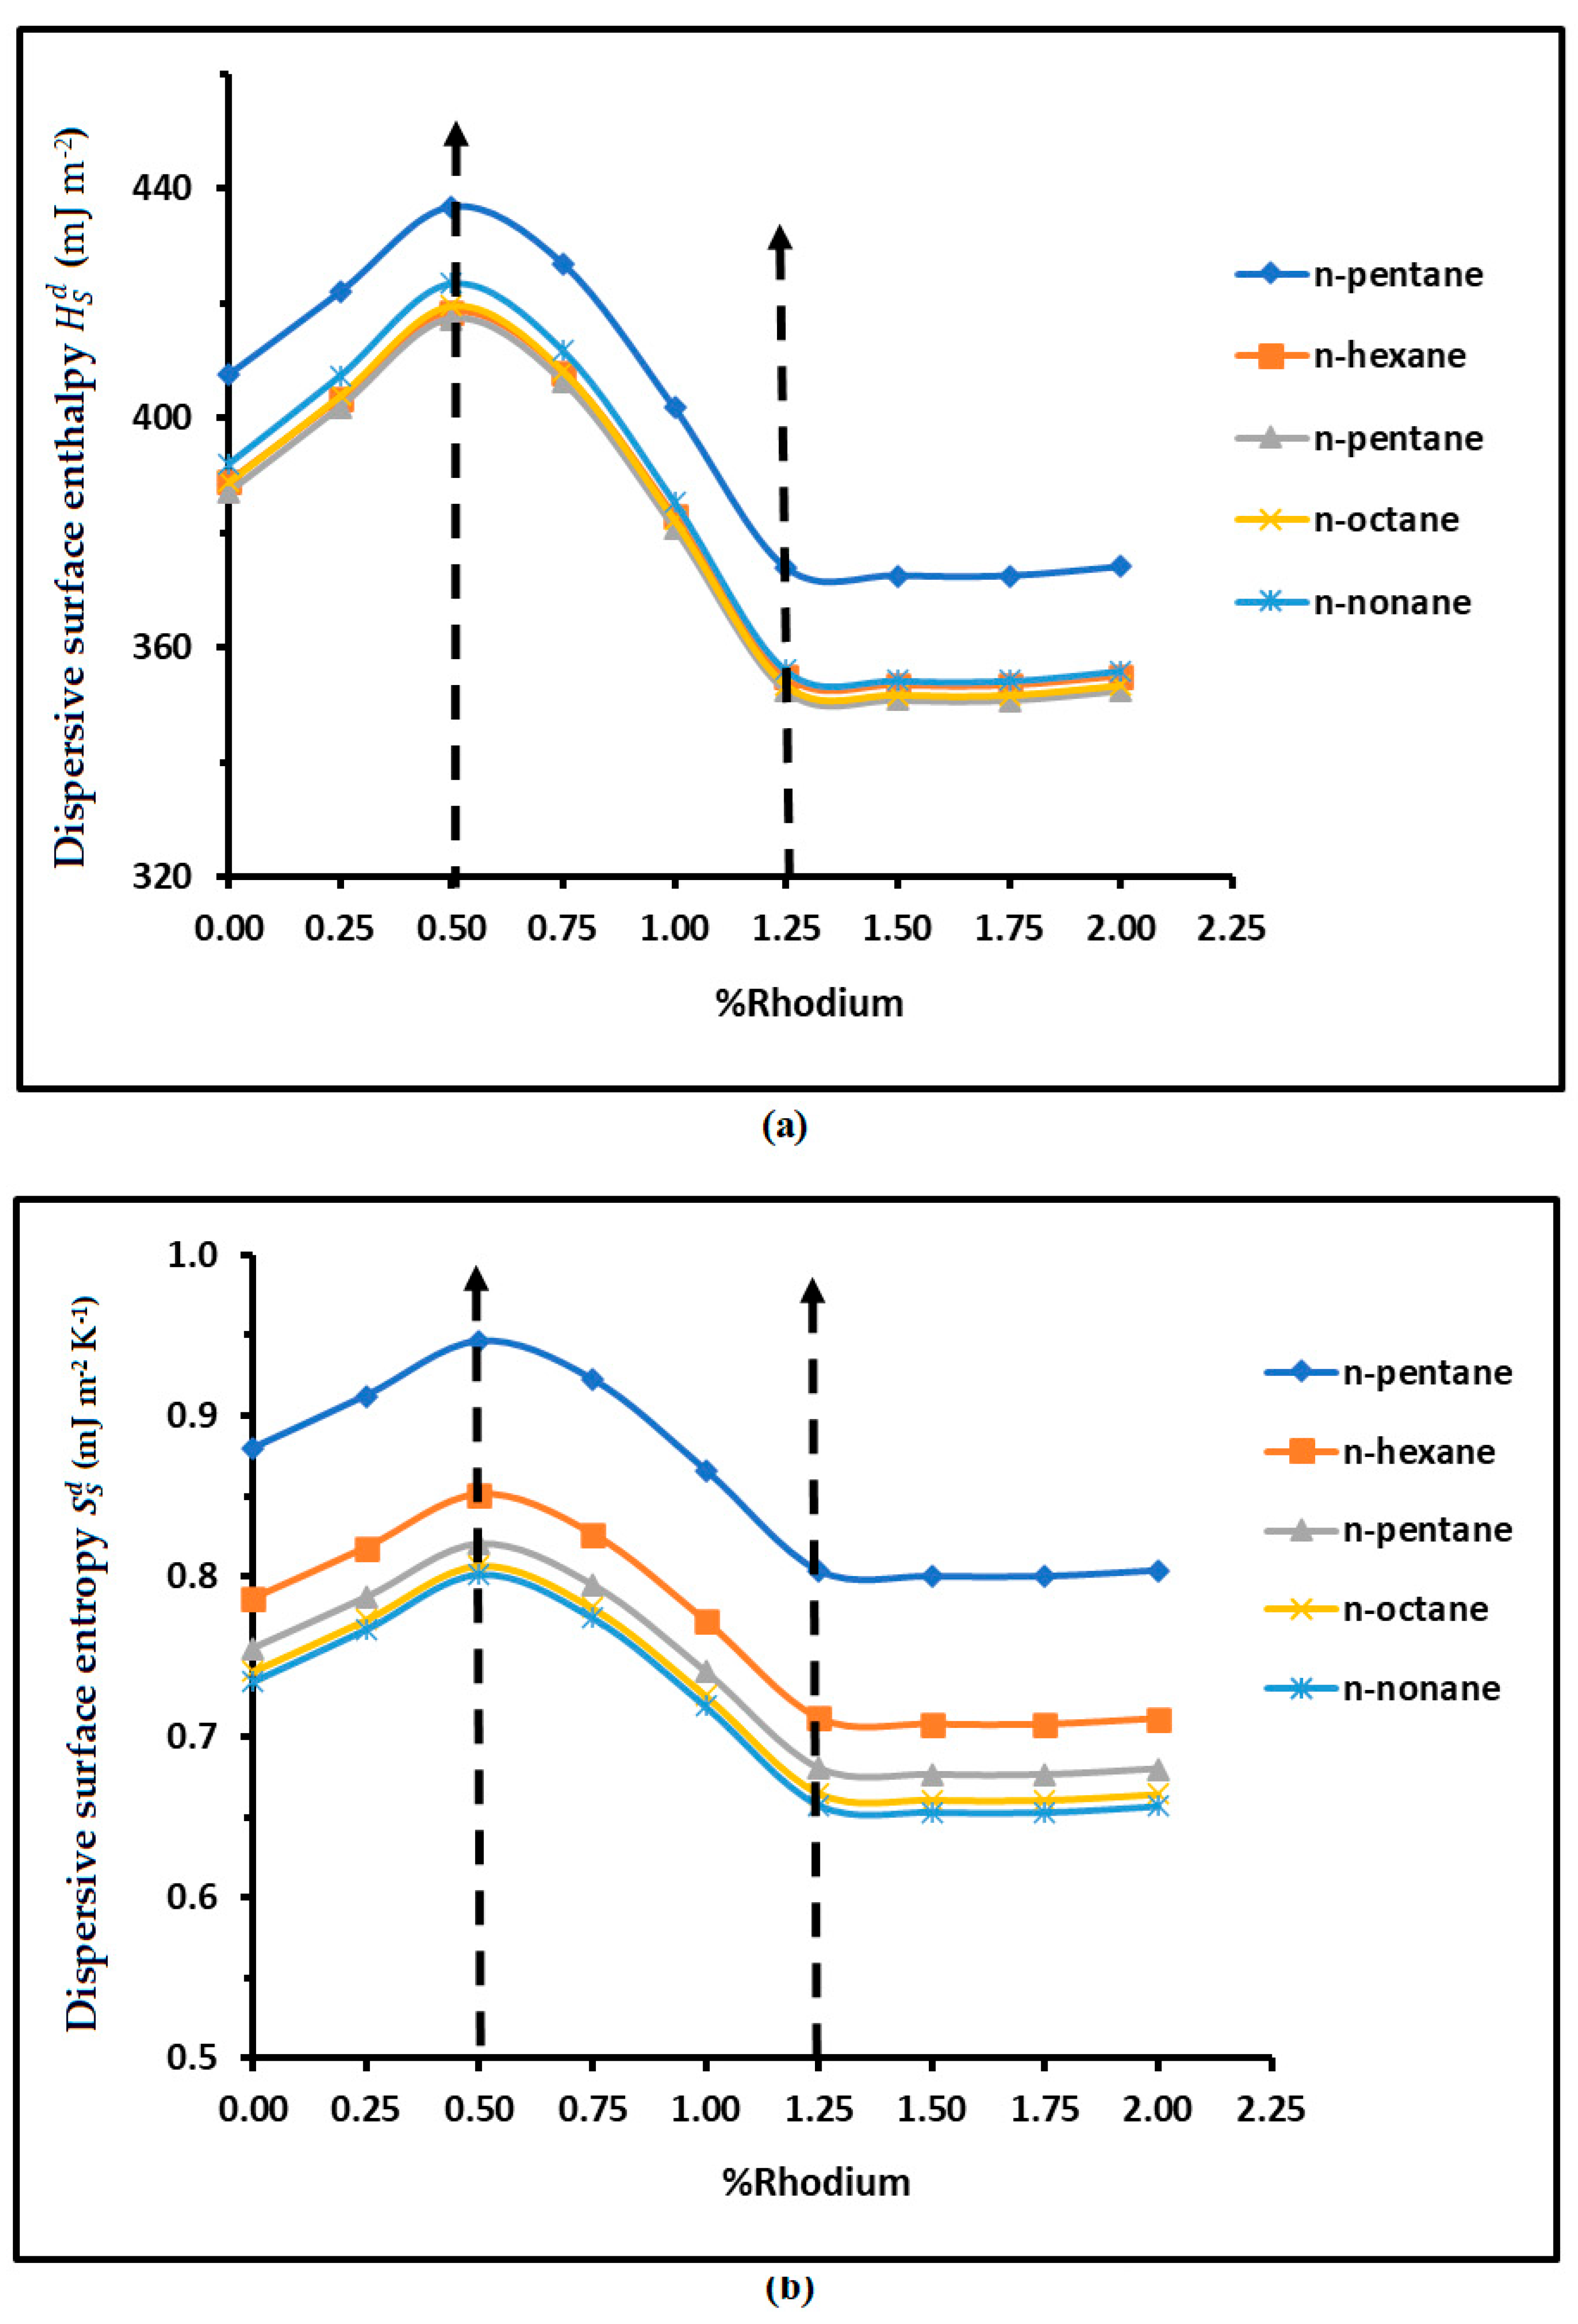

Table 1.
Values of the specific surface area (m2/g) and microporous volume (cm3/g) of the various catalysts [32].
Table 1.
Values of the specific surface area (m2/g) and microporous volume (cm3/g) of the various catalysts [32].
| %Rh | SBET (m2/g) | Vm (cm3/g) |
| 0 | 687 | 0.198 |
| 0.25 | 640 | 0.185 |
| 0.5 | 603 | 0.175 |
| 0.75 | 610 | 0.177 |
| 1 | 622 | 0.182 |
| 1.25 | 591 | 0.172 |
| 1.5 | 568 | 0.165 |
| 1.75 | 563 | 0.164 |
| 2 | 561 | 0.163 |
Table 2.
Values of of different catalysts as a function of temperature, rhodium percentage and molecular model using the increment method.
Table 2.
Values of of different catalysts as a function of temperature, rhodium percentage and molecular model using the increment method.
| %Rh | of catalysts | R² |
|---|---|---|
| 0.00% | 0.9993 | |
| 0.25% | 0.9994 | |
| 0.50% | 0.9995 | |
| 0.75% | 0.9994 | |
| 1.00% | 0.9993 | |
| 1.25% | 0.999 | |
| 1.50% | 0.999 | |
| 1.75% | 0.999 | |
| 2.00% | 0.999 |
Table 3.
Equations of (mJ m-2), (mJ m-2), and (mJ m-2 K-1) of the different n-alkanes adsorbed on H-β-zeolite/rhodium catalysts as a function of temperature at different rhodium percentages, with the corresponding values of the linear regression coefficients.
Table 3.
Equations of (mJ m-2), (mJ m-2), and (mJ m-2 K-1) of the different n-alkanes adsorbed on H-β-zeolite/rhodium catalysts as a function of temperature at different rhodium percentages, with the corresponding values of the linear regression coefficients.
| n-pentane | ||||
|---|---|---|---|---|
| %Rhodium | (mJ m-2) | (mJ m-2 K-1) | (mJ m-2) | R² |
| 0 | = -0.8797T + 407.51 | 0.8797 | 407.51 | 0.995 |
| 0.25 | = -0.9123T + 421.94 | 0.9123 | 421.94 | 0.9955 |
| 0.5 | = -0.9463T + 436.84 | 0.9463 | 436.84 | 0.996 |
| 0.75 | = -0.9226T + 426.85 | 0.9226 | 426.85 | 0.9955 |
| 1 | = -0.866T + 401.7 | 0.866 | 401.7 | 0.9946 |
| 1.25 | = -0.8032T + 373.84 | 0.8032 | 373.84 | 0.9935 |
| 1.5 | = -0.7998T + 372.46 | 0.7998 | 372.46 | 0.9933 |
| 1.75 | = -0.7997T + 372.42 | 0.7997 | 372.42 | 0.9933 |
| 2 | = -0.8034T + 374.02 | 0.8034 | 374.02 | 0.9934 |
| n-hexane | ||||
| %Rhodium | (mJ m-2) | (mJ m-2 K-1) | (mJ m-2) | R² |
| 0 | = -0.786T + 388.86 | 0.786 | 388.86 | 0.9973 |
| 0.25 | = -0.8177T + 403.34 | 0.8177 | 403.34 | 0.9976 |
| 0.5 | = -0.8509T + 418.39 | 0.8509 | 418.39 | 0.998 |
| 0.75 | = -0.8264T + 407.87 | 0.8264 | 407.87 | 0.9976 |
| 1 | = -0.772T + 382.78 | 0.772 | 382.78 | 0.997 |
| 1.25 | = -0.7115T + 354.95 | 0.7115 | 354.95 | 0.9961 |
| 1.5 | = -0.7077T + 353.42 | 0.7077 | 353.42 | 0.996 |
| 1.75 | = -0.7076T + 353.38 | 0.7076 | 353.38 | 0.9961 |
| 2 | = -0.7112T + 355.01 | 0.7112 | 355.01 | 0.9961 |
| n-heptane | ||||
| %Rhodium | (mJ m-2) | (mJ m-2 K-1) | (mJ m-2) | R² |
| 0 | = -0.7554T + 387.11 | 0.7554 | 387.11 | 0.9971 |
| 0.25 | = -0.7872T + 401.88 | 0.7872 | 401.88 | 0.9975 |
| 0.5 | = -0.8206T + 417.27 | 0.8206 | 417.27 | 0.9978 |
| 0.75 | = -0.7952T + 406.3 | 0.7952 | 406.3 | 0.9974 |
| 1 | = -0.7408T + 380.79 | 0.7408 | 380.79 | 0.9968 |
| 1.25 | = -0.6804T + 352.47 | 0.6804 | 352.47 | 0.9959 |
| 1.5 | = -0.6764T + 350.84 | 0.6764 | 350.84 | 0.9958 |
| 1.75 | = -0.6763T + 350.8 | 0.6763 | 350.8 | 0.9958 |
| 2 | = -0.68T + 352.47 | 0.68 | 352.47 | 0.9959 |
| n-octane | ||||
| %Rhodium | (mJ m-2) | (mJ m-2 K-1) | (mJ m-2) | R² |
| 0 | = -0.7408T + 388.78 | 0.7408 | 388.78 | 0.9967 |
| 0.25 | = -0.7729T + 403.85 | 0.7729 | 403.85 | 0.9971 |
| 0.5 | = -0.8067T + 419.57 | 0.8067 | 419.57 | 0.9975 |
| 0.75 | = -0.7805T + 408.24 | 0.7805 | 408.24 | 0.997 |
| 1 | = -0.7258T + 382.27 | 0.7258 | 382.27 | 0.9964 |
| 1.25 | = -0.665T + 353.43 | 0.665 | 353.43 | 0.9954 |
| 1.5 | = -0.6608T + 351.72 | 0.6608 | 351.72 | 0.9952 |
| 1.75 | = -0.6607T + 351.68 | 0.6607 | 351.68 | 0.9953 |
| 2 | = -0.6644T + 353.39 | 0.6644 | 353.39 | 0.9953 |
| n-nonane | ||||
| %Rhodium | (mJ m-2) | (mJ m-2 K-1) | (mJ m-2) | R² |
| 0 | = -0.7343T + 392.02 | 0.7343 | 392.02 | 0.9962 |
| 0.25 | = -0.7667T + 407.38 | 0.7667 | 407.38 | 0.9966 |
| 0.5 | = -0.801T + 423.42 | 0.801 | 423.42 | 0.9971 |
| 0.75 | = -0.7742T + 411.77 | 0.7742 | 411.77 | 0.9966 |
| 1 | = -0.719T + 385.33 | 0.719 | 385.33 | 0.9959 |
| 1.25 | = -0.6576T + 355.97 | 0.6576 | 355.97 | 0.9948 |
| 1.5 | = -0.6532T + 354.2 | 0.6532 | 354.2 | 0.9947 |
| 1.75 | = -0.6531T + 354.15 | 0.6531 | 354.15 | 0.9947 |
| 2 | = -0.6569T + 355.9 | 0.6569 | 355.9 | 0.9948 |
Table 4.
Equations of the dispersive surface enthalpy
(mJ m-2) and entropy (mJ m-2 K-1) of n-alkanes adsorbed on H-β-zeolite/rhodium catalysts as a function of the rhodium percentage with the linear regression coefficient R² and the general equation.
Table 4.
Equations of the dispersive surface enthalpy
(mJ m-2) and entropy (mJ m-2 K-1) of n-alkanes adsorbed on H-β-zeolite/rhodium catalysts as a function of the rhodium percentage with the linear regression coefficient R² and the general equation.
| n-alkanes | R² | R² | ||
|---|---|---|---|---|
| n-pentane | = -106.2 2 + 105.4 + 406.4 | 0.9777 | = 0.24 2 - 0.24 - 0.877 | 0.977 |
| n-hexane | = -106.3 2 + 105.3 + 387.82 | 0.9771 | = 0.23 2 - 0.23 - 0.784 | 0.9762 |
| n-pentane | = -108.3 2 + 107.1 + 386.08 | 0.9768 | = 0.23 2 - 0.23 - 0.754 | 0.9756 |
| n-octane | = -110.4 2 + 109.1 + 387.75 | 0.9766 | = 0.23 2 - 0.23 - 0.739 | 0.9752 |
| n-nonane | = -112.4 2 + 111.1 + 390.99 | 0.9765 | = 0.24 2 - 0.23 - 0.732 | 0.9749 |
Table 5.
Equations of the coefficients , , , and as a function of the carbon atom number with the linear regression coefficient R².
Table 5.
Equations of the coefficients , , , and as a function of the carbon atom number with the linear regression coefficient R².
| = -0.282 2 + 2.297 - 110.41 | R² = 0.9866 |
| = 0.313 2 - 2.872 + 111.73 | R² = 0.9827 |
| = 3.361 2 - 50.139 + 571.38 | R² = 0.9095 |
| = -0.014 2 + 0.223 - 1.648 | R² = 0.9770 |
Disclaimer/Publisher’s Note: The statements, opinions and data contained in all publications are solely those of the individual author(s) and contributor(s) and not of MDPI and/or the editor(s). MDPI and/or the editor(s) disclaim responsibility for any injury to people or property resulting from any ideas, methods, instructions or products referred to in the content. |
© 2024 by the authors. Licensee MDPI, Basel, Switzerland. This article is an open access article distributed under the terms and conditions of the Creative Commons Attribution (CC BY) license (http://creativecommons.org/licenses/by/4.0/).
Copyright: This open access article is published under a Creative Commons CC BY 4.0 license, which permit the free download, distribution, and reuse, provided that the author and preprint are cited in any reuse.


