
Submitted:
08 December 2023
Posted:
08 December 2023
You are already at the latest version
Abstract
The ridge-furrow plastic mulching (RFPM) system and nitrogen application have been effective strategies for improving crop productivity in the Loess Plateau of China. However, it is not clear how the ridge-furrow ratio and nitrogen fertilizer type (NT) affect the utilization of water, nitrogen, heat and radiation resources for increased rain-fed wheat production. Two nitrogen fertilizer types [Traditional urea (TU) and controlled-release urea (CRU)] and four planting patterns [conventional flat planting (F) and the RFPM system of 20 cm ridge with 40 cm furrow (R2F4), 40 cm ridge with 40 cm furrow (R4F4), and 60 cm ridge with 40 cm furrow (R6F4)] were tested from September, 2018 to June, 2021 during winter wheat growing season. The results showed that the RFPM system can increase the soil thermal time (TTsoil) by 41.0–152.1°C d compared to F. The thermal effect of the RFPM system shortens the vegetative growth period and extends the reproductive growth period by 2–7 days, promoting the increase of the leaf area index (LAI) and final dry matter (DM) accumulation. These significantly increased the grain yield (GY) in the RFPM system by 51.6–115.2% and enhanced the thermal time use efficiency (TUE) by 48–99.5%, water productivity (WP) by 37.4–76.3%, radiation use efficiency (RUE) by 16.3–34.4%, and partial factor productivity of nitrogen (PFPN) by 51.6–115.2% compared to F. Although a high ridge-furrow ratio combined with CRU increased GY and resources use efficiency, it also exacerbated the soil water depletion, especially in the 40–140 cm soil layer. Overall, applying CRU in combination with the RFPM system of 40 cm ridge with 40 cm furrow maximized resources use efficiency and increased wheat production in the Loess Plateau of China.
Keywords:
Ridge-furrow ratio
; nitrogen fertilizer type
; Winter wheat
; Soil hydrothermal
; Resource use efficiency
; Grain yield
1. Introduction
The genotype of seeds is the internal factor that determines the yield potential of crops, while the water, fertilizer, temperature, solar radiation and other exterior factors limit the yield potential [1,2]. As a common pasta crop in northern China, winter wheat (Triticum aestivum L.) is widely planted in the Loess Plateau [3]. This region's High solar radiation can lead to high crop production levels. However, crop yields are often low and unstable due to the region's scarce precipitation and infertile soil [4]. Therefore, improving soil moisture and nutrient availability to match solar radiation resources is crucial for achieving greater and more stable grain yields.
The efficient storage of precipitation is an effective way to deal with the low availability of soil moisture [5]. The ridge-furrow plastic mulching (RFPM) technology is considered the most effective planting technology in rain-fed agricultural areas due to its efficient collection and storage of precipitation [4,6]. Previous studies have shown that the RFPM system facilitated precipitation infiltration, suppressed soil evaporation, increased daily radiation, and raised the soil temperature in the early stage of crop growth [7,8]. These alterations improved the photosynthetic assimilation efficiency of leaves, thus promoting dry matter accumulation and yield [9,10]. The ridge to furrow ratio in the RFPM system is a critical indicator that influences resource allocation and can have a significant impact on resource utilization efficiency and final yield formation in rain-fed farming areas [6,7,11]. Increasing ridge width can significantly improve soil water and thermal conditions. Conversely, reducing the furrow area artificially increases plant density and competition between plants, resulting in poor use of solar radiation and heat resources, and ultimately reducing crop yield [6,12,13]. Therefore, it is necessary to study the regulatory effect of the ridge to furrow ratio on the resource utilization and yield of the crop.
Application of fertilizers (especially nitrogen) is the most common and effective method for improving the low soil fertility of the Loess Plateau [14,15]. Numerous studies have shown that N fertilizer application promotes canopy expansion [9,14], leading to enhanced interception of radiation and its conversion into biomass, ultimately resulting in increased grain yield [16,17]. Nitrogen fertilizer type also affects crop growth, development, and crop production. Compared with traditional urea (TU), new controlled-release urea (CRU) that realizes the slow release of N can effectively improve the availability of soil N [6,15,18]. This change induced the downward extension of roots, enhanced the uptake and utilization of nitrogen from deeper soil layers by plant roots, ultimately retarding the premature aging process of leaves [14]. Thus, greater GY can be achieved when CRU is applied compared to TU [6,15,18,19]. However, there have been few studies on the vital production resources of different nitrogen fertilizer types, particularly when applying different nitrogen fertilizer types to RFPM systems.
There have been many studies on the RFPM system, the application of nitrogen to crops, and critical resource (water, nitrogen, thermal, and radiation) use efficiency [2,8,14]. However, more information is needed about the combined effects of the ridge-furrow ratio and nitrogen fertilizer type (NT) on GY and resource use efficiency of rain-fed winter wheat in the Loess Plateau, China. In theory, the effects of soil moisture and nitrogen on crop growth and development interact with each other [4,20], but it is not clear how N availability from different nitrogen fertilizer types impacts crop yield under different ridge-furrow ratios. In addition, little information is available about the internal efficiency mechanism controlling resource utilization (thermal, water, nitrogen, and radiation). Understanding these mechanisms could provide a scientific basis for optimizing the RFPM system and nitrogen fertilizer type selection.
Therefore, a three-year consecutive experiment was conducted to investigate the quantitative effects of different ratios of ridges and furrows and types of nitrogen fertilizers on the dynamics and distribution of captured thermal, water, nitrogen, and radiation resources. Additionally, the aim was to assess the impact of using RFPM system with varying ridge-furrow ratios and nitrogen fertilizer types on the growth and yield of winter wheat. Furthermore, it aimed to determine an optimized ratio for ridges and furrows as well as an appropriate type of nitrogen fertilizer that would result in higher winter wheat yields and resource utilization efficiency in the region.
2. Materials and Methods
2.1. Site and description
The experiments were conducted at the Organic Dryland Agriculture Station (37◦25´N, 112◦36´E) of Shanxi Agricultural University in Taigu, Shanxi Province, China. The study spanned three consecutive growing seasons from September 2018 to June 2021 during the winter wheat cultivation period. Over the past sixty years (1960 - 2020), the region has experienced an average annual precipitation of 462.9 mm and evaporation of 1002.9 mm, which is typical for a semi-dry agricultural area located on the loess plateau. Additionally, the average annual temperature in this area was recorded as 9.9℃ with a sunshine duration of approximately 2550 hours and a frost-free period lasting around 176 days per year. The soil texture observed in this study belongs to the cinnamon soils with a bulk density of 1.29 g cm-3, a field capacity of 23.5 % and a wilting point of 7.3 % within the soil profile extending up to 140 cm depth. The effective phosphorus, available potassium, alkaline nitrogen and organic matter contents within the 30 cm soil profile were 18.44 mg kg-1, 236.87 mg kg-1, 53.76 mg kg-1 and 22.02 g kg-1, respectively. The monthly precipitation and solar radiation for the period from September 2018 to June 2021 are shown in Figure 1.
2.2. Experimental design
The nitrogen fertilizer types included traditional urea (TU) and controlled-release urea (CRU). Each fertilizer type had four planting patterns [conventional flat planting (F) and the RFPM system with 40 cm furrow width and 20, 40 and 60 cm ridge width, respectively. A schematic diagram of the different planting patterns and their unit sizes is shown in Figure 2. A transparent film of 0.08 mm thickness was placed over the ridges at sowing stage and later removed after harvesting. To ensure minimal interference from water and nutrient migration between neighboring plots, a minimum distance of 1.0 m was maintained between each plot.
Prior to establishing the RFPM and F plots, a basal fertilizer consisting of pure N, P2O5, and K2O were applied at rates of 180, 150 and 120 kg ha-1, respectively, before each planting season. The nitrogen fertilizers utilized in the experiments included conventional urea (TU) with a minimum N content of 46% and controlled-release urea (CRU) with an N content of 24%, releasing over a period of 90-120 days from Kingenta Ecological Engineering Co., Ltd., China. Each plot covers an area approximately measuring 36 m2, and the local mainstream variety 'Zhongmai 175' is planted at a density of 150 kg ha-1 across all plots. Pests and weeds are strictly controlled during the growing season to avoid yield loss.
2.3. Sampling and measurements
2.3.1. Phenology
The phenology of winter wheat was continuously monitored throughout the entire growing season for each plot. The date was recorded when at least 50% of the plant population in the observation plot had reached various stages, including seedling emergence, re-greening, flowering, and physiological maturity [21].
2.3.2. Soil temperature and soil water content (SWC)
An automatic soil temperature probe (DS1922L, Analog Devices, Shanghai, China) was buried 15 cm below the surface between two rows of plants in each plot. This instrument provided continuous measurements of soil temperature (℃) at intervals of every 4 hours during the entire growth period of wheat.
Soil samples were collected from a depth of 140 cm for winter wheat at different stages such as sowing, seedling emergence, flowering, grain filling and maturity using a hand drill with sampling points spaced every 20 cm. For the F treatments, soil samples were taken from the middle position between two rows of wheat plants. For the RFPM treatments, soil samples were collected from three specific positions: center ridge point, junction point between ridge and furrow, and center furrow point. These soil samples were then placed in an aluminum box and dried in a forced-air oven at a temperature of 105℃ for a duration of 24 hours to determine soil water content (SWC).
2.3.3. leaf area index (LAI) and dry matter accumulation(DM)
During the main phenology, a total of twenty plants were randomly selected from each plot to evaluate the Leaf Area Index (LAI) and Dry Matter (DM). LAI represents the ratio between the overall leaf area of leaves within a plot and the plot's area. The individual leaf area is determined by multiplying its length with its maximum width, followed by multiplying this result by 0.75 [22]. To obtain DM, wheat plants were chopped and subjected to drying in a forced-air oven at 105℃for thirty minutes initially, then maintained at a temperature range of 65-70℃ for at least seventy-two hours.
2.3.4. Grain yield
At physiological maturity, six rows consisting of one-meter-long wheat plants were manually harvested from the center of each plot. Subsequently, grain moisture content was determined through drying it in a forced-air oven. Finally, grain yield was calculated considering a moisture content level of 14% [3].
2.4. Data calculation
2.4.1. Soil thermal time (TTsoil) and thermal time use efficiency (TUE)
The calculation of the cumulative soil thermal time(TTsoil,℃) for winter wheat cultivation from sowing to maturity was based on the method by McMaster et al. (1997) [23]:
where Tmean represents the daily mean temperature of the soil, while Tbase denotes winter wheat's basic soil temperature of 0◦C. All the available data with Tmean below the basic soil temperature was treated as equal to 0◦C.
The TUE [kg ha−1 (°C d)−1] for winter wheat grain yield was calculated according to the method proposed by Subrahmaniyan et al. (2018) [24]:
where TTsoil (°C d) is the soil thermal time of winter wheat during the whole growing season.
TUE= Grain yield/TTsoil
2.4.2. Intercepted photosynthetically active radiation (PARi) and radiation use efficiency (RUE)
The amount of PARi (MJ m-2) intercepted by the wheat canopy was computed using Zhang et al.'s (2019) [2] exponential function:
where R (MJ m−2) represents the daily solar radiation, while k denotes the light extinction coefficient (0.65 for winter wheat [25]), and LAI indicates the leaf area index.
The formula proposed by Subrahmaniyan et al. (2018) [24] was used to calculate the RUE (g MJ-1) for wheat grain yield:
where GY is the wheat grain yield (g m–2), and PARi (MJ m–2) is the photosynthetically active radiation intercepted by the wheat canopy during the winter wheat growth period.
RUE=GY/PARi
2.4.3. Soil water storage (SWS), evapotranspiration (ET) and water productivity(WP)
The SWS (mm), ET (mm), and WP (kg mm–1 ha–1) were computed using the formula introduced by Mo et al. (2017) [12] as follows:
where SD represents the soil layer depth (mm), SWC is the soil water content of a specific soil layer (%), ρ refers to the soil bulk density (g cm−3); P corresponds to total precipitation received during winter wheat growth period (mm); whereas △SWS (soil water depletion) indicates variation in stored soil water from sowing to maturity stage for winter wheat crops (mm).
SWS = SD × SWC × ρ
ET = P + ΔSWS
WP=GY/ET
2.4.4. Partial factor productivity of N (PFPN)
The partial factor productivity of N (PFPN, kg kg−1) was computed using the formula provided by Qiang et al. (2022b) [15]:
where GY represents the grain yield of wheat (kg ha−1), FN denotes the nitrogen application rate (kg ha−1).
PFPN=GY/FN
2.5. Statistical analysis
The ANOVA technique implemented through SPSS18.0 statistical software facilitated assessment of ridge-to-furrow ratio's impact along with nitrogen fertilizer type and planting year on grain yield, resource allocation, and utilization patterns. Significant differences among treatments were compared utilizing LSD0.05 test. Graphics were generated employing Origin 8.5 drawing software.
3. Results
3.1. Dry matter (DM) accumulation dynamics
Planting pattern, nitrogen fertilizer type, and growing season all positively affected the DM (Figure 3). Regardless of the nitrogen fertilizer type and growing season, DM followed the order of R6F4 = R4F4 > R2F4 > F over the whole growth period. The effect of nitrogen fertilizer type on dry matter accumulation in vegetative growth period was not significant. However, CRU increased DM levels during the reproductive growth period compared to TU. The DM at maturity value was greatest in the 2020–2021 season, followed by 2019–2020 and 2018–2019 season, with values of 9125.9, 5578.7, and 5175.4 kg ha–1, respectively.
3.2. Leaf area index (LAI) dynamics
Planting pattern, nitrogen fertilizer type, and growing season all positively affected the LAI (Figure 4). Averaged across nitrogen fertilizer type and growing season, LAI followed the order: R6F4 = R4F4 > R2F4 > F over the whole growth period. Applying CRU significantly increased LAI, particularly during the reproductive growth period. The mean value for LAI was highest during the 2020–2021 season, followed by 2018–2019 and 2019–2020, with values of 2.8, 1.3, and 1.2 m2 m–2, respectively.
3.3. Crop phenology
The crop phenology was significantly affected by Y, NT, and P (Figure 5). The So-Se period generally became longer as the ridge-furrow ratio decreased, whereas the opposite occurred for the Re-Fi and Fi-Ma stages. The CRU extended the total growth period by about 2 days compared to applying TU and the difference between the two nitrogen fertilizer types was greatest during the Fi-Ma stage. The differences in the meteorological factors meant that the mean value for the length of the whole growing season was longest in 2019–2020, followed by 2018–2019 and 2020–2021, with values of 259, 256, and 252 d, respectively.
3.4. Grain Yield (GY)
The Grain Yield (GY) was significantly affected by Y, NT, and P (Figure 6). The average GY in 2018–2019, 2019–2020, and 2020–2021 wheat growing seasons was 2314.1, 3084.1 and 5699.6 kg ha−1, respectively. The RFPM system produced significantly greater GYs than the F planting treatment. The GY of wheat increased with the increase of ridge width, and reached the maximum when the ridge width was 40 cm. Averaged across three growing seasons, CRU increased GY by an average of 11.8% compared to TU.
3.5. Resource use efficiency
3.5.1. Thermal time and radiation use efficiency
The thermal time use efficiency (TUE) and radiation use efficiency (RUE) were all significantly affected by Y, NT, and P (Table 1). Both TUE and RUE increased with the ridge-furrow ratio, with mean values of 0.99, 1.47, 1.95, and 1.98 kg ha−1 (°C d)−1 for TUE, and 0.85, 0.99, 1.14, and 1.14 g MJ−1 for RUE in the F, R2F4, R4F4, and R6F4 treatments, respectively. The CRU increased the TUE and RUE values more than TU, with TUE and RUE values of 1.68 kg ha−1 (°C d)−1 and 1.07 g MJ−1, respectively, for CRU and 1.51 kg ha−1 (°C d)−1 and 0.99 g MJ−1, respectively, for TU. Averaged across NT and P, the mean TUE values were 0.90, 1.37, and 2.51 kg ha−1 (°C d)−1 in 2018–2019, 2019–2020, and 2020–2021, respectively, while the mean RUE values were 0.85, 0.93, and 1.30 g MJ−1, respectively.
3.5.2. Water productivity and partial factor productivity of N
The water productivity (WP) and the partial factor productivity of N (PFPN) were significantly affected by Y, NT, and P (Table 2). Both WP and PFPN rose as the ridge-furrow ratio increased, with mean values of 10.9, 14.9, 19.1, and 19.1 kg ha–1 mm–1 for WP and 12.2, 18.4, 25.5, and 26.2 kg kg–1 for PFPN in the F, R2F4, R4F4, and R6F4 treatments, respectively. The CRU increased WP by 7.8% and PFPN by 14.1% compared to TU. Averaged across NT and P, the mean WP values were 10.7, 13.1, and 24.2 kg ha–1 mm–1 in 2018–2019, 2019–2020, and 2020–2021, respectively, while the mean PFPN values were 12.9, 17.1, and 31.7 kg kg–1, respectively.
3.6. Allocation of soil thermal time (TTsoil), evapotranspiration (ET), and intercepted photosynthetically active radiation (PAR) during the winter wheat growth period
3.6.1. Soil thermal time (TTsoil)
The soil thermal time (TTsoil) was significantly affected by Y, NT, and P (Table 3). Averaged across Y and P, CRU significantly increased TTsoil over TU, with values of 2363.6℃ d for CRU and 2322.8℃ d for TU. The difference was significant during the Fi-Ma stage, but there was no significant difference during the rest of the growth stages. Generally, the RFPM system had higher TTsoil values than F, with increases in TTsoil of 1.8%, 5.8%, and 6.7% under R2F4, R4F4, and R6F4 compared to F, respectively, when values were averaged across the three seasons. Increasing the ridge-furrow ratio led to a decrease in TTsoil during the Re-Fl growth stage, whereas it increased TTsoil during the other growing stages. TTsoil capture was affected by solar radiation during the growth period and was highest during 2018–2019 (2541.0℃ d), followed by 2019–2020 (2242.7℃ d) and 2020–2021 (2245.8℃ d). The effects of NT×P and P×Y on TTsoil capture during the whole growing season were both significant (P < 0.05), that means the effect of P on this parameter significantly varied with NT and Y. In contrast, NT×Y had no significant effect on TTsoil (P > 0.05), suggesting that the Y effects on this parameter were similar and independent of TU or CRU.
3.6.2. Evapotranspiration (ET)
The evapotranspiration (ET) during all the growth periods was significantly affected by Y, NT, and P (Table 4). Applying CRU significantly increased ET over TU, with values of 229.8 and 218.8 mm for CRU and TU, respectively. The difference was greatest during the Fi-Ma period. Averaged across Y and NT, ET increased with the increase of ridge-furrow ratio, except for the So-Se period. ET by winter wheat was affected by rainfall and significantly varied among growing seasons. The ET values showed the following trend in the three planting seasons: 2018–2019 < 2019–2020 = 2020–2021, and the effects of NT×P on ET were non-significant (P > 0.05), suggesting that the four planting patterns had similar performances in response to CRU and TU.
3.6.3. Photosynthetically active radiation (PAR)
The Photosynthetically active radiation (PAR) interception during the growth period was significantly affected by Y, NT, and P (Table 5). The effect of NT on PAR was greatest during the reproductive growth stages. However, P affected PAR interception throughout the winter wheat growing season. Photosynthetically active radiation interception increased with the ridge-furrow ratio and the mean values averaged among NT and Y were 243.1, 322.7, 390.1, and 398.1 MJ m–2 for F, R2F4, R4F4, and R6F4, respectively. The highest PAR interception occurred in 2020–2021 (427.9 MJ m–2), followed by 2019–2020 (326.5 MJ m–2) and 2018–2019 (261.1 MJ m–2). The effect of NT×P on PAR interception was not significant (P > 0.05), suggesting that the positive impact of P on the PAR was the same regardless of nitrogen fertilizer type.
3.7. Soil water depletion
The soil water depletion during the growing season was significantly affected by Y, NT, and P (Figure 7). Averaged across NT and Y, soil water depletion over the three growing season followed the order: 2020–2021 > 2018–2019 > 2019–2020, with values of 130.9, 94.0, and 64.1 mm, respectively. The NT treatment affected soil water depletion within the 40–100 and 100–140 cm soil layers and followed the trend of CRU > TU, but it did not affect soil water depletion in the 0–40 cm soil layer. Soil water depletion increased with the ridge-furrow ratio and the mean values averaged among NT and Y were 71.6, 92.9, 108.7, and 112.2 mm for F, R2F4, R4F4, and R6F4, respectively. The results also showed that the difference in soil water depletion was greatest in the 40–140 soil layer.
4. Discussion
4.1. Crop growth and phenology
Soil moisture, nutrients, solar energy and thermal energy are the key environmental factors affecting crop growth [26,27]. The results from this study showed that the RFPM system significantly increased LAI and DM compared to F over the three wheat growing seasons. This could be attributed to fact that the RFPM system created favorable hydrothermal conditions in semi-arid areas, which significantly promoted leaf extension and the interception of PAR, thus increasing photosynthetic assimilation and dry matter accumulation [9,11,28]. In addition, LAI and DM both followed the order: R6F4 = R4F4 > R2F4 > F over the whole growth period. This implied that there was a threshold value for the promotion effect of the RFPM system on crop growth, excessive ridge widths artificially led to high plant densities in the furrows, which aggravated competition between plants, resulting in premature senescence of the middle and lower leaves of plants and the inhibition of dry matter accumulation [29,30]. The results also showed that CRU increased LAI and DM, especially during the reproductive growth stage (Figure 3 and Figure 4). This was mainly because applied CRU significantly improved the soil N availability, especially in the middle and late periods, thereby delaying leaf senescence and increasing DM accumulation [15]. It is well-known that mulching can regulate the relationship between soil moisture and thermal status, thus affecting the crop development process [24,31]. In this study, the RFPM system prolonged the total growth period and the reproductive growth stage by 1–5 days and 1–9 days compared to that of F, respectively (Figure 5). A possible reason for this difference was that the RFPM system significantly improved soil water availability, root activity, the absorption of additional water and nitrogen, and delayed leaf senescence, which prolonged the overall growth period [29,31,32].
4.2. Crop resource allocation and resource use efficiency
Numerous studies have shown that crop yield depended on the amount of resources absorbed and the allocation of the resources among different growth stages[27,33]. Consistent with previous studies [2,8], ET in this study increased with the ridge-furrow ratio, except during the So-Se period (Table 4). This was because soil evaporation rather than transpiration determined ET at the seedling stage and larger ridge widths significantly reduced ET by reducing soil evaporation [6,13]. The TTsoil capture values increased with ridge width over the whole growth period, except during the Re-Fi period (Table 3). This was related to the fast crop growth rate and the larger leaf area preventing light from penetrating the leaves and reaching the ground, thus reducing the soil warming effect [2,24]. Photosynthetically active radiation interception at the various growth stages followed the trend of F < R2F4 < R4F4 = R6F4 (Table 5). This was mainly due to the superior hydrothermal conditions created by the RFPM system, which improved seedling establishment and subsequent crop canopy development in the RFPM system. This meant that the RFPM system had a higher LAI than that of F (Figure 4), which improved the interception of radiation by leaves [14]. Applying CRU increased the absorption of resources (ET, TTsoil, and PAR) compared to TU. The differences were greatest during the reproductive growth period because there was no significant difference in N availability between the two N fertilizer type during the vegetative growth period, which meant that the differences primarily occurred during the late growth period [6,15,18].
The ability of plants to capture and utilize resources is the key to determine crop growth and yield [33,34]. In our study, the RFPM system (especially with greater ridge widths) produced higher resource (TUE, RUE, WP, and PFPN) use efficiencies compared to F (Table 1 and Table 2). The effect on TUE may be attributed to the warming effect of the RFPM system in the early growth stage leading to improved early seedling establishment, DM accumulation, and ultimately promoted the transport of dry matter from vegetative organs to grains [2]. The effect on RUE may be attributed to the RFPM system always resulting in higher LAIs compared to the conventional flat planting (F) throughout the growing season (Figure 4). This would increase the interception of solar radiation, the photosynthetic rate, and ultimately, GY [7,28,30]. The effects on WP may be attributed to the RFPM system converting some ineffective rainfall into effective rainfall and to increases in the crop transpiration proportion of ET, which would increase the canopy photosynthetic capacity and ultimately, GY [5,8,35]. The effect on PFPN may be attributable to the RFPM system, particularly when the width is greater, because it improves the soil water conditions. Thus, a possible synergistic effect on yield performance existed between N and water [4,10,20]. Consistent with previous research conclusions [6,15,18], our study showed that applying CRU led to greater resource use efficiencies than TU.
4.3. Crop yield
Water shortage is the primary limiting factor for winter wheat productivity in the rain-fed agricultural planting area of the Loess Plateau [3,5]. In our study, the RFPM system achieved a higher GY than F, which may be attributable to the RFPM system can significantly improved the availability of soil moisture, thereby minimizing the adverse effects of drought on crop growth [4,13]. Improving soil moisture availability directly affects soil temperature and N availability, and ultimately promotes canopy growth and resource utilization, which subsequently increased crop yields [2,14,29]. Changing the size of ridge and furrow is a common measure that is used to regulate resource utilization and crop production. In this study, when the ridge width was ≤ 40 cm, crop yields increased with ridge width. However, there was no effect when the ridge was too wide (> 40 cm) because the GY of R4F4 was equal to R6F4 (Figure 6). This is mainly due to increasing the ridge width can significantly improve soil hydrothermal conditions, thus promoting the utilization of resources and ultimately, crop yields. However, too wide a ridge wastes the solar energy resources of the rainwater harvesting area (ridge) and exacerbates the competition for resources in the furrow, which is not conducive to yield increases [11,13]. It can be predicted that, beyond a certain point, GY will decrease as the ridge-furrow ratio increases.
4.4. Soil water depletion
Applying CRU and wider ridges in rain-fed agriculture planting areas can significantly increase crop ET [6,36]. In the 0–40 cm soil layer, planting year affected soil water depletion, but NT and P did not. This may be because the consumption of soil moisture by NT and P in the 0–40 cm soil layer was phased and weak, and the considerable ET due to meteorological factors eventually eliminated any differences. In the 40–100 and 100–140 cm soil layers, a higher ridge-furrow ratio or applying CRU tended to intensify soil water depletion. A potential reason for this was that the RFPM system led to increased root growth depth and root activity [32], which enhanced root to absorb more soil moisture, especially in the deeper soil layers, to alleviate drought stress [2,12]. Analysis from the soil water balance, the soil moisture within the 0–40 cm layer was easily recovered during the summer fallow period [3,37], but it was not clear whether deep soil moisture (40–140 soil layer) was restored during the fallow period, especially in dry years. Deep soil moisture is an important water source that enables the next stubble crops to cope with periodic drought [38]. Thus, the use of an optimal ridge and furrow size, and an appropriate fertilization strategy directly affected the sustainability of rain-fed farmland production.
5. Conclusions
In the rain-fed agricultural region of the Loess Plateau in China, implementing the RFPM system, especially with higher ridge-furrow ratios, had a significant positive impact on soil hydrothermal conditions. This system facilitated the growth of crop canopies and enhanced their ability to capture more sunlight, resulting in increased evapotranspiration and dry matter accumulation. It also prioritized the allocation of crucial production resources such as water, nitrogen, radiation, and heat towards the reproductive growth phase. These modifications constitute an internal mechanism that drives resource efficiency within the RFPM system and leads to a substantial improvement in winter wheat GY by 51.6–115.2%,TUE by 48.3–99.5%, WP by 37.4–76.3%, RUE by 16.3–34.4%, and PFPN by 51.6–115.2% compared to F. Furthermore, applying CRU increased the absorption and utilization of resources compared to TU, particularly during the reproductive growth stage. We suggest that the R4F4 treatment combined with CRU could be a suitable integrated resource planting pattern for rain-fed winter wheat production.
Author Contributions
Conceptualization, S.Q.; methodology, Y.Z.; software, W.L. and X.T., validation, Y.Z. and J.F.; formal analysis, Y.Z.; investigation, Y.Z.; data curation, W.L. and X.T.; writing—original draft preparation, S.Q.; writing—review and editing, Y.Z.; visualization, Y.Z.; supervision, F.Z. and J.F.; project administration, Z.G. and J.F.; funding acquisition, Z.G. and M.S. All authors have read and agreed to the published version of the manuscript.
Funding
We are grateful for the financial supported by Ministerial and Provincial Co-Innovation Centre for Endemic Crops Production with High-quality and Efficiency in Loess Plateau (SBGJXTZX-35), the National Natural Science Foundation of China (51879226) and Shanxi Agricultural University Science and Technology Innovation Promotion Project (CXGC2023047).
Data Availability Statement
The datasets supporting the results presented in this manuscript are included within the article.
Conflicts of Interest
The authors declare no conflict of interest. The funders had no role in the design of the study; in the collection, analyses, or interpretation of data; in the writing of the manuscript, or in the decision to publish the results.
References
- Ashraf, M., Harris, P.J.C., 2013. Photosynthesis under stressful environments: an overview. Photosynthetica. 51, 163–190. [CrossRef]
- Zhang, X.D., Kamran, M.H., Xue, X.K., Zhao, J., Cai, T., Jia, Z.K., Zhang, P., Han, Q.F., 2019. Ridge furrow mulching system drives the efficient utilization of key production resources and the improvement of maize productivity in the Loess Plateau of China. Soil Tillage Res. 190, 10–21. [CrossRef]
- Sun, M., Ren, A.X., Gao, Z.Q., Wang, P.R., Mo, F., Xue, L.Z., Lei, M.M., 2018. Long-term evaluation of tillage methods in fallow season for soil water storage, wheat yield and water use efficiency in semiarid southeast of the Loess Plateau. Field Crop. Res. 218, 24–32. [CrossRef]
- Zhang, G.X., Zhang, Y., Liu, S.J., Zhao, D.H., Wen, X.X., Han, J., Liao, Y.C., 2023. Optimizing nitrogen fertilizer application to improve nitrogen use efficiency and grain yield of rainfed spring maize under ridge-furrow plastic film mulching planting. Soil Tillage Res. 229, 105680. [CrossRef]
- Gan, Y.T., Siddique, K.H.M., Turner, N.C., Li, X.G., Niu, J.Y., Yang, C., Liu, L.P., Chai, Q., 2013. Ridge-furrow mulching systems-an innovative technique for boosting crop productivity in semiarid rain-fed environments. Adv Agron. 118, 429–476. [CrossRef]
- Qiang, S.C., Zhang,Y., Fan, J.L., Zhang, F.C., Sun, M., Gao, Z.Q. 2022a. Combined effects of ridge-furrow ratio and urea type on grain yield and water productivity of rainfed winter wheat on the Loess Plateau of China. Agric. Water Manag. 261, 107340. [CrossRef]
- Li, C.J., Wang, C.J., Wen, X.X., Qin, X.L., Liu, Y., Han, J., Li, Y., Liao, Y.C., Wu, W., 2017a. Ridge–furrow with plastic film mulching practice improves maize productivity and resource use efficiency under the wheat–maize double–cropping system in dry semi–humid areas. Field Crop. Res. 203, 201–211. [CrossRef]
- Liu, X.L.,Wang, Y.D., Yan, X.Q., Hou, H.Z., Liu, P., Cai, T., Zhang, P., Jia, Z.K., Ren, X.L., Chen, X.L., 2020. Appropriate ridge-furrow ratio can enhance crop production and resource use efficiency by improving soil moisture and thermal condition in a semiarid region. Agric. Water Manag. 240, 106289. [CrossRef]
- Ali, S., Xu, Y.Y., Ahmad, I., Jia, Q.M., Ma, X,C., Sohail, A., Manzoor,, Arif, M., Ren, X.L., Cai, T., Zhang, J.H., Jia, Z.K., 2019. The ridge-furrow system combined with supplemental irrigation strategies to improves radiation use efficiency and winter wheat productivity in semiarid regions of China. Agric. Water Manag. 213, 76–86. [CrossRef]
- Liao, Z.Q., Zhang, K.B., Fan, J.L., Li, Z.J., Zhang, F.C., Wang, X.K., Wang, H.D., Cheng, M.H., Zou, Y.F., 2022. Ridge-furrow plastic mulching and dense planting with reduced nitrogen improve soil hydrothermal conditions, rainfed soybean yield and economic return in a semi-humid drought-prone region of China. Soil Tillage Res. 217, 105291. [CrossRef]
- Ren, X., Cai, T., Chen, X., Zhang, P., Jia, Z., 2016. Effect of rainfall concentration with different ridge widths on winter wheat production under semiarid climate. Eur. J. Agron. 77, 20–27. [CrossRef]
- Mo, F., Wang, J.Y., Zhou, H., Luo, C.L., Zhang, X.F., Li, X.Y., Li, F.M., Xiong, L.B., Kavagi, L., Nguluu, S.N., Xiong, Y.C., 2017. Ridge-furrow plastic-mulching with balanced fertilization in rainfed maize (Zea mays L.): an adaptive management in east African Plateau. Agric. For. Meteorol. 236, 100–112. [CrossRef]
- Li, W.W., Wen, X.X., Han, J., Liu, Y., Wu, W., Liao, Y.C., 2017b. Optimum ridge-to-furrow ratio in ridge-furrow mulching systems for improving water conservation in maize (Zea may L.) production. Environ. Sci. Pollut. R. 24, 23168–23179. [CrossRef]
- Yan, S.C., Wu, Y., Fan, J.L., Zhang, F.C., Guo, J.J., Zheng, J., Wu, L.F., Lu, J.S., 2022. Quantifying nutrient stoichiometry and radiation use efficiency of two maize cultivars under various water and fertilizer management practices in northwest China. Agric. Water Manag. 271, 107772. [CrossRef]
- Qiang, S.C., Zhang,Y., Zhao, H., Fan, J.L., Zhang, F.C., Sun, M., Gao, Z.Q. 2022b. Combined effects of urea type and placement depth on grain yield, water productivity and nitrogen use efficiency of rain-fed spring maize in northern China. Agric. Water Manag. 262. 107442. [CrossRef]
- Elgharably, A., Benes, S., 2021. Alfalfa biomass yield and nitrogen fixation in response to applied mineral nitrogen under saline soil conditions. J. Soil Sci. Plant Nutr. 21, 744–755. [CrossRef]
- Zhang, H., Jing, W.J., Zhao, B.H., Wang, W.L., Xu, Y.J., Zhang, W.Y., Gu, J.F., Liu, L.J., Wang, Z.Q., Yang, J.C., 2021. Alternative fertilizer and irrigation practices improve rice yield and resource use efficiency by regulating source-sink relationships. Field Crop. Res. 265, 108124. [CrossRef]
- Liu, Q.F., Chen, Y., Liu, Y., Wen, X.X., Liao, Y.C., 2016. Coupling effects of plastic film mulching and urea types on water use efficiency and grain yield of maize in the Loess Plateau, China. Soil Tillage Res.157, 1–10. [CrossRef]
- Guo, J.J., Fan, J.L., Zhang, F.C., Yan, S.C., Zheng, J., Wu, Y., Li, J., Wang, Y.L., Sun, X., Liu, X.Q., Xiang, Y.Z., Li, Z.J., 2021. Blending urea and slow-release nitrogen fertilizer increases dryland maize yield and nitrogen use efficiency while mitigating ammonia volatilization. Sci. Total Environ. 790, 148058. [CrossRef]
- Kamran, M., Yan, Z.G., Jia, Q.M., Chang, S.H., Ahmad, I., Ghani, M.U., Hou, F.J., 2022. Irrigation and nitrogen fertilization influence on alfalfa yield, nutritive value, and resource use efficiency in an arid environment. Field Crops Res. 284, 108587. [CrossRef]
- Zadoks, J.C., Chang, T.T., Konzak, C.F., 1974. A decimal code for the growth stages of cereals. Weed Res. 14, 415–421.
- Birch, C.J., Vos, J., Van Der Putten, P.E.L., 2003. Plant development and leaf area production in contrasting cultivars of maize grown in a cool temperate environment in the field. Eur. J. Agron. 19, 173–188. [CrossRef]
- McMaster, G.S., Wilhem, W.W., 1997. Growing degree days: one equation, two interpretations. Agric. For. Meteorol. 87, 291–300.
- Subrahmaniyan, K., Veeramani, P., Harisudan, C., 2018. Heat accumulation and soil properties as affected by transparent plastic mulch in Blackgram (Vigna mungo) doubled cropped with groundnut (Arachis hypogaea) in sequence under rainfed conditions in Tamil Nadu, India. Field Crops Res. 219, 43–54. [CrossRef]
- Kiniry, J.R., Sanderson, M.A., Williams, J.R., 1996. Simulating Alamo switchgrass with the ALMANAC model. Agron J. 88(4) : 602–606. [CrossRef]
- Stone, P.J., Wilson, D.R., Reid, J.B., Gillespie, R.N., Stone, P.J., Wilson, D.R., 2000. Water deficit effects on sweet corn, water use, radiation use efficiency, growth, and yield. Crop Pasture Sci. 52, 103–113.
- Mwale, S.S., Azam-Ali, S.N., Massawe, F.J., 2007. Growth and development of bambara groundnut (Vigna subterranea) in response to soil moisture. 2. Resource capture and conversion. Eur. J. Agron. 26, 354–362.
- Hou, F.Y., Zhang, L.M., Xie, B.T., Dong, S.X., Zhang, H.Y., Li, A.X., Wang, Q.M., 2015. Effect of plastic mulching on the photosynthetic capacity, endogenous hormones and root yield of summer-sown sweet potato (Ipomoea batatas (L). Lam.) in Northern China. Acta Physiol. Plant. 37, 1–10. [CrossRef]
- Liu, Y., Yang, S.J., Li, S.Q., Chen, X.P., Chen, F., 2010. Growth and development of maize (Zea mays L.) in response to different field water management practices: resource capture and use efficiency. Agric. For. Meteorol. 150, 606–613. [CrossRef]
- Mu, H.D., Jiang, B., Wollenweber, B., Dai, T., Jing, Q., Cao, W., 2010. Long-term low radiation decreases leaf photosynthesis, photochemical efficiency and grain yield in winter wheat. J. Agron. Crop Sci. 196, 38–47. [CrossRef]
- Jia, Q.M., Yang, L.Y., An, H.Y., Dong, S., Chang, S.H., Zhang, C., Liu, Y.J, Hou, F.J., 2020. Nitrogen fertilization and planting models regulate maize productivity, nitrate and root distributions in semi-arid regions. Soil Tillage Res. 200:104636. [CrossRef]
- Li, Y.Z., Yang, J.B., Shi, Z., Pan, W.H., Liao, Y.C., Li, T., Qin, X.L., 2021. Response of root traits to plastic film mulch and its effects on yield. Soil Tillage Res. 209, 104930. [CrossRef]
- Bu, L.D., Liu, J.L., Zhu, L., Luo, S.S., Chen, X.P., Li, S.Q., Lee Hill, R., Zhao, Y., 2013. The effects of mulching on maize growth, yield and water use in a semi-arid region. Agric. Water Manag. 123, 71–78. [CrossRef]
- O’Connell, M., O’Leary, G., Whitfield, D., Connor, D., 2004. Interception of photosynthetically active radiation and radiation-use efficiency of wheat, field pea and mustard in a semi-arid environment. Field Crops Res. 85, 111–124. [CrossRef]
- Negin, B., Moshelion, M., 2016. The evolution of the role of ABA in the regulation of water use efficiency: from biochemical mechanisms to stomatal conductance. Plant Sci. 251, 82–89. [CrossRef]
- Jia, Q.M., Chen, K.Y., Chen, Y.Y., Ali, S., Manzoor Sohail, A., Fahad, S., 2018. Mulch covered ridges affect grain yield of maize through regulating root growth and root bleeding sap under simulated rainfall conditions. Soil Tillage Res. 175, 101–111. [CrossRef]
- Yu, S.B., Khan, S., Mo, F., Ren, A.X., Lin, W., Feng, Y., Dong, S.F., Ren, J., Wang, W.X., Noor, H., Yang, Z.P., Sun, M., Gao, Z.Q., 2021. Determining optimal nitrogen input rate on the base of fallow season precipitation to achieve higher crop water productivity and yield. Agric. Water Manag. 246, 106689. [CrossRef]
- Yang, W.J., Li, Y.L., Liu, W.J., Wang, S.W., Yin, L.N., Deng, X.P., 2021. Sustainable high yields can be achieved in drylands on the Loess Plateau by changing water use patterns through integrated agronomic management. Agric. For. Meteorol. 296, 108210. [CrossRef]
Figure 1.
The monthly precipitation and solar radiation at the experimental site during the three consecutive growing seasons (2018–2019, 2019–2020, and 2020–2021) of rain-fed winter wheat.
Figure 1.
The monthly precipitation and solar radiation at the experimental site during the three consecutive growing seasons (2018–2019, 2019–2020, and 2020–2021) of rain-fed winter wheat.
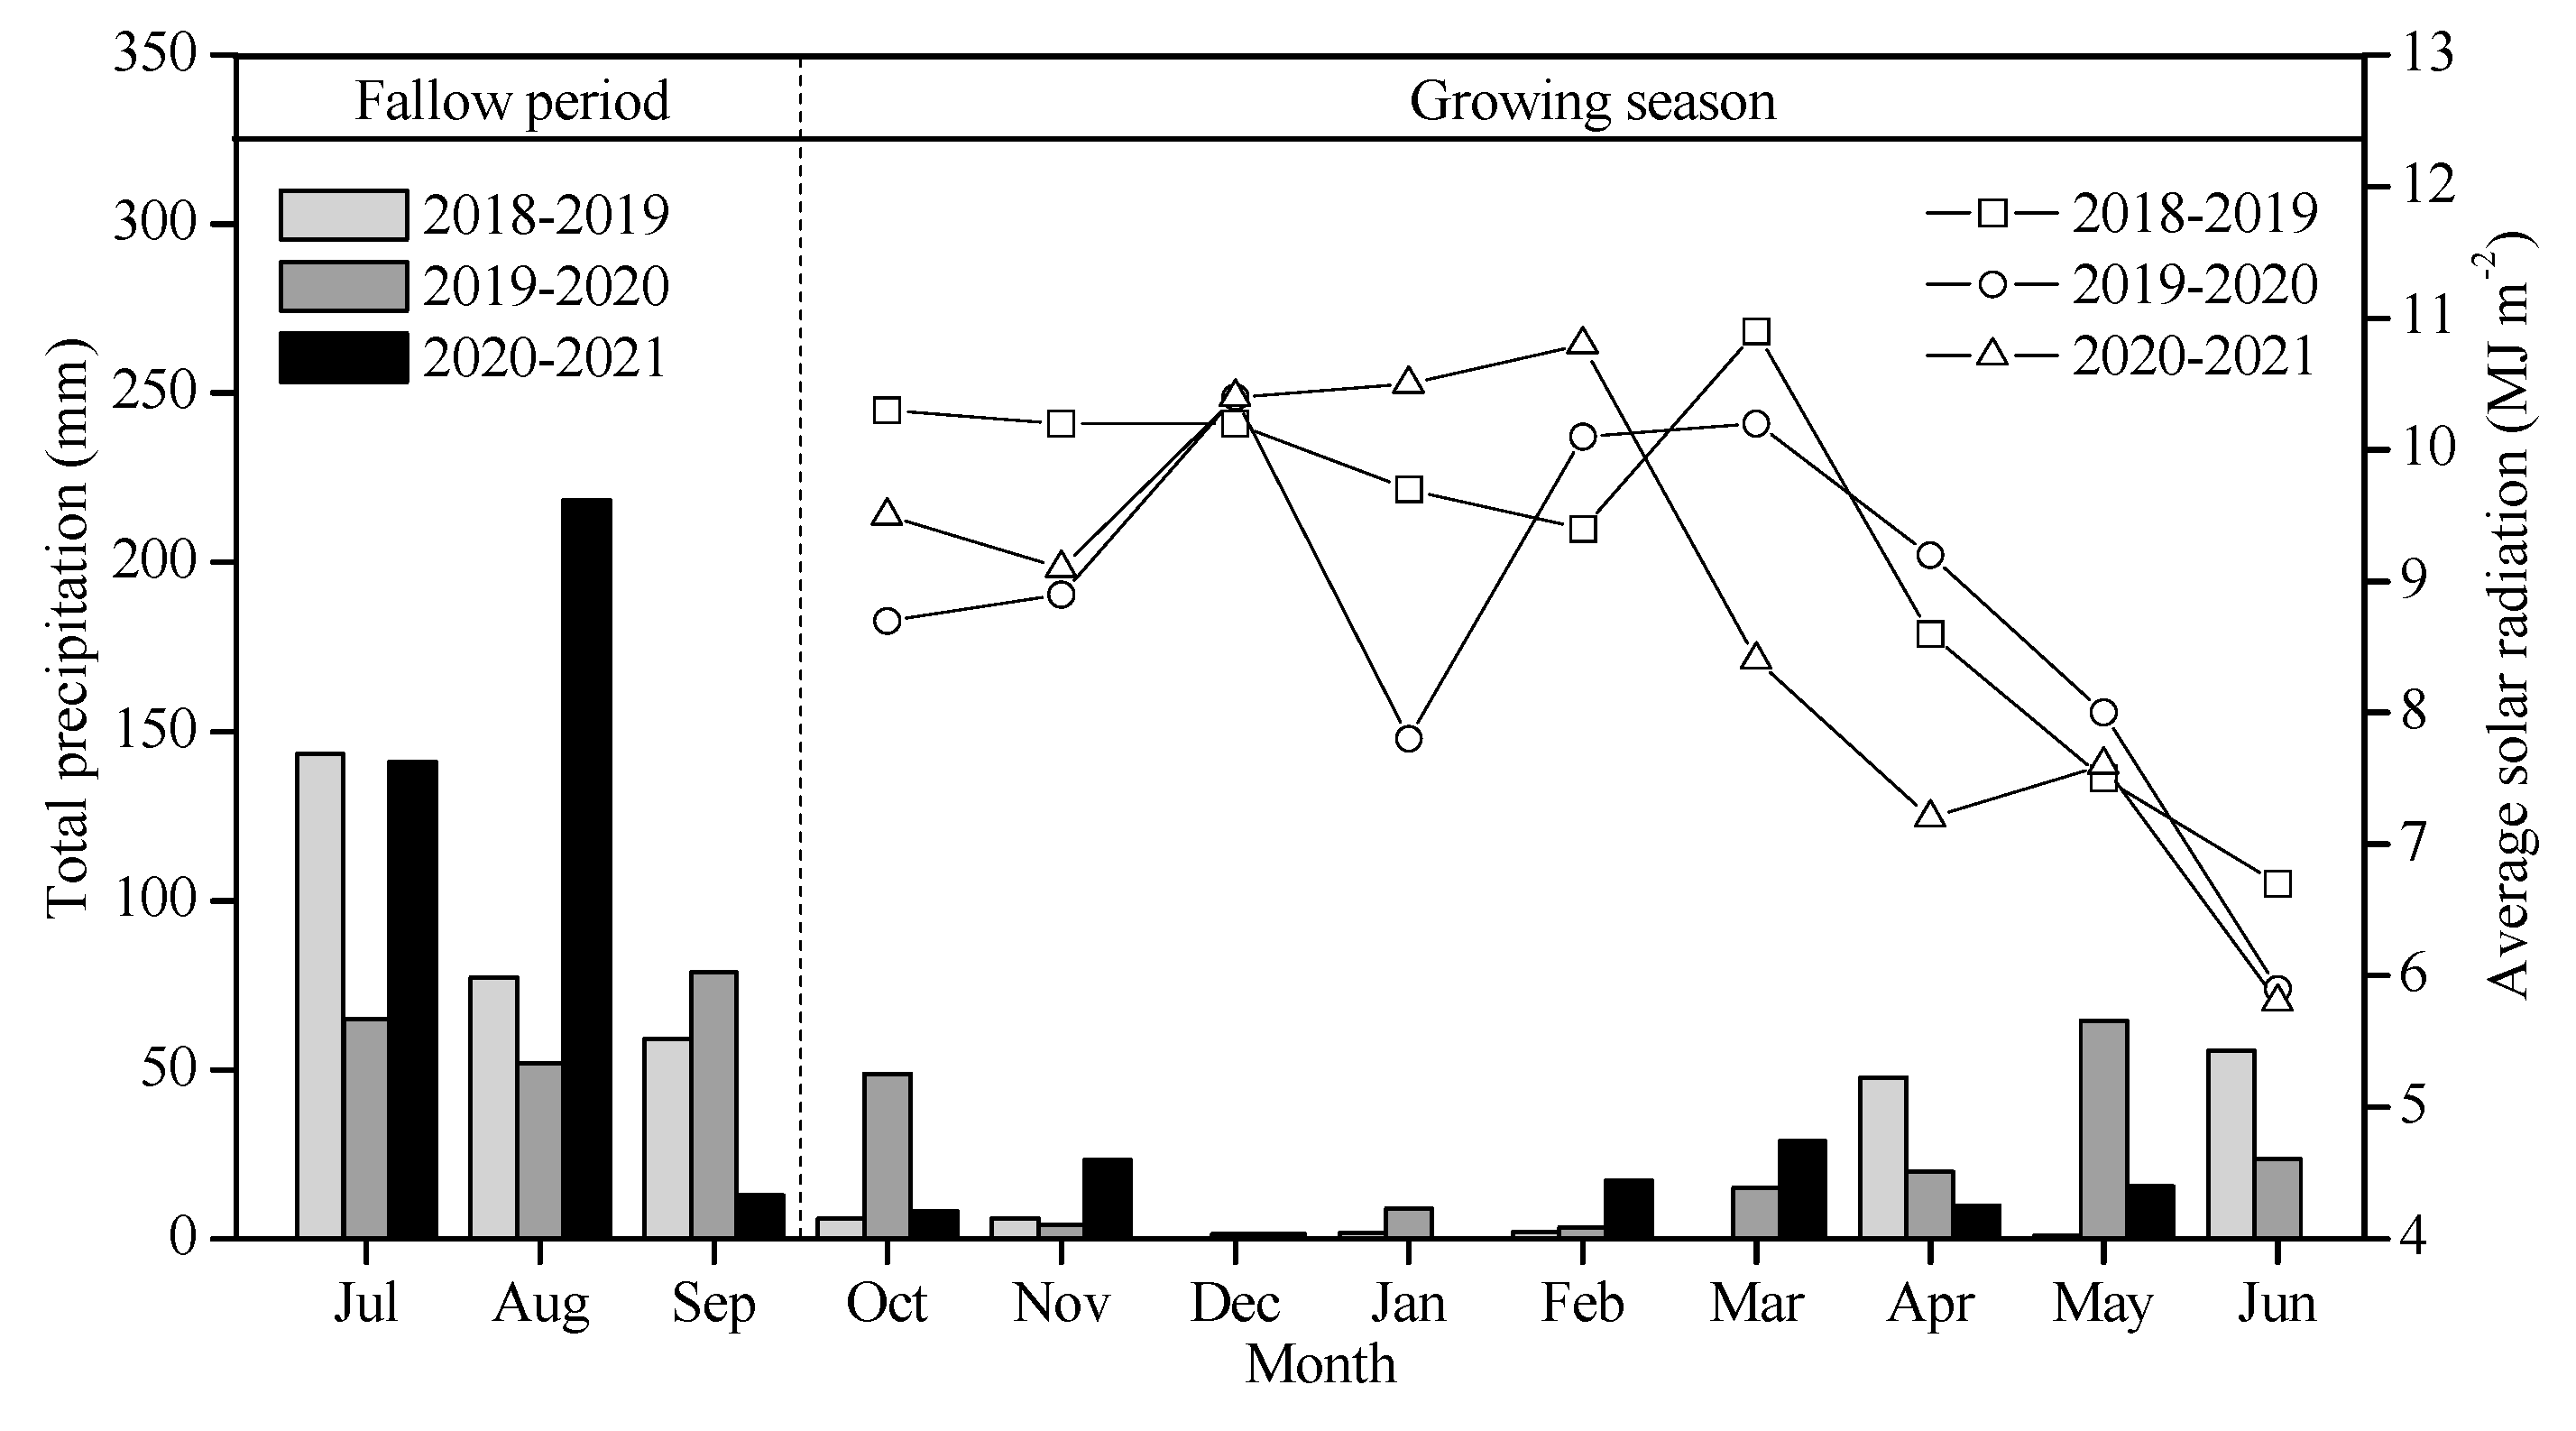
Figure 2.
Field schematic diagrams for four planting patterns (F, R2F4, R4F4, and R6F4) and its unit sizes of rain-fed winter wheat.
Figure 2.
Field schematic diagrams for four planting patterns (F, R2F4, R4F4, and R6F4) and its unit sizes of rain-fed winter wheat.
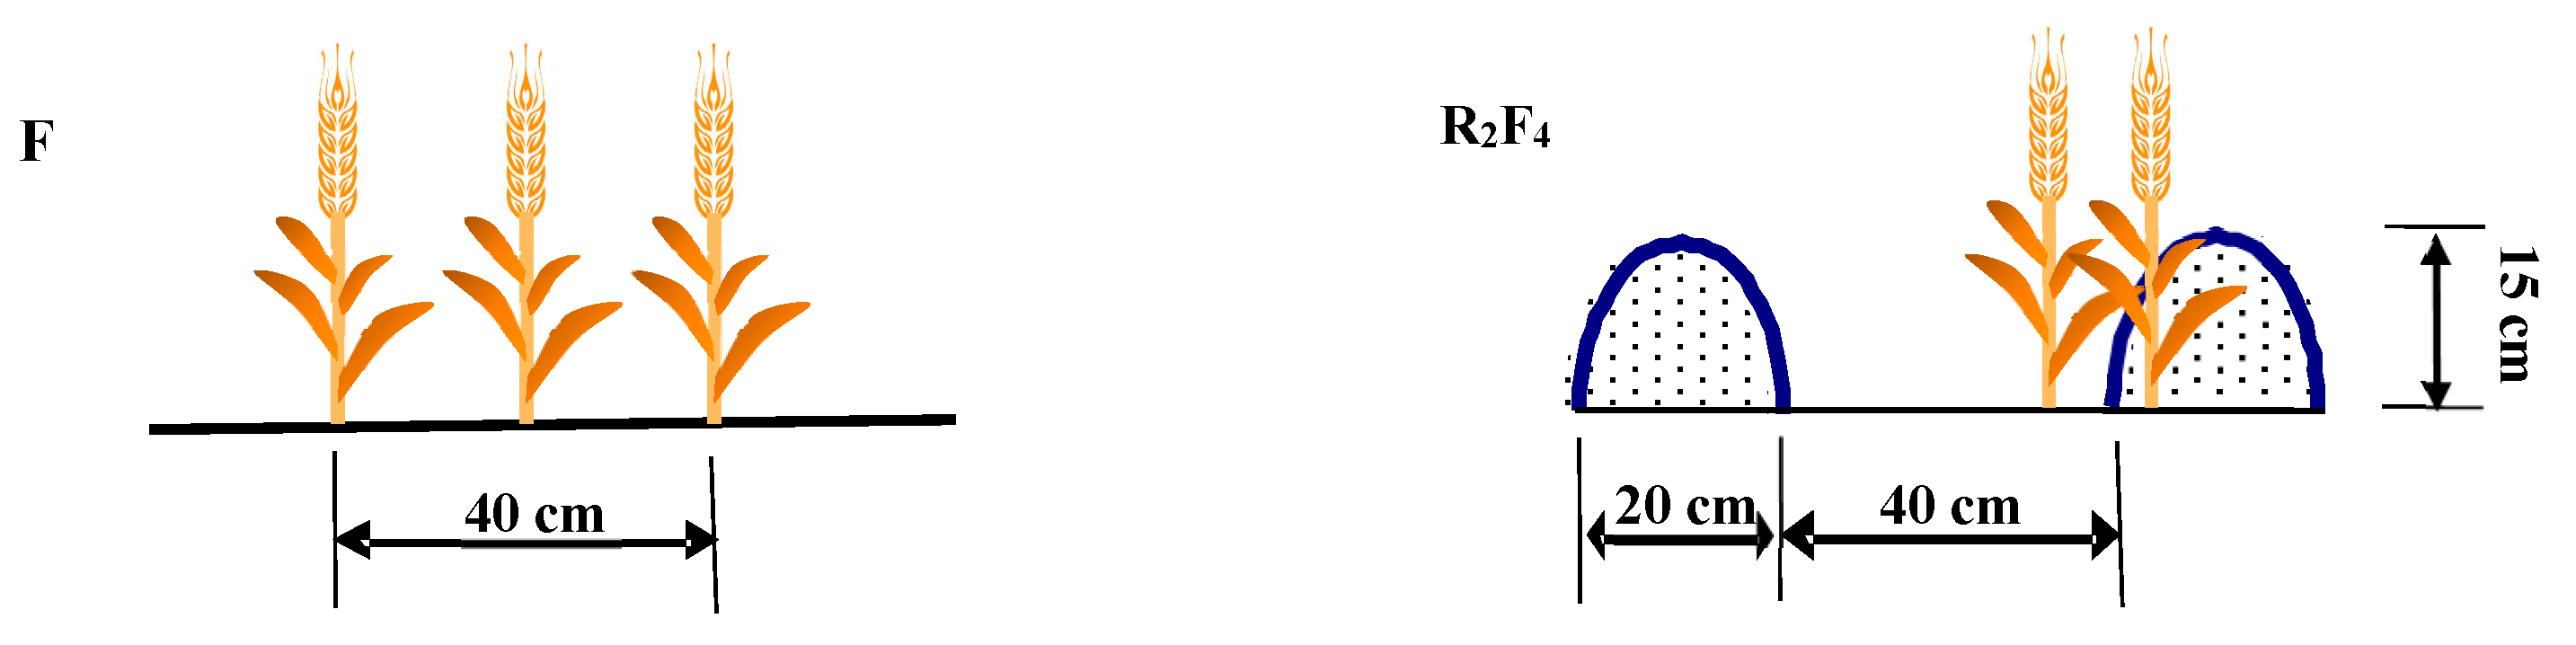
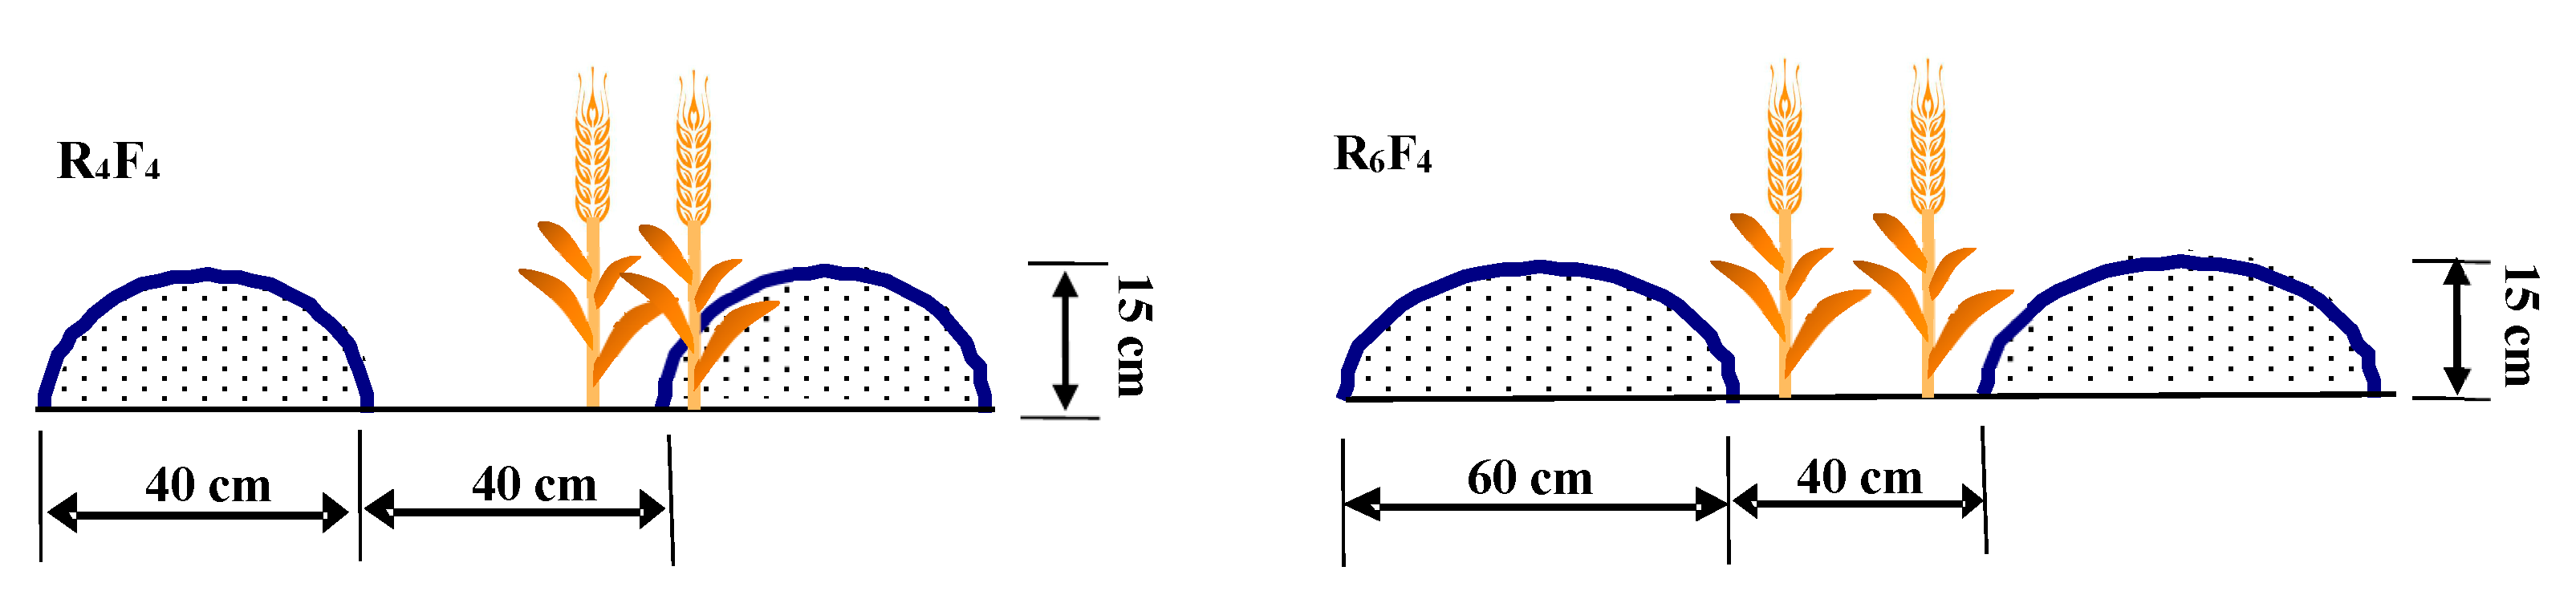
Figure 3.
Dynamic of dry matter accumulation for the two nitrogen fertilizer types (TU and CRU) under four planting patterns (F, R2F4, R4F4, and R6F4) over three wheat growing seasons of 2018–2019 (a), 2019–2020 (b), and 2020–2021 (c). Bars are LSDs at P ≤ 0.05.
Figure 3.
Dynamic of dry matter accumulation for the two nitrogen fertilizer types (TU and CRU) under four planting patterns (F, R2F4, R4F4, and R6F4) over three wheat growing seasons of 2018–2019 (a), 2019–2020 (b), and 2020–2021 (c). Bars are LSDs at P ≤ 0.05.
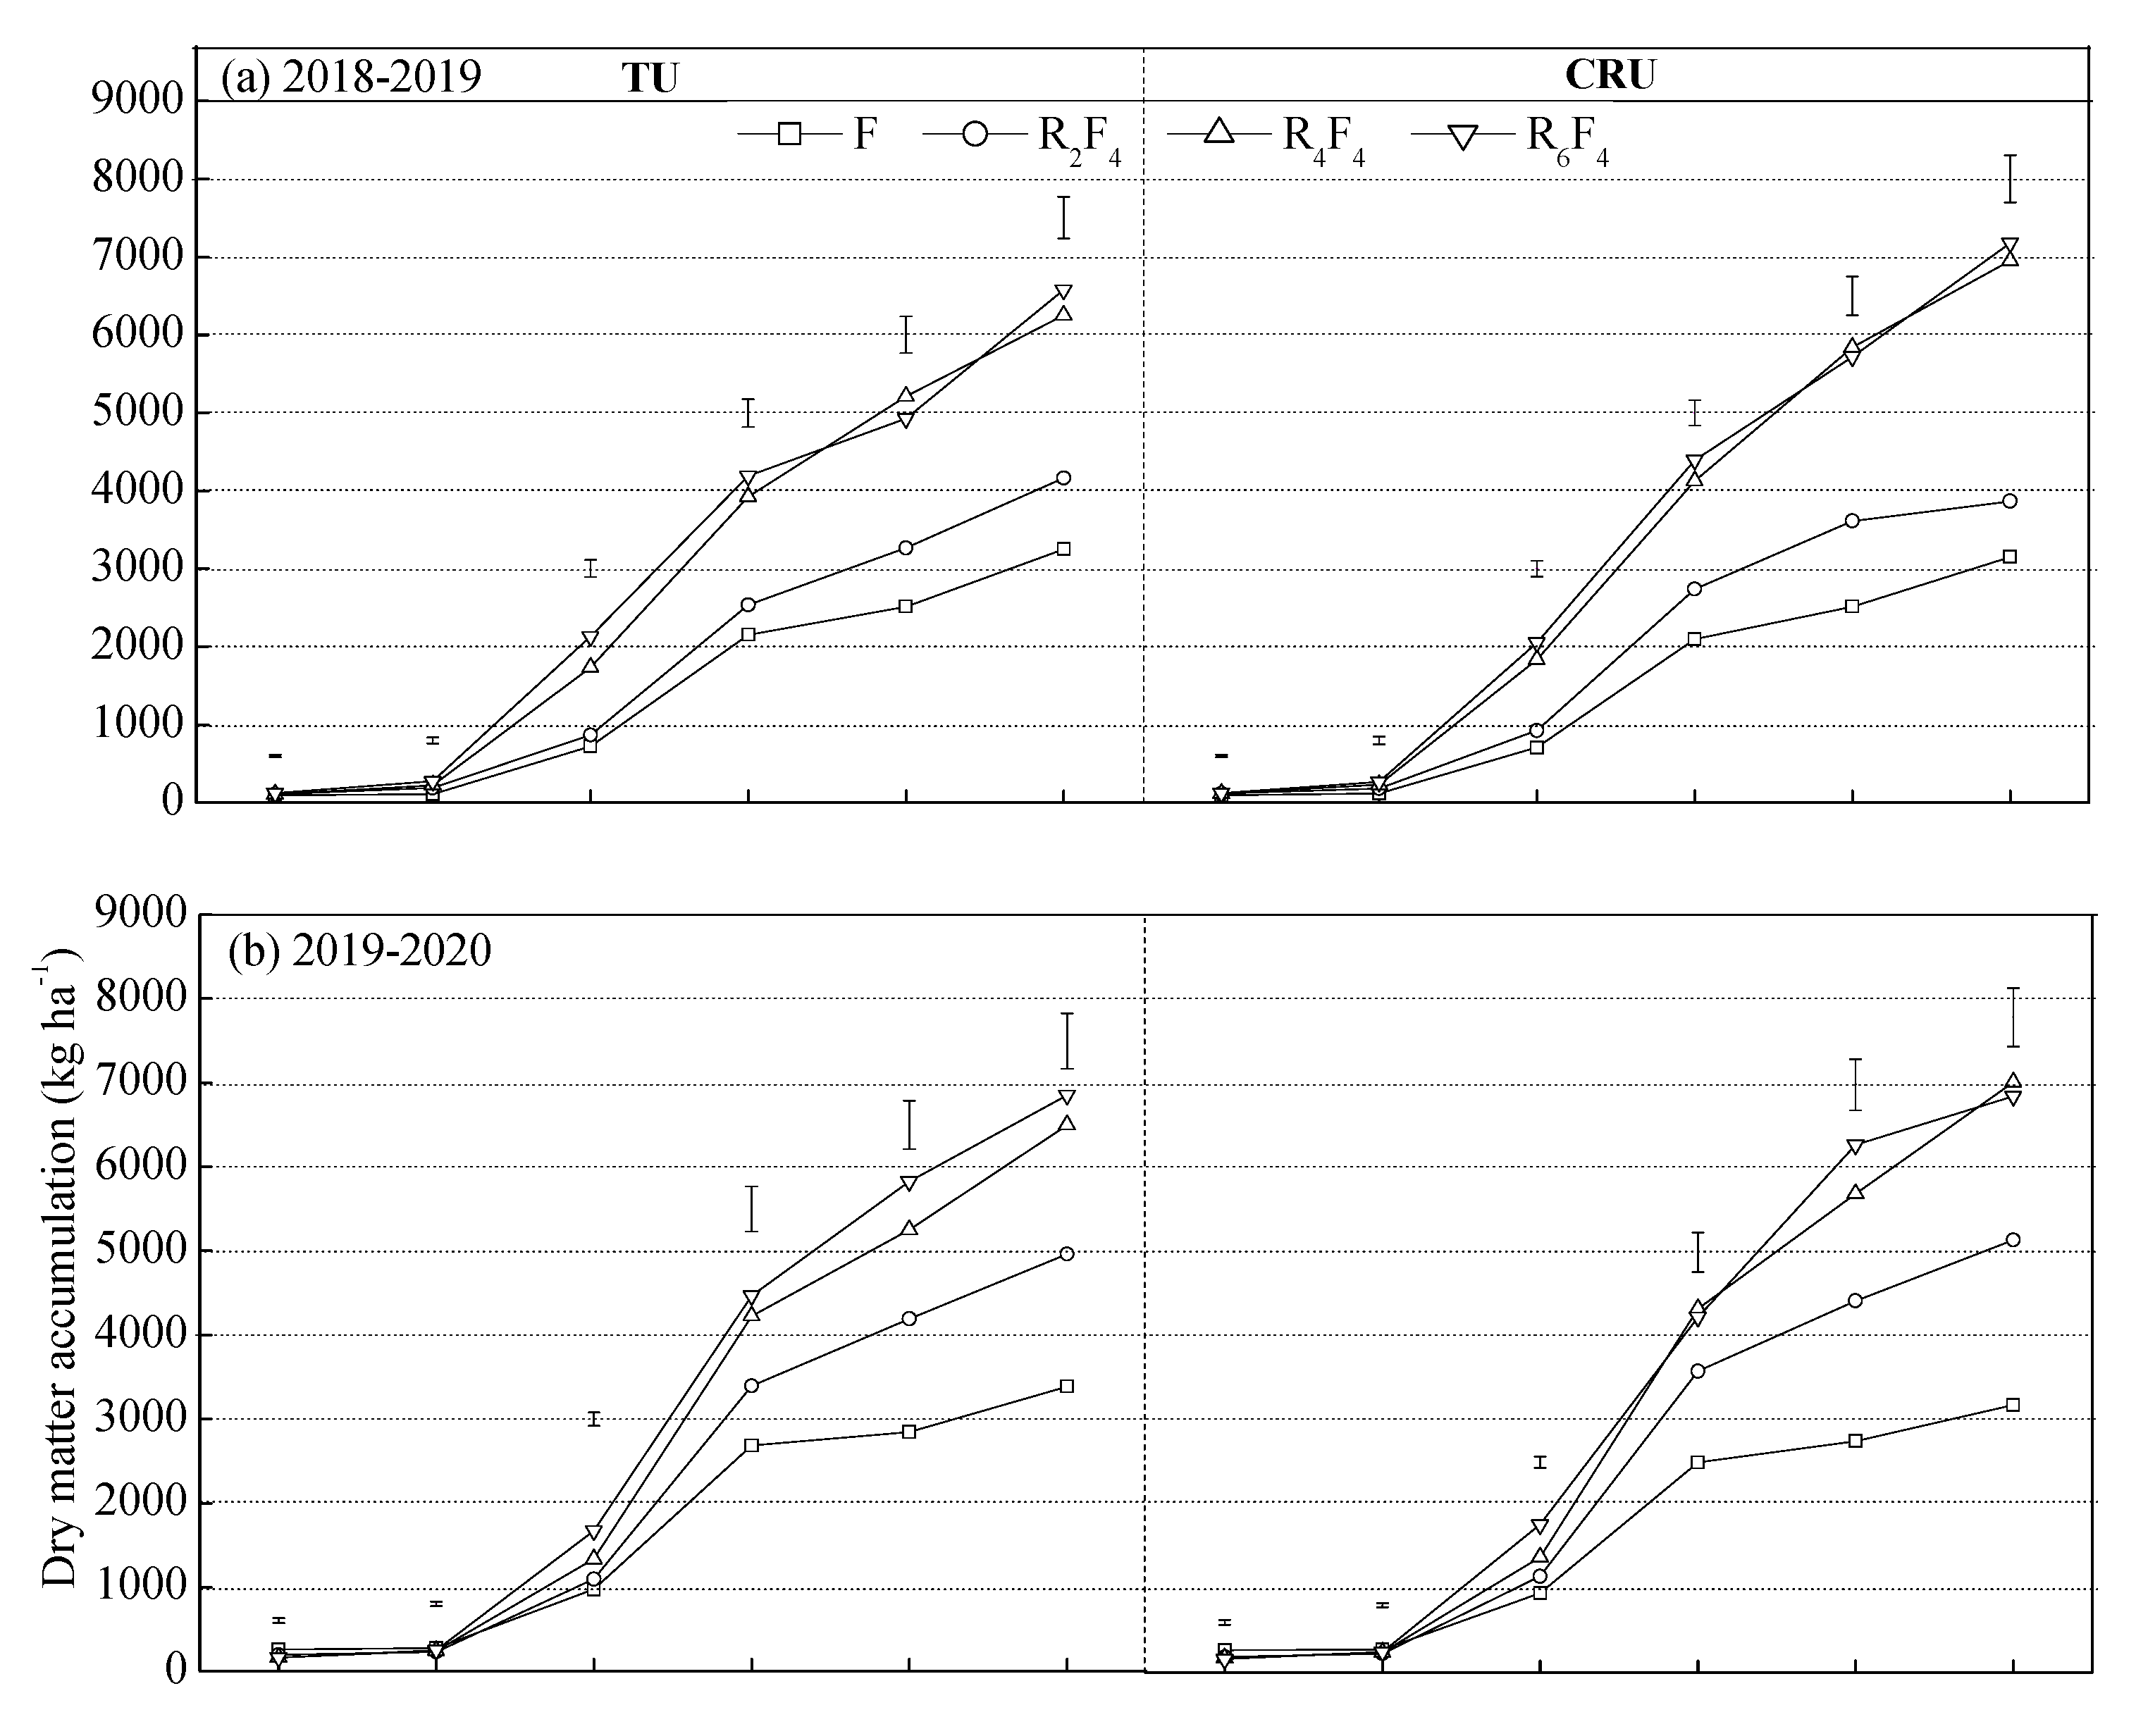
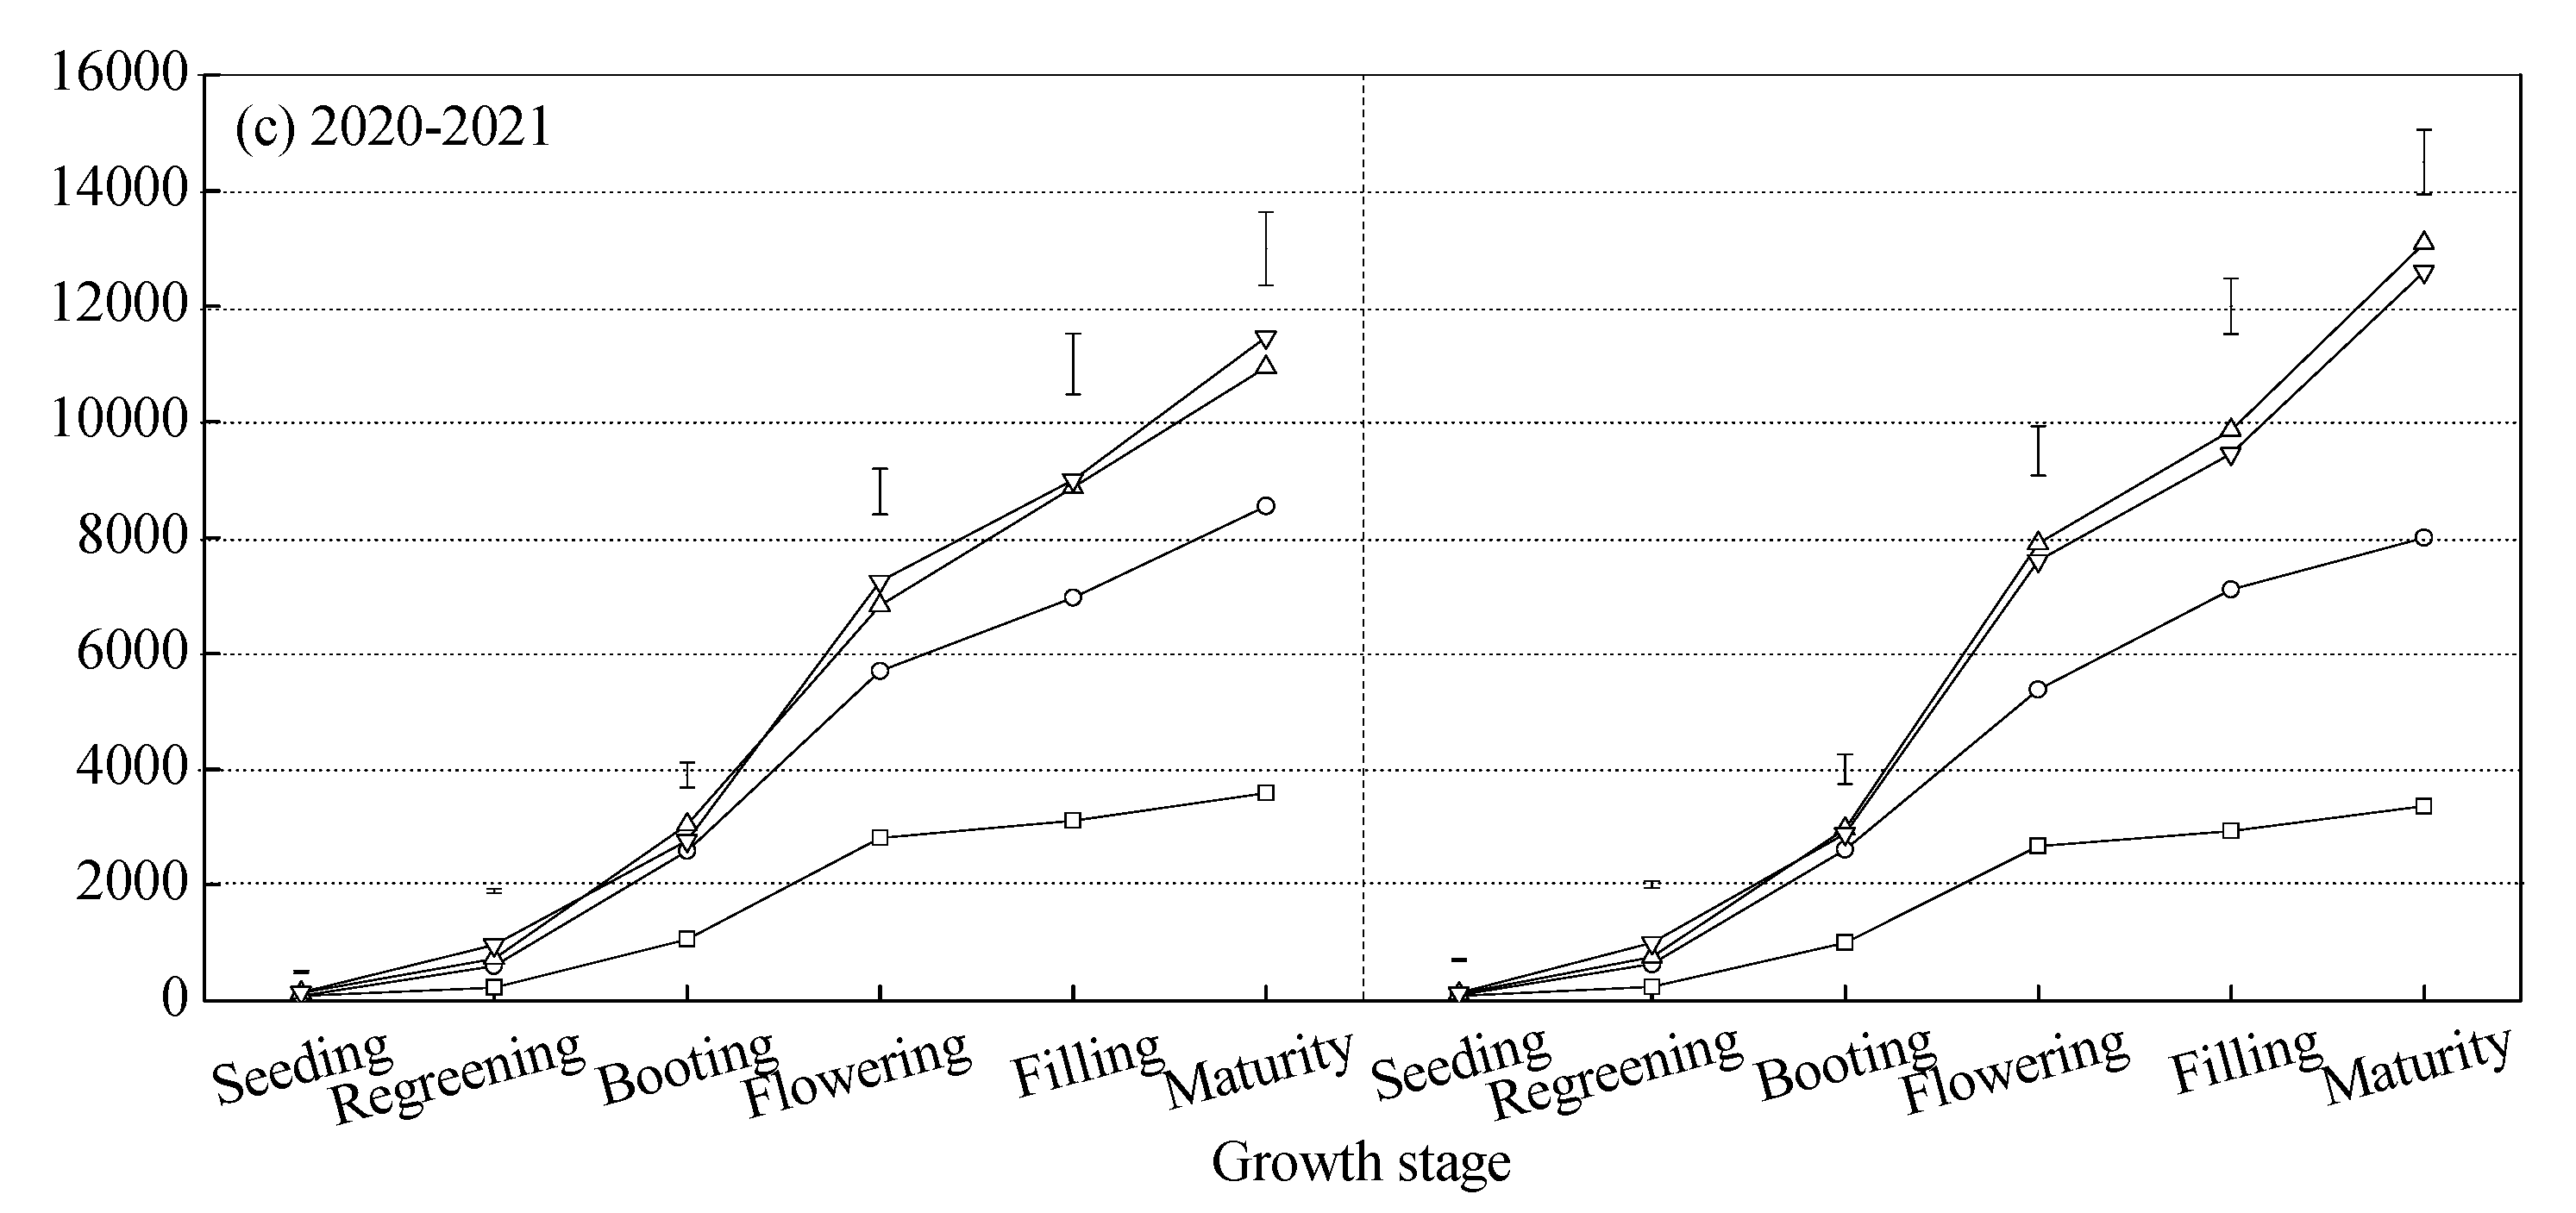
Figure 4.
Dynamic of leaf area index for the two nitrogen fertilizer types (TU and CRU) under four planting patterns (F, R2F4, R4F4, and R6F4) over three wheat growing seasons of 2018–2019 (a), 2019–2020 (b), and 2020–2021 (c). Bars are LSDs at P ≤ 0.05.
Figure 4.
Dynamic of leaf area index for the two nitrogen fertilizer types (TU and CRU) under four planting patterns (F, R2F4, R4F4, and R6F4) over three wheat growing seasons of 2018–2019 (a), 2019–2020 (b), and 2020–2021 (c). Bars are LSDs at P ≤ 0.05.
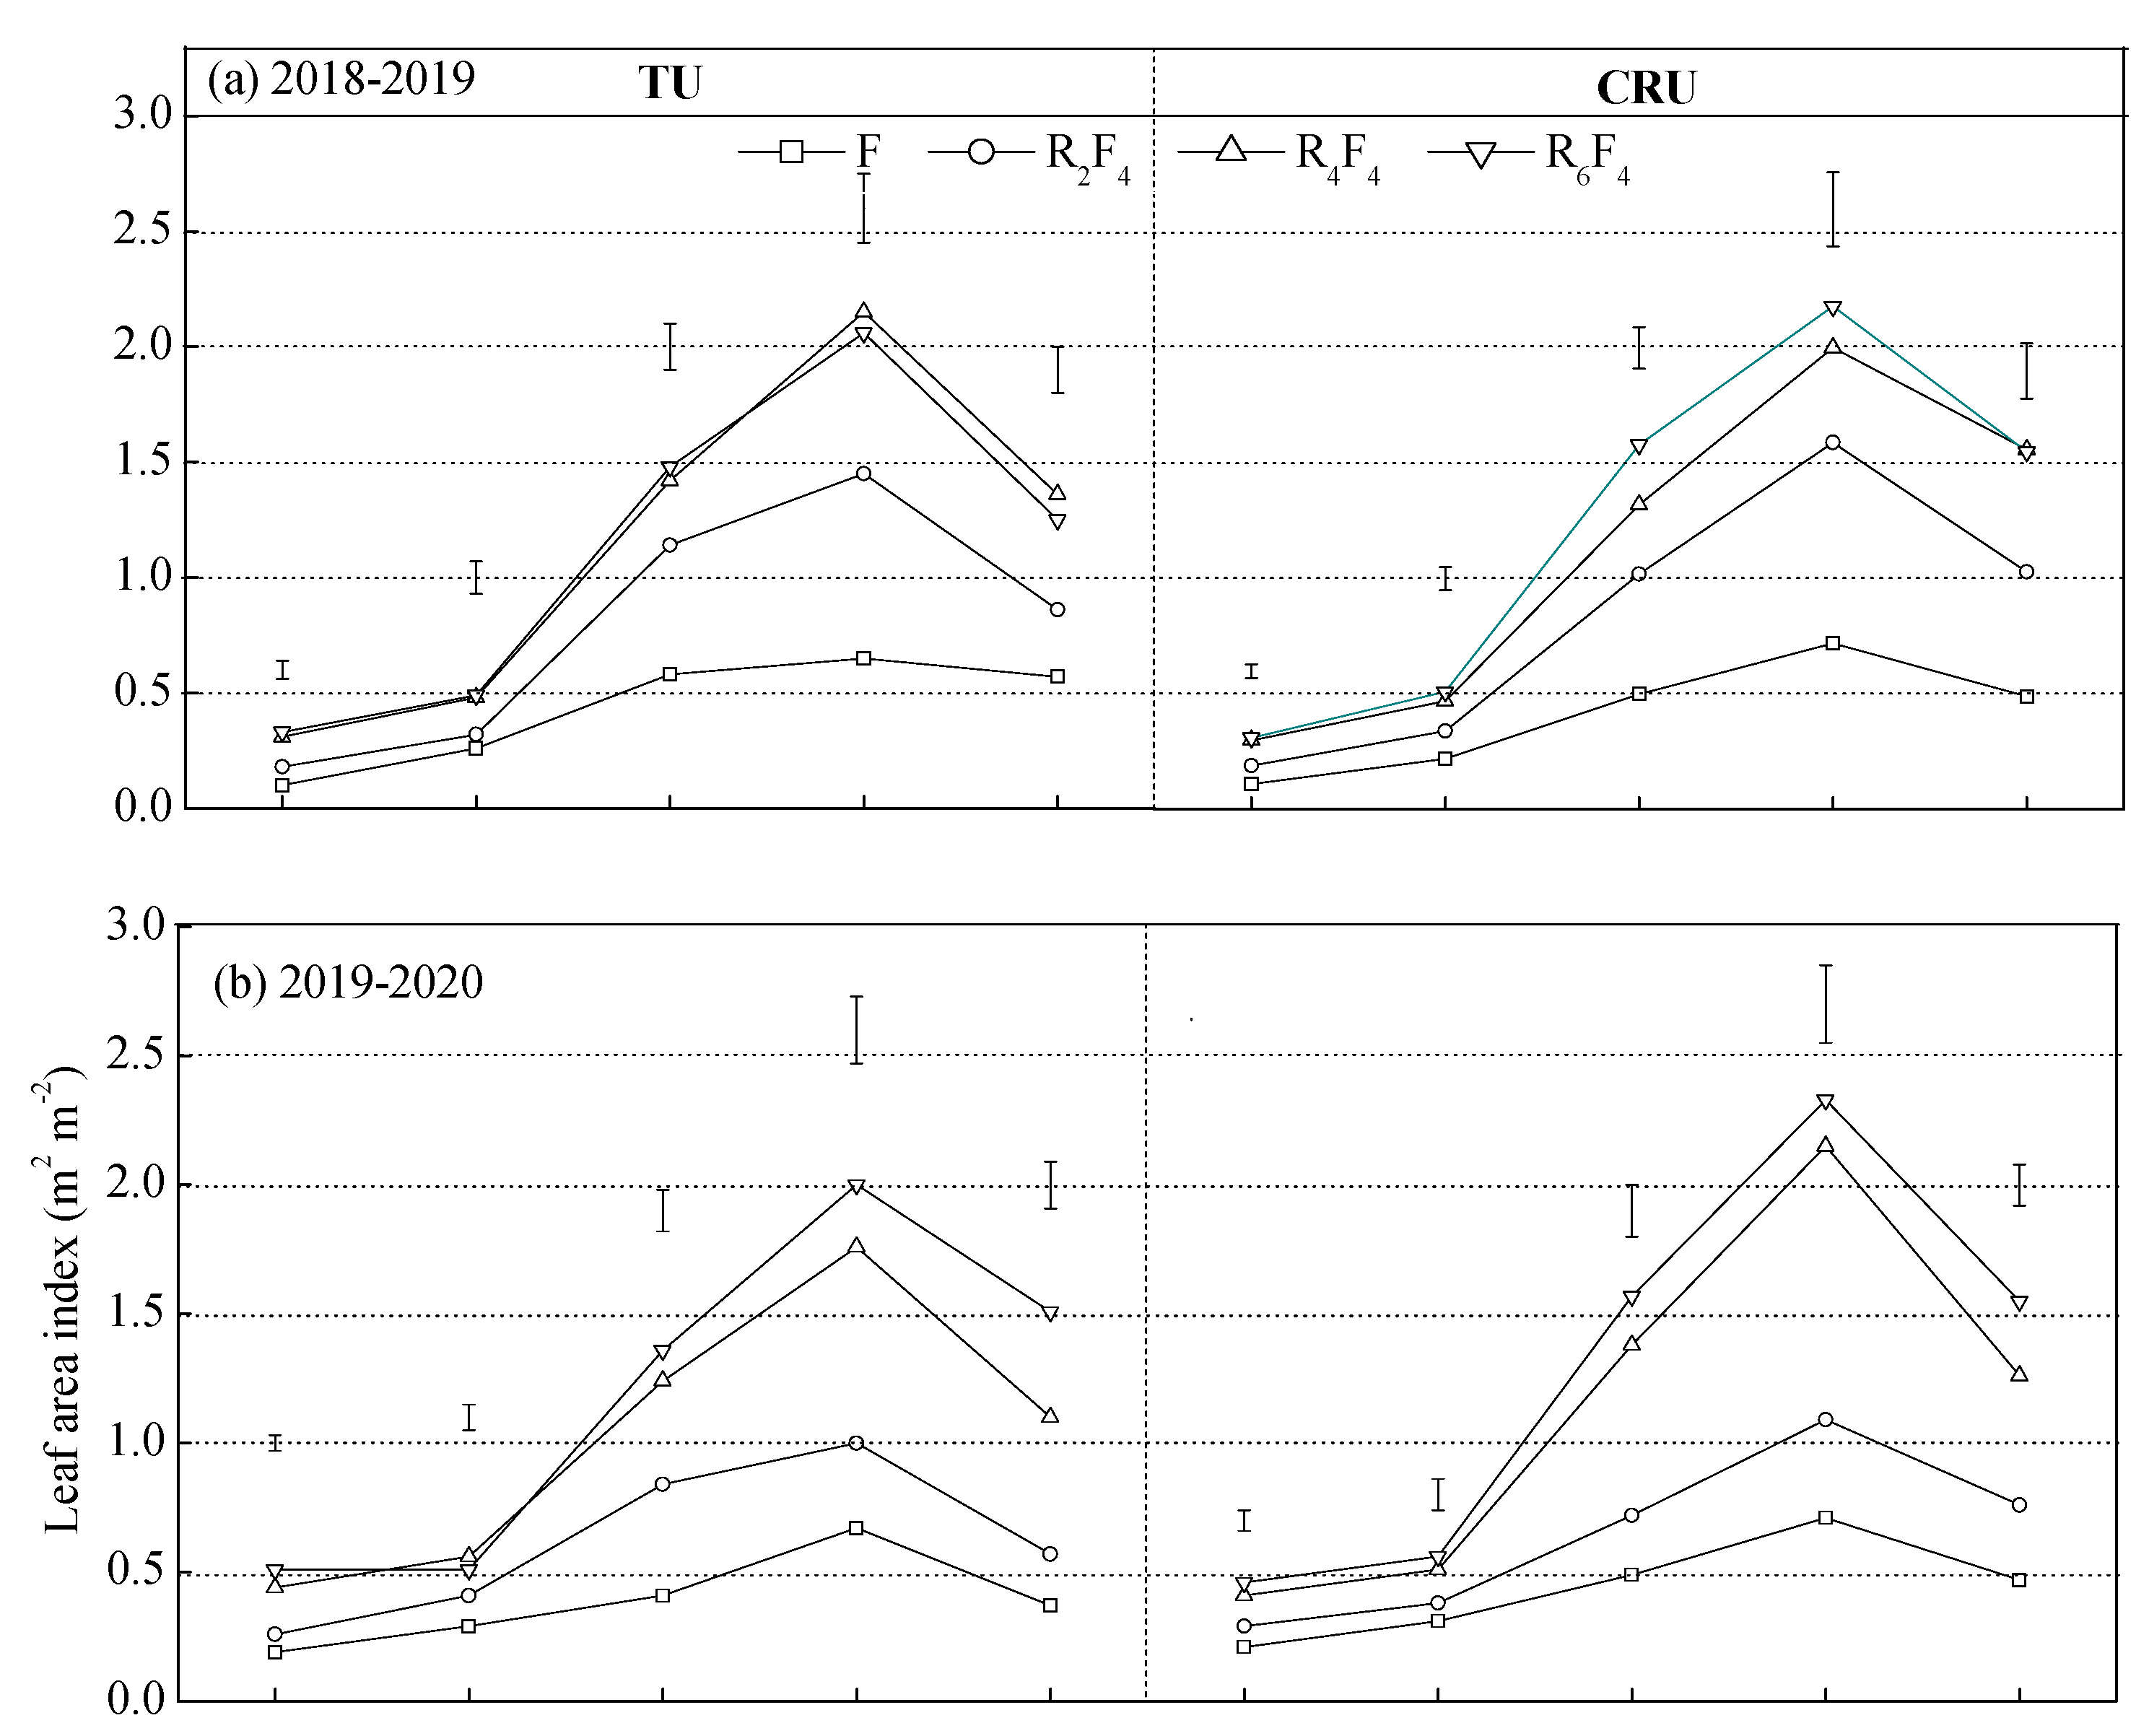
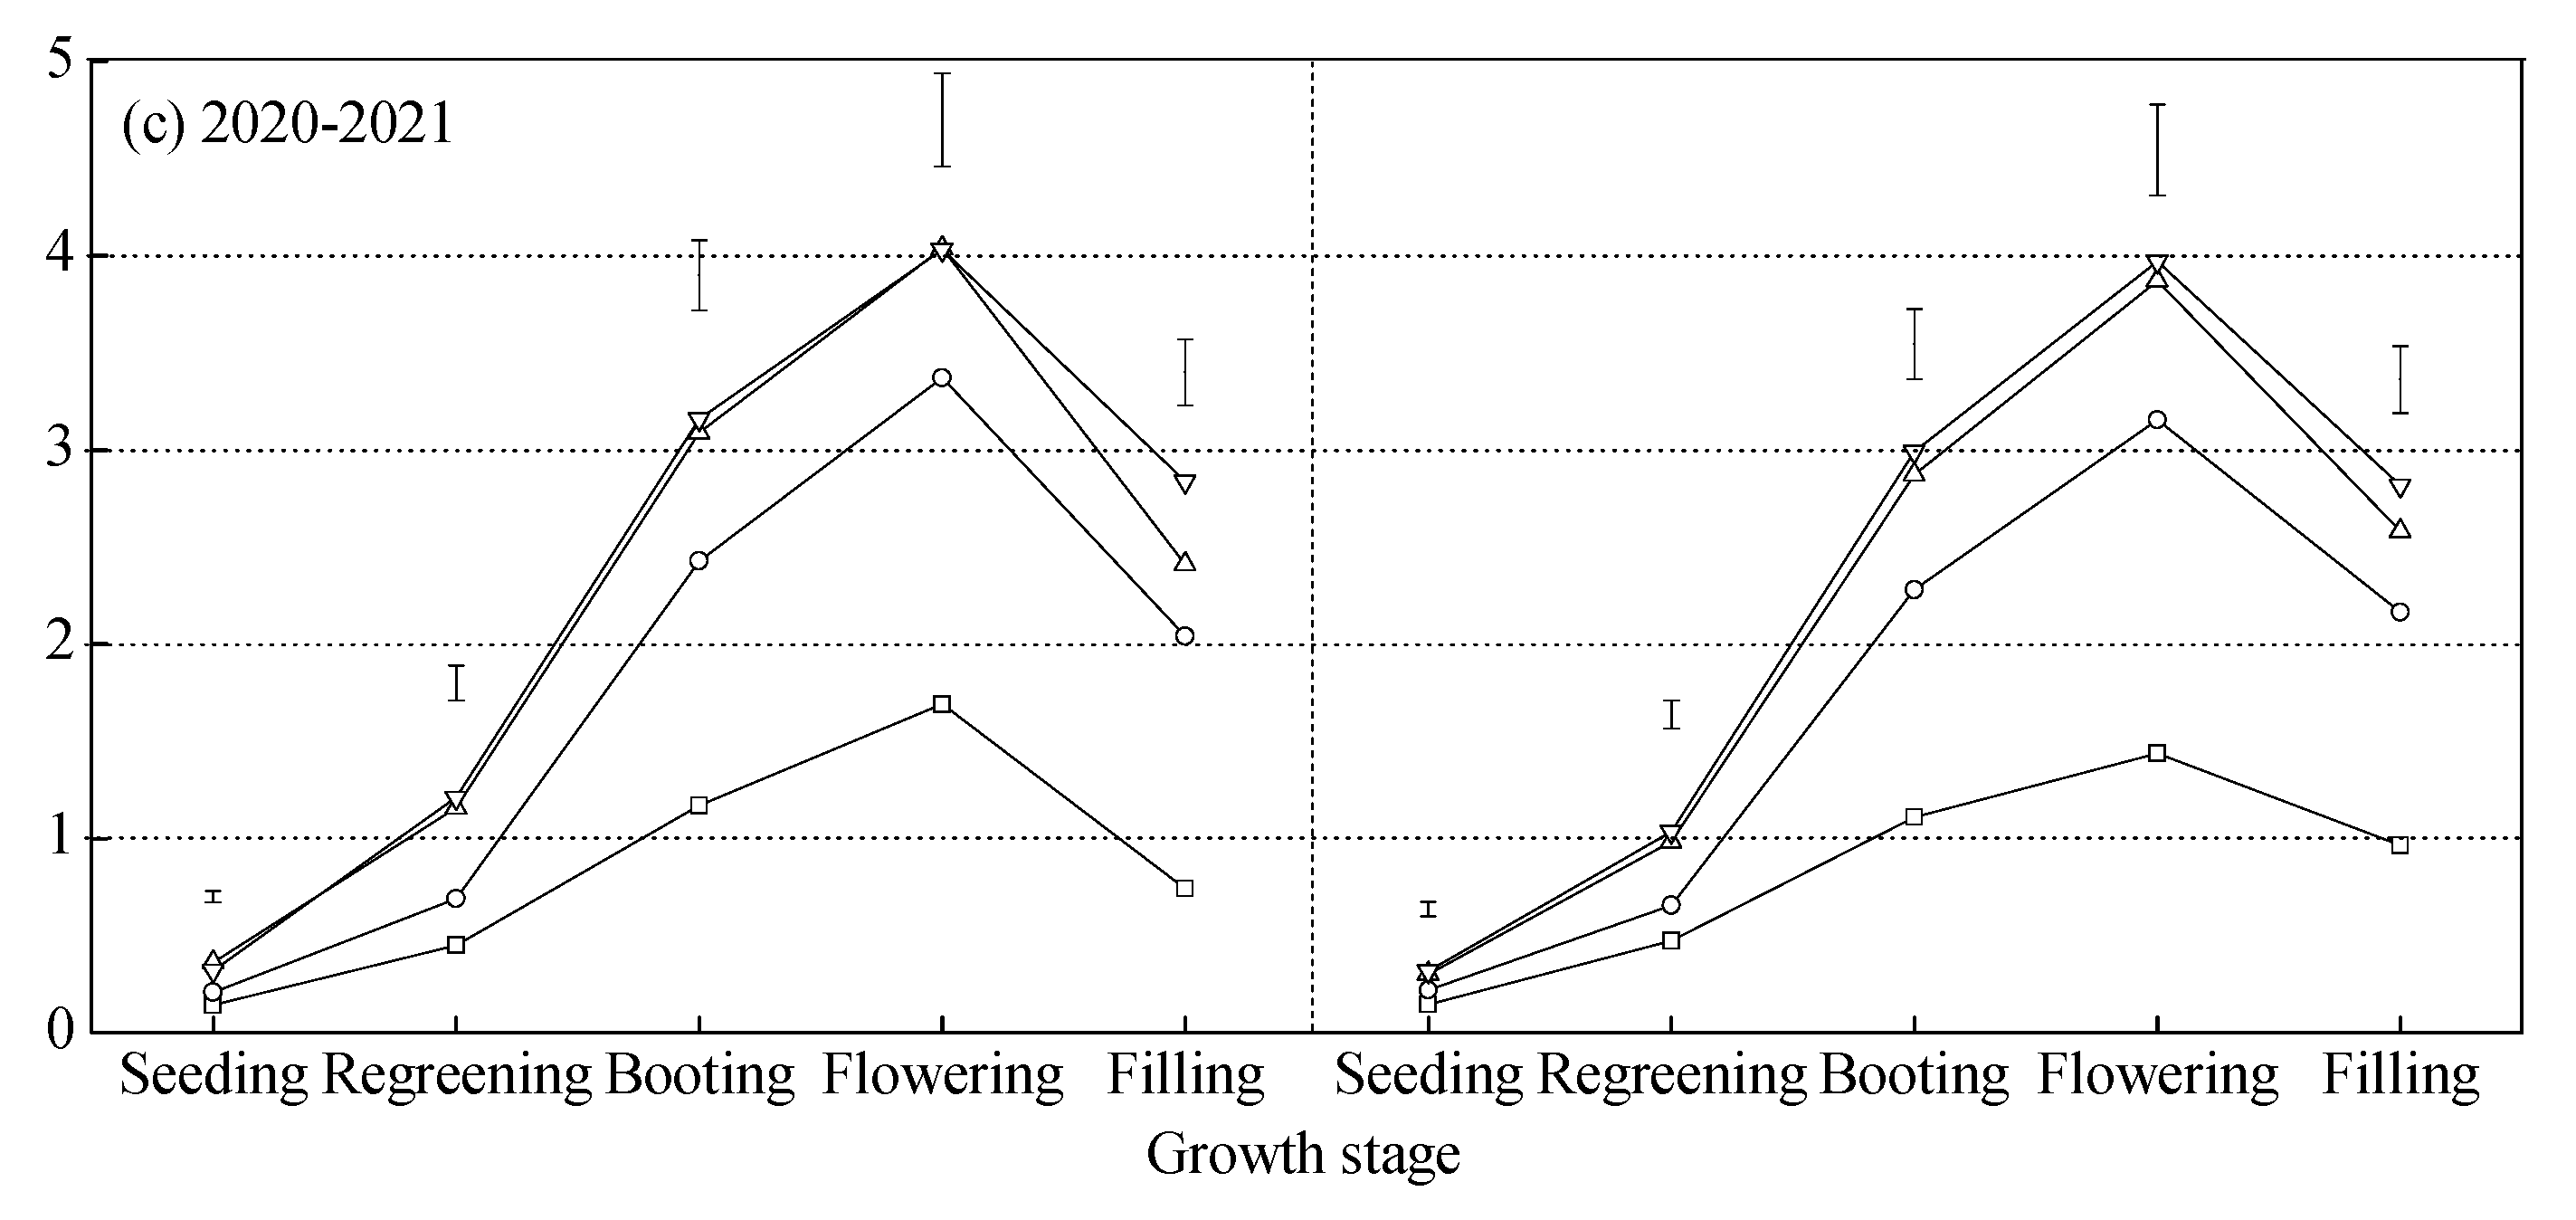
Figure 5.
Effect of two nitrogen fertilizer types (NT) and four planting patterns (P) on days from the sowing date to seedling emergence (So-Se), from seedling emergence to the re-greening stage (Se-Re), from the re-greening stage to the flowering stage (Re-Fi), and from the flowering stage to maturity (Fl-Ma) of winter wheat in 2018–2019(a), 2019–2020(b), and 2020–2021(c) growing seasons. .
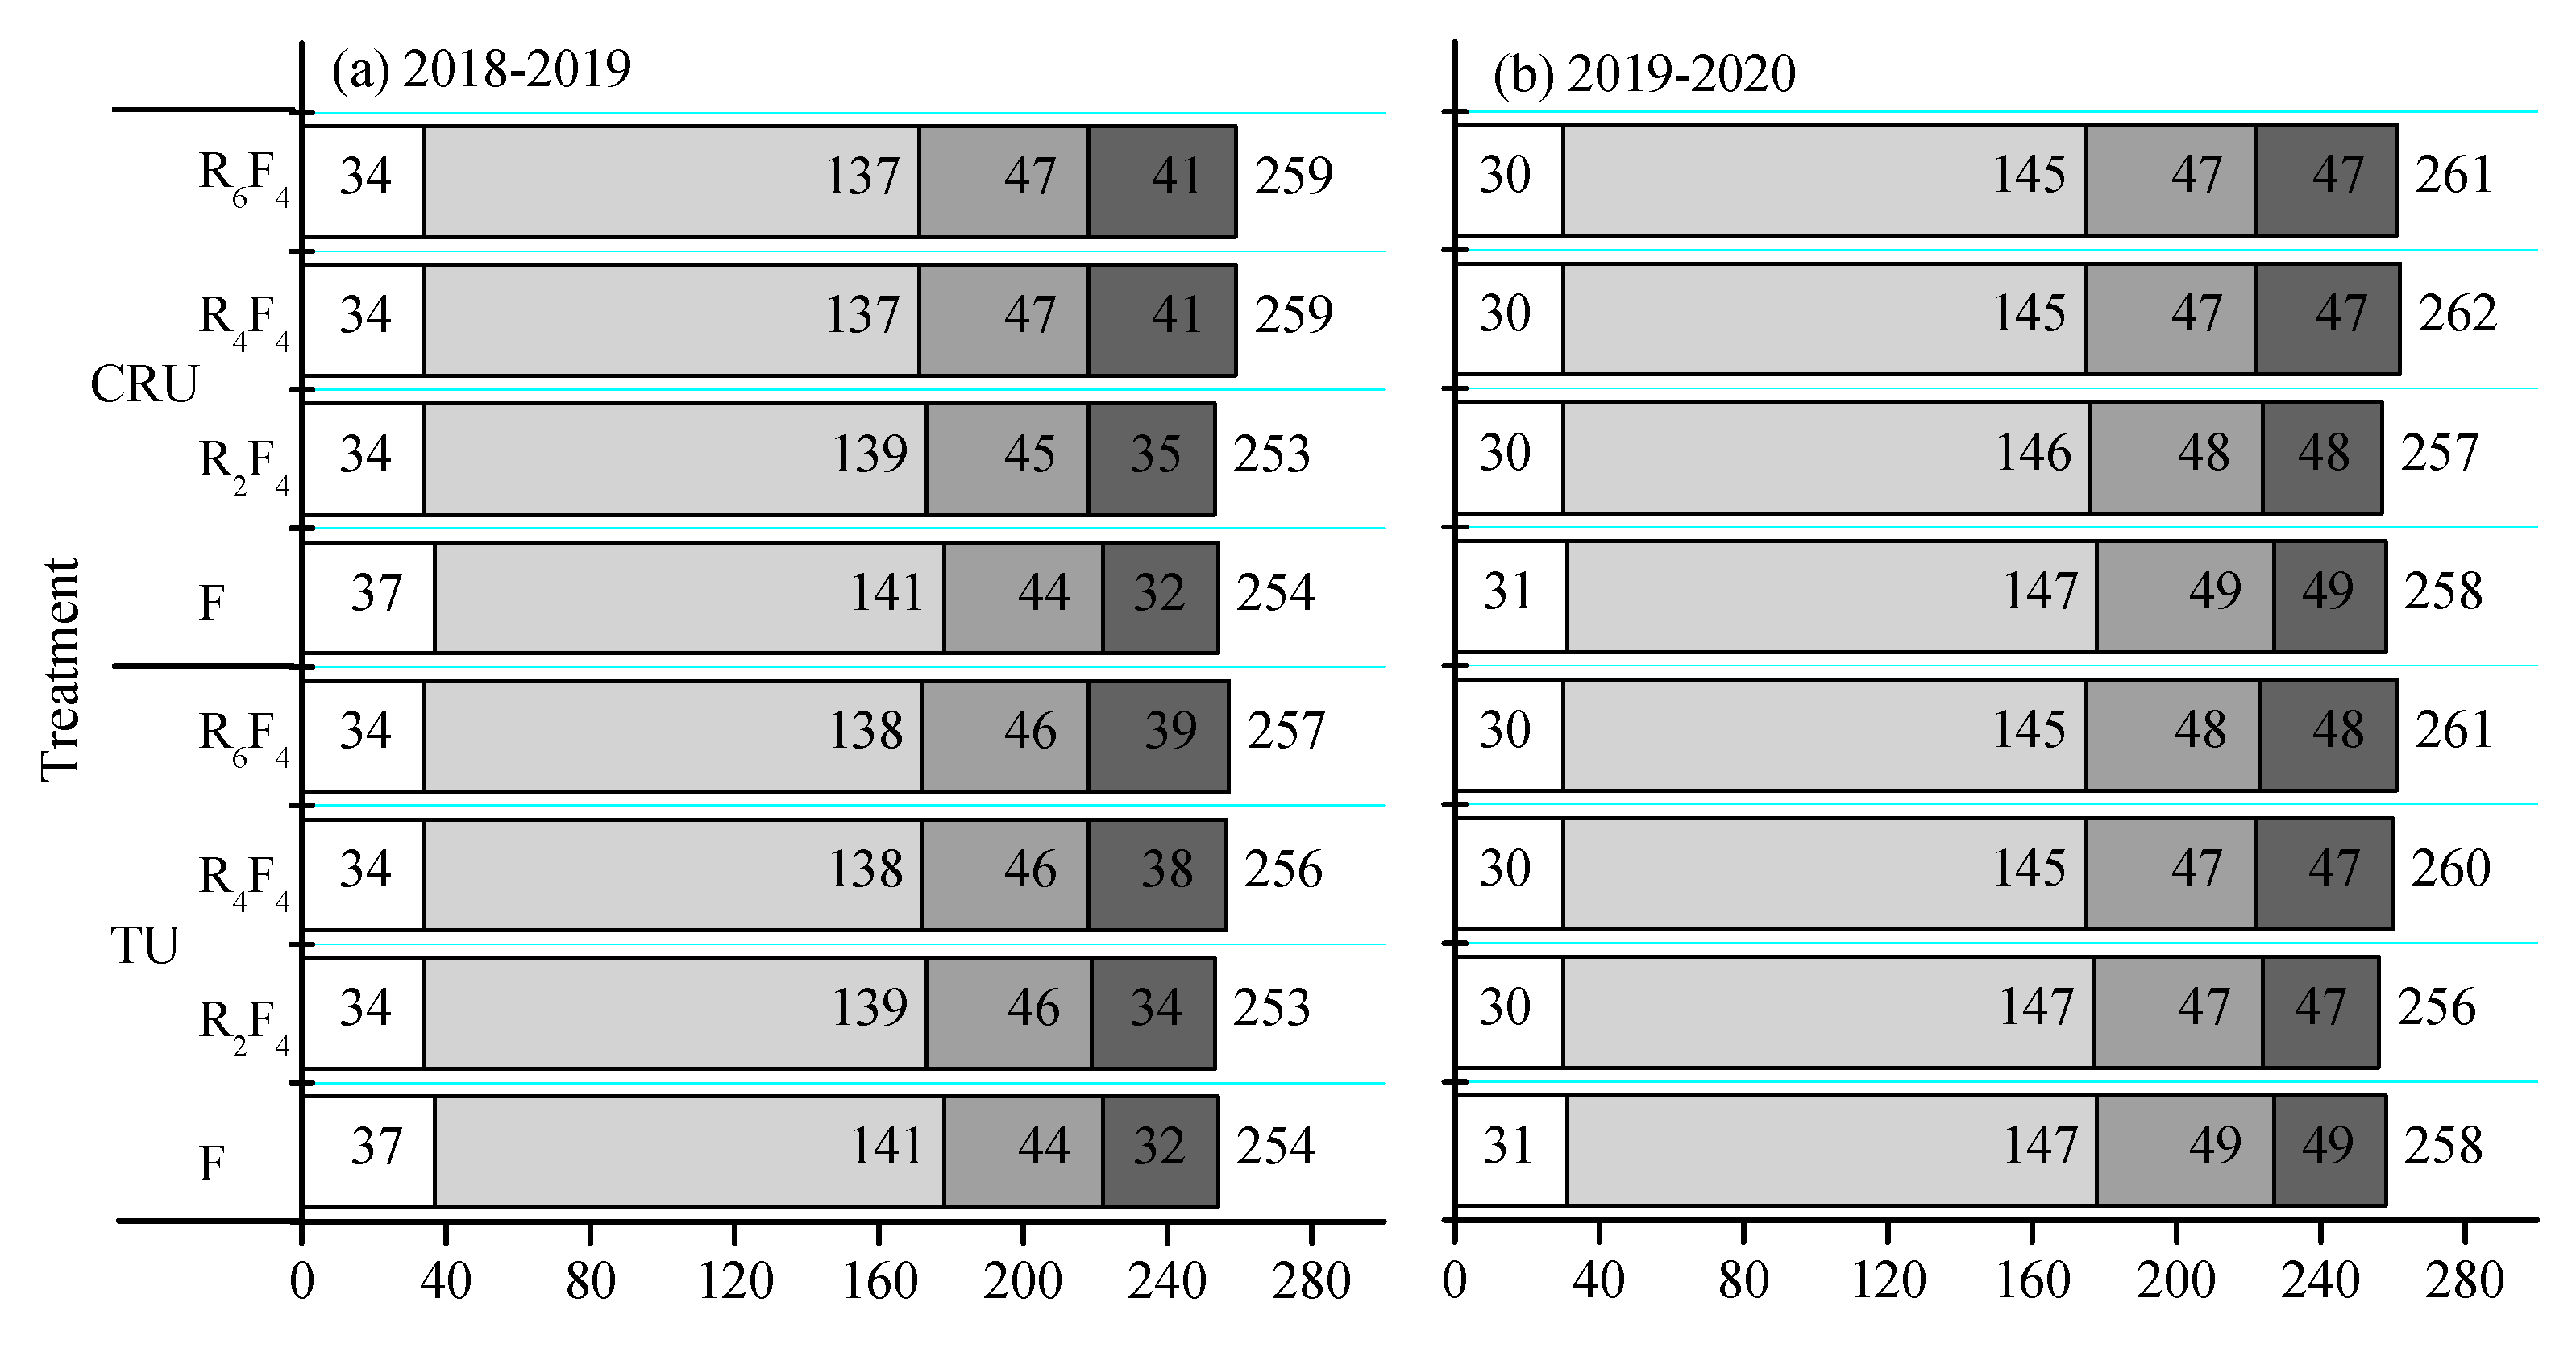
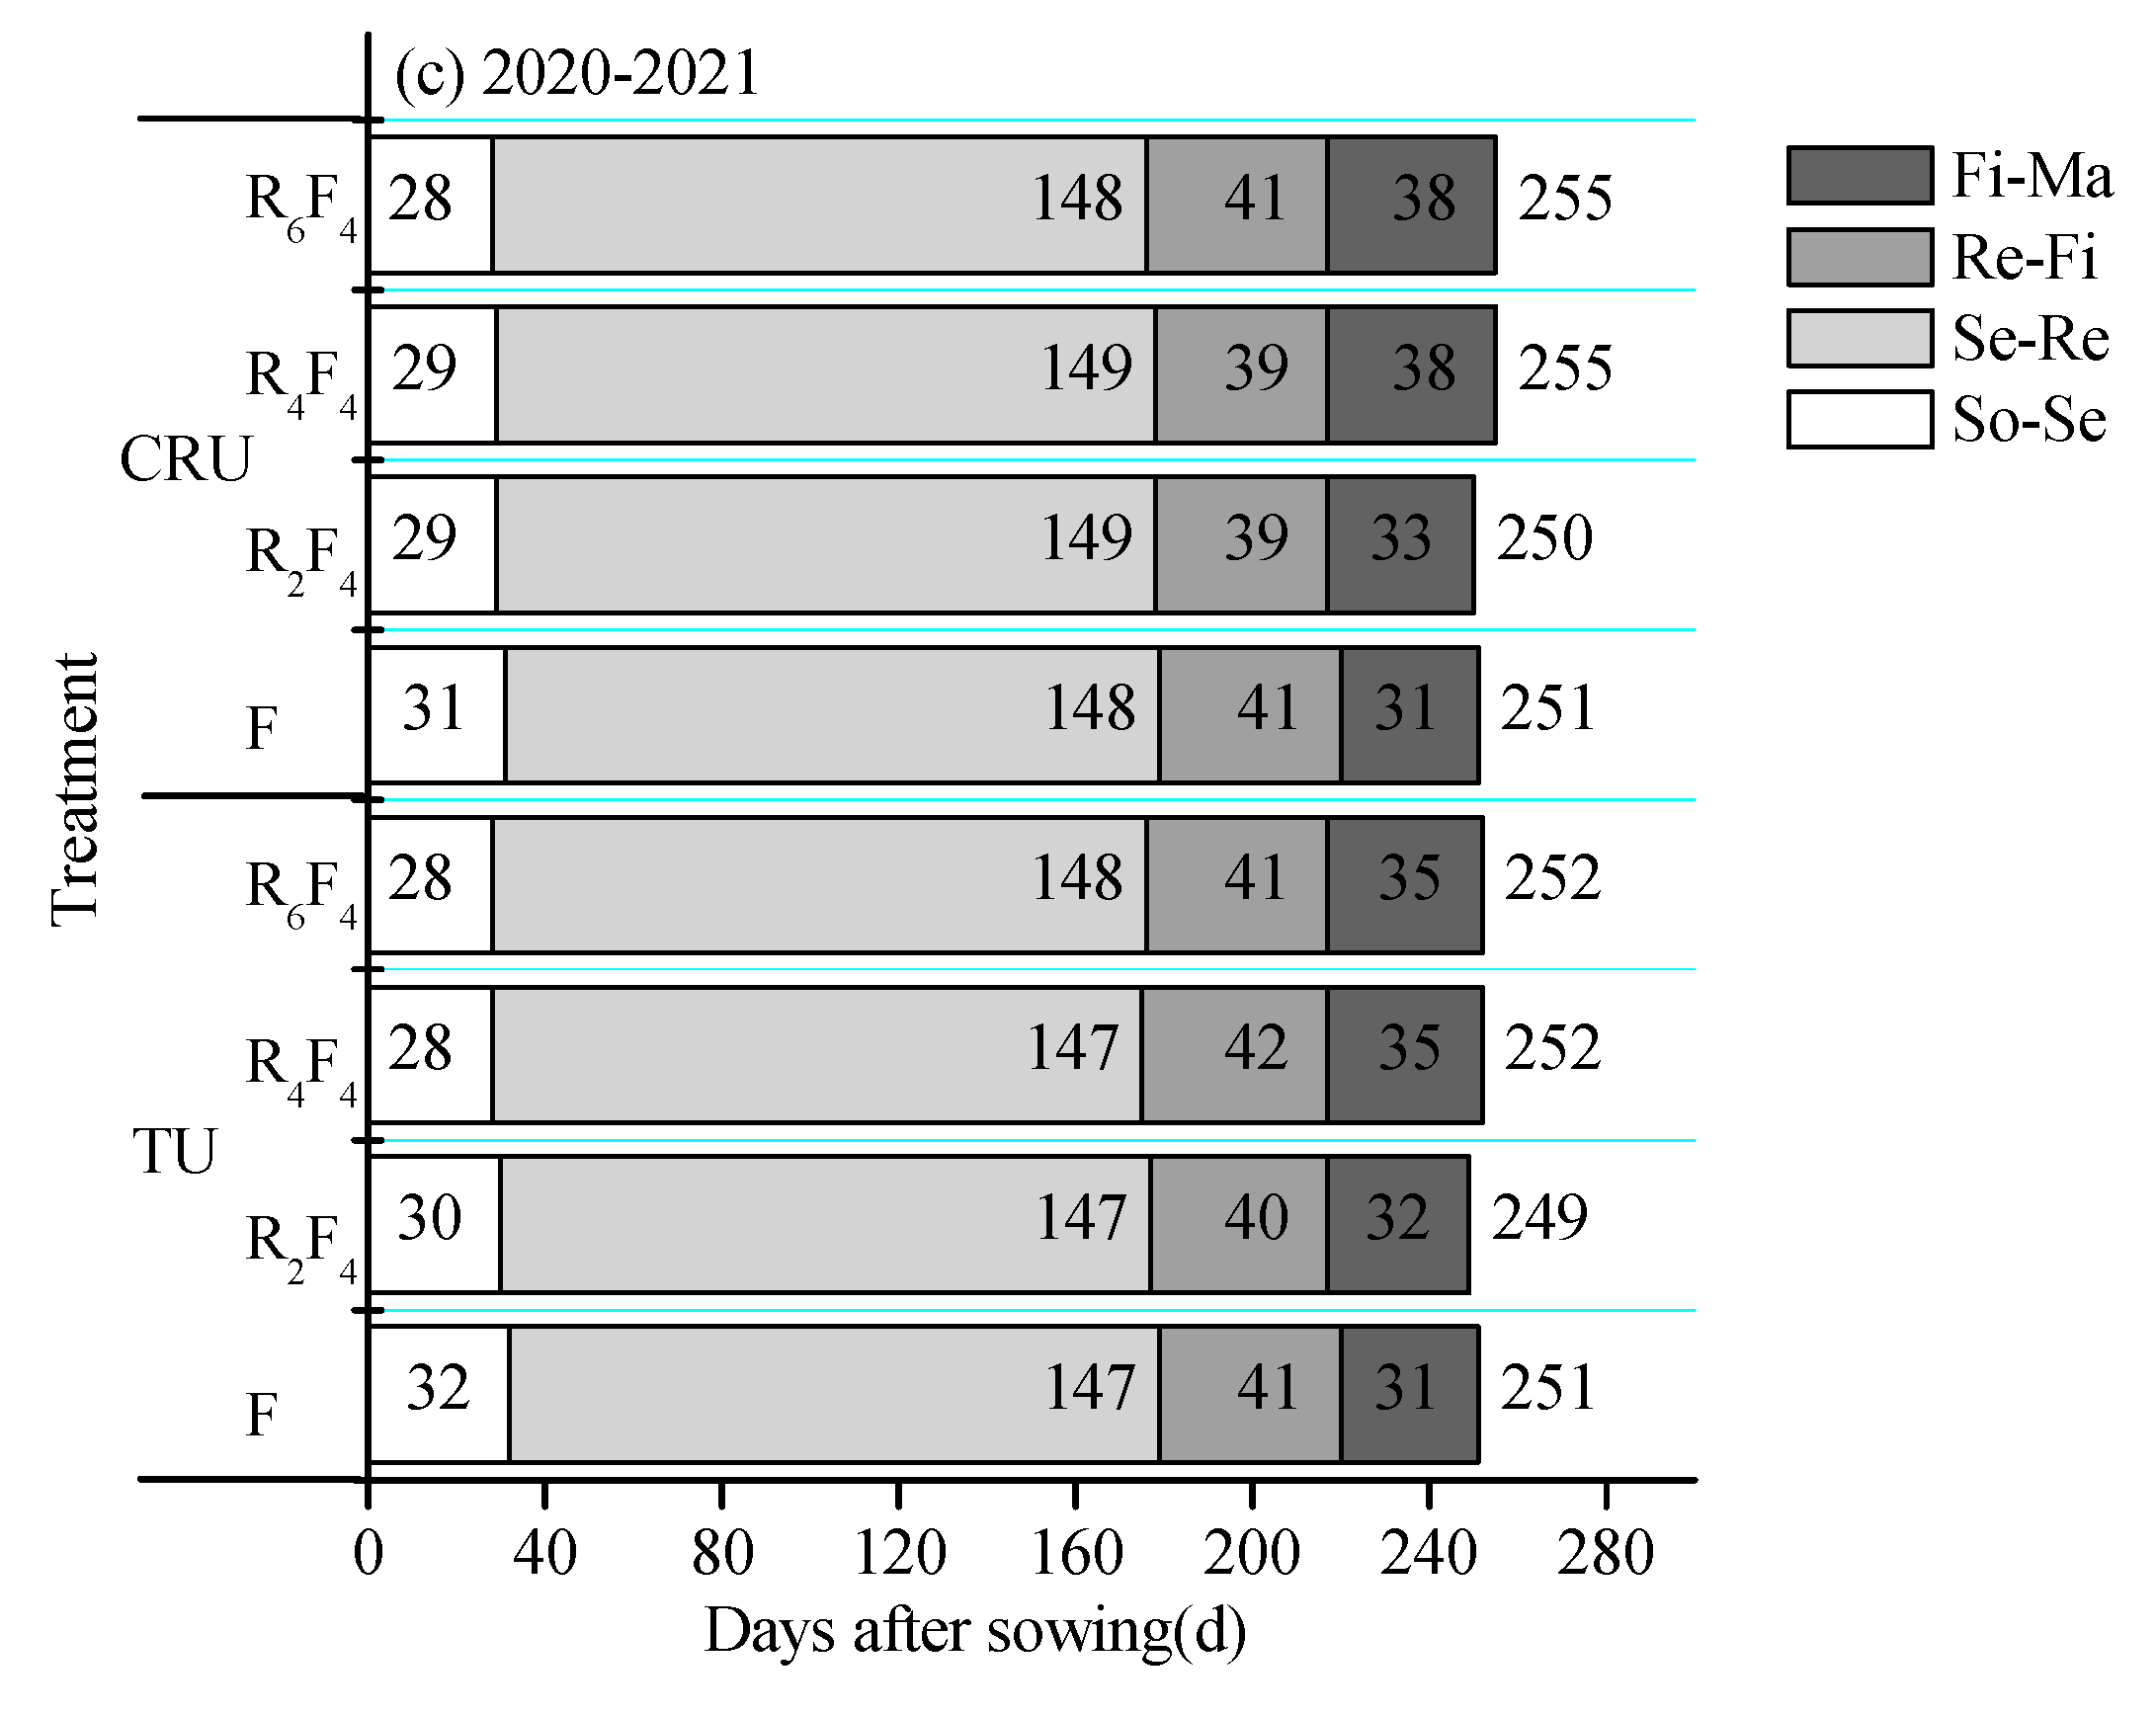
Figure 6.
Effect of two nitrogen fertilizer types (NT) and four planting patterns (P) on grain yield over the three winter wheat growing seasons of 2018-2019 (a), 2019-2020 (b) and 2020-2021 (c). Different lowercase letters on the histogram of the same year represent significant differences at the 0.05 probability level for different treatments.
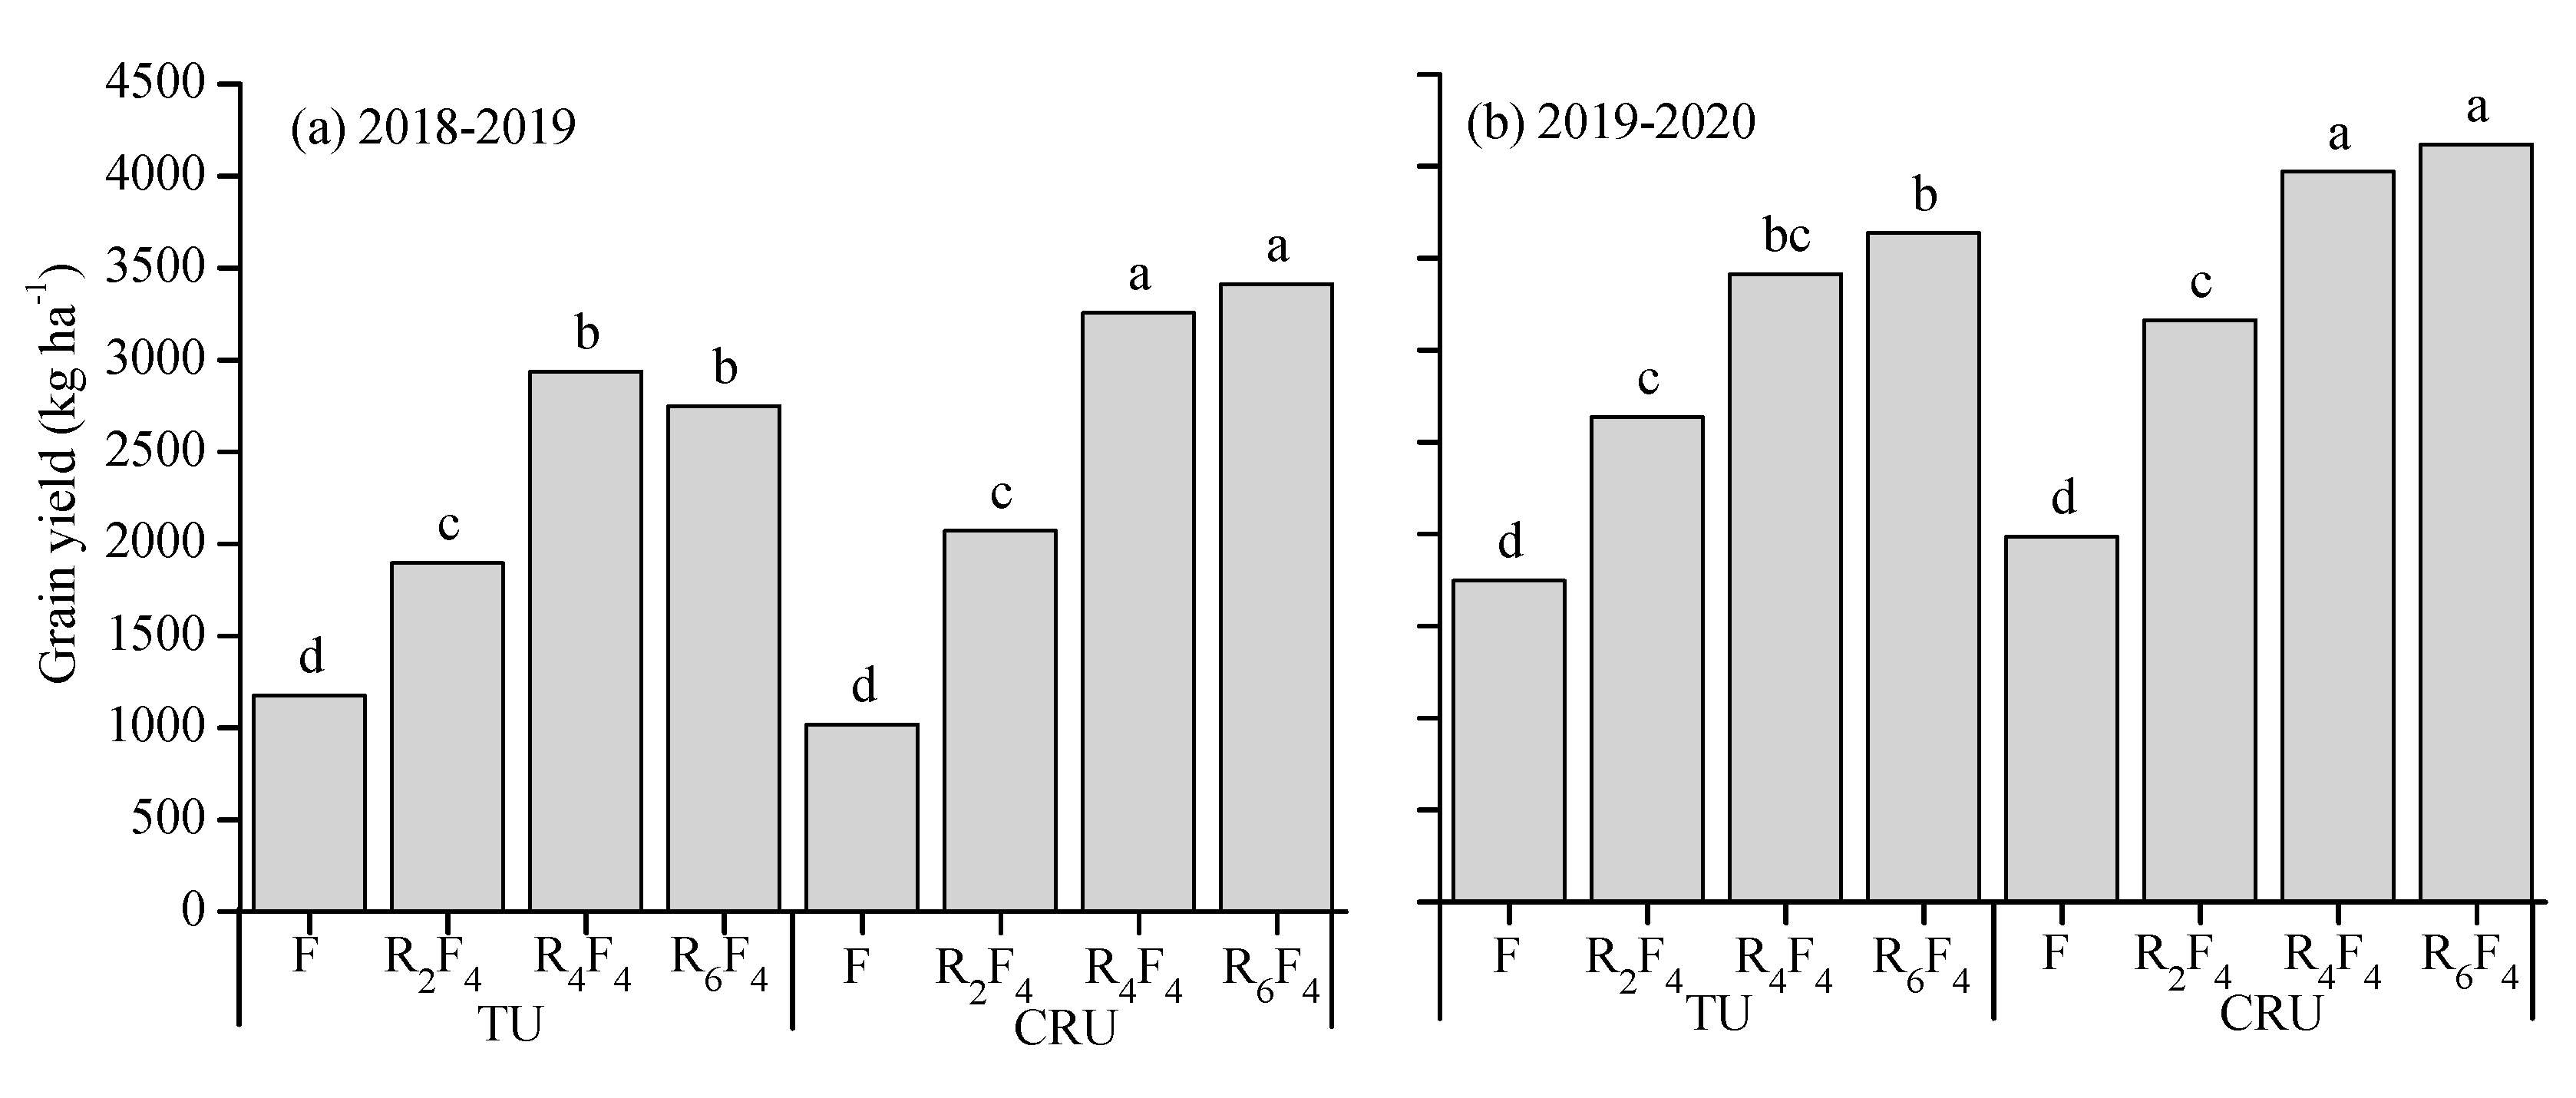
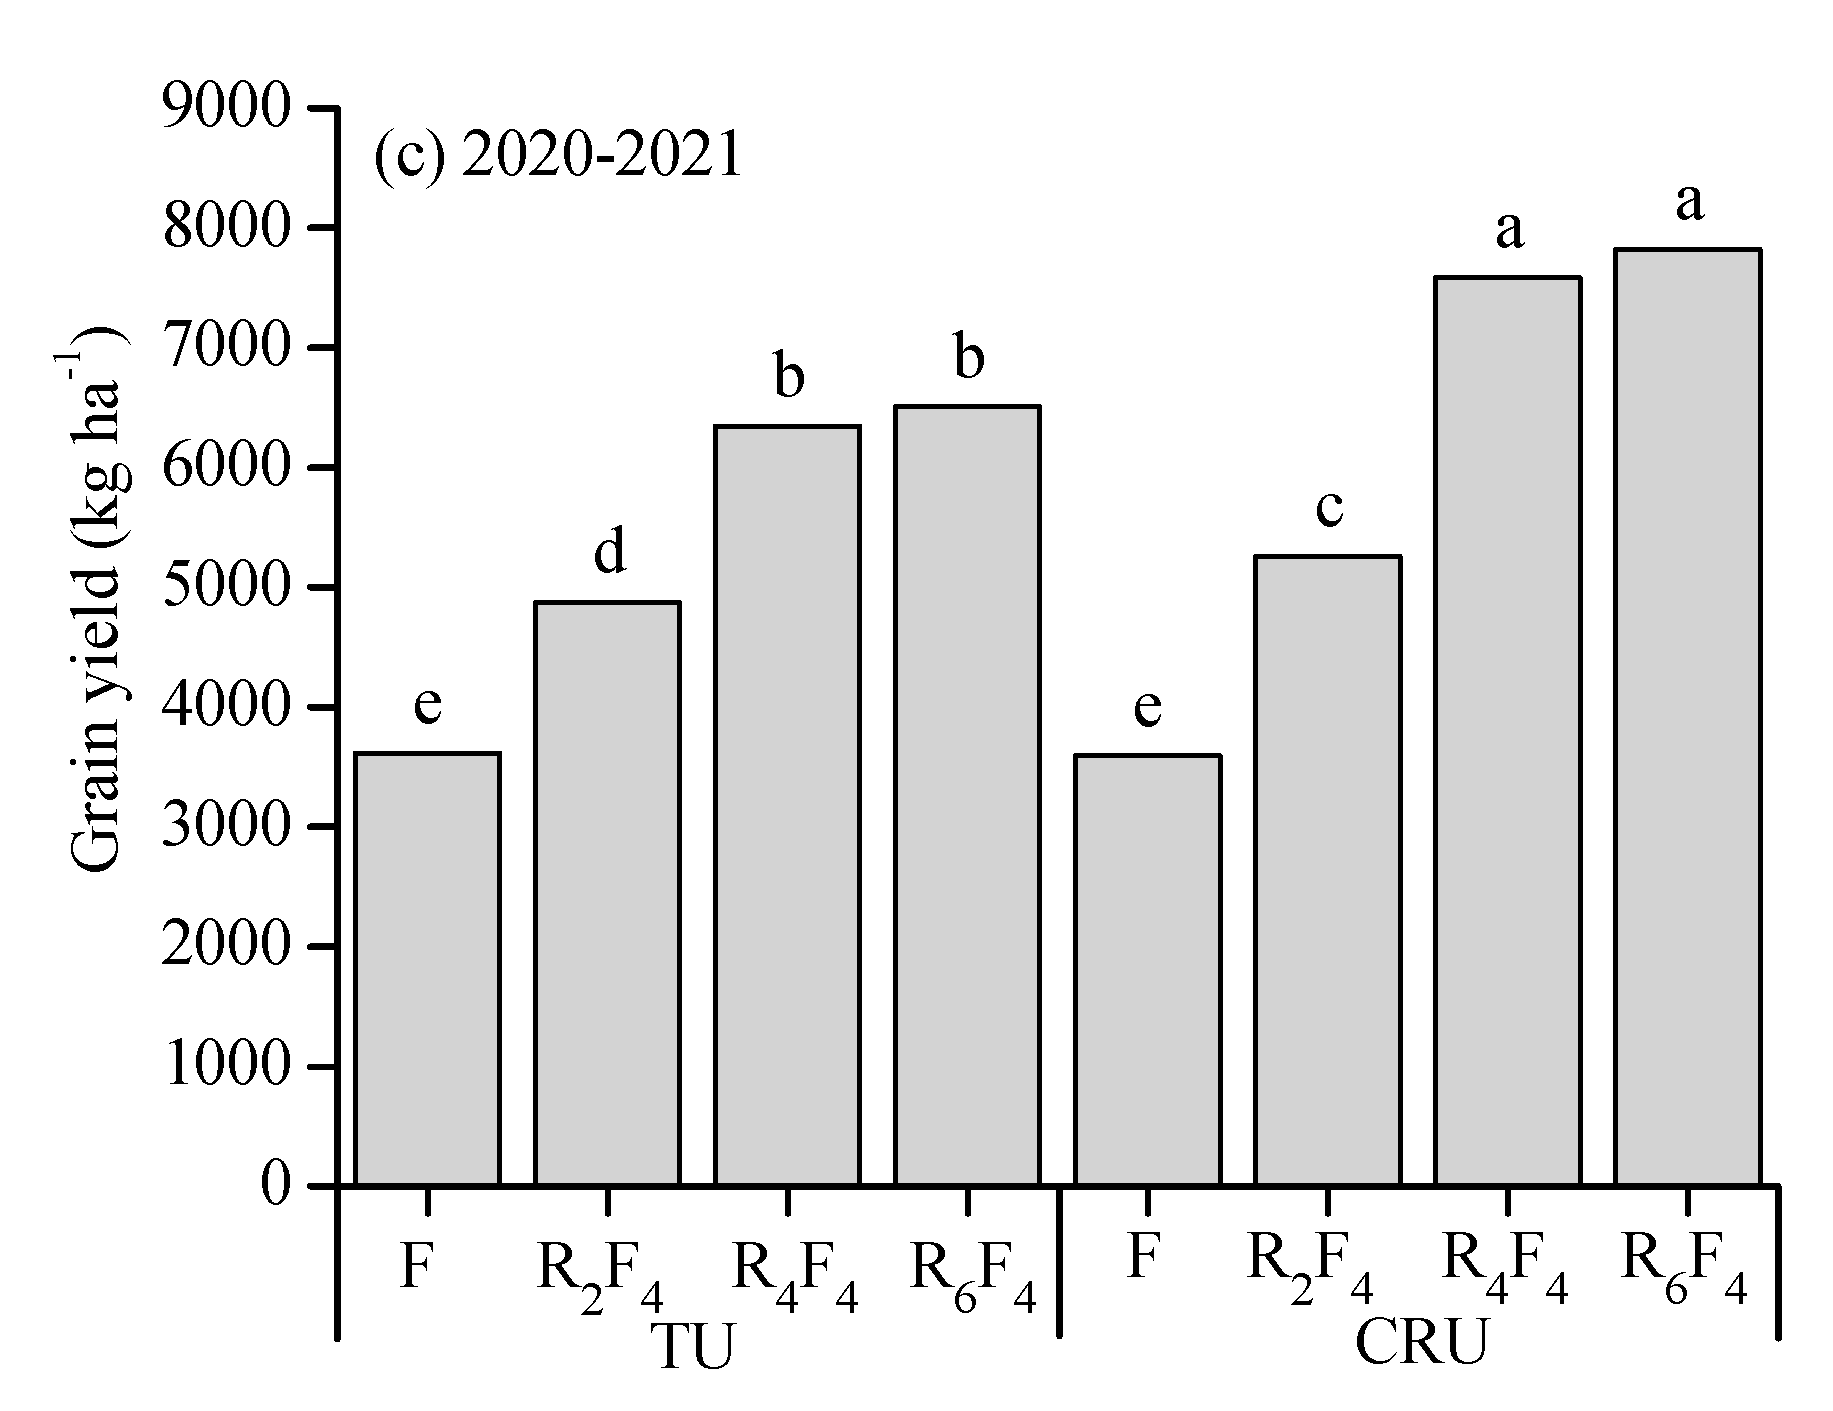
Figure 7.
Soil water depletion in the 0–40, 40–100, and 100–140 cm soil layers for the NT treatments (TU and CRU) under the four planting patterns (F, R2F4, R4F4, and R6F4) over the 2018–2019 (a), 2019–2020 (b), and 2020–2021 (c) growing seasons. Different lowercase letters on the same soil layer represent significant differences for different treatments at the 0.05 probability level.


Table 1.
Thermal time use efficiency (TUE) and radiation use efficiency (RUE) were affected by the two nitrogen fertilizer types (NT) and four planting patterns (P) during 2018 – 2021 rain-fed wheat growing seasons.
Table 1.
Thermal time use efficiency (TUE) and radiation use efficiency (RUE) were affected by the two nitrogen fertilizer types (NT) and four planting patterns (P) during 2018 – 2021 rain-fed wheat growing seasons.
| NT | P | TUE [kg ha−1 (°C d)−1] | RUE (g MJ−1) | |||||
|---|---|---|---|---|---|---|---|---|
| 2018-2019 | 2019-2020 | 2020-2021 | 2018-2019 | 2019-2020 | 2020-2021 | |||
| TU | F | 0.48e | 0.81f | 1.67d | 0.70de | 0.74e | 1.12e | |
| R2F4 | 0.76d | 1.19e | 2.23c | 0.80cd | 0.87cd | 1.20de | ||
| R4F4 | 1.14bc | 1.51cd | 2.83b | 0.96ab | 0.94bc | 1.33dc | ||
| R6F4 | 1.07c | 1.59bc | 2.85b | 0.89bc | 0.96abc | 1.35b | ||
| CRU | F | 0.42e | 0.92f | 1.66d | 0.61e | 0.81de | 1.11e | |
| R2F4 | 0.83d | 1.41d | 2.38c | 0.82cd | 1.00ab | 1.25cd | ||
| R4F4 | 1.23ab | 1.73ab | 3.24a | 1.02a | 1.05a | 1.54a | ||
| R6F4 | 1.30a | 1.77a | 3.29a | 1.04a | 1.05a | 1.57a | ||
*Notes: marking different lowercase letters after the same column value indicates a significant difference between the treatments at the 0.05 probability level.
Table 2.
Water productivity (WP, kg ha−1 mm−1) and partial factor productivity of N (PFPN, kg kg−1) were affected by the two nitrogen fertilizer types (NT) and four planting patterns (P) during 2018 – 2021 rain-fed wheat growing seasons.
Table 2.
Water productivity (WP, kg ha−1 mm−1) and partial factor productivity of N (PFPN, kg kg−1) were affected by the two nitrogen fertilizer types (NT) and four planting patterns (P) during 2018 – 2021 rain-fed wheat growing seasons.
| NT | P | WP (kg ha−1 mm−1) | PFPN ( kg kg−1) | |||||
|---|---|---|---|---|---|---|---|---|
| 2018-2019 | 2019-2020 | 2020-2021 | 2018-2019 | 2019-2020 | 2020-2021 | |||
| TU | F | 6.4d | 8.4d | 18.1d | 6.5d | 9.7e | 20.1d | |
| R2F4 | 9.6c | 11.7c | 21.8c | 10.5c | 14.6d | 27.1c | ||
| R4F4 | 12.7b | 14.8ab | 27.1b | 16.3b | 19.0bc | 35.3b | ||
| R6F4 | 13.2ab | 15.5a | 26.0b | 15.3b | 20.2b | 36.2b | ||
| CRU | F | 5.6d | 9.2d | 16.9d | 5.7d | 11.0e | 19.9d | |
| R2F4 | 9.9c | 13.3bc | 22.9c | 11.5c | 17.6c | 29.2c | ||
| R4F4 | 13.9ab | 16.1a | 29.9a | 18.1a | 22.1a | 42.1a | ||
| R6F4 | 14.2a | 16.5a | 31.4a | 19.0a | 22.9a | 43.4a | ||
*Notes: marking different lowercase letters after the same column value indicates a significant difference between the treatments at the 0.05 probability level.
Table 3.
Soil thermal time (TTsoil, °C d) captured during the main growth stages as affected by the two nitrogen fertilizer types (NT) and four planting patterns (P) over the 2018–2019, 2019–2020, and 2020–2021 growing seasons (Y).
Table 3.
Soil thermal time (TTsoil, °C d) captured during the main growth stages as affected by the two nitrogen fertilizer types (NT) and four planting patterns (P) over the 2018–2019, 2019–2020, and 2020–2021 growing seasons (Y).
| Treatment | TTsoil capture at various growth stages | TTsoil capture during growth period | ||||
|---|---|---|---|---|---|---|
| So-Se | Se-Re | Re-Fi | Fi-Ma | |||
| NT | ||||||
| TU | 442.7a | 538.1a | 596.3a | 745.6b | 2322.8b | |
| CRU | 444.2a | 536.8a | 597.6a | 784.9a | 2363.6a | |
| P | ||||||
| F | 431.7c | 498.4d | 632.0a | 700.3c | 2262.4c | |
| R2F4 | 440.9b | 529.1c | 595.2b | 738.1b | 2303.4b | |
| R4F4 | 447.5a | 550.5b | 584.3b | 810.2a | 2392.5a | |
| R6F4 | 453.8a | 572.0a | 576.4c | 812.3a | 2414.5a | |
| Y | ||||||
| 2018–2019 | 470.1a | 513.3b | 672.6a | 885.0a | 2541.0a | |
| 2019–2020 | 427.7b | 519.9b | 581.2b | 713.9b | 2242.7b | |
| 2020–2021 | 432.6b | 579.3a | 537.1c | 696.8c | 2245.8b | |
| ANOVA | ||||||
| NT | ns | ns | ns | ** | ** | |
| P | ** | ** | ** | ** | ** | |
| Y | ** | ** | ** | ** | ** | |
| NT × P | ns | ns | ns | ** | ** | |
| NT × Y | ns | ns | ns | ** | ns | |
| P × Y | ns | ns | ** | ** | ** | |
| NT × P × Y | ns | ns | ns | ** | * | |
*Notes: So-Se, from sowing date to seedling emergence; Se-Re, from seedling emergence to re-greening stage; Re-Fi, from re-greening stage to flowering stage; Fi-Ma, from flowering stage to maturity; and So-Ma, from sowing date to maturity. Within the NT, P, and Y treatments, symbols of ‘*’ and ‘**’ represent significant at the P=0.05 and 0.01 level, respectively, and ‘ns’ represent not significant at the P=0.05 level.
Table 4.
Evapotranspiration (ET, mm) during the main growth stages as affected by the two nitrogen fertilizer types (NT) and four planting patterns (P) over the 2018–2019, 2019–2020, and 2020–2021 growing seasons (Y).
Table 4.
Evapotranspiration (ET, mm) during the main growth stages as affected by the two nitrogen fertilizer types (NT) and four planting patterns (P) over the 2018–2019, 2019–2020, and 2020–2021 growing seasons (Y).
| Treatment | ET at various growth stages | ET during growth period | ||||
|---|---|---|---|---|---|---|
| So-Se | Se-Re | Re-Fi | Fi-Ma | |||
| NT | ||||||
| TU | 28.9 a | 44.3 a | 83.7 a | 61.9 b | 218.8 b | |
| CRU | 28.7 a | 45.6 a | 87.8 a | 67.8 a | 229.8 a | |
| P | ||||||
| F | 34.1 a | 29.3 c | 76.3 c | 60.2 c | 199.8 c | |
| R2F4 | 28.8 b | 43.9 b | 83.9 b | 63.6 b | 220.2 b | |
| R4F4 | 25.7 c | 53.2 a | 90.4 a | 67.5 a | 236.9 a | |
| R6F4 | 26.4 c | 53.4 a | 92.4 a | 68.1 a | 240.4 a | |
| Y | ||||||
| 2018–2019 | 42.1 a | 42.1 b | 54.7 c | 71.7 a | 210.6 b | |
| 2019–2020 | 29.2 b | 35.2 c | 108.3 a | 58.1 c | 230.8 a | |
| 2020–2021 | 15.0 c | 57.6 a | 94.3 b | 64.7 b | 231.6 a | |
| ANOVA | ||||||
| NT | ns | ns | ns | * | ** | |
| P | ** | ** | ** | ** | ** | |
| Y | ** | ** | ** | ** | ** | |
| NT × P | ns | ns | ns | ns | ns | |
| NT × Y | ns | * | ** | ** | ns | |
| P × Y | ** | * | ** | ** | ns | |
| NT × P × Y | * | * | ns | ns | ns | |
*Notes: So-Se, from sowing date to seedling emergence; Se-Re, from seedling emergence to re-greening stage; Re-Fi, from re-greening stage to flowering stage; Fi-Ma, from flowering stage to maturity; and So-Ma, from sowing date to maturity. Within the NT, P, and Y treatments, symbols of ‘*’ and ‘**’ represent significant at the P=0.05 and 0.01 level, respectively, and ‘ns’ represent not significant at the P=0.05 level.
Table 5.
Photosynthetically active radiation (PAR, MJ m-2) interception during the main growth stages as affected by the two nitrogen fertilizer types (NT) and four planting patterns (P) over the 2018–2019, 2019–2020, and 2020–2021 growing seasons (Y).
Table 5.
Photosynthetically active radiation (PAR, MJ m-2) interception during the main growth stages as affected by the two nitrogen fertilizer types (NT) and four planting patterns (P) over the 2018–2019, 2019–2020, and 2020–2021 growing seasons (Y).
| Treatment | PAR interception at various growth stages | PAR interception during growth period | ||||
|---|---|---|---|---|---|---|
| So-Se | Se-Re | Re-Fi | Fi-Ma | |||
| NT | ||||||
| TU | 6.7a | 180.0a | 94.0a | 52.1b | 332.7b | |
| CRU | 6.9a | 180.6a | 95.8a | 61.0a | 344.3a | |
| P | ||||||
| F | 3.7c | 144.4c | 63.2c | 31.8c | 243.1c | |
| R2F4 | 5.6b | 169.3b | 94.5b | 53.3b | 322.7b | |
| R4F4 | 8.7a | 201.1a | 110.5a | 69.8a | 390.1a | |
| R6F4 | 9.1a | 206.4a | 111.4a | 71.3a | 398.1a | |
| Y | ||||||
| 2018–2019 | 6.6b | 131.0c | 75.4c | 48.1b | 261.1c | |
| 2019–2020 | 8.1a | 170.6b | 99.2b | 48.6b | 326.5b | |
| 2020–2021 | 5.6b | 239.3a | 110.1a | 72.9a | 427.9a | |
| ANOVA | ||||||
| NT | ns | ns | ns | ** | ** | |
| P | ** | ** | ** | ** | ** | |
| Y | ** | ** | ** | ** | ** | |
| NT × P | ns | ns | ns | * | ns | |
| NT ×Y | ns | ns | ns | ns | ns | |
| P × Y | * | ** | ns | ** | ns | |
| NT × P × Y | ns | ns | ns | ns | ns | |
*Notes: So-Se, from sowing date to seedling emergence; Se-Re, from seedling emergence to re-greening stage; Re-Fi, from re-greening stage to flowering stage; Fi-Ma, from flowering stage to maturity; and So-Ma, from sowing date to maturity. Within the NT, P, and Y treatments, symbols of ‘*’ and ‘**’ represent significant at the P=0.05 and 0.01 level, respectively, and ‘ns’ represent not significant at the P=0.05 level.
Disclaimer/Publisher’s Note: The statements, opinions and data contained in all publications are solely those of the individual author(s) and contributor(s) and not of MDPI and/or the editor(s). MDPI and/or the editor(s) disclaim responsibility for any injury to people or property resulting from any ideas, methods, instructions or products referred to in the content. |
© 2023 by the authors. Licensee MDPI, Basel, Switzerland. This article is an open access article distributed under the terms and conditions of the Creative Commons Attribution (CC BY) license (http://creativecommons.org/licenses/by/4.0/).
Copyright: This open access article is published under a Creative Commons CC BY 4.0 license, which permit the free download, distribution, and reuse, provided that the author and preprint are cited in any reuse.


