Submitted:
20 November 2023
Posted:
21 November 2023
You are already at the latest version
Abstract
Glycosylation is a common post-translation modification present on majority of eukaryotic proteins. Therefore, it is dependent on the host cell line and affected by the cell culture and purification process. Additionally, glycosylation of therapeutic biologics is known to have a profound impact on binding and downstream effector functions. Hence, glycosylation is increasingly considered a critical quality attribute (CQA) of biopharmaceutical drugs and has been showed to affect the safety and efficacy of these molecules. Therefore, regulatory agencies have adopted a Quality by Design (QbD) approach for glycan monitoring at various steps with stringent controls to ensure efficacy and safety. This requires multiple, orthogonal fit-for-purpose tools to study the process. One key unmet need in downstream organizations of large pharmaceutical companies is a real-time, rapid glycan detection and quantification tool to guide purification/expression process. To meet this need, we have developed a selective, colorimetric assay which selectively stains sugar moieties (glycosylated IgGs) which appears as magenta bands on an SDS-PAGE resolved gel. The selectivity arises because the method leverages stereochemical differences of hydroxyl groups between amino acids and carbohydrates to selectively stain the primary alcohol in carbohydrates but not in amino acids. Specifically, our method selectively oxidizes the ‘cis-diol’ group in carbohydrates to aldehydes and stains the aldehydes on an SDS-PAGE gel by Schiff’s reaction. Our method is semi-quantitative and has comparable sensitivity to Coomassie with LoD of around 50ng. The method can detect glycosylated IgGs produced in multiple cell lines (including HEK and CHO), thereby enabling us to study batch-to-batch variability and can critically stain both N-linked and O-linked glycosylation. We also show that the assay can be used as a downstream purification guide for process analytics following ion-exchange and hydrophobic interaction chromatography.
Keywords:
glycosylation
; monocloncal antobody
; immunoglobulin
1. Introduction
Glycosylation is a common post-translational modification (PTM) in proteins, influencing protein folding [1] and targeting (both intracellular and extracellular targeting [2]. This has a profound influence on the quality and titer of IgGs manufactured in the pharmaceutical industry. Additionally, glycosylation affects peptide-MHC binding [3], and Fc receptor interactions [4]. Therefore, the glycosylation of biopharmaceutical drugs affect its safety and efficacy – by affecting it’s in vivo half-life [5], immunogenicity [6] and effector functions [7]. A recent survey of the top 20 best-selling IgG drugs shows that more than half of them were glycoproteins (either monoclonal antibodies (mAbs) or Fc-based fusion proteins [8].
Most therapeutic antibodies belong to the IgG1 subclass. The mechanism of action often comprises antibody-dependent cell-mediated cytotoxicity (ADCC) which requires interactions mediated by the Fc region of the IgG1. While the Fab domain of different monoclonal antibodies are structurally diverse in order to recognize different antigens, the Fc region is relatively well conserved and lacks the structural diversity of the Fab domain. After the Fab domain has bound to the antigen, the Fc domain determines the function/mechanism by which the monoclonal antibody will act. For example, it may recruit molecules of innate immune system (complements) or bind to antigen presenting cells (APCs) by binding to Fcγ receptors [12]. Interestingly, the Fc region of IgG1 has two conserved N-glycosylation sites at Asn297 (one each in the two CH2 domains of each heavy chains) [12,13]. Therefore, variability in glycan architecture affects how IgG interacts with the immune system, and therefore the downstream function/efficacy as well.
One of the major reasons for glycan variability is that in contrast to proteins, the biosynthesis of glycans is not solely derived from the plasmid template, but also depends on other factors like genetic make-up of the cells (cell-lines) in which the glycoproteins are expressed [9] including epigenetics [10] and the extracellular environment (cell culture) [11].
As a result, glyco-biologics (biopharmaceutical drugs which are glycosylated) often have a heterogeneous profile for glycans. This profile is heavily dependent on specific host cell line (HEK vs CHO) and the upstream cell culture process. Additionally, the downstream purification process (more specifically, the modes of chromatography used in the purification process) may alter the glycan profile of the final enriched, purified species.
Therefore, regulatory agencies require glycan profiles to be consistent for different batches of the drug. This is critical as glycan profiles affect the safety and efficacy of a drug. Hence, FDA has suggested a QbD (Quality by Design) approach to monitor glycosylation as far as the Critical Process Parameters (CPP) for Drug Substance Manufacture and Target Product Profile (of Drug Product) is concerned. Thus, the process design (upstream/downstream) needs to identify the CPPs for maintaining the optimal glycan profile. QbD requires an appreciation of historical data, design of experiments (DoE), process analytical technology (PAT) and concomitant risk assessments.
All IgGs including glycoproteins need to be purified; additionally, glycoproteins need the glycan architecture to be monitored through the process as that has a profound effect on potency. Generally, the proteins are captured by a Protein A step followed by other polishing steps [14]. Such additional polishing steps consists of ion-exchange and hydrophobic interaction chromatography – these modalities are used to remove process impurities like endotoxins, host cell proteins (HCP) and residual DNA [15]. This is followed by non-chromatographic steps to concentrate the IgG – such as ultrafiltration and diafiltration (UFDF). A population of glycans will behave bind to an anion-exchange column or hydrophobic column (based on charge or hydrophobicity), and the heterogeneity of the purified pool will depend on the specific elution condition. As a result, pharmaceutical manufacturers need to analyze the glycan profile throughout process development and manufacturing.
This diversity coupled with the nonlinear structures of glycans gives their physicochemical characterization an added layer of complexity. Additionally, an oligosaccharide can be “N-linked” or “O-linked” depending on whether the carbohydrate is attached through the amide group of an asparagine residue (“N-linked”) or the hydroxyl group of a serine/threonine residue in an IgG “O-linked”. Therefore, multiple analytical techniques are used to understand IgG glycosylation. Generally speaking, the analysis can be carried out at three distinct levels [16], depending on the specific question to be answered. These levels include the intact protein level, glycopeptide level, or with released glycans.
At the intact protein level, one can use chromatography, gel electrophoresis or mass-spectrometry. At an intact level, a top-down approach can be used to analyze intact protein samples with minimal sample preparation in order to obtain molecular weight and PTMs like glycosylation. It can be used to gauge variability between different batches. However, an intact top-down approach is limited in detecting the nuances of minor glycoforms. Therefore, middle-down strategies, coupled with chemical and enzymatic approaches can be used to analyze different antibody subunits. This approach using reducing agents to reduce inter-chain disulfide bonds and specific protease (like IdeS) is often utilized to detect and identify multiple glycoforms and other PTMs [17].
Additionally, glycopeptide analysis is carried out to comprehend glycosylation microheterogeneity using a bottom-up approach. Here, the therapeutic biologic is treated with proteolytic enzymes (trypsin) and then analyzed with LC/MS or CE [18]. Such methods are used for monitoring variability between different manufacturing batches or process development. Finally, the identity of the monosaccharide composition, the specific glycosidic linkage – of which is critical to safety/efficacy of the therapeutic can be characterized in-depth by HPLC/UPLC coupled with MS [16]. A major technical challenge is the lack of a chromophore in the monosaccharide augmented by the different configurations of the glycan. To circumvent this, released glycans are fluorescently labelled for optimal detection [19]. Capillary electrophoresis with laser-induced fluorescence (CE-LIF) has also been used for glycans analysis (where the released N-glycans are labelled with 8-aminopyrene-1,3,6-trisulfonate). In this case, the labelled glycans are resolved using charge/hydrodynamic-volume ratio [20]. CE-LIF can also be coupled with HPLC/UPLC in a 2D format.
The gold standard to interrogate glycosylation is MS as it has the best resolution. The most common ionization methods for analyzing glycosylation are ESI and MALDI. However, a common challenge to most methods is the complexity introduced by the enzymatic digestion of glycosylated biologics. This may lead to competitive ion suppression (analyzing glycopeptides vs peptides) during mass-spectrometric analysis. Additionally, it may not be practically feasible to engage the MS team during different phases of downstream purification. Engaging a MS team may be time consuming and often a MS team may be geographically distant from the downstream team, requiring samples to be shipped which may lead to temperature excursions, etc.
A highly desired kit in a downstream purification team’s toolbox is a seamless method to detect, monitor and quantitate glycans in real-time. This will be critical to guide both downstream purification and upstream expression studies. This is especially important as glycans are increasingly being shown to be critical for a growing number of therapeutic assets – and understanding glycan content is central to interrogating batch-to-batch variability. Additionally, a common downstream purification chromatographic technique is ion-exchange, and this is known to influence glycan content – thus, a quick tool to monitor glycan activity is helpful in a downstream team.
Currently, most downstream teams analyze glycan content following enzymatic digestion with PNGase (which removes N-linked glycosylation) – the proteins are subsequently resolved on an SDS-PAGE gel and the mobility shift (faster migrating band upon glycan truncation) confirms the presence of a glycosylated species. This is the assay used as purification guide to quickly identify glycosylated species. However, the assay is not quantitative. Additionally, this is an indirect enzymatic measurement and assumes that PNGase will be active for all immunoglobulins.
It is easy to appreciate that an ideal glycosylation-staining method should selectively stain the sugar, without staining the protein on an SDS-PAGE gel. The greatest challenge in the field has been the inability to have a dye that selectively stains sugar – a “Coomassie for carbohydrates”. The primary reason for this is that amino acids (serine/threonine/tyrosine) have primary-hydroxyl groups just like sugars; thus, selectively staining sugar moieties in their native hydroxyl form is challenging.
We have developed a method (henceforth referred to as ‘GlycoIg-stain’) where we can selectively oxidize the primary-alcohol groups in sugars to their aldehyde form using periodic acid. Our method leaves the primary alcohol in the amino acids intact. The reason behind this selectivity is that we leverage the stereochemistry of the alcohols by selectively oxidizing the cis-diol in glycoproteins to aldehyde in situ on the SDS-PAGE gel. The oxidation process we use is selective and requires two proximal hydroxyl groups to be in a ‘cis’ position. The aldehyde is then detected by Schiff’s reaction and the glycosylated IgG appears as a magenta band on the SDS-PAGE gel (graphical abstract). IgGs which are not glycosylated will not be stained by this method. The SDS-PAGE gel can then be counterstained with Coomassie (per regular protocol) to stain both glycosylated and non-glycosylated IgG.
The mechanism for the ‘GlycoIg-stain’ is shown in Figure 1A. The carbohydrates in the CH2 domain are selectively oxidized to aldehydes in situ on an SDS-PAGE gel. These aldehydes can then be visualized using Schiff reaction. A pictorial representation of the expected magenta bands for the glycosylated IgGs is depicted in Figure 1B (the magenta bands disappear upon treatment with PNGase (enzyme that removes N-linked glycosylation).
Our protocol is rapid and semi-quantitative. It can detect both N-linked and O-linked glycosylation. Finally, the ability to stain a single SDS-PAGE gel with the ‘GlycoIg-stain’ followed by the Coomassie (may also serve as protein loading control) enables streamlining with existing protocol to enable facile adoption in any laboratory.
The immunoglobulins, their sizes, isoelectric point, cell lines where they were expressed along with their modes of expression and glycosylation-linkage is designated in Table 1. “G-IgG” refers to “glycosylated imynoglobulin”.
2. Results
2.1.“. GlycoIg-stain” detects glycosylation on SDS-PAGE gel
To confirm if the “GlycoIg-stain” is specific for glycoproteins, we stained Lane 1 (Figure 2A) with a positive control for glycosylation (Horseradish Peroxidase) and Lane 2 with a negative control (Soybean Trypsin Inhibitor). We found that the “GlycoIg-stain” is indeed specific as it stained the positive control but not the negative control. The same SDS-PAGE gel was counterstained with Coomassie (Figure 2B). The Coomassie counter stain shows equal loading of both the positive and the negative control glycol protein. Coomassie could stain both the positive and negative control protein; however, the “GlycoIg-stain” stained only the glycoprotein (Horseradish Peroxidase).
We loaded G-IgG1 and G-IgG2 (non-reduced) in Lanes 3 and 5 respectively. The “GlycoIg-stain” stained both these glycosylated immunoglobulins (Figure 2A). However, when the same samples were treated with PNGase enzyme (which removed the N-linked glycosylation from G-IgG1 and G-IgG2), the “GlycoIg-stain” did not stain the samples (lanes 4 and 6). The Coomassie counterstain shows that the PNGase treated samples migrated faster (Figure 2B; lanes 4 and 6) on the gel, thereby confirming that the PNGase truncated the N-linked glycans from G-IgG1 and G-IgG2. The PNGase band is denoted in Figure 2B (stained with Coomassie but not with “GlycoIg-stain” as PNGase is not glycosylated by itself).
The “reduced” samples for G-IgG1 and G-IgG2 were in Lanes 8 and 10 respectively. Similar to the non-reduced samples, the “GlycoIg-stain” stained both glycosylated immunoglobulins (Figure 2A) but not when they were treated with PNGase (lanes 9 and 11). The Coomassie counterstain again demonstrated that the PNGase treated samples migrated faster on the gel (Figure 2B; lanes 4 and 6), thereby confirming that the PNGase truncated the N-linked glycans from both the reduced and non-reduced G-IgG1 and G-IgG2.
2.2. Staining is semi-quantitative
After confirming that “GlycoIg-stain” is specific to glycosylated immunoglobulins, we wanted to study the linear, dynamic range for staining by “GlycoIg-stain”. For this, we loaded 10ng-5000ng of G-IGG2 onto an SDS-PAGE gel (Figure 3A). We stained the gel with “GlycoIg-stain PAS” and Coomassie. We found that the dynamic range extended from 50ng-5µg. After densitometry and regression analysis (Figure 3B), we determined that the limit of detection (LoD) was 50ng and the coefficient of variation (CV) at 100 ng was 12.57%. We would note that for this specific experiment, the detection of Coomassie was also around ~50ng (visually).
2.3. Glycoprotein staining is independent of glycan architecture
The glycosylation patterns (architecture) for the same protein produced from HEK cells is known to be different than CHO cells. Therefore, we wanted to interrogate if our method could detect glycosylation patterns for proteins produced from both HEK and CHO cell lines.
After confirming the positive control (Horseradish Peroxidase) and negative control (Soybean Trypsin Inhibitor) in Lanes 1 and 2 respectively, we loaded G-IGG1 produced from HEK and CHO cells in Lane 3 and 5 respectively. We could successfully stain G-IGG1 produced from both the cell lines (Figure 4A)
However, when G-IGG1 (from both the cell lines) were treated with PNGase enzyme (lanes 4 and 6 respectively in Figure 4A), the “GlycoIg-stain” did not stain the samples. This is because PNGase cleaves the glycans and is validated by the Coomassie counterstain which shows that the PNGase treated samples migrated faster (Figure 4B; lanes 4 and 6) on the gel. The PNGase band is denoted in Figure 4B (stained with Coomassie but not with “GlycoIg-stain” in Figure 4A). The coomassie for G-IgG1 after PNG-ase treatment suggests that the faster migrating G-IgG1 form may be because it has been deglycosylated; the glycostaining confirms the glycosylation as there is no band (or no glycosylated protein) after PNG-ase treatment.
This method can be easily extended to study batch-to-batch variability for a cell line.
2.4.“. GlycoIg-stain” can detect both linkages (N-linked and O-linked glycosylation) produced from either HEK or CHO cell lines
Our earlier experiments have demonstrated that “GlycoIg-stain” can identify N-linked glycosylation. We now wanted to interrogate if it could recognize O-linked glycosylation as well. For this, we used a positive control (Fetuin protein) which has both N-linked and O-linked glycosylation. We could stain the Fetuin control (Lane 1 in Figure 5A) with the “GlycoIg-stain”. When the control was treated with PNGase, it was still detectable (Lane 2); however, when the control was treated with both PNGase and O-glycosylase (which removes O-linked glycosylation), we could not detect the control using the “GlycoIg-stain” (Lane 3). This is because PNGase treatment removes the N-linked glycosylation but leaves the O-linked glycosylation intact – and the “GlycoIg-stain” can detect it (Lane 2). However, when both the glycosylation linkages are removed (Lane 3), we can no longer detect it using the “GlycoIg-stain”. The PNGase band is denoted in Figure 5B (stained with Coomassie but not with “GlycoIg-stain” in Figure 5A)
The findings using the “GlycoIg-stain” are reinforced by the Coomassie counterstain which shows that the PNGase treated samples migrated faster than the control (Figure 5B; lanes 2 and 1 respectively) on the gel, while the sample treated with both PNGase and O-glycosylase migrated the fastest (Lane 3). This is because the PNGase treated sample still had the O-linked glycosylation intact, while treatment with both the enzymes yielded a faster migrating aglycosylated Fetuin.
Next, we wanted to know if G-IGG3 (which has both N-linked and O-linked glycosylation), produced from both HEK and CHO cell lines, could be detected using “GlycoIg-stain”. Our results show that we could stain G-IGG3 obtained from both HEK and CHO cell lines (lanes 4 and 7 respectively in Figure 5A). When G-IGG3 is treated with only PNGase, we can still detect the O-linked glycosylation (lane 5 and 8 respectively in Figure 5A). However, when both the N-linked and O-linked glycans are severed from G-IGG3 using a combination of PNGase and O-glycosylase, we can no longer detect any glycosylated species using “GlycoIg-stain” (lane 6 and 9 respectively in Figure 5A).
Interestingly, orthogonal analysis suggested (data not shown) that HEK material relatively more glycosylation than CHO; and a comparison of relative intensity (lanes 4 and 7) confirms that observation.
These findings are reinforced from the Coomassie counterstain which shows that removal of both the chains makes the aglycosylated G-IGG3 migrate fastest (lane 6 and 9 respectively in Figure 5B as compared to lanes 4/5 and lanes 7/8).
aHIC chromatography (Figure 5C) demonstrates distinct speciation for glycosylation (peak 1 and 2) and the aglycosylated G-IGG3 (peak 3). The aglycosylated peak is enriched after treatment with both deglycosylating enzymes. In this case, aHIC resolution was confirmed as an appropriate orthogonal method to study glycosylation (in addition to “GlycoIg-stain”).
2.5. Real-time, rapid glycan detection and quantification to guide purification process (ion-exchange)
Anion exchange chromatography (Trimethyl aminoethyl) is often used as a polishing step (in weak-partitioning flow through mode) in the pharmaceutical industry to clean up process related impurities (such as Host Cell Proteins). We wanted to interrogate if the “GlycoIg-stain” could be used to analyze in real-time how the flow-through fractions compared to the elution (strip) fractions (Figure 6A).
We first confirmed that the positive and negative controls for glycosylation behaved as expected (Lanes 1 and 2). The data shows that G-IgG4 is glycosylated (also confirmed with orthogonal analysis; data not shown). The “GlycoIg-stain” stained the glycosylated immunoglobulins (Figure 6B) both in the non-reduced (Lanes 3 and 5) and reduced state (Lanes 8 and 10). However, when the sample is treated with PNGase enzyme, the “GlycoIg-stain” did not stain the samples (lanes 4, 6, 9 and 11). The Coomassie counterstain (Figure 6C) shows that the PNGase treated samples migrated faster on the gel, thereby confirming that the PNGase truncated the N-linked glycans from G-IgG4.
Interestingly, we found that the glycosylated band (Lane 5; Figure 6B/C) for the ‘strip fraction’ migrated slower (higher molecular weight) than the glycosylated band (Lane 3; Figure 6B/C) for the ‘Flow Through fraction’. This increased molecular weight was because of the enhanced glycosylation for the sample in the strip fraction. Glycosylation imparts a negative charge on the immunoglobulin making it bind together to the TMAE stationary phase. This is what is eluted using a high salt mobile phase in the ‘strip’ fraction.
There is another interesting insight that we would have potentially missed during downstream development had we not had a “GlycoIg-stain”. It is not uncommon for IgGs to be clipped in the earlier stages of development (Figure 6C – lower molecular weights). We include an alkylating agent (iodoacetamide) in the Laemmli reagent (see methods) to preclude the possibility that these lower molecular weights might be SDS-PAGE artifacts caused by disulfide scrambling (common in IgGs which has multiple cysteine residues). These clippings may be sequence derived and/or a function of cell culture. A comparison of Figure 6B/C demonstrates that the ‘clippings’ are not glycosylated as they are stained by Coomassie but not by the “GlycoIg-stain”.
3. Discussion
We have developed a protocol which involves resolving the samples on an SDS-PAGE gel, followed by staining the gel with “GlycoIg stain” to detect glycoproteins, enabling the QbD paradigm in a seamless, cost-effective manner. It can quickly determine if a protein is glycosylated leveraging the Periodic Acid Schiff (PAS) reaction to specifically detect glycosylated IgGs with oxidizable carbohydrate groups. The PAS reaction uses periodic acid to oxidize the two cis-diol groups to an aldehyde in-situ on the gel. The gel aldehyde is subsequently treated with Schiff reagent which gives a magenta band for the glycosylated protein against a faint-pink background [36].
The method takes less than two hours, and the same SDS-PAGE gel can be sequentially stained for glycosylation and Coomassie respectively, thereby obviating the need to run multiple gels. This facilitates streamlining with routine SDS-PAGE protocols to enable facile adoption. Additionally, this makes the protocol fast, convenient, and cost-effective. The method is semi-quantitative, sensitive (~100ng) and can detect both N-linked and O-linked glycosylation. We also noted that we could derive critical insights by using the “GlycoIg-stain” which we would otherwise have been challenging. For example, the “GlycoIg-stain” helped us to differentiate that the clipped species were aglycosylated whereas the intact molecule was glycosylated. This information could be important in reevaluating the sequence design or the cell culture conditions.
We added an alkylating agent to the samples to prevent SDS-PAGE artifacts - which may be especially more pronounced for immunoglobulins given the enhanced propensity for disulfide scrambling and resulting fragmentation [34,35,36]. However, our method is compatible with sample preparation without the addition of alkylating agents.
We feel that the method can also be extended to stain on nitrocellulose membranes and may be coupled with western blotting. However, one potential drawback of the method is that the staining intensity may potentially be lower for IgGs with fewer glycosylation sites or “sparse” glycan trees than the “heavily” glycosylated immunoglobulins.
Finally, our method may also find use for developing biosimilars which are increasingly becoming important because of the ‘patent cliff’ for original drugs. A comparability analysis for biosimilars is critical to regulatory approval [40]. The FDA [41], WHO [21], and European Medicines Agency (EMA) guidelines [42] all require a detailed study of the glycosylation patterns and emphasizes a QbD comparison with the original drug where possible.
4. Materials and Methods
4.1. Materials
The mAbs used in this study were produced in-house at Pfizer Inc using proprietary cell lines. mAbs 1, 2, 4, and 6 were produced using Chinse Hamster Ovary (CHO) cell lines, and mAbs 3 and 5 were produced in Human embryonic kidney (HEK) 293 cell lines. The Pierce Thermo Scientific Glycoprotein Staining Kit (catalog number 24562) was used to conduct the staining protocol. The reaction conditions and staining protocols were adapted from the published kit protocol to suit the proteins assayed.
4.2. Deglycosylation Reactions
Non-Denaturing Conditions were used for all reactions. Samples with N-linked sugars were deglycosylated in reactions containing 1X Glycobuffer 2 and 1:5 µg/µl glycoprotein: PNGase F ratio. Reactions were incubated at 37°C for 16-24 hours. Glycoproteins with O-linked sugars were deglycosylated in 1X Deglycosylation Mix Buffer 1, 1X Deglycosylation Mix II, and incubated at 37°C for 16-24 hours with O-Glycosidase. Following incubation, the samples were analyzed using SDS-PAGE. If a shift is seen when the sample is treated with the enzymes, but not with the untreated sample – we can deduce that the sample is glycosylated.
4.3. SDS-PAGE
Samples were mixed to a final concentration of 1X Laemmli Sample Buffer (Bio-Rad 1610747). Reduced samples were mixed with 10% v/v Bond Breaker TCEP Solution (Thermo Scientific™ 77720). Samples were alkylated using iodoacetamide to a final concentration of 50 uM to prevent SDS-PAGE artifacts, due to susceptible disulfide bonds in IgG’s [34,35,36]. All samples were then incubated for 10 minutes at 70°C and loaded into 4-15% Tris-Glycine gels. Gels were electrophoresed at 300V for 25 minutes at 25°C.
4.4. “GlycoIg-stain” or staining SDS gel for Glycosylation and Counterstaining with Coomassie
After electrophoresis, the gels were fixed and stained using the Pierce Thermo Scientific Glycoprotein Staining Kit. All incubations were conducted with gentle agitation. The gels were first fixed in 50% methanol for 30 minutes. Two subsequent washes were performed, each with 3% acetic acid for 10 minutes. After this, the gel was incubated with Oxidizing Solution for 15 minutes – and then washed with 3% acetic acid for thrice for 5 minutes. The gels were then incubated in Glycoprotein stain for 15 minutes and transferred to the Reducing Solution for a 5-minute incubation. Finally, the gels were washed 3 x 10 minutes in 3% acetic acid, and imaged. Glycoproteins appear as magenta bands. The gels can be stored in 3% acetic acid.
Glycoprotein gels were counterstained using traditional Coomassie staining techniques. Briefly, gels were rinsed with ddH2O and incubated with agitation for 30 minutes in Bio-Safe™ Coomassie Stain (Bio-Rad, #1610786). Gels were then destained with Coomassie Brilliant Blue R-250 Destaining Solution (Bio-Rad #1610439) for 30 minutes, and imaged.
4.5. Gel Imaging and Band Quantitation
Glycoprotein Gels were imaged using a Gel Doc EZ system (Bio-Rad). Both ImageLab (BioRad) and ImageJ FIJI software were used to quantitate protein bands. Area under curve (AUC) intensities were used for quantification.
4.6. Limits of Detection Quantitation
To determine the Limits of Detection (LoD) for the Glycostained gels, dilutions of proteins were made from 10ng-5000ng. These samples were run on gels, stained, and quantitated as above. The values were linear fit to a standard curve, and the LoD were calculated.
5. Conclusion
Since the glycosylation profile and diversity can be affected by subtle changes upstream and chromatographic processes downstream, it is imperative to develop a tool that can be integrated with common biochemistry protocols to study both glycosylated and aglycosylated immunoglobulins. We have demonstrated a novel methodology that selectively stains glycosylated immunoglobulins, but not aglycosylated IgGs on an SDS-PAGE gel. The staining of glycoproteins is enabled by selective in situ oxidation of cis-diol groups on the carbohydrate (and not alcohol groups of the amino acids) to aldehyde directly on the polyacrylamide gel. This selective oxidation is carried out by incubating the polyacrylamide gel in periodic acid. These aldehydes are then detected by Schiff reaction and appears as magenta bands of the SDS-PAGE gel.
An experimentally determined glycosylation level is one of the several CQAs that must be specified to regulatory agencies as this has been shown to affect safety and efficacy of IgG therapeutics. The ability to control and analyze glycosylation levels needs to be demonstrated to regulatory agencies before approval. Indeed, both WHO [21]and International Conference on Harmonization (ICH) Q6B [22] require pharmaceutical companies to identify and characterize most PTMs including glycosylation. Thus, the monitoring and characterization of glycans through the development process is an essential part of any successful QC (quality control) endeavor.
The QC challenges are accentuated by the fact that there are two types of glycosylation, N-linked and O-linked. An immunoglobulin can be glycosylated by one or more linkages. Both these types of glycosylation affect protein conformation, folding, processing and secretion (endoplasmic reticulum and Golgi apparatus), degradation and biological activity [23]. Indeed, anomalous glycosylation has been linked with various kinds of diseases, including neurodegenerative [23], congenital [25], various autoimmune diseases [12], and cancer [26]. Additionally, they affect protein purity and titer – important from a cost of goods (COGS) perspective for pharmaceutical companies
An oligosaccharide is “N-linked” through the amide group of an asparagine residue located in a consensus NXS/T sequence (X can be any amino acid except proline). Unlike O-glycosylation, N-glycosylation is unique to proteins that are secreted [25]. Interestingly, the assembly of N-glycans commences as a Glc3Man9GlcNAc2 in the ER, but is transferred to the Golgi only if the protein folds correctly – as a Man8GlcNAc2 [28]. In the Golgi, the glycosylation can continue as a high-mannose or some glycans may be interchanged to form a hybrid “tree-like” bi, tri, or a quaternary structure.
An oligosaccharide is “O-linked” through the hydroxyl group of a serine/threonine residue in an IgG. However, unlike N-linked glycosylation, O-linked glycosylation does not have a consensus site [29]. The common O-linked glycosylations are O-acetylgalactosamine (O-GalNAc), linked via an α-linkage of an O-glycosidic bond. Another O-linked glycosylation is the O-acetylglucosamine (O-GlcNAc), which is linked through β-linkage of an O-glycosidic bond. The most common O-GlcNAc are mucins. O-glycosylation variations can be quite diverse with monosaccharides and/or oligosaccharides. Multiple immunological diseases can be caused by mucin O-glycan aberrations [30].
Monitoring this diversity in N-linked and O-linked glycosylation can be challenging. For this, the regulator agencies recommend a QbD approach to integrate our findings at each step of the development process. QbD is at its core a conceptual framework that is to be adopted through development into manufacturing such that product quality can be built into the process – however, this needs immaculate analytical processes to monitor glycosylation at every stage [31]. To implement a QbD framework, the optimal target product profile (TPP) of the biotherapeutic which is appropriate for clinical efficacy needs to be established. Following this, the critical process parameters (CPPs) that may affect the TPP and the critical quality attributes (CQAs) of the drug can be studied thoroughly [32]. The CPPs need to be studied in real-time (if possible) by process analytical technology (PAT) to ensure appropriate drug attributes [33].
It is appreciated that implementing QbD for biologics is generally a greater challenge than small molecules given the general complexity of biotherapeutics [33]. A simple gel-based monitoring method which can be run in a basic biochemistry lab would be a big step ahead towards this QbD paradigm as it would allow a near real-time assessment of glycosylation parameters.
Two such techniques, alcian blue gel and Stains-All gel [32,33] were developed for staining proteoglycans, glycosaminoglycans, and negatively charged glycoproteins. However, these were non-specific and stained all negatively charged proteins including phosphoproteins. Thus, they could not be adopted to study glycosylation. Another common method is to study the mobility shift post enzymatic digestion with PNGase F (PNGase F is an enzyme that removed N-linked glycans). PNGase F is widely used in the industry as it has the broadest specificity and can completely remove the sugar chains without protein degradation. Other enzymes are more specific with regards to the type of N-glycan they cleave. However, this method is not quantitative and perhaps more importantly, it is an indirect method that relies on how amenable the glycoprotein is to the enzymatic digestion. A comparison of this common enzymatic method with the method we developed is demonstrated in Table 2.
Data Availability
The datasets generated and/or analysed during the current study are not publicly available due as they are proprietary but are available from the corresponding author on reasonable request and with permission of Pfizer.
References
- Parodi, A.J., Protein glucosylation and its role in protein folding. Annu Rev Biochem, 2000. 69: p. 69-93. [CrossRef]
- Moremen, K.W., M. Tiemeyer, and A.V. Nairn, Vertebrate protein glycosylation: diversity, synthesis and function. Nat Rev Mol Cell Biol, 2012. 13(7): p. 448-62. [CrossRef]
- Wearsch, P.A., D.R. Peaper, and P. Cresswell, Essential glycan-dependent interactions optimize MHC class I peptide loading. Proc Natl Acad Sci U S A, 2011. 108(12): p. 4950-5. [CrossRef]
- Hayes, J.M., et al., Glycosylation and Fc receptors. Curr Top Microbiol Immunol, 2014. 382: p. 165-99. [CrossRef]
- Sinclair, A.M., Erythropoiesis stimulating agents: approaches to modulate activity. Biologics, 2013. 7: p. 161-74. [CrossRef]
- Chung, C.H., et al., Cetuximab-induced anaphylaxis and IgE specific for galactose-alpha-1,3-galactose. N Engl J Med, 2008. 358(11): p. 1109-17. [CrossRef]
- Shinkawa, T., et al., The absence of fucose but not the presence of galactose or bisecting N-acetylglucosamine of human IgG1 complex-type oligosaccharides shows the critical role of enhancing antibody-dependent cellular cytotoxicity. J Biol Chem, 2003. 278(5): p. 3466-73. [CrossRef]
- Walsh, G., Biopharmaceutical benchmarks 2014. Nat Biotechnol, 2014. 32(10): p. 992-1000. [CrossRef]
- Rudd, P.M., et al., Glycosylation and the immune system. Science, 2001. 291(5512): p. 2370-6. [CrossRef]
- Daëron, M., Fc receptors as adaptive immunoreceptors. Curr Top Microbiol Immunol, 2014. 382: p. 131-64. [CrossRef]
- Lauc, G., et al., Loci associated with N-glycosylation of human immunoglobulin G show pleiotropy with autoimmune diseases and haematological cancers. PLoS Genet, 2013. 9(1): p. e1003225. [CrossRef]
- Saldova, R., et al., 5-AZA-2'-deoxycytidine induced demethylation influences N-glycosylation of secreted glycoproteins in ovarian cancer. Epigenetics, 2011. 6(11): p. 1362-72. [CrossRef]
- Hossler, P., S.F. Khattak, and Z.J. Li, Optimal and consistent protein glycosylation in mammalian cell culture. Glycobiology, 2009. 19(9): p. 936-49. [CrossRef]
- El Khoury, G., et al., Bespoke affinity ligands for the purification of therapeutic proteins. Pharmaceutical Bioprocessing, 2015. 3(2): p. 139-152. [CrossRef]
- Liu, H.F., et al., Recovery and purification process development for monoclonal antibody production. MAbs, 2010. 2(5): p. 480-99. [CrossRef]
- Mariño, K., et al., A systematic approach to protein glycosylation analysis: a path through the maze. Nat Chem Biol, 2010. 6(10): p. 713-23. [CrossRef]
- Beck, A., et al., Characterization of therapeutic antibodies and related products. Anal Chem, 2013. 85(2): p. 715-36. [CrossRef]
- Baković, M.P., et al., High-throughput IgG Fc N-glycosylation profiling by mass spectrometry of glycopeptides. J Proteome Res, 2013. 12(2): p. 821-31. [CrossRef]
- Zaia, J., Mass spectrometry and the emerging field of glycomics. Chem Biol, 2008. 15(9): p. 881-92. [CrossRef]
- Mittermayr, S., et al., Multiplexed analytical glycomics: rapid and confident IgG N-glycan structural elucidation. J Proteome Res, 2011. 10(8): p. 3820-9. [CrossRef]
- Varki, A., Biological roles of oligosaccharides: all of the theories are correct. Glycobiology, 1993. 3(2): p. 97-130. [CrossRef]
- Lefebvre, T., et al., Does O-GlcNAc play a role in neurodegenerative diseases? Expert Rev Proteomics, 2005. 2(2): p. 265-75. [CrossRef]
- Eklund, E.A. and H.H. Freeze, The congenital disorders of glycosylation: a multifaceted group of syndromes. NeuroRx, 2006. 3(2): p. 254-63. [CrossRef]
- Helenius, A. and M. Aebi, Intracellular functions of N-linked glycans. Science, 2001. 291(5512): p. 2364-9. [CrossRef]
- Ellgaard, L., M. Molinari, and A. Helenius, Setting the standards: quality control in the secretory pathway. Science, 1999. 286(5446): p. 1882-8. [CrossRef]
- Essentials of Glycobiology, in Essentials of Glycobiology, A. Varki, et al., Editors. 2009, Cold Spring Harbor Laboratory Press Copyright © 2009, The Consortium of Glycobiology Editors, La Jolla, California.: Cold Spring Harbor (NY).
- Tabak, L.A., The role of mucin-type O-glycans in eukaryotic development. Semin Cell Dev Biol, 2010. 21(6): p. 616-21. [CrossRef]
- Jedrzejewski, P.M., et al., Applying quality by design to glycoprotein therapeutics: experimental and computational efforts of process control. Pharmaceutical Bioprocessing, 2013. 1(1): p. 51-69. [CrossRef]
- del Val, I.J., C. Kontoravdi, and J.M. Nagy, Towards the implementation of quality by design to the production of therapeutic monoclonal antibodies with desired glycosylation patterns. Biotechnol Prog, 2010. 26(6): p. 1505-27. [CrossRef]
- Rathore, A.S., Roadmap for implementation of quality by design (QbD) for biotechnology products. Trends Biotechnol, 2009. 27(9): p. 546-53. [CrossRef]
- Wardi, A.H. and G.A. Michos, Alcian blue staining of glycoproteins in acrylamide disc electrophoresis. Anal Biochem, 1972. 49(2): p. 607-9. [CrossRef]
- Green, M.R., J.V. Pastewka, and A.C. Peacock, Differential staining of phosphoproteins on polyacrylamide gels with a cationic carbocyanine dye. Anal Biochem, 1973. 56(1): p. 43-51. [CrossRef]
- Clarke, J.T., SIMPLIFIED "DISC" (POLYACRYLAMIDE GEL) ELECTROPHORESIS. Ann N Y Acad Sci, 1964. 121: p. 428-36.
- Schiestl, M., et al., Acceptable changes in quality attributes of glycosylated biopharmaceuticals. Nat Biotechnol, 2011. 29(4): p. 310-2. [CrossRef]
- Research, C.f.D.E.a.R.C.f.B.E.a., Quality Considerations in Demonstrating Biosimilarity of a Therapeutic Protein Product to a Reference Product Guidance for Industry. FDA Guidance Document, 2015. FDA-2011-D-0602.
- Use, C.f.M.P.f.H., Guideline on similar biological medicinal products containing biotechnology-derived proteins as active substance: quality issues (revision 1). European Medicines Agency, 2014.
- Liu, H., et al., Characterization of lower molecular weight artifact bands of recombinant monoclonal IgG1 antibodies on non-reducing SDS-PAGE. Biotechnol Lett, 2007. 29(11): p. 1611-22. [CrossRef]
- Taylor, F.R., et al., Suppression of sodium dodecyl sulfate-polyacrylamide gel electrophoresis sample preparation artifacts for analysis of IgG4 half-antibody. Anal Biochem, 2006. 353(2): p. 204-8. [CrossRef]
- Zhu, Z.C., et al., Investigation of monoclonal antibody fragmentation artifacts in non-reducing SDS-PAGE. J Pharm Biomed Anal, 2013. 83: p. 89-95. [CrossRef]
Figure 1.
A – Mechanism of Periodic Acid Oxidation and “GlycoIg stain”; B – Pictorial representation of glycosylated ‘magenta’ bands.
Figure 1.
A – Mechanism of Periodic Acid Oxidation and “GlycoIg stain”; B – Pictorial representation of glycosylated ‘magenta’ bands.
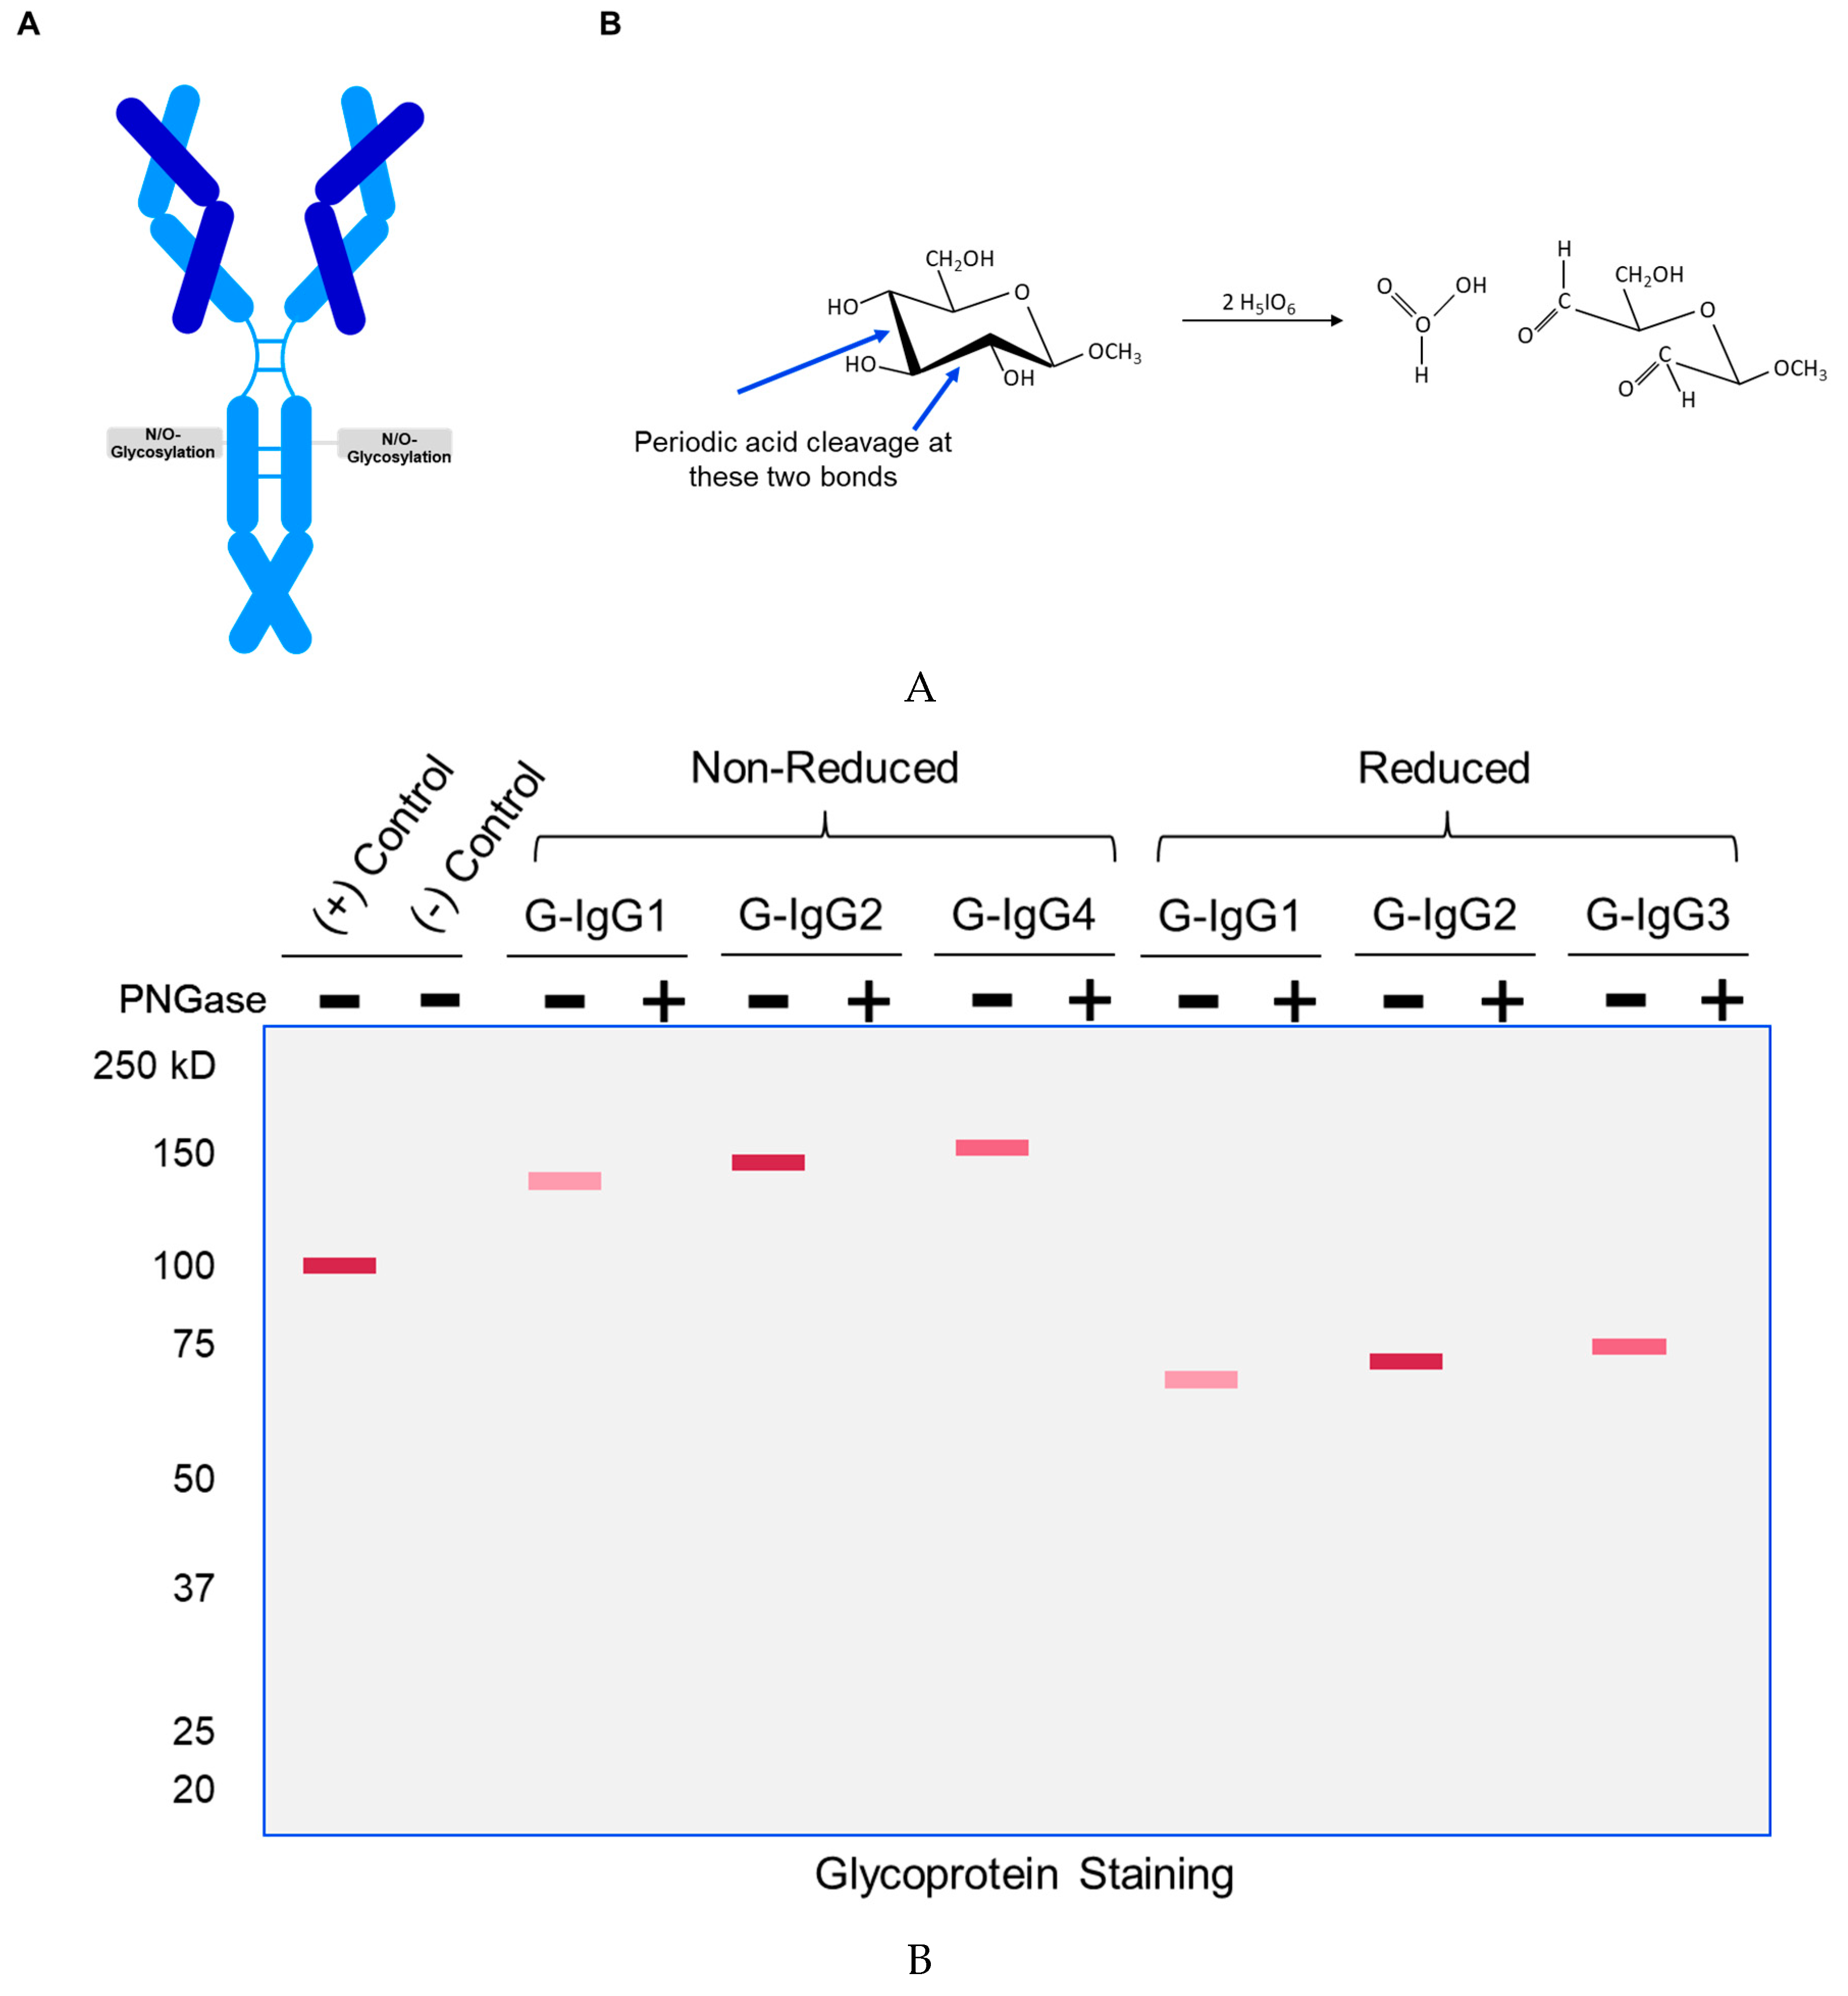
Figure 2.
“GlycoIg-stain” detects glycosylation on SDS-PAGE gel. 2A: SDS-PAGE gel with “glycol stain”. 2B: SDS-PAGE gel counterstained with Coomassie. 2C: Scanned image for SDS-PAGE gel in Figure 2.
Figure 2.
“GlycoIg-stain” detects glycosylation on SDS-PAGE gel. 2A: SDS-PAGE gel with “glycol stain”. 2B: SDS-PAGE gel counterstained with Coomassie. 2C: Scanned image for SDS-PAGE gel in Figure 2.
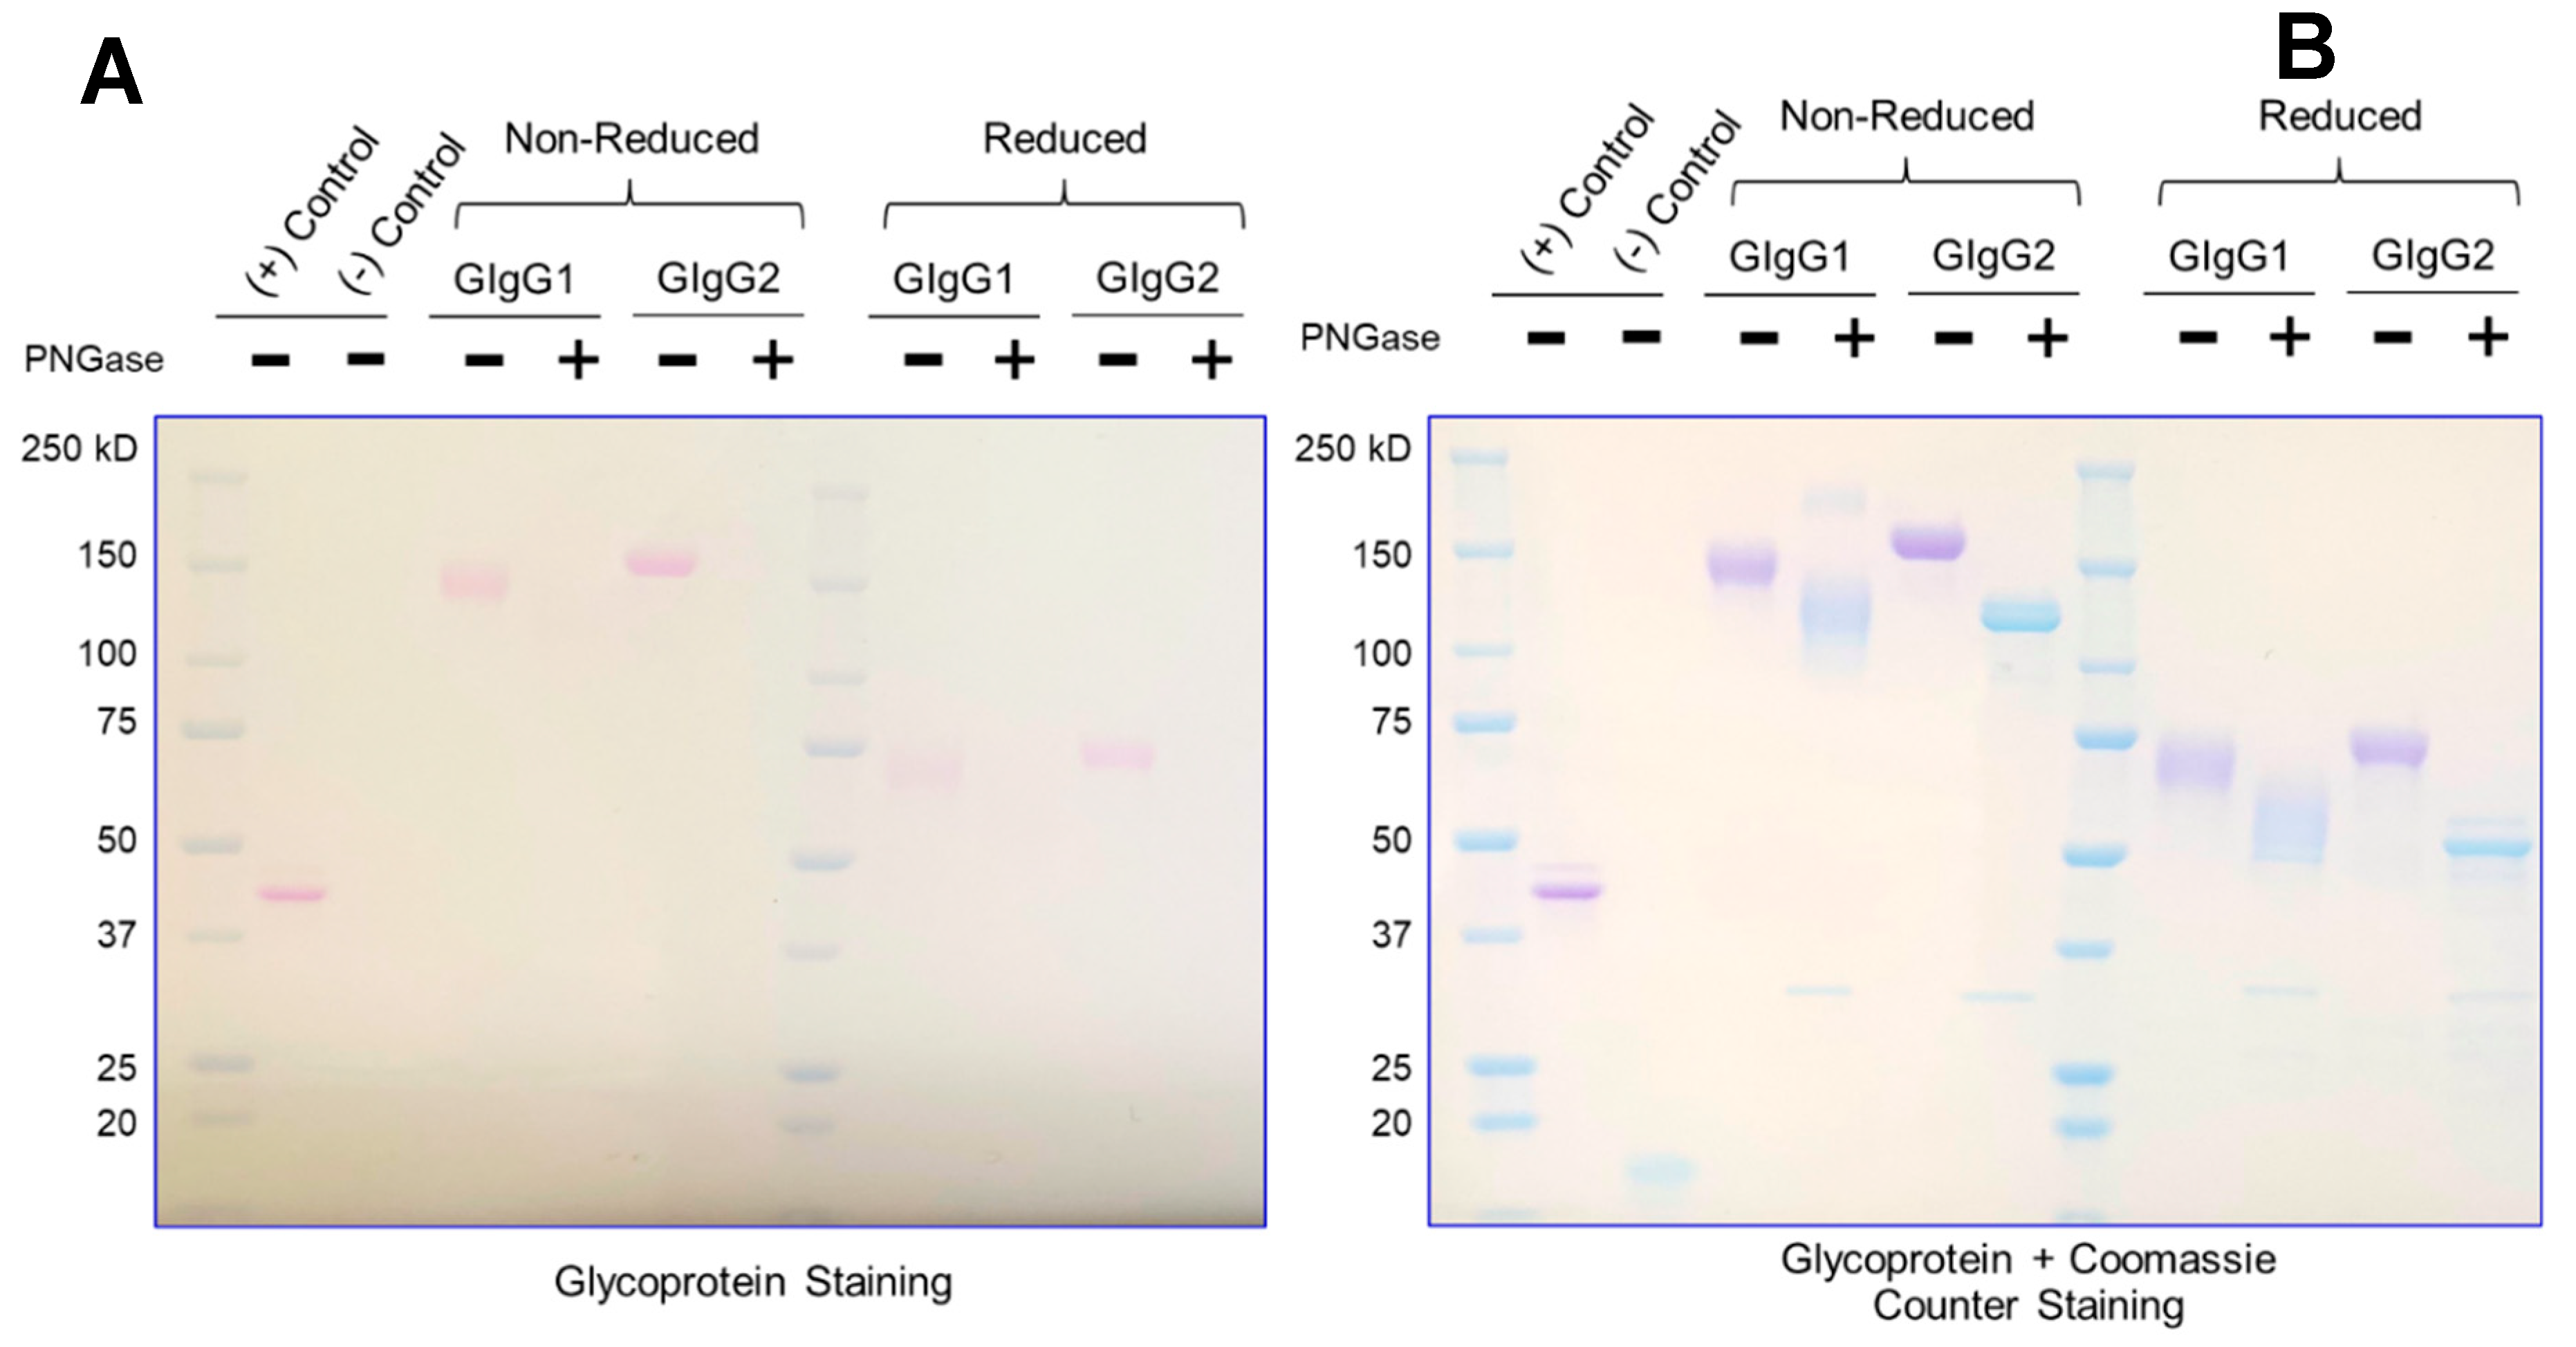
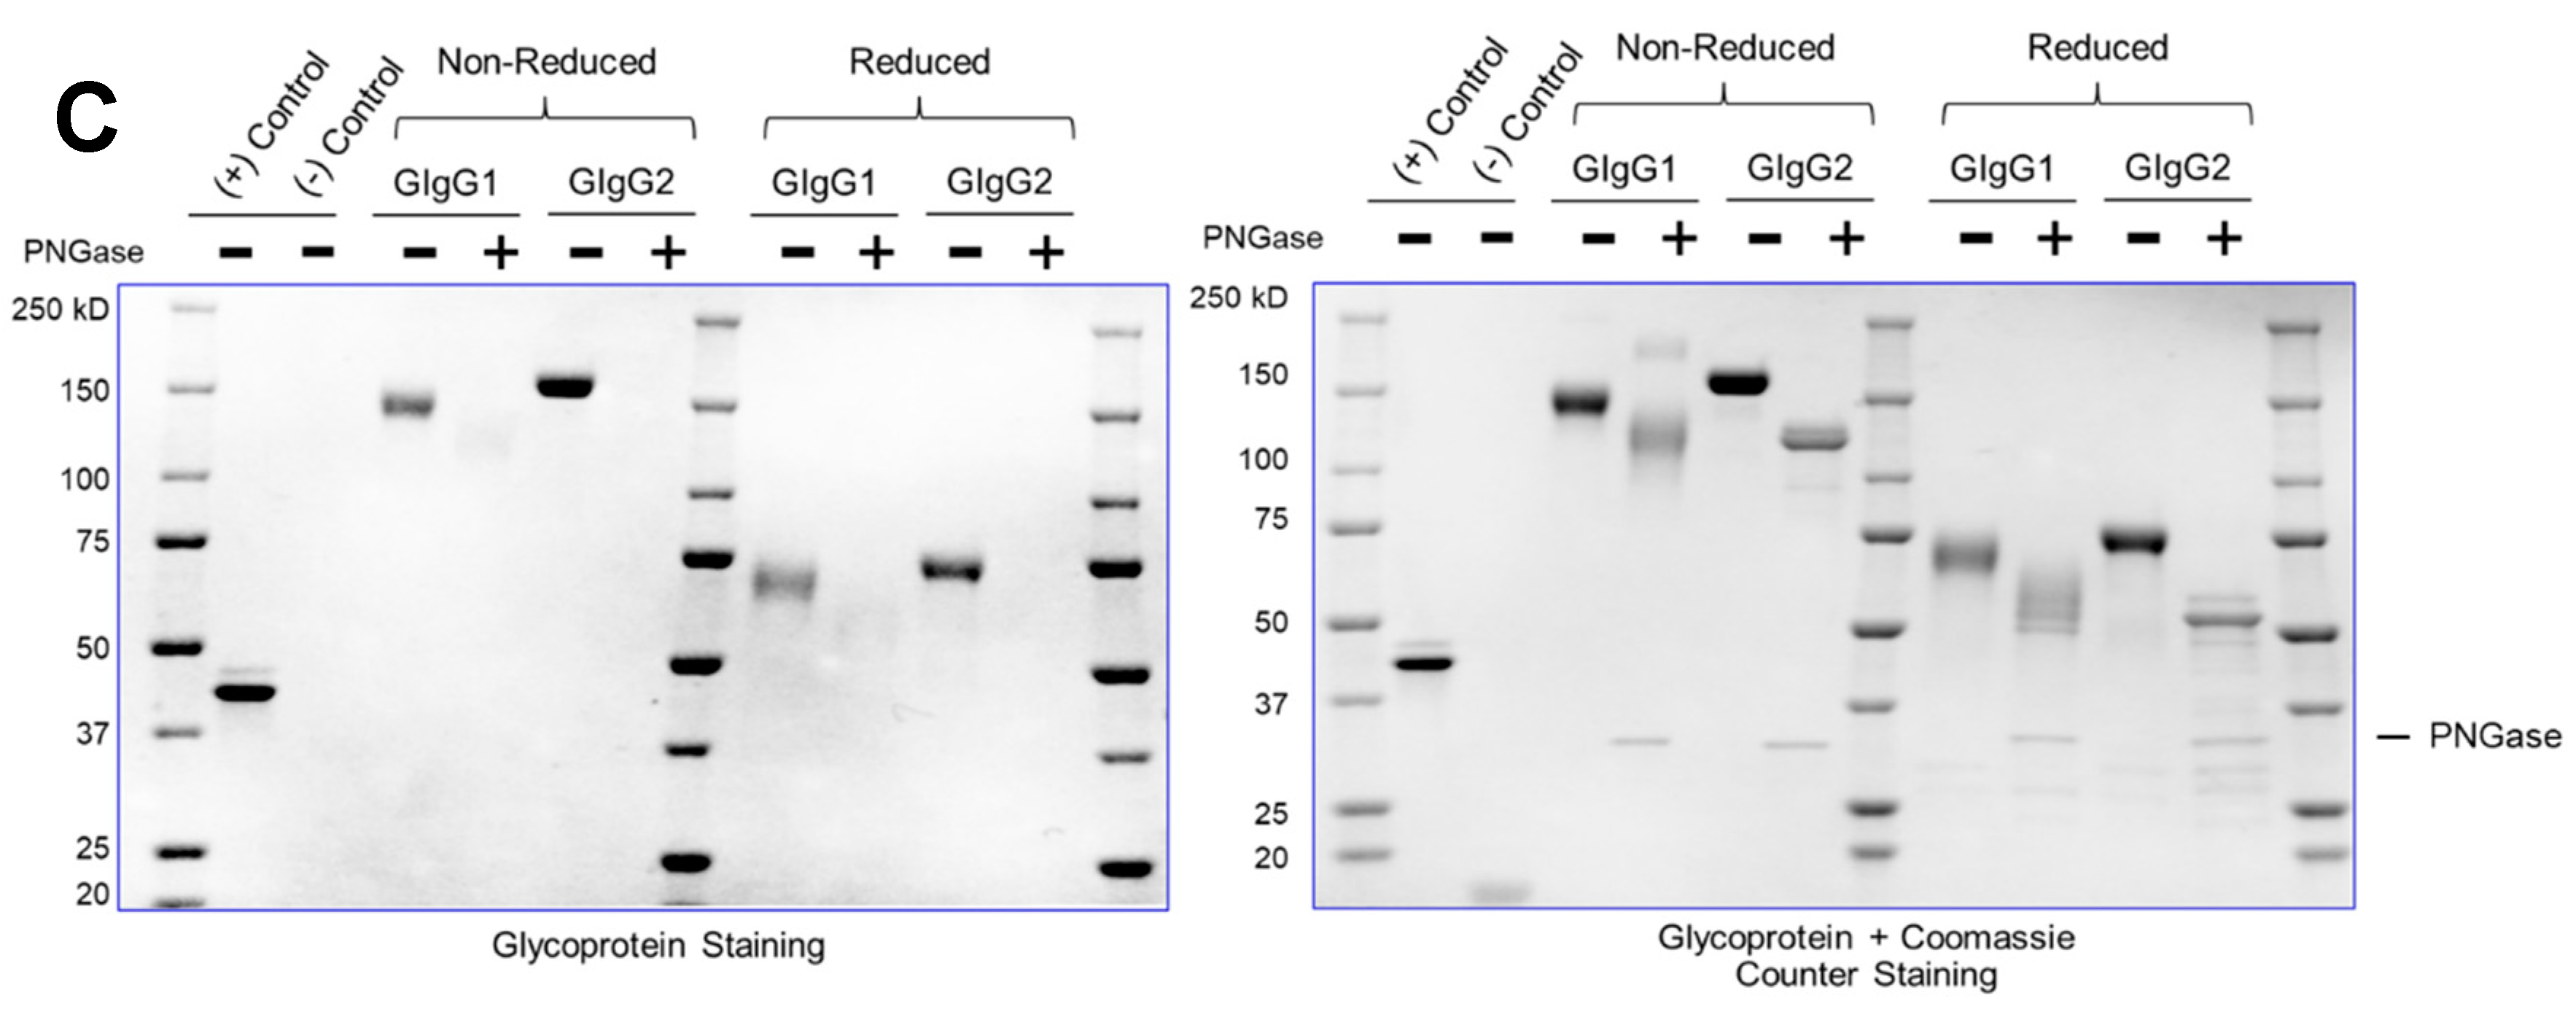
Figure 3.
Staining is semi-quantitative. 3A: Analysis of different loads of G-IGG2 by “GlycoIg-stain”. 3B: Regression Analysis to evaluated Limits of Detection (Lod) and Limits of Quantitation (LoQ).
Figure 3.
Staining is semi-quantitative. 3A: Analysis of different loads of G-IGG2 by “GlycoIg-stain”. 3B: Regression Analysis to evaluated Limits of Detection (Lod) and Limits of Quantitation (LoQ).
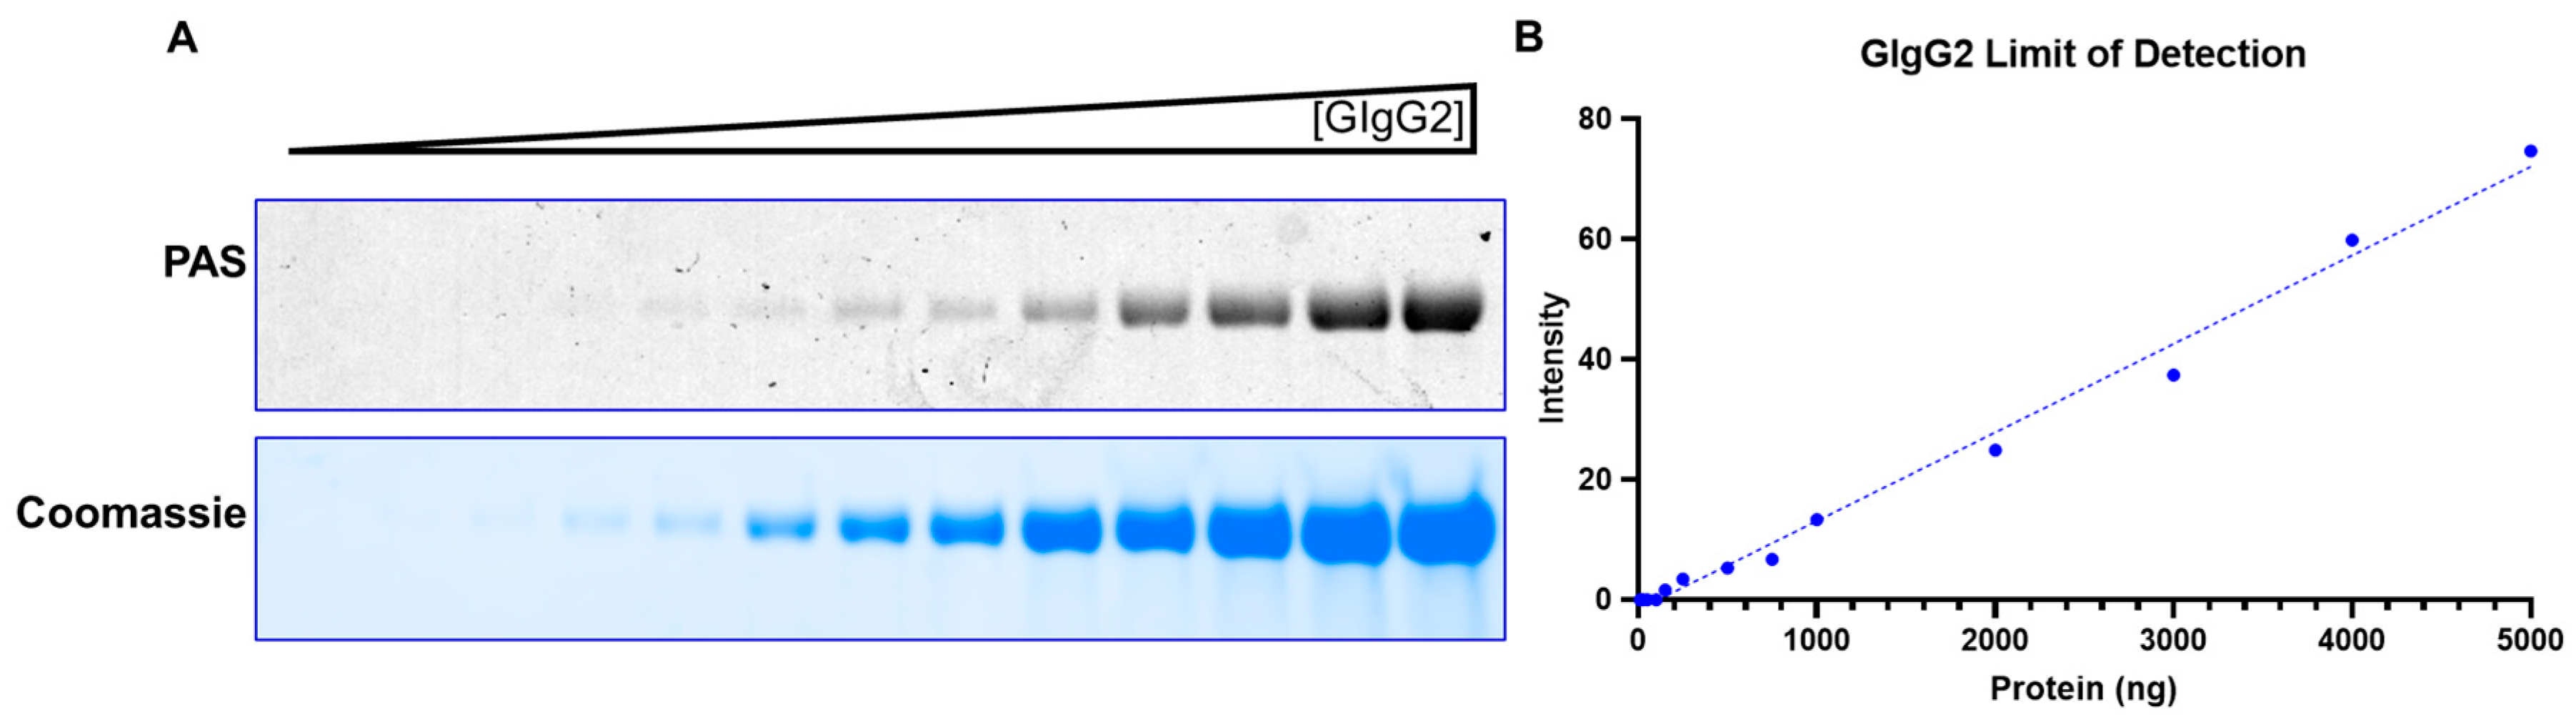
Figure 4.
Glycoprotein staining is cell-line independent. 4A: “GlycoIg-stain” for G-IGG1 produced in HEK and CHO cell lines. 4B: SDS-PAGE gel counterstained with Coomassie.
Figure 4.
Glycoprotein staining is cell-line independent. 4A: “GlycoIg-stain” for G-IGG1 produced in HEK and CHO cell lines. 4B: SDS-PAGE gel counterstained with Coomassie.
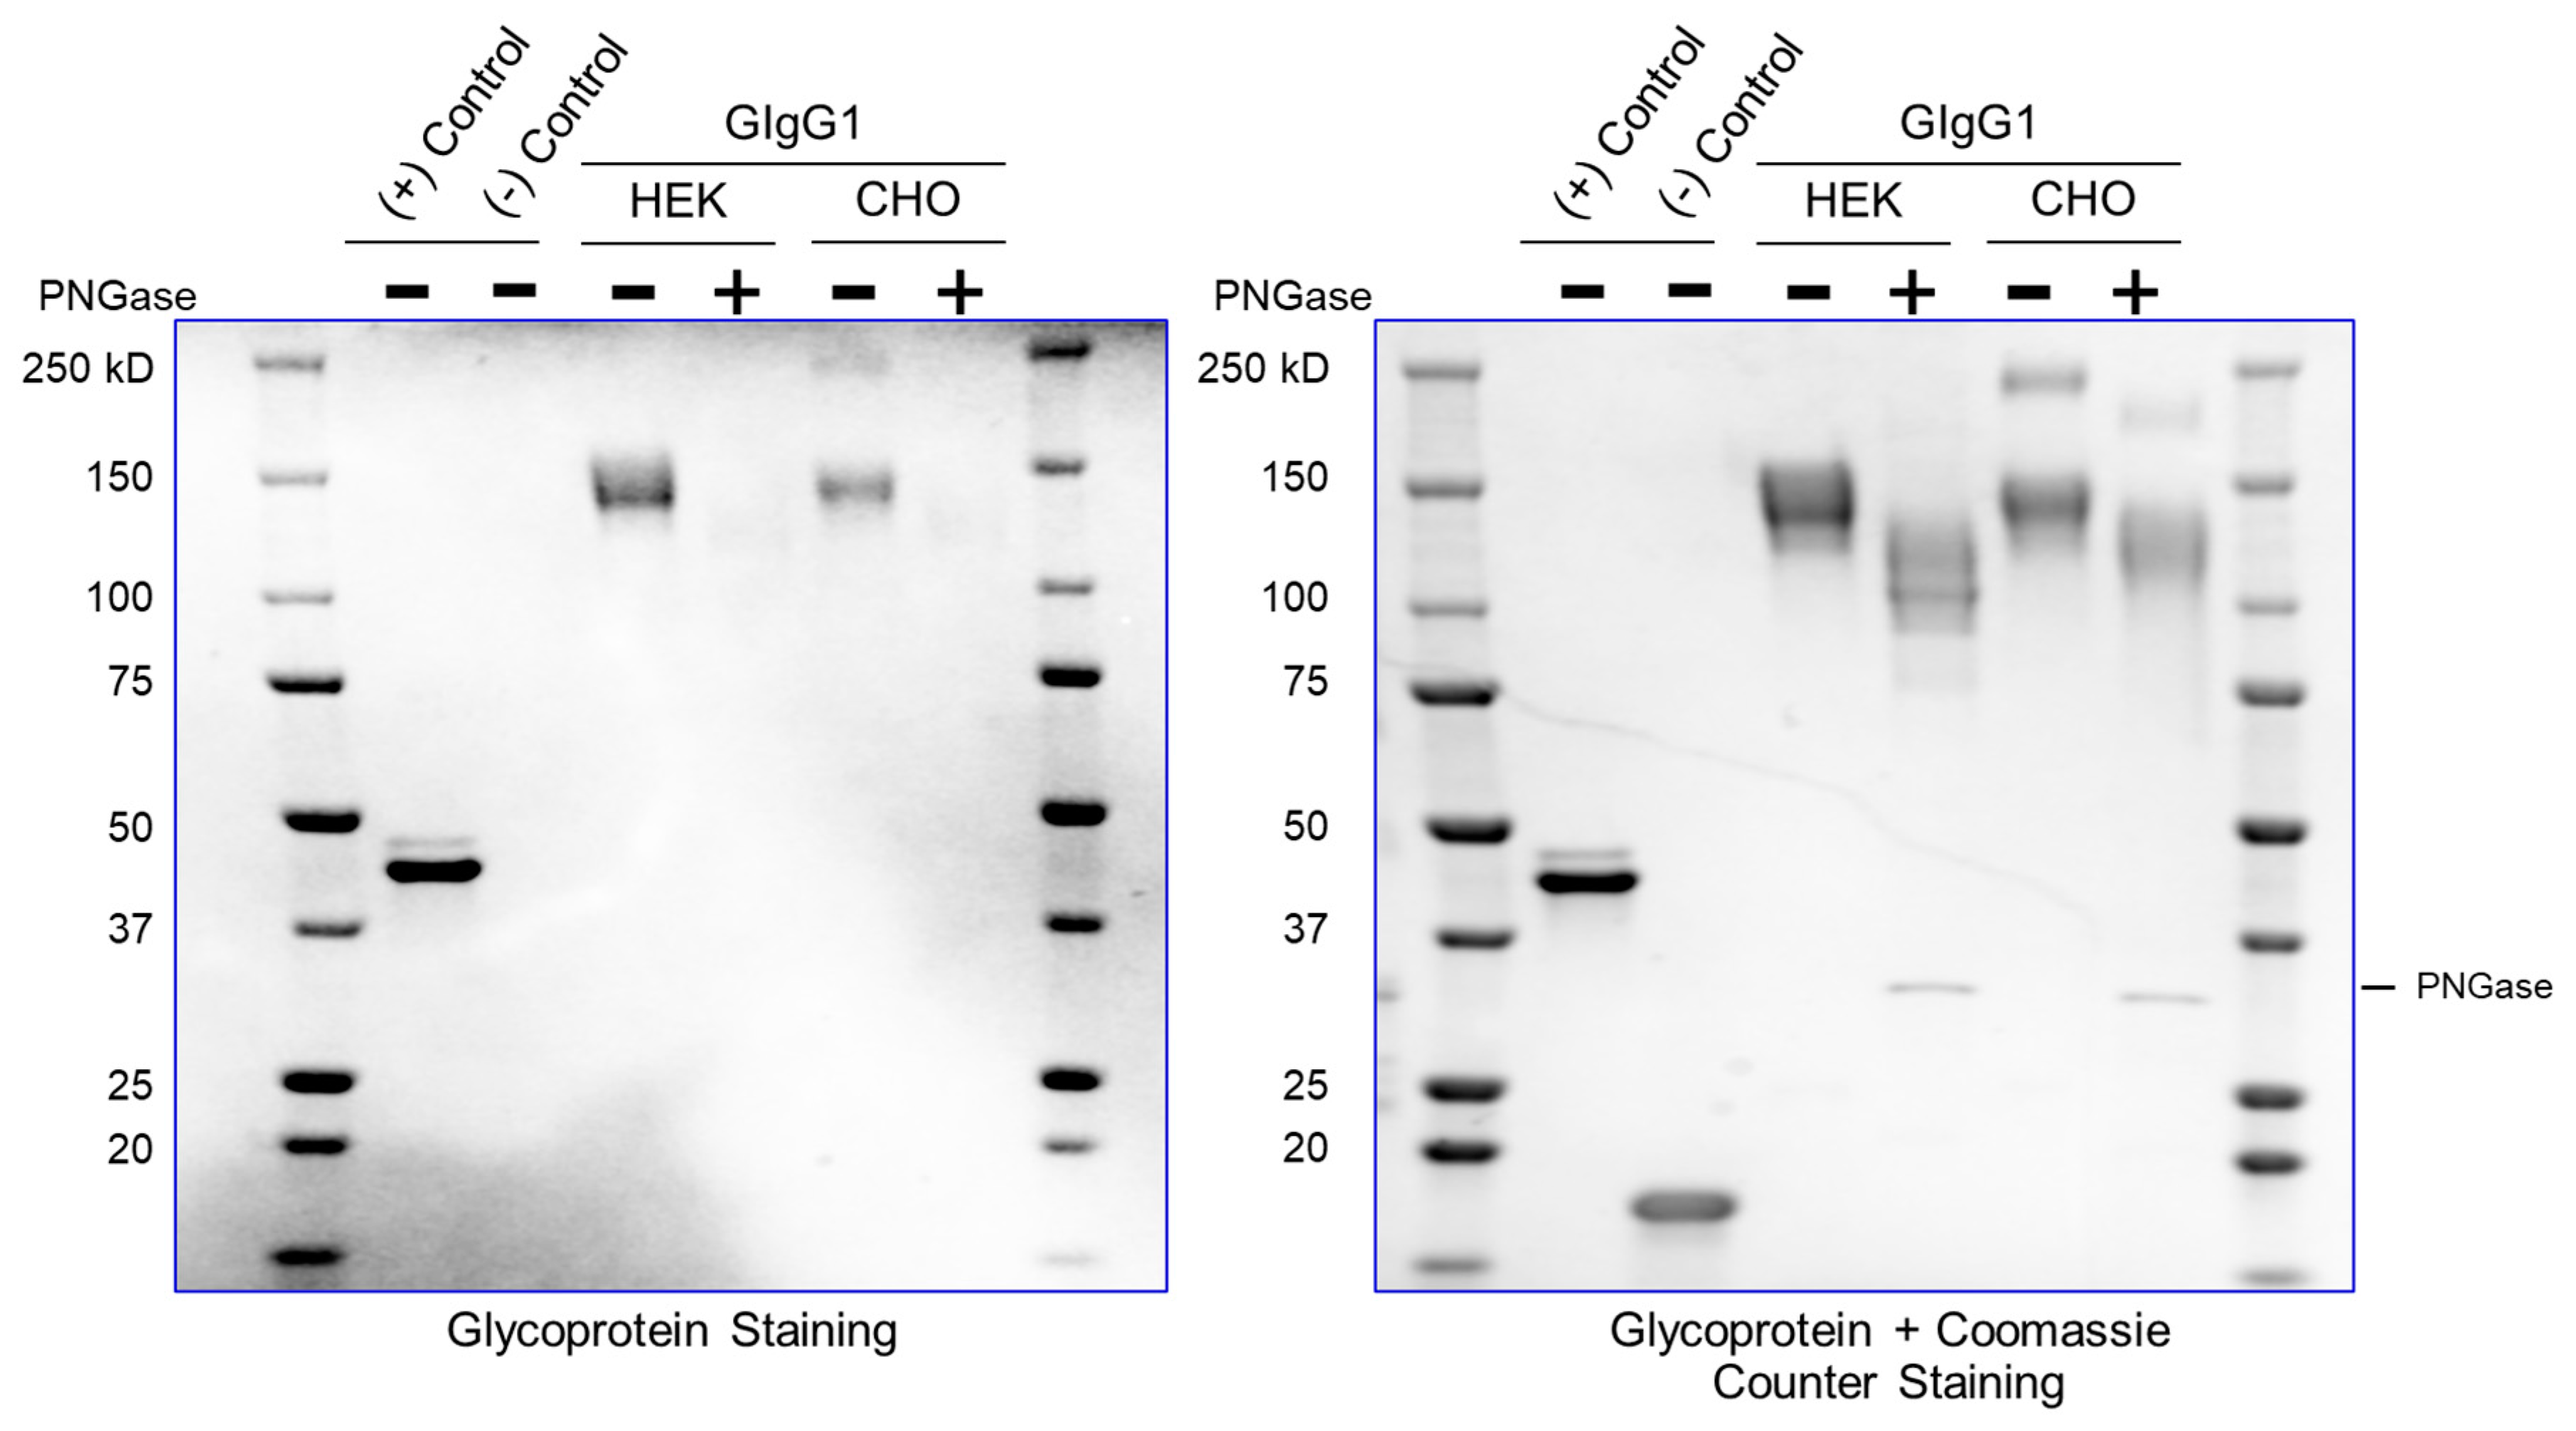
Figure 5.
“GlycoIg-stain” can detect both linkages (N-linked and O-linked glycosylation) produced from either HEK or CHO cell lines. 5A: “GlycoIg-stain” for G-IGG3 (N-linked and O-linked glycosylation) produced in HEK and CHO cell lines. 5B: SDS-PAGE gel counterstained with Coomassie. 5C: aHIC chromatography as an analytical tool to study glycosylation.
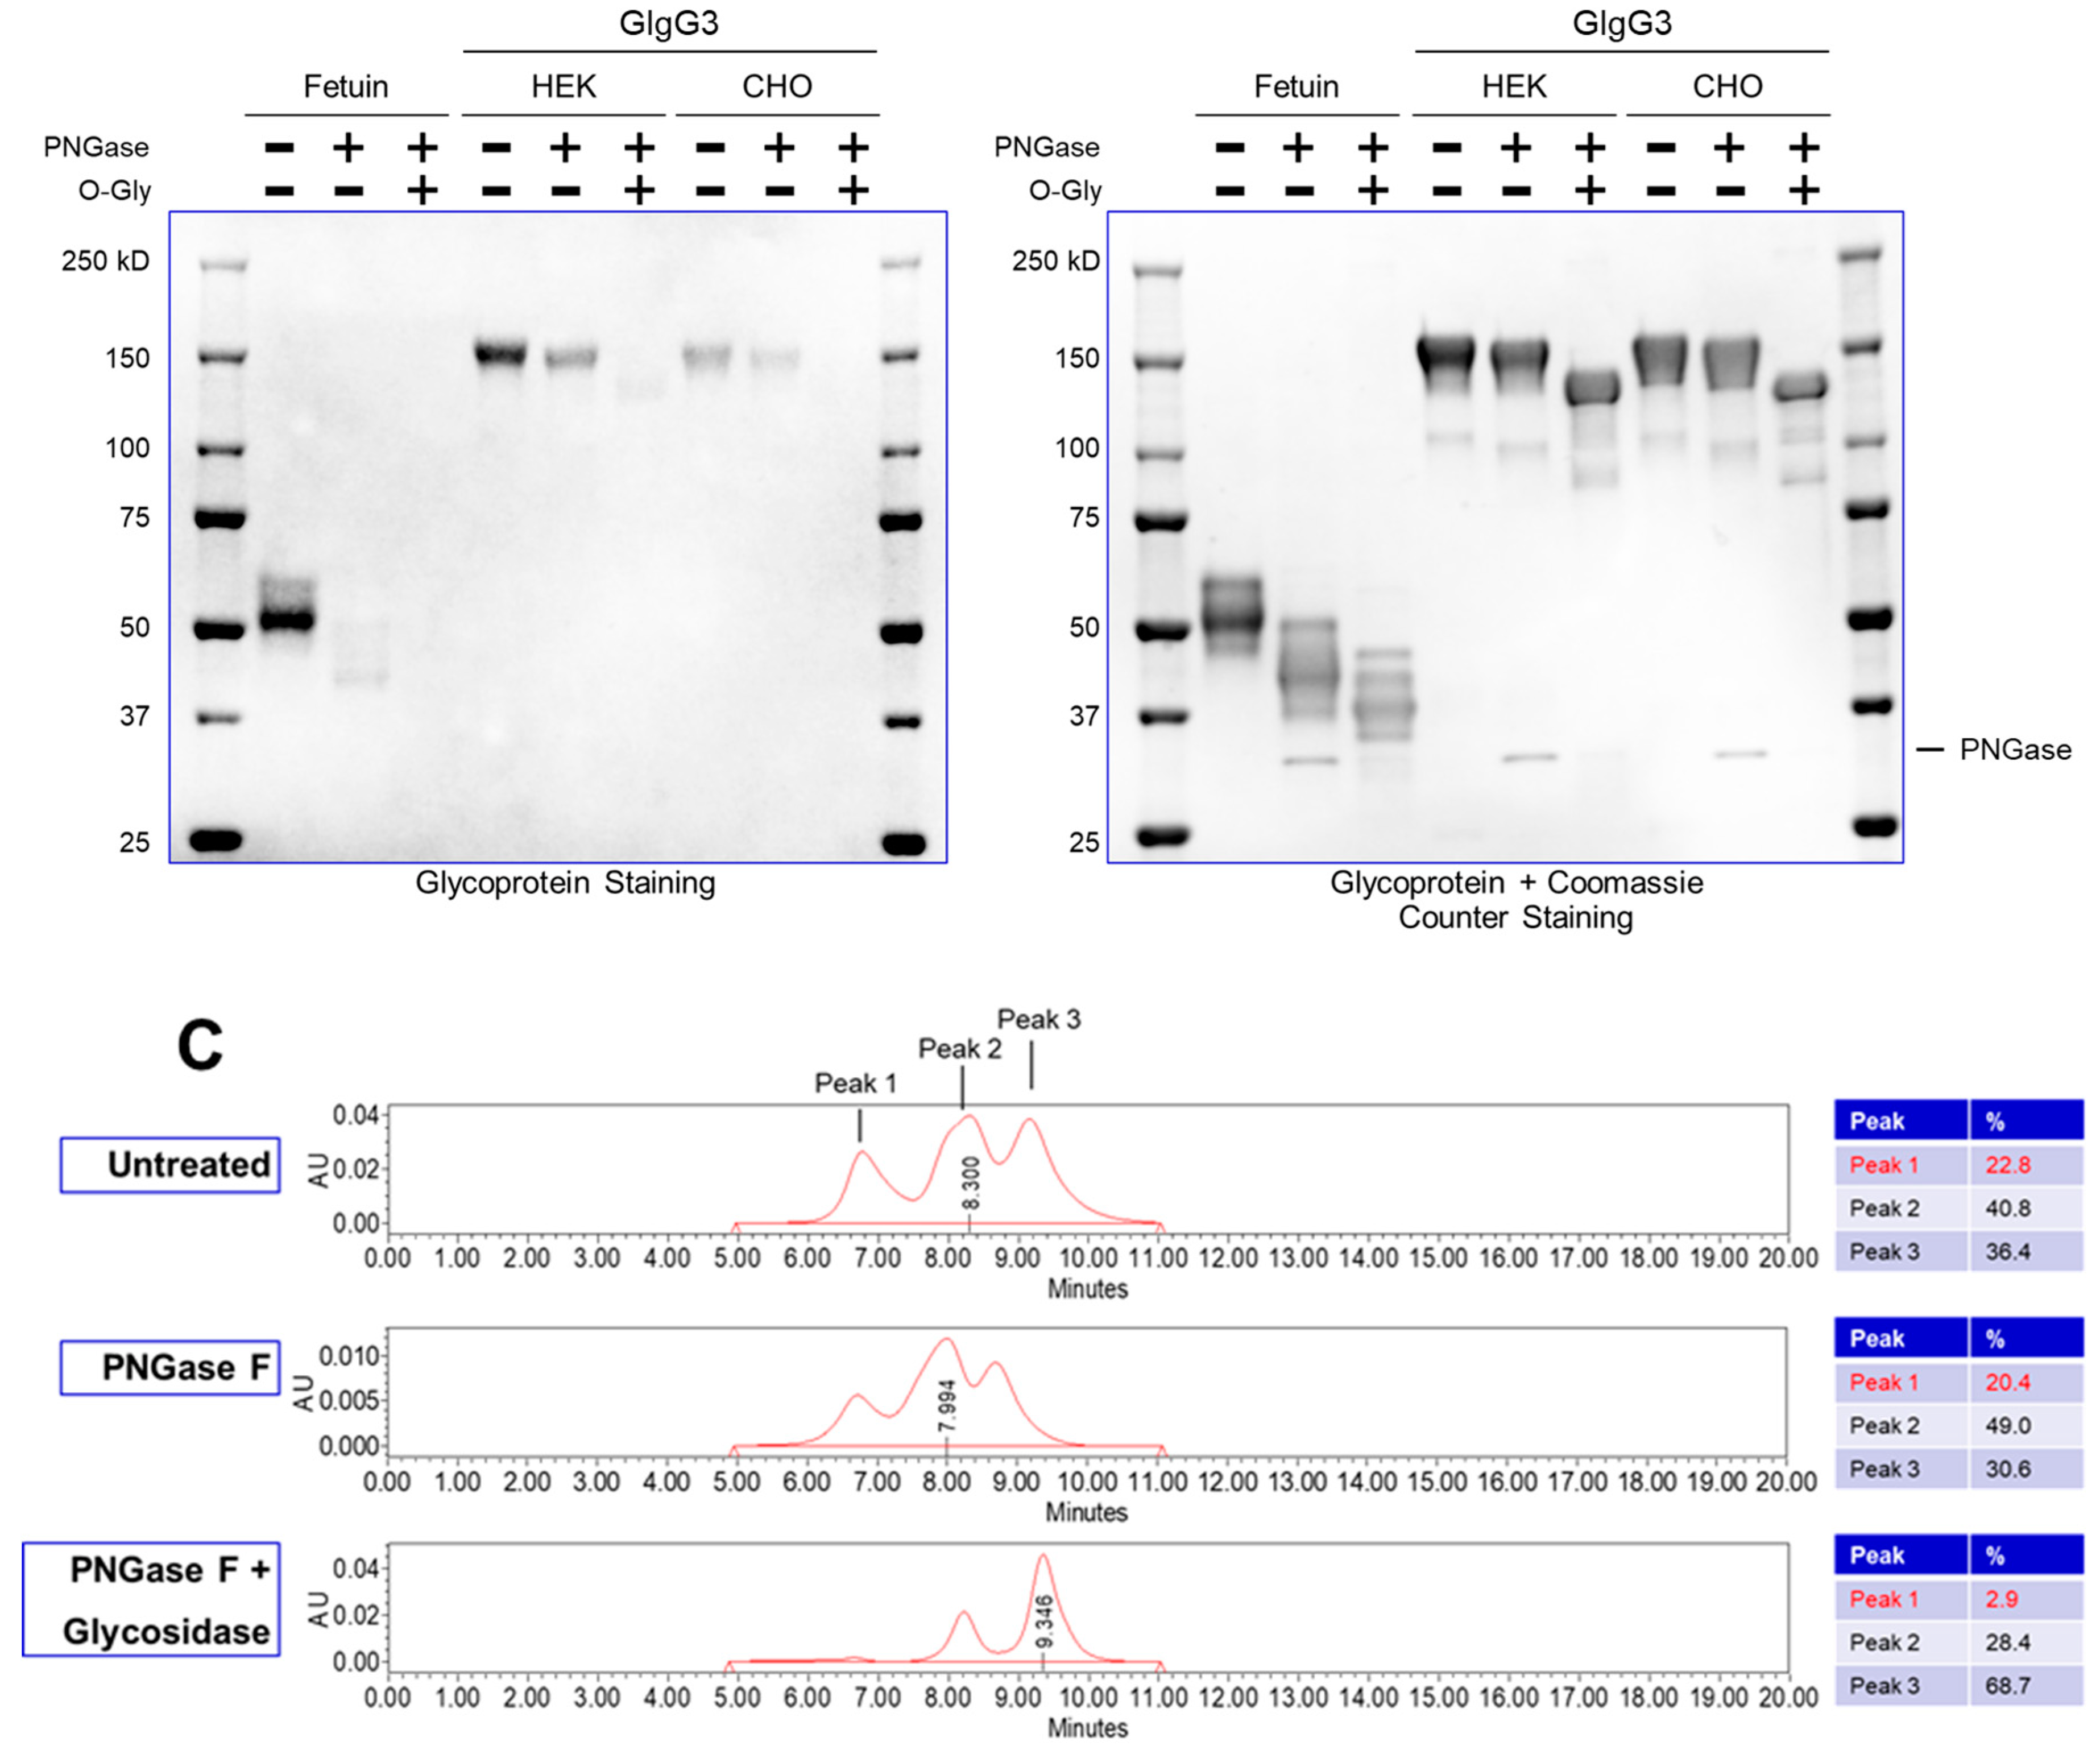
Figure 6.
Rapid glycan detection using “GlycoIg-stain” following ion-exchange chromatography. 6A: Anion-exchange (TMAE purification) for G-IgG4. 6B: “GlycoIg-stain” facilitates rapid detection during purification process. 6C: SDS-PAGE gel counterstained with Coomassie.
Figure 6.
Rapid glycan detection using “GlycoIg-stain” following ion-exchange chromatography. 6A: Anion-exchange (TMAE purification) for G-IgG4. 6B: “GlycoIg-stain” facilitates rapid detection during purification process. 6C: SDS-PAGE gel counterstained with Coomassie.
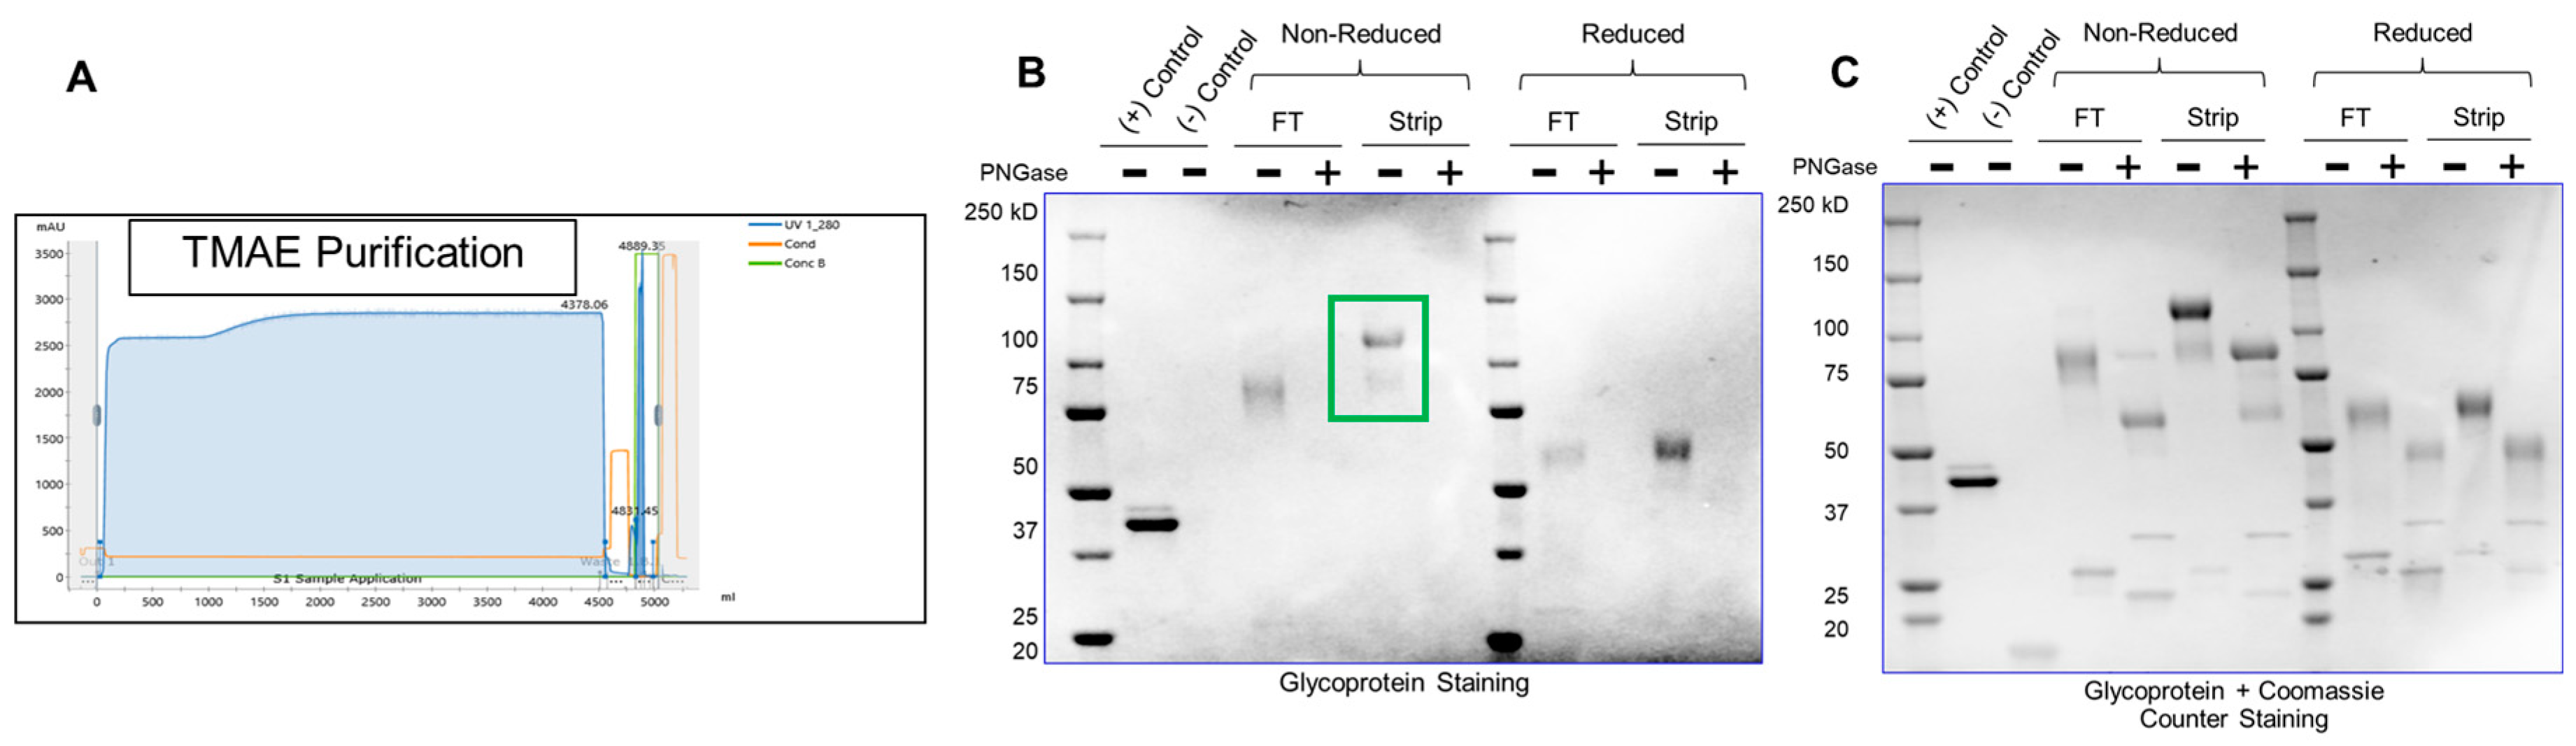

Table 1.
Glycoproteins used in this study.
| Name | Size (kDa) | pI | Cell line | Transfection type | Glycosylation |
|---|---|---|---|---|---|
| G-IgG1 | 133.95 | 6.3 | HEK/CHO | Transient/Stable | N-linked |
| G-IgG2 | 101.82 | 6.2 | CHO | Stable | N-linked |
| G-IgG3 | 111.28 | 8.7 | HEK/CHO | Transient/Stable | N-linked + O-linked |
| G-IgG4 | 77.63 | 6.1 | CHO | Stable | N-linked |
Table 2.
Comparison of enzymatic method (PNGase) with “GlycoIg-stain” method.
| Method # | Enzymatic (PNGase) | “GlycoIg Stain” method |
|---|---|---|
| Cost (estimated; 100 samples) | < $500 | < $500 |
| Time (estimated) excluding SDS-PAGE) | 1h-24h | 1h |
| Estimation quality | Qualitative | Semi-quantitative |
| Number of gels | One | One (compatible with Coomassie Blue à protein loading control) |
Disclaimer/Publisher’s Note: The statements, opinions and data contained in all publications are solely those of the individual author(s) and contributor(s) and not of MDPI and/or the editor(s). MDPI and/or the editor(s) disclaim responsibility for any injury to people or property resulting from any ideas, methods, instructions or products referred to in the content. |
© 2023 by the authors. Licensee MDPI, Basel, Switzerland. This article is an open access article distributed under the terms and conditions of the Creative Commons Attribution (CC BY) license (http://creativecommons.org/licenses/by/4.0/).
Copyright: This open access article is published under a Creative Commons CC BY 4.0 license, which permit the free download, distribution, and reuse, provided that the author and preprint are cited in any reuse.


