
Submitted:
11 January 2025
Posted:
13 January 2025
You are already at the latest version
Abstract
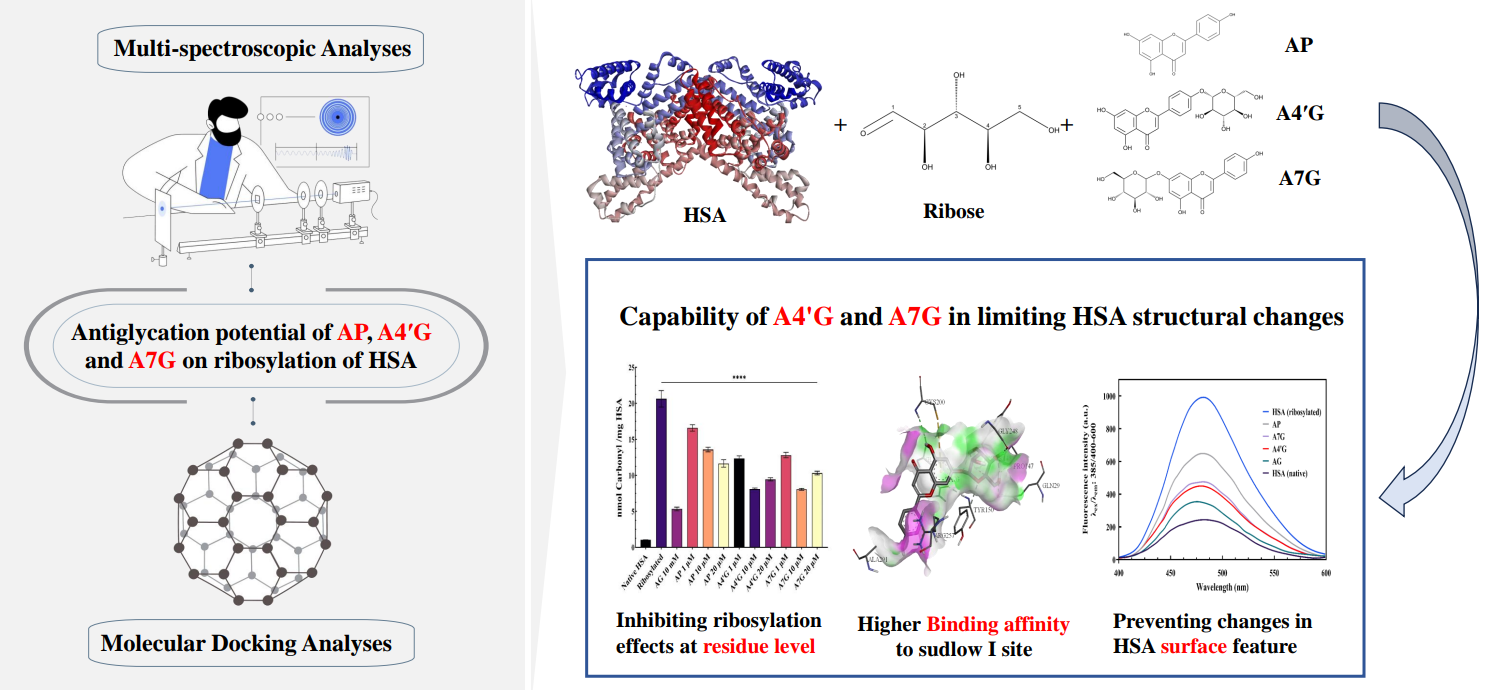
A comparative study was carried out to explore the antiglycation potential and mechanisms
of apigenin (AP) and its glycosidic derivatives, apigenin-4'-O-glucoside (A4′G) and
apigenin-7-O-glucoside (A7G), in the reaction mixtures of ribose and human serum albumin
(HSA). The degree of ribosylation was monitored by ANS and AGE-specific fluorescence,
UV-vis spectroscopy, confocal microscopy, TNBS, DTNB, DNPH assays, and in silico
evaluation. The significant decrease in esterase-like activity of ribosylated HSA was strongly
improved by the presence of glycosidic derivatives (A4'G > A7G). Despite the higher ability
of A4'G to quench AGE-specific fluorescence, the superior capacity of both glycosidic
derivatives to reduce the “cross-β structures” of ribosylated-HSA was confirmed by ThT
fluorescence. Moreover, A4'G/A7G (10 μM) showed considerable protection against side
chain modifications at lysine and cysteine residues, corroborated by TNBS, and DTNB
assays for native, glycated and APs-treated HSA. Molecular docking analysis revealed that
glycosidic derivatives (A4'G > A7G) could alleviate ribosylation by protecting the glycation-
prone sites in Sudlow site I. An explanation was provided regarding the relationship between
the effectiveness of glycoside derivatives in suppressing advanced HSA ribosylation and
their structural features. Overall, a thorough understanding of the mechanisms underlying
AP derivatives in suppressing protein glycation paves the way for the design of "lead
molecules" beyond conventional therapies.
Keywords:
HAS
; Apigenines
; Flavonoid glycosides
; Diabetes
; antiglycation
Introduction
One of the potential degradation reactions that prevail in diabetes and hyperglycemia is protein glycation (PG). PG takes place in a nonenzymatic way between primary or secondary amine groups of a protein and the carbonyl group of a reducing carbohydrate forming labile Schiff base (at early stage), which then undergoes rearrangement to the more stable ketoamine called Amadori/Heinz product (at the intermediate stage) [1,2,3]. Negative impacts of PG dominate at the late stage when advanced glycation end products (AGEs) exacerbate, the consequences of which can be the dysfunction of biomolecules particularly circular proteins such as HSA. There is evidence of the role played by in vivo HSA-AGEs associated with several diabetic consequences. For instance, elevated levels of AGEs can exert perturbation in HSA physiological functions such as molecular stability, esterase-like capacity, and delivery of drugs and metabolites to relevant tissues [4,5].
Moreover, the type and degree of glycation can bring about unforeseen aberration in the structure of HSA. Since high concentration of D-ribose has been reported in the urine of type II diabetics [6,7], we hypothesized that exposure of HSA to ribose would be a suitable target for enzyme-free glycation studies. At the residue level, among 585 amino acids in HSA, specific residues with nucleophilic properties including 59 Lys along with 24 Arg residues and Cys-34 are potentially prone to both in vivo and in vitro glycation. Furthermore, the side chains of Trp-214, all 17 tyrosine, and 35 cysteine residues were found to undergo different levels of glyco-modification in circulating albumin [8,9,10]. Therefore, finding effective therapeutics with the least side effects is a major goal in combating these devastating events.
Increasing interest in identifying novel inhibitors based on healthy food patterns has led to the discovery of "lead molecules" and the design of safer drugs and functional foods capable of reducing blood sugar [11,12]. In natural product activity research, “flavonoid glycosides” are ideal phytochemicals owing to their complex structures and diverse effects [13,14]. It seems the diverse biological activities of flavonoid glycosides are tightly related to the diversity of chemical features of the glycoside moiety [15]. However, the molecular basis through which glycosidic moiety may contribute to the anti-glycation activity of many flavonoid glycosides is poorly understood. Accordingly, to probe if glycoside moiety may help in the antiglycation capacity of flavonoid glycosides, HSA was subjected to the ribose attack, and the antiglycation potential of selected glycosidic derivatives of apigenin was evaluated. The superiority of both apigenin glycoside derivatives was demonstrated by maintaining esterase-like activity, mitigating the rate of AGE formation (evident by quenching of AGE-specific fluorescence), aggregation of amyloid structures (revealed by ThT fluorescence microscopy), protection of the side chain of lysine and cysteine residues (determined by TNBS and DTNB assays), reduction of UV absorption, and reduction of ANS fluorescence intensity in ribosylated HSA. In agreement with experimental findings, in silico results suggest that these compounds are highly effective in preserving protein’s structure and function, offering promising potential for future therapeutics. The present findings pave the way for a comprehensive understanding of the relationship between the efficacy of such phtochemicals in suppressing advanced ribosylation end products and their structural features, allowing for prioritization and optimization of the pharmacological properties of these compounds.
Results and Discussion
Ribosylation Effect at Residue Level
Non-selective glycation of a protein is believed to affect the protein structure in detrimental ways [16]. To elucidate if ribosylation brings about alterations at the residual level, three independent tests were applied to monitor any modification in Lys and Cys residues and carbonyl groups. The number of modified lysines was evaluated by TNBS assay. The high propensity of Lys residues to ribosylation was evident from the significant decrease in the free amine content of HSA (Figure 2A). Our findings showed that out of the 59 lysine residues in the HSA structure, 84% (after ∼21 days of reaction) were susceptible to modification by ribose, while both glycoside derivatives (at 20 μM) protected them much better than apigenin: A7G > A4'G > AP. Maintaining the native feature of lysine residues is crucial for the transport of substances by HSA in the bloodstream. The protective role of these flavonoids may be associated with their interaction with the Lys-rich sequence of HSA in the subdomain AII, which could provide shielding for the Schiff-base adducts and prevent further radical production. Protective effects of both glycosidic derivatives were similar to medical drugs in a dose-dependent manner and may come from specific interactions with nearby sensitive residues, modifying the surrounding environment of lysine and cysteine residues thus protecting them from ribosylation.
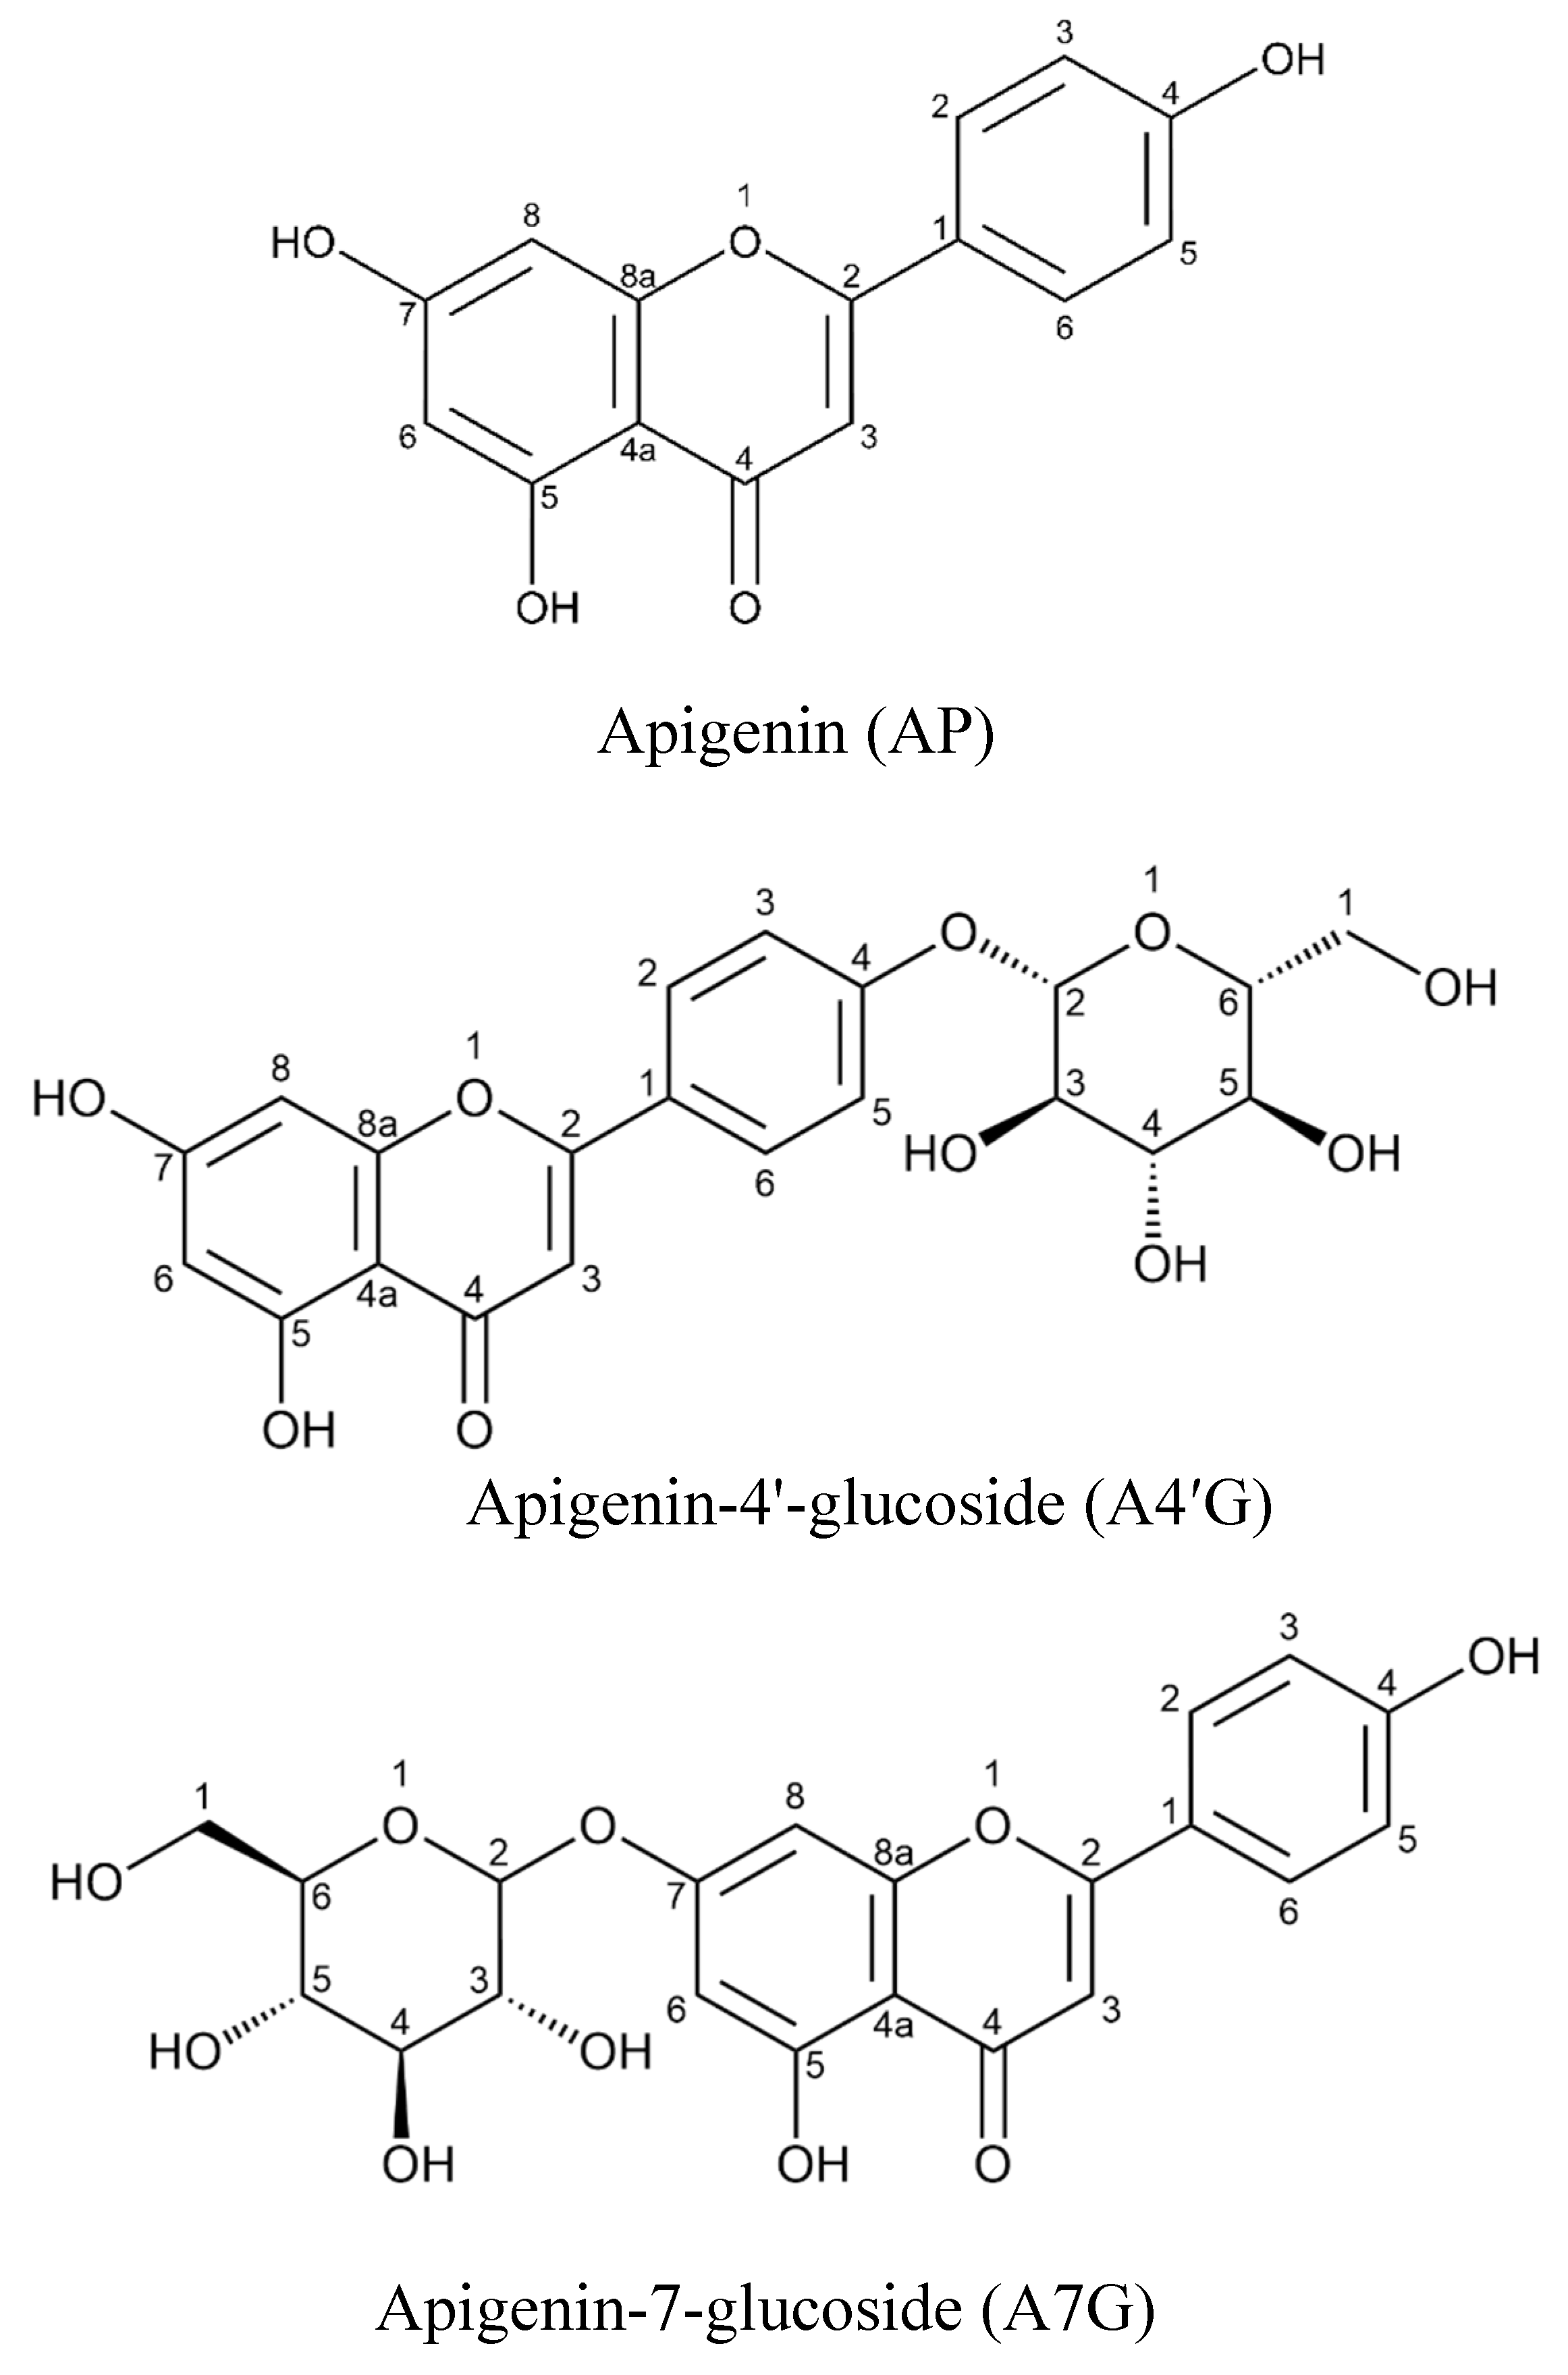
Figure 1.
Chemical structures of studied apigenins.
In addition to Lys residues, thiol groups of Cys residues have been identified as sites for glycosylation in HSA [5]. Modifying thiol groups is one of the dominant reactions responsible for the aberration of ribosylated HSA [6]. DTNB assay was applied to determine if any alteration occurs in Cys residues during ribosylation. The reactivity of the sulphydryl group (disulfide exchange) increased significantly when albumin was gradually unfolded within the ribosylation process (Figure 2B). Treatments with A4'G and A7G (10 μM) preserved thiol groups from modification following the order A7G > A4'G > AP, though their influence decreased at higher concentrations. Interestingly, AP was less effective than its glycosidic counterparts in suppressing Cys modification, implying the priority of the glycosidic moiety against glycation consequences. The results show that the sensitivity of each hotspot to ribosylation is influenced by the milieu surrounding the residues. Each Lys/Cys residue has an intrinsic reactivity that is influenced by its protein context. Cysteine residues play a pivotal role in protein stability through disulfide bridge formation. Ribosylation of thiol groups generates a type of AGE called carboxymethyl cysteine in HSA [17]. Therefore, it can be concluded that both AP derivatives can suppress carboxymethyl AGEs.
Carbonyl groups are among labile sites to ribosylation. Carbonyl content assessment is a criterion for assessing the glycation-induced oxidative stress within cells and their microenvironments, so it is a useful indicator in determining irreversible oxidative modifications in a glycated protein [18]. To determine the effectiveness of flavonoid glycosides, the carbonyl content of glycated HSA was evaluated by DNPH assay. Our results indicate that ribosylation leads to a notable increase in carbonyl content (Figure 2C). Both glycosidic derivatives (10 μM) were more able to decrease the carbonyl content of ribosylated-HSA. The reason for this phenomenon might be due to the dose-dependent effect of apigenins (similar to medical drugs), such that higher concentrations (at 20 μM) of apigenins may bring about synergistic effects with the toxic impact of ribose. Furthermore, part of the synergistic effect could originate from interactions with adjacent sequences of cysteine residues and carbonyl groups, initiating deleterious alterations in the immediate microenvironment surrounding these residues. However, the effects of glycoside derivatives are comparable to those of AP, indicating the capacity of their glycoside moiety to attenuate ribose-induced carbonyl stress. AP and its glycosidic derivatives significantly mitigate this process than the positive control (AG), following the suppressive capabilities as A4'G > A7G > AP. These measurements underline the superior capability of A4'G and A7G in limiting the extensive structural changes imposed by ribosylation compared to their non-glycosidic counterpart (AP).
Ribosylation Alters the HSA Surface Feature
Protein glycation may or may not be accompanied by major conformational changes. Ribosylation has been shown to stimulate profound structural changes in HSA, exposing its hydrophobic patches to the solvent [1,19]. ANS is an appropriate reporter to analyze the redisposition of hydrophobic regions in a protein. ANS fluorescence spectra was recorded to investigate the pattern of solvent-exposed hydrophobic regions associated with ribosylated HSA. The intensity of the ANS spectrum increased fivefold when HSA experienced ribosylation in the absence of flavonoids (Figure 3). This observation strongly suggests that ribose brought about extensive alterations in the conformation of albumin such that hydrophobic pockets moved toward the solvent-exposed surface, a mechanism that potentially facilitates HSA aggregation. Similar findings have been previously reported on the glycosylation of phaseolin and lysozyme [20]. This spectral contribution arises from the fact that glycosylated HSA becomes a less polar molecule than the native protein due to exposing its hydrophobic sites. However, both glycosidic derivatives detained protein remodeling by mitigating the surface hydrophobicity, maintaining the native-like polar conformation of HSA. The capacity of the used flavonoids (20 μM) in retaining the hydrophobic pockets of the native-like conformation followed the order: A4'G > A7G > AP. Apigenins behave in this respect similar to the molecular chaperones that block exposed hydrophobic surfaces and return unfolded proteins to their final native state.
Ribosylation Drives Cross-β Structure Formation
When proteins undergo partial unfolding, their hydrophobic regions are exposed to induce aggregation. The partial unfolding of HSA is the starting point for exposing its hydrophobic regions, resulting in protein aggregation and the formation of “cross-β-amyloid” fibrils. It has previously been reported that ribose stimulates the reassembly of globular HSA into “cross-β-amyloid “fibrils [21]. Given that ribosylation affects the composition of HSA, its tendency to aggregate can be explained. A convenient method for visualizing the degree of progression of amyloid formation during the protein glycation process is the use of ThT fluorescence microscopy. It seems likely that the driving force for the increase in surface hydrophobicity of HSA is the covalent modification of Lys and Cys residues, which respectively cause a change in the arrangement of positive electrical charges and the scrambling of disulfide bonds [22]. Figure 4 shows a significant expansion of the β-fibrillar structure in the presence of ribose. AP derivatives reduced the occurrence of this event and significantly inhibited fibril formation to the point where it was almost undetectable at 20 μM of A7G (Figure 4F). These findings support the hypothesis that glycosidic moieties may play a major role in the fibrillation-inhibiting potency of apigenin derivatives (A7G > A4'G > AP). AP derivatives can exert their anti-amyloid property by producing barriers against β-amyloid fibrils, concealing the glycation sites and lowering the extent of hydrophobic surface area, thereby preventing changes in native alpha conformers. These results are consistent with ANS fluorescence findings that showed how exposed hydrophobic pockets were protected by apigenin derivatives, confirming the chaperone-like role of these compounds, a phenomenon we recently found in Lemon balm extract [23].
HSA Esterase-like Activity
Serum albumin exhibits pseudo-enzymatic activity which mimics the characteristics of the metal-catalyzed oxidation system that produces additional free radicals. HSA esterase-like activity is exhibited by hydrolyzing ester-containing drugs through key residues such as Lys 199 and Tyr 411 in Sudlow sites I and II [5]. Ribosylation can perturb its catalytic function by interfering with the surrounding microenvironment of relevant critical residues. These residues enable nucleophilic attacks and proton transfer action necessary for ester hydrolysis. Glycation primarily occurs at lysine residues impairing esterase-like activity through modifying the essential lysines, disrupting HSA's ability to effectively hydrolyze drug-esters [4]. This impairment is implicated in complications such as microangiopathy, retinopathy, and nephropathy [24]. The pseudo-enzymatic activity is crucial for converting prodrugs to active forms in plasma, much slower and less consistent than that of true hydrolases. The esterase activity of ribosylated HSA is three times lower than that of the native protein, indicating that ribose targeted the critical sites in enzyme activity. Kinetic analysis showed that treatments with A4'G and A7G largely retained the esterase-like activity of HSA in the order of A4'G > A7G > AP (Figure 5). This trend is consistent with a non-competitive inhibition pattern. Based on the data in Table 1, such non-competitive behavior in the presence of increasing concentrations of apigenins is characterized by the constant Vmax and the decrease in Km of albumin enzymatic activity. Molecular docking analysis revealed that, unlike AP, its glycosidic derivatives preserve HSA esterase activity through non-covalent interactions with Lys 199 (Figure 8). It can be concluded that the superior ability of A4'G and A7G against the loss of esterase activity might be attributed to their glycosidic moiety.
AGEs Fluorescence Measurement
AGE-specific fluorescence is widely used for detecting AGE formation in vitro and in vivo [25]. Ribosylation of HSA brought about an increase in fluorescence intensity across various excitation/emission (λex/λem) wavelengths: 330/350-600 nm, 365/400-600 nm, and 485/500-600 nm, a characterization of ribose-derived HSA-AGEs. Notably, specific AGEs such as pentosidine and N-acetyl-L-arginine have detectable signals at λex/λem: 330/395 nm, whereas λex/λem: 530/485 nm indicates the extent of modifications in arginine residues. These observations can be attributed to the chaotropic nature of AGE adducts originating from glycated proteins [[26], thereby imposing substantial remodeling in the native protein. Following treatment with flavonoids, fluorescence analysis revealed that A4′G and A7G were more effective than AP in modulating ribose-derived HSA-AGE accumulation. The inhibitory capacity of the used flavonoids was a function of their glycosidic nature and concentration (Figure 6). The obtained results underscore the superior efficacy of A4′G and A7G in mitigating HSA-AGE formation. Overall, the trend of inhibition was as: λex/λem 330/350-600: A4'G > A7G > AP, λex/λem 365/400-600: A7G > A4'G > AP, λex/λem 440/500-600: A4'G > A7G > AP.
UV–Visible Spectroscopy
The impact of ribosylation on albumin structure was followed by UV–visible spectroscopy. As shown in Figure 7, ribose imposed extensive modifications in the structure of HSA, as evidenced by the pronounced hyperchromicity at 280 nm, with a shoulder peak at 335 nm reflecting the occurrence of the “advanced ribosylation end products” (AREs) in the protein [6]. The chaotropic effect of glycated HSA [25] appears to be responsible for significant changes in the microenvironment surrounding phenylalanine (Phe), tyrosyl (Tyr), and tryptophanyl (Trp-24) residues at different subdomains. Protein glycation is often associated with changes in the microenvironment of hydrophilic residues, leading to increased UV radiation absorption [6]. Comparison between modified and native HSA reflects an extensive structural deformation resulting from substantial alterations in the position of these aromatic chromophores. To approve the generation of “ARE” adducts, absorption signals were recorded at fixed wavelengths of 330, 360, and 400 nm [17]. Notably, HSA did not show any absorption at wavelengths of 330 nm and above comparable to higher UV absorbance for ribosylated protein. At the same time, the glycoside derivatives were more effective than AP, showing their protective role by alleviating the corresponding signals in a dose-dependent manner (Figure 7 and Table 2). The difference in the level of protection is likely related to the location and/or chemical structure of used apigenins. Accordingly, it can be concluded by protecting aromatic residues, AP derivatives imposed significant anti-glycation properties, following the order: 330 nm: A4′G > A7G > AP; 360 nm: A4′G > A7G > AP; 400 nm: A7G > A4′G > AP.
Molecular Docking Approach
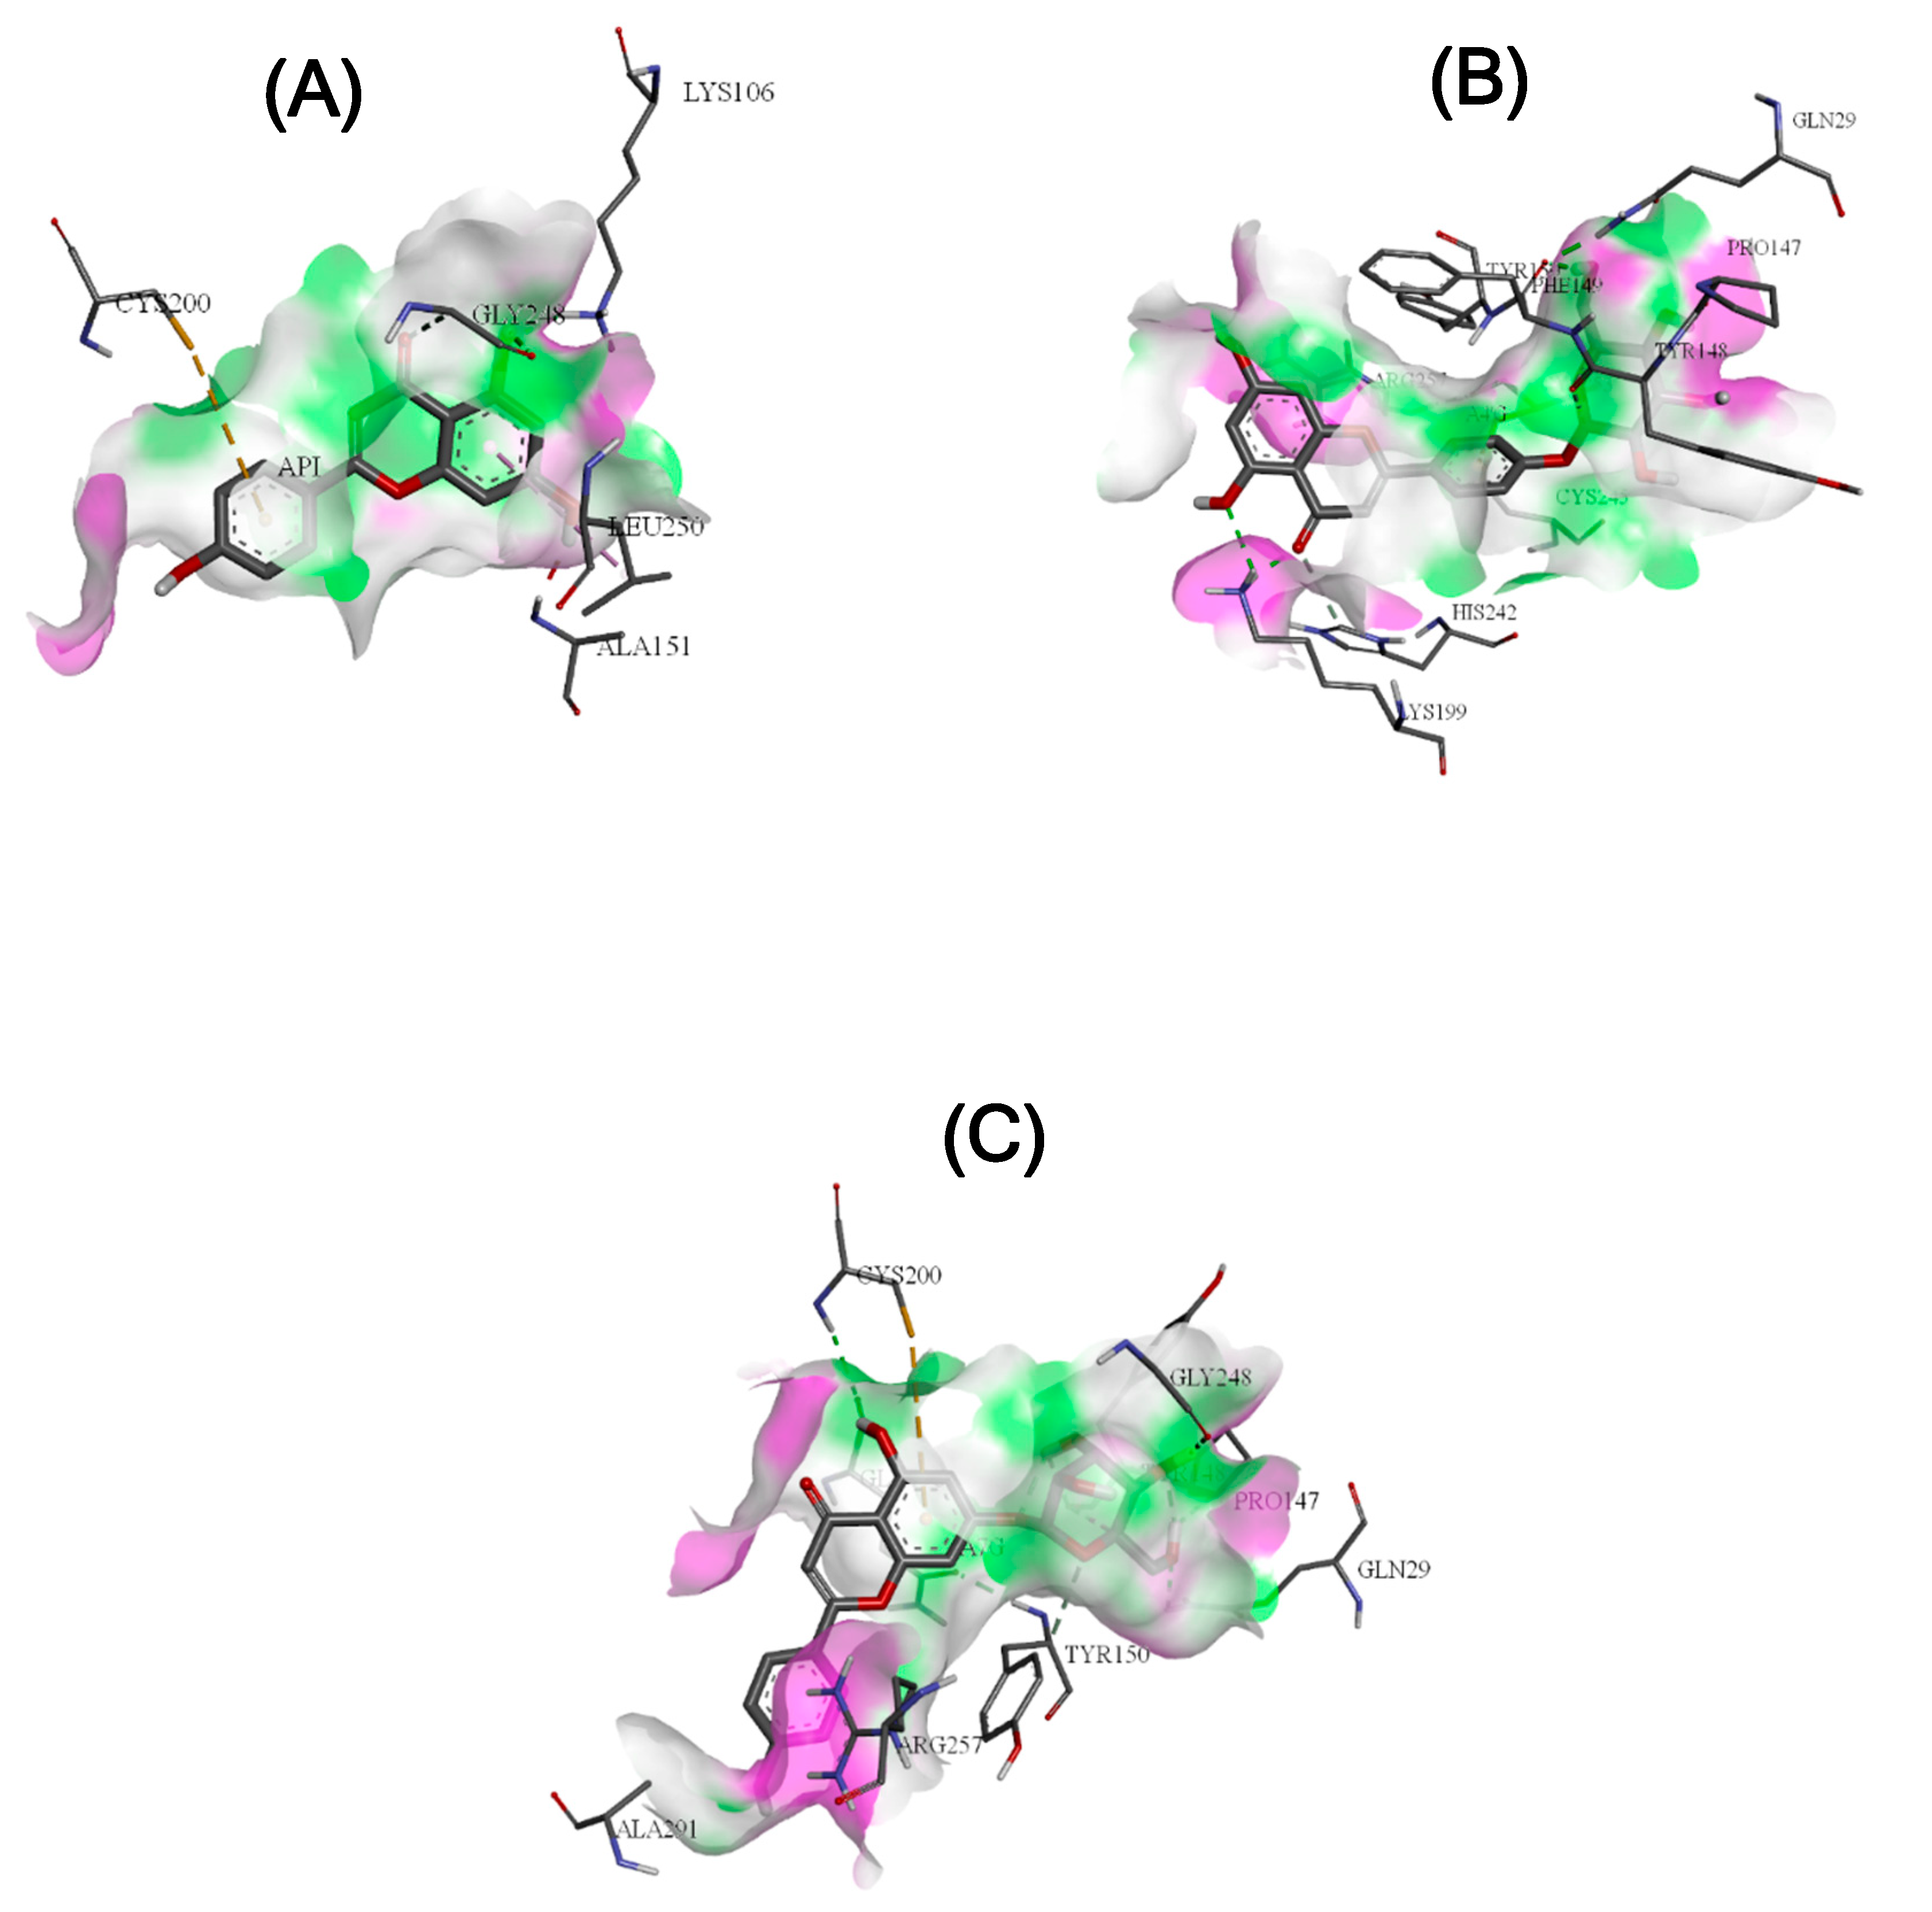
The molecular docking approach provides an estimate of the binding affinity and interaction dynamics of a candidate compound with a desired protein [27,28]. The binding interactions between the three apigenin molecules were categorized by hydrogen bonding, hydrophobic contacts, and electrostatic interactions (Figure 8). Given the structural changes imposed on the chemical nature of the carbonyl groups, Lys and Cys residues, and the alterations originating from the formation of HSA-AGE adducts, ribose appears to affect the pattern of intramolecular interactions. Accordingly, dynamic interactions between AP, A4'G, and A7G and the HSA Sudlow site IIA were identified. However, both flavonoid glycosides exhibited more free energy (ΔG), and stronger hydrogen bonds than AP (Table 3). Both ligands, A4'G/A7G, interacted with the protein through multiple non-covalent interactions, where their glycosidic moiety aligned with key residues in the Sudlow I site. Specifically, A4'G and A7G form hydrogen bonds with Lys 199, Pro 147, Phe 149, His 242, Tyr148, Gly 248, and Gln 196 (Figure 8B,C). Hydrophobic interactions further enhance binding stability by involving non-polar regions of the ligand, such as alkyl chains or aromatic rings, with hydrophobic residues like Tyr 150, Cys 253, Ala 291, and Gln 196. Electrostatic interactions between charged residues such as Arg 257 with complementary functional groups of the glycosidic moiety also contribute to the overall binding affinity following the trend: A4'G > A7G > AP. Overall, by analyzing the chemical features of the three molecules under consideration, A4'G, A7G, and AP, it is determined that the pKa of the hydroxyl group at C7 is ~6.79, while that of C4 is ~7.17. The higher proton-donating ability of the hydroxy group at C4 in A4'G indicates its stronger effect in suppressing HSA ribosylation than that of A7G. This hypothesis is consistent with findings obtained from UV-visible analysis, fluorescence assays, hydrophobic surface rearrangement, and esterase activity assay, supporting the role of C4 in the enhanced protective effects of the glycosidic moiety.
Figure 8.
3D presentation of interaction between HSA and AP (A), A4'G (B), and A7G (C).
Material and Methods
Chemicals
HSA, AP, aminoguanidine, thioflavin T (ThT), D-ribose, 8-anilo-1-naphthalene sulfonic acid (ANS), NaN3, 5,5-dithio-bis-nitrobanzoicacid (DTNB), 2,4,6-trinitrobenzene sulfonic acid (TNBS), and 2,4-dinitrophenylhydrazine (2,4-DNPH) were obtained from Sigma Aldrich (St. Louis, MO, USA). A4′Gand A7G were gifted from the Department of Pharmacognosy, School of Pharmacy, Isfahan University of Medical Sciences. All other used chemicals were of analytical grade.
In-Vitro Glycation of HSA
Glycated HSA was prepared using Schmitt et al. [17] and He et al. [22] methods with few modifications. HSA (4 mg/ml) was incubated at 37 °C alongside D-ribose (100 mM) in PBS (pH 7.3) in the presence and absence of AP, A4′G, and A7G. NaN3 (0.02% (w/v)) was added to the solutions to prevent microbial contamination. To remove free D-ribose molecules (after 21 days incubation), the samples were centrifuged at 10,000 g, 4 °C for 10 min using Amicon® ultra centrifugal filters. Subsequently, the samples were stored at -20 °C for further analysis.
UV-Visible Spectroscopy
Once a week, absorbance measurement of glycation samples was carried out using a multi-mode reader (BioTek Synergy/HTX) within the range of 240-500 nm. In addition, the absorbance of samples at wavelengths of 330 nm, 360 nm, and 400 nm was evaluated [17].
AGE Fluorescence Measurements
To follow the formation of AGE adducts during HSA ribosylation in the presence and absence of AP, A4′G, A7G, and aminoguanidine, spectrofluorometric evaluations were undertaken using a spectrofluorometer (PerkinElmer, model LS55, United States). The samples were excited at wavelengths of 330 nm, 360 nm, and 485 nm, followed by tracking the emitted spectra within a wavelength range of 400-600 nm, while maintaining at constant temperature of 25 °C.
ANS Binding Assay
A widely used fluorescent probe known as ANS (8-anilino-1-naphthalene-sulphonic acid) is decisive in identifying hydrophobic pockets within proteins [19]. Fluorescence ANS provides a means to investigate structural changes occurring in proteins. In the present study, ANS fluorescence was used to investigate hydrophobic changes on the HSA surface. For this purpose, 50 μL of glycation samples were diluted with PBS to a final volume of 1 mL to obtain a concentration of 3 μM. Then, 10 µL of a 1 mM stock solution of ANS was added to the samples. After 30 min incubation at room temperature, the samples were excited at a wavelength of 385 nm, and their emission was recorded at 400-600 nm. Native HSA was used as a control.
Carbonyl Content Measurement
Carbonyl content quantification was performed based on Hughes et al. [3] method, using 2,4-DNPH reagent. To perform this experiment, 250 µL of samples with a concentration of 60 µM were combined with 350 µL 0.1% (w/v) dinitrophenylhydrazine solution (dissolved in 2N HCl). After 90 minutes of incubation at room temperature, 250 µL 30% (w/v) trichloroacetic acid (TCA) solution was added to the reaction mixture. Immediately, the samples were incubated on ice for 30 min. The samples were centrifuged at 10,000 g, 4 °C for 10 min to form sediment. The formed precipitate was washed twice with 1 mL of ethanol/ethyl acetate solution (1:1). Finally, the remaining sediment was dissolved in 500 µL of guanidine hydrochloride solution (including 6 M guanidine hydrochloride, 133 mM Tris hydrochloride and 13 mM EDTA) and the absorbance of the samples was collected at 365 nm. The carbonyl content of the protein was calculated Using Eq. 1 where c is the concentration (M), ɛ is the molar extinction coefficient (M-1cm-1), and l is the cuvette length (cm).
Primary Amino Group Measurement
The TNBS assay is a widely recognized method to quantify the presence of free amino groups within protein structures [29,30]. The analytical smple contained 250 µL 4% (w/v) NaHCO3 combined with 250 µL 0.1% (w/v) TNBS added to 250 µL of glycated and native samples (final concentration 12 µM). After 120 min of incubation at 40°C, SDS (10 wt%) and HCl (125 μL, 1 N) were added to the mixture, then the absorbance was measured at 420 nm.
Thiol Group Measurement
Thiol group quantification in both modified and native HSA was conducted via Ellman's assay, employing the DTNB reagent [30,31]. Briefly, 4 mg DTNB was dissolved in 1 ml of reaction buffer (100 mM sodium phosphate, pH 8, containing 1 mM EDTA). Then, 10 μl of DTNB in reaction buffer (500 μL) was added to 50 μL of samples. After 15 min of incubation at room temperature, the content of free thiol groups was assessed by measuring absorbance at 412 nm against a blank (a solution containing 50 μL of reaction buffer instead of protein samples). The results were expressed as the quantity of nmol free-SH groups per mg HSA.
HSA Esterase-like Activity
Variations in esterase-like activity of native and gHSA can be followed by kinetic parameters measurement [24]. The esterase-like activity of HSA was assessed by converting the synthetic substrate p-nitrophenyl acetate (pNPA) to p-nitrophenol (pNP) and monitoring its absorbance at 405 nm. During the esterase-like activity, the ester bond of the substrate is broken at Lys199 or Tyr 411, and p-nitrophenol (pNP) is formed with acetylated HSA. Since glycation of HSA causes modification of lysine residues, its esterase-like activity is reduced. To measure the enzymatic activity, 50 μL of ribosylated protein sample in the presence and absence of AP, A4G, and A7G (10 μM) was mixed with pNPA (100 μL, with a concentration range 0.1-3.2 mM) to determine the Michaelis-Menten kinetic parameters, and the absorbance of the samples was immediately read at 30-second intervals. Native HSA was used as a positive control. The kinetic parameters Km and Vmax were determined through the Lineweaver-Burke plot.
Fluorescence Microscopy
Using confocal imaging, visualization of sizing and degree of aggregates were monitored based on Thioflavin T (ThT) binding. Fluorescence microscopy measurements were performed using the dye ThT (λex 440 nm, λem 480 nm) to evaluate the effect of AP and its glycosidic derivatives on the process of cross-β amyloid formation and HSA aggregation [6,30]. ThT (125 μM) was mixed with native (at 25°C) and glycated protein samples in the absence and presence of A4G and A7G (20 μM). After 60 min incubation at room temperature, 15 μL of each sample was transferred to clean glass slides for analysis under a fluorescence microscope. Images were acquired with an Olympus IX71 fluorescence microscope equipped with a digital CCD camera at magnifications of 20 and 40.
Molecular Docking Analysis
Molecular docking is a method used to investigate the interactions between receptors and ligands. In this study, AutoDock Vina 1.2.0 was used for docking. Studies have shown that AutoDock Vina is more accurate and efficient than AutoDock 4.2 [32]. To perform molecular docking, first, the crystallographic structures of α-Gl and HSA with PDB entry ID 3A4A and 7QFE, respectively, were obtained from the protein database (www.rcsb.org) in PDB format and the structure of flavonoids downloaded from PubChem (pubchem.ncbi.nlm.nih.gov). Then the structure of flavonoids was optimized with Chem3D 22.2.3300 software. Using Schrödinger Maestro (Release 2023-4), excess water molecules in the structure of α-Gl and HSA were removed. Then, with AutoDock Tools 1.5.7, polar hydrogens were attached to receptors and ligands. Coleman charges were added to the receptor and “gasteiger” charges were added to the ligand [33]. Finally, the structures of these compounds were saved in PDBQT format. The binding range for both receptors was selected based on previous research and key amino acids. In the end, BIOVIA Discovery Studio v.21 was used to check the connection and interactions more closely.
Statistics
All experiments were conducted in triplicate. The results are presented as the mean ± relative standard deviation (mean ± RSD) using one-way analysis of variance (ANOVA). The accuracy of the results is determined based on P-values.
Conclusion
The purpose of this work was to evaluate: (i) how ribosylation impacts the structure and function of HSA; (ii) To what extent AP, A4'G, and A7G can protect the native structure of albumin against ribosylation (rHSA). and (iii) are AP, A4'G, and A7G capable of suppressing the advanced ribosylation step in HSA. Accordingly, the present study was conducted to find any relationship between the role of glycosidic moiety of AP glycosid derivatives in inhibiting the ribosylation of HSA. The extent of HSA-AGE formation, amyloid structure accumulation, carbonyl content measurement, and modifications in Lys, Arg, and Cys residues, revealed a meaningful relationship between the chemical characteristics of the glycosidic derivatives and the suppression of ribose-modified HSA-AGEs. Additionally, molecular docking showed that A4'G and A7G have a greater tendency to bind to the sensitive areas of HSA such as the Sudlow I site. However, further in vitro and in vivo studies, along with considerations of toxicity assessment and structural optimization of flavonoids, should be considered to demonstrate the benefits of this class of natural compounds in the treatment of conformational diseases such as diabetes mellitus. Overall, the results of this study provide a platform for further research aimed at optimizing flavonoid compounds and their glycosidic derivatives to mitigate complications associated with hyperglycemia and a range of conformational diseases.
Acknowledgments
A grant from the research council, University of Isfahan, Isfahan, Iran supported this work.
References
- Qais, F.A.; Alam, M.M.; Naseem, I.; Ahmad, I. Understanding the mechanism of non-enzymatic glycation inhibition by cinnamic acid: an in vitro interaction and molecular modelling study. RSC advances 2016, 6, 65322–65337. [Google Scholar]
- Koerich, S.; Parreira, G.M.; de Almeida, D.L.; Vieira, R.P.; de Oliveira, A.C.P. Receptors for Advanced Glycation End Products (RAGE): promising targets aiming at the treatment of neurodegenerative conditions. Current Neuropharmacology 2023, 21, 219. [Google Scholar]
- Valencia, J.V.; Weldon, S.C.; Quinn, D.; Kiers, G.H.; DeGroot, J.; TeKoppele, J.M.; Hughes, T.E. Advanced glycation end product ligands for the receptor for advanced glycation end products: biochemical characterization and formation kinetics. Analytical biochemistry 2004, 324, 68–78. [Google Scholar]
- Ascenzi, P.; Leboffe, L.; di Masi, A.; Trezza, V.; Fanali, G.; Gioia, M.; Coletta, M.; Fasano, M. Ligand binding to the FA3-FA4 cleft inhibits the esterase-like activity of human serum albumin. PloS one 2015, 10, e0120603. [Google Scholar]
- Rabbani, G.; Ahn, S.N. Structure, enzymatic activities, glycation and therapeutic potential of human serum albumin: A natural cargo. International journal of biological macromolecules 2019, 123, 979–990. [Google Scholar]
- Mohammadpour, A.; Sadeghi, M.; Miroliaei, M. Role of Structural Peculiarities of Flavonoids in Suppressing AGEs Generated From HSA/Glucose System. Applied Biochemistry and Biotechnology 2024, 1–19. [Google Scholar]
- Abdullah, K.; Qais, F.A.; Ahmad, I.; Naseem, I. Inhibitory effect of vitamin B3 against glycation and reactive oxygen species production in HSA: An in vitro approach. Archives of biochemistry and biophysics 2017, 627, 21–29. [Google Scholar]
- Barzegar, A.; Moosavi-Movahedi, A.A.; Sattarahmady, N.; Hosseinpour-Faizi, M.A.; Aminbakhsh, M.; Ahmad, F.; Saboury, A.A.; Ganjali, M.R.; Norouzi, P. Spectroscopic studies of the effects of glycation of human serum albumin on L-Trp binding. Protein and Peptide Letters 2007, 14, 13–18. [Google Scholar]
- Anguizola, J.; Matsuda, R.; Barnaby, O.S.; Hoy, K.; Wa, C.; DeBolt, E.; Koke, M.; Hage, D.S. Glycation of human serum albumin. Clinica chimica acta 2013, 425, 64–76. [Google Scholar]
- Maciążek-Jurczyk, M.; Janas, K.; Pożycka, J.; Szkudlarek, A.; Rogóż, W.; Owczarzy, A.; Kulig, K. Human serum albumin aggregation/fibrillation and its abilities to drugs binding. Molecules 2020, 25, 618. [Google Scholar] [CrossRef]
- Li, W.; Chen, H.; Xu, B.; Wang, Y.; Zhang, C.; Cao, Y.; Xing, X. Research progress on classification, sources and functions of dietary polyphenols for prevention and treatment of chronic diseases. Journal of Future Foods 2023, 3, 289–305. [Google Scholar] [CrossRef]
- de Paulo Farias, D.; de Araujo, F.F.; Neri-Numa, I.A.; Pastore, G.M. Antidiabetic potential of dietary polyphenols: A mechanistic review. Food Research International 2021, 145, 110383. [Google Scholar] [CrossRef]
- Sadeghi, M.; Miroliaei, M.; Ghanadian, M. Inhibitory effect of flavonoid glycosides on digestive enzymes: In silico, in vitro, and in vivo studies. International Journal of Biological Macromolecules 2022, 217, 714–730. [Google Scholar] [CrossRef]
- Yang, B.; Liu, H.; Yang, J.; Gupta, V.K.; Jiang, Y. New insights on bioactivities and biosynthesis of flavonoid glycosides. Trends in food science & technology 2018, 79, 116–124. [Google Scholar]
- Wang, B.; Qin, Q.; Chang, M.; Li, S.; Shi, X.; Xu, G. Molecular interaction study of flavonoids with human serum albumin using native mass spectrometry and molecular modeling. Analytical and bioanalytical chemistry 2018, 410, 827–837. [Google Scholar] [CrossRef]
- Chen, Y.; Yu, L.; Wang, Y.; Wei, Y.; Xu, Y.; He, T.; He, R. d-Ribose contributes to the glycation of serum protein. Biochimica et Biophysica Acta (BBA)-Molecular Basis of Disease 2019, 1865, 2285–2292. [Google Scholar] [CrossRef]
- Schmitt, A.; Schmitt, J.; Münch, G.; Gasic-Milencovic, J. Characterization of advanced glycation end products for biochemical studies: side chain modifications and fluorescence characteristics. Analytical biochemistry 2005, 338, 201–215. [Google Scholar] [CrossRef]
- Stefek, M.; Trnkova, Z.; Krizanova, L. 2, 4-dinitrophenylhydrazine carbonyl assay in metal-catalysed protein glycoxidation. Redox report 1999, 4, 43–48. [Google Scholar] [CrossRef]
- Gasymov, O.K.; Glasgow, B.J. ANS fluorescence: potential to augment the identification of the external binding sites of proteins. Biochimica et Biophysica Acta (BBA)-Proteins and Proteomics 2007, 1774, 403–411. [Google Scholar] [CrossRef]
- Tang, C.-H.; Sun, X.; Foegeding, E.A. Modulation of physicochemical and conformational properties of kidney bean vicilin (phaseolin) by glycation with glucose: Implications for structure–function relationships of legume vicilins. Journal of Agricultural and Food Chemistry 2011, 59, 10114–10123. [Google Scholar] [CrossRef]
- Bouma, B.; Kroon-Batenburg, L.M.; Wu, Y.-P.; Brünjes, B.; Posthuma, G.; Kranenburg, O.; de Groot, P.G.; Voest, E.E.; Gebbink, M.F. Glycation induces formation of amyloid cross-β structure in albumin. Journal of biological chemistry 2003, 278, 41810–41819. [Google Scholar] [CrossRef]
- Chen, C.-y.; Zhang, J.-Q.; Li, L.; Guo, M.-m.; He, Y.-f.; Dong, Y.-m.; Meng, H.; Yi, F. Advanced Glycation End Products in the Skin: Molecular Mechanisms, Methods of Measurement, and Inhibitory Pathways. Frontiers in Medicine 2022, 9. [Google Scholar] [CrossRef]
- Miroliaei, M.; Khazaei, S.; Moshkelgosha, S.; Shirvani, M. Inhibitory effects of Lemon balm (Melissa officinalis, L.) extract on the formation of advanced glycation end products. Food chemistry 2011, 129, 267–271. [Google Scholar] [CrossRef]
- Rabbani, G.; Baig, M.H.; Lee, E.J.; Cho, W.-K.; Ma, J.Y.; Choi, I. Biophysical study on the interaction between eperisone hydrochloride and human serum albumin using spectroscopic, calorimetric, and molecular docking analyses. Molecular pharmaceutics 2017, 14, 1656–1665. [Google Scholar] [CrossRef] [PubMed]
- Leclère, J.; Birlouez-Aragon, I. The fluorescence of advanced Maillard products is a good indicator of lysine damage during the Maillard reaction. Journal of Agricultural and Food Chemistry 2001, 49, 4682–4687. [Google Scholar] [CrossRef]
- Adrover, M.; Mariño, L.; Sanchis, P.; Pauwels, K.; Kraan, Y.; Lebrun, P.; Vilanova, B.; Muñoz, F.; Broersen, K.; Donoso, J. Mechanistic insights in glycation-induced protein aggregation. Biomacromolecules 2014, 15, 3449–3462. [Google Scholar] [CrossRef] [PubMed]
- Sadeghi, M.; Miroliaei, M.; Ghanadian, M.; Szumny, A.; Rahimmalek, M. Exploring the inhibitory properties of biflavonoids on α-glucosidase; computational and experimental approaches. International Journal of Biological Macromolecules 2023, 253, 127380. [Google Scholar] [CrossRef]
- Tousheh, M.; Darvishi, F.Z.; Miroliaei, M. A novel biological role for nsLTP2 from Oriza sativa: Potential incorporation with anticancer agents, nucleosides and their analogues. Computational Biology and Chemistry 2015, 58, 9–18. [Google Scholar] [CrossRef]
- Cayot, P.; Tainturier, G. The quantification of protein amino groups by the trinitrobenzenesulfonic acid method: a reexamination. Analytical biochemistry 1997, 249, 184–200. [Google Scholar] [CrossRef]
- Rahmanifar, E.; Miroliaei, M. Differential effect of biophenols on attenuation of AGE-induced hemoglobin aggregation. International journal of biological macromolecules 2020, 151, 797–805. [Google Scholar] [CrossRef] [PubMed]
- Riener, C.K.; Kada, G.; Gruber, H.J. Quick measurement of protein sulfhydryls with Ellman's reagent and with 4, 4′-dithiodipyridine. Analytical and bioanalytical chemistry 2002, 373, 266–276. [Google Scholar] [CrossRef]
- Eberhardt, J.; Santos-Martins, D.; Tillack, A.F.; Forli, S. AutoDock Vina 1.2. 0: New docking methods, expanded force field, and python bindings. Journal of chemical information and modeling 2021, 61, 3891–3898. [Google Scholar] [CrossRef]
- Wang, J.; Kollman, P.A.; Kuntz, I.D. Flexible ligand docking: a multistep strategy approach. Proteins: Structure, Function, and Bioinformatics 1999, 36, 1–19. [Google Scholar] [CrossRef]
Figure 2.
Effects of AP, A4′G, A7G, and AG (positive control) on, modified lysine residues (A), Cys thiol groups (B), and carbonyl content (C), after 21 days incubation at 37 °C.
Figure 2.
Effects of AP, A4′G, A7G, and AG (positive control) on, modified lysine residues (A), Cys thiol groups (B), and carbonyl content (C), after 21 days incubation at 37 °C.
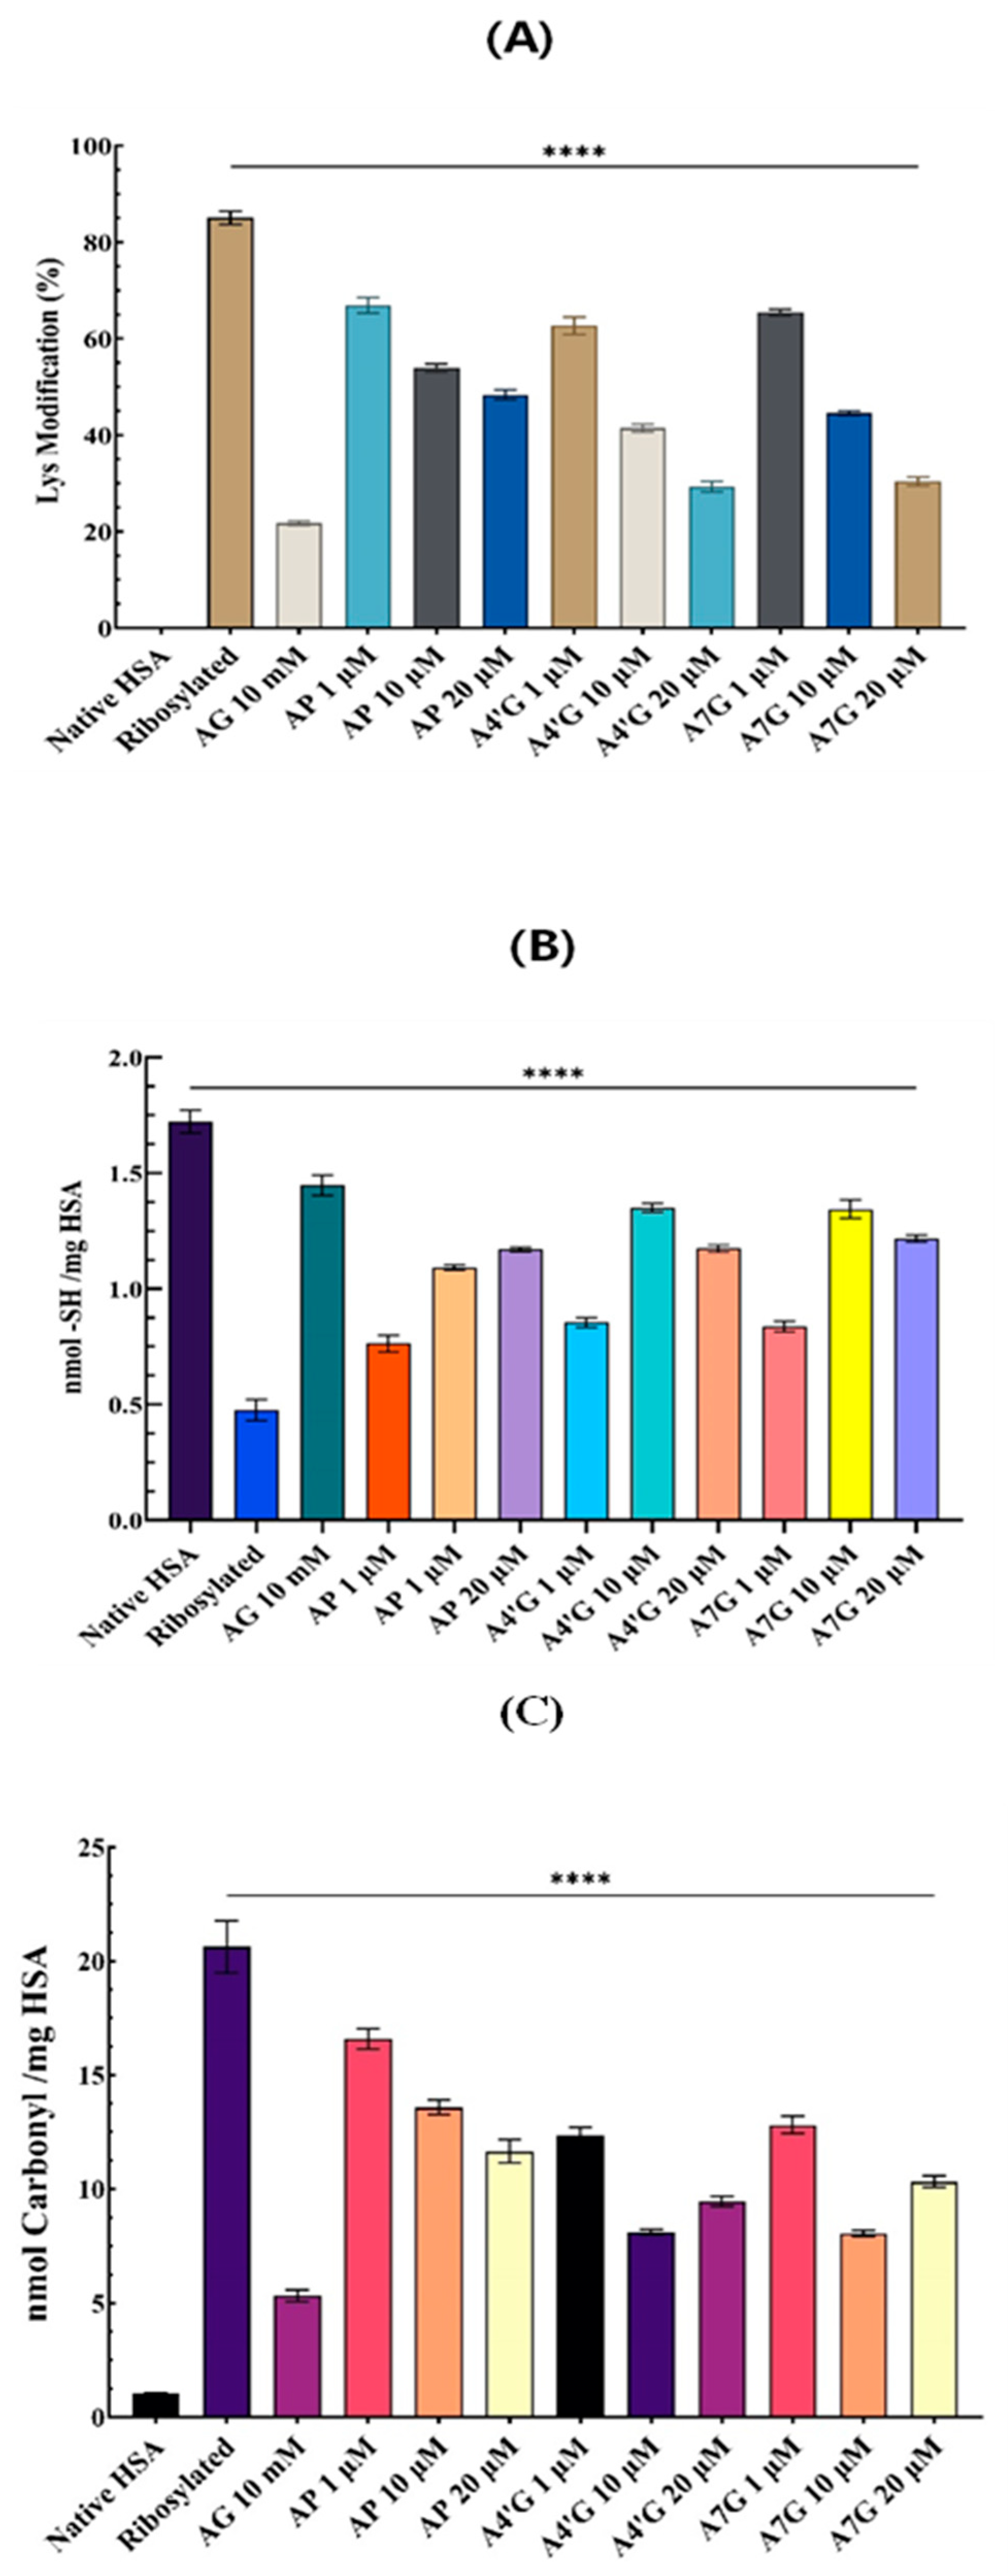
Figure 3.
Remodeling of hydrophobic pockets in HSA probing by ANS fluorescence, with and without AP, A4′G, A7G (20 µM), and AG (10 mM).
Figure 3.
Remodeling of hydrophobic pockets in HSA probing by ANS fluorescence, with and without AP, A4′G, A7G (20 µM), and AG (10 mM).
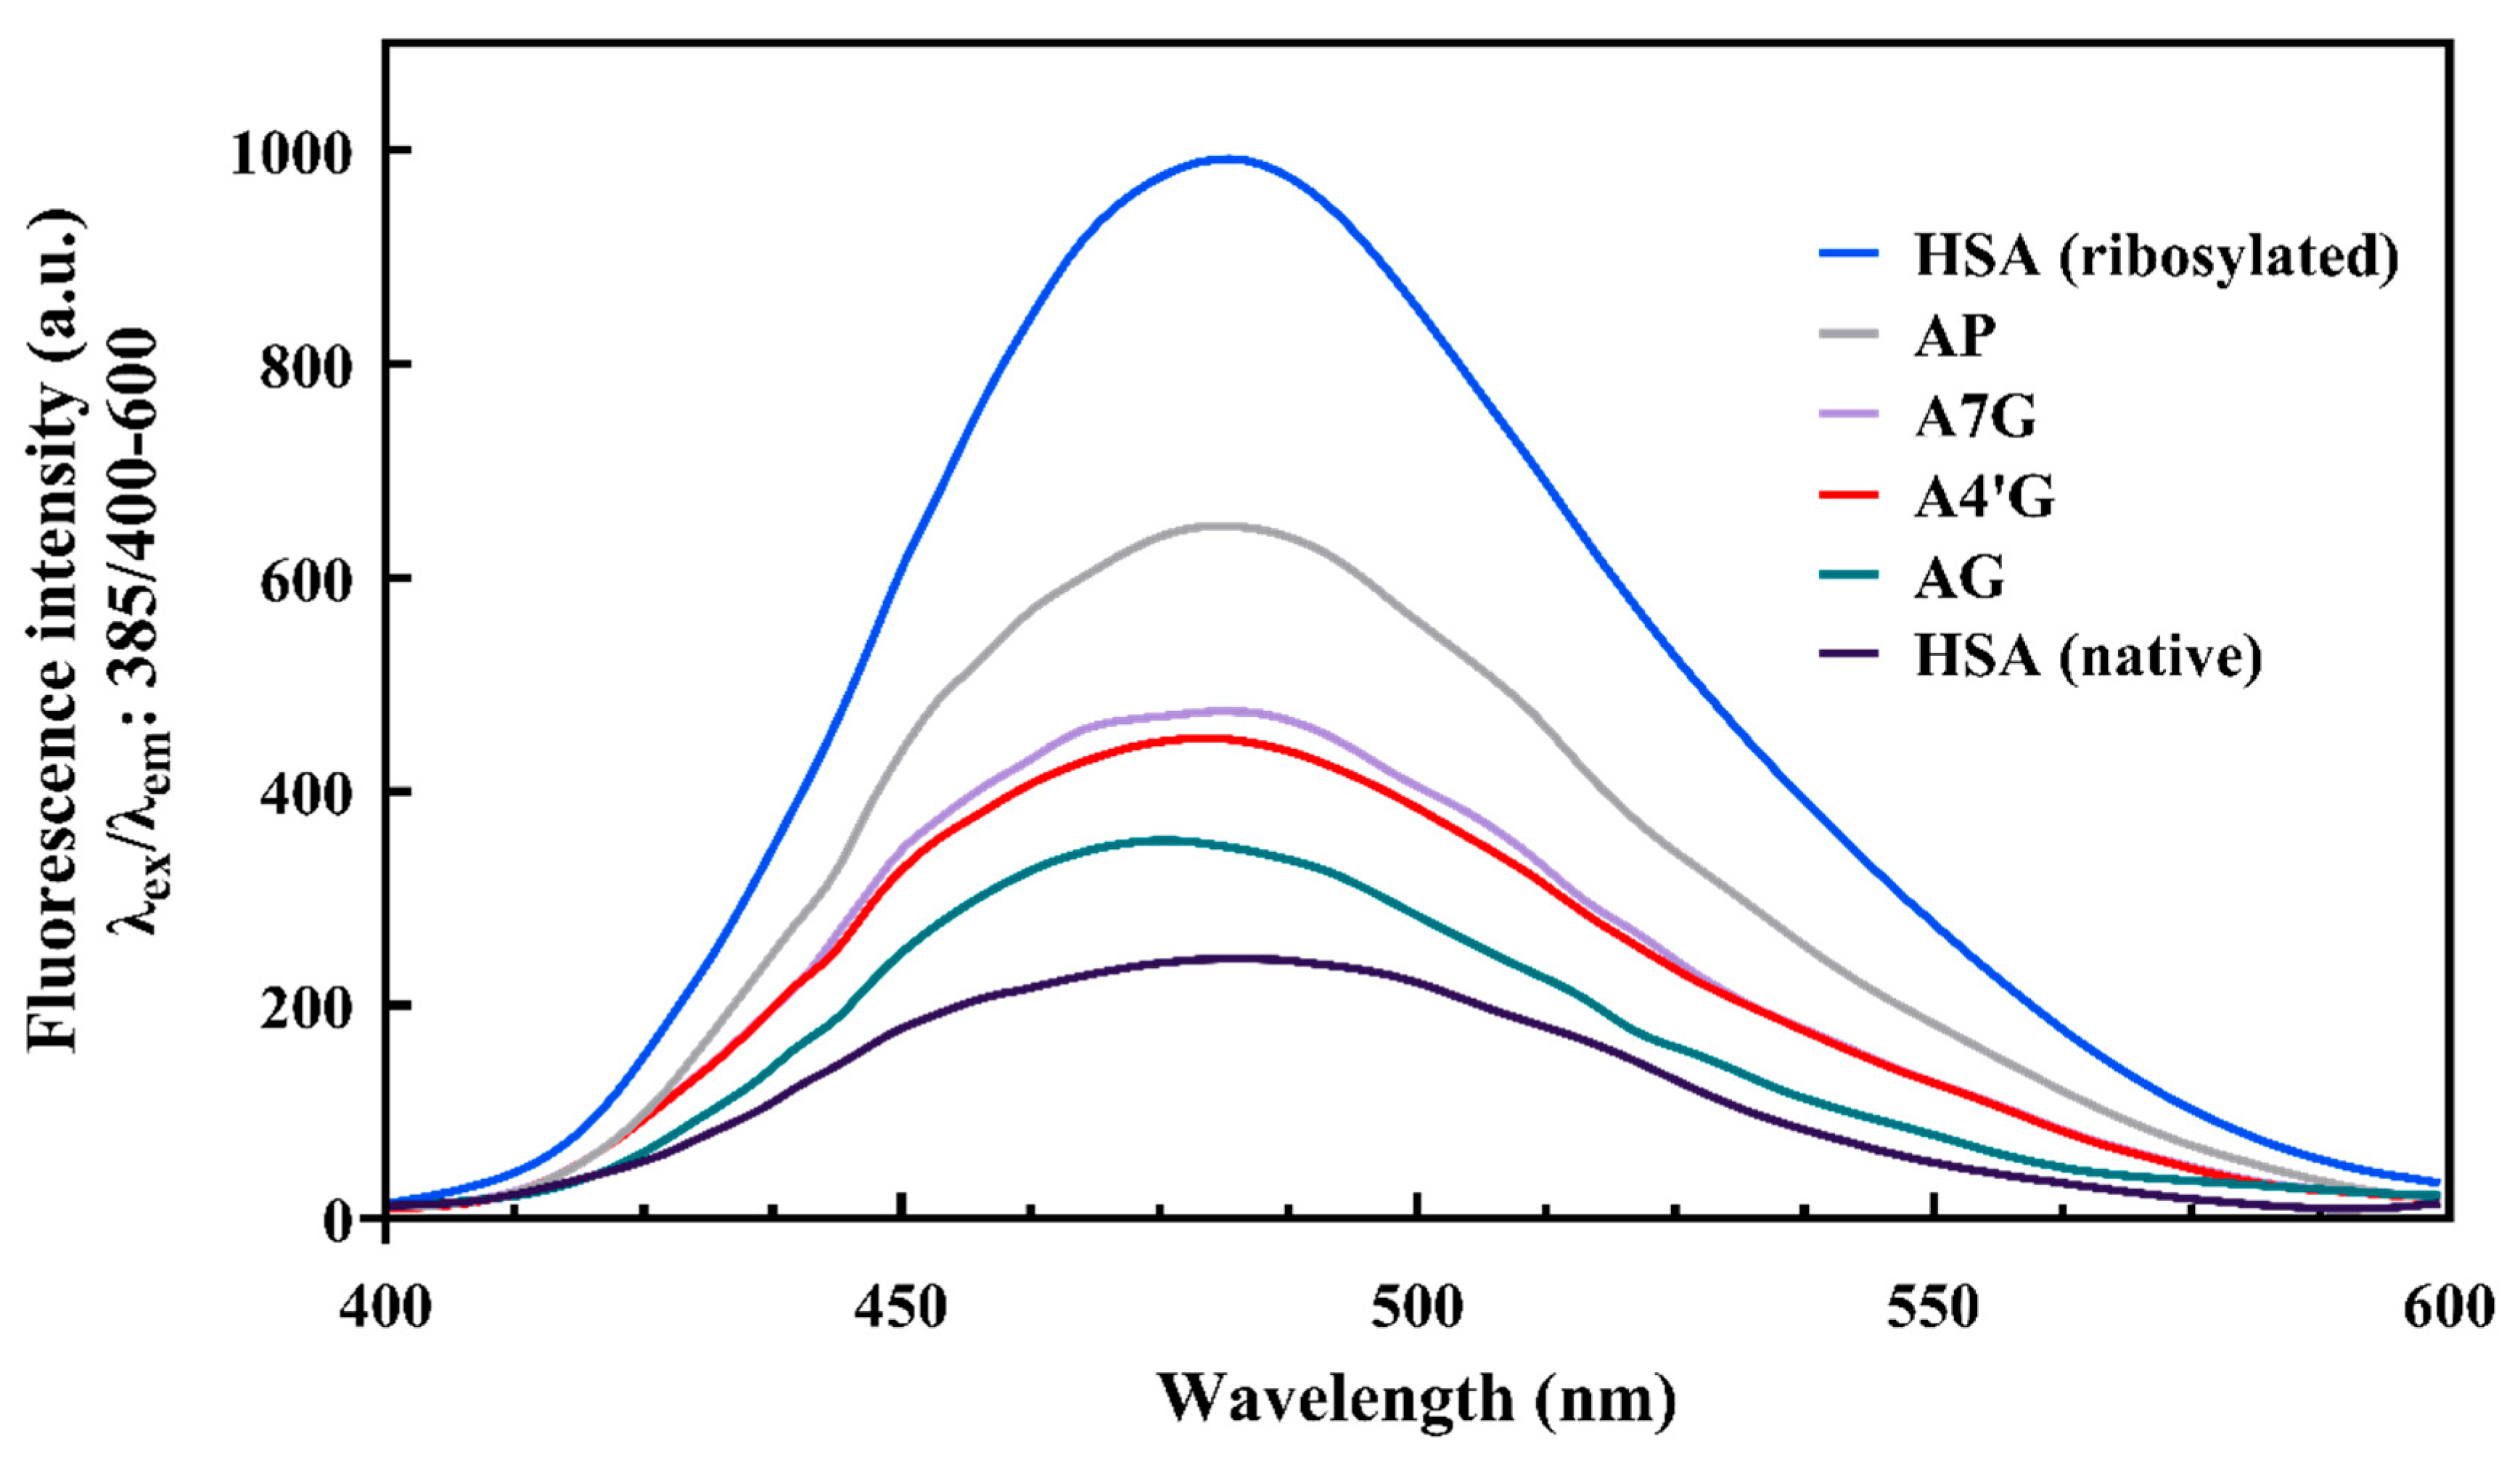
Figure 4.
ThT-based fluorescence microscopy, native HSA (A), ribosylated HSA (B), AG treated (C), and in the presence (20 μM) of AP (D), A4′G (E), and A7G (F).
Figure 4.
ThT-based fluorescence microscopy, native HSA (A), ribosylated HSA (B), AG treated (C), and in the presence (20 μM) of AP (D), A4′G (E), and A7G (F).
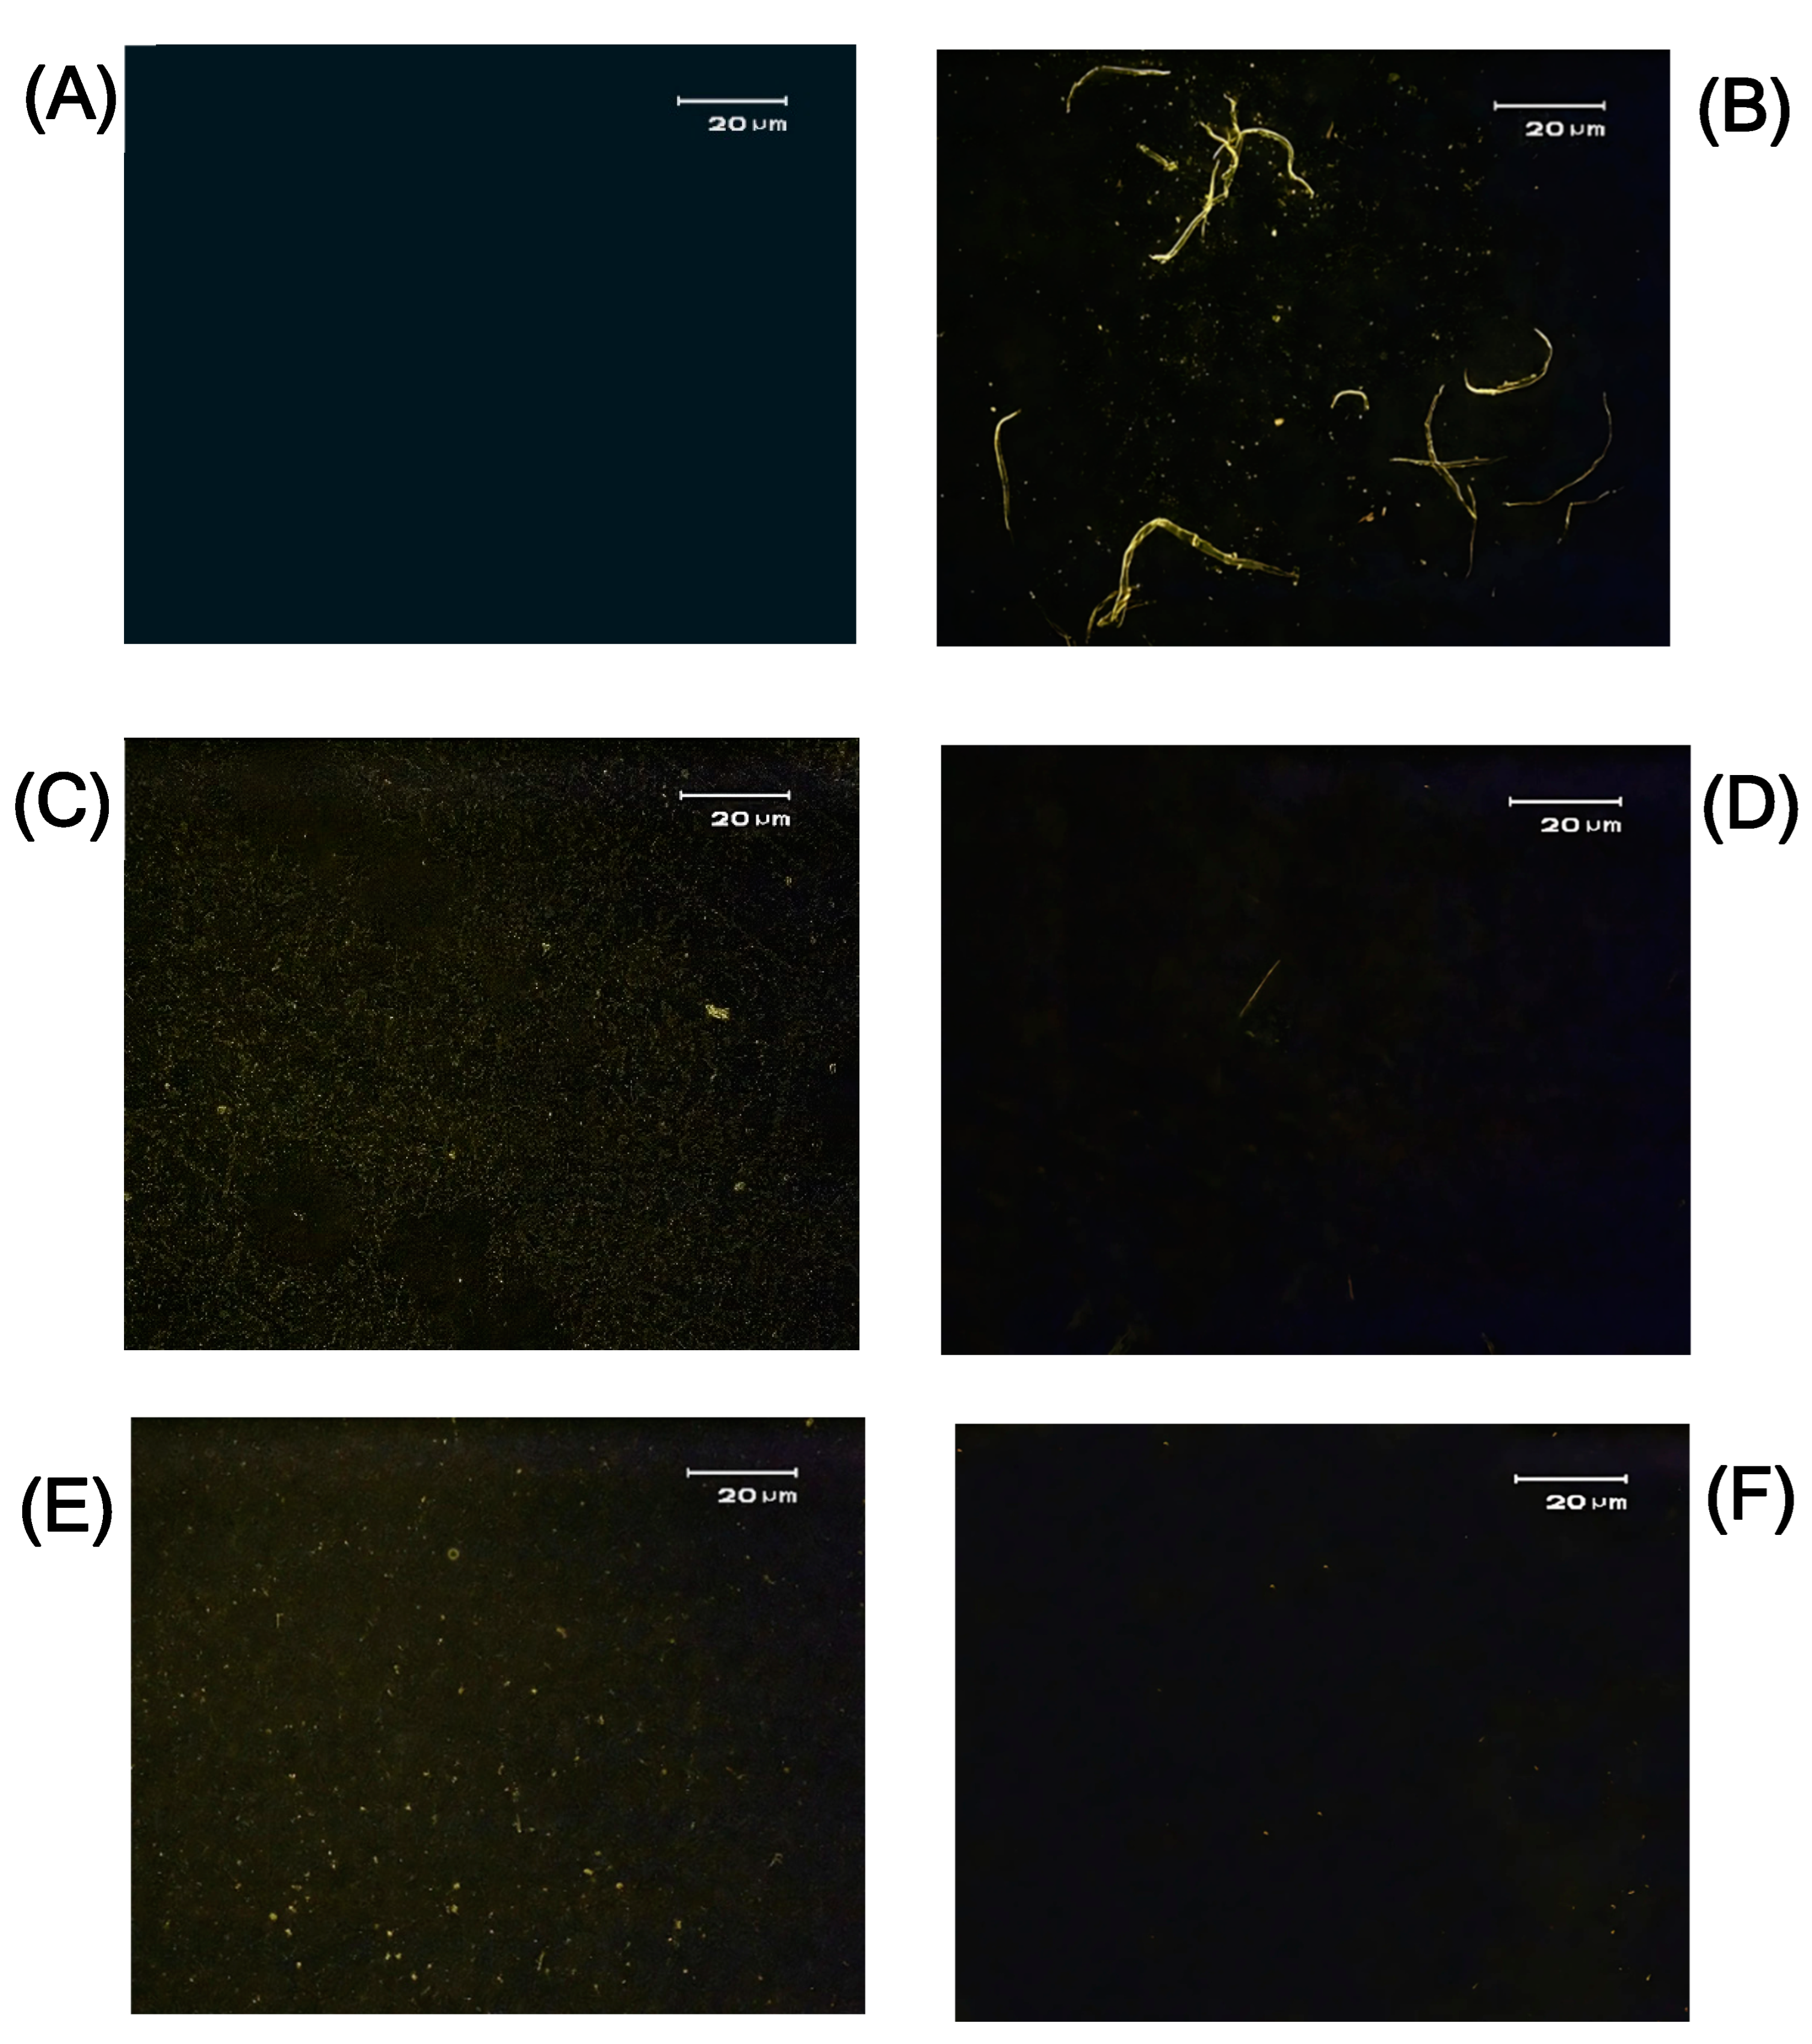
Figure 5.
Lineweaver-Burk plot for HSA esterase-like activity, native and ribosylated HSA in the presence of AP, A4′G, A7G (20 µM), and AG (10 mM) after 21 days incubation at 37 °C.
Figure 5.
Lineweaver-Burk plot for HSA esterase-like activity, native and ribosylated HSA in the presence of AP, A4′G, A7G (20 µM), and AG (10 mM) after 21 days incubation at 37 °C.
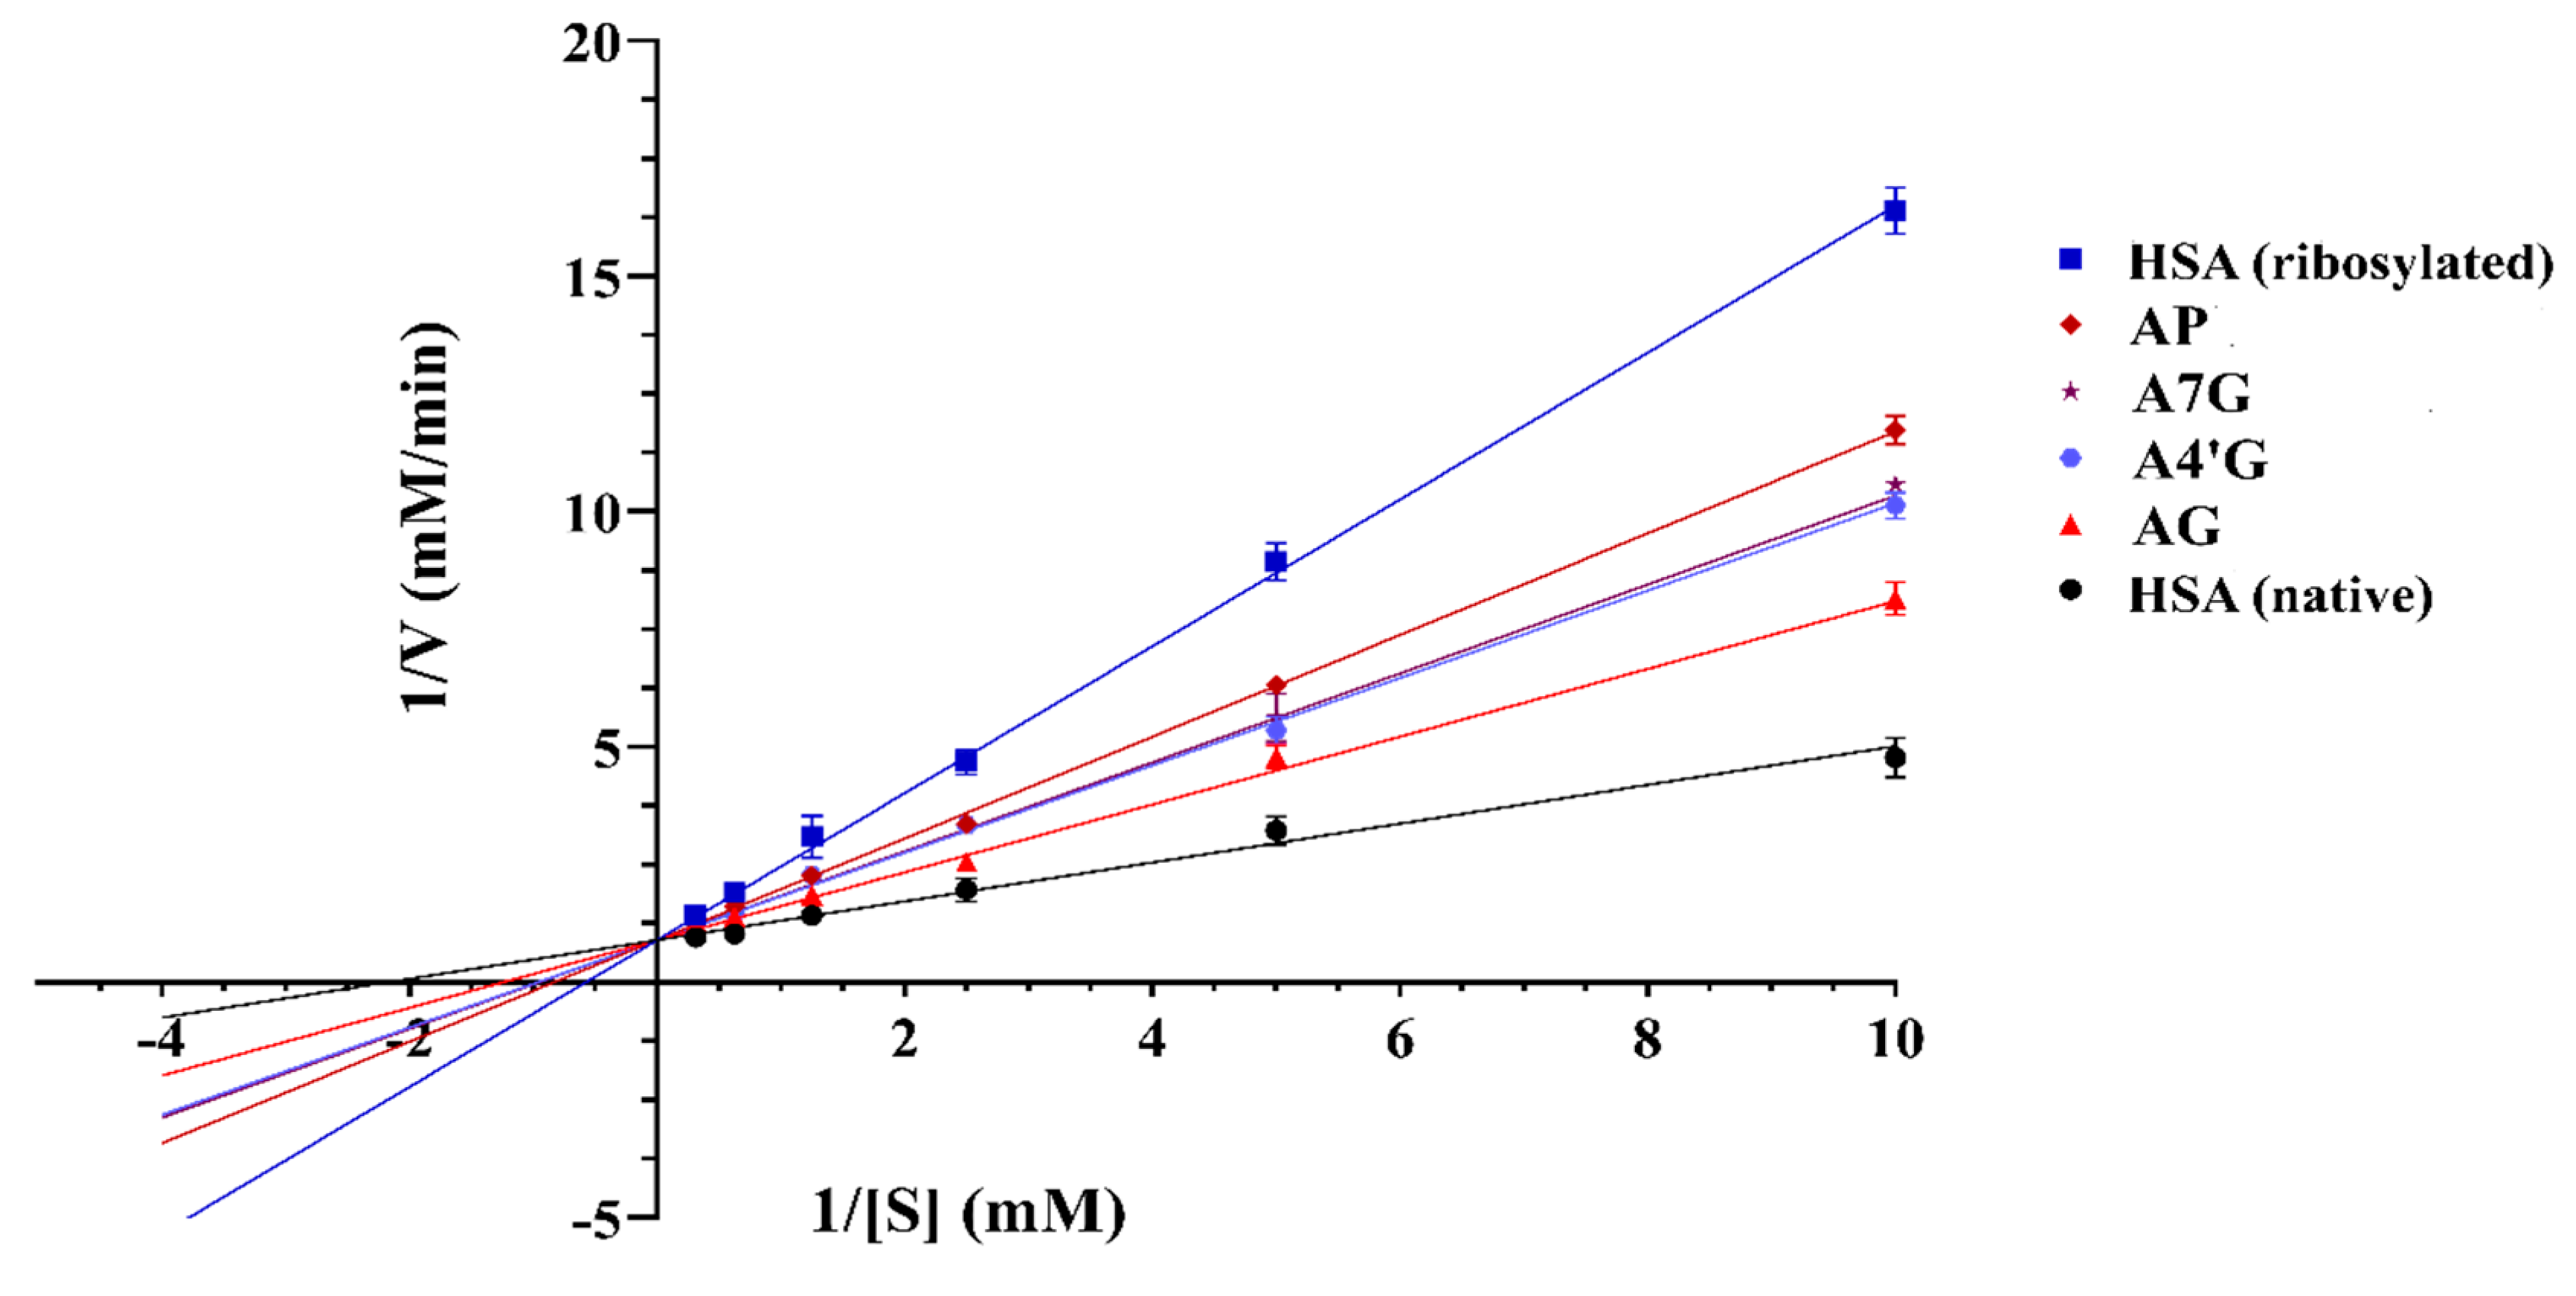
Figure 6.
Fluorescence intensity of native and modified-HSA, after 21 days incubation at 37 °C, (A) λex/λem: 330/350-600 nm, (B) λex/λem: 365/400-600 nm, (C) λex/λem: 485/500-600 nm.
Figure 6.
Fluorescence intensity of native and modified-HSA, after 21 days incubation at 37 °C, (A) λex/λem: 330/350-600 nm, (B) λex/λem: 365/400-600 nm, (C) λex/λem: 485/500-600 nm.
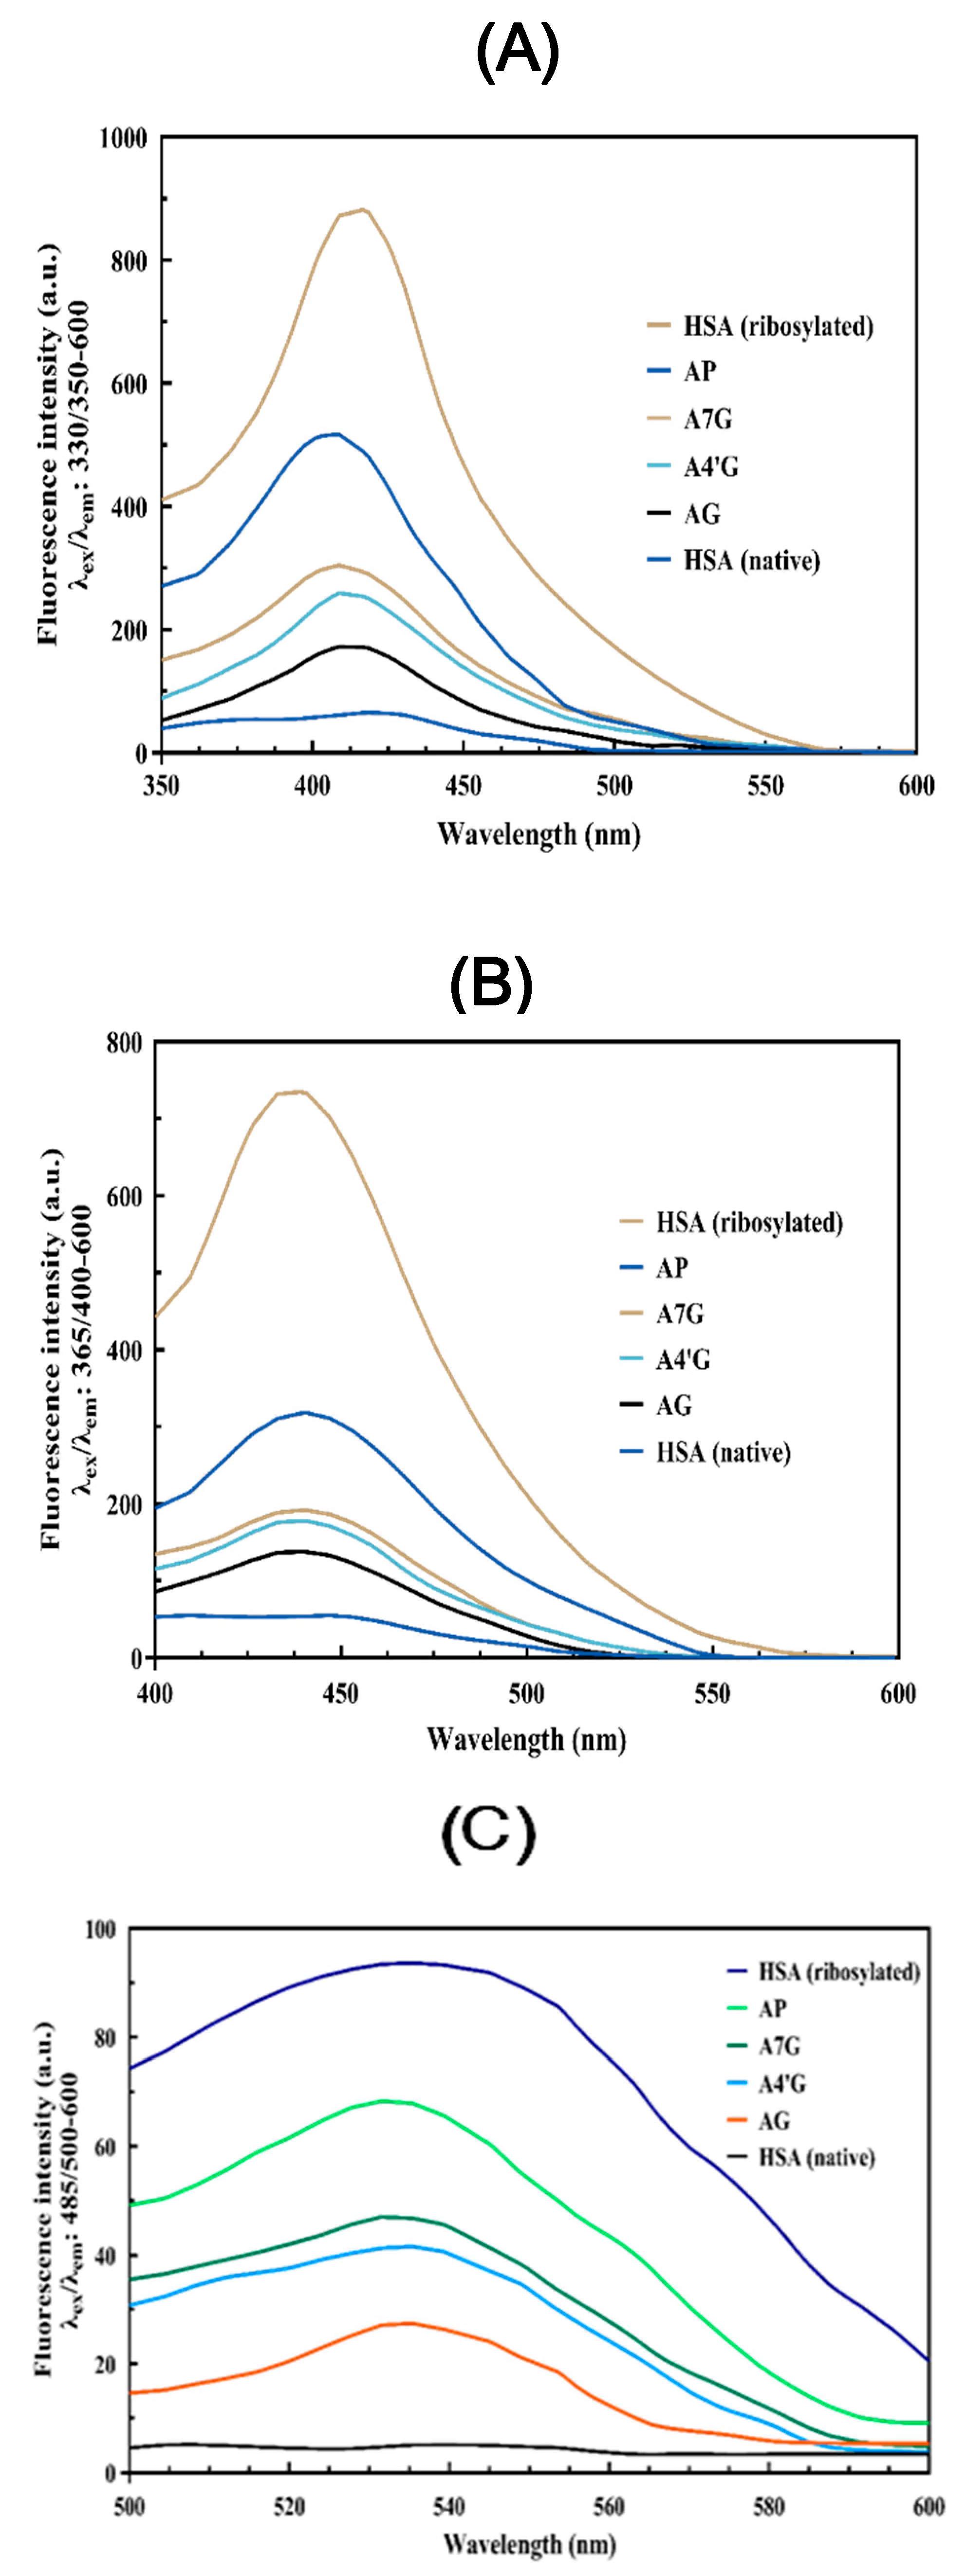
Figure 7.
Absorption spectra of native and ribosylated HSA after 21 days of incubation at 37 °C, with and without 20 µM AP, A4′G, A7G, and AG (10 mM).
Figure 7.
Absorption spectra of native and ribosylated HSA after 21 days of incubation at 37 °C, with and without 20 µM AP, A4′G, A7G, and AG (10 mM).
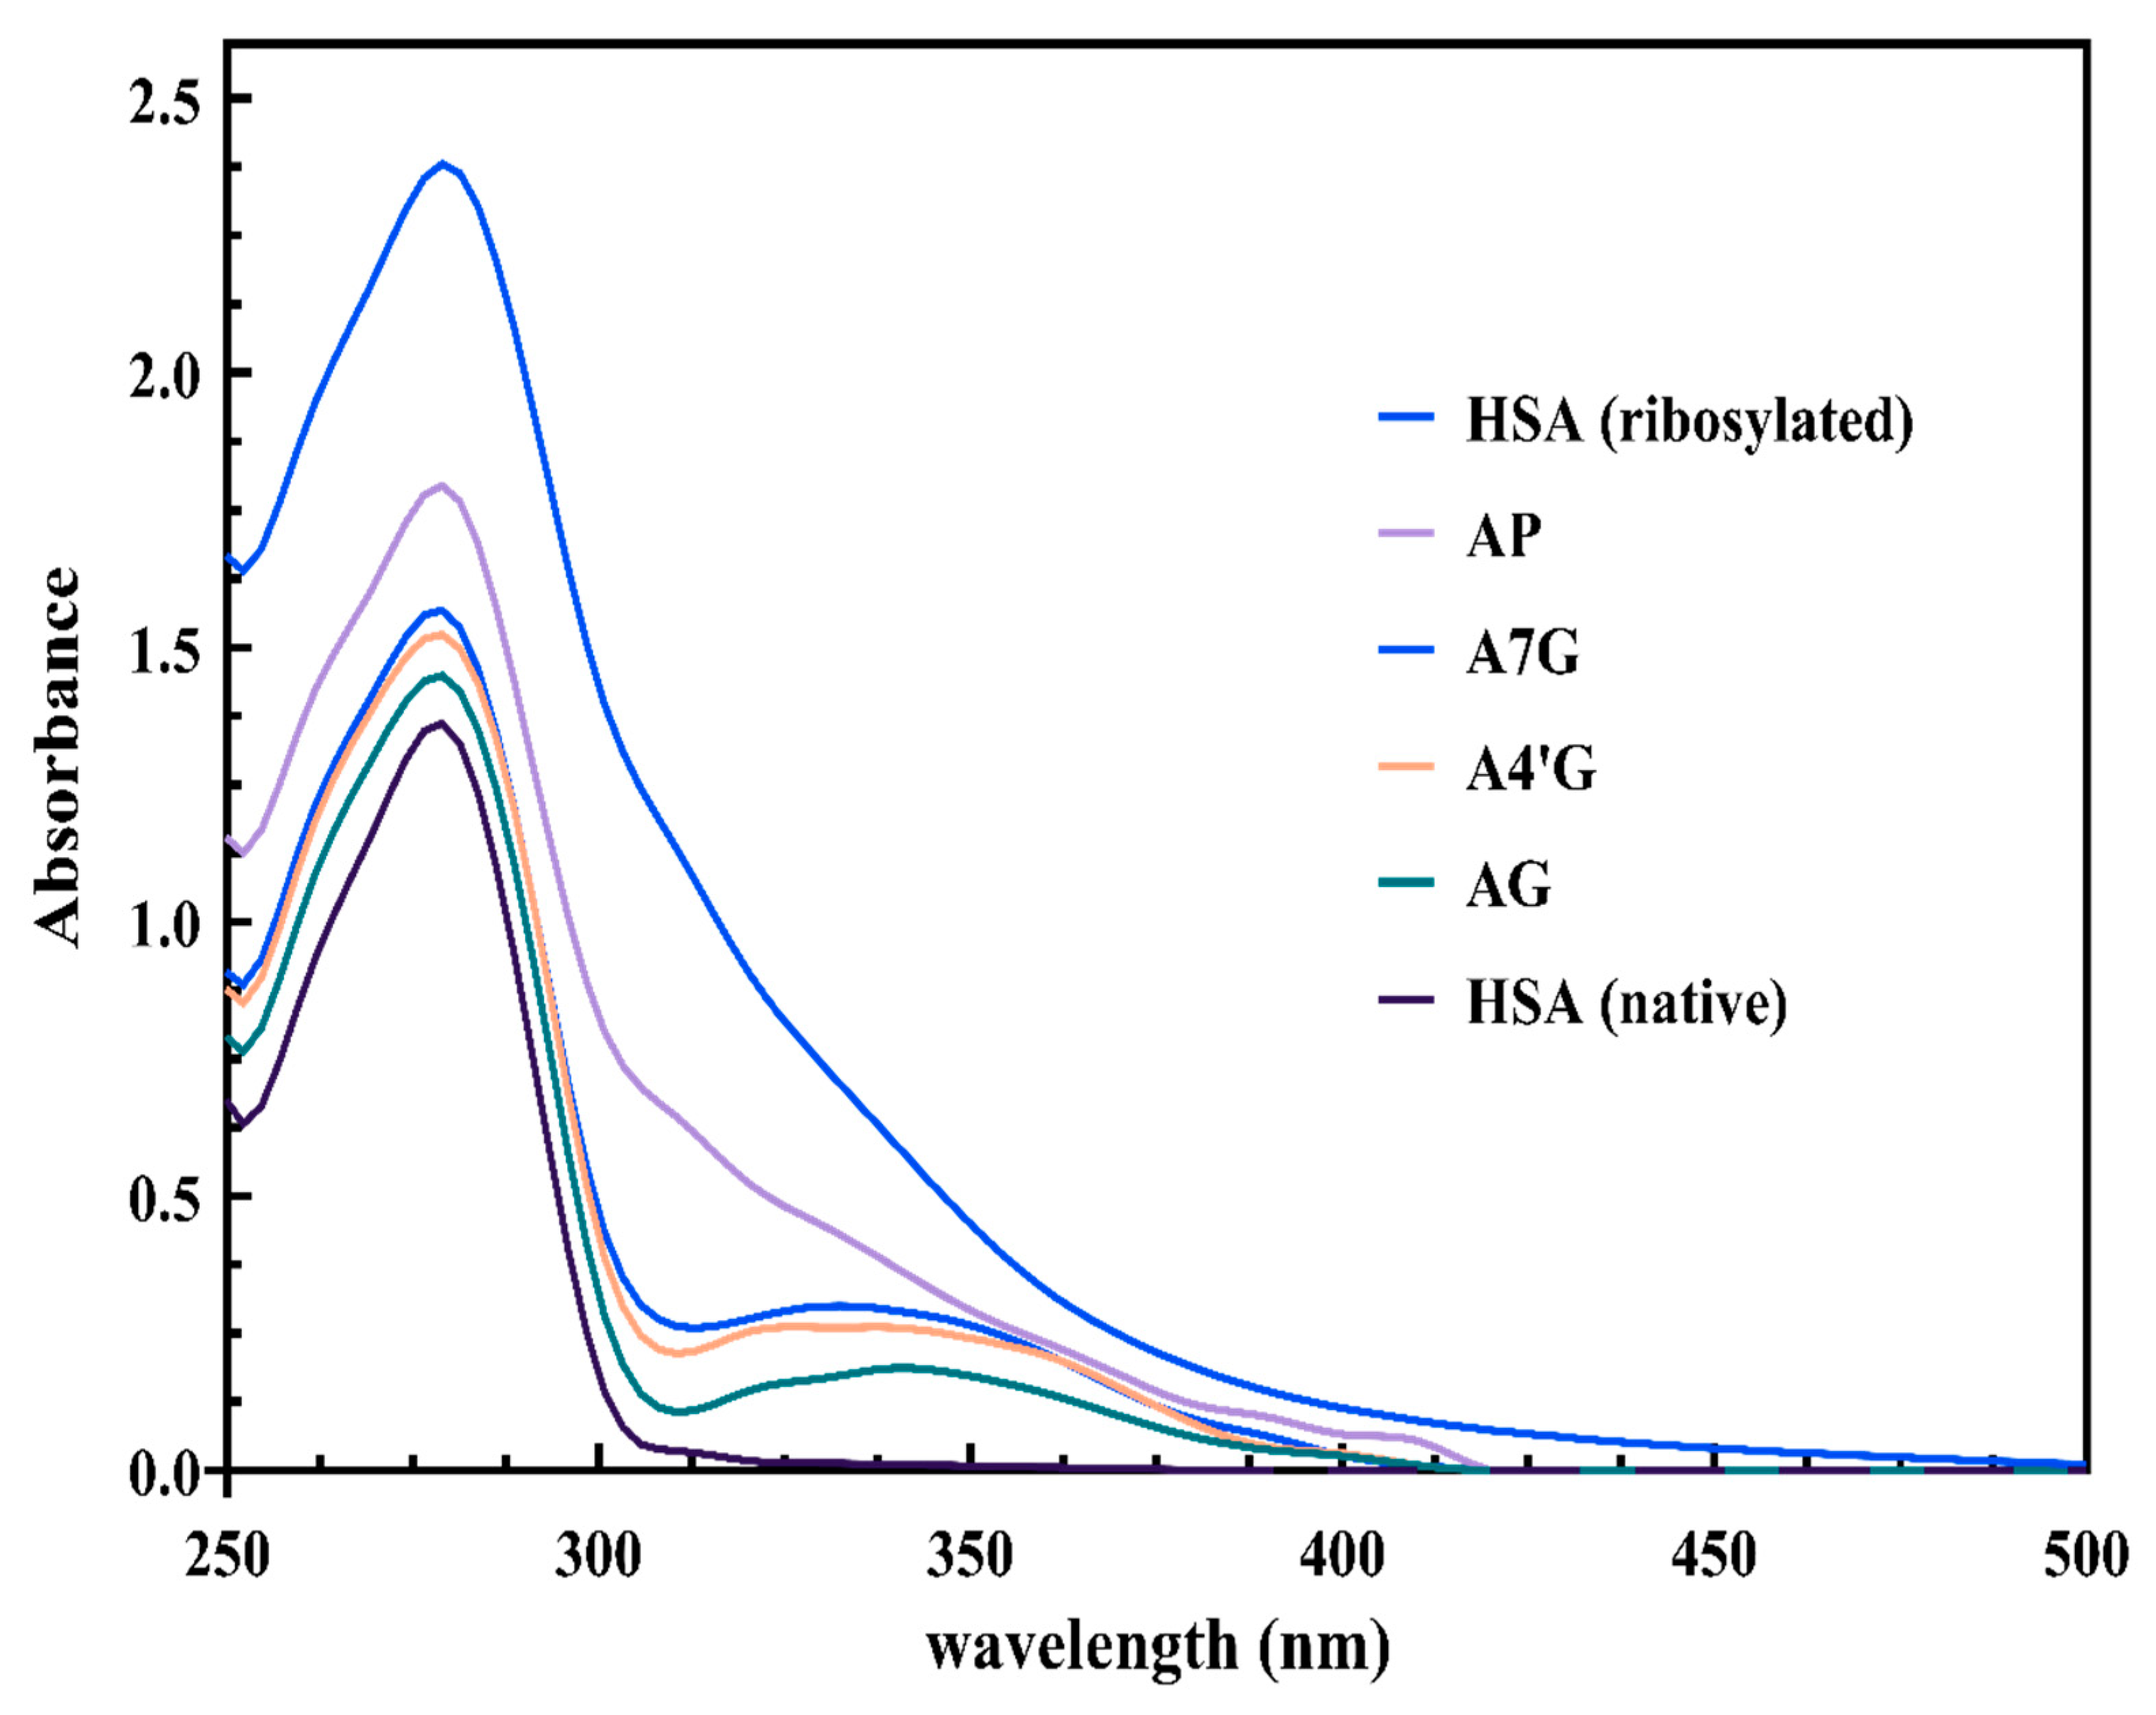

Table 1.
Kinetic parameters of esterase-like activity for native and ribosylated HSA in the presence of AP, A4′G, and A7G after 21 days of incubation at 37 °C.
Table 1.
Kinetic parameters of esterase-like activity for native and ribosylated HSA in the presence of AP, A4′G, and A7G after 21 days of incubation at 37 °C.
| Samples | Km (mM) | Vmax (mM/min) |
| Native HSA | 0.542 ± 0.061 | 1.254 ± 0.001 |
| Glycated HSA | 1.953 ± 0.091 | 1.256 ± 0.003 |
| AG 10 mM | 0.912 ± 0.054 | 1.254 ± 0.002 |
| Apigenin 1 µM | 1.885 ± 0.087 | 1.243 ± 0.004 |
| Apigenin 10 µM | 1.539 ± 0.058 | 1.239 ± 0.002 |
| Apigenin 20 µM | 1.351 ± 0.073 | 1.241 ± 0.002 |
| A4'G 1 µM | 1.754 ± 0.049 | 1.238 ± 0.001 |
| A4'G 10 µM | 1.407 ± 0.071 | 1.238 ± 0.002 |
| A4'G 20 µM | 1.162 ± 0.067 | 1.246 ± 0.002 |
| A7G 1 µM | 1.733 ± 0.051 | 1.242 ± 0.002 |
| A7G 10 µM | 1.438 ± 0.041 | 1.244 ± 0.004 |
| A7G 20 µM | 1.183 ± 0.025 | 1.236 ± 0.003 |
Table 2.
The amount of absorption at wavelengths of 330 nm, 360 nm, and 400 nm. Native and ribosylated-HSA in the presence of tested concentrations of AP, A4′G, A7G, and aminoguanidine (10 mM).
Table 2.
The amount of absorption at wavelengths of 330 nm, 360 nm, and 400 nm. Native and ribosylated-HSA in the presence of tested concentrations of AP, A4′G, A7G, and aminoguanidine (10 mM).
| Samples | OD330nm | OD360nm | OD400nm |
| HSA (native) | 0.014 | 0.006 | 0.000 |
| HSA (ribosylated) | 0.740 | 0.329 | 0.114 |
| AG 10 mM | 0.168 | 0.141 | 0.027 |
| AP 1 µM | 0.548 | 0.272 | 0.113 |
| AP 10 µM | 0.342 | 0.225 | 0.047 |
| AP 20 µM | 0.447 | 0.233 | 0.066 |
| A4'G 1 µM | 0.556 | 0.276 | 0.117 |
| A4'G 10 µM | 0.334 | 0.253 | 0.078 |
| A4'G 20 µM | 0.260 | 0.210 | 0.031 |
| A7G 1 µM | 0.556 | 0.276 | 0.117 |
| A7G 10 µM | 0.334 | 0.253 | 0.078 |
| A7G 20 µM | 0.299 | 0.214 | 0.027 |
Table 3.
Molecular docking score of AP, A4′G, and A7G with HSA.
| Receptor/ligand complex | Binding free energy (kcal/mol) | Hydrogen bonding interactions |
| HSA/AP | -7.6 | A:LYS106:HZ2 - :API:O2 |
| :API:H2 - A:GLY248:O | ||
| A:GLY248:CA - :API:O3 | ||
| HSA/A4'G | -10.4 | A:LYS199:HZ2 - :A4'G:O9 |
| A:LYS199:HZ2 - :A4'G:O8 | ||
| :A4'G:H4 - A:PRO147:O | ||
| :A4'G:H6 - A:PHE149:O | ||
| A:HIS242:CE1 - :A4'G:O9 | ||
| :A4'G:C15 - A:TYR148:O | ||
| HSA/A7G | -9.6 | A:GLN29:HE22 - :A7G:O6 |
| :A7G:H6 - A:PRO147:O | ||
| :A7G:H4 - A:GLY248:O | ||
| :A7G:H3 - A:TYR148:O | ||
| :A7G:H8 - A:GLN196:O | ||
| :A7G:C14 - A:TYR148:O |
Disclaimer/Publisher’s Note: The statements, opinions and data contained in all publications are solely those of the individual author(s) and contributor(s) and not of MDPI and/or the editor(s). MDPI and/or the editor(s) disclaim responsibility for any injury to people or property resulting from any ideas, methods, instructions or products referred to in the content. |
© 2025 by the authors. Licensee MDPI, Basel, Switzerland. This article is an open access article distributed under the terms and conditions of the Creative Commons Attribution (CC BY) license (http://creativecommons.org/licenses/by/4.0/).
Copyright: This open access article is published under a Creative Commons CC BY 4.0 license, which permit the free download, distribution, and reuse, provided that the author and preprint are cited in any reuse.


