
Submitted:
17 November 2023
Posted:
20 November 2023
You are already at the latest version
Abstract
Obesity and overweight are associated with many metabolic diseases, such as hypertension, diabetes, and dyslipidemia, which are closely related to a sedentary lifestyle and lack of exercise. Aerobic exercise effectively increases the high-density lipoproteins-cholesterol (HDL-C) levels and decreases the triglyceride (TG) levels. The consumption of Cuban policosanol (Raydel®) is also effective in enhancing the HDL-C quantity and HDL functionality to treat dyslipidemia and hypertension. On the other hand, no study has examined the effects of a combination of high-intensity exercise and policosanol consumption in obese subjects to improve metabolic disorders. In the current study, 17 obese subjects (average BMI 30.0±1.1 kg/m2, eight male and nine female) were recruited to participate in a program combining exercise and policosanol (20 mg) consumption for 12 weeks. After completion, their BMI, waist circumference, total fat mass, systolic blood pressure (SBP), and diastolic blood pressure (DBP) decreased by approximately 15% (p=0.022), 12.7% (p=0.008), 33% (p=0.006), 11% (p<0.046), and 13% (p=0.007), respectively. In the serum lipid profile, at week 12, they showed a remarkable decrease in the total cholesterol (TC) and triglyceride (TG) levels, up to 17% (p<0.019) and 54% (p<0.002) from the baseline, respectively. Although the serum HDL-C was increased by approximately +12% from the baseline, the percentage of HDL-C in TC, HDL-C/TC (%), was increased by up to +32% (p=0.007) at week 12. The serum coenzyme Q10 (CoQ10) level was increased 1.2-fold in all participants at week 12 from the baseline. In particular, the male participants showed a 1.4-fold increase (p=0.027) from the baseline. The larger increase in serum CoQ10 was correlated with the larger increase in the serum HDL-C during 12 weeks. The hepatic function parameters were improved; the serum -glutamyl transferase decreased at week 12 by up to 55% (p<0.007), while the aspartate aminotransferase and alanine transaminase levels decreased within the normal range. In the lipoprotein level, the extent of oxidation and glycation were reduced significantly in VLDL and LDL, with a remarkable decrease in the TG content in particles. The antioxidant abilities of HDL2 and HDL3, such as paraoxonase (PON) and ferric ion reduction ability (FRA), were enhanced significantly by up to 1.8-fold (p<0.001) and 1.6-fold (p<0.001) at week 12. The particle size and number of HDL2 were increased up to +10% during the 12 weeks with a remarkable decrease in the TG content, glycation extent, oxidation up to 32% (p=0.032), 18% (p=0.043), and 11% (p=0.023), respectively. The particle number and diameter of HDL3 were increased by up to +9% with a remarkable increase in the PON activity, FRA activity, and TC content of +82% (p<0.001), +56% (p<0.001), and +32% (p=0.009), respectively. Expression of apolipoproteinA-I in HDL2 and HDL3 were significantly elevated more in both gender around 30~48% with more distinct band intensity and less glycation at week 12. These improvements in HDL quality and functionality were linked to the higher survivability of adult zebrafish and their embryos. Under the co-presence of carboxymethyllysine (CML), a microinjection of HDL2 to zebrafish embryo from week 0 resulted in approximately 47% survivability with developmental defects and attenuated speed. On the other hand, the HDL2 microinjection from week 12 resulted in remarkably higher survivability (~ 70%). In conclusion, 12 weeks of Cuban policosanol (Raydel®, 20 mg) consumption with high-intensity exercise showed significant improvement in blood pressure, body fat mass, blood lipid profile without liver damage, CoQ10 metabolism, and renal impairment. At week 12, all participants showed a remarkable decrease in oxidation and glycation extent in the VLDL and LDL with a decrease in the TC and TG content. Significant enhancement of the qualities and functionalities in HDL2 and HDL3 by the policosanol consumption were also detected: increase in apoA-I content, TC content, particle size, and particle numbers along with antioxidant abilities, such as PON and FRA.
Keywords:
high-density lipoproteins
; apolipoprotein A-I
; policosanol
; exercise
; paraoxonase
; low-density lipoproteins
1. Introduction
Obesity and overweight are global health issues with the exacerbation of cardiovascular risk and metabolic syndrome, such as hypertension and dyslipidemia with low high-density lipoproteins (HDL)-cholesterol and high triglyceride [1,2]. Sedentary lifestyles are a major risk factor for metabolic syndrome and cardiovascular diseases (CVD) [3,4], which are frequently associated with low HDL-C and high triglyceride (TG), insulin resistance, and abdominal obesity [5,6]. Exercise is a therapy to reduce the risk of cardiovascular disease and overall mortality in a dose-dependent manner [7,8]. On the other hand, the optimal length of the treatment period and exercise intensity to achieve a desirable weight loss, normal blood pressure range, and improvement of serum lipid profile are still unclear depends on age and gen der .
The magnitude of the effects of exercise training on raising the HDL-C level was disappointing: 1.1 and 1.4 mg/dL elevation of HDL-C for men and women, respectively, from five months of aerobic exercise [9]. Although the correlation between the increase in HDL-C and the exercise period and exercise intensity is unclear, the increase in HDL-C levels was unsatisfactory, ranging from 0.27 to 5.41 mg/dl from 23-meta analyses [10]. In addition, the blood pressure (BP) lowering effects of exercise were also unsatisfactory, varying between systolic BP (SBP) and diastolic BP (DBP). Aerobic and static exercise can reduce the SBP significantly, but not the DBP [11,12]. These results suggest that exercise alone cannot achieve sufficient treatment efficacy in lowering the BP and raising the HDL-C levels, despite effectively lowering the body weight, body fat, and serum triglyceride.
Although a combination of statin, either rosuvastatin or atorvastatin, and exercise therapy for 20 weeks raised the HDL-C significantly (from 46±14 mg/dL to 54±14 mg/dL), the combination therapy did not affect blood pressure [13]. The use of statin has been closely associated with undesirable musculoskeletal damage, such as muscular pain, cramps, and stiffness [14]. A combination of statin and high-intensity exercise (eccentric and strenuous exercises) caused muscle injury, whereas a combination with moderate exercise did not cause myopathy [15]. On the other hand, many studies strongly suggest that statin-associated myopathy and myalgia were more exacerbated with an increase in exercise [16], which have been the most common statin side effects [17]. The myopathy and myalgia were more associated with the decrease in CoQ10 by statin consumption and regular exercise [18]. Therefore, increasing or preserving the CoQ10 levels could be an indispensable strategy to treat dyslipidemia and atherosclerosis without adverse effects [19].
In contrast, eight weeks, 12 weeks, or 24 weeks of Cuban policosanol supplementation resulted in a significant decrease in SBP and DBP and an increase in the HDL-C levels in prehypertensive subjects without exercise training [20,21,22]. On the other hand, no study has compared the efficacy of treating hypertension and dyslipidemia by a combination of exercise and policosanol consumption in obese subjects. The correlation between the change in BP and HDL-C levels after combination therapy of high-intensity exercise and policosanol consumption in obese subjects needs to be determined.
A nationally representative study with the Korea National Health and Nutrition Examination Survey showed that patients with metabolic syndrome had significantly higher levels of liver enzymes, aspartate aminotransferase (AST), alanine transaminase (ALT), γ-glutamyl transferase (GTP), and alkaline phosphatase (ALP), than the control subjects [23]. In addition, liver function enzymes, AST, ALT, and γ-GTP were usually elevated by high-intensity exercise, particularly in weight training, as an intense exercise-induced liver injury [24]. Therefore, it is necessary to compare the change in the serum enzymes for liver damage and CoQ10 level by a combination therapy of Cuban policosanol (20 mg/day) and high-intensity exercise in subjects with metabolic syndrome.
The current study was designed to compare the changes in blood pressure, lipid profile parameters, hepatic function parameters, and CoQ10 levels in the serum after 12 weeks of Cuban policosanol consumption and high-intensity exercise. The changes in the qualities of lipoproteins VLDL, LDL, HDL2, and HDL3 were compared using composition analysis, extent of oxidation and glycation, and transmission electron microscopy (TEM). As a HDL functionality test, the antioxidant and anti-inflammatory activities were compared using zebrafish embryo survivability under the presence of carboxymethyllysine. The zebrafish embryos have well-developed innate and acquired immune systems like mammalian ones [25]. An additional advantage of working with zebrafish embryos is external development and optical transparency during development. With these characteristics, zebrafish and their embryos are a valuable and popular animal model for various studies, including screening of antioxidants and anti-inflammatory agents [26].
2. Materials and Methods
2.1. Policosanol
The Raydel® policosanol tablets (20 mg) were obtained from Raydel Korea (Seoul, Korea), which was manufactured from Cuban policosanol at Raydel Australia (Thornleigh, Sydney, Australia). Cuban policosanol was defined as genuine policosanol with a specific ratio of each ingredient [27]: 1-tetracosanol (C24H49OH, 0.1–20 mg/g); 1-hexacosanol (C26H53OH, 30.0–100.0 mg/g); 1-heptacosanol (C27H55OH, 1.0–30.0 mg/g); 1-octacosanol (C28H57OH, 600.0–700.0 mg/g); 1-nonacosanol (C29H59OH, 1.0–20.0 mg/g); 1-triacontanol (C30H61OH, 100.0–150.0); 1-dotriacontanol (C32H65OH, 50.0–100.0 mg/g); 1-tetratriacontanol (C34H69OH, 1.0–50.0 mg/g).
2.2. Participants
Young and middle-aged obese volunteers (BMI > 28 kg/m2) were recruited randomly through a nationwide newspaper advertisement between September 2022 and December 2022. After recruiting, 20 volunteers (30–51 years old, BMI=30.5±1.1) participated in a daily exercise program, which was at least 120 min with high-intensity exercise per session combined with aerobic exercise 60 min and weight training 60 min. All participants were advised to consume the 20 mg policosanol tablet with a daily record of ingestion time.
This study was approved by the Korea National Institute for Bioethics Policy (KoNIBP, approval number P01-202109-31-009) by the Ministry of Health Care and Welfare (MOHW) of Korea. All completed participants were of Korean ethnicity (n=17, male=8 and female=9). They consumed typical Korean dietary pattern, which is enriched with rice-based carbohydrates (60.8%), total fat (24.2%), and proteins (15.1%), consisting of vegetables, meat, and fish, for 12 weeks without caloric restriction. None of the participants consumed vegan or kosher diets. The exercise frequency, spending time, and intensity were estimated from a self-administered questionnaire inquiring about the frequency, time, and intensity of exercise per week during 12 weeks. The metabolic equivalents (METs) were calculated using a shorthand method for estimating the energy expenditure during physical activity to compare the intensity values of specific activities [28]. The METs score was calculated based on the survey results of the participants and were classified as follows: Light <3.0 METs; Moderate 3.0 ~ 6.0 METs; Vigorous >6.0 METs.

Table 1.
Baseline characteristics of participants.1.
| Groups | Age | BMI | Total Exercise | Strength Exercise | Aerobic Exercise | MET |
|---|---|---|---|---|---|---|
| mean ± SEM | mean ± SEM | min/week | min/week | min/week | Score | |
| Male (n=8) |
36.9 ± 1.9 | 31.0 ± 1.9 | 655.0 ± 97.4 | 285.7 ± 9.2 | 390.0 ± 102.7 | 7.0 ± 0.3 |
| Female (n=9) |
38.4 ± 2.7 | 29.0 ± 1.4 | 714.4 ± 94.5 | 194.4 ± 30.6 | 520.0 ± 84.3 | 7.4 ± 0.1 |
| Total (n=17) |
37.7 ± 1.6 | 30.1 ± 1.1 | 686.5 ± 66.1 | 234.4 ± 20.8 | 458.8 ± 65.7 | 7.2 ± 0.1 |
1 Data are expressed as mean±SEM (standard error of the mean). BMI, body mass index; MET, metabolic equivalents. The metabolic equivalents (MET) score was calculated based on the survey results of the participants and can be classified as previously classified [28]: Light <3.0 METs; Moderate 3.0 ~ 6.0 METs; Vigorous >6.0 METs.
The exclusion criteria were as follows: (1) lack of will to complete the exercise program; (2) severe hepatic, renal, cardiac, respiratory, endocrinological, and metabolic disorder diseases; (3) allergies; (4) heavy drinkers, more than 30 g of alcohol per day; (5) taking medicine or functional food products including any statins and coenzyme Q10 supplements that may affect the lipid metabolism, including raising the HDL-C or lowering the LDL-C concentrations, and lowering the triglyceride concentration; (6) women in pregnancy, lactation, or planning to become pregnant during the study period; (7) people who had donated more than 200 mL of blood donation within one month or 400 mL of blood within three months before starting this clinical trial; (8) a person who participated in other clinical trial within the last three months or currently is participating in other clinical trial.
2.4. Exercise Program
After recruiting and selection, all participants (n=20) were split into four small groups (n=5) and had to join a mandatory exercise program from Monday to Saturday at a public fitness center. The program consisted of aerobic exercise for at least 30 min with high intensity and weight training for at least 30 min with high endurance under supervision by a professional health trainer per each group. During the 12-week program, three participants (2 male and 1 female) quit because of their busy schedules and omitting policosanol intake. Seventeen participants completed the daily consumption of policosanol and the exercise program.
2.5. Anthropometric Analysis
Licensed technicians at Health examination information of the Seoul Eastern Branch of the Korea Health Care Association (Seoul, Korea) measured all the anthropometric data and blood pressure data in Table 2. The height, body weight, body fat, and muscle weight were measured individually using INBODY770 (Inbody Co., Seoul, Korea). The blood pressure was measured using a digital automatic blood pressure monitor TM-2655P (A&D Co., Tokyo, Japan).
2.6. Blood Analysis
Blood was donated voluntarily by the participants after 12 hours of fasting and collected according to the Helsinki guidelines approved by the Institutional Review Board of Korea National Institute for Bioethics Policy (KoNIBP, approval number P01-202109-31-009) supported by the Ministry of Health Care and Welfare (MOHW) of Korea. After overnight fasting, blood was collected using a vacutainer (BD Bio Sciences, Franklin Lakes, NJ, USA) without adding an anticoagulant. The serum lipid profiles in Table 3 and protein parameters in Table 4 were determined using an automatic analyzer (Cobas C502 chemistry analyzer, Roche, Germany) at a commercially available diagnostic service via SCL Healthcare (Seoul, Korea).
2.7. Quantification of Serum Coenzyme Q10
The concentration of CoQ10 in serum was measured using an enzyme-linked immunosorbent assay (ELISA) kit with CUSABIO human CoQ10 ELİSA kit (Cat# CSB-E14081h, Cusabio Biotechnology Inc. Houston, TX, USA) in according to the manufacturer’s protocol with 100-fold diluted serum from individual subjects.
2.8. Isolation of Lipoproteins
Very low-density lipoproteins (VLDL, d<1.019 g/ml), LDL (1.019<d<1.063), HDL2 (1.063<d<1.125), and HDL3 (1.125<d<1.225) were isolated from the individual serum via sequential ultracentrifugation, as reported elsewhere [29], with the density adjusted adding NaCl and NaBr in according to standard protocols [30]. Briefly, each serum with the density adjusted was ultracentrifuged sequentially at 100,000×g for 24 hr at 10 °C using a Himac NX (Hitachi, Tokyo, Japan) equipped with a fixed angle rotor P50AT4-0124 at the Raydel Research Institute (Daegu, Korea). The separated lipoproteins were collected and processed individually for dialysis to remove any traces of NaBr against Tris-buffered saline (TBS; 10 mM Tris-HCl, 140 mM NaCl, and 5 mM ethylene-diamine-tetraacetic acid (EDTA) [pH 8.0]).
2.9. Characterization of Lipoproteins
Individual lipoproteins, VLDL, LDL, HDL2, and HDL3, were characterized to determine the lipid and protein composition, oxidation extent, and glycation extent. For each lipoprotein fraction purified individually, the total cholesterol (TC) and TG measurements were obtained using commercially available kits (cholesterol, T-CHO, and TG, Cleantech TS-S; Wako Pure Chemical, Osaka, Japan). The protein concentrations of the lipoproteins were determined using a Lowry protein assay, as modified by Markwell et al. [31] using a Folin & Ciocalteu’s phenol reagent (F9252, Sigma–Aldrich, St. Louis, MO, USA) with bovine serum albumin (BSA) as a standard.
Under the same protein concentration in each lipoprotein, the degree of oxidation of the individual lipoproteins was assessed by measuring the concentration of oxidized species according to the thiobarbituric acid reactive substances (TBARS) method using malondialdehyde (MDA) as a standard [32]. The extent of glycation of individual lipoprotein was determined by measuring the fluorometric intensity at 370 nm (excitation) and 440 nm (emission) under the same protein concentration, as described previously [33], using an FL6500 spectrofluorometer (Perkin-Elmer, Norwalk, CT, USA), and a 1 cm path-length suprasil quartz cuvette (Fisher Scientific, Pittsburg, PA, USA).
The expression of apolipoproteins in HDL2 (2 mg of protein/mL) and HDL3 (2 mg of protein /mL) were compared using 15% SDS-PAGE under denatured state with β-mercaptoethanol addition. The protein bands were visualized by 0.125% Coomassie Brilliant Blue, after which the relative band intensities between weeks 0 and 12 were compared by band scanning using Gel Doc® XR (Bio-Rad) with Quantity One software (version 4.5.2).
2.10. Electron Microscopy
TEM (Hitachi H-7800; Ibaraki, Japan) at Raydel Research Institute (Daegu, Korea) was performed at an acceleration voltage of 80 kV. Each lipoprotein was stained negatively with 1% sodium phosphotungstate (PTA; pH 7.4) with a final apolipoprotein concentration of 0.3 mg/mL in TBS. Five μL of the lipoprotein suspension was blotted with filter paper and replaced immediately with a 5 μL droplet of 1% PTA. After a few seconds, the stained HDL fraction was blotted onto a Formvar carbon-coated 300 mesh copper grid and air-dried. The shape and size of each lipoprotein were determined by TEM at 40,000× magnification, using EMIP-EX software, Ver. 07.13 (Hitachi, Tokyo, Japan), according to a previous report [29].
2.11. Agarose Electrophoresis
The electromobility of the participants’ samples was compared by evaluating the migration of each lipoprotein (LDL, HDL2, and HDL3) by agarose electrophoresis [34]. The relative electrophoretic mobility depends on the intact charge and three-dimensional structure of LDL and HDL. More oxidized LDL migrated faster towards the bottom of the gel due to apo-B fragmentation and increased the negative charge. The gels were dried and stained with 0.125% Coomassie Brilliant Blue, after which the relative band intensities were compared by band scanning using Gel Doc® XR (Bio-Rad) with Quantity One software (version 4.5.2).
2.12. Antioxidant Activities in the HDL
The paraoxonase-1 (PON-1) activity toward paraoxon was determined by evaluating the hydrolysis of paraoxon to p-nitrophenol and diethylphosphate catalyzed by the enzyme [35]. Equally diluted rHDL (20 μL, 1 mg/mL) was added to 180 μL of paraoxon-ethyl (Sigma Cat. No. D-9286) containing the buffer solution (90 mM Tris-HCl/3.6 mM NaCl/2 mM CaCl2 [pH 8.5]). The PON-1 activity was then determined by measuring the initial velocity of p-nitrophenol production at 37°C, as determined by the absorbance at 415 nm (microplate reader, Bio-Rad model 680; Bio-Rad, Hercules, CA, USA).
The ferric ion-reducing ability (FRA) was determined using the method reported by Benzie and Strain [36]. Briefly, the FRA reagents were freshly prepared by mixing 20 mL of 0.2 M acetate buffer (pH 3.6), 2.5 mL of 10 mM 2,4,6-tripyridyl-S-triazine (Fluka Chemicals, Buchs, Switzerland) and 2.5 mL of 20 mM FeCl3∙6H2O. The antioxidant activities of each HDL were estimated by measuring the increase in absorbance induced by the ferrous ions generated. Freshly prepared FRA reagent (300 μL) was mixed with each HDL (100 μg of protein in 1 mL) as an antioxidant source. The FRA was determined by measuring the absorbance at 593 nm every two min during the 60 min period at 25 °C using a UV-2600i spectrophotometer (Shimadzu, Kyoto, Japan) with Labsolutions software UV-Vis 1.11 (Shimadzu, Kyoto, Japan).
2.13. Zebrafish Maintenance
Zebrafish and their embryos were maintained using standard protocols [37] and in compliance with the Guide for the Care and Use of Laboratory Animals [38]. All zebrafish-related procedures and maintenance were approved by the Committee of Animal Care and Use of Raydel Research Institute (approval code RRI-20-003, Daegu, Republic of Korea). The zebrafish were housed in a temperature-controlled system tank at 28 °C and subjected to a 10:14 hour light cycle. The fish were fed a regular diet of tetrabit granules (TetrabitGmbh D49304, containing 47.5% crude protein, 6.5% crude fat, 2.0% crude fiber, and 10.5% crude ash) supplemented with vitamin A (29,770 IU/kg), vitamin D3 (1860 IU/kg), vitamin E (200 mg/kg), and vitamin C (137 mg/kg) from Melle, Germany.
2.14. Microinjection of CML and HDL into Zebrafish Embryos
One day post-fertilization (dpf), zebrafish embryos were microinjected individually using a pneumatic picopump (PV830; World Precision Instruments, Sarasota, FL, USA) equipped with a magnetic manipulator (MM33; Kantec, Bensenville, IL, USA) and a pulled with a microcapillary pipette-using device (PC-10; Narishigen, Tokyo, Japan). An injection of each HDL3 (10 ng of protein) or co-injection with CML (500 ng) was performed at the same location in the yolk to minimize bias using a previously described method [39]. After the injection, the live embryos were observed under a stereomicroscope (Zeiss Stemi 305, Oberkochen, Germany) and photographed at 20× magnification using a ZEISS Axiocam 208 color (Jena, Germany). The chorion was removed 24 hours post-injection, and each live embryo was compared to assess the developmental stage at a higher magnification of 50×.
2.15. Imaging of Oxidative Stress, Apoptosis in Embryo
After injecting CML with each rHDL, the reactive oxygen species (ROS) levels and the extent of cellular apoptosis in the embryos were imaged by dihydroethidium (DHE) staining and acridine orange (AO) staining, respectively, as described elsewhere [40]. Images of the ROS were obtained by fluorescence observations (Ex=585 nm and Em=615 nm), as described previously [41]. The extent of cellular apoptosis among the groups was compared using acridine orange (AO) staining and fluorescence observations (Ex = 505 nm, Em = 535 nm), as reported elsewhere [42] using a Nikon Eclipse TE2000 microscope (Tokyo, Japan).
2.16. Statistical Analysis
The findings are reported as the mean ± SEM, derived from at least three independent experiments with duplicate samples. A paired t-test was used to assess the statistical significance between the baseline and follow-up values within the groups. Spearman correlation analysis was performed to identify the positive or negative associations between the serum level of CoQ10 and the lipid profile and blood pressure. All statistical analyses were conducted using the SPSS software package version 29.0 (SPSS Inc., Chicago, IL, USA).
3. Results
3.1. Changes in Anthropometric Profiles
The SBP and DBP decreased significantly by −7.7% (p=0.046) and −12.8% (p=0.007), respectively, at week 12 compared to the baseline (week 0), suggesting that policosanol consumption and exercise improved prehypertension (Table 2). In particular, the male group, which had more hypertension at week 0, showed a more remarkable decrease in the SBP and DBP by up to −10.9% and −19.4% than those of the female group. All participants showed a remarkable decrease in body weight, waist circumference, total fat mass, and body fat percentage during the 12 weeks of consumption, especially in male participants. On the other hand, there was no change in muscle mass and body water content during 12 weeks of consumption.
3.2. Change in Serum Coenzyme Q10 and Lipid Profiles
After 12 weeks of policosanol consumption and exercise, all participants showed a remarkable decrease in the TC, TG, and remnant cholesterol levels by up to −17%, −53%, and −49%, respectively. The HDL-C and HDL-C/TC (%) levels were also increased by up to 12% and 31%, respectively (Table 3). In particular, the male participants showed a larger decrease in TC and TG, approximately −21% and −56%, respectively, and a larger increase in HDL-C of approximately 24% than those of the female participants. All participants exhibited a remarkable decrease in remnant cholesterol (RC), TG/HDL-C, LDL-C, and HDL-C: LDL-C (L:H) ratio after 12 weeks, as listed in Table 3.
Interestingly, the serum CoQ10 level of all participants was 1.2-fold elevated at week 12 (492±25 ng/mL) from baseline (408±30 ng/mL), as shown in Figure 1A. In addition, the male participants showed a significant increase in the serum CoQ10, 1.4-fold (p=0.027) higher at week 12 (471±27 ng/mL) than week 0 (341±28 ng/mL), while the female participants showed a similar level between weeks 12 (513±43 ng/mL) and 0 (476±48 ng/mL). These results suggest that policosanol consumption did not interfere with the CoQ10 metabolism in both genders, but the male group showed a larger increase in the serum CoQ10 level after 12 weeks of consumption. Spearman correlation analysis showed that the net increase in CoQ10 level was significant and positively correlated with the net increase in HDL-C (r=0.621, p=0.018) between weeks 0 and 12, as shown in Figure 1B, but it was not correlated with the net change of TC, TG, and LDL-C (data not shown).
The serum CoQ10 /TC ratio was increased by 45% (p=0.034) at week 12 from baseline in the total participants (Table 3). In particular, the male group showed a 73% increase (p=0.007) of CoQ10 /TC ratio at week 12 from baseline. Moreover, the CoQ10/LDL-C ratio at week 12 was approximately 51% (p=0.026) higher than the baseline in the total participants; the male group showed an 82% increase (p=0.007) in the CoQ10 /LDL-C ratio. On the other hand, although the female group showed a 28% and 34% increase in the CoQ10 /TC ratio and CoQ10 /LDL-C ratio, respectively, at week 12 from the baseline, no notable significance was detected between weeks 0 and 12. Interestingly, The CoQ10/HDL-C ratio was not changed in the male and female groups between weeks 0 and 12, 370–415 ng/mL. These results suggest that the serum CoQ10 level was not decreased by exercise and policosanol consumption even though the TC, TG, and LDL-C were decreased remarkably. At week 12, the increase in serum CoQ10 level correlated with the increase in HDL-C.
3.3. Change in the Serum Protein Parameters
All participants showed decreased serum AST, ALT, creatinine, and e-GRF levels, which were in the normal range during the 12 weeks of policosanol consumption and exercise, suggesting no notable changes in hepatic damage and kidney impairment (Table 4). On the other hand, γ-GTP was reduced remarkably (by −55%; p=0.007) in all participants at week 12 from baseline. In particular, the male participants showed a larger decrease (up to −59%; p=0.046) from the baseline. The serum glucose, apoA-I, apo-B level, apoA-I/apo-B ratio, and hsCRP levels did not change significantly between weeks 0 and 12, which fell within the normal range (Table 4). These results suggest that policosanol consumption and exercise caused significant improvement in the hepatic parameters without impairing the renal functions, apolipoprotein metabolism, and systemic inflammation.
3.4. Change of VLDL and LDL Properties and Compositions
In VLDL, the extent of glycation and oxidation decreased remarkably (−42 to −43%) in the male and female groups, showing an approximately −26% and −44% decrease in the TC and TG content, respectively, during 12 weeks of consumption (Table 5). Interestingly, at week 0, the female participants showed 30%, 12%, and 9% higher glycation extent, TC content, and TG content, respectively, than those of the male group in VLDL, while the oxidation extent was 34% lower than the male participants. On the other hand, the female group showed a larger decrease in glycation, oxidation, TC content, and TG content than the male group, resulting in impressive intensification of the VLDL properties. These results suggest that policosanol consumption and exercise improved the VLDL properties remarkably to be less atherogenic.
The LDL particle properties were also enhanced at week 12 with a remarkable decrease in glycation and oxidation (up to −14% and −22%, respectively), as shown in Table 5. In addition, the TC and TG content in LDL decreased by −32% and −43%, respectively, at week 12 compared to the baseline. Despite the decrease in TC and TG contents, the particle diameter of LDL (25–27 nm) did not decrease at week 12, suggesting that the LDL particle had changed to more healthy qualities with less oxidation and glycation. In the male participants, the LDL particle size increased by 9% at week 12 compared to the baseline, while no change was observed with the female participants, suggesting that the improvement was more distinct in the male groups.
3.5. Electromobility of LDL and Extent of Oxidation
More oxidized LDL showed faster electromobility in agarose gel because of the smaller particle size and apo-B fragmentation with a larger TG content in LDL particles. As shown in Figure 2A, at week 12, all participants showed slower electromobility with an approximate 13% increased band intensity (BI) compared to week 0. At week 12, the BI of LDL in all participants was more distinct than at week 0. In contrast, oxidized LDL showed an almost absent and smeared band intensity with the aggregation of LDL in the loading position, as indicated by the arrow. Quantification of the oxidized species in all participants showed that malondialdehyde (MDA) in LDL decreased by approximately −22% at week 12 compared to the baseline (Figure 2B). In particular, male participants showed an up to −32% decrease in MDA, suggesting greater improvement of the LDL in the male group.
3.6. Electron Microscopic Observation of Lipoprotein Image
At week 0, all lipoproteins showed irregular size distributions and ambiguous particle morphologies with aggregation, as indicated by the red arrowhead in VLDL, LDL, HDL2, and HDL3 (Fig 3). On the other hand, at week 12, all lipoproteins had a more regular size distribution and distinct particle morphology without aggregation. At week 12, the particle numbers of VLDL and LDL decreased, while the particle numbers of HDL2 and HDL3 increased, as shown in photos of Figure 3.
During 12 weeks, although the VLDL and LDL particle sizes were relatively unchanged (1195–1364 nm2 (size) and 528–576 nm2 (size), respectively), the HDL2 particle size increased significantly up to 10% (p=0.032) from the baseline (127±5 nm2 and 139±3 nm2 for week 0 and 12, respectively). The HDL3 particle size was increased slightly at week 12 compared to the baseline, but no significance was detected.
3.7. Change of HDL Quality during 12 Weeks
In HDL2, as shown in Table 6, the extent of glycation (FI) and TG content in the particles was reduced by approximately −18% and −32%, respectively, while the particle diameter was increased significantly by approximately 5.8% at week 12 compared to the baseline. In HDL3, the extent of glycation and TG content decreased by up to −16% and −9%, while the TC content increased significantly by approximately 32% compared to week 0. These results suggest that the parameters of the HDL quality were improved, such as decreased glycation and TG content with an increase in TC in both HDL2 and HDL3, by the policosanol consumption and exercise.
3.8. Change of apoA-I Expression in HDL
The male group showed a remarkable increase in apoA-I expression in HDL2 and HDL3 (up to 30% and 35% increase in band intensity, respectively) at week 12 compared to week 0 (baseline), suggesting that apoA-I was expressed more in HDL by policosanol consumption and exercise (Figure 4). The band location of apoA-I (28 kDa) was shifted slightly up, as indicated by the red arrowhead with more multimerization at week 0, suggesting that molecular weight of apoA-I was increased by glycation. On the other hand, the smeared and weaker band intensity at week 0, indicated by the red arrowhead, was improved at week 12 in both HDL2 and HDL3, resulting in a more distinct band intensity and smaller molecular weight. The female group also showed an up to 35% and 48% increase in the apoA-I in HDL2 and HDL3 band intensity, respectively, at week 12 compared to week 0 (baseline) (supplemental Figure S1), suggesting that HDL-associated apoA-I was expressed more by policosanol consumption and exercise.
3.9. Change in the Antioxidant Ability in HDL2 and HDL3
The HDL2-associated antioxidant abilities were elevated remarkably, showing an up to 206% and 25% increase in the paraoxonase (PON) and ferric ion reduction ability (FRA), respectively, at week 12 compared to the baseline (Figure 5). The HDL3-associated PON and FRA increased by approximately 81% and 56%, respectively, at week 12 than that of week 0. These results suggest that policosanol consumption and exercise increased the PON and FRA ability in HDL2 and HDL3. Interestingly, HDL3 showed approximately 20-fold and 1.3-fold higher PON and FRA activities, respectively, than HDL2 at weeks 0 and 12, suggesting that HDL3 exhibited much higher antioxidant activity.
3.10. Embryo Survivability under the Presence of Carboxymethyllysine
The CML-alone injected embryo showed the lowest survivability of approximately 35±3% at 24 hr post-injection. In contrast, the PBS-alone injected embryo showed the highest survivability of 82±8% (Figure 6A). In the presence of CML, co-injection of HDL3 (10 ng of protein) in the male and female groups at week 0 showed 47±2% and 51±3% survivability, respectively. On the other hand, co-injection of HDL3 from the male and female groups at week 12 showed 70±3% and 62±1% survivability, respectively, suggesting that the antioxidant and anti-inflammatory activity of HDL3 was enhanced remarkably to prevent embryo death from CML toxicity.
The PBS-injected embryo showed the fastest development speed with a somite number of 30±2, whereas the CML-injected embryo showed the slowest developmental speed in eye pigmentation and tail elongation with the least somite number 25±1 (Figure 6B). In the presence of CML, the co-injection of HDL3 in the male and female groups at week 0 showed an attenuated developmental speed with a somite number of 26–27. On the other hand, the co-injection of HDL3 from the male and female groups at week 12 showed a faster developmental speed with a somite number of 30–32, suggesting that the enhanced HDL3 functionality contributes to the faster developmental speed and higher survivability.
DHE staining showed that the CML-alone injected group showed the highest ROS production (Figure 6C) (3.7-fold higher than PBS alone), suggesting that CML injection caused prompt ROS production via acute inflammatory cascade. In contrast, the co-injection of HDL3 to either males or females from week 0 showed 53% or 27% lower ROS production, respectively, suggesting that the HDL exhibited adequate anti-inflammatory activity. A co-injection of HDL3 to males or females from week 12 showed 80% or 87% lower ROS production, respectively, suggesting enhanced antioxidant and anti-inflammatory activity of HDL3. AO staining also showed that the CML alone group showed a 2.8-fold greater extent of apoptosis than the PBS alone group, whereas the co-injection of HDL3 to males or females from week 0 produced an 18% lower or 26% higher extent of apoptosis, respectively, suggesting that female HDL3 at week 0 showed the worst quality in regarding the extent of cellular apoptosis. On the other hand, the co-injection of HDL3 to males or females from week 12 showed a 39% or 60% lower extent of cellular apoptosis, respectively, suggesting the enhanced anti-apoptosis activity of HDL3.
4. Discussion
This study examined the combined effects of Cuban policosanol consumption and high-intensity exercise for 12 weeks regarding the change in blood pressure, BMI, serum lipid profile, and lipoprotein qualities and functionalities. Despite the conflicting data depending on age and gender, a meta-analysis with middle-aged and older adults, 45-64 years old, showed that aerobic and static exercise had a significant effect on improving only the SBP around mean difference (MD) −9.254 and −10.465, respectively [11]. In contrast, aerobic and static exercise did not cause a significant reduction of the DBP [11]. In addition, a systematic review of metabolic syndrome in middle-aged women showed that 12–24 weeks of exercise resulted in −0.57 kg, −0.43 kg/m2, −4.89 mmHg, and −2.71 mmHg change in body weight, BMI, SBP, and DBP, respectively [43]. Overall, these results suggest that exercise therapy alone, regardless of aerobic and anaerobic, did not reduce the DBP significantly.
On the other hand, twelve weeks of policosanol consumption (20 mg) without exercise resulted in a decrease in SBP and DBP, −10.5 mmHg (−7.7% compared to the baseline) and −6.2 mmHg (−7.1% compared to the baseline), respectively, in Korean prehypertensive subjects [20]. A randomized trial with 12 weeks of policosanol consumption of normotensive Japanese participants also showed −7.9 mmHg (−9.5% compared to the baseline) and −2.8 mmHg (−4.0% compared to the baseline) of SBP and DBP, respectively [44]. Meta-analysis with 19 studies showed that policosanol consumption resulted in a larger decrease in the SBP (−3.423 mmHg) than the DBP (−1.468 mmHg) [45]. These results suggest that policosanol consumption was more likely to decrease the SBP than DBP because exercise alone resulted in only a significant decrease in SBP. In the current results, however, a combination of Cuban policosanol consumption and exercise resulted in a more dramatic decrease in DBP (−10.6 mmHg) (p= 0.007, −12.8% from baseline), whereas the decrease in SBP was approximately −9.8 mmHg (p=0.046, −7.7% compared to the baseline). In particular, the male participants showed a 3.2-fold larger decrease in DBP (−16.7 mmHg, −19.4% compared to the baseline) than that of female participants (−5.1 mmHg, −6.4% from the baseline), as shown in Table 2. These results strongly suggest that there might be a synergistic effect in a combination of policosanol consumption and exercise to result in a remarkable decrease in SBP and DBP.
The effects of exercise for 12 months on weight loss was an approximate 0–3% decrease from the baseline by aerobic and resistance training [46]. On the other hand, the current results showed a −12.5% body weight loss after 12 weeks of exercise and policosanol consumption without calorie restriction. Although a sedentary lifestyle is frequently linked with low HDL-C and high TG in obese subjects, whether exercise can elevate HDL-C quantity or improve HDL quality remains to be established. High-intensity exercise is associated with decreased body weight, BMI, total fat mass, and serum TG. Nevertheless, it is unclear if exercise can elevate the serum HDL-C. Exercise training has little effect on elevating the HDL-C levels in men with initially low HDL-C (<35 mg/dL) [47]. On the other hand, a meta-analysis with 25 articles showed that aerobic exercise modestly increases the HDL-C level; approximately 2.5 mg/dL of HDL-C was increased by at least 900 kcal of energy expenditure or 120 min exercise per week [48]. These results revealed a significant increase in HDL-C/TC (%)and a remarkable decrease in TC, LDL-C, and TG/HDL-C, suggesting a synergistic effect of daily consumption of Cuban policosanol (20 mg) and exercise (Table 3). The TG content in HDL2 was diminished, and the TC content in HDL3 was increased with the elevation of apoA-I in HDL2 and HDL3 at week 12.
The serum CoQ10 level was decreased by up to 40–50% by statin consumption due to the fundamental blocking of cholesterol biosynthesis through the inhibition of 3-hydroxy-3-methylglutaryl-CoA (HMG-CoA) reductase [49]. The depletion of CoQ10 was directly associated with statin-induced myopathy via mitochondrial dysfunction [50]. On the other hand, the current study showed that the 12 weeks of policosanol consumption did not interfere with the CoQ10 metabolism and homeostasis ( approximately 370–513 ng/mL in serum), with a remarkable increase in CoQ10/LDL-C ratio (Figure 2A and Table 3), whereas the CoQ10/HDL-C ratio was not changed. These results suggest that although the LDL-C was decreased by 20% at week 12, the CoQ10 level was maintained sufficiently in the serum. Moreover, male participants showed a 38% increase in the serum CoQ10 level at week 12. The larger increase in serum HDL-C was correlated with the higher increase in serum CoQ10 (Figure 1B)
It was postulated that statin medication depleted serum CoQ10 by blocking the synthesis of TC and LDL-C because LDL-C is a major carrier of CoQ10 in human blood. To the best of the authors’ knowledge, the current study is the first to show that Cuban policosanol (20 mg) consumption for 12 weeks did not impair the serum CoQ10 metabolism despite remarkably lowering TC and LDL-C in the participants of both genders. Furthermore, the increase in serum CoQ10 level was positively correlated with the increase in serum HDL-C (Figure 2B) without inhibiting HMG-CoA reductase. On the other hand, the decrease in LDL-C by atorvastatin 80 mg for 16 weeks of consumption was linked directly with a decrease in serum CoQ10 [51]. A larger portion of CoQ10 was carried by LDL (~58%) than by HDL (~26%) [52]. The current results show that the elevation of HDL-C by Cuban policosanol can be a strategy to maintain or elevate serum CoQ10 level because there has been no study to investigate an association between the increase in serum HDL-C and change in serum CoQ10. Further study will be needed to elucidate the association with CoQ10 in HDL subfractions to find the major carrier of CoQ10, either HDL2 or HDL3, upon the changes in cholesterol contents.
Liver function enzymes, AST, ALT, and γ-GTP, were usually elevated by high-intensity exercise, particularly in weight training as an exercise-induced liver injury and rhabdomyolysis [24,53]. On the other hand, the current results showed that γ-GTP was decreased significantly after 12 weeks, while AST and ALT were also decreased, even though they showed no significance (Table 4). These results suggest that policosanol consumption could ameliorate liver damage against exercise-induced liver injury in obese subjects. Moreover, the extent of oxidation (MDA levels) in VLDL and LDL decreased significantly (approximately −44% and −22%, respectively) (Table 5), whereas the antioxidant abilities in HDL2 and HDL3 were also elevated. All lipoprotein fractions, VLDL, LDL, HDL2, and HDL3, exhibited a reduction of glycation extent of approximately −42%, −16%, −18%, and −16%, respectively, at week 12 compared to the baseline. Similarly, an ELSA-Brasil population study showed that non-alcoholic fatty liver disease (NAFLD) was associated with the elevation of the serum advanced glycation end products, as well as an increase in the serum TG, ALT, γ-GTP, and glycated hemoglobin with a decrease in HDL-C [54]. These results showed good agreement with a previous clinical study of Cuban policosanol (20 mg) consumption for 12 weeks, significant improvement of the liver functions and antioxidant abilities with a decrease in the serum AST, ALT, ALP, and γ-GTP levels in healthy Japanese middle-aged participants, as well as a decrease in the oxidation and glycation in VLDL and LDL [44,55].
5. Conclusion
Combining high-intensity exercise and Cuban policosanol consumption in obese subjects improved hypertension and dyslipidemia by increasing the HDL quality and antioxidant functionality without destabilizing the CoQ10 metabolism or causing liver damage. In HDL2 and HDL3, the enlarged particle size and increased particle numbers with an elevated apoA-I content and antioxidant activities were observed after 12 weeks of therapy.
Author Contributions
Conceptualization, K.-H.C.; methodology, H.-S.N., M-S. Lee, D-J. Kim, and N-Y. Kim; writing—original draft preparation, K.-H.C.; supervision, K.-H.C. All authors have read and agreed to the published version of the manuscript.
Funding
This research received no external funding.
Institutional Review Board Statement
The protocol for human blood donation was conducted according to the guidelines of the Declaration of Helsinki and was approved by the Korea National Institute for Bioethics Policy (KoNIBP, approval number P01-202109-31-009) and supported by the Ministry of Health Care and Welfare (MOHW) of Korea. The animal study protocol was approved by the Committee of Animal Care and Use of Raydel Research Institute (approval code RRI-20-003).
Informed Consent Statement
Not applicable.
Data Availability Statement
The data used to support the findings of this study are available from the corresponding author upon reasonable request.
Conflicts of Interest
The authors declare no conflict of interest.
References
- Chew NW, Ng CH, Tan DJH, Kong G, Lin C, Chin YH, et al. The global burden of metabolic disease: Data from 2000 to 2019. Cell. Metab. 2023;35(3):414-28. [CrossRef]
- Noubiap JJ, Nansseu JR, Lontchi Yimagou E, Nkeck JR, Nyaga UF, Ngouo AT, et al. Geographic distribution of metabolic syndrome and its components in the general adult population: A meta-analysis of global data from 28 million individuals. Diabetes. Res. Clin. Pract. 2022;188:109924. [CrossRef]
- Mainous III AG, Tanner RJ, Rahmanian KP, Jo A, Carek PJ. Effect of sedentary lifestyle on cardiovascular disease risk among healthy adults with body mass indexes 18.5 to 29.9 kg/m2. Am. J. Cardiol. 2019;123(5):764-8. [CrossRef]
- Paffenbarger Jr RS, Hyde RT, Wing AL, Lee IM, Jung DL, Kampert JB. The association of changes in physical-activity level and other lifestyle characteristics with mortality among men. New. Eng. J. Med. 1993;328(8):538-45. [CrossRef]
- Kinoshita K, Ozato N, Yamaguchi T, Sudo M, Yamashiro Y, Mori K, et al. Association of sedentary behaviour and physical activity with cardiometabolic health in Japanese adults. Sci. Rep. 2022;12(1):2262. [CrossRef]
- Jeppesen J, Hein HO, Suadicani P, Gyntelberg F. Relation of high TG–low HDL cholesterol and LDL cholesterol to the incidence of ischemic heart disease: An 8-year follow-up in the Copenhagen male study. Arterioscler. Thromb. Vasc. Biol. 1997;17(6):1114-20. [CrossRef]
- Paffenbarger Jr RS, Hyde R, Wing AL, Hsieh Cc. Physical activity, all-cause mortality, and longevity of college alumni. N. Engl. J. Med. 1986;314(10):605-13. [CrossRef]
- Blair SN, Kohl HW, Paffenbarger RS, Clark DG, Cooper KH, Gibbons LW. Physical fitness and all-cause mortality: a prospective study of healthy men and women. J. Am. Med. Assoc. 1989;262(17):2395-401. [CrossRef]
- Couillard C, Després JP, Lamarche B, Bergeron J, Gagnon J, Leon AS, et al. Effects of endurance exercise training on plasma HDL cholesterol levels depend on levels of triglycerides: evidence from men of the Health, Risk Factors, Exercise Training and Genetics (HERITAGE) Family Study. Arterioscler. Thromb. Vasc. Biol. 2001;21(7):1226-3. [CrossRef]
- Palazón Bru A, Hernández Lozano D, Gil Guillén VF. Which physical exercise interventions increase HDL-cholesterol levels? A systematic review of meta-analyses of randomized controlled trials. Sports. Med. 2021;51:243-53. [CrossRef]
- Gao W, Lv M, Huang T. Effects of different types of exercise on hypertension in middle-aged and older adults: a network meta-analysis. Front. Public Health. 2023;11. [CrossRef]
- Lin M, Lin Y, Li Y, Lin X. Effect of exercise training on blood pressure variability in adults: A systematic review and meta-analysis. PloS one. 2023;18(10):e0292020. [CrossRef]
- Toyama K, Sugiyama S, Oka H, Iwasaki Y, Sumida H, Tanaka T, et al. Combination treatment of rosuvastatin or atorvastatin, with regular exercise improves arterial wall stiffness in patients with coronary artery disease. PloS one. 2012;7(7):e41369. [CrossRef]
- Joy TR, Hegele RA. Narrative review: statin-related myopathy. Ann. Intern. Med. 2009;150(12):858-68. [CrossRef]
- Bonfim MR, Oliveira ASB, Amaral SLD, Monteiro HL. Treatment of dyslipidemia with statins and physical exercises: recent findings of skeletal muscle responses. Arq. Bras. Cardiol. 2015;104:324-31. [CrossRef]
- Meador BM, Huey KA. Statin-associated myopathy and its exacerbation with exercise. Muscle Nerve. 2010;42(4):469-79. [CrossRef]
- Vinci P, Panizon E, Tosoni LM, Cerrato C, Pellicori F, Mearelli F, Biasinutto C, Fiotti N, Di Girolamo FG, Biolo G. Statin-Associated Myopathy: Emphasis on Mechanisms and Targeted Therapy. Int. J. Mol. Sci. 2021 Oct 28;22(21):11687. [CrossRef]
- Opie, LH. Exercise-induced myalgia may limit the cardiovascular benefits of statins. Cardiovasc. Drugs. Ther. 2013;27:569-72. [CrossRef]
- Singh RB, Neki NS, Kartikey K, Pella D, Kumar A, Niaz MA, et al. Effect of coenzyme Q10 on risk of atherosclerosis in patients with recent myocardial infarction. Vascul. Pharmacol. 2003:75-82. [CrossRef]
- Cho KH, Kim SJ, Yadav D, Kim JY, Kim JR. Consumption of Cuban policosanol improves blood pressure and lipid profile via enhancement of HDL functionality in healthy women subjects: Randomized, double-blinded, and placebo-controlled study. Oxid. Med. Cell. Longev. 2018. [CrossRef]
- Park HJ, Yadav D, Jeong DJ, Kim SJ, Bae MA, Kim JR, et al. Short-term consumption of Cuban policosanol lowers aortic and peripheral blood pressure and ameliorates serum lipid parameters in healthy Korean participants: Randomized, double-blinded, and placebo-controlled study. Int. J. Environ. Res. Public Health. 2019;16(5):809. [CrossRef]
- Kim SJ, Yadav D, Park HJ, Kim JR, Cho KH. Long-term consumption of Cuban policosanol lowers central and brachial blood pressure and improves lipid profile with enhancement of lipoprotein properties in healthy Korean participants. Front. physiol. 2018;9:412. [CrossRef]
- Kim HR, Han MA. Association between serum liver enzymes and metabolic syndrome in Korean adults. Int. J. Environ. Res. Public Health. 2018;15(8):1658. [CrossRef]
- Pettersson J, Hindorf U, Persson P, Bengtsson T, Malmqvist U, Werkström V, et al. Muscular exercise can cause highly pathological liver function tests in healthy men. Br. J. Clin. Pharmacol. 2008;65(2):253-9. [CrossRef]
- Trede NS, Zapata A, Zon LI. Fishing for lymphoid genes. Trends. Immunol. 2001;22(6):302-7. [CrossRef]
- Novoa B, Bowman T, Zon L, Figueras A. LPS response and tolerance in the zebrafish (Danio rerio). Fish. Shellfish. Immunol. 2009;26(2):326-31. [CrossRef]
- Canavaciolo VLG, Gómez CV. “Copycat-policosanols” versus genuine policosanol. Rev. CENIC Cienc. Quím. 2007;38(1):207-13.
- Haskell WL, Lee IM, Pate RR, Powell KE, Blair SN, Franklin BA, et al. Physical activity and public health: updated recommendation for adults from the American College of Sports Medicine and the American Heart Association. Circulation. 2007;116(9):1081. [CrossRef]
- Cho KH, Nam HS, Baek SH, Kang DJ, Na H, Komatsu T, et al. Beneficial Effect of Cuban Policosanol on Blood Pressure and Serum Lipoproteins Accompanied with Lowered Glycated Hemoglobin and Enhanced High-Density Lipoprotein Functionalities in a Randomized, Placebo-Controlled, and Double-Blinded Trial with Healthy Japanese. Int. J. Mol. Sci. 2023;24(6):5185. [CrossRef]
- Havel RJ, Eder HA, Bragdon JH. The distribution and chemical composition of ultracentrifugally separated lipoproteins in human serum. J. Clin. Investig. 1955;34(9):1345-53. [CrossRef]
- Markwell MAK, Haas SM, Bieber L, Tolbert N. A modification of the Lowry procedure to simplify protein determination in membrane and lipoprotein samples. Anal. Biochem. 1978;87(1):206-10. [CrossRef]
- Blois, MS. Antioxidant determinations by the use of a stable free radical. Nature. 1958;181(4617):1199-200. [CrossRef]
- McPherson JD, Shilton BH, Walton DJ. Role of fructose in glycation and cross-linking of proteins. Biochem. 1988;27(6):1901-7. [CrossRef]
- Noble, RP. Electrophoretic separation of plasma lipoproteins in agarose gel. J. Lipid Res. 1968;9(6):693-700. [CrossRef]
- Mackness M, Mackness B. Effect of dilution on high-density lipoprotein associated paraoxonase-1 activity. Clin. Biochem. 2011;44(14-15):1270-1. [CrossRef]
- Benzie IF, Strain JJ. The ferric reducing ability of plasma (FRAP) as a measure of “antioxidant power”: the FRAP assay. Anal. Biochem. 1996;239(1):70-6. [CrossRef]
- Nusslein V, R Dahm. Zebrafish: A Practical Approach. Edited by C. Oxford University Press. 2002.
- National Research Council (US) Committee for the Update of the Guide for the Care and Use of Laboratory Animals. Guide for the Care and Use of Laboratory Animals. 8th ed. Washington (DC): National Academies Press (US). 2011. [CrossRef]
- Cho KH, Kim JE, Nam HS, Kang DJ, Na HJ. Anti-inflammatory activity of CIGB-258 against acute toxicity of carboxymethyl lysine in paralyzed zebrafish via enhancement of high-density lipoproteins stability and functionality. Int. J. Mol. Sci. 2022;23(17):10130. [CrossRef]
- Cho KH, Nam HS, Kim JE, Na HJ, del Carmen Dominguez-Horta M, Martinez-Donato G. CIGB-258 exerts potent anti-inflammatory activity against carboxymethyl lysine-induced acute inflammation in hyperlipidemic zebrafish via the protection of apolipoprotein A-I. Int. J. Mol. Sci. 2023;24(8):7044. [CrossRef]
- Owusu Ansah E, Yavari A, Mandal S, Banerjee U. Distinct mitochondrial retrograde signals control the G1-S cell cycle checkpoint. Nat. Genet. 2008;40(3):356-61. [CrossRef]
- Hayashi M, Sofuni T, Ishidate Jr M. An application of acridine orange fluorescent staining to the micronucleus test. Mutat. Res. Lett. 1983;120(4):241-7. [CrossRef]
- Park SH, Kim CG. What types of exercise are more effective in reducing obesity and blood pressure for middle-aged women? A systematic review with meta-analysis. Biol. Res. Nurs. 2021;23(4):658-75. [CrossRef]
- Cho KH, Nam HS, Baek SH, Kang DJ, Na H, Komatsu T, Uehara Y. Beneficial Effect of Cuban Policosanol on Blood Pressure and Serum Lipoproteins Accompanied with Lowered Glycated Hemoglobin and Enhanced High-Density Lipoprotein Functionalities in a Randomized, Placebo-Controlled, and Double-Blinded Trial with Healthy Japanese. Int. J. Mol. Sci. 2023 Mar 8;24(6):5185. [CrossRef]
- Askarpour M, Ghaedi E, Roshanravan N, Hadi A, Mohammadi H, Symonds ME, et al. Policosanol supplementation significantly improves blood pressure among adults: A systematic review and meta-analysis of randomized controlled trials. Complement. Ther. Med. 2019;45:89-97. [CrossRef]
- Swift DL, McGee JE, Earnest CP, Carlisle E, Nygard M, Johannsen NM. The effects of exercise and physical activity on weight loss and maintenance. Prog. Cardiovasc. Dis. 2018;61(2):206-13. [CrossRef]
- Zmuda JM, Yurgalevitch SM, Flynn MM, Bausserman LL, Saratelli A, Spannaus-Martin DJ, Herbert PN, Thompson PD. Exercise training has little effect on HDL levels and metabolism in men with initially low HDL cholesterol. Atherosclerosis. 1998 Mar;137(1):215-21. [CrossRef]
- Kodama S, Tanaka S, Saito K, Shu M, Sone Y, Onitake F, et al. Effect of aerobic exercise training on serum levels of high-density lipoprotein cholesterol: a meta-analysis. Arch. Intern. Med. 2007;167(10):999-1008. [CrossRef]
- Ghirlanda G, Oradei A, Manto A, Lippa S, Uccioli L, Caputo S, et al. Evidence of plasma CoQ10-lowering effect by HMG-CoA reductase inhibitors: a double-blind, placebo-controlled study. J. Clin. Pharmacol. 1993;33(3):226-9. [CrossRef]
- Deichmann R, Lavie C, Andrews S. Coenzyme Q10 and statin-induced mitochondrial dysfunction. Ochsner J. 2010;10(1):16-21.
- Pacanowski MA, Frye RF, Enogieru O, Schofield RS, Zineh I. Plasma Coenzyme Q10 Predicts Lipid-lowering Response to High-Dose Atorvastatin. J. Clin. Lipidol. 2008 Aug;2(4):289-97. [CrossRef]
- Tomasetti M, Alleva R, Solenghi MD, Littarru GP. Distribution of antioxidants among blood components and lipoproteins: significance of lipids/CoQ10 ratio as a possible marker of increased risk for atherosclerosis. Biofactors. 1999;9(2-4):231-40. [CrossRef]
- Kim J, Lee J, Kim S, Ryu HY, Cha KS, Sung DJ. Exercise-induced rhabdomyolysis mechanisms and prevention: A literature review. J. Sport. Health. Sci. 2016;5(3):324-33. 3. [CrossRef]
- Ho CM, Ho SL, Jeng YM, Lai YS, Chen YH, Lu SC, Chen HL, Chang PY, Hu RH, Lee PH. Accumulation of free cholesterol and oxidized low-density lipoprotein is associated with portal inflammation and fibrosis in nonalcoholic fatty liver disease. J. Inflamm. 2019 Apr 2;16:7. [CrossRef]
- Xiong DD, Zhang M, Li N, Gai JF, Mao L, Li M. Mediation of inflammation, obesity and fatty liver disease by advanced glycation endoproducts. Eur. Rev. Med. Pharmacol. Sci. 2017;21(22). [CrossRef]
- Da Silva Pereira ENG, Paula DP, De Araujo BP, Da Fonseca MdJM, Diniz MdFHS, Daliry A, et al. Advanced glycation end product: A potential biomarker for risk stratification of non-alcoholic fatty liver disease in ELSA-Brasil study. World. J. Gastroenterol. 2021;27(29):4913. [CrossRef]
- Cho KH, Kim JE, Komatsu T, Uehara Y. Protection of Liver Functions and Improvement of Kidney Functions by Twelve Weeks Consumption of Cuban Policosanol (Raydel®) with a Decrease of Glycated Hemoglobin and Blood Pressure from a Randomized, Placebo-Controlled, and Double-Blinded Study with Healthy and Middle-Aged Japanese Participants. Life. 2023 Jun 4;13(6):1319. [CrossRef]
Figure 1.
Comparison of the serum coenzyme Q10 (CoQ10) level at week 12 from the baseline (week 0). .A:Quantification of CoQ10 in 100-fold diluted serum from each participant using Cusabio human CoQ10 ELİSA kit. *, p<0.05 versus week 0; ns, not significant. B:Spearman correlation analysis with the net change in HDL-C (ΔHDL-C) and net change in CoQ10 (ΔCoQ10) between weeks 0 and 12.
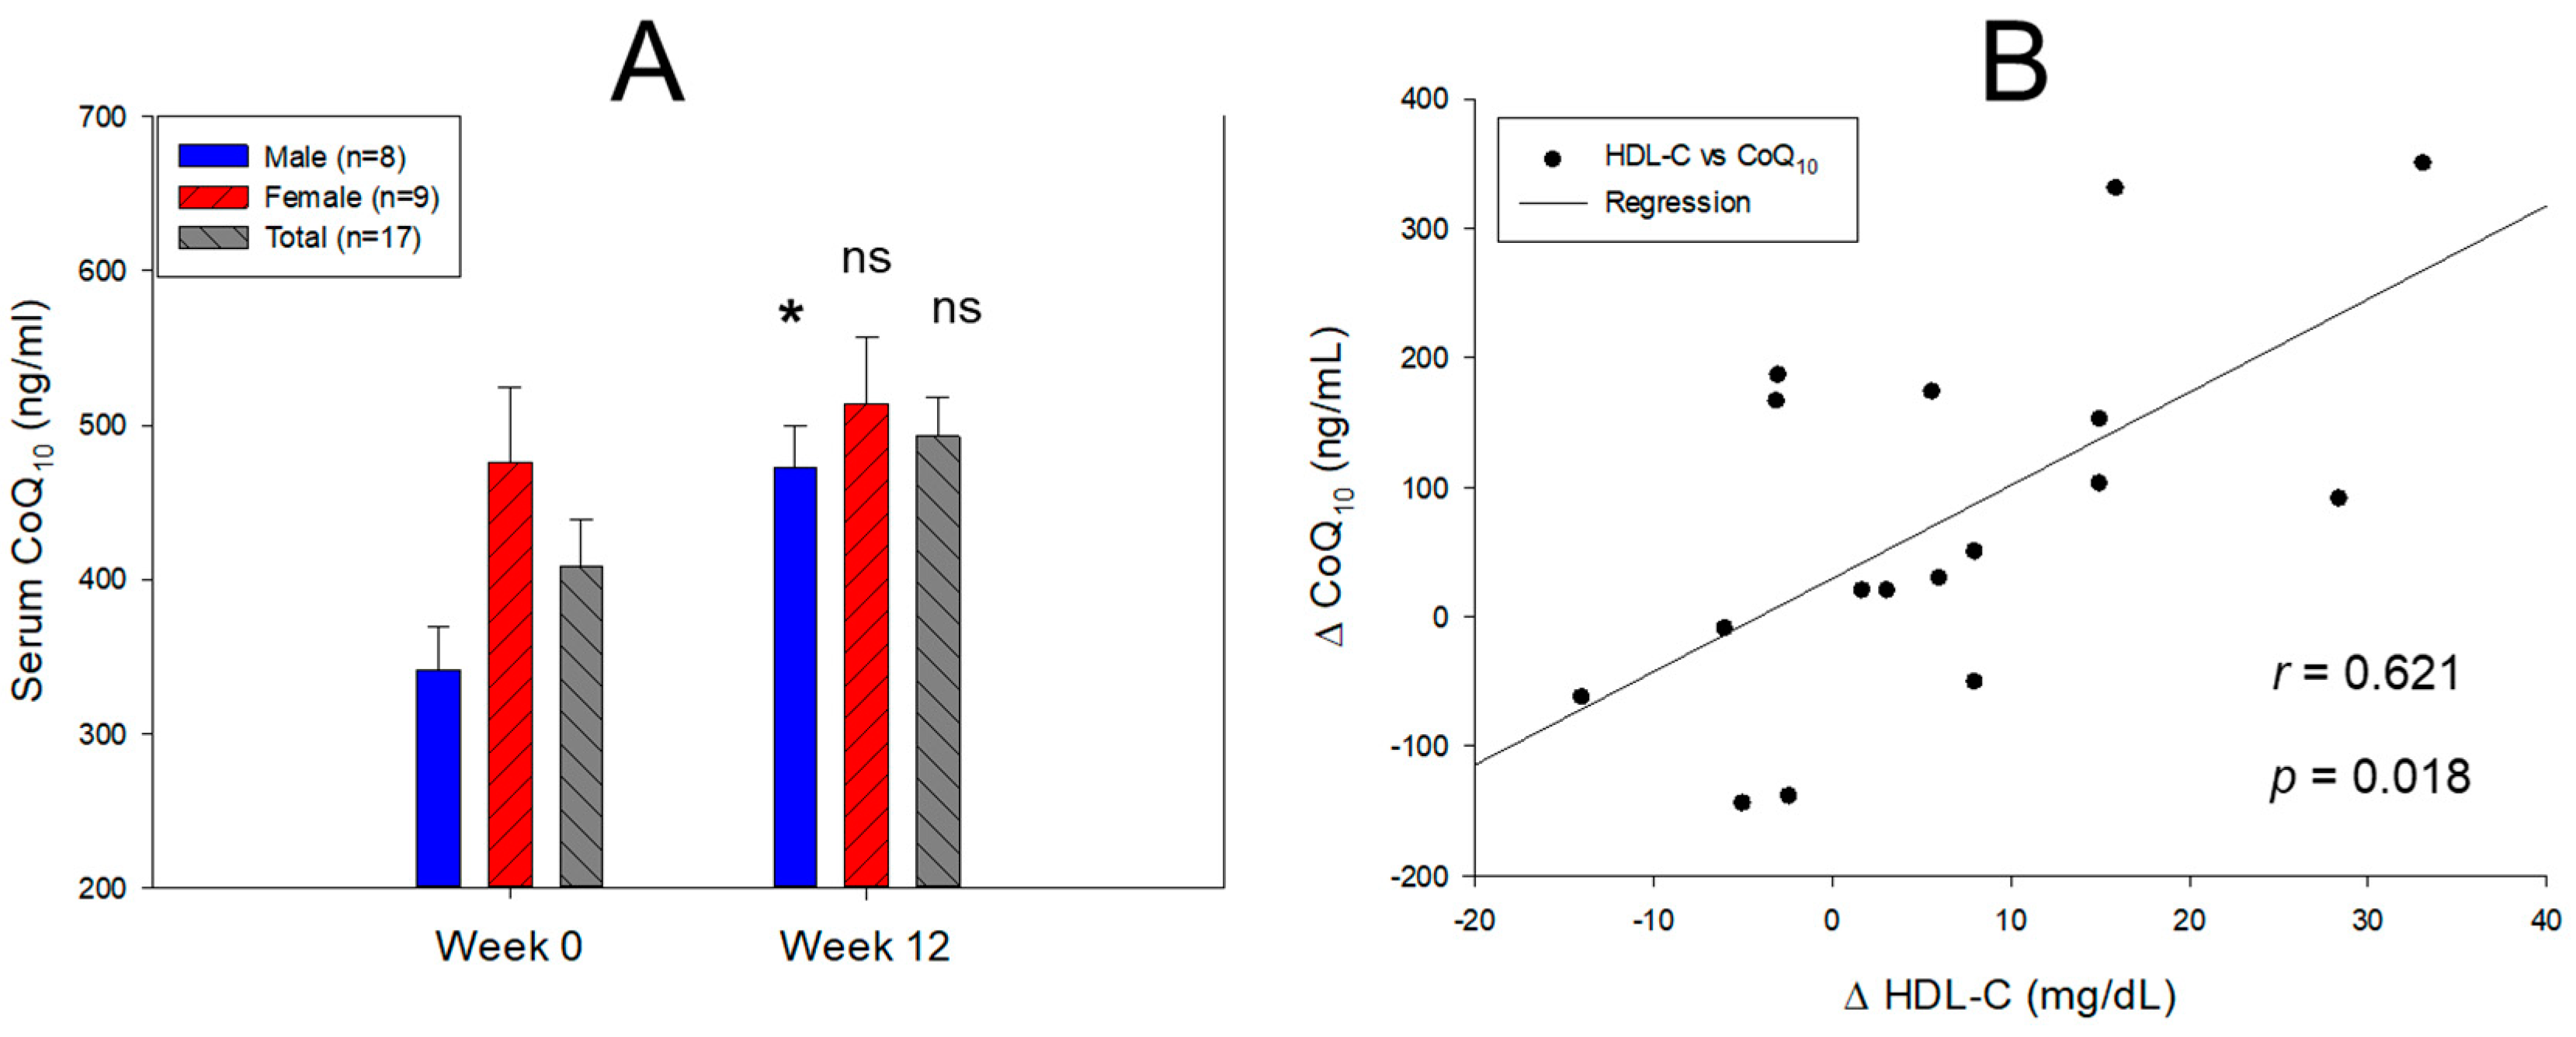
Figure 2.
Comparison of the electromobility and oxidation extent in LDL between weeks 0 and 12.A: Electrophoresis under the nondenatured state on 0.5% agarose gel 120 mm length × 60 mm width × 5 mm thickness. Electrophoresis was carried out with 50 V for 1 h in tris-acetate-ethylene-diamine-tetraacetic acid buffer (pH 8.0). The apo-B in LDL was visualized by Coomassie brilliant blue staining (final 1.25%). The yellow font indicates the band intensity compared to the 100% initialized band intensity of week 0. Oxidized LDL, cupric ion (final 1 μM) treated for 4 hr. The red arrowhead indicates an aggregated oxLDL band at the loading position. The blue triangle indicates the smeared and disappeared oxLDL band range. M1, M2, F1, and F2 are representative band image of the participants. M, male; F, female.B: Quantification of the oxidized LDL contents by a thiobarbituric acid reactive substance assay using a malondialdehyde (MDA) standard. The data are expressed as the mean ± SEM from three independent experiments with duplicate samples. The oxidation extent in each group between weeks 0 and 12 was compared using a paired t-test.
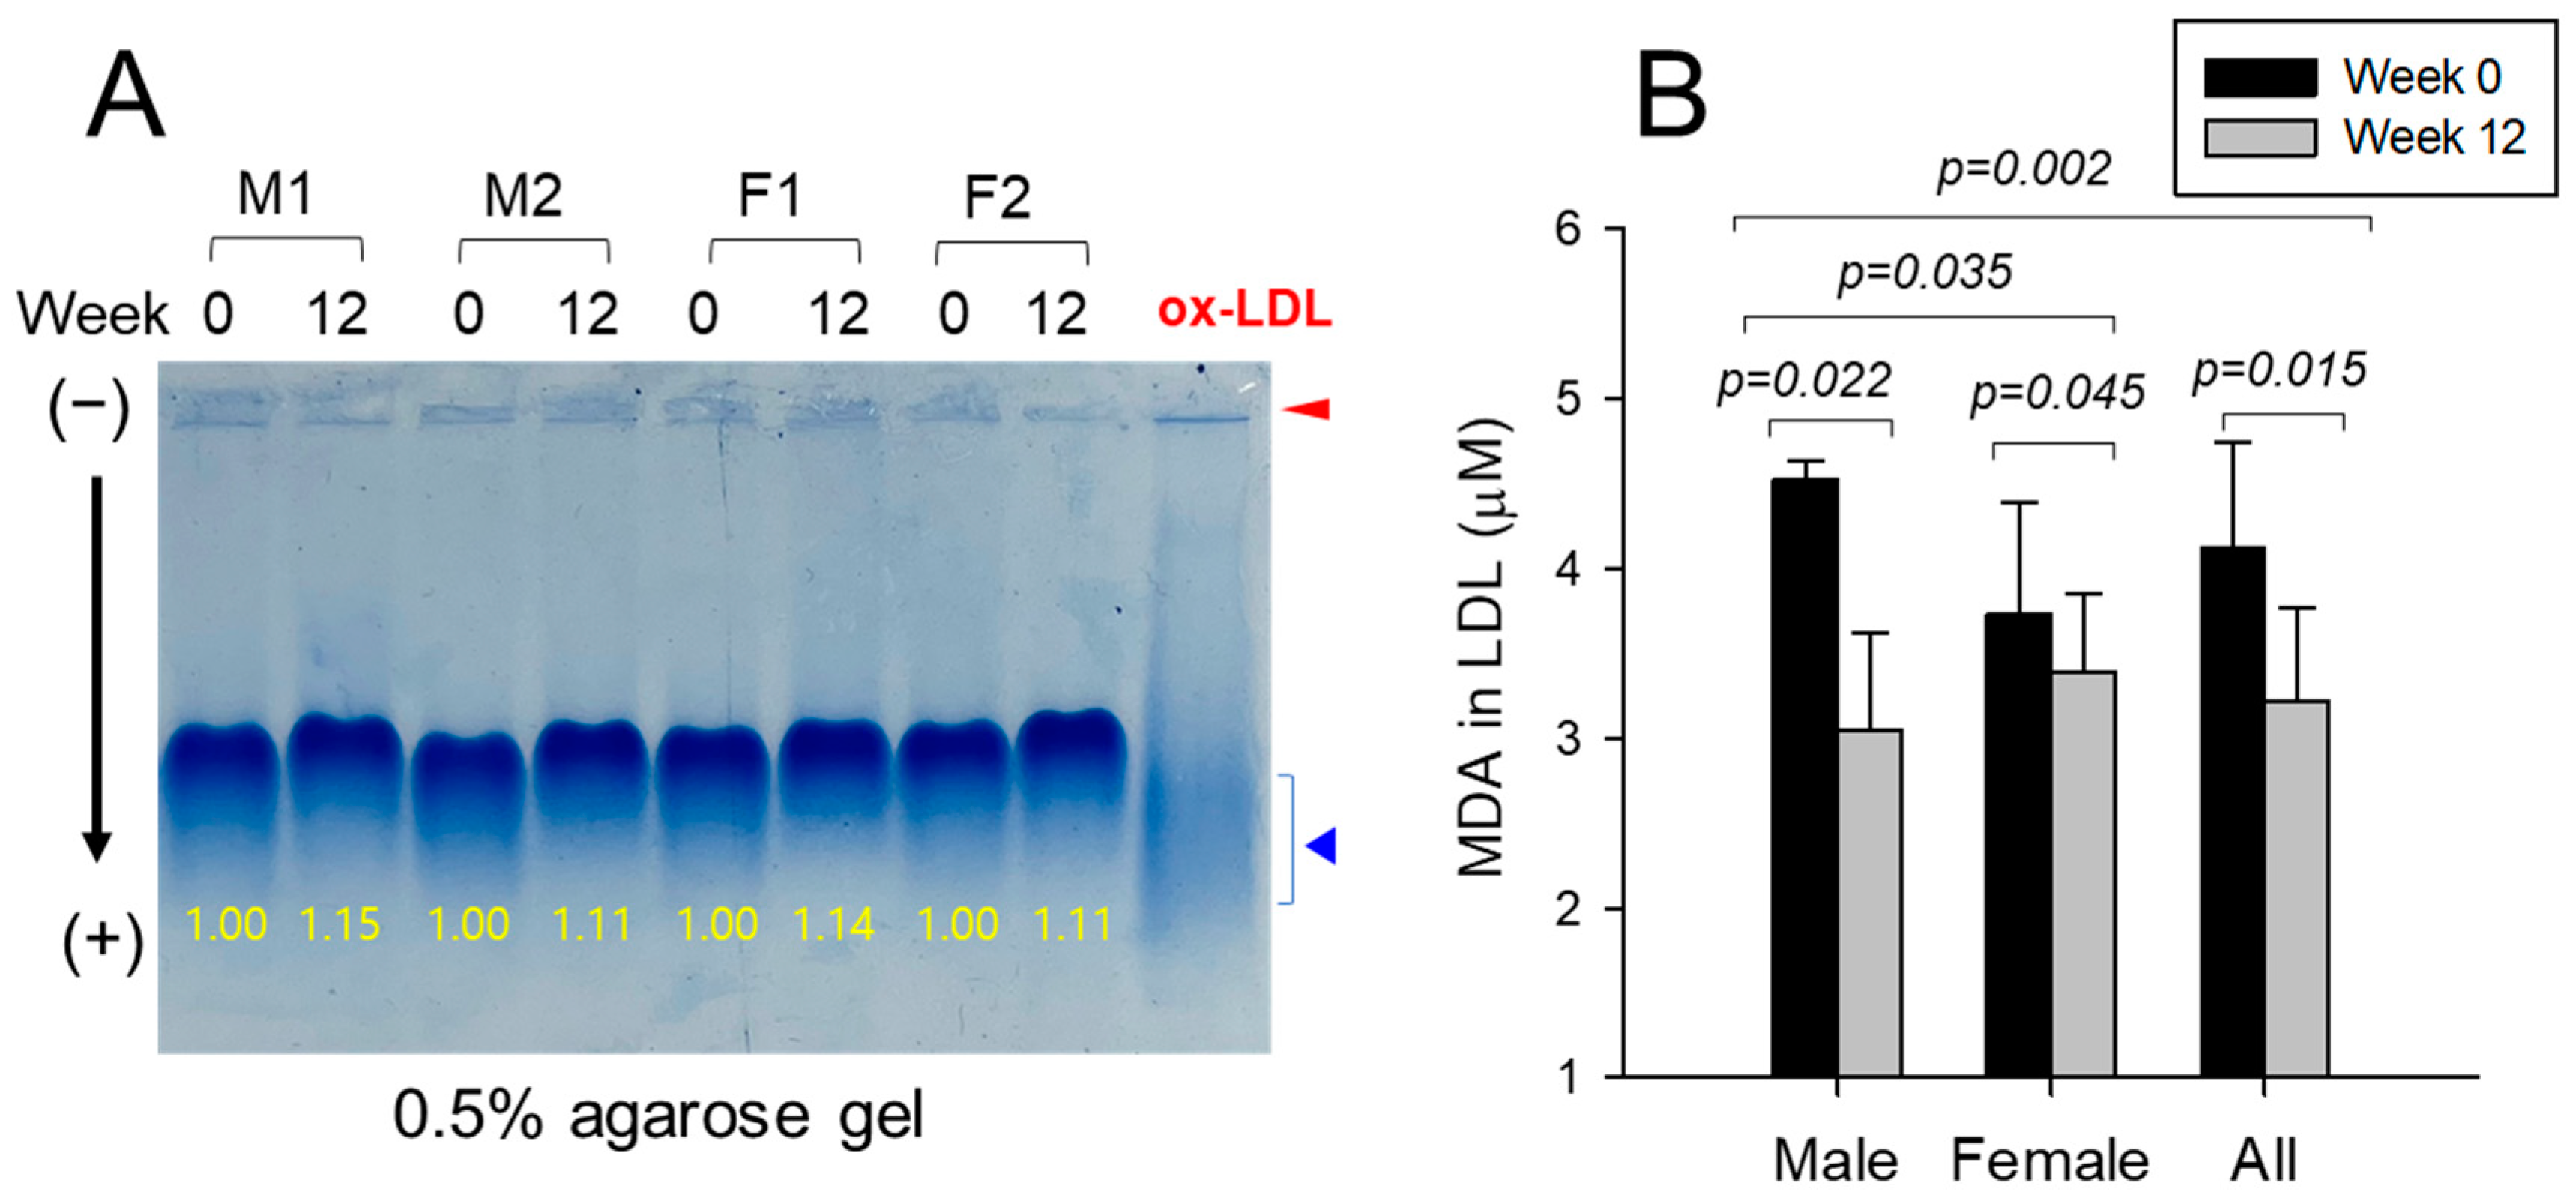
Figure 3.
Transmitted electron microscopy (TEM) image analysis of lipoproteins, VLDL, LDL, HDL2, and HDL3 and size analysis between weeks 0 and 12. Representative image of VLDL, LDL, HDL2, and HDL3 from the same individual between weeks 0 and 12 with magnification 40,000×. One graduation of the scale bar indicates 20 nm. The red arrowhead indicates aggregated lipoprotein particles. A: Comparison of the VLDL particle size in each group between weeks 0 and 12 using a paired t-test. ns, not significant versus week 0. B: Comparison of the LDL particle size in each group between weeks 0 and 12 using a paired t-test. ns, not significant versus week 0. C: Comparison of the HDL2 particle size in each group between weeks 0 and 12 using a paired t-test. *, p<0.05 versus week 0. D: Comparison of the HDL3 particle size in each group between weeks 0 and 12 using a paired t-test. ns, not significant versus week 0.
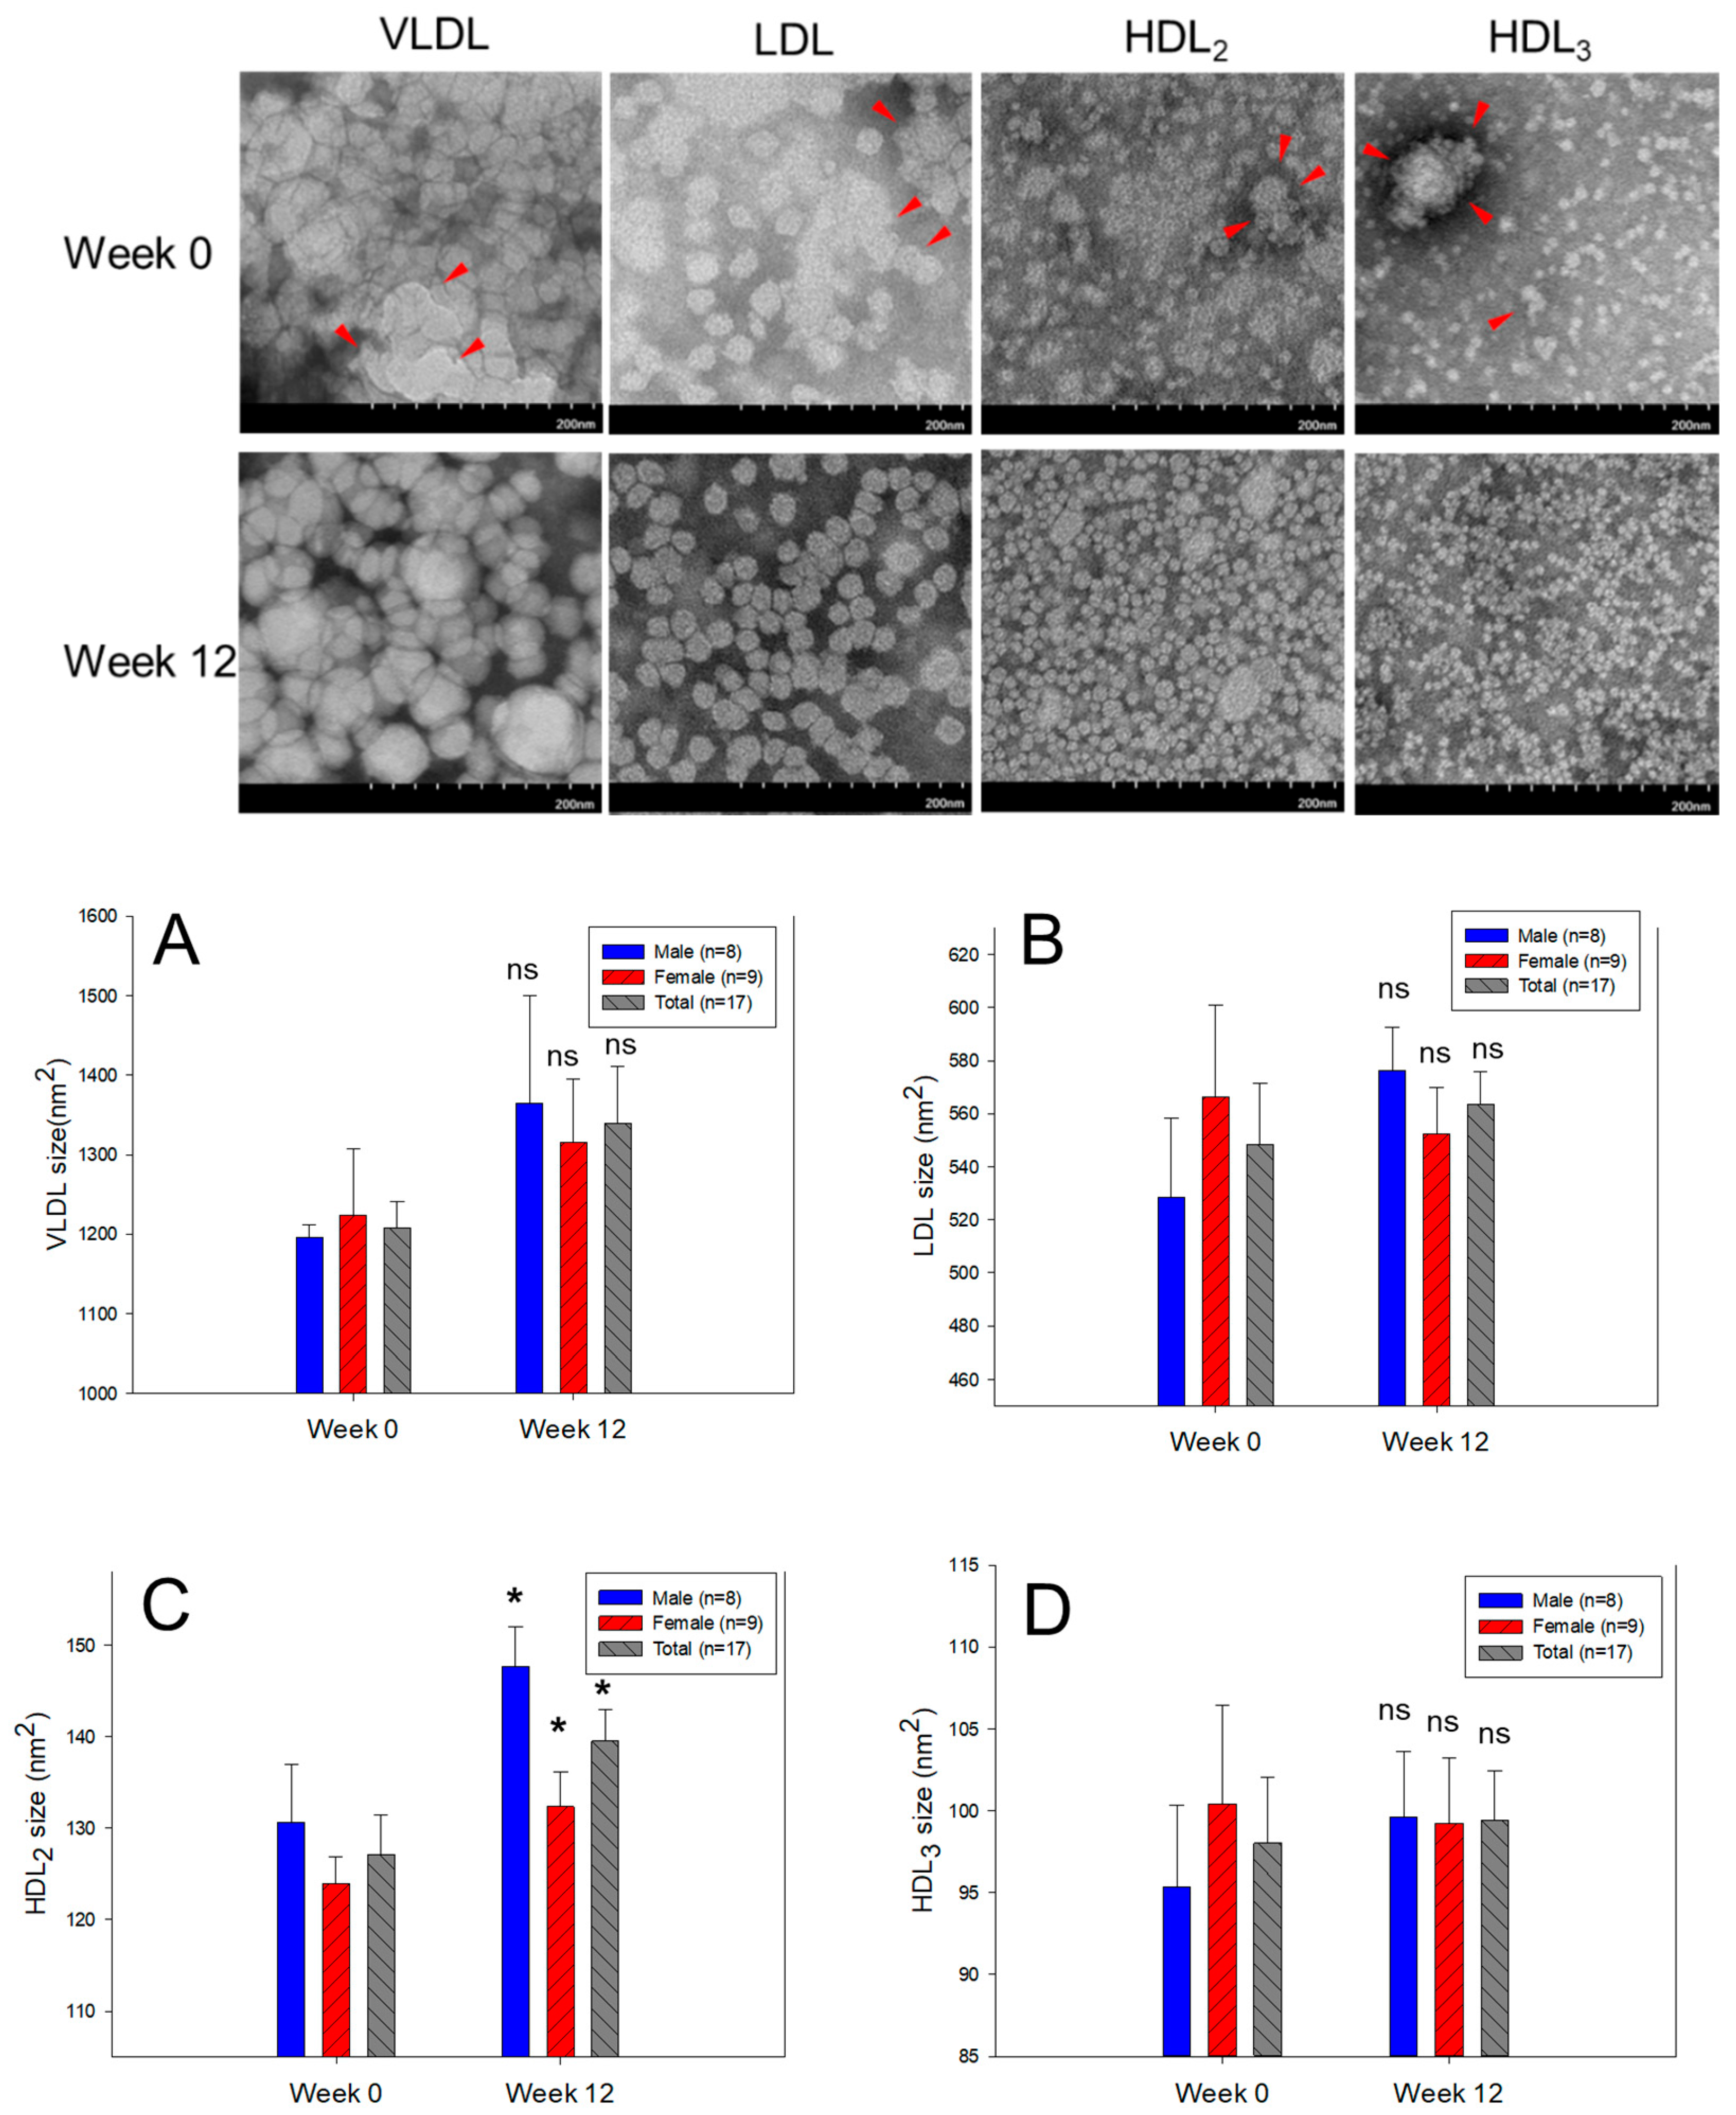
Figure 4.
Representative image of the apoA-I expression pattern in HDL2 (A) and HDL3 (B) between weeks 0 and 12 in the male group. M1, M2, M3, and M4 is male participant 1, 2, 3, and 4, respectively, as a representative image. The yellow font indicates the band intensity of apoA-I compared to week 0. The red arrowhead indicates a smeared band intensity with a shifted up band position of apoA-I because of glycation at week 0. .
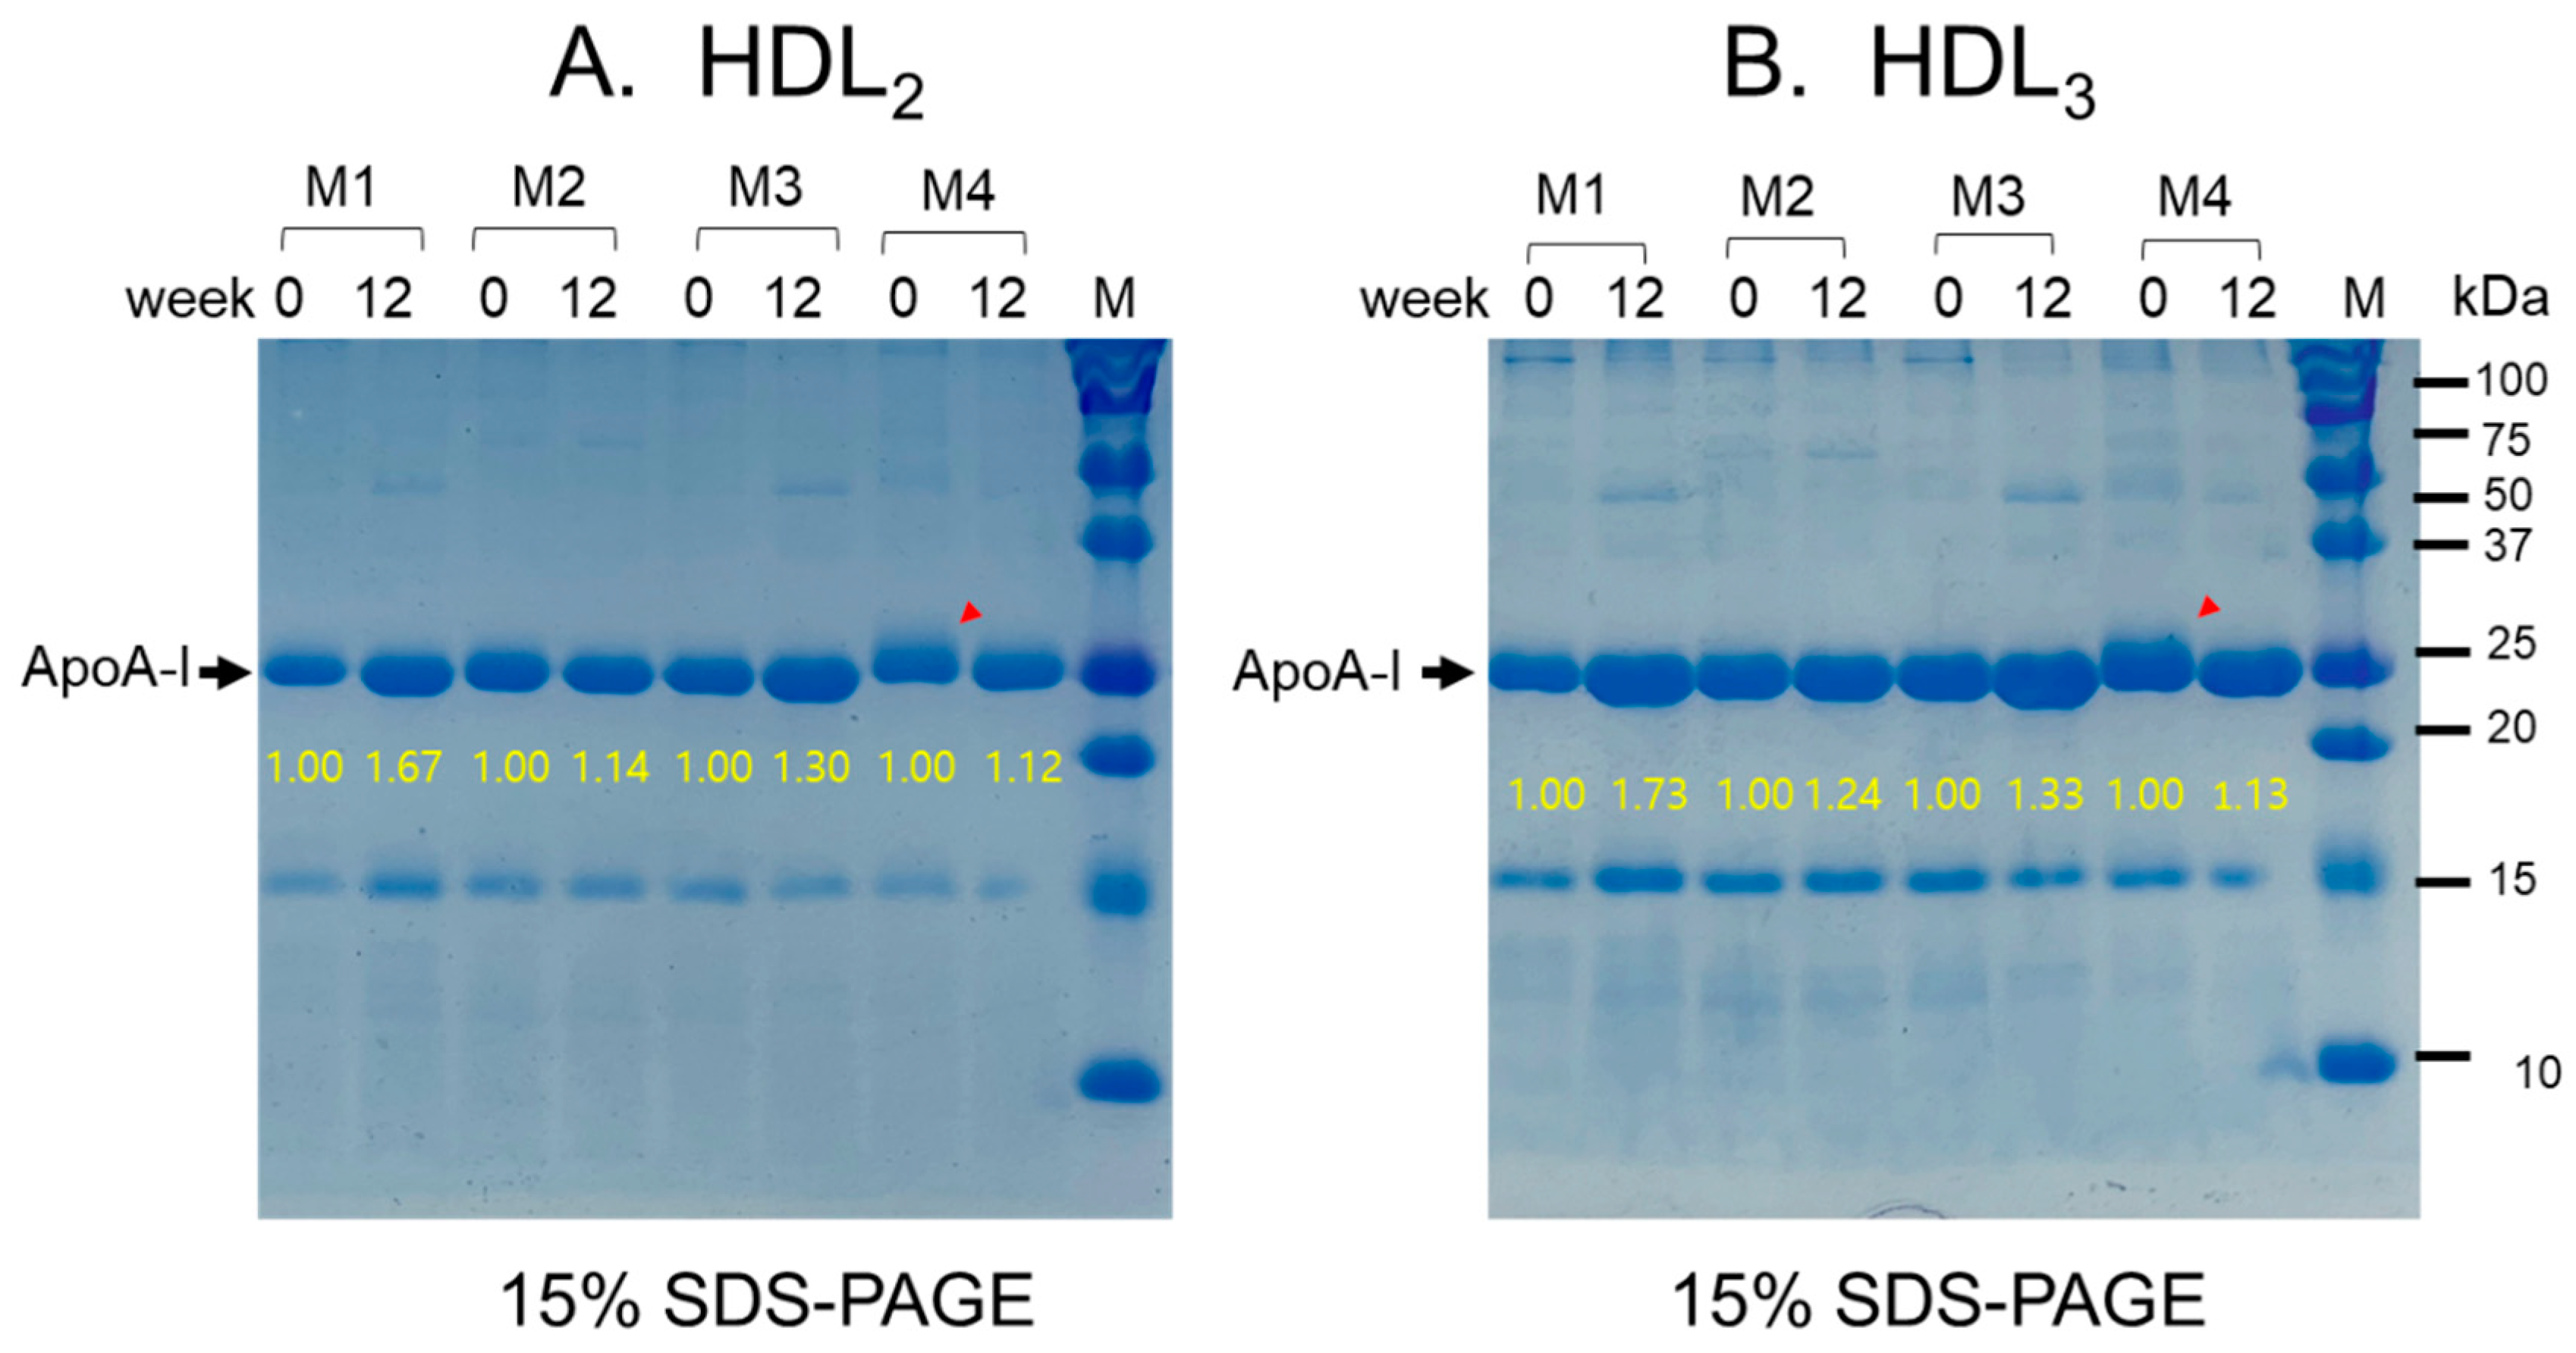
Figure 5.
Determination of paraoxonase (PON)-1 activity and ferric ion reduction ability (FRA) in HDL2 and HDL3 at week 0 and week 12. *, p<0.05 versus week 0; **, p<0.01 versus week 0; ***, p<0.001 versus week 0. A: Comparison of HDL2-associated PON-1 activity at weeks 0 and 12 B: Comparison of HDL3-associated PON-1 activity at weeks 0 and 12 C: Comparison of HDL2-associated FRA activity at weeks 0 and 12 D: Comparison of HDL3-associated FRA activity at weeks 0 and 12.
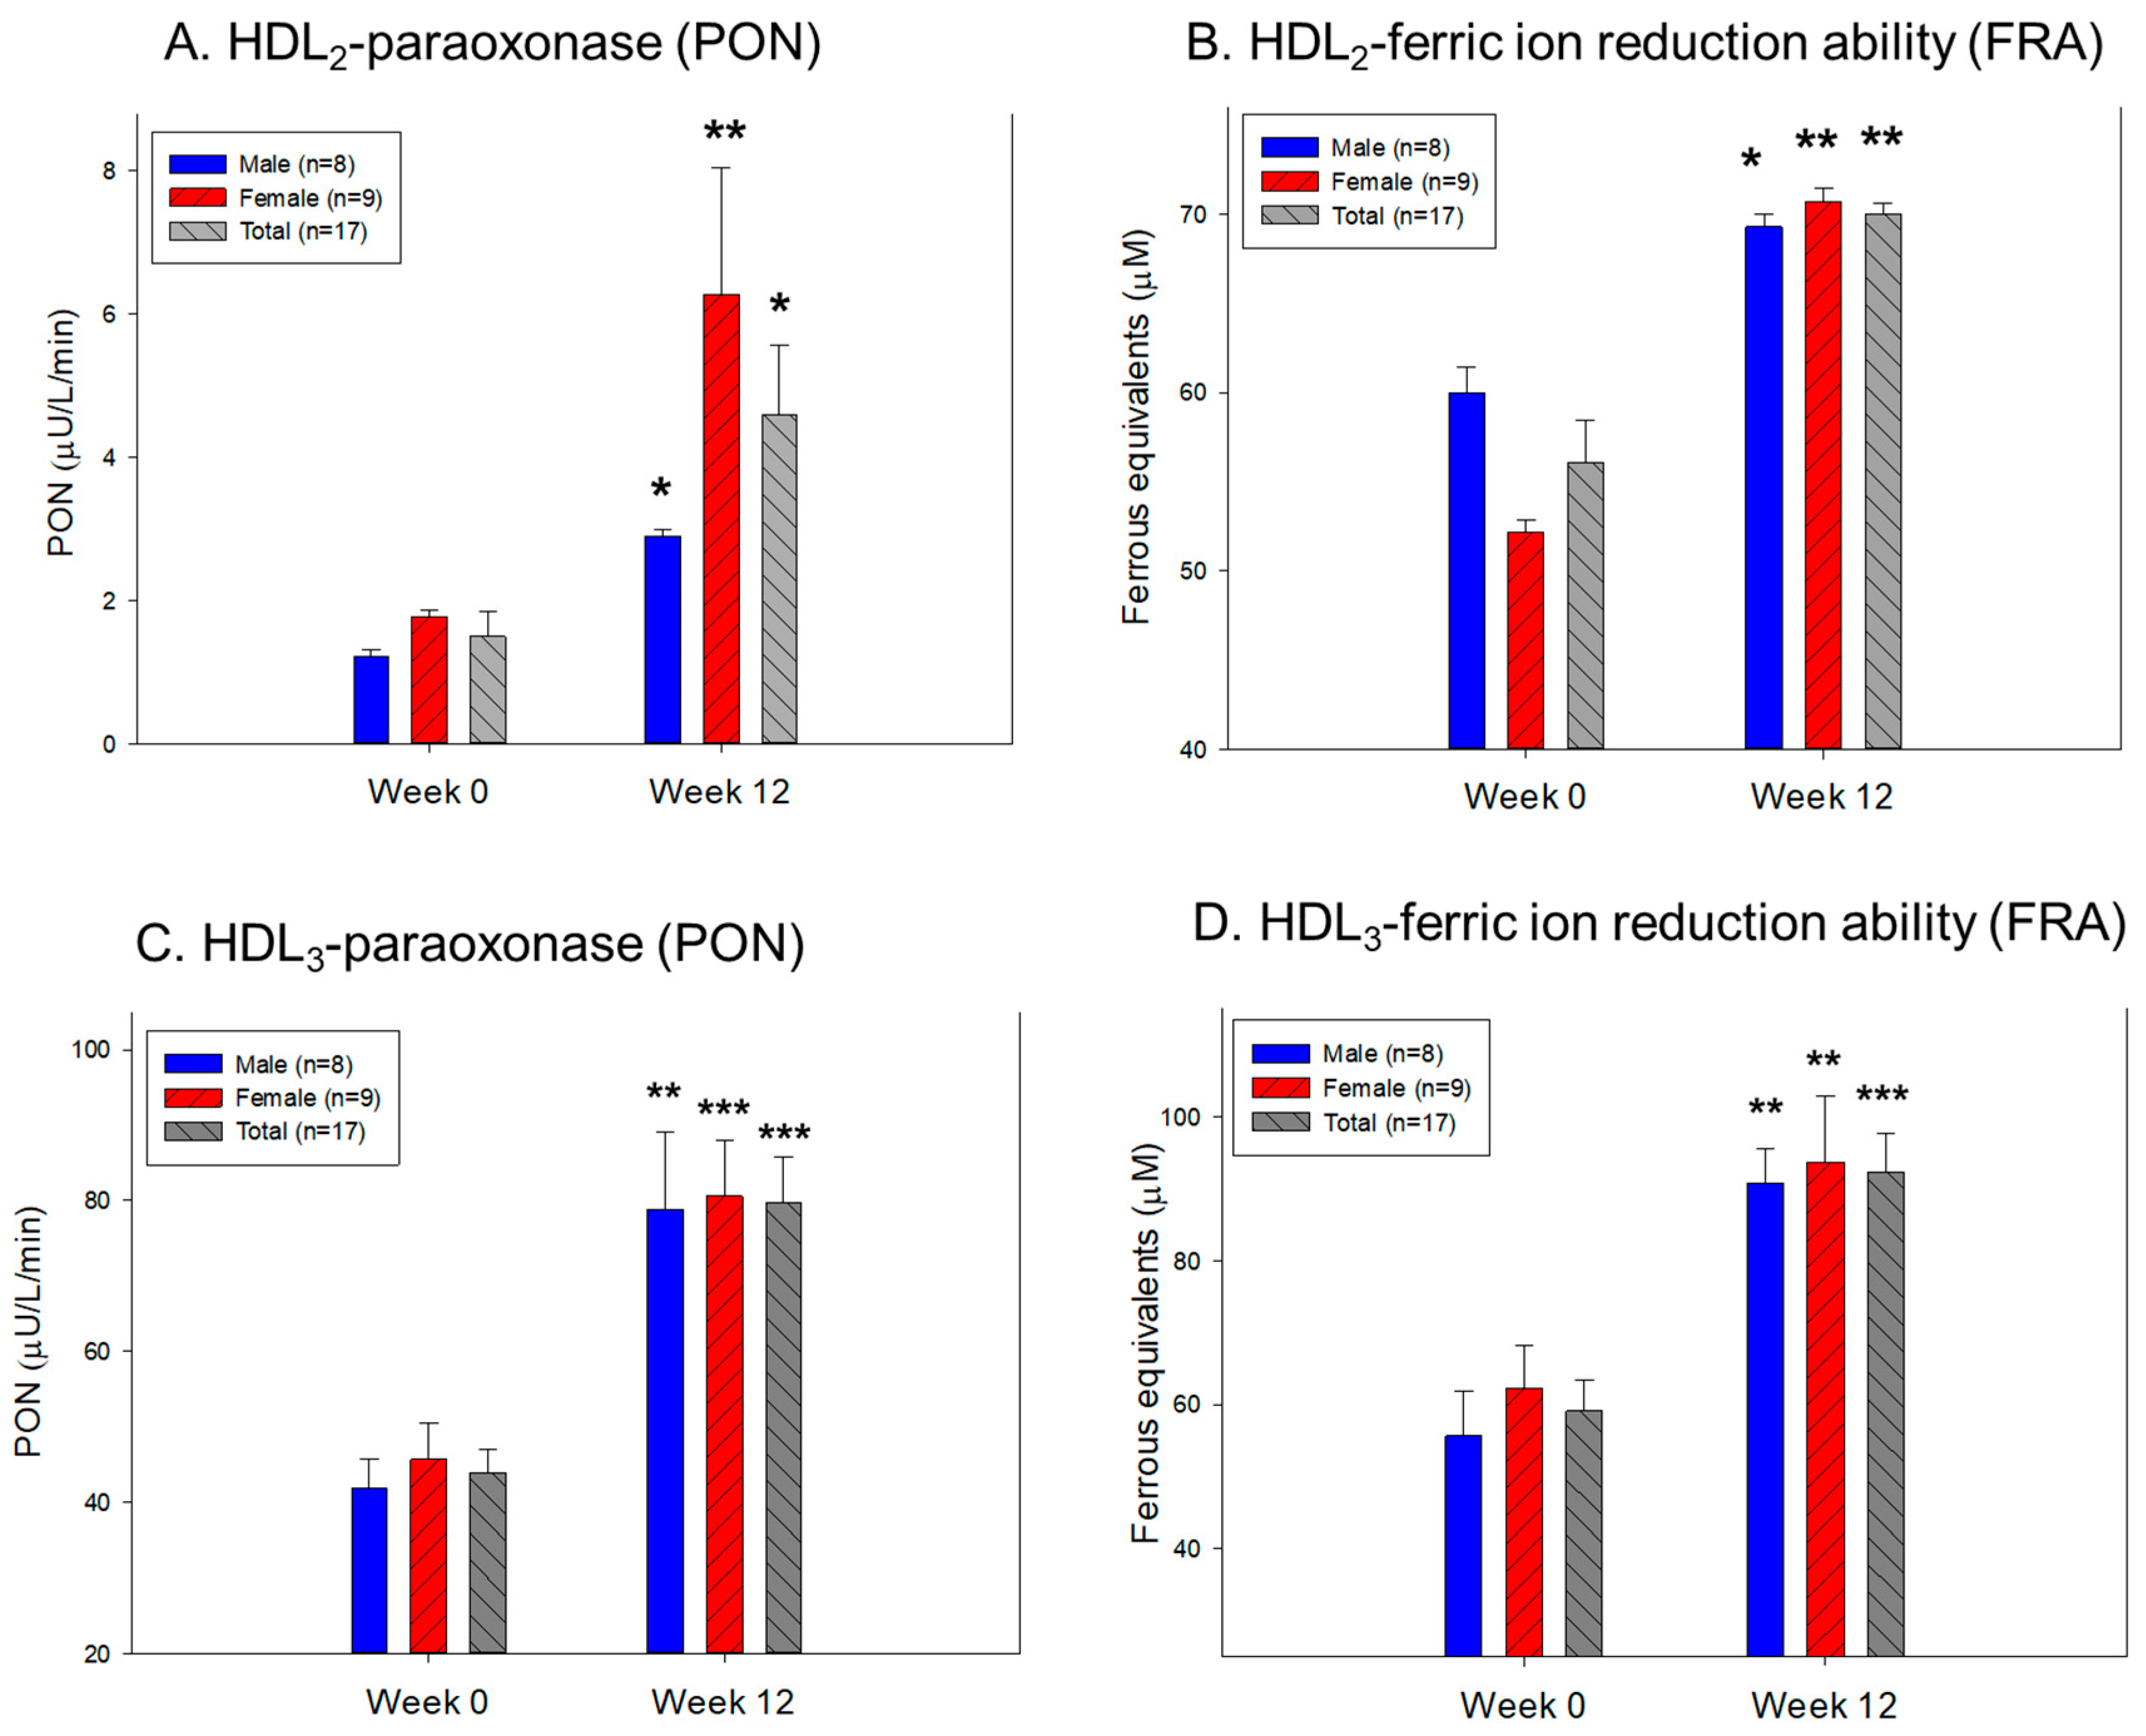
Figure 6.
Comparison of the survivability, developmental speed and morphology, and extent of ROS production and cellular apoptosis after injection of HDL3 from each group in the presence of carboxymethyllysine. A: Survivability of embryo during 24 hours post-injection. B: Morphological change in an embryo during development. Stereoimage observation at 5 hours and 24 hours post-injection, somite number at 24 hours post-injection, DHE-stained image at 5 hours post-injection, AO-stained image at 5 hours post-injection. C: Quantification of ROS production and extent of cellular apoptosis from DHE staining and AO staining using Image J software (http://rsb.info.nih.gov/ij/, accessed on 16 May 2023). The data are expressed as the mean±SD from three independent experiments.
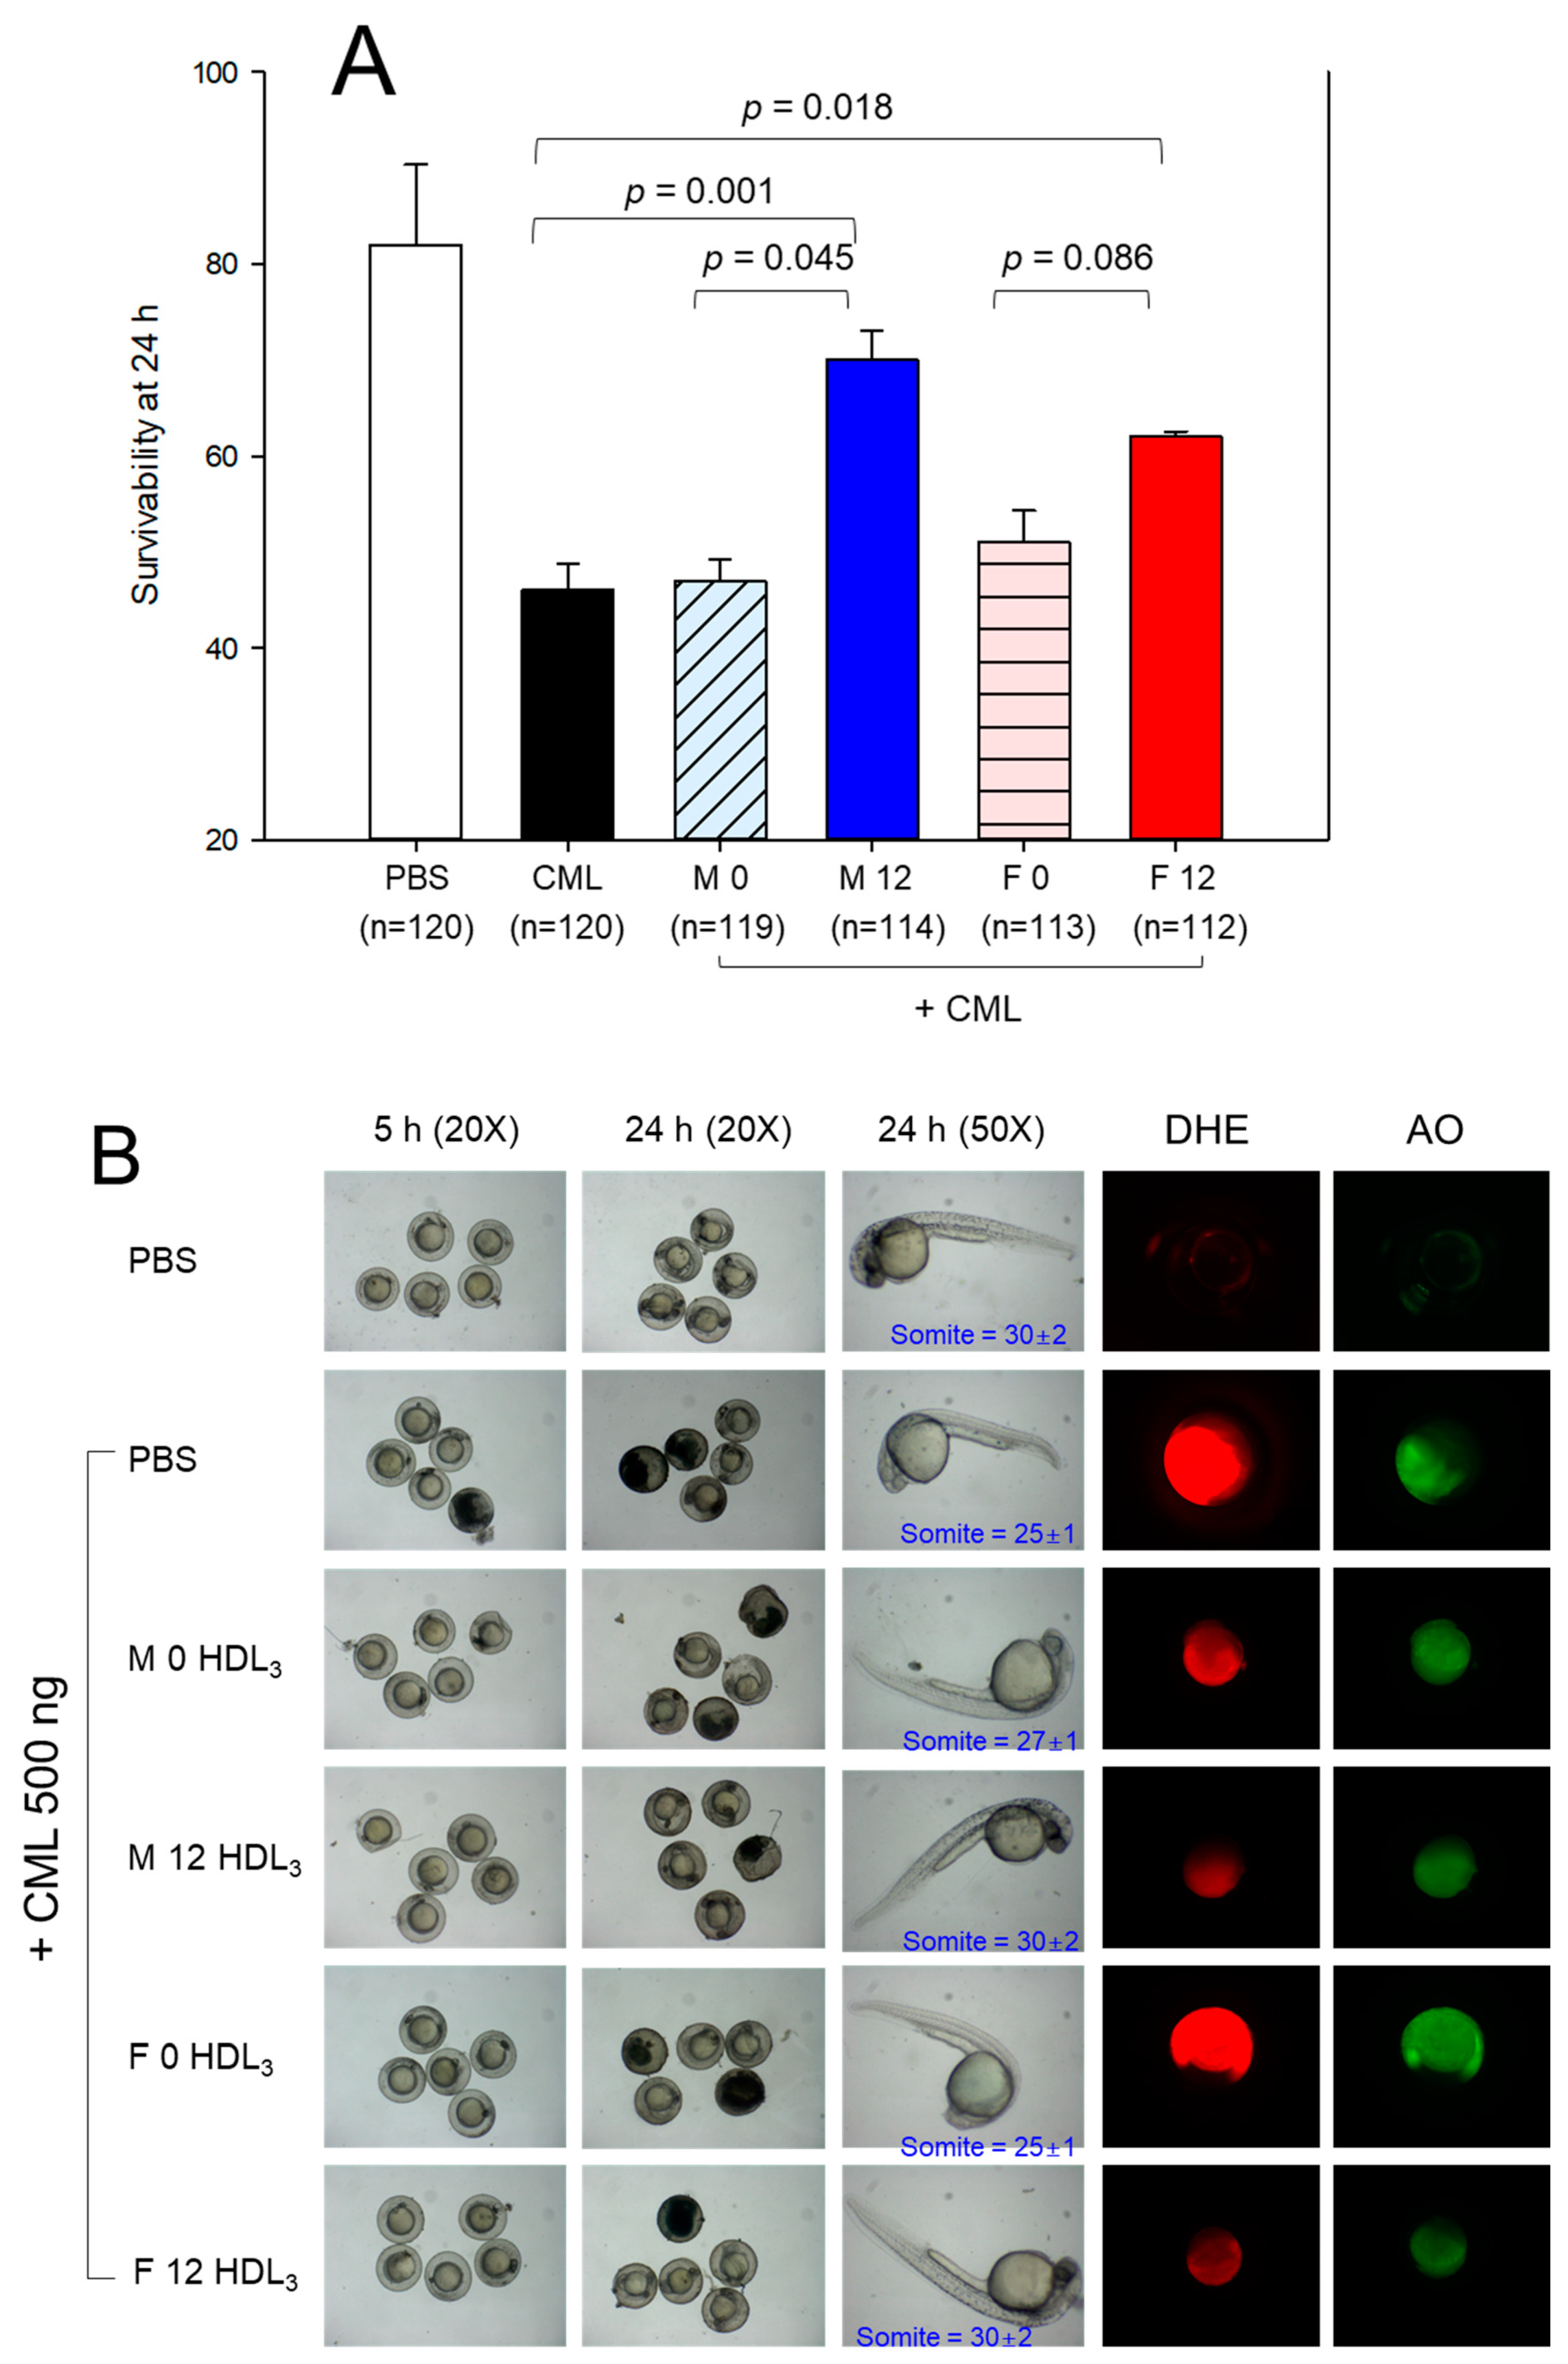
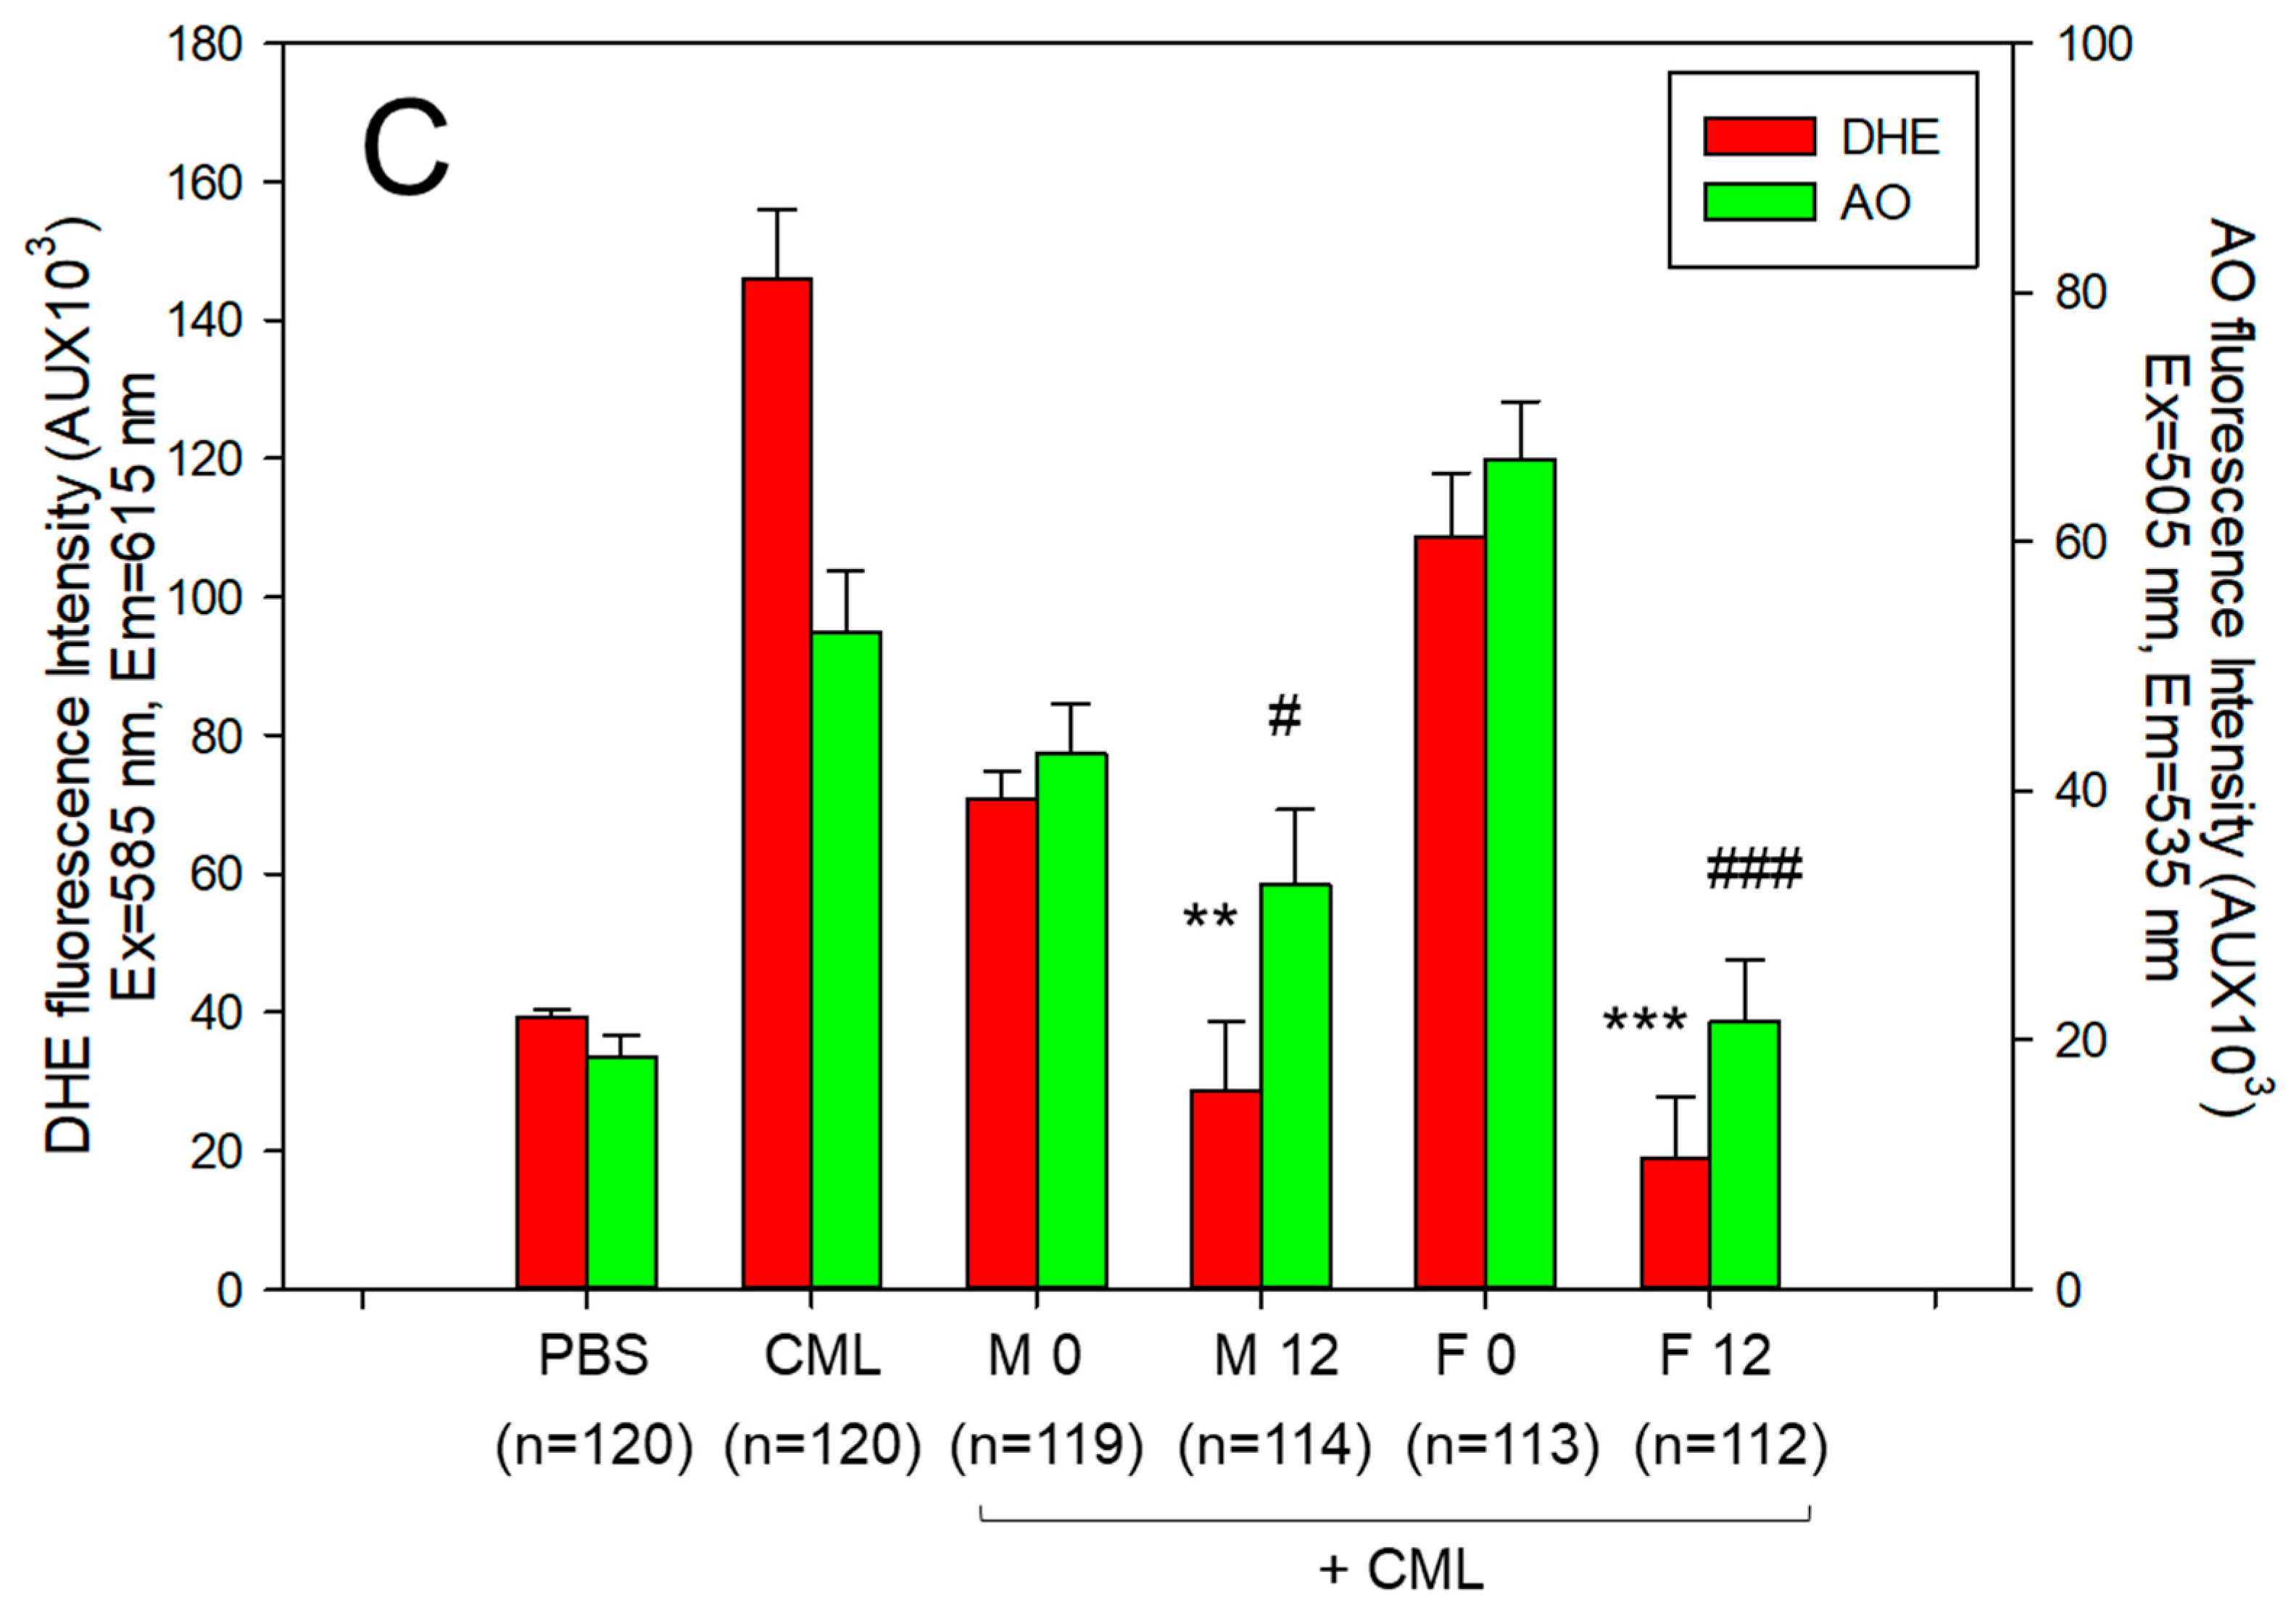
Table 2.
Change of anthropometric profiles between week 0 and week 12.
| Groups | Week 0 | Week 12 | Δ Change (%) |
p† | |
|---|---|---|---|---|---|
| Mean ± SEM | Mean ± SEM | ||||
| SBP (mmHg) | Male (n=8) | 133.8 ± 6.8 | 119.1 ± 5.2 | –10.9 | 0.109 |
| Female (n=9) | 122.8 ± 2.8 | 117.2 ± 3.5 | –4.5 | 0.233 | |
| Total (n=17) | 127.9 ± 3.7 | 118.1 ± 3.0 | –7.7 | 0.046 | |
| DBP (mmHg) | Male (n=8) | 85.8 ± 5.2 | 69.1 ± 3.9 | –19.4 | 0.022 |
| Female (n=9) | 79.3 ± 2.1 | 74.2 ± 3.0 | –6.4 | 0.180 | |
| Total (n=17) | 82.4 ± 2.7 | 71.8 ± 2.4 | –12.8 | 0.007 | |
| BMI (kg/m²) | Male (n=8) | 31.0 ± 1.9 | 25.0 ± 2.7 | –19.3 | 0.092 |
| Female (n=9) | 29.0 ± 1.4 | 26.0 ± 1.4 | –10.5 | 0.146 | |
| Total (n=17) | 30.0 ± 1.1 | 25.5 ± 1.4 | –14.8 | 0.022 | |
| Weight (kg) | Male (n=8) | 99.9 ± 6.4 | 85.2 ± 5.5 | –14.7 | 0.104 |
| Female (n=9) | 79.0 ± 4.1 | 71.0 ± 4.2 | –10.2 | 0.190 | |
| Total (n=17) | 88.8 ± 4.4 | 77.7 ± 3.7 | –12.5 | 0.064 | |
| Waist circumference (cm) | Male (n=7) | 108.3 ± 3.8 | 89.7 ± 4.6 | –17.2 | 0.009 |
| Female (n=9) | 95.8 ± 3.7 | 87.4 ± 4.9 | –8.8 | 0.193 | |
| Total (n=16) | 101.2 ± 3.1 | 88.4 ± 3.3 | –12.7 | 0.008 | |
| Muscle mass (kg) | Male (n=8) | 65.3 ± 3.2 | 64.1 ± 2.8 | –1.8 | 0.786 |
| Female (n=9) | 45.2 ± 1.4 | 44.2 ± 1.4 | –2.2 | 0.625 | |
| Total (n=17) | 54.6 ± 3.0 | 53.6 ± 2.9 | –2.0 | 0.797 | |
| Total fat mass (kg) | Male (n=8) | 30.6 ± 3.4 | 17.1 ± 3.4 | –44.0 | 0.014 |
| Female (n=9) | 31.0 ± 3.4 | 24.0 ± 3.4 | –22.6 | 0.163 | |
| Total (n=17) | 30.8 ± 2.3 | 20.8 ± 2.5 | –32.6 | 0.006 | |
| Subcutaneous fat mass (kg) | Male (n=8) | 28.9 ± 3.4 | 15.8 ± 3.4 | –45.4 | 0.017 |
| Female (n=9) | 29.7 ± 3.3 | 22.9 ± 3.3 | –23.1 | 0.162 | |
| Total (n=17) | 29.3 ± 2.3 | 19.5 ± 2.5 | –33.4 | 0.007 | |
| Visceral fat mass (kg) | Male (n=8) | 1.7 ± 0.2 | 1.4 ± 0.2 | –20.4 | 0.229 |
| Female (n=9) | 1.3 ± 0.1 | 1.2 ± 0.1 | –11.8 | 0.200 | |
| Total (n=17) | 1.5 ± 0.1 | 1.3 ± 0.1 | –16.4 | 0.109 | |
| Body fat percentage (%) |
Male (n=8) | 30.1 ± 1.6 | 19.2 ± 2.8 | –36.3 | 0.005 |
| Female (n=9) | 38.4 ± 2.8 | 32.7 ± 3.1 | –14.9 | 0.189 | |
| Total (n=17) | 34.5 ± 1.9 | 26.3 ± 2.7 | –23.7 | 0.018 | |
| Body water content (kg) |
Male (n=8) | 50.8 ± 2.5 | 50.0 ± 2.2 | –1.6– | 0.803 |
| Female (n=9) | 35.2 ± 1.1 | 34.4 ± 1.1 | –2.2 | 0.626 | |
| Total (n=17) | 42.5 ± 2.3 | 41.7 ± 2.2 | –1.9 | 0.806 |
Data are expressed as the mean±SEM (standard error of the mean).p†, paired t-test performed for values obtained between weeks 0 and 12.SBP, systolic blood pressure; DBP, diastolic blood pressure; BMI, body mass index.
Table 3.
Change in the serum lipid parameters and coenzyme Q10 (CoQ10) ratio between weeks 0 and 12.
Table 3.
Change in the serum lipid parameters and coenzyme Q10 (CoQ10) ratio between weeks 0 and 12.
| Groups | Week 0 | Week 12 | ΔChange (%) |
p† | |
|---|---|---|---|---|---|
| Mean ± SEM | Mean ± SEM | ||||
| TC (mg/dL) | Male (n=8) | 267.7 ± 24.2 | 211.2 ± 12.5 | –21.1 | 0.056 |
| Female (n=9) | 221.4 ± 8.2 | 195.3 ± 15.3 | –11.8 | 0.152 | |
| Total (n=17) | 243.2 ± 13.1 | 202.8 ± 9.9 | –16.6 | 0.019 | |
| TG (mg/dL) | Male (n=8) | 191.4 ± 34.8 | 84.1 ± 17.4 | –56.1 | 0.015 |
| Female (n=9) | 102.2 ± 9.5 | 52.4 ± 6.5 | –48.7 | 0.001 | |
| Total (n=17) | 144.2 ± 19.9 | 67.3 ± 9.4 | –53.3 | 0.002 | |
| RC (mg/dL) | Male (n=8) | 36.2 ± 7.7 | 16.2 ± 3.4 | –55.4 | 0.032 |
| Female (n=9) | 20.5 ± 1.9 | 12.7 ± 2.2 | –38.0 | 0.017 | |
| Total (n=17) | 27.9 ± 4.1 | 14.3. ± 2.0 | –48.6 | 0.007 | |
| HDL-C (mg/dL) | Male (n=8) | 43.8 ± 3.1 | 54.3 ± 4.7 | 23.9 | 0.084 |
| Female (n=9) | 56.3 ± 3.5 | 58.8 ± 5.9 | 4.4 | 0.721 | |
| Total (n=17) | 50.4 ± 2.8 | 56.6 ± 3.7 | 12.4 | 0.189 | |
| HDL-C/TC (%) | Male (n=8) | 17.1 ± 1.7 | 26.2 ± 2.4 | 53.2 | 0.008 |
| Female (n=9) | 25.7 ± 1.9 | 30.5 ± 2.3 | 18.6 | 0.126 | |
| Total (n=17) | 21.6 ± 1.6 | 28.5 ± 1.7 | 31.5 | 0.007 | |
| TG/HDL-C (ratio) |
Male (n=8) | 4.7 ± 0.9 | 1.7 ± 0.4 | –63.2 | 0.014 |
| Female (n=9) | 1.9 ± 0.2 | 1.0 ± 0.1 | –48.6 | 0.005 | |
| Total (n=17) | 3.2 ± 0.5 | 1.3 ± 0.2 | –58.6 | 0.005 | |
| LDL-C (mg/dL) | Male (n=8) | 188.0 ± 18.7 | 140.8 ± 10.3 | –25.1 | 0.044 |
| Female (n=9) | 144.6 ± 8.3 | 123.7 ± 11.7 | –14.5 | 0.164 | |
| Total (n=17) | 165.0 ± 10.9 | 131.7 ± 7.9 | –20.2 | 0.019 | |
| LDL-C/HDL-C(ratio) | Male (n=8) | 4.5 ± 0.6 | 2.8 ± 0.4 | –38.2 | 0.029 |
| Female (n=9) | 2.7 ± 0.3 | 2.2 ± 0.2 | –17.9 | 0.198 | |
| Total (n=17) | 3.5 ± 0.4 | 2.5 ± 0.2 | –30.0 | 0.022 | |
| Serum CoQ10 (mol/L) |
Male (n=8) | 0.395 ± 0.032 | 0.547 ± 0.031 | 38.2 | 0.027 |
| Female (n=9) | 0.551 ± 0.056 | 0.595 ± 0.05 | 7.9 | 0.566 | |
| Total (n=17) | 0.473 ± 0.035 | 0.571 ± 0.029 | 20.6 | 0.090 | |
| CoQ10/TC (mol/mol) |
Male (n=8) | 59.4 ± 7.3 | 102.5 ± 11.1 | 72.6 | 0.007 |
| Female (n=9) | 99.5 ± 17.0 | 127.3 ± 20.9 | 27.9 | 0.323 | |
| Total (n=17) | 79.5 ± 10.5 | 114.9 ± 11.9 | 44.5 | 0.034 | |
| CoQ10/HDL-C (mol/mol) |
Male (n=8) | 369.7 ± 75.0 | 395.8 ± 39.7 | 7.1 | 0.764 |
| Female (n=9) | 400.5 ± 92.2 | 415.5 ± 75.3 | 3.7 | 0.902 | |
| Total (n=17) | 385.1 ± 57.3 | 405.6 ± 41.0 | 5.3 | 0.773 | |
| CoQ10/LDL-C (mol/mol) |
Male (n=8) | 85.9 ± 12.5 | 156.3 ± 19.4 | 82.0 | 0.010 |
| Female (n=9) | 155.1 ± 25.1 | 207.5 ± 34.2 | 33.8 | 0.240 | |
| Total (n=17) | 120.5 ± 16.6 | 181.9 ± 20.2 | 51.0 | 0.026 |
Data are expressed as the mean±SEM (standard error of the mean).p†, paired t-test performed for the values obtained between weeks 0 and 12.CoQ10, coenzyme Q10; TC, total cholesterol; TG, triglyceride, RC, remnant cholesterol; HDL-C, high-density lipoprotein; LDL-C, low-density lipoprotein.
Table 4.
Change in the serum protein parameters between weeks 0 and 12.
| Groups | Week 0 | Week 12 | Δ Change (%) |
p† | |
|---|---|---|---|---|---|
| Mean ± SEM | Mean ± SEM | ||||
| AST (IU/L) | Male (n=8) | 33.5 ± 5.1 | 27.5 ± 2.2 | –17.9 | 0.306 |
| Female (n=9) | 23.7 ± 2.8 | 27.4 ± 2.8 | 16.0 | 0.352 | |
| Total (n=17) | 28.3 ± 3.0 | 27.5 ± 1.7 | –2.9 | 0.813 | |
| ALT (IU/L) | Male (n=8) | 37.8 ± 6.4 | 25.3 ± 2.8 | –33.1 | 0.103 |
| Female (n=9) | 29.2 ± 8.3 | 28.6 ± 7.0 | –2.3 | 0.952 | |
| Total (n=17) | 33.2 ± 5.3 | 27.0 ± 3.8 | –18.8 | 0.346 | |
| γ-GTP (IU/L) | Male (n=8) | 48.0 ± 11.6 | 19.9 ± 2.4 | –58.6 | 0.046 |
| Female (n=9) | 30.4 ± 6.9 | 15.6 ± 1.7 | –48.9 | 0.065 | |
| Total (n=17) | 38.7 ± 6.7 | 17.6 ± 1.5 | –54.6 | 0.007 | |
| hsCRP (mg/L) | Male (n=8) | 2.7 ± 1.1 | 3.4 ± 2.3 | 28.5 | 0.772 |
| Female (n=9) | 2.0 ± 0.5 | 2.0 ± 0.7 | –0.6 | 0.989 | |
| Total (n=17) | 2.3 ± 0.6 | 2.7 ± 1.1 | 15.2 | 0.781 | |
| apoA-I (mg/dL) | Male (n=8) | 144.5 ± 13.6 | 132.6 ± 8.7 | –8.2 | 0.473 |
| Female (n=9) | 140.9 ± 7.8 | 154.8 ± 10.4 | 9.9 | 0.303 | |
| Total (n=17) | 142.6 ± 7.4 | 144.4 ± 7.2 | 1.2 | 0.865 | |
| apo-B (mg/dL) | Male (n=8) | 140.8 ± 16.9 | 105.0 ± 7.2 | –25.4 | 0.072 |
| Female (n=9) | 89.9 ± 6.3 | 95.1 ± 7.3 | 5.8 | 0.596 | |
| Total (n=17) | 113.8 ± 10.5 | 99.8 ± 5.1 | –12.4 | 0.237 | |
| apo-B/apoA-I | Male (n=8) | 1.0 ± 0.1 | 0.8 ± 0.1 | –19.9 | 0.195 |
| Female (n=9) | 0.7 ± 0.1 | 0.6 ± 0.1 | –4.6 | 0.793 | |
| Total (n=17) | 0.8 ± 0.1 | 0.7 ± 0.0 | –13.4 | 0.277 | |
| Glucose (mg/dL) | Male (n=8) | 105.1 ± 5.7 | 97.3 ± 5.0 | –7.5 | 0.320 |
| Female (n=9) | 90.3 ± 3.7 | 89.2 ± 4.4 | –1.2 | 0.849 | |
| Total (n=17) | 97.3 ± 3.7 | 93.0 ± 3.4 | –4.4 | 0.398 | |
| Creatinine (mg/dL) | Male (n=8) | 1.1 ± 0.0 | 1.1 ± 0.1 | –3.0 | 0.619 |
| Female (n=9) | 1.0 ± 0.1 | 1.0 ± 0.0 | –2.2 | 0.804 | |
| Total (n=17) | 1.1 ± 0.0 | 1.0 ± 0.0 | –2.6 | 0.627 | |
| e-GRF (mL/min/1.73m²) | Male (n=8) | 76.7 ± 2.9 | 80.0 ± 3.8 | 4.3 | 0.505 |
| Female (n=9) | 72.6 ± 4.2 | 70.1 ± 4.3 | –3.4 | 0.689 | |
| Total (n=17) | 74.4 ± 2.7 | 74.4 ± 3.1 | 0.1 | 0.988 |
Data are expressed as the mean±SEM (standard error of the mean).p†, paired t-test performed for values obtained between weeks 0 and 12.hs-CRP, high sensitivity C-reactive protein; AST, aspartate transferase; ALT, alanine aminotransferase; γ-GTP, gamma-glutamyl transferase; e-GRF, estimated glomerular filtration rate.
Table 5.
Lipid compositions and extent of VLDL and LDL between weeks 0 and 12.
| Groups | Week 0 | Week 12 | ΔChange (%) |
p† | ||
|---|---|---|---|---|---|---|
| Mean ± SEM | Mean ± SEM | |||||
| VLDL | FI (Glycated) | Male (n=8) | 7131 ± 910 | 4431 ± 374 | –37.9 | 0.052 |
| Female (n=9) | 9311 ± 2943 | 5085 ± 782 | –45.4 | 0.214 | ||
| All (n=17) | 8221 ± 1484 | 4758 ± 420 | –42.1 | 0.041 | ||
| MDA (μM) | Male (n=8) | 27.1 ± 4.8 | 15.0 ± 1.9 | –44.6 | 0.080 | |
| Female (n=9) | 18.0 ± 6.5 | 10.4 ± 3.4 | –42.4 | 0.339 | ||
| All (n=17) | 22.6 ± 4.1 | 12.7 ± 2.0 | –43.7 | 0.050 | ||
| Diameter (nm) | Male (n=8) | 37.6 ± 0.4 | 39.4 ± 2.8 | 4.8 | 0.588 | |
| Female (n=9) | 38.8 ± 1.0 | 38.5 ± 2.6 | –0.8 | 0.918 | ||
| Total (n=17) | 38.1 ± 0.5 | 38.9 ± 1.7 | 2.2 | 0.659 | ||
| TC (μg/mg of protein) | Male (n=8) | 59.3 ± 10.1 | 53.1 ± 4.5 | –10.5 | 0.582 | |
| Female (n=9) | 66.6 ± 7.3 | 41.2 ± 3.4 | –38.2 | 0.009 | ||
| Total (n=17) | 63.2 ± 6.0 | 46.8 ± 3.1 | –26.0 | 0.023 | ||
| TG (μg/mg of protein) | Male (n=8) | 120.6 ± 19.4 | 74.0 ± 15.3 | –38.6 | 0.081 | |
| Female (n=9) | 131.4 ± 16.4 | 68.4 ± 10.8 | –47.9 | 0.006 | ||
| Total (n=17) | 126.3 ± 12.3 | 71.0 ± 8.9 | –43.7 | 0.001 | ||
| LDL | FI (Glycated) | Male (n=8) | 5009 ± 241 | 4358 ± 143 | –13.0 | 0.040 |
| Female (n=9) | 4907 ± 248 | 4138 ± 165 | –15.7 | 0.020 | ||
| Total (n=17) | 4955 ± 168 | 4242 ± 110 | –14.4 | 0.001 | ||
| MDA (μM) | Male (n=8) | 4.5 ± 0.1 | 3.0 ± 0.3 | –32.7 | 0.019 | |
| Female (n=9) | 3.7 ± 0.4 | 3.4 ± 0.3 | –9.1 | 0.494 | ||
| All (n=17) | 4.1 ± 0.2 | 3.2 ± 0.2 | –22.0 | 0.012 | ||
| Diameter (nm) | Male (n=8) | 25.8 ± 0.7 | 27.4 ± 0.4 | 5.9 | 0.091 | |
| Female (n=9) | 26.7 ± 0.8 | 25.8 ± 0.6 | –3.5 | 0.367 | ||
| Total (n=17) | 26.3 ± 0.5 | 26.5 ± 0.4 | 0.9 | 0.740 | ||
| TC (μg/mg of protein) | Male (n=8) | 139.8 ± 14.6 | 103.2 ± 5.0 | –26.2 | 0.043 | |
| Female (n=9) | 150.1 ± 19.4 | 95.3 ± 4.7 | –36.5 | 0.023 | ||
| Total (n=17) | 145.3 ± 12.1 | 99.0 ± 3.5 | –31.8 | 0.002 | ||
| TG (μg/mg of protein) | Male (n=8) | 20.6 ± 2.1 | 12.2 ± 1.3 | –40.8 | 0.005 | |
| Female (n=9) | 19.7 ± 2.6 | 10.8 ± 1.7 | –45.2 | 0.010 | ||
| Total (n=17) | 20.1 ± 1.6 | 11.4 ± 1.1 | –43.1 | < 0.001 |
Data are expressed as the mean±SEM (standard error of the mean).p†, paired t-test performed for values obtained between weeks 0 and 12.VLDL, very low-density lipoprotein; FI, fluorescence intensity (Ex=370 nm, Em=440 nm, 0.01 mg/dL of protein); MDA, malondialdehyde; TC, total cholesterol (μg/mg of protein); TG, triglyceride (μg/mg of protein); LDL, low-density lipoprotein.
Table 6.
Parameters of the HDL quality and functionality. Glycation and oxidation extent, lipid compositions, paraoxonase activity, and ferric ion reduction ability in HDL particles between weeks 0 and 12.
Table 6.
Parameters of the HDL quality and functionality. Glycation and oxidation extent, lipid compositions, paraoxonase activity, and ferric ion reduction ability in HDL particles between weeks 0 and 12.
| Groups | Week 0 | Week 12 | Δ Change % |
p† | ||
|---|---|---|---|---|---|---|
| Mean ± SEM | Mean ± SEM | |||||
| HDL₂ | FI (Glycated) | Male (n=8) | 2234 ± 213 | 1837 ± 180 | –17.8 | 0.175 |
| Female (n=9) | 1969 ± 166 | 1616 ± 153 | –17.9 | 0.138 | ||
| Total (n=17) | 2094 ± 133 | 1720 ± 117 | –17.9 | 0.043 | ||
| Diameter (nm) | Male (n=8) | 12.8 ± 0.4 | 13.5 ± 0.2 | 5.6 | 0.112 | |
| Female (n=9) | 12.5 ± 0.3 | 13.2 ± 0.4 | 6.0 | 0.180 | ||
| Total (n=17) | 12.6 ± 0.2 | 13.4 ± 0.2 | 5.8 | 0.038 | ||
| TC (μg/mg of protein) | Male (n=8) | 84.7 ± 12.5 | 67.2 ± 4.8 | –20.6 | 0.225 | |
| Female (n=9) | 68.7 ± 7.7 | 69.7 ± 3.6 | 1.4 | 0.910 | ||
| Total (n=17) | 76.2 ± 7.2 | 68.5 ± 2.9 | –10.1 | 0.332 | ||
| TG (μg/mg of protein) | Male (n=8) | 14.9 ± 2.8 | 7.5 ± 1.2 | –49.4 | 0.029 | |
| Female (n=9) | 9.8 ± 0.9 | 6.7 ± 1.0 | –32.2 | 0.033 | ||
| Total (n=17) | 12.2 ± 1.5 | 7.1 ± 0.8 | –42.1 | 0.004 | ||
| HDL₃ | FI (Glycated) | Male (n=8) | 1885 ± 208 | 1616 ± 159 | –14.3 | 0.322 |
| Female (n=9) | 1891 ± 241 | 1578 ± 136 | –16.6 | 0.278 | ||
| Total (n=17) | 1888 ± 156 | 1596 ± 101 | –15.5 | 0.126 | ||
| Diameter (nm) | Male (n=8) | 9.8 ± 0.3 | 11.2 ± 0.4 | 14.7 | 0.012 | |
| Female (n=9) | 9.5 ± 0.3 | 10.4 ± 0.4 | 9.5 | 0.070 | ||
| Total (n=17) | 9.6 ± 0.2 | 10.8 ± 0.3 | 12.0 | 0.002 | ||
| TC (μg/mg of protein) | Male (n=8) | 37.5 ± 1.3 | 50.0 ± 5.0 | 33.5 | 0.030 | |
| Female (n=9) | 40.5 ± 1.2 | 52.8 ± 6.7 | 30.5 | 0.107 | ||
| Total (n=17) | 39.1 ± 0.9 | 51.5 ± 4.2 | 31.8 | 0.009 | ||
| TG (μg/mg of protein) | Male (n=8) | 6.6 ± 1.2 | 5.6 ± 0.7 | –15.6 | 0.469 | |
| Female (n=9) | 4.8 ± 1.4 | 4.8 ± 0.7 | –0.2 | 1.000 | ||
| Total (n=17) | 5.7 ± 0.9 | 5.2 ± 0.5 | –8.7 | 0.643 |
Data are expressed as the mean±SEM (standard error of the mean).p†, paired t-test performed for values obtained between weeks 0 and 12.FI, fluorescence intensity (Ex=370 nm, Em=440 nm, 0.01 mg/dL of protein); HDL, high-density lipoprotein; TC, total cholesterol (μg/mg of protein); TG, triglyceride (μg/mg of protein); PON, paraoxonase; FRAP, ferric ion reduction ability.
Disclaimer/Publisher’s Note: The statements, opinions and data contained in all publications are solely those of the individual author(s) and contributor(s) and not of MDPI and/or the editor(s). MDPI and/or the editor(s) disclaim responsibility for any injury to people or property resulting from any ideas, methods, instructions or products referred to in the content. |
© 2023 by the authors. Licensee MDPI, Basel, Switzerland. This article is an open access article distributed under the terms and conditions of the Creative Commons Attribution (CC BY) license (http://creativecommons.org/licenses/by/4.0/).
Copyright: This open access article is published under a Creative Commons CC BY 4.0 license, which permit the free download, distribution, and reuse, provided that the author and preprint are cited in any reuse.


