
Submitted:
28 November 2023
Posted:
29 November 2023
You are already at the latest version
Abstract
Clinical and pre-clinical studies of neuropsychiatric (NP) disorders show altered astrocyte properties and synaptic networks. These are refined during early postnatal developmental (PND) stages. Thus, investigating early brain maturational trajectories is essential to understand NP disorders. However, animal experiments are highly time-/resource-consuming, thereby calling for alternative methodological approaches. The function of MEGF10 in astrocyte-mediated synapse elimination (pruning) is crucial to refine neuronal networks during development and adulthood. To investigate the impact of MEGF10 during PND in the rat prefrontal cortex (PFC) and its putative role in brain disorders, we established and validated an Organotypic Brain Slice Culture (OBSC) system.Using Western blot, we characterized the expression of MEGF10 and the synaptic markers synaptophysin and PSD95 in the cortex of developing pups. We then combined immunofluorescent-immunohistochemistry with Imaris-supported 3D-analysis to compare age- and sex-dependent astrocyte-mediated pruning within the PFC in pups and OBSCs. We thereby validated this system to investigate age-dependent astrocyte-mediated changes in pruning during PND. However, further optimizations are required to use OBSCs for revealing sex-dependent differences. In conclusion, OBSCs offer a valid alternative to study physiological astrocyte-mediated synaptic remodelling during PND and might be exploited to investigate pathomechanisms of brain disorders with aberrant synaptic development.
Keywords:
organotypic brain slice culture
; astrocyte
; synaptic phagocytosis
; critical period
; sex differences
1. Introduction
Astrocytes represent the most abundant subtype of glial cells in the central nervous system. They are characterized by a typical star-shaped morphology with numerous ramified processes and exert a wide range of distinct functions, e.g. the support of endothelial cells at the blood-brain barrier, the maintenance of ion homeostasis around synapses and in the extracellular space, the metabolic support of neuronal survival and the regulation of synaptogenesis, among others [1,2,3,4,5]. Several clinical studies of neuropsychiatric (NP) disorders show altered astrocyte properties [6,7,8,9,10,11] and pre-clinical studies have been pivotal in clarifying neurobiological underpinnings of those disorders [12,13,14,15].
In rodents, the generation, expansion and maturation of astrocytes (astrogenesis) take place during the first three weeks of brain postnatal development (PND) and are for the most part completed by the end of the so-called “critical period”, a highly sensitive time window of elevated brain plasticity [16,17,18]. In humans, this developmental time frame corresponds to the juvenile period of postnatal brain growth, which ends around the first decade of life, when adolescence begins [19]. However, it is still debated whether it might further extend into adolescence and even early adulthood. This latter aspect becomes clearly relevant when investigating putatively detrimental effects of environmental cues on early brain developmental processes or searching for the most effective therapeutic treatments for early-onset mental disorders, thereby calling for further investigations [20,21].
Astrogenesis, together with the refinement and specialization of astrocyte processes [22], coincides with a highly active period of synaptogenesis, which culminates with the establishment of properly functional neuronal networks [23,24]. The work of Chung and colleagues revealed that in mice, astrocytes play a pivotal role in synapse elimination (pruning), mediated by the multiple EGF-like domains 10 (MEGF10) phagocytic pathway. This process is prevalently directed towards glutamatergic synapses and occurs during both developmental stages and adulthood. MEGF10, the mammalian ortholog of the glia-specific phagocytic proteins Draper in Drosophila melanogaster and CED- 1 in Caenorhabditis elegans, is a transmembrane receptor almost exclusively expressed in astrocytes [25,26].
MEGF10 can mediate its phagocytic functions on apoptotic material via the recognition of the “eat-me signal” C1q bound to phosphatidylserine (PS) exposed on dying cells [27]. Interestingly, Chung and colleagues showed that MEGF10 phagocytic pathway is essential for the establishment of the eye-specific retinogeniculate segregation and the maintenance of a functional synaptic homeostasis in the adult hippocampus [26,28]. Any disturbance in the sequence of these events may lead to the development of dysfunctional neuronal circuits and improper synaptic transmission, thereby contributing to the onset of brain disorders [29].
Among additional factors that may affect brain development, sex differences have been consistently reported in epidemiological studies to be relevant for their impact on both physiological and pathological processes. However, there is a gap in research when it comes to unravelling the causes of these differences, thereby preventing not only a deep understanding of sex-dependent neurobiological underpinnings of synaptic network development, but also aetiological and pathogenic mechanisms of mental disorders in general. Moreover, this lack of knowledge hinders the generation of therapeutic approaches specific for either women or men [30,31].
The prefrontal cortex (PFC) is one of the regions with high vulnerability to environmental and endogenous stimuli, especially during sensitive early PND stages. Exposure to detrimental cues during these early growing phases has the potential to leave lasting imprints on the developing system, ultimately shaping maladaptive adult behaviors [19,32]. Previous studies in humans have carefully described changes in synaptogenesis from childhood through adolescence into early adulthood [33]. In rats, sex-dependent differences have been observed in the size of the PFC in adulthood, which started to appear during adolescence and could stem from neuronal death or pruning effects on neuronal circuits [34].
Primary dissociated cultures have been pivotal to study molecular, morphological and biochemical features of single homogeneous cell populations, allowing the performance of animal research experiments, without excessively increasing the numbers of experimental animals or their sufferance. However, in vitro cell cultures inherently lack 3D structures to explore the functional interplays between brain cells in a more complex context, where the main cell-cell physical and mechanical interactions are preserved. Thus, several models have been developed to support the analysis of such interactions. Among them, organotypic brain slice cultures (OBSCs) have proven to be useful for investigating specific cellular and molecular brain processes ex vivo [35,36,37]. Moreover, they maintain various aspects of structural and synaptic organization of the original tissue. With respect to other in vitro/ex vivo systems, such as the more complex brain organoids [38,39], OBSCs represent a useful tool with various advantages, notwithstanding some evident limitations [40,41].
Here, we first measured via Western blot the expression of MEGF10 and the glutamatergic synaptic markers synaptophysin (presynaptic) and postsynaptic density-95 (PSD-95; postsynaptic) during the critical period of brain development, at postnatal (P) day 7, P14 and P21, and after its closure, at P32, in the cortex of male and female Wistar rats. In parallel, we used immunofluorescent-immunohistochemistry combined with the 3D reconstruction of single astrocytes to examine age-dependent and sex-specific differences in astrocyte-mediated synapse elimination more closely into the infralimbic/prelimbic areas of PFC. Furthermore, we established and validated an OBSC model, which might serve to evaluate how the MEGF10 phagocytic pathway contributes to the formation of glutamatergic synaptic networks in the PFC during the critical period and whether it might be implicated in brain disorders with synaptic aberrancies. The application of pharmacological and/or genetic manipulations in OBSCs may be helpful to identify and investigate novel, sex-specific, disease trajectories and to potentially develop alternative treatment options tailored to the needs of males and females.
2. Materials and Methods
2.1. Animals
Experiments were carried out using male and female Wistar rats at postnatal days 0 to 32. Animals were group housed under standard conditions (12-hour light/dark cycle: lights on at 06:00 am, 22-24°C, 55% humidity, ad libitum access to food and water). Pregnant dams were acquired from Charles River Laboratories (Charles River, Sulzfeld, Germany). All experimental procedures were approved by the government of Oberpfalz, Germany, and performed in accordance with the guidelines of European Community Council Directives of 01/01/2013 (2010/63/EU). All efforts was taken to minimize animal pain or discomfort.
2.2. Developing pups
2.2.1. Protein isolation and immunoblotting
Whenever possible, mostly prefrontal cortex (PFC) tissue was collected at different postnatal stages (P0, P7, P14, P21, P32) and incubated in ice-cold RIPA buffer containing 50mM TRIS-HCl, pH 7.5 and protease inhibitor cocktail (Roche) for 15 minutes. However, tissue extracted might include proteins from neighboring areas (Figure 1A). Subsequently, homogenates were sonicated (4x 20s, 20% intensity), and centrifuged at 15,000 rcf for 25 minutes at 4°C. Supernatant containing proteins was collected and stored at -20°C.
Samples were boiled 5 minutes at 95°C and loaded onto 10% or12% SDS-PAGE, depending on the size of the protein of interest (10% for MEGF10, 12% for PSD95 and synaptophysin). A total amount of 12µg of protein per lane was loaded to be separated by electrophoresis and transferred to nitrocellulose membranes (Protran BA, Whatman, GE Healthcare, Munich, Germany). However, some technical variations might still occur during the loading procedure, possibly affecting the evenness of total proteins run and transferred. To address this, we consistently included the analysis of internal loading controls, such as cofilin or β-actin, to correct for such putative variations and allow relative comparisons of results. Membranes were blocked with 5% milk or BSA in Tris-buffered saline + Tween-20 (TBST) and incubated overnight at 4°C with primary antibodies as follows: anti-MEGF10 antibody (1:500, Thermofisher, Cat#PA5-76556), anti-PSD95 antibody (1:2500, Sigma-Aldrich, Cat#MAB1596), anti-synaptophysin antibody (1:5000, Abcam, Cat#ab52636), anti-β-actin antibody (1:10,000, Abcam, Cat#ab179467), anti-cofilin antibody (1:1000, Cell Signaling, Cat#5175S). Membranes were washed and incubated with horseradish peroxidase (HRP) –conjugated anti-mouse (1: 2500, Dianova, Cat#115-035-003) and anti-rabbit (1:1000 and 1:5000 for β-actin, Dianova, Cat#111-035-003) IgG antibody for 2 hours. Immunoreactivity was detected with the enhanced chemiluminescence kit (ECL, SuperSignal chemiluminescent substrate, Thermofisher, Cat#34580). The intensity of the bands was scanned and analyzed quantitatively using ImageJ software. Proteins of interest’s immunoreactivity was normalized to that of either β-actin or cofilin, as specified in the respective figure legends. In all gels, a sample was loaded to guarantee comparability of results, even when samples had to be run in different gels because of space limitations. Specifically, we used P0/P7 and DIV7 samples for pups and OBSCs, respectively. For the preparation of images, representative selected bands of the results were cropped from original gels and put together in a single panel to enhance their readability. In few cases, the brightness/contrast tool was applied, but only at the end to the whole picture. Full uncropped gels from which bands were taken are collected together in Supplementary Figure 1.
2.2.2. Immunofluorescent-immunohistochemistry to examine synaptogenesis and astrocyte phagocytosis in developing pup brains
For immunostaining, male and female littermates were either anesthetized with CO2 or directly decapitated. Intact hemibrains were collected in ice-cold phosphate-buffered saline (PBS) and fixed in 4% paraformaldehyde/PBS for two weeks at 4°C followed by cryoprotection in 30% sucrose. Afterwards, hemibrains were sectioned coronally at 40µm and preserved in 25% ethylene glycol/25% glycerol in PBS at -20°C. Brain sections were then washed thoroughly before permeabilization and blocking in 0.2% Triton-X 100+2% Normal Goat Serum (NGS) in PBS for 1.5 hour. Brain slices were incubated overnight at 4°C with primary antibody solution as follows: anti-LAMP1 antibody (1:100, Abcam, Cat#ab24170), anti-synaptophysin antibody (1:500, Synaptic System, Cat#101 006), anti-GFAP antibody (1:250, Sigma-Aldrich, Cat#G3893), anti-S100β antibody (1:500, Abcam, Cat#ab11178) in 0.2% Triton-X 100+2% NGS in PBS. After washing, sections were incubated with secondary antibodies Alexa Fluor 488-conjugated anti-chicken (1:500, Invitrogen, Cat#A11039), Cy3-conjugated anti-mouse (1:400, Sigma-Aldrich, Cat#C2181), biotin-conjugated anti-rabbit (1:500, Dianova, Cat#111-065-003) diluted in 2% NGS in PBS for 1.5 hour. After washing, a solution containing DAPI (1:1000, Merck, Cat#32670) and Alexa Fluor 647-conjugated Streptavidin (1:1000, Thermofisher, Cat#S21374) diluted in 2% NGS in PBS was applied to samples for 1 hour. Finally, brain sections were mounted on slides for confocal analysis.
2.2.3. Confocal imaging and analysis
Confocal images from the infralimbic/prelimbic areas of the PFC were taken using the Olympus FV31S-SW confocal microscope (Olympus Europe Holding GmbH, Hamburg, Germany). Images were acquired from at least two slices per animal (n=4 animals/time point) with a 60x magnification plus 2x optical zoom. 25 z-stack images of 512 x 512 µm were taken at 0.50 µm intervals. To examine the overall rate of synaptogenesis locally, the total synaptophysin fluorescence intensity per field was calculated using corrected total cell fluorescence (CTFC) on ImageJ, after subtracting the background noise. To analyze astrocyte internalization of synaptophysin in lysosomes (LAMP1 positive (LAMP1+) puncta), images were reconstructed using IMARIS 9.8 software (Bitplane, Zurich, Switzerland). In brief, single astrocytes were 3D-reconstructed using the surface rendering function. Both LAMP1 and synaptophysin channels were masked inside the astrocyte surface and synaptophysin puncta inside the lysosomes were quantified using the spots function. Astrocyte phagocytosis was assessed with IMARIS 9.8 software (Bitplane, Zurich, Switzerland). In brief, individual astrocytes were selected and cropped (‘crop tool’) and subjected to 3D reconstruction utilizing the ‘surface rendering’ function. Subsequently, the LAMP1 and synaptophysin channels were specifically masked within the identified astrocytic surface. Quantification of LAMP1+ spots was executed utilizing the ‘spot’ function, while synaptophysin+ spots were redefined within the LAMP1+ spots, with exclusive quantification restricted to those residing within lysosomes. The phagocytic index was calculated by determining the total number of synaptophysin+/LAMP1+ colocalizing spots normalized to the total volume of a given astrocyte. This normalization to the volume was used to equalizeputative differences among astrocytes due to the staining procedure with antibodies, which might have not always uniformly labelled the entire astrocyte. Moreover, the same number of astrocytes (six) per animal was analyzed at any given developmental stage to enable the comparison of age-dependent changes in phagocytic index, independently from developmentally-driven increases in total numbers of astrocytes along PND stages.
2.3. Organotypic Brain Slice Cultures (OBSCs)
2.3.1. Organotypic Brain Slice preparation
Organotypic brain slices (OBSCs) were prepared after the method of Stoppini et al. [35] and Humpel [42]. In brief, male and female rat pups aged postnatal day 4 (P4) to P6- were promptly decapitated in ice-cold, oxygenated (95%/5% O2/CO2) dissection medium mixed with D-Glucose (10mM) and penicillin-streptomycin (100U/mL), olfactory bulb and cerebellum were removed. Brains were mounted on the cutting disk with a thin layer of superglue. Sequential coronal slices containing the PFC (400µm thickness, 9 slices of both hemispheres) were obtained using a vibratome platform (Leica VT1200, Leica Biosystems, Wetzlar, Germany) submerged in chilled oxygenated dissection solution at a speed of 0.06 mm/s. Subsequently, brain slices were carefully transferred onto translucent porous membranes (Millicell Cell Culture inserts, 0.4µm, 30mm, Merck Millipore, Cat#PICM03050) pre-conditioned with 1mL of OBSC culture medium placed in 6-well plates.
2.3.2. Organotypic Brain Slice Culture
OBSCs were cultured in group of 3 slices per animal onto membrane inserts in 1mL OBSCs culture medium at 37°C, 5% CO2 in 6-well plates. OBSCs culture medium consisted of basal medium eagle with Earle’s Balanced Salt Solution (EBSS), 25mM HEPES, 25% inactivated horse Serum, 5mg/mL D-Glucose, 1mM GlutaMAX, and 1% penicillin-streptomycin. Half of the OBSCs culture medium was replaced every 3 days (500µL removed, replaced with 800µL due to evaporation). OBSCs were kept in culture up to 21 days in vitro (DIV).
2.3.3. Cell viability assay
Cell viability of OBSCs was assessed using the propidium iodide (PI) dye (Sigma-Aldrich, Cat#P4170). In brief, brain slices collected at DIV0, 7, 14 and 21 were placed in fresh culture medium containing 2µg/mL of PI and incubated for 30 minutes at 37°C. Subsequently, OBSCs were transferred into new wells containing DAPI and incubated another 30 minutes at RT. Finally, OBSCs were mounted on slides and imaged using the inverted Zeiss LSM 880 Airyscan microscope with a 10x magnification. This method has been widely used to assess cell viability in OBSCs [43].
2.3.4. Protein isolation and immunoblotting
Proteins were isolated from OBSCs at different time points: DIV7, 14, and 21. In brief, brain slices were washed with ice-cold PBS, cut out of membrane inserts and afterwards cortices were dissected and collected in ice-cold RIPA buffer for 15 minutes. For OBSCs, it was not really possible to selectively isolate PFC from other cortical regions, therefore tissue analyzed may contain proteins from neighboring areas. Subsequently, tissue homogenates were sonicated (2x20s, 20% intensity), and centrifuged at 15,000 rcf for 25 minutes at 4°C. For immunoblotting and protein analysis the same protocol was applied as described in §2.2.1.
2.3.5. Immunofluorescent-immunohistochemistry to examine astrocyte phagocytosis in OBSCs
Membranes containing brain slices were transferred into a 6-well plate and rinsed with PBS for 10 minutes. Slices were then fixed with gentle shaking in 4% paraformaldehyde in PBS at 4°C overnight and washed three times with PBS at room temperature. Finally, culturing membranes containing brain slices were cut out of the insert and placed in 0.1% Sodium Azide-PBS to be stored at 4°C.
Following 2 hours blocking and permeabilization at room temperature in 0.1% Triton-X 100+2% NGS in PBS, fixed brain slices were labeled with anti-GFAP antibody (1:400, Sigma-Aldrich, Cat#G3893), anti-LAMP1 antibody (1:100, Abcam, Cat#ab24170), anti-synaptophysin antibody (1:500, Synaptic System, Cat#101 006) in 0.1% Triton-X 100+2% NGS in PBS, overnight at 4°C. Slices were incubated with secondary antibodies Alexa Fluor 488-conjugated anti-chicken (1:500, Invitrogen, Cat#A11039), Cy3-conjugated anti-mouse (1:400, Sigma-Aldrich, Cat#C2181), biotin-conjugated anti-rabbit (1:500, Dianova, Cat#111-065-003) diluted in 2% NGS in PBS for 2 hours. Subsequently, a solution containing DAPI (1:1000, Merck, Cat#32670) and Alexa Fluor 647-conjugated Streptavidin (1:1000, Thermofisher, Cat#S21374) diluted in 2% NGS in PBS was applied to samples for 1 hour. Finally, OBSCs were mounted on slides for confocal analysis.
2.3.6. Confocal imaging and analysis
OBSCs were imaged using the Zeiss LSM 880 Airyscan confocal microscope (Carl Zeiss Microscopy GmbH, Germany). Images of PI labeled cells were acquired with a 10x air magnification objective, using DAPI as reference. For astrocyte phagocytic activity in OBSCs, images were taken with a 63x oil objective. 6 images per OBSCs were acquired from the infralimbic/prelimbic areas of the PFC. Thirty z-stack images were taken at 0.50 µm intervals, using GFAP as reference.
Intensity of PI+ cells weas quantified in the PFC using corrected total cell fluorescence (CTFC) on ImageJ, after subtracting the background noise. OBSCs viability was analyzed after 0, 7, 14, and 21 days in culture (DIV). The mean CTFC value per brain was calculated and expressed as a percentage of difference to DIV0. Analysis of astrocyte phagocytosis (“phagocytic index”) in OBSCs was carried out with a different procedure than in brain pups due to the intrinsic nature of OBSC which prevented us from selecting and examining single astrocytes. In brief, the analysis was performed on whole image areas for every picture with IMARIS 9.8 software (Bitplane, Zurich, Switzerland). A co-localization channel of LAMP1+ and synaptophysin+ was created and masked with the GFAP+ channel. Finally, astrocyte phagocytosis was determined as ratio of “synphys+/LAMP1+/GFAP+” and “synphys+/LAMP1+” colocalized voxels.
2.4. Statistical Analysis
For statistical analysis, the normality distribution of data was verified before running the appropriate statistic tool. Data were analyzed with one-way ANOVA for multiple comparisons. We used the ANOVA with repeated measures for OBSCs (with mixed-effects whenever missing values occurred), as slices derived from the same brain were analyzed at different time points. The analysis was followed by Tukey´s posthoc test and data are presented as mean ± Standard Deviation (SD). Statistical significance was considered when the p value was equal or less than 5% (p<0.05). All statistical analysis and data visualization were carried out using GraphPad Prism 8 (GraphPad Software, San Diego, CA).
3. Results
3.1. MEGF10, PSD95 and synaptophysin expression in the PFC of male and female developing rat pups
We first examined differences in the expression of the phagocytic protein MEGF10 and the synaptic markers synaptophysin (synphys) and PSD95 in the cortex of male and female rat pups from P7 to P32. We observed that in males MEGF10 total protein levels remained unaltered through P7-P21 and decreased at P32 (Figure. 1B,C, one-way ANOVA, F(3,27)=3,787, p<0.0218, Tukey’s posthoc test: P21-P32, *p<0.05). Contrarily, in female pups MEGF10 total protein levels did not change at any of the developmental stages examined (Figure 1H,I, one-way ANOVA, F(3,24)=1.399, p=0.2673, ns, not significant).
We found additional differences between sexes when we evaluated the expression of synphys and PSD95. In males, we observed a significant rise in the amount of PSD95 between P7 and P14, reaching a peak and remaining elevated throughout the subsequent stages (Figure 1D,E, one-way ANOVA, F(3,27)=9.714, p=0.0002; Tukey’s posthoc test: P7-P14, *p<0.05, P7-P21, ***p<0.001, P7-P32, **p<0.01). In females, levels of PSD95 were already slightly higher than in males at P7 and showed a peak of expression at P21, subsequently decreasing again by P32 (Figure 1J,K, one-way ANOVA, F(3,25)=4.646, p=0.0103; Tukey’s posthoc test: P7-P21, *p<0.05, P14-P21, *p<0.05).
When we examined synphys, we observed that, in males, changes in expression levels mirrored a similar pattern to PSD95, with a rise between P7 and P14, which plateaued throughout P21 and P32 (Figure 1F,G, one-way ANOVA, F(3.26)=13.28, p<0.0001; Tukey’s posthoc test: P7-P14, *p<0.05, P7-P21, ****p<0.0001, P7-P32, ***p<0.001). In females, the increase in protein expression followed a delayed pattern similar to PSD95, with a peak at P21, which was however still slightly elevated at P32, although less prominently than at P21 (Figure 1L,M, one-way ANOVA, F(3,24)=11.82, p<0.0001; Tukey’s posthoc test: P7-P21, ****p<0.0001, P14-P21, **p<0.001, P7-P32, *p<0.05).
3.2. Astrocyte-dependent synapse elimination in the PFC of male and female developing rat pups
Although markers for adult astrocytes have been identified and successfully used so far [16], it is still under debate which markers can unequivocally label early-stage postnatal astrocytes. Based on the work of Raponi and colleagues [17], we decided to use a combination of GFAP and S100ß antibodies to identify early-stage mature astrocytes of the PFC. We performed immunofluorescent-immunohistochemistry in brain slices and quantified the phagocytic index (for details, see §2.2.3 of the Materials and Methods section) using antibodies against synaptophysin and lysosomal associated membrane protein 1 (LAMP1) (Figure 2B-D,E-G). This analysis was specifically carried out in the infralimbic/prelimbic areas of the PFC in male and female pups from P7 to P32 (Figure 2A).
When assessing the changes in the rates of synapse elimination, we observed again sex-dependent differences. In males, we measured a rise in synapse elimination between P7 and P14, followed by a decrease at P21 and a further drop at P32 (Figure 2C,D, one-way ANOVA, F(3.12)=17.17, p=0.0001; Tukey’s posthoc test: P7-P14, *p<0.05, P7-P32, *p<0.05, P14-P21, **p<0.001, P14-P32, ****p<0.0001). In females, the pattern of synapse elimination displayed higher levels of phagocytic index already detectable at P7, which remained elevated at P14, went down at P21 and slightly increased again at P32 (Figure 2F,G, one-way ANOVA, F(3.12)=11.12, p=0.0009; Tukey’s posthoc test: P7-P21, **p<0.001, P14-P21, **p<0.001).
To characterize changes in synphys protein with greater precision and localization than previously achieved with Western Blot, we analyzed synphys fluorescence intensity in the infralimbic/prelimbic areas of the PFC (Suppl Figure 2A,B). This analysis revealed that, in males, a rapid increase of the signal occurred between P7 and P14, followed by an equally rapid signal decline by P21, which stabilized at P32, mirroring the respective patterns of synapse elimination (Suppl Figure 2A, one-way ANOVA, F(3.12)=21.36, p<0.0001; Tukey’s posthoc test: P7-P14, ****p<0.0001, P14-P21, **p<0.001, P14-P32, ***p<0.001). Similar to males, synphys fluorescent intensity in females exhibited a rapid rise from P7 to P14 and a decline between P14 and P21. However, in contrast to males, the signal increased again by P32, suggesting that a second wave of synaptogenesis may occur in female pups (Suppl Figure 2B, one-way ANOVA, F(3.12)=18.01, p<0.0001; Tukey’s posthoc test: P7-P14, **p<0.01, P14-P21, ****p<0.0001, P14-P32, *p<0.05, P21-P32, *p<0.05). Remarkably, however, in females these changes in synaptogenesis did not mirror the respective patterns of synapse elimination.
3.3. Establishing organotypic brain slice cultures (OBSCs) to examine synapse elimination in the PFC during early postnatal developmental stages
3.3.1. Viability assay
The procedure used to prepare organotypic slices may cause tissue damage, which in turn has the potential to affect their viability (33). To assess the amount of cellular damage over the culturing period, OBSCs were labeled with Propidium Iodide (PI), which is only able to penetrate compromised cell membranes and therefore marks dead or dying cells. DAPI was additionally used to counterstain cell nuclei and precisely identify single cells. The intensity of PI staining was then used as a correlate measure of cell death and data from 7 days-in-vitro (DIV7) to DIV21 were normalized to DIV0, the time point taken immediately after cutting.
3.3.2. MEGF10 expression and astrocyte-dependent synapse elimination in the PFC of OBSCs derived from male and female rat pups
To validate OBSCs for investigating differences in astrocyte-mediated age- and sex-dependent phagocytosis, we first analyzed MEGF10 expression levels in the PFC of OBSCs prepared from male and female rat pups at DIV7, 14 and 21.
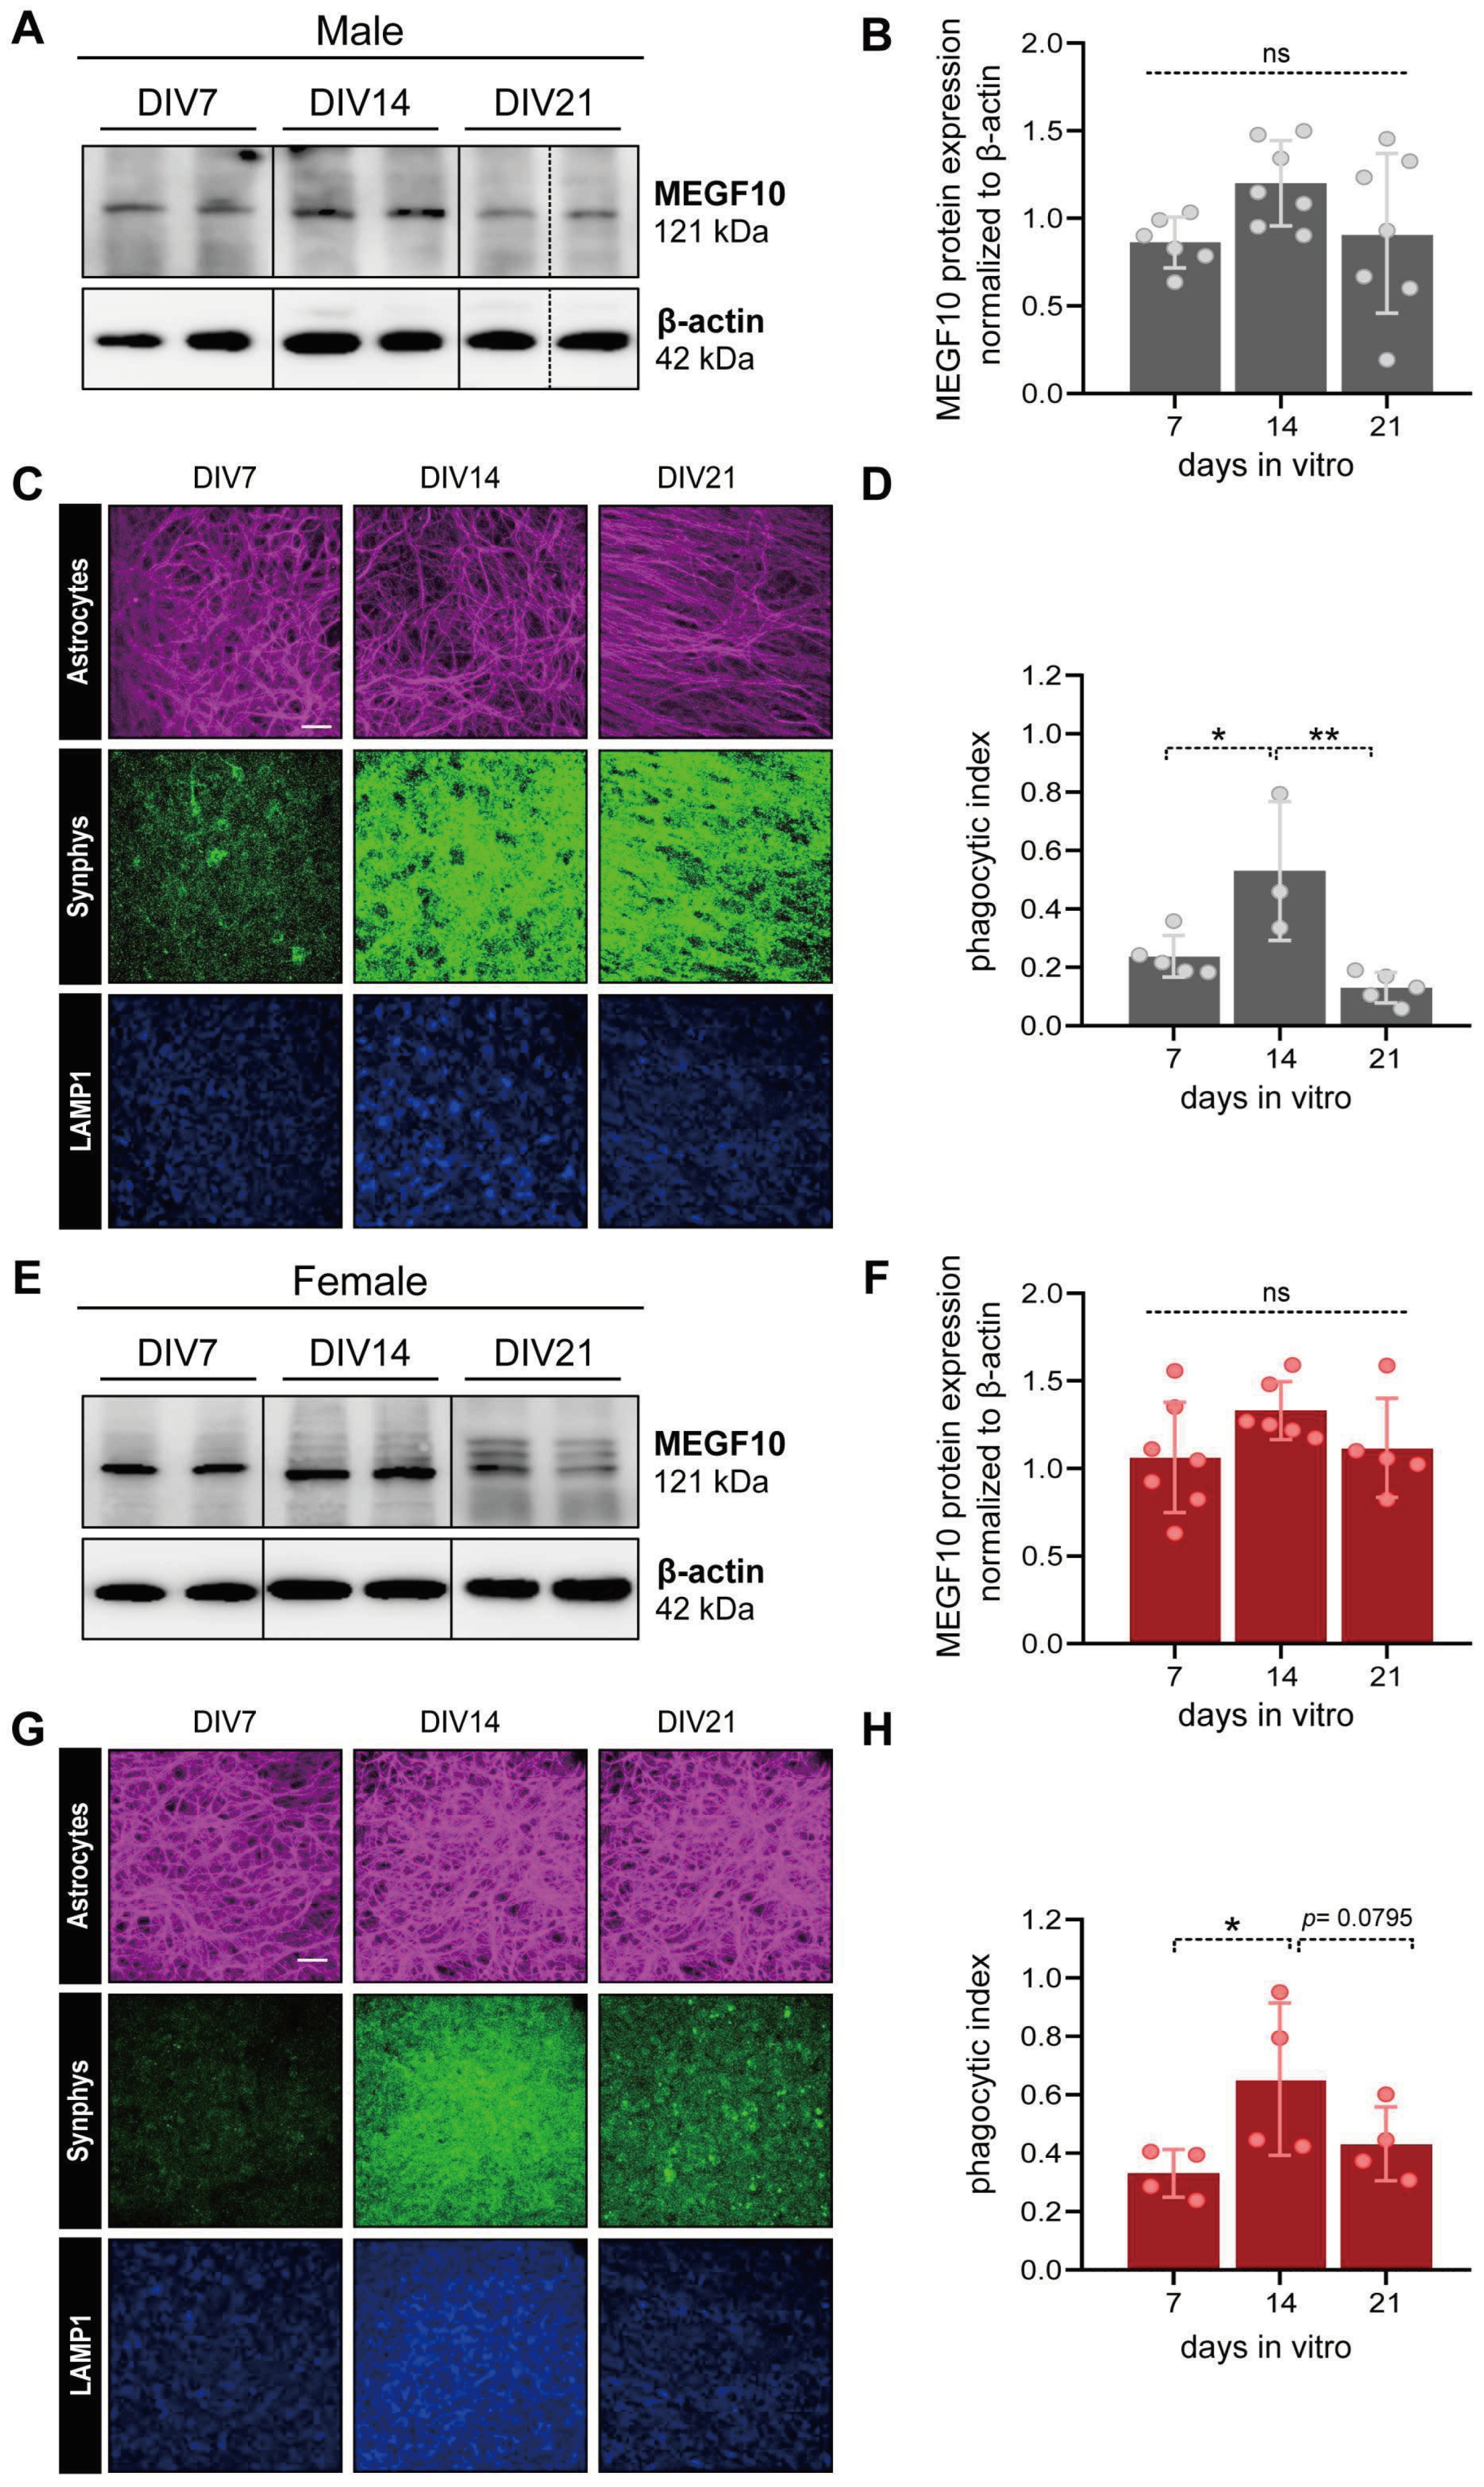
In accordance with results obtained from rat pups (Figure 1B,C and H,I), we observed no differences in the expression of MEGF10 levels in male OBSCs between DIV7 and DIV21 (Figure 4A,B, one-way ANOVA with mixed-effects model, F(2, 11)= 2.563, ns, not significant). The same trend was observed for female OBSCs, which also showed no detectable differences at any of the stages examined (Figure 4E,F, one-way ANOVA with repeated measures, F(2, 9)=1.937, ns, not significant).
Subsequently, we evaluated the astrocyte-dependent phagocytosis using GFAP to label astrocytes. This approach was chosen to avoid difficulties in the analysis of single astrocytes in this type of ex vivo system, where double staining with S100ß might hinder the identification and examination of single cells ([44] and our data). This experiment revealed that in OBSCs derived from male rat pups, the rate of astrocyte-mediated synapse elimination (measured as described in §2.3.5 of the Materials and Methods section) increased between DIV7 and DIV14 to reach a peak and drop down again at DIV21, as we previously observed in rat pups at comparable developmental stages (Figure 4C,D, one-way ANOVA with repeated measures, F(2,6)= 11.14, p=0.0096, Tukey’s posthoc test: DIV7- DIV14, * p<0.05, DIV14- DIV21, ** p<0.001). In female OBSC, however, differently than from female rat pups, we observed an analogous trend to change as in males, with a significant increase in the rate of phagocytosis between DIV7 and DIV14, which declined again between DIV14 and DIV21 (Figure 4G,H, one-way ANOVA with repeated measures, F(2,6)= 8.067, p=0.0199, Tukey’s posthoc test: DIV7- DIV14, * p<0.05, DIV14- DIV21, p=0.0795).
We further examined temporal changes in synphys expression in OBSCs. In contrast to results from pup brains, in OBSC the signal fluorescence intensity displayed a higher degree of variability, with no significant changes at any time point neither in males nor in females (Suppl Figure 2C, males, one-way ANOVA, F(2.6)=0.52, ns, not significant; Suppl Figure 2D, females, one-way ANOVA, F(2.6)=0.09, ns, not significant).
4. Discussion
Postmortem studies in human and non-human primates have shown that in cortical areas all synaptogenic events leading to supernumerary synapses and the subsequent age-dependent synapse elimination, increase after birth. These processes reach a peak in early childhood to decline during later developmental stages and finally become refined in late adolescence/early adulthood [33,45,46,47,48,49]. However, brain scan imaging methods have shown that dynamic changes in the density of the gray matter may persist longer than adolescence, opening the question whether such events continue beyond it and extend into the third decade of life, before reaching adult levels [50]. Such long developmental range of neuronal network reorganization could also account for the substantial impact of environmental challenges on the formation of human cognitive and emotional capacities, as well as their potent detrimental effects, which may underlie the onset of neuropsychiatric disorders [32].
In addition to these intrinsic neurobiological modifications, it is also clear that sex-specific hormonal changes may influence synaptic formation/elimination to favor the development of adaptive behavioral responses during sexual maturation in both males and females. However, only few studies consider sex differences among the critical factors that should be evaluated when interpreting experimental findings and measured parameters [34,48]. Therefore, research in this direction is highly warranted to better understand sex-dependent maturational trajectories of brain development in healthy contexts, which can in turn guide medical interventions in disease states with a focus on sex differences.
Here, we sought to offer an alternative tool to examine age- and sex-dependent changes in astrocyte-mediated synapse elimination in the prefrontal cortex (PFC) at early postnatal stages, from birth until adolescence. We compared developing brains from rat pups with organotypic brain slices (OBSCs), a 3D system so far used to investigate hippocampal and cerebellar developmental processes [37,42,44,51,52,53,54]. In addition, this system is more amenable to pharmacological, genetic and various manipulations than other models and may substantially reduce eperimental costs. In rat pups, we examined age- and sex-dependent rates of synapse formation and elimination and evaluated whether putative sex-dependent differences in astrocyte-mediated synapse elimination occurred. We found that MEGF10 showed slight oscillations in the average of its protein levels between P21 and P32 in males (Figure 1B,C), which marks the end of the juvenile period and corresponds to the generally accepted time for the closure of the cortical developmental critical period [55]. On the contrary, MEGF10 levels did not change in females at any developmental stage (Figure 1H,I). These findings were effectively reproducible in OBSCs, which did not show any relevant modifications in the levels of MEGF10 between DIV7 and DIV21 (Figure 4A,B and E,F). While these results might initially suggest a lack of MEGF10-dependent phagocytic activity from P7 to P32, our observations were in apparent contradiction to such expectations. We measured both age- and sex-dependent changes in astrocyte-mediated synaptic phagocytosis (Figure 2B-G), indicating different mechanisms regulating MEGF10 activity compared to changes in its expression levels. For instance, it has been shown that for the MEGF10-mediated uptake of amyloid-ß plaques, the role of a lipid raft-dependent endocytosis, in the absence of any changes in MEGF10 protein levels, is relevant for MEGF10 functionality [56]. Further work would be needed to clarify whether this possibility applies to OBSCs.
To next evaluate whether this system represented a useful platform to examine changes in synaptic elimination during the critical period of cortical development, we first measured and correlated changes in synaptic proteins with the astrocyte-mediated phagocytosis in pups from P7 to P32.
Here, we observed clear age- but also sex-dependent developmental patterns, which suggested that sex-specific determinants influence both the rates of synaptogenesis and astrocyte-mediated synapse elimination (Figure 1 D-G, J-M and Figure 2B-D, E-G).
We initially detected an apparent inconsistency between results obtained on the expression levels of synaptophysin by Western blot (Figure 1F-G, L-M) and immunohistochemistry (Suppl. Figure, 2A,B). On the one hand, the expression of this protein in Western blot increased from P7 to P14, remaining elevated until P32 in males (Figure 1F,G), while it peaked with a delayed increase in females between P14 and P21 (Figure 1L,M). On the other hand, the IHC showed a different pattern, with an apparent peak at P14 which decreased afterwards in males, whereas it decreased in females at P21 to increase again by P32 (Figure 2B,E and Suppl. Figure 2 A,B). The observed discrepancies could be attributed to distinct methods used to prepare tissues for the two experiments. As mentioned in the Method section, brain tissue for Western blots might have contained tissue from other brain cortical areas around the PFC (Figure 1A), whereas the IHC analysis was restricted to the infralimbic/prelimbic areas of the PFC (Figure 2A). Achieving complete congruence in experimental conditions, such as using laser microdissection, might be necessary to address these differences precisely.
Our results in pups showed that, at the end of the juvenile period around P32, also the pattern of astrocyte-dependent phagocytosis followed a different trend in females when compared to males in the PFC (Figure 2 B-D and E-G). We observed a second slight rise in the rate of synapse pruning at P32, which correlated with a significant elevation in synaptophysin levels only in females at this time point (Suppl Figure 2B). These results suggest that in females multiple waves of synaptogenesis and synaptic refinement through astrocyte-dependent synapse elimination might occur (at P7/P14 and at P32). This phenomenon could also be examined in human and non-human primates to possibly explain the observed reduced sizes of the PFC in adult females compared to males [34,48]. However, further experiments should be conducted to validate this hypothesis, including the examination of later developmental stages and, if possible, increasing samples sizes.
From our results, we could argue that a detrimental environmental hit, such as stress or a traumatic event, during late adolescence in females may have long-lasting effects, as the system appears to be still in a developmental phase with respect to the male counterparts. This is in line with observations in disorders more prevalent in females, which may be linked to the different maturational trajectories of the neuronal circuits in the two sexes.
These differences could depend on long-range synaptic innervation, but also local cellular mechanisms, which might both contribute to the sex-specific synaptic refinements in the infralimbic/prelimbic areas of the PFC. Therefore, we established a 3D culturing system to examine developmentally regulated, but also sex-dependent mechanisms, which control synaptic elimination during the juvenile stages of postnatal brain growth. As discussed before, the comparison of the early PND stages of pups’ brain growth with OBSCs revealed that slices prepared from P4-P6, a period when sensory inputs have already reached cortical areas [57] and astrocyte proliferation/differentiation processes are primarily local [16], might retain sufficient autonomous information to reproduce an in vivo brain environment. This allows astrocytes to display very similar patterns of MEGF10 expression in the cortex of both sexes in pups and OBSCs (Figure 1 B,C and H,I and Figure 4 A,B and E,F). More strikingly, we noticed that in males the astrocyte-mediated synaptic phagocytosis was preserved in OBSCs and followed the same dynamics showed by the developing brains (Figure 2 B-D and Figure 4 C,D). These first results suggested that OBSCs might undergo a sort of developmentally programmed “reset” after cutting and show similarities between P7 and DIV7 stages. However, the findings were notably different in female OBSCs, with the change in the rate of phagocytosis resembling the male-derived OBSCs, with a peak at DIV14 and reduction afterwards. This was in contrast to the female developing brains, where the levels of phagocytosis at P7 were as high as at P14 and dropped down at P21 (Figure 2 E-G and Figure 4 G,H). These results suggested that this parameter is not sufficiently preserved in our model system to confidently claim yet its validity for the examination of female-specific changes in astrocyte-dependent synapse elimination. We hypothesized that this factor may be affected by the cutting procedure [40], which might hinder essential long-range, most likely peripheral, sex-specific determinants, such as sexual hormones, from reaching the cortex and influencing the sex-dependent reshaping of this distinct astrocyte-mediated function. More experiments should be performed to assess whether interventions, such as the administration of sexual hormones in OBSCs might help to phenocopy the phagocytic rate found in the developing female brains. However, even though cultures can be maintained for long times [40,54], studies of hormonal interferences with neuronal network formation in this system may have limitations.
Another possible explanation for the observed differences could be related to method we used to quantify the rate of synaptic pruning in OBSCs, since the immunohistochemical stainings employed for brains had to be slightly adapted in slices to allow the characterization of astrocyte-associated synaptic engulfment. To rule out possible confounding factors, the use of virally-mediated astrocyte labelling in OBSCs may help in refining the characterization of rates of synaptic material engulfment in this system. However, this procedure may reintroduce a high inter-sample variability and has to be carefully established to reach an acceptable degree of reproducibility and reliability of experimental findings.
Finally, in view of the acknowledged limitations of OBSCs for conducting studies on synaptic changes in cortical areas because of the disruption of both short- and long-range axonal inputs during the cutting procedure [40], we expected reduced rates of synaptic elimination in brain slices. Moreover, we were aware of the possible increase in astrocyte gliosis, which has been described in OBSCs and might have affected our results [58]. However, it has been reported that especially the lysosomal-dependent phagocytosis would actually be reduced and not increased in reactive astrocytes [59]. This further reinforces the specificity of our results obtained in OBSCs on dynamically changing rates of phagocytosis in the PFC along PND stages and lack of artifactual effects resulting from tissue damage during dissection.
Of course, other limitations exist, such as the impaired capability of directly correlating any type of induced manipulation with complex changes, such as behavioral parameters.
However, overall this system offers numerous advantages which should be considered when planning animal research experiments. For example, it allows for the direct correlation of effects with selected molecular or biochemical processes or cell-type specific responses occurring in situ in distinct brain regions. This is surely also in line with animal welfare regulations, which encourage the use of alternative model systems to sensibly reduce the number(s) of animals used to perform multiple experiments and measure various parameters in biomedical research, without compromising the acquisition of strong and reliable data from molecular or histochemical examinations [60].
Here, we demonstrated that OBSCs can serve as a useful supporting tool to examine age- and sex-dependent changes in astrocyte-dependent synapse elimination in the rat PFC during postnatal developmental stages. This model might be very valuable for evaluating particularly male-related differences in astrocyte responses to environmental or endogenous insults, which may induce synaptic aberrancies. Therefore, OBSCs may prove to be an ideal model to study the neurobiological underpinnings of neuropsychiatric or neurodevelopmental disorders characterized by synaptic deficits correlated with astrocyte pathology, such as schizophrenia, autism disorder or major depressive disorder
Supplementary Materials
The following supporting information can be downloaded at the website of this paper posted on Preprints.org.
Author Contributions
Conceptualization, B.D.B.; Methodology, L.R.S. and E.V.; Investigation, E.V., L.R.S. and A.N.; Writing –Original Draft, E.V., L.R.S., A.N. and B.D.B.; Writing –Review & Editing, E.V., L.R.S., A.N. and B.D.B.; Funding Acquisition, B.D.B.; Supervision, B.D.B.; Project administration, B.D.B.
Funding
This work was supported by intramural funding from the Department of Psychiatry and Psychotherapy of the University of Regensburg and by the German Research Council (DFG-GRK2174 “Neurobiology of Emotion Dysfunction” (P1)) to BDB. The FV3000 confocal microscope was funded by a grant (INST 89/506-1 FUGG, 91b GG) from the Deutsche Forschungsgemeinschaft (DFG). The sponsors did not have any role in writing the report and in the decision to submit the article for publication.
Institutional Review Board Statement
The animal study protocol was approved by the government of Oberpfalz, Germany, and performed in accordance with the guidelines of European Community Council Directives of 01/01/2013 (2010/63/EU). All efforts was taken to minimize animal pain or discomfort.
Data Availability Statement
No new data were created or analyzed in this study. Data sharing is not applicable to this article.
Acknowledgments
The authors would like to thank Dr. Britta Wenske and Susanne Wallner for their constant support during the establishment of the OBSCs, the execution of the experiments and critical technical advancements.
Conflicts of Interest
The authors declare that the research was conducted in the absence of any commercial or financial relationships that could be construed as a potential conflict of interest. The funders had no role in the design of the study; in the collection, analyses, or interpretation of data; in the writing of the manuscript; or in the decision to publish the results.
References
- Magistretti, P.J.; Allaman, I. Lactate in the Brain: From Metabolic End-Product to Signalling Molecule. Nat Rev Neurosci 2018, 19, 235–249. [Google Scholar] [CrossRef]
- Hashimoto, Y.; Greene, C.; Munnich, A.; Campbell, M. The CLDN5 Gene at the Blood-Brain Barrier in Health and Disease. Fluids Barriers CNS 2023, 20, 22. [Google Scholar] [CrossRef]
- Bosworth, A.P.; Allen, N.J. The Diverse Actions of Astrocytes during Synaptic Development. Current Opinion in Neurobiology 2017, 47, 38–43. [Google Scholar] [CrossRef]
- Verkhratsky, A.; Untiet, V.; Rose, C.R. Ionic Signalling in Astroglia beyond Calcium. J Physiol 2020, 598, 1655–1670. [Google Scholar] [CrossRef]
- Stogsdill, J.A.; Eroglu, C. The Interplay between Neurons and Glia in Synapse Development and Plasticity. Current Opinion in Neurobiology 2017, 42, 1–8. [Google Scholar] [CrossRef]
- Rajkowska, G.; Hughes, J.; Stockmeier, C.A.; Javier Miguel-Hidalgo, J.; Maciag, D. Coverage of Blood Vessels by Astrocytic Endfeet Is Reduced in Major Depressive Disorder. Biological Psychiatry 2013, 73, 613–621. [Google Scholar] [CrossRef]
- Rajkowska, G.; Miguel-Hidalgo, J. Gliogenesis and Glial Pathology in Depression. CNSNDDT 2007, 6, 219–233. [Google Scholar] [CrossRef]
- Miguel-Hidalgo, J.J. Astroglia in the Vulnerability to and Maintenance of Stress-Mediated Neuropathology and Depression. Front. Cell. Neurosci. 2022, 16, 869779. [Google Scholar] [CrossRef]
- De Oliveira Figueiredo, E.C.; Calì, C.; Petrelli, F.; Bezzi, P. Emerging Evidence for Astrocyte Dysfunction in Schizophrenia. Glia 2022, 70, 1585–1604. [Google Scholar] [CrossRef]
- Russo, F.B.; Freitas, B.C.; Pignatari, G.C.; Fernandes, I.R.; Sebat, J.; Muotri, A.R.; Beltrão-Braga, P.C.B. Modeling the Interplay Between Neurons and Astrocytes in Autism Using Human Induced Pluripotent Stem Cells. Biological Psychiatry 2018, 83, 569–578. [Google Scholar] [CrossRef]
- Vakilzadeh, G.; Martinez-Cerdeño, V. Pathology and Astrocytes in Autism. Neuropsychiatr Dis Treat 2023, 19, 841–850. [Google Scholar] [CrossRef]
- Gould, T.D.; Gottesman, I.I. Psychiatric Endophenotypes and the Development of Valid Animal Models. Genes Brain Behav 2006, 5, 113–119. [Google Scholar] [CrossRef]
- Neumann, I.D.; Wegener, G.; Homberg, J.R.; Cohen, H.; Slattery, D.A.; Zohar, J.; Olivier, J.D.A.; Mathé, A.A. Animal Models of Depression and Anxiety: What Do They Tell Us about Human Condition? Progress in Neuro-Psychopharmacology and Biological Psychiatry 2011, 35, 1357–1375. [Google Scholar] [CrossRef]
- Di Benedetto, B.; Malik, V.A.; Begum, S.; Jablonowski, L.; Gómez-González, G.B.; Neumann, I.D.; Rupprecht, R. Fluoxetine Requires the Endfeet Protein Aquaporin-4 to Enhance Plasticity of Astrocyte Processes. Front. Cell. Neurosci. 2016, 10. [Google Scholar] [CrossRef]
- Malik, V.A.; Zajicek, F.; Mittmann, L.A.; Klaus, J.; Unterseer, S.; Rajkumar, S.; Pütz, B.; Deussing, J.M.; Neumann, I.D.; Rupprecht, R.; et al. GDF15 Promotes Simultaneous Astrocyte Remodeling and Tight Junction Strengthening at the Blood–Brain Barrier. J of Neuroscience Research 2020, 98, 1433–1456. [Google Scholar] [CrossRef]
- Akdemir, E.S.; Huang, A.Y.-S.; Deneen, B. Astrocytogenesis: Where, When, and How. F1000Res 2020, 9, 233. [Google Scholar] [CrossRef]
- Raponi, E.; Agenes, F.; Delphin, C.; Assard, N.; Baudier, J.; Legraverend, C.; Deloulme, J.-C. S100B Expression Defines a State in Which GFAP-Expressing Cells Lose Their Neural Stem Cell Potential and Acquire a More Mature Developmental Stage. Glia 2007, 55, 165–177. [Google Scholar] [CrossRef]
- Bandeira, F.; Lent, R.; Herculano-Houzel, S. Changing Numbers of Neuronal and Non-Neuronal Cells Underlie Postnatal Brain Growth in the Rat. Proc. Natl. Acad. Sci. U.S.A. 2009, 106, 14108–14113. [Google Scholar] [CrossRef]
- Milbocker, K.A.; Campbell, T.S.; Collins, N.; Kim, S.; Smith, I.F.; Roth, T.L.; Klintsova, A.Y. Glia-Driven Brain Circuit Refinement Is Altered by Early-Life Adversity: Behavioral Outcomes. Front. Behav. Neurosci. 2021, 15, 786234. [Google Scholar] [CrossRef]
- Chugani, H.T. A Critical Period of Brain Development: Studies of Cerebral Glucose Utilization with PET. Preventive Medicine 1998, 27, 184–188. [Google Scholar] [CrossRef]
- Juraska, J.M.; Willing, J. Pubertal Onset as a Critical Transition for Neural Development and Cognition. Brain Research 2017, 1654, 87–94. [Google Scholar] [CrossRef]
- Bushong, E.A.; Martone, M.E.; Ellisman, M.H. Maturation of Astrocyte Morphology and the Establishment of Astrocyte Domains during Postnatal Hippocampal Development. Int. j. dev. neurosci. 2004, 22, 73–86. [Google Scholar] [CrossRef]
- Allen, N.J.; Eroglu, C. Cell Biology of Astrocyte-Synapse Interactions. Neuron 2017, 96, 697–708. [Google Scholar] [CrossRef]
- Perez-Catalan, N.A.; Doe, C.Q.; Ackerman, S.D. The Role of Astrocyte-Mediated Plasticity in Neural Circuit Development and Function. Neural Dev 2021, 16, 1. [Google Scholar] [CrossRef]
- Cahoy, J.D.; Emery, B.; Kaushal, A.; Foo, L.C.; Zamanian, J.L.; Christopherson, K.S.; Xing, Y.; Lubischer, J.L.; Krieg, P.A.; Krupenko, S.A.; et al. A Transcriptome Database for Astrocytes, Neurons, and Oligodendrocytes: A New Resource for Understanding Brain Development and Function. J. Neurosci. 2008, 28, 264–278. [Google Scholar] [CrossRef]
- Chung, W.-S.; Clarke, L.E.; Wang, G.X.; Stafford, B.K.; Sher, A.; Chakraborty, C.; Joung, J.; Foo, L.C.; Thompson, A.; Chen, C.; et al. Astrocytes Mediate Synapse Elimination through MEGF10 and MERTK Pathways. Nature 2013, 504, 394–400. [Google Scholar] [CrossRef]
- Iram, T.; Ramirez-Ortiz, Z.; Byrne, M.H.; Coleman, U.A.; Kingery, N.D.; Means, T.K.; Frenkel, D.; El Khoury, J. Megf10 Is a Receptor for C1Q That Mediates Clearance of Apoptotic Cells by Astrocytes. J. Neurosci. 2016, 36, 5185–5192. [Google Scholar] [CrossRef]
- Lee, J.-H.; Kim, J.; Noh, S.; Lee, H.; Lee, S.Y.; Mun, J.Y.; Park, H.; Chung, W.-S. Astrocytes Phagocytose Adult Hippocampal Synapses for Circuit Homeostasis. Nature 2021, 590, 612–617. [Google Scholar] [CrossRef]
- Roeper, J. Closing Gaps in Brain Disease — from Overlapping Genetic Architecture to Common Motifs of Synapse Dysfunction. Current Opinion in Neurobiology 2018, 48, 45–51. [Google Scholar] [CrossRef]
- Blokland, G.A.M.; Grove, J.; Chen, C.-Y.; Cotsapas, C.; Tobet, S.; Handa, R.; St Clair, D.; Lencz, T.; Mowry, B.J.; Periyasamy, S.; et al. Sex-Dependent Shared and Nonshared Genetic Architecture Across Mood and Psychotic Disorders. Biological Psychiatry 2022, 91, 102–117. [Google Scholar] [CrossRef]
- Seedat, S.; Scott, K.M.; Angermeyer, M.C.; Berglund, P.; Bromet, E.J.; Brugha, T.S.; Demyttenaere, K.; de Girolamo, G.; Haro, J.M.; Jin, R.; et al. Cross-National Associations Between Gender and Mental Disorders in the World Health Organization World Mental Health Surveys. Arch Gen Psychiatry 2009, 66, 785. [Google Scholar] [CrossRef] [PubMed]
- Drzewiecki, C.M.; Juraska, J.M. The Structural Reorganization of the Prefrontal Cortex during Adolescence as a Framework for Vulnerability to the Environment. Pharmacology Biochemistry and Behavior 2020, 199, 173044. [Google Scholar] [CrossRef] [PubMed]
- Glantz, L.A.; Gilmore, J.H.; Hamer, R.M.; Lieberman, J.A.; Jarskog, L.F. Synaptophysin and Postsynaptic Density Protein 95 in the Human Prefrontal Cortex from Mid-Gestation into Early Adulthood. Neuroscience 2007, 149, 582–591. [Google Scholar] [CrossRef] [PubMed]
- Markham, J.A.; Morris, J.R.; Juraska, J.M. Neuron Number Decreases in the Rat Ventral, but Not Dorsal, Medial Prefrontal Cortex between Adolescence and Adulthood. Neuroscience 2007, 144, 961–968. [Google Scholar] [CrossRef]
- Stoppini, L.; Buchs, P.-A.; Muller, D. A Simple Method for Organotypic Cultures of Nervous Tissue. Journal of Neuroscience Methods 1991, 37, 173–182. [Google Scholar] [CrossRef]
- Stoppini, L.; Buchs, P.-A.; Brun, R.; Muller, D.; Duport, S.; Parisi, L.; Seebeck, T. Infection of Organotypic Slice Cultures from Rat Central Nervous Tissue with Trypanosoma Brucei Brucei. International Journal of Medical Microbiology 2000, 290, 105–113. [Google Scholar] [CrossRef] [PubMed]
- Muller, D.; Buchs, P.-A.; Stoppini, L. Time Course of Synaptic Development in Hippocampal Organotypic Cultures. Developmental Brain Research 1993, 71, 93–100. [Google Scholar] [CrossRef]
- Lancaster, M.A.; Knoblich, J.A. Generation of Cerebral Organoids from Human Pluripotent Stem Cells. Nat Protoc 2014, 9, 2329–2340. [Google Scholar] [CrossRef] [PubMed]
- Kyrousi, C.; Cappello, S. Using Brain Organoids to Study Human Neurodevelopment, Evolution and Disease. WIREs Dev Biol 2020, 9. [Google Scholar] [CrossRef]
- Humpel, C. Organotypic Brain Slice Cultures: A Review. Neuroscience 2015, 305, 86–98. [Google Scholar] [CrossRef]
- Kamikubo, Y.; Jin, H.; Zhou, Y.; Niisato, K.; Hashimoto, Y.; Takasugi, N.; Sakurai, T. Ex Vivo Analysis Platforms for Monitoring Amyloid Precursor Protein Cleavage. Front. Mol. Neurosci. 2023, 15, 1068990. [Google Scholar] [CrossRef]
- Humpel, C. Organotypic Brain Slice Cultures. Current Protocols in Immunology 2018, 123, e59. [Google Scholar] [CrossRef] [PubMed]
- Hezel, M.; Ebrahimi, F.; Koch, M.; Dehghani, F. Propidium Iodide Staining: A New Application in Fluorescence Microscopy for Analysis of Cytoarchitecture in Adult and Developing Rodent Brain. Micron 2012, 43, 1031–1038. [Google Scholar] [CrossRef] [PubMed]
- Staal, J.A.; Alexander, S.R.; Liu, Y.; Dickson, T.D.; Vickers, J.C. Characterization of Cortical Neuronal and Glial Alterations during Culture of Organotypic Whole Brain Slices from Neonatal and Mature Mice. PLoS ONE 2011, 6, e22040. [Google Scholar] [CrossRef]
- Huttenlocher, P.R.; Dabholkar, A.S. Regional Differences in Synaptogenesis in Human Cerebral Cortex. J. Comp. Neurol. 1997, 387, 167–178. [Google Scholar] [CrossRef]
- Petanjek, Z.; Judaš, M.; Šimić, G.; Rašin, M.R.; Uylings, H.B.M.; Rakic, P.; Kostović, I. Extraordinary Neoteny of Synaptic Spines in the Human Prefrontal Cortex. Proc. Natl. Acad. Sci. U.S.A. 2011, 108, 13281–13286. [Google Scholar] [CrossRef]
- Peter R., H. Synaptic Density in Human Frontal Cortex — Developmental Changes and Effects of Aging. Brain Research 1979, 163, 195–205. [Google Scholar] [CrossRef]
- Knickmeyer, R.C.; Styner, M.; Short, S.J.; Lubach, G.R.; Kang, C.; Hamer, R.; Coe, C.L.; Gilmore, J.H. Maturational Trajectories of Cortical Brain Development through the Pubertal Transition: Unique Species and Sex Differences in the Monkey Revealed through Structural Magnetic Resonance Imaging. Cerebral Cortex 2010, 20, 1053–1063. [Google Scholar] [CrossRef]
- Whitford, T.J.; Rennie, C.J.; Grieve, S.M.; Clark, C.R.; Gordon, E.; Williams, L.M. Brain Maturation in Adolescence: Concurrent Changes in Neuroanatomy and Neurophysiology. Hum. Brain Mapp. 2007, 28, 228–237. [Google Scholar] [CrossRef]
- Dosenbach, N.U.F.; Nardos, B.; Cohen, A.L.; Fair, D.A.; Power, J.D.; Church, J.A.; Nelson, S.M.; Wig, G.S.; Vogel, A.C.; Lessov-Schlaggar, C.N.; et al. Prediction of Individual Brain Maturity Using fMRI. Science 2010, 329, 1358–1361. [Google Scholar] [CrossRef]
- Doussau, F.; Dupont, J.-L.; Neel, D.; Schneider, A.; Poulain, B.; Bossu, J.L. Organotypic Cultures of Cerebellar Slices as a Model to Investigate Demyelinating Disorders. Expert Opinion on Drug Discovery 2017, 12, 1011–1022. [Google Scholar] [CrossRef]
- Hurtado De Mendoza, T.; Balana, B.; Slesinger, P.A.; Verma, I.M. Organotypic Cerebellar Cultures: Apoptotic Challenges and Detection. JoVE 2011, 2564. [Google Scholar] [CrossRef]
- Kapfhammer, J.P. Cerebellar Slice Cultures. In Protocols for Neural Cell Culture; Doering, L.C., Ed.; Springer Protocols Handbooks; Humana Press: Totowa, NJ, 2009; pp. 285–298. ISBN 978-1-60761-291-9. [Google Scholar]
- Michaelson, S.D.; Müller, T.M.; Bompolaki, M.; Miranda Tapia, A.P.; Villarroel, H.S.; Mackay, J.P.; Balogun, P.J.; Urban, J.H.; Colmers, W.F. Long-Lived Organotypic Slice Culture Model of the Rat Basolateral Amygdala. Current Protocols 2021, 1. [Google Scholar] [CrossRef]
- Sengpiel, F. The Critical Period. Current Biology 2007, 17, R742–R743. [Google Scholar] [CrossRef]
- Singh, T.D.; Park, S.-Y.; Bae, J.; Yun, Y.; Bae, Y.-C.; Park, R.-W.; Kim, I.-S. MEGF10 Functions as a Receptor for the Uptake of Amyloid-β. FEBS Letters 2010, 584, 3936–3942. [Google Scholar] [CrossRef]
- Guirado, R.; Perez-Rando, M.; Ferragud, A.; Gutierrez-Castellanos, N.; Umemori, J.; Carceller, H.; Nacher, J.; Castillo-Gómez, E. A Critical Period for Prefrontal Network Configurations Underlying Psychiatric Disorders and Addiction. Front. Behav. Neurosci. 2020, 14, 51. [Google Scholar] [CrossRef]
- Benediktsson, A.M.; Schachtele, S.J.; Green, S.H.; Dailey, M.E. Ballistic Labeling and Dynamic Imaging of Astrocytes in Organotypic Hippocampal Slice Cultures. Journal of Neuroscience Methods 2005, 141, 41–53. [Google Scholar] [CrossRef]
- Rooney, B.; Leng, K.; McCarthy, F.; Rose, I.V.L.; Herrington, K.A.; Bax, S.; Chin, M.Y.; Fathi, S.; Leonetti, M.; Kao, A.W.; et al. mTOR Controls Neurotoxic Lysosome Exocytosis in Inflammatory Reactive Astrocytes; Cell Biology. 2021. [Google Scholar]
- Arora, T.; Mehta, A.K.; Joshi, V.; Mehta, K.D.; Rathor, N.; Mediratta, P.K.; Sharma, K.K. Substitute of Animals in Drug Research: An Approach Towards Fulfillment of 4R’s. Indian J Pharm Sci 2011, 73, 1–6. [Google Scholar] [CrossRef]
Figure 1.
Progressive expression of MEGF10 and synaptic markers during the cortical critical period in male and female littermates. (A) Representative graphs from the Rat Brain Atlas to show areas of tissue dissected for Western blots. (B,D,F) For males, representative lanes were cropped from immunoblots to show changes in MEGF10 (B) PSD95 (D) and synaptophysin (F) from isolated cortices of male pups at postnatal day (P) 7, 14, 21 and 32. Full blots are shown in Supplementary Figure 1. (C,E,G) Quantitative analysis of total MEGF10 (C), PSD95 (E) and synaptophysin (G) protein expression normalized to β-actin (for MEGF10) and cofilin (for PSD95 and synaptophysin) in male pups at different developmental stages. Each dot represents one animal. Statistical analysis was performed via one-way ANOVA, Tukey´s multiple comparison, ns, not significant; *p< 0.05; **p< 0.01; ***p<0.001; ****p<0.0001. (H,J,L) For females, representative lanes were cropped from immunoblots of MEGF10 (H), PSD95 (J) and synaptophysin (L) from isolated PFC of female pups at postnatal day (P) 7, 14, 21 and 32. Full blots are shown in Supplementary Figure 1. (I,K,M) Quantitative analysis of total MEGF10 (I), PSD95 (K) and synaptophysin (M) protein expression normalized to β-actin (for MEGF10) and cofilin (for PSD95 and synaptophysin) in female pups at different developmental stages. Each dot represents one animal. Statistical analysis was performed via one-way ANOVA, Tukey´s multiple comparison, ns, not significant; *p< 0.05; **p< 0.01; ***p<0.001; ****p<0.0001. All data are presented as mean ± SD.
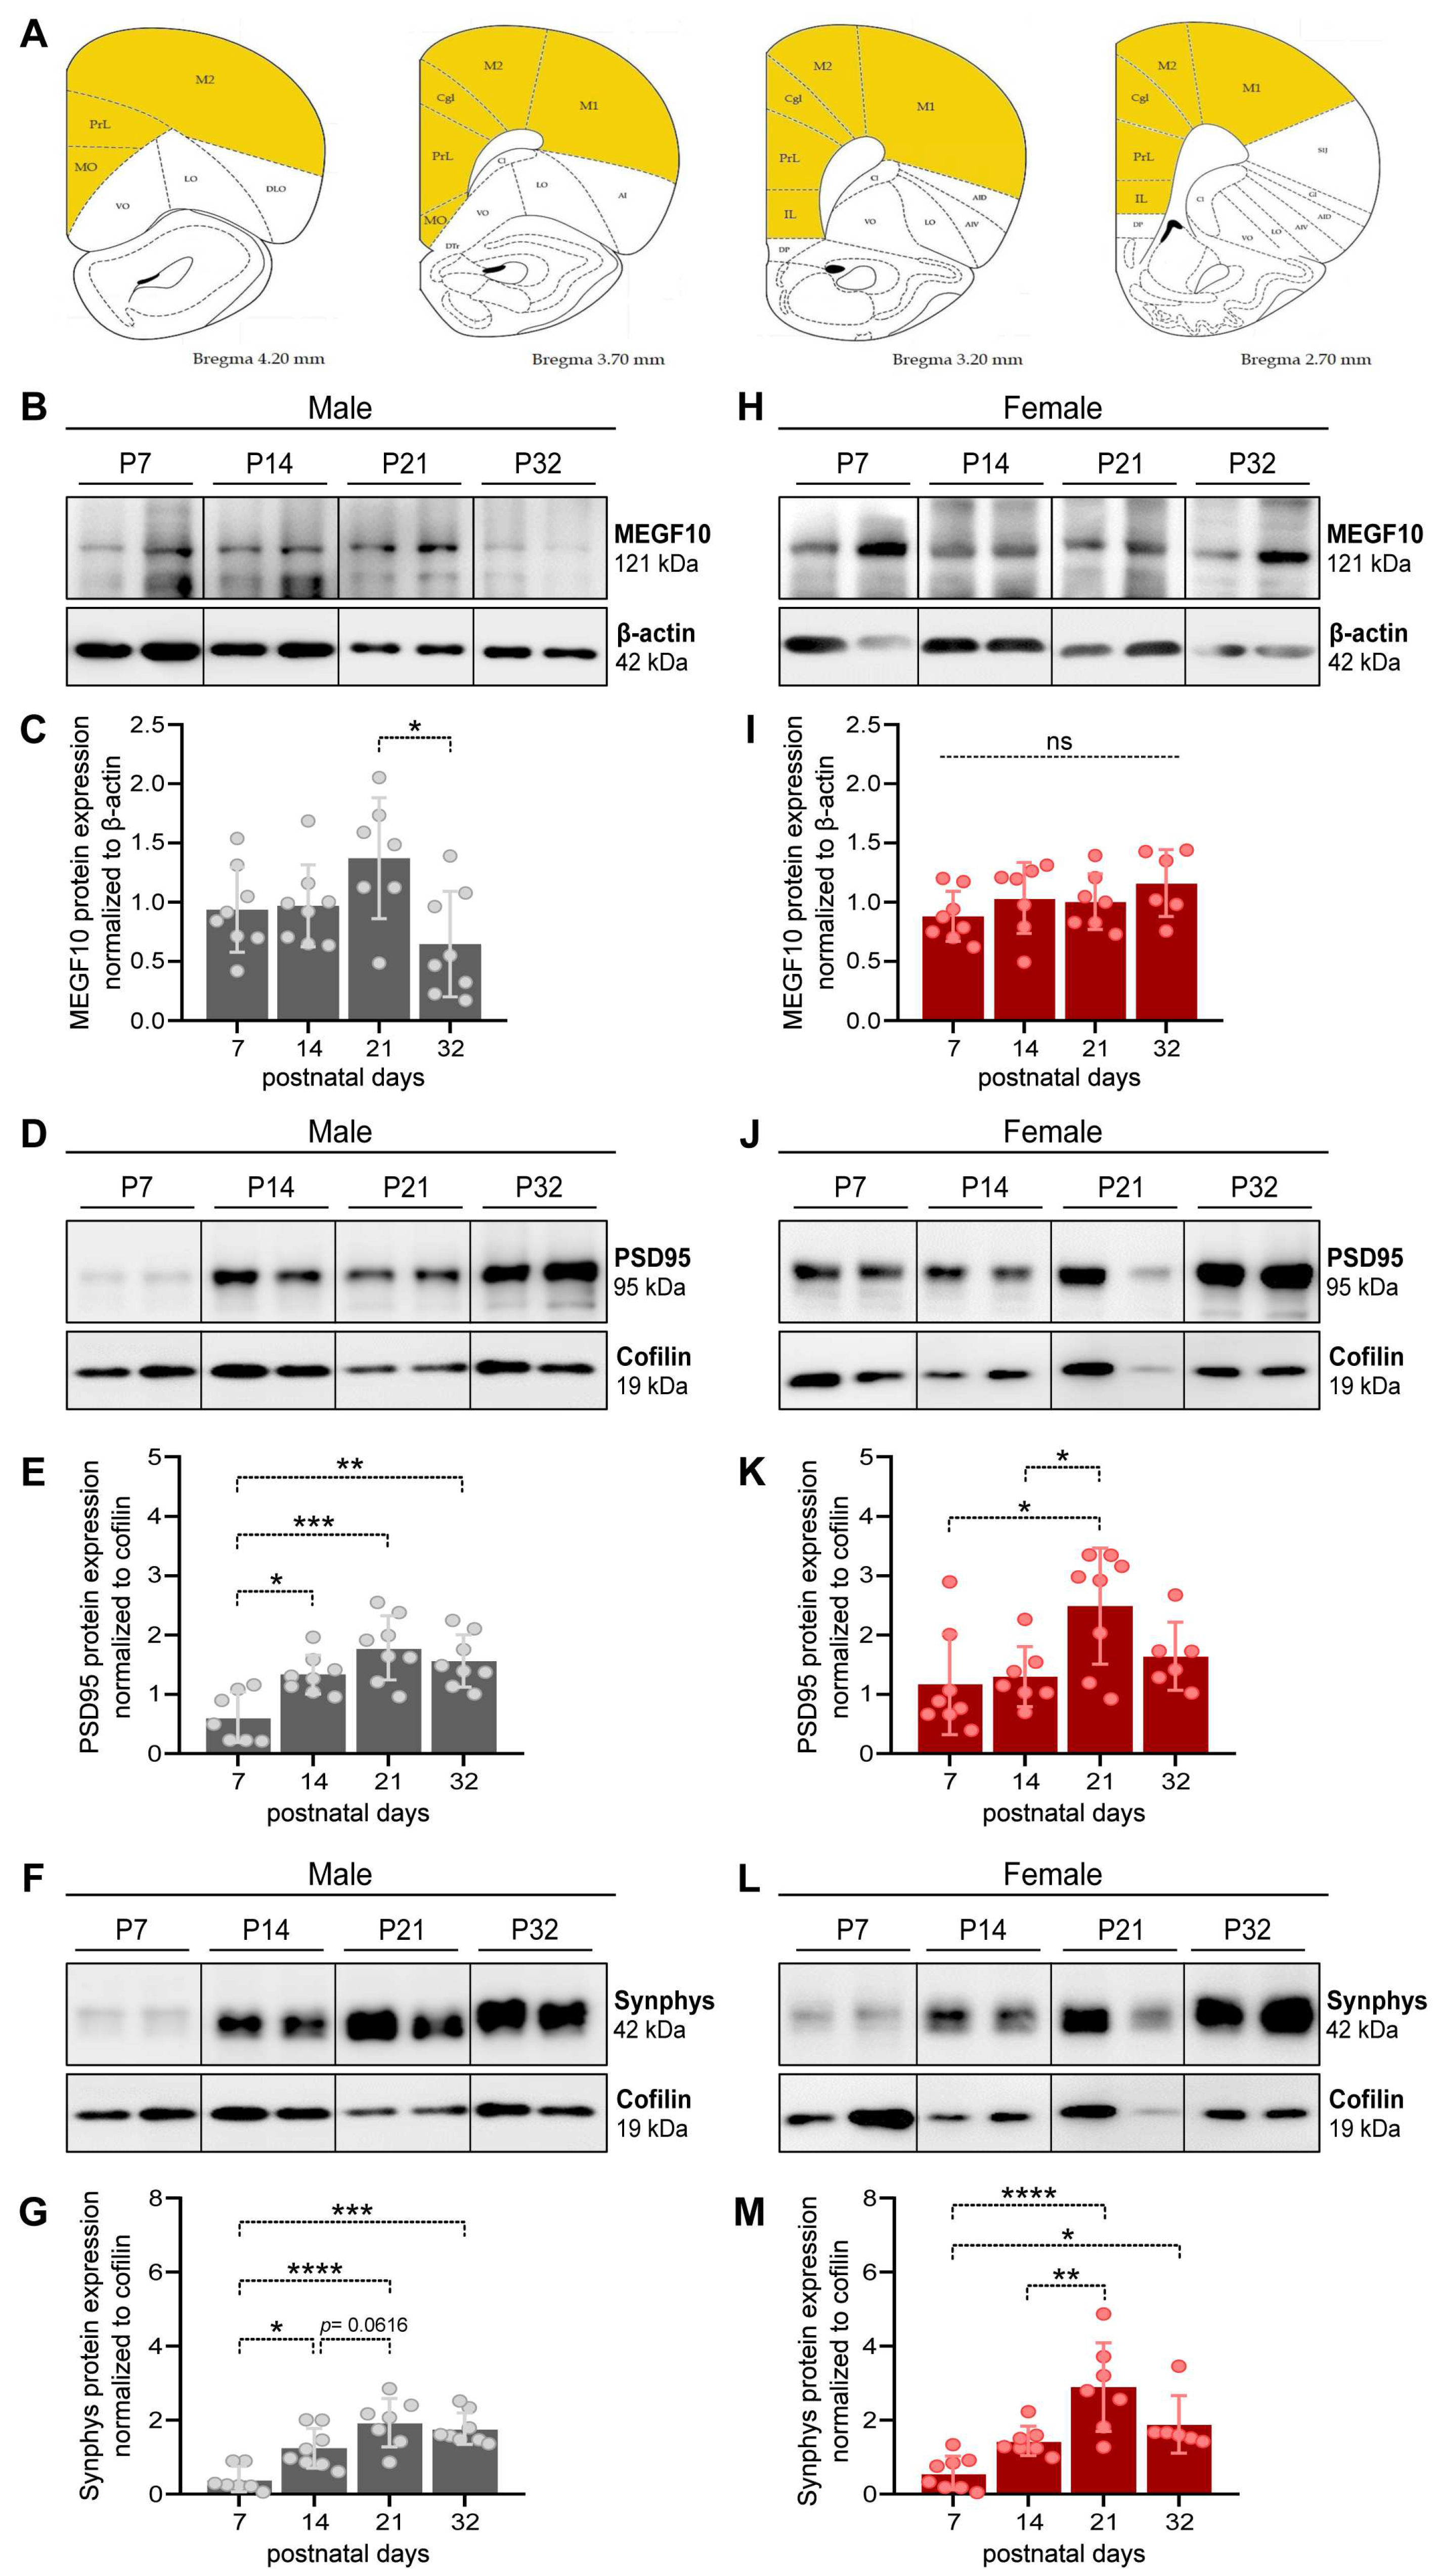
Figure 2.
Astrocyte-mediated synaptic pruning during developmental stages in male and female infralimbic/prelimbic areas of the PFC. (A) Representative graphs from the Rat Brain Atlas (46) to show areas of tissue labelled for immunofluorescent-immuhistochemistry and confocal imaging. (B) Representative confocal images of brain slices from male littermates labelled with GFAP/S100ß (astrocytes, magenta), synaptophysin (green) and LAMP1 (blue) at P7, 14, 21 and 32. Scale bar 10µm. (C) Representative confocal (upper panels) and Imaris surface-rendered (lower panels) images of analyzed male astrocytes (insets from B). In the 3D reconstructions, only LAMP1+ and synaptophysin+ spots inside the astrocyte volume are rendered. Scale bar 2µm. (D) Quantification of the engulfed synaptophysin spots within LAMP1 spots in astrocytes of the PFC normalized to the astrocyte volume at different postnatal developmental stages of male littermates. Each dot represents the average data of 6 analyzed astrocytes from each animal: n= 4 animals. One-way ANOVA, Tukey´s multiple comparison, *p< 0.05; **p< 0.01; ****p< 0.0001. (E) Representative confocal images of brain slices from female littermates labelled with GFAP/S100ß (astrocytes, magenta), synaptophysin (green) and LAMP1 (blue) at P7, 14, 21 and 32. Scale bar 10µm. (F) Representative confocal (upper panels) and Imaris surface-rendered (lower panels) images of analyzed female astrocytes (insets from E). In the 3D reconstructions, only LAMP1+ and synaptophysin+ spots inside the astrocyte volume are rendered. Scale bar 2µm. (G) Quantification of the engulfed synaptophysin spots within LAMP1 spots in astrocytes of the PFC normalized to the astrocyte volume at different postnatal developmental stages of female littermates. Each dot represents the average data of 6 analyzed astrocytes from each animal: n= 4 animals. One-way ANOVA, Tukey´s multiple comparison, **p< 0.01. All data are presented as mean ± SD.
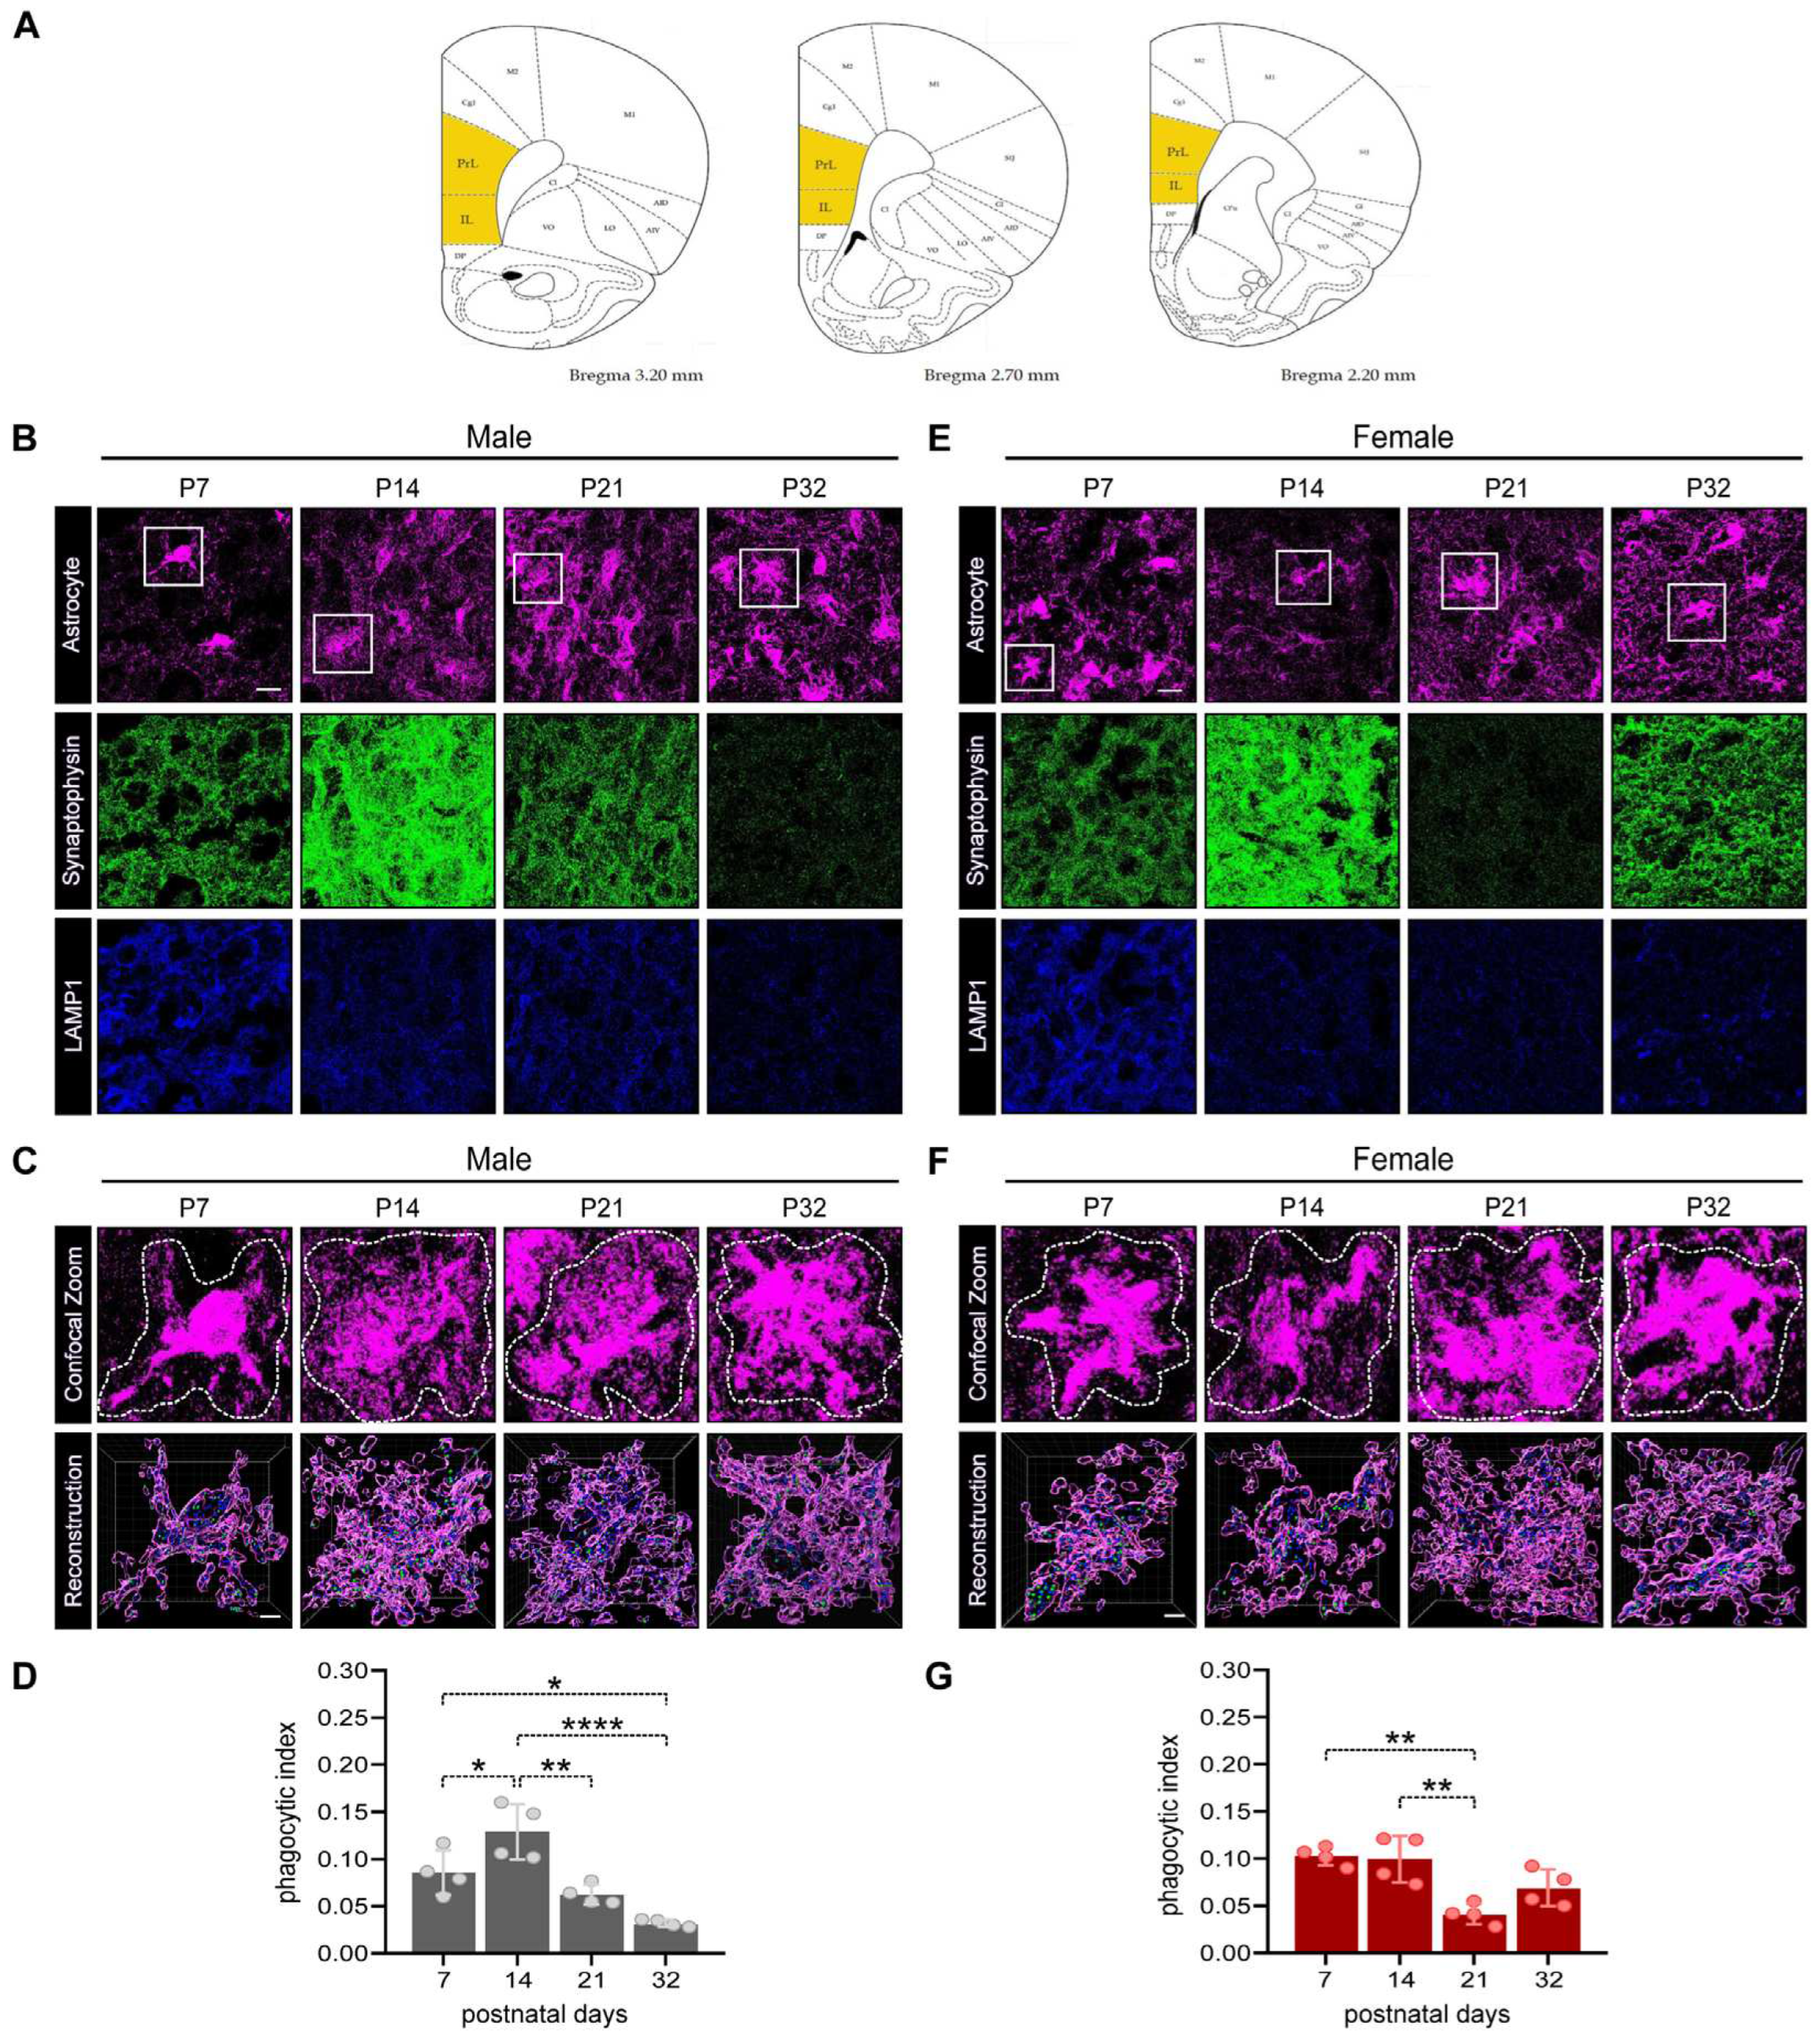
Figure 3.
Assessment of cell viability in organotypic brain slice culture (OBSCs). (A) Representative confocal images of selective cell death (red) in the prelimbic/limbic area of OBSCs at different timepoints: days in vitro (DIV) 0, 7, 14 and 21. Scale bar 200µm. (B) Quantification of cell death assessed by Propidium Iodide (PI) total fluorescence intensity normalized to DIV0. Each dot represents a single animal. Statistical analysis was performed via one-way ANOVA, Tukey´s multiple comparison, *p< 0.05; **p< 0.01. Data are presented as mean ± SD.
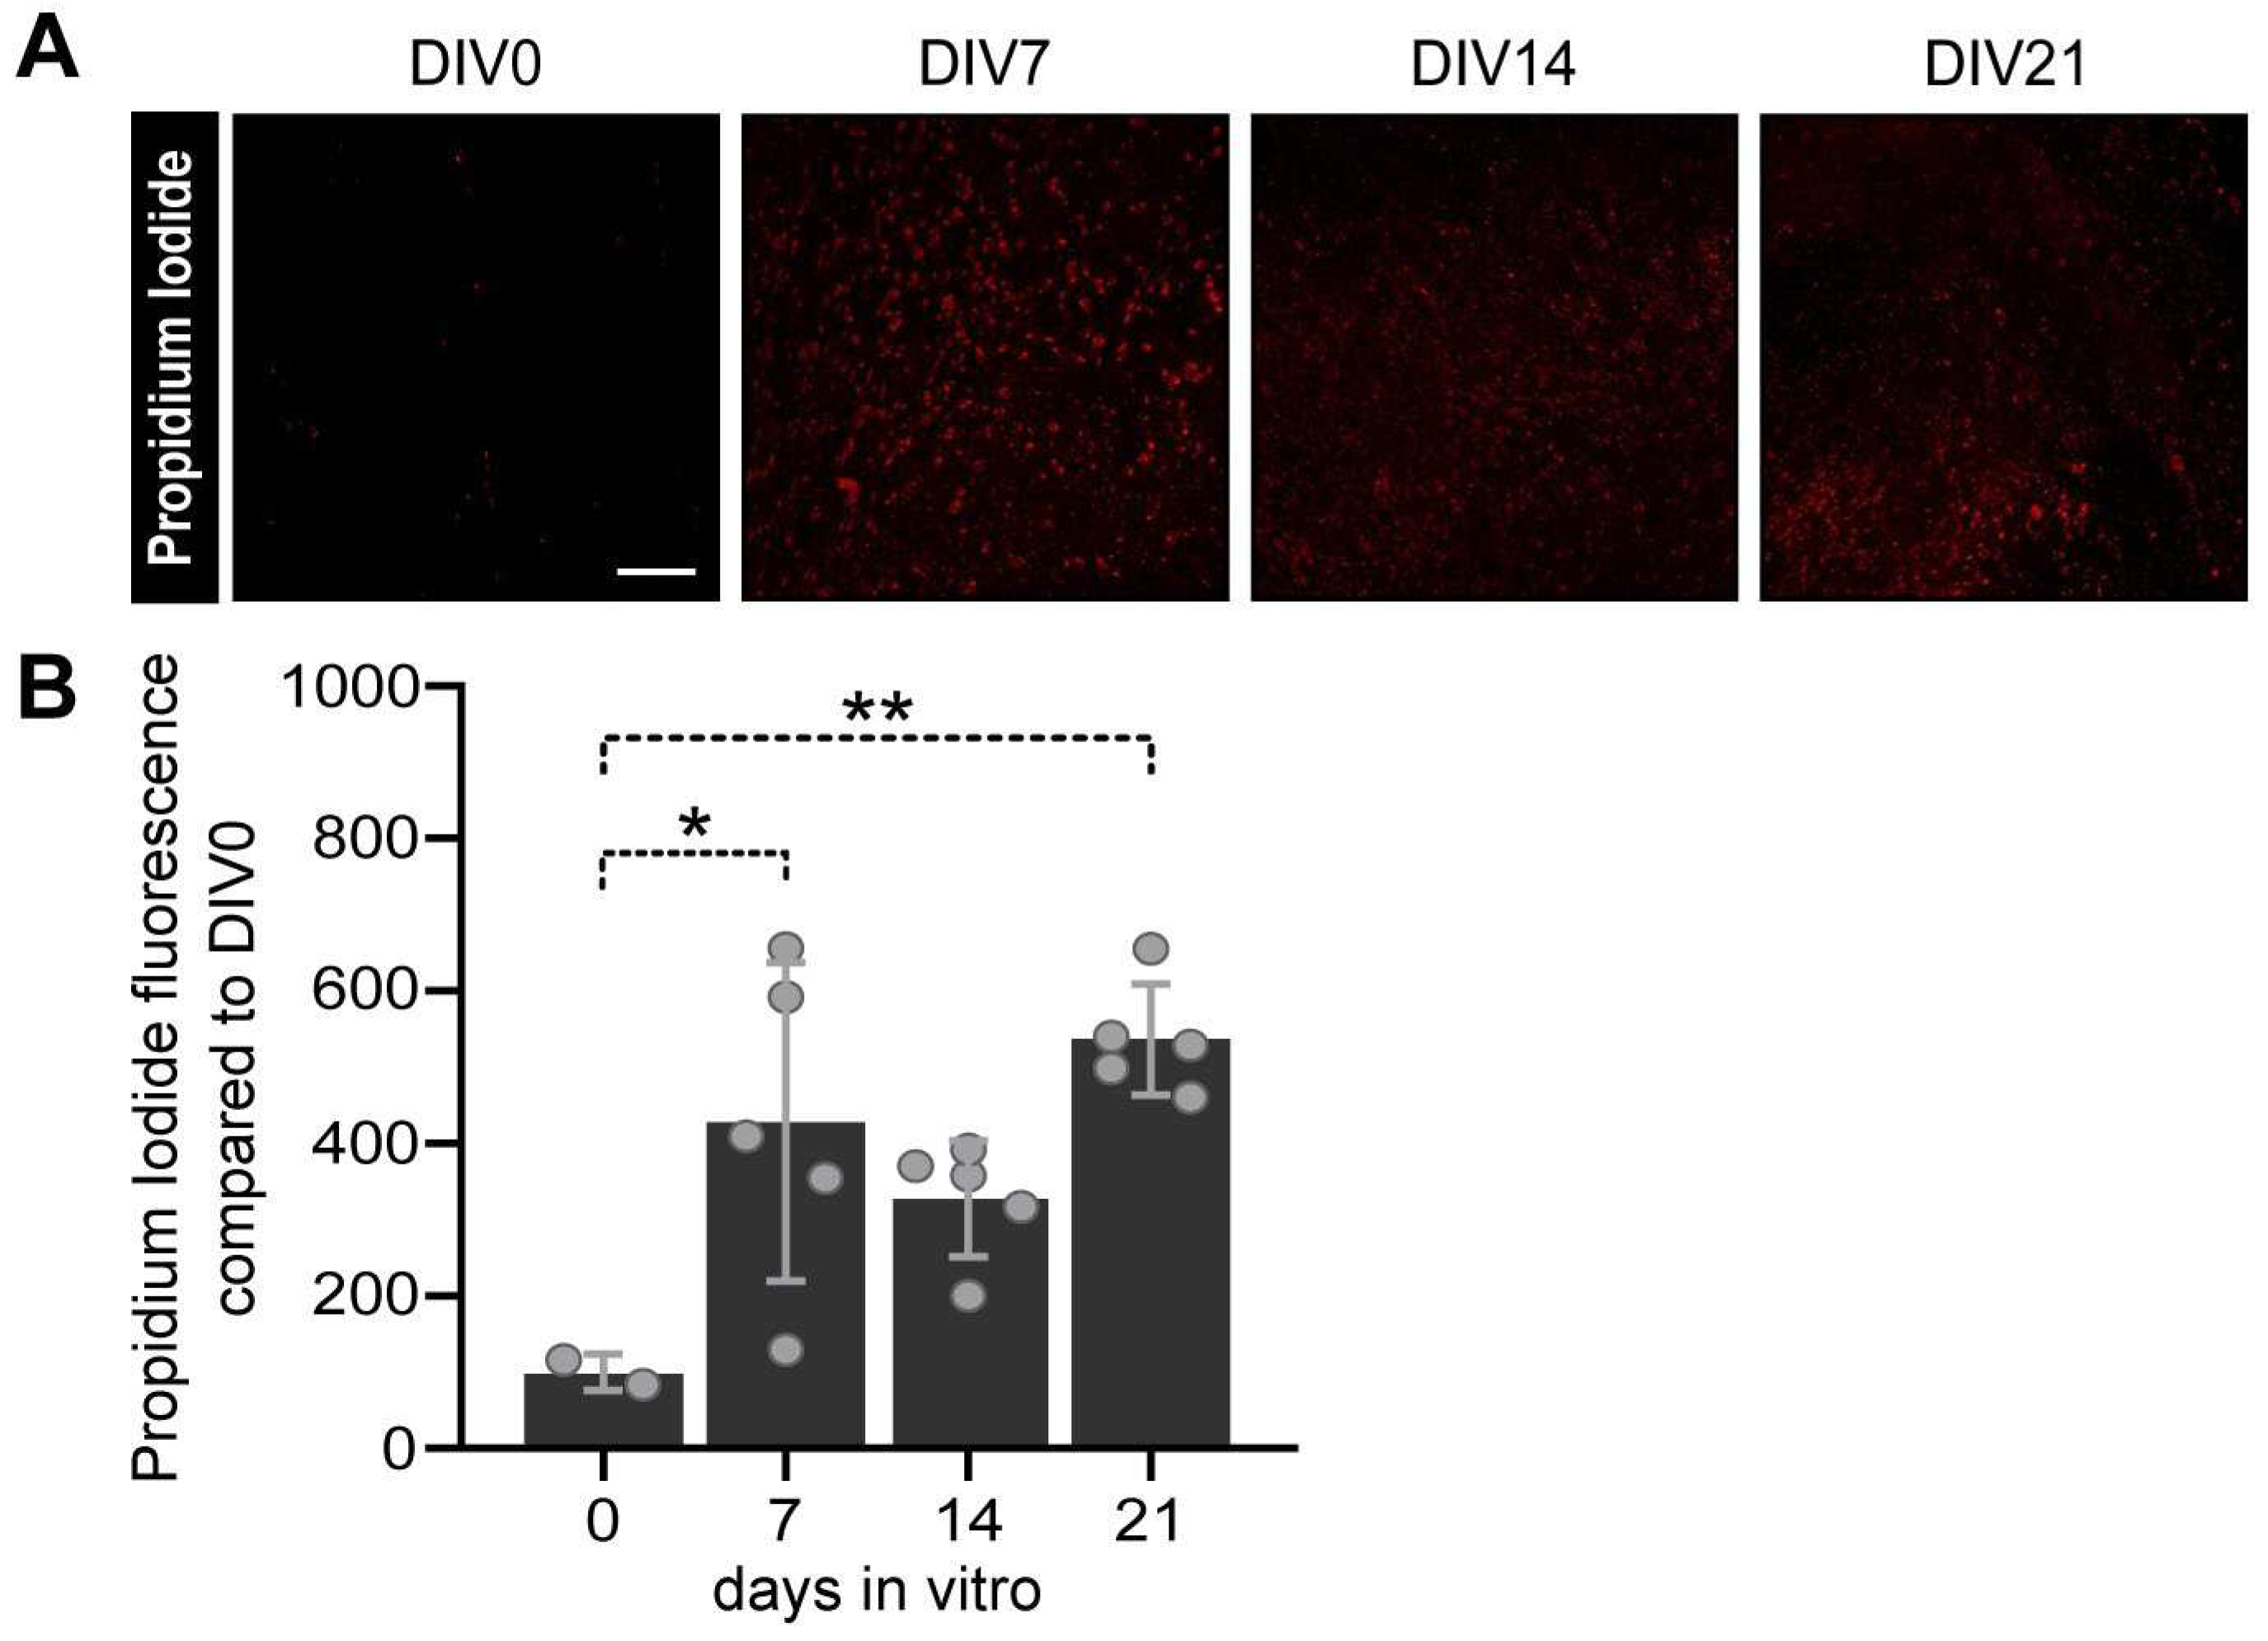
Figure 4.
MEGF10 expression in the cortex and astrocyte phagocytic capacity in infralimbic/prelimbic areas of the PFC of male and female OBSCs. (A) Representative lanes cropped from immunoblots show MEGF10 protein expression in the cortex isolated from male-derived OBSCs at DIV7, 14 and 21. Full blots are shown in Supplementary Figure 1. (B) Quantitative analysis of total MEGF10 protein expression normalized to β-actin in male-derived OBSCs at different timepoints. Each dot represents one animal, n=6-7 animals. Statistical analysis was performed via one-way ANOVA repeated measures, with Tukey´s multiple comparison, ns, not significant. (C) Representative confocal images of OBSCs labelled with GFAP (astrocytes, magenta), synaptophysin (green) and LAMP1 (blue) at DIV7, 14 and 21 in male-derived OBSCs. Scale bar 25µm. (D) Quantification of co-localized voxels positive for LAMP1, synaptophysin and GFAP. The phagocytic index is expressed as the ratio of “synphys+/LAMP1+/GFAP+” and “synphys+/LAMP1+” colocalized voxels. Each dot represents the average data of 5 pictures from one animal, n=3-5 animals. Statistical analysis was performed via one-way ANOVA repeated measures (mixed-effects), Tukey´s multiple comparison, *p< 0.05; **p< 0.01. All data are presented as mean ± SD. (E) Representative lanes cropped from immunoblots show MEGF10 protein expression in the cortex isolated from female-derived OBSCs at DIV7, 14 and 21. Full blots are shown in Supplementary Figure 1. (F) Quantitative analysis of total MEGF10 protein expression normalized to β-actin in female-derived OBSCs at different timepoints. Each dot represents one animal, n=5-7 animals. Statistical analysis was performed via one-way ANOVA repeated measures, Tukey´s multiple comparison, ns, not significant. (G) Representative confocal images of OBSCs labelled with GFAP (astrocytes, magenta), synaptophysin (green) and LAMP1 (blue) at DIV7, 14 and 21 in female-derived OBSCs. Scale bar 25µm. (H) Quantification of co-localized voxels positive for LAMP1, synaptophysin and GFAP. The phagocytic index is expressed as the ratio of “synphys+/LAMP1+/GFAP+” and “synphys+/LAMP1+” colocalized voxels. Each dot represents the average data of 5 pictures from each animal, n=4 animals. Statistical analysis was performed via one-way ANOVA repeated measures, Tukey´s multiple comparison, *p< 0.05; trend, p=0.0795. All data are presented as mean ± SD.
Disclaimer/Publisher’s Note: The statements, opinions and data contained in all publications are solely those of the individual author(s) and contributor(s) and not of MDPI and/or the editor(s). MDPI and/or the editor(s) disclaim responsibility for any injury to people or property resulting from any ideas, methods, instructions or products referred to in the content. |
© 2023 by the authors. Licensee MDPI, Basel, Switzerland. This article is an open access article distributed under the terms and conditions of the Creative Commons Attribution (CC BY) license (http://creativecommons.org/licenses/by/4.0/).
Copyright: This open access article is published under a Creative Commons CC BY 4.0 license, which permit the free download, distribution, and reuse, provided that the author and preprint are cited in any reuse.


