
Submitted:
18 June 2025
Posted:
19 June 2025
You are already at the latest version
Abstract
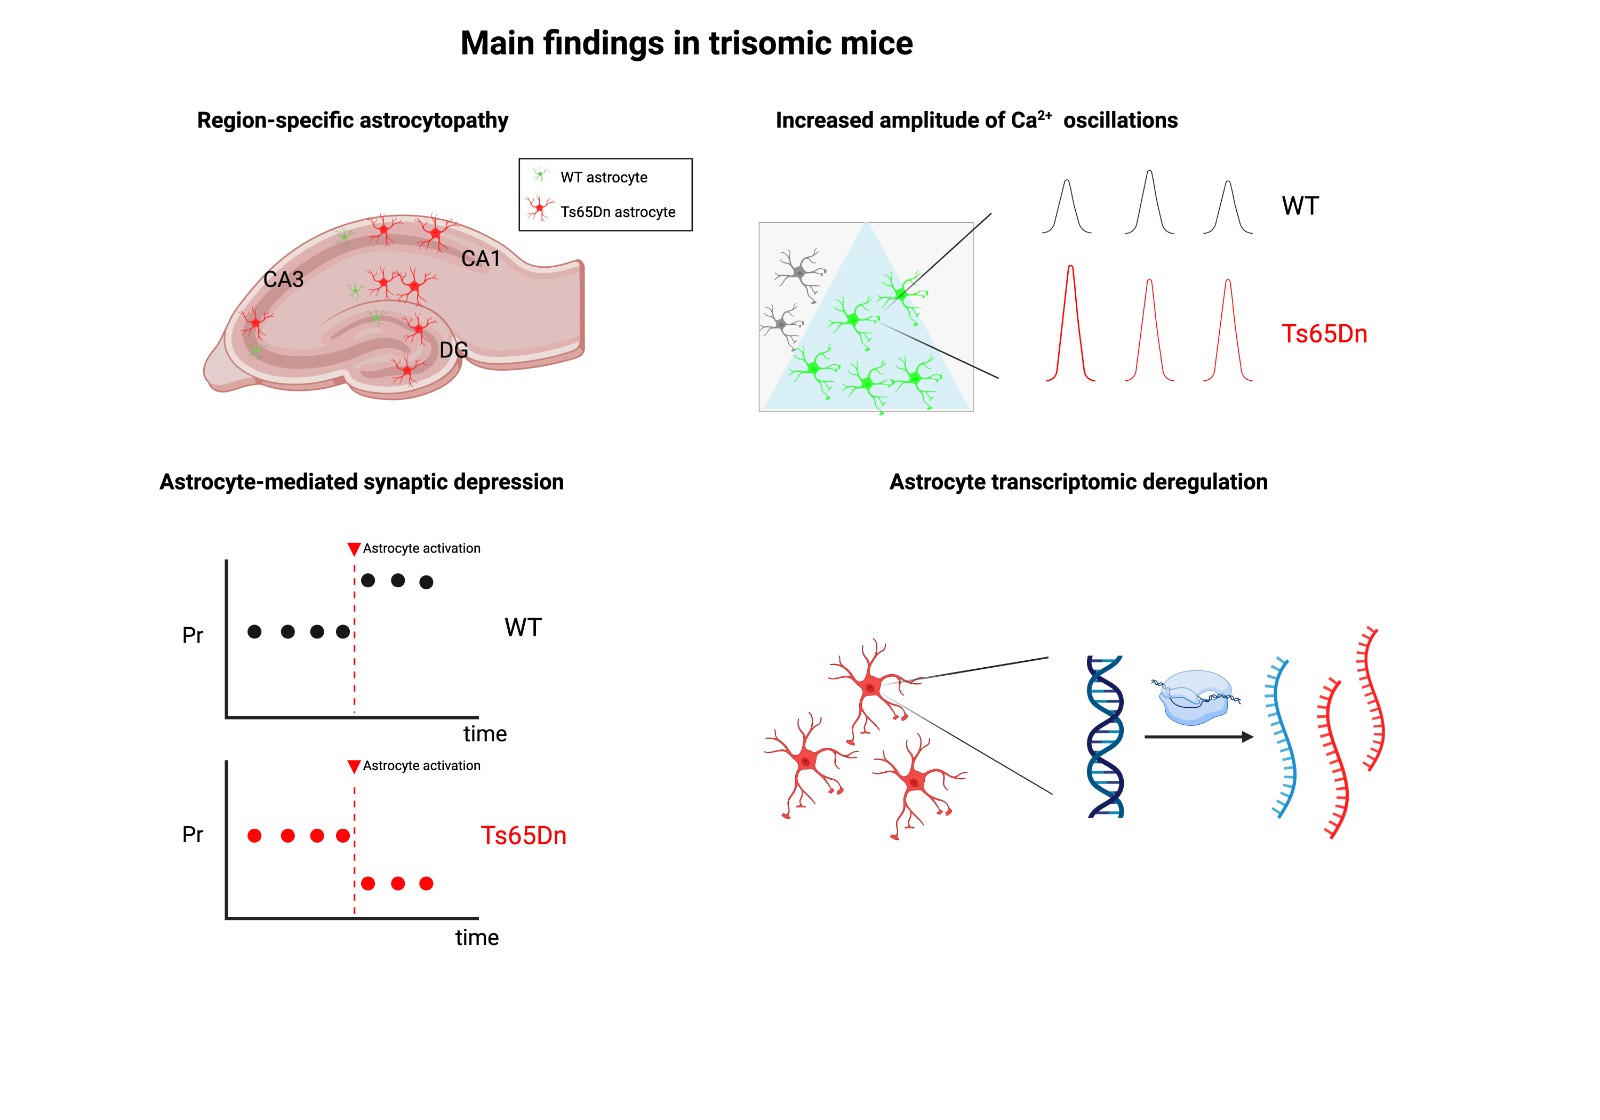
Brain pathophysiology in Down syndrome (DS), the most common genetic cause of intellectual disability, has traditionally been considered as a consequence of neuronal dysfunction. However, although it is well documented that astrocytes play a critical role in brain homeostasis, synaptic regulation, and neuronal support and their malfunction has been associated with the onset and progression of different neurological disorders only few studies have addressed whether astrocyte dysfunction can contribute to the DS pathophysiology. Astrocytes are increased in number and size, and show increased levels of expression of astroglial markers like S100β and GFAP. In this study, we detected a region-specific increase in astrocyte population in CA1, and to a lesser extent in the dentate gyrus. Single-nucleus transcriptomic profiling identified markers associated with reactive astroglia, synaptic transmission, and neuroinflammation in trisomic astrocytes. Functional analysis revealed abnormal Ca2+ oscillations in trisomic astrocytes, and impaired astrocyte-to-neuron communication in CA1, the most affected subregion, leading to astrocyte-mediated excitatory synaptic depression. Our findings demonstrate that astrocytes play an active and critical role in the pathophysiology of DS, not only as reactive responders to neuronal injury but as key contributors to the disease process itself. This astrocytic dysfunction presents a region-specific distribution within the hippocampus, suggesting localized vulnerability and complex glial involvement in DS-related neuropathology.
Keywords:
astrocytes
; Down syndrome
; astrocytopathy
; hippocampus
; astrocyte-neuron communication
; intellectual disability
1. Introduction
Astrocytes play critical roles in maintaining brain homeostasis, regulating synaptic activity [1,2]. and providing metabolic support to neurons [3,4]. Growing evidence suggests that astrocytic dysfunction contributes to the onset and progression of different neurodevelopmental and cognitive disorders [5]. Among these alterations, changes in the number, size, expression of astroglial proteins and transcriptomic changes have been widely described [6,7,8,9,10,11]. Down syndrome (DS) is a complex genetic disorder caused by the presence of an extra copy of chromosome 21. However, even though astroglial cells display pathological alterations across the lifespan of individuals with DS, the role of astrocytes in the pathophysiology of DS remains unknown.
Studies utilizing postmortem brain tissue from individuals with DS have shown that astrocytes are more numerous, larger, and express increased levels of astroglial markers (S100β, GFAP) [10,12]. In the hippocampus, DS fetuses have a greater fraction of cells with an astrocytic phenotype [13], indicating a neurogenic-to-gliogenic shift. This shift was confirmed in induced pluripotent stem cells (iPSCs) from monozygotic twins discordant for trisomy 21, in which trisomic cells showed increased expression of GFAP, S100β, and Vimentin [14]. Remarkably, S100β overexpression has been linked not only with impaired Ca2+ oscillations but also with reduced neuronal excitability in DS patient-derived iPSCs [15]. In addition to human studies, mouse models of DS have shown astroglial hypertrophy already in young trisomic mice, increased number of astrocytes and higher expression of GFAP in the hippocampus of aged Ts65Dn mice [6,16]. Altogether, these results suggest that in DS, astrocytopathy appears early during neurodevelopment and persists to adulthood. Yet, implications of a sustained astrocytopathy for neuronal communication and brain function are poorly understood.
We selected for our study the Ts65Dn mouse model, as it recapitulates many of the features found in DS. It includes trisomy for 125 human protein-coding orthologs, but the limitation is trisomic mice also carry a triplication of 43 coding genes which are non-orthologous to HSA21. This can complicate the interpretation of genotype-phenotype relationships and potentially mask or amplify certain DS-related phenotypes. Even so, Ts65Dn mice recapitulate most of the results shown in humans [17], and other models have limitations in husbandry, including difficulties in breeding and maintaining large colonies, or present increased prevalence of hydrocephalus [18].
In the hippocampus of young adult Ts65Dn male mice we detected a general increase in astrocyte somatic volume and elevated expression of S100β. The astrocyte cell density was not modified, except in CA1, where it was increased. We also detected aberrant Ca2+ oscillations, and altered neuronal synaptic activity upon selective activation of astrocytes by chemogenetics, indicating a functional impact of astrocyte dysfunction. Single nuclei RNAseq from control and Ts65Dn astrocytes revealed transcriptional changes related to cell proliferation, regulation of signaling, and synapse organization that may explain the structural and functional abnormalities observed.
Our results indicate that region-specific alterations in trisomic astrocytes might affect how astrocytes and neurons communicate in the Ts65Dn hippocampus and might contribute to cognitive impairments shown in Ts65Dn mice.
2. Materials and Methods
Animals
Ts(1716)65Dn/J (Ts65Dn; strain 005252) mice were obtained through crossings of a B6EiC3Sn a/A-Ts(1716)65Dn (Ts65Dn) female to B6C3F1/J males purchased from The Jackson Laboratory (Bar Harbor, USA). Genotyping was performed by amplifying genomic DNA obtained from the mice tail according to the Jackson Laboratory indications. Mice had access to food and water ad libitum in controlled laboratory conditions with temperature maintained at 22 ± 1ºC and humidity at 55 ± 10% on a 12h light/dark cycle (lights off 20:00h). Mice were housed in numbers of two to four littermates. The colony of Ts65Dn mice was maintained in the Animal Facility of the Barcelona Biomedical Research Park (PRBB, Barcelona, Spain). Experiments were performed according to Directive 63/2010 and Member States' implementation and followed the "Three Rs'' principle of replacement, reduction, and refinement. The investigation was conducted in accordance with the Standards for Use of Laboratory Animals No. A5388-01 (NIH) and local (Law 32/2007) and European regulations and protocols were approved by the Ethics Committee of Parc de Recerca Biomèdica (Comité Ético de Experimentación Animal del PRBB (CEEAPRBB); authorization number MDS 0040P2). A/ES/05/I-13 and A/ES/05/14 grant the CRG permission to work with genetically modified organisms..
All the experiments were conducted in male Ts65Dn mice. All mice were aged two months ± 2 weeks at the time of the experiment.
We used male Ts65Dn for different relevant reasons. In the first place, to minimize the number of animals required to conduct the study, adhering to ethical considerations in animal research. Additionally, it enabled us to compare our studies with existing literature in the field, which predominantly used male mice. In second place, by conducting this study in male mice, we minimized the experimental variability arising from hormonal fluctuations, as female sex hormones significantly influence astrocyte function, gene expression and Ca2+ dynamics [19,20,21,22]. Therefore we ensured that observed astrocyte dysfunction was directly attributable to trisomy rather than sex-specific differences. We acknowledge the importance of studying both sexes to better understand whether trisomic astrocyte dysfunction in the Ts65Dn hippocampus is contributed by sex differences. However, we believe that this initial exploratory study will serve as a foundation for future investigations that can delve into sex-specific differences of astrocyte dysfunction in DS.
Stereological Estimates
Tissue Preparation and Immunohistochemistry
For each experimental group, 40 μm coronal consecutive brain sections were obtained employing a vibratome (LeicaVT1200S). The first section was identified at the stereotaxic coordinate bregma -1.34 mm. This region was selected as the somatic layers of the hippocampus are clearly distinguishable. Previous studies in the laboratory showed that taking every 6th did not show significant differences in the coefficient of variation (CV) using a ANOVA one-way test. Therefore 6 sections per mice of the dorsal hippocampus were taken into consideration for stereological estimates according to stereotaxic coordinates: Bregma, -1.34 to -2.34 mm, regarding the mouse brain atlas [23] with the aid of a bright-field microscope (Zeiss Cell Observer HS).
Brain sections were washed with PBS (3x10’). Then, sections were permeabilized with 0.5 % Triton X-100 (Merck) in PBS (PBS-T 0.5 %) (3x15’) and blocked with 10% of Normal Goat Serum (NGS) for two hours at room temperature. Sections were incubated in PBS-T 0.5% and NGS 5 % with the primary antibodies overnight at 4ºC (mouse anti-NeuN 1:500, Merck-Millipore, #MAB377; and rabbit anti-S100β 1:1000, Synaptic systems, #287003). Slices were washed with PBS-T 0.5 % (3x15’) and incubated with the secondary antibodies (goat anti-mouse Alexa Fluor 555 for NeuN (1:500, Thermo Fisher Scientific, #A11001) and goat anti-rabbit 488 for S100β (1:500, Thermo Fisher Scientific, #A-11008)) in the incubation buffer (PBS-T 0.5 % + NGS 5 %) for two hours at room temperature protected from light. Finally, samples were washed with PBS-T 0.5 % (3x15’) followed by PBS washing (3x10’) to get rid of the detergent and sections were mounted and coverslipped into a pre-cleaned glass slide with mowiol mounting medium. Prior to immunostaining all the samples, an optimization of the primary antibodies and PBS-T conditions was performed with sections not needed for the estimations but sectioned with the same conditions. Serial dilutions of primary antibodies ranging from 1:100 to 1:1000 were prepared while maintaining the secondary antibody concentration constant (1:500). By confocal microscopy, the best primary antibody concentration was selected taking into account the achievement of low background noise and the signal level obtained with the same laser configuration.
Stereological Estimates
Stereological estimates were performed using a Leica DMI6000B inverted microscope (Leica Microsystems) equipped with a motorized stage, a microcator and a digital camera connected to a PC was used to obtain microscopic captures. Images were analyzed with the newCAST software (Version: 5.3.0.1562; Visiopharm Integrator System). All the estimations were performed single-blinded to avoid researcher bias.
Tissue Sampling and Stereological Methods
Mice were sacrificed with CO2 and transcardially perfused with ice-cold PBS followed by 4% PFA in PBS (pH 7.4). Brains were extracted and post-fixed in 4% PFA at 4ºC overnight. Brains were then transferred to PBS and 40 μm coronal consecutive brain sections were obtained using a vibratome (Leica VT1200S, Leica Microsystems), collected in PBS and stored in cryoprotective solution (40% PBS, 30%, glycerol and 30% polyethylene glycol) for long-term storage. Every 6th section was collected using the principle of systematic uniform random sampling. In total, six sections per mice were selected from bregma, -1.74 to -3.24 mm [23], with the aid of a bright-field microscope (Zeiss Cell Observer HS). We next followed the immunohistochemistry protocol previously described to stain and visualize astrocytes and neurons.
In order to precisely quantify the number of neurons and astrocytes in the different regions of the dorsal hippocampus we used stereology, a technique that utilizes stringent sampling methods to obtain three-dimensional information about the entire tissue that is unbiased. Although 2D morphometry can provide quantitative information about the tissue sections being examined, it also makes several assumptions about the tissue, all of which are sources of bias, and can thus only be used in specific cases. Given the high neuronal density in CA1 and in the DG, stereological methods such as the Optical Disector prevent double-counting and precisely correct for the tridimensional volume of the region of study.
Prior to starting any stereological quantification, a quality check was performed in every section based on our expectations for global hippocampal architecture and specific immunostaining patterns. All the estimations were performed in one hemisphere, randomly chosen. Stereological estimates were performed in concrete ROIs of the hippocampus. Regions of interest were manually delineated according to the Franklin & Paxinos, and the immunohistochemistry labeling (see below). For astrocytic and neuronal populations 63x Oil 1.4 numerical aperture (NA) lens objective was required to resolve fine details in order to be able to: (i) differentiate neurons inside a high density of cells (i.e CA1 and DG) and (ii) clearly distinguish between somatic and astrocytic processes when moving through the z-axis.
Regional Volume Estimation of Hippocampal Subregions
Volume estimation of the selected ROIs (CA1, CA3 and DG somatic and dendritic layers) was calculated according to the Cavalieri principle as it provides an estimate of the volume of any object when it is divided into parallel cross sections. ROIs were selected according to anatomic boundaries following Franklin and Paxinos mouse brain atlas [23]. At least 200 points of known area were required in each ROI to obtain accurate volume estimations. For this reason, a specific point configuration was configured to ensure that more than 200 points in total were counted for every ROI across all the selected slices. For the Cavalieri estimation, the area of each ROI was 100 % covered.
Volume estimation for the whole ROI and for every slice was calculated according to this formula:
where:
Volume = T x a(p) x Σ P
T = spacing between sections
a(p) = area per point given by each specific configuration.
Σ P = sum of points inside the ROI.
Quantification of Neurons and Astrocytes
Optical Disector (OD) uses thick sections and a microcator that allows focusing through the z-axis of the section to count cells directly as they appear in an unbiased tridimensional counting frame (CF). For every region of interest, the percentage of the total sampling area was adjusted to obtain from 21-24 CFs. This range was established for two reasons: (i) fixing the same sampling area for every ROI can lead to biased results as hippocampal subregions vary across the anteroposterior axis and (ii) this CF range covers a representative area of each structure and is superior to the values found in the literature, which ensures a reliable estimation [24]. Real thickness of the planar sections was calculated for every section to avoid biased assumptions and adjusting the tridimensional CF accordingly, as tissue is usually shrinked after histological fixation. CFs were uniform and randomly sampled across each ROI. CF zero position was set when the first cell became clear to vision meaning the top view of the histological preparation. Cells were only counted if the nucleus was clearly visible inside the disector along the z-axis section or touching the inclusion lines (right and upper border), otherwise neurons or astrocytes were discarded.
Zero μm position was set when the first cell became clear to vision e.g. the top view of the histological preparation. Cells were only counted if the nucleus was clearly visible inside the disector along the z-axis section or touching the inclusion lines (right and upper border), otherwise neurons were discarded. Each time that the upper right corner of the CF was inside the delineated ROI, a corner point (CP) mark was introduced to the counting meaning that the CF was hitting the reference tissue. Once a CF was quantified, the microscope returned to the zero position and the CF went to the next sampling position. To avoid potential double counting, the optical plane was moved throughout the whole thickness of the preparation section to ensure correct cell identification. Cell densities were calculated according the Nv formula [25]:
where:
tQ-: is the number-weighted mean section thickness.
BA: Block Advance: the cut thickness of the section on a calibrated cutting device.
h: disector height.
(a/p): a is the area of the CF and p the number of points associated with the frame (1 - using the upper right corner of the CF).
Σ P: is the sum of corner points hitting reference tissue.
The total number of cells (N) was estimated by the product of the cell density (Nv) and the volume (Vref) obtained from Cavalieri estimations:
N = Vref x Nv
CF dimensions were adjusted based on the lens objective used and the surface of a specific area to cover. For the somatic layers of the neuronal population the frame was adjusted to cover 5% of the area of the field of view given for the 63x Oil objective.
Estimation of Astroglial Volume
In order to estimate astroglia volume, we utilized the S100β marker since it is mainly expressed in the astrocyte soma. We followed the immunohistochemistry protocol previously described to stain S100ꞵ with rabbit anti-S100ꞵ (1:1000, Synaptic systems; #287003) and was visualized with goat anti-rabbit Alexa-555 (1:500, Thermo Fisher Scientific, #A-32732). Confocal fluorescence images were acquired at 20x magnification on a Leica TCS SP5 inverted scanning laser microscope creating a composite image of the entire dorsal hippocampus at 16 bits. Tissue was only exposed to the lasers during the moment of image acquisition to prevent photobleaching. To minimize quenching of fluorescence, z-stacks were rapidly scanned at 1 µm increments. After image acquisition, stitched images of the dorsal hippocampus were converted to binary masks using ImageJ (Supplementary Figure 2AB). To estimate the size of astroglial somas, the somatic area was semi-automatically identified in every plane and the volume was calculated using the Cavalieri estimator (Supplementary Figure 2C-E):
where:
Volume = ∑(A) x n x T
A = area of an astrocyte in a single plane (in µm2)
n = number of planes
T = spacing between sections (in µm)
Quantification of S100β Fluorescence Intensity
In order to quantify the fluorescence intensity of S100β in euploid and trisomic astrocytes, we followed the immunohistochemistry protocol previously described to stain S100ꞵ with rabbit anti-S100ꞵ (1:1000, Synaptic systems; #287003) and was visualized with goat anti-rabbit Alexa-555 (1:500, Thermo Fisher Scientific, #A-32732). Next, confocal fluorescence images were acquired at 20x magnification on a Leica TCS SP5 inverted scanning laser microscope creating a composite image of the entire dorsal hippocampus at 16 bits. Confocal acquisition settings were maintained constant for all the samples and all images were taken the same day. The mean intensity of astroglial somas was performed by manually delineating the somas in accordance with the S100β signal using ImageJ. Signal background was subtracted for every region and image.
Astrocyte Tagging and Manipulation Techniques
Viral Constructs
In order to identify and manipulate astrocytes, we used a construct that expressed the excitatory DREADD hM3D(Gq)-mCherry under the GFAP promoter. AAV5- GFAP-hM3D(Gq)-mCherry was a gift from Bryan Roth (Addgene Viral prep # 50478-AAV5; RRID:Addgene_50478). As a control, we used AAV5-GFAP104-mCherry (gift from Edward Boyden; Addgene viral prep #58909-AAV5). We also used a construct to express a genetically encoded calcium indicator (cyto-GCaMP6f) under the gfaABC1 promoter, a shortened 681 bp GFAP promoter. AAV5-gfaABC1D-cyto-GCaMP6f was a gift from Baljit Khakh (Addgene viral prep #52925-AAV5; RRID: Addgene 52925-AAV5) [26]. Viral titers were 1.4 x 10¹³ genome copy (GC)/mL for AAV5-GFAP-hM3D(Gq)-mCherry, 1.4 x 10¹³ GC/mL for GFAP104-mCherry and 1.3 x 10¹³ GC/mL for gfaABC1D-cyto-GCaMP6f. For ex vivo calcium imaging studies, a 1:2 mixture of both AAV5-GFAP-hM3D(Gq)-mCherry and AAV5-gfaABC1Dcyto- GCaMP6f was used.
Stereotaxic Surgery Injection
Intracerebral injections in CA1 were performed bilaterally at Bregma -2.5 mm AP, +/- 2.0 mm ML, -1.5 mm DV with the aid of a stereotaxic apparatus (Stoelting 51730). For electrophysiology ex vivo studies, mice were 5-7 weeks at the time of surgery. Mice were anesthetized using ketamidol (7.5 mg/kg) and medetomidin (0.2 mg/kg). Fur was shaved from the incision site. Skin was wiped with ethanol 70% and small incisions were made along the midline to expose bregma and injection sites. Craniotomies were performed using a 0.45 mm diameter stereotaxic drill (RWD Life Science, model 78001). Viral vectors were injected at 60 nl/min through a 33-gauge cannula (Plastics One, C235I/Spc) attached to a Hamilton microsyringe (1701N; Hamilton) connected to a syringe pump (PHD 2000, Harvard Apparatus) for 10 min. For ex vivo calcium imaging studies, a volume of 600 nl/hemisphere of a 1:2 mixture of both AAV5-GFAP-hM3D(Gq)-mCherry and AAV5-gfaABC1D-cyto-GCaMP6f was used. Cannulas remained 10 min after injection to allow virus diffusion and were slowly withdrawn during 5 min. Skin was sutured and mice were treated with 0.03 mg/kg buprenorphine as analgesic. Mice were recovered from anesthesia by Atipemazol (1 mg/kg) and maintained on a heating pad until fully recovered. Mice were allowed to recover for 3 weeks before experimentation to allow construct expression. After sacrifice, all injection sites were verified histologically. Only those mice in which virus expression was restricted to the dorsal CA1 were included for analysis.
Calcium Imaging
To characterize spontaneous and evoked Ca2+ oscillations, coronal hippocampal slices (300 μm) were obtained from 8-10 weeks of Ts65Dn and WT male littermates injected with AAV5-GFAP-hM3D(Gq)-mCherry and AAV5-gfaABC1D-cyto-GCaMP6f. Animals were sacrificed, brains were quickly removed and sliced using a vibratome (Leica VT1200S, Leica Microsystems) in ice-cold oxygenated low Ca2+ ACSF (126 mM NaCl, 2.6 mM KCl, 26 mM NaHCO3, 1.25 mM NaH2PO4, 10 mM Glucose, 1 mM MgCl2, 0.625 mM CaCl2). Slices were then incubated for 1 h with oxygenated normal Ca2+ ACSF (126 mM NaCl, 2.6 mM KCl, 26 mM NaHCO3, 1.25 mM NaH2PO4, 10 mM Glucose, 1 mM MgCl2, 2 mM CaCl2). Individual slices were transferred to a recording chamber in an Olympus BX51WI upright microscope at room temperature (20-22 ºC) in the presence of picrotoxin (50 μM). Images were acquired at 1 Hz for 150 s having 6-15 astrocytes in the field of view of the camera using epifluorescence microscope (Olympus BX51 WI upright). In the first 120 s the spontaneous astrocyte Ca2+ activity was measured. Between second 118 and 120, a 2 s pulse (1 bar) was applied using a patch pipette to locally apply CNO (1 mM) into the field of view. Then, astrocyte Ca2+ activity post CNO administration was measured from 120 s to 150 s. Co-localization of GCaMP6f with hM3D(Gq)-mCherry was checked after the recording. Image acquisition and image analysis was performed using a cellSens software (Olympus). Ca2+ oscillations were recorded from the cell body. Background was subtracted for every image. Data was then fed into a in-house code kindly provided by Perea lab that identified Ca2+ events when the signal showed maximum values above 2 times the standard deviation of the previous steady signal [27]. Ca2+ variations were estimated as changes in the fluorescence signal (ΔF) over the baseline (F0). Mean event frequency and amplitude values for each experimental group were obtained by averaging the mean amplitude and frequency over a 2 min period. Astrocytes with no oscillations were not included in the analysis. Frames with movement artifacts were excluded for the analysis.
Minimal Stimulation Protocol
We used a minimal stimulation protocol to investigate whether astrocyte to neuronal communication is impaired in Ts65Dn mice. Coronal hippocampal slices (300 µm) were made from 8-10 weeks WT and Ts65Dn littermates previously injected with AAV5-GFAP-hM3D(Gq)-mCherry in CA1. Animals were decapitated, brains were quickly removed and sliced using a vibratome (Leica VT1200S, Leica Microsystems) in an ice-cold (4º C) NMDG-HEPES solution (92 mM NMDG, 2.5 mM KCl, 30 mM NaHCO3, 1.2 mM NaH2PO4, 20 mM HEPES, 5 mM Na-ascorbate, 2 mM thiourea, 3 mM Na-pyruvate, 25 mM Glucose, 10 mM MgSO4.7H2O, 0.5 mM CaCl2.2H2O) [28]. Subsequently, slices were placed in the same NMDG-HEPES solution at 32–34 °C for 10 min. Slices were then incubated for 1h with oxygenated normal Ca2+ACSF (124 mM NaCl, 2.69 mM KCl, 26 mM NaHCO3, 1.25 mM KH2PO4, 10 mM Glucose, 2 mM MgSO4, 2 mM CaCl2). Individual slices were transferred to a recording chamber in an Olympus BX50WI upright microscope (Olympus Optical). Electrophysiological recordings were filtered at 1 kHz and acquired at 10 kHz sampling rate with PC-ONE amplifier (Dagan Corporation) and digitized by a 1440A DigiData interface board (Axon Instruments). Patch pipettes of borosilicate glass were pulled (Sutter P-1000, Sutter Instruments), and filled with internal solution for whole-cell somatic voltage clamp recordings (135 mM K-gluconate, 10 mM KCl, 10 mM HEPES, 1 mM MgCl2, and 2 mM ATP-Na2). The membrane potential was held at -70 mV while fast and slow whole-cell capacitances were neutralized and series resistance was compensated (by around 70%). Before and after the trials, electrophysiological parameters were monitored. Throughout the experiment, a -5 mV pulse was used to keep track of the series and input resistances. When the series and input resistances, resting membrane potential, and stimulus artifact duration did not fluctuate by more than 20%, recordings were considered stable.
Synaptic responses in CA1 were evoked by stimulating the SC fibers with theta capillaries (2-5 µm tip diameter) filled with ACSF electrode delivering pulses of 50 μs duration at 0.5 Hz. Recordings were performed in the presence of picrotoxin (50 µM). Stimulus intensity was set to stimulate single or very few synapses and was kept constant during the experiment. Stimulus intensity was also adjusted to achieve a 50% of failures and 50% of success of CA1 evoked synaptic responses. Basal evoked-responses were measured for 5 min. At min 5, CNO was locally applied at 1 mM with a puff (2 s, 1 bar) and then activity was measured for 10 more min. The following synaptic parameters were examined: synaptic efficacy (mean peak amplitude of all responses, including failures); synaptic potency (mean peak amplitude of the successes); probability of release (Pr, ratio between number of successes versus total number of stimuli). Synaptic parameters were evaluated before and after astrocyte stimulation with CNO. For statistical purposes basal responses and 5 min after CNO stimulation were considered. Experiments were performed at room temperature (22 ± 2 °C).
Single Nucleus RNA Sequencing Data Analysis
The single-cell RNA sequencing data analyzed in this study were generated as previously described [29]. Briefly, tissue was dissociated, NeuN negative neuronal nuclei were sorted using fluorescent activated nuclear sorting (FANS), and libraries were prepared using the 10x Genomics Chromium Single Cell Kit Version 3 and sequenced on a NovaSeq 6000 S1 to an average depth of approximately 20.000 reads per cell.
10x Data Pre-Processing
The readings were matched to the reference genome, including exons and introns, and transformed to mRNA molecule counts using the manufacturer's Cellranger pipeline (CellRanger v3.0.1). We counted the number of genes for which at least one read was mapped for each nucleus, then discarded any nuclei with fewer than 200 or more than 2500 genes, respectively, to eliminate low-quality nuclei and duplets. Genes found in fewer than six nuclei were discarded. To normalize for differences in coverage, expression values Ei,j for gene I in cell j were calculated by dividing UMI counts for gene I by the sum of UMI counts in nucleus j, multiplying by 10,000 to create TP10K (transcript per 10,000) values, and finally computing log2(TP10K + 1) (using the NormalizeData function from the Seurat package v.2.3.4) [30].
Batch Correction and Scaling Data Matrix
Because samples were processed in two different experiments, batch correction and data scaling were executed as previously described [29]. Briefly, Harmony was used on the normalized dataset and then the data were scaled using the ScaleData function from Seurat [31]. The scaled data matrix was then used for dimensionality reduction and clustering.
Dimensionality Reduction, Clustering and Visualization
Using the RunPCA method in Seurat (a wrapper for the irlba function), we computed the top 60 principle components using the scaled expression matrix restricted to the variable genes. UMAP (Uniform Manifold Approximation and Projection) used the scores from these principal components as input to downstream grouping and visualization (UMAP). The FindNeighbors and FindClusters functions in Seurat (resolution = 0.6) were used to cluster the data. After that, using UMAP, the clusters were visualized. Before integrating with the IntegrateData function, reference anchors between genotypes were found, and the combined data was analyzed using the same procedures.
SingleR (version 1.0.6) [32] was used for single-cell annotation based on the “MouseRNAseqData” dataset from the celldex package (version 1.0.0) and using the “label.main” to assign cell subtypes. Clusters at a resolution of 0.05 were annotated based on the most prevalent predicted cell subtypes. The annotation was further refined by mapping the most enriched genes for each cluster (identified using the FindAllMarkers function) to the cell types of the Linnarson mouse atlas [33].
Identification of Marker Genes Within Every Cluster
The FindAllMarkers function was used to find cluster-specific marker genes using a negative binomial distribution (DESeq2). A marker gene was defined as having a detectable expression in > 20% of the cells from the related cluster and being >0.25 log-fold greater than the mean expression value in the other clusters. We were able to choose markers that were highly expressed within each cluster while still being restricted to genes unique to each individual cluster.
Identification of Differentially Expressed Genes Between WT and Ts65Dn
Within each cell type, WT and TS samples were compared for differential gene expression using Seurat’s FindMarkers function. To be included in the analysis, the gene had to be expressed in at least 10% of the cells from one of the two groups for that cell type and there had to be at least a 0.25-fold change in gene expression between genotypes. After correcting for multiple testing, only genes with a p-adjusted value < 0.001 were considered for downstream analyses.
Diffusion Map
Using the DiffusionMap function from the destiny package in R [34] (with k = 30 and a local sigma), the diffusion components were calculated using the cell embedding values in the top 15 principal components (generated either on the scaled expression matrix restricted to the variable genes in the 7-month-old mouse dataset or on the aligned canonical correlation analysis (CCA) subspace for the entire time-course data). For data visualization, we selected the top two diffusion components. This function allowed us to discover drivers of cell embedding at a global or subregion level using non-linear low-dimensional embeddings like UMAP or Diffusion Map.
Cellular Proportion
The proportional fraction of nuclei in each cell type was standardized to the total number of nuclei taken from each library to acquire insight into cell type variations in the trisomic hippocampus. We used single cell differential composition analysis (scDC) to bootstrap proportion estimates for our samples to see if any changes in cell-type proportion were statistically significant [35].
Statistical Analysis
When two conditions were compared, the Shapiro-Wilks test was conducted to check the normality of the data and Fisher’s F test was used to assess the homogeneity of variances between groups. When data met the assumptions of parametric distribution, results were analyzed by unpaired student's t-test. Paired t-tests were employed to compare paired variables. Mann-Whitney-Wilcoxon test was applied in cases where the data did not meet the requirements of normal distribution. Statistical analyses were two-tailed.
For comparison between more than two groups, two-way ANOVA with different levels was conducted followed by Tukey HSD multiple comparison test. Bartlett test was used to assess the homogeneity of variances between groups. If the data distribution was non-parametric, the Kruskal-Wallis test was used followed by Mann Whitney-Wilcoxon test. All statistical analyses were two-tailed. The statistical test used is indicated in every Figure. Differences in means were considered statistically significant at p < 0.05. Data analysis and statistics were performed using R studio (Version 1.1.463).
3. Results
Astrocytopathy Is Not Evenly Distributed Across Hippocampal Regions in Ts65Dn
We quantified the number of neurons (NeuN+) and astrocytes (S100β+) in all subregions of the dorsal hippocampus in WT and Ts65Dn mice (Figure 1A,B) by using the systematic-random optical dissector method (see Methods). We selected S100β+ to quantify astrocytes because GFAP was mainly located in astroglial processes (Figure 1A). We also analyzed astrocyte cell volume and the S100β expression levels in both the somatic and dendritic layers of the dorsal hippocampus (see Methods and Supplementary Figure 2).
No differences were observed in the volume of the different hippocampal subregions (CA1, CA3 or the DG) (Supplementary Figure 1) nor in the number or the density of NeuN+ cells between WT and Ts65Dn mice (two-tailed t-test; N.S.; Figure 1C and Supplementary Figure 1A). However, the number of S100β+ cells was significantly higher in CA1 stratum lacunosum (two-tailed T test; p < 0.001 Figure 1D), CA1 stratum oriens (two-tailed T test; p < 0.05 Figure 1D) and the DG granule cell layer (two-tailed T test; p < 0.05; Figure 1F) of trisomic compared to WT mice, along with increased astroglial density in CA1 stratum lacunosum (two-tailed T test; p < 0.001 Supplementary Figure 1C) and in DG granule cell layer (two-tailed T test; p < 0.05; Supplementary Figure 1G). No differences were detected in CA1 stratum pyramidale, and radiatum, nor in DG molecular and polymorphic layers (two-tailed T test; p = N.S. Figure 1F). No increase in S100β+ number nor density was found in CA3 (two-tailed T test; p = N.S. Figure 1E). Ts65Dn S100β+ cells had a larger soma than their euploid littermates in all the hippocampal regions, except the CA3 pyramidal layer (Mann-Whitney; p = 0.12; Figure 2A-D). S100β expression levels were significantly higher in Ts65Dn than in WT astrocytes in all the hippocampal regions (Mann-Whitney; p < 0.001; Figure 2E-G).
In summary, while CA1 and DG present increased number, and soma size in the astrocytes, CA3 shows a milder phenotype with no significant astrocytopathy and a less marked increase astrocyte soma size, but increased S100β levels, suggesting that while there may be some neuroinflammatory response, the structural and functional aspects of CA3 astrocytes might remain relatively intact.
Trisomic Astroglia Exhibit Abnormal Ca2+ Dynamics in CA1
Astrocytopathy is usually associated with changes in astrocyte physiology and several studies have reported changes in astrocyte Ca2+ oscillations, which are critical for astrocytic signaling, homeostasis, and communication with neurons [15]. In order to investigate whether trisomy had an impact in trisomic astrocyte physiology, we focused on the CA1 region that showed the most important changes in trisomic mice. We expressed a genetically encoded Ca2+ indicator (GCaMP6f) driven by the astrocyte-specific GfaABC1B promoter in CA1 astrocytes along with hM3D(Gq)-mCherry in WT and Ts65Dn mice (Figure 3A). Gq-coupled designer receptors induce reversible and time-restricted Ca2+ oscillations in astrocytes when activated by clozapine N-oxide (CNO) [36,37].
First, we evaluated spontaneous Ca2+ oscillations in the presence of the GABAA receptor antagonist picrotoxin (50 µM) in order to block inhibitory neurotransmission [1]. The basal event frequency (e.g. the rate at which Ca2+ or oscillations occur in baseline conditions) was similar in WT and Ts65Dn astrocytes (Figure 3B-E). Nevertheless, the average basal amplitude of Ca2+ events (ΔF/F0) was significantly higher in Ts65Dn astrocytes (two-way ANOVA; Genotype: F(1,330) = 9.67, p = 0.002; Post hoc Tukey HSD; p = 0.001; Figure 3D; right panel, Supplementary Figure 3AB). To assess intracellular Ca2+ oscillations, we locally applied a puff of CNO while examining the time course of Ca2+ responses. CNO application led to a rise in the intracellular Ca2+ signal in astrocytes (Figure 3D). Event frequency was significantly increased both in WT (two-way ANOVA; Treatment: F(1,330) = 31.07, p < 0.001; Post hoc Tukey HSD; p < 0.001; Figure 3D) and in Ts65Dn astrocytes (Post hoc Tukey HSD; p = 0.0059; Figure 3D) but amplitude was not modified upon CNO application neither in WT nor Ts65Dn astrocytes (Figure 3D).
Activation of Ts65Dn Astrocytes Leads to Synaptic Depression
Ca2+ dynamics is essential for astrocyte-to-neuron communication [38,39,40]. As such, the increased amplitude of Ca2+ signals in trisomic mice may enhance the release of gliotransmitters [41,42], which can impact synaptic transmission.
We investigated whether the excitatory synaptic transmission in trisomic CA3-CA1 synapses was modified upon astrocyte manipulation. We expressed the excitatory DREADD Gq fused to mCherry (AAV5-GFAP-hM3D(Gq)-mCherry) in CA1 astrocytes and evaluated the impact of astrocyte activity on excitatory transmission by recording single or very few CA3-CA1 synapses; that is, CA3 Schaffer Collaterals (SC) were electrically stimulated to activate single CA1 hippocampal synapses (see Methods, and Figure 4A,B). Evoked excitatory postsynaptic currents (EPSCs) were recorded in the presence of picrotoxin (50 µM) in basal conditions and after stimulating astrocytes with a local application of CNO (1mM), both in WT and in Ts65Dn mice.
In WT mice, astrocyte stimulation evoked a synaptic potentiation of EPSCs in 7 of 13 synapses (53.84%) during 5 min upon CNO local application, as evidenced by an increase in synaptic efficacy (paired T test; p < 0.05; Figure 4D, right panel) and probability of neurotransmitter release (Pr) (paired T test; p < 0.001; Supplementary Figure 4A), while no changes in synaptic potency were detected (paired T test; N.S.; Supplementary Figure 4C). Conversely, trisomic astrocyte activation by CNO led to a synaptic depre¡ssion in 42,88% of the synapses (6 of 14) (Figure 4F). Synaptic efficacy (paired T test; p < 0.01; Figure 4F) and Pr were significantly reduced in Ts65Dn (paired T test; p < 0.01; Supplementary Figure 4B), while synaptic potency remained unaltered (paired T test; N.S.; Supplementary Figure 4D).
Glutamatergic, Neuroinflammatory and Synaptic Transcriptomic Signatures in Trisomic Astrocytes
To understand the possible mechanisms underlying synaptic depression upon astrocyte stimulation, we analyzed from a previously obtained single-nucleus RNA sequencing (snRNA-seq) dataset the transcriptomic alterations of the astrocyte population in Ts65Dn [43]. To do so, we focused on the astrocyte cluster and analyzed 4614 astrocyte nuclei.
By using a uniform manifold approximation and projection (UMAP) method, we were able to distinguish two main astrocytic populations: mature (Cluster 0), being the main class (94,03% of total astrocytes) and cycling astrocytes (Cluster 1) (Figure 5A), which correspond to previously described AST1 and AST4 astrocyte hippocampal subtypes (Supplementary Figure 5A) [44].
Cluster 1 was enriched in S phase astrocytes as measured by the Cell-Cycle Scoring and Regression function using canonical markers [30]. Astroglial markers such as Ndrg2, Gfap, S100β, or Vimentin were used to identify astrocyte clusters (Figure 5B). No differences in the percentage of Cluster 0 and 1 astrocytes were observed between WT and Ts65Dn mice (Figure 5C).
The gene expression analysis revealed a total of 121 DEGs between trisomic and euploid mature astrocytes (Cluster 0), and 4 DEG in cycling astrocytes (Cluster 1) (Figure 5D). As expected, most of the upregulated DEG genes were found in the triplicated regions located in Mmu16 (Figure 5E). From the 121 DEGs genes in Cluster 0, only 12 were orthologous to the HSA21 (≈7%), suggesting that astrocytes might have a differential susceptibility to the trisomy to gene dosage effects compared to neurons [45], where the percentage of DEGs genes orthologous to HSA21 is around 19% [29] (Supplementary Figure 5B). Triplicated genes involved in cell survival, proliferation and in the gliogenic shift such as Dyrk1A were significantly upregulated in trisomic astrocytes (Supplementary Table 3). We found an overexpression of both Blbp also called Fabp7, a marker of reactive astroglia and biomarker of neurotrauma and Angiotensin (Agt), that is related with angiogenesis and blood pressure regulation during neuroinflammation. We also found an upregulation of antioxidant genes such as Prdx6, which suggests an increased oxidative stress response in the hippocampus, which might exacerbate neuronal dysfunction.
Gjb6, encoding for connexin 30 (Cx30), was significantly downregulated in trisomic astrocytes. Remarkably, we also found a downregulation of solute carrier family 1 member 2 (Slc1a2 or Glt-1), which is a crucial astrocytic transporter responsible for the reuptake of glutamate from the synaptic cleft, and an upregulation of genes encoding for neurotransmitter receptor subunits of AMPA and GABAB1, such as Gria1 and Gabbr1.
4. Discussion
In DS, astrocyte dysfunction is detectable early in brain development [9,10]. Previous studies showed an increased astrocyte number, increased astroglial volume, and higher expression of astroglial proteins, such as S100β, both in postmortem DS brains [9,10,11,46,47] and DS mouse models [6,16].
Our findings refine this view, showing that astrocytopathy is not evenly distributed across hippocampal subregions. The CA1 hippocampal subregion, particularly the stratum oriens, and stratum lacunosum as well as the DG granule cell layer showed more severe changes, including localized increases in the number astrocytes, increased astrocyte somatic volumes and S100β expression, suggesting that astrocytopathy may differentially influence the trisynaptic hippocampal circuit. In contrast, CA3 showed no significant increase in astrocyte number, possibly due to its intrinsic recurrent circuitry and a robust mossy fiber input from the DG [48,49], that may buffer the effects of astrocyte dysfunction, maintaining homeostasis despite trisomy-related stressors. Nevertheless, as CA3 function depends on the integrity of downstream and upstream regions, its function is probably hindered by astrocytopathy in the surrounding regions.
The increased expression of S100β, a Ca2+-binding protein located on HSA21 and primarily expressed in astrocytes, was reported to contribute to the spontaneous intracellular Ca2+ fluctuations in DS astroglia [15] This increased S100β was associated with elevated spontaneous Ca2+ oscillations in trisomic astrocytes, which were associated with reduced neuronal activity [15]. In contrast, in our experiments, the frequency of spontaneous Ca2+ oscillations was not affected in Ts65Dn astrocytes and the amplitude of the Ca2+ transients was significantly higher in trisomic astrocytes. Different mechanisms can contribute to the observed changes in Ca2+ oscillation patterns. Elevated basal Ca2+ levels can predict the amplitude of Ca2+ signals in astrocytes [50] and resting cytosolic Ca2+ is elevated in trisomic models such as Ts65Dn mice [51] and in Ts16 mice [52]. The fact that in human iPSC-derived trisomy 21 astrocytes, increased S100β was linked to higher Ca²⁺ oscillation frequency, may be due to the immature developmental stage of iPSCs-derived astrocytes that differ from adult astrocytes in terms of gene expression and calcium dynamics [53,54].
The increased amplitude of Ca2+ oscillations might lead to atypical modulation of synaptic activity by modifying the release of different gliotransmitters like ATP, glutamate, or D-serine, disrupting astrocyte-neuron communication. We previously described that selective activation of astrocytes by expressing hM3D(Gq), a designer receptor exclusively activated by designer drugs (DREADD), promoted synaptic potentiation, by potentiating transmitter release at single CA3-CA1 hippocampal synapses [1]. In Ts65Dn mice, CNO activation of astrocytes had the opposite effect, inducing synaptic depression, reducing synaptic efficacy and the probability of neurotransmitter release. This short-term synaptic depression is probably to exacerbated gliotransmission that might reduce the probability of glutamate release [1].
We then analyzed possible transcriptional alterations leading to trisomic astroglia dysfunction. To this aim, we used previously produced single nuclei RNAseq data of the different glial subtypes in the hippocampus including oligodendroglia, astroglia and microglia focusing on astrocytes [43]. We identified two clusters of astrocytes: a major cluster of mature astrocytes and a small cluster of cycling astrocytes. This is in line with evidence showing that most astrocytes in the adult brain are post-mitotic and long-lived, whereas the number of newly generated astrocytes are limited [55]. In the snRNA-seq analysis, we did not detect the increase in the number of astrocytes we observed using stereological techniques. This might be attributed to differences in spatial resolution and sampling sensitivity since stereological methods provide precise cell counts in defined subregions allowing the detection of localized changes, whereas snRNA-seq of the whole hippocampus might dilute subregion-specific changes.
We found that from the 121 DEGs genes in the cluster of mature astrocytes, approximately 7% were triplicated genes orthologous to the HSA21. This is a quite reduced number, compared to the impact of trisomy in neurons, where a higher portion of DEGs, mostly upregulated, were located to Mmu16 [29]. Compensatory mechanisms like heterochromatinization might be compensating for the gene overdosage effects in trisomic astrocytes, given the upregulation of Dyrk1A, Brd9 and Arid1b along with the downregulation of Tcf4, which are involved in chromatin remodeling and transcription regulation [56,57,58,59].
These results suggest that trisomic astrocytes adapt to genetic perturbations but instead may be less able to adequately respond to environmental such as inflammation, brain insult, and neurodegeneration [45,60,61,62], as suggested by the downregulation of key genes such as Clcc1 and Rnf121 that likely exacerbates Ca²⁺ dysregulation and metabolic dyshomeostasis, while the upregulation of genes like Fabp7, Agt and Sav1 suggests a shift toward a reactive state. This reactive state might disrupt homeostatic functions, such as supporting synaptic transmission and maintaining the extracellular environment. In line with these results, we observed significant downregulation of Gjb6, the gene encoding Connexin 30 (Cx30), in trisomic astrocytes. Unlike neurons, which operate in discrete circuits, astrocytes form an interconnected syncytium via gap junctions composed primarily of Connexin 30 (Cx30) and Connexin 43 (Cx43). The downregulation of Cx30 could disrupt the buffering of extracellular potassium and glutamate [63] as well as activity-induced Ca²⁺ waves propagation, impairing astrocyte-to-astrocyte signaling [64]. Interestingly, Cx30 expression is upregulated in response to enriched environments that enhance memory [65]. In contrast, Cx30-deficient mice exhibit behavioral abnormalities, reduced AMPAR-mediated excitatory transmission, impaired synaptic plasticity, and deficits in contextual fear memory [66,67].
We also identified several differentially expressed genes related to synaptic transmission in trisomic astrocytes. Notably, there was an upregulation of genes encoding subunits AMPA and GABAB, such as Gria1, Gabbr1. Astrocytes expressing AMPA receptors can influence excitatory transmission and influence gliotransmitter release while GABAB receptor activation regulates inhibitory signaling and Ca2+ dynamics [68].
In conclusion, our study reveals region-specific and functional alterations with increased astrocyte number in the CA1 and DG hippocampal subregions, accompanied by an overall increase in the somatic volume and S100β expression, across hippocampal regions. From a functional perspective, we demonstrate a significant increase in the amplitude of spontaneous Ca2+ oscillations in CA1 with no changes in the frequency, suggesting deregulated Ca2+ dynamics. Importantly, we found that the chemogenetic activation of trisomic astrocytes induced a synaptic depression of CA3-CA1 single synapses, in contrast with the potentiation observed in WT astrocytes, highlighting a shift in the astroglial modulation of synaptic activity in CA1 neurons. These findings highlight that trisomic astrocytes play a crucial role in hippocampal network dysfunction, which may have consequences for the learning and memory impairments shown in Ts65Dn mice. Our results not only expand our understanding of the astrocytopathy associated with DS but also highlight astrocytes as potential targets for therapeutic intervention for restoring synaptic function in DS.
Supplementary Materials
The following supporting information can be downloaded at the website of this paper posted on Preprints.org.
Author Contributions
MD and AFB conceived the study, designed and coordinated the study and wrote the manuscript. AFB conducted in vivo animal experiments. AFB analyzed histological preparations. CGA and GP designed the electrophysiology experiments. CGA conducted the electrophysiological studies. AFB and AZM conducted and analyzed the in vitro Ca2+ imaging experiments. CS and AFB conducted and analyzed the single nucleus RNA seq experiments. All authors revised and corrected the final version of the manuscript.
Funding
The lab of MD is supported by the Secretaria d’Universitats i Recerca del Departament d’Economia I Coneixement de la Generalitat de Catalunya (Grups consolidats 2017 SGR 926). We also acknowledge the support of the Agencia Estatal de Investigación (PID2022-141900OB-I00 INTO-DS), H2020 SC1 Gene overdosage and comorbidities during the early lifetime in Down Syndrome GO-DS21- 848077, Fundació La Marató-TV3 (#2016/20-30). AFB received an FPI-SO fellowship (PRE2018-084504). Additionally, we have been supported by Fundació La Marató TV3 (# 225619), PID2022-142617NB-I00 and PID2019-106579RB-I00 funded by MCIN/AEI/10.13039/501100011033 to G.P.
Institutional Review Board Statement
Experiments were performed according to Directive 63/2010 and Member States' implementation and followed the "Three Rs'' principle of replacement, reduction, and refinement. The investigation was conducted in accordance with the Standards for Use of Laboratory Animals No. A5388-01 (NIH) and local (Law 32/2007) and European regulations and protocols were approved by the Ethics Committee of Parc de Recerca Biomèdica (Comité Ético de Experimentación Animal del PRBB (CEEAPRBB); authorization number MDS 0040P2). A/ES/05/I-13 and A/ES/05/14 grant the CRG permission to work with genetically modified organisms.
Data Availability Statement
The data that support the findings of this study are available from the corresponding author upon request.
Acknowledgments
The graphical abstract, Figure 3A a Figure 4AB were created with BioRender.com. We thank the Advanced Light Microscopy Unit (ALMU) at the CRG for their support in the confocal data acquisition process. We thank the Single Cell Genomics Team at the National Center for Genomic Analysis (CNAG) led by Holger Heyn for their assistance with experiment planning and sequencing and for the fruitful discussion throughout this project. We are grateful to the CRG Genomics Unit for the support and assistance in this work. We acknowledge support of the Spanish Ministry of Science and Innovation through the Centro de Excelencia Severo Ochoa (CEX2020-001049-S, MCIN/AEI /10.13039/501100011033), the Generalitat de Catalunya through the CERCA programme and to the EMBL partnership. The CIBER of Rare Diseases is an initiative of the ISCIII.
Conflicts of Interest
The authors declare no conflicts of interest.
Abbreviations
The following abbreviations are used in this manuscript:
| AAV5 | Adeno Associated Virus 5 |
| ACSF | Artificial cerebrospinal fluid |
| ATP | Adenosine triphosphate |
| CA1 | Cornu Ammonis 1 |
| CA3 | Cornu Ammonis 3 |
| CNO | Clozapine N-oxide |
| CP | Corner Point |
| DEG | Differentially expressed genes |
| DG | Dentate Gyrus |
| DREADD | Designed Receptor Exclusively Activated by Designer Drugs |
| DS | Down syndrome |
| EPSCs | Excitatory Postsynaptic Currents |
| FANS | Fluorescence Activated Nuclear Sorting |
| HSA21 | Homo Sapiens Autosome 21 |
| iPSCs | Induced Pluripotent Stem Cells |
| NA | Numerical Aperture |
| NGS | Normal Goat Serum |
| OD | Optical Disector |
| PBS | Phosphate Buffer Saline |
| PFA | Paraformaldehyde |
| ROI | Region of Interest |
| SC | Schaffer Collaterals |
| UMAP | Uniform Manifold Approximation and Projection |
| UMI | Unique Molecular Identifier |
| WT | wyld type |
References
- Perea, G.; Araque, A. Astrocytes Potentiate Transmitter Release at Single Hippocampal Synapses. Science 2007, 317, 1083–1086. [CrossRef]
- Adamsky, A.; Kol, A.; Kreisel, T.; Doron, A.; Ozeri-Engelhard, N.; Melcer, T.; Refaeli, R.; Horn, H.; Regev, L.; Groysman, M.; et al. Astrocytic Activation Generates De Novo Neuronal Potentiation and Memory Enhancement. Cell 2018, 174, 59-71.e14. [CrossRef]
- Jourdain, P.; Bergersen, L.H.; Bhaukaurally, K.; Bezzi, P.; Santello, M.; Domercq, M.; Matute, C.; Tonello, F.; Gundersen, V.; Volterra, A. Glutamate Exocytosis from Astrocytes Controls Synaptic Strength. Nat. Neurosci. 2007, 10, 331–339. [CrossRef]
- Beard, E.; Lengacher, S.; Dias, S.; Magistretti, P.J.; Finsterwald, C. Astrocytes as Key Regulators of Brain Energy Metabolism: New Therapeutic Perspectives. Front. Physiol. 2022, 12. [CrossRef]
- Fernández-blanco, Á.; Dierssen, M. Rethinking Intellectual Disability from Neuro- to Astro-Pathology. Int. J. Mol. Sci. 2020, 21, 1–20. [CrossRef]
- Illouz, T.; Madar, R.; Biragyn, A.; Okun, E. Restoring Microglial and Astroglial Homeostasis Using DNA Immunization in a Down Syndrome Mouse Model. Brain. Behav. Immun. 2019, 75, 163–180. [CrossRef]
- Ponroy Bally, B.; Farmer, W.T.; Jones, E.V.; Jessa, S.; Kacerovsky, J.B.; Mayran, A.; Peng, H.; Lefebvre, J.L.; Drouin, J.; Hayer, A.; et al. Human iPSC-Derived Down Syndrome Astrocytes Display Genome-Wide Perturbations in Gene Expression, an Altered Adhesion Profile, and Increased Cellular Dynamics. Hum. Mol. Genet. 2020, 29, 785–802. [CrossRef]
- Silva, A.L.T. e; Oliveira, P.H.P. de; Yokota-Moreno, B.Y.; Avila, J.P.; Nakaya, H.I.; Fausto, J. da S.; Sertié, A.L.; Zampieri, B.L. Complement System Alteration in iPSC-Derived Astrocytes from Individuals with Down Syndrome 2024.
- Griffin, W.S.T.; Sheng, J.G.; Mckenzie, J.E.; Royston, M.C.; Gentleman, S.M.; Brumback, R.A.; Cork, L.C.; Del Bigio, M.R.; Roberts, G.W.; Mrak, R.E. Life-Long Overexpression of S100β in Down’s Syndrome: Implications for Alzheimer Pathogenesis. Neurobiol. Aging 1998, 19, 401–405. [CrossRef]
- Griffin, W.S.T.; Stanley, L.C.; Ling, C.; White, L.; MacLeod, V.; Perrot, L.J.; White, C.L.; Araoz, C. Brain Interleukin 1 and S-100 Immunoreactivity Are Elevated in Down Syndrome and Alzheimer Disease. Proc. Natl. Acad. Sci. U. S. A. 1989, 86, 7611–7615. [CrossRef]
- Zdaniuk, G.; Wierzba-Bobrowicz, T.; Szpak, G.M.; Stępień, T. Astroglia Disturbances during Development of the Central Nervous System in Fetuses with Down’s Syndrome. Folia Neuropathol. 2011, 49, 109–114.
- Mito, T.; Becker, L.E. Developmental Changes of S-100 Protein and Glial Fibrillary Acidic Protein in the Brain in Down Syndrome. Exp. Neurol. 1993. [CrossRef]
- Guidi, S.; Bonasoni, P.; Ceccarelli, C.; Santini, D.; Gualtieri, F.; Ciani, E.; Bartesaghi, R. Neurogenesis Impairment and Increased Cell Death Reduce Total Neuron Number in the Hippocampal Region of Fetuses with Down Syndrome. Brain Pathol. Zurich Switz. 2008, 18, 180–197. [CrossRef]
- Letourneau, A.; Santoni, F.A.; Bonilla, X.; Sailani, M.R.; Gonzalez, D.; Kind, J.; Chevalier, C.; Thurman, R.; Sandstrom, R.S.; Hibaoui, Y.; et al. Domains of Genome-Wide Gene Expression Dysregulation in Down’s Syndrome. Nat. 2014 5087496 2014, 508, 345–350. [CrossRef]
- Mizuno, G.O.; Wang, Y.; Shi, G.; Wang, Y.; Sun, J.; Papadopoulos, S.; Broussard, G.J.; Unger, E.K.; Deng, W.; Weick, J.; et al. Aberrant Calcium Signaling in Astrocytes Inhibits Neuronal Excitability in a Human Down Syndrome Stem Cell Model. Cell Rep. 2018. [CrossRef]
- Lockrow, J.P.; Fortress, A.M.; Granholm, A.C.E. Age-Related Neurodegeneration and Memory Loss in down Syndrome. Curr. Gerontol. Geriatr. Res. 2012. [CrossRef]
- Contestabile, A.; Fila, T.; Ceccarelli, C.; Bonasoni, P.; Bonapace, L.; Santini, D.; Bartesaghi, R.; Ciani, E. Cell Cycle Alteration and Decreased Cell Proliferation in the Hippocampal Dentate Gyrus and in the Neocortical Germinal Matrix of Fetuses with down Syndrome and in Ts65Dn Mice. Hippocampus 2007, 17, 665–678. [CrossRef]
- Raveau, M.; Nakahari, T.; Asada, S.; Ishihara, K.; Amano, K.; Shimohata, A.; Sago, H.; Yamakawa, K. Brain Ventriculomegaly in Down Syndrome Mice Is Caused by Pcp4 Dose-Dependent Cilia Dysfunction. Hum. Mol. Genet. 2017, 26, 923–931. [CrossRef]
- Hypothalamic Astrocytes and the Role of Neuroprogesterone in Estrogen Positive Feedback | SpringerLink Available online: https://link.springer.com/chapter/10.1007/978-3-030-62383-8_10 (accessed on 28 November 2024).
- Thomaz, N.K.; Bobermin, L.D.; Quincozes-Santos, A. Sexual Dimorphism and Hypothalamic Astrocytes: Focus on Glioprotection. Neuroglia 2024, 5, 274–288. [CrossRef]
- Kuo, J.; Hamid, N.; Bondar, G.; Dewing, P.; Clarkson, J.; Micevych, P. Sex Differences in Hypothalamic Astrocyte Response to Estradiol Stimulation. Biol. Sex Differ. 2010, 1, 7. [CrossRef]
- Gozlan, E.; Lewit-Cohen, Y.; Frenkel, D. Sex Differences in Astrocyte Activity. Cells 2024, 13, 1724. [CrossRef]
- Paxinos and Franklin’s the Mouse Brain in Stereotaxic Coordinates - George Paxinos, Keith B.J. Franklin - Google Libros.
- Boyce, R.W.; Dorph-Petersen, K.A.; Lyck, L.; Gundersen, H.J.G. Design-Based Stereology: Introduction to Basic Concepts and Practical Approaches for Estimation of Cell Number. Toxicol. Pathol. 2010, 38, 1011–1025. [CrossRef]
- Dorph-Petersen, K.-A.; Lewis, D.A. Stereological Approaches to Identifying Neuropathology in Psychosis. Biol. Psychiatry 2011, 69, 113–126. [CrossRef]
- Haustein, M.D.; Kracun, S.; Lu, X.H.; Shih, T.; Jackson-Weaver, O.; Tong, X.; Xu, J.; Yang, X.W.; O’Dell, T.J.; Marvin, J.S.; et al. Conditions and Constraints for Astrocyte Calcium Signaling in the Hippocampal Mossy Fiber Pathway. Neuron 2014, 82, 413–429. [CrossRef]
- Mederos, S.; Sánchez-Puelles, C.; Esparza, J.; Valero, M.; Ponomarenko, A.; Perea, G. GABAergic Signaling to Astrocytes in the Prefrontal Cortex Sustains Goal-Directed Behaviors. Nat. Neurosci. 2021, 24, 82–92. [CrossRef]
- Ting, J.T.; Daigle, T.L.; Chen, Q.; Feng, G. Acute Brain Slice Methods for Adult and Aging Animals: Application of Targeted Patch Clamp Analysis and Optogenetics. Methods Mol. Biol. Clifton NJ 2014, 1183, 221–242. [CrossRef]
- Sierra, C.; Sabariego-Navarro, M.; Fernández-Blanco, Á.; Cruciani, S.; Zamora-Moratalla, A.; Novoa, E.M.; Dierssen, M. The lncRNA Snhg11, a New Candidate Contributing to Neurogenesis, Plasticity, and Memory Deficits in Down Syndrome. Mol. Psychiatry 2024, 29, 2117–2134. [CrossRef]
- Hochgerner, H.; Zeisel, A.; Lönnerberg, P.; Linnarsson, S. Conserved Properties of Dentate Gyrus Neurogenesis across Postnatal Development Revealed by Single-Cell RNA Sequencing. Nat. Neurosci. 2018, 21, 290–299. [CrossRef]
- Korsunsky, I.; Millard, N.; Fan, J.; Slowikowski, K.; Zhang, F.; Wei, K.; Baglaenko, Y.; Brenner, M.; Loh, P. ru; Raychaudhuri, S. Fast, Sensitive and Accurate Integration of Single-Cell Data with Harmony. Nat. Methods 2019 1612 2019, 16, 1289–1296. [CrossRef]
- Aran, D.; Looney, A.P.; Liu, L.; Wu, E.; Fong, V.; Hsu, A.; Chak, S.; Naikawadi, R.P.; Wolters, P.J.; Abate, A.R.; et al. Reference-Based Analysis of Lung Single-Cell Sequencing Reveals a Transitional Profibrotic Macrophage. Nat. Immunol. 2019 202 2019, 20, 163–172. [CrossRef]
- Zeisel, A.; Hochgerner, H.; Lönnerberg, P.; Johnsson, A.; Memic, F.; van der Zwan, J.; Häring, M.; Braun, E.; Borm, L.E.; La Manno, G.; et al. Molecular Architecture of the Mouse Nervous System. Cell 2018, 174, 999-1014.e22. [CrossRef]
- Angerer, P.; Haghverdi, L.; Büttner, M.; Theis, F.J.; Marr, C.; Buettner, F. Destiny : Diffusion Maps for Large-Scale Single-Cell Data in R. Bioinformatics 2016, 32, 1241–1243. [CrossRef]
- Cao, Y.; Lin, Y.; Ormerod, J.T.; Yang, P.; Yang, J.Y.H.; Lo, K.K. scDC: Single Cell Differential Composition Analysis. BMC Bioinformatics 2019, 20, 721–721. [CrossRef]
- Van Den Herrewegen, Y.; Sanderson, T.M.; Sahu, S.; De Bundel, D.; Bortolotto, Z.A.; Smolders, I. Side-by-Side Comparison of the Effects of Gq- and Gi-DREADD-Mediated Astrocyte Modulation on Intracellular Calcium Dynamics and Synaptic Plasticity in the Hippocampal CA1. Mol. Brain 2021, 14. [CrossRef]
- Urban, D.J.; Roth, B.L. DREADDs (Designer Receptors Exclusively Activated by Designer Drugs): Chemogenetic Tools with Therapeutic Utility. Annu. Rev. Pharmacol. Toxicol. 2015, 55, 399–417. [CrossRef]
- Bazargani, N.; Attwell, D. Astrocyte Calcium Signaling: The Third Wave. Nat. Neurosci. 2016, 19, 182–189. [CrossRef]
- Dani, J.W.; Chernjavsky, A.; Smith, S.J. Neuronal Activity Triggers Calcium Waves in Hippocampal Astrocyte Networks. Neuron 1992, 8, 429–440. [CrossRef]
- Guerra-Gomes, S.; Sousa, N.; Pinto, L.; Oliveira, J.F. Functional Roles of Astrocyte Calcium Elevations: From Synapses to Behavior. Front. Cell. Neurosci. 2018, 11. [CrossRef]
- Araque, A.; Carmignoto, G.; Haydon, P.G.; Oliet, S.H.R.; Robitaille, R.; Volterra, A. Gliotransmitters Travel in Time and Space. Neuron 2014, 81, 728–739. [CrossRef]
- Covelo, A.; Araque, A. Neuronal Activity Determines Distinct Gliotransmitter Release from a Single Astrocyte. eLife 2018, 7. [CrossRef]
- Fernández-Blanco, Á.; Sierra, C.; Tejido, C.; Dierssen, M. Beyond Quiescent and Active: Intermediate Microglial Transcriptomic States in a Mouse Model of Down Syndrome. Int. J. Mol. Sci. 2024, 25, 3289. [CrossRef]
- Batiuk, M.Y.; Martirosyan, A.; Wahis, J.; de Vin, F.; Marneffe, C.; Kusserow, C.; Koeppen, J.; Viana, J.F.; Oliveira, J.F.; Voet, T.; et al. Identification of Region-Specific Astrocyte Subtypes at Single Cell Resolution. Nat. Commun. 2020, 11, 1220. [CrossRef]
- Schitine, C.; Nogaroli, L.; Costa, M.R.; Hedin-Pereira, C. Astrocyte Heterogeneity in the Brain: From Development to Disease. Front. Cell. Neurosci. 2015, 9. [CrossRef]
- Guidi, S.; Giacomini, A.; Stagni, F.; Emili, M.; Uguagliati, B.; Bonasoni, M.P.; Bartesaghi, R. Abnormal Development of the Inferior Temporal Region in Fetuses with Down Syndrome. Brain Pathol. Zurich Switz. 2018, 28, 986–998. [CrossRef]
- García, O.; Flores-Aguilar, L. Astroglial and Microglial Pathology in Down Syndrome: Focus on Alzheimer’s Disease. Front. Cell. Neurosci. 2022, 16. [CrossRef]
- Le Duigou, C.; Simonnet, J.; Teleñczuk, M.T.; Fricker, D.; Miles, R. Recurrent Synapses and Circuits in the CA3 Region of the Hippocampus: An Associative Network. Front. Cell. Neurosci. 2014, 7, 262. [CrossRef]
- Káli, S.; Dayan, P. The Involvement of Recurrent Connections in Area CA3 in Establishing the Properties of Place Fields: A Model. J. Neurosci. 2000, 20, 7463–7477. [CrossRef]
- King, C.M.; Bohmbach, K.; Minge, D.; Delekate, A.; Zheng, K.; Reynolds, J.; Rakers, C.; Zeug, A.; Petzold, G.C.; Rusakov, D.A.; et al. Local Resting Ca2+ Controls the Scale of Astroglial Ca2+ Signals. Cell Rep. 2020, 30, 3466-3477.e4. [CrossRef]
- Bambrick, L.L.; Yarowsky, P.J.; Krueger, B.K. Altered Astrocyte Calcium Homeostasis and Proliferation in theTs65Dn Mouse, a Model of Down Syndrome. J. Neurosci. Res. 2003, 73, 89–94. [CrossRef]
- Müller, W.; Heinemann, U.; Schuchmann, S. Impaired Ca-Signaling in Astrocytes from the Ts16 Mouse Model of Down Syndrome. Neurosci. Lett. 1997, 223, 81–84. [CrossRef]
- Sloan, S.A.; Darmanis, S.; Huber, N.; Khan, T.A.; Birey, F.; Caneda, C.; Reimer, R.; Quake, S.R.; Barres, B.A.; Paşca, S.P. Human Astrocyte Maturation Captured in 3D Cerebral Cortical Spheroids Derived from Pluripotent Stem Cells. Neuron 2017, 95, 779-790.e6. [CrossRef]
- Tchieu, J.; Calder, E.L.; Guttikonda, S.R.; Gutzwiller, E.M.; Aromolaran, K.A.; Steinbeck, J.A.; Goldstein, P.A.; Studer, L. NFIA Is a Gliogenic Switch Enabling Rapid Derivation of Functional Human Astrocytes from Pluripotent Stem Cells. Nat. Biotechnol. 2019, 37, 267–275. [CrossRef]
- Colodner, K.J.; Montana, R.A.; Anthony, D.C.; Folkerth, R.D.; De Girolami, U.; Feany, M.B. Proliferative Potential of Human Astrocytes. J. Neuropathol. Exp. Neurol. 2005, 64, 163–169. [CrossRef]
- Gatchalian, J.; Malik, S.; Ho, J.; Lee, D.-S.; Kelso, T.W.R.; Shokhirev, M.N.; Dixon, J.R.; Hargreaves, D.C. A Non-Canonical BRD9-Containing BAF Chromatin Remodeling Complex Regulates Naive Pluripotency in Mouse Embryonic Stem Cells. Nat. Commun. 2018, 9, 5139. [CrossRef]
- Xiao, M.; Kondo, S.; Nomura, M.; Kato, S.; Nishimura, K.; Zang, W.; Zhang, Y.; Akashi, T.; Viny, A.; Shigehiro, T.; et al. BRD9 Determines the Cell Fate of Hematopoietic Stem Cells by Regulating Chromatin State. Nat. Commun. 2023, 14, 8372. [CrossRef]
- Sim, J.C.H.; White, S.M.; Fitzpatrick, E.; Wilson, G.R.; Gillies, G.; Pope, K.; Mountford, H.S.; Torring, P.M.; McKee, S.; Vulto-van Silfhout, A.T.; et al. Expanding the Phenotypic Spectrum of ARID1B-Mediated Disorders and Identification of Altered Cell-Cycle Dynamics Due to ARID1B Haploinsufficiency. Orphanet J. Rare Dis. 2014, 9, 43. [CrossRef]
- Lepagnol-Bestel, A.M.; Zvara, A.; Maussion, G.; Quignon, F.; Ngimbous, B.; Ramoz, N.; Imbeaud, S.; Loe-Mie, Y.; Benihoud, K.; Agier, N.; et al. DYRK1A Interacts with the REST/NRSF-SWI/SNF Chromatin Remodelling Complex to Deregulate Gene Clusters Involved in the Neuronal Phenotypic Traits of Down Syndrome. Hum. Mol. Genet. 2009. [CrossRef]
- Paryani, F.; Kwon, J.-S.; Ng, C.W.; Jakubiak, K.; Madden, N.; Ofori, K.; Tang, A.; Lu, H.; Xia, S.; Li, J.; et al. Multi-Omic Analysis of Huntington’s Disease Reveals a Compensatory Astrocyte State. Nat. Commun. 2024, 15, 6742. [CrossRef]
- Serrano-Pozo, A.; Li, H.; Li, Z.; Muñoz-Castro, C.; Jaisa-aad, M.; Healey, M.A.; Welikovitch, L.A.; Jayakumar, R.; Bryant, A.G.; Noori, A.; et al. Astrocyte Transcriptomic Changes along the Spatiotemporal Progression of Alzheimer’s Disease. Nat. Neurosci. 2024, 1–17. [CrossRef]
- Kéry, R.; Chen, A.P.F.; Kirschen, G.W. Genetic Targeting of Astrocytes to Combat Neurodegenerative Disease. Neural Regen. Res. 2019, 15, 199–211. [CrossRef]
- Ma, B.; Buckalew, R.; Du, Y.; Kiyoshi, C.M.; Alford, C.C.; Wang, W.; McTigue, D.M.; Enyeart, J.J.; Terman, D.; Zhou, M. Gap Junction Coupling Confers Isopotentiality on Astrocyte Syncytium. Glia 2016, 64, 214–226. [CrossRef]
- Scemes, E.; Spray, D.C. The Astrocytic Syncytium. In; 2003; pp. 165–179.
- Rampon, C.; Jiang, C.H.; Dong, H.; Tang, Y.P.; Lockhart, D.J.; Schultz, P.G.; Tsien, J.Z.; Hu, Y. Effects of Environmental Enrichment on Gene Expression in the Brain. Proc. Natl. Acad. Sci. U. S. A. 2000, 97, 12880–12884. [CrossRef]
- Dere, E.; De Souza-Silva, M.A.; Frisch, C.; Teubner, B.; Söhl, G.; Willecke, K.; Huston, J.P. Connexin30-Deficient Mice Show Increased Emotionality and Decreased Rearing Activity in the Open-Field along with Neurochemical Changes. Eur. J. Neurosci. 2003, 18, 629–638. [CrossRef]
- Pannasch, U.; Freche, D.; Dallérac, G.; Ghézali, G.; Escartin, C.; Ezan, P.; Cohen-Salmon, M.; Benchenane, K.; Abudara, V.; Dufour, A.; et al. Connexin 30 Sets Synaptic Strength by Controlling Astroglial Synapse Invasion. Nat. Neurosci. 2014, 17, 549–558. [CrossRef]
- Liu, J.; Feng, X.; Wang, Y.; Xia, X.; Zheng, J.C. Astrocytes: GABAceptive and GABAergic Cells in the Brain. Front. Cell. Neurosci. 2022, 16. [CrossRef]
Figure 1.
Subregion-specific astrocytopathy in Ts65Dn hippocampus. (A) Representative images of the different antibodies used against astroglial antigens. Left: S100β is mainly located in the astrocyte soma (asterisks). Middle: GFAP is mainly distributed in the astroglial processes (arrows and arrowheads). Right: Merged image. Scale bar = 10 µm. (B) Left: NeuN distribution in the dorsal hippocampus using the NeuN neuronal marker (in red). Right: S100β distribution in the dorsal hippocampus (in green). Scale bar = 300 µm. (C) Stereological estimates of NeuN+ numbers in the somatic regions of the hippocampus (CA1, CA3 and DG). Dots represent the mean of 6 different sections of individual mice (Gray represents WT and orange Ts65Dn). (D, E, F) Boxplots showing the stereological estimations of S100β+ cells in (D) the CA1 somatic (CA1_SP) and dendritic layers (CA1_SL, CA1_SO and CA1_SR). (E) the CA3 somatic (CA3_SP) and dendritic layers (CA3_SL, CA3_SO and CA3_SR), and (F) the DG somatic (DG_GL) and dendritic regions (DG_ML and DG_PL). WT = 4-5, Ts65Dn = 5. Every dot corresponds to the average of six sections. On the boxplots, the horizontal line indicates the median, the box indicates the first to third quartile of expression and whiskers indicate 1.5 × the interquartile range. *** P < 0.001, * p < 0.05. SL = stratum lacunosum, SO = stratum oriens, SP = stratum pyramidale, SR = stratum radiatum, GL = granule layer, ML = molecular layer.
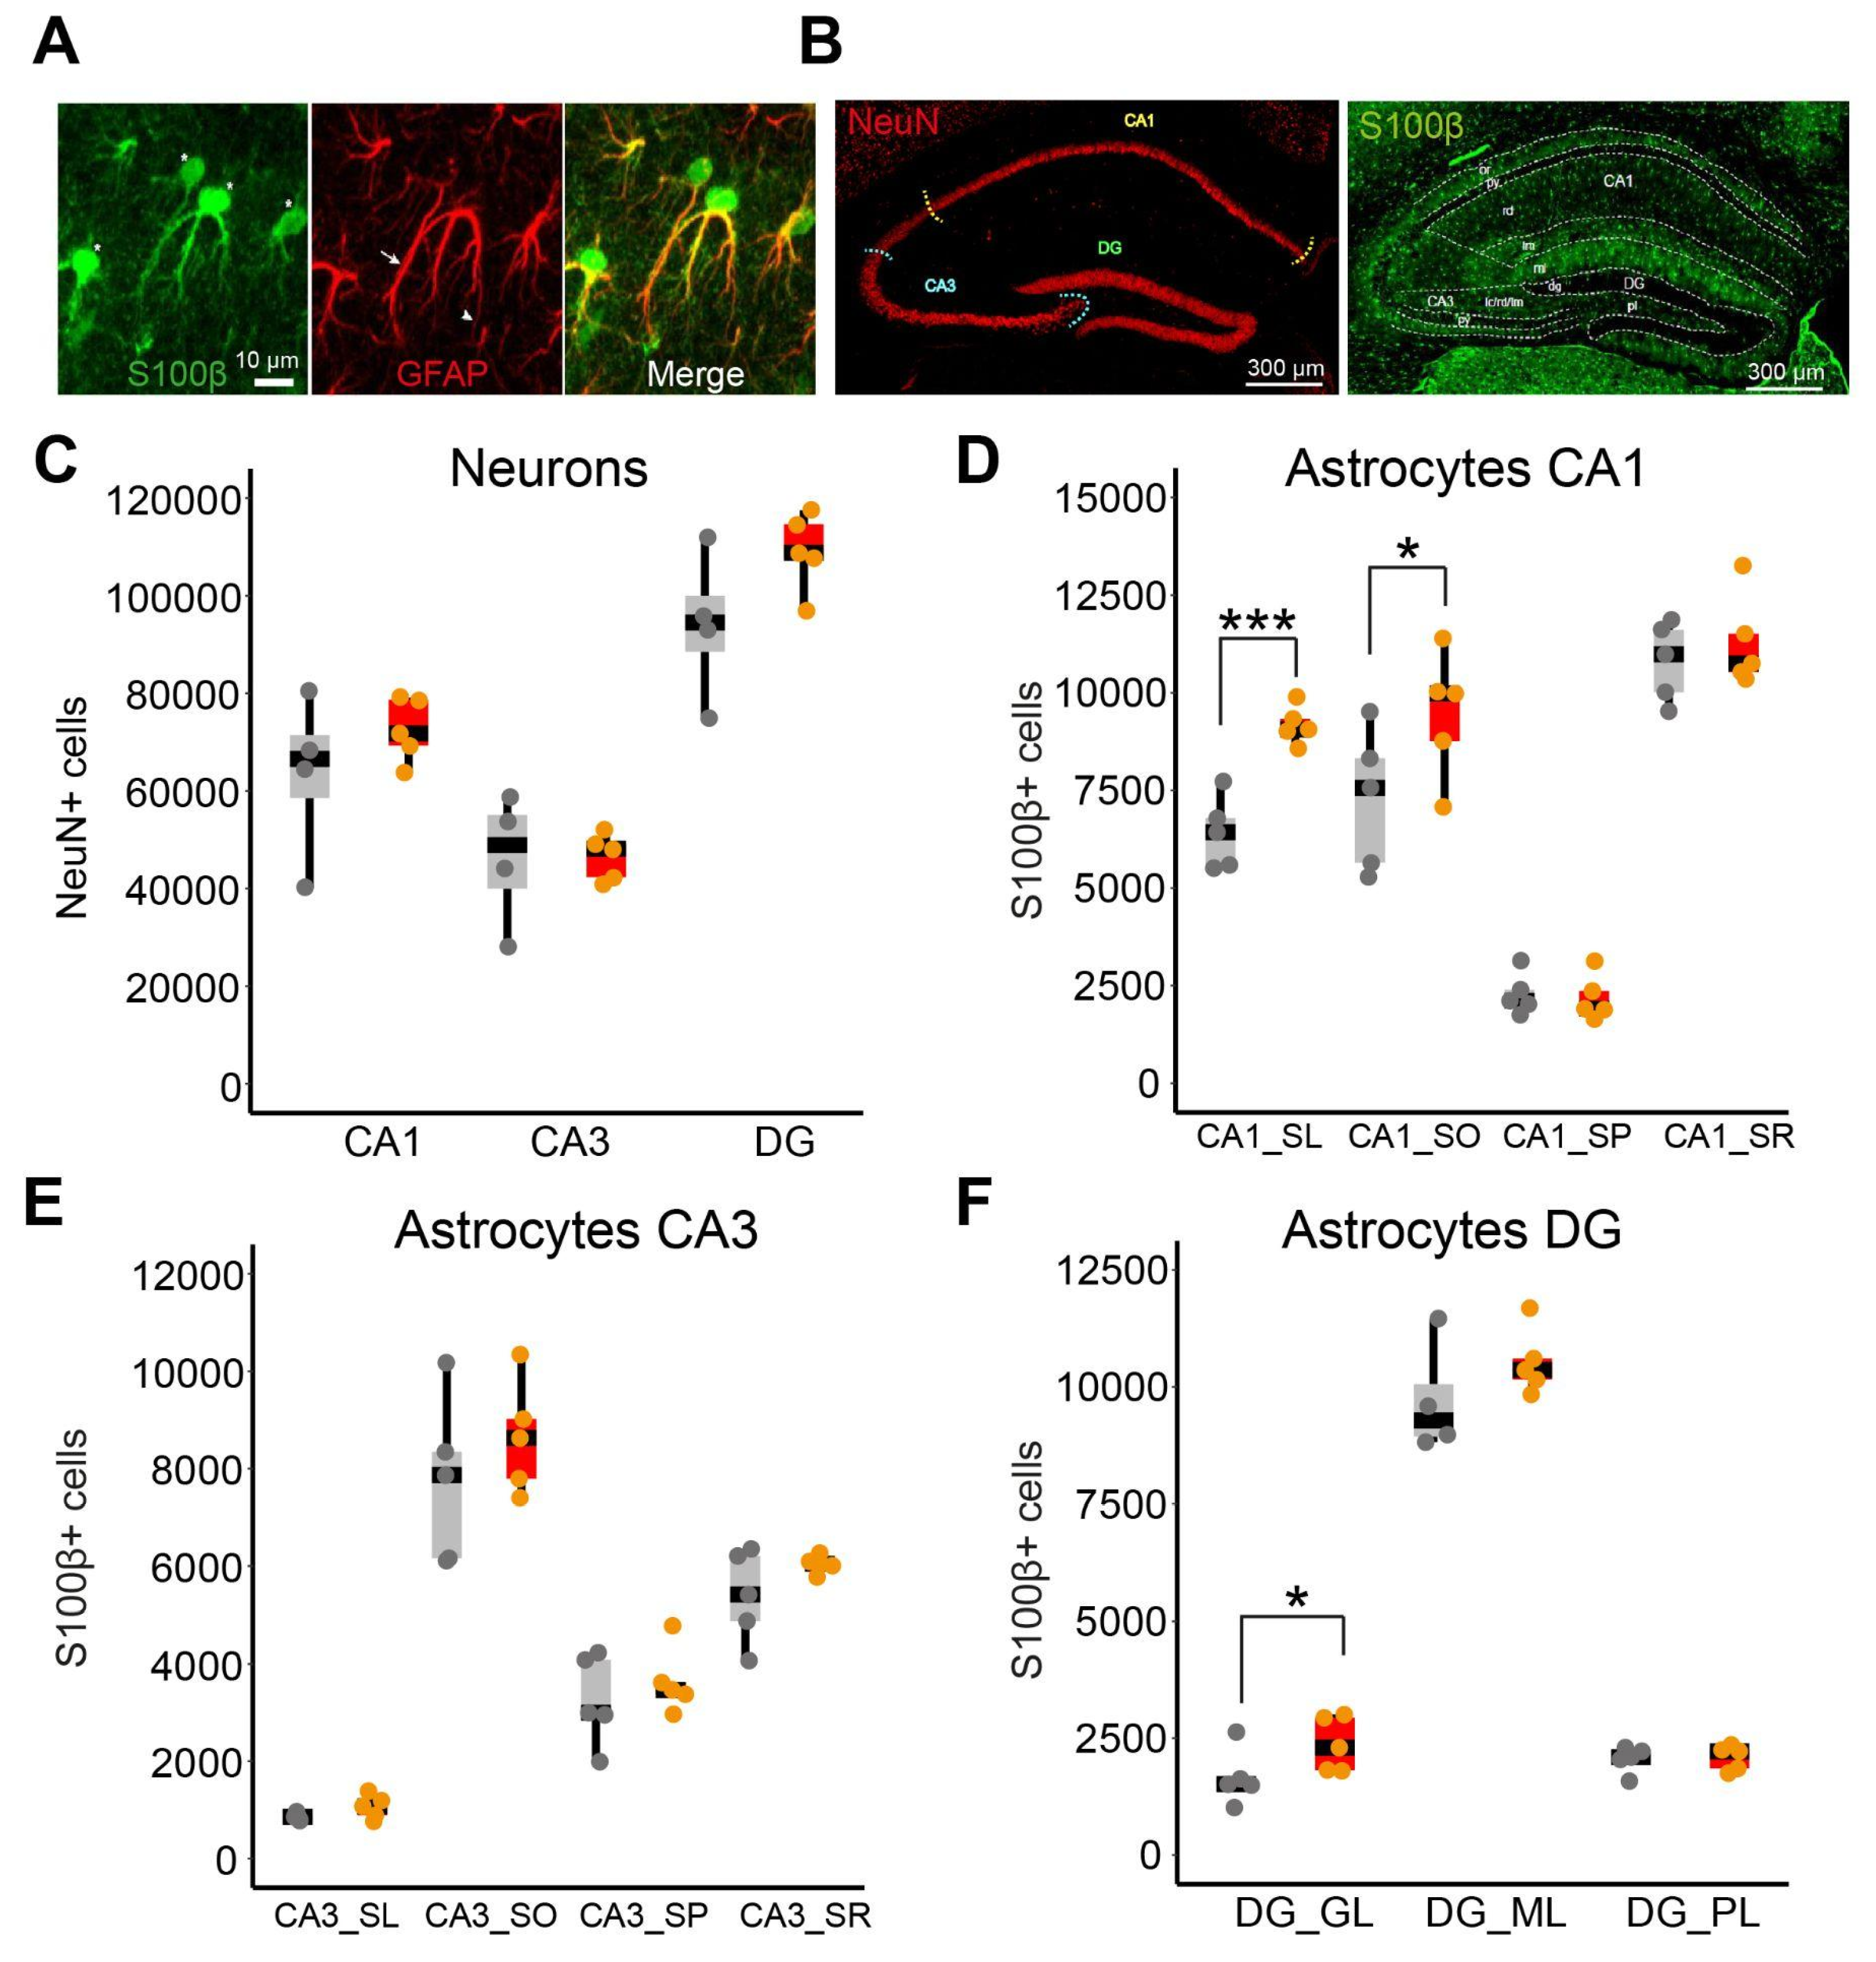
Figure 2.
Increased astroglial somatic volume and S100β expression in Ts65Dn astrocytes. (A) Representative image of WT (above) and Ts65Dn (below) S100β expression in CA1. It is noticeable that astrocytes are larger in Ts65Dn. Scale bar = 25 µm. (B-D) Quantification of astroglial volume (in µm3) in: (B) CA1 layers, (C) CA3 layers (D) DG layers. Gray dots indicate the estimations of individual WT mice (n = 61-106 astrocytes from 4 mice), while orange dots indicate the estimations of the individual Ts65Dn mice (n = 58-103 astrocytes from 4 mice). (E-G) Elevated S100β intensity signal in Ts65Dn astrocytes compared to euploid mice was detected in (E) CA1 (F) CA3 and (G) DG subregions. Gray dots indicate the estimations of individual WT mice (n = 81-94 astrocytes from 4 mice) while orange dots indicate the estimations of Ts65Dn (n = 81-97 astrocytes from 4 mice). On the boxplots, the horizontal line indicates the median, the box indicates the first to third quartile of expression and whiskers indicate 1.5 × the interquartile range. *** P < 0.001, ** P < 0.01, * p < 0.05, Mann-Whitney. SL = stratum lacunosum, SO = stratum oriens, SP = stratum pyramidale, SR = stratum radiatum, GL = granule layer, ML = molecular layer.
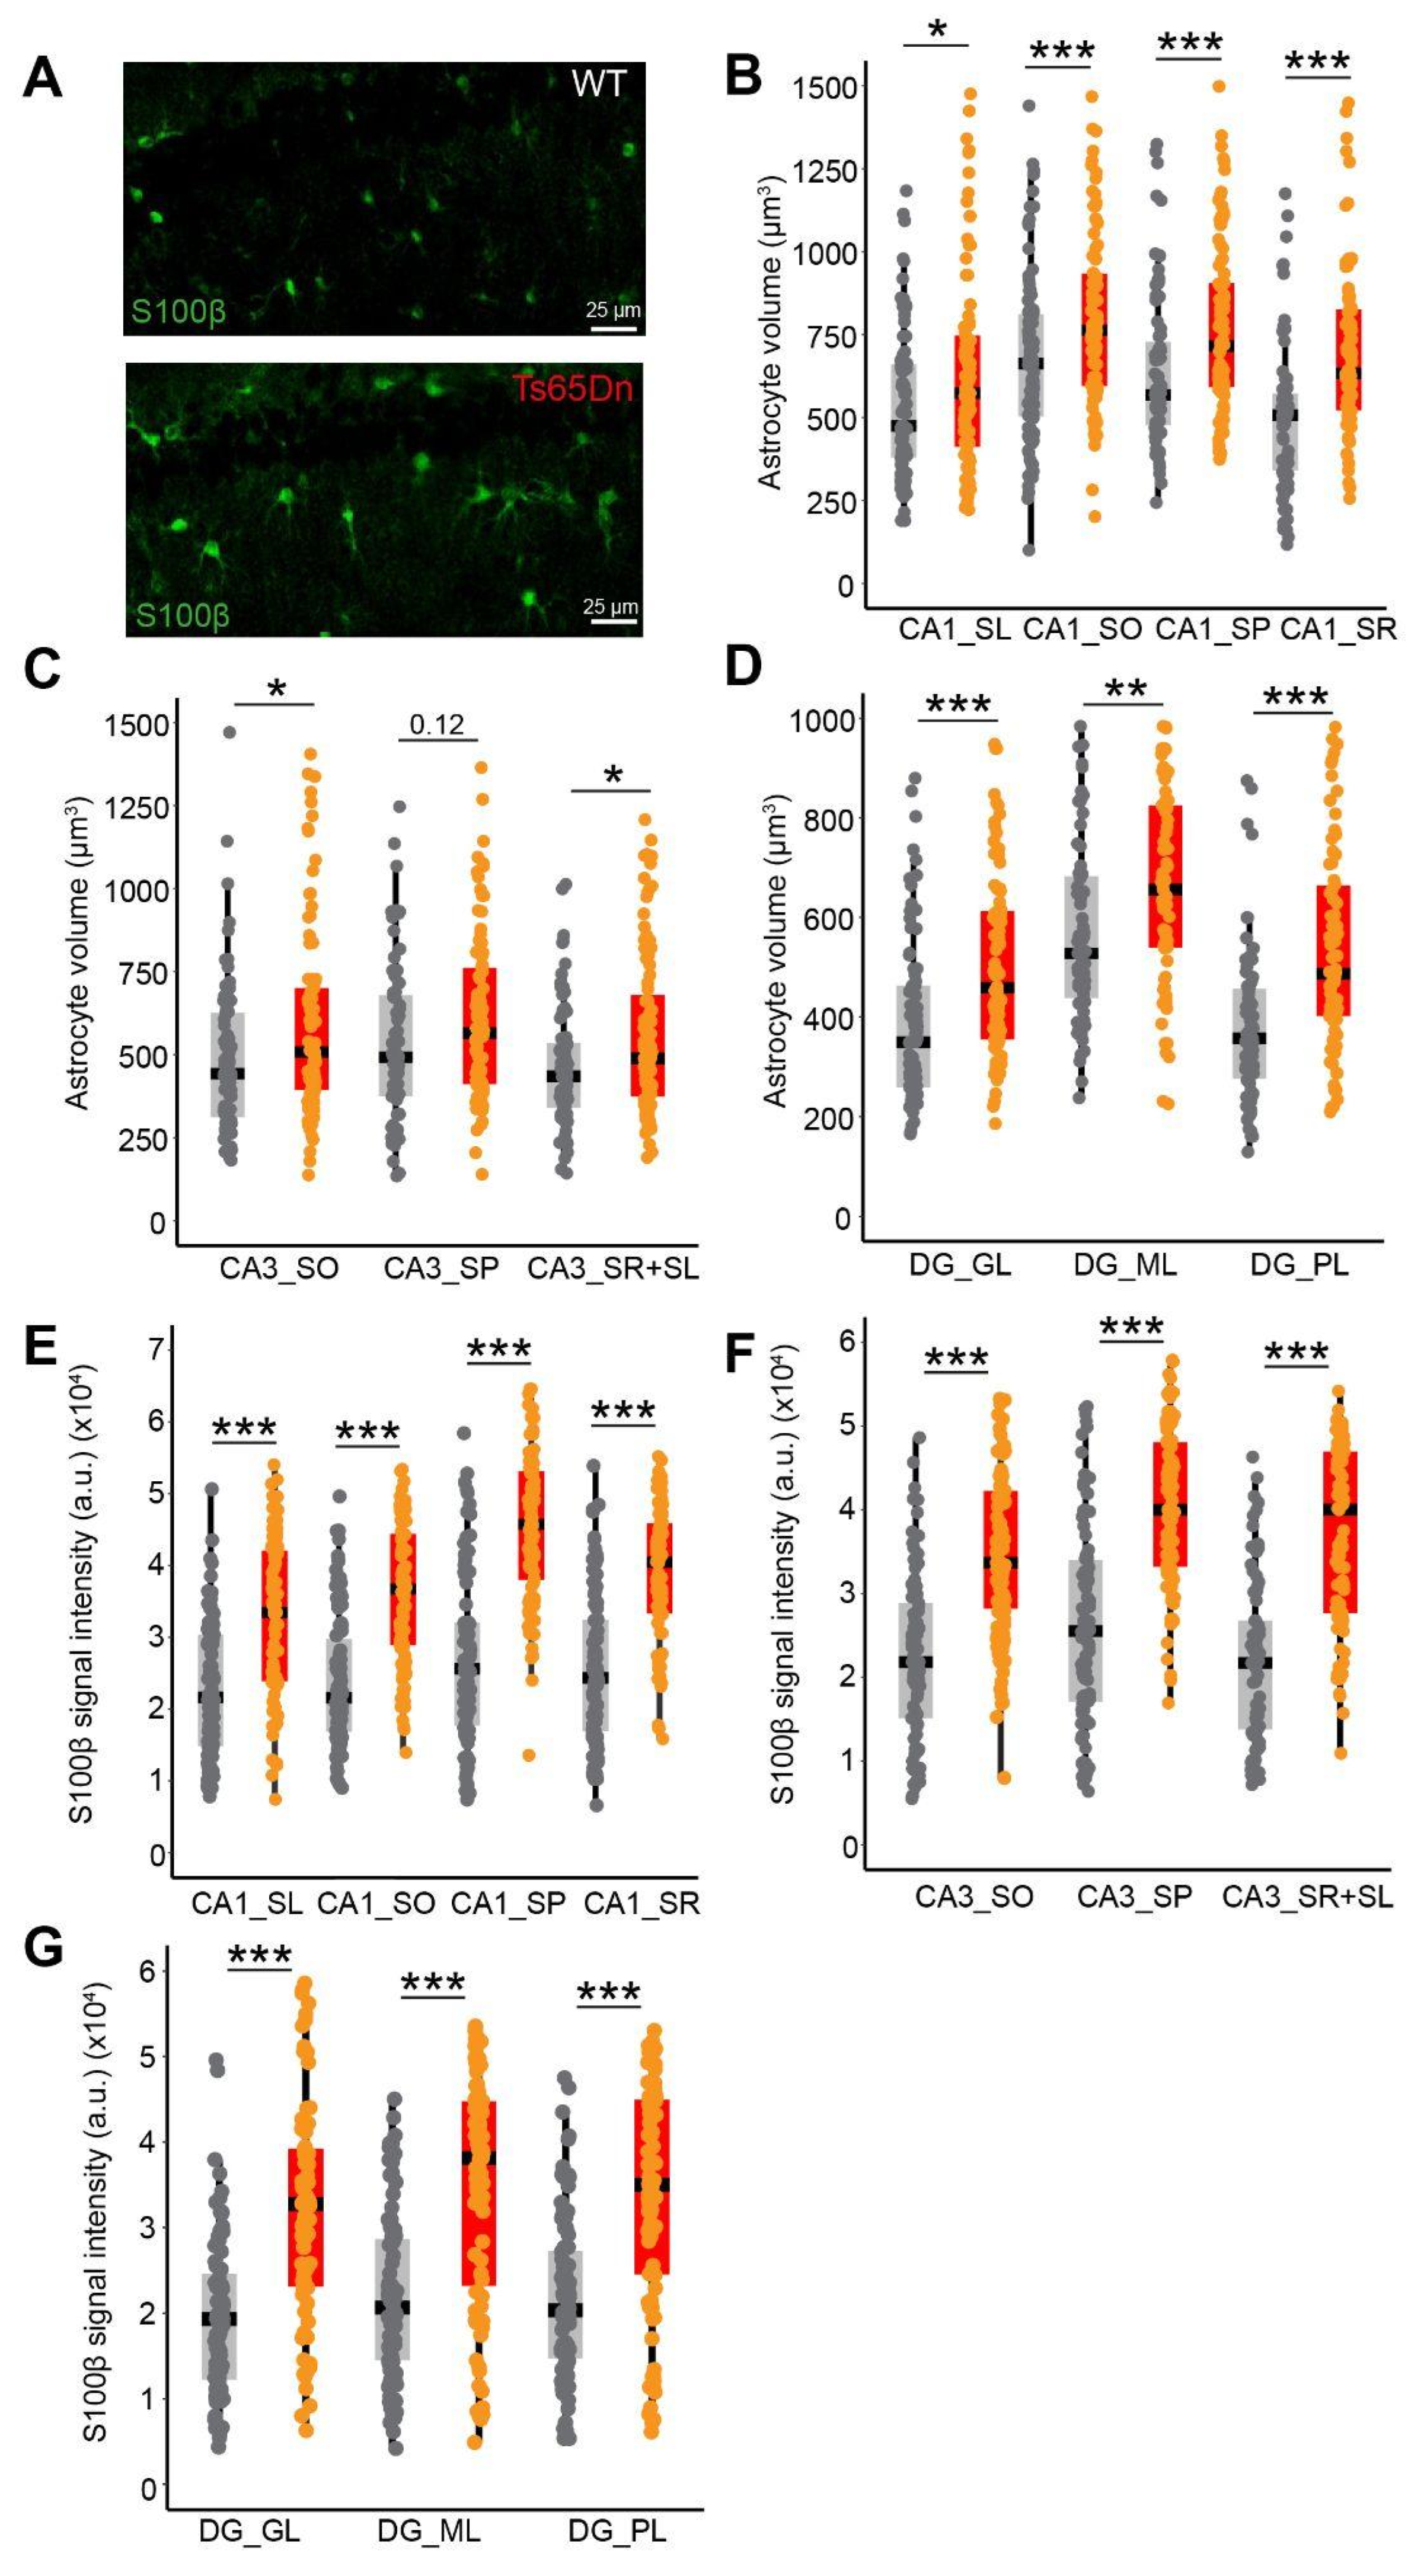
Figure 3.
Ts65Dn astrocytes exhibit abnormal Ca2+ dynamics. (A) Experimental design: AAV5-GFAP-hM3D(Gq)-mCherry and AAV5-gfaABC1D-cyto-GCaMP6f were targeted bilaterally to the dorsal CA1 region of WT and Ts65Dn mice. (B) Left: changes in ΔF/Fo over time for multiple WT astrocytes. Right: changes in ΔF/Fo over time for multiple Ts65Dn astrocytes (WT = 70 astrocytes from 3 mice, Ts65Dn = 70 astrocytes from 3 mice). (C) Mapping of the different events for every astrocyte in WT (left) and Ts65Dn (right) mice. Each dot represents an event (WT = 253 events from 70 astrocytes, Ts65Dn = 205 events from 70 astrocytes). (D) Left: basal and post-CNO Ca2+ oscillation frequency both in WT (gray) and Ts65Dn (red) astrocytes. Right: basal and post-CNO Ca2+ oscillation amplitude in WT and Ts65Dn astrocytes (WT basal = 87 astrocytes from 3 mice, Ts65Dn basal = 109 astrocytes from 3 mice, WT post-CNO = 70 astrocytes from 3 mice, Ts65Dn post-CNO = 68 astrocytes from 3 mice). (E) Time course depicting the mean intracellular Ca2+ signal changes after the local application of CNO (1 mM). CNO application is indicated by a red line at second 5 (WT = 70 astrocytes from 3 mice, Ts65Dn = 68 astrocytes from 3 mice). Data are expressed as mean ± SEM. ***P < 0.001, **P < 0.01, *P < 0.05, Two-way ANOVA, Tukey HSD as post hoc.
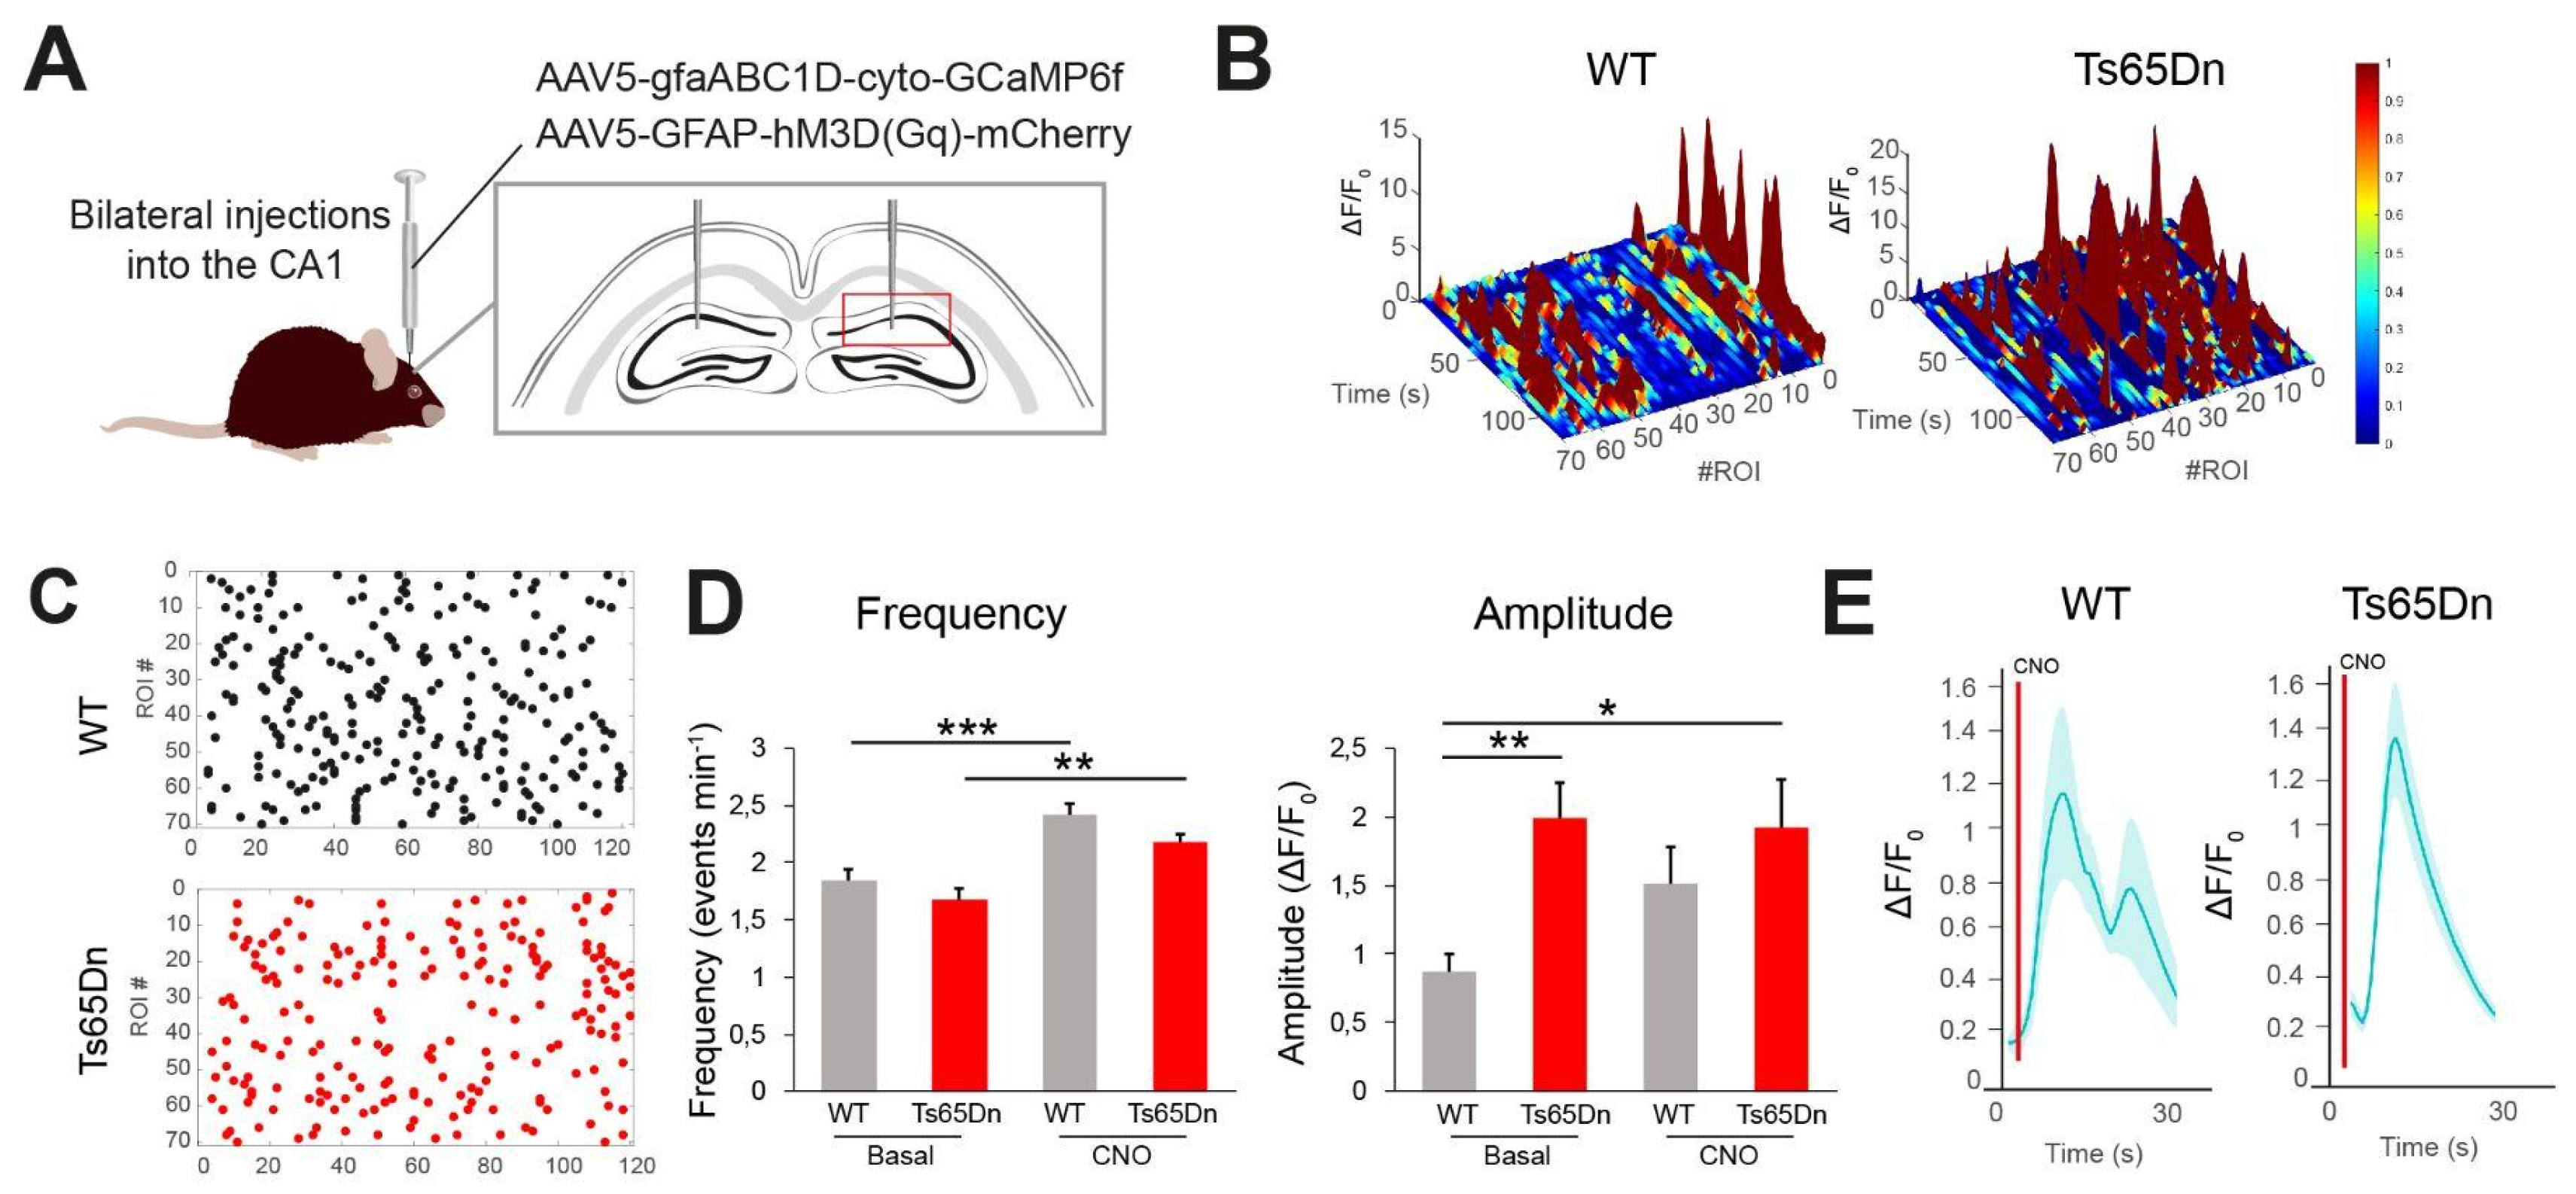
Figure 4.
Trisomic astrocyte manipulation induced a short-term synaptic depression in single synapses. (A) Schematic drawing showing the minimal stimulation protocol. Schaffer collaterals (SCs) were stimulated by an electrode while recording a CA1 pyramidal neuron. Changes in synaptic transmission were evaluated upon activating hM3D(Gq)-expressing astrocytes by a local CNO puff. (B) Above: Schematic representation of the hM3D(Gq)-mCherry-expressing astrocyte terminal surrounding pre- and postsynaptic neurons. Below: Experimental timeline: evoked basal synaptic transmission is recorded during 5 min. At min 5, a CNO puff is applied and evoked synaptic responses are recorded for 10 min. (C,E) EPSCs failures and successes (in gray) in basal conditions (left) and after CNO (right), and synaptic efficacy (mean response, in black). Proportion of synapses that showed potentiation (blue), depression (red) or no changes (orange) in WT (C) and Ts65Dn (E) mice. (D,F) Left: normalized synaptic efficacy changes over 15 min in WT mice (D) (n = 7 out of 13 astrocyte-neuron pairs) and in Ts65Dn mice (F) (n = 6 out of 14 astrocyte-neuron pairs). Right: relative changes of normalized synaptic efficacy in basal conditions and after astrocytes stimulation in WT (D) and in Ts65Dn mice (F). Data are expressed as mean ± SEM. ***P < 0.001, **P < 0.01, *P < 0.05, Paired T test.
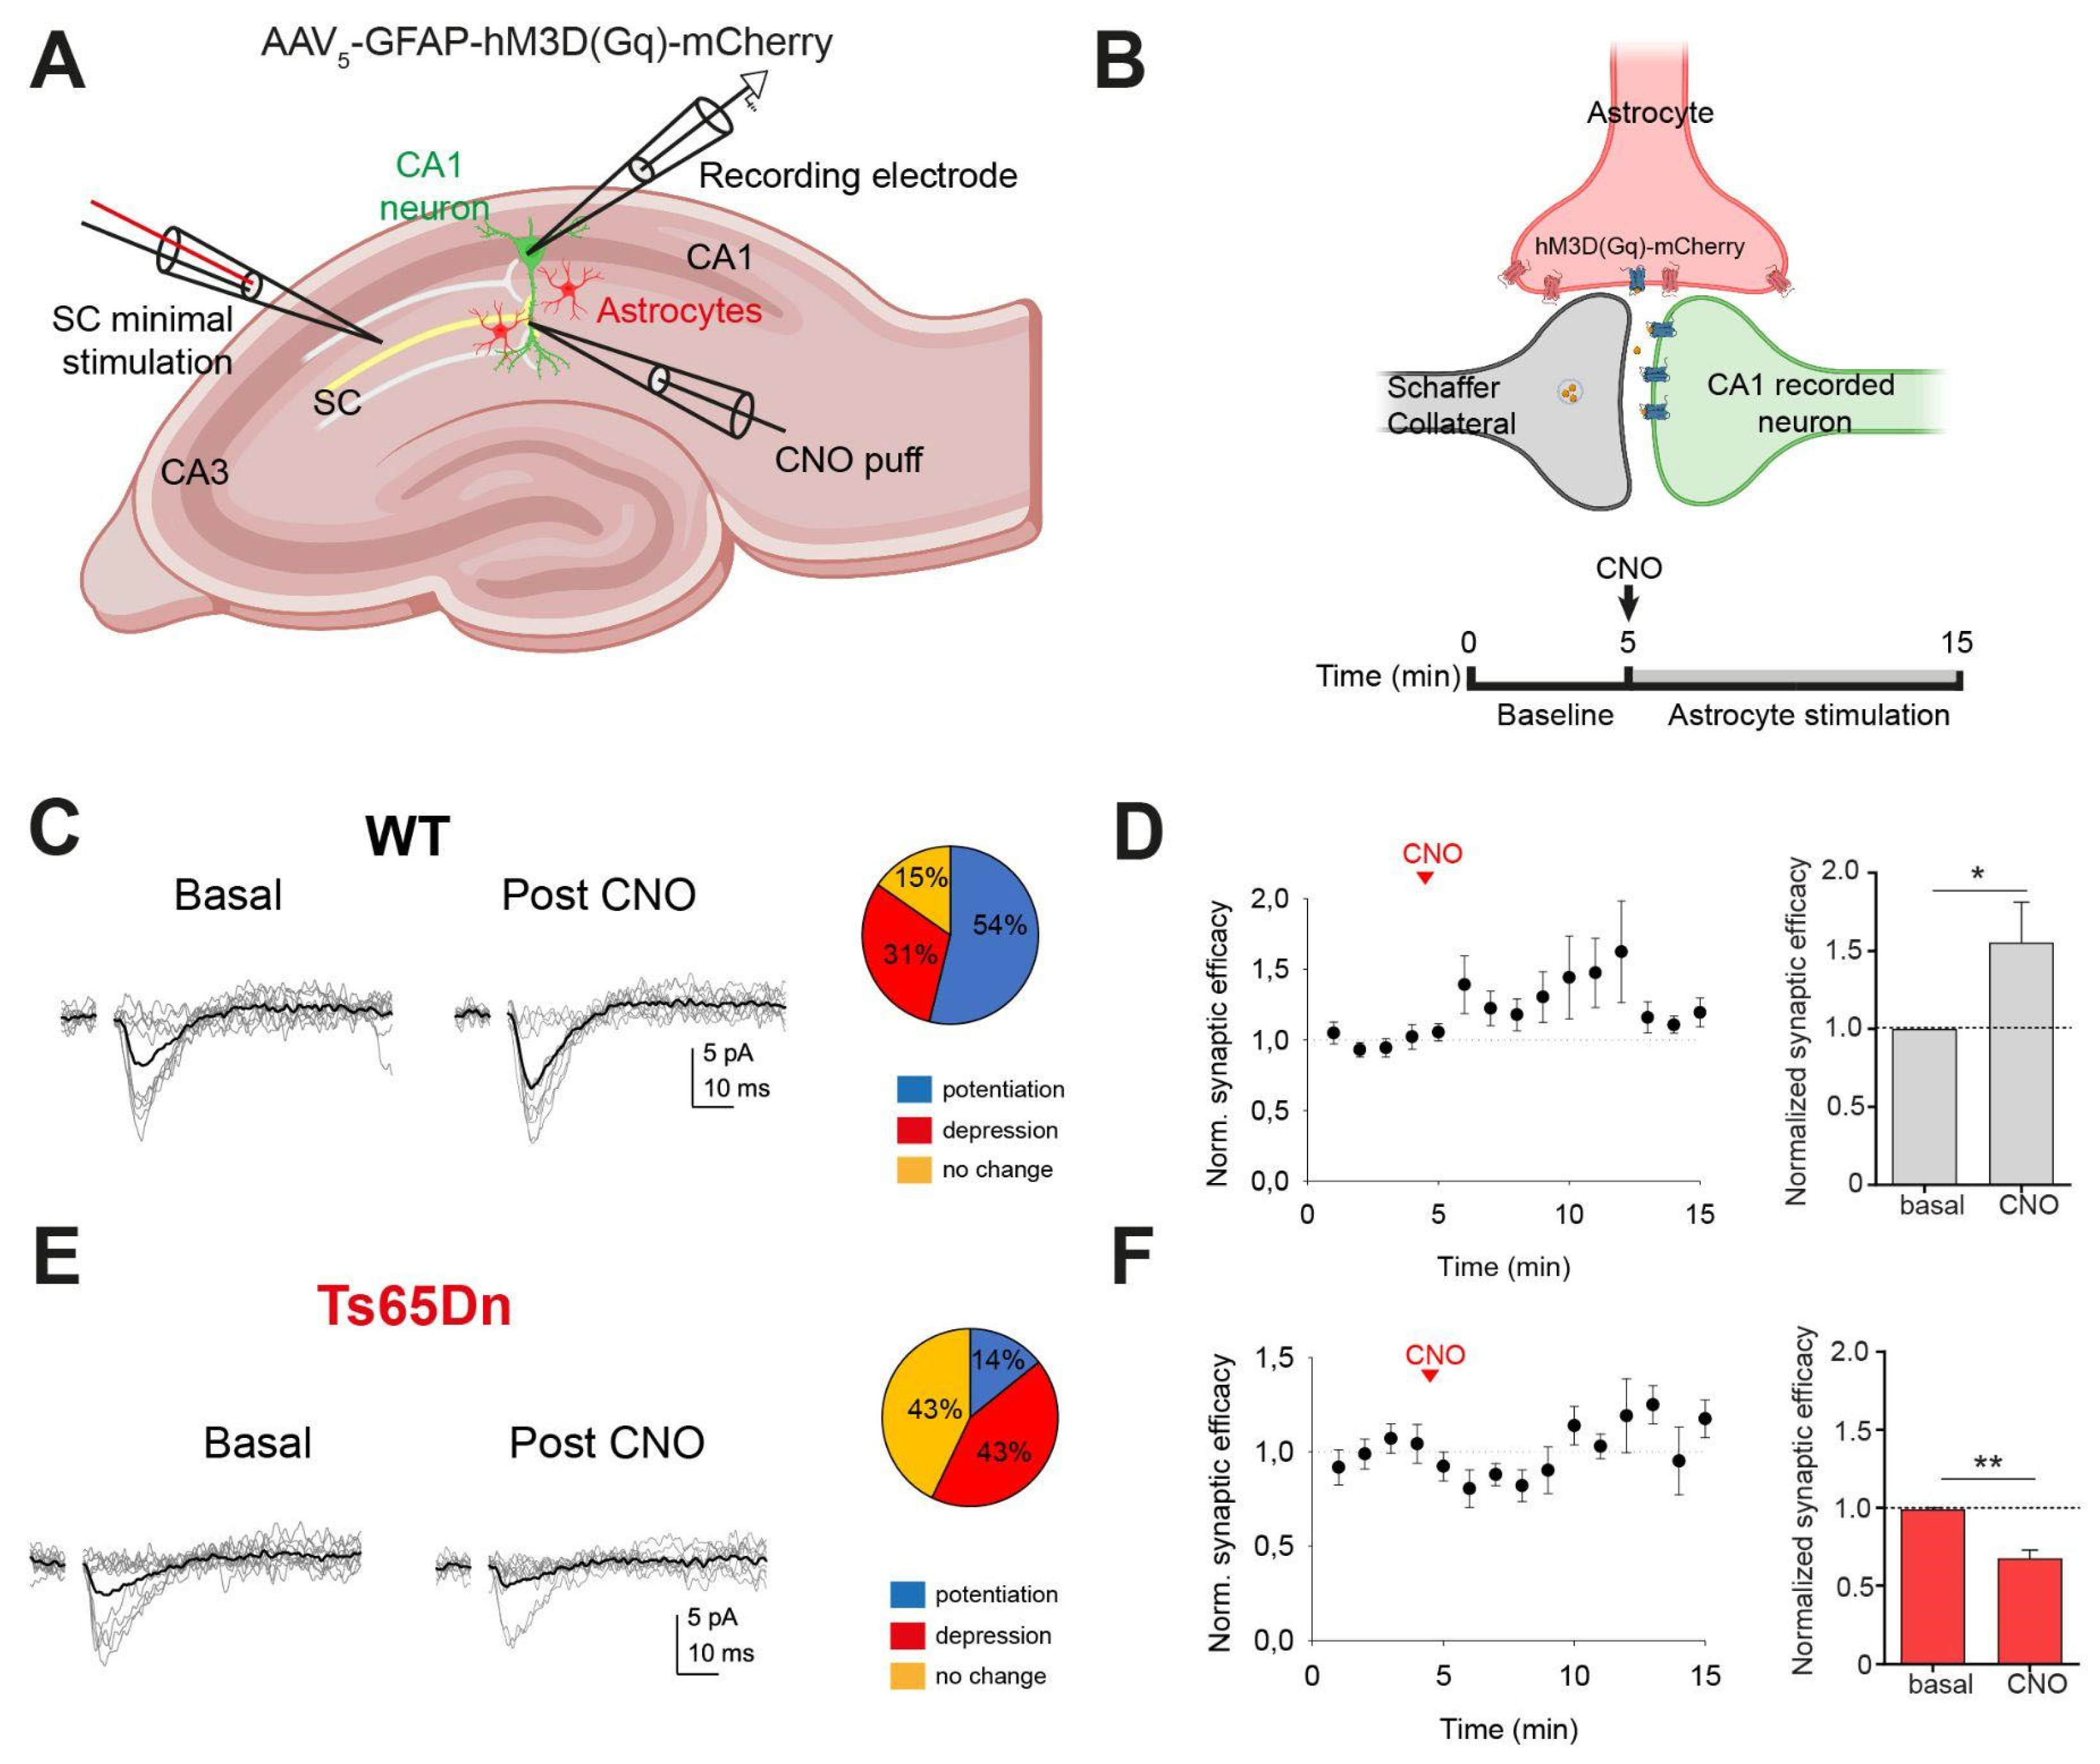
Figure 5.
Differential gene expression in trisomic astrocytes in the hippocampus. (A) UMAP projection of single-nucleus RNA sequencing data showing the distribution of astrocytes from WT (left) and Ts65Dn (right) mice. Two distinct clusters of cells are observed, indicating differences in cell populations. (B) Expression of Ndrg2, a marker for astrocytes, visualized on the UMAP plot. High expression levels are shown in darker shades of blue, confirming the identity of astrocytes in the both clusters. (C) Bar graph depicting the percentage of cells in each cluster (0 and 1) for WT (blue) and Ts65Dn (red) and astrocytes. (D) Volcano plot showing differentially expressed genes between Ts65Dn and WT astrocytes. Genes significantly expressed in Cluster 0 are depicted in red and Cluster 1 in blue. (E) Bar chart representing the percentage of differentially expressed genes (DEGs) across different chromosomes. The chart differentiates between genes that are upregulated (dark blue) and downregulated (cyan) in Ts65Dn astrocytes. Chromosome 16 shows a particularly high proportion of DEGs, reflecting the triplication present in the Ts65Dn mouse model.
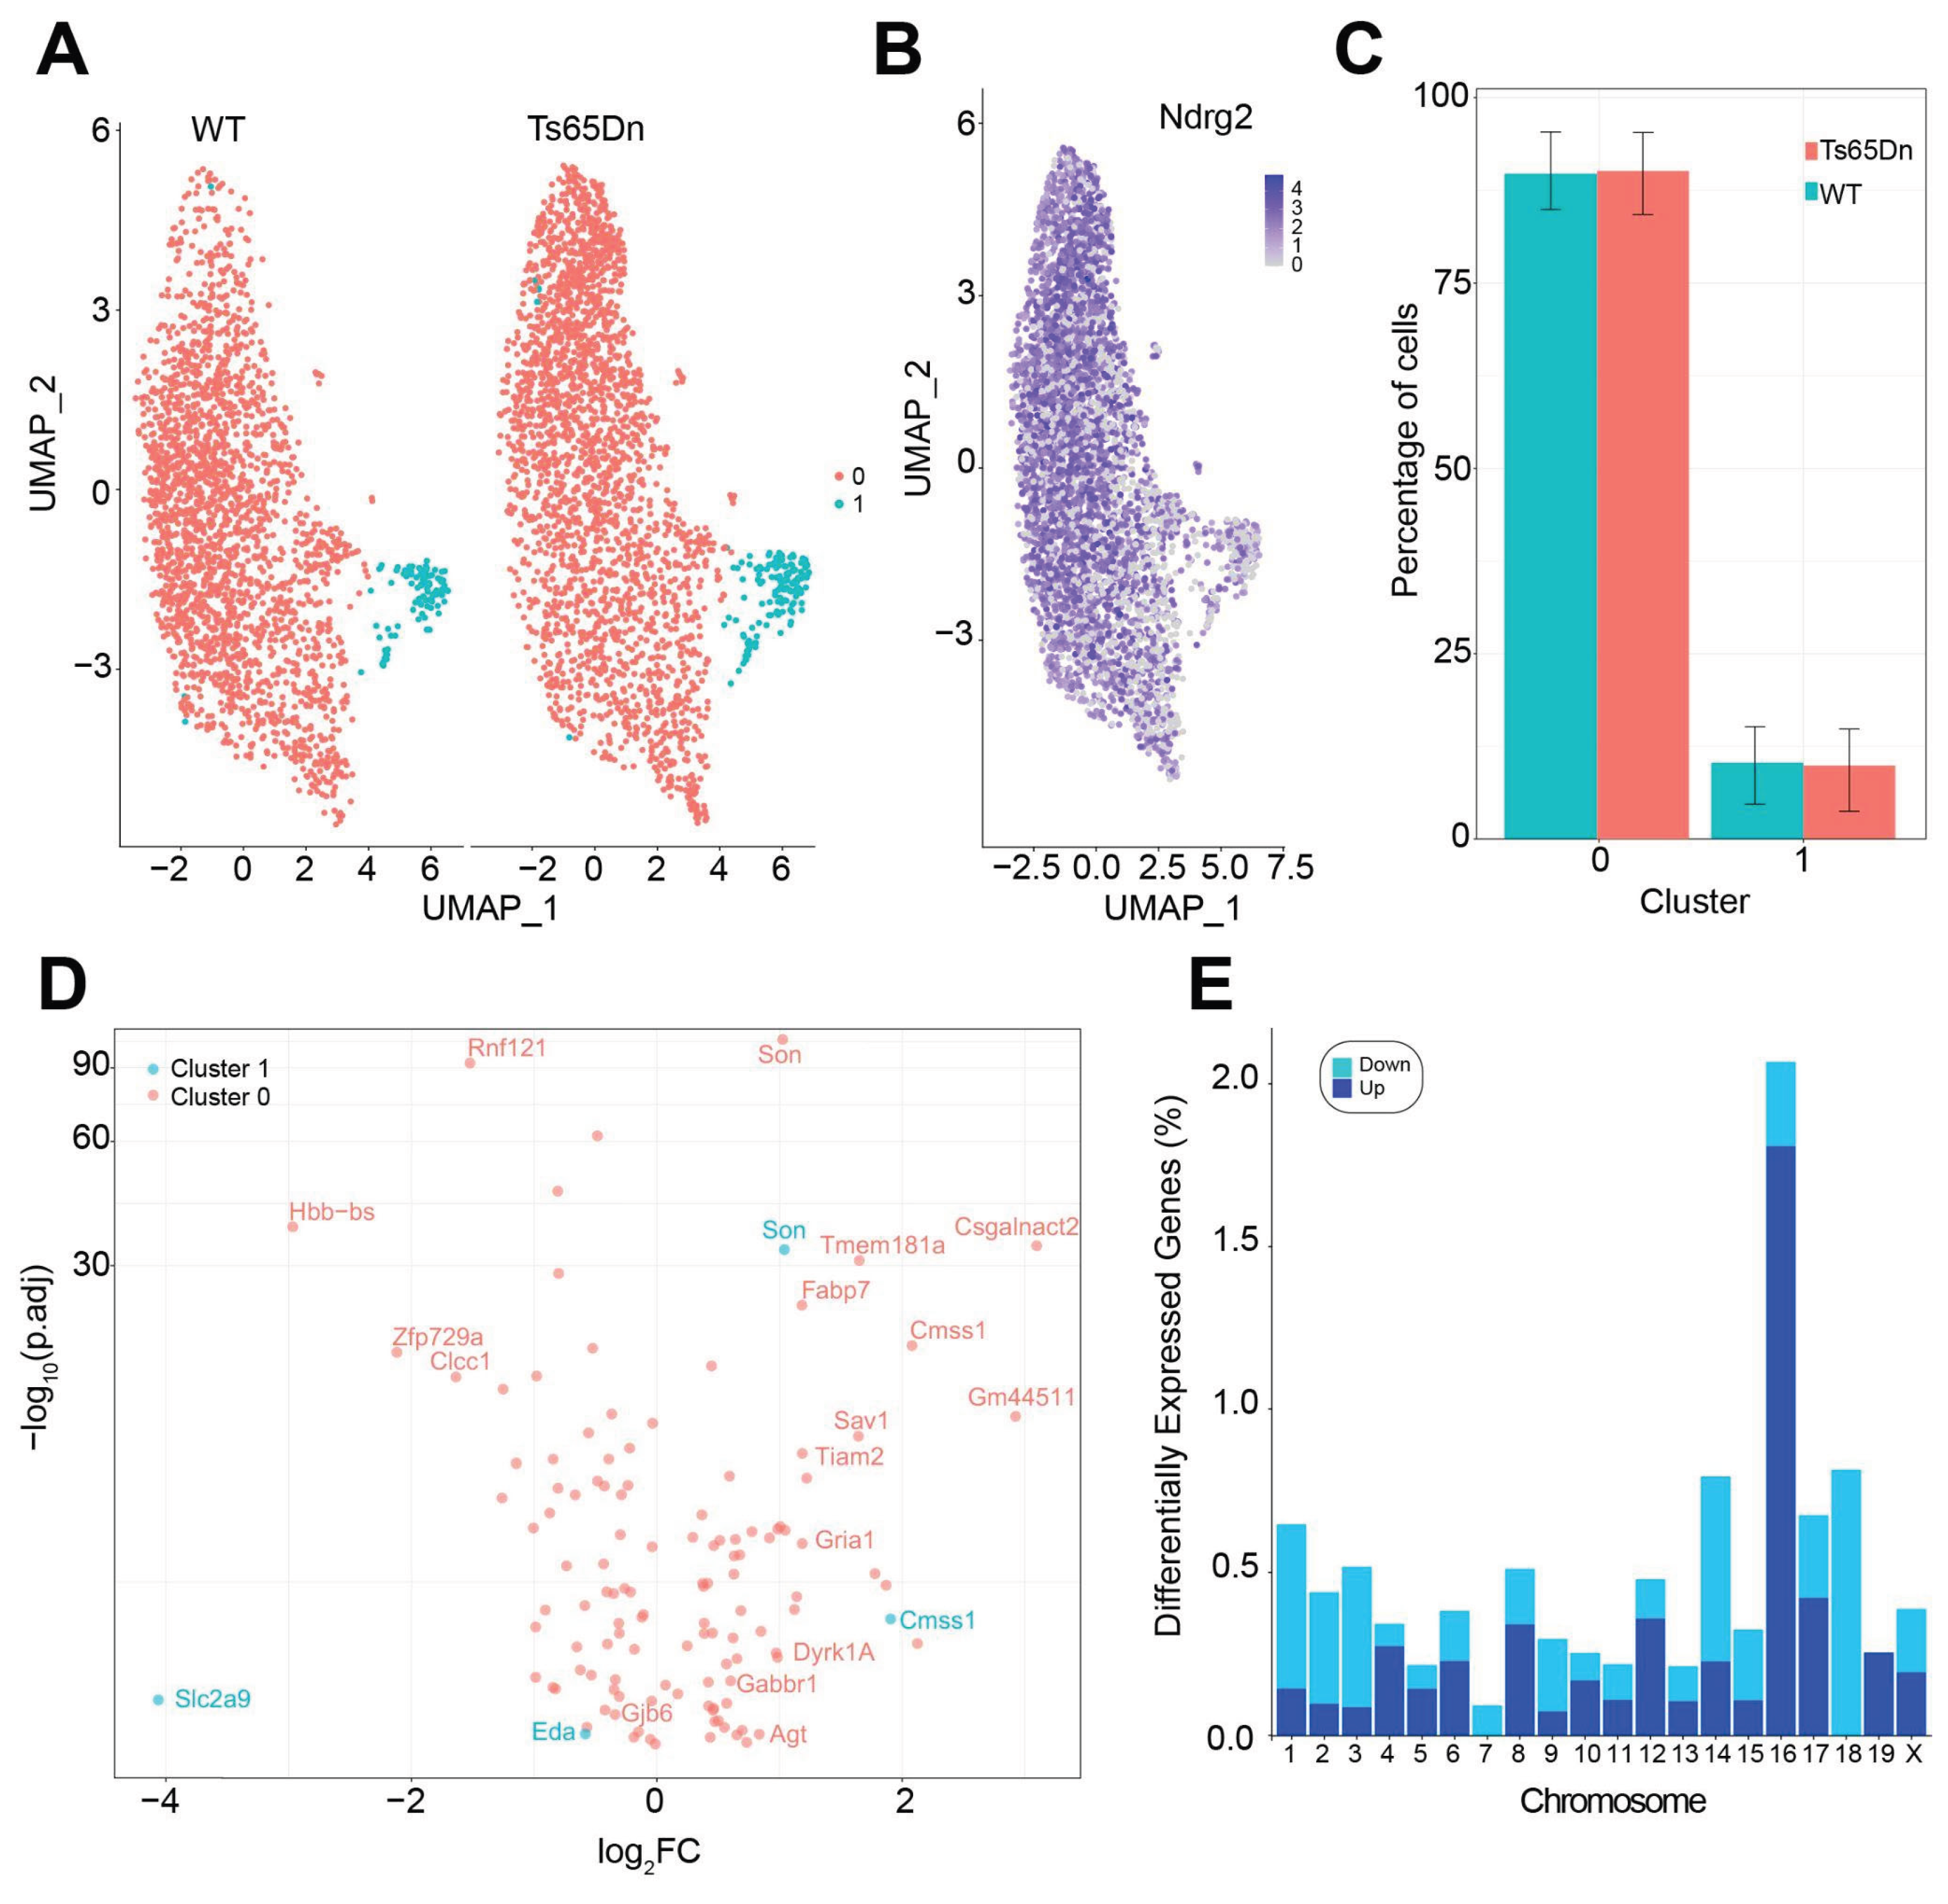
Disclaimer/Publisher’s Note: The statements, opinions and data contained in all publications are solely those of the individual author(s) and contributor(s) and not of MDPI and/or the editor(s). MDPI and/or the editor(s) disclaim responsibility for any injury to people or property resulting from any ideas, methods, instructions or products referred to in the content. |
© 2025 by the authors. Licensee MDPI, Basel, Switzerland. This article is an open access article distributed under the terms and conditions of the Creative Commons Attribution (CC BY) license (http://creativecommons.org/licenses/by/4.0/).
Copyright: This open access article is published under a Creative Commons CC BY 4.0 license, which permit the free download, distribution, and reuse, provided that the author and preprint are cited in any reuse.


