Submitted:
07 October 2023
Posted:
09 October 2023
You are already at the latest version
Abstract
Modern war is sudden and rapid, and once the battle starts, the demand for equipment maintenance and guarantee will show an outburst situation, which puts equipment maintenance and guarantee capability to a severe test. To accurately grasp the civil-military integration of aviation maintenance and guarantee capabilities, it is necessary to evaluate their capabilities. To this end, the evaluation indicator system is established by using the three-dimensional indicator system construction model of "maintenance task → task demand → capability demand", and the evaluation method based on intuitionistic fuzzy entropy and normal grey cloud model is proposed, using intuitionistic fuzzy entropy theory to determine the expert weights and indicator weights, and the grey cloud model theory to determine the capability evaluation level. Finally, the application process of the evaluation model is demonstrated through specific examples, and the evaluation results are analyzed to verify the effectiveness of the evaluation model.
Keywords:
intuitionistic fuzzy entropy
; normal grey cloud model
; civil-military integration
; maintenance and guarantee
; capability evaluation
1. Introduction
With five generations of aircraft successively equipped with troops, aviation equipment technology is increasingly complex, relying on the army to protect the force has been unable to fully meet the needs of modern warfare, to take the road of civil-military integration and maintenance of the world's military transformation, the realization of the unity of the rich and strong military, but also to improve civil-military integration of aviation equipment maintenance and guarantee capabilities and equipment readiness rate of the inevitable choice.
The evaluation of civil-military integrated aviation maintenance and guarantee capability is to accurately grasp the current status of aviation maintenance and guarantee capability and lay the foundation for subsequent improvement and enhancement of aviation equipment maintenance and guarantee capability. In the specific evaluation, the construction of an indicator system and evaluation model are the two main links. Whether the evaluation indicator system is scientific and reasonable will directly determine the effect of the whole evaluation work. Therefore, should follow the idea of "focusing on the task and based on the capability" to construct the evaluation indicator system scientifically. Because there are many influencing factors involved in the maintenance and guarantee capability of civil-military integrated aviation equipment, and the evaluation work has the characteristics of complexity, vagueness, and uncertainty, the evaluation method based on the intuitive fuzzy entropy and the normal grey cloud model is proposed, and it is verified to be feasible and effective through specific examples.
2. Construction of the evaluation indicator system
When constructing the evaluation indicator system of civil-military integrated aviation equipment maintenance and guarantee capability, the first step is to clarify the maintenance task set of aviation equipment, then decompose and refine the maintenance task into specific task requirements to establish the task requirement set, and then transform the maintenance task requirements to the maintenance capability requirements to form the capability requirement set, to establish the "Maintenance Task → Task Requirements → Capability Requirements " Three-dimensional evaluation indicator system construction model [1], as shown in Figure 1. The three-dimensional model has a simple structure, which visually reflects the indicator construction process, and is used to analyze the feasibility of the evaluation indicator system of equipment maintenance and guarantee capability [2].
On this basis, by the principles of scientificity, objectivity, completeness, and independence, the evaluation indicator system of civil-military integrated aviation maintenance and guarantee capability was constructed from six aspects, namely, maintenance operation capability, resource guarantee capability, information system operation, and management capability, command and management capability, maintenance technology application capability and comprehensive guarantee capability, as shown in Figure 2.
3. Weight determination based on intuitionistic fuzzy entropy methods [3]
Assume that the set of experts is , the set of evaluation indicators is , where is the qualitative indicator set, and is the quantitative indicator set. Experts evaluate the qualitative indicators to obtain the subjective evaluation matrix .
where denotes the evaluation value of the evaluation object given by the expert concerning the indicator ; the statistically obtained objective evaluation matrix is denoted as .
It should be noted that each expert gives qualitative subjective evaluation information, and the objective evaluation information is obtained directly from statistical analyses, and there is no correlation between subjective and objective evaluation information. The key to the problem of multi-criteria evaluation of mixed evaluation information lies in determining the weights of experts and the weights of subjective and objective indicators, and on this basis, the evaluation information of subjective and objective indicators is assembled. The specific steps are as follows:
Step 1: The subjective evaluation information given by each expert is uniformly transformed into intuitionistic fuzzy numbers.
It is assumed that the set of linguistic evaluations used for the expert qualitative measure is and its granularity is +1. The inter-translation relationship between linguistic variables and intuitionistic fuzzy numbers is shown in Table 1.
Let be linguistic variables in and , then is an uncertain linguistic variable, and the two endpoints of the interval are the lower and upper limits of the uncertain linguistic variable. transformed intuitionistic fuzzy numbers are , . The uncertain linguistic variables are linguistic intervals, which can be weighted based on the IFWA operator to integrate the intuitionistic fuzzy numbers represented by the upper and lower limits of the uncertain linguistic variables, i.e.
where , which is generally taken as , thus transforming uncertain linguistic variables into intuitionistic fuzzy numbers.
According to Table 1 and equation (3), the linguistic variables are uniformly transformed into intuitionistic fuzzy numbers to obtain the evaluation matrix in which subjective evaluation information is transformed into intuitionistic fuzzy numbers.
Step 2: Calculate the score function and the overall deviation of the evaluation to determine the weight of each expert.
The deviation between the intuitionistic fuzzy subjective evaluation matrices can be reflected by the deviation between the transformed score function matrices.
Let be a set of intuitionistic fuzzy numbers and , then the score function of is .
Among them, , , .
denotes the intuitionistic fuzzy number the ratio of the degree of affiliation to the degree of non-affiliation of the intuitionistic fuzzy numbers, also known as the set-pair potential of the degree of affiliation to the degree of non-affiliation; denotes the set-pair potential of overall affiliation to overall non-affiliation for this set of intuitionistic fuzzy numbers; denotes the relative set-pair potential of the affiliation and non-affiliation of when considering this set of intuitionistic fuzzy numbers as a whole.
The score function of each intuitionistic fuzzy evaluation information is calculated from equation (5), thus obtaining the corresponding score function matrix .
The mean value of each expert's score function value regarding the evaluation object under the subjective evaluation indicator is .
Thus, it can be obtained the average deviation between the expert and the group of experts about the evaluation object under each subjective evaluation indicator.
In general, the greater the deviation of the evaluation information of the expert from the average evaluation information of the expert group, the greater the disagreement between the evaluation opinion of the expert and the expert group, and it is difficult to reach an agreement, so the expert should be given a smaller weight; on the contrary, if the deviation of the evaluation information of the expert from the average evaluation of the expert group is smaller, the greater the degree of consistency between the evaluation opinion of the expert and the expert group, and the greater weight should be given to the expert. Based on this, the weight of each expert is obtained.
Step 3: Determine the group intuition fuzzy subjective evaluation matrix and merge it with the normalized objective evaluation information to obtain the group intuition fuzzy mixed subjective and objective evaluation matrix.
From the intuitionistic fuzzy subjective evaluation matrix and each expert weight , the group intuitionistic fuzzy subjective evaluation matrix is obtained based on the operator.
Among them, .
For the exact number of indicator values , the vector specification method is used, i.e.
where denotes a positive indicator, and denotes a reverse indicator.
Normalized exact numbers can be viewed as special interval numbers, i.e., interval numbers with equal upper and lower bounds, which translates into the intuitionistic fuzzy numbers obtained as .
The objective evaluation information containing exact numbers is normalized according to equation (11), and at the same time, the normalized evaluation values are converted into intuitionistic fuzzy numbers to obtain the corresponding intuitionistic fuzzy objective evaluation matrix , and the group intuitionistic fuzzy subjective evaluation matrix is merged with the objective evaluation matrix to obtain the group intuitionistic fuzzy evaluation matrix , which mixes subjective and objective evaluation information.
Step 4: Determine the evaluation indicator weights based on intuitive fuzzy entropy.
The intuitive fuzzy entropy of the evaluated value of each indicator is:
The intuitionistic fuzzy entropy of each indicator value constitutes a matrix of . The larger is, the greater the degree of uncertainty of the intuitionistic fuzzy number is; at the same time, if the intuitionistic fuzzy entropy of the evaluation object about a single indicator is larger, it means that the validity of the evaluation information of the indicator is poorer, and the role of this indicator on the evaluation results is also smaller, and it should be given smaller weights.
The weights of the indicators are .
4. Integrated evaluation method based on normal grey cloud model
The key to comprehensive evaluation is to choose an appropriate method. At present, the research on civil-military integration of aviation equipment maintenance and guarantee is still shallow, the data accumulation is small, the knowledge and experience of experts are not comprehensive, and the evaluation language is fuzzy, which is in line with the grey system characteristics. At the same time, the theory of the normal cloud model expresses both the incompleteness and vagueness of information and fully considers the randomness of human subjective judgment [4]. Therefore, for the ambiguity, randomness, and incompleteness of decision-making information in evaluation, the normal grey cloud model is established to evaluate the maintenance capability.
4.1. Normal grey cloud model theory [5]
Set be a field of arguments, and be a linguistic value matching . The whitening power of an element concerning the grey concept expressed by is a random number with a stable tendency, then the distribution of whitening power on the argument domain is called the grey-cloud whitening power function, or grey cloud for short. The grey cloud is a mapping from the argument domain to the interval , i.e., .
The grey cloud model is modeled by peak , left and right bounds , entropy and super-entropy and other numerical features to characterize quantitative concepts, denoted as:. Among them, the peak value denotes the value with whitening power equal to 1, which is the value that best characterizes the qualitative concepts; the left and right boundary values reflect the range of values of grey concepts in the domain ; entropy reflects the degree of dispersion of the grey cloud of qualitative concepts; super-entropy is a measure of uncertainty, indicating the randomness of the assessment level boundaries.
The universality of normal distribution and the universality of bell-shaped affiliation function together determine the universality of the normal cloud model. Therefore, this paper adopts the point-peak normal grey cloud model to evaluate the equipment maintenance and guarantee capability, and the calculation formula of the numerical characteristics corresponding to its different indicators is as follows:
In equation (16), the is a given constant reflecting the linear relationship between and , which is used to adjust the degree of fogging of the cloud model.
The whitening weight function of the normal grey cloud model is:
where is the value of as the expectation and is the normal random number with standard deviation.
Assuming that there are evaluation indicators in the evaluation system and there are grey classifications for the clustering object, a normal grey cloud model is established for indicator belonging to grey class , and its corresponding whitening weight function is noted as , and is the quantitative value of evaluation indicator . According to the classification of the whitening weight function, the normal grey cloud model can also be classified into the upper limit measure type, the lower limit measure type, and the moderate measure type with the following formula:
- 1.
- The upper limit measures the normal grey cloud model.
- 2.
- The lower bound measures the normal grey cloud model.
- 3.
- Moderately measured normal grey cloud model.
4.2. Methodology and steps for the integrated evaluation [6]
4.2.1. Determination of the grey level of the evaluation
The evaluation grade of civil-military integrated aviation equipment maintenance and guarantee capability is divided into {poor, medium, good, and excellent} four grey categories. According to the evaluation indicator system, the grey cloud model is constructed separately for quantitative and qualitative indicators.
4.2.2. Constructing a normal grey cloud model
- 1.
- Grey cloud model for qualitative indicators.
For the quantification of qualitative indicators, existing studies mainly use the expert rating method to give evaluation scores. Using the linguistic evaluation set adopted by experts for qualitative indicators in the previous section, the left and right bounding values of each grade are set in the interval from 0 to 1. Using equations (14) to (16), the peak value, entropy value, and super entropy are calculated to obtain the grey class grades and numerical features of qualitative indicators, and the grey cloud model is generated by using MATLAB software.
The probability of an expert's rating of a qualitative indicator during the indicator assignment process is converted into a final degree of affiliation of the qualitative indicator concerning each grey category rating. This degree of affiliation can be regarded as a whitening weight coefficient, reflecting the degree of preference of the evaluation indicator for belonging to the grey class hierarchy, which determines the whitening weight of the qualitative indicator.
- 2.
- Grey cloud model for quantitative indicators.
According to the value range of the quantitative indicators, four evaluation grades of "excellent, good, medium, and poor" are classified, and the left and right boundary values of each grade are determined. The peak value , the entropy value , and the super-entropy corresponding to each pair of bounds are calculated according to Eqs. (14) to (16).
According to the left and right boundary values and numerical characteristics of the four grey class levels, the normal grey cloud model corresponding to each level of the evaluation indicator was constructed by performing times whitening weight calculation with the help of MATLAB software by Eqs. (18) to (20).
4.2.3. Solving for grey cloud whitening weights
The whitening weights of the evaluation indicators reflect the degree of affiliation of the evaluation indicator data to each evaluation class. When calculating the whitening weight of indicator concerning grey class according to the normal grey cloud whitening weight function , the whitening weight value obtained from each calculation is not the same due to the existence of random variables in . To increase the credibility of the whitening weights, the method of multiple calculations to find the mean value is adopted to determine the final whitening weights. Assuming that operations are carried out, the whitening weight value of the indicator obtained from each operation is regarded as a cloud droplet, and the average value of the whitening weight of each grey class level of the indicator obtained from calculations is taken to be , and the larger is, the smaller the randomness of the average value is, and the more stable the whitening weight is.
where is the quantitative value of evaluation indicator in the object to be evaluated; is the weight of grey cloud whitening calculated for the time.
The whitening weights for each grey class level of the same indicator are normalized to obtain the final indicator grey cloud whitening weights , calculated by the formula:
4.2.4. Calculation of integrated clustering coefficients
Based on the weights and whitening weights of all evaluation indicators, the integrated clustering coefficient of the evaluation object belonging to the gray class is calculated using equation (23).
where is the grey cloud whitening weight of the evaluation indicator belonging to grey class ; is the clustering weight of the indicator.
4.2.5. Determination of evaluation ratings and scores
The integrated clustering coefficients of the evaluation objects corresponding to each grey class are calculated according to the above steps, and the integrated clustering vector is:
Based on the formula:
The gray class of the evaluated object can be judged, to determine its maintenance ability level.
Let the total score by 100 points, then the grade corresponding to the score is
Then the rating value of the evaluated subject is
5. Example analysis
In the XX action exercise, the military and civilian maintenance and guarantee forces cooperated fully to complete the maintenance and guarantee tasks of the exercise. Through expert scoring and data collection, qualitative and quantitative analyses were conducted on the aviation maintenance and guarantee capabilities demonstrated in the exercise, and the evaluation model constructed was used to conduct a comprehensive evaluation of the integrated maintenance and guarantee capabilities of the military and the civilian side and to analyze the shortcomings and weaknesses that existed in the process of maintenance and guarantee of equipment.
5.1. Evaluation of data collection and processing
5.1.1. Data collection and processing of qualitative indicators
The qualitative indicators are assigned by the expert scoring method, inviting experts, professors, and business leaders from the exercise evaluation team, maintenance and guarantee departments, military academies, and other units. A total of five people, using 4-grain linguistic variables , which represent "poor, medium, good and excellent", respectively, to assign values to the qualitative indicators, and the results of the scoring of the qualitative indicators are shown in Table 2.
The linguistic variables given by the experts were converted into intuitionistic fuzzy numbers according to Table 1, and the intuitionistic fuzzy number evaluation matrix was obtained from five experts regarding the qualitative indicators, .
|
] |
|
|
|
|
|
] |
|
|
] |
|
|
] |
5.1.2. Quantitative indicator data collection and processing
The quantitative indicators are based on the statistical data of the maintenance and guarantee institutions of both the civil and military sides on the configuration of personnel, equipment, materials, information systems, etc., and the data collected in the course of the exercise, and some of the data were declassified due to the need for confidentiality, and the results of the calculation of the quantitative indicators and their attributes are shown in Table 3.
The results of the standardization of the quantitative indicator data are shown in Table 4.
Standardized exact numbers can be regarded as a special interval number, i.e., an interval number with equal upper and lower limits so that the intuitionistic fuzzy number obtained from the transformation is , and the specific results are shown in Table 4.
5.2. Calculation of expert weights
For the intuitionistic fuzzy number evaluation matrix of five experts about the qualitative indicators, the score function of each intuitionistic fuzzy evaluation information is calculated by using equation (5), and the score function matrix is obtained corresponding to .
S1 = [0.5,0.85,0.5,0.85,0.5,0.5,0.1,0.1,0.85,0.85,0.1,0.1,0.5,0.85,0.85,0.85,0.5, -0.45]
S2 = [-0.45,0.5,0.85,0.5,0.1,0.5,0.5,0.5,0.5,0.5,0.5,0.1,0.1, -0.45,0.85,0.85,0.85,0.5]
S3 = [0.1,0.5,0.5,0.1,0.5,0.1,0.5,0.5,0.85,0.85,0.5,0.5,0.1,0.5,0.5,0.85,0.85,0.5]
S4 = [0.5,0.5,0.1,0.5,0.1,0.1,0.5,0.1,0.85,0.85,0.1,0.5,0.5,0.5,0.5,0.5,0.85,0.1]
S5 = [0.85,0.1,0.85,0.5,0.5, -0.45,0.5,0.5,0.85,0.5,0.5,0.5,0.5,0.1,0.85,0.5,0.5,0.5]
The mean value of the expert's score function about the evaluation object under the qualitative indicator is calculated from equation (7).
S = [0.3,0.49,0.56,0.49,0.34,0.15,0.42,0.34,0.78,0.71,0.34,0.34,0.34,0.3,0.71,0.71,0.71,0.23]
Calculated from equation (8), the average deviation between expert and the group of experts about the evaluation object under the subjective evaluation indicator is:
H1=0.2567, H2=0.2478, H3=0.1578, H4=0.1639, H5=0.2239.
The weight of each expert is calculated from equation (9) as:
λ1=0.1882, λ2=0.1904, λ3=0.2132, λ4=0.2117, λ5=0.1965.
5.3. Calculation of indicator weights
Based on the intuitionistic fuzzy subjective evaluation matrix and the expert weights , the group intuitionistic fuzzy subjective evaluation matrix is obtained using the intuitionistic fuzzy weighted arithmetic mean operator as follows:
| [〈0.6790,0.2241〉〈0.7303,0.1766〉〈0.7815,0.1355〉〈0.7280,0.1786〉〈0.6316,0.2643〉 〈0.5538,0.3434〉〈0.6697,0.2279〉〈0.6320,0.2639〉〈0.8767,0.0651〉〈0.8470,0.0855〉 〈0.6320,0.2639〉〈0.6360,0.2600〉〈0.6313,0.2646〉〈0.6789,0.2241〉〈0.8405,0.0901〉 〈0.8434,0.0880〉〈0.8474,0.0852〉〈0.6028,0.2932〉] |
According to Table 4, the group intuition fuzzy objective evaluation matrix is as follows:
| [〈0.8875,0.1125〉〈0.9500,0.0500〉〈0.8958,0.1042〉〈0.7500,0.2500〉〈0.9000,0.1000〉 〈0.7292,0.2708〉〈0.6700,0.3300〉〈0.8550,0.1450〉〈0.6000,0.4000〉〈0.3500,0.6500〉 〈0.8700,0.1300〉〈0.8400,0.1600〉〈0.8700,0.1300〉〈0.9600,0.0400〉〈0.6800,0.3200〉 〈0.2500,0.7500〉〈0.2000,0.8000〉〈0.3000,0.7000〉〈0.7000,0.3000〉〈0.8200,0.1800〉] |
Combining the subjective and objective evaluation matrices, the group intuition fuzzy evaluation matrix is obtained as follows:
| [〈0.8875,0.1125〉〈0.9500,0.0500〉〈0.8958,0.1042〉〈0.7500,0.2500〉〈0.9000,0.1000〉 〈0.7292,0.2708〉〈0.6700,0.3300〉〈0.8550,0.1450〉〈0.5000,0.5000〉〈0.3500,0.6500〉 〈0.8700,0.1300〉〈0.6790,0.2241〉〈0.8400,0.1600〉〈0.8700,0.1300〉〈0.9600,0.0400〉 〈0.6800,0.3200〉〈0.7303,0.1766〉〈0.7815,0.1355〉〈0.7280,0.1786〉〈0.6316,0.2643〉 〈0.5538,0.3434〉〈0.6697,0.2279〉〈0.6320,0.2639〉〈0.8767,0.0651〉〈0.8470,0.0855〉 〈0.6320,0.2639〉〈0.6360,0.2600〉〈0.6313,0.2646〉〈0.6789,0.2241〉〈0.8405,0.0901〉 〈0.8434,0.0880〉〈0.8474,0.0852〉〈0.6028,0.2932〉〈0.2500,0.7500〉〈0.2000,0.8000〉 〈0.3000,0.7000〉〈0.7000,0.3000〉〈0.8200,0.1800〉] |
The intuitionistic fuzzy entropy of the evaluation value of each indicator is calculated from equation (12) as follows:
| [0.127,0.053,0.116,0.333,0.111,0.371,0.493,0.170,0.667,0.538,0.149,0.414, 0.190,0.149,0.042,0.471,0.328,0.253,0.331,0.501,0.680,0.428,0.500,0.132, 0.167,0.500,0.492,0.501,0.414,0.175,0.172,0.167,0.562,0.333,0.250,0.429, 0.429,0.220] |
The weight vector for each indicator is calculated from equation (13) as follows:
| [0.034,0.037,0.034,0.026,0.035,0.025,0.020,0.032,0.013,0.018,0.033,0.023,0.032, 0.033,0.037,0.021,0.026,0.029,0.026,0.019,0.012,0.022,0.020,0.034,0.032,0.020, 0.020,0.019,0.023,0.032,0.032,0.032,0.017,0.026,0.029,0.022,0.022,0.030] |
5.4. Determination of evaluation results based on the normal grey cloud model
5.4.1. Determination of the grey level of the evaluation
The evaluation grade of civil-military integrated aviation equipment maintenance and guarantee capability is divided into four grey categories, namely, "poor, medium, good, and excellent", and the description of the evaluation grade is shown in Table 5.
5.4.2. Constructing a normal grey cloud model
- 1.
- Grey cloud model for qualitative indicators
According to the 4-granularity language evaluation adopted by experts for qualitative indicators, the left and right boundary values of each class are set in the interval from 0 to 1, which is taken as , calculate the peak value, entropy value, and super-entropy according to (14) ~ (16), as shown in Table 6, get the grey class rank and numerical characteristics of qualitative indicators, and use MATLAB software to generate grey cloud model, as shown in Figure 3.
Referring to the method in the literature [6], according to the statistical table of qualitative indicator rating information in Table 2, considering the expert weights, the probability of the expert's evaluation grade of the qualitative indicator is transformed into the final affiliation degree of the qualitative indicator belonging to the grades of each grey category, as shown in Table 7. This degree of affiliation is equivalent to the whitening weight coefficient, which reflects the degree of preference for the evaluation indicators to belong to the grey class hierarchy, and thus determines the whitening weights of the qualitative indicators.
- 2.
- Grey cloud model for quantitative indicators
Referring to the evaluation experience and seeking expert opinions, the range of values of quantitative indicators is divided into four evaluation levels, namely, "excellent, good, medium, and poor", and the left and right boundaries of each level are determined, and the specific quantitative range is shown in Table 8.
Calculate the peak value , entropy value , and hyper entropy corresponding to each pair of boundary values, and take the evaluation indicators of "Average troubleshooting time " and "Troubleshooting rate " as an example for the limitation of space in the text, and the results are shown in Table 9.
According to the left and right boundary values and numerical characteristics of the four grey class levels, the normal grey cloud model corresponding to each level of the evaluation indicator was generated by performing 5000 times whitening weight operation with the help of MATLAB software according to equations (18) to (20). The grey cloud model maps of indicators and are simulated by the forward cloud generator, as shown in Figure 4.
5.4.3. Solving for grey cloud whitening weights
To increase the credibility of the whitening weights, 5000 operations were performed using MATLAB software, and the indicator whitening weights obtained from each operation were considered as a cloud droplet. The average value of 5000 operations was calculated using equation (21). The whitening weights of each grey class level of the same indicator are normalized using equation (22) to obtain the final indicator grey cloud whitening weights , and the results are summarized as shown in Table 10.
5.4.4. Calculating the integrated clustering coefficient
According to the weights and whitened weights of all evaluation indicators, the integrated clustering coefficient for the evaluation of civil-military integration of aviation equipment maintenance and guarantee capabilities is calculated using equation (23).
5.4.5. Determination of evaluation ratings and scores
The integrated clustering vector is , and according to the formula (25), the grade of civil-military integrated aviation equipment maintenance and guarantee capability is "good".
Let the total score value be 100 points, according to equations (26) and (27) to find the rating value of the evaluated object is 76.7675 points.
5.5. Analysis of evaluation results
The evaluation grade of civil-military integrated aviation equipment maintenance and guarantee capability is "good", and the result is consistent with the actual situation and in line with the experts' expectations. Compared with the traditional capability evaluation method, the combination of intuitive fuzzy entropy and normal grey cloud model can better consider the fuzziness and randomness of the indicator information. The evaluation grades of the second-level indicators are shown in Figure 5, and the evaluation grades from outside to inside are "excellent, good, medium, and poor". It can be seen that “Battle wound repair rate ”, “Remote support success rate ”, “Civilian repair percentage ”, “Maintenance spare parts utilization rate ”, “Information acquisition capability ”, “Time-saving ratio ”, “Repair rate increase ratio ” and “Equipment intact rate ” are rated as "medium".
In the first-level indicators, the evaluation grades of "Maintenance operation capability" and "Resource support capability" are "excellent", "Information system operation and management capability", "Command and management capability" and "Comprehensive support capability" are "good", and "Maintenance technology utilization capability" is "medium".
In light of the results of the comprehensive analysis and evaluation of the current situation of equipment maintenance and guarantee, there is still much room for improvement in the ability to use maintenance technology. With the accelerated replacement of aviation weapons and equipment, advanced aviation equipment increasingly relies on advanced maintenance equipment and technical means, and improving the ability to apply advanced maintenance technology and means will help realize rapid maintenance and guarantee and improve the rate of war injury repair. Advantageous private enterprises hold a considerable number of new maintenance technologies and means, and should boldly introduce private security forces and resources into the field of military aircraft maintenance and guarantee, increase the proportion of private maintenance, and make full use of the advanced technologies and guarantee means of private enterprises for aviation equipment maintenance and guarantee services.
The lack of intelligent guarantee and predictive maintenance capabilities has led to a low utilization rate of maintenance equipment and spare parts, while some maintenance equipment and spare parts are insufficiently stocked and need to be allocated temporarily. The fundamental reason is that there is no equipment maintenance and guarantee information system with integrated functions, real-time interaction, high efficiency, visibility, and assisted decision-making, and the existing information system is not highly intelligent, with weak information collection capability and insufficient data support capability, which makes it impossible to realize effective use of resources such as maintenance equipment, on-demand use, unified management, and unified scheduling, and also seriously restricts the success rate of remote support. Therefore, improving the information system support capability and the ability to use maintenance technology is the top priority for improving aviation maintenance and guarantee the capability of civil-military integration.
6. Conclusions
The evaluation of civil-military integrated aviation equipment maintenance capability is a complex multi-attribute evaluation problem, featuring a complex evaluation process, fuzzy evaluation information, poor evaluation data, etc. The accuracy of the evaluation results relies on the scientificity of the indicator system and evaluation model. This paper uses the three-dimensional indicator system of "maintenance task → task demand → capability demand" to construct a model, decompose and map indicators step by step, and form a relatively perfect evaluation indicator system. The intuitive fuzzy entropy and normal grey cloud model are introduced to construct the evaluation model, and the evaluation method of innovative equipment maintenance and guarantee capability takes into full consideration factors such as fuzzy information, multivariate mixing, lack of data, and differences in the individual judgment of experts in the evaluation. This evaluation model achieves effective evaluation of a single evaluation object and analysis and comparison of multiple evaluation objects, providing an effective and practical method for evaluating equipment maintenance and guarantee capability.
Author Contributions
Conceptualization, W.L., and L.Z.; writing—original draft preparation, W.L.; methodology, W.L.; review and editing, L.Z. and H.Y.; software, validation, and data curation, Z.Q. All authors have read and agreed to the published version of the manuscript.
Institutional Review Board Statement
Not applicable.
Informed Consent Statement
Not applicable.
Data Availability Statement
Not applicable.
Acknowledgments
We greatly appreciate the comments from the anonymous reviewers and editors for their valuable suggestions to improve the quality of this manuscript.
Conflicts of Interest
The authors declare that they have no known competing financial interests or personal relationships that could have appeared to influence the work reported in this paper.
References
- GUO Jinmao, YIN Hanze, XU Yuguo. Fuzzy clustering analysis of indicators for assessing equipment maintenance and guarantee capability[J]. Journal of Weapons and Equipment Engineering 2020, 41, 76–80. [Google Scholar]
- YIN Xuyang, RUAN Congjun, YAN Peng, et al. Analysis of equipment maintenance guarantee capability assessment indicator system based on Hall's three-dimensional structure[J]. Science and Innovation 2021, 14, 79–82. [Google Scholar]
- Han Erdong. Hesitant fuzzy language multi-criteria decision-making method and application research on project group management[M]. Beijing: Xinhua Publishing House, 2021.
- WANG Shuangchuan, HU Qiwei, BAI Yongsheng, et al. Effectiveness assessment of equipment maintenance and guarantee system based on asymmetric grey cloud model[J]. Journal of Military Engineering 2019, 40, 1277–1286. [Google Scholar]
- WANG Shuangchuan, JIA Xisheng, HU Qiwei, et al. Effectiveness assessment of equipment maintenance and guarantee system based on normal grey cloud model[J]. System Engineering and Electronic Technology 2019, 41, 1576–1582. [Google Scholar]
- ZHU Chang'an, HU Wenhua, XUE Dongfang, et al. Radar quality assessment based on combined empowerment-grey cloud model[J]. Journal of Weapons and Equipment Engineering 2023, 44, 133–141. [Google Scholar]
Figure 1.
Three-dimensional model diagram for the construction of the evaluation indicator system.
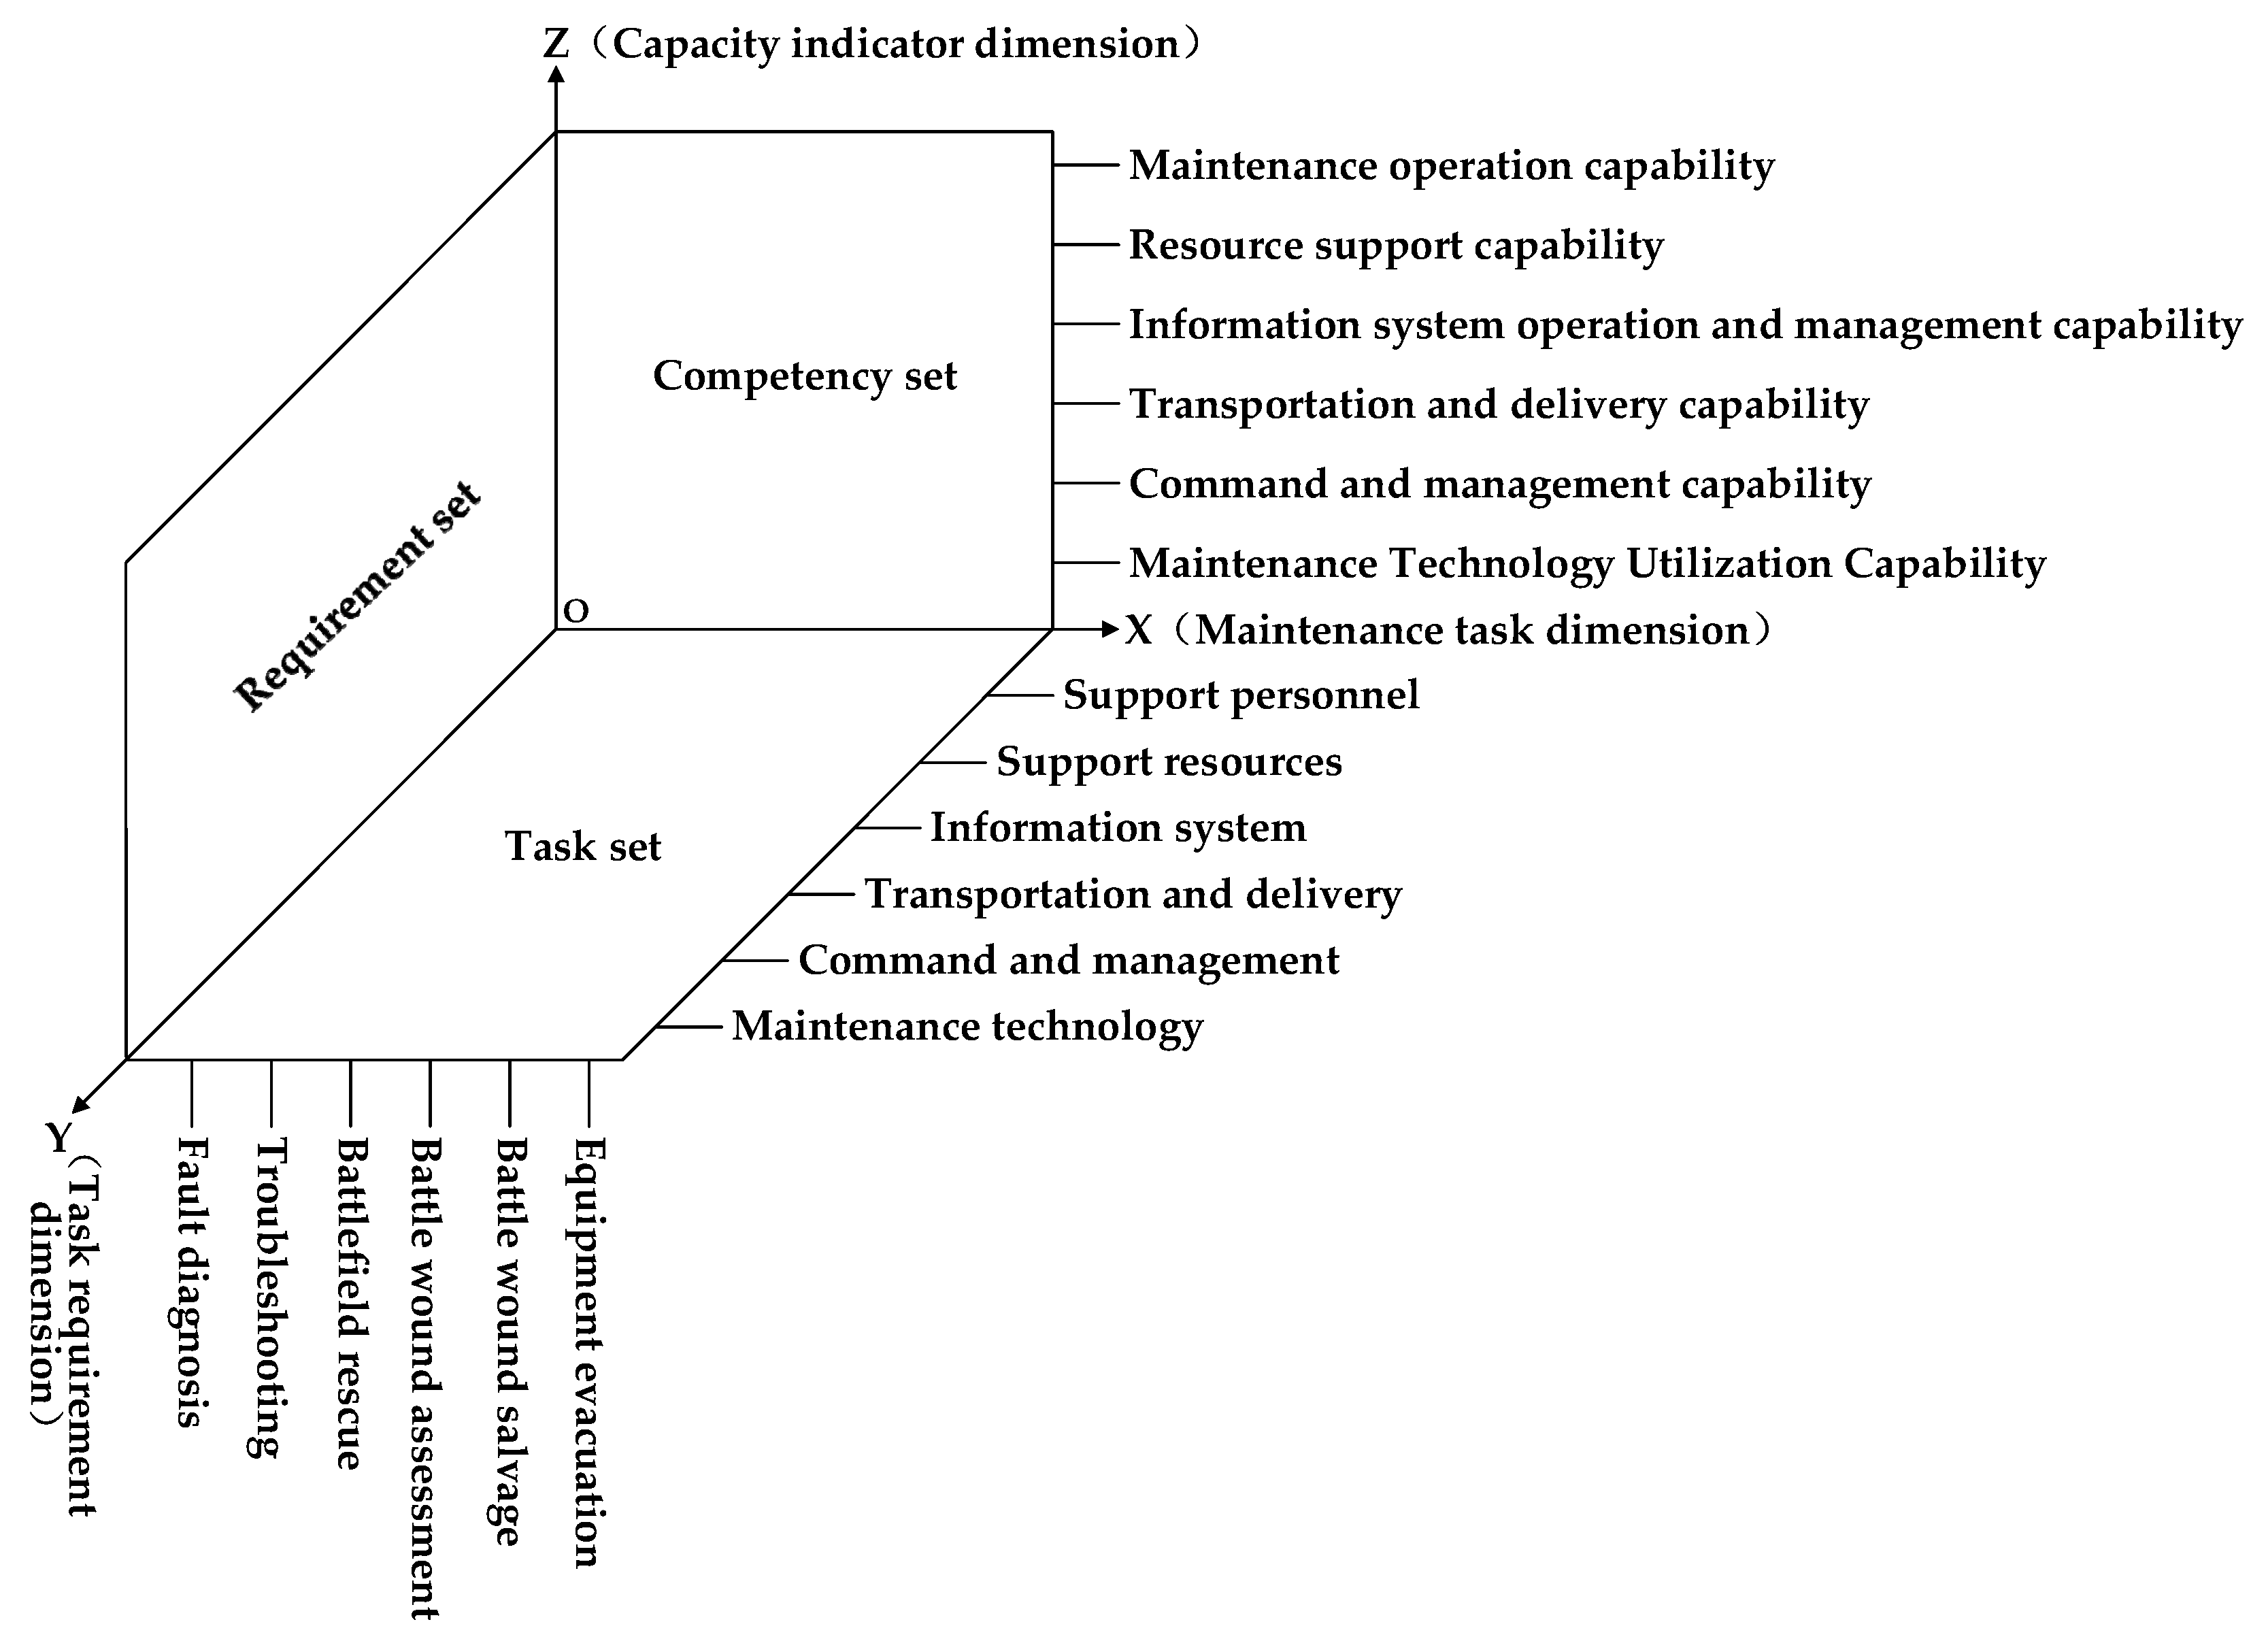
Figure 2.
Civil-military integrated aviation maintenance and guarantee capability evaluation indicator system.
Figure 2.
Civil-military integrated aviation maintenance and guarantee capability evaluation indicator system.
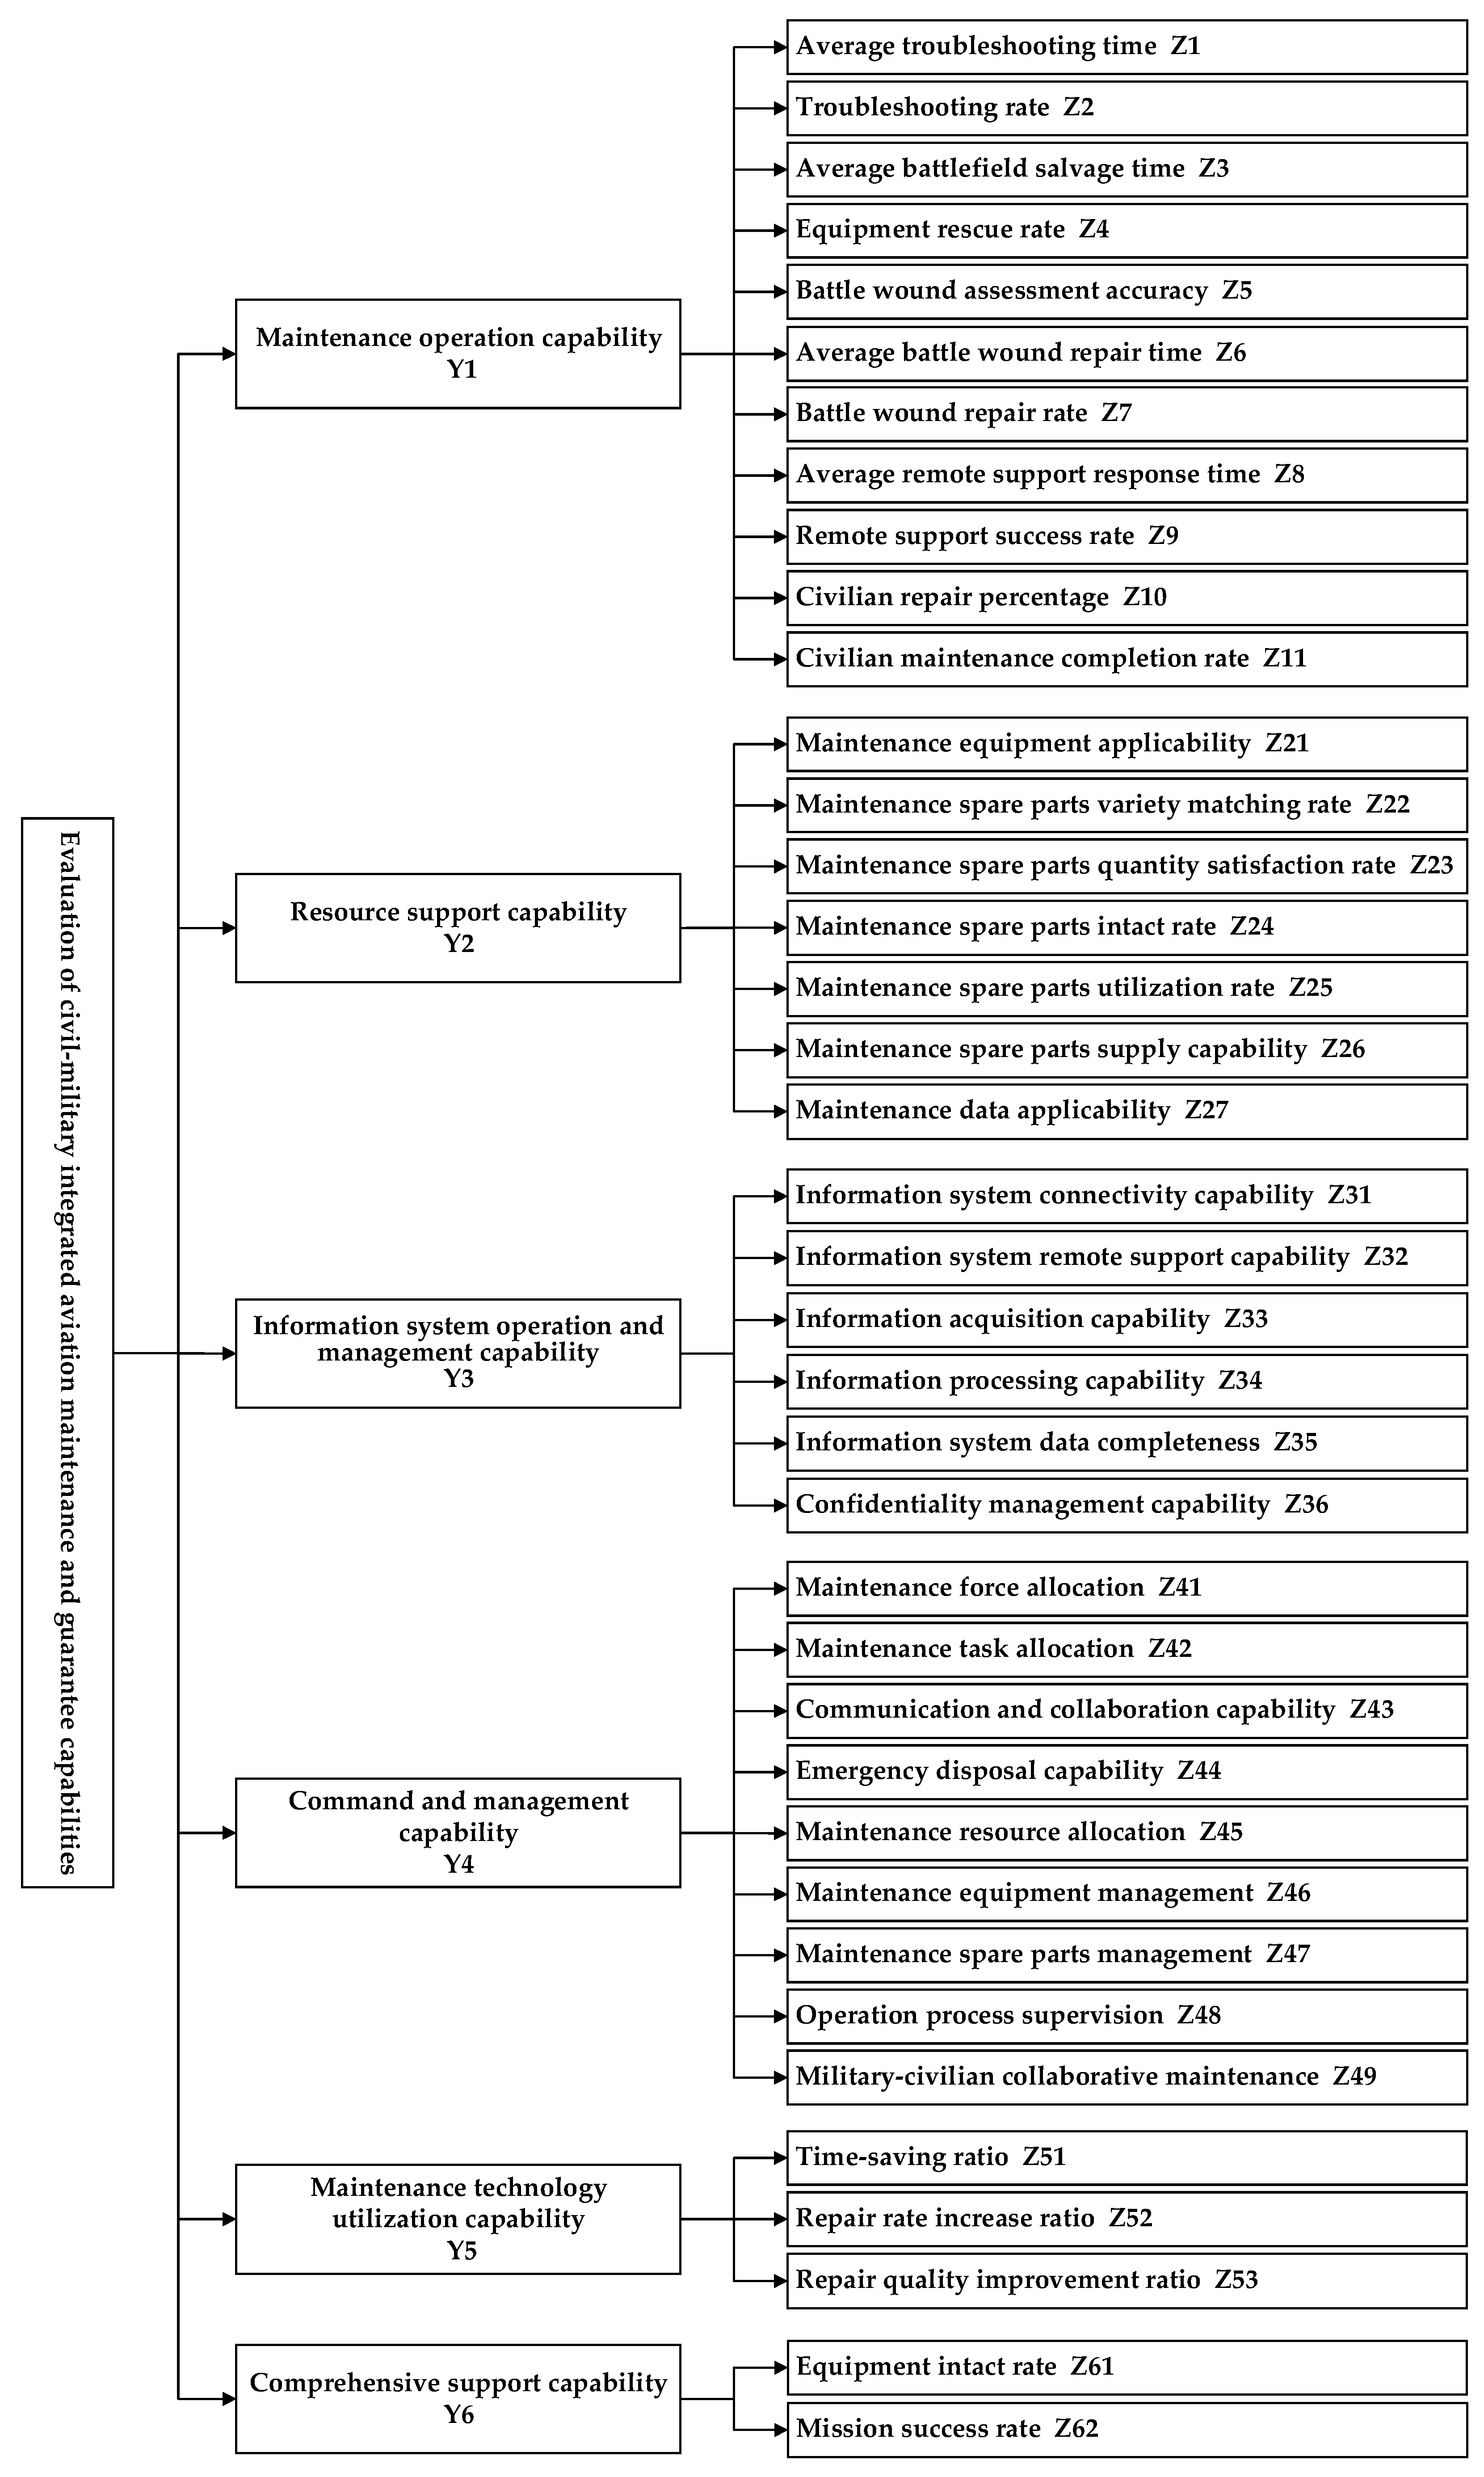
Figure 3.
Normal grey cloud model for qualitative indicators.
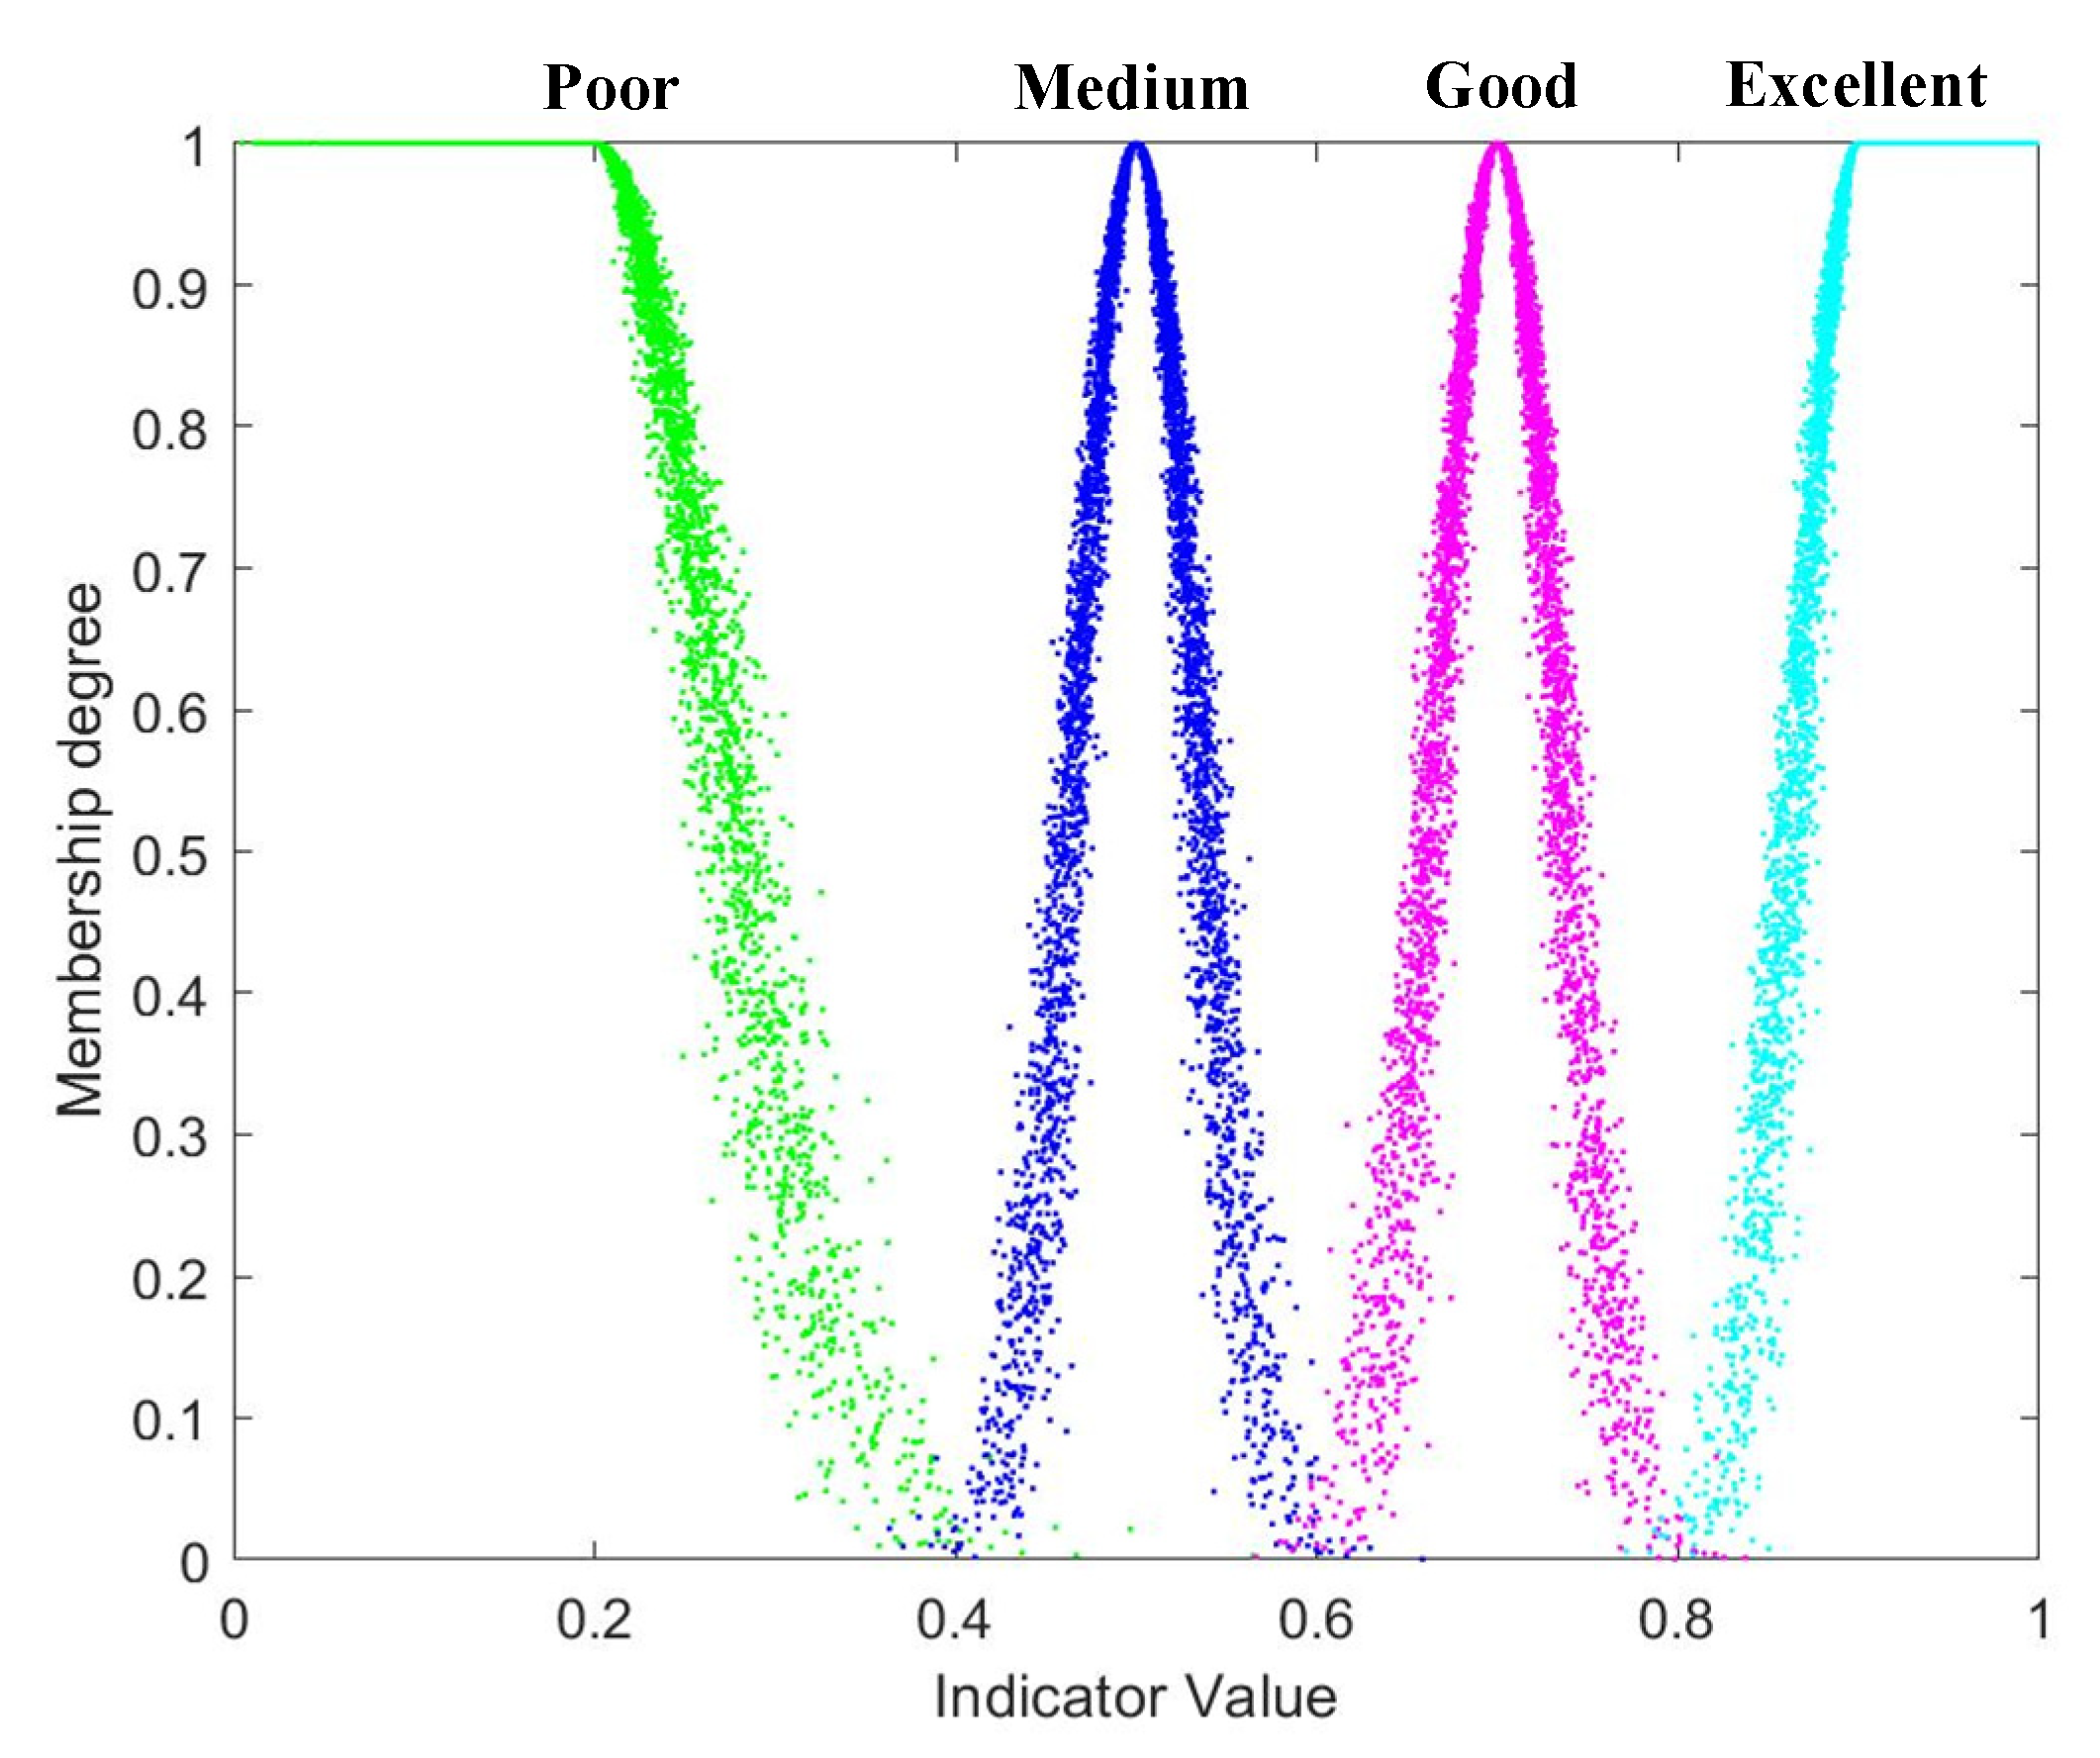
Figure 4.
Grey cloud model for selected indicators. (a) grey cloud model; (b) grey cloud model.
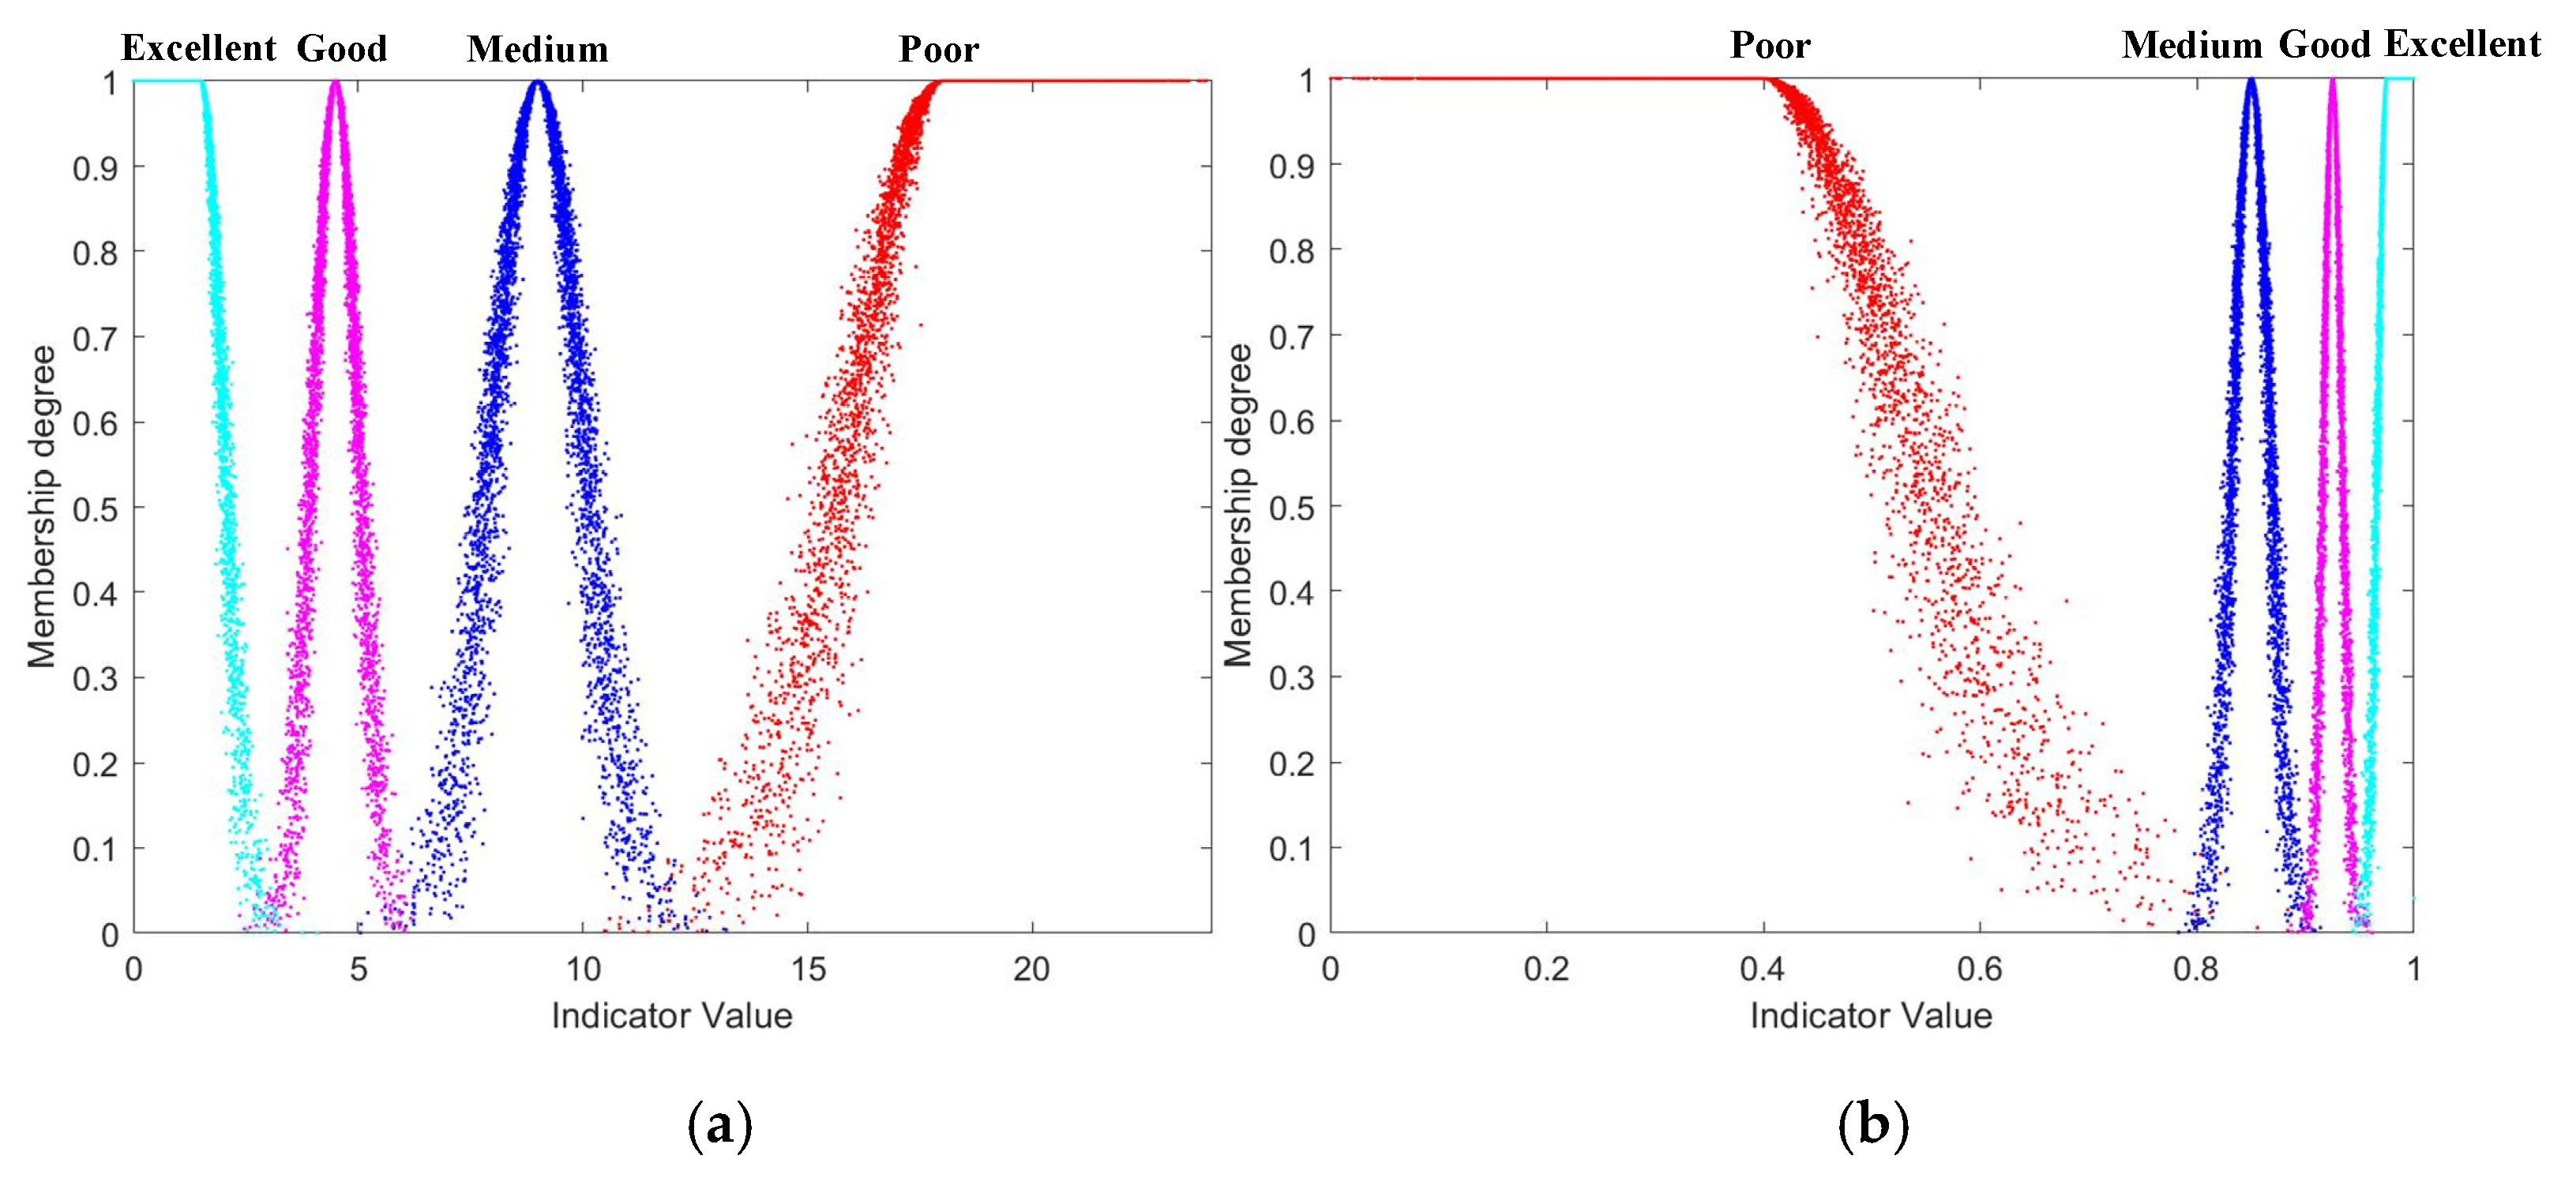
Figure 5.
Evaluation level of secondary indicators.
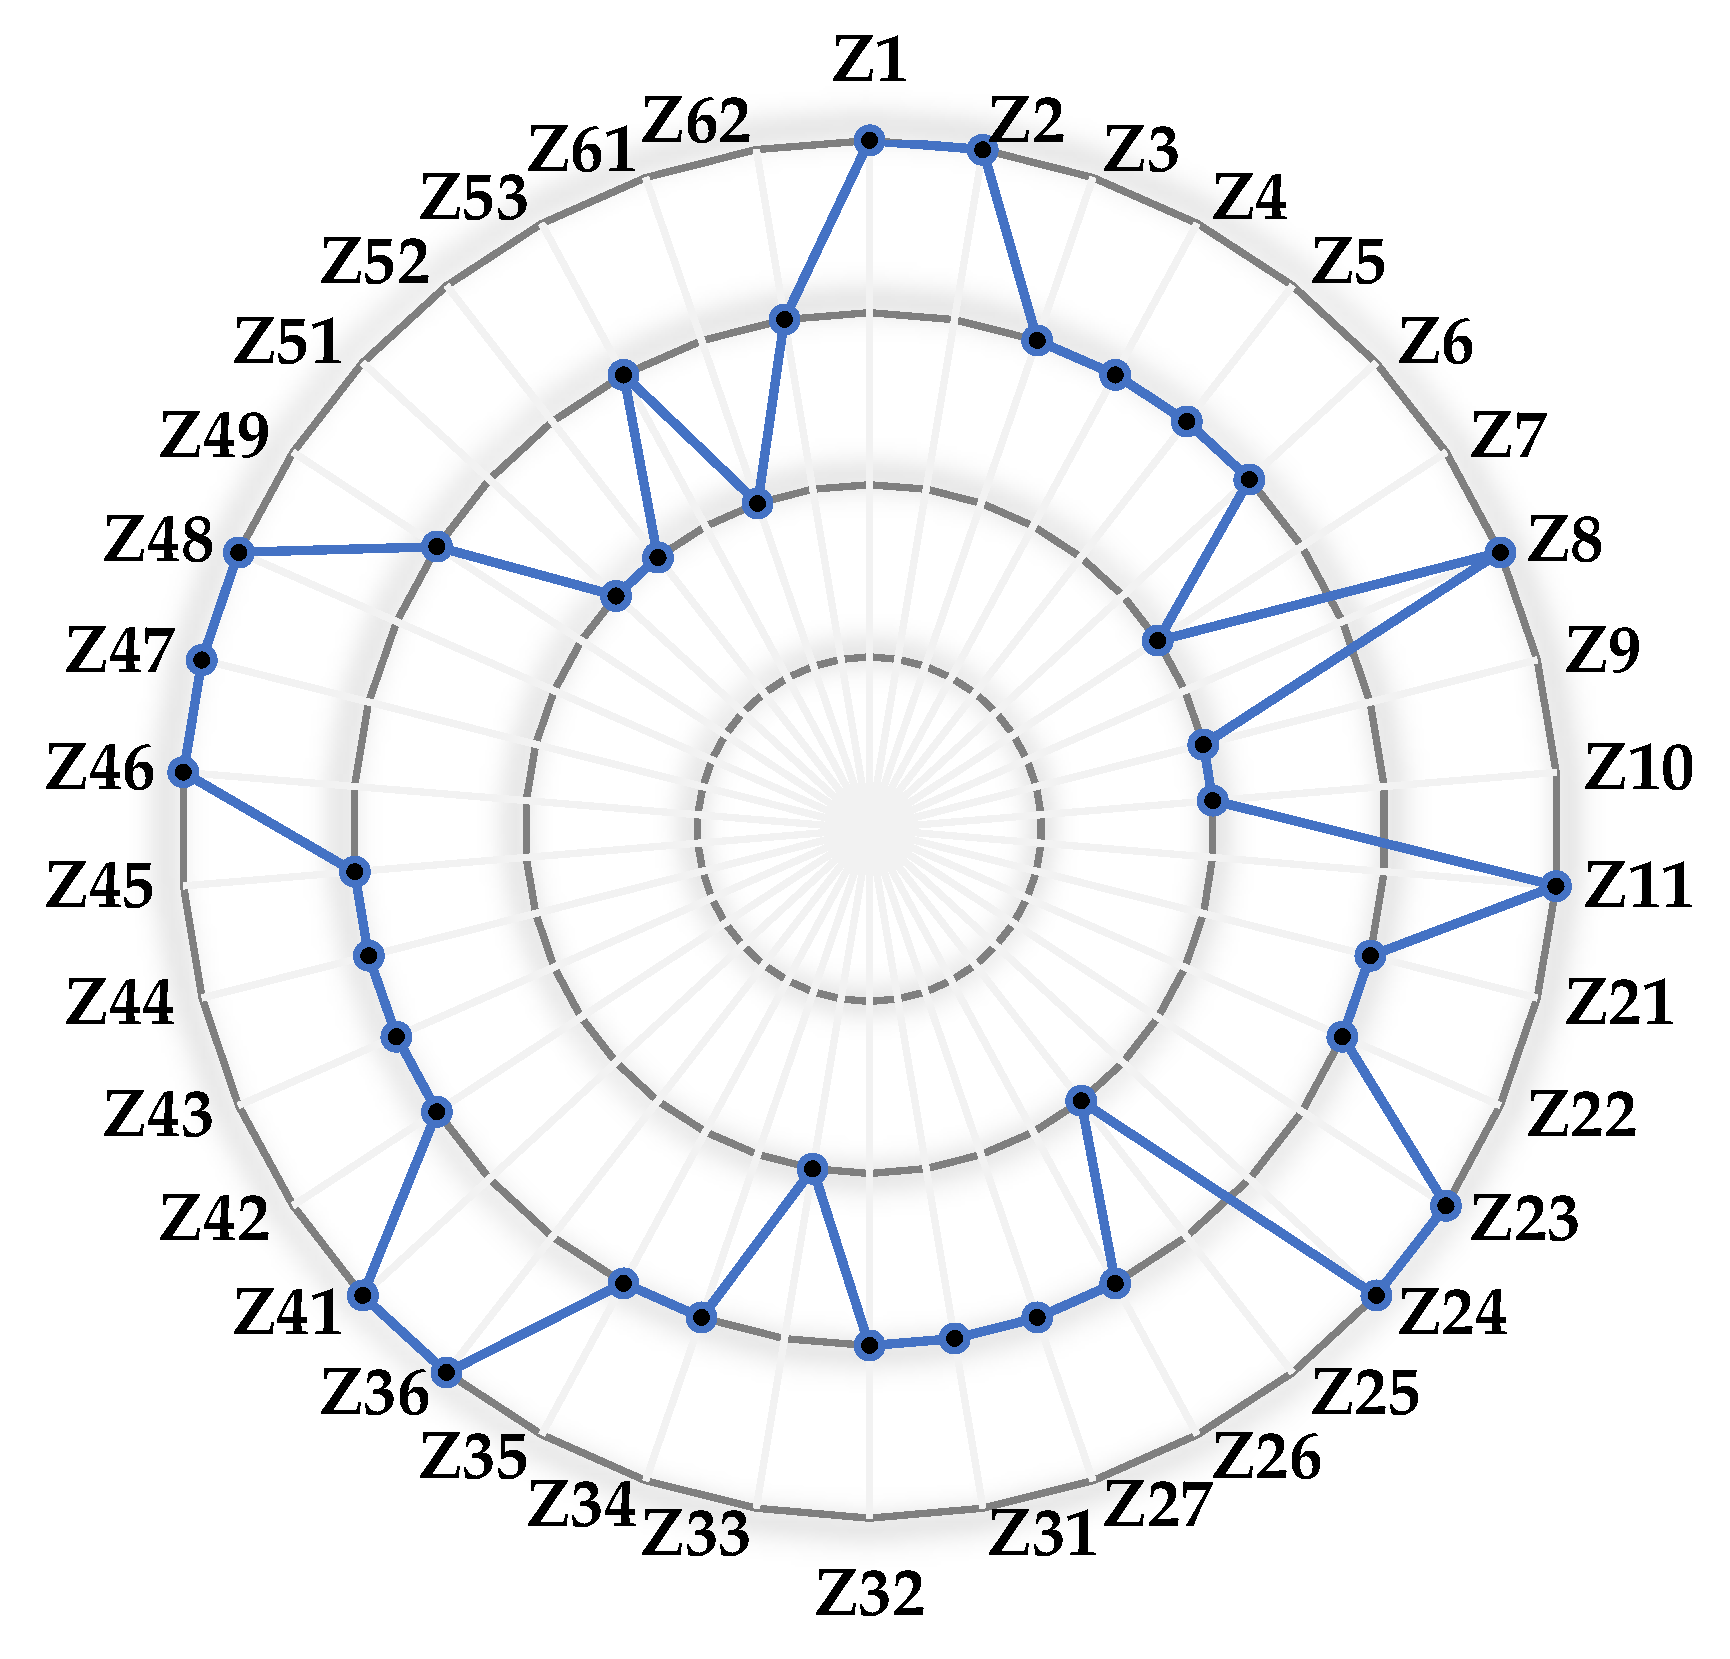

Table 1.
Transformational relationship between linguistic variables and intuitionistic fuzzy numbers.
Table 1.
Transformational relationship between linguistic variables and intuitionistic fuzzy numbers.
| Language variable | Intuitionistic fuzzy number |
|---|---|
Table 2.
Statistical information on qualitative indicator scores.
| Indicators | Expert 1 | Expert 2 | Expert 3 | Expert 4 | Expert 5 |
|---|---|---|---|---|---|
| s2 | s0 | s1 | s2 | s3 | |
| s3 | s2 | s2 | s2 | s1 | |
| s2 | s3 | s2 | s1 | s3 | |
| s3 | s2 | s1 | s2 | s2 | |
| s2 | s1 | s2 | s1 | s2 | |
| s2 | s2 | s1 | s1 | s0 | |
| s1 | s2 | s2 | s2 | s2 | |
| s1 | s2 | s2 | s1 | s2 | |
| s3 | s2 | s3 | s3 | s3 | |
| s3 | s2 | s3 | s3 | s2 | |
| s1 | s2 | s2 | s1 | s2 | |
| s1 | s1 | s2 | s2 | s2 | |
| s2 | s1 | s1 | s2 | s2 | |
| s3 | s0 | s2 | s2 | s1 | |
| s3 | s3 | s2 | s2 | s3 | |
| s3 | s3 | s3 | s2 | s2 | |
| s2 | s3 | s3 | s3 | s2 | |
| s0 | s2 | s2 | s1 | s2 |
Table 3.
Values and polarity of quantitative indicators.
| Indicator name |
Numerical value |
Causality | Indicator name |
Numerical value |
Causality |
|---|---|---|---|---|---|
| 2.7 | Inverse | 0.87 | Positive | ||
| 0.95 | Positive | 0.84 | Positive | ||
| 2.5 | Inverse | 0.87 | Positive | ||
| 0.75 | Positive | 0.96 | Positive | ||
| 0.9 | Positive | 0.68 | Positive | ||
| 13 | Inverse | 0.25 | Positive | ||
| 0.67 | Positive | 0.2 | Positive | ||
| 0.58 | Inverse | 0.3 | Positive | ||
| 0.6 | Positive | 0.7 | Positive | ||
| 0.35 | Positive | 0.82 | Positive |
Table 4.
Standardized values and intuitionistic fuzzy numbers for quantitative indicators.
| Quantitative indicator | Standard value | Fuzzy number |
Quantitative indicator | Standard value | Fuzzy number |
|---|---|---|---|---|---|
| 0.8875 | 0.8700 | ||||
| 0.9500 | 0.8400 | ||||
| 0.8958 | 0.8700 | ||||
| 0.7500 | 0.9600 | ||||
| 0.9000 | 0.6800 | ||||
| 0.7292 | 0.2500 | ||||
| 0.6700 | 0.2000 | ||||
| 0.8550 | 0.3000 | ||||
| 0.6000 | 0.7000 | ||||
| 0.3500 | 0.8200 |
Table 5.
Description of evaluation levels.
| Rating | Grade Description |
|---|---|
| poor | Aviation equipment maintenance and guarantee capacity is lacking, unable to meet the maintenance and guarantee needs, there is an urgent need to find deficiencies, rectification, and improvement. |
| medium | Aviation equipment maintenance and guarantee capacity is fair, basically able to meet the maintenance and guarantee needs, but still need to find the weak links, targeted to improve the maintenance and guarantee capacity. |
| good | Aviation equipment maintenance and guarantee capacity is better, able to meet maintenance and guarantee needs, but there is still room for improvement. |
| excellent | Aviation equipment maintenance and guarantee capacity is strong, and fully meets the maintenance and guarantee needs, the relevant guarantee process and experience can be used for other units to learn from. |
Table 6.
Evaluation levels and numerical characteristics of qualitative indicators.
| Indicator level | Left and right boundary values | |||
| poor | [0,0.4] | 0.2 | 0.067 | 0.0112 |
| medium | [0.4,0.6] | 0.5 | 0.033 | 0.0055 |
| good | [0.6,0.8] | 0.7 | 0.033 | 0.0055 |
| excellent | [0.8,1] | 0.9 | 0.033 | 0.0055 |
Table 7.
Greyscale affiliation of qualitative indicators.
| Indicators | Poor | Medium | Good | Excellent |
|---|---|---|---|---|
| 0.1904 | 0.2132 | 0.3999 | 0.1965 | |
| 0 | 0.1965 | 0.6153 | 0.1882 | |
| 0 | 0.2117 | 0.4014 | 0.3869 | |
| 0 | 0.2132 | 0.5986 | 0.1882 | |
| 0 | 0.4021 | 0.5979 | 0 | |
| 0.1965 | 0.4249 | 0.3786 | 0 | |
| 0 | 0.1882 | 0.8118 | 0 | |
| 0 | 0.3999 | 0.6001 | 0 | |
| 0 | 0 | 0.1904 | 0.8096 | |
| 0 | 0 | 0.3869 | 0.6131 | |
| 0 | 0.3999 | 0.6001 | 0 | |
| 0 | 0.3786 | 0.6214 | 0 | |
| 0 | 0.4036 | 0.5964 | 0 | |
| 0.1904 | 0.1965 | 0.4249 | 0.1882 | |
| 0 | 0 | 0.4249 | 0.5751 | |
| 0 | 0 | 0.4082 | 0.5918 | |
| 0 | 0 | 0.3847 | 0.6153 | |
| 0.1882 | 0.2117 | 0.6001 | 0 |
Table 8.
Quantitative indicators evaluation level and left and right thresholds.
| Indicators | Poor | Medium | Good | Excellent |
|---|---|---|---|---|
| (12,24] | (6,12] | (3,6] | (0,3] | |
| (0,0.8] | (0.8,0.9] | (0.9,0.95] | (0.95,1] | |
| (9,24] | (3,9] | (1,3] | (0,1] | |
| (0,0.5] | (0.5,0.7] | (0.7,0.9] | (0.9,1] | |
| (0,0.6] | (0.6,0.8] | (0.8,0.9] | (0.9,1] | |
| (24,48] | (12,24] | (3,12] | (0,3] | |
| (0,0.5] | (0.5,0.7] | (0.7,0.85] | (0.85,1] | |
| (3,4] | (2,3] | (1,2] | (0,1] | |
| (0,0.5] | (0.5,0.7] | (0.7,0.85] | (0.85,1] | |
| (0,0.3] | (0.3,0.6] | (0.6,0.8] | (0.8,1) | |
| (0,0.5] | (0.5,0.7] | (0.7,0.85] | (0.85,1] | |
| (0,0.5] | (0.5,0.7] | (0.7,0.85] | (0.85,1] | |
| (0,0.5] | (0.5,0.7] | (0.7,0.85] | (0.85,1] | |
| (0,0.7] | (0.7,0.85] | (0.85,0.95] | (0.95,1] | |
| (0,0.5] | (0.5,0.7] | (0.7,0.85] | (0.85,1] | |
| (0,0.1] | (0.1,0.3] | (0.3,0.6] | (0.6,1] | |
| (0,0.1] | (0.1,0.3] | (0.3,0.6] | (0.6,1] | |
| (0,0.1] | (0.1,0.3] | (0.3,0.6] | (0.6,1] | |
| (0,0.6] | (0.6,0.75] | (0.75,0.9] | (0.9,1] | |
| (0,0.6] | (0.6,0.8] | (0.8,0.9] | (0.9,1] |
Table 9.
Quantitative indicator levels and numerical characteristics.
| Indicators | Hierarchy | Threshold value | |||
|---|---|---|---|---|---|
| poor | (12,24] | 18 | 2 | 0.3333 | |
| medium | (6,12] | 9 | 1 | 0.1667 | |
| good | (3,6] | 4.5 | 0.5 | 0.0833 | |
| excellent | (0,3] | 1.5 | 0.5 | 0.0833 | |
| poor | (0,0.8] | 0.4 | 0.1333 | 0.0222 | |
| medium | (0.8,0.9] | 0.85 | 0.0167 | 0.0028 | |
| good | (0.9,0.95] | 0.925 | 0.0083 | 0.0014 | |
| excellent | (0.95,1] | 0.975 | 0.0083 | 0.0014 |
Table 10.
Normalized grey cloud whitening weights for quantitative indicators.
| Indicators | Normalized whitening weights | |||
|---|---|---|---|---|
| Poor | Medium | Good | Excellent | |
| 0.0000 | 0.0000 | 0.0619 | 0.9381 | |
| 0.0001 | 0.0267 | 0.4812 | 0.4919 | |
| 0.0000 | 0.0321 | 0.9679 | 0.0000 | |
| 0.0000 | 0.0000 | 1.0000 | 0.0000 | |
| 0.0000 | 0.0001 | 0.5026 | 0.4972 | |
| 0.0000 | 0.2205 | 0.7795 | 0.0000 | |
| 0.0007 | 0.9915 | 0.0078 | 0.0000 | |
| 0.0000 | 0.0000 | 0.0000 | 1.0000 | |
| 0.0000 | 1.0000 | 0.0000 | 0.0000 | |
| 0.0104 | 0.9896 | 0.0000 | 0.0000 | |
| 0.0000 | 0.0000 | 0.0253 | 0.9747 | |
| 0.0000 | 0.0000 | 0.8655 | 0.1345 | |
| 0.0000 | 0.0000 | 0.0255 | 0.9745 | |
| 0.0000 | 0.0002 | 0.0215 | 0.9782 | |
| 0.0008 | 0.9624 | 0.0369 | 0.0000 | |
| 0.0000 | 1.0000 | 0.0000 | 0.0000 | |
| 0.0000 | 1.0000 | 0.0000 | 0.0000 | |
| 0.0000 | 0.2103 | 0.7897 | 0.0000 | |
| 0.0000 | 0.9999 | 0.0001 | 0.0000 | |
| 0.0003 | 0.0219 | 0.9778 | 0.0000 | |
Disclaimer/Publisher’s Note: The statements, opinions and data contained in all publications are solely those of the individual author(s) and contributor(s) and not of MDPI and/or the editor(s). MDPI and/or the editor(s) disclaim responsibility for any injury to people or property resulting from any ideas, methods, instructions, or products referred to in the content. |
© 2023 by the authors. Licensee MDPI, Basel, Switzerland. This article is an open access article distributed under the terms and conditions of the Creative Commons Attribution (CC BY) license (http://creativecommons.org/licenses/by/4.0/).
Copyright: This open access article is published under a Creative Commons CC BY 4.0 license, which permit the free download, distribution, and reuse, provided that the author and preprint are cited in any reuse.


