
Submitted:
30 August 2023
Posted:
01 September 2023
You are already at the latest version
Abstract
Plants exhibit the capacity for adaptation through their metabolic processes to various changes in environmental conditions. Investigating these adaptations in current and future climatic scenarios is of great importance for ensuring productive agricultural crops. This adaptative potential is commonly employed as an indicator of genotypes with higher potential in breeding programs. However, the complexity and interaction of plant metabolic parameters pose a challenge to selection strategies. In this context, the aim of this study was to explore phenotypic plasticity within the germplasm of Hybrid Timor coffee. Additionally, we assessed the utility of the Phenotypic Plasticity Index (MVPi) as a promising tool to predict genotype performance across diverse climatic conditions. To achieve this, we evaluated the performance of seven accessions from the Hybrid Timor germplasm in comparison to the Rubi and IPR 100 cultivars, known for their susceptibility and resistance to drought, respectively. The experiment was conducted at greenhouse conditions, with two treatments: a control scenario, maintaining soil moisture near its maximum water-holding capacity, and a water deficit scenario involving irrigation cessation followed by rehydration. Data encompassing physiological, biochemical, and growth aspects were collected during three distinct stages: pre-application of water deficit, its imposition, and subsequent rehydration. Furthermore, field evaluations of the productivity of the same genotypes were carried out over two consecutive seasons. Based on physiological and biochemical assessments, the MVPi was computed, employing Euclidean distance between principal component multivariate analysis scores. Subsequently, this index was correlated with growth and productivity data through linear regressions. Our findings reveal that the more plastic genotypes, capable of significantly altering physiological and biochemical parameters in response to environmental stimuli, exhibited reduced biomass loss in both aerial and root parts, consequently positively influencing their productivity. Enhanced plasticity was particularly prominent in accessions from the MG Germplasm Collection: MG 311 - Hybrid Timor UFV 428-02, MG 270 - Hybrid Timor UFV 377-21, and MG 279 - Hybrid Timor UFV 376-31, alongside the Rubi MG 1192 cultivar. The MVPi emerged as a valuable instrument to assess genotype adaptability and predict their performance under varying climatic scenarios.
Keywords:
plasticidade fenotípica
; estresse hídrico
; seleção genotípica
; estratégia adaptativa
; melhoramento fisiológico.
1. Introduction
Coffee cultivation holds significant socioeconomic importance in Brazil, and its productivity has been jeopardized by adverse climatic factors such as rising temperatures and irregular rainfall patterns [1,2]. Severe drought periods can lead to plant mortality, while moderate droughts also prove detrimental, impacting flowering, grain development, and consequentially, coffee yield. Furthermore, fluctuations in precipitation and temperature augment grain defects, alter biochemical composition, and influence the final beverage quality [3].
The scarcity of water promptly affects leaves, which play a pivotal role in plants [4]. To curb excessive water loss, stomata close, inducing a reduction in CO2 absorption and photosynthesis [5]. This may lead to an imbalance between light capture and utilization, resulting in the overproduction of reactive oxygen species (EROs). These EROs can inflict cellular damage, potentially leading to plant mortality [6,7]. However, plants exhibit the capacity to adapt to adverse conditions, including water deficit, by activating physiological, biochemical, and anatomical mechanisms to sustain vital functions [8]. Responses to water stress may vary among species and genotypes of the same species, implying varying aptitudes for dealing with this condition [9].
Phenotypic plasticity is a crucial mechanism by which organisms, including plants, adapt to environmental changes, contributing to water stress tolerance. This plasticity manifests through modifications in growth, morphology, physiology, and behavior of plants [10]. It enables plants to adapt to diverse environmental conditions such as water availability, nutrients, light, and temperature, proving valuable in predicting plant responses to climate changes [11]. Phenotypic plasticity also serves as an essential tool for exploring plant adaptation to climate change [12] and can be employed to assess combined effects of various stresses [13]. However, information regarding phenotypic plasticity in response to water stress in coffee remains limited.
Considering that climate changes significantly impact global climate, comprehending coffee's phenotypic plasticity in response to water stress and identifying genotypes with heightened adaptative capacity assumes paramount importance. This aids in developing management and genetic improvement strategies to maximize productivity and sustainability of coffee cultivation under water restriction [14].
Traditionally, genotype evaluation and selection in breeding programs involves meticulous analysis of each genotype's phenotypic response to individual parameters. This aim to identify genotypes exhibiting remarkable capacity to elucidate variations in the target variable often linked to productivity. However, the increase of phenotyping capacity through high-throughput methods, coupled with the increasing number of genotypes requiring evaluation, pose challenges, potentially leading to intricate and less efficient processes [15].
In this context, the possibility of employing a multivariate phenotypic plasticity index emerges as an alternative for genotype evaluation in genetic improvement programs. This index not only considers isolated phenotypic responses of each parameter but also how these responses harmonize under diverse environmental conditions. The multivariate phenotypic plasticity index (MVPi) proposed by Pennacchi et al. [16] consolidates multiple phenotypic characteristics into a single plasticity marker, based on parameter variance and Euclidean distances in a multidimensional space, enhancing efficiency in genotype evaluation.
Building upon our earlier work, when our research group identified Hybrid Timor accessions from the Epamig Germplasm Collection that displayed varying responses to water stress [17], our recent investigation aimed to delve deeper. This time, we focused on exploring the phenotypic plasticity present within the germplasm of Hybrid Timor coffee. Additionally, we assessed the utility of the Phenotypic Plasticity Index (MVPi) as a promising tool to predict genotype performance across diverse climatic conditions. The potential to develop coffee plants adapted to low water availability renders this investigation highly pertinent.
2. Materials and Methods
Seven accessions of Coffea arabica L. from the Germplasm Collection (GC-MG) of the Minas Gerais Agricultural Research Agency (Empresa de Pesquisa Agropecuária de Minas Gerais- EPAMIG), chosen based on productivity parameters, beverage quality, and disease resistance (Supplementary Figure S1), along with two control cultivars, the drought-tolerant (IPR 100) [18] and drought-sensitive (Rubi MG 1192) [19], were subjected to physiological, biochemical, and growth evaluations under controlled greenhouse conditions. Additionally, field productivity evaluations were conducted.
Greenhouse Experiment
For seedling formation, seeds of selected Coffea arabica L. accessions were germinated in sand until reaching the stage of cotyledon leaf emergence. Subsequently, they were transplanted into 120 ml polyethylene tubes containing a substrate for plants based on pine bark, peat, expanded vermiculite, enriched with macro and micronutrients from the brand Tropstrato HT. The seedlings were then kept in a nursery until they developed four pairs of true leaves and were acclimated.
After this period, the seedlings were transferred to 20-liter polyethylene pots containing a substrate mixture of 3 parts topsoil, 1 part sand, and 1 part bovine manure (3:1:1). They were grown in a greenhouse for a period of eleven months. Fertilization was carried out according to substrate analysis and regional crop recommendations.
The plants were irrigated to maintain the soil at 100% available water for eleven months, with the hydraulic treatment initiated in April 2019. In the first hydraulic treatment, the plants were maintained with the soil at 100% available water from April 2019 until the end of the experimental period (Irrigated - I). In the second treatment, irrigation was completely suspended (Non-irrigated - NI) until the majority of non-irrigated plants reached a predawn water potential of -3MPa (BRUM et al., 2013). Once this water potential was reached, which occurred 33 days after the stress imposition, irrigation was resumed, again maintaining the soil at 100% available water.
For the assessments of gas exchange and biochemical analyses, three distinct periods were considered: 1 - prior to the imposition of water deficit, 2 at 25 days after the imposition of water deficit (when the majority of plants reached a predawn water potential around -2MPa), and 3 - at 17 days after the resumption of irrigation.
Gas exchange assessments were conducted between 8 and 11 AM under artificial light (1000 µmol m-2 s-1) using a portable infrared gas analyzer (IRGA LICOR – 6400XT). Measurements included net photosynthetic rate (A - µmol CO2 m-2 s-1), stomatal conductance (gs - mol H2O m-1 s-1), transpiration rate (E – mmol H2O m-2 s-1), and instantaneous water use efficiency (WUE - µmol CO2/ mmol H2O m-2 s-1) (A/E). Water potential was determined using a pressure chamber (PMS Instruments Plant Moisture - Model 1000) before sunrise.
For biochemical analyses, leaves were collected in the afternoon (between 12 and 1 PM), immediately immersed in liquid nitrogen, and stored in an ultra freezer (-80 °C). Subsequent maceration and extraction were performed to quantify hydrogen peroxide (H2O2), lipid peroxidation, antioxidant metabolism, and ascorbate content.
For H2O2 quantification, 100 mg of plant material was macerated in liquid nitrogen and polyvinylpolypyrrolidone (PVPP), followed by homogenization in 0.1% (w/v) trichloroacetic acid (TCA). Samples were centrifuged at 12000g for 15 minutes at 4 °C, and the supernatant was mixed with a reaction solution containing 10 mM potassium phosphate buffer (pH 7.0) and 1M potassium iodide. H2O2 concentration was determined by measuring absorbance at 390 nm, using a standard curve of known H2O2 concentrations [20], with modifications. Lipid peroxidation was assessed by quantifying thiobarbituric acid reactive species (TBA) as described by Buege and Aust [21]. The aliquots were added to the reaction medium composed of 0.5% (w/v) thiobarbituric acid (TBA) and 10% (w/v) trichloroacetic acid (TCA). Subsequently, the medium was incubated at 95°C for 30 minutes. The reaction was halted by rapid cooling on ice, and readings were taken at 535 nm and 600 nm. TBA forms reddish-colored complexes, such as malondialdehyde (MDA), a secondary product of the peroxidation process. The concentration of MDA was calculated using the following equation: [MDA]= (A535 – A600) / (ξ x b), where ξ (molar extinction coefficient = 1,56 x 10⁻⁵); b (optical path = 1). Peroxidation was expressed in mmol of MDA.g-1 (FW - fresh weight).
For the determination of antioxidant enzyme activity, 100 mg of plant material was macerated in liquid nitrogen and polyvinylpolypyrrolidone (PVPP), followed by homogenization with 3.5 mL of the following extraction buffer: 100 mM potassium phosphate (pH 7.8), 0.1 mM EDTA, and 10 mM ascorbic acid. The extract was centrifuged at 13,000 g for 10 minutes at 4°C. The supernatants were collected and used for the analysis of the enzymes: catalase (CAT), superoxide dismutase (SOD), and ascorbate peroxidase (APX) [22].
For the determination of catalase (CAT) activity, the protocol of Mengutay et al. [23] with modifications was employed. Aliquots of the samples were added to the incubation medium, composed of phosphate buffer (45 mM, pH 7.6), Na2EDTA (0.1 mM) (dissolved in the phosphate buffer), and hydrogen peroxide (10 mM). Enzyme activity was determined by the decrease in absorbance at 240 nm every 15 seconds for 3 minutes, monitored by the consumption of hydrogen peroxide. The molar extinction coefficient used was 36 mM-1cm-1.
The ascorbate peroxidase (APX) activity was determined by monitoring the oxidation rate of ascorbate at 290 nm over 3 minutes, following Nakano and Asada's methodology (1981), with modifications. Ascorbate quantification was performed using 50 mg of plant material, which was macerated in liquid nitrogen and PVPP, and then homogenized with 5% trichloroacetic acid (m/v). After centrifugation, samples were added to a reaction mixture containing 5% trichloroacetic acid, 99.8% ethanol, ascorbic acid, phosphoric acid (0.4% in ethanol), bathophenanthroline (0.5% in ethanol), and ferric chloride (III) (0.03% in ethanol). The mixture was incubated, and readings were taken at 534 nm using a standard curve with known concentrations [24].
All biochemical analyses were conducted using 96-well microtitration plates, and readings were performed using a Synergy TM HTX multimode microplate reader.
At the end of the experimental period, dry weights of the aboveground plant parts (MSPA – g), root dry weight (MSR – g), and total dry weight (MST g) were obtained. Roots were washed, and aboveground parts were separated from the root system. The samples were then dried in a forced-air oven at 70 °C for 72 hours, and dry weight was measured using a precision balance.
Field Experiment
The GC-MG was established in 2005 at the EPAMIG Experimental Farm in Patrocínio, MG, located in the Alto Paranaíba region, positioned at approximately 18°59'26" latitude South, 48°58'95" longitude West, and an altitude of about one thousand meters. The adopted spacing was 3.5 x 1.0 m between rows and between plants, respectively. The soil type is Red-Yellow Latosol, and the topography is flat with a slight slope [25].
Harvesting was conducted in individual plots in 2020 and 2021. The field coffee volume (coffee fruits of mixed maturity) per plot was converted into the number of 60-kg bags of husked coffee produced per hectare (bags ha-1) (PROD). The experimental design followed randomized blocks with two replicates and ten plants per plot. Plant spacing was 4.0 × 1.0 m. Sowing and crop management were carried out according to technical recommendations for the species cultivation.
Statistical Analyses
Calculation of the MVPi
To assess the phenotypic plasticity of the evaluated genotypes, data obtained from physiological and biochemical assessments were subjected to a multivariate approach using an index that considers multiple evaluated traits. The multivariate plasticity index (MVPi), proposed by Pennacchi et al. [15], was calculated based on the absolute deviation, measured as Euclidean distances in the multidimensional Cartesian plane, between different phenotypic states of the plants, specifically with and without water deficit. The scores for each individual were defined through Principal Componente Analysis (PCA).
The MVPi values were calculated at three different stages, corresponding to the same time points as other physiological and biochemical parameters: before the application of water deficit (WW), during its application (WD), and after irrigation resumed (RW). Using the MVPi values for each point, differences in plasticity values were calculated as the slopes of lines (I) between periods: I1 between the initial measurement and the post-imposition of stress point, and I2 between the post-imposition of stress point and the return of irrigation. The I1 and I2 values were then correlated with differences in total biomass accumulation in both above and belowground parts between control and water deficit treatments, as well as with conventional field management productivity. These correlations were measured through linear regressions using R software [26].
Genetic Parameters
Variance estimation and prediction of random effects were conducted using the restricted maximum likelihood/best linear unbiased prediction (REML/BLUP) procedure with the assistance of the SELEGEN-REML/BLUP software [27]. For these analysis, the employed model was:. Where: is the vector of phenotypic observations; is the vector of fixed block effects; is the vector of random genotype effects; is the vector of errors; is the block incidence matrix; is the genotype effect incidence matrix.
Using the estimated variance components, individual heritabilities and other coefficients of determination associated with the random effects of the models were calculated as outlined in Resende [27]. The variance components were subjected to a likelihood ratio test at a 5% significance level. Subsequently, the selection index was determined based on the Mulamba and Mock [28] sum of ranks.
3. Results
Microclimatic Data in the Greenhouse
The climatic conditions inside the greenhouse during the experimental period are depicted in Supplementary Figure S2. At the commencement of the experimental period (04/01/2019), the average temperature and relative humidity were 31 °C and 56%, respectively. On the 25th day after the imposition of water deficit (04/26/2019), when the evaluated genotypes exhibited variability in response to water stress, the average temperature was 29 °C, and the relative humidity was 55%. The maximum recorded temperature during the experimental period reached approximately 42 °C. Following the rehydration of the genotypes (05/20/2019), the recorded average temperature and relative humidity were 28 °C and 59%, respectively.
Field Climate Data
The climatic conditions in the field during the experiment were characterized by well-defined dry and rainy seasons. In the year 2019, the average maximum and minimum temperatures were 30.4 °C and 16.1 °C, respectively. The total annual precipitation was 1299 mm (Supplementary Figure S3 A and B). In August 2019, there was an absence of precipitation, with a maximum temperature of 29.6 °C and a minimum of 14.5 °C (Supplementary Figure S3A). In the year 2020, the average maximum and minimum temperatures were 29.4 °C and 15.9 °C, respectively, and the annual precipitation was 1402 mm. In January 2020, there was a precipitation of 282 mm, and the maximum and minimum temperatures were 30.3 °C and 18.7 °C, respectively (Supplementary Figure S3B).
4. Discussion
Water stress is one of the most significant environmental factors affecting agricultural production, leading to growth reduction, development problems, and decreased yield. Responses to water stress vary among species and within genotypes of the same species, with some being more adapted due to genetic, environmental, and management factors [11,16]. Tolerance to stress is determined by these complex elements.
Given the increasing demand for drought-tolerant coffee genotypes and the emergence of new automated phenotyping techniques, the need for a more efficient genotypic selection process has significantly intensified. Analyzing these multiple parameters individually and their intercorrelations complicates decision-making in the breeding process. To address this challenge, our research group has been seeking integrated parameters for assessing plasticity that align with breeding selection criteria. Phenotypic plasticity, the ability of a specific genotype to display multiple phenotypes in response to the environment, can be used to predict plant behavior under stress conditions. This phenomenon has been extensively studied in the context of plant adaptation to adverse environmental conditions [3]. The MVPi is applied to quantify plant phenotypic plasticity based on multiple characteristics in response to varying growth conditions [16].
In this study, we investigated the relationship between MVPi, biomass accumulation, and production of genotypes subjected to water limitation. We found that the MVPi fulfilled three main desired characteristics to be considered a potential marker for genetic improvement. Firstly, we observed a clear correlation between MVPi and productivity and productive resilience in different growth environments. Additionally, we noted wide genetic variation among the evaluated genotypes in relation to MVPi, highlighting its relevance as a parameter of interest for selection. Lastly, our results demonstrated that MVPi is heritable, meaning it is genetically transmitted to subsequent generations, solidifying its utility as a valuable tool in agricultural crop improvement programs.
When analyzing the I1 of MVPi, related to the period of irrigation suspension, we noticed that genotypes 8 (Rubi MG 1192), 5 (MG 311 Hybrid Timor UFV 428-02), 1 (MG 270 B1 Hybrid Timor UFV 377-21), and 6 (MG 279 Hybrid Timor UFV 376-31) exhibited the highest degree of phenotypic plasticity. Indicating significant shifts from the irrigated control, these genotypes showcased pronounced deviations. Such adjustments facilitated the preservation of metabolic activities, illustrating an adaptive approach for confronting water stress while sustaining dry matter content and overall productivity.
The sensitivity to water deficit of the 'Rubi MG 1192' cultivar (genotype 8), described by other authors [19], was not observed in this study. The observed tolerance behavior may be related to greater phenotypic plasticity, indicated by the larger Euclidean distance between the control and water deficit treatments (Figure 1, G8, distance between filled and empty squares). It is evident that the control treatment in the WD stage has a phenotypic state similar to the same treatment in the previous stage (WW), shifted in the direction of the vectors A, E, gs, and ψw. On the other hand, the plants under water deficit are shifted to the far-right side of the Cartesian plane, indicating stomatal closure and increased water-use efficiency. The tolerance mechanism may be related to increased carbon fixation during periods of higher water availability and enhanced control of water loss during water deficit periods. This mechanism differs from that studied by Freire et al. [18].who evaluated the expression of the CaM6FR gene related to mannitol sy nthesis.
Among the most plastic genotypes, accessions 5 (MG 311 Hybrid Timor UFV 428-02), 1 (MG 270 B1 Hybrid Timor UFV 377-21), and 6 (MG 279 Hybrid Timor UFV 376-31) belong to the Hybrid of Timor germplasm (Supplementary Table S1), commonly used in breeding programs as a source of resistance to major coffee diseases [28]. In another study, these genotypes were found to have leaf anatomical structures that optimize water transport and prevent excessive transpiration, as well as physiological mechanisms that minimize impacts during dry periods [17]. This adaptive capacity is crucial in future scenarios of climate change, where extreme events such as prolonged droughts may become more frequent.
In plants subjected to recurring water stress, such as coffee, the ability to restore their pre-stress behavior is crucial for resuming growth and productivity, as demonstrated by Beacham et al. [30]. Both recovery ability and drought tolerance are essential, as indicated by Hassan et al. [8]. This phenomenon was observed in genotypes 1 (MG 270 B1 Hybrid Timor UFV 377-21), 2 (MG 270 B2 Hybrid Timor UFV 377-21), 3 (MG 364 Hybrid Timor UFV 442-42), and control 8 (Rubi MG 1192), which exhibited a greater ability to return to metabolic levels similar to the irrigated control.
Phenotypic plasticity ranges from stable to highly plastic in genotypes [13]. The 'IPR 100' cultivar demonstrated lower plasticity, possibly related to different drought tolerance mechanisms [18]. Its distinction may stem from hybridization origin, "Catuaí" x coffee ("Catuaí" x coffee genotype from 'BA-10' series) bearing C. liberica genes, diverging from other materials in the Hybrid of Timor germplasm (Supplementary Table 1). Future studies can explore these mechanisms for sustainable agronomic approaches in the face of climate change.
The concept of "Physiological Breeding" [31] proposes the use of parameters related to plant metabolism, primarily those of physiological and biochemical nature, as indicators for selecting genotypes in plant breeding. The growing capacity to measure these parameters, driven by high-throughput phenotyping methods, is remarkable. However, this progress demands the development of new statistical approaches that translate phenotyping advancements into substantial genetic gains [32]. In this study, genetic parameters were estimated, indicating promising prospects for selecting individuals with greater phenotypic plasticity. Subsequently, the application of the Mulamba and Mock selection index [28] was proposed, using plasticity index during the interval between the initial measurement and the subsequent point after stress imposition (I1), as well as during the period between post-stress imposition and irrigation return (I2), when the plants were under water stress conditions. By amalgamating the genotype rankings evaluated by Mulamba and Mock [28] we selected genotypes 8 (Rubi MG 1192), 5 (MG 311 Hybrid Timor UFV 428-02), 1 (MG 270 B1 Hybrid Timor UFV 377-21), and 6 (MG 279 Hybrid Timor UFV 376-31). These selections exhibited significant enhancements in phenotypic plasticity, with increments of 57.09% in I1 and 36.67% in I2. This reaffirms the consistency of prior findings across diverse assessments (Figure 1, Figure 2 and Figure 3).
The outcomes of this investigation align cohesively with antecedent studies, which also accentuated the pivotal role of phenotypic plasticity as a valuable tool in prognosticating plant responses under the aegis of climate change [12,13,21] The prognostication of genotypic responses to diverse environmental stress scenarios stands as a pivotal imperative in the realm of devising strategies for the management and selection of more resilient and productive cultivars.
Our findings underscore the fundamental significance of phenotypic plasticity as an intrinsic adaptive mechanism for heightening plant productivity in water-stress environments. It is evident from our observations that the more plastic genotypes—those endowed with the capability to meaningfully modulate their physiological and biochemical parameters in response to environmental stimuli—exhibited diminished biomass losses in both aerial and root components, thus engendering a favorable impact on their overall productivity. The MVPi emerged as a valuable instrument for assessing the adaptive capacity of genotypes and forecasting their performance across varying climatic scenarios. Heightened plasticity was discernible within the GC-MG accessions: MG 311 Hybrid Timor UFV 428-02, MG 270 Hybrid Timor UFV 377-21, and MG 279 Hybrid Timor UFV 376-31, as well as the Rubi MG 1192 cultivar.
It is imperative to underscore that while phenotypic plasticity has demonstrated benefits in the context of biomass preservation and productivity under water stress, substantial uncharted realms remain within this sphere of inquiry. Prospective studies could delve into the molecular underpinnings of phenotypic plasticity and the adaptive response of genotypes to an array of environmental stimuli. A comprehensive comprehension of these processes is paramount in formulating sustainable agronomic paradigms in the face of global climatic transformations.
Author Contributions
CSS, AFF, GHBS: Conceptualization, Data curation, Formal analysis, Investigation, Methodology, Validation, Visualization, Writing – original draft, Writing – review & editing. JPP, MAFC, MOS,: Conceptualization, Data curation, Formal analysis, Investigation, Methodology. TSJM,, JCRA, AAP, GRC,: Investigation, Methodology, Validation,Visualization, Writing – original draft, Writing – review & editing. VAS: Conceptualization, Investigation, Methodology, Resources, Supervision,Validation, Visualization, Writing – original draft, Writing – review & editing.
Funding
This work was supported by Empresa de Pesquisa Agropecuária de Minas Gerais (EPAMIG). The authors would like to thank for the financial support and research grants of Fundação de Amparo à Pesquisa do Estado de Minas Gerais (FAPEMIG), Conselho Nacional de Desenvolvimento Científico e Tecnológico (CNPq), Consórcio de Pesquisa Café, and Instituto Nacional de Ciência e Tecnologia do Café (INCT-Café).
Conflicts of Interest
The authors declare no conflict of interest.
References
- Dubberstein, D.; Lidon, F.C.; Rodrigues, A.P.; Semedo, J.N.; Marques, I.; Rodrigues, W.P.; Gouveia, D.; Armengaud, J.; Semedo, M.C.; Martins, S.; et al. Resilient and Sensitive Key Points of the Photosynthetic Machinery of Coffea Spp. to the Single and Superimposed Exposure to Severe Drought and Heat Stresses. Front. Plant Sci. 2020, 11, 1049. [Google Scholar] [CrossRef] [PubMed]
- Moat, J.; Williams, J.; Baena, S.; Wilkinson, T.; Gole, T.W.; Challa, Z.K.; Demissew, S.; Davis, A.P. Resilience Potential of the Ethiopian Coffee Sector under Climate Change. Nature Plants 2017, 3, 17081. [Google Scholar] [CrossRef] [PubMed]
- Marraccini, P.; Freire, L.P.; Alves, G.S.; Vieira, N.G.; Vinecky, F.; Elbelt, S.; Ramos, H.J.; Montagnon, C.; Vieira, L.G.; Leroy, T.; et al. RBCS1 Expression in Coffee: Coffea Orthologs, Coffea Arabica Homeologs, and Expression Variability between Genotypes and under Drought Stress. BMC Plant Biol 2011, 11, 85. [Google Scholar] [CrossRef] [PubMed]
- Hasanagić, D.; Koleška, I.; Kojić, D.; Vlaisavljević, S.; Janjić, N.; Kukavica, B. Long Term Drought Effects on Tomato Leaves: Anatomical, Gas Exchange and Antioxidant Modifications. Acta Physiol Plant 2020, 42, 121. [Google Scholar] [CrossRef]
- Della Torre, F.; Ferreira, B.G.; Lima, J.E.; Lemos-Filho, J.P.; Rossiello, R.O.P.; França, M.G.C. Leaf Morphophysiological Changes Induced by Long-Term Drought in Jatropha Curcas Plants Explain the Resilience to Extreme Drought. Journal of Arid Environments 2021, 185, 104381. [Google Scholar] [CrossRef]
- Barbosa, M.R.; Silva, M.M.D.A.; Willadino, L.; Ulisses, C.; Camara, T.R. Geração e Desintoxicação Enzimática de Espécies Reativas de Oxigênio Em Plantas. Cienc. Rural 2014, 44, 453–460. [Google Scholar] [CrossRef]
- Hasanuzzaman, M.; Bhuyan, M.H.M.B.; Parvin, K.; Bhuiyan, T.F.; Anee, T.I.; Nahar, K.; Hossen, Md.S.; Zulfiqar, F.; Alam, Md.M.; Fujita, M. Regulation of ROS Metabolism in Plants under Environmental Stress: A Review of Recent Experimental Evidence. IJMS 2020, 21, 8695. [Google Scholar] [CrossRef]
- Hassan, M.U.; Chattha, M.U.; Khan, I.; Chattha, M.B.; Barbanti, L.; Aamer, M.; Iqbal, M.M.; Nawaz, M.; Mahmood, A.; Ali, A.; et al. Heat Stress in Cultivated Plants: Nature, Impact, Mechanisms, and Mitigation Strategies—a Review. Plant Biosystems - An International Journal Dealing with all Aspects of Plant Biology 2021, 155, 211–234. [Google Scholar] [CrossRef]
- Canales, F.J.; Rispail, N.; García-Tejera, O.; Arbona, V.; Pérez-de-Luque, A.; Prats, E. Drought Resistance in Oat Involves ABA-Mediated Modulation of Transpiration and Root Hydraulic Conductivity. Environmental and Experimental Botany 2021, 182, 104333. [Google Scholar] [CrossRef]
- Stotz, G.C.; Salgado-Luarte, C.; Escobedo, V.M.; Valladares, F.; Gianoli, E. Global Trends in Phenotypic Plasticity of Plants. Ecology Letters 2021, 24, 2267–2281. [Google Scholar] [CrossRef]
- Arantes, M.K.; Da Silva Filho, M.P.; Pennacchi, J.P.; Das Chagas Mendonça, A.M.; Barbosa, J.P.R.A.D. Phenotypic Plasticity of Leaf Anatomical Traits Helps to Explain Gas-Exchange Response to Water Shortage in Grasses of Different Photosynthetic Types. Theor. Exp. Plant Physiol. 2020, 32, 341–356. [Google Scholar] [CrossRef]
- Arnold, P.A.; Kruuk, L.E.B.; Nicotra, A.B. How to Analyse Plant Phenotypic Plasticity in Response to a Changing Climate. New Phytol 2019, 222, 1235–1241. [Google Scholar] [CrossRef] [PubMed]
- Monforte, A.J. Time to Exploit Phenotypic Plasticity. Journal of Experimental Botany 2020, 71, 5295–5297. [Google Scholar] [CrossRef] [PubMed]
- Koh, I.; Garrett, R.; Janetos, A.; Mueller, N.D. Climate Risks to Brazilian Coffee Production. Environ. Res. Lett. 2020, 15, 104015. [Google Scholar] [CrossRef]
- Lobos, G.A.; Estrada, F.; Del Pozo, A.; Romero-Bravo, S.; Astudillo, C.A.; Mora-Poblete, F. Challenges for a Massive Implementation of Phenomics in Plant Breeding Programs. Methods Mol Biol. 2022, 2539, 135–157. [Google Scholar] [CrossRef]
- Pennacchi, J.P.; Lira, J.M.S.; Rodrigues, M.; Garcia, F.H.S.; Mendonça, A.M.D.C.; Barbosa, J.P.R.A.D. A Systemic Approach to the Quantification of the Phenotypic Plasticity of Plant Physiological Traits: The Multivariate Plasticity Index. Journal of Experimental Botany 2021, 72, 1864–1878. [Google Scholar] [CrossRef] [PubMed]
- Santos, C.S.D.; Freitas, A.F.D.; Silva, G.H.B.D.; Carvalho, M.A.D.F.; Santos, M.D.O.; Carvalho, G.R.; Silva, V.A. Adaptations to the Drought Season and Impacts on the Yield of ‘Híbrido de Timor’ Coffee Tree in the Minas Gerais State Cerrado (Brazilian Savanna). Pesqui. Agropecu. Trop. 2022, 52, e72448. [Google Scholar] [CrossRef]
- Carvalho, F.G.; Sera, G.H.; Andreazi, E.; Sera, T.; Fonseca, I.C.D.B.; Carducci, F.C.; Shigueoka, L.H.; Holderbaum, M.M.; Costa, K.C. Tolerância Ao Déficit Hídrico Em Mudas de Genótipos de Café Portadores de Genes de Diferentes Espécies. C.Sci. 2017, 12, 156. [Google Scholar] [CrossRef]
- Freire, L.P.; Marraccini, P.R.; Rodrigues, G.C.; Andrade, A.C. . Analysis of the mannose 6 phosphate reductase gene expression in coffee trees submitted to water deficit. C.Sci.. 2013, 8, . 1, 15–20. [Google Scholar]
- Velikova, V.; Yordanov, I.; Edreva, A. Oxidative Stress and Some Antioxidant Systems in Acid Rain-Treated Bean Plants. Plant Science 2000, 151, 59–66. [Google Scholar] [CrossRef]
- Buege, J.A.; Aust, S.D. [30] Microsomal Lipid Peroxidation. In Methods in Enzymology; Elsevier, 1978; Vol. 52, pp. 302–310 ISBN 9780121819521.
- Biemelt, S.; Keetman, U.; Albrecht, G. Re-Aeration Following Hypoxia or Anoxia Leads to Activation of the Antioxidative Defense System in Roots of Wheat Seedlings1. Plant Physiology 1998, 116, 651–658. [Google Scholar] [CrossRef] [PubMed]
- Mengutay, M.; Ceylan, Y.; Kutman, U.B.; Cakmak, I. Adequate Magnesium Nutrition Mitigates Adverse Effects of Heat Stress on Maize and Wheat. Plant Soil 2013, 368, 57–72. [Google Scholar] [CrossRef]
- Arakawa, N.; Tsutsumi, K.; Sanceda, N.G.; Kurata, T.; Inagaki, C. A Rapid and Sensitive Method for the Determination of Ascorbic Acid Using 4,7-Diphenyl-1,10-Phenanthroline. Agricultural and Biological Chemistry 1981, 45, 1289–1290. [Google Scholar] [CrossRef]
- Santos, H.G. dos Sistema Brasileiro de Classificação de Solos; 3a edição revista e ampliada.; Embrapa: Brasília, DF, 2013; ISBN 9788570351982.
- Ripley, B.D. The R Project in Statistical Computing. MSOR Connections 2001, 1, 23–25. [Google Scholar] [CrossRef]
- Resende, M.D.V.D. Software Selegen-REML/BLUP: A Useful Tool for Plant Breeding. Crop Breed. Appl. Biotechnol. 2016, 16, 330–339. [Google Scholar] [CrossRef]
- Mulamba, N.N.; Mock, J.J. Improvement of yield potential of the ETO blanco maize (Zea mays L.) population by breeding for plant traits [Mexico]. Egypt. J. Genet. Cytol. 1978, 7, 40–51. [Google Scholar]
- Lima Castro, I.S.; Rossi Marques Barreiros, P.R.; De Oliveira Mendes, T.A.; Florez, J.C.; Andrade Silva, E.M.D.; Neves Porto, B.; Zambolim, L.; Caixeta, E.T. Gene Expression and Interactome Analysis of Candidate Effectors Associated with Pre- and Post-Haustorial Hemileia vastatrix-Coffee Interaction. J Biotechnol Biomed 2022, 05. [Google Scholar] [CrossRef]
- Beacham, A.M.; Hand, P.; Barker, G.C.; Denby, K.J.; Teakle, G.R.; Walley, P.G.; Monaghan, J.M. Addressing the Threat of Climate Change to Agriculture Requires Improving Crop Resilience to Short-Term Abiotic Stress. Outlook Agric 2018, 47, 270–276. [Google Scholar] [CrossRef]
- Reynolds, M.; Langridge, P. Physiological Breeding. Current Opinion in Plant Biology 2016, 31, 162–171. [Google Scholar] [CrossRef]
- Araus, J.L.; Kefauver, S.C.; Zaman-Allah, M.; Olsen, M.S.; Cairns, J.E. Translating High-Throughput Phenotyping into Genetic Gain. Trends in Plant Science 2018, 23, 451–466. [Google Scholar] [CrossRef]
Figure 1.
Principal Component Biplot (1st and 2nd PCs) with the average points for all the treatments. Circle, stage before the imposition of water deficit treatment (WW); Square, stage after the imposition of the water deficit (WD); Triangle, stage after the rewatering (RW). W, well-watered treatment (control, full symbols); D, drought treatment (empty symbols). The lines connecting points represent the MVPi as the euclidean distance.
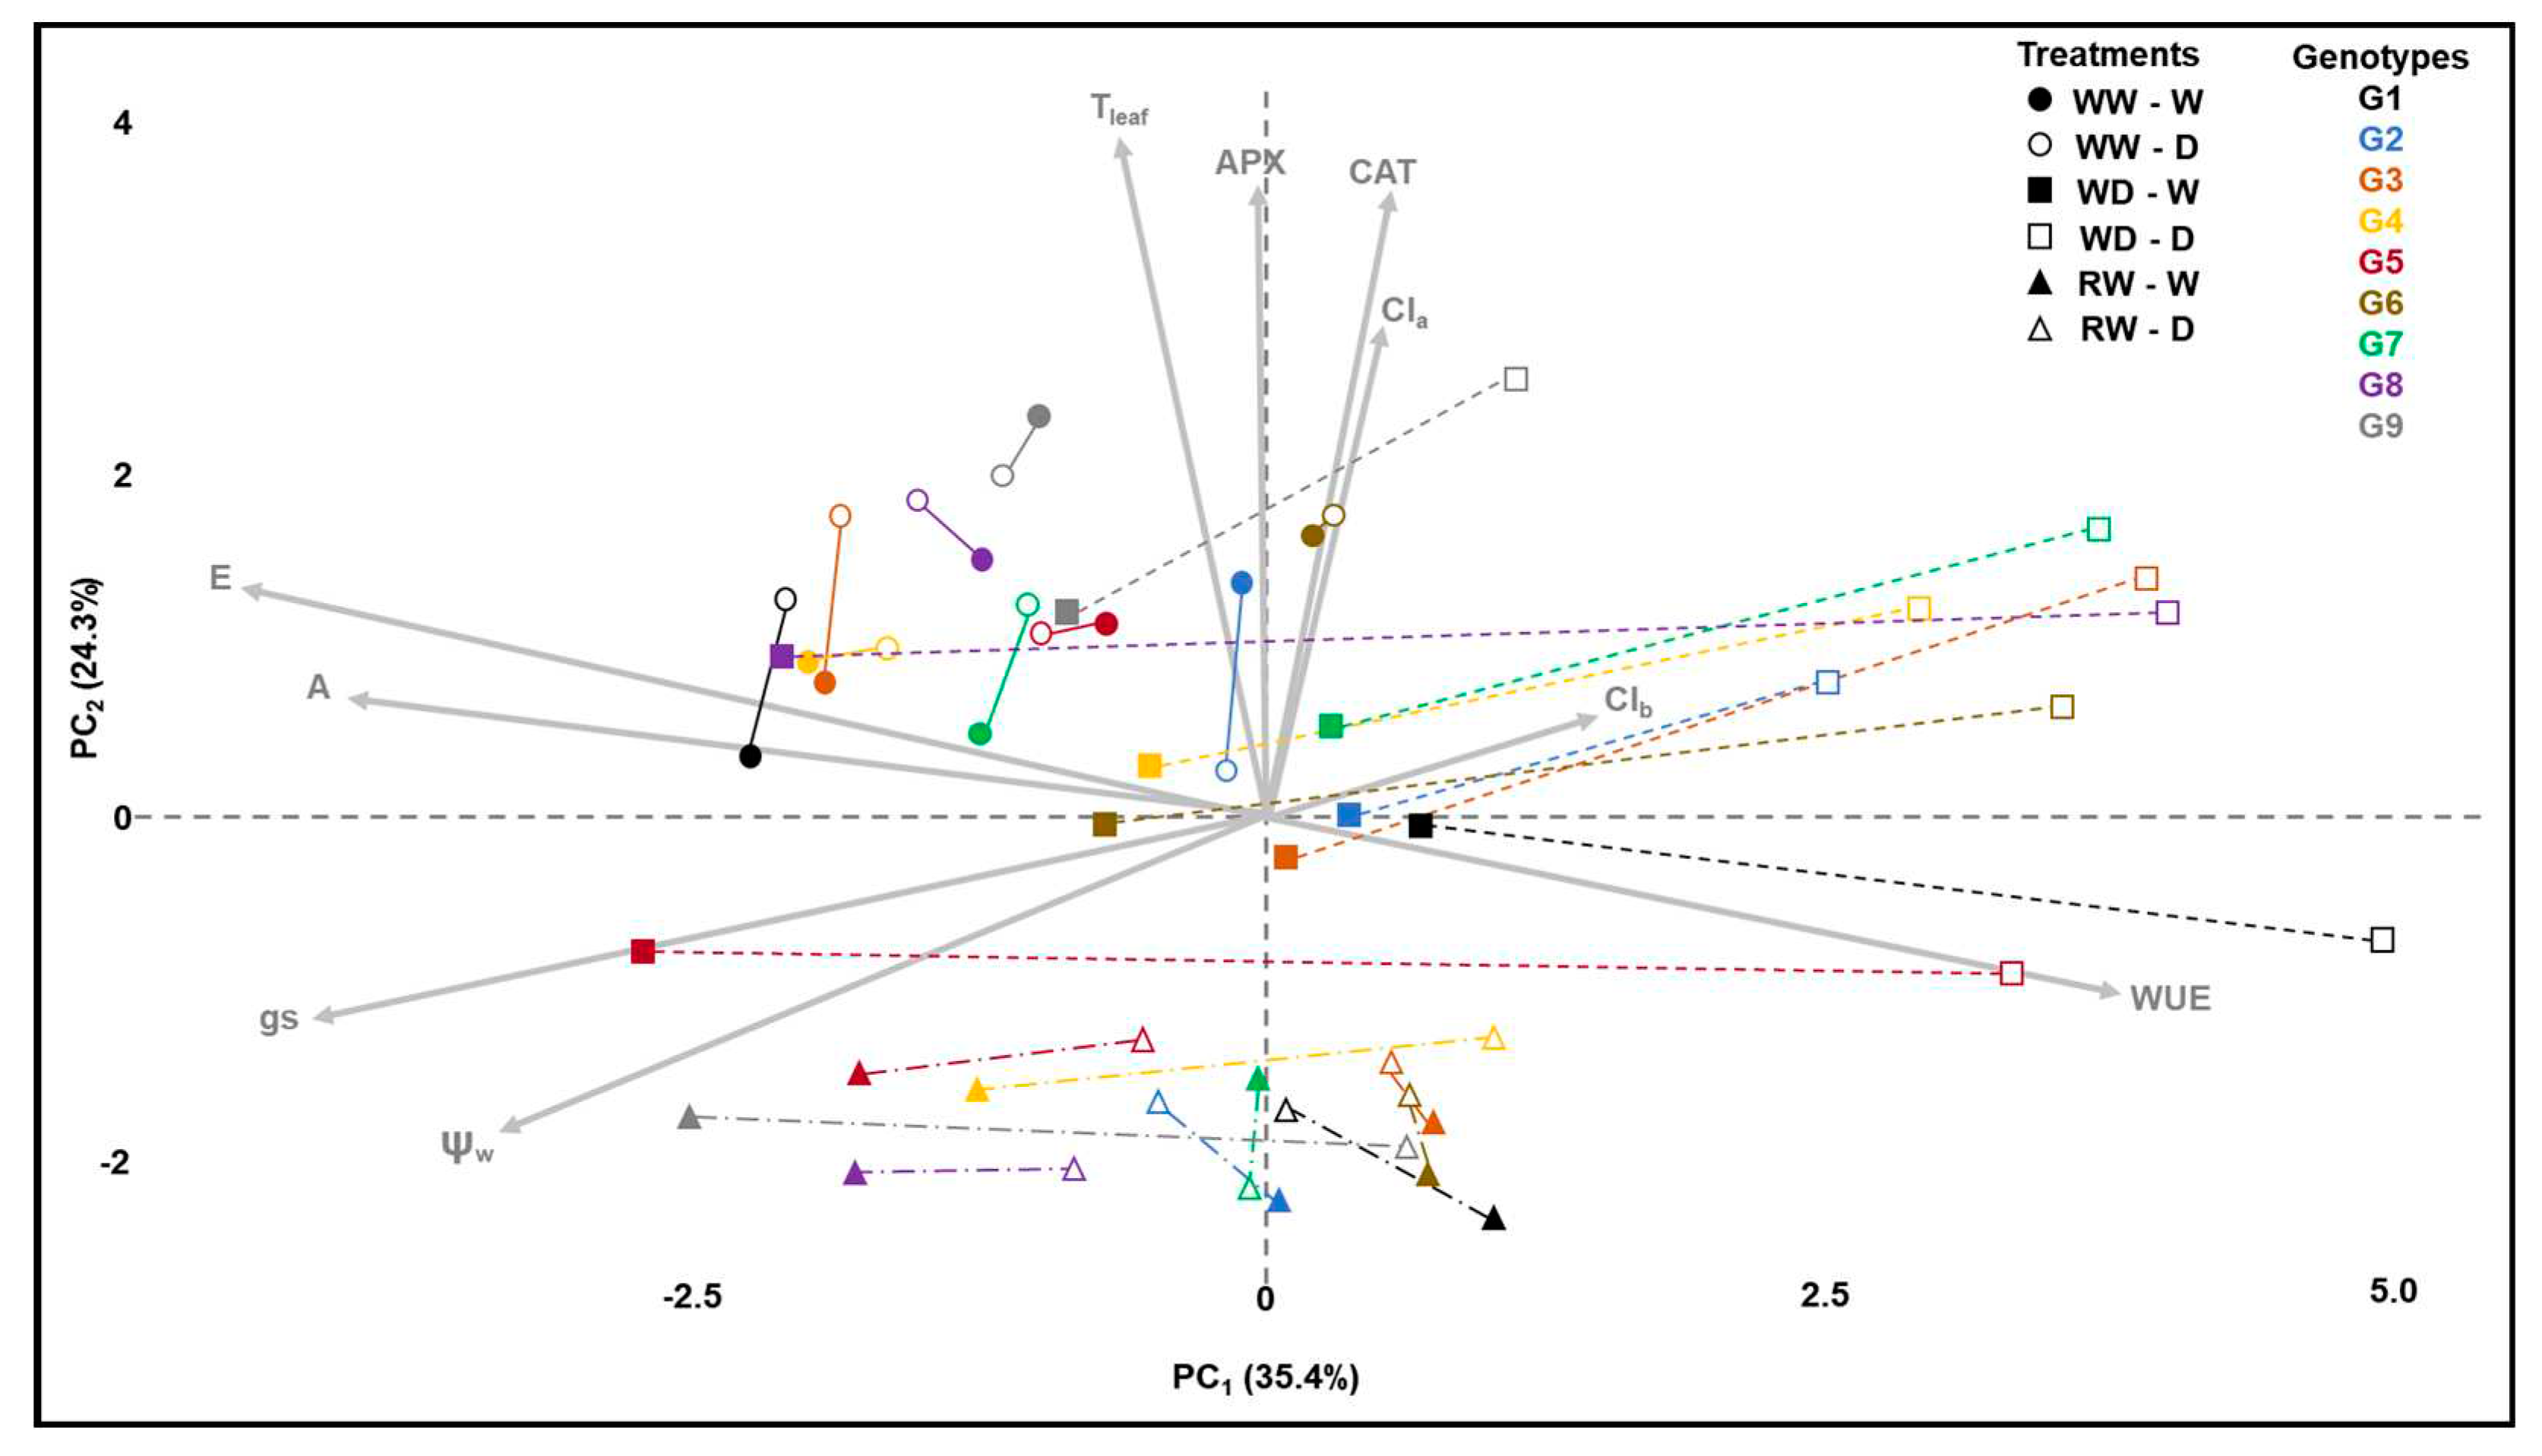
Figure 2.
Plasticity of Coffea arabica L. genotypes subjected to water deficit in WW (pre-treatment period); WD (25 days after irrigation cutoff) and RW (re-irrigation after water deficit period). Genotypes: 1- MG 270, 2: MG 270, 3: MG 364, 4: MG 534, 5: MG 311, 6: MG 279, 7: MG 308, 8: Rubi MG 1192 and 9: IPR 100. I1 - period between initial measurement and post-imposition of stress point; I2 - period between post-imposition of stress point and irrigation recovery.
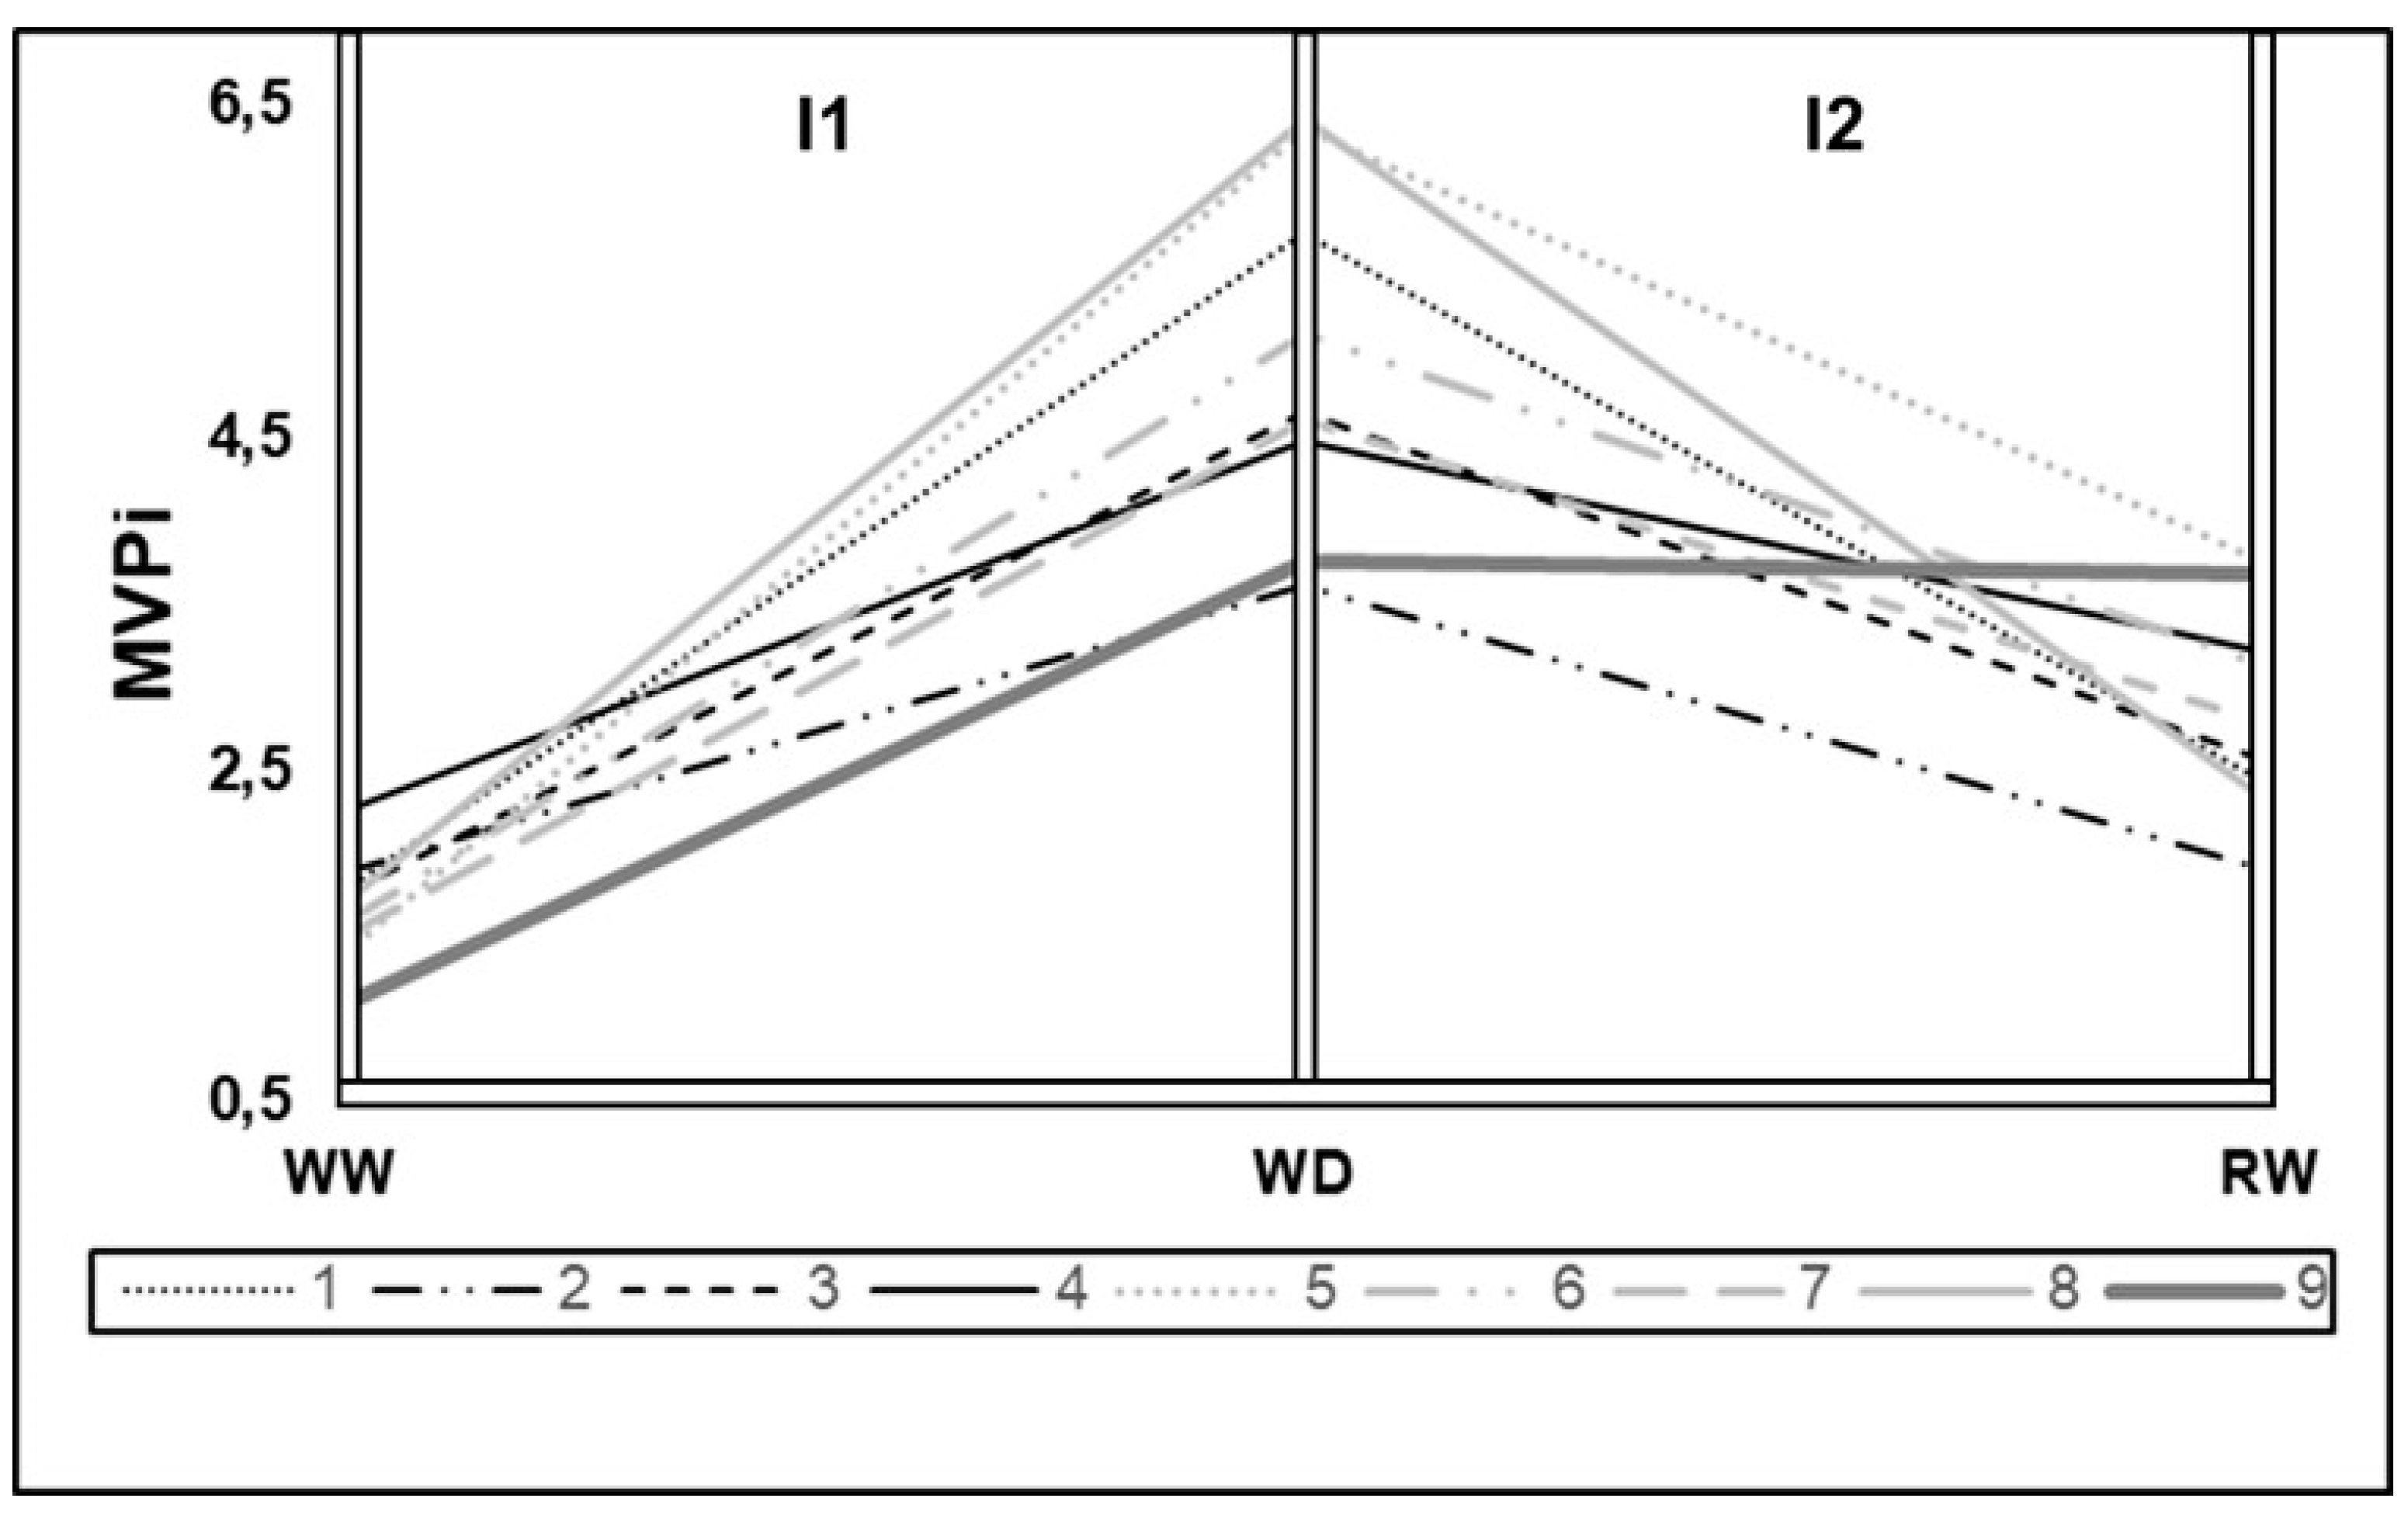
Figure 3.
A) Relationship between total dry mass, B) above-ground dry mass, and C) root dry mass with changes in MVPi between WW (pre-treatment period) and WD (25 days after irrigation cutoff), represented by the slope I1 (period between initial measurement and post-imposition of stress point).
Figure 3.
A) Relationship between total dry mass, B) above-ground dry mass, and C) root dry mass with changes in MVPi between WW (pre-treatment period) and WD (25 days after irrigation cutoff), represented by the slope I1 (period between initial measurement and post-imposition of stress point).
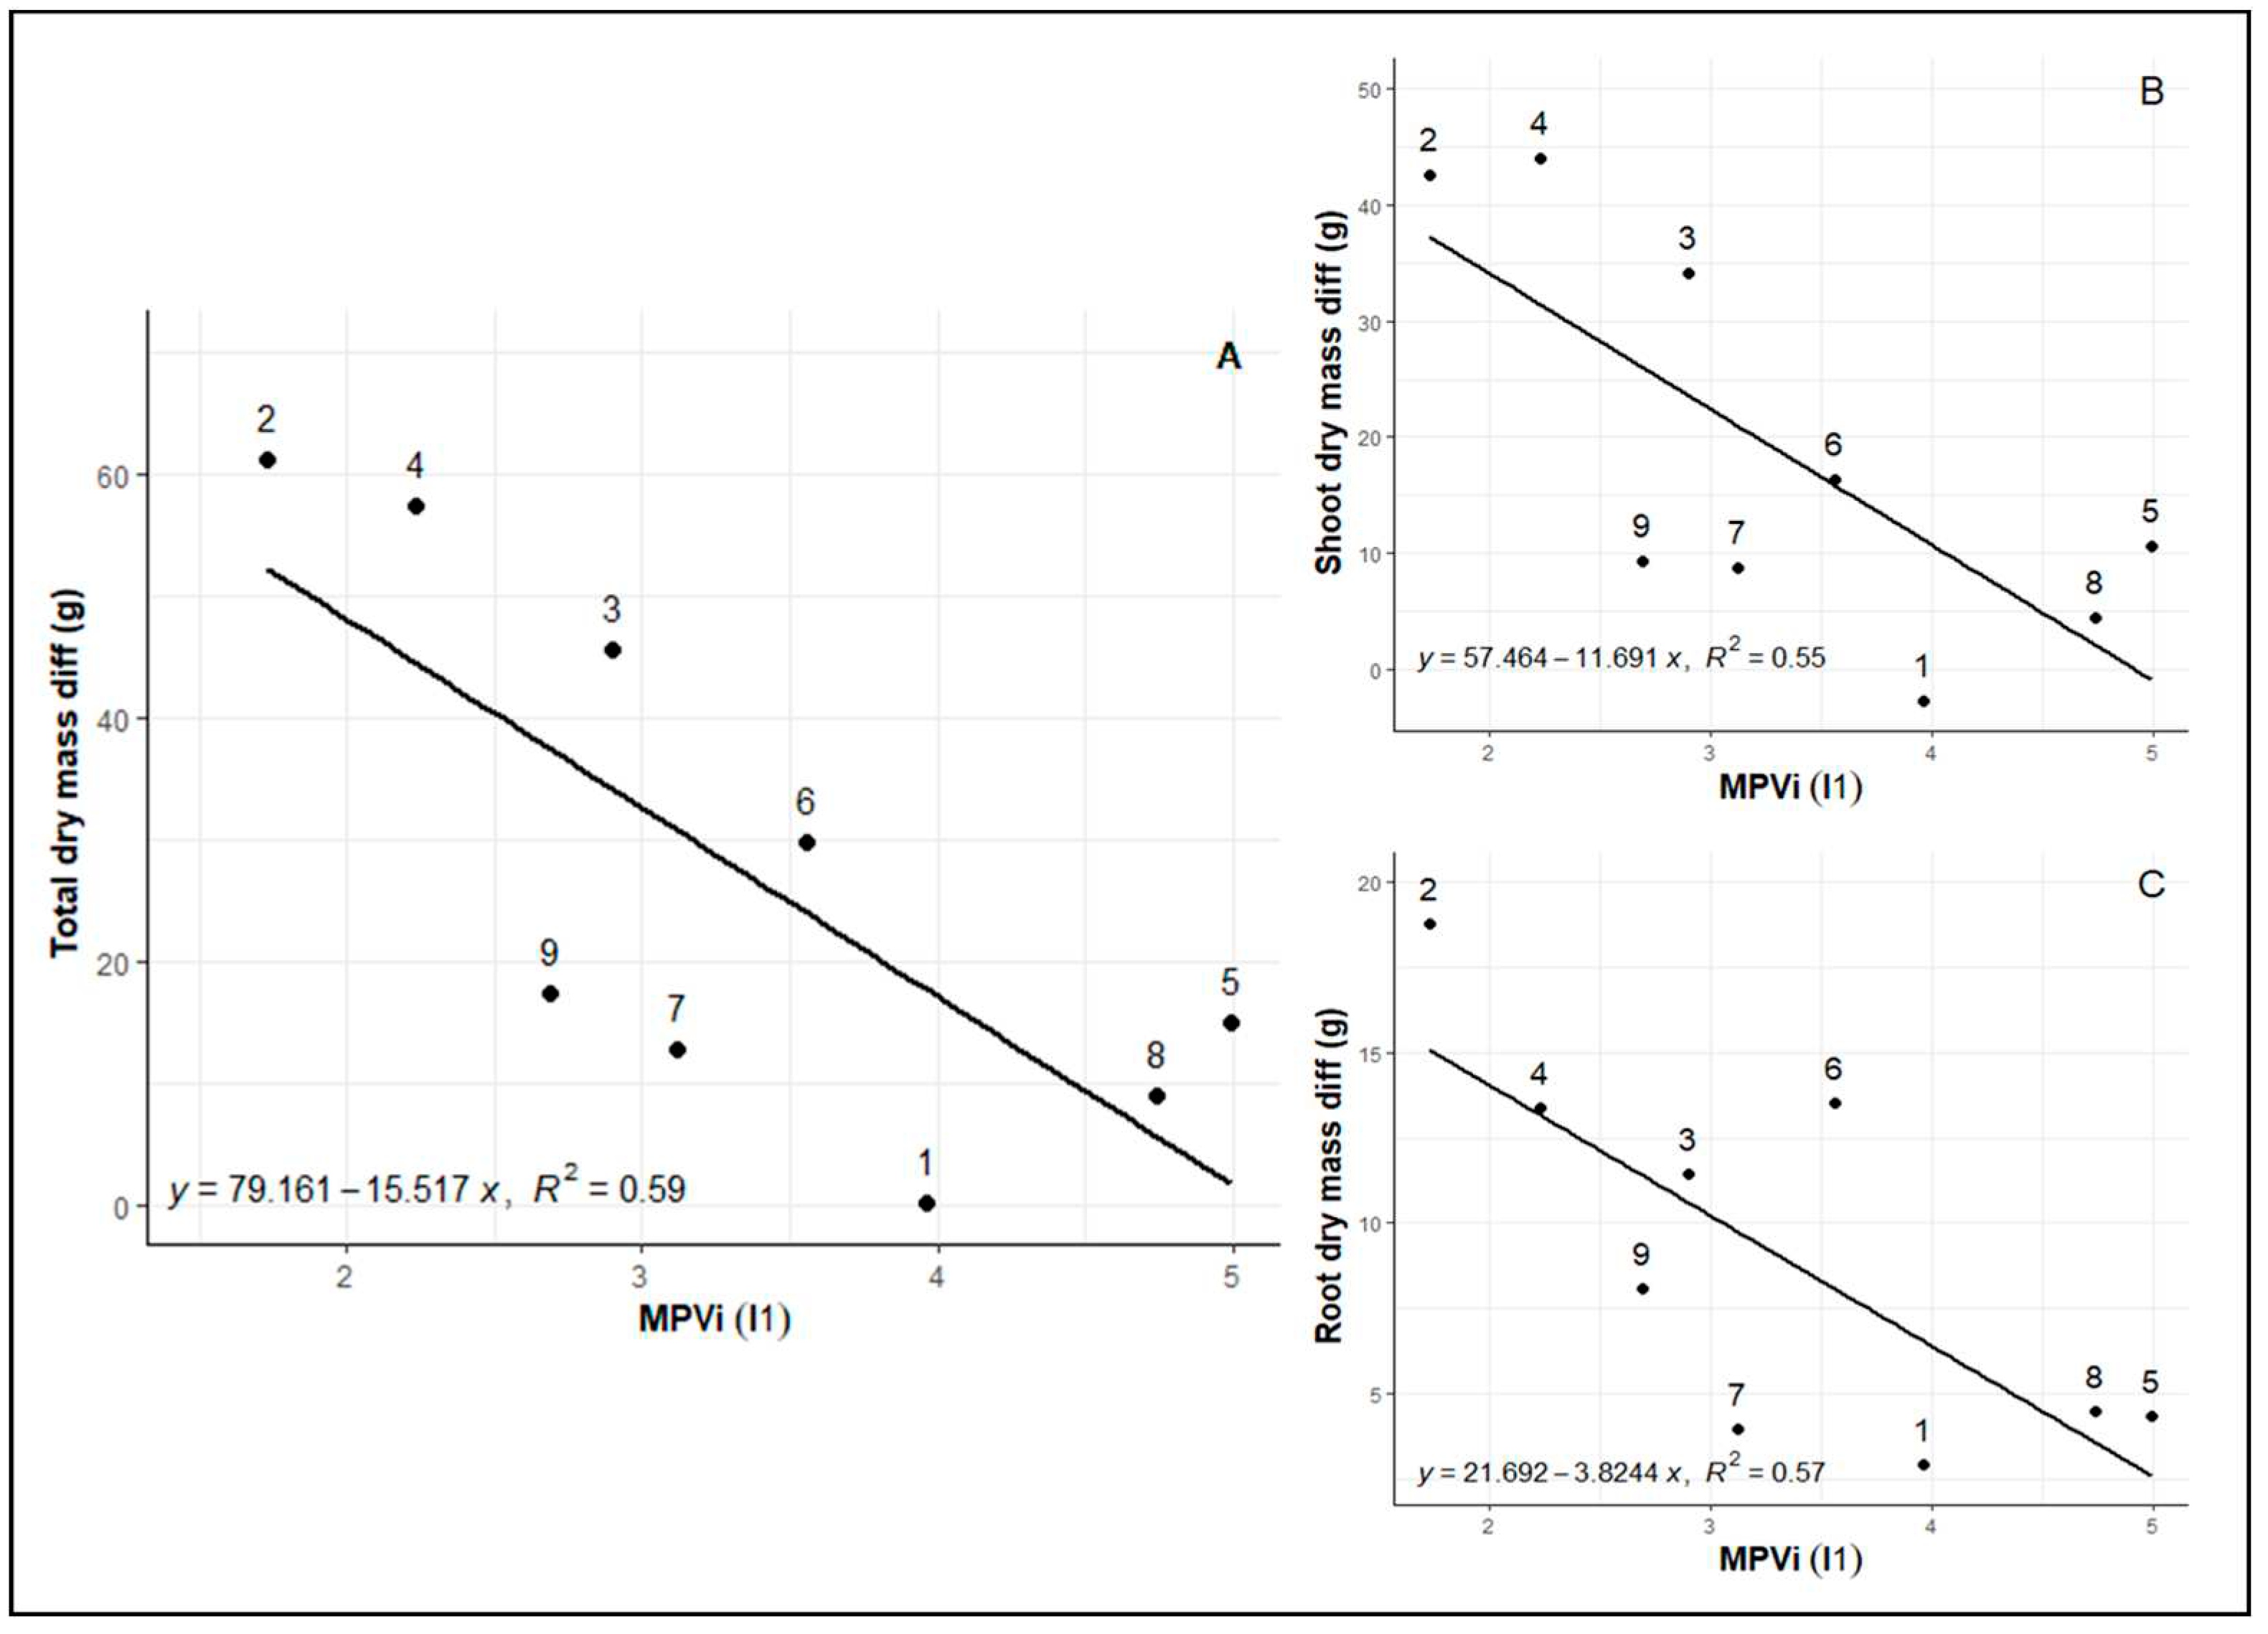
Figure 4.
A) Relationship between total dry mass, B) above-ground dry mass, and C) root dry mass with changes in MVPi between WD (25 days after irrigation cutoff) and RW (re-irrigation after water deficit period), represented by the slope I2 (period between post-imposition of stress point and return of irrigation).
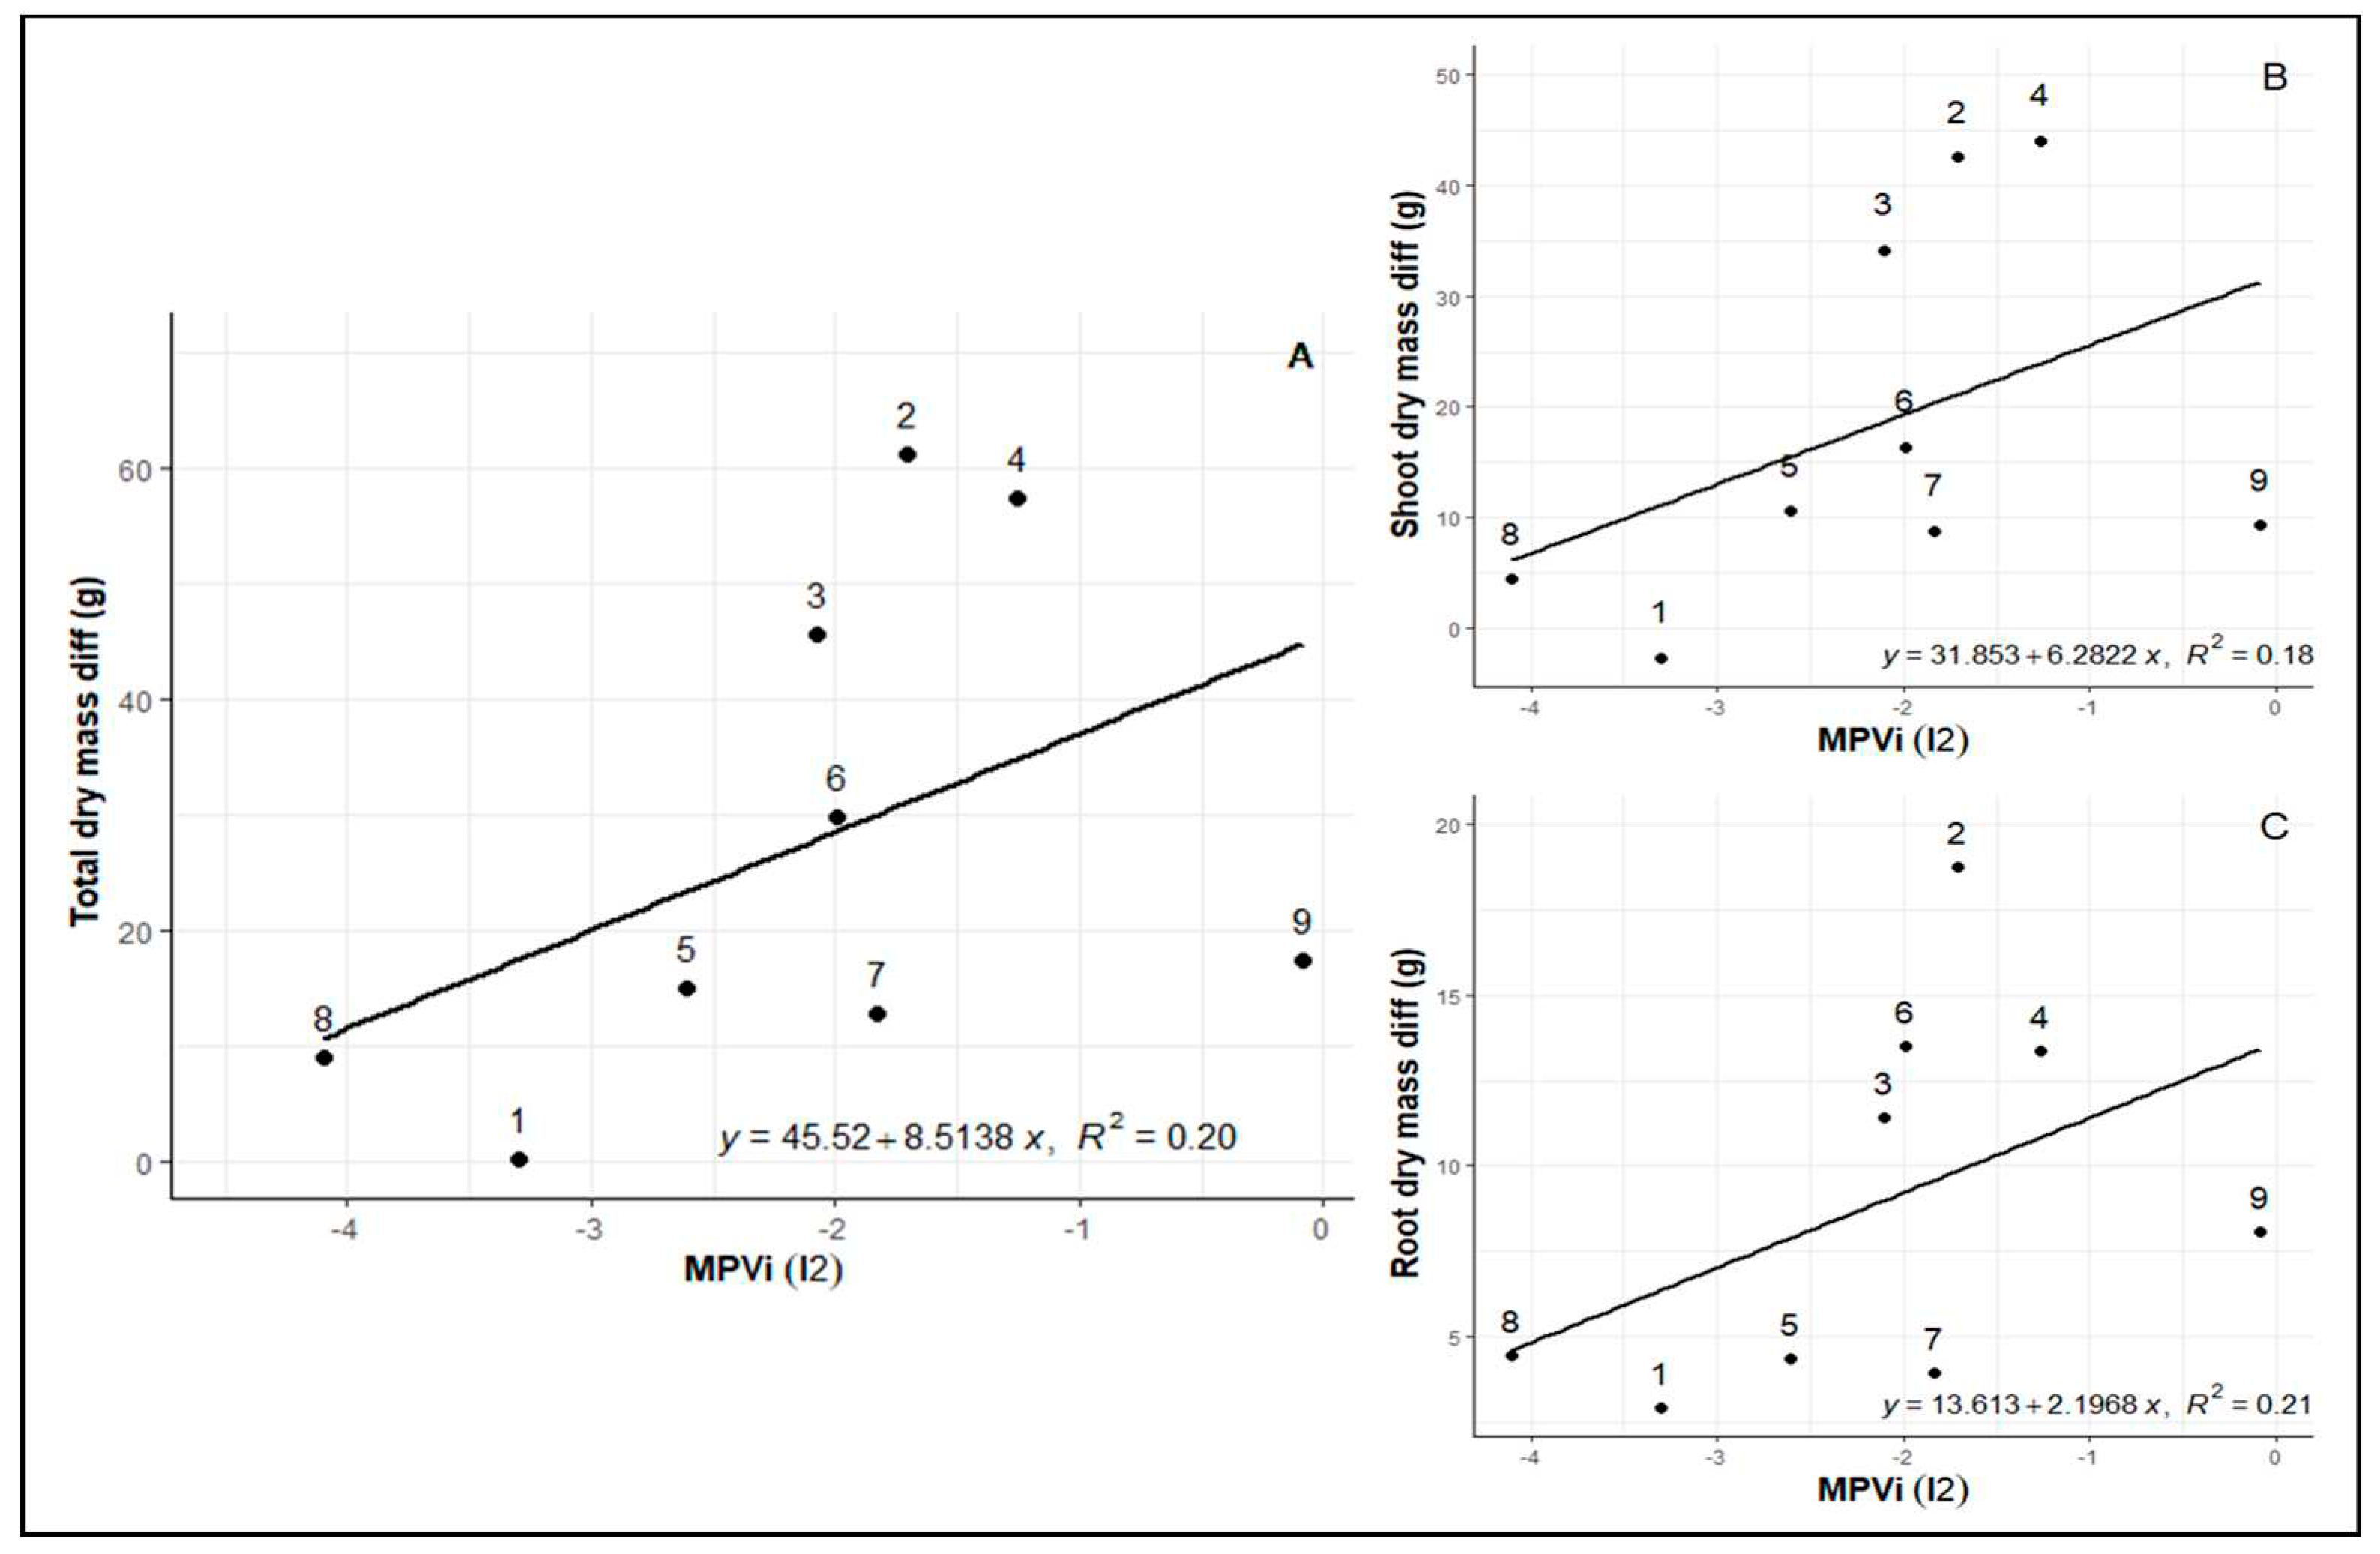
Figure 5.
Relationship between MVPi and genotype field productivity.
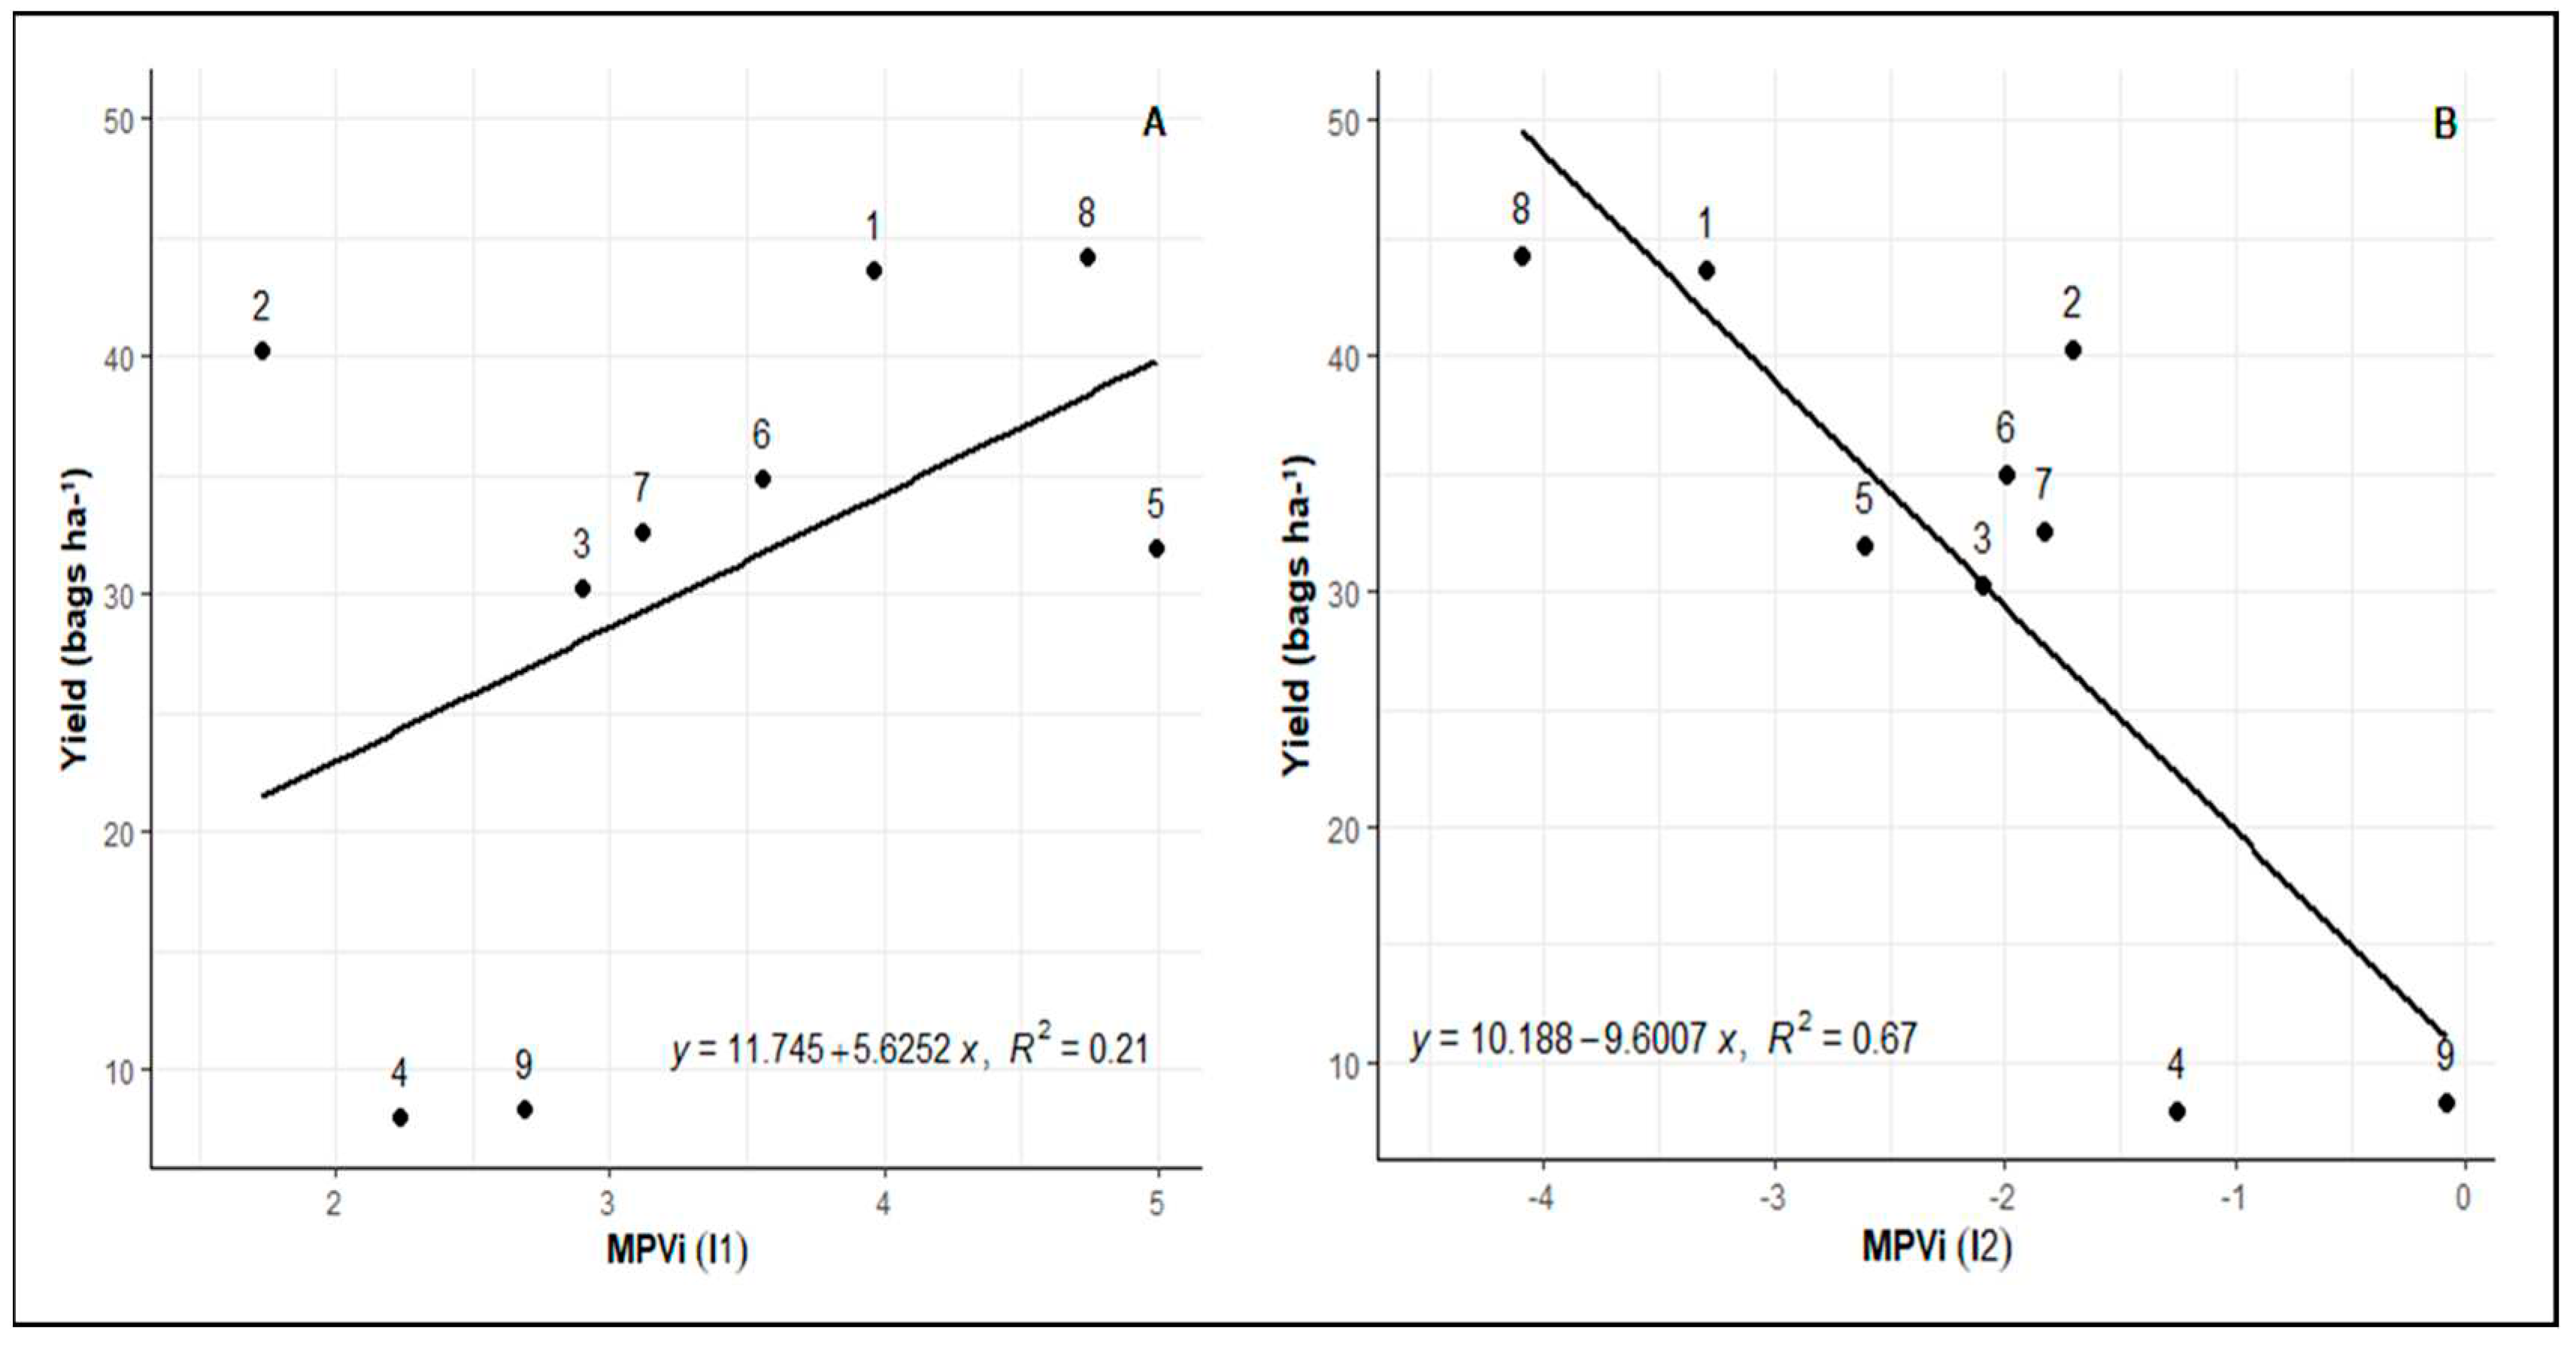

Table 1.
Estimates of genetic parameters and predicted additive genetic values for the inclinations between the initial measurement and the post-imposition of stress point (I1) and between the post-imposition of stress point and the return of irrigation (I2).
Table 1.
Estimates of genetic parameters and predicted additive genetic values for the inclinations between the initial measurement and the post-imposition of stress point (I1) and between the post-imposition of stress point and the return of irrigation (I2).
| Mean | |||||
|---|---|---|---|---|---|
| I1 | 1.07* | 0.90 | 0.94 | 0.97 | 3.31 |
| I2 | 1.15* | 0.86 | 0.93 | 0.82 | -2.10 |
: genotypic variance, heritability of genotype average, assuming complete survival, selective accuracy, relative coefficient of variation, Mean: overall mean of the experiment. Mean: overall mean of the experiment. I1 - period between initial measurement and post-imposition of stress point; I2 - period between post-imposition of stress point and return of irrigation. *Significance, determined by likelihood ratio test, at 5% probability.
Table 2.
Predicted additive genetic values for MVPi inclinations I1 and I2 and estimated selection gain (SG%) of the top four (*) progenies with higher phenotypic plasticity.
Table 2.
Predicted additive genetic values for MVPi inclinations I1 and I2 and estimated selection gain (SG%) of the top four (*) progenies with higher phenotypic plasticity.
| Number | Genotype | I1 | I2 | Ij |
|---|---|---|---|---|
| 8 | Rubi MG1192 | 4.59 | -3.82 | 3* |
| 5 | MG 311 | 4.81 | -2.53 | 4* |
| 1 | MG 270¹ | 3.89 | -3.13 | 5* |
| 6 | MG 279 | 3.53 | -2.00 | 9* |
| 3 | MG 364 | 2.94 | -2.08 | 10 |
| 7 | MG 308 | 3.13 | -1.87 | 11 |
| 9 | IPR 100 | 2.75 | -0.36 | 16 |
| 4 | MG 534 | 2.34 | -1.37 | 16 |
| 2 | MG 270² | 1.89 | -1.76 | 16 |
| Msm | 4.20 | -2.87 | 5.25 | |
| SG% | 57.09 | 36.67 |
Msm: selected progenies mean.
Disclaimer/Publisher’s Note: The statements, opinions and data contained in all publications are solely those of the individual author(s) and contributor(s) and not of MDPI and/or the editor(s). MDPI and/or the editor(s) disclaim responsibility for any injury to people or property resulting from any ideas, methods, instructions or products referred to in the content. |
© 2023 by the authors. Licensee MDPI, Basel, Switzerland. This article is an open access article distributed under the terms and conditions of the Creative Commons Attribution (CC BY) license (http://creativecommons.org/licenses/by/4.0/).
Copyright: This open access article is published under a Creative Commons CC BY 4.0 license, which permit the free download, distribution, and reuse, provided that the author and preprint are cited in any reuse.


